Embed Size (px)
Citation preview
Costerfield Operation, Victoria, Australia NI 43-101 Report
Prepared for:
Mandalay Resources Corporation
76 Richmond Street, Toronto ONTARIO MSC1P1 Canada
Prepared by:
SRK Project Number: PLI014
Qualified Persons: Peter Fairfield, BEng (Mining), FAusIMM (No: 106754), Principal Consultant (Project Evaluation) Brett Muller, BEng (Minerals Engineering and Extractive Metallurgy),BCom (Finance), SRK Associate, Principal Consulting Engineer (Metallurgy) Bob Lidbury, Senior Consultant (Resource Geology), BAppSc (Geology), MAIG (No: 3014)
Date of Report: 28 March 2014 Effective Date: 31 December 2013
FAIR\MULL\LIDB\EBBE\mota Pli014_Costerfield_Operations_Ni_43 101_Master_Rev0 28 March 2014
SRK Consulting Page ii
FAIR\MULL\LIDB\EBBE\mota Pli014_Costerfield_Operations_Ni_43 101_Master_Rev0 28 March 2014
Date and Signature Page
SRK Project Number: PLI014
SRK Consulting (Australasia) Pty Ltd Level 8, 365 Queen Street Melbourne, Victoria, 3000, Australia
Mandalay Resources Corporation Costerfield Operation Victoria, Australia NI 43-101 Technical Report
Project Manager: Peter Fairfield
Date of Report: 28 March 2014
Effective Date: 31 December 2013
Peter Fairfield, Principal Consultant (Project Evaluation), BEng (Mining), FAusIMM
Qualified Person (QP)
Authors:
Peter Fairfield, Brett Muller, Bob Lidbury
SRK Consulting Page iii
Important Notice This report was prepared as a National Instrument 43-101 Technical Report for Mandalay Resources Corporation (Mandalay) by SRK Consulting (Australasia) Pty Ltd (SRK). The quality of information, conclusions, and estimates contained herein is consistent with the level of effort involved in SRK’s services, based on: i) information available at the time of preparation, ii) data supplied by outside sources, including without limitation, those sources listed in Section 3 - Reliance on Other Experts, and iii) the assumptions, conditions, and qualifications set forth in this report.
This report is prepared for the investing public and is intended for use by Mandalay subject to the terms and conditions of its contract with SRK and relevant securities legislation. The contract permits Mandalay to file this report as a Technical Report with Canadian securities regulatory authorities pursuant to National Instrument 43-101, Standards of Disclosure for Mineral Projects. Except for the purposes legislated under provincial securities law, any other uses of this report by any third party is at that party’s sole risk. SRK accepts no responsibility with respect to the opinions of those experts listed in Section 3 - Reliance on Other Experts nor determinations made by Mandalay with respect its obligation to file this Technical Report, or subsequent technical reports, nor any determinations as to the materiality of a mineral project to Mandalay, and SRK is under no obligation to update this Technical Report, except as may be agreed to between Mandalay and SRK by contract from time to time. The user of this document should ensure that this is the most recent Technical Report for the property as it is not valid if a new Technical Report has been issued.
Copyright
This report is protected by copyright vested in SRK. It may not be reproduced or transmitted in any form or by any means whatsoever to any person without the written permission of the copyright holder, SRK, except for the purpose as set out in this Technical Report Section 2.3.
FAIR\MULL\LIDB\EBBE\mota Pli014_Costerfield_Operations_Ni_43 101_Master_Rev0 28 March 2014
SRK Consulting Page iv
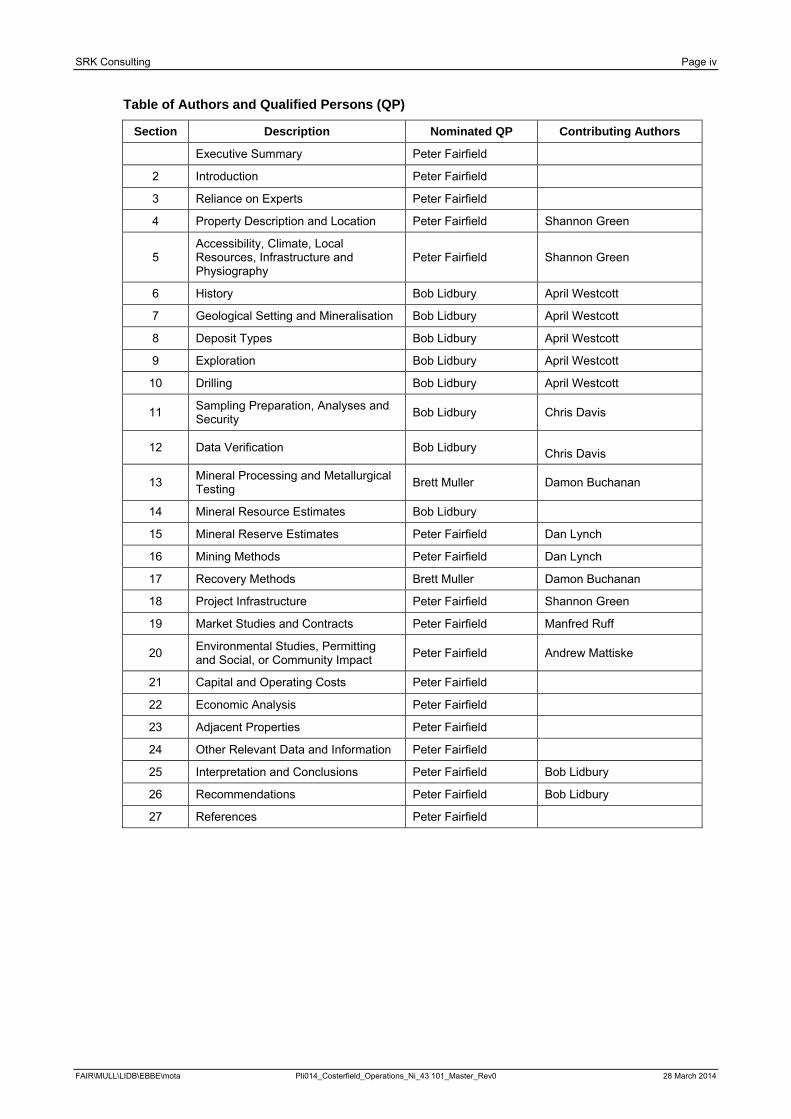
Table of Authors and Qualified Persons (QP)
Section Description Nominated QP Contributing Authors
Executive Summary Peter Fairfield
2 Introduction Peter Fairfield
3 Reliance on Experts Peter Fairfield
4 Property Description and Location Peter Fairfield Shannon Green
5 Accessibility, Climate, Local Resources, Infrastructure and Physiography
Peter Fairfield Shannon Green
6 History Bob Lidbury April Westcott
7 Geological Setting and Mineralisation Bob Lidbury April Westcott
8 Deposit Types Bob Lidbury April Westcott
9 Exploration Bob Lidbury April Westcott
10 Drilling Bob Lidbury April Westcott
11 Sampling Preparation, Analyses and Security Bob Lidbury Chris Davis
12 Data Verification Bob Lidbury Chris Davis
13 Mineral Processing and Metallurgical Testing Brett Muller Damon Buchanan
14 Mineral Resource Estimates Bob Lidbury
15 Mineral Reserve Estimates Peter Fairfield Dan Lynch
16 Mining Methods Peter Fairfield Dan Lynch
17 Recovery Methods Brett Muller Damon Buchanan
18 Project Infrastructure Peter Fairfield Shannon Green
19 Market Studies and Contracts Peter Fairfield Manfred Ruff
20 Environmental Studies, Permitting and Social, or Community Impact Peter Fairfield Andrew Mattiske
21 Capital and Operating Costs Peter Fairfield
22 Economic Analysis Peter Fairfield
23 Adjacent Properties Peter Fairfield
24 Other Relevant Data and Information Peter Fairfield
25 Interpretation and Conclusions Peter Fairfield Bob Lidbury
26 Recommendations Peter Fairfield Bob Lidbury
27 References Peter Fairfield
FAIR\MULL\LIDB\EBBE\mota Pli014_Costerfield_Operations_Ni_43 101_Master_Rev0 28 March 2014
SRK Consulting Page v
Table of Contents
Important Notice .......................................................................................................................................... iii
List of Abbreviations ................................................................................................................................. xviii
1 Summary ....................................................................................................................... 1
1.1 Introduction ......................................................................................................................................... 1
1.2 Property Description and Location ...................................................................................................... 1
1.3 Accessibility, Climate, Local Resources, Infrastructure and Physiography ........................................ 1
1.4 History ................................................................................................................................................. 2
1.5 Geological Setting and Mineralisation................................................................................................. 2
1.6 Deposit Types ..................................................................................................................................... 3
1.7 Mineral Resource Estimates ............................................................................................................... 3
1.8 Mining Methods ................................................................................................................................... 5
1.9 Metallurgy and Recovery Methods ..................................................................................................... 7
1.10 Project Infrastructure ........................................................................................................................... 9
1.11 Underground Infrastructure ............................................................................................................... 11
1.12 Services ............................................................................................................................................ 11
1.13 Contracts ........................................................................................................................................... 12
1.14 Environmental Studies, Permitting and Social Impacts .................................................................... 12
1.15 Capital and Operating Costs ............................................................................................................. 12
1.16 Economic Analysis ............................................................................................................................ 13
1.17 Adjacent Properties ........................................................................................................................... 15
1.18 Other Relevant Data and Information ............................................................................................... 15
1.19 Interpretation and Conclusions ......................................................................................................... 15
1.20 Comments and Recommendations ................................................................................................... 16
2 Introduction ................................................................................................................ 17
2.1 Scope of Work ................................................................................................................................... 17
2.2 Work Programme .............................................................................................................................. 18
2.3 Basis of Technical Report ................................................................................................................. 18
2.4 Qualifications of SRK and SRK Team .............................................................................................. 18
2.5 Acknowledgement ............................................................................................................................. 21
2.6 Declaration ........................................................................................................................................ 21
3 Reliance on Other Experts ......................................................................................... 22
3.1 Marketing .......................................................................................................................................... 22
4 Property Description and Location ........................................................................... 23
4.1 Property Location .............................................................................................................................. 23
4.2 Land Tenure ...................................................................................................................................... 24
4.3 Underlying Agreements .................................................................................................................... 27
4.4 Environmental Liability ...................................................................................................................... 27
FAIR\MULL\LIDB\EBBE\mota Pli014_Costerfield_Operations_Ni_43 101_Master_Rev0 28 March 2014
SRK Consulting Page vi
4.5 Royalties ........................................................................................................................................... 27
4.6 Taxes ................................................................................................................................................ 27
4.7 Legislation and Permitting ................................................................................................................. 27
5 Accessibility, Climate, Local Resources, Infrastructure and Physiography ......... 29
5.1 Accessibility ....................................................................................................................................... 29
5.2 Land Use ........................................................................................................................................... 29
5.3 Topography ....................................................................................................................................... 29
5.4 Climate .............................................................................................................................................. 29
5.5 Infrastructure and Local Resources .................................................................................................. 30
6 History ......................................................................................................................... 32
6.1 Introduction ....................................................................................................................................... 32
6.2 Ownership and Exploration Work ..................................................................................................... 32
6.2.1 Mid-East Minerals (1968 - 1971) ........................................................................................... 33
6.2.2 Metals Investment Holdings (1971) ....................................................................................... 33
6.2.3 Victorian Mines Department (1975 - 1981) ........................................................................... 33
6.2.4 Federation Resources NL (1983 - 2000) ............................................................................... 33
6.2.5 Australian Gold Development NL / Planet resource JV (AGD) (1987 - 1988) ...................... 33
6.2.6 Australian Gold Development NL (AGD) (1987 - 1997) ........................................................ 33
6.2.7 AGD Operations Pty Ltd (2001 – 2009) ................................................................................ 33
7 Geological Setting and Mineralisation ...................................................................... 37
7.1 Regional Geology.............................................................................................................................. 37
7.2 Property Geology .............................................................................................................................. 39
7.3 Property Mineralisation ..................................................................................................................... 41
7.4 Deposit Mineralisation ....................................................................................................................... 42
8 Deposit Types ............................................................................................................. 46
9 Exploration .................................................................................................................. 48
9.1 Costean / Trenching .......................................................................................................................... 48
9.2 Petrophysical Analysis ...................................................................................................................... 48
9.3 Geophysics ....................................................................................................................................... 48
9.3.1 Ground Geophysics ............................................................................................................... 48
9.3.2 Airborne Geophysics ............................................................................................................. 49
9.4 Geochemistry .................................................................................................................................... 49
9.4.1 Mobile Metal Ion (MMI) .......................................................................................................... 49
9.4.2 Bedrock Geochemistry .......................................................................................................... 49
9.5 Aerial Photogrammetry Survey ......................................................................................................... 53
9.6 Underground Face Sampling ............................................................................................................ 53
10 Drilling ......................................................................................................................... 54
10.1 Mandalay Resources (2009 – Present) ............................................................................................ 54
10.2 2009/ 2010 ........................................................................................................................................ 54
10.3 2010/ 2011 ........................................................................................................................................ 54
FAIR\MULL\LIDB\EBBE\mota Pli014_Costerfield_Operations_Ni_43 101_Master_Rev0 28 March 2014
SRK Consulting Page vii
10.4 2011/ 2012 ........................................................................................................................................ 55
10.5 2013 Cuffley Lode Drilling ................................................................................................................. 55
10.6 Jul – Dec 2013 Cuffley / N Lode Drilling ........................................................................................... 56
10.7 Drilling Methods ................................................................................................................................ 57
10.8 Collar Surveys ................................................................................................................................... 57
10.9 Downhole Surveys ............................................................................................................................ 59
10.10 Logging Procedures .......................................................................................................................... 59
10.11 Drilling Pattern and Quality ............................................................................................................... 60
10.11.1 Augusta ............................................................................................................................. 60
10.11.2 Cuffley ............................................................................................................................... 60
10.12 Interpretation of Drilling Results ........................................................................................................ 60
10.13 Factors that could Materially Impact Accuracy of Results ................................................................ 61
11 Sample Preparation, Analyses, and Security ........................................................... 63
11.1 Sampling Techniques ....................................................................................................................... 63
11.1.1 Diamond Core Sampling ....................................................................................................... 63
11.2 Data Spacing and Distribution .......................................................................................................... 63
11.3 Testing Laboratories ......................................................................................................................... 63
11.4 Sample Preparation .......................................................................................................................... 64
11.5 Sample Analysis ................................................................................................................................ 64
11.6 Laboratory Reviews .......................................................................................................................... 65
11.7 Assay Quality Assurance and Quality Control .................................................................................. 65
11.7.1 Standard Reference Material ................................................................................................ 65
11.7.2 Blank Material ........................................................................................................................ 69
11.7.3 Duplicate Assay Statistics ..................................................................................................... 70
11.7.4 Check Assay Program – Sample Pulps ................................................................................ 72
11.8 Sample Transport and Security ........................................................................................................ 75
11.9 Conclusions ....................................................................................................................................... 75
12 Data Verification ......................................................................................................... 77
13 Mineral Processing and Metallurgical Testing ......................................................... 79
13.1 Metallurgical Testing – Augusta ........................................................................................................ 79
13.1.1 Historical Testwork ................................................................................................................ 79
13.1.2 Recent Testwork ................................................................................................................... 82
13.1.3 Test Samples ........................................................................................................................ 84
13.1.4 Cuffley Lode Mineralisation ................................................................................................... 85
13.2 Stibnite Liberation ............................................................................................................................. 86
13.3 Gold Liberation .................................................................................................................................. 87
13.3.1 Cuffley Lode Hardness Comparison ..................................................................................... 88
13.3.2 Gravity and Flotation Recovery of the Cuffley Lode ............................................................. 89
13.4 Recovery Data on Augusta Orebody ................................................................................................ 90
13.4.1 Mineralogical Study ............................................................................................................... 90
FAIR\MULL\LIDB\EBBE\mota Pli014_Costerfield_Operations_Ni_43 101_Master_Rev0 28 March 2014
SRK Consulting Page viii
13.5 Mineral Processing............................................................................................................................ 90
14 Mineral Resource Estimates ...................................................................................... 92
14.1 Introduction ....................................................................................................................................... 92
14.2 Diamond Drillhole and Underground Face Sample Statistics ........................................................... 92
14.3 Data Interpretation and Domaining ................................................................................................... 96
14.4 Grade Capping .................................................................................................................................. 97
14.5 Estimation Domain Boundaries ....................................................................................................... 100
14.6 Dip Domains .................................................................................................................................... 103
14.7 Bulk Density Determinations ........................................................................................................... 106
14.8 Variography ..................................................................................................................................... 107
14.9 Estimation Parameters .................................................................................................................... 108
14.10 Block Model Estimation ................................................................................................................... 114
14.11 Block Model Validation .................................................................................................................... 114
14.12 Mineral Resource Classification ...................................................................................................... 121
14.13 Mineral Resources .......................................................................................................................... 121
14.14 Cut-off Grade Calculations .............................................................................................................. 127
14.15 Reconciliation .................................................................................................................................. 127
14.16 Comparison with Previous Mineral Resource Estimate .................................................................. 129
14.17 Other Material Factors .................................................................................................................... 129
15 Mineral Reserve Estimate ........................................................................................ 130
15.1 Modifying Factors ............................................................................................................................ 130
15.1.1 Mining Dilution and Recovery ............................................................................................. 130
15.1.2 Cut-off Grade ....................................................................................................................... 132
16 Mining Methods ........................................................................................................ 133
16.1 Introduction ..................................................................................................................................... 133
16.2 Geotechnical ................................................................................................................................... 134
16.2.1 Augusta Overview ............................................................................................................... 134
16.2.2 Cuffley Overview ................................................................................................................. 135
16.2.3 Rock stress .......................................................................................................................... 136
16.2.4 Stope Design Criteria .......................................................................................................... 136
16.2.5 Ground Support Requirements ........................................................................................... 138
16.2.6 Decline Location .................................................................................................................. 138
16.2.7 References .......................................................................................................................... 139
16.3 Augusta Mine Design ...................................................................................................................... 139
16.3.1 Method Selection ................................................................................................................. 139
16.3.2 Method Description ............................................................................................................. 139
16.3.3 Materials Handling ............................................................................................................... 141
16.4 Augusta Mine Design Guidelines .................................................................................................... 142
16.4.1 Design Parameters .............................................................................................................. 142
16.4.2 Mining Sequence ................................................................................................................. 142
FAIR\MULL\LIDB\EBBE\mota Pli014_Costerfield_Operations_Ni_43 101_Master_Rev0 28 March 2014
SRK Consulting Page ix
16.4.3 Level Development .............................................................................................................. 143
16.4.4 Vertical Development .......................................................................................................... 144
16.4.5 Augusta Design Inventory ................................................................................................... 144
16.5 Cuffley Mine Design ........................................................................................................................ 144
16.5.1 Mine Fill ............................................................................................................................... 145
16.5.2 Additional Geotechnical Work ............................................................................................. 145
16.6 Cuffley Mine Design Guidelines ...................................................................................................... 145
16.6.1 Design Parameters .............................................................................................................. 145
16.6.2 Mining Sequence ................................................................................................................. 146
16.6.3 Decline Development .......................................................................................................... 146
16.6.4 Level Development .............................................................................................................. 146
16.6.5 Vertical Development .......................................................................................................... 146
16.6.6 Stoping ................................................................................................................................ 146
16.6.7 Materials Handling ............................................................................................................... 147
16.6.8 Cuffley Design Inventory ..................................................................................................... 148
16.7 Ventilation ....................................................................................................................................... 148
16.7.1 Existing Circuit ..................................................................................................................... 148
16.7.2 Proposed Ventilation Circuit ................................................................................................ 149
16.7.3 Airflow Requirements .......................................................................................................... 149
16.7.4 Rise Sizes ........................................................................................................................... 151
16.7.5 Fan Duties ........................................................................................................................... 151
16.7.6 References .......................................................................................................................... 151
16.8 Backfill 152
16.9 Mine Services and Infrastructure .................................................................................................... 152
16.9.1 Electrical and Communications ........................................................................................... 152
16.9.2 Compressed Air ................................................................................................................... 153
16.9.3 Process and Potable Water ................................................................................................ 153
16.9.4 Explosives and Magazine ................................................................................................... 153
16.9.5 Emergency Egress .............................................................................................................. 154
16.9.6 Refuge Chambers ............................................................................................................... 154
16.10 Augusta Hydrogeology/ Dewatering ............................................................................................... 154
16.10.1 Hydrogeology .................................................................................................................. 154
16.10.2 Dewatering ...................................................................................................................... 156
16.11 Cuffley Hydrogeology / Dewatering ................................................................................................ 156
16.11.1 Hydrogeology .................................................................................................................. 156
16.11.2 Dewatering ...................................................................................................................... 157
16.12 Mineral Reserve Schedule .............................................................................................................. 157
16.12.1 Development Schedule ................................................................................................... 157
16.12.2 Equipment Requirements ............................................................................................... 158
16.12.3 Personnel ........................................................................................................................ 159
16.12.4 Labour Costs ................................................................................................................... 160
FAIR\MULL\LIDB\EBBE\mota Pli014_Costerfield_Operations_Ni_43 101_Master_Rev0 28 March 2014
SRK Consulting Page x
16.13 Schedule Summary ......................................................................................................................... 160
17 Recovery Methods .................................................................................................... 161
17.1 Brunswick Processing Plant ............................................................................................................ 161
17.1.1 Crushing and Screening Circuit .......................................................................................... 161
17.1.2 Milling Circuit ....................................................................................................................... 161
17.1.3 Flotation Circuit ................................................................................................................... 162
17.1.4 Concentrate Thickening Filtration ....................................................................................... 162
17.1.5 Tailings and Circuit .............................................................................................................. 162
17.1.6 Recovery ............................................................................................................................. 162
17.1.7 Concentrate Grade .............................................................................................................. 162
17.2 Plant Upgrade ................................................................................................................................. 166
17.2.1 Crushing and Screening Circuit .......................................................................................... 166
17.2.2 Milling Circuit ....................................................................................................................... 166
17.2.3 Flotation Circuit ................................................................................................................... 166
17.2.4 Concentrate Thickening and Filtration ................................................................................ 166
17.2.5 Tailings Circuit ..................................................................................................................... 166
17.2.6 Reagent Mixing and Storage ............................................................................................... 167
17.2.7 Recovery ............................................................................................................................. 167
17.2.8 Services ............................................................................................................................... 167
18 Project Infrastructure ............................................................................................... 169
18.1 Surface Infrastructure ..................................................................................................................... 169
18.2 Augusta Mine Underground Infrastructure ...................................................................................... 171
18.3 Tailings Storage .............................................................................................................................. 171
18.4 Power Supply .................................................................................................................................. 172
18.5 Power Reticulation .......................................................................................................................... 172
18.6 Water Supply ................................................................................................................................... 172
18.7 Waste Rock Storage ....................................................................................................................... 173
18.8 Water Management......................................................................................................................... 173
18.9 Augusta to Brunswick ROM Pad Transport .................................................................................... 174
18.10 Diesel Storage ................................................................................................................................. 174
18.11 Explosive Storage ........................................................................................................................... 174
18.12 Maintenance Facilities .................................................................................................................... 174
18.13 Housing and Land ........................................................................................................................... 174
19 Market Studies and Contracts ................................................................................. 176
19.1 Concentrate Transport .................................................................................................................... 176
19.2 Marketing ........................................................................................................................................ 176
19.3 Contracts ......................................................................................................................................... 178
20 Environmental Studies, Permitting, and Social or Community Impact ............... 179
20.1 Environment and Social Aspects .................................................................................................... 179
20.1.1 Mine Ventilation ................................................................................................................... 179
FAIR\MULL\LIDB\EBBE\mota Pli014_Costerfield_Operations_Ni_43 101_Master_Rev0 28 March 2014
SRK Consulting Page xi
20.1.2 Water Disposal .................................................................................................................... 179
20.1.3 Waste Rock ......................................................................................................................... 180
20.1.4 Tailings Disposal ................................................................................................................. 180
20.2 Impacts ............................................................................................................................................ 180
20.2.1 Air Quality ............................................................................................................................ 180
20.2.2 Groundwater ........................................................................................................................ 181
20.2.3 Noise ................................................................................................................................... 183
20.2.4 Blasting and Vibration ......................................................................................................... 183
20.2.5 Native Vegetation ................................................................................................................ 183
20.2.6 Visual Amenity ..................................................................................................................... 184
20.2.7 Heritage ............................................................................................................................... 184
20.2.8 Community .......................................................................................................................... 184
20.2.9 Mine Closure and Revegetation .......................................................................................... 185
20.3 Regulatory Approvals ...................................................................................................................... 185
20.3.1 Work Plan Variation ............................................................................................................. 185
20.3.2 Other Permitting .................................................................................................................. 186
20.4 References ...................................................................................................................................... 186
21 Capital and Operating Costs ................................................................................... 187
21.1 Capital Costs ................................................................................................................................... 187
21.1.1 Capital Lateral Development ............................................................................................... 187
21.1.2 Vertical Development .......................................................................................................... 188
21.1.3 Infrastructure ....................................................................................................................... 188
21.1.4 Mobile Plant ......................................................................................................................... 188
21.1.5 Processing Plant ................................................................................................................. 188
21.1.6 Drilling.................................................................................................................................. 188
21.1.7 Closure ................................................................................................................................ 189
21.2 Operating Costs .............................................................................................................................. 189
21.2.1 Lateral Development ........................................................................................................... 189
21.2.2 Production Stoping .............................................................................................................. 190
21.2.3 Augusta to Brunswick ROM Pad trucking ........................................................................... 190
21.2.4 Processing ........................................................................................................................... 190
21.3 Concentrate Selling Expenses ........................................................................................................ 190
21.4 Royalties and Compensation .......................................................................................................... 190
22 Economic Analysis ................................................................................................... 191
22.1 Introduction ..................................................................................................................................... 191
22.2 Principal Assumptions ..................................................................................................................... 191
22.2.1 Metal Sale Prices ................................................................................................................ 191
22.2.2 Concentrate Sales ............................................................................................................... 192
22.2.3 Exchange Rate .................................................................................................................... 192
22.2.4 Taxes ................................................................................................................................... 192
FAIR\MULL\LIDB\EBBE\mota Pli014_Costerfield_Operations_Ni_43 101_Master_Rev0 28 March 2014
SRK Consulting Page xii
22.2.5 Royalties / Agreements ....................................................................................................... 192
22.2.6 Reclamation ........................................................................................................................ 193
22.2.7 Project Financing ................................................................................................................. 193
22.3 Economic Summary ........................................................................................................................ 193
22.3.1 Sensitivity ............................................................................................................................ 193
23 Adjacent Properties .................................................................................................. 195
23.1 General Statement about Adjacent Properties ............................................................................... 195
24 Other Relevant Data and Information ..................................................................... 196
24.1 Remnant Mining .............................................................................................................................. 196
25 Interpretation and Conclusions............................................................................... 197
25.1 Geology ........................................................................................................................................... 197
25.2 Mining 198
26 Recommendations ................................................................................................... 199
26.1 Geology ........................................................................................................................................... 199
26.2 Mining 199
26.3 General ........................................................................................................................................... 199
27 References ................................................................................................................ 200
List of Tables Table 1-1: Augusta, Cuffley and Brunswick Mineral Resource Summary .................................................... 4
Table 1-2: Mineral Reserves at Costerfield, as of 31 December 2013 ......................................................... 6
Table 1-3: Costerfield Design Inventory by Deposit ...................................................................................... 7
Table 1-4: Costerfield Operation – Capital Cost Estimate .......................................................................... 13
Table 1-5: Costerfield Operation – Operating Cost Estimate ...................................................................... 13
Table 1-6: Project Criteria ........................................................................................................................... 14
Table 1-7: Project Economics ..................................................................................................................... 14
Table 2-1: List of Qualified Persons ............................................................................................................ 20
Table 4-1: Granted Tenement Details ......................................................................................................... 24
Table 6-1: Historical Drilling Statistics for the Costerfield Property ............................................................. 32
Table 10-1: Drillhole Summary ...................................................................................................................... 54
Table 10-2: Significant Cuffley Lode drillhole intercepts: January to July 2013 ............................................ 56
Table 10-3: Significant Cuffley / N Lode drillhole intercepts: July to December 2013 .................................. 56
Table 11-1: Summary of Onsite duplicate statistics ...................................................................................... 70
Table 11-2: Summary of Onsite versus ALS Gold Duplicate Statistics ......................................................... 72
Table 11-3: Summary of Onsite versus ALS Antimony Duplicate Statistics ................................................. 73
Table 13-1: Ore Characterisation testwork vs plant reconciled recovery results for Antimony..................... 80
Table 13-2: Ore Characterisation testwork vs plant reconciled recovery results for Gold ............................ 80
Table 13-3: Ore Characterisation testwork size range tested per test .......................................................... 82
Table 13-4: Testwork Schedule and Grades ................................................................................................. 82
FAIR\MULL\LIDB\EBBE\mota Pli014_Costerfield_Operations_Ni_43 101_Master_Rev0 28 March 2014
SRK Consulting Page xiii
Table 13-5: Amdel QEMSCAN Stibnite Liberation Table .............................................................................. 86
Table 13-6: Amdel QEMSCAN Gold Liberation Table .................................................................................. 87
Table 13-7: Antimony Recovery Comparison Cuffley Lode vs Augusta Orebody ........................................ 89
Table 13-8: Gold Recovery Comparison Cuffley Lode vs. Augusta Orebody .............................................. 90
Table 14-1: Face and diamond drilling sample statistics .............................................................................. 92
Table 14-2: Zone Code and Subdomain Coding for modelled Domains ...................................................... 97
Table 14-3: Samples affected by 150 g/t Au grade top cut ........................................................................... 99
Table 14-4: Gold statistics before and after 150 g/t top cuts ........................................................................ 99
Table 14-5: Accumulated Gold and Antimony statistics before and after top cuts ..................................... 100
Table 14-6: Variogram Model Parameters .................................................................................................. 112
Table 14-7: Search Parameters for first estimation run .............................................................................. 113
Table 14-8: Face Sample Block Model Dimensions ................................................................................... 114
Table 14-9: Drillhole Sample Block Model Dimensions .............................................................................. 114
Table 14-10: Mine Planning Regularised Block Model Dimensions ............................................................. 114
Table 14-11: Declustered top-cut sample grades compared to model grades ............................................. 115
Table 14-12: Declustered sample true thickness compared to model thickness .......................................... 116
Table 14-13: Augusta, Cuffley and Brunswick Mineral Resource Summary ................................................ 122
Table 14-14: Current Estimates Compared with the previous (December 2012) estimates for E, W, N Main and Cuffley lodes ......................................................................................................... 129
Table 15-1: Mineral Reserves at Costerfield, as of 31 December 2013 ..................................................... 130
Table 15-2: Augusta Recovery and Dilution Assumptions .......................................................................... 131
Table 16-1: Main Mine Design Parameters ................................................................................................. 137
Table 16-2: Mine Design Parameters.......................................................................................................... 142
Table 16-3: Augusta Design Inventory ........................................................................................................ 144
Table 16-4: Mine Design Parameters.......................................................................................................... 145
Table 16-5: Cuffley Stope and Development Inventory .............................................................................. 148
Table 16-6: Augusta Primary Flow to Match Diesel Flow ........................................................................... 150
Table 16-7: Proposed Cuffley Diesel Fleet and ventilation requirements ................................................... 150
Table 16-8: Cuffley Ventilation Operational Summary ................................................................................ 150
Table 16-9: Cuffley Rise sizes ..................................................................................................................... 151
Table 16-10: Current Augusta Licence Maximum Quantities and Types of Explosives ............................... 153
Table 16-11: Jumbo Production Rates .......................................................................................................... 157
Table 16-12: Handheld Production Rates ..................................................................................................... 158
Table 16-13: Augusta Underground Mobile Equipment Fleet ....................................................................... 158
Table 16-14: Personnel on Payroll by Department ....................................................................................... 159
Table 16-15: Underground Shift Mining Personnel ....................................................................................... 160
Table 16-16 Summary of design physicals .................................................................................................... 160
Table 17-1: Brunswick Mill production results for February 2012 to December 2013 ................................ 164
Table 17-2: Brunswick Mill concentrate production February 2012 to December 2013 ............................. 165
Table 18-1: Current Augusta Licence Maximum Quantities and Types of Explosives ............................... 174
Table 20-1: Permit Requirements ............................................................................................................... 186
FAIR\MULL\LIDB\EBBE\mota Pli014_Costerfield_Operations_Ni_43 101_Master_Rev0 28 March 2014
SRK Consulting Page xiv
Table 21-1: Costerfield Operation – Capital Cost Estimate ........................................................................ 187
Table 21-2: Operating Cost Inputs .............................................................................................................. 189
Table 21-3: Costerfield Operation - Operating Cost Summary ................................................................... 189
Table 21-4: Summary of Development requirements ................................................................................. 190
Table 22-1: Project Criteria ......................................................................................................................... 191
Table 22-2: Project Economics ................................................................................................................... 193
Table 22-3: Sensitivity at 5% NPV .............................................................................................................. 194
Table 23-1: Augusta Mine Adjacent Properties (DPL, 2012) ...................................................................... 195
Table 23-2: Distance from the Augusta Mine Site to Significant Central Victoria Mining Landmarks ........ 195
List of Figures Figure 1-1: Schematic of Augusta and Proposed Cuffley Underground Design ............................................ 5
Figure 1-2: Isometric of Cuffley Development ................................................................................................ 6
Figure 1-3: Historic Gold Recovery ................................................................................................................ 8
Figure 1-4: Historic Antimony Recovery ......................................................................................................... 8
Figure 1-5: Historic Monthly Throughput ........................................................................................................ 9
Figure 1-6: Augusta Mine Site ...................................................................................................................... 10
Figure 1-7: Brunswick Site Area ................................................................................................................... 11
Figure 1-8: Project Sensitivity ....................................................................................................................... 15
Figure 4-1: Costerfield Operation Location .................................................................................................. 23
Figure 4-2: Plan of Area – Mining Licence No: 4644 .................................................................................... 25
Figure 4-3: Current AGD Mining and Exploration Lease Boundaries (Mandalay, 2012) ............................. 26
Figure 5-1: Monthly Average Temperature and Rainfall .............................................................................. 30
Figure 5-2: Augusta Box-cut, Portal and Workshop ..................................................................................... 30
Figure 5-3: Aerial View of Brunswick Processing Plant and Brunswick Open Pit ........................................ 31
Figure 7-1: Geological Map of the Heathcote – Colbinabbin – Nagambie Region ...................................... 38
Figure 7-2: Costerfield Property Geology and Old Workings ....................................................................... 40
Figure 7-3: Two views of E Lode 1070 Level South, with annotation on right-hand side ............................ 41
Figure 7-4: Close-up of mineralisation in E Lode 1070 Level South ............................................................ 42
Figure 7-5: Deposit wireframes and underground development .................................................................. 43
Figure 7-6: Structural relationship between the Costerfield Thrust and the Augusta and Cuffley Lode systems ...................................................................................................................................... 44
Figure 8-1: Costerfield geological systems showing Brunswick, Bombay/Minerva, Cuffley and Augusta deposits ........................................................................................................................ 47
Figure 9-1: Augusta South Aircore Programme Results with Lode Locations ............................................. 50
Figure 9-2: Augusta South (Margaret Zone) – Auger drill 2011 bedrock geochemistry: antimony contours ..................................................................................................................................... 51
Figure 9-3: Auger geochemistry results displayed as antimony contours .................................................... 52
Figure 10-1: Collar Locations near Augusta and Cuffley lodes ...................................................................... 58
Figure 10-2: Cross section at 4430N through the Augusta deposit ............................................................... 61
Figure 11-1: G901-8 Gold Standard Reference Material – Assay Results for 2013 ...................................... 66
FAIR\MULL\LIDB\EBBE\mota Pli014_Costerfield_Operations_Ni_43 101_Master_Rev0 28 March 2014
SRK Consulting Page xv
Figure 11-2: G907-6 Gold Standard Reference Material – Assay Results for 2013 ...................................... 67
Figure 11-3: G906-8 Gold Standard Reference Material – Assay Results for 2013 ...................................... 67
Figure 11-4: MR11-01 Gold Standard Reference Material – Assay Results for 2013 .................................. 68
Figure 11-5: AGD08-01 Antimony Standard Reference Material – Assay Results for 2013 .......................... 68
Figure 11-6: MR11-01 Antimony Standard Reference Material – Assay Results for 2013 ............................ 69
Figure 11-7: Blank assay results for 2013 ...................................................................................................... 70
Figure 11-8: Scatter Plot for Onsite Gold Duplicates (g/t) .............................................................................. 71
Figure 11-9: Relative Paired Difference Plot for Onsite Gold Duplicates (g/t) ............................................... 71
Figure 11-10: Scatter Plot for Onsite versus ALS Gold Duplicates (g/t) .......................................................... 73
Figure 11-11: Scatter Plot for Onsite versus ALS Antimony Duplicates (%) .................................................... 74
Figure 11-12: Relative Paired Difference Plot for Onsite versus ALS Gold Duplicates (g/t) ............................ 74
Figure 11-13: Relative Paired Difference Plot for Onsite versus ALS Antimony Duplicates (%) ..................... 75
Figure 13-1: Ore Characterisation testwork (M2610) vs plant reconciled recovery ....................................... 81
Figure 13-2: Pre-Characterisation testwork flowsheet ................................................................................... 83
Figure 13-3: Longitudinal section of the Cuffley deposit intercepts as at January 2013 ................................ 84
Figure 13-4: Longitudinal section of the Cuffley deposit intercepts as at January 2013 ................................ 85
Figure 13-5: Amdel QEMSCAN Mineral Abundance ...................................................................................... 86
Figure 13-6: Amdel QEMSCAN Stibnite Liberation Visual Representation ................................................... 87
Figure 13-7: Amdel QEMSCAN Gold Liberation Visual Representation ........................................................ 88
Figure 13-8: Grind Establishment Testwork Comparisons at 75 µm .............................................................. 88
Figure 13-9: Grind Establishment Testwork Comparisons at 53 µm .............................................................. 89
Figure 13-10: Historic Monthly Throughput ...................................................................................................... 90
Figure 13-11: Historic Gold Recovery .............................................................................................................. 91
Figure 13-12: Historic Antimony Recovery ....................................................................................................... 91
Figure 14-1: Au grades for uncomposited face and diamond samples for East Lode ................................... 93
Figure 14-2: Au grades for uncomposited face and diamond samples for West Lode .................................. 94
Figure 14-3: Au grades for uncomposited face and diamond samples for N Main Lode ............................... 94
Figure 14-4: Sb grades for uncomposited face and diamond samples for East Lode ................................... 95
Figure 14-5: Sb grades for uncomposited face and diamond samples for West Lode .................................. 95
Figure 14-6: Sb grades for uncomposited face and diamond samples for N Main Lode ............................... 96
Figure 14-7: Log Probability Plot of Gold – Face Samples ............................................................................ 98
Figure 14-8: Log Probability Plot of Gold – Diamond Samples ...................................................................... 98
Figure 14-9: E Lode Estimation subdomain boundaries and composite samples ....................................... 101
Figure 14-10: W Lode Estimation subdomain boundaries and composite samples ...................................... 101
Figure 14-11: N Main Lode Estimation subdomain boundaries and composite samples .............................. 102
Figure 14-12: Cuffley Lode Estimation subdomain boundaries and composite samples .............................. 102
Figure 14-13: E Lode Dip – Dip Direction Domains Coloured by Dip ............................................................ 103
Figure 14-14: E Lode Dip – Dip Direction Domains Coloured by Dip Direction ............................................. 104
Figure 14-15: W Lode Dip – Dip Direction Domains Coloured by Dip ........................................................... 104
Figure 14-16: W Lode Dip – Dip Direction Domains Coloured by Dip Direction ............................................ 105
Figure 14-17: N Main Lode Dip – Dip Direction Domains Coloured by Dip ................................................... 105
FAIR\MULL\LIDB\EBBE\mota Pli014_Costerfield_Operations_Ni_43 101_Master_Rev0 28 March 2014
SRK Consulting Page xvi
Figure 14-18: N Main Lode Dip – Dip Direction Domains with Dip Direction legend ..................................... 106
Figure 14-19: Bulk Density Determinations .................................................................................................... 107
Figure 14-20: Nugget variogram for W Lode subdomain 201 ........................................................................ 109
Figure 14-21: Primary direction variogram for W Lode subdomain 201 ......................................................... 109
Figure 14-22: Secondary direction variogram for W Lode subdomain 201 .................................................... 110
Figure 14-23: Nugget variogram for N Main Lode subdomain 201 ................................................................ 110
Figure 14-24: Primary direction variogram for N Main Lode subdomain 401................................................. 111
Figure 14-25: Secondary direction variogram for N Main Lode subdomain 401 ............................................ 111
Figure 14-26: W Lode HG Subdomain 201 Thickness Swath Plot by Northing ............................................. 116
Figure 14-27: W Lode HG Subdomain 201 Au Swath Plot by Northing ......................................................... 117
Figure 14-28: W Lode HG Subdomain 201 Sb Swath Plot by Northing ......................................................... 117
Figure 14-29: N Lode HG Subdomain 401 Thickness Swath Plot by Northing .............................................. 118
Figure 14-30: N Lode HG Subdomain 401 Au Swath Plot by Northing .......................................................... 118
Figure 14-31: N Lode HG Subdomain 401 Sb Swath Plot by Northing .......................................................... 119
Figure 14-32: Cuffley Lode Thickness Swath Plot by Northing ...................................................................... 119
Figure 14-33: Cuffley Lode Au Swath Plot by Northing .................................................................................. 120
Figure 14-34: Cuffley Lode Sb Swath Plot by Northing .................................................................................. 120
Figure 14-35: E Lode Resource Block Model with Resource Category Boundaries (black) .......................... 123
Figure 14-36: W Lode Resource Block Model with Resource Category Boundaries (black) ......................... 124
Figure 14-37: N Main Lode Block Model with Resource Category Boundaries (black) ................................. 124
Figure 14-38: Cuffley Lode Block Model with Resource Category Boundaries ............................................. 125
Figure 14-39: B, K and P Lode Block Models with Resource Category Boundaries ..................................... 125
Figure 14-40: N E AND N SW Lode Block Models with Resource Category Boundaries .............................. 126
Figure 14-41: NW Lode Block Model with Resource Category Boundary ..................................................... 126
Figure 14-42: Brunswick 2009 Mineral Resource Estimate Longitudinal Projection ...................................... 127
Figure 14-43: Mill Reconciliation – Dry Tonnes .............................................................................................. 128
Figure 14-44: Mill Reconciliation – Gold (oz) ................................................................................................. 128
Figure 14-45: Mill Reconciliation – Antimony (t) ............................................................................................. 128
Figure 16-1: Section Augusta and Proposed Cuffley Underground Design ................................................. 133
Figure 16-2: Schematic of Augusta and Proposed Cuffley Underground Design ........................................ 133
Figure 16-3: Geotechnical Domains – Section 5,010 mN ............................................................................ 136
Figure 16-4: Augusta Longhole CRF Stoping Method (after Potvin, Thomas, Fourie; 2005) ...................... 140
Figure 16-5: Augusta Half Upper Mining Method (Marshall, 2010) .............................................................. 141
Figure 16-6: Long section of Augusta stoping between 1015 mRL and 989 mRL ....................................... 143
Figure 16-7: Typical Section Looking North through Augusta Level Development ...................................... 143
Figure 16-8: Long Section of Cuffley stoping areas ..................................................................................... 147
Figure 16-9: Proposed Cuffley Ventilation Circuit ........................................................................................ 149
Figure 16-10: Conceptual cross section of the groundwater flow paths ........................................................ 155
Figure 16-11: Groundwater elevation contour map of the areas surrounding the Augusta Mine .................. 155
Figure 17-1: Brunswick Processing Plant Flowsheet ................................................................................... 163
Figure 17-2: Brunswick Processing Plant Proposed Upgrade Flowsheet .................................................... 168
FAIR\MULL\LIDB\EBBE\mota Pli014_Costerfield_Operations_Ni_43 101_Master_Rev0 28 March 2014
SRK Consulting Page xvii
Figure 18-1: Augusta Mine Site .................................................................................................................... 169
Figure 18-2: Brunswick Site Area ................................................................................................................. 170
Figure 19-1: World Antimony production and consumption, 2000 – 2011 (t Antimony) ............................... 177
Figure 19-2: World Antimony demand and supply forecast, 2000 – 2016 (t Antimony) ............................... 178
Figure 19-3: China trends in domestic FOB prices for Antimony metal and trioxide ................................... 178
Figure 20-1: Groundwater elevation contour map of the areas surrounding the Augusta Mine as at February 2014 .......................................................................................................................... 182
Figure 22-1: AUD: USD Exchange Rate Chart ............................................................................................ 192
Figure 22-2: Sensitivity Analysis ................................................................................................................... 194
Figure 23-1: Augusta Mine Adjacent Properties ........................................................................................... 195
FAIR\MULL\LIDB\EBBE\mota Pli014_Costerfield_Operations_Ni_43 101_Master_Rev0 28 March 2014
SRK Consulting Page xviii
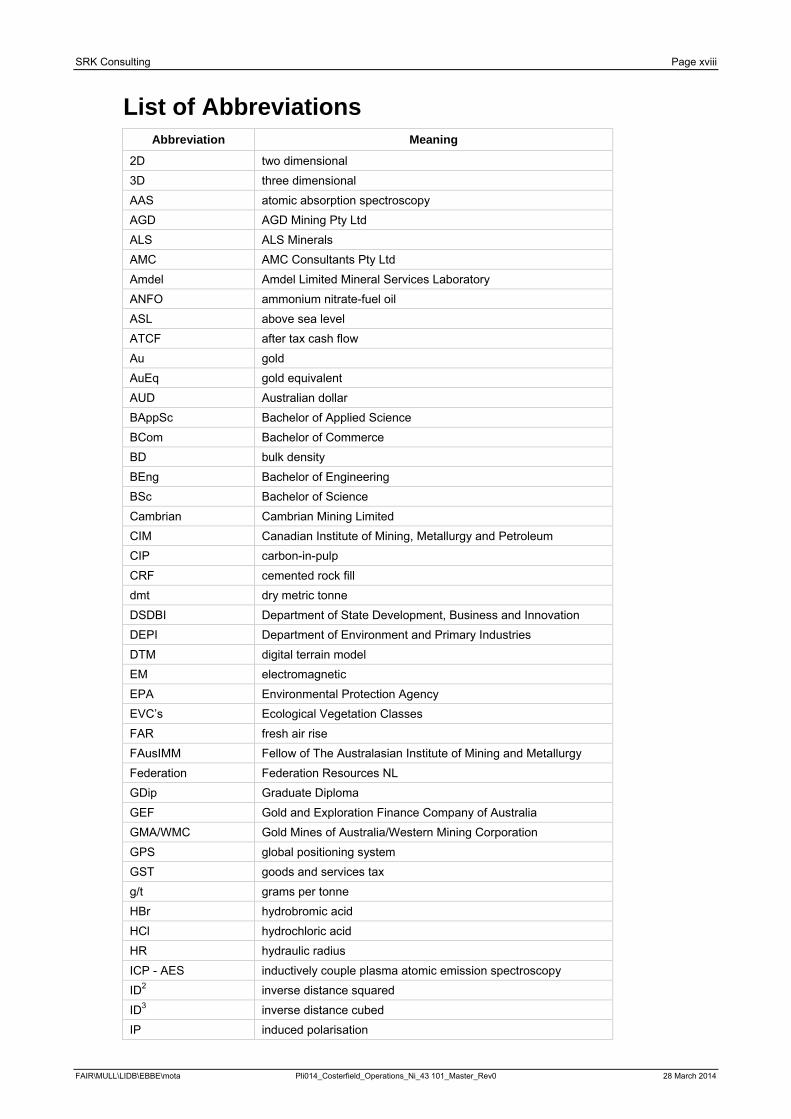
List of Abbreviations Abbreviation Meaning
2D two dimensional 3D three dimensional AAS atomic absorption spectroscopy AGD AGD Mining Pty Ltd ALS ALS Minerals AMC AMC Consultants Pty Ltd Amdel Amdel Limited Mineral Services Laboratory ANFO ammonium nitrate-fuel oil ASL above sea level ATCF after tax cash flow Au gold AuEq gold equivalent AUD Australian dollar BAppSc Bachelor of Applied Science BCom Bachelor of Commerce BD bulk density BEng Bachelor of Engineering BSc Bachelor of Science Cambrian Cambrian Mining Limited CIM Canadian Institute of Mining, Metallurgy and Petroleum CIP carbon-in-pulp CRF cemented rock fill dmt dry metric tonne DSDBI Department of State Development, Business and Innovation DEPI Department of Environment and Primary Industries DTM digital terrain model EM electromagnetic EPA Environmental Protection Agency EVC’s Ecological Vegetation Classes FAR fresh air rise FAusIMM Fellow of The Australasian Institute of Mining and Metallurgy Federation Federation Resources NL GDip Graduate Diploma GEF Gold and Exploration Finance Company of Australia GMA/WMC Gold Mines of Australia/Western Mining Corporation GPS global positioning system GST goods and services tax g/t grams per tonne HBr hydrobromic acid HCl hydrochloric acid HR hydraulic radius ICP - AES inductively couple plasma atomic emission spectroscopy ID2 inverse distance squared ID3 inverse distance cubed IP induced polarisation
FAIR\MULL\LIDB\EBBE\mota Pli014_Costerfield_Operations_Ni_43 101_Master_Rev0 28 March 2014
SRK Consulting Page xix
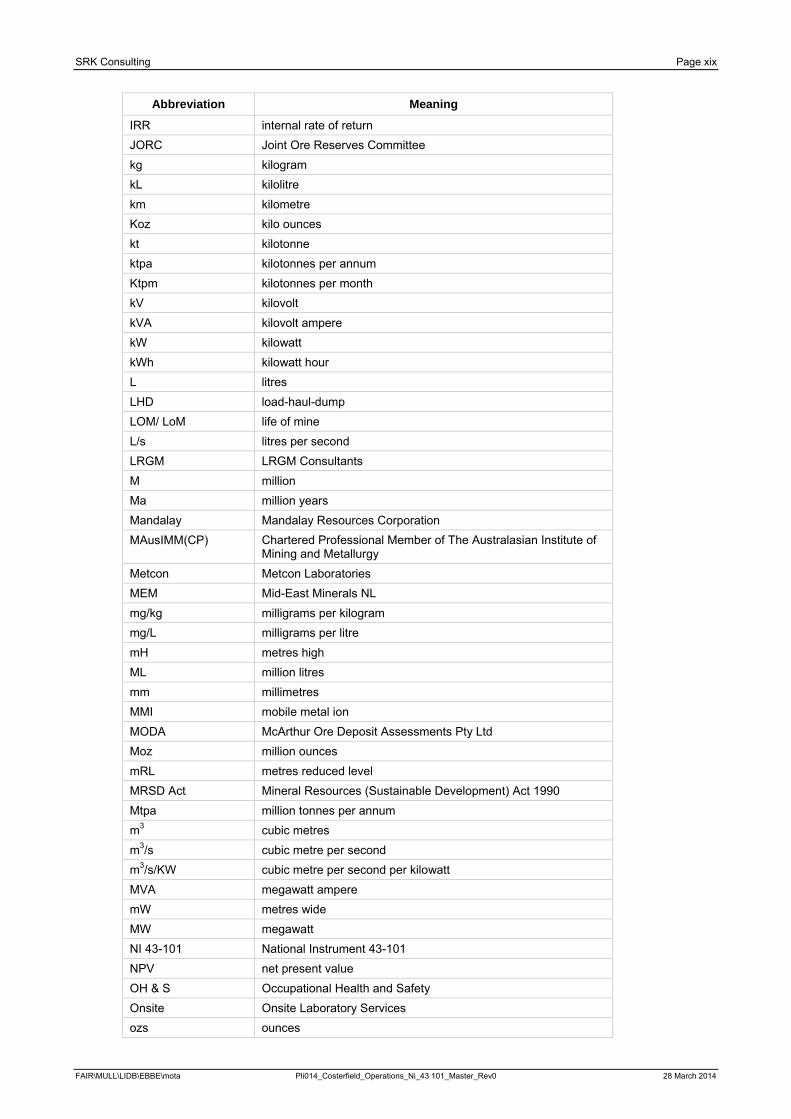
Abbreviation Meaning
IRR internal rate of return JORC Joint Ore Reserves Committee kg kilogram kL kilolitre km kilometre Koz kilo ounces kt kilotonne ktpa kilotonnes per annum Ktpm kilotonnes per month kV kilovolt kVA kilovolt ampere kW kilowatt kWh kilowatt hour L litres LHD load-haul-dump LOM/ LoM life of mine L/s litres per second LRGM LRGM Consultants M million Ma million years Mandalay Mandalay Resources Corporation MAusIMM(CP) Chartered Professional Member of The Australasian Institute of
Mining and Metallurgy Metcon Metcon Laboratories MEM Mid-East Minerals NL mg/kg milligrams per kilogram mg/L milligrams per litre mH metres high ML million litres mm millimetres MMI mobile metal ion MODA McArthur Ore Deposit Assessments Pty Ltd Moz million ounces mRL metres reduced level MRSD Act Mineral Resources (Sustainable Development) Act 1990 Mtpa million tonnes per annum m3 cubic metres m3/s cubic metre per second m3/s/KW cubic metre per second per kilowatt MVA megawatt ampere mW metres wide MW megawatt NI 43-101 National Instrument 43-101 NPV net present value OH & S Occupational Health and Safety Onsite Onsite Laboratory Services ozs ounces
FAIR\MULL\LIDB\EBBE\mota Pli014_Costerfield_Operations_Ni_43 101_Master_Rev0 28 March 2014
SRK Consulting Page xx
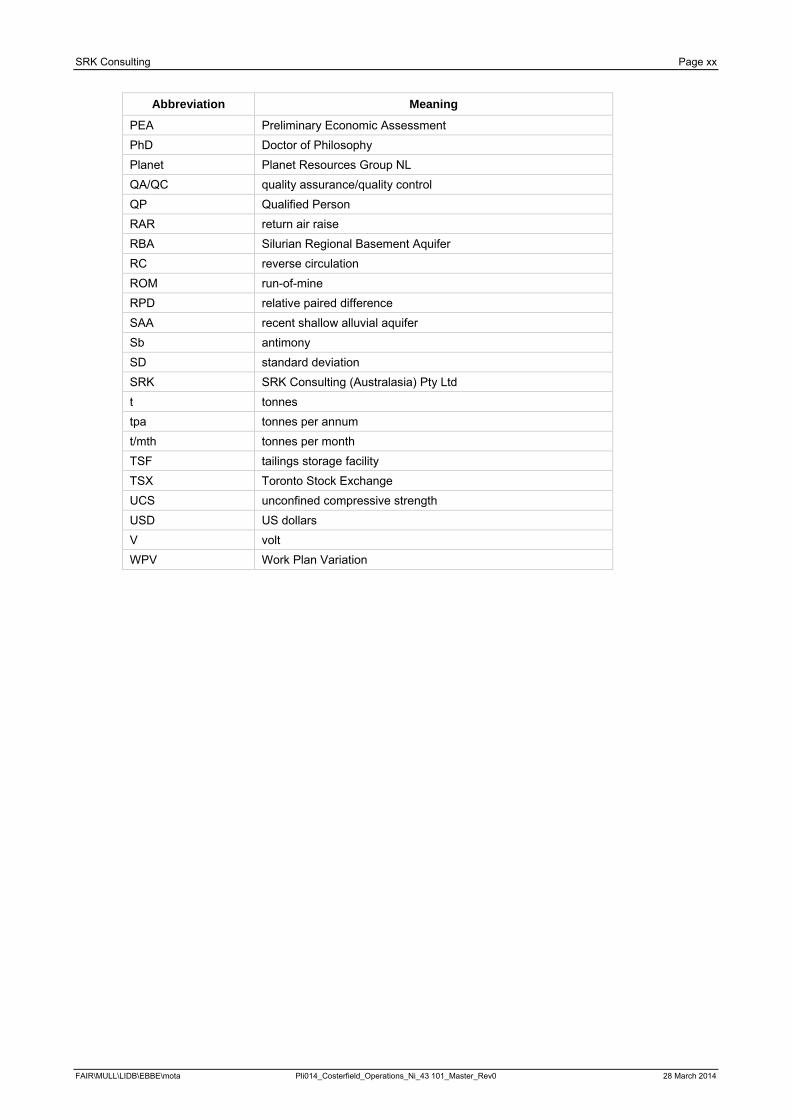
Abbreviation Meaning
PEA Preliminary Economic Assessment PhD Doctor of Philosophy Planet Planet Resources Group NL QA/QC quality assurance/quality control QP Qualified Person RAR return air raise RBA Silurian Regional Basement Aquifer RC reverse circulation ROM run-of-mine RPD relative paired difference SAA recent shallow alluvial aquifer Sb antimony SD standard deviation SRK SRK Consulting (Australasia) Pty Ltd t tonnes tpa tonnes per annum t/mth tonnes per month TSF tailings storage facility TSX Toronto Stock Exchange UCS unconfined compressive strength USD US dollars V volt WPV Work Plan Variation
FAIR\MULL\LIDB\EBBE\mota Pli014_Costerfield_Operations_Ni_43 101_Master_Rev0 28 March 2014
SRK Consulting Page 1
1 Summary 1.1 Introduction
SRK Consulting (Australasia) Pty Ltd (SRK) has prepared the Costerfield Operation NI 43-101 Technical Report for the continuing operations at Augusta Mine in connection with the addition of mineralisation sourced from the Cuffley Lode. This report updates the finding of the Preliminary Economic Assessment (PEA 2013) previously reported in SRK Consulting (Australasia) Pty Ltd’s NI 43-101 report filed October 10, 2013.
This Technical Report is based on Mineral Resources that conform to Canadian Securities Administrators’ National Instrument 43-101 Standards of Disclosure for Mineral Projects (NI 43-101).
Mandalay Resources Corporation (Mandalay) is a publicly traded company listed on the Toronto Stock Exchange and trading under the symbol MND. On 1 December 2009, Mandalay completed the acquisition of AGD Mining Pty Ltd (AGD), the sole owner of the Costerfield Operation, resulting in AGD becoming a wholly-owned subsidiary of Mandalay.
The Costerfield Operation is located within the Costerfield mining district, approximately 10 km northeast of the town of Heathcote, Victoria. The Augusta Mine has been operational since 2006 and has been the sole ore source for the Brunswick Processing Plant. The Cuffley Lode located approximately 500 m to the north of the existing Augusta mine workings is proposed to supplement the current Augusta Mine and extend the life of the Costerfield Operation.
1.2 Property Description and Location The Costerfield Operation encompasses the underground Augusta Mine, the Brunswick Processing Plant, the Cuffley Lode deposit and associated infrastructure, all of which is located within mining licence MIN4644. The mining licence is located with exploration lease EL3310 which is held 100% by AGD.
The Augusta Mine is located at latitude of 36° 52’ 27” south and longitude 144° 47’ 38” east. The Brunswick Processing Plant is located approximately 2 km northwest of Augusta. The Cuffley Lode is located approximately 500 m north-northwest of the Augusta workings and is planned to be accessed by an underground decline from Augusta.
1.3 Accessibility, Climate, Local Resources, Infrastructure and Physiography Access to the Costerfield Operation is via the sealed Heathcote–Nagambie Road, which is accessed off the Northern Highway to the south of Heathcote. The Northern Highway links Bendigo with Melbourne.
The nearest significant population to Costerfield is Bendigo with a population of approximately 90,000 people, located 50 km to the west-northwest. The Costerfield Operation is a residential operation with personnel residing throughout central Victoria, as well as in Melbourne. Local infrastructure and services are available in Heathcote, the largest town within the vicinity of the Costerfield Operation.
The Augusta Mine site is located on privately held land, while the Brunswick Processing Plant site is located on unrestricted Crown land. The surrounding land is largely rocky, rugged hill country administered by the Department of Environment and Primary Industries (DEPI) as State Forest. The Puckapunyal Military Area is located on the eastern boundary of the Project Area.
PFAIR\MULL\LIDB\EBBE\mota Pli014_Costerfield_Operations_Ni_43 101_Master_Rev0 28 March 2014
SRK Consulting Page 2
The area has Mediterranean climate with temperature ranges from -2°C in winter (May to August) to +40°C in summer (November to February). Annual rainfall in the area is approximately 500 mm to 600 mm, with the majority occurring between April and October. The annual pan evaporation is between 1,300 mm to 1,400 mm.
The weather is amendable to year round mining operations; however, construction activity is restricted to the summer months as high winter rainfall can lead to saturated ground conditions that can affect surface activities.
1.4 History Exploration for antimony gold deposits in the Costerfield area of Central Victoria started in the early 1850s and resulted in the discovery of the main Costerfield Reef in 1860. At around the same time, the ‘Kelburn (Alison) Reef’ and Tait’s Reef were discovered at South Costerfield.
The Alison Mine ceased operations in 1923, while the South Costerfield/ Tait’s Mine operated sporadically from the 1860s until 1978 and was the last shaft mine to operate on the field.
In 1970, Mid-East Minerals NL identified a large bedrock geochemistry anomaly south of Tait’s Shaft, which they called ‘Tait-Margaret’. This was subsequently drilled by the Mines Department in 1977 and mineralised veins were intersected.
It was not until 2001 that AGD drilled the ‘Tait-Margaret’ anomaly, which was re-named ‘Augusta’. AGD commenced underground mining of the Augusta resource (N, C, W and E Lodes) in 2006. Between November 2006 and May 2012, 249,751 t at 7.7 g/t gold and 4.2% antimony was processed from the Augusta Mine yielding 10,459 t of antimony and 61,833 oz of gold.
Brownfield exploration core drilling by Mandalay in 2011 located a faulted offset of the Alison Lode beneath the old Alison Mine and New Alison Mine workings. The deeper offset mineralisation was renamed the Cuffley Lode. Subsequent definition drilling throughout 2011 and 2012 resulted in an initial Inferred Resource for the Cuffley Lode being established in January 2012. This Inferred Resource was further increased and a Mineral Resource Estimate was published in September 2013.
1.5 Geological Setting and Mineralisation The Costerfield Gold-Antimony field is located within the Costerfield Dome, in the Melbourne Zone, which consists of a very thick sequence of Siluro-Devonian marine sedimentary rocks.
The western boundary of the Costerfield Dome is demarcated by the Cambrian Heathcote Volcanic Belt and north trending Mt William Fault. The Mt William Fault is a major structural terrain boundary that separates the Bendigo Zone from the Melbourne Zone. The Dome is bounded to the east by the Moormbool Fault which has truncated the eastern limb of the Costerfield Anticline, resulting in an asymmetric dome structure.
The quartz-stibnite lodes are controlled by north-northwest trending faults and fractures located predominantly near the crest, on the western flank of the Costerfield Dome.
The Augusta Lodes comprise sub-parallel, west-dipping, quartz-stibnite veins denoted (from west to east) ‘N Lode’, ‘W Lode’, ‘E Lode’ as well as a number of additional veins, all of which are located in the west-dipping Costerfield Siltstone host-rock. Mining has demonstrated that mineralised splay veins and that oblique, cross-cutting fault structures influence grade in the north-northwest trending lodes. The lodes can vary from massive stibnite with microscopic gold to quartz-stibnite with minor visible gold, pyrite and arsenopyrite. In some cases, gold occurs in quartz veins with little or no stibnite. The Augusta Mine is currently extracting ore from the W Lode, E Lode and N Lode.
PFAIR\MULL\LIDB\EBBE\mota Pli014_Costerfield_Operations_Ni_43 101_Master_Rev0 28 March 2014
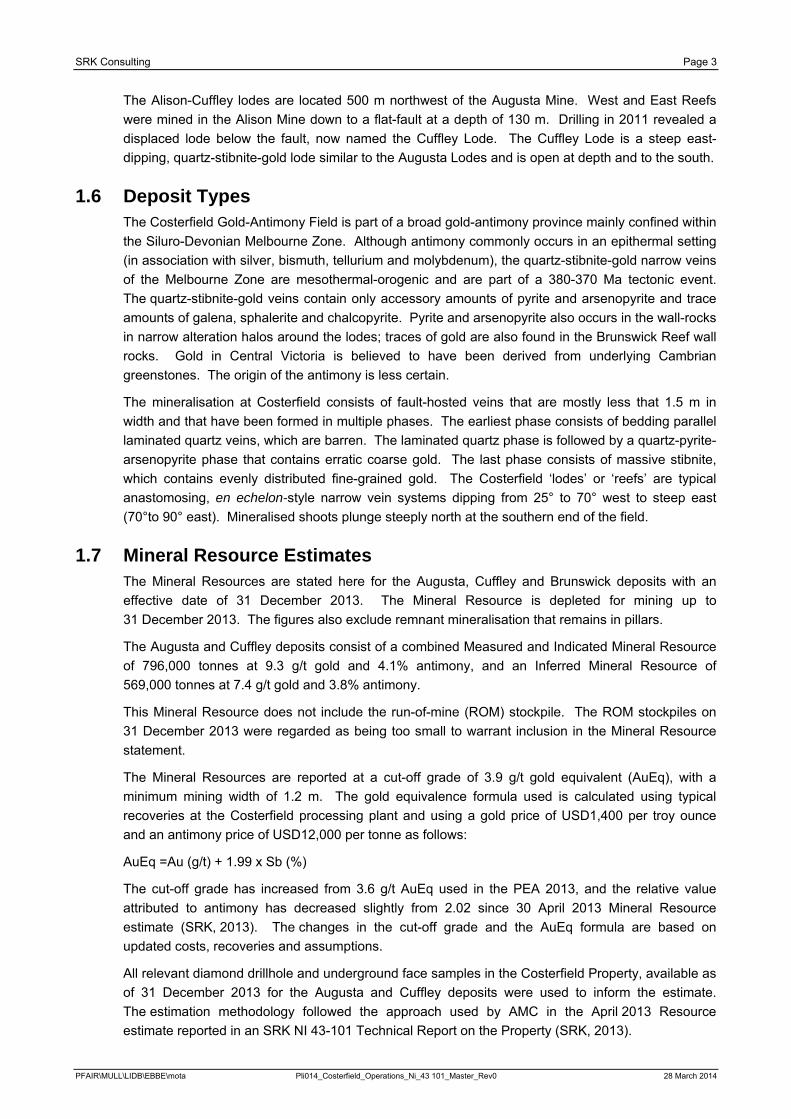
SRK Consulting Page 3
The Alison-Cuffley lodes are located 500 m northwest of the Augusta Mine. West and East Reefs were mined in the Alison Mine down to a flat-fault at a depth of 130 m. Drilling in 2011 revealed a displaced lode below the fault, now named the Cuffley Lode. The Cuffley Lode is a steep east-dipping, quartz-stibnite-gold lode similar to the Augusta Lodes and is open at depth and to the south.
1.6 Deposit Types The Costerfield Gold-Antimony Field is part of a broad gold-antimony province mainly confined within the Siluro-Devonian Melbourne Zone. Although antimony commonly occurs in an epithermal setting (in association with silver, bismuth, tellurium and molybdenum), the quartz-stibnite-gold narrow veins of the Melbourne Zone are mesothermal-orogenic and are part of a 380-370 Ma tectonic event. The quartz-stibnite-gold veins contain only accessory amounts of pyrite and arsenopyrite and trace amounts of galena, sphalerite and chalcopyrite. Pyrite and arsenopyrite also occurs in the wall-rocks in narrow alteration halos around the lodes; traces of gold are also found in the Brunswick Reef wall rocks. Gold in Central Victoria is believed to have been derived from underlying Cambrian greenstones. The origin of the antimony is less certain.
The mineralisation at Costerfield consists of fault-hosted veins that are mostly less that 1.5 m in width and that have been formed in multiple phases. The earliest phase consists of bedding parallel laminated quartz veins, which are barren. The laminated quartz phase is followed by a quartz-pyrite-arsenopyrite phase that contains erratic coarse gold. The last phase consists of massive stibnite, which contains evenly distributed fine-grained gold. The Costerfield ‘lodes’ or ‘reefs’ are typical anastomosing, en echelon-style narrow vein systems dipping from 25° to 70° west to steep east (70°to 90° east). Mineralised shoots plunge steeply north at the southern end of the field.
1.7 Mineral Resource Estimates The Mineral Resources are stated here for the Augusta, Cuffley and Brunswick deposits with an effective date of 31 December 2013. The Mineral Resource is depleted for mining up to 31 December 2013. The figures also exclude remnant mineralisation that remains in pillars.
The Augusta and Cuffley deposits consist of a combined Measured and Indicated Mineral Resource of 796,000 tonnes at 9.3 g/t gold and 4.1% antimony, and an Inferred Mineral Resource of 569,000 tonnes at 7.4 g/t gold and 3.8% antimony.
This Mineral Resource does not include the run-of-mine (ROM) stockpile. The ROM stockpiles on 31 December 2013 were regarded as being too small to warrant inclusion in the Mineral Resource statement.
The Mineral Resources are reported at a cut-off grade of 3.9 g/t gold equivalent (AuEq), with a minimum mining width of 1.2 m. The gold equivalence formula used is calculated using typical recoveries at the Costerfield processing plant and using a gold price of USD1,400 per troy ounce and an antimony price of USD12,000 per tonne as follows:
AuEq =Au (g/t) + 1.99 x Sb (%)
The cut-off grade has increased from 3.6 g/t AuEq used in the PEA 2013, and the relative value attributed to antimony has decreased slightly from 2.02 since 30 April 2013 Mineral Resource estimate (SRK, 2013). The changes in the cut-off grade and the AuEq formula are based on updated costs, recoveries and assumptions.
All relevant diamond drillhole and underground face samples in the Costerfield Property, available as of 31 December 2013 for the Augusta and Cuffley deposits were used to inform the estimate. The estimation methodology followed the approach used by AMC in the April 2013 Resource estimate reported in an SRK NI 43-101 Technical Report on the Property (SRK, 2013).
PFAIR\MULL\LIDB\EBBE\mota Pli014_Costerfield_Operations_Ni_43 101_Master_Rev0 28 March 2014
SRK Consulting Page 4
Mineral Resources for Brunswick have not been re-estimated since they were last reported in 2009 (Fredericksen, 2009). No drilling or mining has occurred on these structures since then. The Brunswick Mineral Resources are restated here for consistency with the other Costerfield lodes with an updated cut-off grade of 3.9 g/t AuEq and a 1.2 m minimum mining width criterion.
The effective date for the Brunswick Mineral Resources is 31 December 2013. Previously reported Indicated Resources for the Brunswick Deposit have been classified as Inferred by SRK. A review of the available data could not support the Indicated classification due to discrepancies in the QA/QC data as previously reported in Frederickson, 2009, and the absence of reconciliation data which might have supported the Indicated resource classification. SRK has reviewed the work carried out in 2009 and the author, Bob Lidbury, takes Qualified Person responsibility for the restated Mineral Resources.
Gold and antimony grades and lode thickness were estimated using the two dimensional (2D) accumulation method. The 2D accumulation method requires that gold and antimony are multiplied by true thickness to give a gold accumulation and antimony accumulation. This method correctly assigns weights to composites of different lengths during estimation. The interpolation method used was ordinary kriging. The estimated grade is then back-calculated by dividing estimated gold accumulation and estimated antimony accumulation by estimated true thickness.
A summary of the Augusta, Cuffley and Brunswick Mineral Resources is stated in Table 1-1.
Table 1-1: Augusta, Cuffley and Brunswick Mineral Resource Summary
Resource Category Tonnes Au (g/t) Sb (%) AuEq (g/t)
Measured 191,000 8.4 4.3 16.8
Indicated 605,000 9.6 3.7 17.6
Measured + Indicated 796,000 9.3 4.1 17.5
Inferred 569,000 7.4 3.8 14.8
Notes to Table 1-1: 1. CIM definitions followed for classification of Measured, Indicated, and Inferred Resources. 2. Mineral Resources estimated as of 31 December 2013, and depleted for production through 31 December 2013. 3. Mineral Resources stated according to CIM guidelines and include Mineral Reserves. 4. Totals may appear different from the sum of their components due to rounding. 5. A 3.9 g/t Au Equivalent (AuEq) cut-off grade over a minimum mining width of 1.2 m is applied where AuEq is calculated
at a gold price of USD1,400/oz and an antimony price of USD12,000/t. 6. The Au Equivalent value (AuEq) is calculated using the formula: AuEq = Au g/t + 1.99 * Sb%. 7. The cut-off grade has increased from 3.6 g/t AuEq used in the 31 June 2013, Mineral Resource estimate due to
changes in the minimum mining width, metal price assumptions, updated costings, recoveries and other assumptions. 8. The Brunswick Mineral Resource has not been re-estimated since it was reported in Frederickson, D., 2009,
Costerfield Gold and Antimony Project, Augusta and Brunswick Deposits, Frederickson Geological Solutions Pty Ltd. 9. Previously reported Indicated Resources for the Brunswick Deposit have been classified as Inferred by SRK here.
A review of the available data could not support the Indicated classification due to discrepancies in the QA/QC data as previously reported in Frederickson, 2009, and the absence of reconciliation data.
10. The Mineral Resource estimation for Augusta was performed by Bob Lidbury, fulltime employee of SRK Consulting, BSc, MAIG, who is a Qualified Person under NI 43-101 and is the Competent Person for the Augusta Mineral Resource Estimates.
11. Bob Lidbury, BSc, MAIG, fulltime employee of SRK Consulting is a Qualified Person under NI 43-101 and is the Competent Person for the Brunswick Mineral Resource Estimate.
PFAIR\MULL\LIDB\EBBE\mota Pli014_Costerfield_Operations_Ni_43 101_Master_Rev0 28 March 2014
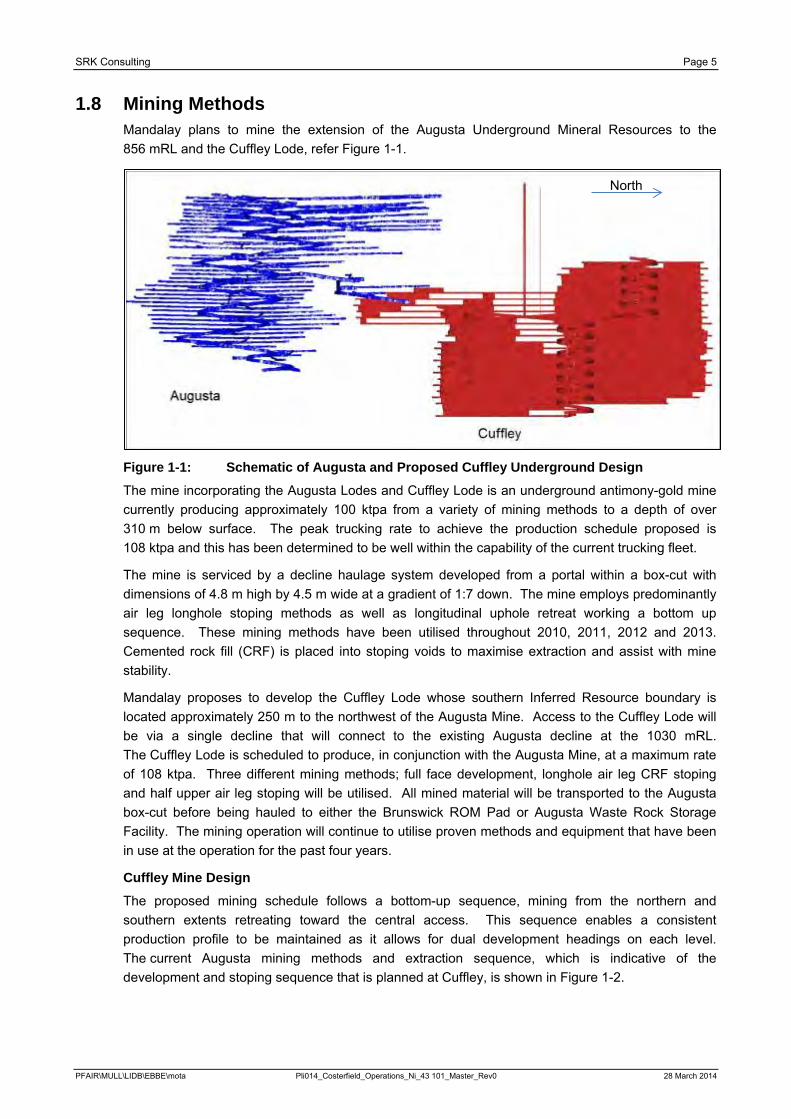
SRK Consulting Page 5
1.8 Mining Methods Mandalay plans to mine the extension of the Augusta Underground Mineral Resources to the 856 mRL and the Cuffley Lode, refer Figure 1-1.
Figure 1-1: Schematic of Augusta and Proposed Cuffley Underground Design
The mine incorporating the Augusta Lodes and Cuffley Lode is an underground antimony-gold mine currently producing approximately 100 ktpa from a variety of mining methods to a depth of over 310 m below surface. The peak trucking rate to achieve the production schedule proposed is 108 ktpa and this has been determined to be well within the capability of the current trucking fleet.
The mine is serviced by a decline haulage system developed from a portal within a box-cut with dimensions of 4.8 m high by 4.5 m wide at a gradient of 1:7 down. The mine employs predominantly air leg longhole stoping methods as well as longitudinal uphole retreat working a bottom up sequence. These mining methods have been utilised throughout 2010, 2011, 2012 and 2013. Cemented rock fill (CRF) is placed into stoping voids to maximise extraction and assist with mine stability.
Mandalay proposes to develop the Cuffley Lode whose southern Inferred Resource boundary is located approximately 250 m to the northwest of the Augusta Mine. Access to the Cuffley Lode will be via a single decline that will connect to the existing Augusta decline at the 1030 mRL. The Cuffley Lode is scheduled to produce, in conjunction with the Augusta Mine, at a maximum rate of 108 ktpa. Three different mining methods; full face development, longhole air leg CRF stoping and half upper air leg stoping will be utilised. All mined material will be transported to the Augusta box-cut before being hauled to either the Brunswick ROM Pad or Augusta Waste Rock Storage Facility. The mining operation will continue to utilise proven methods and equipment that have been in use at the operation for the past four years.
Cuffley Mine Design
The proposed mining schedule follows a bottom-up sequence, mining from the northern and southern extents retreating toward the central access. This sequence enables a consistent production profile to be maintained as it allows for dual development headings on each level. The current Augusta mining methods and extraction sequence, which is indicative of the development and stoping sequence that is planned at Cuffley, is shown in Figure 1-2.
North
PFAIR\MULL\LIDB\EBBE\mota Pli014_Costerfield_Operations_Ni_43 101_Master_Rev0 28 March 2014
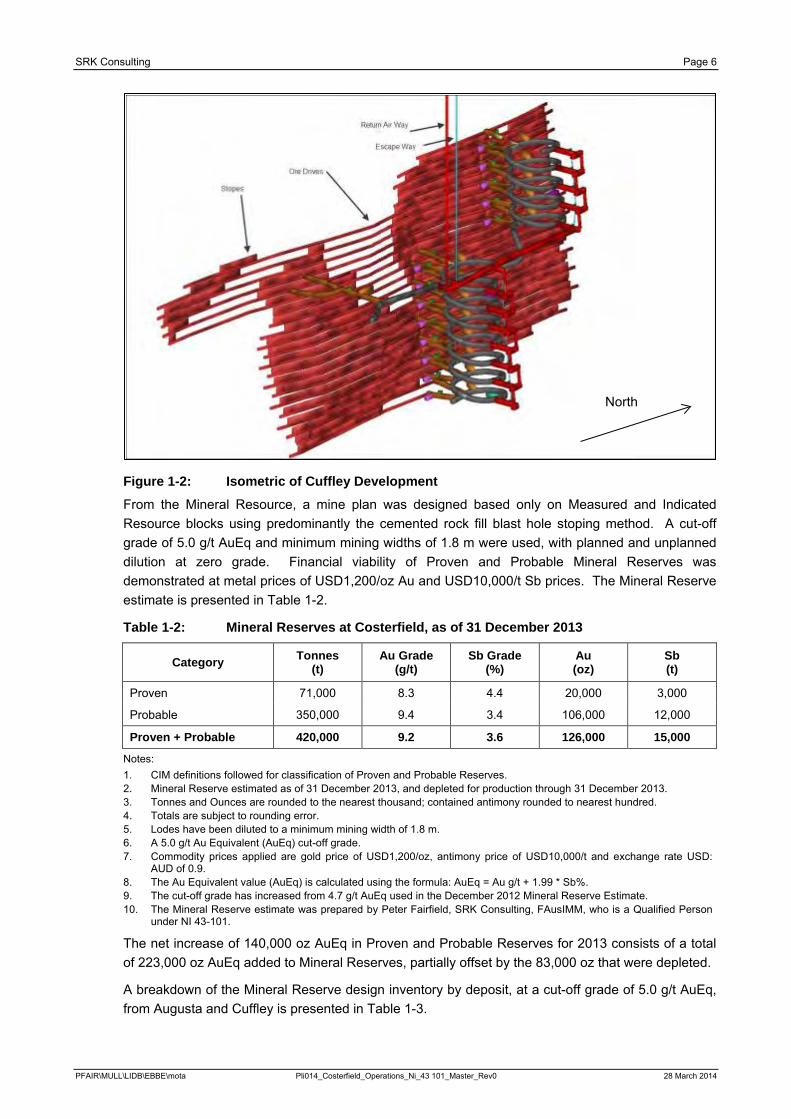
SRK Consulting Page 6
Figure 1-2: Isometric of Cuffley Development From the Mineral Resource, a mine plan was designed based only on Measured and Indicated Resource blocks using predominantly the cemented rock fill blast hole stoping method. A cut-off grade of 5.0 g/t AuEq and minimum mining widths of 1.8 m were used, with planned and unplanned dilution at zero grade. Financial viability of Proven and Probable Mineral Reserves was demonstrated at metal prices of USD1,200/oz Au and USD10,000/t Sb prices. The Mineral Reserve estimate is presented in Table 1-2.
Table 1-2: Mineral Reserves at Costerfield, as of 31 December 2013
Category Tonnes (t)
Au Grade (g/t)
Sb Grade (%)
Au (oz)
Sb (t)
Proven 71,000 8.3 4.4 20,000 3,000 Probable 350,000 9.4 3.4 106,000 12,000 Proven + Probable 420,000 9.2 3.6 126,000 15,000
Notes: 1. CIM definitions followed for classification of Proven and Probable Reserves. 2. Mineral Reserve estimated as of 31 December 2013, and depleted for production through 31 December 2013. 3. Tonnes and Ounces are rounded to the nearest thousand; contained antimony rounded to nearest hundred. 4. Totals are subject to rounding error. 5. Lodes have been diluted to a minimum mining width of 1.8 m. 6. A 5.0 g/t Au Equivalent (AuEq) cut-off grade. 7. Commodity prices applied are gold price of USD1,200/oz, antimony price of USD10,000/t and exchange rate USD:
AUD of 0.9. 8. The Au Equivalent value (AuEq) is calculated using the formula: AuEq = Au g/t + 1.99 * Sb%. 9. The cut-off grade has increased from 4.7 g/t AuEq used in the December 2012 Mineral Reserve Estimate. 10. The Mineral Reserve estimate was prepared by Peter Fairfield, SRK Consulting, FAusIMM, who is a Qualified Person
under NI 43-101.
The net increase of 140,000 oz AuEq in Proven and Probable Reserves for 2013 consists of a total of 223,000 oz AuEq added to Mineral Reserves, partially offset by the 83,000 oz that were depleted.
A breakdown of the Mineral Reserve design inventory by deposit, at a cut-off grade of 5.0 g/t AuEq, from Augusta and Cuffley is presented in Table 1-3.
North
PFAIR\MULL\LIDB\EBBE\mota Pli014_Costerfield_Operations_Ni_43 101_Master_Rev0 28 March 2014
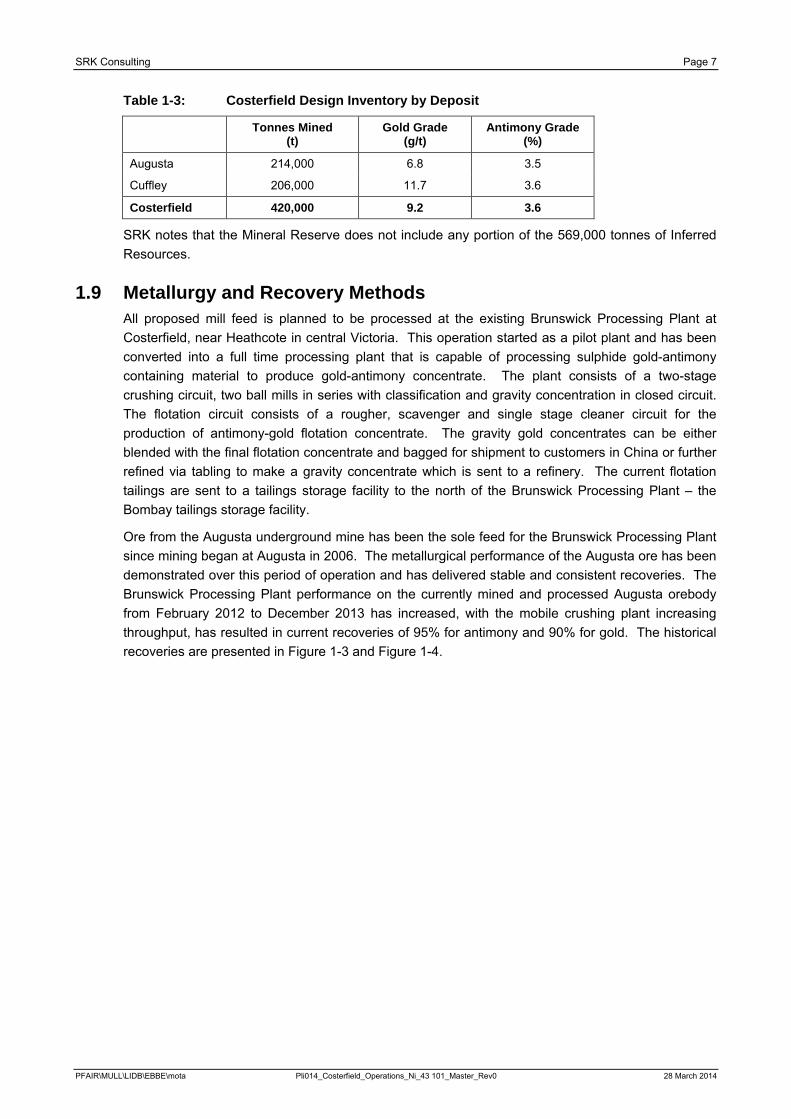
SRK Consulting Page 7
Table 1-3: Costerfield Design Inventory by Deposit
Tonnes Mined (t)
Gold Grade (g/t)
Antimony Grade (%)
Augusta 214,000 6.8 3.5
Cuffley 206,000 11.7 3.6
Costerfield 420,000 9.2 3.6
SRK notes that the Mineral Reserve does not include any portion of the 569,000 tonnes of Inferred Resources.
1.9 Metallurgy and Recovery Methods All proposed mill feed is planned to be processed at the existing Brunswick Processing Plant at Costerfield, near Heathcote in central Victoria. This operation started as a pilot plant and has been converted into a full time processing plant that is capable of processing sulphide gold-antimony containing material to produce gold-antimony concentrate. The plant consists of a two-stage crushing circuit, two ball mills in series with classification and gravity concentration in closed circuit. The flotation circuit consists of a rougher, scavenger and single stage cleaner circuit for the production of antimony-gold flotation concentrate. The gravity gold concentrates can be either blended with the final flotation concentrate and bagged for shipment to customers in China or further refined via tabling to make a gravity concentrate which is sent to a refinery. The current flotation tailings are sent to a tailings storage facility to the north of the Brunswick Processing Plant – the Bombay tailings storage facility.
Ore from the Augusta underground mine has been the sole feed for the Brunswick Processing Plant since mining began at Augusta in 2006. The metallurgical performance of the Augusta ore has been demonstrated over this period of operation and has delivered stable and consistent recoveries. The Brunswick Processing Plant performance on the currently mined and processed Augusta orebody from February 2012 to December 2013 has increased, with the mobile crushing plant increasing throughput, has resulted in current recoveries of 95% for antimony and 90% for gold. The historical recoveries are presented in Figure 1-3 and Figure 1-4.
PFAIR\MULL\LIDB\EBBE\mota Pli014_Costerfield_Operations_Ni_43 101_Master_Rev0 28 March 2014
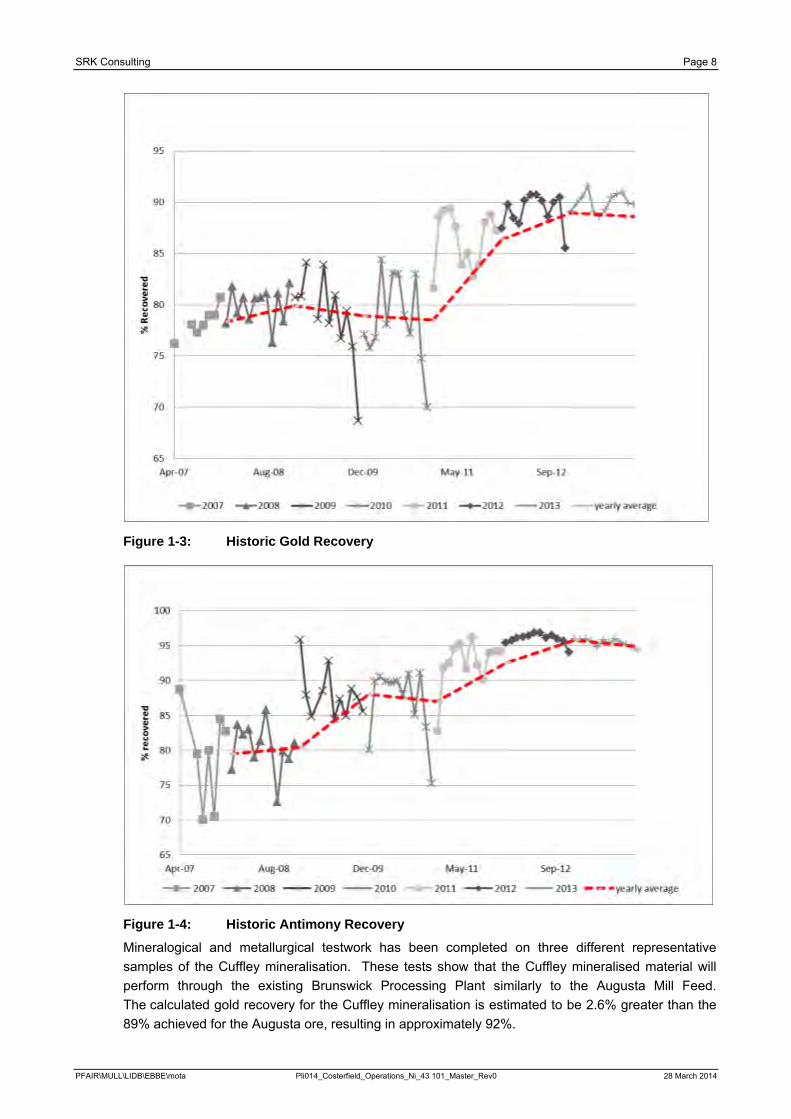
SRK Consulting Page 8
Figure 1-3: Historic Gold Recovery
Figure 1-4: Historic Antimony Recovery Mineralogical and metallurgical testwork has been completed on three different representative samples of the Cuffley mineralisation. These tests show that the Cuffley mineralised material will perform through the existing Brunswick Processing Plant similarly to the Augusta Mill Feed. The calculated gold recovery for the Cuffley mineralisation is estimated to be 2.6% greater than the 89% achieved for the Augusta ore, resulting in approximately 92%.
PFAIR\MULL\LIDB\EBBE\mota Pli014_Costerfield_Operations_Ni_43 101_Master_Rev0 28 March 2014
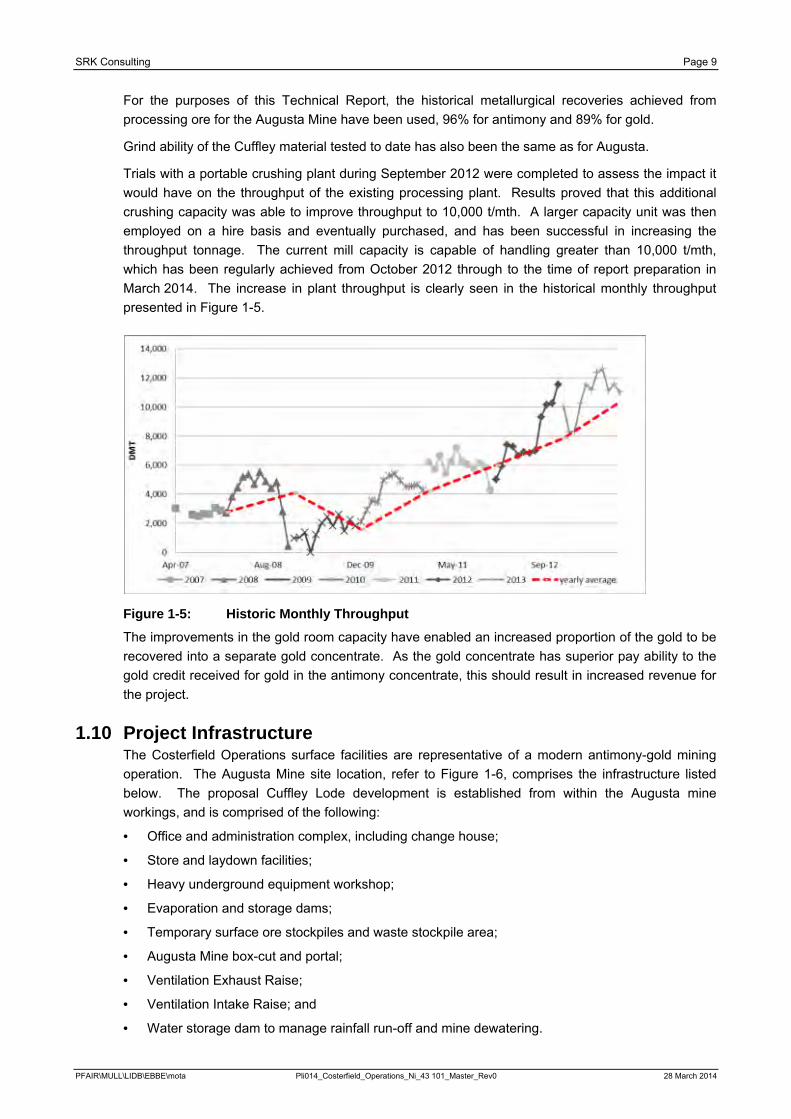
SRK Consulting Page 9
For the purposes of this Technical Report, the historical metallurgical recoveries achieved from processing ore for the Augusta Mine have been used, 96% for antimony and 89% for gold.
Grind ability of the Cuffley material tested to date has also been the same as for Augusta.
Trials with a portable crushing plant during September 2012 were completed to assess the impact it would have on the throughput of the existing processing plant. Results proved that this additional crushing capacity was able to improve throughput to 10,000 t/mth. A larger capacity unit was then employed on a hire basis and eventually purchased, and has been successful in increasing the throughput tonnage. The current mill capacity is capable of handling greater than 10,000 t/mth, which has been regularly achieved from October 2012 through to the time of report preparation in March 2014. The increase in plant throughput is clearly seen in the historical monthly throughput presented in Figure 1-5.
Figure 1-5: Historic Monthly Throughput
The improvements in the gold room capacity have enabled an increased proportion of the gold to be recovered into a separate gold concentrate. As the gold concentrate has superior pay ability to the gold credit received for gold in the antimony concentrate, this should result in increased revenue for the project.
1.10 Project Infrastructure The Costerfield Operations surface facilities are representative of a modern antimony-gold mining operation. The Augusta Mine site location, refer to Figure 1-6, comprises the infrastructure listed below. The proposal Cuffley Lode development is established from within the Augusta mine workings, and is comprised of the following:
· Office and administration complex, including change house;
· Store and laydown facilities;
· Heavy underground equipment workshop;
· Evaporation and storage dams;
· Temporary surface ore stockpiles and waste stockpile area;
· Augusta Mine box-cut and portal;
· Ventilation Exhaust Raise;
· Ventilation Intake Raise; and
· Water storage dam to manage rainfall run-off and mine dewatering.
PFAIR\MULL\LIDB\EBBE\mota Pli014_Costerfield_Operations_Ni_43 101_Master_Rev0 28 March 2014
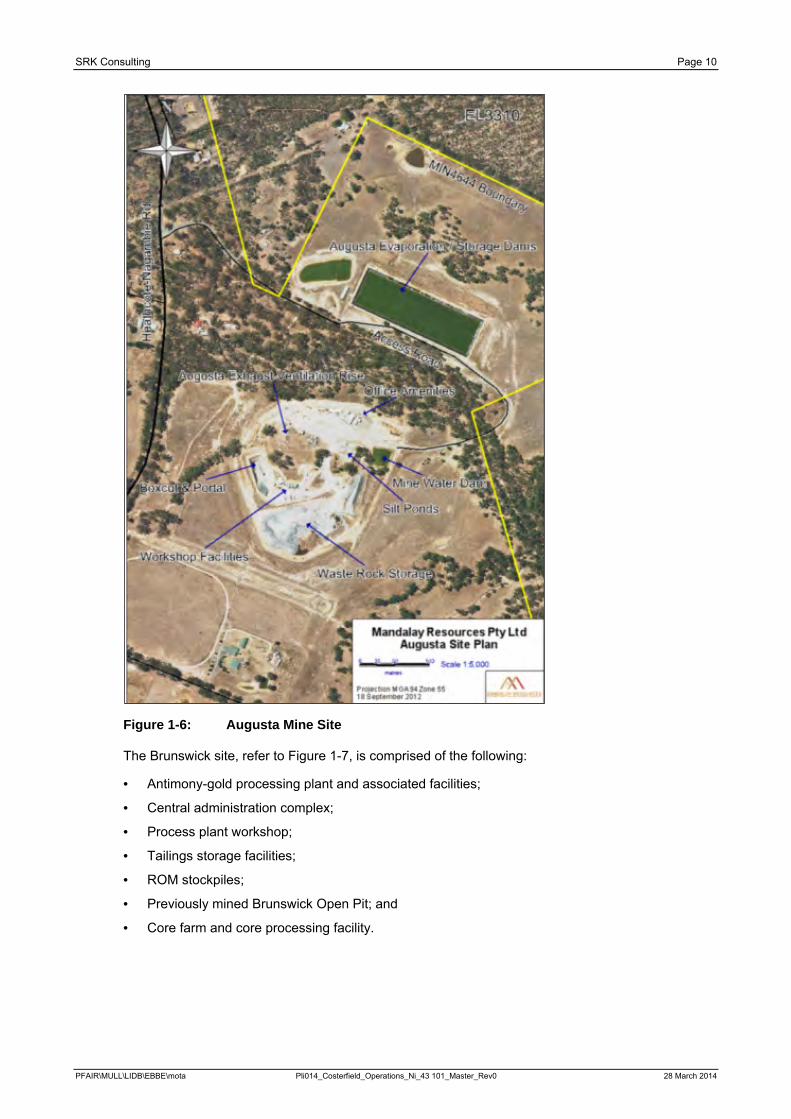
SRK Consulting Page 10
Figure 1-6: Augusta Mine Site
The Brunswick site, refer to Figure 1-7, is comprised of the following:
· Antimony-gold processing plant and associated facilities;
· Central administration complex;
· Process plant workshop;
· Tailings storage facilities;
· ROM stockpiles;
· Previously mined Brunswick Open Pit; and
· Core farm and core processing facility.
PFAIR\MULL\LIDB\EBBE\mota Pli014_Costerfield_Operations_Ni_43 101_Master_Rev0 28 March 2014
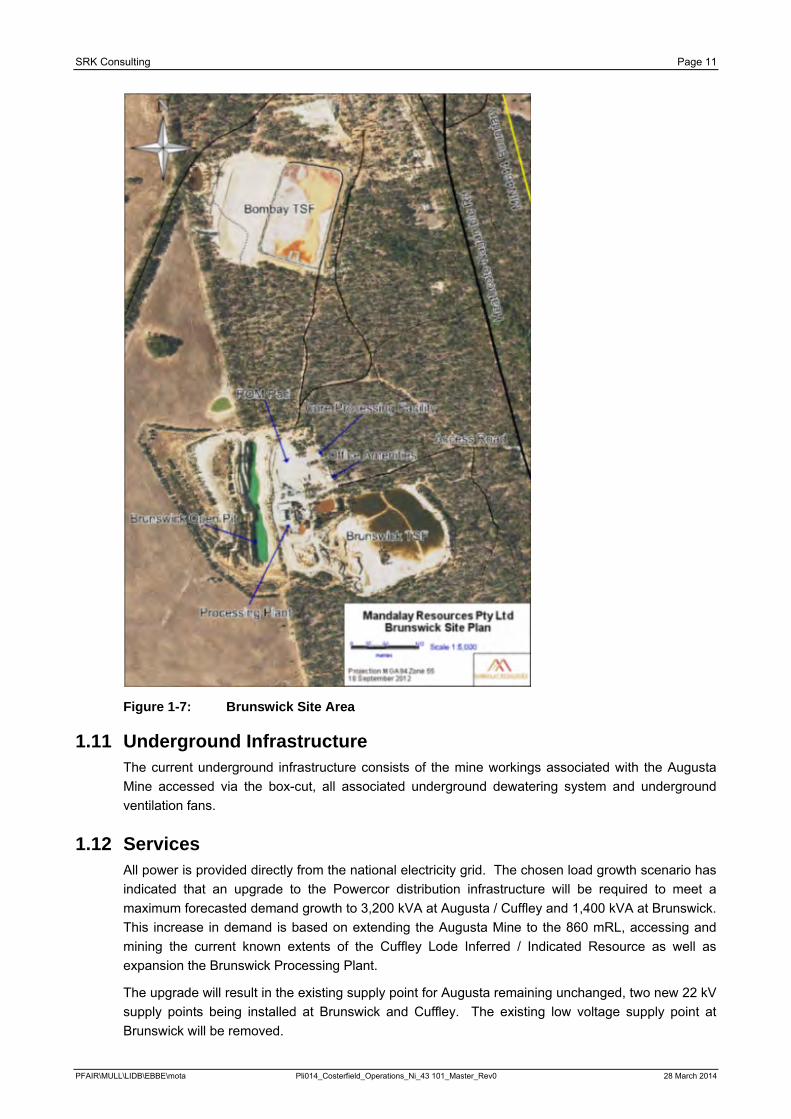
SRK Consulting Page 11
Figure 1-7: Brunswick Site Area
1.11 Underground Infrastructure The current underground infrastructure consists of the mine workings associated with the Augusta Mine accessed via the box-cut, all associated underground dewatering system and underground ventilation fans.
1.12 Services All power is provided directly from the national electricity grid. The chosen load growth scenario has indicated that an upgrade to the Powercor distribution infrastructure will be required to meet a maximum forecasted demand growth to 3,200 kVA at Augusta / Cuffley and 1,400 kVA at Brunswick. This increase in demand is based on extending the Augusta Mine to the 860 mRL, accessing and mining the current known extents of the Cuffley Lode Inferred / Indicated Resource as well as expansion the Brunswick Processing Plant.
The upgrade will result in the existing supply point for Augusta remaining unchanged, two new 22 kV supply points being installed at Brunswick and Cuffley. The existing low voltage supply point at Brunswick will be removed.
PFAIR\MULL\LIDB\EBBE\mota Pli014_Costerfield_Operations_Ni_43 101_Master_Rev0 28 March 2014
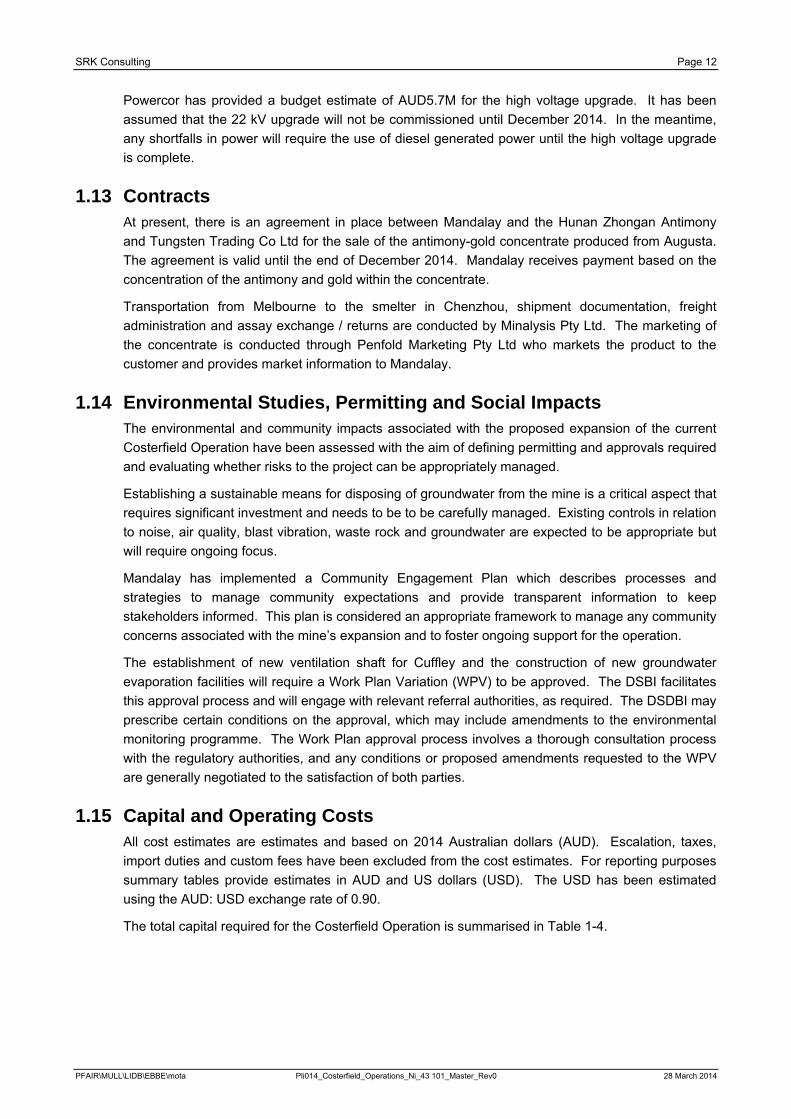
SRK Consulting Page 12
Powercor has provided a budget estimate of AUD5.7M for the high voltage upgrade. It has been assumed that the 22 kV upgrade will not be commissioned until December 2014. In the meantime, any shortfalls in power will require the use of diesel generated power until the high voltage upgrade is complete.
1.13 Contracts At present, there is an agreement in place between Mandalay and the Hunan Zhongan Antimony and Tungsten Trading Co Ltd for the sale of the antimony-gold concentrate produced from Augusta. The agreement is valid until the end of December 2014. Mandalay receives payment based on the concentration of the antimony and gold within the concentrate.
Transportation from Melbourne to the smelter in Chenzhou, shipment documentation, freight administration and assay exchange / returns are conducted by Minalysis Pty Ltd. The marketing of the concentrate is conducted through Penfold Marketing Pty Ltd who markets the product to the customer and provides market information to Mandalay.
1.14 Environmental Studies, Permitting and Social Impacts The environmental and community impacts associated with the proposed expansion of the current Costerfield Operation have been assessed with the aim of defining permitting and approvals required and evaluating whether risks to the project can be appropriately managed.
Establishing a sustainable means for disposing of groundwater from the mine is a critical aspect that requires significant investment and needs to be to be carefully managed. Existing controls in relation to noise, air quality, blast vibration, waste rock and groundwater are expected to be appropriate but will require ongoing focus.
Mandalay has implemented a Community Engagement Plan which describes processes and strategies to manage community expectations and provide transparent information to keep stakeholders informed. This plan is considered an appropriate framework to manage any community concerns associated with the mine’s expansion and to foster ongoing support for the operation.
The establishment of new ventilation shaft for Cuffley and the construction of new groundwater evaporation facilities will require a Work Plan Variation (WPV) to be approved. The DSBI facilitates this approval process and will engage with relevant referral authorities, as required. The DSDBI may prescribe certain conditions on the approval, which may include amendments to the environmental monitoring programme. The Work Plan approval process involves a thorough consultation process with the regulatory authorities, and any conditions or proposed amendments requested to the WPV are generally negotiated to the satisfaction of both parties.
1.15 Capital and Operating Costs All cost estimates are estimates and based on 2014 Australian dollars (AUD). Escalation, taxes, import duties and custom fees have been excluded from the cost estimates. For reporting purposes summary tables provide estimates in AUD and US dollars (USD). The USD has been estimated using the AUD: USD exchange rate of 0.90.
The total capital required for the Costerfield Operation is summarised in Table 1-4.
PFAIR\MULL\LIDB\EBBE\mota Pli014_Costerfield_Operations_Ni_43 101_Master_Rev0 28 March 2014
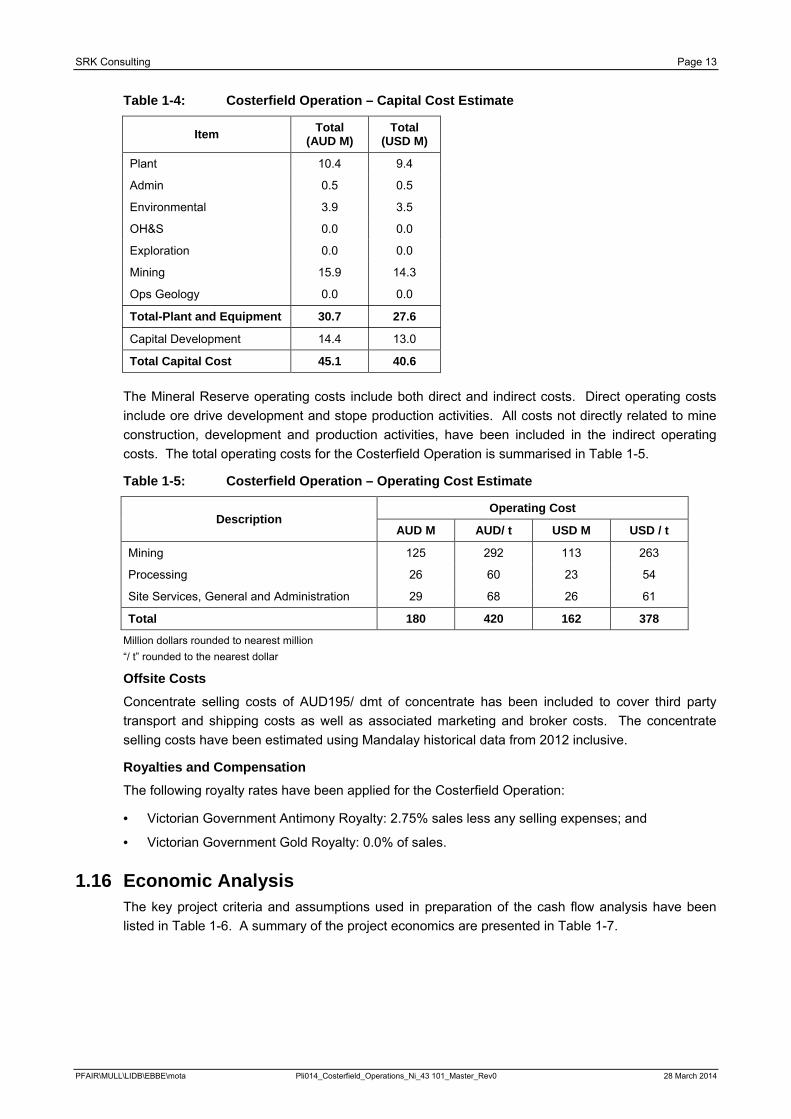
SRK Consulting Page 13
Table 1-4: Costerfield Operation – Capital Cost Estimate
Item Total (AUD M)
Total (USD M)
Plant 10.4 9.4
Admin 0.5 0.5
Environmental 3.9 3.5
OH&S 0.0 0.0
Exploration 0.0 0.0
Mining 15.9 14.3
Ops Geology 0.0 0.0
Total-Plant and Equipment 30.7 27.6
Capital Development 14.4 13.0
Total Capital Cost 45.1 40.6
The Mineral Reserve operating costs include both direct and indirect costs. Direct operating costs include ore drive development and stope production activities. All costs not directly related to mine construction, development and production activities, have been included in the indirect operating costs. The total operating costs for the Costerfield Operation is summarised in Table 1-5.
Table 1-5: Costerfield Operation – Operating Cost Estimate
Description Operating Cost
AUD M AUD/ t USD M USD / t
Mining 125 292 113 263
Processing 26 60 23 54
Site Services, General and Administration 29 68 26 61
Total 180 420 162 378
Million dollars rounded to nearest million “/ t” rounded to the nearest dollar
Offsite Costs
Concentrate selling costs of AUD195/ dmt of concentrate has been included to cover third party transport and shipping costs as well as associated marketing and broker costs. The concentrate selling costs have been estimated using Mandalay historical data from 2012 inclusive.
Royalties and Compensation The following royalty rates have been applied for the Costerfield Operation:
· Victorian Government Antimony Royalty: 2.75% sales less any selling expenses; and
· Victorian Government Gold Royalty: 0.0% of sales.
1.16 Economic Analysis The key project criteria and assumptions used in preparation of the cash flow analysis have been listed in Table 1-6. A summary of the project economics are presented in Table 1-7.
PFAIR\MULL\LIDB\EBBE\mota Pli014_Costerfield_Operations_Ni_43 101_Master_Rev0 28 March 2014
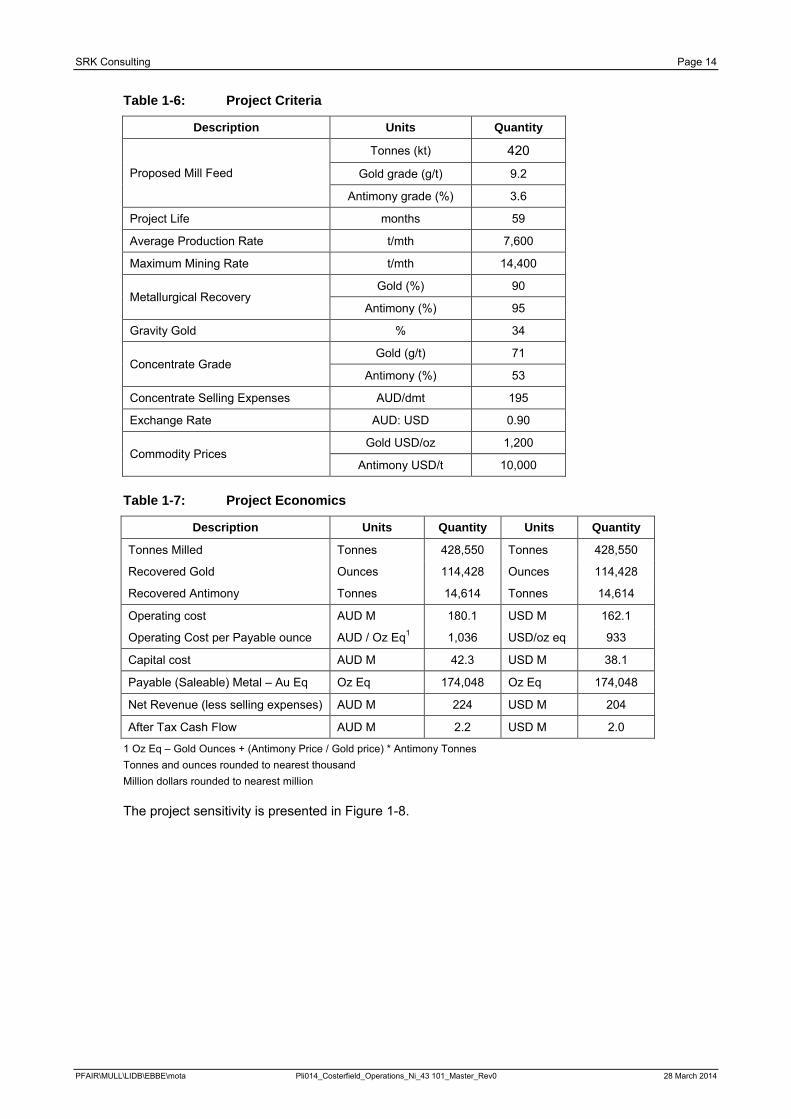
SRK Consulting Page 14
Table 1-6: Project Criteria
Description Units Quantity
Proposed Mill Feed
Tonnes (kt) 420
Gold grade (g/t) 9.2
Antimony grade (%) 3.6
Project Life months 59
Average Production Rate t/mth 7,600
Maximum Mining Rate t/mth 14,400
Metallurgical Recovery Gold (%) 90
Antimony (%) 95
Gravity Gold % 34
Concentrate Grade Gold (g/t) 71
Antimony (%) 53
Concentrate Selling Expenses AUD/dmt 195
Exchange Rate AUD: USD 0.90
Commodity Prices Gold USD/oz 1,200
Antimony USD/t 10,000
Table 1-7: Project Economics
Description Units Quantity Units Quantity
Tonnes Milled Tonnes 428,550 Tonnes 428,550
Recovered Gold Ounces 114,428 Ounces 114,428
Recovered Antimony Tonnes 14,614 Tonnes 14,614
Operating cost AUD M 180.1 USD M 162.1
Operating Cost per Payable ounce AUD / Oz Eq1 1,036 USD/oz eq 933
Capital cost AUD M 42.3 USD M 38.1
Payable (Saleable) Metal – Au Eq Oz Eq 174,048 Oz Eq 174,048
Net Revenue (less selling expenses) AUD M 224 USD M 204
After Tax Cash Flow AUD M 2.2 USD M 2.0
1 Oz Eq – Gold Ounces + (Antimony Price / Gold price) * Antimony Tonnes Tonnes and ounces rounded to nearest thousand Million dollars rounded to nearest million
The project sensitivity is presented in Figure 1-8.
PFAIR\MULL\LIDB\EBBE\mota Pli014_Costerfield_Operations_Ni_43 101_Master_Rev0 28 March 2014
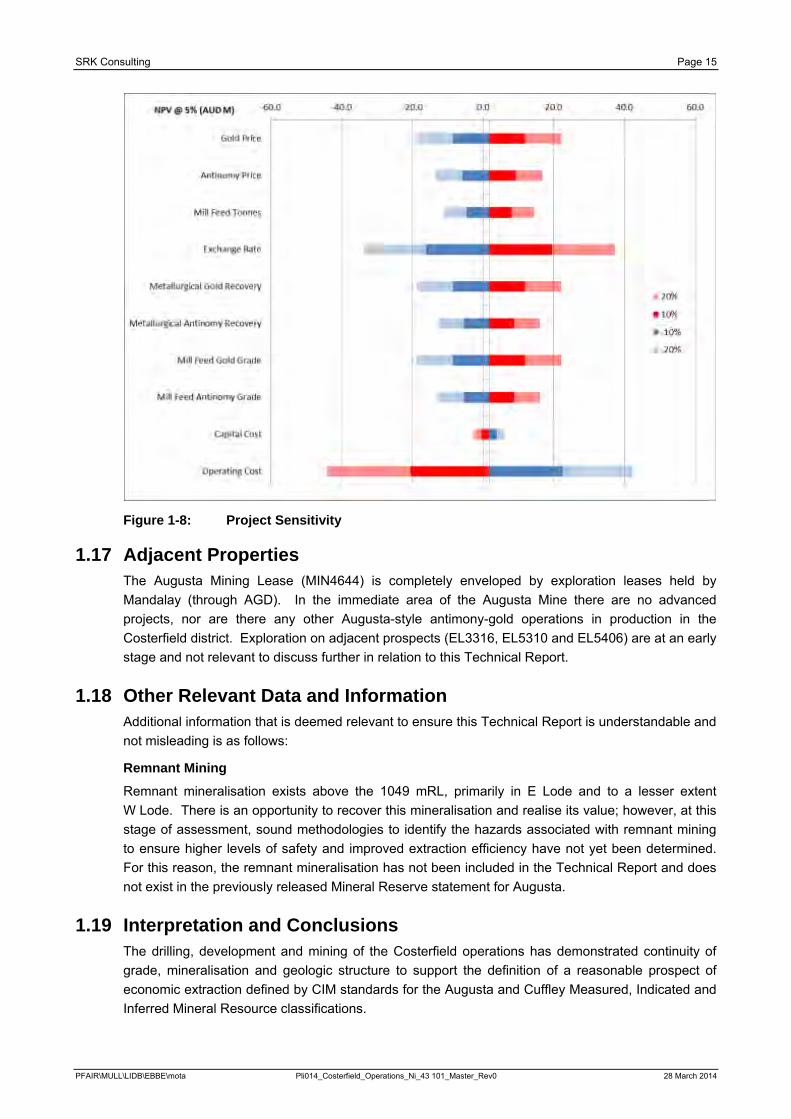
SRK Consulting Page 15
Figure 1-8: Project Sensitivity
1.17 Adjacent Properties The Augusta Mining Lease (MIN4644) is completely enveloped by exploration leases held by Mandalay (through AGD). In the immediate area of the Augusta Mine there are no advanced projects, nor are there any other Augusta-style antimony-gold operations in production in the Costerfield district. Exploration on adjacent prospects (EL3316, EL5310 and EL5406) are at an early stage and not relevant to discuss further in relation to this Technical Report.
1.18 Other Relevant Data and Information Additional information that is deemed relevant to ensure this Technical Report is understandable and not misleading is as follows:
Remnant Mining
Remnant mineralisation exists above the 1049 mRL, primarily in E Lode and to a lesser extent W Lode. There is an opportunity to recover this mineralisation and realise its value; however, at this stage of assessment, sound methodologies to identify the hazards associated with remnant mining to ensure higher levels of safety and improved extraction efficiency have not yet been determined. For this reason, the remnant mineralisation has not been included in the Technical Report and does not exist in the previously released Mineral Reserve statement for Augusta.
1.19 Interpretation and Conclusions The drilling, development and mining of the Costerfield operations has demonstrated continuity of grade, mineralisation and geologic structure to support the definition of a reasonable prospect of economic extraction defined by CIM standards for the Augusta and Cuffley Measured, Indicated and Inferred Mineral Resource classifications.
PFAIR\MULL\LIDB\EBBE\mota Pli014_Costerfield_Operations_Ni_43 101_Master_Rev0 28 March 2014
SRK Consulting Page 16
This Technical Report for the combined Mineral Resources (Measured and Indicated Resources) of the Augusta Deposit and Cuffley Lode support the technical and economic viability of the Mineral Reserve based on fair and reasonable production and cost assumptions. No Inferred Resources were included in the economic assessment. Ongoing geological drilling and development of these deposits and advancement of the engineering studies to develop a more detailed Life of Mine (LoM) Plan is considered to be appropriate.
Further advancement of geological drilling to better define the Mineral Resource and conversion of Inferred Resources to Indicated Resources in conjunction with revisions to the mine design and mining schedule to better smooth the development and production profile is warranted.
1.20 Comments and Recommendations The overall positive results of this Technical Report indicate the technical and financial feasibility of the project, indicating the viability of the Mineral Reserve.
SRK considers that there is opportunity to improve the cashflow profile by undertaking the following actions:
· Review the Mineral Resource to assess potential to identify additional tonnes closer to Augusta;
· Review the Mineral Resource to assess the potential to convert Inferred Resources to Indicate Resources for inclusion in the Mineral Reserve and Life of Mine plan;
· Undertaking more detailed scheduling work to smooth the development and production profiles; and
· Continue to refine and review mining methods and capital and operating cost estimates.
PFAIR\MULL\LIDB\EBBE\mota Pli014_Costerfield_Operations_Ni_43 101_Master_Rev0 28 March 2014
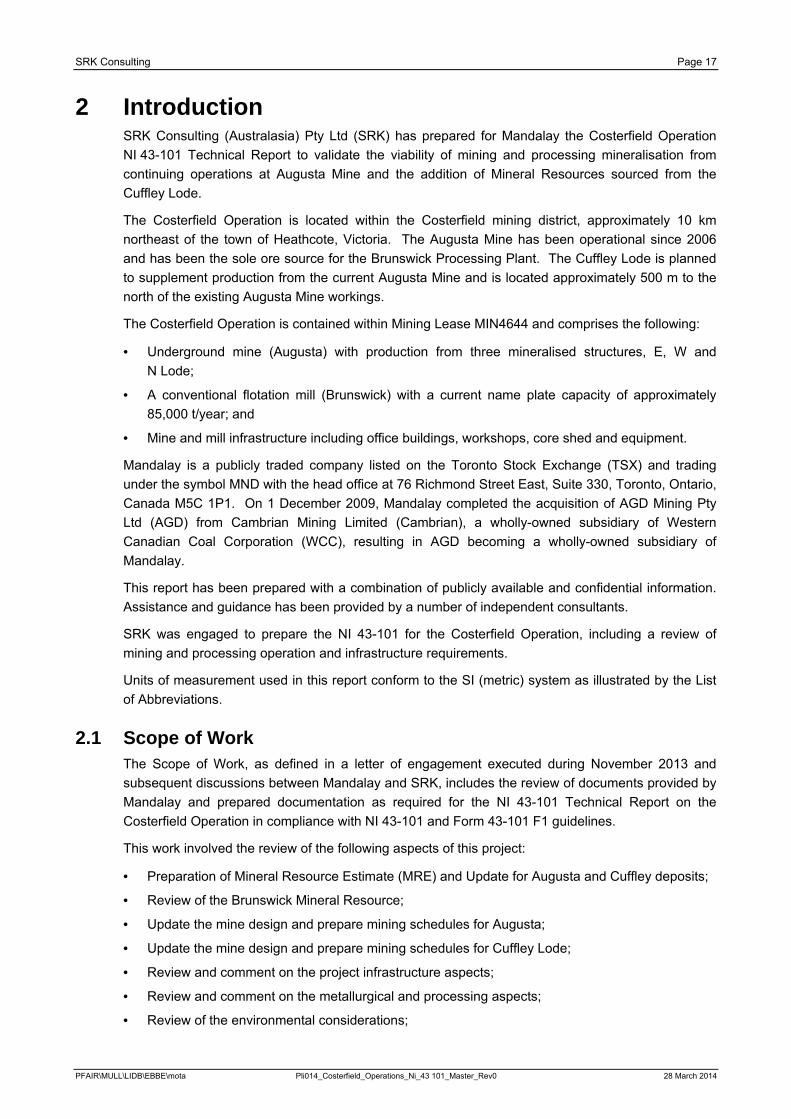
SRK Consulting Page 17
2 Introduction SRK Consulting (Australasia) Pty Ltd (SRK) has prepared for Mandalay the Costerfield Operation NI 43-101 Technical Report to validate the viability of mining and processing mineralisation from continuing operations at Augusta Mine and the addition of Mineral Resources sourced from the Cuffley Lode.
The Costerfield Operation is located within the Costerfield mining district, approximately 10 km northeast of the town of Heathcote, Victoria. The Augusta Mine has been operational since 2006 and has been the sole ore source for the Brunswick Processing Plant. The Cuffley Lode is planned to supplement production from the current Augusta Mine and is located approximately 500 m to the north of the existing Augusta Mine workings.
The Costerfield Operation is contained within Mining Lease MIN4644 and comprises the following:
· Underground mine (Augusta) with production from three mineralised structures, E, W and N Lode;
· A conventional flotation mill (Brunswick) with a current name plate capacity of approximately 85,000 t/year; and
· Mine and mill infrastructure including office buildings, workshops, core shed and equipment.
Mandalay is a publicly traded company listed on the Toronto Stock Exchange (TSX) and trading under the symbol MND with the head office at 76 Richmond Street East, Suite 330, Toronto, Ontario, Canada M5C 1P1. On 1 December 2009, Mandalay completed the acquisition of AGD Mining Pty Ltd (AGD) from Cambrian Mining Limited (Cambrian), a wholly-owned subsidiary of Western Canadian Coal Corporation (WCC), resulting in AGD becoming a wholly-owned subsidiary of Mandalay.
This report has been prepared with a combination of publicly available and confidential information. Assistance and guidance has been provided by a number of independent consultants.
SRK was engaged to prepare the NI 43-101 for the Costerfield Operation, including a review of mining and processing operation and infrastructure requirements.
Units of measurement used in this report conform to the SI (metric) system as illustrated by the List of Abbreviations.
2.1 Scope of Work The Scope of Work, as defined in a letter of engagement executed during November 2013 and subsequent discussions between Mandalay and SRK, includes the review of documents provided by Mandalay and prepared documentation as required for the NI 43-101 Technical Report on the Costerfield Operation in compliance with NI 43-101 and Form 43-101 F1 guidelines.
This work involved the review of the following aspects of this project:
· Preparation of Mineral Resource Estimate (MRE) and Update for Augusta and Cuffley deposits;
· Review of the Brunswick Mineral Resource;
· Update the mine design and prepare mining schedules for Augusta;
· Update the mine design and prepare mining schedules for Cuffley Lode;
· Review and comment on the project infrastructure aspects;
· Review and comment on the metallurgical and processing aspects;
· Review of the environmental considerations;
PFAIR\MULL\LIDB\EBBE\mota Pli014_Costerfield_Operations_Ni_43 101_Master_Rev0 28 March 2014
SRK Consulting Page 18
· Review of the capital and operating cost estimates;
· Review of the financial modelling; and
· Recommendations for additional work.
2.2 Work Programme The Costerfield NI 43-101 Technical Report herein is a collaborative effort between Mandalay and SRK.
SRK has independently reviewed the work completed by Mandalay.
The Mineral Resource Statement reported herein was prepared in conformity with generally accepted CIM “Exploration Best Practices” and “Estimation of Mineral Resource and Mineral Reserves Best Practices” guidelines. This Technical Report was prepared following the guidelines of the Canadian Securities Administrators National Instrument 43-101 and Form 43-101 F1.
The Technical Report was assembled in Melbourne during the months of January to March 2014.
2.3 Basis of Technical Report The purpose of this Technical Report is to present the findings of an economic assessment for both the Augusta deposits and Cuffley Lode.
This report is based on information provided by Mandalay to SRK and verified during site visits conducted in 2012 and 2013 and any additional information provided by Mandalay throughout the course of SRK’s investigations. SRK has no reason to doubt the reliability of the information provided by Mandalay. The most recent site visit was undertaken on 13 December 2013.
This Technical Report is based on the following sources of information:
· Discussions with Mandalay personnel;
· Inspection of Mandalay’s Costerfield Operation; and
· Additional information and studies provided by Mandalay.
2.4 Qualifications of SRK and SRK Team The SRK Group comprises over 1,600 professionals, offering expertise in a wide range of Resource engineering disciplines. The SRK Group’s independence is ensured by the fact that it holds no equity in any project and that its ownership rests solely with its staff. This fact permits SRK to provide its clients with conflict-free and objective recommendations on crucial judgment issues. SRK has a demonstrated track record in undertaking independent assessments of Mineral Resources and Mineral Reserves, project evaluations and audits, technical reports and independent feasibility evaluations to bankable standards on behalf of exploration and mining companies and financial institutions worldwide. The SRK Group has also worked with a large number of major international mining companies and their projects, providing mining industry consultancy service inputs.
The compilation of this Technical Report was completed by Peter Fairfield, Principal Consultant (Project Evaluation), BEng (Mining), FAusIMM (No 106754). By virtue of his education, membership to a recognised professional association and relevant work experience, Peter Fairfield is an independent QP as this term is defined by NI 43-101.
Brett Muller, SRK Associate Principal Metallurgist, undertook a review of the metallurgical and mineral processing aspects of the project. Brett Muller, Principal Consulting Engineer (Metallurgy), BEng (Minerals Engineering and Extractive Metallurgy), BCom (Finance), member of The Institute of
PFAIR\MULL\LIDB\EBBE\mota Pli014_Costerfield_Operations_Ni_43 101_Master_Rev0 28 March 2014
SRK Consulting Page 19
Engineers Australia (Chemical College No 3442998), SRK Associate, is by virtue of his education, membership to a recognised professional association and relevant work experience, an independent QP as this term is defined by NI 43-101.
Bob Lidbury, Senior Consultant (Resource Geology), BAppSc (Geology), MAIG (No: 3014), undertook a review of the Mineral Resources and geological aspects of the project and contributed to the relevant sections in this report. By virtue of his education, membership to a recognised professional association and relevant work experience, Bob Lidbury is an independent QP as this term is defined by NI 43-101.
The lead author of the Technical Report is Peter Fairfield.
Internal SRK Peer Review of this Technical Report was completed by Anne-Marie Ebbels and Danny Kentwell.
Anne-Marie Ebbels, Principal Consultant (Mining), conducted a peer review of non-geological aspects of this Technical report. Anne-Marie Ebbels, BEng (Mining), MAusIMM (CP) (No 111006), is by virtue of her education, membership to a recognised professional association and relevant work experience, an independent QP as this term is defined by NI 43-101.
Danny Kentwell, Principal Consultant (Resource Evaluation), MSc Mathematics and Planning (Geostatistics), FAusIMM, conducted a peer review of the geological aspects of this Technical report. Mr Kentwell, MSc, FAusIMM, is by virtue of his education, membership to a recognised professional association and relevant work experience, an independent QP as this term is defined by NI 43-101.
Table 2-1 lists the individuals who, by virtue of their education, experience and professional association, are considered QP as defined in NI 43-101 for this report. The table defines the areas of responsibility for the QP who all meet the requirements of independence as defined in NI 43-101.
PFAIR\MULL\LIDB\EBBE\mota Pli014_Costerfield_Operations_Ni_43 101_Master_Rev0 28 March 2014
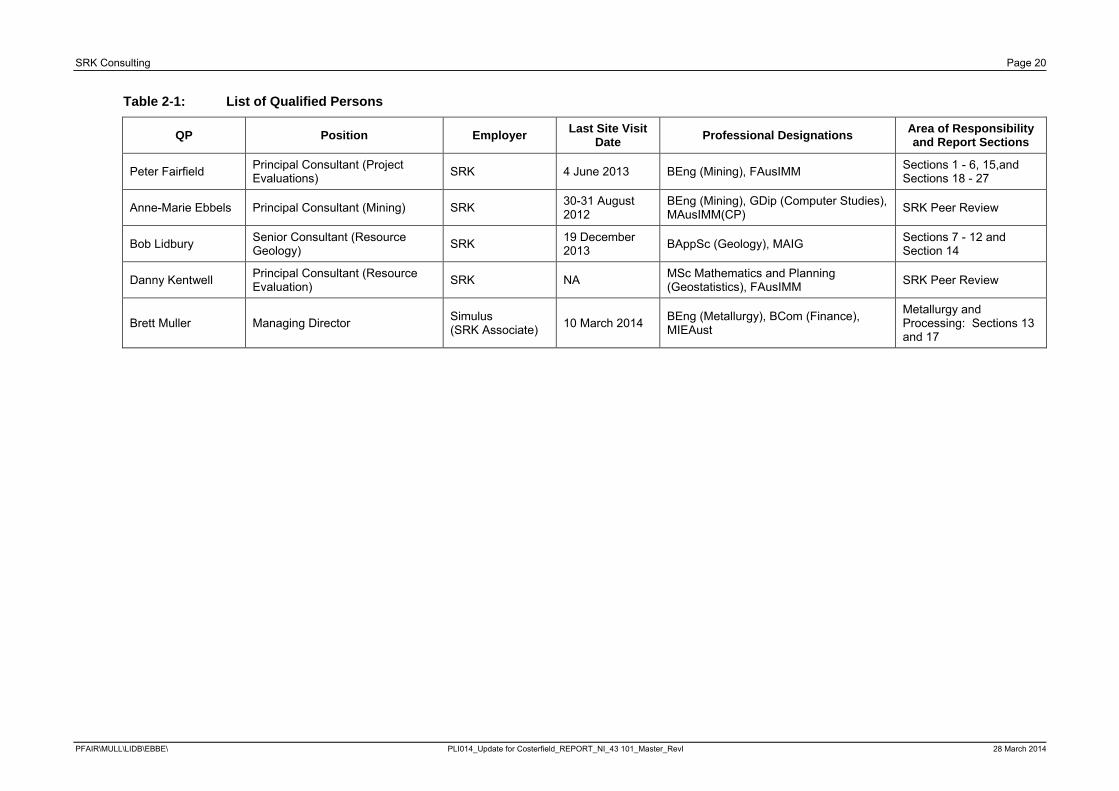
SRK Consulting Page 20
Table 2-1: List of Qualified Persons
QP Position Employer Last Site Visit Date Professional Designations Area of Responsibility
and Report Sections
Peter Fairfield Principal Consultant (Project Evaluations) SRK 4 June 2013 BEng (Mining), FAusIMM Sections 1 - 6, 15,and
Sections 18 - 27
Anne-Marie Ebbels Principal Consultant (Mining) SRK 30-31 August 2012
BEng (Mining), GDip (Computer Studies), MAusIMM(CP) SRK Peer Review
Bob Lidbury Senior Consultant (Resource Geology) SRK 19 December
2013 BAppSc (Geology), MAIG Sections 7 - 12 and Section 14
Danny Kentwell Principal Consultant (Resource Evaluation) SRK NA MSc Mathematics and Planning
(Geostatistics), FAusIMM SRK Peer Review
Brett Muller Managing Director Simulus (SRK Associate) 10 March 2014 BEng (Metallurgy), BCom (Finance),
MIEAust
Metallurgy and Processing: Sections 13 and 17
PFAIR\MULL\LIDB\EBBE\ PLI014_Update for Costerfield_REPORT_NI_43 101_Master_RevI 28 March 2014
SRK Consulting Page 21
2.5 Acknowledgement SRK would like to acknowledge the support and collaboration provided by Mandalay personnel for this assignment. Their collaboration was greatly appreciated and instrumental to the success of this project.
2.6 Declaration SRK’s opinion contained herein and effective 31 December 2013 is based on information collected by SRK throughout the course of SRK’s investigations, which in turn reflect various technical and economic conditions at the time of writing. Given the nature of the mining business, these conditions can change significantly over relatively short periods of time. Consequently, actual results may be significantly more or less favourable.
This report may include technical information that requires subsequent calculations to derive sub-totals, totals and weighted averages.
Such calculations inherently involve a degree of rounding and consequently introduce a margin of error. Where these occur, SRK does not consider them to be material.
SRK is not an insider, associate or an affiliate of Mandalay, and neither SRK nor any affiliate has acted as advisor to Mandalay, its subsidiaries or its affiliates in connection with this project. The results of the technical review by SRK are not dependent on any prior agreements concerning the conclusions to be reached, nor are there any undisclosed understandings concerning any future business dealings.
PFAIR\MULL\LIDB\EBBE\mota Pli014_Costerfield_Operations_Ni_43 101_Master_Rev0 28 March 2014

SRK Consulting Page 22
3 Reliance on Other Experts 3.1 Marketing
Marketing information for this report, specifically Section 19, relies entirely on information by Roskill Information Services Ltd. The two reports referenced are as follows:
· Roskill, 2012. Antimony: Global Industry Markets and Outlook, 11th edition, 2012. Available from http://www.roskill.com/reports/minor-and-light-metals/antimony; and
· Roskill, 2011. ANOCA Ltd: Study of the antimony market, 17 October 2011. Available from http://www.ancoa.com.au/RoskillCRT.pdf.
A specific marketing study was not completed for this report.
PFAIR\MULL\LIDB\EBBE\mota Pli014_Costerfield_Operations_Ni_43 101_Master_Rev0 28 March 2014
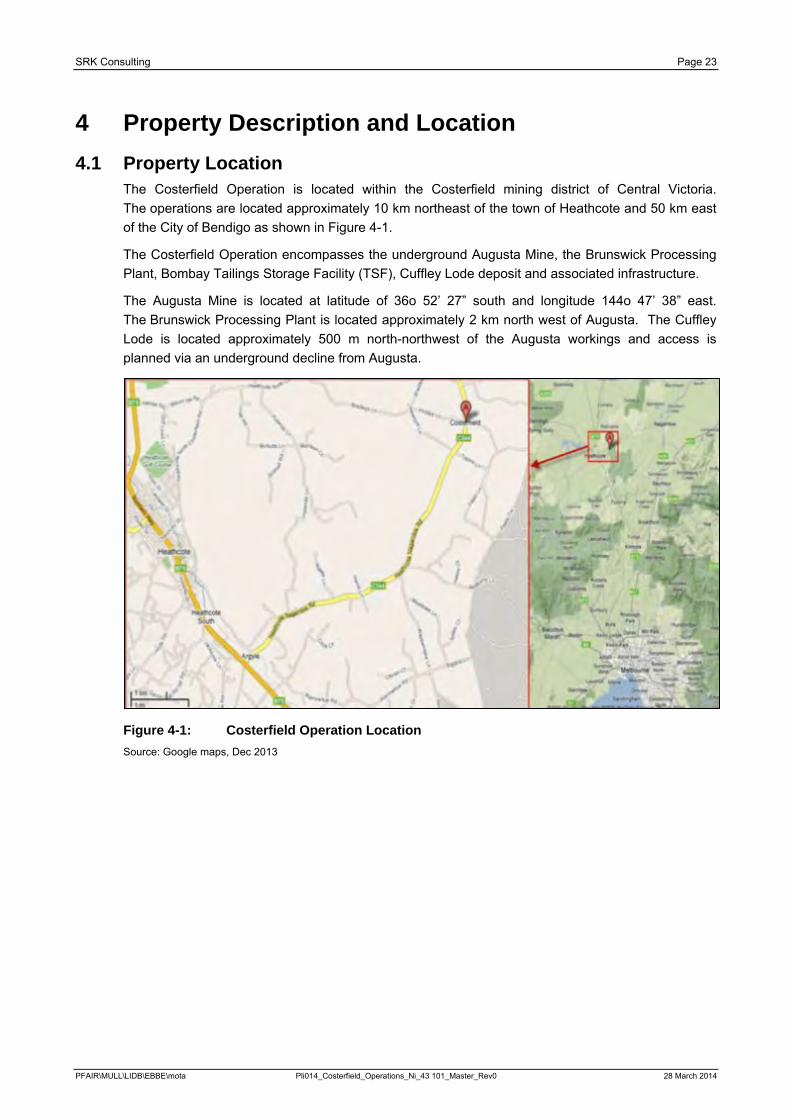
SRK Consulting Page 23
4 Property Description and Location 4.1 Property Location
The Costerfield Operation is located within the Costerfield mining district of Central Victoria. The operations are located approximately 10 km northeast of the town of Heathcote and 50 km east of the City of Bendigo as shown in Figure 4-1.
The Costerfield Operation encompasses the underground Augusta Mine, the Brunswick Processing Plant, Bombay Tailings Storage Facility (TSF), Cuffley Lode deposit and associated infrastructure.
The Augusta Mine is located at latitude of 36o 52’ 27” south and longitude 144o 47’ 38” east. The Brunswick Processing Plant is located approximately 2 km north west of Augusta. The Cuffley Lode is located approximately 500 m north-northwest of the Augusta workings and access is planned via an underground decline from Augusta.
Figure 4-1: Costerfield Operation Location Source: Google maps, Dec 2013
PFAIR\MULL\LIDB\EBBE\mota Pli014_Costerfield_Operations_Ni_43 101_Master_Rev0 28 March 2014
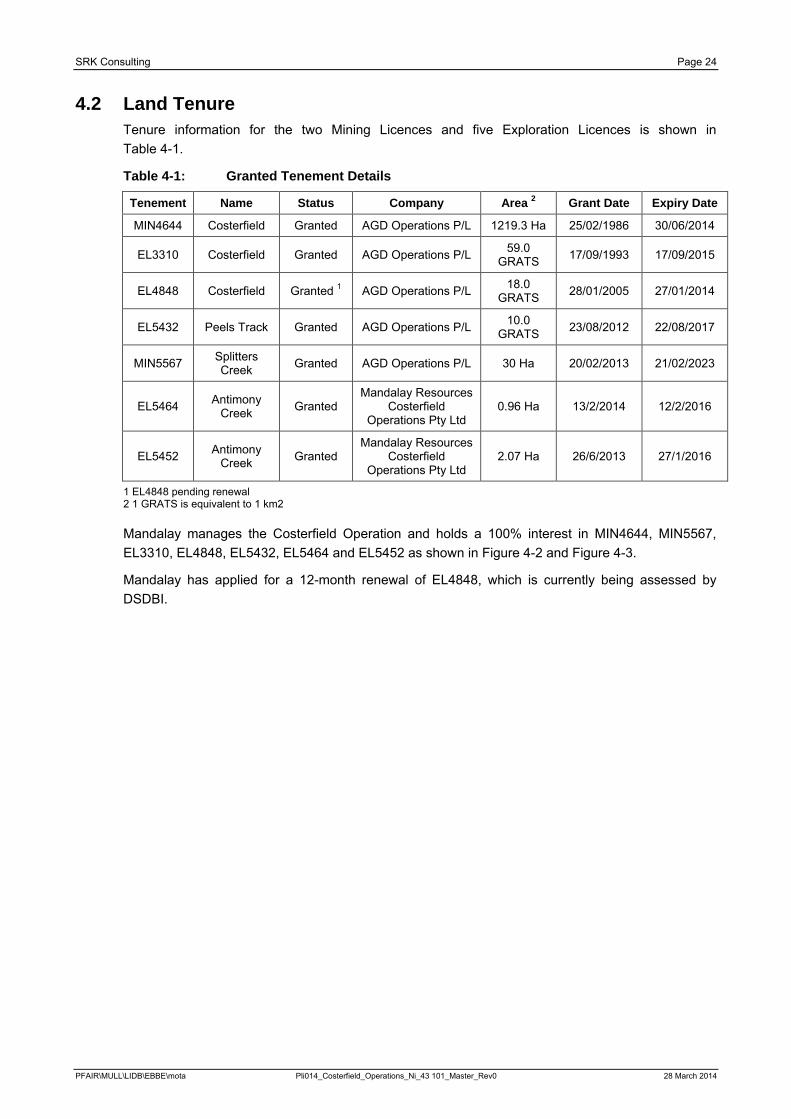
SRK Consulting Page 24
4.2 Land Tenure Tenure information for the two Mining Licences and five Exploration Licences is shown in Table 4-1.
Table 4-1: Granted Tenement Details
Tenement Name Status Company Area 2 Grant Date Expiry Date
MIN4644 Costerfield Granted AGD Operations P/L 1219.3 Ha 25/02/1986 30/06/2014
EL3310 Costerfield Granted AGD Operations P/L 59.0 GRATS 17/09/1993 17/09/2015
EL4848 Costerfield Granted 1 AGD Operations P/L 18.0 GRATS 28/01/2005 27/01/2014
EL5432 Peels Track Granted AGD Operations P/L 10.0 GRATS 23/08/2012 22/08/2017
MIN5567 Splitters Creek Granted AGD Operations P/L 30 Ha 20/02/2013 21/02/2023
EL5464 Antimony Creek Granted
Mandalay Resources Costerfield
Operations Pty Ltd 0.96 Ha 13/2/2014 12/2/2016
EL5452 Antimony Creek Granted
Mandalay Resources Costerfield
Operations Pty Ltd 2.07 Ha 26/6/2013 27/1/2016
1 EL4848 pending renewal 2 1 GRATS is equivalent to 1 km2
Mandalay manages the Costerfield Operation and holds a 100% interest in MIN4644, MIN5567, EL3310, EL4848, EL5432, EL5464 and EL5452 as shown in Figure 4-2 and Figure 4-3.
Mandalay has applied for a 12-month renewal of EL4848, which is currently being assessed by DSDBI.
PFAIR\MULL\LIDB\EBBE\mota Pli014_Costerfield_Operations_Ni_43 101_Master_Rev0 28 March 2014
SRK Consulting Page 25
Figure 4-2: Plan of Area – Mining Licence No: 4644 Source: DSDBI, Victorian State Government, 2009.
PFAIR\MULL\LIDB\EBBE\mota Pli014_Costerfield_Operations_Ni_43 101_Master_Rev0 28 March 2014
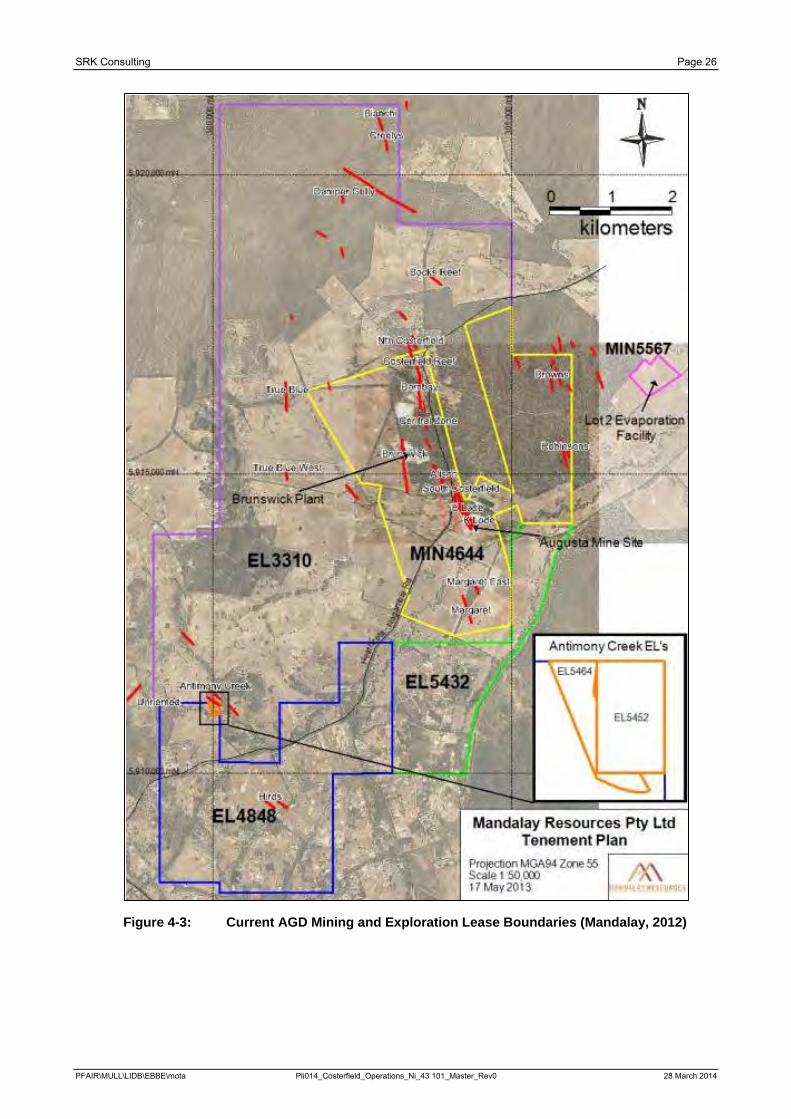
SRK Consulting Page 26
Figure 4-3: Current AGD Mining and Exploration Lease Boundaries (Mandalay, 2012)
PFAIR\MULL\LIDB\EBBE\mota Pli014_Costerfield_Operations_Ni_43 101_Master_Rev0 28 March 2014
SRK Consulting Page 27
4.3 Underlying Agreements The sustainable and responsible development of Mineral Resources in Victoria is regulated by the State Government of Victoria through the MRSD Act.
The MRSD Act, which is administered by the DSDBI, requires that negotiation of access and/ or compensation agreements with landowners affected by the work plans is undertaken between the mining tenement applicant and the relevant landowner prior to a Mining Licence being granted, or renewed. In accordance with this obligation, Mandalay has compensation agreements in place for land allotments owned by third party landowners that are situated within the boundaries of MIN4644.
Mandalay owns the land that contains MIN5567 as such no compensation agreements are required.
4.4 Environmental Liability The rehabilitation bond for MIN4644 is currently set at AUD2.511M and is reviewed by the DSDBI every two years or when a Variation to the Work Plan is approved.
There is a further AUD10,000 bond for each of the following, EL3310, EL4848 and with Vic Roads for licenses for pipelines crossing roads.
Additional Bonds will be linked to the work plan that has been submitted for MIN5567.
The total bond is AUD2.541M.
Rehabilitation is undertaken progressively at Costerfield Operation, with the environmental bond only being reduced when rehabilitation of an area or site has been deemed successful by the DSDBI. This rehabilitation bond is based on the assumption that all rehabilitation is undertaken by an independent third party. Therefore, various project management and equipment mobilisation costs are incorporated into the rehabilitation bond liability calculation. In practice, rehabilitation costs may be less if Mandalay chooses to utilise internal resources to complete rehabilitation.
Other than the rehabilitation bond, the project is not subject to any other environmental liabilities.
4.5 Royalties Royalties apply to the production of antimony and are payable to the Victorian State Government through the DSDBI. This royalty is applied at 2.75% of the revenue realised from the sale of antimony produced, less the selling costs.
No royalty is payable on gold production, nor is there any royalty agreement in place with previous owners.
Royalties are also payable to the Victorian State Government through the DSDBI if waste rock or tailings is sold (or provided to) to third parties, because they are deemed to be ‘quarry products’. The royalty rate is AUD0.87/t.
4.6 Taxes Mandalay reports that, as at December 2013, there is approximately AUD41M in tax loss carry forwards for AGD that will effectively eliminate any income tax liability in the next few years. Income Tax on Australian company profits is set at 30%.
4.7 Legislation and Permitting Mining Licence MIN4644 has a series of licence conditions that must be met and are the controlling conditions upon which all associated Work Plan Variations (WPVs) are filed with the regulatory authority. Apart from the primary mining legislation which consists of the MRSD Act, operations on MIN4644 are subject to the additional following legislation and regulations for which all appropriate permits and approvals have been obtained.
PFAIR\MULL\LIDB\EBBE\mota Pli014_Costerfield_Operations_Ni_43 101_Master_Rev0 28 March 2014
SRK Consulting Page 28
Legislation:
· Environment Protection Act 1970;
· Planning and Environment Act 1987;
· Environmental Protection and Biodiversity Conservation Act 1999;
· Flora and Fauna Guarantee Act 1988;
· Catchment and Land Protection Act 1994;
· Archaeological and Aboriginal Relics Preservation Act 1972;
· Heritage Act 1995;
· Forest Act 1958;
· Dangerous Goods Act 1985;
· Drugs, Poisons and Controlled Substances Act 1981;
· Public Health and Wellbeing Act 2008;
· Water Act 1989;
· Crown Land (Reserves) Act 1978;
· Radiation Act 2005;
· Conservation, Forests and Lands Act 1987; and
· Wildlife Act 1975.
Regulations:
· Dangerous Goods (Explosives) Regulations 2011;
· Dangerous Goods (Storage and Handling) Regulations 2000;
· Dangerous Goods (HCDG) Regulations 2005;
· Drugs, Poisons and Controlled Substances (Commonwealth Standard) Regulations 2011; and
· Mineral Resources Development Regulations 2002.
Mandalay is currently operating under an approved Work Plan in accordance with Section 39 of the MRSD Act. WPVs are required when significant changes from the Work Plan exist, and it is deemed that the works will have a material impact on the environment and/ or community. Various WPVs have been approved by the DSDBI and are registered against the tenement.
There are no Native Title issues relevant to MIN4644.
To the best of the author’s knowledge, there is no other significant factor or risk that may affect access, title, or the right or ability to perform work on the property.
PFAIR\MULL\LIDB\EBBE\mota Pli014_Costerfield_Operations_Ni_43 101_Master_Rev0 28 March 2014
SRK Consulting Page 29
5 Accessibility, Climate, Local Resources, Infrastructure and Physiography
5.1 Accessibility Access to the Costerfield Operation is via the sealed Heathcote-Nagambie Road which is accessed off the Northern Highway to the south of Heathcote. The Northern Highway links Bendigo with Melbourne.
The Augusta Mine site is accessed off the Heathcote-Nagambie Road via McNicols Lane which comprises a sealed/ gravel road that continues for approximately 1.5 km to the Augusta site offices.
The Brunswick Processing Plant is located on the western side of the Heathcote-Nagambie Road, approximately one kilometre further north of the McNicols Lane turnoff. The Brunswick site offices are accessed by a gravel road that is approximately 600 m long.
5.2 Land Use Land use surrounding the site is mainly small scale farming consisting of grazing on cleared land, surrounded by areas of lightly timbered Box-Ironbark forest. The majority of the undulating land and alluvial flats is privately held freehold land.
The surrounding forest is largely rocky, rugged hill country administered by the Department of Environment and Primary Industries (DEPI) as State Forest. The Puckapunyal Military Area is located on the eastern boundary of the Project Area.
The Augusta Mine site is located on privately held land, while the Brunswick Processing Plant is located on unrestricted Crown land.
The Cuffley Lode is located beneath unrestricted Crown land that consists of sparse woodland, with numerous abandoned shafts and workings along the historic Alison and New Alison mineralised zone.
5.3 Topography The topography of the Costerfield area consists of relatively flat to undulating terrain with elevated areas to the south and west sloping down to a relatively flat plain to the north and east. The low lying areas of the plain are a floodplain. The area ranges in elevation from about 160 m above sea level (ASL) in the east, along Wappentake Creek, to 288 m ASL in the northwest.
5.4 Climate The climate of central Victoria in which the Costerfield Operation is located is ‘Mediterranean’ in nature and consists of hot, dry summers followed by cool and wet winters. Annual rainfall in the area is approximately 500 mm to 600 mm, with the majority occurring between April and October. The annual pan evaporation is between 1,300 mm to 1,400 mm.
The temperature ranges from -2°C in winter (May to August) to +40°C in summer (November to February). Monthly average temperature and rainfall data from Redesdale (the nearest weather recording station to Costerfield, which is some 19 km southwest of Heathcote) is shown in Figure 5-1.
The weather is amendable to year round mining operations; however, occasional significant high rainfall events may restrict surface construction activity for a small number of days.
PFAIR\MULL\LIDB\EBBE\mota Pli014_Costerfield_Operations_Ni_43 101_Master_Rev0 28 March 2014
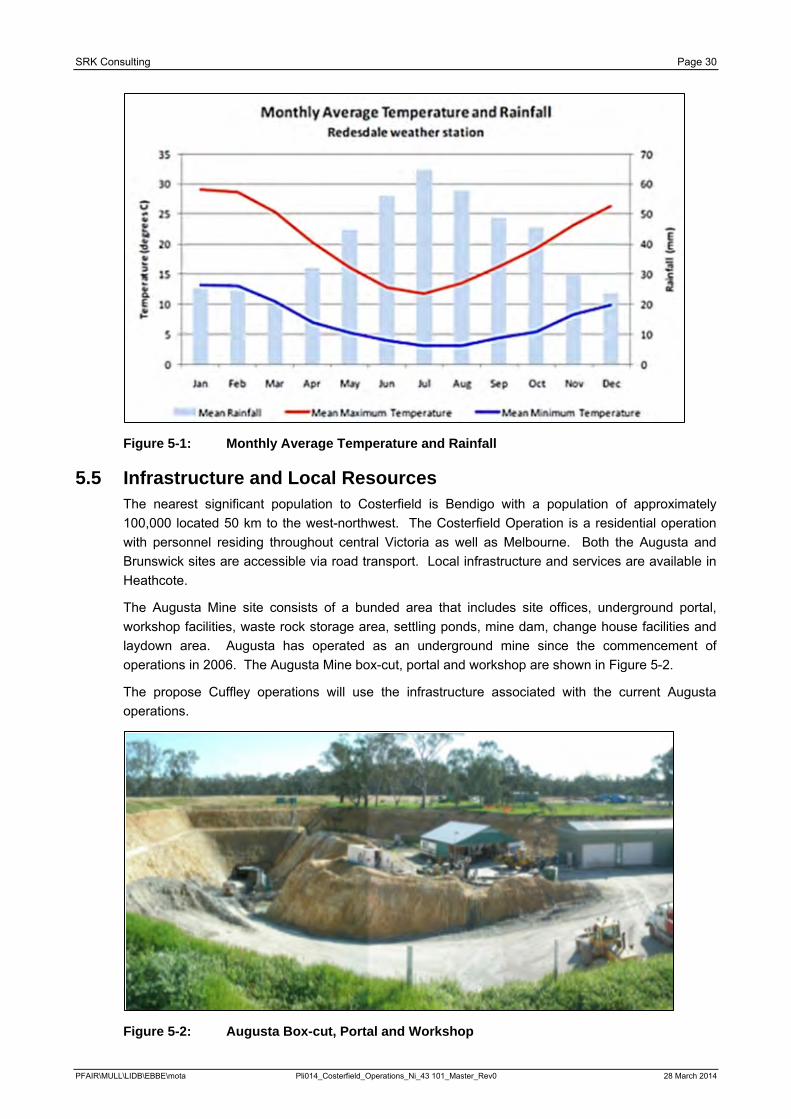
SRK Consulting Page 30
Figure 5-1: Monthly Average Temperature and Rainfall
5.5 Infrastructure and Local Resources The nearest significant population to Costerfield is Bendigo with a population of approximately 100,000 located 50 km to the west-northwest. The Costerfield Operation is a residential operation with personnel residing throughout central Victoria as well as Melbourne. Both the Augusta and Brunswick sites are accessible via road transport. Local infrastructure and services are available in Heathcote.
The Augusta Mine site consists of a bunded area that includes site offices, underground portal, workshop facilities, waste rock storage area, settling ponds, mine dam, change house facilities and laydown area. Augusta has operated as an underground mine since the commencement of operations in 2006. The Augusta Mine box-cut, portal and workshop are shown in Figure 5-2.
The propose Cuffley operations will use the infrastructure associated with the current Augusta operations.
Figure 5-2: Augusta Box-cut, Portal and Workshop
PFAIR\MULL\LIDB\EBBE\mota Pli014_Costerfield_Operations_Ni_43 101_Master_Rev0 28 March 2014
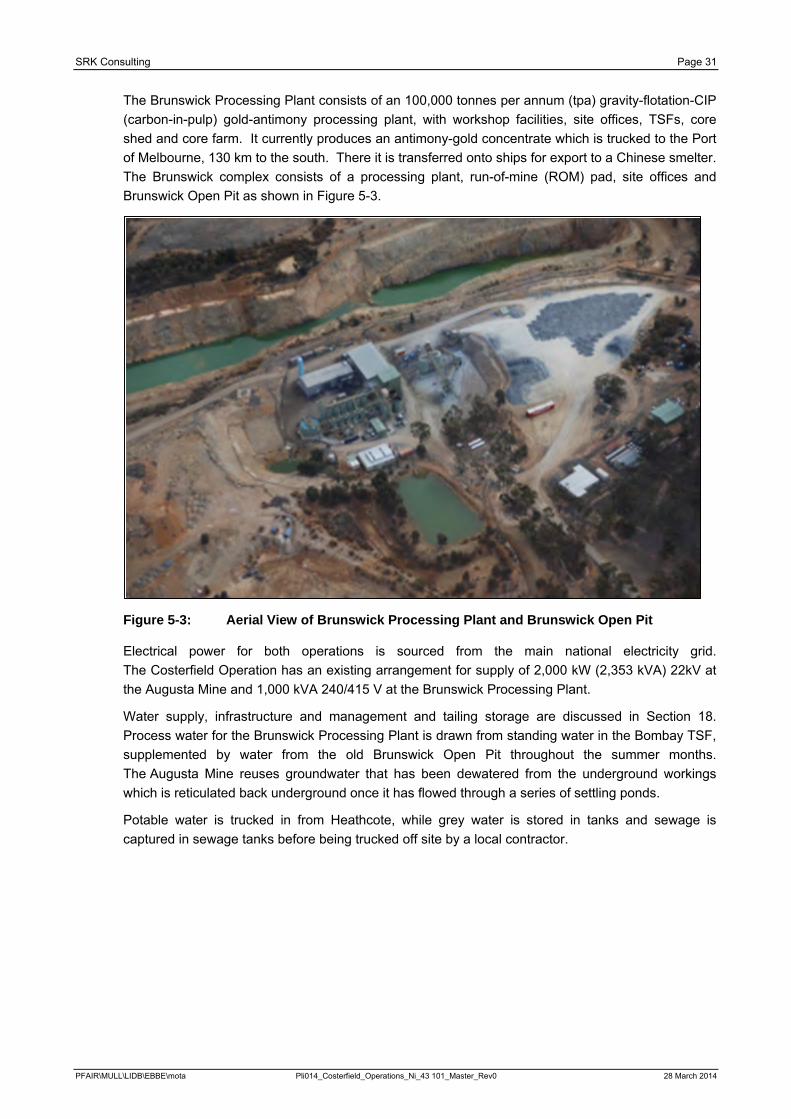
SRK Consulting Page 31
The Brunswick Processing Plant consists of an 100,000 tonnes per annum (tpa) gravity-flotation-CIP (carbon-in-pulp) gold-antimony processing plant, with workshop facilities, site offices, TSFs, core shed and core farm. It currently produces an antimony-gold concentrate which is trucked to the Port of Melbourne, 130 km to the south. There it is transferred onto ships for export to a Chinese smelter. The Brunswick complex consists of a processing plant, run-of-mine (ROM) pad, site offices and Brunswick Open Pit as shown in Figure 5-3.
Figure 5-3: Aerial View of Brunswick Processing Plant and Brunswick Open Pit
Electrical power for both operations is sourced from the main national electricity grid. The Costerfield Operation has an existing arrangement for supply of 2,000 kW (2,353 kVA) 22kV at the Augusta Mine and 1,000 kVA 240/415 V at the Brunswick Processing Plant.
Water supply, infrastructure and management and tailing storage are discussed in Section 18. Process water for the Brunswick Processing Plant is drawn from standing water in the Bombay TSF, supplemented by water from the old Brunswick Open Pit throughout the summer months. The Augusta Mine reuses groundwater that has been dewatered from the underground workings which is reticulated back underground once it has flowed through a series of settling ponds.
Potable water is trucked in from Heathcote, while grey water is stored in tanks and sewage is captured in sewage tanks before being trucked off site by a local contractor.
PFAIR\MULL\LIDB\EBBE\mota Pli014_Costerfield_Operations_Ni_43 101_Master_Rev0 28 March 2014
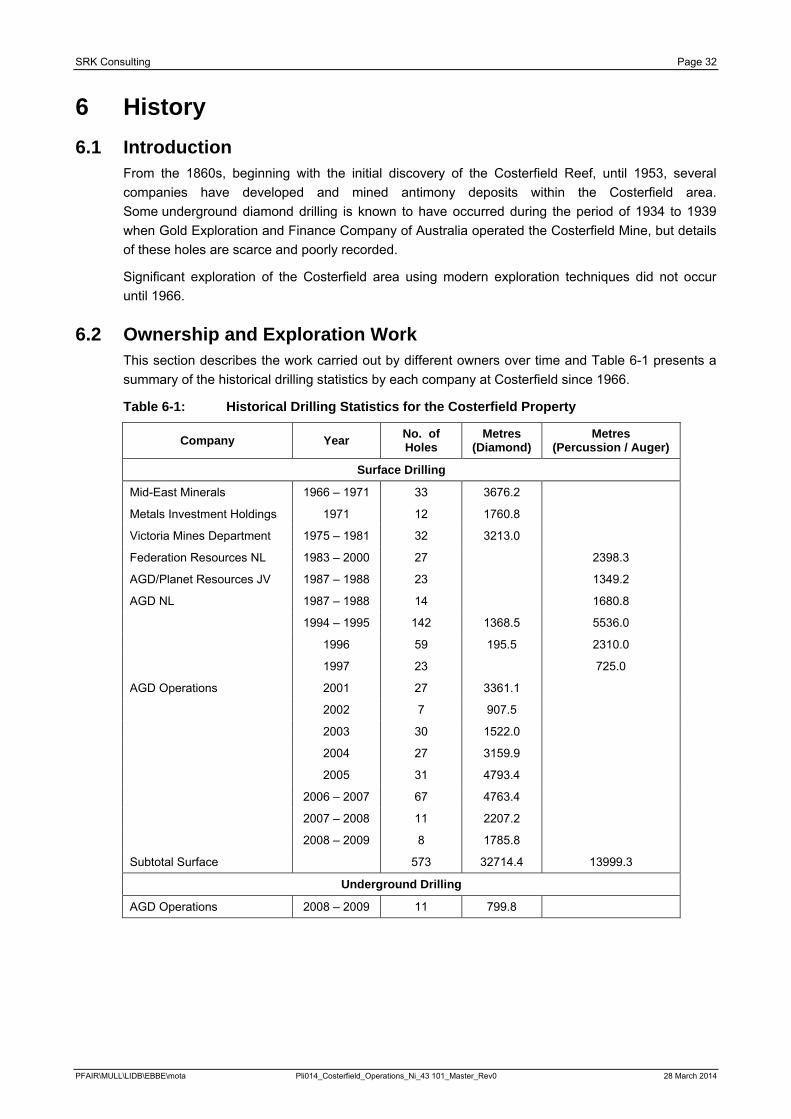
SRK Consulting Page 32
6 History 6.1 Introduction
From the 1860s, beginning with the initial discovery of the Costerfield Reef, until 1953, several companies have developed and mined antimony deposits within the Costerfield area. Some underground diamond drilling is known to have occurred during the period of 1934 to 1939 when Gold Exploration and Finance Company of Australia operated the Costerfield Mine, but details of these holes are scarce and poorly recorded.
Significant exploration of the Costerfield area using modern exploration techniques did not occur until 1966.
6.2 Ownership and Exploration Work This section describes the work carried out by different owners over time and Table 6-1 presents a summary of the historical drilling statistics by each company at Costerfield since 1966.
Table 6-1: Historical Drilling Statistics for the Costerfield Property
Company Year No. of Holes
Metres (Diamond)
Metres (Percussion / Auger)
Surface Drilling
Mid-East Minerals 1966 – 1971 33 3676.2
Metals Investment Holdings 1971 12 1760.8
Victoria Mines Department 1975 – 1981 32 3213.0
Federation Resources NL 1983 – 2000 27 2398.3
AGD/Planet Resources JV 1987 – 1988 23 1349.2
AGD NL 1987 – 1988 14 1680.8
1994 – 1995 142 1368.5 5536.0
1996 59 195.5 2310.0
1997 23 725.0
AGD Operations 2001 27 3361.1
2002 7 907.5
2003 30 1522.0
2004 27 3159.9
2005 31 4793.4
2006 – 2007 67 4763.4
2007 – 2008 11 2207.2
2008 – 2009 8 1785.8
Subtotal Surface 573 32714.4 13999.3
Underground Drilling
AGD Operations 2008 – 2009 11 799.8
PFAIR\MULL\LIDB\EBBE\mota Pli014_Costerfield_Operations_Ni_43 101_Master_Rev0 28 March 2014
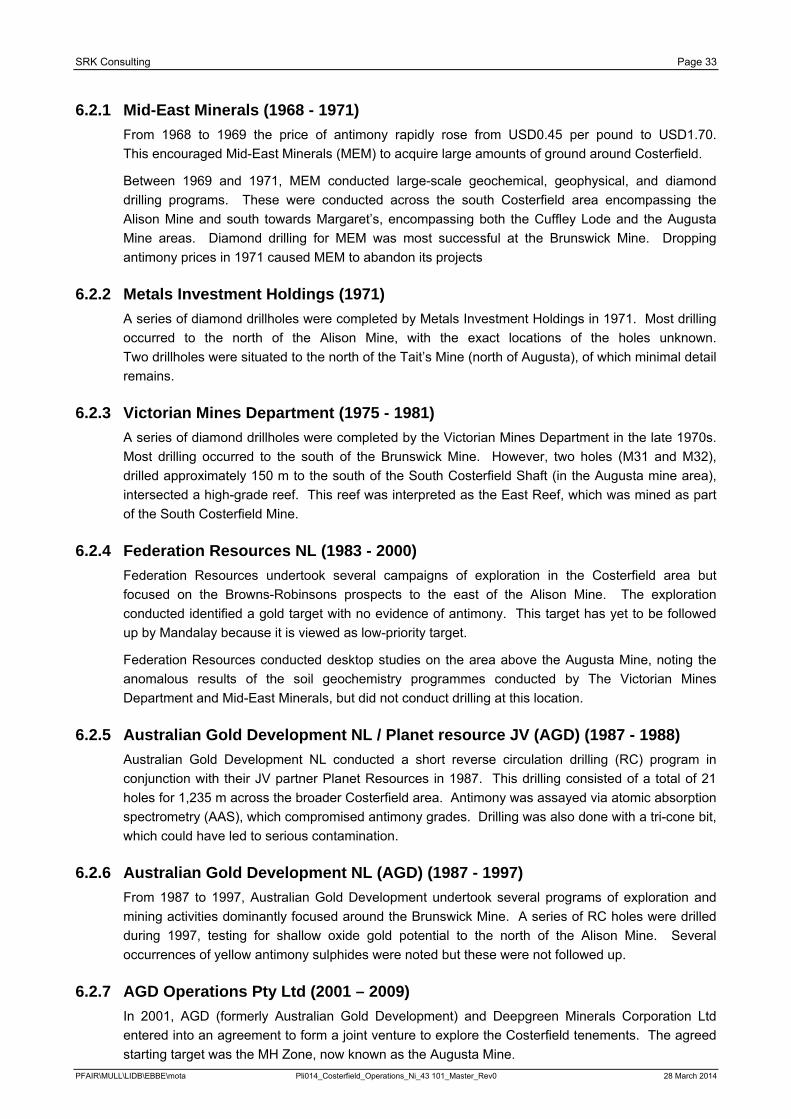
SRK Consulting Page 33
6.2.1 Mid-East Minerals (1968 - 1971) From 1968 to 1969 the price of antimony rapidly rose from USD0.45 per pound to USD1.70. This encouraged Mid-East Minerals (MEM) to acquire large amounts of ground around Costerfield.
Between 1969 and 1971, MEM conducted large-scale geochemical, geophysical, and diamond drilling programs. These were conducted across the south Costerfield area encompassing the Alison Mine and south towards Margaret’s, encompassing both the Cuffley Lode and the Augusta Mine areas. Diamond drilling for MEM was most successful at the Brunswick Mine. Dropping antimony prices in 1971 caused MEM to abandon its projects
6.2.2 Metals Investment Holdings (1971) A series of diamond drillholes were completed by Metals Investment Holdings in 1971. Most drilling occurred to the north of the Alison Mine, with the exact locations of the holes unknown. Two drillholes were situated to the north of the Tait’s Mine (north of Augusta), of which minimal detail remains.
6.2.3 Victorian Mines Department (1975 - 1981) A series of diamond drillholes were completed by the Victorian Mines Department in the late 1970s. Most drilling occurred to the south of the Brunswick Mine. However, two holes (M31 and M32), drilled approximately 150 m to the south of the South Costerfield Shaft (in the Augusta mine area), intersected a high-grade reef. This reef was interpreted as the East Reef, which was mined as part of the South Costerfield Mine.
6.2.4 Federation Resources NL (1983 - 2000) Federation Resources undertook several campaigns of exploration in the Costerfield area but focused on the Browns-Robinsons prospects to the east of the Alison Mine. The exploration conducted identified a gold target with no evidence of antimony. This target has yet to be followed up by Mandalay because it is viewed as low-priority target.
Federation Resources conducted desktop studies on the area above the Augusta Mine, noting the anomalous results of the soil geochemistry programmes conducted by The Victorian Mines Department and Mid-East Minerals, but did not conduct drilling at this location.
6.2.5 Australian Gold Development NL / Planet resource JV (AGD) (1987 - 1988) Australian Gold Development NL conducted a short reverse circulation drilling (RC) program in conjunction with their JV partner Planet Resources in 1987. This drilling consisted of a total of 21 holes for 1,235 m across the broader Costerfield area. Antimony was assayed via atomic absorption spectrometry (AAS), which compromised antimony grades. Drilling was also done with a tri-cone bit, which could have led to serious contamination.
6.2.6 Australian Gold Development NL (AGD) (1987 - 1997) From 1987 to 1997, Australian Gold Development undertook several programs of exploration and mining activities dominantly focused around the Brunswick Mine. A series of RC holes were drilled during 1997, testing for shallow oxide gold potential to the north of the Alison Mine. Several occurrences of yellow antimony sulphides were noted but these were not followed up.
6.2.7 AGD Operations Pty Ltd (2001 – 2009) In 2001, AGD (formerly Australian Gold Development) and Deepgreen Minerals Corporation Ltd entered into an agreement to form a joint venture to explore the Costerfield tenements. The agreed starting target was the MH Zone, now known as the Augusta Mine.
PFAIR\MULL\LIDB\EBBE\mota Pli014_Costerfield_Operations_Ni_43 101_Master_Rev0 28 March 2014
SRK Consulting Page 34
2001 AGD’s drilling of the MH Zone commenced on 5 April 2001. In total, 27 holes were completed for 3301.1 m. All holes were drilled with an initial PQ or HQ collar to approximately 25 m and then finished with NQ-sized core, the purpose of which was to maximize core recoveries. Triple-tube drilling was also employed in areas to maximize recoveries. Cobar Drilling Company Pty Ltd, based in Rushworth, was contracted for the drilling program. Much softer selvages to the Mineralisation were successfully recovered during this program but core loss was still estimated to be up to 15% within the Mineralised zones. All holes were downhole surveyed and orientated during drilling. Collar locations were surveyed by Cummins & Associates from Bendigo.
This drilling was confined to an area 180 m south of the South Costerfield Shaft and over approximately 400 m of strike.
It was identified that because of prolonged mining and exploration undertaken in the Costerfield area, up to three metric grids were in use. The drilling undertaken in 2001 at Augusta was based on the mine grid established in the late 1950s. This grid set-up remains in use in present day mining and exploration activities.
2002 In 2002, AGD completed a further five holes at the MH Zone for a total 732.3 m, including 41.7 m blade, 309.3 m of RC hammer and 381.3 m of HQ diamond drilling. Drillhole MH034 intersected an unmineralised zone at 55 m downhole. This is hypothesised to represent the Alison line of lode towards the south.
Towards the east of the MH Zone, AGD completed two lines of soil sampling comprising 400.5 m of aircore drilling in 88 holes. The known MH lodes were highly anomalous and a weak, gold-only trend was outlined 180 m east of the MH Zone. This zone was drilled by diamond drillhole MH028, which contained a large siliceous lode zone with low-grade gold values.
To the south of the MH Zone, AGD sampled two soil lines in 42 holes. It was later recognised that these holes probably did not sample basement siltstones. A further line of 21 soil holes confirmed this prognosis. These holes picked up widespread anomalous gold geochemistry with a central strong anomaly. A total of 218 m of aircore drilling was completed.
2003 In 2003, the MH Zone was renamed the Augusta Deposit. In total, 30 diamond drillholes for 1514 m were drilled by AGD as part of an infill and extension program to the Augusta Deposit. The main purpose of this drilling was to prove continuity of the deposit to near surface, in preparation for open-pit mining and to extend the Mineralised system both north and south. Mineralisation was shown to extend north to the South Costerfield Shaft and upwards to the surface. To the south, drilling confirmed that the lode system, although being present, was not economic.
Each hole was logged in detail and geological lode thickness and recovered thicknesses were recorded. Core loss was estimated to be less in this drill program when compared to previous drilling programs, even though the majority of drillholes were drilled in the weathered zone.
In addition to the infill and extension program, 14 RC drillholes were drilled as part of a metallurgical testwork program. These holes were drilled at low angles to the lodes, specifically to obtain the required sample mass for the metallurgical testwork.
PFAIR\MULL\LIDB\EBBE\mota Pli014_Costerfield_Operations_Ni_43 101_Master_Rev0 28 March 2014
SRK Consulting Page 35
2004/ 2005 Between October 2004 and April 2005, AGD completed a 26-hole diamond-drilling program at the Augusta Deposit. Apart from 5 m percussion pre-collars and 4 RC geotechnical holes, the holes were drilled by HQ triple-tube diamond drilling.
The objectives of the diamond-drilling program were:
· Improvement in mineralisation definition by increasing drillhole density;
· Extension of the mineralisation model by drilling around the deposit periphery; and
· Increasing the Mineral Resource and Mineral Reserve.
2006 / 2007 AGD’s drilling activities throughout 2006 and 2007 comprised grid drilling of the Brunswick Deposit and drilling of the periphery of the Augusta Deposit for a total of 7,562 metres of diamond drilling. This comprised the following drillholes:
· 31 holes, totalling 4,994 m, drilled under the old Brunswick open pit for resource estimation;
· 17 holes, totalling 755 m, drilled into the upper northern end of W Lode; and
· 20 holes, totalling 1813 m, drilled north of the Augusta Mine to test E Lode’s northern extent.
The Brunswick Resource definition drilling was drilled using HQ triple tube with a modified Longyear LM75 drill rig by Boart Longyear drilling. The area under the pit was drilled on a 40 m by 40 m pattern.
Due to initial difficulty with following W Lode underground, a Bobcat mounted Longyear LM30 diamond drilling rig was used to infill drill the near-surface portion of W lode. This drilling was done using a narrow-kerf LTK60-sized core barrel, with a total of 17 holes, totalling 755 m, being drilled adjacent to the Augusta box cut.
On completion of the Brunswick and W Lode drilling, both the LM75 and the LM30 rigs were used to drill north of the Augusta Mine, tracing the northern extent of E Lode towards the old South Costerfield workings. A total of 20 holes for 1,813 m were drilled north of the Augusta Mine.
2007 / 2008 AGD’s drilling activities throughout 2007 and 2008 comprised reconnaissance drilling of the Tin Pot Gully Prospect and drilling along strike and down-dip of the existing Augusta Deposit. A total of 3395.6 m of diamond drilling was carried out during the year. This comprised the following:
· 13 holes, totalling 1,188 m, drilled under the Tin Pot Gully Prospect; and
· 11 holes, totalling 2,207 metres, drilled into the Augusta Deposit, particularly to test W and E Lodes.
Encouraging results highlighted down-dip and strike extensions in terms of vein widths and grades, as described below:
· W Lode: 8 out of the 11 drillholes confirmed W Lode continuity down-dip, with true thicknesses ranging from 0.254 to 0.814 m at 22.50 to 89.26 g/t Au and 16.19 to 47.20% Sb;
· E Lode: 3 out of the 8 holes drillholes confirmed E Lode continuity down-dip, with true thickness ranging from 0.074 to 0.215 m at 4.24 to 35.1 g/t Au and 3.25 to 32.2% Sb; and
· N Lode: 6 holes out of the 11 holes intercepted N Lode or a similar structure in the hanging wall of W lode, showing true thicknesses from 0.09 to 0.293 m at 6.82 to 46.9 g/t Au and 6.81 to 27% Sb.
PFAIR\MULL\LIDB\EBBE\mota Pli014_Costerfield_Operations_Ni_43 101_Master_Rev0 28 March 2014
SRK Consulting Page 36
Based on these results, AGD commissioned AMC to undertake a resource estimate for the Augusta Deposit, in January 2008.
Between February and June 2008, Silver City Drilling Company completed 11 drillholes, totalling 2207.2 m that were drilled on the northern section of the Augusta Deposit, particularly from 4411 mN to 4602 mN.
The 11 surface drillholes covered an area of approximately 18,740 m2, delineating a 120 m down-dip continuation, below 4 Level, of the three dominant Augusta Lodes: W Lode, E Lode, and N lode.
Holes ranged in size from HQ to NQ and LTK46.
2008 / 2009 AGD’s drilling activities throughout 2008 and 2009 comprised drilling along strike and down-dip from the existing Augusta resource. A total of 2585.95 metres of diamond drilling was completed.
Drilling during 2008 and 2009 was concentrated on the definition of the W Lode resource. Five drillholes tested the depth extent of W Lode. Another 13 holes were designed as infill holes to test ore shoots and gather geotechnical data. Holes ranged in size from HQ to NQ and LTK46.
PFAIR\MULL\LIDB\EBBE\mota Pli014_Costerfield_Operations_Ni_43 101_Master_Rev0 28 March 2014
SRK Consulting Page 37
7 Geological Setting and Mineralisation 7.1 Regional Geology
The Costerfield gold-antimony field is located at the northern end of the Darraweit Guim province, in the Western portion of the Melbourne Zone. In the Heathcote area of the Melbourne Zone, the Murrindindi Supergroup within the Darraweit Guim Province encompasses a very thick sequence of Siluro-Devonian marine sediments. These consist predominantly of siltstone, mudstone, and turbidite sequences.
The western boundary of the Darraweit Guim Province is demarcated by the Cambrian Heathcote Volcanic Belt and north-trending Mt William Fault. The Mt William Fault is a major structural terrain boundary that separates the Bendigo Zone from the Melbourne Zone.
The lower Silurian Costerfield Siltstone is the oldest unit in the Heathcote area and is conformably overlain by the Wappentake Formation (sandstone/ siltstone), the Dargile Formation (mudstone), the McIvor Sandstone, and the Mount Ida Formation (sandstone/ mudstone). This is shown in Figure 7-1.
The Melbourne Zone sedimentary sequence has been deformed into a series of large-scale domal folds. These major north-trending, sub-parallel folds in the Darraweit Guim Province include, from west to east: the Mount Ida Syncline; the Costerfield Dome/ Anticline; the Black Cat and Graytown anticlines; and the Rifle Range Syncline. These folds tend to be upright, open, large wavelength curvilinear structures.
The folds have been truncated by significant movements along two major north trending faults, the Moormbool and Black Cat faults.
The Moormbool Fault has truncated the eastern limb of the Costerfield Anticline, resulting in an asymmetric dome structure. The Moormbool Fault is a major structural boundary separating two structural subdomains in the Melbourne Zone. West of the Moormbool Fault is the Siluro-Devonian sedimentary sequence, hosting the gold-antimony lodes. The thick, predominantly Devonian Broadford Formation sequence occurs to the east of the fault and contains minor gold-dominant mineralisation.
PFAIR\MULL\LIDB\EBBE\mota Pli014_Costerfield_Operations_Ni_43 101_Master_Rev0 28 March 2014
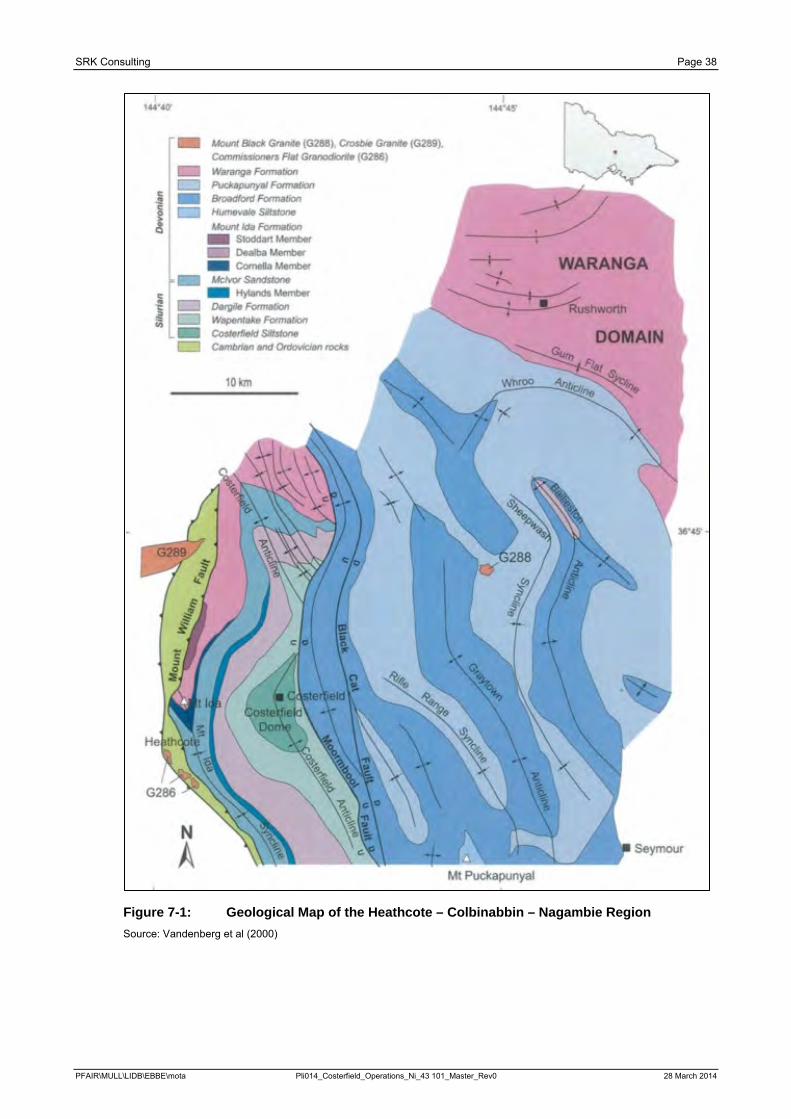
SRK Consulting Page 38
Figure 7-1: Geological Map of the Heathcote – Colbinabbin – Nagambie Region Source: Vandenberg et al (2000)
PFAIR\MULL\LIDB\EBBE\mota Pli014_Costerfield_Operations_Ni_43 101_Master_Rev0 28 March 2014
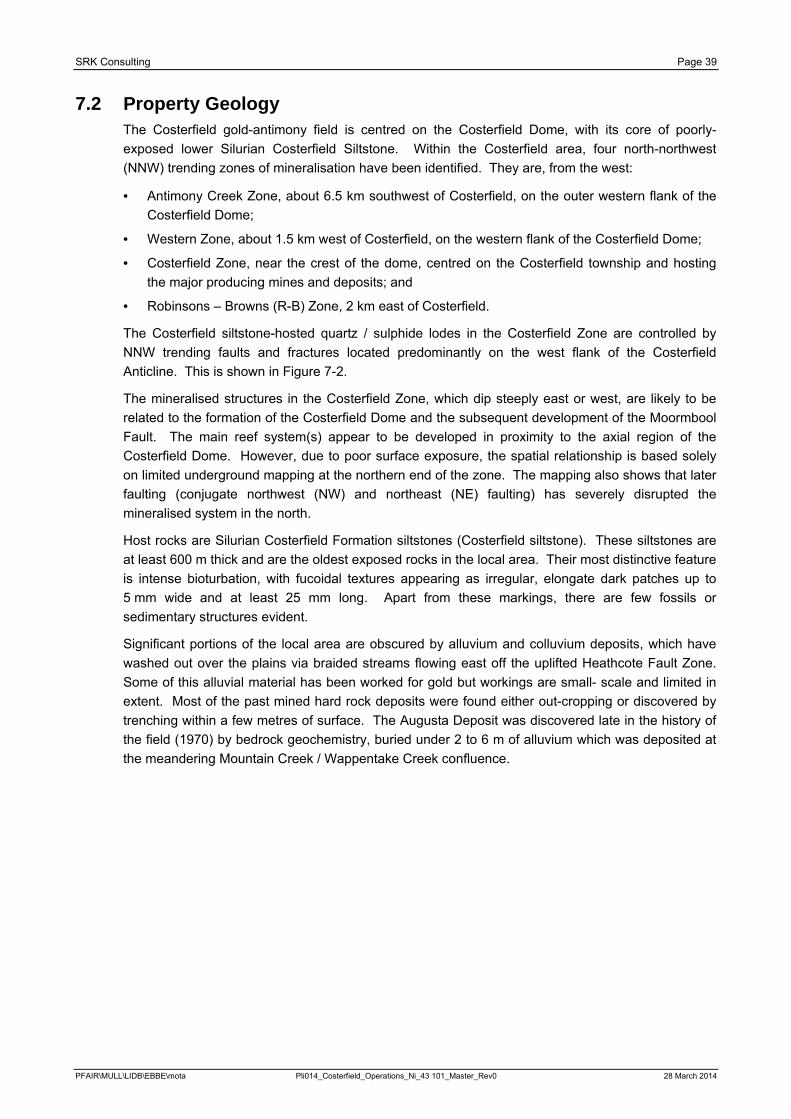
SRK Consulting Page 39
7.2 Property Geology The Costerfield gold-antimony field is centred on the Costerfield Dome, with its core of poorly-exposed lower Silurian Costerfield Siltstone. Within the Costerfield area, four north-northwest (NNW) trending zones of mineralisation have been identified. They are, from the west:
· Antimony Creek Zone, about 6.5 km southwest of Costerfield, on the outer western flank of the Costerfield Dome;
· Western Zone, about 1.5 km west of Costerfield, on the western flank of the Costerfield Dome;
· Costerfield Zone, near the crest of the dome, centred on the Costerfield township and hosting the major producing mines and deposits; and
· Robinsons – Browns (R-B) Zone, 2 km east of Costerfield.
The Costerfield siltstone-hosted quartz / sulphide lodes in the Costerfield Zone are controlled by NNW trending faults and fractures located predominantly on the west flank of the Costerfield Anticline. This is shown in Figure 7-2.
The mineralised structures in the Costerfield Zone, which dip steeply east or west, are likely to be related to the formation of the Costerfield Dome and the subsequent development of the Moormbool Fault. The main reef system(s) appear to be developed in proximity to the axial region of the Costerfield Dome. However, due to poor surface exposure, the spatial relationship is based solely on limited underground mapping at the northern end of the zone. The mapping also shows that later faulting (conjugate northwest (NW) and northeast (NE) faulting) has severely disrupted the mineralised system in the north.
Host rocks are Silurian Costerfield Formation siltstones (Costerfield siltstone). These siltstones are at least 600 m thick and are the oldest exposed rocks in the local area. Their most distinctive feature is intense bioturbation, with fucoidal textures appearing as irregular, elongate dark patches up to 5 mm wide and at least 25 mm long. Apart from these markings, there are few fossils or sedimentary structures evident.
Significant portions of the local area are obscured by alluvium and colluvium deposits, which have washed out over the plains via braided streams flowing east off the uplifted Heathcote Fault Zone. Some of this alluvial material has been worked for gold but workings are small- scale and limited in extent. Most of the past mined hard rock deposits were found either out-cropping or discovered by trenching within a few metres of surface. The Augusta Deposit was discovered late in the history of the field (1970) by bedrock geochemistry, buried under 2 to 6 m of alluvium which was deposited at the meandering Mountain Creek / Wappentake Creek confluence.
PFAIR\MULL\LIDB\EBBE\mota Pli014_Costerfield_Operations_Ni_43 101_Master_Rev0 28 March 2014
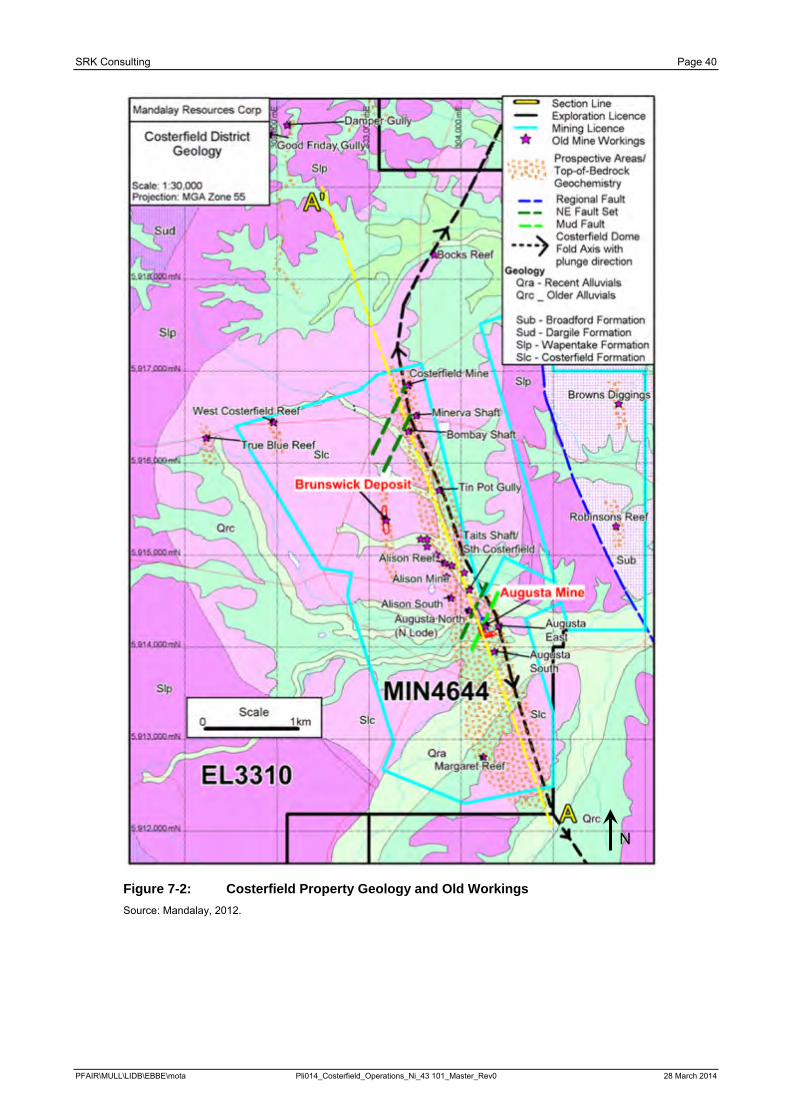
SRK Consulting Page 40
Figure 7-2: Costerfield Property Geology and Old Workings Source: Mandalay, 2012.
N
PFAIR\MULL\LIDB\EBBE\mota Pli014_Costerfield_Operations_Ni_43 101_Master_Rev0 28 March 2014
SRK Consulting Page 41
7.3 Property Mineralisation The economic mineralisation in the Property occurs at the southern end of a system of steeply-dipping quartz-stibnite lodes, with thicknesses ranging from millimetres to one metre and extending over a strike of at least 4 km. Individual lodes can persist for up to 800 m in strike and 300 m down-dip. The lode system is centred in the core of the doubly-plunging Costerfield Anticline and is hosted by Costerfield siltstones.
The fault-hosted narrow lodes have been formed in multiple phases. The earliest phase was the bedding parallel laminated quartz veins, which are barren. The next was the quartz-pyrite-arsenopyrite phase with erratic coarse gold. The last was the stibnite-gold phase, which hosts evenly-distributed, fine-grained gold. The Costerfield lodes are typical anastomosing, en échelon style, narrow-vein systems, dipping from 25° to 70° west to steep east (70° to 90° east). Mineralised shoots are observed to plunge to the north in some lodes and south in other lodes.
The mineralisation occurs as single lodes and vein stockworks associated with brittle fault zones. These bedding and cleavage parallel faults range from sharp breaks of less than 1 mm to dilated shears that locally contain fault gouge, quartz, carbonate, and stibnite. Cross faults, such as those seen offsetting other Costerfield lodes, have been identified in both open-pit and underground workings.
Mineralised lodes vary from massive stibnite with microscopic gold to quartz-stibnite, with minor visible gold, pyrite, and arsenopyrite. Stibnite is clearly seen to replace quartz. Gold can also be hosted by quartz.
Figure 7-3 is a photograph of typical mineralisation as shown in E Lode on the 1070 mRL and shows the features of the deposit discussed above. A close-up photograph of the mineralised lode is shown in Figure 7-4.
Figure 7-3: Two views of E Lode 1070 Level South, with annotation on right-hand side Notes: The mining face is approximately 1.8 m wide and 2.8 m high. For scale, the lens cap is 67 mm. Source: SRK Consulting, 2010
PFAIR\MULL\LIDB\EBBE\mota Pli014_Costerfield_Operations_Ni_43 101_Master_Rev0 28 March 2014
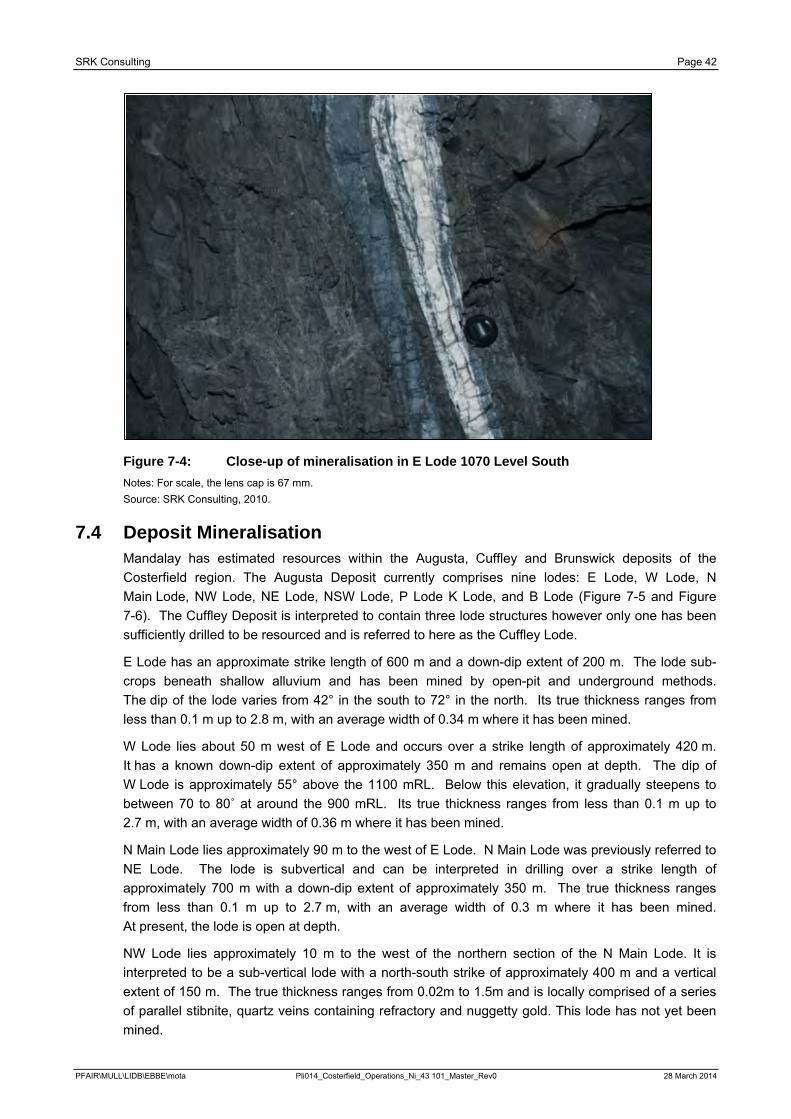
SRK Consulting Page 42
Figure 7-4: Close-up of mineralisation in E Lode 1070 Level South Notes: For scale, the lens cap is 67 mm. Source: SRK Consulting, 2010.
7.4 Deposit Mineralisation Mandalay has estimated resources within the Augusta, Cuffley and Brunswick deposits of the Costerfield region. The Augusta Deposit currently comprises nine lodes: E Lode, W Lode, N Main Lode, NW Lode, NE Lode, NSW Lode, P Lode K Lode, and B Lode (Figure 7-5 and Figure 7-6). The Cuffley Deposit is interpreted to contain three lode structures however only one has been sufficiently drilled to be resourced and is referred to here as the Cuffley Lode.
E Lode has an approximate strike length of 600 m and a down-dip extent of 200 m. The lode sub-crops beneath shallow alluvium and has been mined by open-pit and underground methods. The dip of the lode varies from 42° in the south to 72° in the north. Its true thickness ranges from less than 0.1 m up to 2.8 m, with an average width of 0.34 m where it has been mined.
W Lode lies about 50 m west of E Lode and occurs over a strike length of approximately 420 m. It has a known down-dip extent of approximately 350 m and remains open at depth. The dip of W Lode is approximately 55° above the 1100 mRL. Below this elevation, it gradually steepens to between 70 to 80˚ at around the 900 mRL. Its true thickness ranges from less than 0.1 m up to 2.7 m, with an average width of 0.36 m where it has been mined.
N Main Lode lies approximately 90 m to the west of E Lode. N Main Lode was previously referred to NE Lode. The lode is subvertical and can be interpreted in drilling over a strike length of approximately 700 m with a down-dip extent of approximately 350 m. The true thickness ranges from less than 0.1 m up to 2.7 m, with an average width of 0.3 m where it has been mined. At present, the lode is open at depth.
NW Lode lies approximately 10 m to the west of the northern section of the N Main Lode. It is interpreted to be a sub-vertical lode with a north-south strike of approximately 400 m and a vertical extent of 150 m. The true thickness ranges from 0.02m to 1.5m and is locally comprised of a series of parallel stibnite, quartz veins containing refractory and nuggetty gold. This lode has not yet been mined.
PFAIR\MULL\LIDB\EBBE\mota Pli014_Costerfield_Operations_Ni_43 101_Master_Rev0 28 March 2014
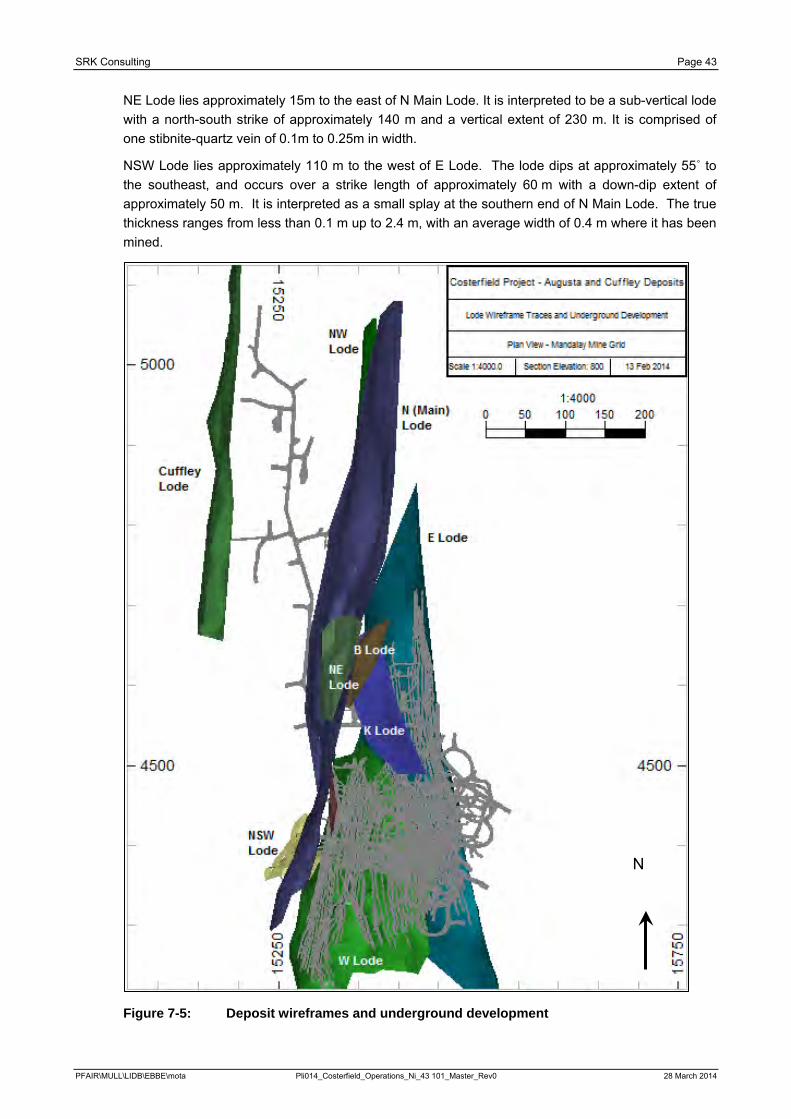
SRK Consulting Page 43
NE Lode lies approximately 15m to the east of N Main Lode. It is interpreted to be a sub-vertical lode with a north-south strike of approximately 140 m and a vertical extent of 230 m. It is comprised of one stibnite-quartz vein of 0.1m to 0.25m in width.
NSW Lode lies approximately 110 m to the west of E Lode. The lode dips at approximately 55˚ to the southeast, and occurs over a strike length of approximately 60 m with a down-dip extent of approximately 50 m. It is interpreted as a small splay at the southern end of N Main Lode. The true thickness ranges from less than 0.1 m up to 2.4 m, with an average width of 0.4 m where it has been mined.
Figure 7-5: Deposit wireframes and underground development
N
PFAIR\MULL\LIDB\EBBE\mota Pli014_Costerfield_Operations_Ni_43 101_Master_Rev0 28 March 2014
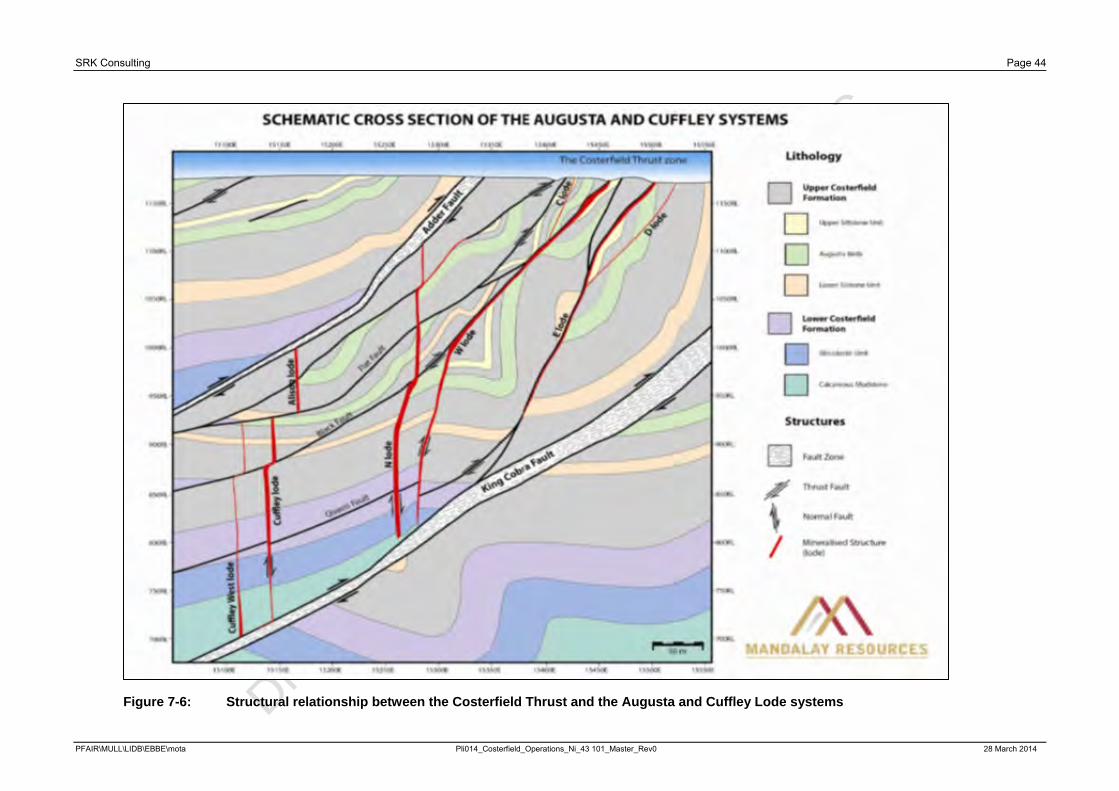
SRK Consulting Page 44
Figure 7-6: Structural relationship between the Costerfield Thrust and the Augusta and Cuffley Lode systems
PFAIR\MULL\LIDB\EBBE\mota Pli014_Costerfield_Operations_Ni_43 101_Master_Rev0 28 March 2014
SRK Consulting Page 45
P Lode lies approximately 80 m to the west of E Lode. The lode dips at approximately 85˚ to the east and occurs over a strike length of approximately 60 m, with a down-dip extent of approximately 60 m. It is interpreted as a small transfer structure between W Lode and N Main Lode. The true thickness ranges from less than 0.1 m up to 1.9 m, with an average width of 0.4 m where it has been mined.
K Lode lies 50 m to the west of the northern section of E lode. The lode dips at approximately 55˚ to the west with a strike length of 80 m and a vertical extent of 70 m. it consists of a bedding parallel, laminated quartz-stibnite vein of 0.1 m to 0.35 m width.
B Lode it interpreted to be a splay of the northern extent of E Lode and is between 0-20 m to the west of E Lode. It is sub vertical to west dipping and strikes east of north. Its vertical extent is approximately 170 m and strike extent 100 m.
The Cuffley Lode lies approximately 200 m to the west of E Lode. The lode dips at about 85° to the east and occurs over a strike length of approximately 750 m, with a down-dip extent of approximately 250 m. It has an average true thickness of approximately 0.53 m. At present, the lode is open at depth.
The Brunswick Lode lies approximately 600 m west and 1300 m north of E Lode. The lode is approximately vertical and occurs over a strike length of approximately 350 m, with a down-dip extent of approximately 200 m. It has an average true thickness of approximately 1.28 m. At present, the lode is open at depth.
FAIR\MULL\LIDB\EBBE\mota PLI014_Costerfield_Operations_NI_43 101_Master_Rev0 28 March 2014
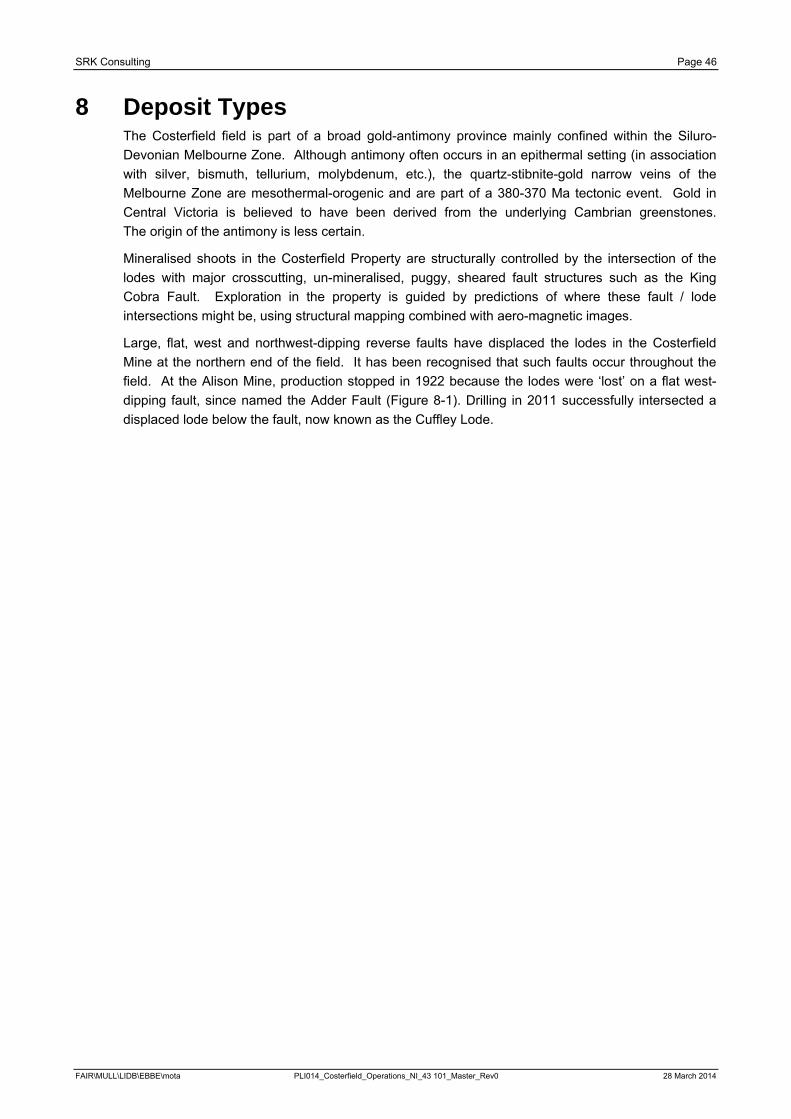
SRK Consulting Page 46
8 Deposit Types The Costerfield field is part of a broad gold-antimony province mainly confined within the Siluro-Devonian Melbourne Zone. Although antimony often occurs in an epithermal setting (in association with silver, bismuth, tellurium, molybdenum, etc.), the quartz-stibnite-gold narrow veins of the Melbourne Zone are mesothermal-orogenic and are part of a 380-370 Ma tectonic event. Gold in Central Victoria is believed to have been derived from the underlying Cambrian greenstones. The origin of the antimony is less certain.
Mineralised shoots in the Costerfield Property are structurally controlled by the intersection of the lodes with major crosscutting, un-mineralised, puggy, sheared fault structures such as the King Cobra Fault. Exploration in the property is guided by predictions of where these fault / lode intersections might be, using structural mapping combined with aero-magnetic images.
Large, flat, west and northwest-dipping reverse faults have displaced the lodes in the Costerfield Mine at the northern end of the field. It has been recognised that such faults occur throughout the field. At the Alison Mine, production stopped in 1922 because the lodes were ‘lost’ on a flat west-dipping fault, since named the Adder Fault (Figure 8-1). Drilling in 2011 successfully intersected a displaced lode below the fault, now known as the Cuffley Lode.
FAIR\MULL\LIDB\EBBE\mota PLI014_Costerfield_Operations_NI_43 101_Master_Rev0 28 March 2014
SRK Consulting Page 47
Figure 8-1: Costerfield geological systems showing Brunswick, Bombay/Minerva, Cuffley and Augusta deposits
FAIR\MULL\LIDB\EBBE\mota PLI014_Costerfield_Operations_NI_43 101_Master_Rev0 28 March 2014
SRK Consulting Page 48
9 Exploration Exploration work has consisted of prospecting, trenching, geological mapping, geophysics, geochemistry, and diamond-drill testing of interpreted geological targets. Geochemical methods have proven to be applicable in detecting gold-antimony mineralisation, with such methods leading to the discovery of the Augusta Deposit.
9.1 Costean / Trenching Previous owners have undertaken trenching but records of these exploration activities are limited.
9.2 Petrophysical Analysis In 2006, AGD submitted a suite of 22 rock and mineralised samples from all the known deposits around Costerfield for testing by Systems Exploration (NSW) Pty Ltd. The aim was to determine their petrophysical properties and to identify the most effective geophysical methods that could be used in the field to detect similar mineralisation.
Of the samples submitted, thirteen were mineralised and were sourced from Augusta, Margaret, Antimony Creek, Costerfield, Bombay, Alison and Brunswick; two were weathered mineralisation and were sourced from Augusta; seven were waste.
The following petrophysical measurements were made:
· Mass properties:
– Dry bulk density;
– Apparent porosity;
– Grain density; and
– Wet bulk density.
· Inductive properties:
– Magnetic susceptibility;
– Diamagnetic susceptibility; and
– Electromagnetic conductivity.
· Galvanic properties:
– Galvanic resistivity; and
– Chargeability
Although there are measurable differences in the physical properties of mineralised and non-mineralised material at Costerfield, they are marginal at best, and it is unlikely that the differences present would result in clear geophysical signatures. The only field techniques recommended for trialling were ground-based magnetic, gravity, and induced polarisation (IP) profiling.
9.3 Geophysics
9.3.1 Ground Geophysics Based on the results of the petrophysical testing program, a limited program of ground magnetic, gravity, and IP profiling, with optimal measurement parameters, was carried out across the Augusta Deposit. None of the techniques were found to be effective at detecting the known mineralisation at Augusta.
FAIR\MULL\LIDB\EBBE\mota PLI014_Costerfield_Operations_NI_43 101_Master_Rev0 28 March 2014
SRK Consulting Page 49
9.3.2 Airborne Geophysics A low-level detailed airborne magnetic and radiometric survey was undertaken in 2008 by AGD over the AGD tenements, including both Augusta and Cuffley. The airborne survey was conducted on east-west lines spaced 50 m apart, with a terrain clearance of approximately 50 m. Survey details are included in a logistics report prepared by UTS (UTS, 2008).
Magnetic data was recorded at 0.1 second intervals and radiometric data was recorded at 1 second intervals. Additional processing was undertaken by Greenfields Geophysics. Interpretation of the radiometric and magnetic data resulted in regional lineament trends across the tenements, which assist in interpreting the local buried structures.
9.4 Geochemistry
9.4.1 Mobile Metal Ion (MMI) Based on historic geochemical surveys over the Augusta Deposit as described by Stock and Zaki in 1972, and informal recommendations by Dr G McArthur of McArthur Ore Deposit Assessments Pty Ltd (MODA), it was decided by AGD geologists to trial mobile metal ion (MMI) analytical techniques on samples collected on traverses across the Augusta lodes in 2005.
Utilising two geophysical traverse lines across the Augusta Deposit, five-metre spaced samples were collected from the soil horizon and submitted to Genalysis Laboratory Services (Genalysis) for MMI analysis of gold, arsenic, mercury, molybdenum, and antimony via inductively coupled plasma (ICP).
While the other elements showed no correlation to the underlying mineralisation, the gold and antimony results appear to show a broad anomaly across the mineralisation, indicating that the technique could be useful for regional exploration.
9.4.2 Bedrock Geochemistry Augusta South Orientation Bedrock Geochemistry Aircore Drilling (MIN4644) The effectiveness of bedrock geochemistry was demonstrated by Mid-East Minerals NL (MEM) in 1968 to 1970, when a grid south of the South Costerfield / Tait’s Shafts was sampled. What is now known as the Augusta Gold-Antimony Deposit was highlighted by the resultant anomalies. Although MEM drilled three shallow (22 – 57 m) diamond drillholes to test the anomalies and intersected stibnite stringers, they did not proceed any further. Both conventional surface soil and bedrock samples were collected to compare techniques; although the surface samples were anomalous (and cheaper) bedrock samples defined the lodes more precisely.
During March of 2010, Mandalay employed the use of a Mantis 200 drill rig from Blacklaws Drilling, Elphinstone, Victoria, to provide aircore drilling services, with an NQ size bit. Drillholes were at 15 m intervals on traverses 100 m apart. Because of the soft, weathered nature of the bedrock, samples consisted mainly of silt size cuttings (with only rare segments of core). In the latter part of the program, the aircore bit was replaced by a reverse circulation (RC) bit. A total of 104 holes were drilled for a cumulative total of 547 m and an average hole depth of 5.2 m.
Cuttings were collected (in a cyclone) at 1 m intervals downhole in each drillhole and laid out in sequence on the ground. Mandalay staff supervising the program determined when bedrock was intersected by observing the cuttings and ensured that the driller penetrated at least 1 m into bedrock. A 5 kg ‘top-of-bedrock’ sample was collected in a plastic sample bag, with the coordinates labelled on it. Each hole was logged and the sample number assigned.
FAIR\MULL\LIDB\EBBE\mota PLI014_Costerfield_Operations_NI_43 101_Master_Rev0 28 March 2014
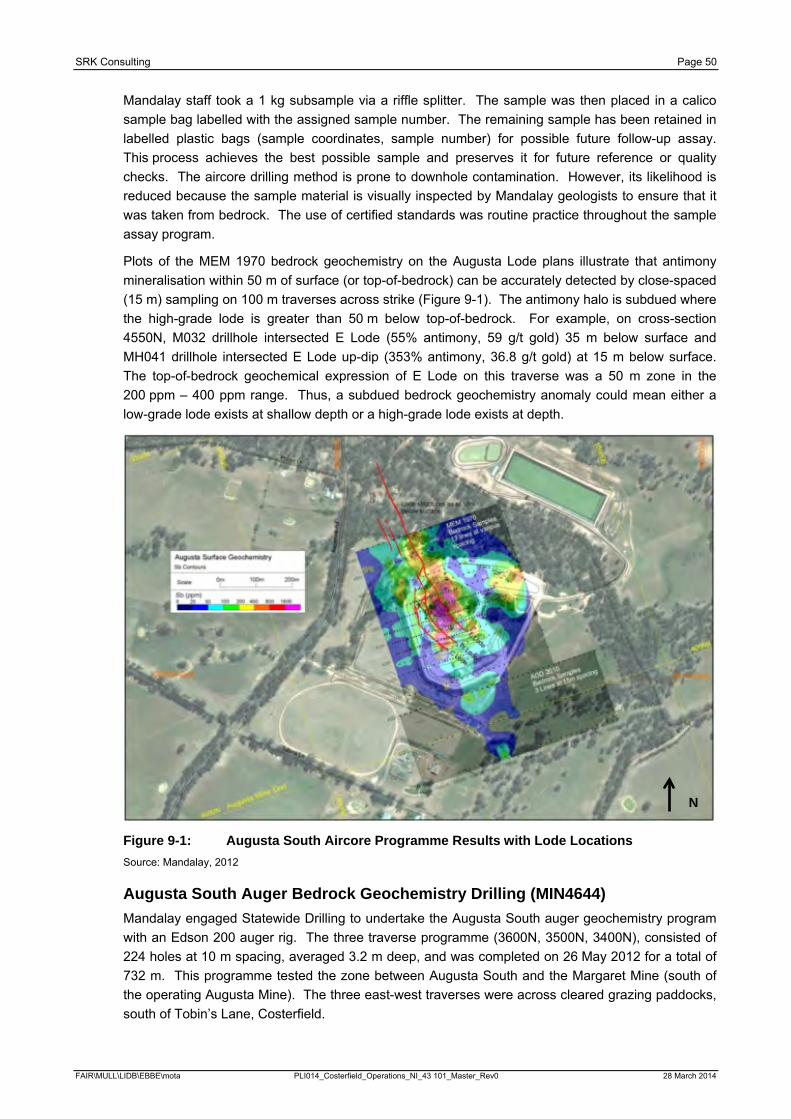
SRK Consulting Page 50
Mandalay staff took a 1 kg subsample via a riffle splitter. The sample was then placed in a calico sample bag labelled with the assigned sample number. The remaining sample has been retained in labelled plastic bags (sample coordinates, sample number) for possible future follow-up assay. This process achieves the best possible sample and preserves it for future reference or quality checks. The aircore drilling method is prone to downhole contamination. However, its likelihood is reduced because the sample material is visually inspected by Mandalay geologists to ensure that it was taken from bedrock. The use of certified standards was routine practice throughout the sample assay program.
Plots of the MEM 1970 bedrock geochemistry on the Augusta Lode plans illustrate that antimony mineralisation within 50 m of surface (or top-of-bedrock) can be accurately detected by close-spaced (15 m) sampling on 100 m traverses across strike (Figure 9-1). The antimony halo is subdued where the high-grade lode is greater than 50 m below top-of-bedrock. For example, on cross-section 4550N, M032 drillhole intersected E Lode (55% antimony, 59 g/t gold) 35 m below surface and MH041 drillhole intersected E Lode up-dip (353% antimony, 36.8 g/t gold) at 15 m below surface. The top-of-bedrock geochemical expression of E Lode on this traverse was a 50 m zone in the 200 ppm – 400 ppm range. Thus, a subdued bedrock geochemistry anomaly could mean either a low-grade lode exists at shallow depth or a high-grade lode exists at depth.
Figure 9-1: Augusta South Aircore Programme Results with Lode Locations Source: Mandalay, 2012
Augusta South Auger Bedrock Geochemistry Drilling (MIN4644) Mandalay engaged Statewide Drilling to undertake the Augusta South auger geochemistry program with an Edson 200 auger rig. The three traverse programme (3600N, 3500N, 3400N), consisted of 224 holes at 10 m spacing, averaged 3.2 m deep, and was completed on 26 May 2012 for a total of 732 m. This programme tested the zone between Augusta South and the Margaret Mine (south of the operating Augusta Mine). The three east-west traverses were across cleared grazing paddocks, south of Tobin’s Lane, Costerfield.
N
FAIR\MULL\LIDB\EBBE\mota PLI014_Costerfield_Operations_NI_43 101_Master_Rev0 28 March 2014
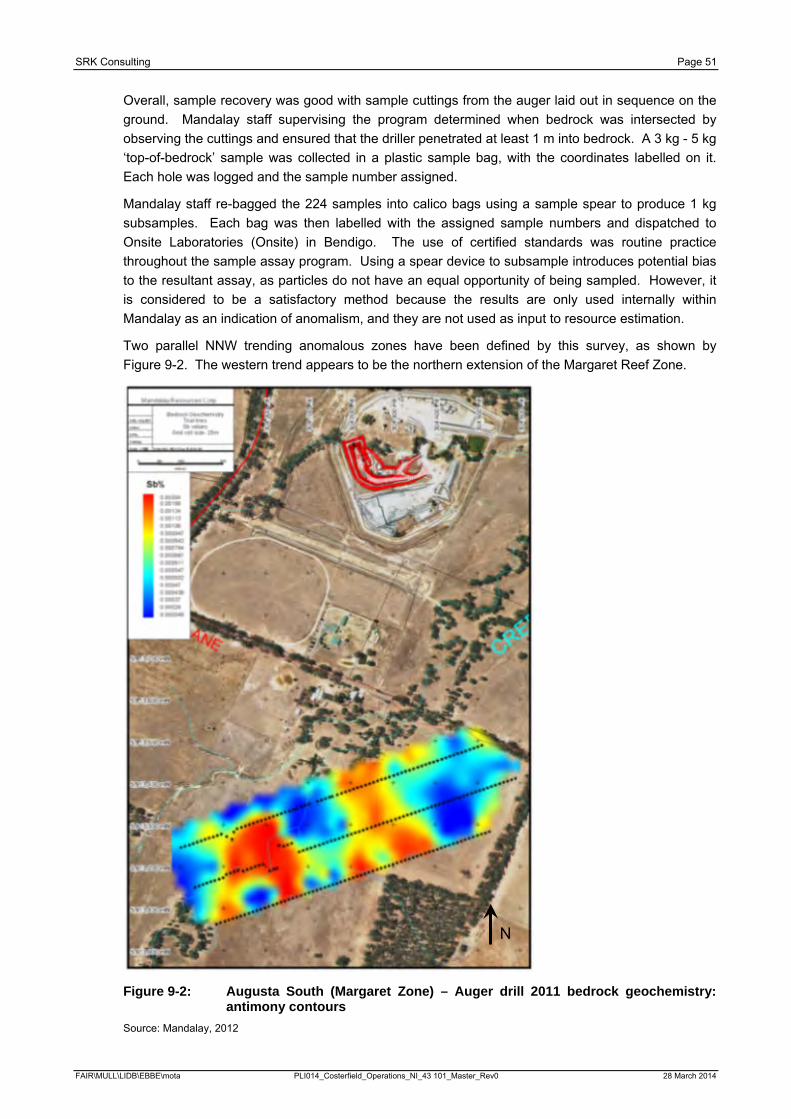
SRK Consulting Page 51
Overall, sample recovery was good with sample cuttings from the auger laid out in sequence on the ground. Mandalay staff supervising the program determined when bedrock was intersected by observing the cuttings and ensured that the driller penetrated at least 1 m into bedrock. A 3 kg - 5 kg ‘top-of-bedrock’ sample was collected in a plastic sample bag, with the coordinates labelled on it. Each hole was logged and the sample number assigned.
Mandalay staff re-bagged the 224 samples into calico bags using a sample spear to produce 1 kg subsamples. Each bag was then labelled with the assigned sample numbers and dispatched to Onsite Laboratories (Onsite) in Bendigo. The use of certified standards was routine practice throughout the sample assay program. Using a spear device to subsample introduces potential bias to the resultant assay, as particles do not have an equal opportunity of being sampled. However, it is considered to be a satisfactory method because the results are only used internally within Mandalay as an indication of anomalism, and they are not used as input to resource estimation.
Two parallel NNW trending anomalous zones have been defined by this survey, as shown by Figure 9-2. The western trend appears to be the northern extension of the Margaret Reef Zone.
Figure 9-2: Augusta South (Margaret Zone) – Auger drill 2011 bedrock geochemistry: antimony contours
Source: Mandalay, 2012
N
FAIR\MULL\LIDB\EBBE\mota PLI014_Costerfield_Operations_NI_43 101_Master_Rev0 28 March 2014
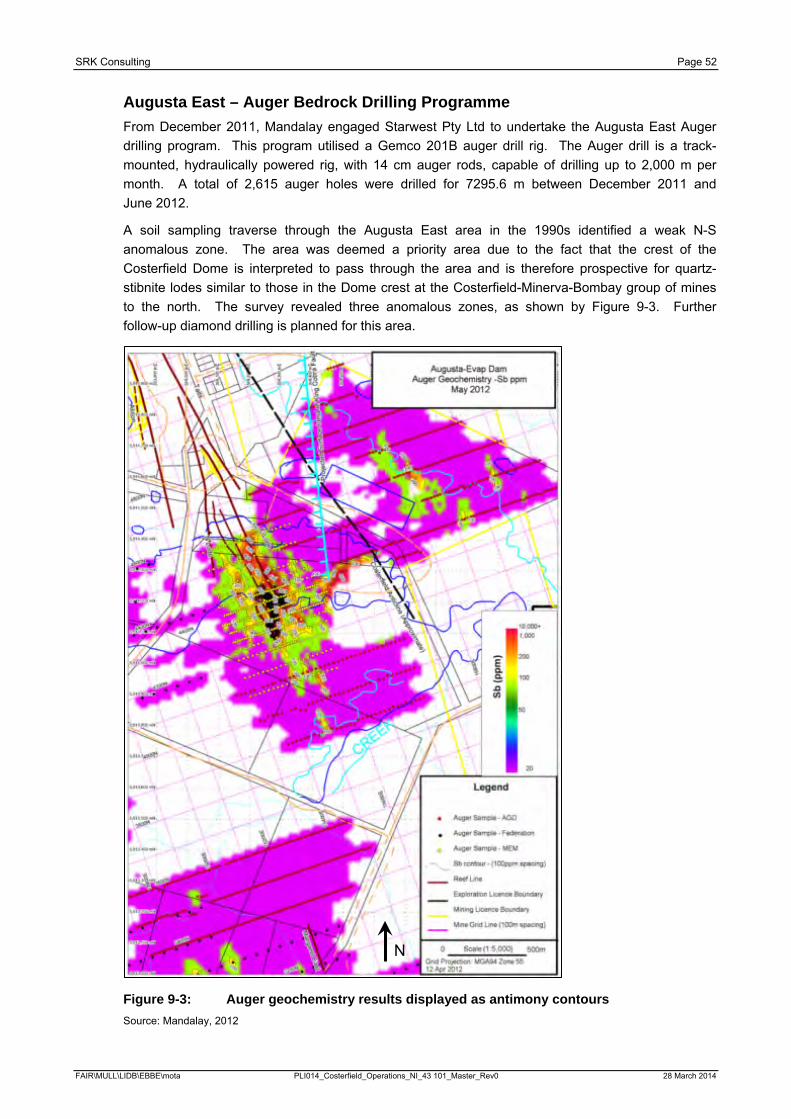
SRK Consulting Page 52
Augusta East – Auger Bedrock Drilling Programme From December 2011, Mandalay engaged Starwest Pty Ltd to undertake the Augusta East Auger drilling program. This program utilised a Gemco 201B auger drill rig. The Auger drill is a track-mounted, hydraulically powered rig, with 14 cm auger rods, capable of drilling up to 2,000 m per month. A total of 2,615 auger holes were drilled for 7295.6 m between December 2011 and June 2012.
A soil sampling traverse through the Augusta East area in the 1990s identified a weak N-S anomalous zone. The area was deemed a priority area due to the fact that the crest of the Costerfield Dome is interpreted to pass through the area and is therefore prospective for quartz-stibnite lodes similar to those in the Dome crest at the Costerfield-Minerva-Bombay group of mines to the north. The survey revealed three anomalous zones, as shown by Figure 9-3. Further follow-up diamond drilling is planned for this area.
Figure 9-3: Auger geochemistry results displayed as antimony contours Source: Mandalay, 2012
N
FAIR\MULL\LIDB\EBBE\mota PLI014_Costerfield_Operations_NI_43 101_Master_Rev0 28 March 2014
SRK Consulting Page 53
9.5 Aerial Photogrammetry Survey AGD commissioned Quarry Survey Solutions, of Healesville, and United Photo and Graphic Services Pty Ltd, of Melbourne, to organise and carry out aerial photogrammetry of the Costerfield Project tenements as well as the Augusta Mine Site in 2005.
High-level (24,000 ft) photo coverage was carried out in November 2005. This was followed by low-level (8,000 ft) coverage over the Augusta Mine Site in January 2006.
A second low-level (4,000 ft) flight was carried out in April 2006, at the time of maximum surface excavation, prior to the commencement of backfilling of the E Lode Pit.
The various photo sets were subsequently used to generate a digital terrain model (DTM) and a referenced orthophotographic scan of the Costerfield central mine area. This area essentially extended from Costerfield south to the Margaret area, thereby encompassing most of Mining Licence MIN 4644.
9.6 Underground Face Sampling Approximately 60% of all drive faces are sampled. Each development cut is approximately 1.8 m along strike. Samples are taken at a frequency of between 1.8 to 7 m along strike. Underground face samples are collected using the following method:
· The face is marked out by the sampler to show the limits of the lode and the bedding angle;
· Sample locations are marked out so that the sample is taken in a direction that is perpendicular to the dip of the lode;
· The face and lengths of the sample are measured;
· The face is photographed (a chalkboard is used to display the date, name of the face, and northing);
· Each sample is collected as a channel sample using pick or pneumatic chisel and placed into a sample bag;
· Care is taken to obtain a representative sample;
· Where there are two or more lode structures in the face, samples are also taken of the intervening siltstone;
· Samples are between 0.5 kg and 2 kg in weight;
· The sample length can vary from 5 cm to 1.5 m across the structures;
· Each sample bag is assigned a unique sample ID;
· A sample book is used to record the sample IDs used. A tab from the sample book is placed into the sample bag for use by the assay lab;
· The face is sketched on a face sample sheet and sample details recorded;
· The location of the face is derived from survey pickups of the floor and backs of the ore drive; and
· Face samples are taken at the appropriate orientation to the mineralisation and are representative of the mine heading being sampled.
FAIR\MULL\LIDB\EBBE\mota PLI014_Costerfield_Operations_NI_43 101_Master_Rev0 28 March 2014
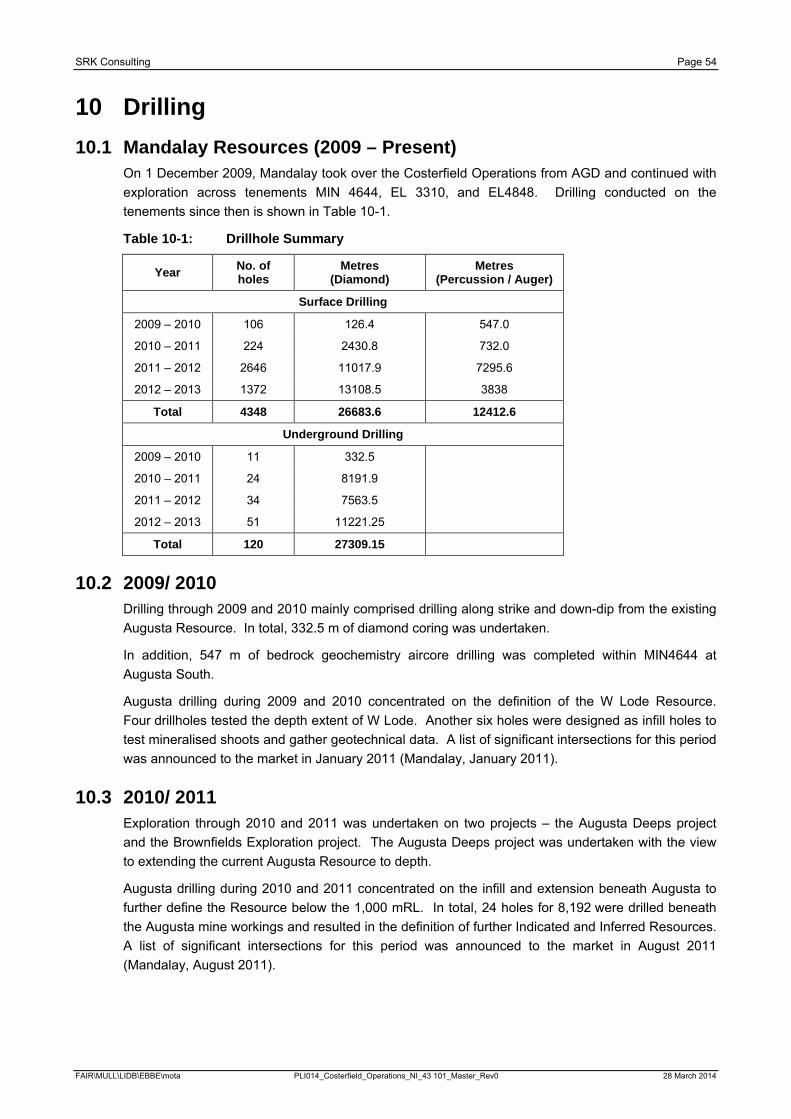
SRK Consulting Page 54
10 Drilling 10.1 Mandalay Resources (2009 – Present)
On 1 December 2009, Mandalay took over the Costerfield Operations from AGD and continued with exploration across tenements MIN 4644, EL 3310, and EL4848. Drilling conducted on the tenements since then is shown in Table 10-1.
Table 10-1: Drillhole Summary
Year No. of holes
Metres (Diamond)
Metres (Percussion / Auger)
Surface Drilling
2009 – 2010 106 126.4 547.0
2010 – 2011 224 2430.8 732.0
2011 – 2012 2646 11017.9 7295.6
2012 – 2013 1372 13108.5 3838
Total 4348 26683.6 12412.6
Underground Drilling
2009 – 2010 11 332.5
2010 – 2011 24 8191.9
2011 – 2012 34 7563.5
2012 – 2013 51 11221.25
Total 120 27309.15
10.2 2009/ 2010 Drilling through 2009 and 2010 mainly comprised drilling along strike and down-dip from the existing Augusta Resource. In total, 332.5 m of diamond coring was undertaken.
In addition, 547 m of bedrock geochemistry aircore drilling was completed within MIN4644 at Augusta South.
Augusta drilling during 2009 and 2010 concentrated on the definition of the W Lode Resource. Four drillholes tested the depth extent of W Lode. Another six holes were designed as infill holes to test mineralised shoots and gather geotechnical data. A list of significant intersections for this period was announced to the market in January 2011 (Mandalay, January 2011).
10.3 2010/ 2011 Exploration through 2010 and 2011 was undertaken on two projects – the Augusta Deeps project and the Brownfields Exploration project. The Augusta Deeps project was undertaken with the view to extending the current Augusta Resource to depth.
Augusta drilling during 2010 and 2011 concentrated on the infill and extension beneath Augusta to further define the Resource below the 1,000 mRL. In total, 24 holes for 8,192 were drilled beneath the Augusta mine workings and resulted in the definition of further Indicated and Inferred Resources. A list of significant intersections for this period was announced to the market in August 2011 (Mandalay, August 2011).
FAIR\MULL\LIDB\EBBE\mota PLI014_Costerfield_Operations_NI_43 101_Master_Rev0 28 March 2014
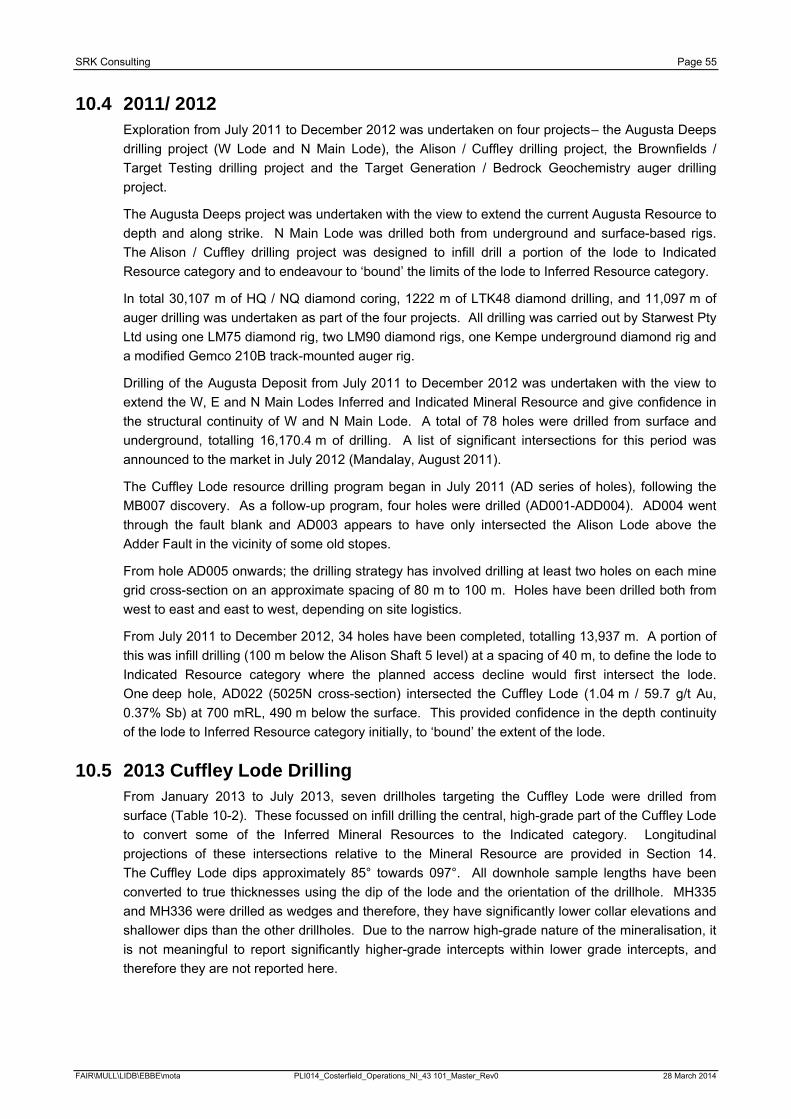
SRK Consulting Page 55
10.4 2011/ 2012 Exploration from July 2011 to December 2012 was undertaken on four projects – the Augusta Deeps drilling project (W Lode and N Main Lode), the Alison / Cuffley drilling project, the Brownfields / Target Testing drilling project and the Target Generation / Bedrock Geochemistry auger drilling project.
The Augusta Deeps project was undertaken with the view to extend the current Augusta Resource to depth and along strike. N Main Lode was drilled both from underground and surface-based rigs. The Alison / Cuffley drilling project was designed to infill drill a portion of the lode to Indicated Resource category and to endeavour to ‘bound’ the limits of the lode to Inferred Resource category.
In total 30,107 m of HQ / NQ diamond coring, 1222 m of LTK48 diamond drilling, and 11,097 m of auger drilling was undertaken as part of the four projects. All drilling was carried out by Starwest Pty Ltd using one LM75 diamond rig, two LM90 diamond rigs, one Kempe underground diamond rig and a modified Gemco 210B track-mounted auger rig.
Drilling of the Augusta Deposit from July 2011 to December 2012 was undertaken with the view to extend the W, E and N Main Lodes Inferred and Indicated Mineral Resource and give confidence in the structural continuity of W and N Main Lode. A total of 78 holes were drilled from surface and underground, totalling 16,170.4 m of drilling. A list of significant intersections for this period was announced to the market in July 2012 (Mandalay, August 2011).
The Cuffley Lode resource drilling program began in July 2011 (AD series of holes), following the MB007 discovery. As a follow-up program, four holes were drilled (AD001-ADD004). AD004 went through the fault blank and AD003 appears to have only intersected the Alison Lode above the Adder Fault in the vicinity of some old stopes.
From hole AD005 onwards; the drilling strategy has involved drilling at least two holes on each mine grid cross-section on an approximate spacing of 80 m to 100 m. Holes have been drilled both from west to east and east to west, depending on site logistics.
From July 2011 to December 2012, 34 holes have been completed, totalling 13,937 m. A portion of this was infill drilling (100 m below the Alison Shaft 5 level) at a spacing of 40 m, to define the lode to Indicated Resource category where the planned access decline would first intersect the lode. One deep hole, AD022 (5025N cross-section) intersected the Cuffley Lode (1.04 m / 59.7 g/t Au, 0.37% Sb) at 700 mRL, 490 m below the surface. This provided confidence in the depth continuity of the lode to Inferred Resource category initially, to ‘bound’ the extent of the lode.
10.5 2013 Cuffley Lode Drilling From January 2013 to July 2013, seven drillholes targeting the Cuffley Lode were drilled from surface (Table 10-2). These focussed on infill drilling the central, high-grade part of the Cuffley Lode to convert some of the Inferred Mineral Resources to the Indicated category. Longitudinal projections of these intersections relative to the Mineral Resource are provided in Section 14. The Cuffley Lode dips approximately 85° towards 097°. All downhole sample lengths have been converted to true thicknesses using the dip of the lode and the orientation of the drillhole. MH335 and MH336 were drilled as wedges and therefore, they have significantly lower collar elevations and shallower dips than the other drillholes. Due to the narrow high-grade nature of the mineralisation, it is not meaningful to report significantly higher-grade intercepts within lower grade intercepts, and therefore they are not reported here.
FAIR\MULL\LIDB\EBBE\mota PLI014_Costerfield_Operations_NI_43 101_Master_Rev0 28 March 2014
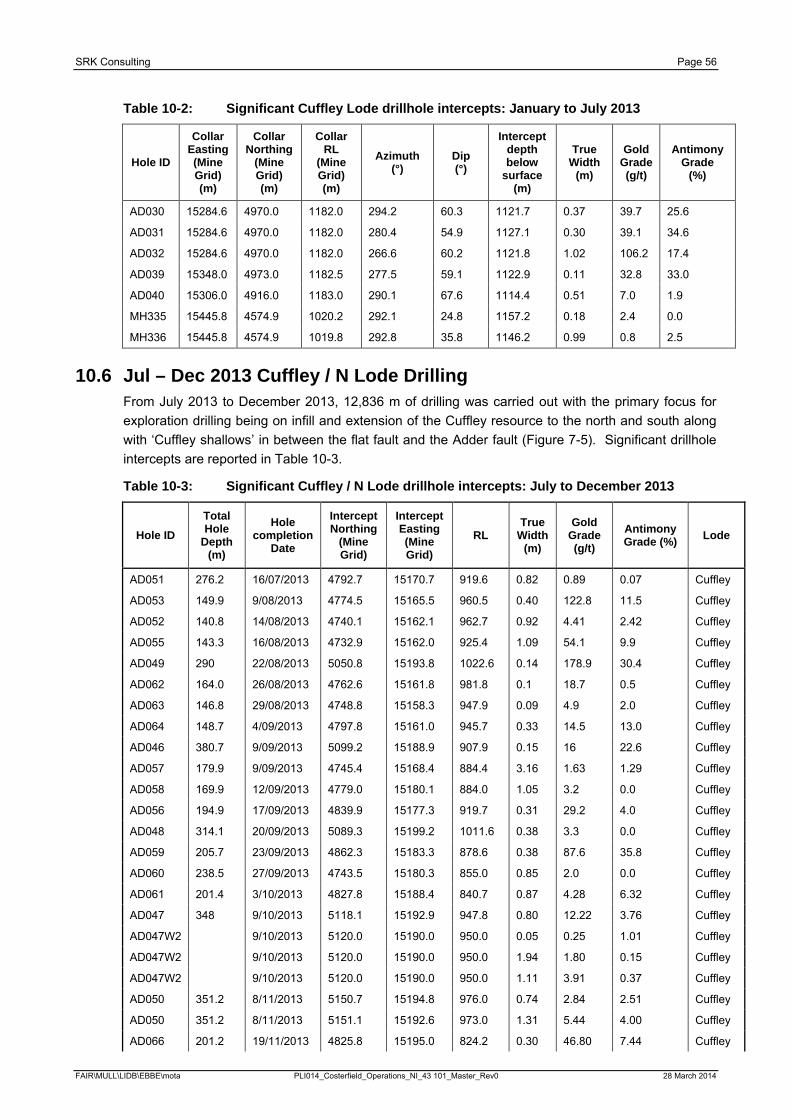
SRK Consulting Page 56
Table 10-2: Significant Cuffley Lode drillhole intercepts: January to July 2013
Hole ID
Collar Easting (Mine Grid) (m)
Collar Northing
(Mine Grid) (m)
Collar RL
(Mine Grid) (m)
Azimuth (°)
Dip (°)
Intercept depth below
surface (m)
True Width
(m)
Gold Grade (g/t)
Antimony Grade
(%)
AD030 15284.6 4970.0 1182.0 294.2 60.3 1121.7 0.37 39.7 25.6
AD031 15284.6 4970.0 1182.0 280.4 54.9 1127.1 0.30 39.1 34.6
AD032 15284.6 4970.0 1182.0 266.6 60.2 1121.8 1.02 106.2 17.4
AD039 15348.0 4973.0 1182.5 277.5 59.1 1122.9 0.11 32.8 33.0
AD040 15306.0 4916.0 1183.0 290.1 67.6 1114.4 0.51 7.0 1.9
MH335 15445.8 4574.9 1020.2 292.1 24.8 1157.2 0.18 2.4 0.0
MH336 15445.8 4574.9 1019.8 292.8 35.8 1146.2 0.99 0.8 2.5
10.6 Jul – Dec 2013 Cuffley / N Lode Drilling From July 2013 to December 2013, 12,836 m of drilling was carried out with the primary focus for exploration drilling being on infill and extension of the Cuffley resource to the north and south along with ‘Cuffley shallows’ in between the flat fault and the Adder fault (Figure 7-5). Significant drillhole intercepts are reported in Table 10-3.
Table 10-3: Significant Cuffley / N Lode drillhole intercepts: July to December 2013
Hole ID Total Hole
Depth (m)
Hole completion
Date
Intercept Northing
(Mine Grid)
Intercept Easting (Mine Grid)
RL True
Width (m)
Gold Grade (g/t)
Antimony Grade (%) Lode
AD051 276.2 16/07/2013 4792.7 15170.7 919.6 0.82 0.89 0.07 Cuffley
AD053 149.9 9/08/2013 4774.5 15165.5 960.5 0.40 122.8 11.5 Cuffley
AD052 140.8 14/08/2013 4740.1 15162.1 962.7 0.92 4.41 2.42 Cuffley
AD055 143.3 16/08/2013 4732.9 15162.0 925.4 1.09 54.1 9.9 Cuffley
AD049 290 22/08/2013 5050.8 15193.8 1022.6 0.14 178.9 30.4 Cuffley
AD062 164.0 26/08/2013 4762.6 15161.8 981.8 0.1 18.7 0.5 Cuffley
AD063 146.8 29/08/2013 4748.8 15158.3 947.9 0.09 4.9 2.0 Cuffley
AD064 148.7 4/09/2013 4797.8 15161.0 945.7 0.33 14.5 13.0 Cuffley
AD046 380.7 9/09/2013 5099.2 15188.9 907.9 0.15 16 22.6 Cuffley
AD057 179.9 9/09/2013 4745.4 15168.4 884.4 3.16 1.63 1.29 Cuffley
AD058 169.9 12/09/2013 4779.0 15180.1 884.0 1.05 3.2 0.0 Cuffley
AD056 194.9 17/09/2013 4839.9 15177.3 919.7 0.31 29.2 4.0 Cuffley
AD048 314.1 20/09/2013 5089.3 15199.2 1011.6 0.38 3.3 0.0 Cuffley
AD059 205.7 23/09/2013 4862.3 15183.3 878.6 0.38 87.6 35.8 Cuffley
AD060 238.5 27/09/2013 4743.5 15180.3 855.0 0.85 2.0 0.0 Cuffley
AD061 201.4 3/10/2013 4827.8 15188.4 840.7 0.87 4.28 6.32 Cuffley
AD047 348 9/10/2013 5118.1 15192.9 947.8 0.80 12.22 3.76 Cuffley
AD047W2 9/10/2013 5120.0 15190.0 950.0 0.05 0.25 1.01 Cuffley
AD047W2 9/10/2013 5120.0 15190.0 950.0 1.94 1.80 0.15 Cuffley
AD047W2 9/10/2013 5120.0 15190.0 950.0 1.11 3.91 0.37 Cuffley
AD050 351.2 8/11/2013 5150.7 15194.8 976.0 0.74 2.84 2.51 Cuffley
AD050 351.2 8/11/2013 5151.1 15192.6 973.0 1.31 5.44 4.00 Cuffley
AD066 201.2 19/11/2013 4825.8 15195.0 824.2 0.30 46.80 7.44 Cuffley
FAIR\MULL\LIDB\EBBE\mota PLI014_Costerfield_Operations_NI_43 101_Master_Rev0 28 March 2014
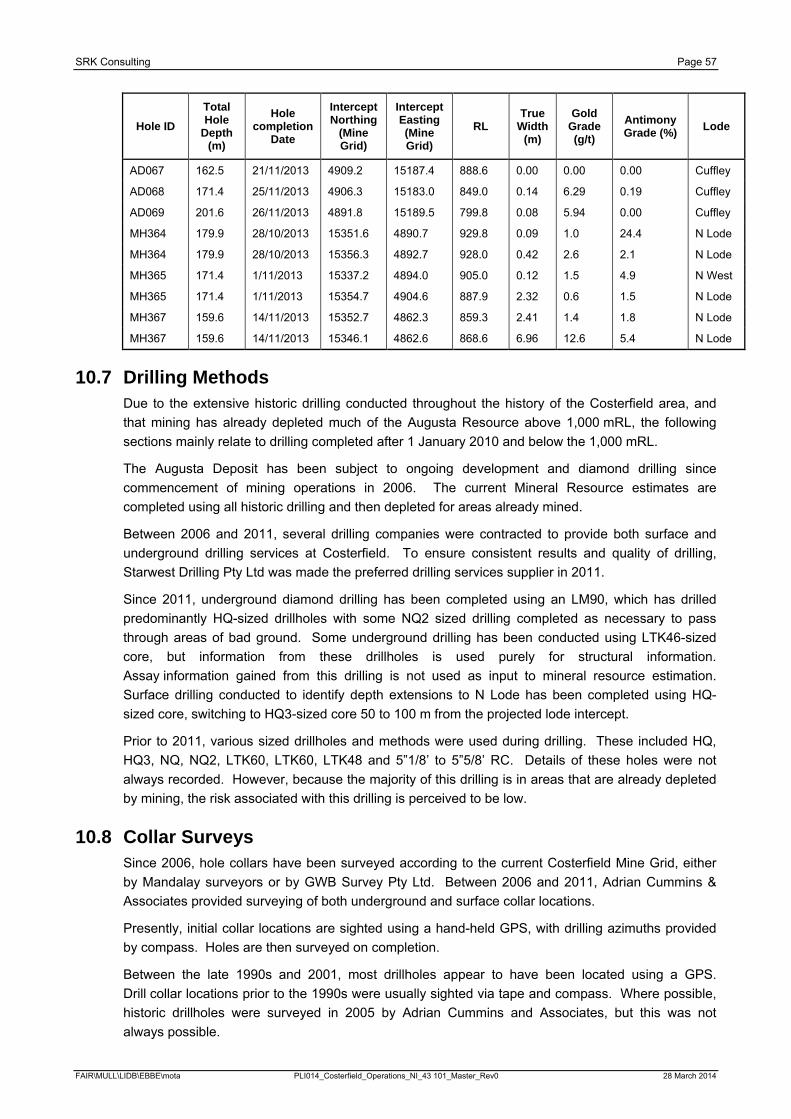
SRK Consulting Page 57
Hole ID Total Hole
Depth (m)
Hole completion
Date
Intercept Northing
(Mine Grid)
Intercept Easting (Mine Grid)
RL True
Width (m)
Gold Grade (g/t)
Antimony Grade (%) Lode
AD067 162.5 21/11/2013 4909.2 15187.4 888.6 0.00 0.00 0.00 Cuffley
AD068 171.4 25/11/2013 4906.3 15183.0 849.0 0.14 6.29 0.19 Cuffley
AD069 201.6 26/11/2013 4891.8 15189.5 799.8 0.08 5.94 0.00 Cuffley
MH364 179.9 28/10/2013 15351.6 4890.7 929.8 0.09 1.0 24.4 N Lode
MH364 179.9 28/10/2013 15356.3 4892.7 928.0 0.42 2.6 2.1 N Lode
MH365 171.4 1/11/2013 15337.2 4894.0 905.0 0.12 1.5 4.9 N West
MH365 171.4 1/11/2013 15354.7 4904.6 887.9 2.32 0.6 1.5 N Lode
MH367 159.6 14/11/2013 15352.7 4862.3 859.3 2.41 1.4 1.8 N Lode
MH367 159.6 14/11/2013 15346.1 4862.6 868.6 6.96 12.6 5.4 N Lode
10.7 Drilling Methods Due to the extensive historic drilling conducted throughout the history of the Costerfield area, and that mining has already depleted much of the Augusta Resource above 1,000 mRL, the following sections mainly relate to drilling completed after 1 January 2010 and below the 1,000 mRL.
The Augusta Deposit has been subject to ongoing development and diamond drilling since commencement of mining operations in 2006. The current Mineral Resource estimates are completed using all historic drilling and then depleted for areas already mined.
Between 2006 and 2011, several drilling companies were contracted to provide both surface and underground drilling services at Costerfield. To ensure consistent results and quality of drilling, Starwest Drilling Pty Ltd was made the preferred drilling services supplier in 2011.
Since 2011, underground diamond drilling has been completed using an LM90, which has drilled predominantly HQ-sized drillholes with some NQ2 sized drilling completed as necessary to pass through areas of bad ground. Some underground drilling has been conducted using LTK46-sized core, but information from these drillholes is used purely for structural information. Assay information gained from this drilling is not used as input to mineral resource estimation. Surface drilling conducted to identify depth extensions to N Lode has been completed using HQ-sized core, switching to HQ3-sized core 50 to 100 m from the projected lode intercept.
Prior to 2011, various sized drillholes and methods were used during drilling. These included HQ, HQ3, NQ, NQ2, LTK60, LTK60, LTK48 and 5”1/8’ to 5”5/8’ RC. Details of these holes were not always recorded. However, because the majority of this drilling is in areas that are already depleted by mining, the risk associated with this drilling is perceived to be low.
10.8 Collar Surveys Since 2006, hole collars have been surveyed according to the current Costerfield Mine Grid, either by Mandalay surveyors or by GWB Survey Pty Ltd. Between 2006 and 2011, Adrian Cummins & Associates provided surveying of both underground and surface collar locations.
Presently, initial collar locations are sighted using a hand-held GPS, with drilling azimuths provided by compass. Holes are then surveyed on completion.
Between the late 1990s and 2001, most drillholes appear to have been located using a GPS. Drill collar locations prior to the 1990s were usually sighted via tape and compass. Where possible, historic drillholes were surveyed in 2005 by Adrian Cummins and Associates, but this was not always possible.
FAIR\MULL\LIDB\EBBE\mota PLI014_Costerfield_Operations_NI_43 101_Master_Rev0 28 March 2014
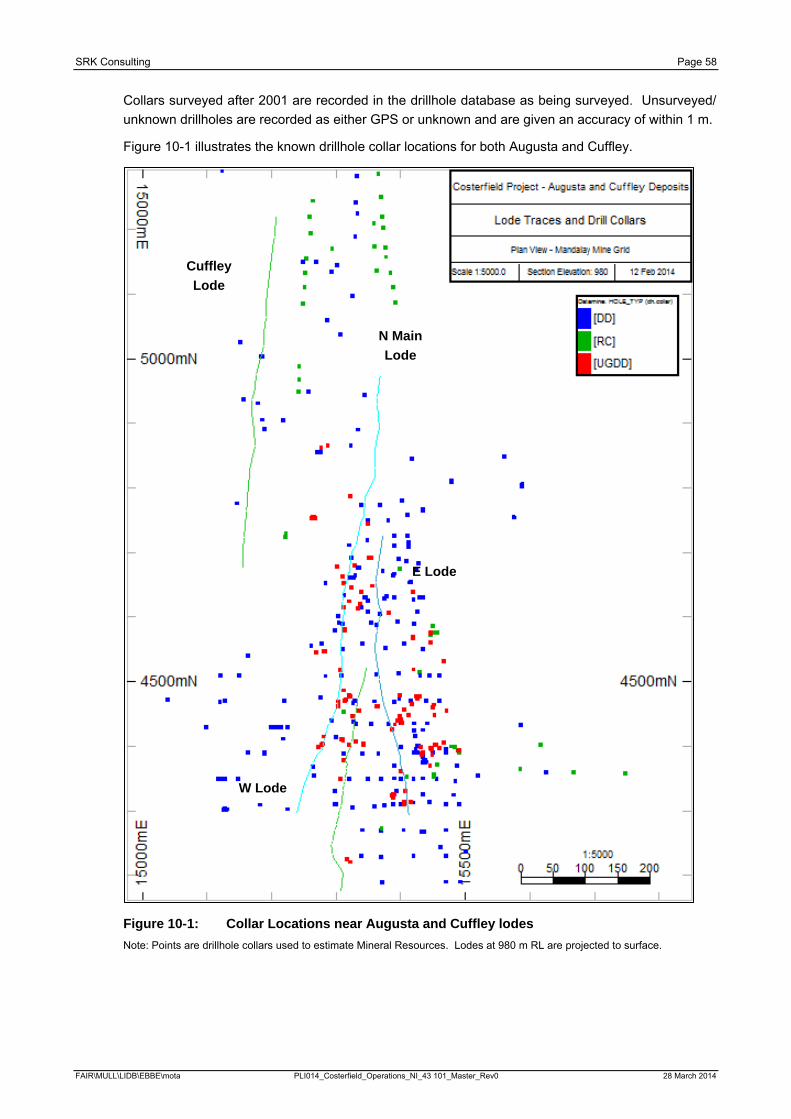
SRK Consulting Page 58
Collars surveyed after 2001 are recorded in the drillhole database as being surveyed. Unsurveyed/ unknown drillholes are recorded as either GPS or unknown and are given an accuracy of within 1 m.
Figure 10-1 illustrates the known drillhole collar locations for both Augusta and Cuffley.
Figure 10-1: Collar Locations near Augusta and Cuffley lodes Note: Points are drillhole collars used to estimate Mineral Resources. Lodes at 980 m RL are projected to surface.
Cuffley Lode
N Main Lode
E Lode
W Lode
FAIR\MULL\LIDB\EBBE\mota PLI014_Costerfield_Operations_NI_43 101_Master_Rev0 28 March 2014
SRK Consulting Page 59
10.9 Downhole Surveys Since 2011, all holes have been downhole-surveyed using an electronic, single-shot survey tool. An initial check survey is completed at 15 m to ensure that the collar set-up is accurate. Thereafter, surveys are conducted at 30 m intervals, unless ground conditions are unsuitable to conduct a survey. In those cases, the survey is completed when suitable ground conditions are subsequently encountered.
Between 2001 and 2011, all drillholes appear to have been surveyed via either electronic single-shot or film single-shot survey tools. Prior to 2001, survey information exists for the majority of holes, but the method and records of these surveys are not readily available.
10.10 Logging Procedures The following information only relates to drilling completed after 1 January 2010 and below the 1,000 mRL in the Augusta deposit.
Augusta core is geologically logged at the core preparation facility located at the Brunswick Processing Plant site. Core is initially brought to the facility by either the drill crews at the end of shift or by field technicians who work in the core preparation facility. Core is generally stored on pallets while waiting for processing.
Field technicians initially orientate all core to the alignment provided by the drill crews through the use of an electronic core orientation device. This orientation is transferred along the length of the run, with each drill run having been orientated. If a discrepancy is found between two adjacent runs, the next run is orientated and the two best-matching orientations are used. If no orientation is recorded by the drill crews, the core is simply rotated to a consistent alignment of bedding or cleavage, with no orientation mark made on the core.
Depth marks are made on the core at one-metre intervals using a tape measure, taking into account core loss and overdrill. If core loss is encountered, a block is placed in the zone of core loss. If problems are encountered with driller core blocks, the drill shift supervisor is advised and depth marking stops until the problem is rectified.
Field technicians then collect rock quality designation (RQD) data directly onto a digital tablet device using Microsoft Excel. RQD data is collected corresponding to drill runs and includes the “from” depth, “to” depth, run length in metres, the recovered length in metres, the recovery as a percentage, the length of recovered core greater than or equal to 10 cm, and the number of fractures. From this data, an RQD value is calculated. This data is transferred daily from the tablet device to the company server and it is then loaded into the primary drilling data Microsoft Access database on a weekly basis.
Once depth marks are placed on the core, site geologists then log lithology, sample intervals, structural data, and geotechnical data (if applicable) directly to a Microsoft Access database using DrillKing logging software. All measurements of structural features, such as bedding, cleavage, faults, and shears are made using a kenometer for alpha and beta measurements using the orientation line on the core. If no orientation line is available, only alpha measurements are made. Measurements are recorded directly into the Microsoft Access database and are also scribed on to the core using wax pencil. Local Microsoft Access databases on the laptops are archived daily to the company server. They are then loaded into the primary drilling data Microsoft Access database weekly.
After geological logging has been completed, all trays are photographed before sampling. Once sampling is completed, the trays are put on pallets and moved to a permanent core storage area.
FAIR\MULL\LIDB\EBBE\mota PLI014_Costerfield_Operations_NI_43 101_Master_Rev0 28 March 2014
SRK Consulting Page 60
10.11 Drilling Pattern and Quality
10.11.1 Augusta Drilling completed prior to 1 January 2010 informed areas of the resource that have largely been mined, therefore, the following discussion relates to drilling completed after 1 January 2010 and below the 1000 m RL.
Drilling is generally conducted with planned intercepts based on northing at an interval of approximately 40 m and 30 m up- and down-dip. Because most drilling at Augusta is now conducted from underground and W Lode is the primary target of the majority of this drilling, the pattern and density achieved on E and N Main Lodes can vary greatly. Where increased geological confidence is required, infill holes specifically targeting NE or E Lodes have been drilled. Surface drilling, targeting depth extensions of the Augusta Deposit, is generally conducted on 100 m sections along strike, with intersections spaced 80 to 100 m up- and down-dip.
10.11.2 Cuffley Initial drilling of the Cuffley Lode was intended to be done in a ‘W’ pattern on an approximate 50 m by 50 m offset grid. This pattern was started with AD001 through to and including AD004. To aid interpretation, this pattern was changed to a 100 m grid based on mine grid northings, with 50 to 80 m between holes on a given section. This pattern allowed better interpretation to be completed on sections.
For infill drilling between the 820 mRL and 1020 mRL of the Cuffley Lode the ‘W’ pattern was used to maximize strike direction information. This is as opposed to depth information, which is gained by drilling on section. This infill drilling was conducted on a nominal 30 m (RL) by 40 m (N) grid.
10.12 Interpretation of Drilling Results Drilling results are interpreted on paper cross sections. Interpretations are then scanned and registered into the mine planning software package Surpac. These sections are then used to interpret wireframes between drillholes that are snapped to the drillhole in three-dimensional (3D) space. Figure 10-2 illustrates a typical cross-sectional interpretation completed for the Augusta deposit.
FAIR\MULL\LIDB\EBBE\mota PLI014_Costerfield_Operations_NI_43 101_Master_Rev0 28 March 2014
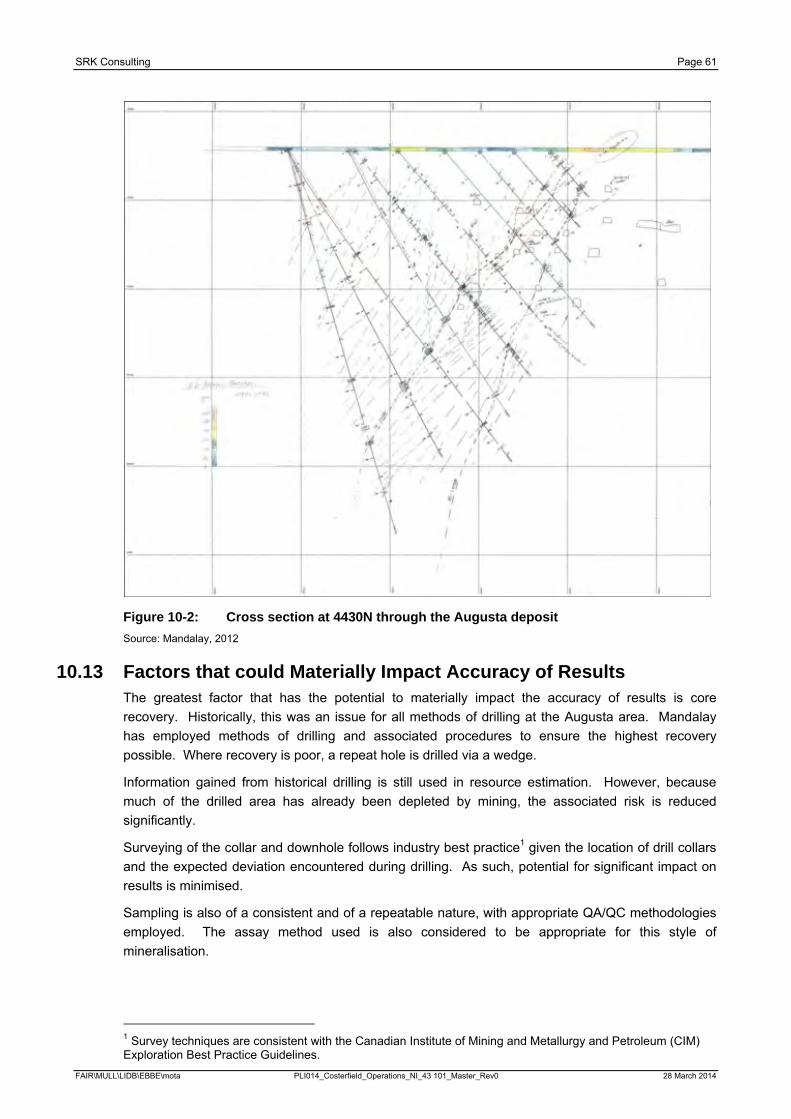
SRK Consulting Page 61
Figure 10-2: Cross section at 4430N through the Augusta deposit Source: Mandalay, 2012
10.13 Factors that could Materially Impact Accuracy of Results The greatest factor that has the potential to materially impact the accuracy of results is core recovery. Historically, this was an issue for all methods of drilling at the Augusta area. Mandalay has employed methods of drilling and associated procedures to ensure the highest recovery possible. Where recovery is poor, a repeat hole is drilled via a wedge.
Information gained from historical drilling is still used in resource estimation. However, because much of the drilled area has already been depleted by mining, the associated risk is reduced significantly.
Surveying of the collar and downhole follows industry best practice1 given the location of drill collars and the expected deviation encountered during drilling. As such, potential for significant impact on results is minimised.
Sampling is also of a consistent and of a repeatable nature, with appropriate QA/QC methodologies employed. The assay method used is also considered to be appropriate for this style of mineralisation.
1 Survey techniques are consistent with the Canadian Institute of Mining and Metallurgy and Petroleum (CIM) Exploration Best Practice Guidelines.
FAIR\MULL\LIDB\EBBE\mota PLI014_Costerfield_Operations_NI_43 101_Master_Rev0 28 March 2014

SRK Consulting Page 62
The nature of geological information collected during the logging process is considered to be in line with industry best practice2 and consistent with other systems employed at deposits that are similar in nature i.e. discrete, structurally controlled narrow vein deposits.
Drilling pattern and density are also considered to be appropriate as sectional based intersections allow for the best possible interpretation. Where required, infill drilling is utilised to gain additional information to assist in the interpretation and estimation processes.
2 Logging and interpretation techniques are consistent with the CIM Exploration Best Practice Guidelines and the CIM Mineral Resource, Mineral Reserve Estimation Best Practice Guidelines.
FAIR\MULL\LIDB\EBBE\mota PLI014_Costerfield_Operations_NI_43 101_Master_Rev0 28 March 2014
SRK Consulting Page 63
11 Sample Preparation, Analyses, and Security 11.1 Sampling Techniques
Samples used to inform the Augusta block model estimates come from both drill core and channel sampling along the ore development drives, while the Cuffley Lode estimate was informed using only diamond drill core samples.
11.1.1 Diamond Core Sampling Much of the drill core produced from the Costerfield area is composed of barren siltstone. Thus, not all diamond drill core is sampled. Sample intervals are determined and marked on the core by Mandalay geologists. General rules that are applied in the selection of sample intervals are as follows:
· All stibnite-bearing veins are sampled;
· A waste sample is taken either side of the mineralised vein;
· Areas of stockwork veining are sampled;
· Laminated quartz veins are sampled;
· Massive quartz veins are sampled;
· Siltstone is sampled where disseminated arsenopyrite is prevalent; and
· Puggy fault zones are sampled at the discretion of the geologist.
Mandalay staff sample the core. In order to obtain a representative sample, the diamond drill core is cut in half with a diamond saw along the top or bottom mark of the orientated core.
Sampling intervals for drill core used for resource estimation purposes are no smaller than 3 cm in length and no greater than 2.7 m in length. The average sample length for drill core samples within the Augusta drill program is 31 cm. Drillholes that were designed and drilled for metallurgical analysis have had sample intervals up to 2 m in length.
The northern side of the core is sampled to ensure that the same side of the core is sampled consistently. Where there is a definitive lithological contact that marks the boundary of a sample, the sample is cut along that contact. If by doing this the sample is less than 5 cm in length, the boundary of the sample is taken at a perpendicular distance from the centre of the sample, which achieves the 5 cm requirement.
RC drilling-based samples are not used in the estimation of the Augusta Mineral Resource, although some RC and hammer drilling is used to establish pre-collars for deeper diamond drillholes.
11.2 Data Spacing and Distribution Within the Augusta Deposit, the distance between drillhole intercepts is approximately 40 m by 30 m. This is reduced to 20 m by 20 m in areas of structural complexity. Face sampling along drives is done at a frequency of between 1.8 and 7 m along strike and 5 to 10 m down-dip.
11.3 Testing Laboratories Assaying of the drill core and face samples is predominantly completed by Onsite Laboratory Services (Onsite) in Bendigo. This laboratory is independent of Mandalay and holds a current ISO 9001 accreditation. Genalysis (Brisbane and Perth) and ALS (Brisbane) have also been used to verify the accuracy of Onsite.
After Mandalay dispatches the core or face samples, the assaying laboratory’s personnel undertake sample preparation and chemical analysis. Results are returned to Mandalay staff, which validate and input the data into the relevant databases.
FAIR\MULL\LIDB\EBBE\mota PLI014_Costerfield_Operations_NI_43 101_Master_Rev0 28 March 2014
SRK Consulting Page 64
11.4 Sample Preparation The following sample preparation activities are undertaken by Mandalay staff:
· Sample material is placed into a calico bag previously marked with a sample number;
· The sample characteristics are marked on a sample ticket and placed in the bag;
· Calico bags are loaded in to plastic bags so that the plastic bags weigh less than 10 kg;
· An assay request sheet is completed and placed in the sample bag; and
· Plastic bags containing samples are sealed and transported to Onsite in Bendigo via private courier.
The following sample preparation activities are undertaken by Onsite staff:
· Samples are received and checked against the submission sheet;
· A job number is assigned and worksheets as well as sample bags prepared;
· Samples are placed in an oven and dried overnight at 80°C;
· The entire sample (up to 2 kg) is jaw-crushed to approximately 2 mm;
· The entire sample is then milled and pulverised to 90% passing 75 μm; and
· Samples are then split, with 200 g for analysis and the remaining sample returned to its sample bag for storage and eventual return to Mandalay.
11.5 Sample Analysis Augusta drill core and face samples are assayed for gold, antimony, arsenic, and iron. The following procedure is undertaken by Onsite for gold and antimony.
Gold grades are determined by fire assay/ atomic absorption spectroscopy (AAS).
The following procedure is undertaken:
· 50 g of pulp is fused with 180 g of flux (silver);
· Slag is removed from the lead button and cupellation is used to produce a gold/ silver prill;
· 0.6 mL of 50% nitric acid is added to a test tube containing prill, and the test tube is placed in a boiling water bath (100°C) until fumes cease and silver appears to be completely dissolved;
· 1.4 mL of hydrochloric acid (HCl) is added;
· On complete dissolution of gold, 8 mL of water is added once the solution is cooled; and
· Once the solids have settled, the gold content is determined by flame AAS.
Antimony grades are determined using acid digest/ AAS. Where the sample contains antimony in excess of 0.6% concentration, the following procedure is undertaken:
· 0.2 g of sample is added to a flask of distilled water (20 mL);
· 30 mL of 50% nitric acid is added;
· 20 mL of tartaric acid is added;
· 80 mL of 50% HCl is added and allowed to stand for 40 minutes;
· 5 mL of hydrobromic acid (HBr) is added;
· The solution is mixed for one hour and left to stand overnight until fuming ceases;
· Sample is heated until colour changes to light yellow and white precipitate dissolves;
· When cool, the sample is diluted to 200 mL with distilled water; and
· Antimony content is determined by AAS.
FAIR\MULL\LIDB\EBBE\mota PLI014_Costerfield_Operations_NI_43 101_Master_Rev0 28 March 2014
SRK Consulting Page 65
11.6 Laboratory Reviews Mandalay personnel conduct periodic visits to the Onsite Laboratory in Bendigo, the last visits being on September 2012, February 2013 and October 2013. Tours of the laboratory are normally completed in the presence of Onsite’s Laboratory Manager, Mr Rob Robinson.
Mandalay discussed the problem related to the assay results for the Blank Standards exceeding the 0.02 g/t Au threshold (see Section 11.7.2) and subsequently modified the submission procedure for the Blank Standards and the “cleaner” samples.
A problem with illegible pulp labels was addressed by rectifying a problem with the labelling machine.
There is no documentation to retain information concerning these lab visits. SRK recommends that in the future, the lab visits and any related observations, discussions, actions, outcomes, recommendations are formally documented. A lab audit checklist could be compiled to serve as a basis for the documentation.
Mandalay conducted a check assay programmes January 2013. This process involves obtaining a pulped sample from Onsite, splitting it, and submitting pulps to Onsite and to one or both of ALS or Genalysis. The results of the most recent programme are outlined in Section 11.7.4.
11.7 Assay Quality Assurance and Quality Control SRK is encouraged by the manner in which Mandalay constantly strive to find new ways to improve the confidence in the drilling data and act on any recommendations or problems that might arise.
11.7.1 Standard Reference Material Two standards that are currently in use have been made from material collected underground at Augusta (AGD08-01 and MR11-01), and are routinely submitted to Onsite. Mandalay also routinely sends three commercially available, gold-only standards or Certified Reference Material (CRM), G901-8, G906-8 and G907-6 (sourced from Geostats Pty. Ltd.) to Onsite. A standard is sent with each batch of exploration samples and twice a week with the underground face samples.
Results from January 2013 to December 2013 for Gold and Antimony are displayed in Figure 11-1 to Figure 11-6. A standard assay result is considered to be compliant when it falls inside the three standard deviation (SD) limits defined by the standard certification. When a batch fails to comply with the three SD limits defined by the standard certification, all significant assay results from that batch are re-assayed. Significant assay results are defined as samples that may be used in a future resource estimate. Any actions or outcomes are recorded as comments on the QA/QC database.
A review of the results shows the following:
· Gold standard G901-8 (CRM Assay 47.24 g/t Au) displays good compliance for the period, with five assays out of 174 samples outside the ±3SD limits. There was one assay result well below the acceptable limits assaying at 27.4 g/t (Figure 11-1). There are no actions commented against this sample. There is a slightly low bias displayed for most of the period and a much more pronounced low bias identified in 2012. There is a marked change in the assay result distribution between the two years which is an unusual phenomenon. There is no evidence for any significant drift in accuracy for the assay results although there does seem to be some periodic clustering of the low assays;
· Gold standard G907-6 (CRM Assay 7.25 g/t Au) displays good compliance for the period, with no assays outside the ±3SD limits. There is a very slight high bias displayed for the period. There is no evidence for any significant drift in the accuracy of assay results (Figure 11-2);
FAIR\MULL\LIDB\EBBE\mota PLI014_Costerfield_Operations_NI_43 101_Master_Rev0 28 March 2014
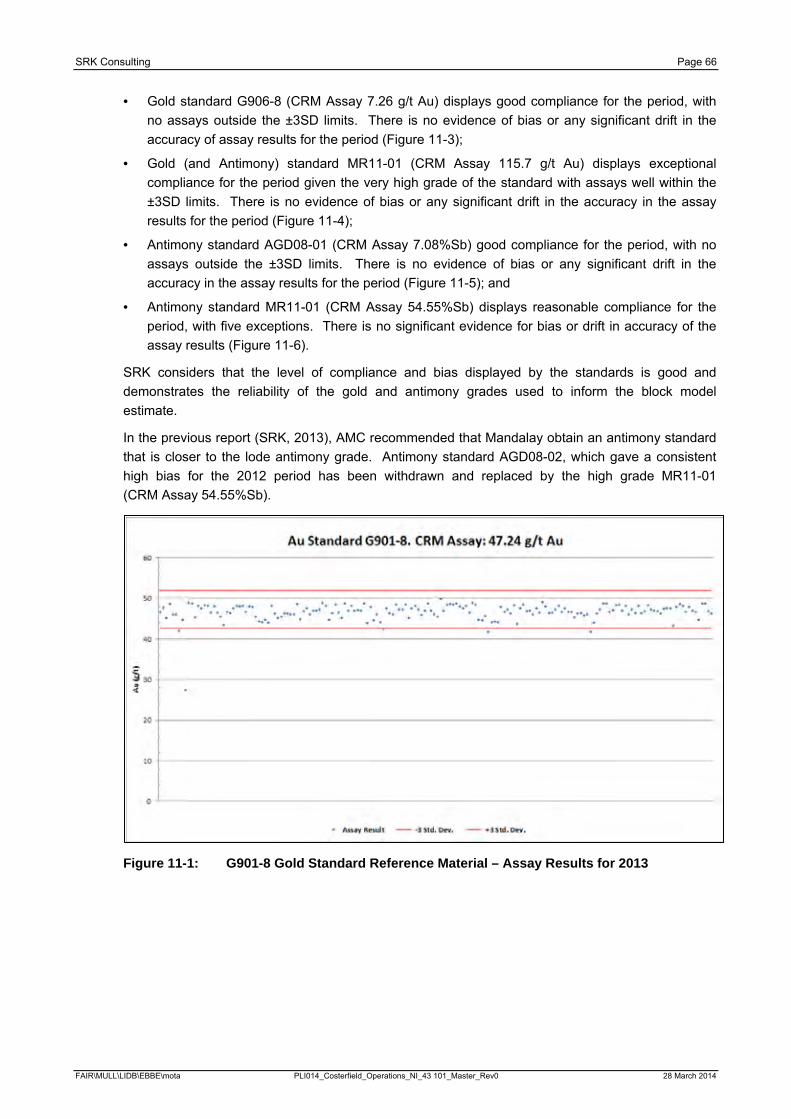
SRK Consulting Page 66
· Gold standard G906-8 (CRM Assay 7.26 g/t Au) displays good compliance for the period, with no assays outside the ±3SD limits. There is no evidence of bias or any significant drift in the accuracy of assay results for the period (Figure 11-3);
· Gold (and Antimony) standard MR11-01 (CRM Assay 115.7 g/t Au) displays exceptional compliance for the period given the very high grade of the standard with assays well within the ±3SD limits. There is no evidence of bias or any significant drift in the accuracy in the assay results for the period (Figure 11-4);
· Antimony standard AGD08-01 (CRM Assay 7.08%Sb) good compliance for the period, with no assays outside the ±3SD limits. There is no evidence of bias or any significant drift in the accuracy in the assay results for the period (Figure 11-5); and
· Antimony standard MR11-01 (CRM Assay 54.55%Sb) displays reasonable compliance for the period, with five exceptions. There is no significant evidence for bias or drift in accuracy of the assay results (Figure 11-6).
SRK considers that the level of compliance and bias displayed by the standards is good and demonstrates the reliability of the gold and antimony grades used to inform the block model estimate.
In the previous report (SRK, 2013), AMC recommended that Mandalay obtain an antimony standard that is closer to the lode antimony grade. Antimony standard AGD08-02, which gave a consistent high bias for the 2012 period has been withdrawn and replaced by the high grade MR11-01 (CRM Assay 54.55%Sb).
Figure 11-1: G901-8 Gold Standard Reference Material – Assay Results for 2013
FAIR\MULL\LIDB\EBBE\mota PLI014_Costerfield_Operations_NI_43 101_Master_Rev0 28 March 2014
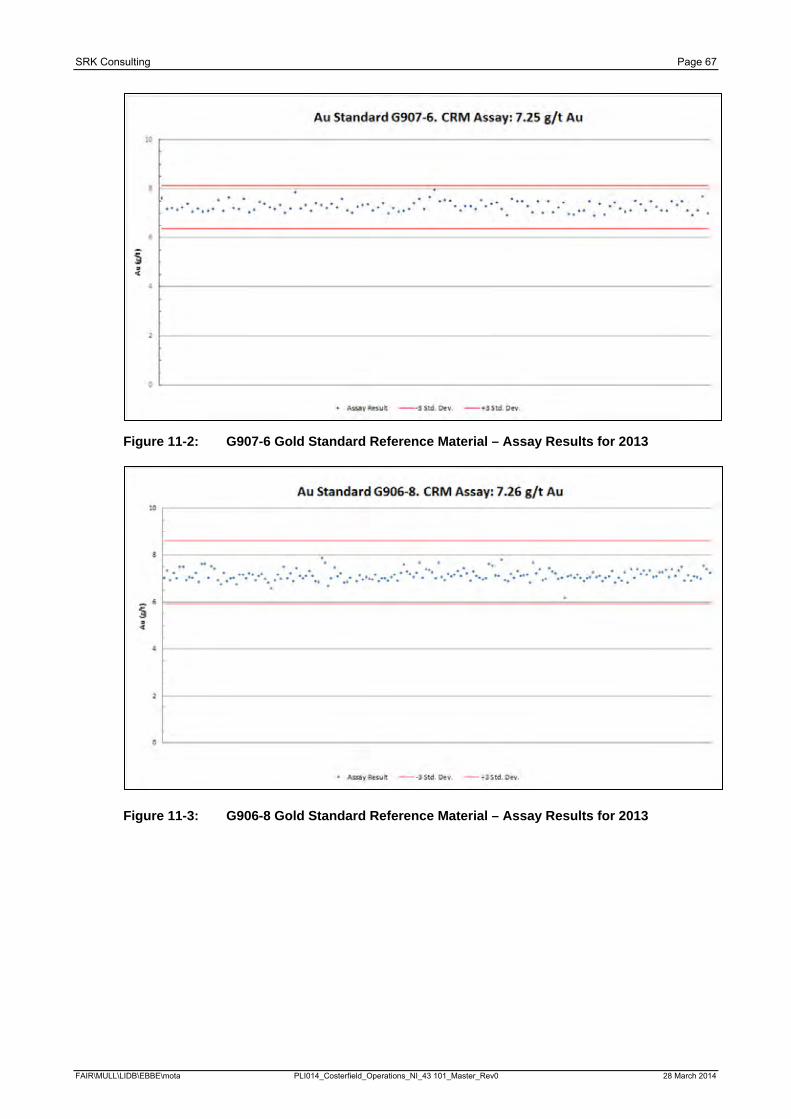
SRK Consulting Page 67
Figure 11-2: G907-6 Gold Standard Reference Material – Assay Results for 2013
Figure 11-3: G906-8 Gold Standard Reference Material – Assay Results for 2013
FAIR\MULL\LIDB\EBBE\mota PLI014_Costerfield_Operations_NI_43 101_Master_Rev0 28 March 2014
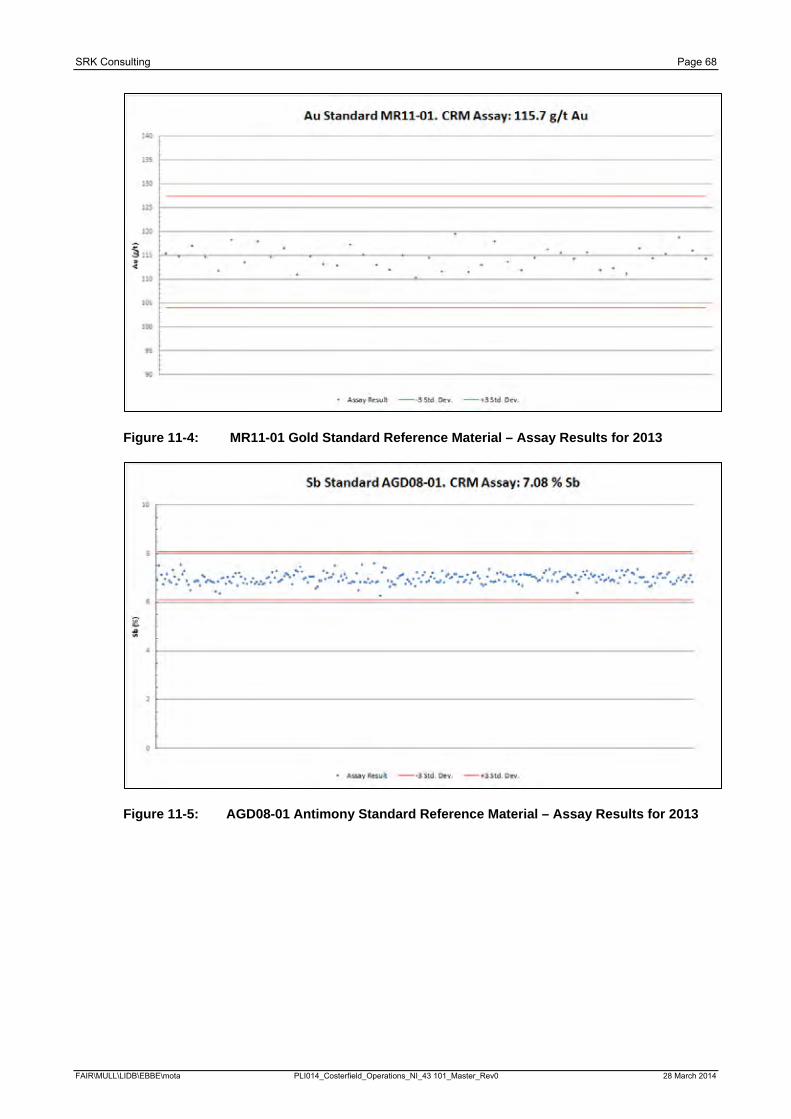
SRK Consulting Page 68
Figure 11-4: MR11-01 Gold Standard Reference Material – Assay Results for 2013
Figure 11-5: AGD08-01 Antimony Standard Reference Material – Assay Results for 2013
FAIR\MULL\LIDB\EBBE\mota PLI014_Costerfield_Operations_NI_43 101_Master_Rev0 28 March 2014
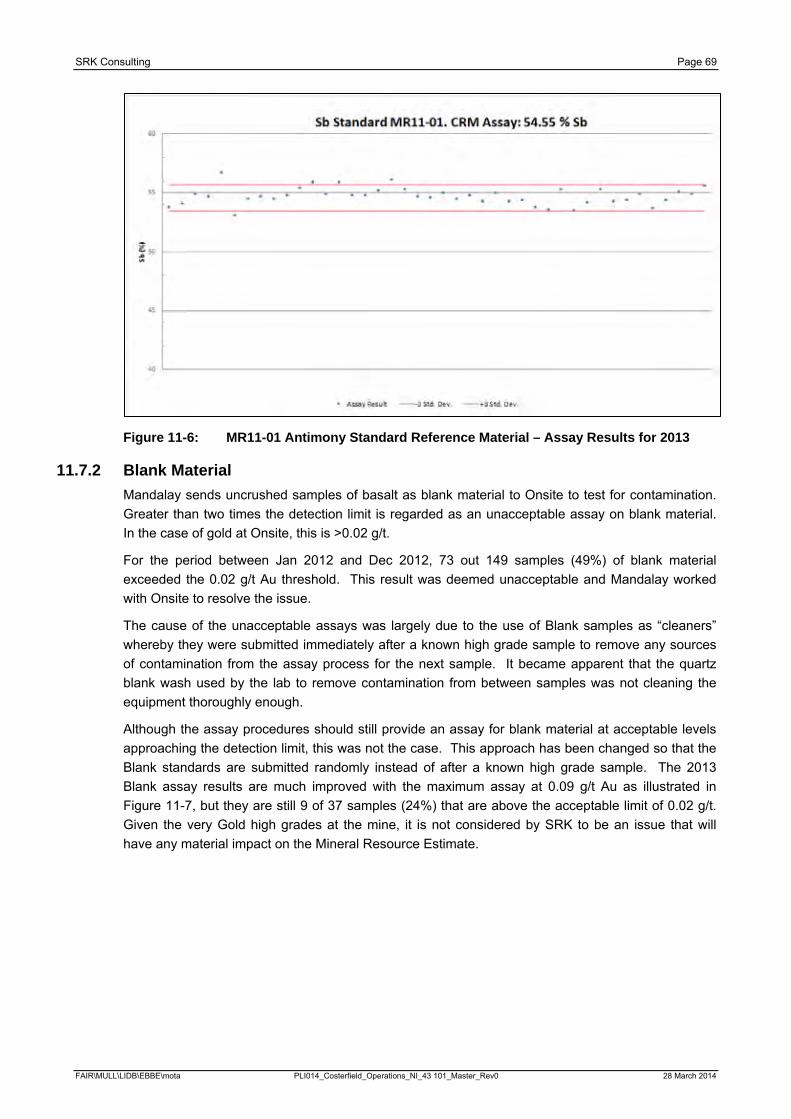
SRK Consulting Page 69
Figure 11-6: MR11-01 Antimony Standard Reference Material – Assay Results for 2013
11.7.2 Blank Material Mandalay sends uncrushed samples of basalt as blank material to Onsite to test for contamination. Greater than two times the detection limit is regarded as an unacceptable assay on blank material. In the case of gold at Onsite, this is >0.02 g/t.
For the period between Jan 2012 and Dec 2012, 73 out 149 samples (49%) of blank material exceeded the 0.02 g/t Au threshold. This result was deemed unacceptable and Mandalay worked with Onsite to resolve the issue.
The cause of the unacceptable assays was largely due to the use of Blank samples as “cleaners” whereby they were submitted immediately after a known high grade sample to remove any sources of contamination from the assay process for the next sample. It became apparent that the quartz blank wash used by the lab to remove contamination from between samples was not cleaning the equipment thoroughly enough.
Although the assay procedures should still provide an assay for blank material at acceptable levels approaching the detection limit, this was not the case. This approach has been changed so that the Blank standards are submitted randomly instead of after a known high grade sample. The 2013 Blank assay results are much improved with the maximum assay at 0.09 g/t Au as illustrated in Figure 11-7, but they are still 9 of 37 samples (24%) that are above the acceptable limit of 0.02 g/t. Given the very Gold high grades at the mine, it is not considered by SRK to be an issue that will have any material impact on the Mineral Resource Estimate.
FAIR\MULL\LIDB\EBBE\mota PLI014_Costerfield_Operations_NI_43 101_Master_Rev0 28 March 2014
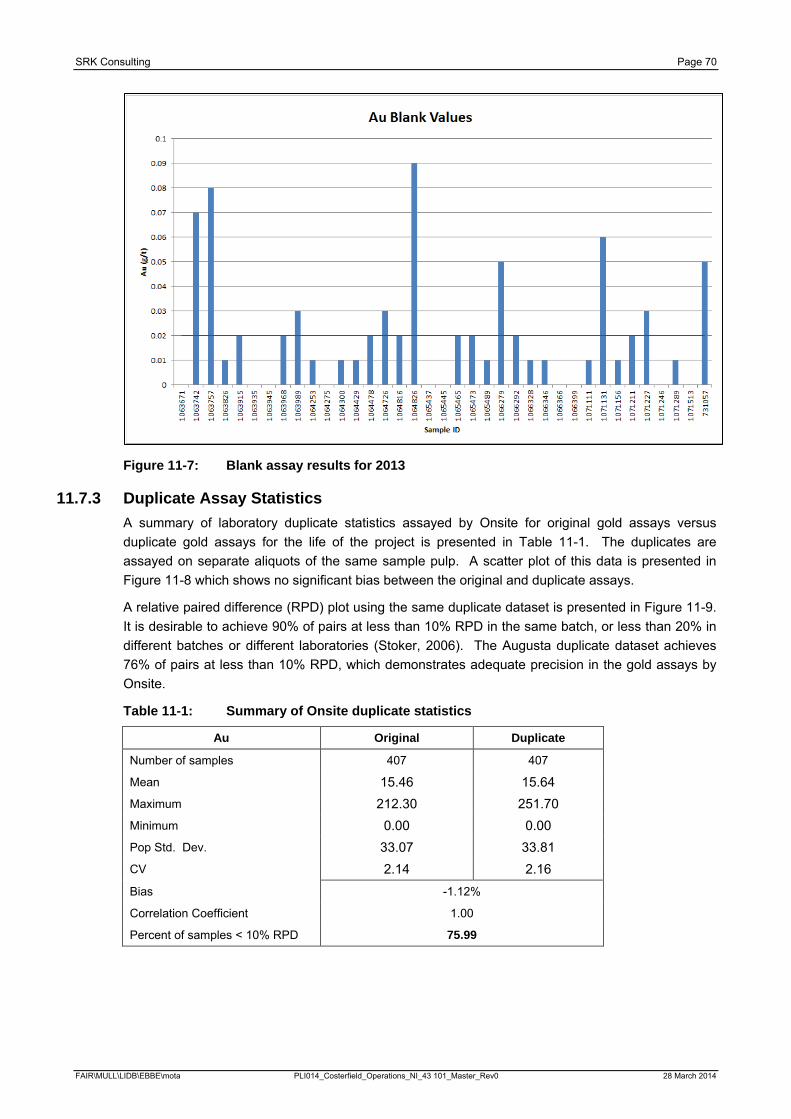
SRK Consulting Page 70
Figure 11-7: Blank assay results for 2013
11.7.3 Duplicate Assay Statistics A summary of laboratory duplicate statistics assayed by Onsite for original gold assays versus duplicate gold assays for the life of the project is presented in Table 11-1. The duplicates are assayed on separate aliquots of the same sample pulp. A scatter plot of this data is presented in Figure 11-8 which shows no significant bias between the original and duplicate assays.
A relative paired difference (RPD) plot using the same duplicate dataset is presented in Figure 11-9. It is desirable to achieve 90% of pairs at less than 10% RPD in the same batch, or less than 20% in different batches or different laboratories (Stoker, 2006). The Augusta duplicate dataset achieves 76% of pairs at less than 10% RPD, which demonstrates adequate precision in the gold assays by Onsite.
Table 11-1: Summary of Onsite duplicate statistics
Au Original Duplicate
Number of samples 407 407
Mean 15.46 15.64 Maximum 212.30 251.70 Minimum 0.00 0.00 Pop Std. Dev. 33.07 33.81 CV 2.14 2.16 Bias -1.12%
Correlation Coefficient 1.00
Percent of samples < 10% RPD 75.99
FAIR\MULL\LIDB\EBBE\mota PLI014_Costerfield_Operations_NI_43 101_Master_Rev0 28 March 2014
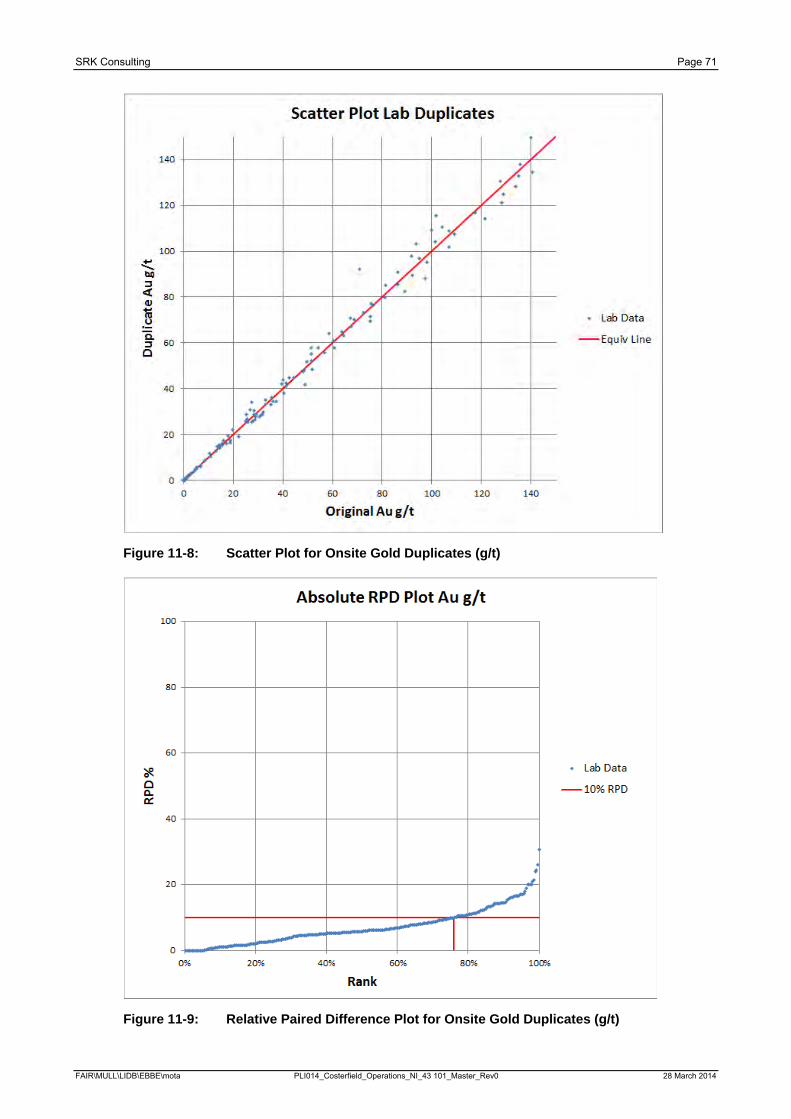
SRK Consulting Page 71
Figure 11-8: Scatter Plot for Onsite Gold Duplicates (g/t)
Figure 11-9: Relative Paired Difference Plot for Onsite Gold Duplicates (g/t)
FAIR\MULL\LIDB\EBBE\mota PLI014_Costerfield_Operations_NI_43 101_Master_Rev0 28 March 2014
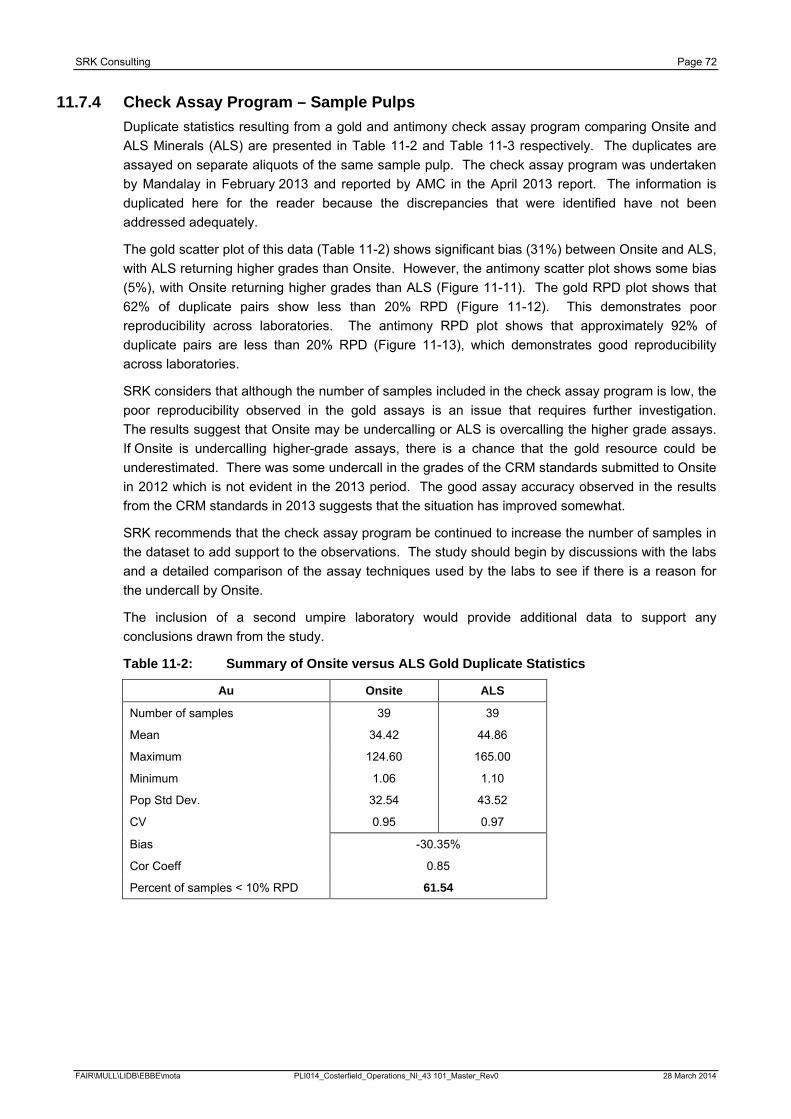
SRK Consulting Page 72
11.7.4 Check Assay Program – Sample Pulps Duplicate statistics resulting from a gold and antimony check assay program comparing Onsite and ALS Minerals (ALS) are presented in Table 11-2 and Table 11-3 respectively. The duplicates are assayed on separate aliquots of the same sample pulp. The check assay program was undertaken by Mandalay in February 2013 and reported by AMC in the April 2013 report. The information is duplicated here for the reader because the discrepancies that were identified have not been addressed adequately.
The gold scatter plot of this data (Table 11-2) shows significant bias (31%) between Onsite and ALS, with ALS returning higher grades than Onsite. However, the antimony scatter plot shows some bias (5%), with Onsite returning higher grades than ALS (Figure 11-11). The gold RPD plot shows that 62% of duplicate pairs show less than 20% RPD (Figure 11-12). This demonstrates poor reproducibility across laboratories. The antimony RPD plot shows that approximately 92% of duplicate pairs are less than 20% RPD (Figure 11-13), which demonstrates good reproducibility across laboratories.
SRK considers that although the number of samples included in the check assay program is low, the poor reproducibility observed in the gold assays is an issue that requires further investigation. The results suggest that Onsite may be undercalling or ALS is overcalling the higher grade assays. If Onsite is undercalling higher-grade assays, there is a chance that the gold resource could be underestimated. There was some undercall in the grades of the CRM standards submitted to Onsite in 2012 which is not evident in the 2013 period. The good assay accuracy observed in the results from the CRM standards in 2013 suggests that the situation has improved somewhat.
SRK recommends that the check assay program be continued to increase the number of samples in the dataset to add support to the observations. The study should begin by discussions with the labs and a detailed comparison of the assay techniques used by the labs to see if there is a reason for the undercall by Onsite.
The inclusion of a second umpire laboratory would provide additional data to support any conclusions drawn from the study.
Table 11-2: Summary of Onsite versus ALS Gold Duplicate Statistics
Au Onsite ALS
Number of samples 39 39
Mean 34.42 44.86
Maximum 124.60 165.00
Minimum 1.06 1.10
Pop Std Dev. 32.54 43.52
CV 0.95 0.97
Bias -30.35%
Cor Coeff 0.85
Percent of samples < 10% RPD 61.54
FAIR\MULL\LIDB\EBBE\mota PLI014_Costerfield_Operations_NI_43 101_Master_Rev0 28 March 2014
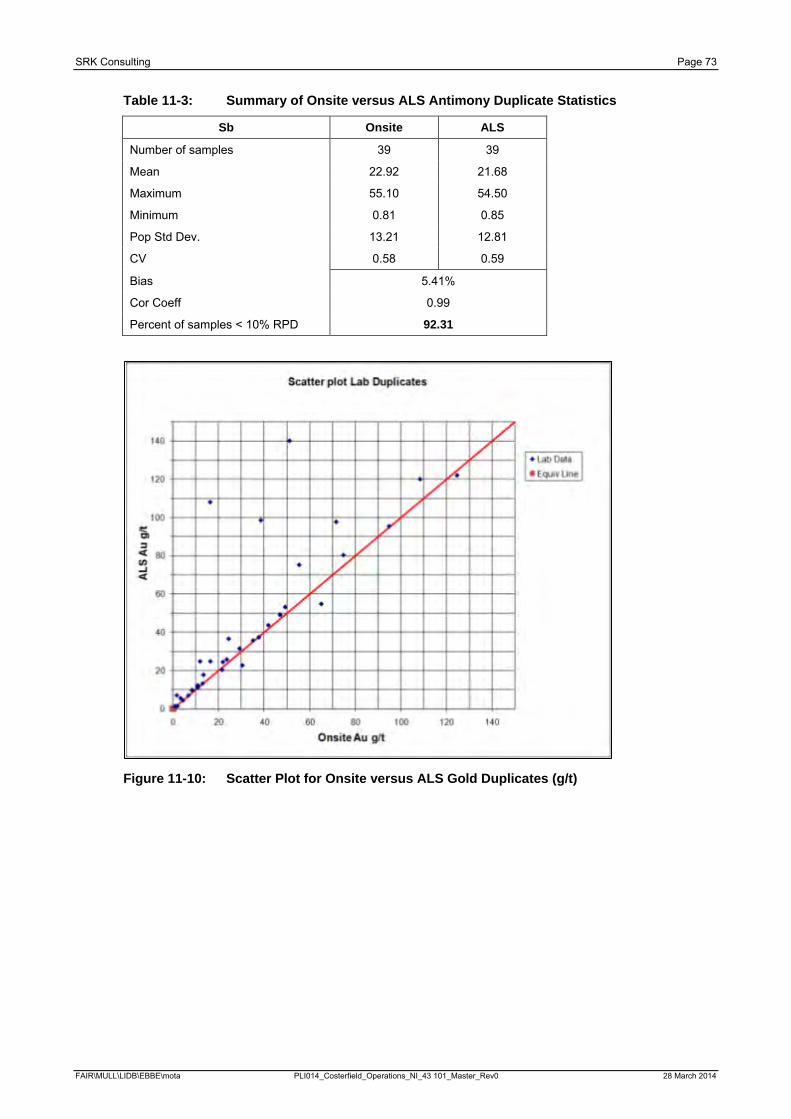
SRK Consulting Page 73
Table 11-3: Summary of Onsite versus ALS Antimony Duplicate Statistics
Sb Onsite ALS
Number of samples 39 39
Mean 22.92 21.68
Maximum 55.10 54.50
Minimum 0.81 0.85
Pop Std Dev. 13.21 12.81
CV 0.58 0.59
Bias 5.41%
Cor Coeff 0.99
Percent of samples < 10% RPD 92.31
Figure 11-10: Scatter Plot for Onsite versus ALS Gold Duplicates (g/t)
FAIR\MULL\LIDB\EBBE\mota PLI014_Costerfield_Operations_NI_43 101_Master_Rev0 28 March 2014
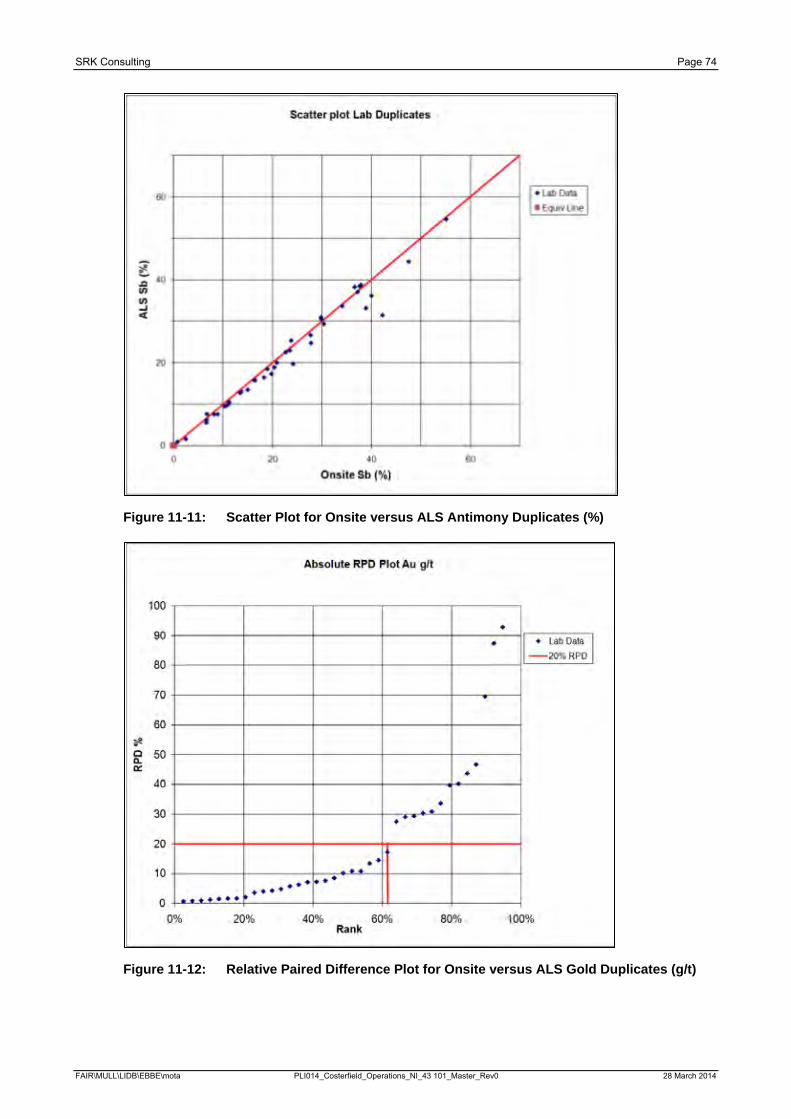
SRK Consulting Page 74
Figure 11-11: Scatter Plot for Onsite versus ALS Antimony Duplicates (%)
Figure 11-12: Relative Paired Difference Plot for Onsite versus ALS Gold Duplicates (g/t)
FAIR\MULL\LIDB\EBBE\mota PLI014_Costerfield_Operations_NI_43 101_Master_Rev0 28 March 2014
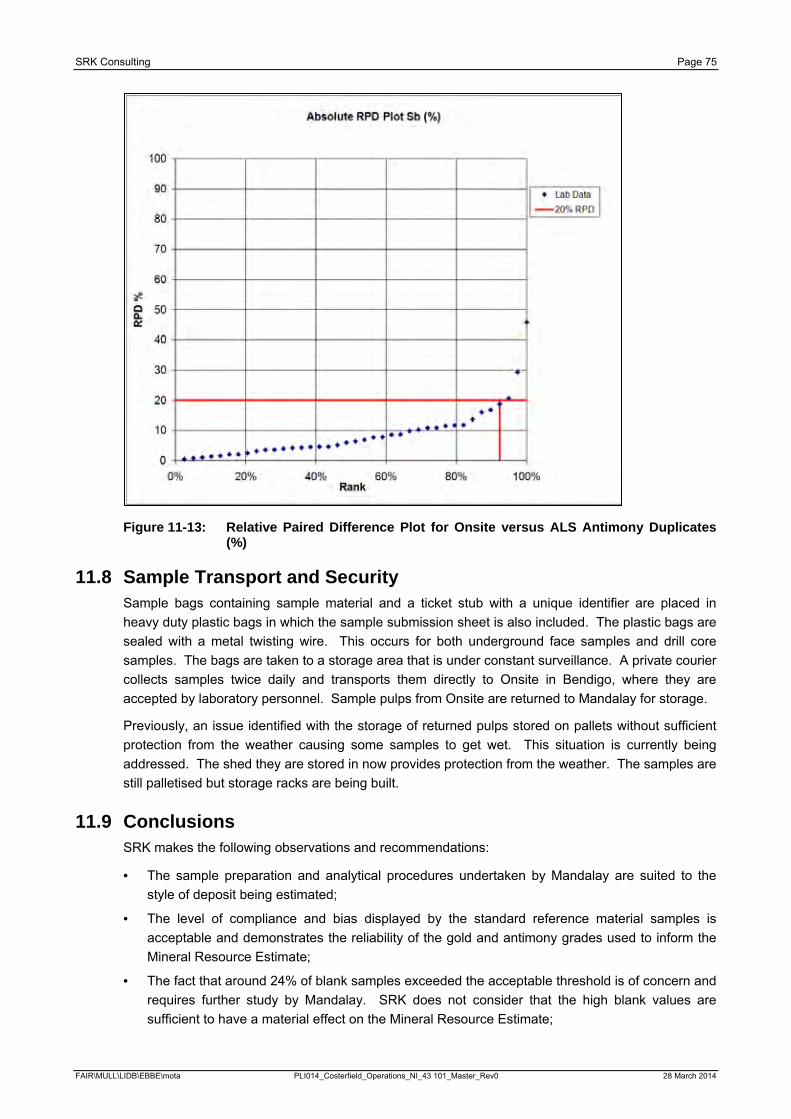
SRK Consulting Page 75
Figure 11-13: Relative Paired Difference Plot for Onsite versus ALS Antimony Duplicates (%)
11.8 Sample Transport and Security Sample bags containing sample material and a ticket stub with a unique identifier are placed in heavy duty plastic bags in which the sample submission sheet is also included. The plastic bags are sealed with a metal twisting wire. This occurs for both underground face samples and drill core samples. The bags are taken to a storage area that is under constant surveillance. A private courier collects samples twice daily and transports them directly to Onsite in Bendigo, where they are accepted by laboratory personnel. Sample pulps from Onsite are returned to Mandalay for storage.
Previously, an issue identified with the storage of returned pulps stored on pallets without sufficient protection from the weather causing some samples to get wet. This situation is currently being addressed. The shed they are stored in now provides protection from the weather. The samples are still palletised but storage racks are being built.
11.9 Conclusions SRK makes the following observations and recommendations:
· The sample preparation and analytical procedures undertaken by Mandalay are suited to the style of deposit being estimated;
· The level of compliance and bias displayed by the standard reference material samples is acceptable and demonstrates the reliability of the gold and antimony grades used to inform the Mineral Resource Estimate;
· The fact that around 24% of blank samples exceeded the acceptable threshold is of concern and requires further study by Mandalay. SRK does not consider that the high blank values are sufficient to have a material effect on the Mineral Resource Estimate;
FAIR\MULL\LIDB\EBBE\mota PLI014_Costerfield_Operations_NI_43 101_Master_Rev0 28 March 2014

SRK Consulting Page 76
· The poor reproducibility observed in the gold assays for duplicate pulps assayed by Onsite and ALS in 2012 suggests that Onsite may be undercalling higher-grade assays. It is worth noting that this is this was also observed in the gold standard reference material results in 2012, but not in 2013 which suggests that the situation has improved somewhat. SRK recommends that Mandalay investigates the poor reproducibility of the gold assays between Onsite and ALS, and perhaps procure the services of a second umpire lab; and
· SRK recommends that Mandalay undertakes quarterly laboratory inspections and reviews of Onsite, and institutes check assay programs on a quarterly basis.
FAIR\MULL\LIDB\EBBE\mota PLI014_Costerfield_Operations_NI_43 101_Master_Rev0 28 March 2014
SRK Consulting Page 77
12 Data Verification On 19 December 2013, SRK full-time employee Bob Lidbury (QP for sections 7 to 12 and Section 14) visited the Augusta and the Brunswick Mine sites and was escorted by Chris Davis, Resource Manager for the Costerfield Operations. All drill-core for the Costerfield Property is processed at the Brunswick exploration core shed. The following data verification steps were undertaken:
· Discussions with site geologists regarding:
· Sample collection;
· Sample preparation;
· Core mark-up;
· Core recovery;
· Core cutting procedures;
· Sample storage;
· QA/QC;
· Data validation procedures;
· Collar survey procedures;
· Downhole survey procedures;
· Geological interpretation; and
· Exploration strategy.
· Discussions with the driller regarding:
· Drilling procedures;
· Core retrieval and recovery;
· Core mark-up; and
· Ground conditions.
· Inspection of Brunswick core shed facilities and drill core intersections (Augusta and Cuffley);
· An underground tour was conducted. The first exposure of the Cuffley Lode was seen in the crosscut access and exposures of the Augusta lodes were also visited;
· Inspections of a surface drill rig in operation; recovery of core from the barrel was observed; and
· Inspections of the Brunswick Pit and the core farm.
SRK makes the following observations based on the data verification undertaken:
· The importance of good core recovery in the mineralised zone is understood and stringent core recovery procedures are in place to ensure good core recovery. If the core recovery is less than 90% in the mineralised zone, the drillhole is redrilled. If the core recovery is between 90% and 100% in the mineralised zone, the hole might be redrilled anyway;
· The geological characteristics of the Cuffley Lode were observed in a crosscut exposure underground. The characteristics appear quite similar to the other lode exposures observed;
· Considerable attention is paid to the collection and analysis of structural information from drill core and underground mapping; and
· Sample handling procedures are good and appear to conform to a high standard. A proactive approach is taken to identify and address any problems that might arise. SRK made the suggestion while onsite that a periodic core shed audit could be implemented to monitor and maintain sample handling procedures.
FAIR\MULL\LIDB\EBBE\mota PLI014_Costerfield_Operations_NI_43 101_Master_Rev0 28 March 2014

SRK Consulting Page 78
In SRK’s opinion, the geological data used to inform the Augusta and Cuffley block model estimates were collected in line with industry best practice as defined in the Canadian Institute of Mining and Metallurgy and Petroleum (CIM) Exploration Best Practice Guidelines and the CIM Mineral Resource, Mineral Reserve Best Practice Guidelines. As such, the data are suitable for use in the estimation of Mineral Resources.
FAIR\MULL\LIDB\EBBE\mota PLI014_Costerfield_Operations_NI_43 101_Master_Rev0 28 March 2014
SRK Consulting Page 79
13 Mineral Processing and Metallurgical Testing 13.1 Metallurgical Testing – Augusta
13.1.1 Historical Testwork From 2004 to May 2012 Augusta samples have been tested to determine the amenability of the ore to metallurgical recovery. The following companies were involved with various aspects of the metallurgical evaluation:
· ALS Ammtec, Brookvale NSW (Previously known as Metcon Laboratories) (Metcon); and
· AMDEL LIMITED Mineral Services Laboratory, Torrensville Plaza, South Australia (Amdel).
Historically, Amdel tested drill core samples in 2004 prior to the processing of the Augusta ore through the Brunswick processing plant. Amdel tested the ore amenability to crushing and grinding and the metallurgical response of the different ore types to gravity concentration, flotation and cyanide recovery.
Metcon has been responsible for ongoing ore characterisation testwork since 2008, the aim of this testwork has been to compare the recovery of the laboratory tested samples to the mill reconciled recovery. In total, ten separate ore characterisation tests have been completed on Augusta ore. Samples were selected via face sampling of ore drives or mill feed belt cuts to coincide with what was being processed at the time in the processing plant.
The Metcon ore characterisation tests involve testing specifically targeted grind sizes and the ore amenability at these sizes to gravity concentration, flotation and cyanide recovery. Since July 2011 (i.e. test M2421), gold deportment testwork on the flotation tailings has been included in the ore characterisation tests to determine the percentage of cyanide soluble, sulphide locked and silicate locked gold.
Table 13-1 and Table 13-2 outline the plant performance recovery for antimony and gold separately, compared to the historical testwork for the Augusta mined and processed ore.
For the first four ore characterisation tests (M1592, M1609, M1654 and M2091), there were no accurate flotation feed sizing’s for comparison, hence the percentage difference between the plant versus testwork recovery cannot be calculated. This is also why there is a range given for the testwork recovery as the metallurgical testing was completed at different size fractions.
Tests M2115 and M2139 were completed only at the p80 106 µm size range, which is not comparable to the actual plant flotation feed size range that was p80 76 µm and p80 60 µm at the time.
The remaining three tests, M2305, M2421 and M2610, were tested at similar flotation feed size ranges to the actual plant feeds size at the time and showed good correlation for antimony recovery. However, the gold recovery results are inconsistent when compared to the plant gold recoveries.
FAIR\MULL\LIDB\EBBE\mota PLI014_Costerfield_Operations_NI_43 101_Master_Rev0 28 March 2014
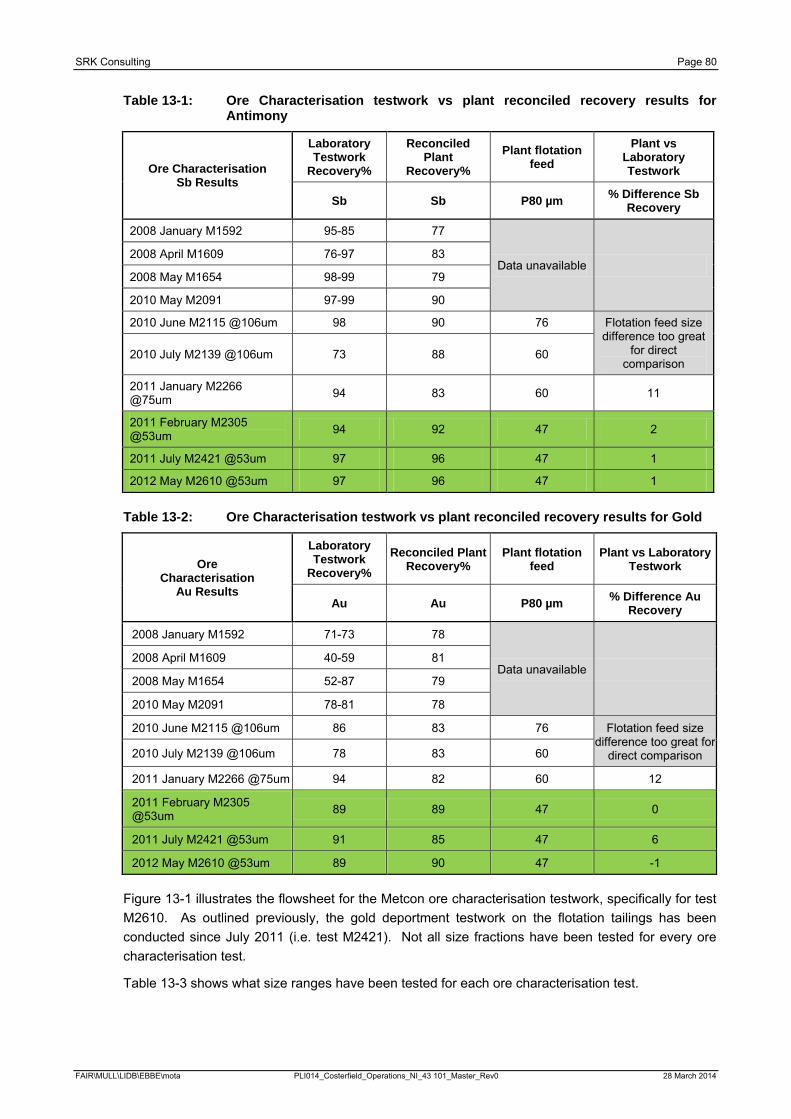
SRK Consulting Page 80
Table 13-1: Ore Characterisation testwork vs plant reconciled recovery results for Antimony
Ore Characterisation Sb Results
Laboratory Testwork
Recovery%
Reconciled Plant
Recovery% Plant flotation
feed Plant vs
Laboratory Testwork
Sb Sb P80 µm % Difference Sb Recovery
2008 January M1592 95-85 77
Data unavailable 2008 April M1609 76-97 83
2008 May M1654 98-99 79
2010 May M2091 97-99 90
2010 June M2115 @106um 98 90 76 Flotation feed size difference too great
for direct comparison
2010 July M2139 @106um 73 88 60
2011 January M2266 @75um 94 83 60 11
2011 February M2305 @53um 94 92 47 2
2011 July M2421 @53um 97 96 47 1
2012 May M2610 @53um 97 96 47 1
Table 13-2: Ore Characterisation testwork vs plant reconciled recovery results for Gold
Ore Characterisation
Au Results
Laboratory Testwork
Recovery% Reconciled Plant
Recovery% Plant flotation
feed Plant vs Laboratory
Testwork
Au Au P80 µm % Difference Au Recovery
2008 January M1592 71-73 78
Data unavailable 2008 April M1609 40-59 81
2008 May M1654 52-87 79
2010 May M2091 78-81 78
2010 June M2115 @106um 86 83 76 Flotation feed size difference too great for
direct comparison 2010 July M2139 @106um 78 83 60
2011 January M2266 @75um 94 82 60 12
2011 February M2305 @53um 89 89 47 0
2011 July M2421 @53um 91 85 47 6
2012 May M2610 @53um 89 90 47 -1
Figure 13-1 illustrates the flowsheet for the Metcon ore characterisation testwork, specifically for test M2610. As outlined previously, the gold deportment testwork on the flotation tailings has been conducted since July 2011 (i.e. test M2421). Not all size fractions have been tested for every ore characterisation test.
Table 13-3 shows what size ranges have been tested for each ore characterisation test.
FAIR\MULL\LIDB\EBBE\mota PLI014_Costerfield_Operations_NI_43 101_Master_Rev0 28 March 2014
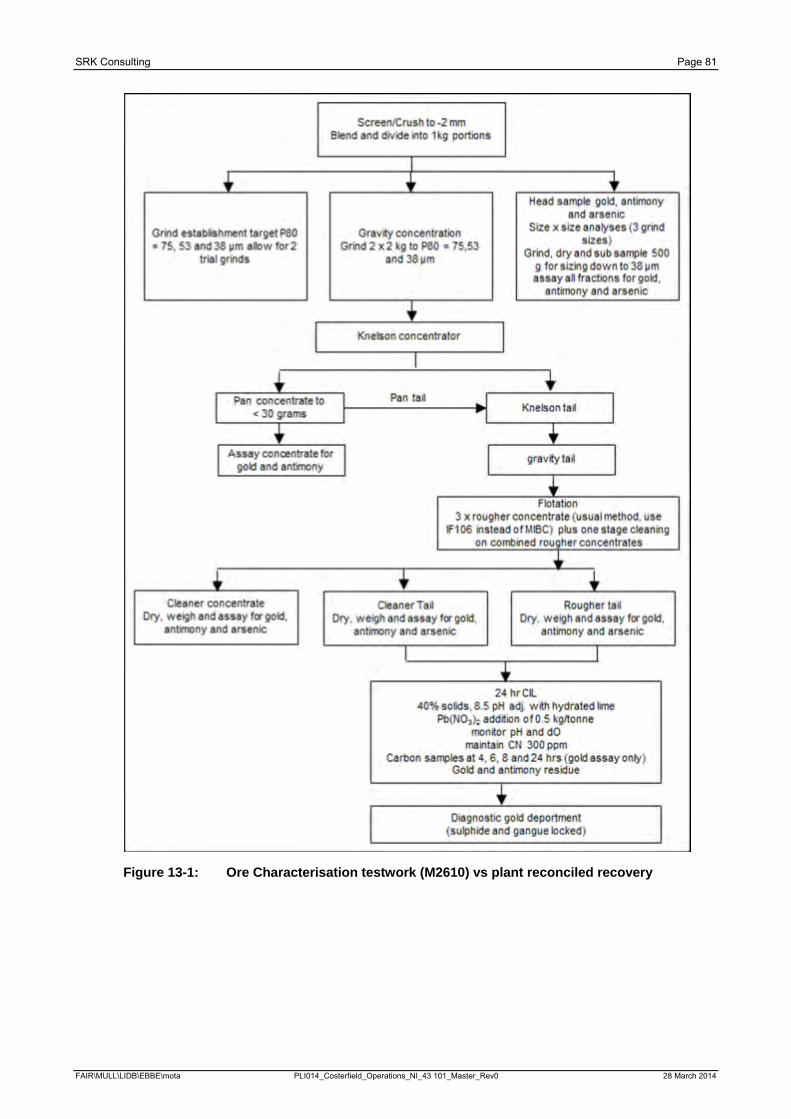
SRK Consulting Page 81
Figure 13-1: Ore Characterisation testwork (M2610) vs plant reconciled recovery
FAIR\MULL\LIDB\EBBE\mota PLI014_Costerfield_Operations_NI_43 101_Master_Rev0 28 March 2014
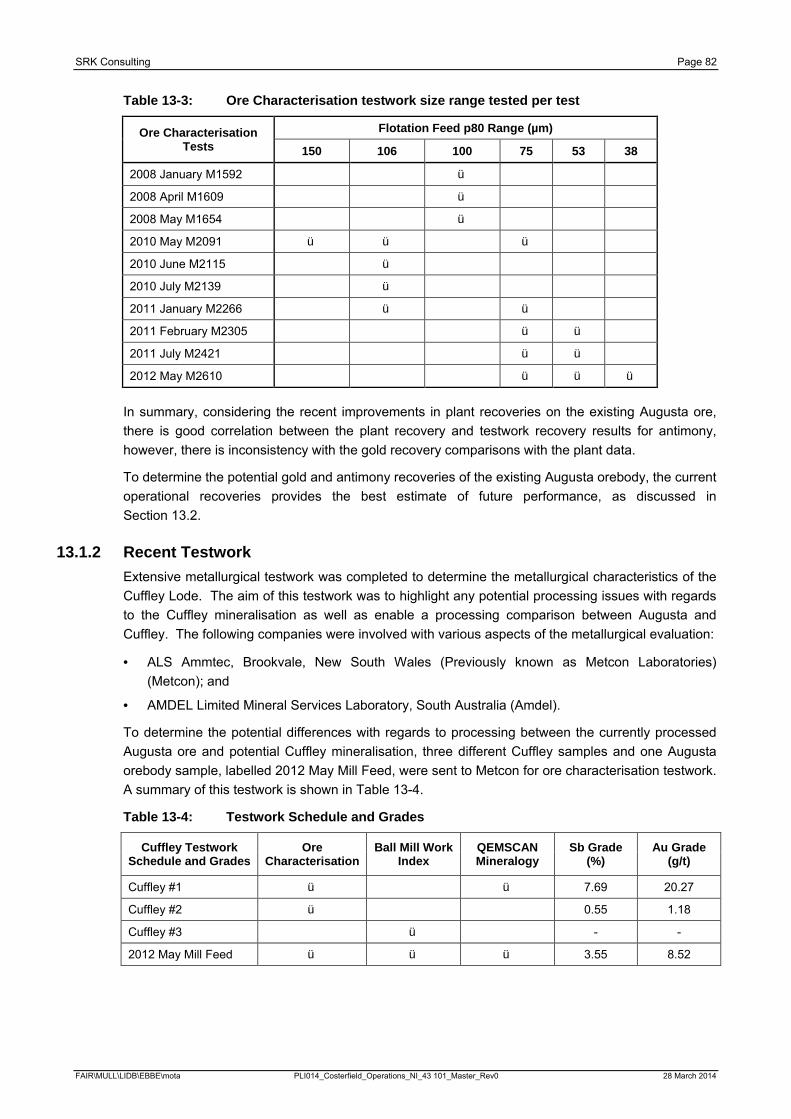
SRK Consulting Page 82
Table 13-3: Ore Characterisation testwork size range tested per test
Ore Characterisation Tests
Flotation Feed p80 Range (µm)
150 106 100 75 53 38
2008 January M1592 ü
2008 April M1609 ü 2008 May M1654 ü 2010 May M2091 ü ü ü 2010 June M2115 ü 2010 July M2139 ü 2011 January M2266 ü ü 2011 February M2305 ü ü 2011 July M2421 ü ü 2012 May M2610 ü ü ü
In summary, considering the recent improvements in plant recoveries on the existing Augusta ore, there is good correlation between the plant recovery and testwork recovery results for antimony, however, there is inconsistency with the gold recovery comparisons with the plant data.
To determine the potential gold and antimony recoveries of the existing Augusta orebody, the current operational recoveries provides the best estimate of future performance, as discussed in Section 13.2.
13.1.2 Recent Testwork Extensive metallurgical testwork was completed to determine the metallurgical characteristics of the Cuffley Lode. The aim of this testwork was to highlight any potential processing issues with regards to the Cuffley mineralisation as well as enable a processing comparison between Augusta and Cuffley. The following companies were involved with various aspects of the metallurgical evaluation:
· ALS Ammtec, Brookvale, New South Wales (Previously known as Metcon Laboratories) (Metcon); and
· AMDEL Limited Mineral Services Laboratory, South Australia (Amdel).
To determine the potential differences with regards to processing between the currently processed Augusta ore and potential Cuffley mineralisation, three different Cuffley samples and one Augusta orebody sample, labelled 2012 May Mill Feed, were sent to Metcon for ore characterisation testwork. A summary of this testwork is shown in Table 13-4.
Table 13-4: Testwork Schedule and Grades
Cuffley Testwork Schedule and Grades
Ore Characterisation
Ball Mill Work Index
QEMSCAN Mineralogy
Sb Grade (%)
Au Grade (g/t)
Cuffley #1 ü
ü 7.69 20.27
Cuffley #2 ü
0.55 1.18
Cuffley #3
ü
- -
2012 May Mill Feed ü ü ü 3.55 8.52
FAIR\MULL\LIDB\EBBE\mota PLI014_Costerfield_Operations_NI_43 101_Master_Rev0 28 March 2014

SRK Consulting Page 83
The Metcon ore characterisation testwork involves testing specifically targeted grind sizes and the ore amenability at these sizes to gravity concentration, flotation, cyanide recovery and gold deportment on the flotation tailings, to determine the percentage of cyanide soluble, sulphide locked and silicate locked gold. The flowsheet for the Metcon ore characterisation testwork is shown in Figure 13-2.
Figure 13-2: Pre-Characterisation testwork flowsheet
FAIR\MULL\LIDB\EBBE\mota PLI014_Costerfield_Operations_NI_43 101_Master_Rev0 28 March 2014
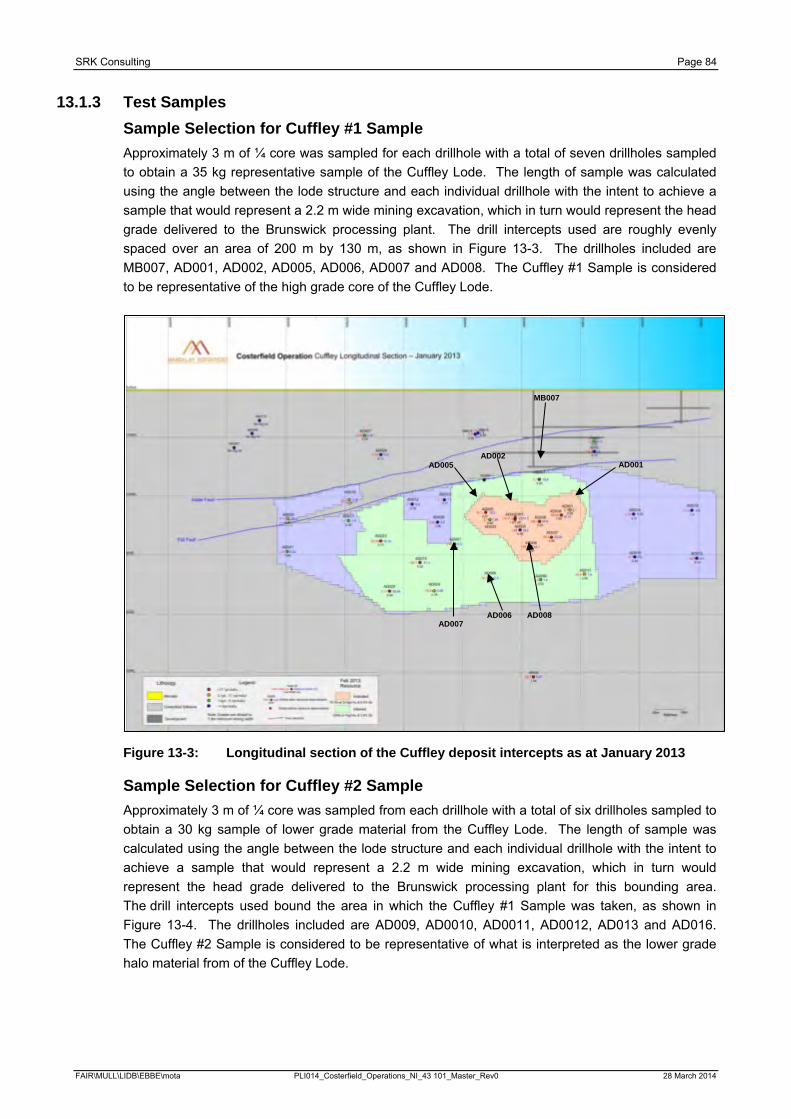
SRK Consulting Page 84
13.1.3 Test Samples Sample Selection for Cuffley #1 Sample Approximately 3 m of ¼ core was sampled for each drillhole with a total of seven drillholes sampled to obtain a 35 kg representative sample of the Cuffley Lode. The length of sample was calculated using the angle between the lode structure and each individual drillhole with the intent to achieve a sample that would represent a 2.2 m wide mining excavation, which in turn would represent the head grade delivered to the Brunswick processing plant. The drill intercepts used are roughly evenly spaced over an area of 200 m by 130 m, as shown in Figure 13-3. The drillholes included are MB007, AD001, AD002, AD005, AD006, AD007 and AD008. The Cuffley #1 Sample is considered to be representative of the high grade core of the Cuffley Lode.
Figure 13-3: Longitudinal section of the Cuffley deposit intercepts as at January 2013
Sample Selection for Cuffley #2 Sample Approximately 3 m of ¼ core was sampled from each drillhole with a total of six drillholes sampled to obtain a 30 kg sample of lower grade material from the Cuffley Lode. The length of sample was calculated using the angle between the lode structure and each individual drillhole with the intent to achieve a sample that would represent a 2.2 m wide mining excavation, which in turn would represent the head grade delivered to the Brunswick processing plant for this bounding area. The drill intercepts used bound the area in which the Cuffley #1 Sample was taken, as shown in Figure 13-4. The drillholes included are AD009, AD0010, AD0011, AD0012, AD013 and AD016. The Cuffley #2 Sample is considered to be representative of what is interpreted as the lower grade halo material from of the Cuffley Lode.
MB007
AD001 AD002
AD005
AD007 AD008 AD006
FAIR\MULL\LIDB\EBBE\mota PLI014_Costerfield_Operations_NI_43 101_Master_Rev0 28 March 2014
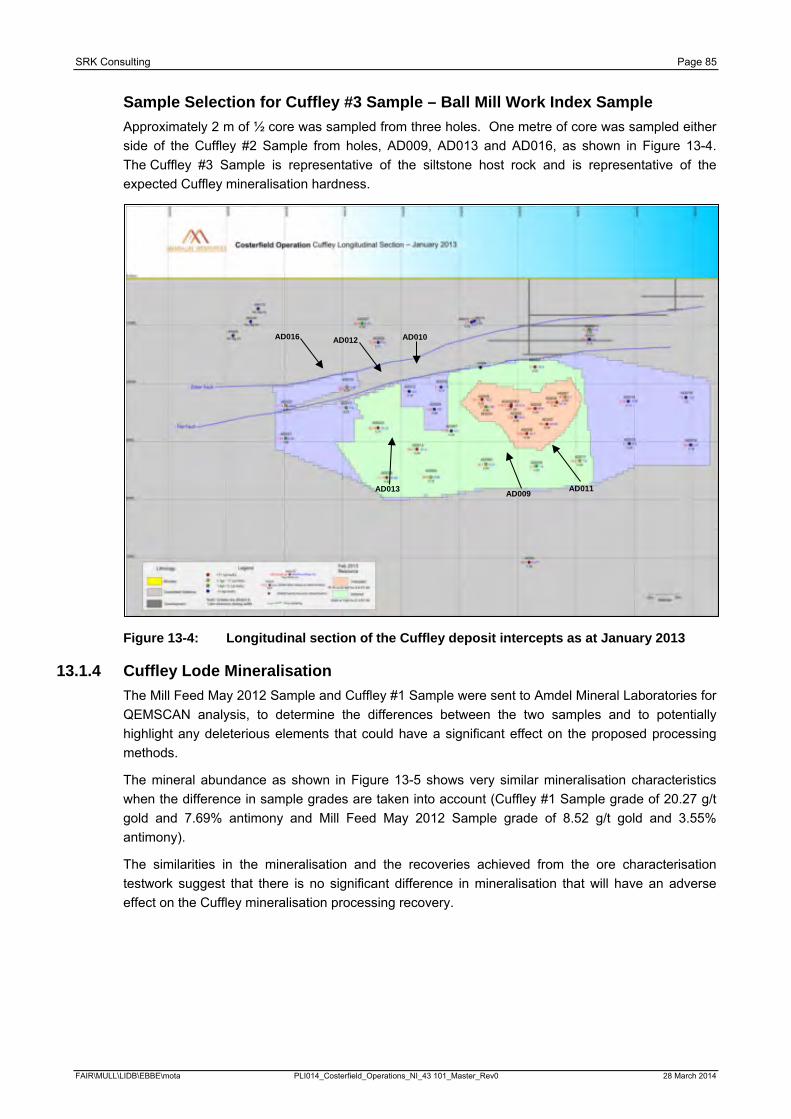
SRK Consulting Page 85
Sample Selection for Cuffley #3 Sample – Ball Mill Work Index Sample Approximately 2 m of ½ core was sampled from three holes. One metre of core was sampled either side of the Cuffley #2 Sample from holes, AD009, AD013 and AD016, as shown in Figure 13-4. The Cuffley #3 Sample is representative of the siltstone host rock and is representative of the expected Cuffley mineralisation hardness.
Figure 13-4: Longitudinal section of the Cuffley deposit intercepts as at January 2013
13.1.4 Cuffley Lode Mineralisation The Mill Feed May 2012 Sample and Cuffley #1 Sample were sent to Amdel Mineral Laboratories for QEMSCAN analysis, to determine the differences between the two samples and to potentially highlight any deleterious elements that could have a significant effect on the proposed processing methods.
The mineral abundance as shown in Figure 13-5 shows very similar mineralisation characteristics when the difference in sample grades are taken into account (Cuffley #1 Sample grade of 20.27 g/t gold and 7.69% antimony and Mill Feed May 2012 Sample grade of 8.52 g/t gold and 3.55% antimony).
The similarities in the mineralisation and the recoveries achieved from the ore characterisation testwork suggest that there is no significant difference in mineralisation that will have an adverse effect on the Cuffley mineralisation processing recovery.
AD009 AD011 AD013
AD016 AD012 AD010
FAIR\MULL\LIDB\EBBE\mota PLI014_Costerfield_Operations_NI_43 101_Master_Rev0 28 March 2014
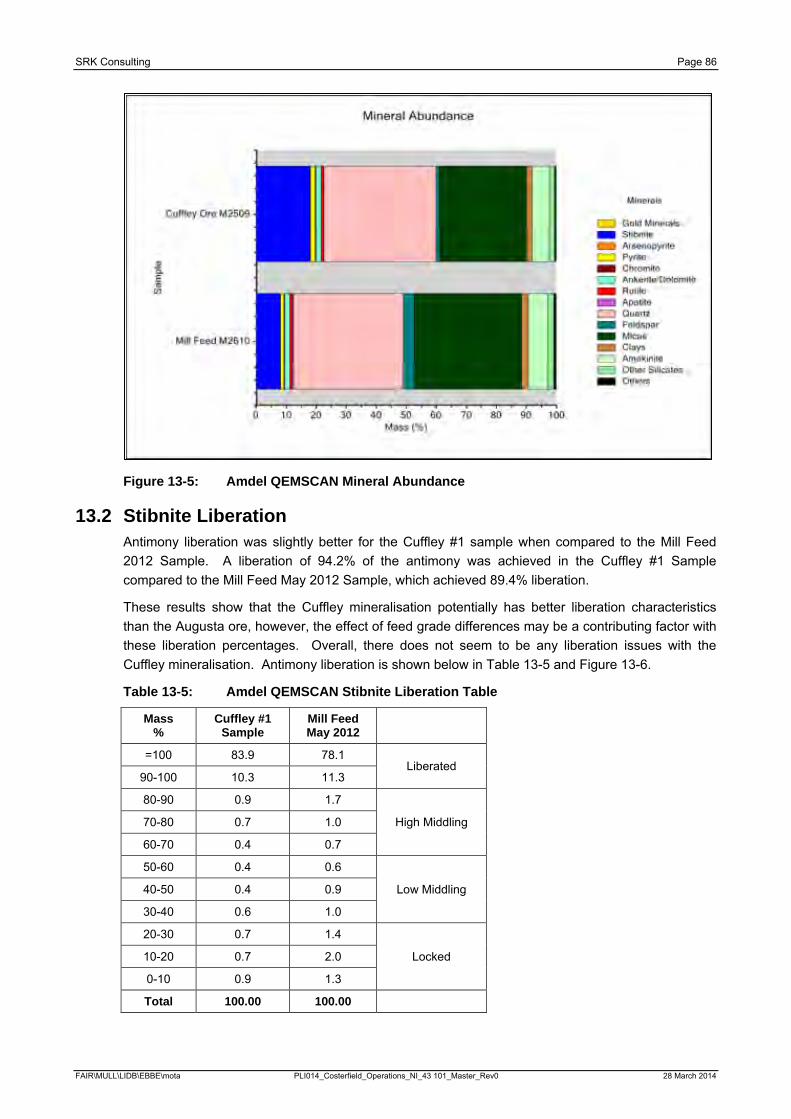
SRK Consulting Page 86
Figure 13-5: Amdel QEMSCAN Mineral Abundance
13.2 Stibnite Liberation Antimony liberation was slightly better for the Cuffley #1 sample when compared to the Mill Feed 2012 Sample. A liberation of 94.2% of the antimony was achieved in the Cuffley #1 Sample compared to the Mill Feed May 2012 Sample, which achieved 89.4% liberation.
These results show that the Cuffley mineralisation potentially has better liberation characteristics than the Augusta ore, however, the effect of feed grade differences may be a contributing factor with these liberation percentages. Overall, there does not seem to be any liberation issues with the Cuffley mineralisation. Antimony liberation is shown below in Table 13-5 and Figure 13-6.
Table 13-5: Amdel QEMSCAN Stibnite Liberation Table
Mass %
Cuffley #1 Sample
Mill Feed May 2012
=100 83.9 78.1 Liberated
90-100 10.3 11.3
80-90 0.9 1.7
High Middling 70-80 0.7 1.0
60-70 0.4 0.7
50-60 0.4 0.6
Low Middling 40-50 0.4 0.9
30-40 0.6 1.0
20-30 0.7 1.4
Locked 10-20 0.7 2.0
0-10 0.9 1.3
Total 100.00 100.00
FAIR\MULL\LIDB\EBBE\mota PLI014_Costerfield_Operations_NI_43 101_Master_Rev0 28 March 2014
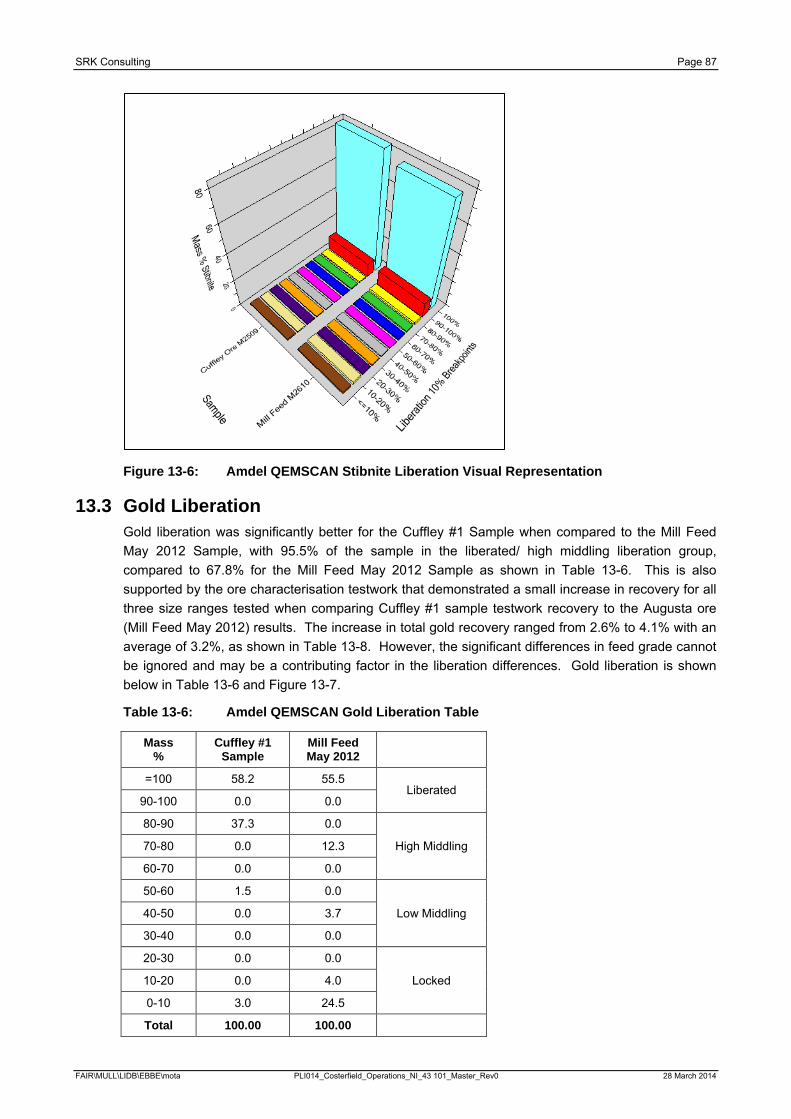
SRK Consulting Page 87
Figure 13-6: Amdel QEMSCAN Stibnite Liberation Visual Representation
13.3 Gold Liberation Gold liberation was significantly better for the Cuffley #1 Sample when compared to the Mill Feed May 2012 Sample, with 95.5% of the sample in the liberated/ high middling liberation group, compared to 67.8% for the Mill Feed May 2012 Sample as shown in Table 13-6. This is also supported by the ore characterisation testwork that demonstrated a small increase in recovery for all three size ranges tested when comparing Cuffley #1 sample testwork recovery to the Augusta ore (Mill Feed May 2012) results. The increase in total gold recovery ranged from 2.6% to 4.1% with an average of 3.2%, as shown in Table 13-8. However, the significant differences in feed grade cannot be ignored and may be a contributing factor in the liberation differences. Gold liberation is shown below in Table 13-6 and Figure 13-7.
Table 13-6: Amdel QEMSCAN Gold Liberation Table
Mass %
Cuffley #1 Sample
Mill Feed May 2012
=100 58.2 55.5 Liberated
90-100 0.0 0.0
80-90 37.3 0.0
High Middling 70-80 0.0 12.3
60-70 0.0 0.0
50-60 1.5 0.0
Low Middling 40-50 0.0 3.7
30-40 0.0 0.0
20-30 0.0 0.0
Locked 10-20 0.0 4.0
0-10 3.0 24.5
Total 100.00 100.00
FAIR\MULL\LIDB\EBBE\mota PLI014_Costerfield_Operations_NI_43 101_Master_Rev0 28 March 2014
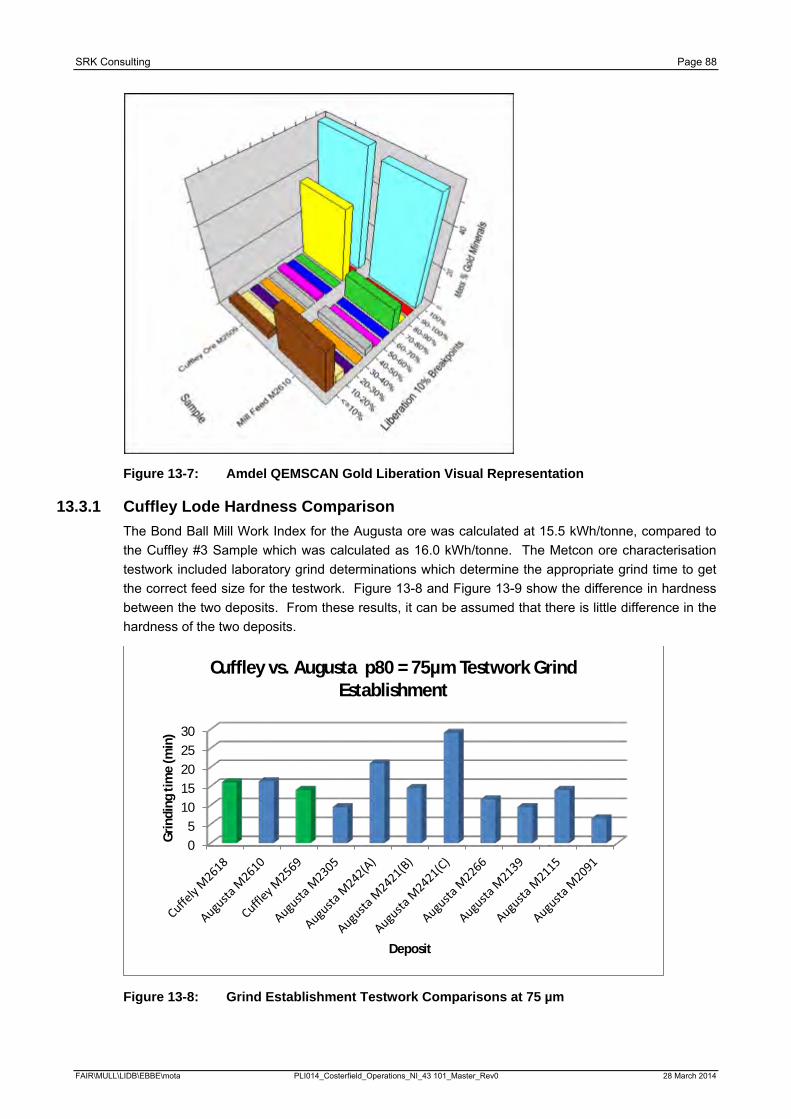
SRK Consulting Page 88
Figure 13-7: Amdel QEMSCAN Gold Liberation Visual Representation
13.3.1 Cuffley Lode Hardness Comparison The Bond Ball Mill Work Index for the Augusta ore was calculated at 15.5 kWh/tonne, compared to the Cuffley #3 Sample which was calculated as 16.0 kWh/tonne. The Metcon ore characterisation testwork included laboratory grind determinations which determine the appropriate grind time to get the correct feed size for the testwork. Figure 13-8 and Figure 13-9 show the difference in hardness between the two deposits. From these results, it can be assumed that there is little difference in the hardness of the two deposits.
Figure 13-8: Grind Establishment Testwork Comparisons at 75 µm
05
1015202530
Grin
ding
tim
e (m
in)
Deposit
Cuffley vs. Augusta p80 = 75µm Testwork Grind Establishment
FAIR\MULL\LIDB\EBBE\mota PLI014_Costerfield_Operations_NI_43 101_Master_Rev0 28 March 2014
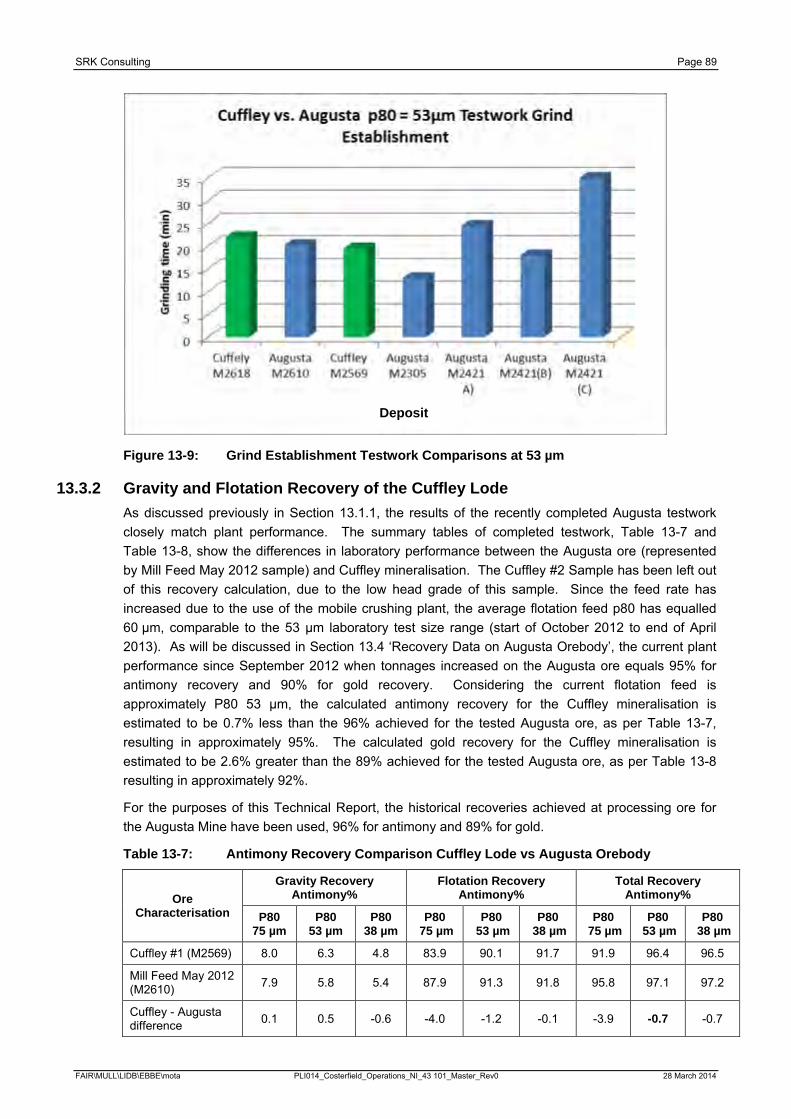
SRK Consulting Page 89
Figure 13-9: Grind Establishment Testwork Comparisons at 53 µm
13.3.2 Gravity and Flotation Recovery of the Cuffley Lode As discussed previously in Section 13.1.1, the results of the recently completed Augusta testwork closely match plant performance. The summary tables of completed testwork, Table 13-7 and Table 13-8, show the differences in laboratory performance between the Augusta ore (represented by Mill Feed May 2012 sample) and Cuffley mineralisation. The Cuffley #2 Sample has been left out of this recovery calculation, due to the low head grade of this sample. Since the feed rate has increased due to the use of the mobile crushing plant, the average flotation feed p80 has equalled 60 µm, comparable to the 53 µm laboratory test size range (start of October 2012 to end of April 2013). As will be discussed in Section 13.4 ‘Recovery Data on Augusta Orebody’, the current plant performance since September 2012 when tonnages increased on the Augusta ore equals 95% for antimony recovery and 90% for gold recovery. Considering the current flotation feed is approximately P80 53 µm, the calculated antimony recovery for the Cuffley mineralisation is estimated to be 0.7% less than the 96% achieved for the tested Augusta ore, as per Table 13-7, resulting in approximately 95%. The calculated gold recovery for the Cuffley mineralisation is estimated to be 2.6% greater than the 89% achieved for the tested Augusta ore, as per Table 13-8 resulting in approximately 92%.
For the purposes of this Technical Report, the historical recoveries achieved at processing ore for the Augusta Mine have been used, 96% for antimony and 89% for gold.
Table 13-7: Antimony Recovery Comparison Cuffley Lode vs Augusta Orebody
Ore Characterisation
Gravity Recovery Antimony%
Flotation Recovery Antimony%
Total Recovery Antimony%
P80 75 µm
P80 53 µm
P80 38 µm
P80 75 µm
P80 53 µm
P80 38 µm
P80 75 µm
P80 53 µm
P80 38 µm
Cuffley #1 (M2569) 8.0 6.3 4.8 83.9 90.1 91.7 91.9 96.4 96.5
Mill Feed May 2012 (M2610) 7.9 5.8 5.4 87.9 91.3 91.8 95.8 97.1 97.2
Cuffley - Augusta difference 0.1 0.5 -0.6 -4.0 -1.2 -0.1 -3.9 -0.7 -0.7
Deposit
FAIR\MULL\LIDB\EBBE\mota PLI014_Costerfield_Operations_NI_43 101_Master_Rev0 28 March 2014
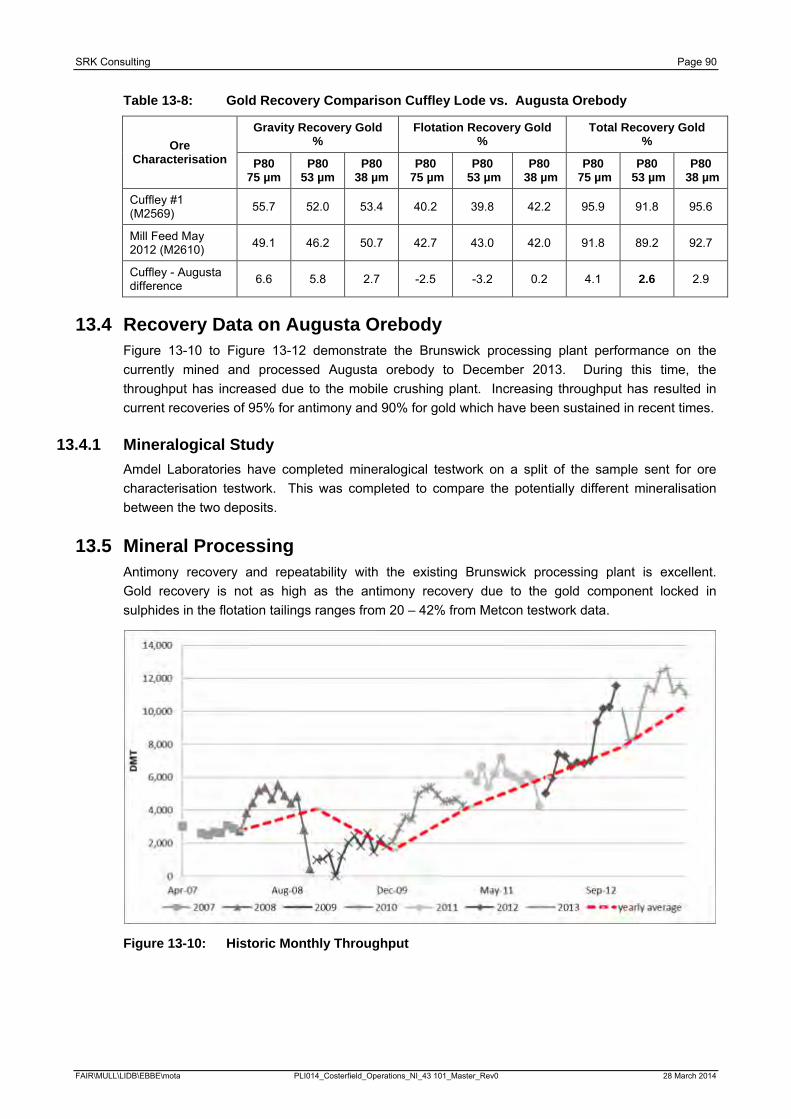
SRK Consulting Page 90
Table 13-8: Gold Recovery Comparison Cuffley Lode vs. Augusta Orebody
Ore Characterisation
Gravity Recovery Gold %
Flotation Recovery Gold %
Total Recovery Gold %
P80 75 µm
P80 53 µm
P80 38 µm
P80 75 µm
P80 53 µm
P80 38 µm
P80 75 µm
P80 53 µm
P80 38 µm
Cuffley #1 (M2569) 55.7 52.0 53.4 40.2 39.8 42.2 95.9 91.8 95.6
Mill Feed May 2012 (M2610) 49.1 46.2 50.7 42.7 43.0 42.0 91.8 89.2 92.7
Cuffley - Augusta difference 6.6 5.8 2.7 -2.5 -3.2 0.2 4.1 2.6 2.9
13.4 Recovery Data on Augusta Orebody Figure 13-10 to Figure 13-12 demonstrate the Brunswick processing plant performance on the currently mined and processed Augusta orebody to December 2013. During this time, the throughput has increased due to the mobile crushing plant. Increasing throughput has resulted in current recoveries of 95% for antimony and 90% for gold which have been sustained in recent times.
13.4.1 Mineralogical Study Amdel Laboratories have completed mineralogical testwork on a split of the sample sent for ore characterisation testwork. This was completed to compare the potentially different mineralisation between the two deposits.
13.5 Mineral Processing Antimony recovery and repeatability with the existing Brunswick processing plant is excellent. Gold recovery is not as high as the antimony recovery due to the gold component locked in sulphides in the flotation tailings ranges from 20 – 42% from Metcon testwork data.
Figure 13-10: Historic Monthly Throughput
FAIR\MULL\LIDB\EBBE\mota PLI014_Costerfield_Operations_NI_43 101_Master_Rev0 28 March 2014
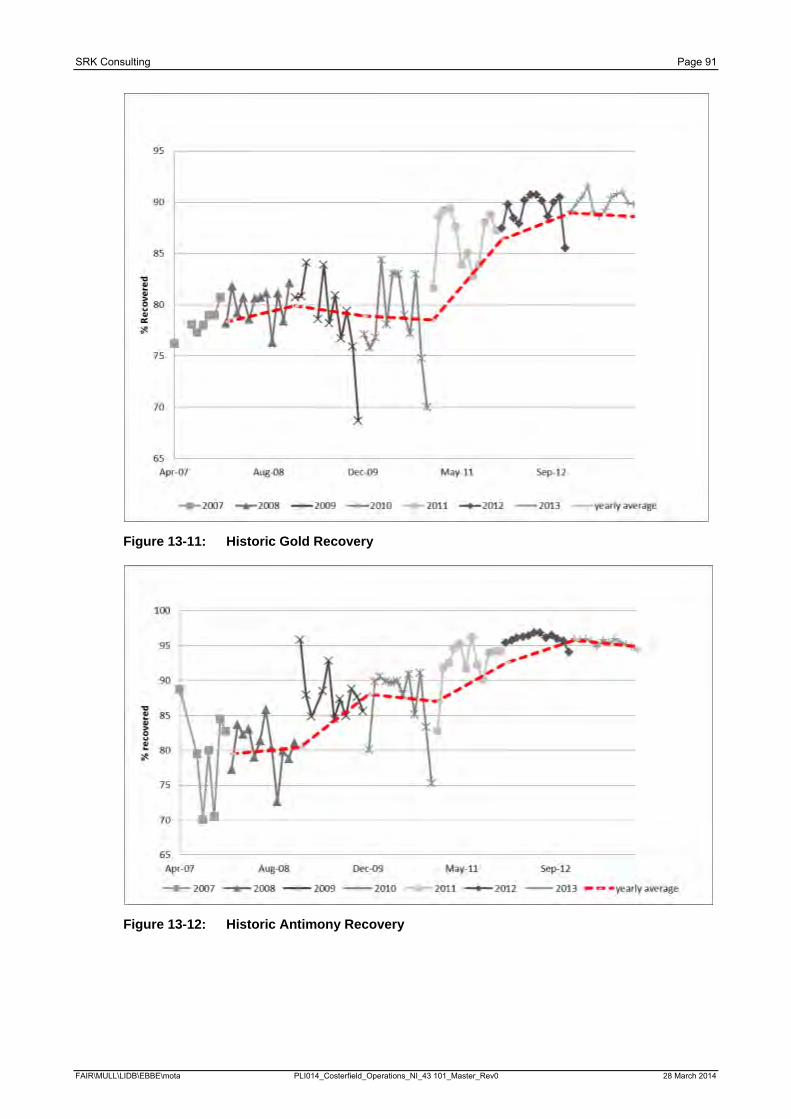
SRK Consulting Page 91
Figure 13-11: Historic Gold Recovery
Figure 13-12: Historic Antimony Recovery
FAIR\MULL\LIDB\EBBE\mota PLI014_Costerfield_Operations_NI_43 101_Master_Rev0 28 March 2014
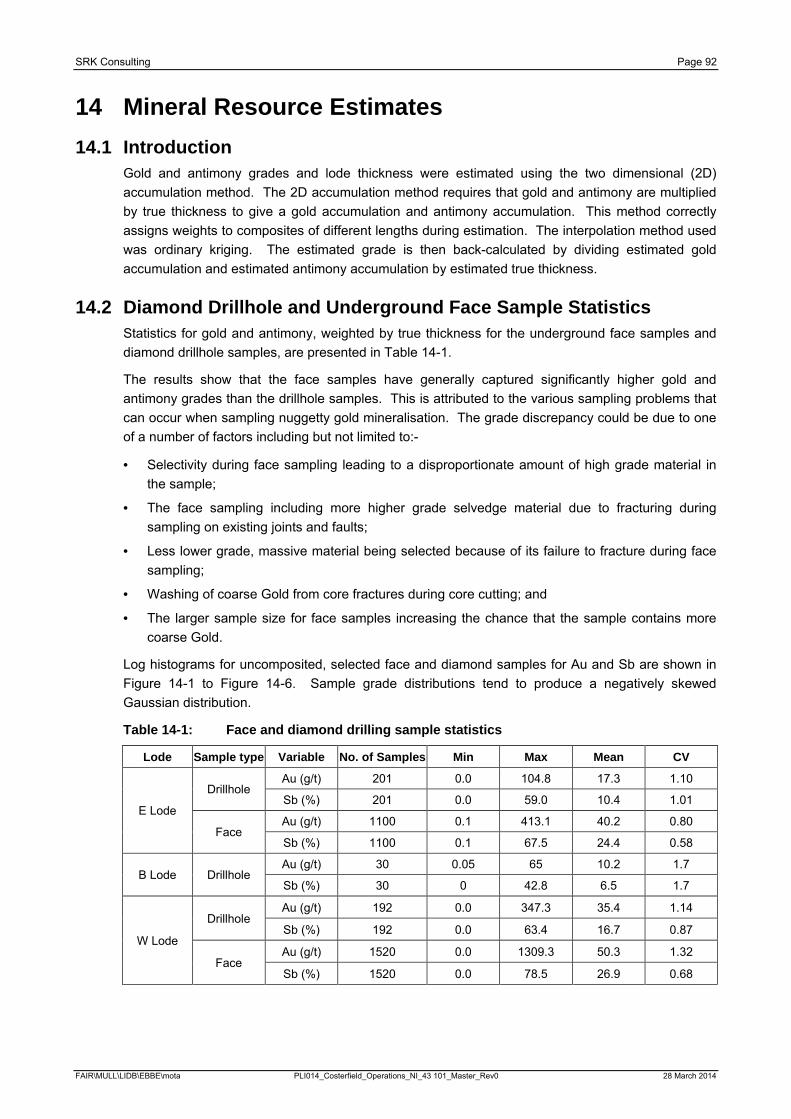
SRK Consulting Page 92
14 Mineral Resource Estimates 14.1 Introduction
Gold and antimony grades and lode thickness were estimated using the two dimensional (2D) accumulation method. The 2D accumulation method requires that gold and antimony are multiplied by true thickness to give a gold accumulation and antimony accumulation. This method correctly assigns weights to composites of different lengths during estimation. The interpolation method used was ordinary kriging. The estimated grade is then back-calculated by dividing estimated gold accumulation and estimated antimony accumulation by estimated true thickness.
14.2 Diamond Drillhole and Underground Face Sample Statistics Statistics for gold and antimony, weighted by true thickness for the underground face samples and diamond drillhole samples, are presented in Table 14-1.
The results show that the face samples have generally captured significantly higher gold and antimony grades than the drillhole samples. This is attributed to the various sampling problems that can occur when sampling nuggetty gold mineralisation. The grade discrepancy could be due to one of a number of factors including but not limited to:-
· Selectivity during face sampling leading to a disproportionate amount of high grade material in the sample;
· The face sampling including more higher grade selvedge material due to fracturing during sampling on existing joints and faults;
· Less lower grade, massive material being selected because of its failure to fracture during face sampling;
· Washing of coarse Gold from core fractures during core cutting; and
· The larger sample size for face samples increasing the chance that the sample contains more coarse Gold.
Log histograms for uncomposited, selected face and diamond samples for Au and Sb are shown in Figure 14-1 to Figure 14-6. Sample grade distributions tend to produce a negatively skewed Gaussian distribution.
Table 14-1: Face and diamond drilling sample statistics
Lode Sample type Variable No. of Samples Min Max Mean CV
E Lode
Drillhole Au (g/t) 201 0.0 104.8 17.3 1.10
Sb (%) 201 0.0 59.0 10.4 1.01
Face Au (g/t) 1100 0.1 413.1 40.2 0.80
Sb (%) 1100 0.1 67.5 24.4 0.58
B Lode Drillhole Au (g/t) 30 0.05 65 10.2 1.7
Sb (%) 30 0 42.8 6.5 1.7
W Lode
Drillhole Au (g/t) 192 0.0 347.3 35.4 1.14
Sb (%) 192 0.0 63.4 16.7 0.87
Face Au (g/t) 1520 0.0 1309.3 50.3 1.32
Sb (%) 1520 0.0 78.5 26.9 0.68
FAIR\MULL\LIDB\EBBE\mota PLI014_Costerfield_Operations_NI_43 101_Master_Rev0 28 March 2014
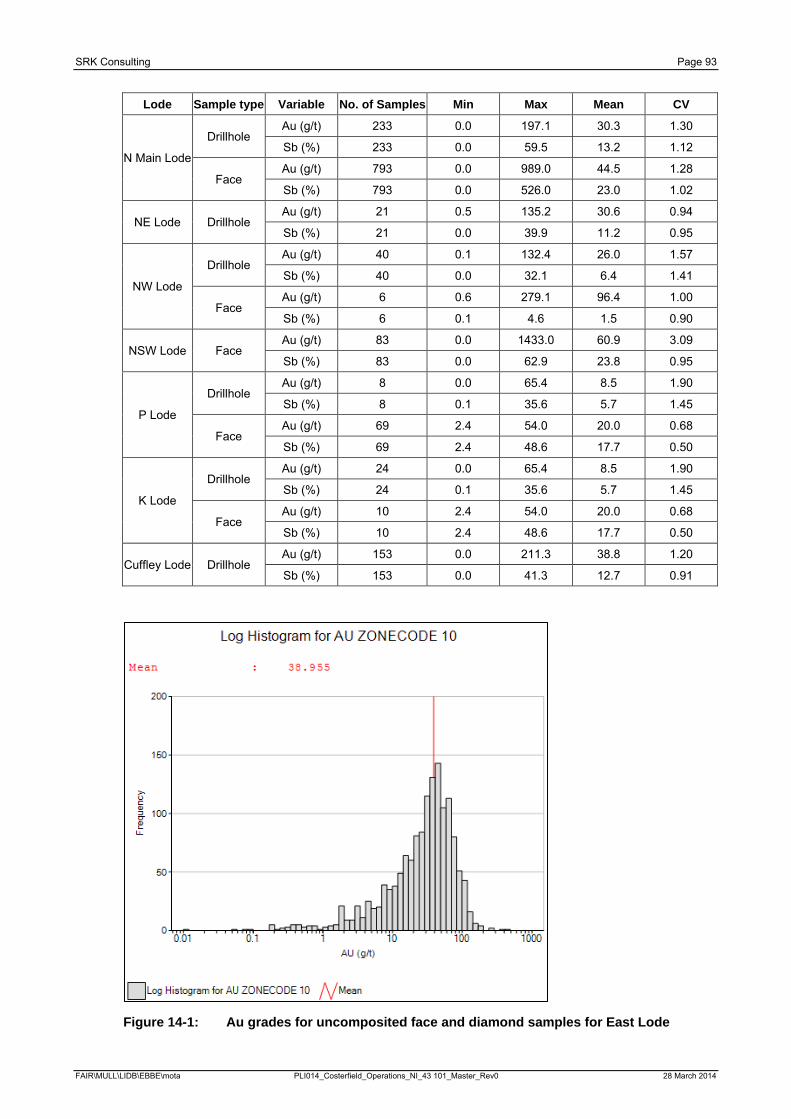
SRK Consulting Page 93
Lode Sample type Variable No. of Samples Min Max Mean CV
N Main Lode
Drillhole Au (g/t) 233 0.0 197.1 30.3 1.30
Sb (%) 233 0.0 59.5 13.2 1.12
Face Au (g/t) 793 0.0 989.0 44.5 1.28
Sb (%) 793 0.0 526.0 23.0 1.02
NE Lode Drillhole Au (g/t) 21 0.5 135.2 30.6 0.94
Sb (%) 21 0.0 39.9 11.2 0.95
NW Lode
Drillhole Au (g/t) 40 0.1 132.4 26.0 1.57
Sb (%) 40 0.0 32.1 6.4 1.41
Face Au (g/t) 6 0.6 279.1 96.4 1.00
Sb (%) 6 0.1 4.6 1.5 0.90
NSW Lode Face Au (g/t) 83 0.0 1433.0 60.9 3.09
Sb (%) 83 0.0 62.9 23.8 0.95
P Lode
Drillhole Au (g/t) 8 0.0 65.4 8.5 1.90
Sb (%) 8 0.1 35.6 5.7 1.45
Face Au (g/t) 69 2.4 54.0 20.0 0.68
Sb (%) 69 2.4 48.6 17.7 0.50
K Lode
Drillhole Au (g/t) 24 0.0 65.4 8.5 1.90
Sb (%) 24 0.1 35.6 5.7 1.45
Face Au (g/t) 10 2.4 54.0 20.0 0.68
Sb (%) 10 2.4 48.6 17.7 0.50
Cuffley Lode Drillhole Au (g/t) 153 0.0 211.3 38.8 1.20
Sb (%) 153 0.0 41.3 12.7 0.91
Figure 14-1: Au grades for uncomposited face and diamond samples for East Lode
FAIR\MULL\LIDB\EBBE\mota PLI014_Costerfield_Operations_NI_43 101_Master_Rev0 28 March 2014
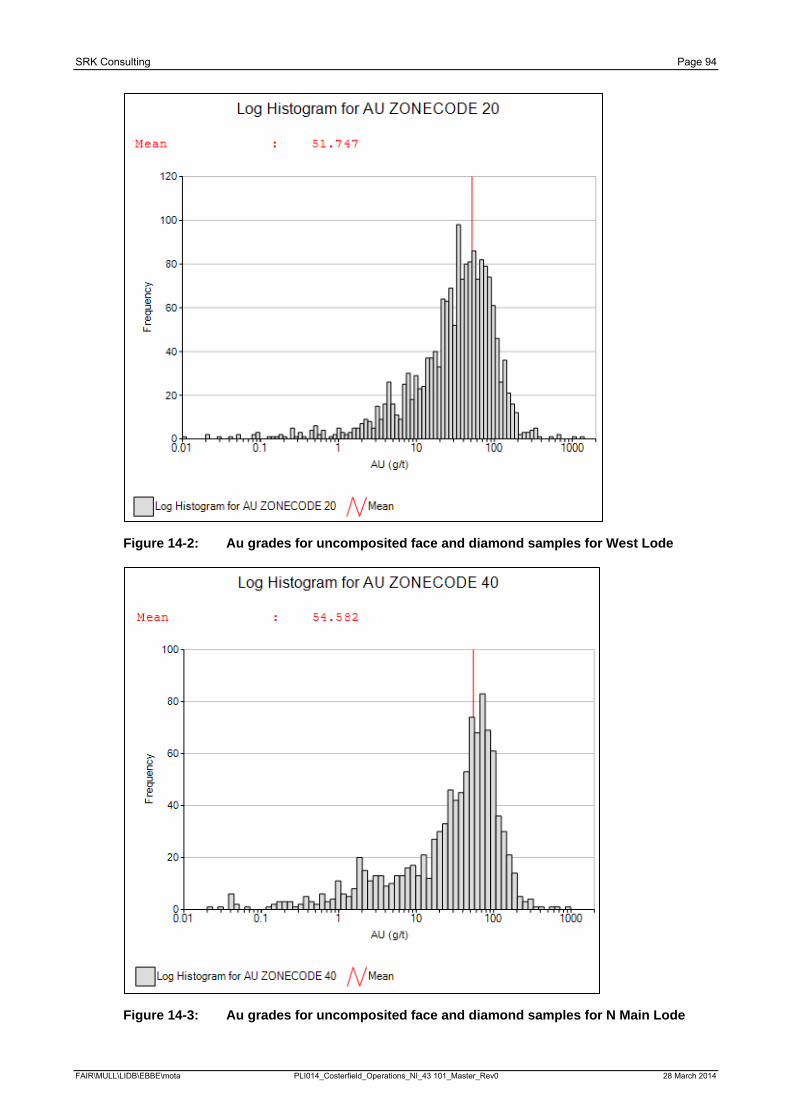
SRK Consulting Page 94
Figure 14-2: Au grades for uncomposited face and diamond samples for West Lode
Figure 14-3: Au grades for uncomposited face and diamond samples for N Main Lode
FAIR\MULL\LIDB\EBBE\mota PLI014_Costerfield_Operations_NI_43 101_Master_Rev0 28 March 2014
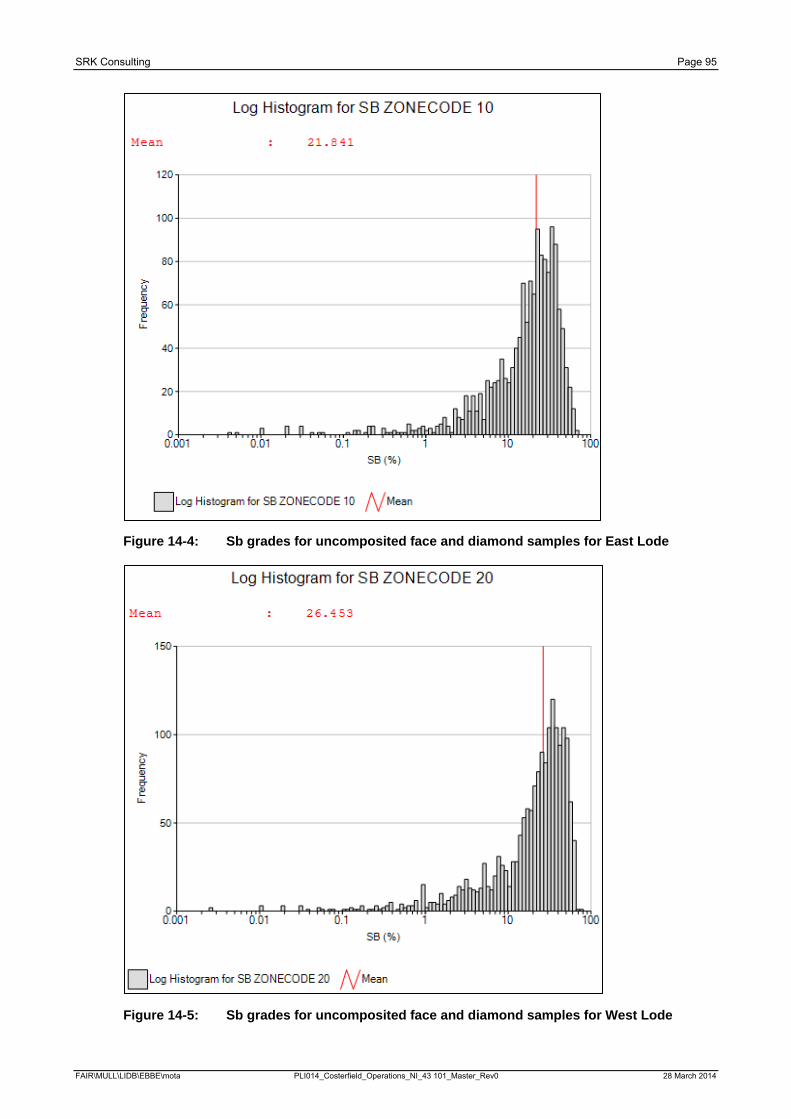
SRK Consulting Page 95
Figure 14-4: Sb grades for uncomposited face and diamond samples for East Lode
Figure 14-5: Sb grades for uncomposited face and diamond samples for West Lode
FAIR\MULL\LIDB\EBBE\mota PLI014_Costerfield_Operations_NI_43 101_Master_Rev0 28 March 2014
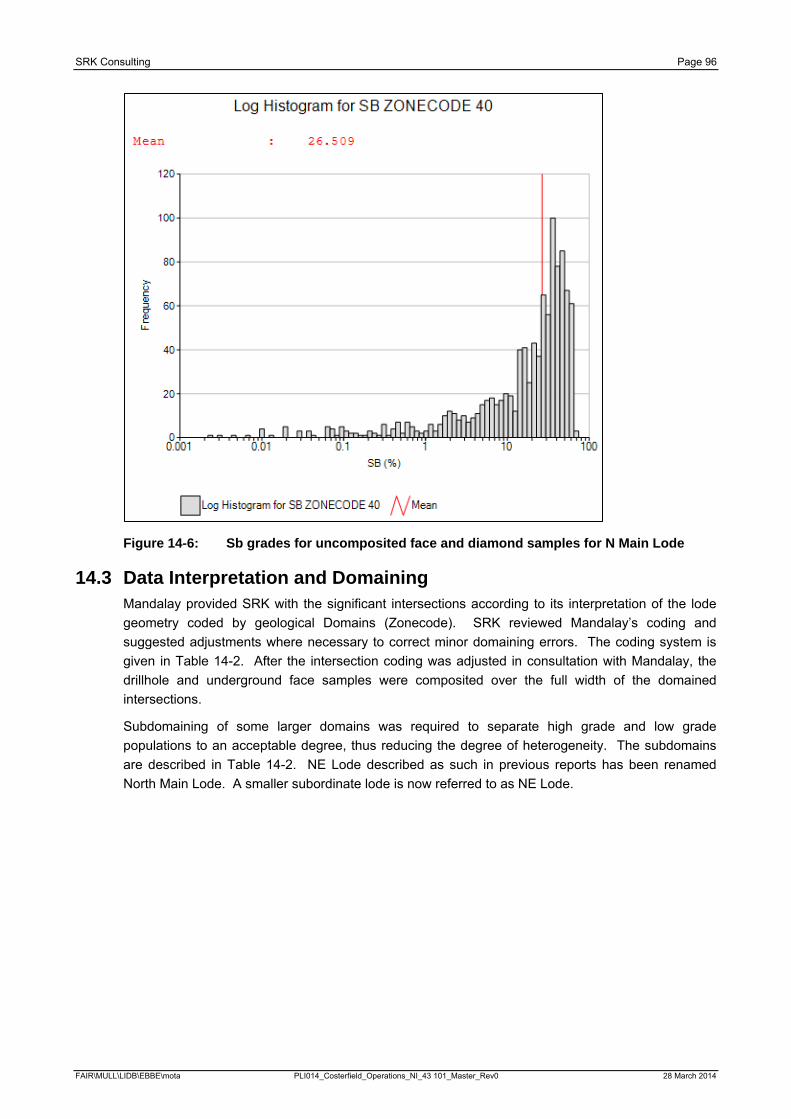
SRK Consulting Page 96
Figure 14-6: Sb grades for uncomposited face and diamond samples for N Main Lode
14.3 Data Interpretation and Domaining Mandalay provided SRK with the significant intersections according to its interpretation of the lode geometry coded by geological Domains (Zonecode). SRK reviewed Mandalay’s coding and suggested adjustments where necessary to correct minor domaining errors. The coding system is given in Table 14-2. After the intersection coding was adjusted in consultation with Mandalay, the drillhole and underground face samples were composited over the full width of the domained intersections.
Subdomaining of some larger domains was required to separate high grade and low grade populations to an acceptable degree, thus reducing the degree of heterogeneity. The subdomains are described in Table 14-2. NE Lode described as such in previous reports has been renamed North Main Lode. A smaller subordinate lode is now referred to as NE Lode.
FAIR\MULL\LIDB\EBBE\mota PLI014_Costerfield_Operations_NI_43 101_Master_Rev0 28 March 2014
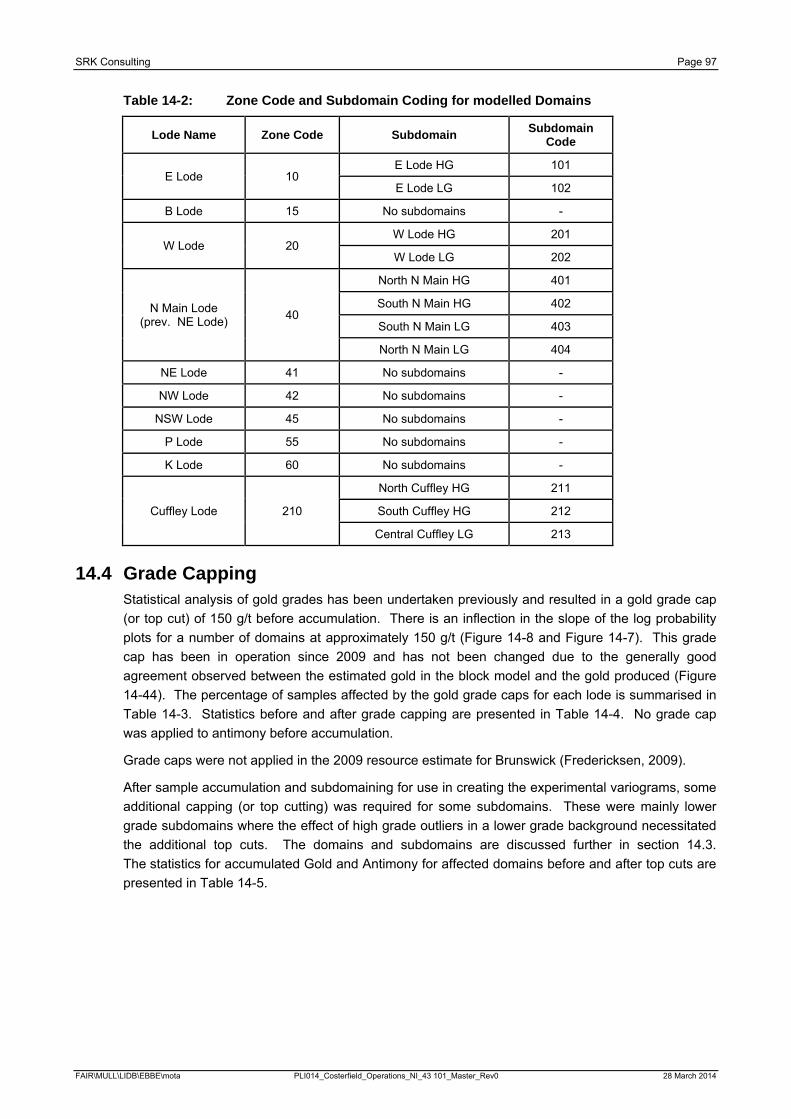
SRK Consulting Page 97
Table 14-2: Zone Code and Subdomain Coding for modelled Domains
Lode Name Zone Code Subdomain Subdomain Code
E Lode 10 E Lode HG 101
E Lode LG 102
B Lode 15 No subdomains -
W Lode 20 W Lode HG 201
W Lode LG 202
N Main Lode (prev. NE Lode) 40
North N Main HG 401
South N Main HG 402
South N Main LG 403
North N Main LG 404
NE Lode 41 No subdomains -
NW Lode 42 No subdomains -
NSW Lode 45 No subdomains -
P Lode 55 No subdomains -
K Lode 60 No subdomains -
Cuffley Lode 210
North Cuffley HG 211
South Cuffley HG 212
Central Cuffley LG 213
14.4 Grade Capping Statistical analysis of gold grades has been undertaken previously and resulted in a gold grade cap (or top cut) of 150 g/t before accumulation. There is an inflection in the slope of the log probability plots for a number of domains at approximately 150 g/t (Figure 14-8 and Figure 14-7). This grade cap has been in operation since 2009 and has not been changed due to the generally good agreement observed between the estimated gold in the block model and the gold produced (Figure 14-44). The percentage of samples affected by the gold grade caps for each lode is summarised in Table 14-3. Statistics before and after grade capping are presented in Table 14-4. No grade cap was applied to antimony before accumulation.
Grade caps were not applied in the 2009 resource estimate for Brunswick (Fredericksen, 2009).
After sample accumulation and subdomaining for use in creating the experimental variograms, some additional capping (or top cutting) was required for some subdomains. These were mainly lower grade subdomains where the effect of high grade outliers in a lower grade background necessitated the additional top cuts. The domains and subdomains are discussed further in section 14.3. The statistics for accumulated Gold and Antimony for affected domains before and after top cuts are presented in Table 14-5.
FAIR\MULL\LIDB\EBBE\mota PLI014_Costerfield_Operations_NI_43 101_Master_Rev0 28 March 2014
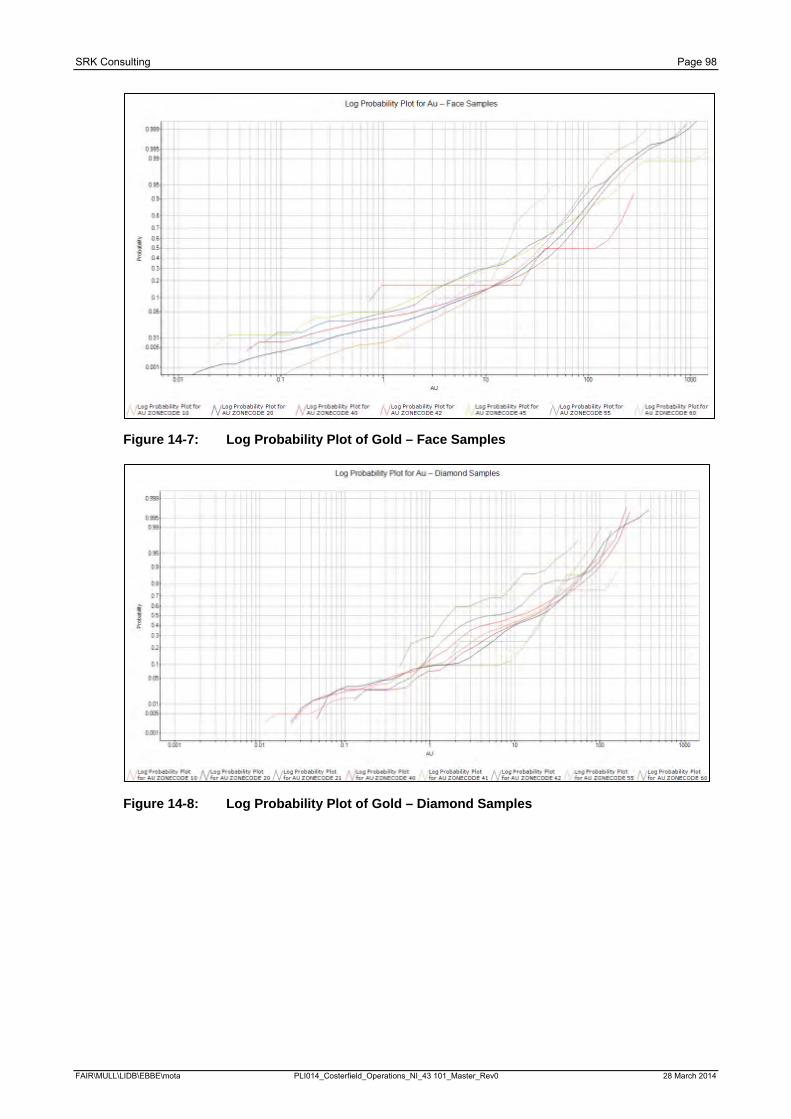
SRK Consulting Page 98
Figure 14-7: Log Probability Plot of Gold – Face Samples
Figure 14-8: Log Probability Plot of Gold – Diamond Samples
FAIR\MULL\LIDB\EBBE\mota PLI014_Costerfield_Operations_NI_43 101_Master_Rev0 28 March 2014
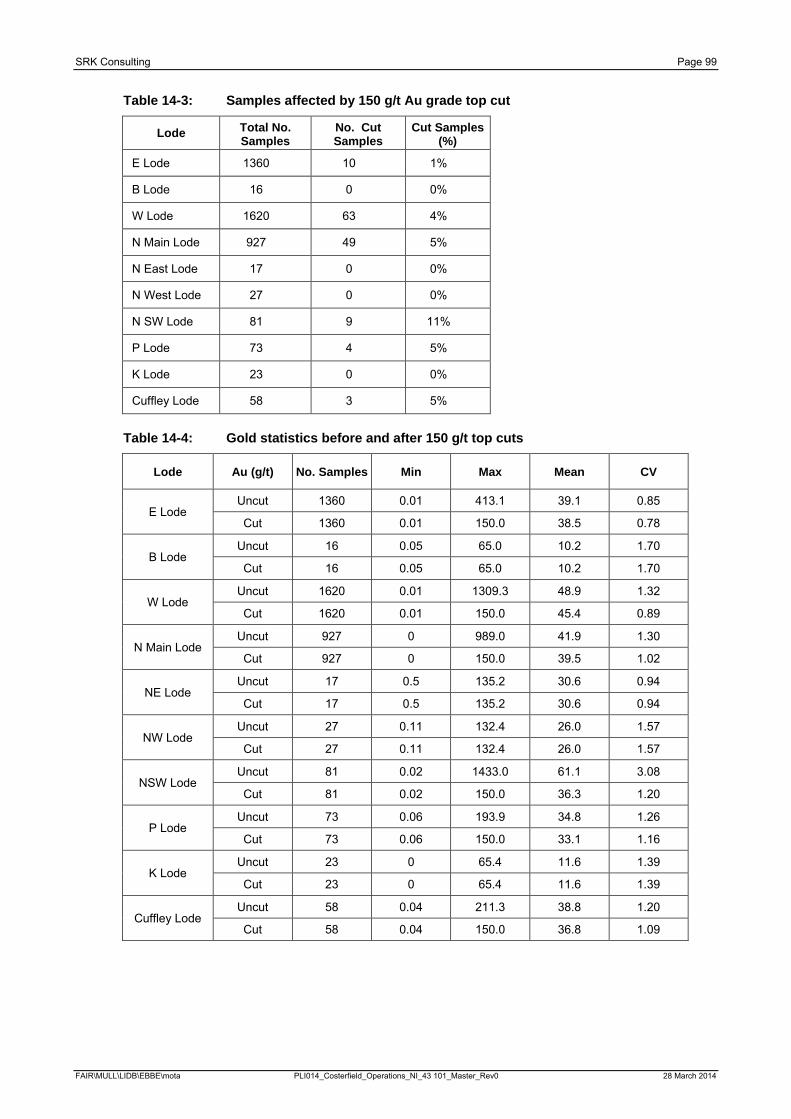
SRK Consulting Page 99
Table 14-3: Samples affected by 150 g/t Au grade top cut
Lode Total No. Samples
No. Cut Samples
Cut Samples (%)
E Lode 1360 10 1%
B Lode 16 0 0%
W Lode 1620 63 4%
N Main Lode 927 49 5%
N East Lode 17 0 0%
N West Lode 27 0 0%
N SW Lode 81 9 11%
P Lode 73 4 5%
K Lode 23 0 0%
Cuffley Lode 58 3 5%
Table 14-4: Gold statistics before and after 150 g/t top cuts
Lode Au (g/t) No. Samples Min Max Mean CV
E Lode Uncut 1360 0.01 413.1 39.1 0.85
Cut 1360 0.01 150.0 38.5 0.78
B Lode Uncut 16 0.05 65.0 10.2 1.70
Cut 16 0.05 65.0 10.2 1.70
W Lode Uncut 1620 0.01 1309.3 48.9 1.32
Cut 1620 0.01 150.0 45.4 0.89
N Main Lode Uncut 927 0 989.0 41.9 1.30
Cut 927 0 150.0 39.5 1.02
NE Lode Uncut 17 0.5 135.2 30.6 0.94
Cut 17 0.5 135.2 30.6 0.94
NW Lode Uncut 27 0.11 132.4 26.0 1.57
Cut 27 0.11 132.4 26.0 1.57
NSW Lode Uncut 81 0.02 1433.0 61.1 3.08
Cut 81 0.02 150.0 36.3 1.20
P Lode Uncut 73 0.06 193.9 34.8 1.26
Cut 73 0.06 150.0 33.1 1.16
K Lode Uncut 23 0 65.4 11.6 1.39
Cut 23 0 65.4 11.6 1.39
Cuffley Lode Uncut 58 0.04 211.3 38.8 1.20
Cut 58 0.04 150.0 36.8 1.09
FAIR\MULL\LIDB\EBBE\mota PLI014_Costerfield_Operations_NI_43 101_Master_Rev0 28 March 2014
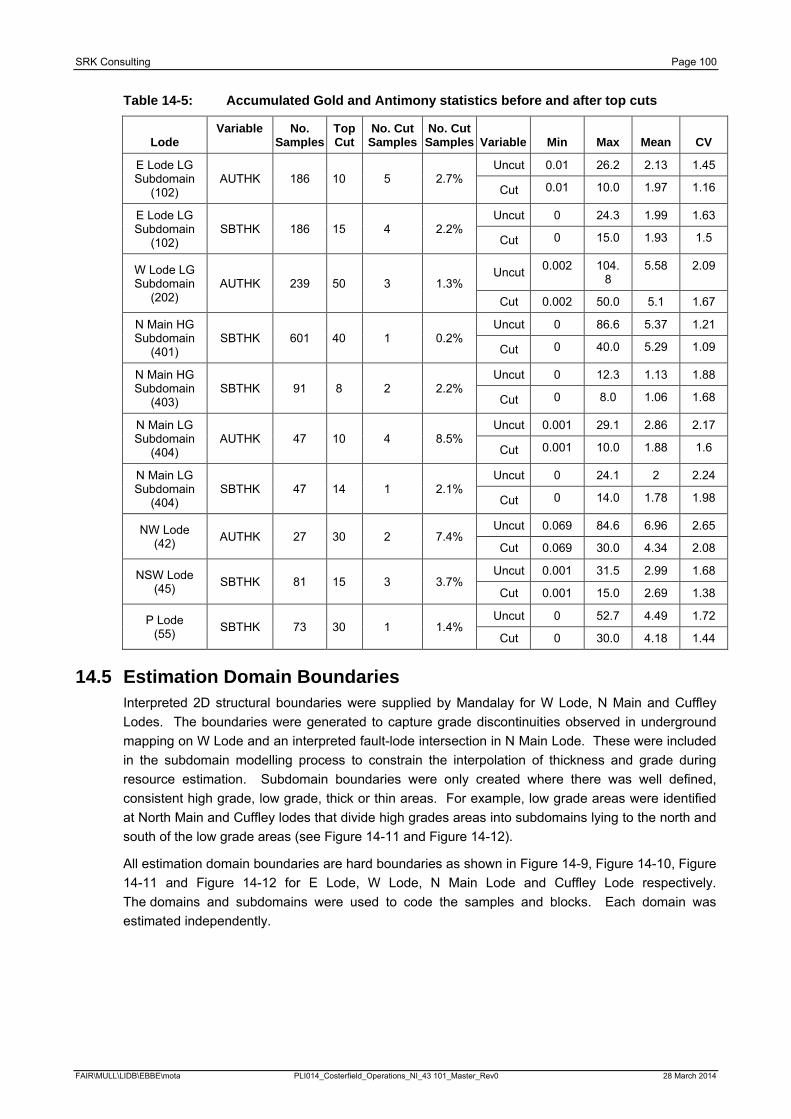
SRK Consulting Page 100
Table 14-5: Accumulated Gold and Antimony statistics before and after top cuts
Lode Variable No.
Samples Top Cut
No. Cut Samples
No. Cut Samples Variable Min Max Mean CV
E Lode LG Subdomain
(102) AUTHK 186 10 5 2.7%
Uncut 0.01 26.2 2.13 1.45
Cut 0.01 10.0 1.97 1.16
E Lode LG Subdomain
(102) SBTHK 186 15 4 2.2%
Uncut 0 24.3 1.99 1.63
Cut 0 15.0 1.93 1.5
W Lode LG Subdomain
(202) AUTHK 239 50 3 1.3%
Uncut 0.002 104.8
5.58 2.09
Cut 0.002 50.0 5.1 1.67
N Main HG Subdomain
(401) SBTHK 601 40 1 0.2%
Uncut 0 86.6 5.37 1.21
Cut 0 40.0 5.29 1.09
N Main HG Subdomain
(403) SBTHK 91 8 2 2.2%
Uncut 0 12.3 1.13 1.88
Cut 0 8.0 1.06 1.68
N Main LG Subdomain
(404) AUTHK 47 10 4 8.5%
Uncut 0.001 29.1 2.86 2.17
Cut 0.001 10.0 1.88 1.6
N Main LG Subdomain
(404) SBTHK 47 14 1 2.1%
Uncut 0 24.1 2 2.24
Cut 0 14.0 1.78 1.98
NW Lode (42) AUTHK 27 30 2 7.4%
Uncut 0.069 84.6 6.96 2.65
Cut 0.069 30.0 4.34 2.08
NSW Lode (45) SBTHK 81 15 3 3.7%
Uncut 0.001 31.5 2.99 1.68
Cut 0.001 15.0 2.69 1.38
P Lode (55) SBTHK 73 30 1 1.4%
Uncut 0 52.7 4.49 1.72
Cut 0 30.0 4.18 1.44
14.5 Estimation Domain Boundaries Interpreted 2D structural boundaries were supplied by Mandalay for W Lode, N Main and Cuffley Lodes. The boundaries were generated to capture grade discontinuities observed in underground mapping on W Lode and an interpreted fault-lode intersection in N Main Lode. These were included in the subdomain modelling process to constrain the interpolation of thickness and grade during resource estimation. Subdomain boundaries were only created where there was well defined, consistent high grade, low grade, thick or thin areas. For example, low grade areas were identified at North Main and Cuffley lodes that divide high grades areas into subdomains lying to the north and south of the low grade areas (see Figure 14-11 and Figure 14-12).
All estimation domain boundaries are hard boundaries as shown in Figure 14-9, Figure 14-10, Figure 14-11 and Figure 14-12 for E Lode, W Lode, N Main Lode and Cuffley Lode respectively. The domains and subdomains were used to code the samples and blocks. Each domain was estimated independently.
FAIR\MULL\LIDB\EBBE\mota PLI014_Costerfield_Operations_NI_43 101_Master_Rev0 28 March 2014
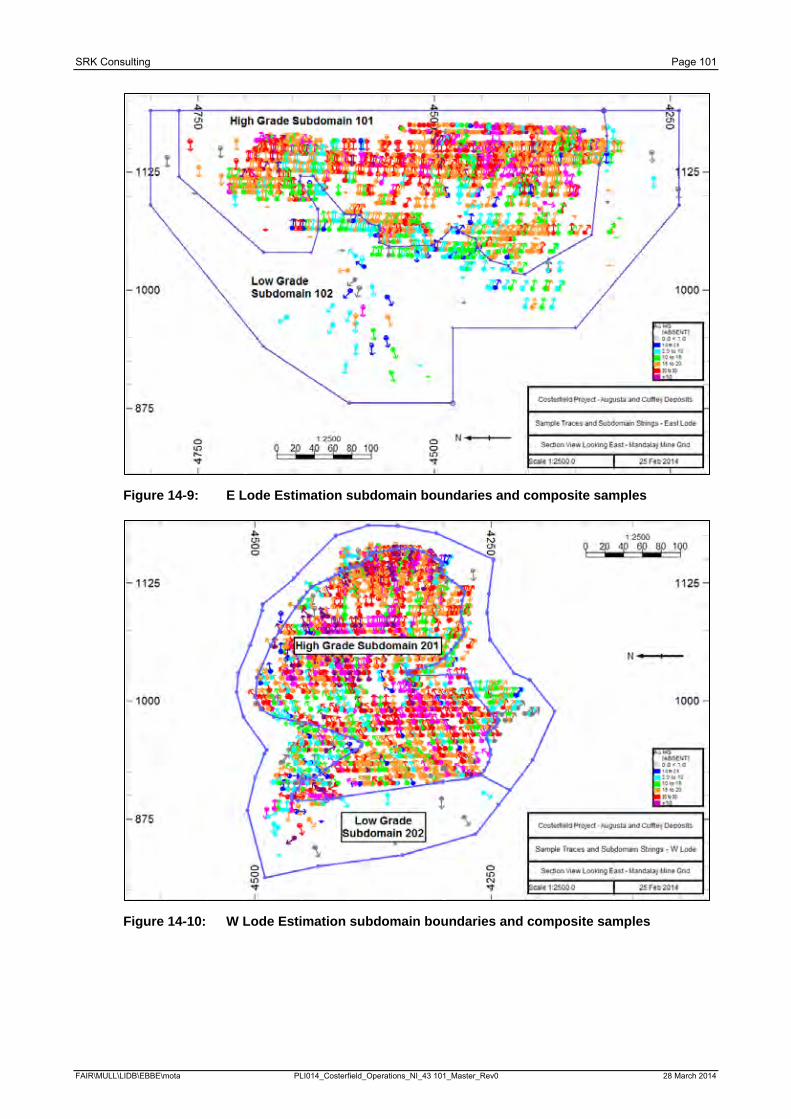
SRK Consulting Page 101
Figure 14-9: E Lode Estimation subdomain boundaries and composite samples
Figure 14-10: W Lode Estimation subdomain boundaries and composite samples
FAIR\MULL\LIDB\EBBE\mota PLI014_Costerfield_Operations_NI_43 101_Master_Rev0 28 March 2014
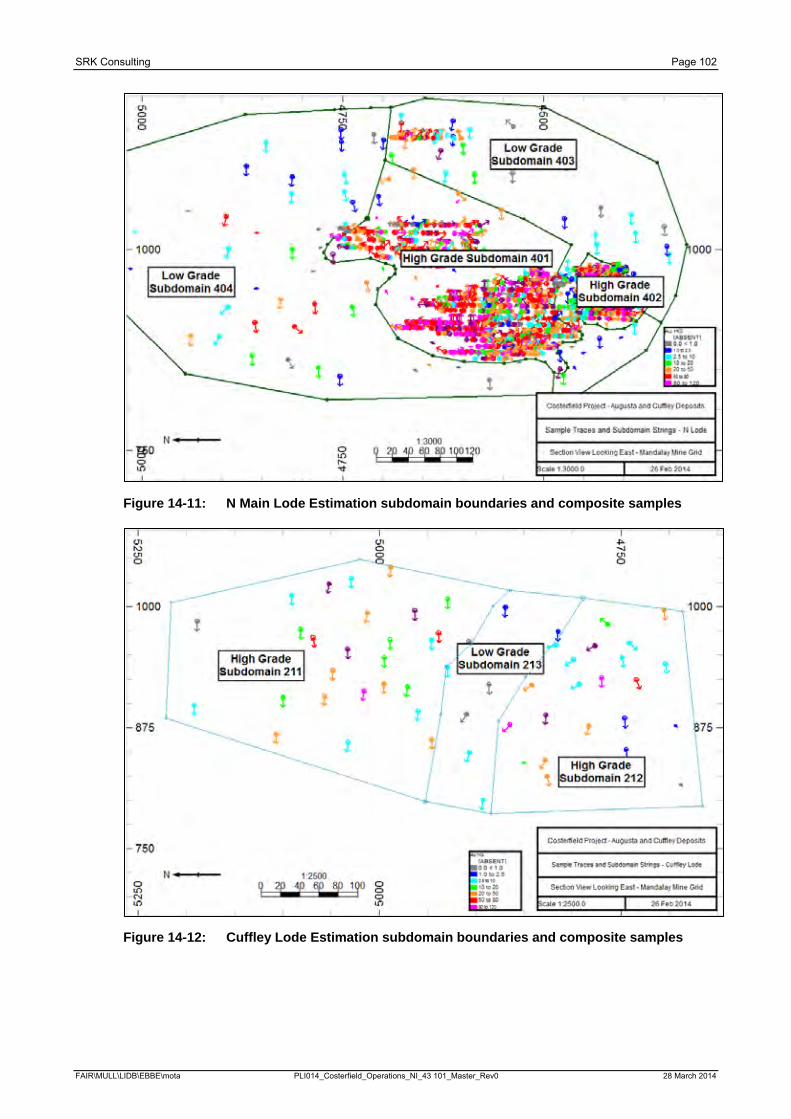
SRK Consulting Page 102
Figure 14-11: N Main Lode Estimation subdomain boundaries and composite samples
Figure 14-12: Cuffley Lode Estimation subdomain boundaries and composite samples
FAIR\MULL\LIDB\EBBE\mota PLI014_Costerfield_Operations_NI_43 101_Master_Rev0 28 March 2014
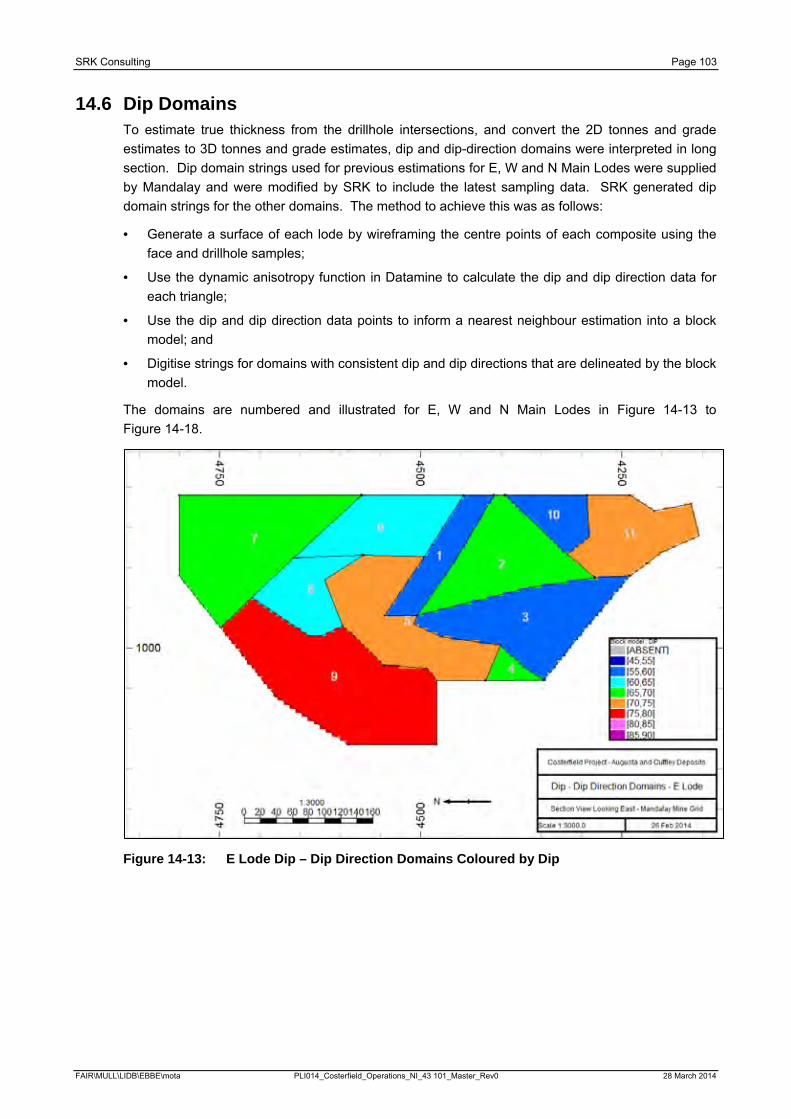
SRK Consulting Page 103
14.6 Dip Domains To estimate true thickness from the drillhole intersections, and convert the 2D tonnes and grade estimates to 3D tonnes and grade estimates, dip and dip-direction domains were interpreted in long section. Dip domain strings used for previous estimations for E, W and N Main Lodes were supplied by Mandalay and were modified by SRK to include the latest sampling data. SRK generated dip domain strings for the other domains. The method to achieve this was as follows:
· Generate a surface of each lode by wireframing the centre points of each composite using the face and drillhole samples;
· Use the dynamic anisotropy function in Datamine to calculate the dip and dip direction data for each triangle;
· Use the dip and dip direction data points to inform a nearest neighbour estimation into a block model; and
· Digitise strings for domains with consistent dip and dip directions that are delineated by the block model.
The domains are numbered and illustrated for E, W and N Main Lodes in Figure 14-13 to Figure 14-18.
Figure 14-13: E Lode Dip – Dip Direction Domains Coloured by Dip
FAIR\MULL\LIDB\EBBE\mota PLI014_Costerfield_Operations_NI_43 101_Master_Rev0 28 March 2014
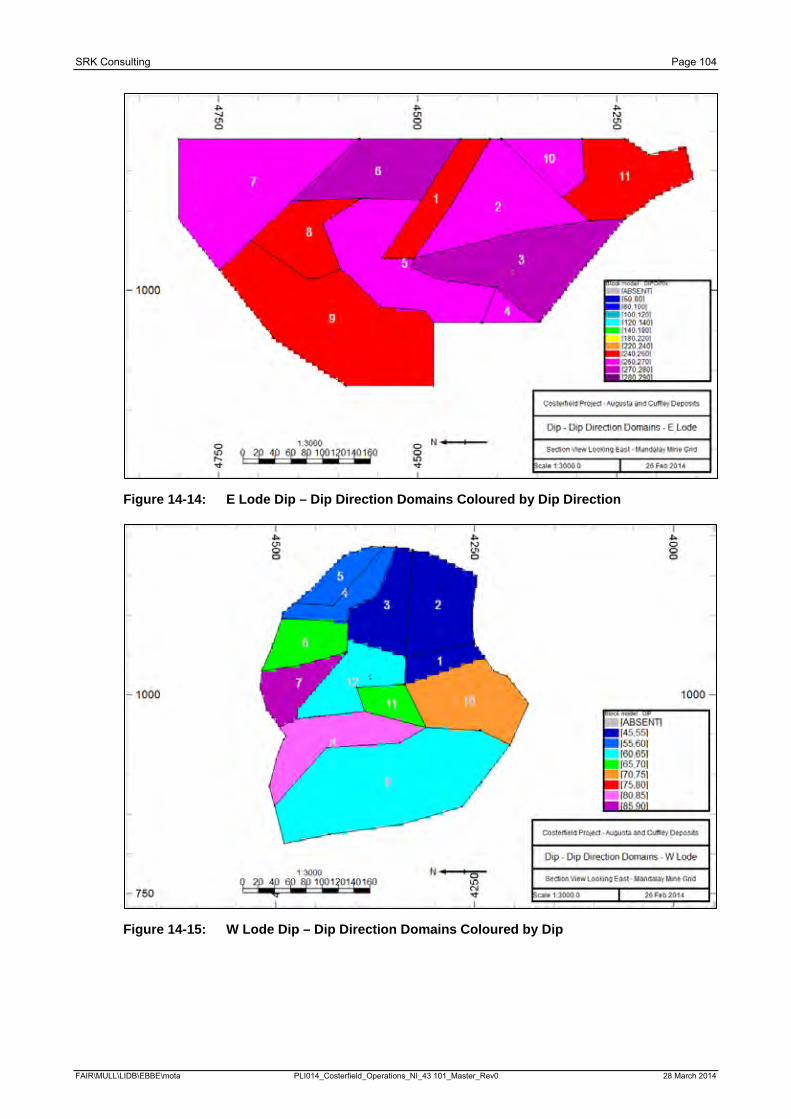
SRK Consulting Page 104
Figure 14-14: E Lode Dip – Dip Direction Domains Coloured by Dip Direction
Figure 14-15: W Lode Dip – Dip Direction Domains Coloured by Dip
FAIR\MULL\LIDB\EBBE\mota PLI014_Costerfield_Operations_NI_43 101_Master_Rev0 28 March 2014
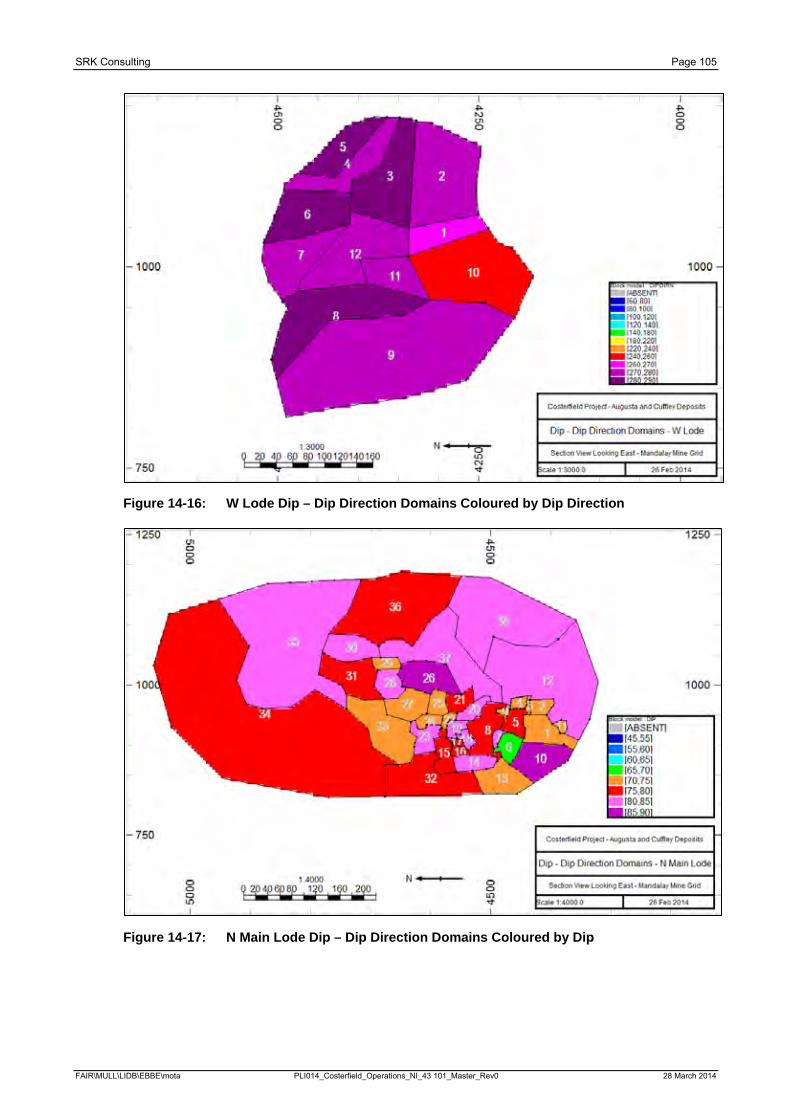
SRK Consulting Page 105
Figure 14-16: W Lode Dip – Dip Direction Domains Coloured by Dip Direction
Figure 14-17: N Main Lode Dip – Dip Direction Domains Coloured by Dip
FAIR\MULL\LIDB\EBBE\mota PLI014_Costerfield_Operations_NI_43 101_Master_Rev0 28 March 2014
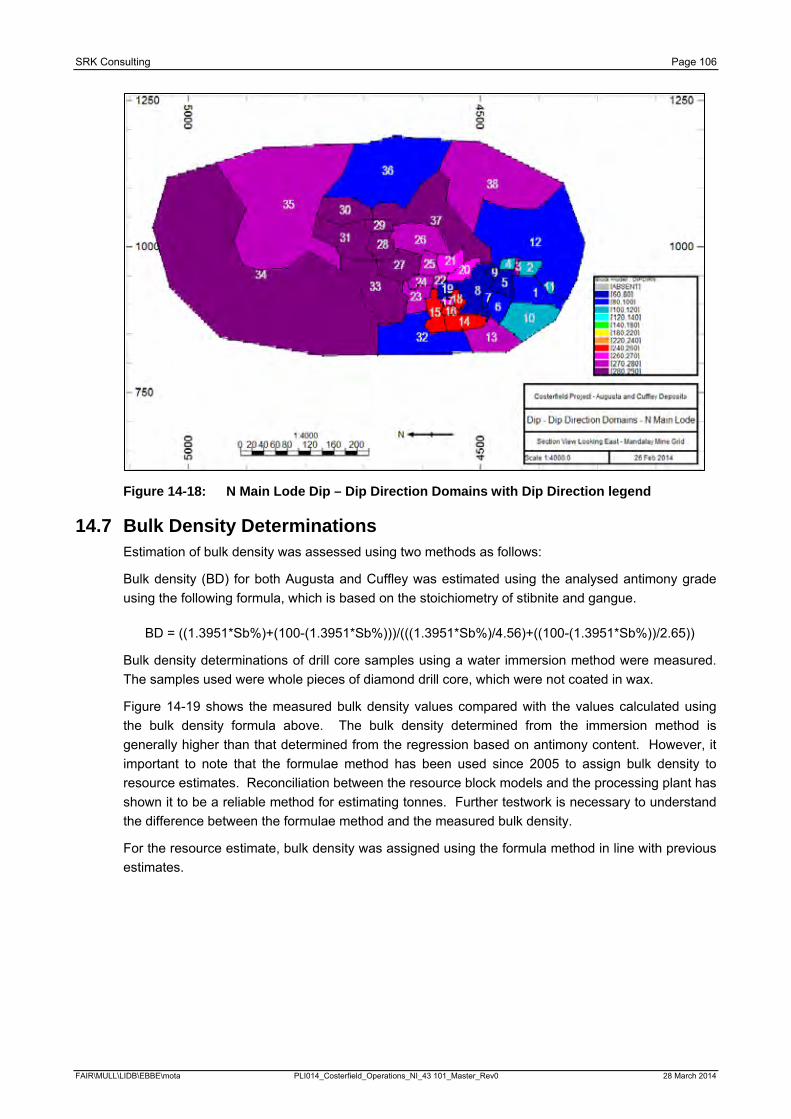
SRK Consulting Page 106
Figure 14-18: N Main Lode Dip – Dip Direction Domains with Dip Direction legend
14.7 Bulk Density Determinations Estimation of bulk density was assessed using two methods as follows:
Bulk density (BD) for both Augusta and Cuffley was estimated using the analysed antimony grade using the following formula, which is based on the stoichiometry of stibnite and gangue.
BD = ((1.3951*Sb%)+(100-(1.3951*Sb%)))/(((1.3951*Sb%)/4.56)+((100-(1.3951*Sb%))/2.65))
Bulk density determinations of drill core samples using a water immersion method were measured. The samples used were whole pieces of diamond drill core, which were not coated in wax.
Figure 14-19 shows the measured bulk density values compared with the values calculated using the bulk density formula above. The bulk density determined from the immersion method is generally higher than that determined from the regression based on antimony content. However, it important to note that the formulae method has been used since 2005 to assign bulk density to resource estimates. Reconciliation between the resource block models and the processing plant has shown it to be a reliable method for estimating tonnes. Further testwork is necessary to understand the difference between the formulae method and the measured bulk density.
For the resource estimate, bulk density was assigned using the formula method in line with previous estimates.
FAIR\MULL\LIDB\EBBE\mota PLI014_Costerfield_Operations_NI_43 101_Master_Rev0 28 March 2014
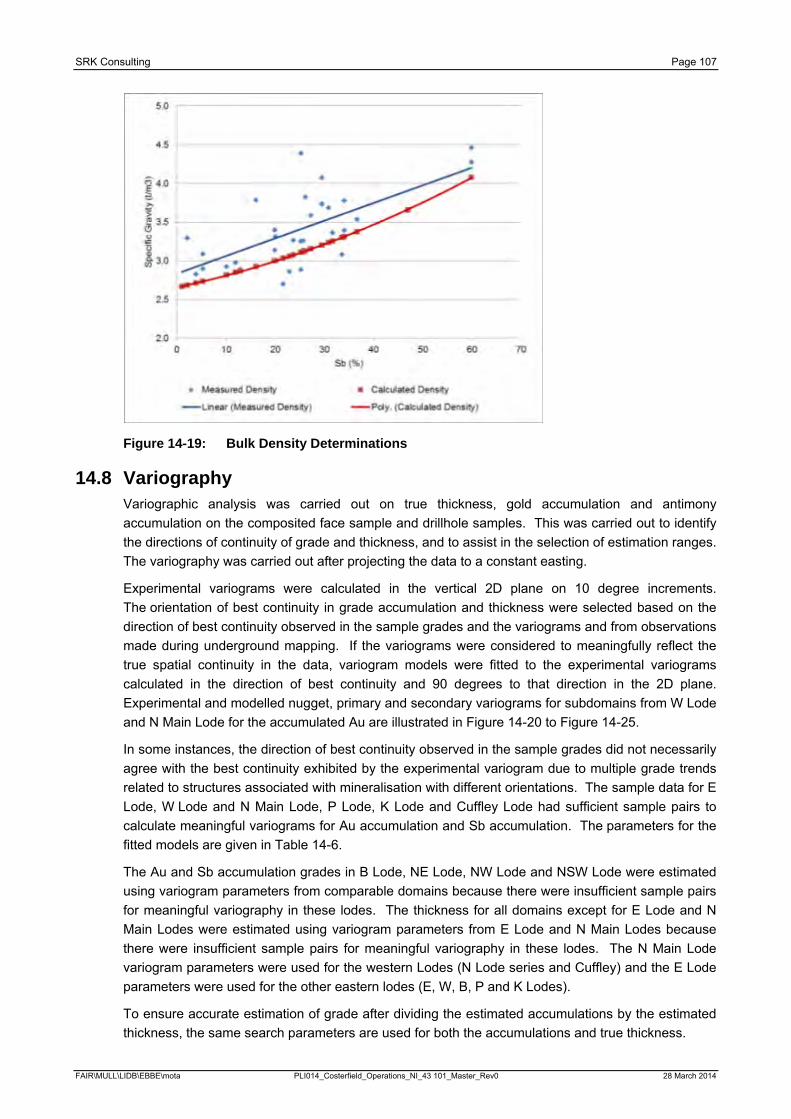
SRK Consulting Page 107
Figure 14-19: Bulk Density Determinations
14.8 Variography Variographic analysis was carried out on true thickness, gold accumulation and antimony accumulation on the composited face sample and drillhole samples. This was carried out to identify the directions of continuity of grade and thickness, and to assist in the selection of estimation ranges. The variography was carried out after projecting the data to a constant easting.
Experimental variograms were calculated in the vertical 2D plane on 10 degree increments. The orientation of best continuity in grade accumulation and thickness were selected based on the direction of best continuity observed in the sample grades and the variograms and from observations made during underground mapping. If the variograms were considered to meaningfully reflect the true spatial continuity in the data, variogram models were fitted to the experimental variograms calculated in the direction of best continuity and 90 degrees to that direction in the 2D plane. Experimental and modelled nugget, primary and secondary variograms for subdomains from W Lode and N Main Lode for the accumulated Au are illustrated in Figure 14-20 to Figure 14-25.
In some instances, the direction of best continuity observed in the sample grades did not necessarily agree with the best continuity exhibited by the experimental variogram due to multiple grade trends related to structures associated with mineralisation with different orientations. The sample data for E Lode, W Lode and N Main Lode, P Lode, K Lode and Cuffley Lode had sufficient sample pairs to calculate meaningful variograms for Au accumulation and Sb accumulation. The parameters for the fitted models are given in Table 14-6.
The Au and Sb accumulation grades in B Lode, NE Lode, NW Lode and NSW Lode were estimated using variogram parameters from comparable domains because there were insufficient sample pairs for meaningful variography in these lodes. The thickness for all domains except for E Lode and N Main Lodes were estimated using variogram parameters from E Lode and N Main Lodes because there were insufficient sample pairs for meaningful variography in these lodes. The N Main Lode variogram parameters were used for the western Lodes (N Lode series and Cuffley) and the E Lode parameters were used for the other eastern lodes (E, W, B, P and K Lodes).
To ensure accurate estimation of grade after dividing the estimated accumulations by the estimated thickness, the same search parameters are used for both the accumulations and true thickness.
FAIR\MULL\LIDB\EBBE\mota PLI014_Costerfield_Operations_NI_43 101_Master_Rev0 28 March 2014
SRK Consulting Page 108
14.9 Estimation Parameters True thickness, gold accumulation, and antimony accumulation were estimated in the 2D vertical plane using ordinary kriging for all domains. Search ellipsoids were orthogonal to the 2D block model orientation. The following summarises the resource estimation process:
· Drillhole and face samples were projected into the plane of the estimate at 15,400 mE;
· The orientation of the long axis of the search ellipsoid for each lode matched the maximum continuity observed in the variography;
· The anisotropy of the search ellipsoid for each lode was guided by the anisotropy observed in the grade distribution;
The search parameters for the first estimation run are listed in Table 14-7. For the E, W and N Main Lodes, four separate estimates were made using channel (face) samples and drillhole samples combined, with octants on for the first pass, then with octants off for unestimated blocks on the second pass. Each estimate involved three search passes with increasing search ellipse diameters on the second and third pass, as listed in Table 14-7.
For the other lodes, only one estimate was made using combined drillhole samples and any face samples in a single estimation run using three search passes with no octant search.
Discretization was set to 4 by 4 in the Y and Z directions.
After estimation, the results of the face sample estimates for the E, W and N Main Lodes were overprinted on the drillhole sample estimate for each lode, applying a prioritisation to the face sampling data, as done in previous estimates. Lode volumes were estimated for each block by applying dip and dip direction corrections to take account of the estimate being run in a 2D plane. Lode tonnes were estimated for each block by applying the formula specified in Section 14.7.
The resource was based on a minimum true lode width of 1.2 m, which is the practical minimum mining width applied at the Augusta Mine. For blocks with widths less than 1.2 m, diluted grades were estimated by adding a waste envelope with zero grade and 2.65 t/m3 bulk density to the lode. This minimum mining width has been reduced from 1.8 m for previous estimates following a review of the mining parameters.
FAIR\MULL\LIDB\EBBE\mota PLI014_Costerfield_Operations_NI_43 101_Master_Rev0 28 March 2014
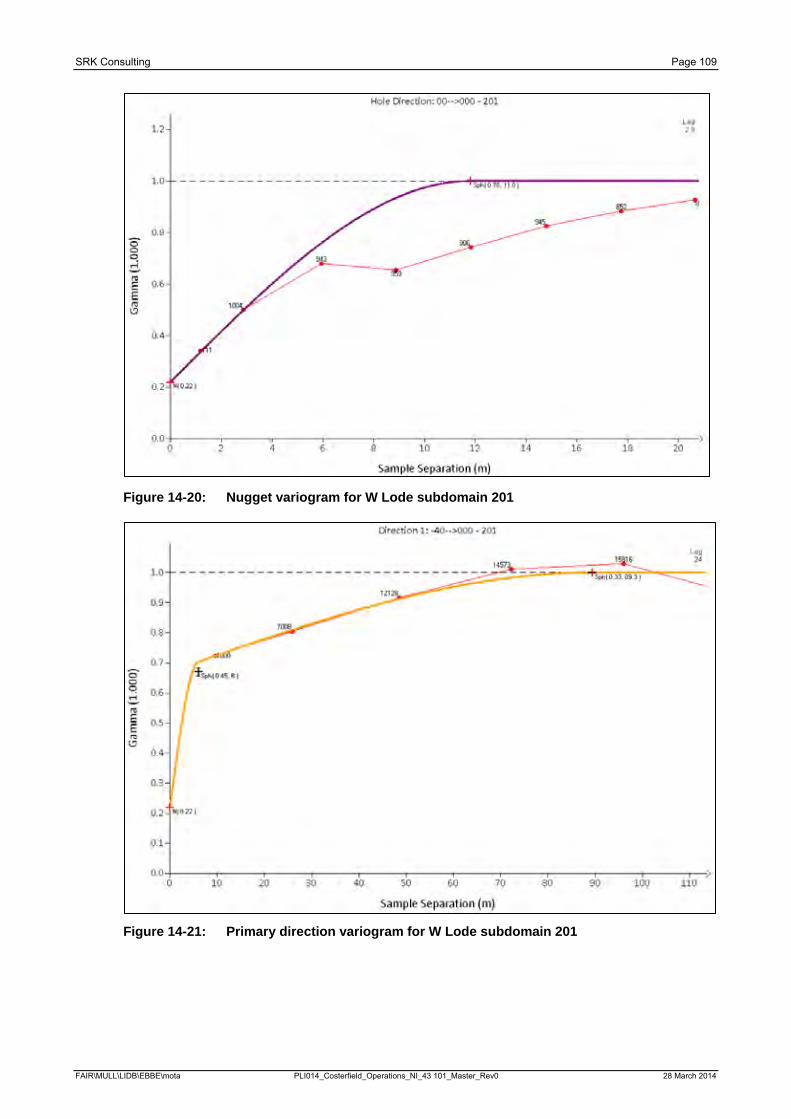
SRK Consulting Page 109
Figure 14-20: Nugget variogram for W Lode subdomain 201
Figure 14-21: Primary direction variogram for W Lode subdomain 201
FAIR\MULL\LIDB\EBBE\mota PLI014_Costerfield_Operations_NI_43 101_Master_Rev0 28 March 2014
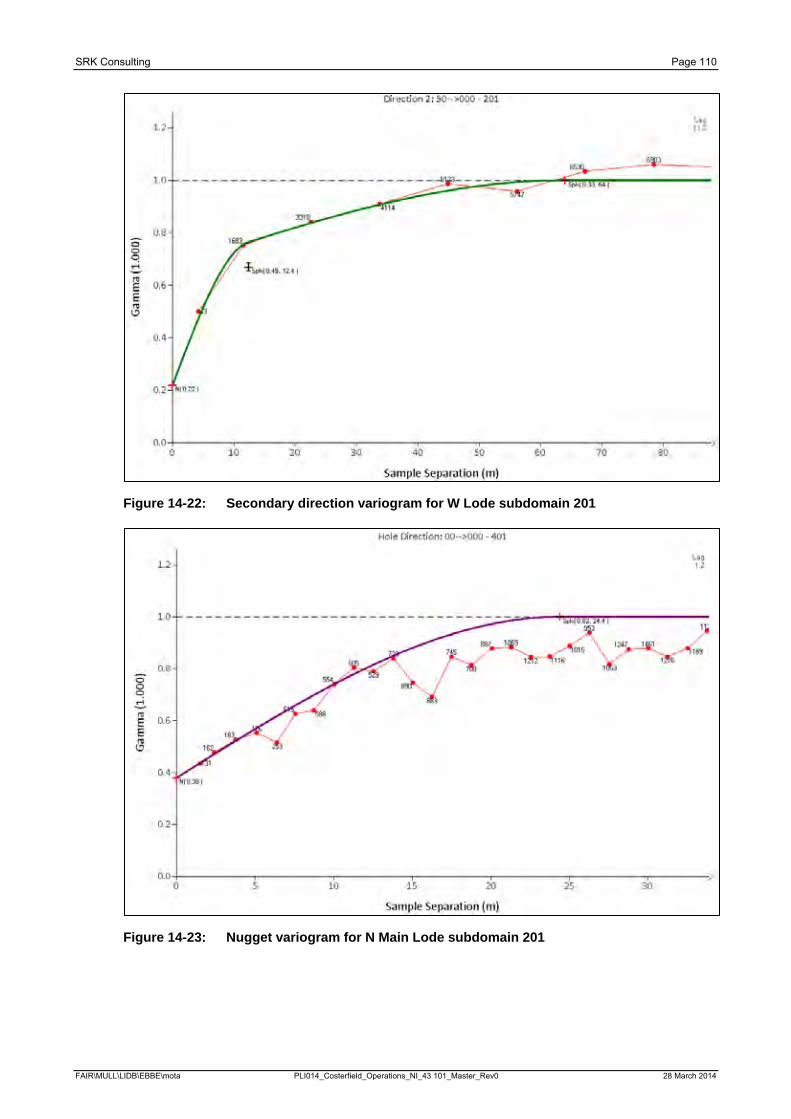
SRK Consulting Page 110
Figure 14-22: Secondary direction variogram for W Lode subdomain 201
Figure 14-23: Nugget variogram for N Main Lode subdomain 201
FAIR\MULL\LIDB\EBBE\mota PLI014_Costerfield_Operations_NI_43 101_Master_Rev0 28 March 2014
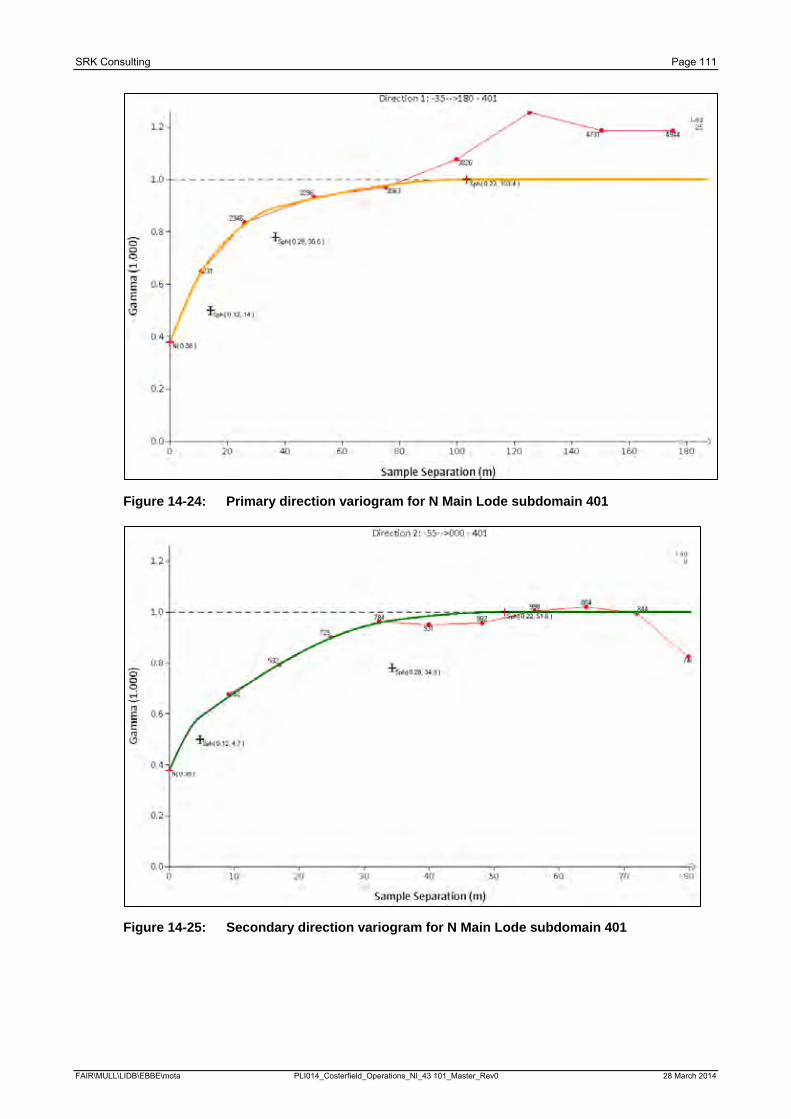
SRK Consulting Page 111
Figure 14-24: Primary direction variogram for N Main Lode subdomain 401
Figure 14-25: Secondary direction variogram for N Main Lode subdomain 401
FAIR\MULL\LIDB\EBBE\mota PLI014_Costerfield_Operations_NI_43 101_Master_Rev0 28 March 2014
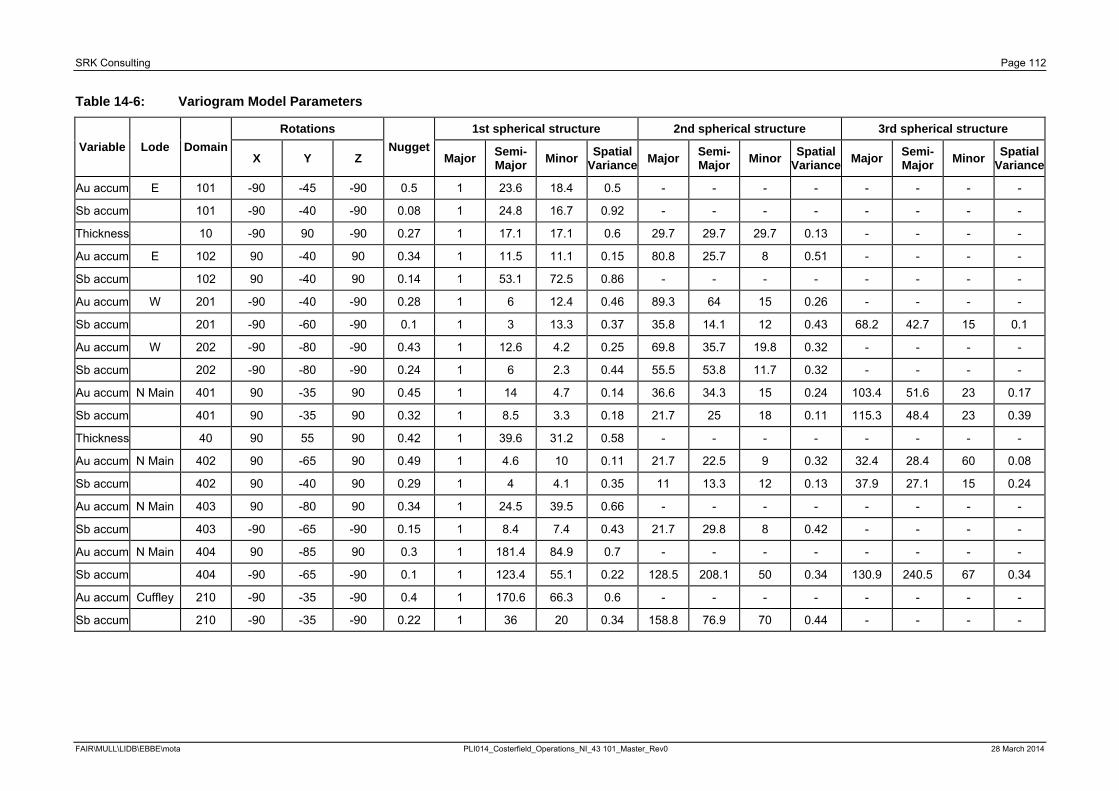
SRK Consulting Page 112
Table 14-6: Variogram Model Parameters
Variable Lode Domain Rotations
Nugget 1st spherical structure 2nd spherical structure 3rd spherical structure
X Y Z Major Semi-Major Minor Spatial
Variance Major Semi-Major Minor Spatial
Variance Major Semi-Major Minor Spatial
Variance
Au accum E 101 -90 -45 -90 0.5 1 23.6 18.4 0.5 - - - - - - - -
Sb accum 101 -90 -40 -90 0.08 1 24.8 16.7 0.92 - - - - - - - -
Thickness 10 -90 90 -90 0.27 1 17.1 17.1 0.6 29.7 29.7 29.7 0.13 - - - -
Au accum E 102 90 -40 90 0.34 1 11.5 11.1 0.15 80.8 25.7 8 0.51 - - - -
Sb accum 102 90 -40 90 0.14 1 53.1 72.5 0.86 - - - - - - - -
Au accum W 201 -90 -40 -90 0.28 1 6 12.4 0.46 89.3 64 15 0.26 - - - -
Sb accum 201 -90 -60 -90 0.1 1 3 13.3 0.37 35.8 14.1 12 0.43 68.2 42.7 15 0.1
Au accum W 202 -90 -80 -90 0.43 1 12.6 4.2 0.25 69.8 35.7 19.8 0.32 - - - -
Sb accum 202 -90 -80 -90 0.24 1 6 2.3 0.44 55.5 53.8 11.7 0.32 - - - -
Au accum N Main 401 90 -35 90 0.45 1 14 4.7 0.14 36.6 34.3 15 0.24 103.4 51.6 23 0.17
Sb accum 401 90 -35 90 0.32 1 8.5 3.3 0.18 21.7 25 18 0.11 115.3 48.4 23 0.39
Thickness 40 90 55 90 0.42 1 39.6 31.2 0.58 - - - - - - - -
Au accum N Main 402 90 -65 90 0.49 1 4.6 10 0.11 21.7 22.5 9 0.32 32.4 28.4 60 0.08
Sb accum 402 90 -40 90 0.29 1 4 4.1 0.35 11 13.3 12 0.13 37.9 27.1 15 0.24
Au accum N Main 403 90 -80 90 0.34 1 24.5 39.5 0.66 - - - - - - - -
Sb accum 403 -90 -65 -90 0.15 1 8.4 7.4 0.43 21.7 29.8 8 0.42 - - - -
Au accum N Main 404 90 -85 90 0.3 1 181.4 84.9 0.7 - - - - - - - -
Sb accum 404 -90 -65 -90 0.1 1 123.4 55.1 0.22 128.5 208.1 50 0.34 130.9 240.5 67 0.34
Au accum Cuffley 210 -90 -35 -90 0.4 1 170.6 66.3 0.6 - - - - - - - -
Sb accum 210 -90 -35 -90 0.22 1 36 20 0.34 158.8 76.9 70 0.44 - - - -
FAIR\MULL\LIDB\EBBE\mota PLI014_Costerfield_Operations_NI_43 101_Master_Rev0 28 March 2014
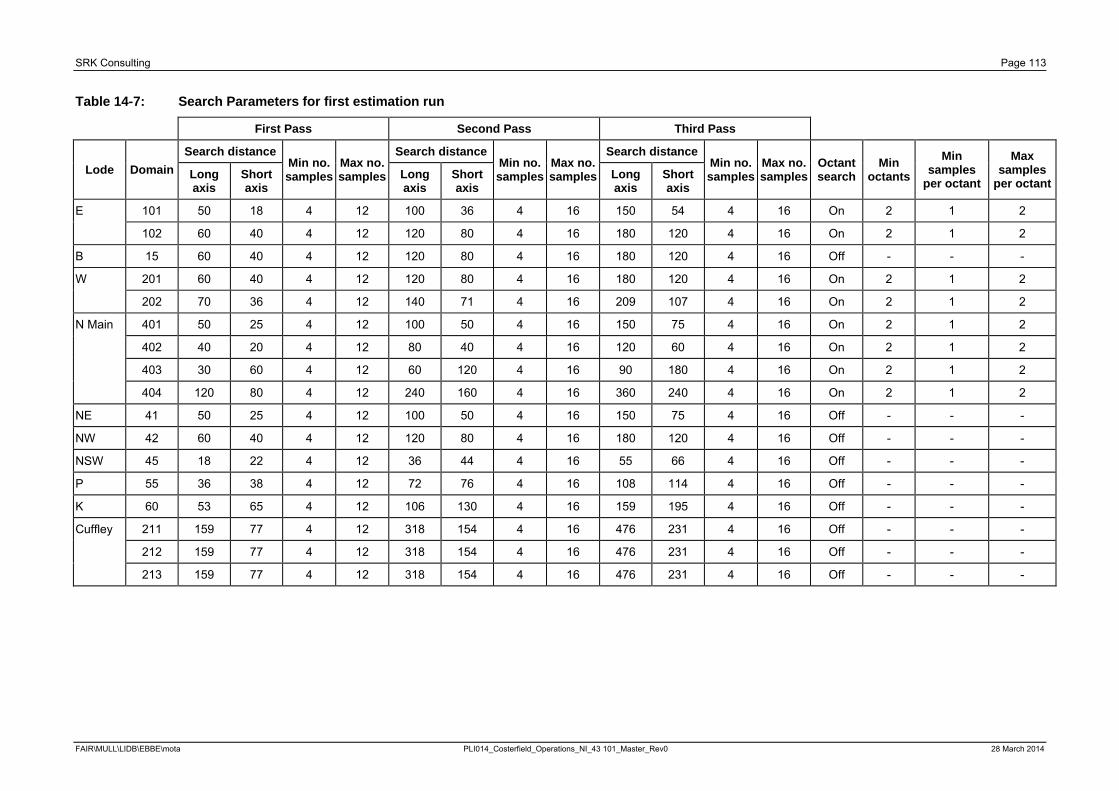
SRK Consulting Page 113
Table 14-7: Search Parameters for first estimation run
First Pass Second Pass Third Pass
Lode Domain Search distance
Min no. samples
Max no. samples
Search distance Min no. samples
Max no. samples
Search distance Min no. samples
Max no. samples
Octant search
Min octants
Min samples
per octant
Max samples
per octant Long axis
Short axis
Long axis
Short axis
Long axis
Short axis
E 101 50 18 4 12 100 36 4 16 150 54 4 16 On 2 1 2
102 60 40 4 12 120 80 4 16 180 120 4 16 On 2 1 2
B 15 60 40 4 12 120 80 4 16 180 120 4 16 Off - - -
W 201 60 40 4 12 120 80 4 16 180 120 4 16 On 2 1 2
202 70 36 4 12 140 71 4 16 209 107 4 16 On 2 1 2
N Main 401 50 25 4 12 100 50 4 16 150 75 4 16 On 2 1 2
402 40 20 4 12 80 40 4 16 120 60 4 16 On 2 1 2
403 30 60 4 12 60 120 4 16 90 180 4 16 On 2 1 2
404 120 80 4 12 240 160 4 16 360 240 4 16 On 2 1 2
NE 41 50 25 4 12 100 50 4 16 150 75 4 16 Off - - -
NW 42 60 40 4 12 120 80 4 16 180 120 4 16 Off - - -
NSW 45 18 22 4 12 36 44 4 16 55 66 4 16 Off - - -
P 55 36 38 4 12 72 76 4 16 108 114 4 16 Off - - -
K 60 53 65 4 12 106 130 4 16 159 195 4 16 Off - - -
Cuffley 211 159 77 4 12 318 154 4 16 476 231 4 16 Off - - -
212 159 77 4 12 318 154 4 16 476 231 4 16 Off - - -
213 159 77 4 12 318 154 4 16 476 231 4 16 Off - - -
FAIR\MULL\LIDB\EBBE\mota PLI014_Costerfield_Operations_NI_43 101_Master_Rev0 28 March 2014
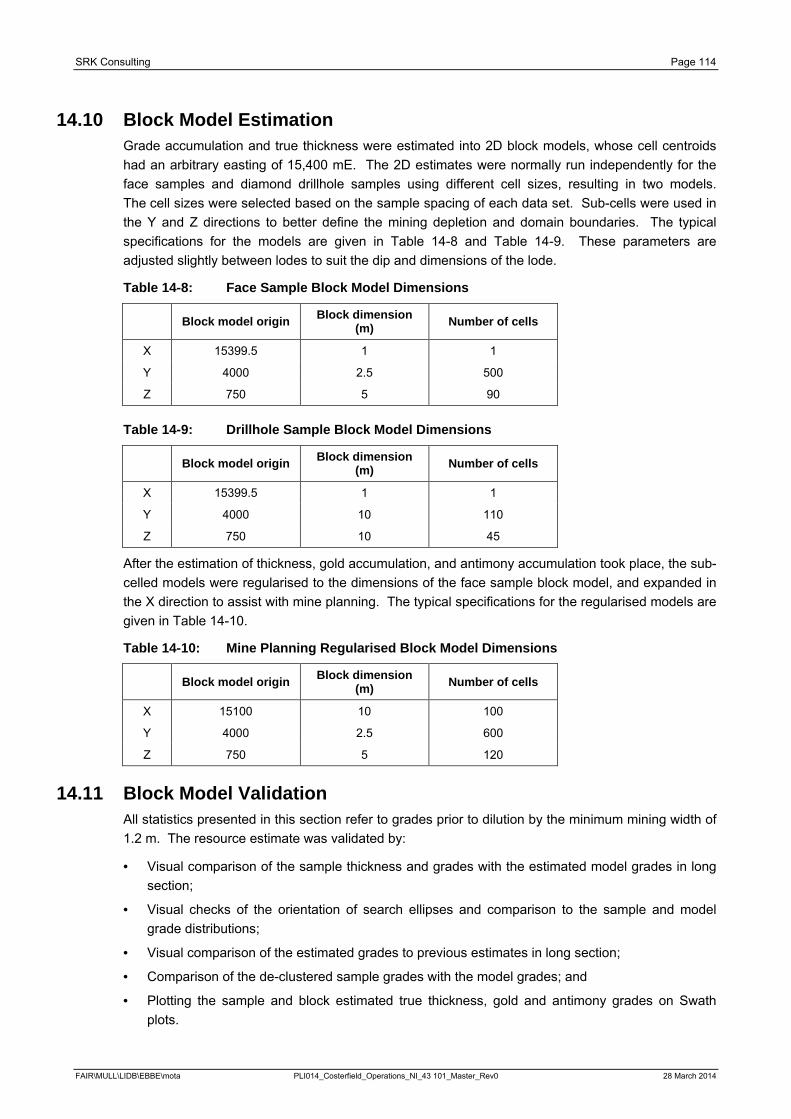
SRK Consulting Page 114
14.10 Block Model Estimation Grade accumulation and true thickness were estimated into 2D block models, whose cell centroids had an arbitrary easting of 15,400 mE. The 2D estimates were normally run independently for the face samples and diamond drillhole samples using different cell sizes, resulting in two models. The cell sizes were selected based on the sample spacing of each data set. Sub-cells were used in the Y and Z directions to better define the mining depletion and domain boundaries. The typical specifications for the models are given in Table 14-8 and Table 14-9. These parameters are adjusted slightly between lodes to suit the dip and dimensions of the lode.
Table 14-8: Face Sample Block Model Dimensions
Block model origin Block dimension (m) Number of cells
X 15399.5 1 1
Y 4000 2.5 500
Z 750 5 90
Table 14-9: Drillhole Sample Block Model Dimensions
Block model origin Block dimension (m) Number of cells
X 15399.5 1 1
Y 4000 10 110
Z 750 10 45
After the estimation of thickness, gold accumulation, and antimony accumulation took place, the sub-celled models were regularised to the dimensions of the face sample block model, and expanded in the X direction to assist with mine planning. The typical specifications for the regularised models are given in Table 14-10.
Table 14-10: Mine Planning Regularised Block Model Dimensions
Block model origin Block dimension (m) Number of cells
X 15100 10 100
Y 4000 2.5 600
Z 750 5 120
14.11 Block Model Validation All statistics presented in this section refer to grades prior to dilution by the minimum mining width of 1.2 m. The resource estimate was validated by:
· Visual comparison of the sample thickness and grades with the estimated model grades in long section;
· Visual checks of the orientation of search ellipses and comparison to the sample and model grade distributions;
· Visual comparison of the estimated grades to previous estimates in long section;
· Comparison of the de-clustered sample grades with the model grades; and
· Plotting the sample and block estimated true thickness, gold and antimony grades on Swath plots.
FAIR\MULL\LIDB\EBBE\mota PLI014_Costerfield_Operations_NI_43 101_Master_Rev0 28 March 2014
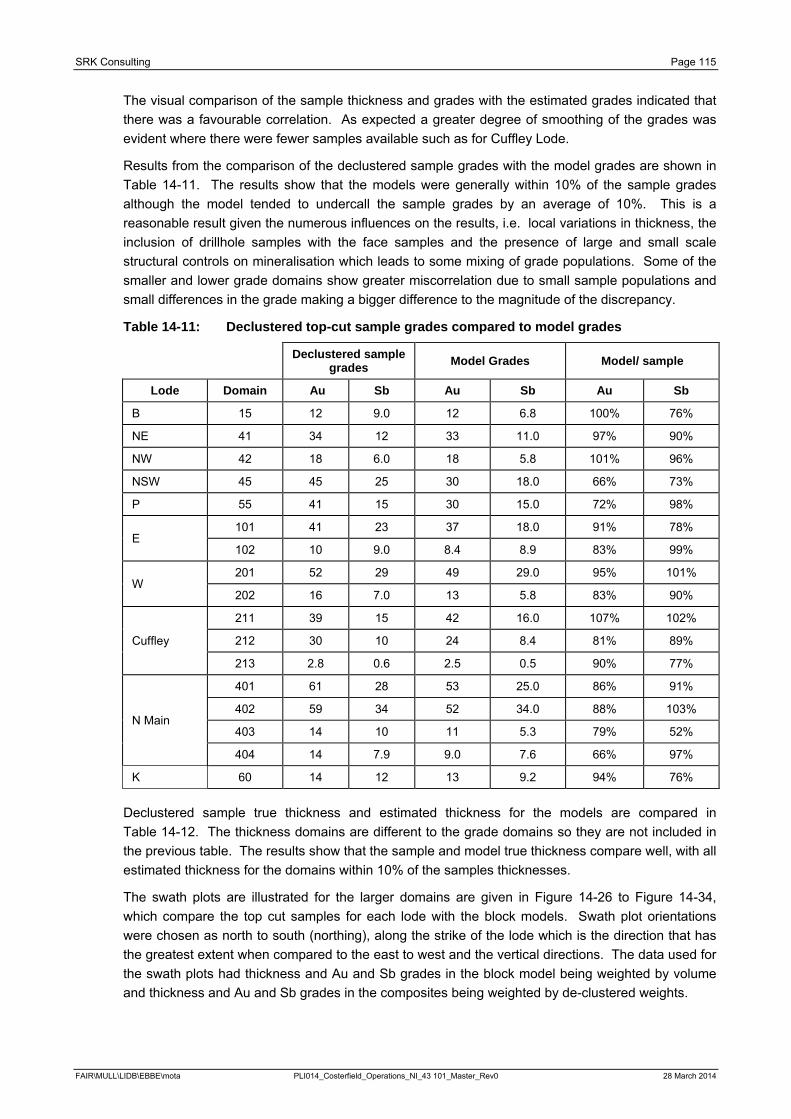
SRK Consulting Page 115
The visual comparison of the sample thickness and grades with the estimated grades indicated that there was a favourable correlation. As expected a greater degree of smoothing of the grades was evident where there were fewer samples available such as for Cuffley Lode.
Results from the comparison of the declustered sample grades with the model grades are shown in Table 14-11. The results show that the models were generally within 10% of the sample grades although the model tended to undercall the sample grades by an average of 10%. This is a reasonable result given the numerous influences on the results, i.e. local variations in thickness, the inclusion of drillhole samples with the face samples and the presence of large and small scale structural controls on mineralisation which leads to some mixing of grade populations. Some of the smaller and lower grade domains show greater miscorrelation due to small sample populations and small differences in the grade making a bigger difference to the magnitude of the discrepancy.
Table 14-11: Declustered top-cut sample grades compared to model grades
Declustered sample grades Model Grades Model/ sample
Lode Domain Au Sb Au Sb Au Sb
B 15 12 9.0 12 6.8 100% 76%
NE 41 34 12 33 11.0 97% 90%
NW 42 18 6.0 18 5.8 101% 96%
NSW 45 45 25 30 18.0 66% 73%
P 55 41 15 30 15.0 72% 98%
E 101 41 23 37 18.0 91% 78%
102 10 9.0 8.4 8.9 83% 99%
W 201 52 29 49 29.0 95% 101%
202 16 7.0 13 5.8 83% 90%
Cuffley
211 39 15 42 16.0 107% 102%
212 30 10 24 8.4 81% 89%
213 2.8 0.6 2.5 0.5 90% 77%
N Main
401 61 28 53 25.0 86% 91%
402 59 34 52 34.0 88% 103%
403 14 10 11 5.3 79% 52%
404 14 7.9 9.0 7.6 66% 97%
K 60 14 12 13 9.2 94% 76%
Declustered sample true thickness and estimated thickness for the models are compared in Table 14-12. The thickness domains are different to the grade domains so they are not included in the previous table. The results show that the sample and model true thickness compare well, with all estimated thickness for the domains within 10% of the samples thicknesses.
The swath plots are illustrated for the larger domains are given in Figure 14-26 to Figure 14-34, which compare the top cut samples for each lode with the block models. Swath plot orientations were chosen as north to south (northing), along the strike of the lode which is the direction that has the greatest extent when compared to the east to west and the vertical directions. The data used for the swath plots had thickness and Au and Sb grades in the block model being weighted by volume and thickness and Au and Sb grades in the composites being weighted by de-clustered weights.
FAIR\MULL\LIDB\EBBE\mota PLI014_Costerfield_Operations_NI_43 101_Master_Rev0 28 March 2014
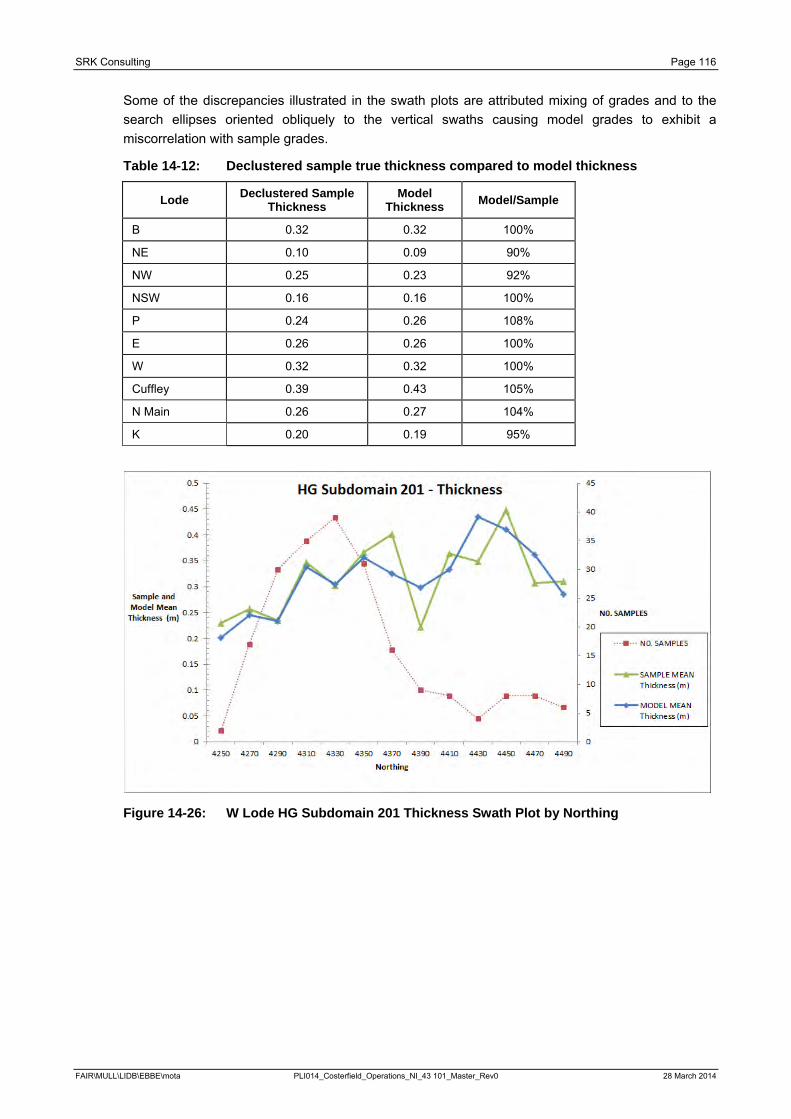
SRK Consulting Page 116
Some of the discrepancies illustrated in the swath plots are attributed mixing of grades and to the search ellipses oriented obliquely to the vertical swaths causing model grades to exhibit a miscorrelation with sample grades.
Table 14-12: Declustered sample true thickness compared to model thickness
Lode Declustered Sample Thickness
Model Thickness Model/Sample
B 0.32 0.32 100%
NE 0.10 0.09 90%
NW 0.25 0.23 92%
NSW 0.16 0.16 100%
P 0.24 0.26 108%
E 0.26 0.26 100%
W 0.32 0.32 100%
Cuffley 0.39 0.43 105%
N Main 0.26 0.27 104%
K 0.20 0.19 95%
Figure 14-26: W Lode HG Subdomain 201 Thickness Swath Plot by Northing
FAIR\MULL\LIDB\EBBE\mota PLI014_Costerfield_Operations_NI_43 101_Master_Rev0 28 March 2014
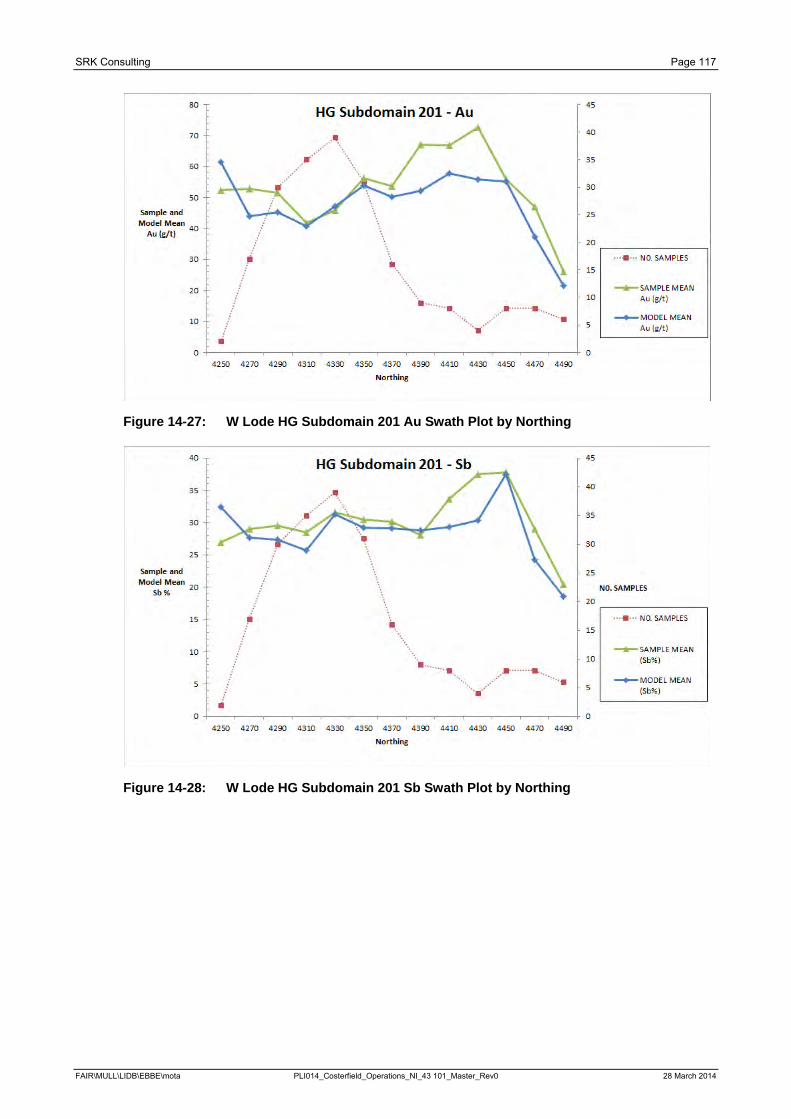
SRK Consulting Page 117
Figure 14-27: W Lode HG Subdomain 201 Au Swath Plot by Northing
Figure 14-28: W Lode HG Subdomain 201 Sb Swath Plot by Northing
FAIR\MULL\LIDB\EBBE\mota PLI014_Costerfield_Operations_NI_43 101_Master_Rev0 28 March 2014
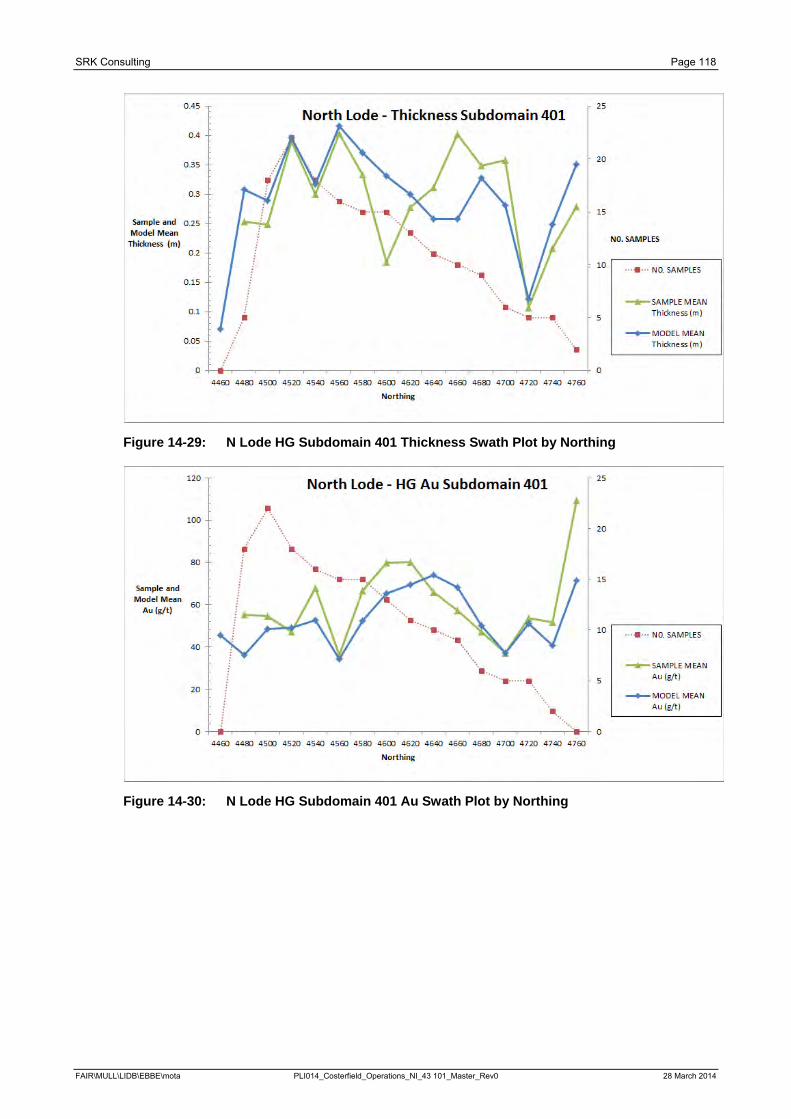
SRK Consulting Page 118
Figure 14-29: N Lode HG Subdomain 401 Thickness Swath Plot by Northing
Figure 14-30: N Lode HG Subdomain 401 Au Swath Plot by Northing
FAIR\MULL\LIDB\EBBE\mota PLI014_Costerfield_Operations_NI_43 101_Master_Rev0 28 March 2014
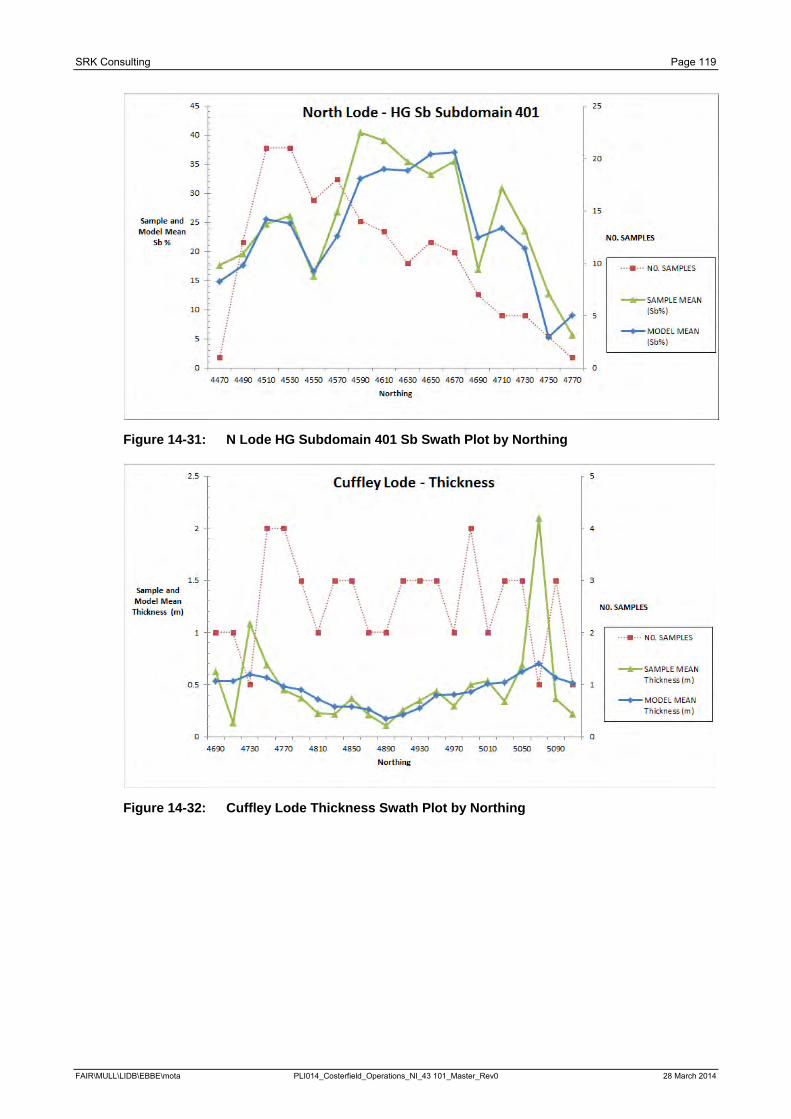
SRK Consulting Page 119
Figure 14-31: N Lode HG Subdomain 401 Sb Swath Plot by Northing
Figure 14-32: Cuffley Lode Thickness Swath Plot by Northing
FAIR\MULL\LIDB\EBBE\mota PLI014_Costerfield_Operations_NI_43 101_Master_Rev0 28 March 2014
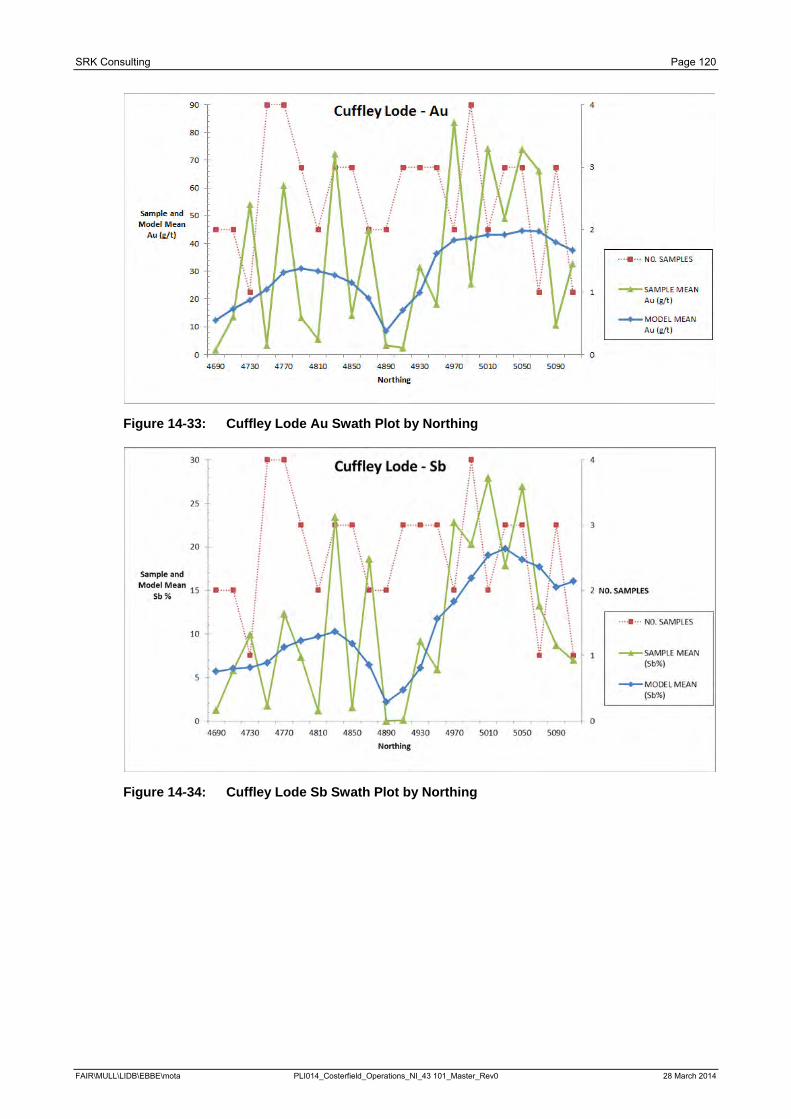
SRK Consulting Page 120
Figure 14-33: Cuffley Lode Au Swath Plot by Northing
Figure 14-34: Cuffley Lode Sb Swath Plot by Northing
FAIR\MULL\LIDB\EBBE\mota PLI014_Costerfield_Operations_NI_43 101_Master_Rev0 28 March 2014
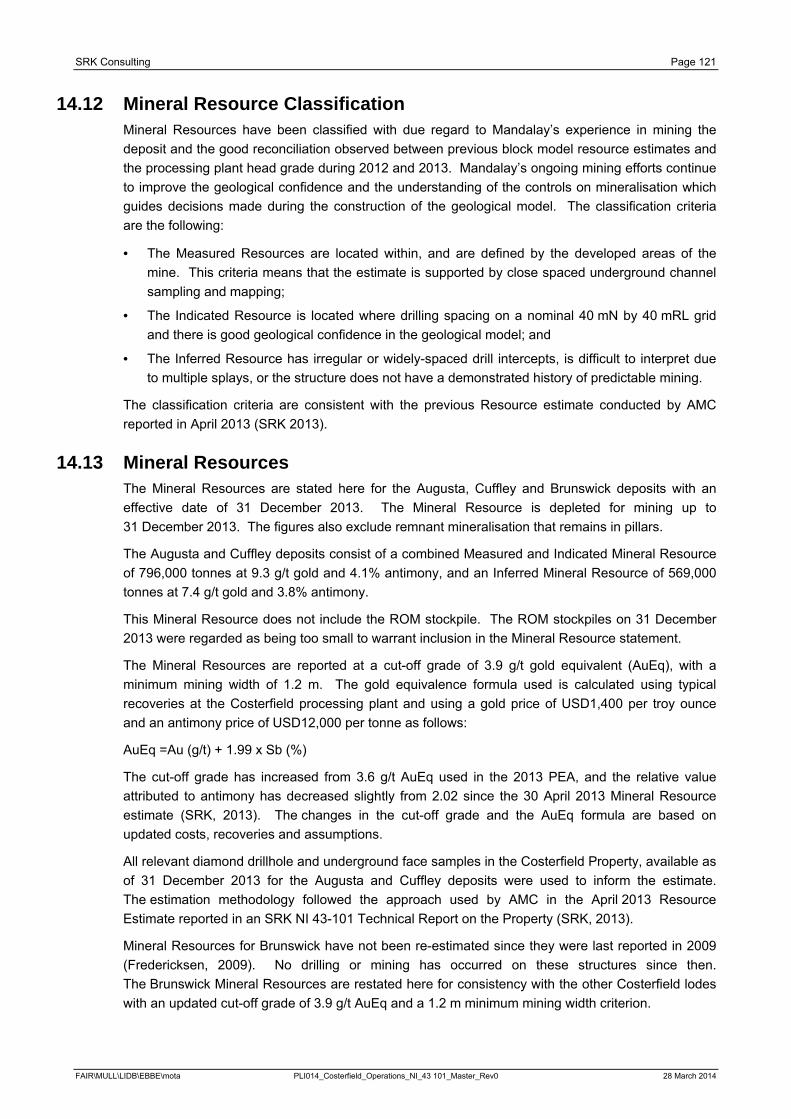
SRK Consulting Page 121
14.12 Mineral Resource Classification Mineral Resources have been classified with due regard to Mandalay’s experience in mining the deposit and the good reconciliation observed between previous block model resource estimates and the processing plant head grade during 2012 and 2013. Mandalay’s ongoing mining efforts continue to improve the geological confidence and the understanding of the controls on mineralisation which guides decisions made during the construction of the geological model. The classification criteria are the following:
· The Measured Resources are located within, and are defined by the developed areas of the mine. This criteria means that the estimate is supported by close spaced underground channel sampling and mapping;
· The Indicated Resource is located where drilling spacing on a nominal 40 mN by 40 mRL grid and there is good geological confidence in the geological model; and
· The Inferred Resource has irregular or widely-spaced drill intercepts, is difficult to interpret due to multiple splays, or the structure does not have a demonstrated history of predictable mining.
The classification criteria are consistent with the previous Resource estimate conducted by AMC reported in April 2013 (SRK 2013).
14.13 Mineral Resources The Mineral Resources are stated here for the Augusta, Cuffley and Brunswick deposits with an effective date of 31 December 2013. The Mineral Resource is depleted for mining up to 31 December 2013. The figures also exclude remnant mineralisation that remains in pillars.
The Augusta and Cuffley deposits consist of a combined Measured and Indicated Mineral Resource of 796,000 tonnes at 9.3 g/t gold and 4.1% antimony, and an Inferred Mineral Resource of 569,000 tonnes at 7.4 g/t gold and 3.8% antimony.
This Mineral Resource does not include the ROM stockpile. The ROM stockpiles on 31 December 2013 were regarded as being too small to warrant inclusion in the Mineral Resource statement.
The Mineral Resources are reported at a cut-off grade of 3.9 g/t gold equivalent (AuEq), with a minimum mining width of 1.2 m. The gold equivalence formula used is calculated using typical recoveries at the Costerfield processing plant and using a gold price of USD1,400 per troy ounce and an antimony price of USD12,000 per tonne as follows:
AuEq =Au (g/t) + 1.99 x Sb (%)
The cut-off grade has increased from 3.6 g/t AuEq used in the 2013 PEA, and the relative value attributed to antimony has decreased slightly from 2.02 since the 30 April 2013 Mineral Resource estimate (SRK, 2013). The changes in the cut-off grade and the AuEq formula are based on updated costs, recoveries and assumptions.
All relevant diamond drillhole and underground face samples in the Costerfield Property, available as of 31 December 2013 for the Augusta and Cuffley deposits were used to inform the estimate. The estimation methodology followed the approach used by AMC in the April 2013 Resource Estimate reported in an SRK NI 43-101 Technical Report on the Property (SRK, 2013).
Mineral Resources for Brunswick have not been re-estimated since they were last reported in 2009 (Fredericksen, 2009). No drilling or mining has occurred on these structures since then. The Brunswick Mineral Resources are restated here for consistency with the other Costerfield lodes with an updated cut-off grade of 3.9 g/t AuEq and a 1.2 m minimum mining width criterion.
FAIR\MULL\LIDB\EBBE\mota PLI014_Costerfield_Operations_NI_43 101_Master_Rev0 28 March 2014
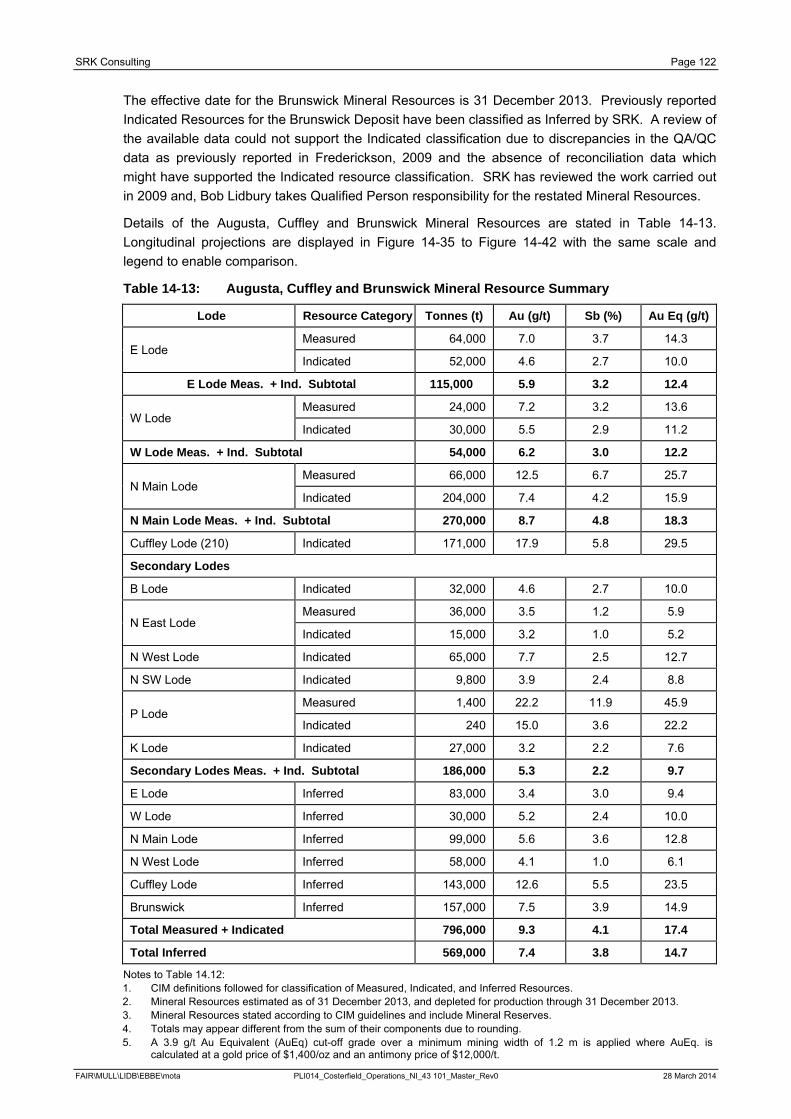
SRK Consulting Page 122
The effective date for the Brunswick Mineral Resources is 31 December 2013. Previously reported Indicated Resources for the Brunswick Deposit have been classified as Inferred by SRK. A review of the available data could not support the Indicated classification due to discrepancies in the QA/QC data as previously reported in Frederickson, 2009 and the absence of reconciliation data which might have supported the Indicated resource classification. SRK has reviewed the work carried out in 2009 and, Bob Lidbury takes Qualified Person responsibility for the restated Mineral Resources.
Details of the Augusta, Cuffley and Brunswick Mineral Resources are stated in Table 14-13. Longitudinal projections are displayed in Figure 14-35 to Figure 14-42 with the same scale and legend to enable comparison.
Table 14-13: Augusta, Cuffley and Brunswick Mineral Resource Summary
Lode Resource Category Tonnes (t) Au (g/t) Sb (%) Au Eq (g/t)
E Lode Measured 64,000 7.0 3.7 14.3
Indicated 52,000 4.6 2.7 10.0
E Lode Meas. + Ind. Subtotal 115,000 5.9 3.2 12.4
W Lode Measured 24,000 7.2 3.2 13.6
Indicated 30,000 5.5 2.9 11.2
W Lode Meas. + Ind. Subtotal 54,000 6.2 3.0 12.2
N Main Lode Measured 66,000 12.5 6.7 25.7
Indicated 204,000 7.4 4.2 15.9
N Main Lode Meas. + Ind. Subtotal 270,000 8.7 4.8 18.3
Cuffley Lode (210) Indicated 171,000 17.9 5.8 29.5
Secondary Lodes
B Lode Indicated 32,000 4.6 2.7 10.0
N East Lode Measured 36,000 3.5 1.2 5.9
Indicated 15,000 3.2 1.0 5.2
N West Lode Indicated 65,000 7.7 2.5 12.7
N SW Lode Indicated 9,800 3.9 2.4 8.8
P Lode Measured 1,400 22.2 11.9 45.9
Indicated 240 15.0 3.6 22.2
K Lode Indicated 27,000 3.2 2.2 7.6
Secondary Lodes Meas. + Ind. Subtotal 186,000 5.3 2.2 9.7
E Lode Inferred 83,000 3.4 3.0 9.4
W Lode Inferred 30,000 5.2 2.4 10.0
N Main Lode Inferred 99,000 5.6 3.6 12.8
N West Lode Inferred 58,000 4.1 1.0 6.1
Cuffley Lode Inferred 143,000 12.6 5.5 23.5
Brunswick Inferred 157,000 7.5 3.9 14.9
Total Measured + Indicated 796,000 9.3 4.1 17.4
Total Inferred 569,000 7.4 3.8 14.7
Notes to Table 14.12: 1. CIM definitions followed for classification of Measured, Indicated, and Inferred Resources. 2. Mineral Resources estimated as of 31 December 2013, and depleted for production through 31 December 2013. 3. Mineral Resources stated according to CIM guidelines and include Mineral Reserves. 4. Totals may appear different from the sum of their components due to rounding. 5. A 3.9 g/t Au Equivalent (AuEq) cut-off grade over a minimum mining width of 1.2 m is applied where AuEq. is
calculated at a gold price of $1,400/oz and an antimony price of $12,000/t.
FAIR\MULL\LIDB\EBBE\mota PLI014_Costerfield_Operations_NI_43 101_Master_Rev0 28 March 2014
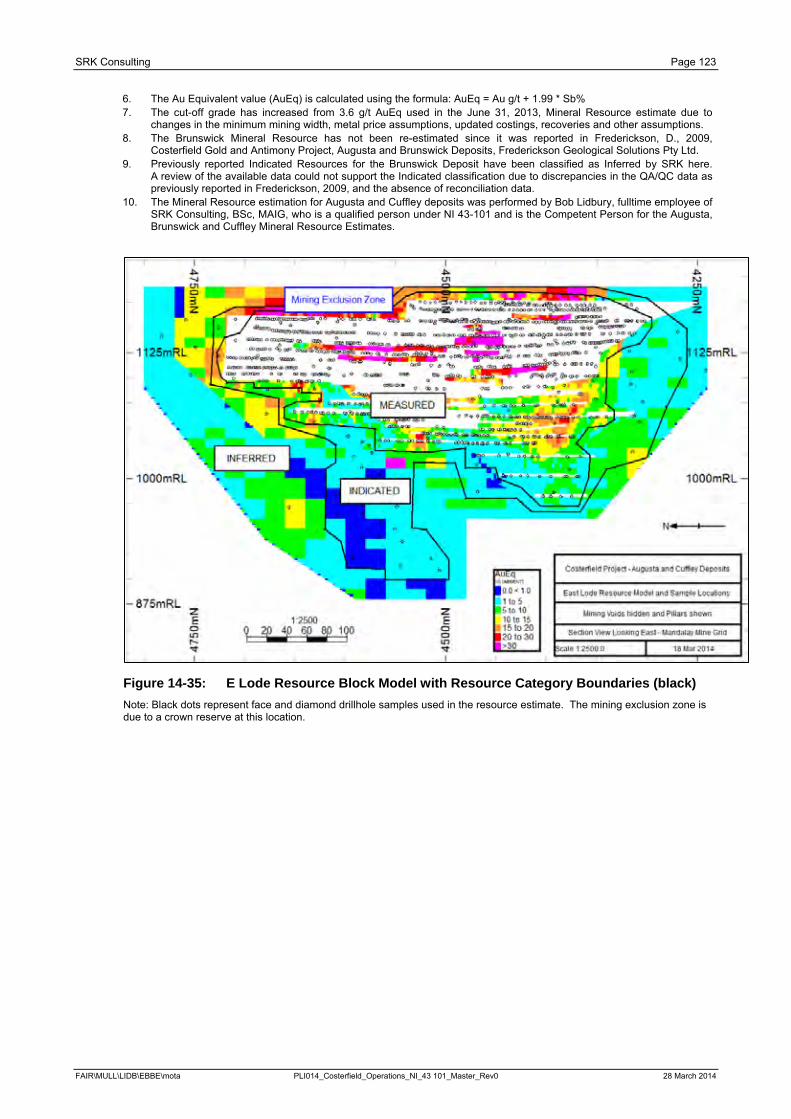
SRK Consulting Page 123
6. The Au Equivalent value (AuEq) is calculated using the formula: AuEq = Au g/t + 1.99 * Sb% 7. The cut-off grade has increased from 3.6 g/t AuEq used in the June 31, 2013, Mineral Resource estimate due to
changes in the minimum mining width, metal price assumptions, updated costings, recoveries and other assumptions. 8. The Brunswick Mineral Resource has not been re-estimated since it was reported in Frederickson, D., 2009,
Costerfield Gold and Antimony Project, Augusta and Brunswick Deposits, Frederickson Geological Solutions Pty Ltd. 9. Previously reported Indicated Resources for the Brunswick Deposit have been classified as Inferred by SRK here.
A review of the available data could not support the Indicated classification due to discrepancies in the QA/QC data as previously reported in Frederickson, 2009, and the absence of reconciliation data.
10. The Mineral Resource estimation for Augusta and Cuffley deposits was performed by Bob Lidbury, fulltime employee of SRK Consulting, BSc, MAIG, who is a qualified person under NI 43-101 and is the Competent Person for the Augusta, Brunswick and Cuffley Mineral Resource Estimates.
Figure 14-35: E Lode Resource Block Model with Resource Category Boundaries (black) Note: Black dots represent face and diamond drillhole samples used in the resource estimate. The mining exclusion zone is due to a crown reserve at this location.
FAIR\MULL\LIDB\EBBE\mota PLI014_Costerfield_Operations_NI_43 101_Master_Rev0 28 March 2014
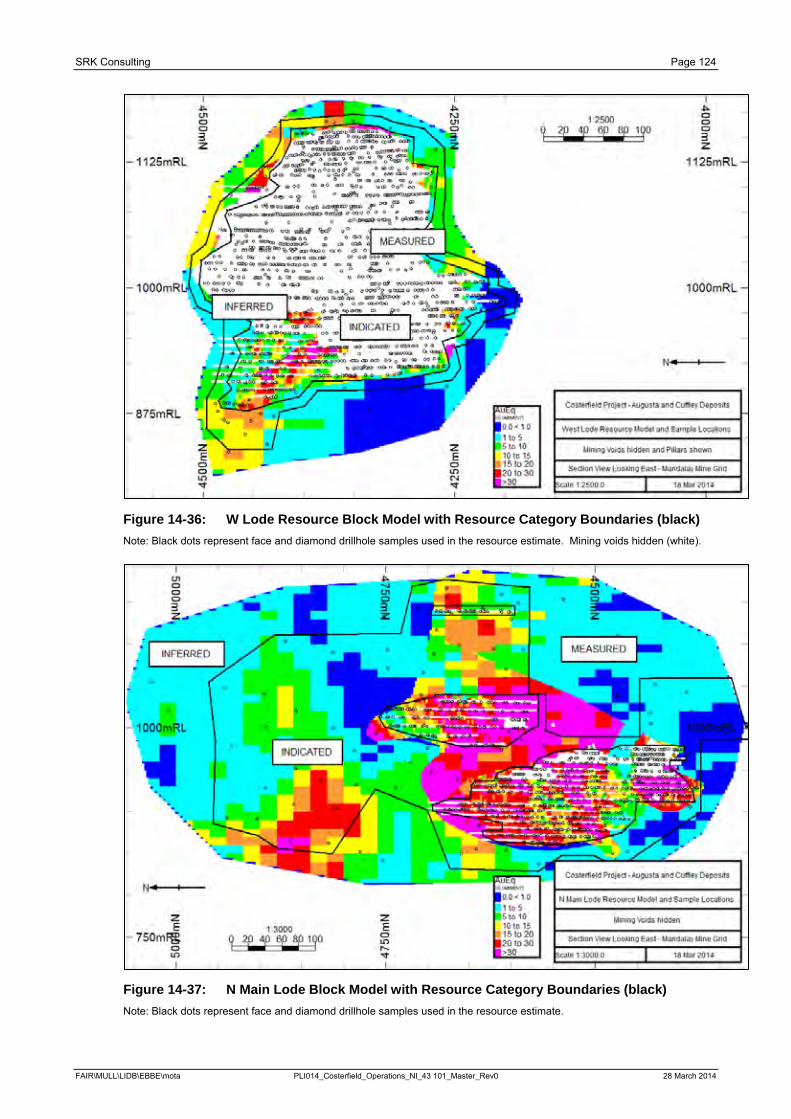
SRK Consulting Page 124
Figure 14-36: W Lode Resource Block Model with Resource Category Boundaries (black) Note: Black dots represent face and diamond drillhole samples used in the resource estimate. Mining voids hidden (white).
Figure 14-37: N Main Lode Block Model with Resource Category Boundaries (black) Note: Black dots represent face and diamond drillhole samples used in the resource estimate.
FAIR\MULL\LIDB\EBBE\mota PLI014_Costerfield_Operations_NI_43 101_Master_Rev0 28 March 2014
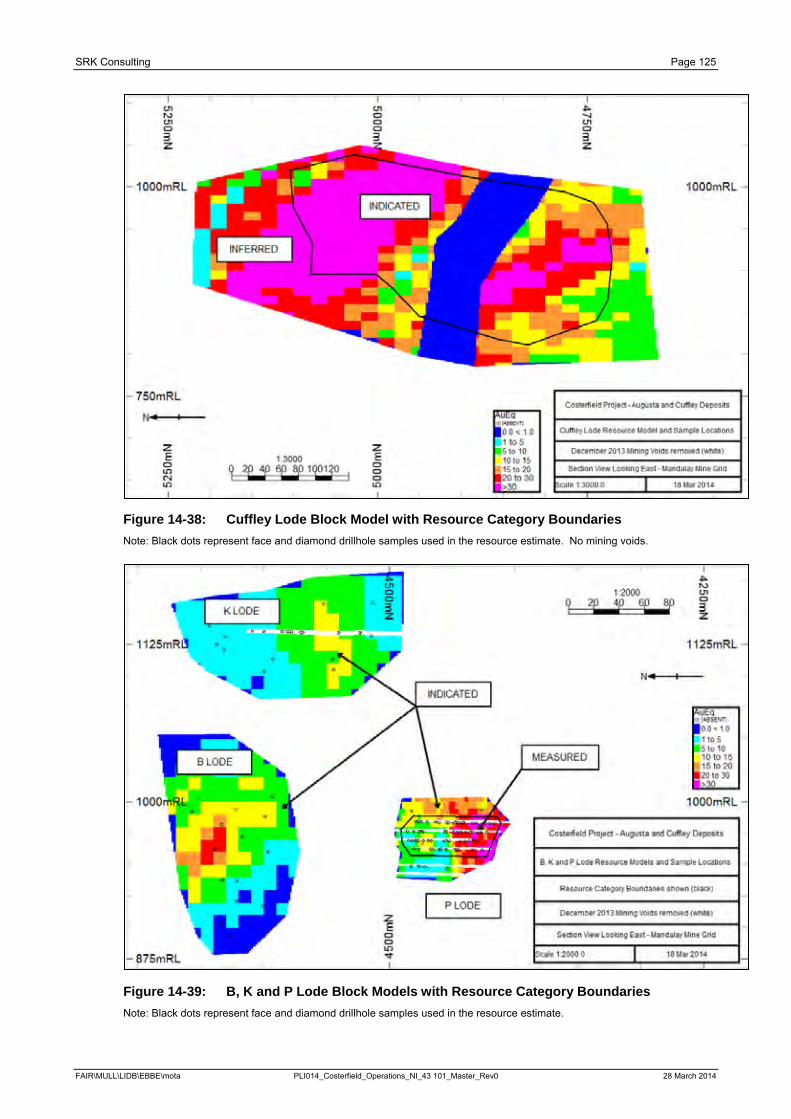
SRK Consulting Page 125
Figure 14-38: Cuffley Lode Block Model with Resource Category Boundaries Note: Black dots represent face and diamond drillhole samples used in the resource estimate. No mining voids.
Figure 14-39: B, K and P Lode Block Models with Resource Category Boundaries Note: Black dots represent face and diamond drillhole samples used in the resource estimate.
FAIR\MULL\LIDB\EBBE\mota PLI014_Costerfield_Operations_NI_43 101_Master_Rev0 28 March 2014
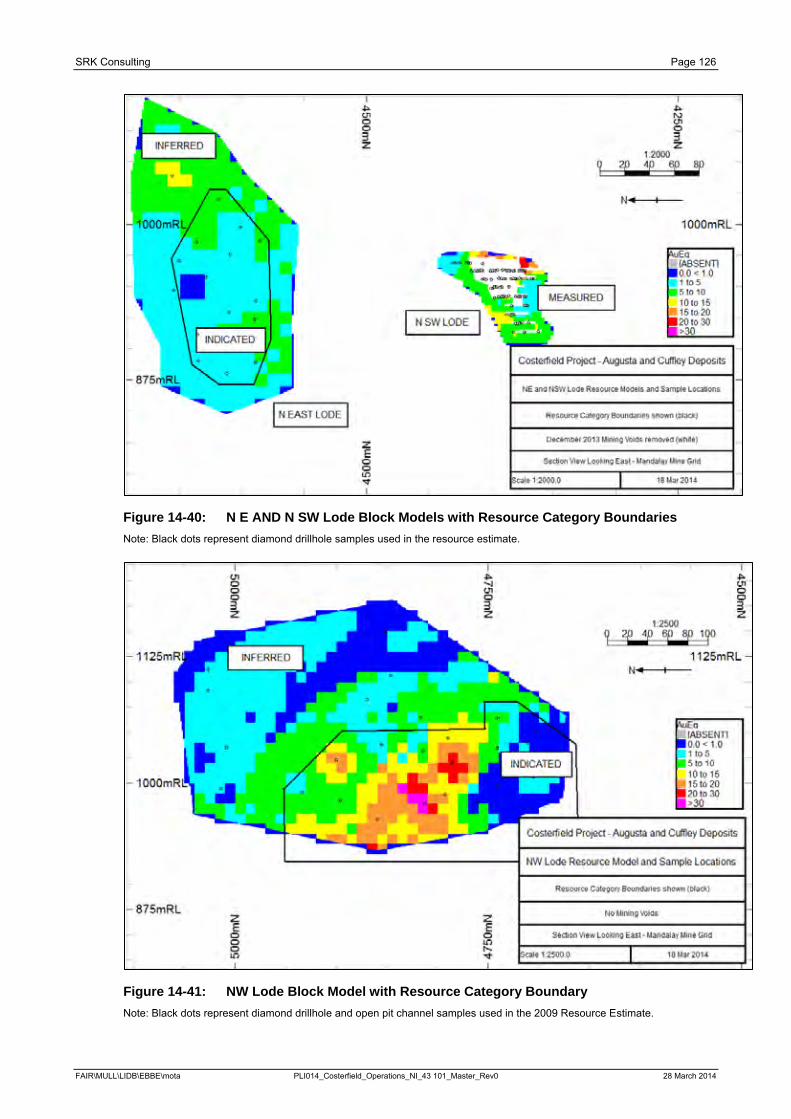
SRK Consulting Page 126
Figure 14-40: N E AND N SW Lode Block Models with Resource Category Boundaries Note: Black dots represent diamond drillhole samples used in the resource estimate.
Figure 14-41: NW Lode Block Model with Resource Category Boundary Note: Black dots represent diamond drillhole and open pit channel samples used in the 2009 Resource Estimate.
FAIR\MULL\LIDB\EBBE\mota PLI014_Costerfield_Operations_NI_43 101_Master_Rev0 28 March 2014
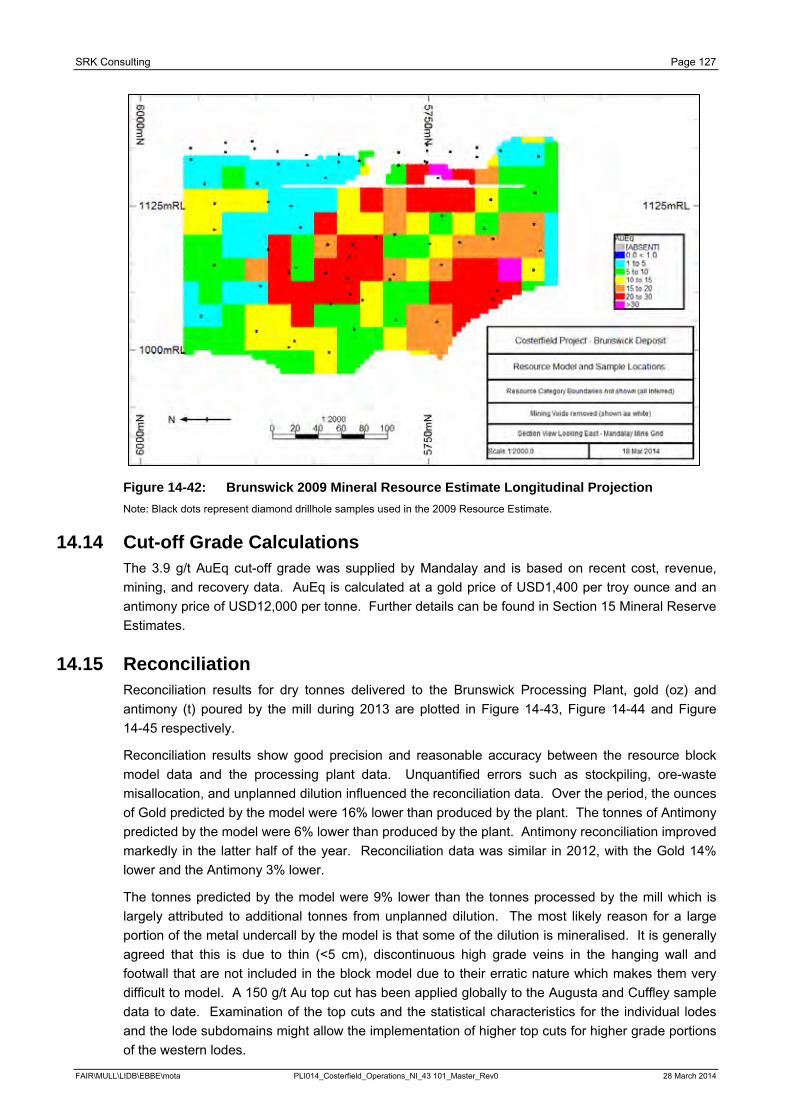
SRK Consulting Page 127
Figure 14-42: Brunswick 2009 Mineral Resource Estimate Longitudinal Projection Note: Black dots represent diamond drillhole samples used in the 2009 Resource Estimate.
14.14 Cut-off Grade Calculations The 3.9 g/t AuEq cut-off grade was supplied by Mandalay and is based on recent cost, revenue, mining, and recovery data. AuEq is calculated at a gold price of USD1,400 per troy ounce and an antimony price of USD12,000 per tonne. Further details can be found in Section 15 Mineral Reserve Estimates.
14.15 Reconciliation Reconciliation results for dry tonnes delivered to the Brunswick Processing Plant, gold (oz) and antimony (t) poured by the mill during 2013 are plotted in Figure 14-43, Figure 14-44 and Figure 14-45 respectively.
Reconciliation results show good precision and reasonable accuracy between the resource block model data and the processing plant data. Unquantified errors such as stockpiling, ore-waste misallocation, and unplanned dilution influenced the reconciliation data. Over the period, the ounces of Gold predicted by the model were 16% lower than produced by the plant. The tonnes of Antimony predicted by the model were 6% lower than produced by the plant. Antimony reconciliation improved markedly in the latter half of the year. Reconciliation data was similar in 2012, with the Gold 14% lower and the Antimony 3% lower.
The tonnes predicted by the model were 9% lower than the tonnes processed by the mill which is largely attributed to additional tonnes from unplanned dilution. The most likely reason for a large portion of the metal undercall by the model is that some of the dilution is mineralised. It is generally agreed that this is due to thin (<5 cm), discontinuous high grade veins in the hanging wall and footwall that are not included in the block model due to their erratic nature which makes them very difficult to model. A 150 g/t Au top cut has been applied globally to the Augusta and Cuffley sample data to date. Examination of the top cuts and the statistical characteristics for the individual lodes and the lode subdomains might allow the implementation of higher top cuts for higher grade portions of the western lodes.
FAIR\MULL\LIDB\EBBE\mota PLI014_Costerfield_Operations_NI_43 101_Master_Rev0 28 March 2014
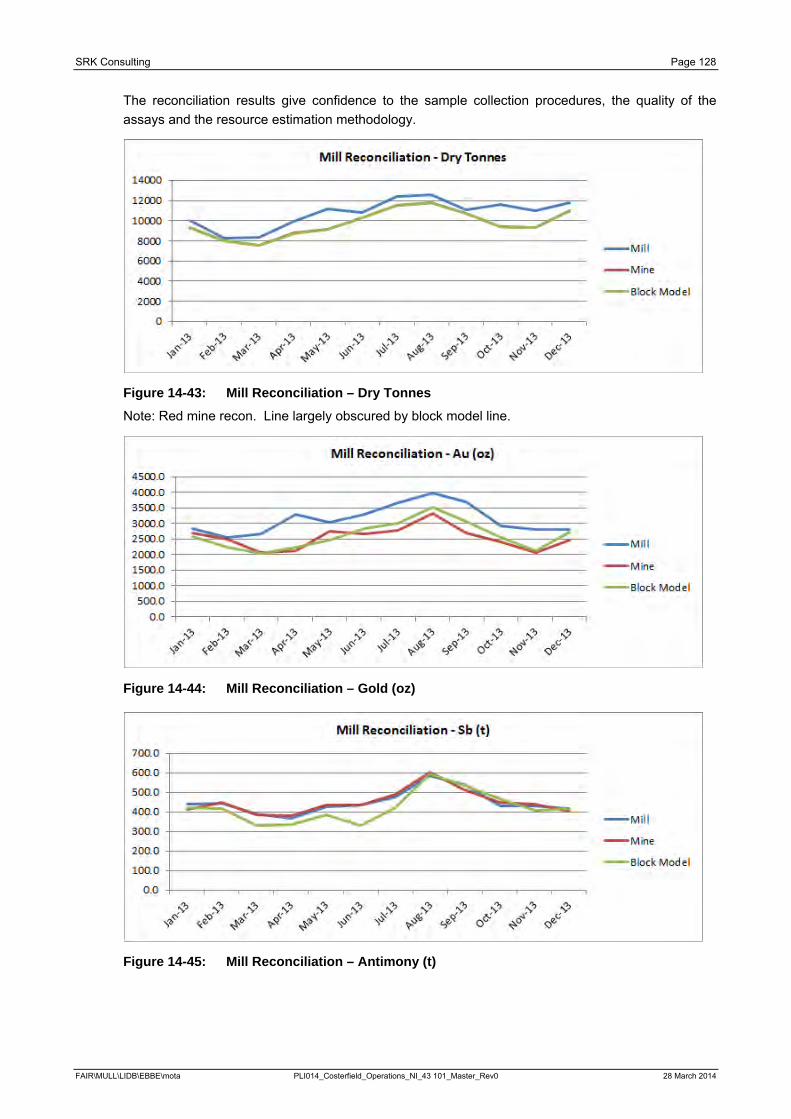
SRK Consulting Page 128
The reconciliation results give confidence to the sample collection procedures, the quality of the assays and the resource estimation methodology.
Figure 14-43: Mill Reconciliation – Dry Tonnes Note: Red mine recon. Line largely obscured by block model line.
Figure 14-44: Mill Reconciliation – Gold (oz)
Figure 14-45: Mill Reconciliation – Antimony (t)
FAIR\MULL\LIDB\EBBE\mota PLI014_Costerfield_Operations_NI_43 101_Master_Rev0 28 March 2014
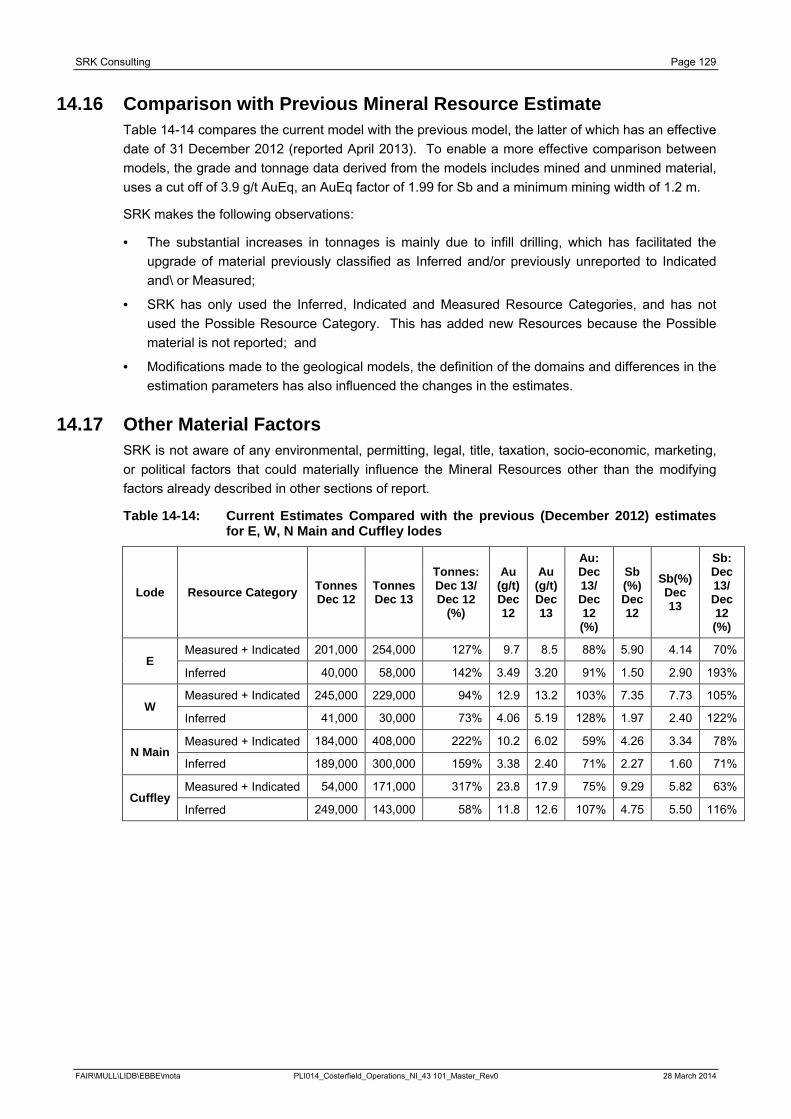
SRK Consulting Page 129
14.16 Comparison with Previous Mineral Resource Estimate Table 14-14 compares the current model with the previous model, the latter of which has an effective date of 31 December 2012 (reported April 2013). To enable a more effective comparison between models, the grade and tonnage data derived from the models includes mined and unmined material, uses a cut off of 3.9 g/t AuEq, an AuEq factor of 1.99 for Sb and a minimum mining width of 1.2 m.
SRK makes the following observations:
· The substantial increases in tonnages is mainly due to infill drilling, which has facilitated the upgrade of material previously classified as Inferred and/or previously unreported to Indicated and\ or Measured;
· SRK has only used the Inferred, Indicated and Measured Resource Categories, and has not used the Possible Resource Category. This has added new Resources because the Possible material is not reported; and
· Modifications made to the geological models, the definition of the domains and differences in the estimation parameters has also influenced the changes in the estimates.
14.17 Other Material Factors SRK is not aware of any environmental, permitting, legal, title, taxation, socio-economic, marketing, or political factors that could materially influence the Mineral Resources other than the modifying factors already described in other sections of report.
Table 14-14: Current Estimates Compared with the previous (December 2012) estimates for E, W, N Main and Cuffley lodes
Lode Resource Category Tonnes Dec 12
Tonnes Dec 13
Tonnes: Dec 13/ Dec 12
(%)
Au (g/t) Dec 12
Au (g/t) Dec 13
Au: Dec 13/ Dec 12 (%)
Sb (%) Dec 12
Sb(%) Dec 13
Sb: Dec 13/ Dec 12 (%)
E Measured + Indicated 201,000 254,000 127% 9.7 8.5 88% 5.90 4.14 70%
Inferred 40,000 58,000 142% 3.49 3.20 91% 1.50 2.90 193%
W Measured + Indicated 245,000 229,000 94% 12.9 13.2 103% 7.35 7.73 105%
Inferred 41,000 30,000 73% 4.06 5.19 128% 1.97 2.40 122%
N Main Measured + Indicated 184,000 408,000 222% 10.2 6.02 59% 4.26 3.34 78%
Inferred 189,000 300,000 159% 3.38 2.40 71% 2.27 1.60 71%
Cuffley Measured + Indicated 54,000 171,000 317% 23.8 17.9 75% 9.29 5.82 63%
Inferred 249,000 143,000 58% 11.8 12.6 107% 4.75 5.50 116%
FAIR\MULL\LIDB\EBBE\mota PLI014_Costerfield_Operations_NI_43 101_Master_Rev0 28 March 2014
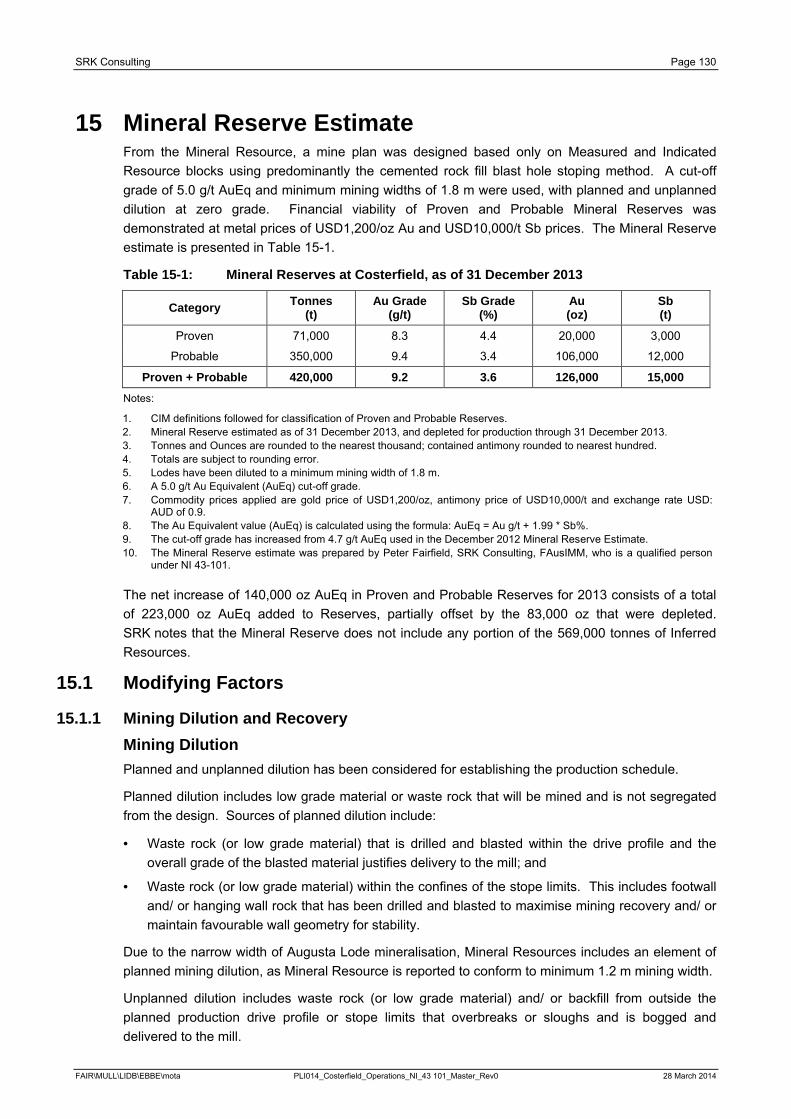
SRK Consulting Page 130
15 Mineral Reserve Estimate From the Mineral Resource, a mine plan was designed based only on Measured and Indicated Resource blocks using predominantly the cemented rock fill blast hole stoping method. A cut-off grade of 5.0 g/t AuEq and minimum mining widths of 1.8 m were used, with planned and unplanned dilution at zero grade. Financial viability of Proven and Probable Mineral Reserves was demonstrated at metal prices of USD1,200/oz Au and USD10,000/t Sb prices. The Mineral Reserve estimate is presented in Table 15-1.
Table 15-1: Mineral Reserves at Costerfield, as of 31 December 2013
Category Tonnes (t)
Au Grade (g/t)
Sb Grade (%)
Au (oz)
Sb (t)
Proven 71,000 8.3 4.4 20,000 3,000
Probable 350,000 9.4 3.4 106,000 12,000
Proven + Probable 420,000 9.2 3.6 126,000 15,000 Notes:
1. CIM definitions followed for classification of Proven and Probable Reserves. 2. Mineral Reserve estimated as of 31 December 2013, and depleted for production through 31 December 2013. 3. Tonnes and Ounces are rounded to the nearest thousand; contained antimony rounded to nearest hundred. 4. Totals are subject to rounding error. 5. Lodes have been diluted to a minimum mining width of 1.8 m. 6. A 5.0 g/t Au Equivalent (AuEq) cut-off grade. 7. Commodity prices applied are gold price of USD1,200/oz, antimony price of USD10,000/t and exchange rate USD:
AUD of 0.9. 8. The Au Equivalent value (AuEq) is calculated using the formula: AuEq = Au g/t + 1.99 * Sb%. 9. The cut-off grade has increased from 4.7 g/t AuEq used in the December 2012 Mineral Reserve Estimate. 10. The Mineral Reserve estimate was prepared by Peter Fairfield, SRK Consulting, FAusIMM, who is a qualified person
under NI 43-101.
The net increase of 140,000 oz AuEq in Proven and Probable Reserves for 2013 consists of a total of 223,000 oz AuEq added to Reserves, partially offset by the 83,000 oz that were depleted. SRK notes that the Mineral Reserve does not include any portion of the 569,000 tonnes of Inferred Resources.
15.1 Modifying Factors
15.1.1 Mining Dilution and Recovery Mining Dilution Planned and unplanned dilution has been considered for establishing the production schedule.
Planned dilution includes low grade material or waste rock that will be mined and is not segregated from the design. Sources of planned dilution include:
· Waste rock (or low grade material) that is drilled and blasted within the drive profile and the overall grade of the blasted material justifies delivery to the mill; and
· Waste rock (or low grade material) within the confines of the stope limits. This includes footwall and/ or hanging wall rock that has been drilled and blasted to maximise mining recovery and/ or maintain favourable wall geometry for stability.
Due to the narrow width of Augusta Lode mineralisation, Mineral Resources includes an element of planned mining dilution, as Mineral Resource is reported to conform to minimum 1.2 m mining width.
Unplanned dilution includes waste rock (or low grade material) and/ or backfill from outside the planned production drive profile or stope limits that overbreaks or sloughs and is bogged and delivered to the mill.
FAIR\MULL\LIDB\EBBE\mota PLI014_Costerfield_Operations_NI_43 101_Master_Rev0 28 March 2014
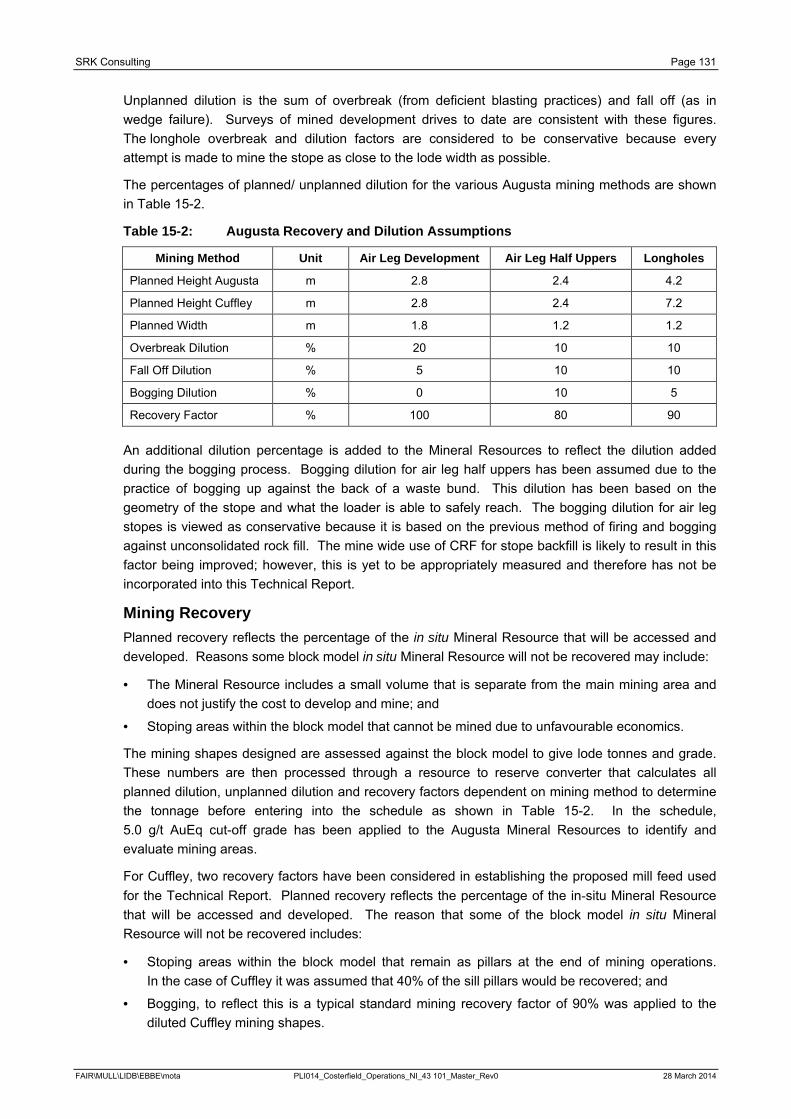
SRK Consulting Page 131
Unplanned dilution is the sum of overbreak (from deficient blasting practices) and fall off (as in wedge failure). Surveys of mined development drives to date are consistent with these figures. The longhole overbreak and dilution factors are considered to be conservative because every attempt is made to mine the stope as close to the lode width as possible.
The percentages of planned/ unplanned dilution for the various Augusta mining methods are shown in Table 15-2.
Table 15-2: Augusta Recovery and Dilution Assumptions
Mining Method Unit Air Leg Development Air Leg Half Uppers Longholes
Planned Height Augusta m 2.8 2.4 4.2
Planned Height Cuffley m 2.8 2.4 7.2
Planned Width m 1.8 1.2 1.2
Overbreak Dilution % 20 10 10
Fall Off Dilution % 5 10 10
Bogging Dilution % 0 10 5
Recovery Factor % 100 80 90
An additional dilution percentage is added to the Mineral Resources to reflect the dilution added during the bogging process. Bogging dilution for air leg half uppers has been assumed due to the practice of bogging up against the back of a waste bund. This dilution has been based on the geometry of the stope and what the loader is able to safely reach. The bogging dilution for air leg stopes is viewed as conservative because it is based on the previous method of firing and bogging against unconsolidated rock fill. The mine wide use of CRF for stope backfill is likely to result in this factor being improved; however, this is yet to be appropriately measured and therefore has not be incorporated into this Technical Report.
Mining Recovery Planned recovery reflects the percentage of the in situ Mineral Resource that will be accessed and developed. Reasons some block model in situ Mineral Resource will not be recovered may include:
· The Mineral Resource includes a small volume that is separate from the main mining area and does not justify the cost to develop and mine; and
· Stoping areas within the block model that cannot be mined due to unfavourable economics.
The mining shapes designed are assessed against the block model to give lode tonnes and grade. These numbers are then processed through a resource to reserve converter that calculates all planned dilution, unplanned dilution and recovery factors dependent on mining method to determine the tonnage before entering into the schedule as shown in Table 15-2. In the schedule, 5.0 g/t AuEq cut-off grade has been applied to the Augusta Mineral Resources to identify and evaluate mining areas.
For Cuffley, two recovery factors have been considered in establishing the proposed mill feed used for the Technical Report. Planned recovery reflects the percentage of the in-situ Mineral Resource that will be accessed and developed. The reason that some of the block model in situ Mineral Resource will not be recovered includes:
· Stoping areas within the block model that remain as pillars at the end of mining operations. In the case of Cuffley it was assumed that 40% of the sill pillars would be recovered; and
· Bogging, to reflect this is a typical standard mining recovery factor of 90% was applied to the diluted Cuffley mining shapes.
FAIR\MULL\LIDB\EBBE\mota PLI014_Costerfield_Operations_NI_43 101_Master_Rev0 28 March 2014
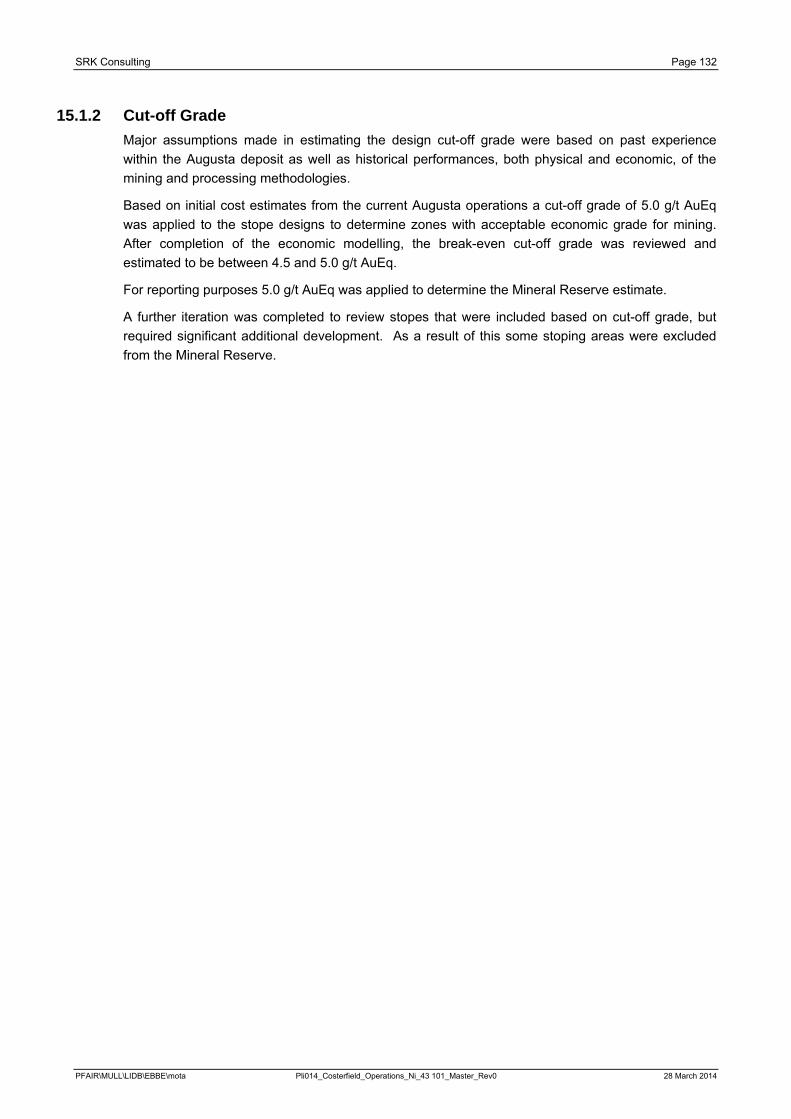
SRK Consulting Page 132
15.1.2 Cut-off Grade Major assumptions made in estimating the design cut-off grade were based on past experience within the Augusta deposit as well as historical performances, both physical and economic, of the mining and processing methodologies.
Based on initial cost estimates from the current Augusta operations a cut-off grade of 5.0 g/t AuEq was applied to the stope designs to determine zones with acceptable economic grade for mining. After completion of the economic modelling, the break-even cut-off grade was reviewed and estimated to be between 4.5 and 5.0 g/t AuEq.
For reporting purposes 5.0 g/t AuEq was applied to determine the Mineral Reserve estimate.
A further iteration was completed to review stopes that were included based on cut-off grade, but required significant additional development. As a result of this some stoping areas were excluded from the Mineral Reserve.
PFAIR\MULL\LIDB\EBBE\mota Pli014_Costerfield_Operations_Ni_43 101_Master_Rev0 28 March 2014
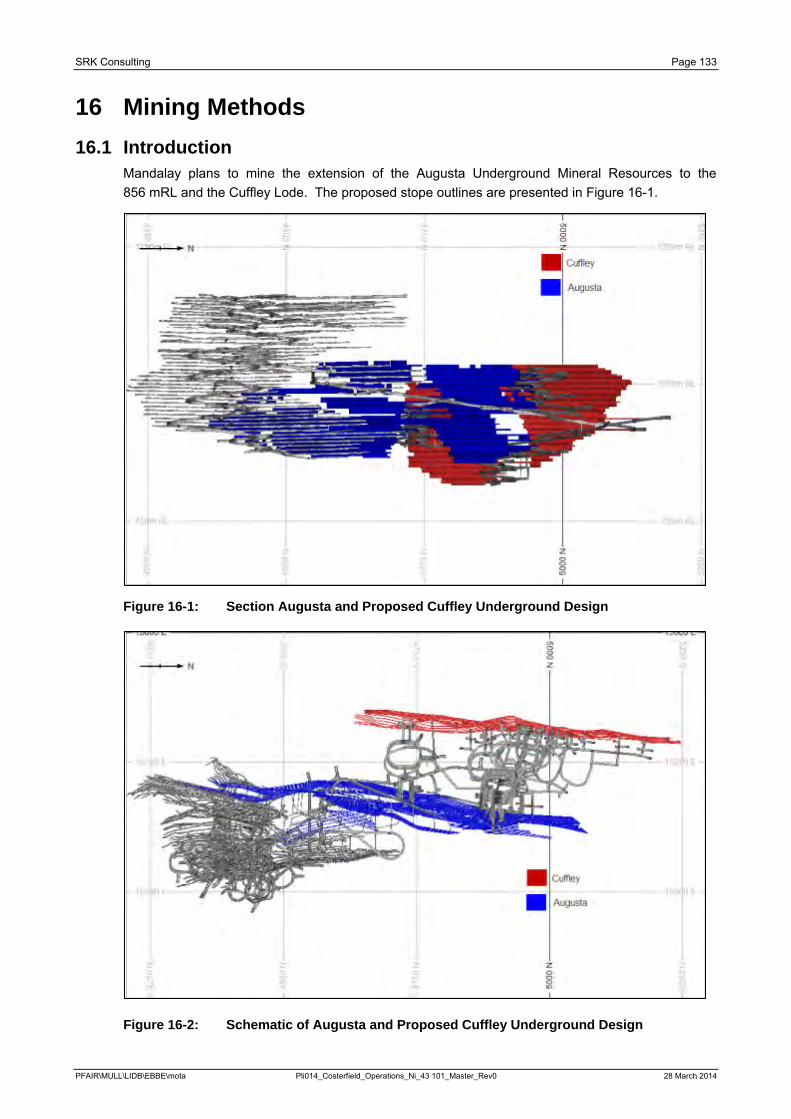
SRK Consulting Page 133
16 Mining Methods 16.1 Introduction
Mandalay plans to mine the extension of the Augusta Underground Mineral Resources to the 856 mRL and the Cuffley Lode. The proposed stope outlines are presented in Figure 16-1.
Figure 16-1: Section Augusta and Proposed Cuffley Underground Design
Figure 16-2: Schematic of Augusta and Proposed Cuffley Underground Design
PFAIR\MULL\LIDB\EBBE\mota Pli014_Costerfield_Operations_Ni_43 101_Master_Rev0 28 March 2014
SRK Consulting Page 134
The Costerfield Mine incorporating the Augusta Lodes and Cuffley Lode is an underground antimony-gold mine currently producing approximately 100 ktpa of mill feed from a variety of mining methods to a depth of over 310 m below surface.
The Augusta Mine is serviced by a decline haulage system. The Augusta decline has been developed from a portal within a box-cut with dimensions of 4.8 m high by 4.5 m wide at a gradient of 1:7 down. The majority of the decline development has been completed with a twin boom jumbo; however, development of the decline from the portal to Level 2 was completed with a road-header. The decline provides primary access for personnel, equipment and materials to the underground workings.
The Augusta Mine employs predominantly air leg longhole stoping methods as well as longitudinal uphole retreat working a bottom up sequence. These mining methods have been utilised throughout 2010 to 2013. CRF is placed into stoping voids to maximise extraction and assist with mine stability.
Mandalay proposes to develop the Cuffley Lode whose southern boundary is located approximately 250 m to the northwest of the current Augusta Mine workings. Access to the Cuffley Lode will be via a single decline that will connect to the existing Augusta decline at the 1030 mRL. The Cuffley Lode is scheduled to produce, in conjunction with the Augusta Mine, at a combined average rate of 100 ktpa. Three different mining methods: full face development, longhole CRF stoping and half upper stoping will be utilised. All mined material will be transported to the Augusta box-cut before being hauled to either the Brunswick ROM Pad or Augusta Waste Rock Storage Facility.
16.2 Geotechnical
16.2.1 Augusta Overview Since 2006, the Augusta Mine has utilised seven different mining methods, a summary of these methods are as follows:
· Capital development undertaken with two boom jumbo;
· Level development undertaken with air leg (hand held drill);
· Flat back overhand ‘cut-and-fill’ development;
· Floor benching of level development;
· Crown ‘half upper’ stopes;
· Longhole stopes with loose rock filled and varying level interval spacing; and
· Longhole stopes with CRF and fixed sub-level spacing.
The chosen mining method for future stoping is longhole stoping with CRF and fixed sub-level spacing. CRF and extensive cable bolting of the hanging wall on all levels prior to stoping provides the required support of the hanging wall and therefore rib pillars are unnecessary. To ensure medium term stability of the hanging wall, crown / sill pillars are left in place and extracted on the completion of a stoping panel as half upper stopes utilising hand held mining techniques.
Numerical modelling using the program ‘FLAC3D’ was undertaken in March 2012 to examine the geomechanical performance of the planned longhole extraction strategy, together with the performance of the CRF and crown/ sill pillars at the Augusta Mine. The material properties of the weak, bedded/ foliated siltstone, Orebody Domain, which makes up the hanging wall of the open stopes, was calibrated to the in situ conditions whereby excessive hanging wall failure and fall-off occurs when the stope strike length is increased beyond 8 m. The primary failure mechanism was recognised to be tensile along the siltstone bedding/ foliation/ cleavage. The CRF pillars are predicted to remain stable throughout the extraction process.
PFAIR\MULL\LIDB\EBBE\mota Pli014_Costerfield_Operations_Ni_43 101_Master_Rev0 28 March 2014
SRK Consulting Page 135
16.2.2 Cuffley Overview The Cuffley Lode is situated within the Costerfield area which is hosted by the Silurian Costerfield Siltstone. Lode mineralisation is associated with an 85° steeply dipping north-northwest trending shear zone. Underground operations within the Cuffley Lode will be confined to a sequence of Turbidite Siltstones at a depth of between 200 m to 500 m below surface. This geotechnical assessment focuses on preliminary development and stoping conditions within the main turbidite sequences.
Proceeding from the surface to depth, the sedimentary sequence of host rocks is dominated by siltstones with minor sandstone interbeds. Due to this host rock lithological origin, five geotechnical domains have been defined. Major known fault intercepts were also investigated to produce a further five geotechnical domains; for a total of ten identified domains. Of these ten domains, six have been identified as important to determine major design principles for the Cuffley Lode. The six geotechnical domains of interest are outlined below and shown in Figure 16-3. The Adder Fault ranges from 6 m to 20 m true thickness and dips at 20° to the south:
· The East Fault has been defined as having a true thickness of 600 mm and dips between 55 to 70° to the west. This structure is crucial to dominating placement of access infrastructure because it exists to the east of the Cuffley Lode where decline development and mine infrastructure has been conceptually positioned;
· The Flat Shear tends to strike parallel with bedding and ranges in thickness from 500 mm to 2 m true width;
· The Capital Turbidite Host domain has a ‘very good’ Q rating rock mass quality. The true thickness of this unit is 100 m. Poor rock mass conditions are only encountered in the vicinity of fault structures. There is predominately only one joint set parallel to bedding and a high percentile RQD of 90%;
· Continuing beneath the Capital Turbidite Host Unit is a turbidite sequence referred to as the Eagle Formation due to its visually distinct bands of siltstone 1 cm to 2 cm thick. This domain has a ‘very poor to poor’ Q rating rock mass quality with an RQD of less than 50%. It has been interpreted with a true thickness of 90 m. Three or more joint sets exist in conjunction with infill material whose properties result in low friction values; and
· The Beach Unit also has a Q rating rock mass quality of ‘very poor to poor’ and an RQD of less than 50%. It has not been defined at depth due to drilling constraints. It includes three or more joint sets, including quartz veins, with low friction infill materials.
PFAIR\MULL\LIDB\EBBE\mota Pli014_Costerfield_Operations_Ni_43 101_Master_Rev0 28 March 2014
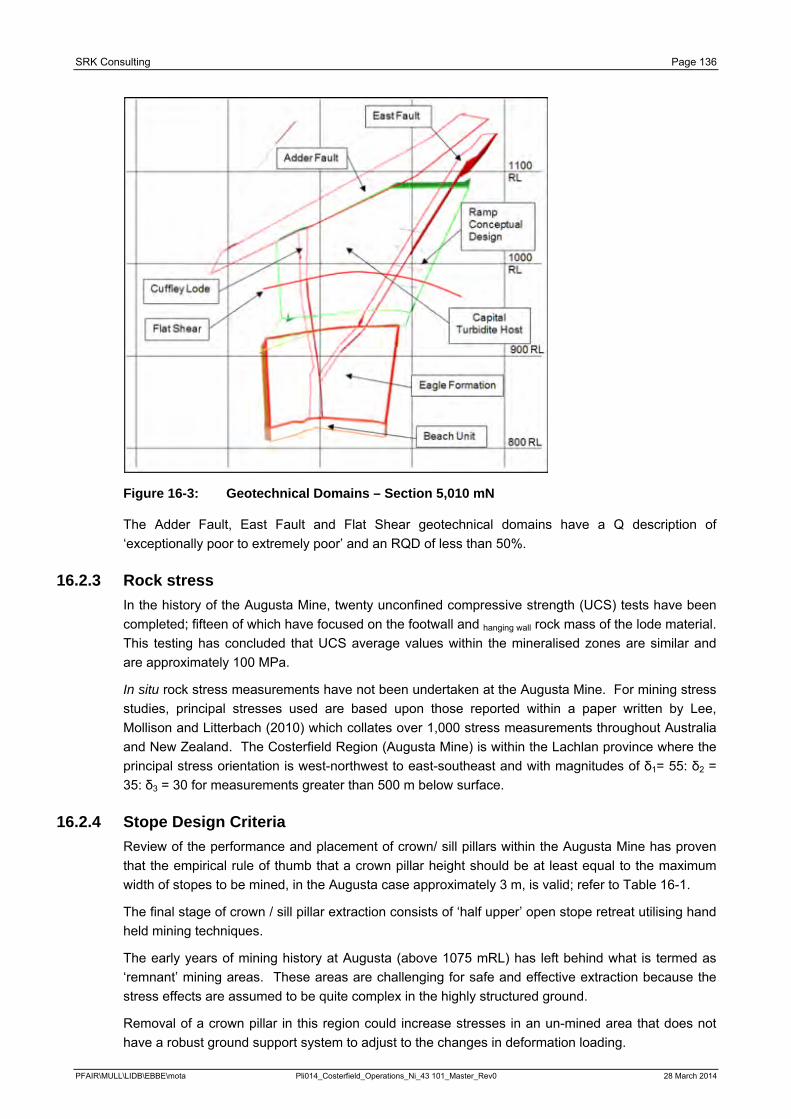
SRK Consulting Page 136
Figure 16-3: Geotechnical Domains – Section 5,010 mN
The Adder Fault, East Fault and Flat Shear geotechnical domains have a Q description of ‘exceptionally poor to extremely poor’ and an RQD of less than 50%.
16.2.3 Rock stress In the history of the Augusta Mine, twenty unconfined compressive strength (UCS) tests have been completed; fifteen of which have focused on the footwall and hanging wall rock mass of the lode material. This testing has concluded that UCS average values within the mineralised zones are similar and are approximately 100 MPa.
In situ rock stress measurements have not been undertaken at the Augusta Mine. For mining stress studies, principal stresses used are based upon those reported within a paper written by Lee, Mollison and Litterbach (2010) which collates over 1,000 stress measurements throughout Australia and New Zealand. The Costerfield Region (Augusta Mine) is within the Lachlan province where the principal stress orientation is west-northwest to east-southeast and with magnitudes of δ1= 55: δ2 = 35: δ3 = 30 for measurements greater than 500 m below surface.
16.2.4 Stope Design Criteria Review of the performance and placement of crown/ sill pillars within the Augusta Mine has proven that the empirical rule of thumb that a crown pillar height should be at least equal to the maximum width of stopes to be mined, in the Augusta case approximately 3 m, is valid; refer to Table 16-1.
The final stage of crown / sill pillar extraction consists of ‘half upper’ open stope retreat utilising hand held mining techniques.
The early years of mining history at Augusta (above 1075 mRL) has left behind what is termed as ‘remnant’ mining areas. These areas are challenging for safe and effective extraction because the stress effects are assumed to be quite complex in the highly structured ground.
Removal of a crown pillar in this region could increase stresses in an un-mined area that does not have a robust ground support system to adjust to the changes in deformation loading.
PFAIR\MULL\LIDB\EBBE\mota Pli014_Costerfield_Operations_Ni_43 101_Master_Rev0 28 March 2014
SRK Consulting Page 137
This becomes critical if there are multiple structures involved and water present.
A central mine access pillar has been planned for the majority of stopes remaining below the 1049 mRL. The primary reason for the use of a central access pillar is to provide a stable production profile due to increased development drive ore tonnes as the level can be mined in both north and south directions compared to a sole direction only (it doubles production development drive heading availability). Table 16-1 lists this method as Option A.
A trial stoping area completed in February 2013, involved a single development drive with an increased level interval of 10 m floor to floor (7 m stope height). Table 16-1 lists this method as Option B.
Temporary and long-term sill pillar placement is important for minimising stress affects within the local mine environment. Stope dimension design and development level interval spacing is critical to minimise increases in mine stresses in the future.
The term ‘hydraulic radius’ (HR) is used to characterise the size and shape of stope surfaces and is a function of the area over perimeter of a given stope surface. The area and perimeter are directly proportional to the selection of level interval spacing. For example, the levels from 1049 mRL down are spaced approximately 7 m apart (refer to Table 16-1, Option A). This results in a development extraction ratio of approximately 40%. The longhole stope dimensions are designed with an 8 m strike length, stability empirical rule. The 7 m level interval in conjunction with 3 m-high production drives results in a hanging wall HR of 2.22, as shown by equation one:
Equation One: HR(Hanging wall span 7 + 3) = (10 x 8)/(2x10)+(2 x 8) = 2.22
If the level interval is increased to 10 m and a 7 m strike length, stability empirical rule adopted (Refer to Table 16-1, Option B), a hanging wall HR of 2.28 is calculated, as shown by equation two:
Equation Two: HR(Hanging wall span 10 + 3) = (13 x 7)/(2x13)+(2 x 7) = 2.28
A level spacing of 10 m results in a development extraction sequence ratio of approximately 30% for Option B. This is the preferred option because it has been observed that ground conditions, through the development process, deteriorate the closer the level interval spacing. One main advantage of the closer level spacing has been the opportunity to support the mid span of stoping blocks.
A longhole stoping performance review and cost analysis from a trial stoping area will be beneficial to provide a sound basis for establishing the final future level spacing design.
Table 16-1: Main Mine Design Parameters
Pillar / Development Type Dimension
Development level spacing
Option A – 7.0 m (8.0 m strike length) 1.8 mW x 2.8 mH
Option B - 10.0 m (7.0 m strike length) 1.8 mW x 2.8 mH
Crown pillar dimensions and spacing 3.0 mW x 3.0 mH (21.0 m vertical spacing)
Dimensions of central access pillar
Option A - shrink retreat 30 m from access centroid
Option B - single retreat direction 15 m from access centroid
Rib pillar dimensions 2.5 m true strike length
Sill pillar dimensions 2.0 mW x 3.0 mH
3.0 m dia. Ventilation Shaft pillar size 10 – 15 m from capital development
Decline stand-off Augusta 50 m
Decline stand-off Cuffley 40 m
PFAIR\MULL\LIDB\EBBE\mota Pli014_Costerfield_Operations_Ni_43 101_Master_Rev0 28 March 2014
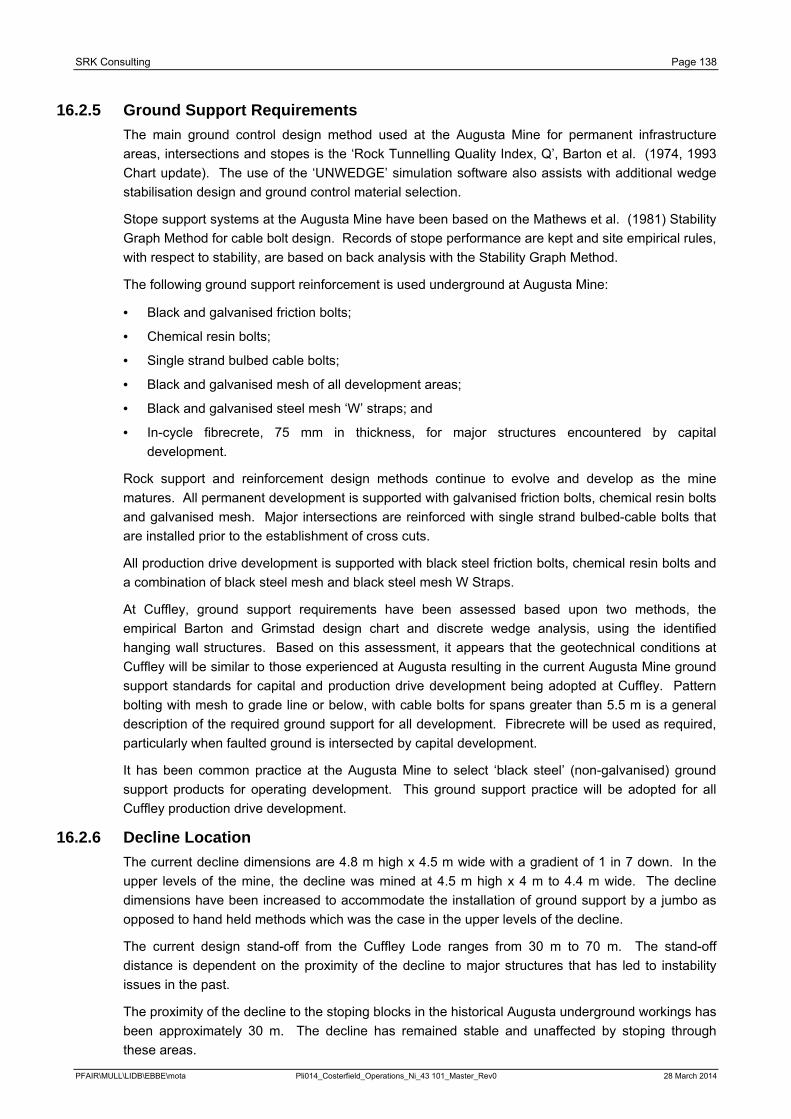
SRK Consulting Page 138
16.2.5 Ground Support Requirements The main ground control design method used at the Augusta Mine for permanent infrastructure areas, intersections and stopes is the ‘Rock Tunnelling Quality Index, Q’, Barton et al. (1974, 1993 Chart update). The use of the ‘UNWEDGE’ simulation software also assists with additional wedge stabilisation design and ground control material selection.
Stope support systems at the Augusta Mine have been based on the Mathews et al. (1981) Stability Graph Method for cable bolt design. Records of stope performance are kept and site empirical rules, with respect to stability, are based on back analysis with the Stability Graph Method.
The following ground support reinforcement is used underground at Augusta Mine:
· Black and galvanised friction bolts;
· Chemical resin bolts;
· Single strand bulbed cable bolts;
· Black and galvanised mesh of all development areas;
· Black and galvanised steel mesh ‘W’ straps; and
· In-cycle fibrecrete, 75 mm in thickness, for major structures encountered by capital development.
Rock support and reinforcement design methods continue to evolve and develop as the mine matures. All permanent development is supported with galvanised friction bolts, chemical resin bolts and galvanised mesh. Major intersections are reinforced with single strand bulbed-cable bolts that are installed prior to the establishment of cross cuts.
All production drive development is supported with black steel friction bolts, chemical resin bolts and a combination of black steel mesh and black steel mesh W Straps.
At Cuffley, ground support requirements have been assessed based upon two methods, the empirical Barton and Grimstad design chart and discrete wedge analysis, using the identified hanging wall structures. Based on this assessment, it appears that the geotechnical conditions at Cuffley will be similar to those experienced at Augusta resulting in the current Augusta Mine ground support standards for capital and production drive development being adopted at Cuffley. Pattern bolting with mesh to grade line or below, with cable bolts for spans greater than 5.5 m is a general description of the required ground support for all development. Fibrecrete will be used as required, particularly when faulted ground is intersected by capital development.
It has been common practice at the Augusta Mine to select ‘black steel’ (non-galvanised) ground support products for operating development. This ground support practice will be adopted for all Cuffley production drive development.
16.2.6 Decline Location The current decline dimensions are 4.8 m high x 4.5 m wide with a gradient of 1 in 7 down. In the upper levels of the mine, the decline was mined at 4.5 m high x 4 m to 4.4 m wide. The decline dimensions have been increased to accommodate the installation of ground support by a jumbo as opposed to hand held methods which was the case in the upper levels of the decline.
The current design stand-off from the Cuffley Lode ranges from 30 m to 70 m. The stand-off distance is dependent on the proximity of the decline to major structures that has led to instability issues in the past.
The proximity of the decline to the stoping blocks in the historical Augusta underground workings has been approximately 30 m. The decline has remained stable and unaffected by stoping through these areas.
PFAIR\MULL\LIDB\EBBE\mota Pli014_Costerfield_Operations_Ni_43 101_Master_Rev0 28 March 2014
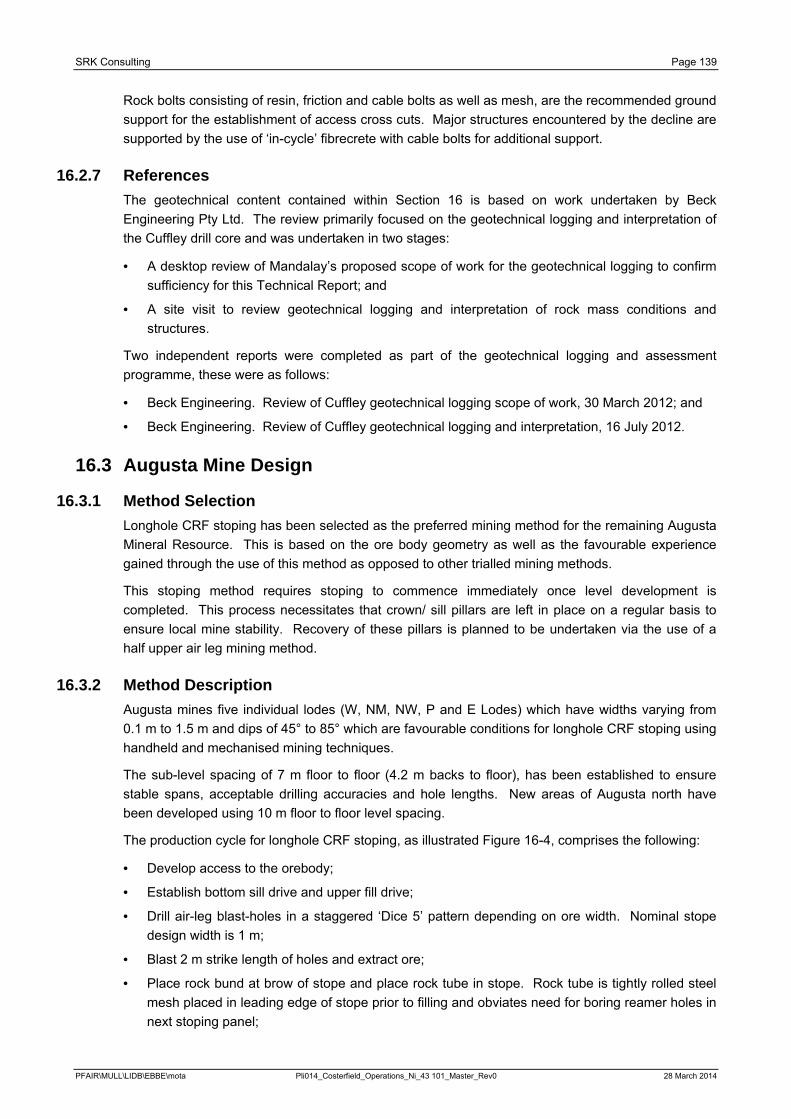
SRK Consulting Page 139
Rock bolts consisting of resin, friction and cable bolts as well as mesh, are the recommended ground support for the establishment of access cross cuts. Major structures encountered by the decline are supported by the use of ‘in-cycle’ fibrecrete with cable bolts for additional support.
16.2.7 References The geotechnical content contained within Section 16 is based on work undertaken by Beck Engineering Pty Ltd. The review primarily focused on the geotechnical logging and interpretation of the Cuffley drill core and was undertaken in two stages:
· A desktop review of Mandalay’s proposed scope of work for the geotechnical logging to confirm sufficiency for this Technical Report; and
· A site visit to review geotechnical logging and interpretation of rock mass conditions and structures.
Two independent reports were completed as part of the geotechnical logging and assessment programme, these were as follows:
· Beck Engineering. Review of Cuffley geotechnical logging scope of work, 30 March 2012; and
· Beck Engineering. Review of Cuffley geotechnical logging and interpretation, 16 July 2012.
16.3 Augusta Mine Design
16.3.1 Method Selection Longhole CRF stoping has been selected as the preferred mining method for the remaining Augusta Mineral Resource. This is based on the ore body geometry as well as the favourable experience gained through the use of this method as opposed to other trialled mining methods.
This stoping method requires stoping to commence immediately once level development is completed. This process necessitates that crown/ sill pillars are left in place on a regular basis to ensure local mine stability. Recovery of these pillars is planned to be undertaken via the use of a half upper air leg mining method.
16.3.2 Method Description Augusta mines five individual lodes (W, NM, NW, P and E Lodes) which have widths varying from 0.1 m to 1.5 m and dips of 45° to 85° which are favourable conditions for longhole CRF stoping using handheld and mechanised mining techniques.
The sub-level spacing of 7 m floor to floor (4.2 m backs to floor), has been established to ensure stable spans, acceptable drilling accuracies and hole lengths. New areas of Augusta north have been developed using 10 m floor to floor level spacing.
The production cycle for longhole CRF stoping, as illustrated Figure 16-4, comprises the following:
· Develop access to the orebody;
· Establish bottom sill drive and upper fill drive;
· Drill air-leg blast-holes in a staggered ‘Dice 5’ pattern depending on ore width. Nominal stope design width is 1 m;
· Blast 2 m strike length of holes and extract ore;
· Place rock bund at brow of stope and place rock tube in stope. Rock tube is tightly rolled steel mesh placed in leading edge of stope prior to filling and obviates need for boring reamer holes in next stoping panel;
PFAIR\MULL\LIDB\EBBE\mota Pli014_Costerfield_Operations_Ni_43 101_Master_Rev0 28 March 2014
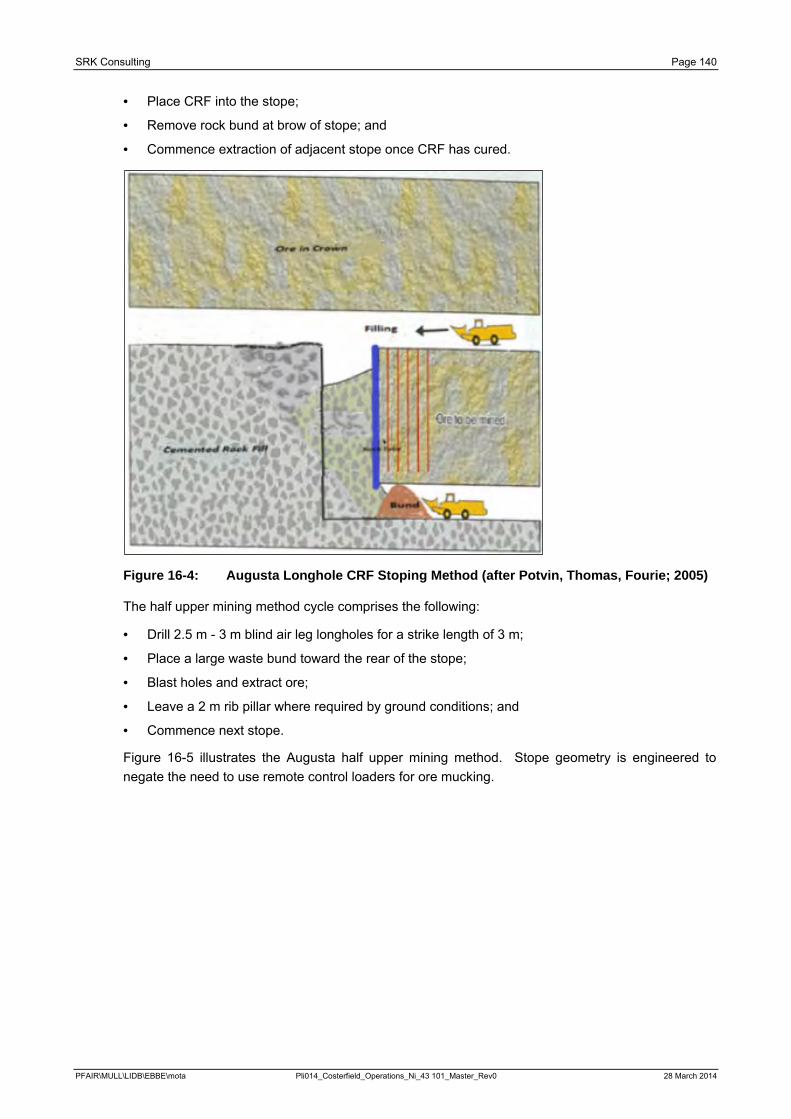
SRK Consulting Page 140
· Place CRF into the stope;
· Remove rock bund at brow of stope; and
· Commence extraction of adjacent stope once CRF has cured.
Figure 16-4: Augusta Longhole CRF Stoping Method (after Potvin, Thomas, Fourie; 2005)
The half upper mining method cycle comprises the following:
· Drill 2.5 m - 3 m blind air leg longholes for a strike length of 3 m;
· Place a large waste bund toward the rear of the stope;
· Blast holes and extract ore;
· Leave a 2 m rib pillar where required by ground conditions; and
· Commence next stope.
Figure 16-5 illustrates the Augusta half upper mining method. Stope geometry is engineered to negate the need to use remote control loaders for ore mucking.
PFAIR\MULL\LIDB\EBBE\mota Pli014_Costerfield_Operations_Ni_43 101_Master_Rev0 28 March 2014
SRK Consulting Page 141
Figure 16-5: Augusta Half Upper Mining Method (Marshall, 2010)
16.3.3 Materials Handling All underground ore is trucked to surface via the Augusta decline and dumped in the box-cut. A private contractor rehandles the ore and transfers it to the Brunswick ROM pad where it is stockpiled, screened, blended and crushed prior to be being fed into the Brunswick Processing Plant.
All other waste is trucked to surface and stockpiled within a temporary waste rock storage facility. A portion of suitable material is screened and utilised underground for CRF. The remaining waste is either trucked across to the Brunswick site for capping the TSF or used in the construction of additional TSF lifts. Approximately 25,000 m3 will remain on the Augusta site to meet future rehabilitation commitments.
PFAIR\MULL\LIDB\EBBE\mota Pli014_Costerfield_Operations_Ni_43 101_Master_Rev0 28 March 2014
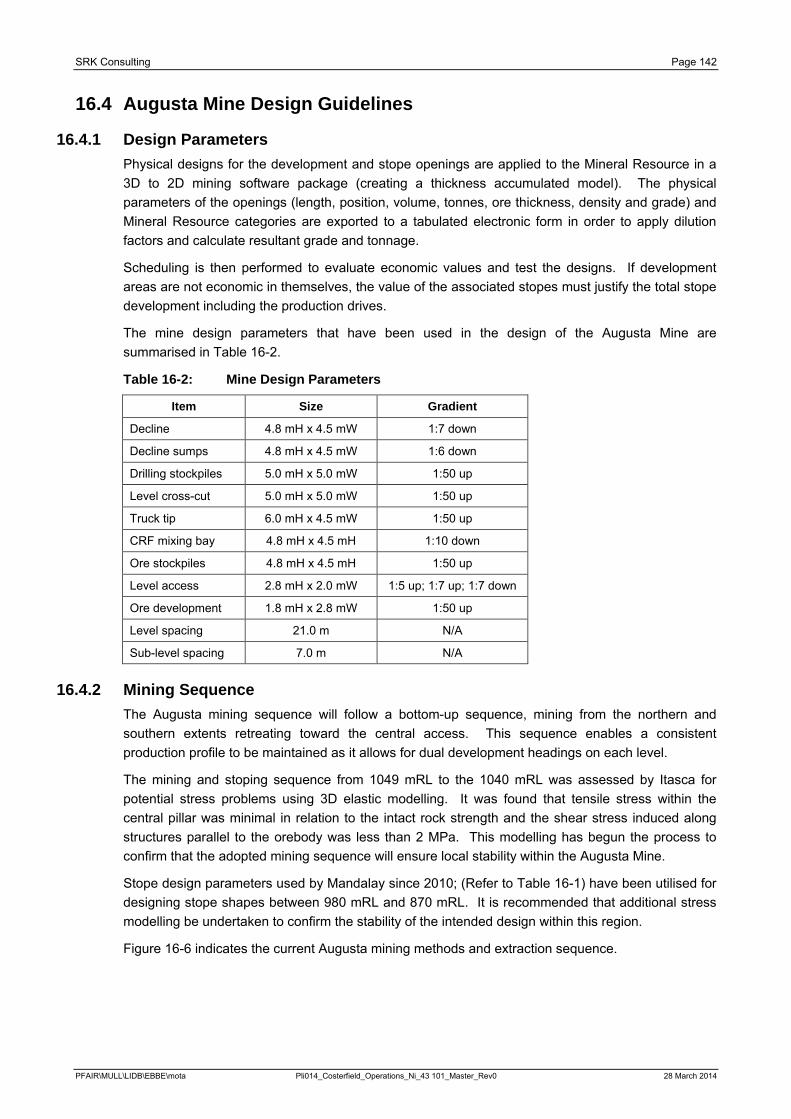
SRK Consulting Page 142
16.4 Augusta Mine Design Guidelines
16.4.1 Design Parameters Physical designs for the development and stope openings are applied to the Mineral Resource in a 3D to 2D mining software package (creating a thickness accumulated model). The physical parameters of the openings (length, position, volume, tonnes, ore thickness, density and grade) and Mineral Resource categories are exported to a tabulated electronic form in order to apply dilution factors and calculate resultant grade and tonnage.
Scheduling is then performed to evaluate economic values and test the designs. If development areas are not economic in themselves, the value of the associated stopes must justify the total stope development including the production drives.
The mine design parameters that have been used in the design of the Augusta Mine are summarised in Table 16-2.
Table 16-2: Mine Design Parameters
Item Size Gradient
Decline 4.8 mH x 4.5 mW 1:7 down
Decline sumps 4.8 mH x 4.5 mW 1:6 down
Drilling stockpiles 5.0 mH x 5.0 mW 1:50 up
Level cross-cut 5.0 mH x 5.0 mW 1:50 up
Truck tip 6.0 mH x 4.5 mW 1:50 up
CRF mixing bay 4.8 mH x 4.5 mH 1:10 down
Ore stockpiles 4.8 mH x 4.5 mH 1:50 up
Level access 2.8 mH x 2.0 mW 1:5 up; 1:7 up; 1:7 down
Ore development 1.8 mH x 2.8 mW 1:50 up
Level spacing 21.0 m N/A
Sub-level spacing 7.0 m N/A
16.4.2 Mining Sequence The Augusta mining sequence will follow a bottom-up sequence, mining from the northern and southern extents retreating toward the central access. This sequence enables a consistent production profile to be maintained as it allows for dual development headings on each level.
The mining and stoping sequence from 1049 mRL to the 1040 mRL was assessed by Itasca for potential stress problems using 3D elastic modelling. It was found that tensile stress within the central pillar was minimal in relation to the intact rock strength and the shear stress induced along structures parallel to the orebody was less than 2 MPa. This modelling has begun the process to confirm that the adopted mining sequence will ensure local stability within the Augusta Mine.
Stope design parameters used by Mandalay since 2010; (Refer to Table 16-1) have been utilised for designing stope shapes between 980 mRL and 870 mRL. It is recommended that additional stress modelling be undertaken to confirm the stability of the intended design within this region.
Figure 16-6 indicates the current Augusta mining methods and extraction sequence.
PFAIR\MULL\LIDB\EBBE\mota Pli014_Costerfield_Operations_Ni_43 101_Master_Rev0 28 March 2014
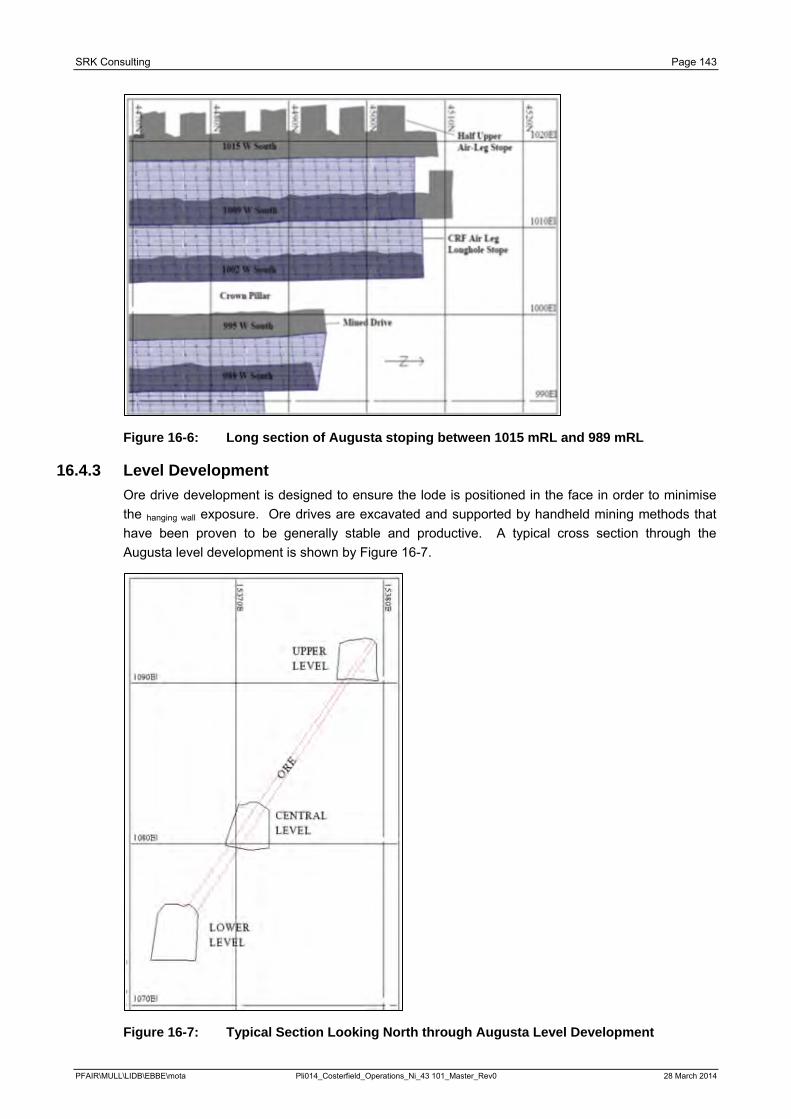
SRK Consulting Page 143
Figure 16-6: Long section of Augusta stoping between 1015 mRL and 989 mRL
16.4.3 Level Development Ore drive development is designed to ensure the lode is positioned in the face in order to minimise the hanging wall exposure. Ore drives are excavated and supported by handheld mining methods that have been proven to be generally stable and productive. A typical cross section through the Augusta level development is shown by Figure 16-7.
Figure 16-7: Typical Section Looking North through Augusta Level Development
PFAIR\MULL\LIDB\EBBE\mota Pli014_Costerfield_Operations_Ni_43 101_Master_Rev0 28 March 2014
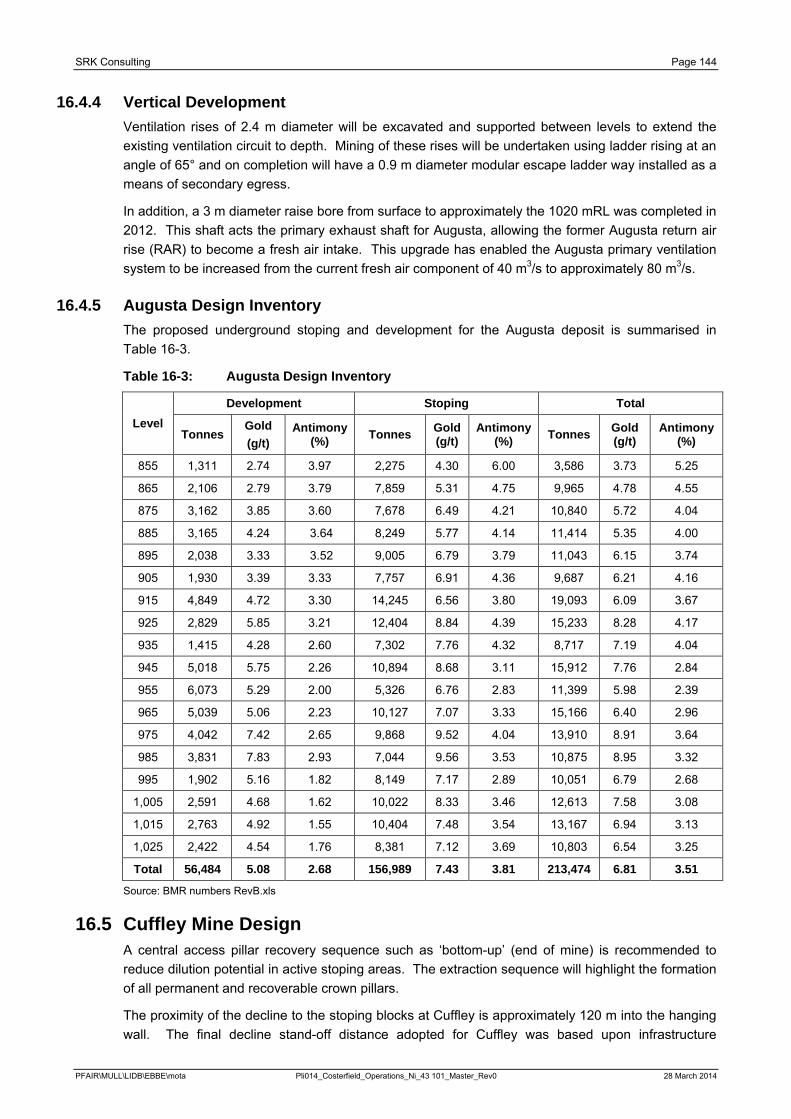
SRK Consulting Page 144
16.4.4 Vertical Development Ventilation rises of 2.4 m diameter will be excavated and supported between levels to extend the existing ventilation circuit to depth. Mining of these rises will be undertaken using ladder rising at an angle of 65° and on completion will have a 0.9 m diameter modular escape ladder way installed as a means of secondary egress.
In addition, a 3 m diameter raise bore from surface to approximately the 1020 mRL was completed in 2012. This shaft acts the primary exhaust shaft for Augusta, allowing the former Augusta return air rise (RAR) to become a fresh air intake. This upgrade has enabled the Augusta primary ventilation system to be increased from the current fresh air component of 40 m3/s to approximately 80 m3/s.
16.4.5 Augusta Design Inventory The proposed underground stoping and development for the Augusta deposit is summarised in Table 16-3.
Table 16-3: Augusta Design Inventory
Level Development Stoping Total
Tonnes Gold (g/t)
Antimony (%) Tonnes Gold
(g/t) Antimony
(%) Tonnes Gold (g/t)
Antimony (%)
855 1,311 2.74 3.97 2,275 4.30 6.00 3,586 3.73 5.25
865 2,106 2.79 3.79 7,859 5.31 4.75 9,965 4.78 4.55
875 3,162 3.85 3.60 7,678 6.49 4.21 10,840 5.72 4.04
885 3,165 4.24 3.64 8,249 5.77 4.14 11,414 5.35 4.00
895 2,038 3.33 3.52 9,005 6.79 3.79 11,043 6.15 3.74
905 1,930 3.39 3.33 7,757 6.91 4.36 9,687 6.21 4.16
915 4,849 4.72 3.30 14,245 6.56 3.80 19,093 6.09 3.67
925 2,829 5.85 3.21 12,404 8.84 4.39 15,233 8.28 4.17
935 1,415 4.28 2.60 7,302 7.76 4.32 8,717 7.19 4.04
945 5,018 5.75 2.26 10,894 8.68 3.11 15,912 7.76 2.84
955 6,073 5.29 2.00 5,326 6.76 2.83 11,399 5.98 2.39
965 5,039 5.06 2.23 10,127 7.07 3.33 15,166 6.40 2.96
975 4,042 7.42 2.65 9,868 9.52 4.04 13,910 8.91 3.64
985 3,831 7.83 2.93 7,044 9.56 3.53 10,875 8.95 3.32
995 1,902 5.16 1.82 8,149 7.17 2.89 10,051 6.79 2.68
1,005 2,591 4.68 1.62 10,022 8.33 3.46 12,613 7.58 3.08
1,015 2,763 4.92 1.55 10,404 7.48 3.54 13,167 6.94 3.13
1,025 2,422 4.54 1.76 8,381 7.12 3.69 10,803 6.54 3.25
Total 56,484 5.08 2.68 156,989 7.43 3.81 213,474 6.81 3.51
Source: BMR numbers RevB.xls
16.5 Cuffley Mine Design A central access pillar recovery sequence such as ‘bottom-up’ (end of mine) is recommended to reduce dilution potential in active stoping areas. The extraction sequence will highlight the formation of all permanent and recoverable crown pillars.
The proximity of the decline to the stoping blocks at Cuffley is approximately 120 m into the hanging wall. The final decline stand-off distance adopted for Cuffley was based upon infrastructure
PFAIR\MULL\LIDB\EBBE\mota Pli014_Costerfield_Operations_Ni_43 101_Master_Rev0 28 March 2014
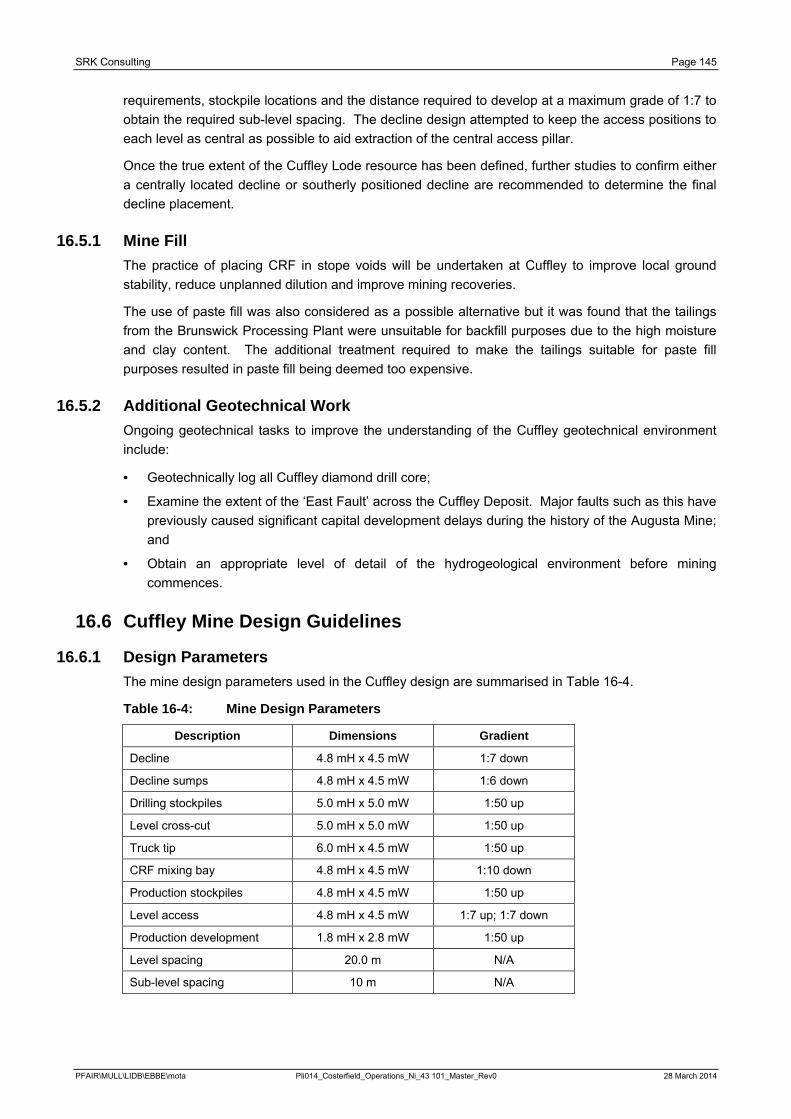
SRK Consulting Page 145
requirements, stockpile locations and the distance required to develop at a maximum grade of 1:7 to obtain the required sub-level spacing. The decline design attempted to keep the access positions to each level as central as possible to aid extraction of the central access pillar.
Once the true extent of the Cuffley Lode resource has been defined, further studies to confirm either a centrally located decline or southerly positioned decline are recommended to determine the final decline placement.
16.5.1 Mine Fill The practice of placing CRF in stope voids will be undertaken at Cuffley to improve local ground stability, reduce unplanned dilution and improve mining recoveries.
The use of paste fill was also considered as a possible alternative but it was found that the tailings from the Brunswick Processing Plant were unsuitable for backfill purposes due to the high moisture and clay content. The additional treatment required to make the tailings suitable for paste fill purposes resulted in paste fill being deemed too expensive.
16.5.2 Additional Geotechnical Work Ongoing geotechnical tasks to improve the understanding of the Cuffley geotechnical environment include:
· Geotechnically log all Cuffley diamond drill core;
· Examine the extent of the ‘East Fault’ across the Cuffley Deposit. Major faults such as this have previously caused significant capital development delays during the history of the Augusta Mine; and
· Obtain an appropriate level of detail of the hydrogeological environment before mining commences.
16.6 Cuffley Mine Design Guidelines
16.6.1 Design Parameters The mine design parameters used in the Cuffley design are summarised in Table 16-4.
Table 16-4: Mine Design Parameters
Description Dimensions Gradient
Decline 4.8 mH x 4.5 mW 1:7 down
Decline sumps 4.8 mH x 4.5 mW 1:6 down
Drilling stockpiles 5.0 mH x 5.0 mW 1:50 up
Level cross-cut 5.0 mH x 5.0 mW 1:50 up
Truck tip 6.0 mH x 4.5 mW 1:50 up
CRF mixing bay 4.8 mH x 4.5 mW 1:10 down
Production stockpiles 4.8 mH x 4.5 mW 1:50 up
Level access 4.8 mH x 4.5 mW 1:7 up; 1:7 down
Production development 1.8 mH x 2.8 mW 1:50 up
Level spacing 20.0 m N/A
Sub-level spacing 10 m N/A
PFAIR\MULL\LIDB\EBBE\mota Pli014_Costerfield_Operations_Ni_43 101_Master_Rev0 28 March 2014
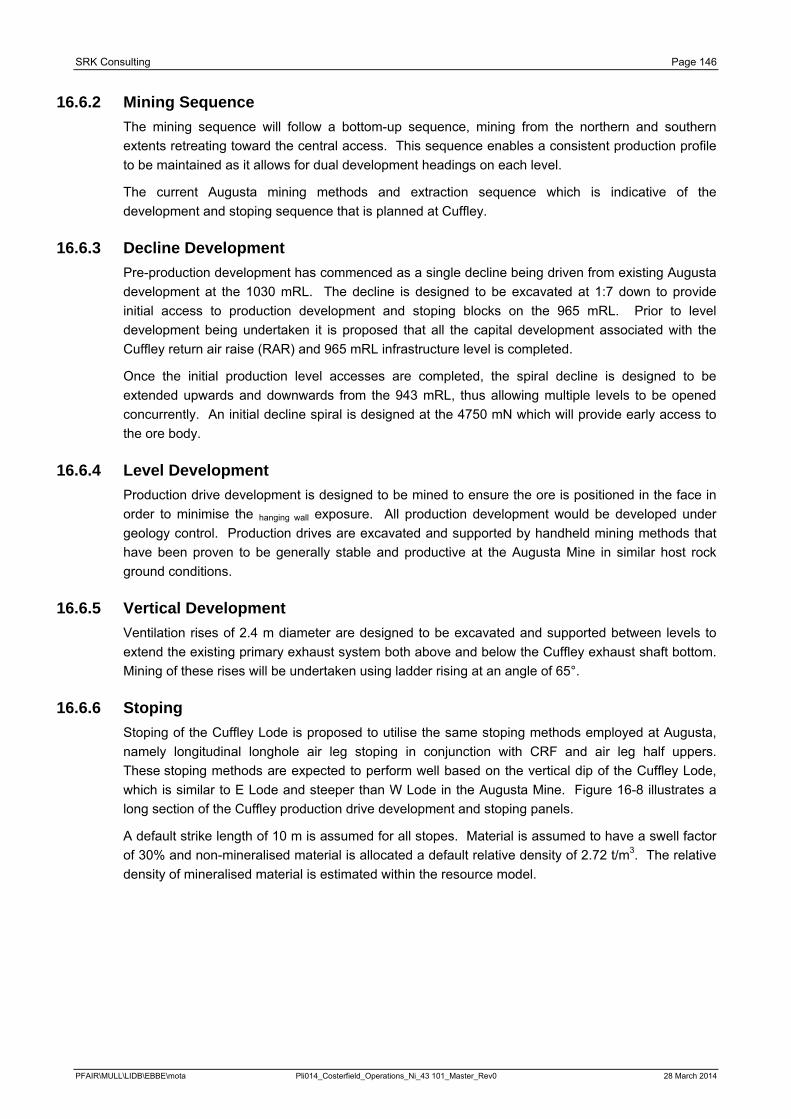
SRK Consulting Page 146
16.6.2 Mining Sequence The mining sequence will follow a bottom-up sequence, mining from the northern and southern extents retreating toward the central access. This sequence enables a consistent production profile to be maintained as it allows for dual development headings on each level.
The current Augusta mining methods and extraction sequence which is indicative of the development and stoping sequence that is planned at Cuffley.
16.6.3 Decline Development Pre-production development has commenced as a single decline being driven from existing Augusta development at the 1030 mRL. The decline is designed to be excavated at 1:7 down to provide initial access to production development and stoping blocks on the 965 mRL. Prior to level development being undertaken it is proposed that all the capital development associated with the Cuffley return air raise (RAR) and 965 mRL infrastructure level is completed.
Once the initial production level accesses are completed, the spiral decline is designed to be extended upwards and downwards from the 943 mRL, thus allowing multiple levels to be opened concurrently. An initial decline spiral is designed at the 4750 mN which will provide early access to the ore body.
16.6.4 Level Development Production drive development is designed to be mined to ensure the ore is positioned in the face in order to minimise the hanging wall exposure. All production development would be developed under geology control. Production drives are excavated and supported by handheld mining methods that have been proven to be generally stable and productive at the Augusta Mine in similar host rock ground conditions.
16.6.5 Vertical Development Ventilation rises of 2.4 m diameter are designed to be excavated and supported between levels to extend the existing primary exhaust system both above and below the Cuffley exhaust shaft bottom. Mining of these rises will be undertaken using ladder rising at an angle of 65°.
16.6.6 Stoping Stoping of the Cuffley Lode is proposed to utilise the same stoping methods employed at Augusta, namely longitudinal longhole air leg stoping in conjunction with CRF and air leg half uppers. These stoping methods are expected to perform well based on the vertical dip of the Cuffley Lode, which is similar to E Lode and steeper than W Lode in the Augusta Mine. Figure 16-8 illustrates a long section of the Cuffley production drive development and stoping panels.
A default strike length of 10 m is assumed for all stopes. Material is assumed to have a swell factor of 30% and non-mineralised material is allocated a default relative density of 2.72 t/m3. The relative density of mineralised material is estimated within the resource model.
PFAIR\MULL\LIDB\EBBE\mota Pli014_Costerfield_Operations_Ni_43 101_Master_Rev0 28 March 2014
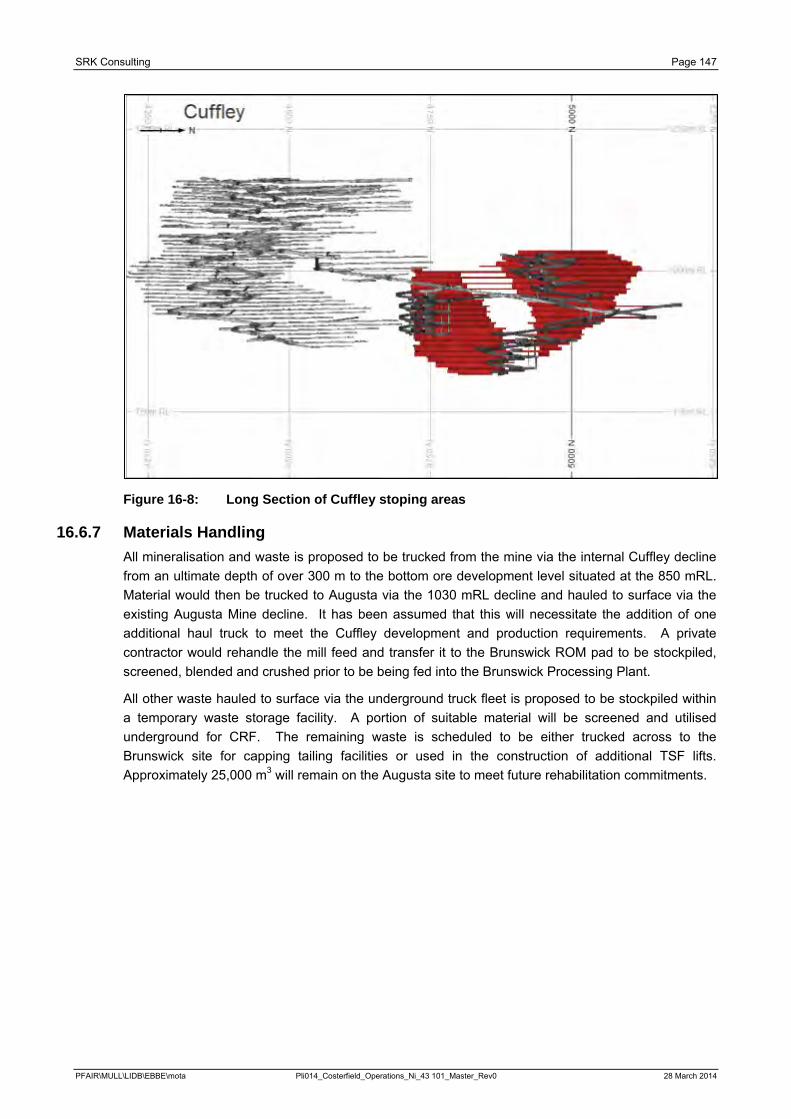
SRK Consulting Page 147
Figure 16-8: Long Section of Cuffley stoping areas
16.6.7 Materials Handling All mineralisation and waste is proposed to be trucked from the mine via the internal Cuffley decline from an ultimate depth of over 300 m to the bottom ore development level situated at the 850 mRL. Material would then be trucked to Augusta via the 1030 mRL decline and hauled to surface via the existing Augusta Mine decline. It has been assumed that this will necessitate the addition of one additional haul truck to meet the Cuffley development and production requirements. A private contractor would rehandle the mill feed and transfer it to the Brunswick ROM pad to be stockpiled, screened, blended and crushed prior to be being fed into the Brunswick Processing Plant.
All other waste hauled to surface via the underground truck fleet is proposed to be stockpiled within a temporary waste storage facility. A portion of suitable material will be screened and utilised underground for CRF. The remaining waste is scheduled to be either trucked across to the Brunswick site for capping tailing facilities or used in the construction of additional TSF lifts. Approximately 25,000 m3 will remain on the Augusta site to meet future rehabilitation commitments.
PFAIR\MULL\LIDB\EBBE\mota Pli014_Costerfield_Operations_Ni_43 101_Master_Rev0 28 March 2014
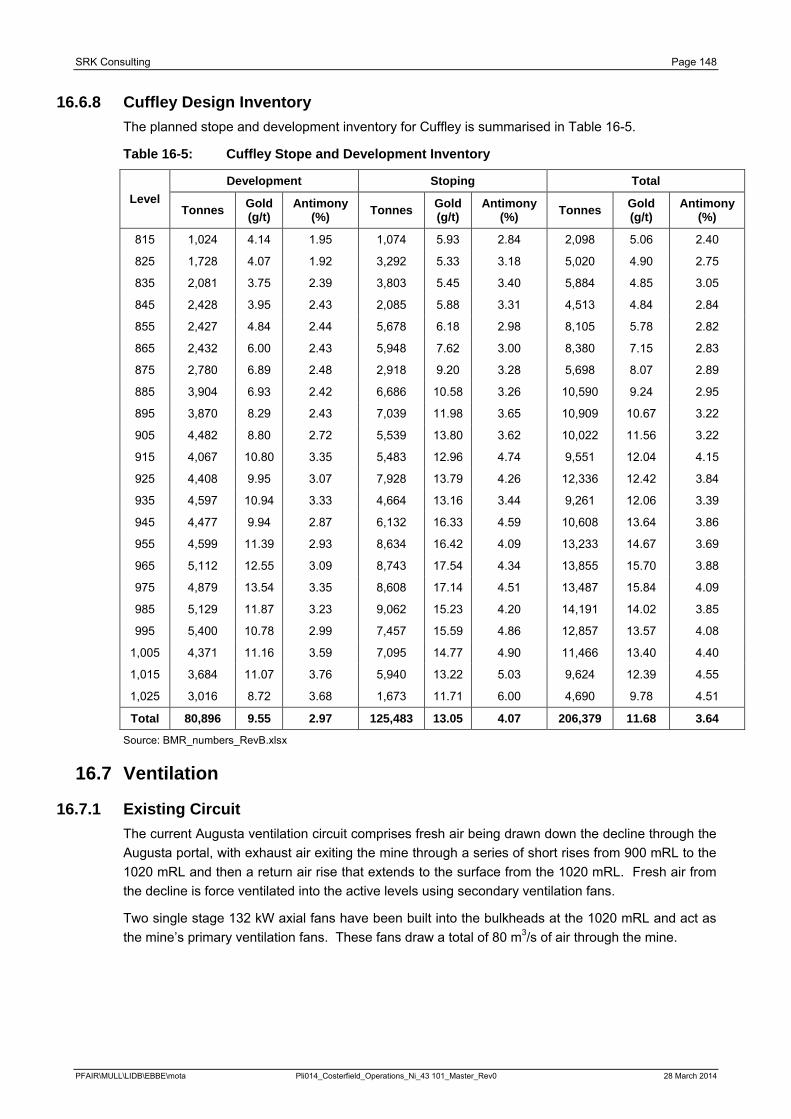
SRK Consulting Page 148
16.6.8 Cuffley Design Inventory The planned stope and development inventory for Cuffley is summarised in Table 16-5.
Table 16-5: Cuffley Stope and Development Inventory
Level Development Stoping Total
Tonnes Gold (g/t)
Antimony (%) Tonnes Gold
(g/t) Antimony
(%) Tonnes Gold (g/t)
Antimony (%)
815 1,024 4.14 1.95 1,074 5.93 2.84 2,098 5.06 2.40
825 1,728 4.07 1.92 3,292 5.33 3.18 5,020 4.90 2.75
835 2,081 3.75 2.39 3,803 5.45 3.40 5,884 4.85 3.05
845 2,428 3.95 2.43 2,085 5.88 3.31 4,513 4.84 2.84
855 2,427 4.84 2.44 5,678 6.18 2.98 8,105 5.78 2.82
865 2,432 6.00 2.43 5,948 7.62 3.00 8,380 7.15 2.83
875 2,780 6.89 2.48 2,918 9.20 3.28 5,698 8.07 2.89
885 3,904 6.93 2.42 6,686 10.58 3.26 10,590 9.24 2.95
895 3,870 8.29 2.43 7,039 11.98 3.65 10,909 10.67 3.22
905 4,482 8.80 2.72 5,539 13.80 3.62 10,022 11.56 3.22
915 4,067 10.80 3.35 5,483 12.96 4.74 9,551 12.04 4.15
925 4,408 9.95 3.07 7,928 13.79 4.26 12,336 12.42 3.84
935 4,597 10.94 3.33 4,664 13.16 3.44 9,261 12.06 3.39
945 4,477 9.94 2.87 6,132 16.33 4.59 10,608 13.64 3.86
955 4,599 11.39 2.93 8,634 16.42 4.09 13,233 14.67 3.69
965 5,112 12.55 3.09 8,743 17.54 4.34 13,855 15.70 3.88
975 4,879 13.54 3.35 8,608 17.14 4.51 13,487 15.84 4.09
985 5,129 11.87 3.23 9,062 15.23 4.20 14,191 14.02 3.85
995 5,400 10.78 2.99 7,457 15.59 4.86 12,857 13.57 4.08
1,005 4,371 11.16 3.59 7,095 14.77 4.90 11,466 13.40 4.40
1,015 3,684 11.07 3.76 5,940 13.22 5.03 9,624 12.39 4.55
1,025 3,016 8.72 3.68 1,673 11.71 6.00 4,690 9.78 4.51
Total 80,896 9.55 2.97 125,483 13.05 4.07 206,379 11.68 3.64
Source: BMR_numbers_RevB.xlsx
16.7 Ventilation
16.7.1 Existing Circuit The current Augusta ventilation circuit comprises fresh air being drawn down the decline through the Augusta portal, with exhaust air exiting the mine through a series of short rises from 900 mRL to the 1020 mRL and then a return air rise that extends to the surface from the 1020 mRL. Fresh air from the decline is force ventilated into the active levels using secondary ventilation fans.
Two single stage 132 kW axial fans have been built into the bulkheads at the 1020 mRL and act as the mine’s primary ventilation fans. These fans draw a total of 80 m3/s of air through the mine.
PFAIR\MULL\LIDB\EBBE\mota Pli014_Costerfield_Operations_Ni_43 101_Master_Rev0 28 March 2014
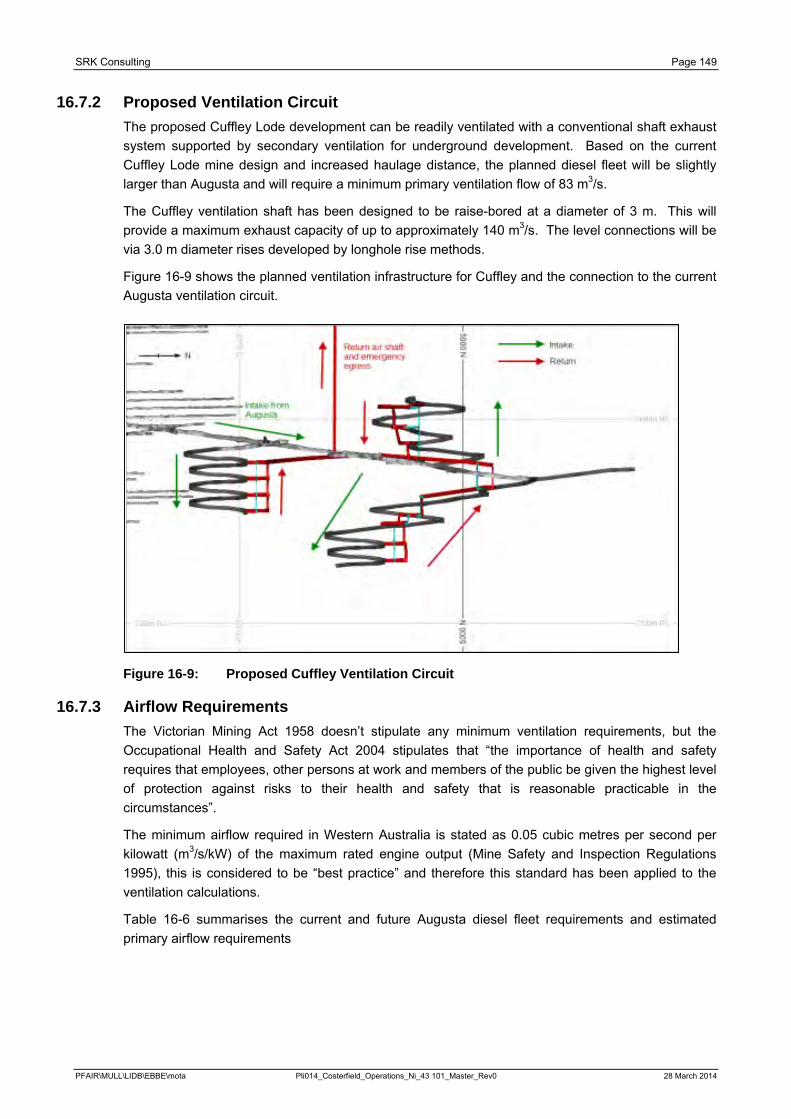
SRK Consulting Page 149
16.7.2 Proposed Ventilation Circuit The proposed Cuffley Lode development can be readily ventilated with a conventional shaft exhaust system supported by secondary ventilation for underground development. Based on the current Cuffley Lode mine design and increased haulage distance, the planned diesel fleet will be slightly larger than Augusta and will require a minimum primary ventilation flow of 83 m3/s.
The Cuffley ventilation shaft has been designed to be raise-bored at a diameter of 3 m. This will provide a maximum exhaust capacity of up to approximately 140 m3/s. The level connections will be via 3.0 m diameter rises developed by longhole rise methods.
Figure 16-9 shows the planned ventilation infrastructure for Cuffley and the connection to the current Augusta ventilation circuit.
Figure 16-9: Proposed Cuffley Ventilation Circuit
16.7.3 Airflow Requirements The Victorian Mining Act 1958 doesn’t stipulate any minimum ventilation requirements, but the Occupational Health and Safety Act 2004 stipulates that “the importance of health and safety requires that employees, other persons at work and members of the public be given the highest level of protection against risks to their health and safety that is reasonable practicable in the circumstances”.
The minimum airflow required in Western Australia is stated as 0.05 cubic metres per second per kilowatt (m3/s/kW) of the maximum rated engine output (Mine Safety and Inspection Regulations 1995), this is considered to be “best practice” and therefore this standard has been applied to the ventilation calculations.
Table 16-6 summarises the current and future Augusta diesel fleet requirements and estimated primary airflow requirements
PFAIR\MULL\LIDB\EBBE\mota Pli014_Costerfield_Operations_Ni_43 101_Master_Rev0 28 March 2014
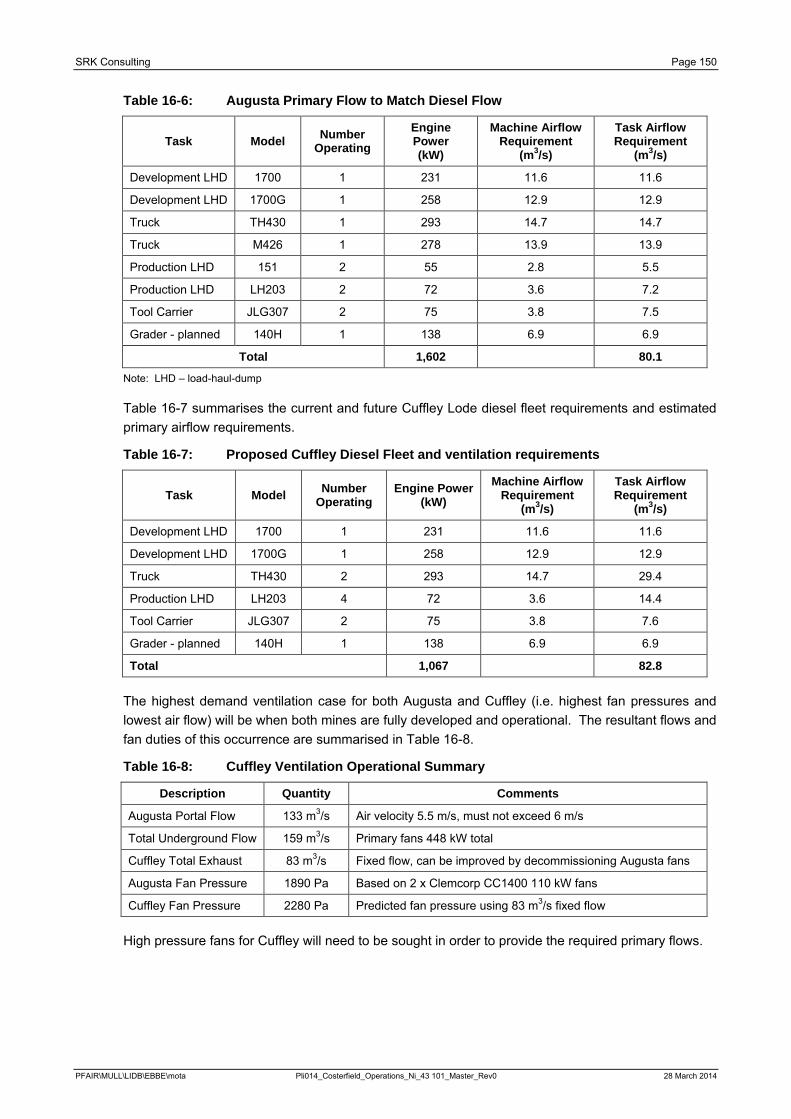
SRK Consulting Page 150
Table 16-6: Augusta Primary Flow to Match Diesel Flow
Task Model Number Operating
Engine Power (kW)
Machine Airflow Requirement
(m3/s)
Task Airflow Requirement
(m3/s)
Development LHD 1700 1 231 11.6 11.6
Development LHD 1700G 1 258 12.9 12.9
Truck TH430 1 293 14.7 14.7
Truck M426 1 278 13.9 13.9
Production LHD 151 2 55 2.8 5.5
Production LHD LH203 2 72 3.6 7.2
Tool Carrier JLG307 2 75 3.8 7.5
Grader - planned 140H 1 138 6.9 6.9
Total 1,602
80.1
Note: LHD – load-haul-dump
Table 16-7 summarises the current and future Cuffley Lode diesel fleet requirements and estimated primary airflow requirements.
Table 16-7: Proposed Cuffley Diesel Fleet and ventilation requirements
Task Model Number Operating
Engine Power (kW)
Machine Airflow Requirement
(m3/s)
Task Airflow Requirement
(m3/s)
Development LHD 1700 1 231 11.6 11.6
Development LHD 1700G 1 258 12.9 12.9
Truck TH430 2 293 14.7 29.4
Production LHD LH203 4 72 3.6 14.4
Tool Carrier JLG307 2 75 3.8 7.6
Grader - planned 140H 1 138 6.9 6.9
Total 1,067 82.8
The highest demand ventilation case for both Augusta and Cuffley (i.e. highest fan pressures and lowest air flow) will be when both mines are fully developed and operational. The resultant flows and fan duties of this occurrence are summarised in Table 16-8.
Table 16-8: Cuffley Ventilation Operational Summary
Description Quantity Comments
Augusta Portal Flow 133 m3/s Air velocity 5.5 m/s, must not exceed 6 m/s
Total Underground Flow 159 m3/s Primary fans 448 kW total
Cuffley Total Exhaust 83 m3/s Fixed flow, can be improved by decommissioning Augusta fans
Augusta Fan Pressure 1890 Pa Based on 2 x Clemcorp CC1400 110 kW fans
Cuffley Fan Pressure 2280 Pa Predicted fan pressure using 83 m3/s fixed flow
High pressure fans for Cuffley will need to be sought in order to provide the required primary flows.
PFAIR\MULL\LIDB\EBBE\mota Pli014_Costerfield_Operations_Ni_43 101_Master_Rev0 28 March 2014
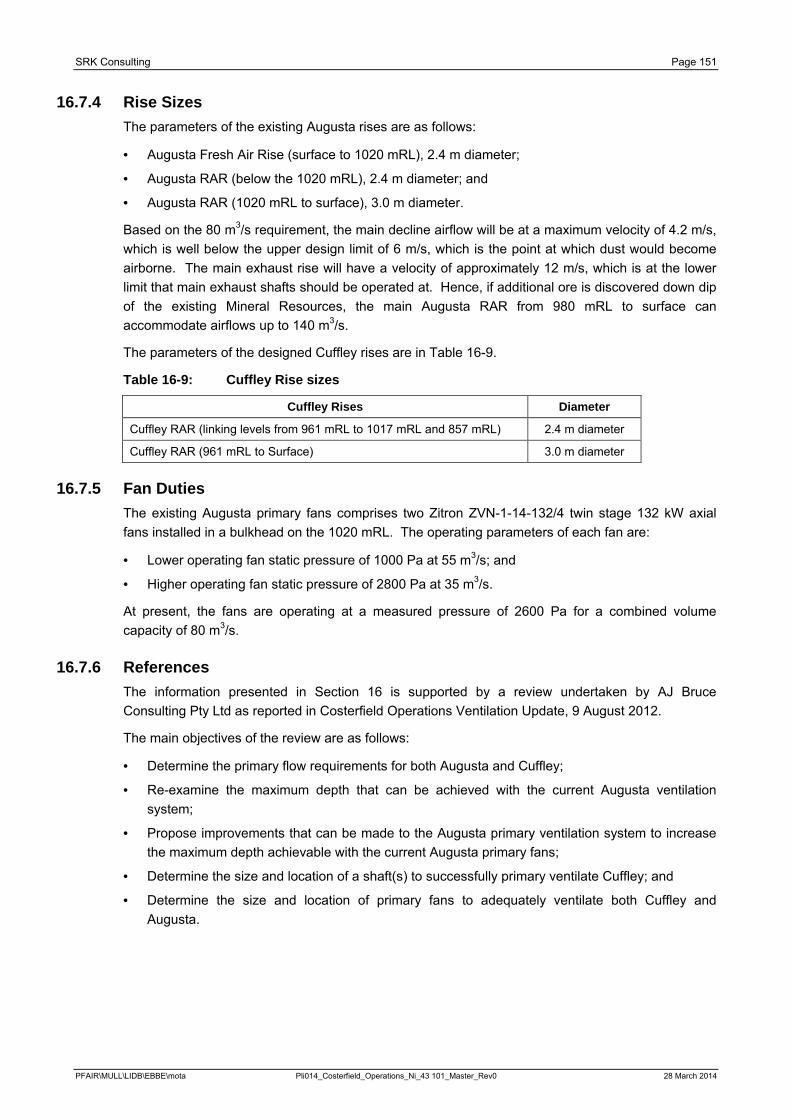
SRK Consulting Page 151
16.7.4 Rise Sizes The parameters of the existing Augusta rises are as follows:
· Augusta Fresh Air Rise (surface to 1020 mRL), 2.4 m diameter;
· Augusta RAR (below the 1020 mRL), 2.4 m diameter; and
· Augusta RAR (1020 mRL to surface), 3.0 m diameter.
Based on the 80 m3/s requirement, the main decline airflow will be at a maximum velocity of 4.2 m/s, which is well below the upper design limit of 6 m/s, which is the point at which dust would become airborne. The main exhaust rise will have a velocity of approximately 12 m/s, which is at the lower limit that main exhaust shafts should be operated at. Hence, if additional ore is discovered down dip of the existing Mineral Resources, the main Augusta RAR from 980 mRL to surface can accommodate airflows up to 140 m3/s.
The parameters of the designed Cuffley rises are in Table 16-9.
Table 16-9: Cuffley Rise sizes
Cuffley Rises Diameter
Cuffley RAR (linking levels from 961 mRL to 1017 mRL and 857 mRL) 2.4 m diameter
Cuffley RAR (961 mRL to Surface) 3.0 m diameter
16.7.5 Fan Duties The existing Augusta primary fans comprises two Zitron ZVN-1-14-132/4 twin stage 132 kW axial fans installed in a bulkhead on the 1020 mRL. The operating parameters of each fan are:
· Lower operating fan static pressure of 1000 Pa at 55 m3/s; and
· Higher operating fan static pressure of 2800 Pa at 35 m3/s.
At present, the fans are operating at a measured pressure of 2600 Pa for a combined volume capacity of 80 m3/s.
16.7.6 References The information presented in Section 16 is supported by a review undertaken by AJ Bruce Consulting Pty Ltd as reported in Costerfield Operations Ventilation Update, 9 August 2012.
The main objectives of the review are as follows:
· Determine the primary flow requirements for both Augusta and Cuffley;
· Re-examine the maximum depth that can be achieved with the current Augusta ventilation system;
· Propose improvements that can be made to the Augusta primary ventilation system to increase the maximum depth achievable with the current Augusta primary fans;
· Determine the size and location of a shaft(s) to successfully primary ventilate Cuffley; and
· Determine the size and location of primary fans to adequately ventilate both Cuffley and Augusta.
PFAIR\MULL\LIDB\EBBE\mota Pli014_Costerfield_Operations_Ni_43 101_Master_Rev0 28 March 2014
SRK Consulting Page 152
16.8 Backfill CRF is mixed in batches of 24 t of -150 mm aggregate (stockpiled on surface from waste material screened periodically by cartage contractor and carted to CRF mixing bays as required) with 1,200 kg ordinary Portland cement and 660 L water. The 24 t of aggregate is equivalent to 3 x R1700 loader buckets and is loaded into trucks from the stockpile using an R1700 loader. The truck then conveys the dry aggregate to a CRF mixing bay proximal to the stope been filled (mixing bays are located at each access). The hydrated cement mix is batched on surface using a batching plant supplied on contract by Mawsons Ltd and is conveyed to the mixing bays using a leased agitator truck specifically designed for use underground. Mandalay is investigating options for purchasing a suitable agitator truck.
Emergency dump and wash-out areas are located underground should a load of batched cement need to be disposed of before curing in the agitator bowl.
The CRF is mixed mechanically in the mixing bays by means of bogger bucket prior to been trammed to the top of the stope to be filled using Toro 151 (or equivalent) loader. A bund is placed at an appropriate distance from the top of the stope to minimise potential for loader to overbalance into stope void. Care is taken during placement of the CRF that the rock-tube is not displaced which is secured by chains during filling process.
Nominal curing time is 12 hours and after approximately eight hours the rock bund placed at the brow of the stope is bogged away. There has been no observed failure of the CRF during this process.
Quality of the CRF is ensured by use of PLC control of the cement batching plant and standardised bucket filling of the aggregate. Records are kept of batch quantities for all batches. The CRF has proved effective in minimising dilution during subsequent panel extraction as well as providing better ground stability and has eliminated the requirement for rib pillars.
16.9 Mine Services and Infrastructure
16.9.1 Electrical and Communications Electrical power for the Augusta site is provided by Powercor from the main electricity grid. The existing arrangement for electricity supply comprises a 2,353 kVA (2,000 kW) 22 kV supply. The Augusta Mine reached the limit during the fourth quarter of 2012. The upgrade to power supply will be completed by Powercor in the second quarter of 2014, in the interim; a single 750 kVA diesel generator with an equivalent back up unit will be installed on surface to supply additional power requirements.
Power is reticulated between each level through the RAR system as opposed to the decline, thereby reducing the length of cable runs throughout the mine. High voltage (11 kV) power is fed underground via a service hole from surface to a 1.5 MVA 11 kV substation at the 1020 mRL. From this location, an additional service hole has been drilled to the 935 Sub Station Cuddy which will allow the high voltage cable to be lowered and connected to the 1.5 MVA 11 kV sub-station at this location. From these sub-stations, the power is reticulated to the working areas via cable and distribution boxes.
The Augusta Mine utilises a leaky feeder system for communications that will be extended as the mine develops into new production areas. Underground refuge chambers have direct communication to surface.
PFAIR\MULL\LIDB\EBBE\mota Pli014_Costerfield_Operations_Ni_43 101_Master_Rev0 28 March 2014
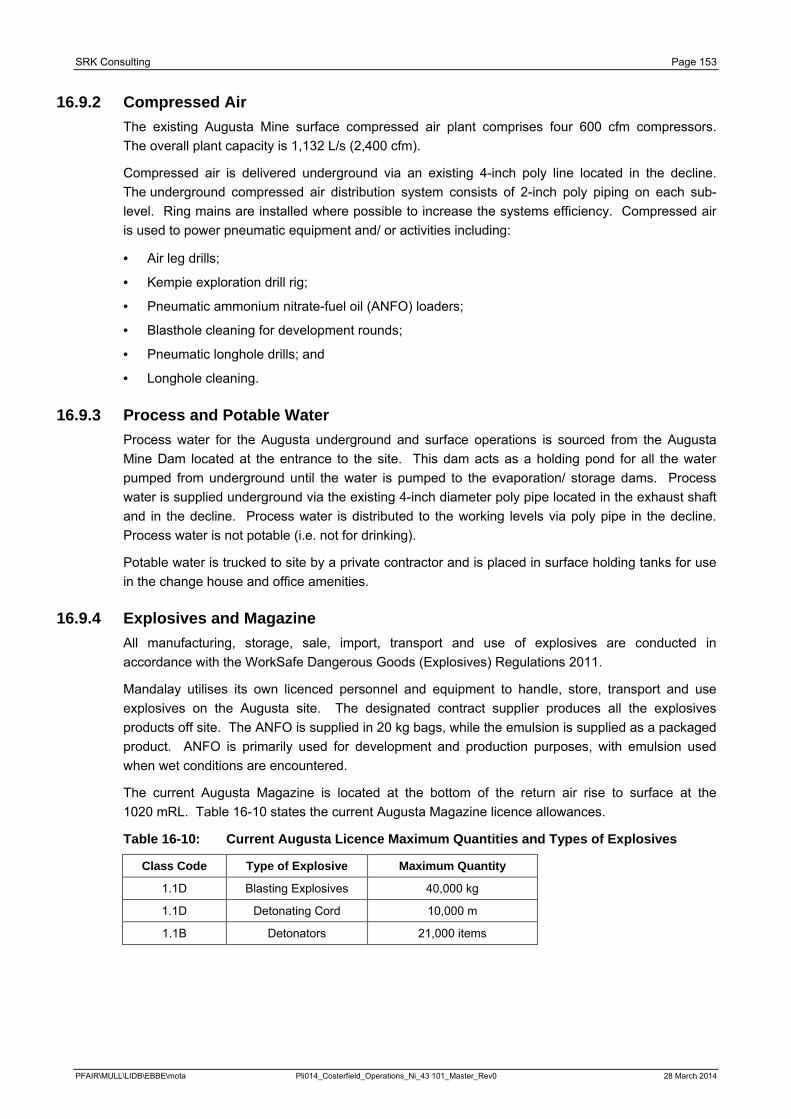
SRK Consulting Page 153
16.9.2 Compressed Air The existing Augusta Mine surface compressed air plant comprises four 600 cfm compressors. The overall plant capacity is 1,132 L/s (2,400 cfm).
Compressed air is delivered underground via an existing 4-inch poly line located in the decline. The underground compressed air distribution system consists of 2-inch poly piping on each sub-level. Ring mains are installed where possible to increase the systems efficiency. Compressed air is used to power pneumatic equipment and/ or activities including:
· Air leg drills;
· Kempie exploration drill rig;
· Pneumatic ammonium nitrate-fuel oil (ANFO) loaders;
· Blasthole cleaning for development rounds;
· Pneumatic longhole drills; and
· Longhole cleaning.
16.9.3 Process and Potable Water Process water for the Augusta underground and surface operations is sourced from the Augusta Mine Dam located at the entrance to the site. This dam acts as a holding pond for all the water pumped from underground until the water is pumped to the evaporation/ storage dams. Process water is supplied underground via the existing 4-inch diameter poly pipe located in the exhaust shaft and in the decline. Process water is distributed to the working levels via poly pipe in the decline. Process water is not potable (i.e. not for drinking).
Potable water is trucked to site by a private contractor and is placed in surface holding tanks for use in the change house and office amenities.
16.9.4 Explosives and Magazine All manufacturing, storage, sale, import, transport and use of explosives are conducted in accordance with the WorkSafe Dangerous Goods (Explosives) Regulations 2011.
Mandalay utilises its own licenced personnel and equipment to handle, store, transport and use explosives on the Augusta site. The designated contract supplier produces all the explosives products off site. The ANFO is supplied in 20 kg bags, while the emulsion is supplied as a packaged product. ANFO is primarily used for development and production purposes, with emulsion used when wet conditions are encountered.
The current Augusta Magazine is located at the bottom of the return air rise to surface at the 1020 mRL. Table 16-10 states the current Augusta Magazine licence allowances.
Table 16-10: Current Augusta Licence Maximum Quantities and Types of Explosives
Class Code Type of Explosive Maximum Quantity
1.1D Blasting Explosives 40,000 kg
1.1D Detonating Cord 10,000 m
1.1B Detonators 21,000 items
PFAIR\MULL\LIDB\EBBE\mota Pli014_Costerfield_Operations_Ni_43 101_Master_Rev0 28 March 2014
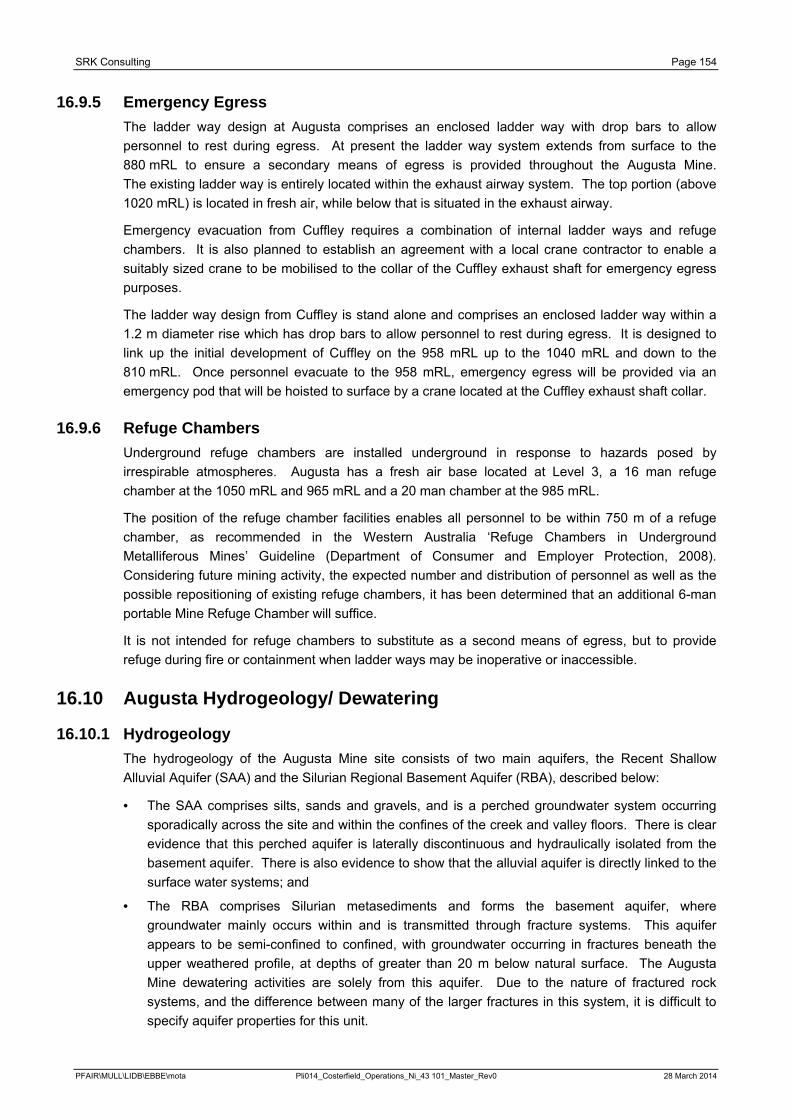
SRK Consulting Page 154
16.9.5 Emergency Egress The ladder way design at Augusta comprises an enclosed ladder way with drop bars to allow personnel to rest during egress. At present the ladder way system extends from surface to the 880 mRL to ensure a secondary means of egress is provided throughout the Augusta Mine. The existing ladder way is entirely located within the exhaust airway system. The top portion (above 1020 mRL) is located in fresh air, while below that is situated in the exhaust airway.
Emergency evacuation from Cuffley requires a combination of internal ladder ways and refuge chambers. It is also planned to establish an agreement with a local crane contractor to enable a suitably sized crane to be mobilised to the collar of the Cuffley exhaust shaft for emergency egress purposes.
The ladder way design from Cuffley is stand alone and comprises an enclosed ladder way within a 1.2 m diameter rise which has drop bars to allow personnel to rest during egress. It is designed to link up the initial development of Cuffley on the 958 mRL up to the 1040 mRL and down to the 810 mRL. Once personnel evacuate to the 958 mRL, emergency egress will be provided via an emergency pod that will be hoisted to surface by a crane located at the Cuffley exhaust shaft collar.
16.9.6 Refuge Chambers Underground refuge chambers are installed underground in response to hazards posed by irrespirable atmospheres. Augusta has a fresh air base located at Level 3, a 16 man refuge chamber at the 1050 mRL and 965 mRL and a 20 man chamber at the 985 mRL.
The position of the refuge chamber facilities enables all personnel to be within 750 m of a refuge chamber, as recommended in the Western Australia ‘Refuge Chambers in Underground Metalliferous Mines’ Guideline (Department of Consumer and Employer Protection, 2008). Considering future mining activity, the expected number and distribution of personnel as well as the possible repositioning of existing refuge chambers, it has been determined that an additional 6-man portable Mine Refuge Chamber will suffice.
It is not intended for refuge chambers to substitute as a second means of egress, but to provide refuge during fire or containment when ladder ways may be inoperative or inaccessible.
16.10 Augusta Hydrogeology/ Dewatering
16.10.1 Hydrogeology The hydrogeology of the Augusta Mine site consists of two main aquifers, the Recent Shallow Alluvial Aquifer (SAA) and the Silurian Regional Basement Aquifer (RBA), described below:
· The SAA comprises silts, sands and gravels, and is a perched groundwater system occurring sporadically across the site and within the confines of the creek and valley floors. There is clear evidence that this perched aquifer is laterally discontinuous and hydraulically isolated from the basement aquifer. There is also evidence to show that the alluvial aquifer is directly linked to the surface water systems; and
· The RBA comprises Silurian metasediments and forms the basement aquifer, where groundwater mainly occurs within and is transmitted through fracture systems. This aquifer appears to be semi-confined to confined, with groundwater occurring in fractures beneath the upper weathered profile, at depths of greater than 20 m below natural surface. The Augusta Mine dewatering activities are solely from this aquifer. Due to the nature of fractured rock systems, and the difference between many of the larger fractures in this system, it is difficult to specify aquifer properties for this unit.
PFAIR\MULL\LIDB\EBBE\mota Pli014_Costerfield_Operations_Ni_43 101_Master_Rev0 28 March 2014
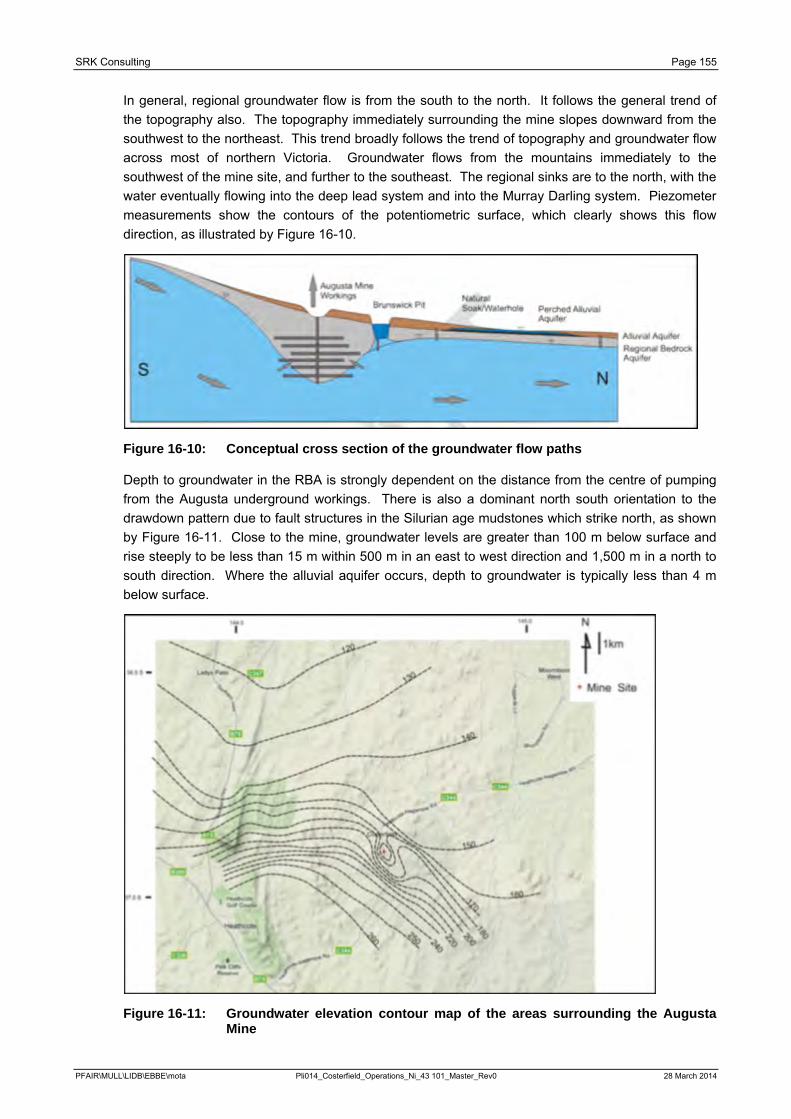
SRK Consulting Page 155
In general, regional groundwater flow is from the south to the north. It follows the general trend of the topography also. The topography immediately surrounding the mine slopes downward from the southwest to the northeast. This trend broadly follows the trend of topography and groundwater flow across most of northern Victoria. Groundwater flows from the mountains immediately to the southwest of the mine site, and further to the southeast. The regional sinks are to the north, with the water eventually flowing into the deep lead system and into the Murray Darling system. Piezometer measurements show the contours of the potentiometric surface, which clearly shows this flow direction, as illustrated by Figure 16-10.
Figure 16-10: Conceptual cross section of the groundwater flow paths
Depth to groundwater in the RBA is strongly dependent on the distance from the centre of pumping from the Augusta underground workings. There is also a dominant north south orientation to the drawdown pattern due to fault structures in the Silurian age mudstones which strike north, as shown by Figure 16-11. Close to the mine, groundwater levels are greater than 100 m below surface and rise steeply to be less than 15 m within 500 m in an east to west direction and 1,500 m in a north to south direction. Where the alluvial aquifer occurs, depth to groundwater is typically less than 4 m below surface.
Figure 16-11: Groundwater elevation contour map of the areas surrounding the Augusta Mine
PFAIR\MULL\LIDB\EBBE\mota Pli014_Costerfield_Operations_Ni_43 101_Master_Rev0 28 March 2014
SRK Consulting Page 156
16.10.2 Dewatering Dewatering of the Augusta Mine used to be undertaken from a combination of surrounding bores, shafts and directly from the decline. As the mine is extended to depth, dewatering Augusta has been via the existing rising main infrastructure. The process of dewatering in front of the mining levels is achieved by leaving the diamond holes drilled from underground open to drain. Due to the fractured nature of the aquifer, the groundwater inflows are not always predictable. Flow rates have continued to increase as the decline advances and more drives are developed.
Removal of the process and ground water is achieved by a staged pump station system. Currently comprising Weartuff WT084 mono pumps located at 1040 mRL, 1030 mRL and 960 mRL. They each have the capacity to pump 240 m of total dynamic head with a total system flow of 12.5 L/s.
The lower working levels utilise electric Flygt pumps to direct water to the 960 mRL mono pumps. One of the 960 mRL mono pump lifts water to the 1030 mRL mono pump which pumps water to surface via the Level 5 rising main. The other 960 mRL mono pump lifts water to the 1040 mRL mono pump which pumps water to surface via the 1040 mRL rising main. This system will need to be extended as the mine progresses vertically. The mine owns an additional WT084 pump which can be used as a travelling mono pump, allowing it to be positioned where required.
16.11 Cuffley Hydrogeology / Dewatering
16.11.1 Hydrogeology Much of the conceptual hydrogeology of the Cuffley Lode is based on information obtained at the Augusta Mine as well as some groundwater bores located in the vicinity of Cuffley. The regional hydrogeology comprises of two main aquifers, the SAA and the RBA, described below:
· The SAA comprises of silts, sands and gravels, and is a perched groundwater system occurring sporadically across the site and within the confines of the creek and valley floors. There is clear evidence that this perched aquifer is laterally discontinuous and is less common in the area around Cuffley due to its distance from surface water systems; and
· The RBA comprises of Silurian metasediments and forms the basement aquifer, where groundwater mainly occurs within and is transmitted through fracture systems. This aquifer appears to be semi-confined to confined, with groundwater occurring in fractures beneath the upper weathered profile, at depths of greater than 20 m below natural surface. Groundwater at Cuffley is likely to occur within the fractures of the RBA.
The Cuffley Lode is displaced from the historical workings of the overlying Alison Reefs via the Adder Fault. This fault is a sub-horizontal puggy fault and is considered to be responsible for partly dewatering the former Alison workings via the Augusta Mine to the east. It is thought that future dewatering of the RBA above Cuffley Lode can be undertaken either through directly pumping groundwater from the Alison Shaft or targeting the Adder Fault via vertical groundwater bores.
It is likely that the future dewatering of Cuffley Lode will be similar to groundwater flows and behaviour experienced at the Augusta Mine. Therefore, due to pre-dewatering of Cuffley, it is anticipated that groundwater inflow will be either less or equal to that experienced at the Augusta Mine.
The Cuffley Lode will be developed horizontally via access through the Augusta Mine at depth, it is likely to have high initial groundwater inflows during the initial development stage. The high initial groundwater flows are likely to decrease as the hydraulic pressure reduces and dewatering occurs. Where Augusta Mine is dewatered via sumps within the underground drives, Cuffley may have the potential to be dewatered through vertical groundwater bores.
PFAIR\MULL\LIDB\EBBE\mota Pli014_Costerfield_Operations_Ni_43 101_Master_Rev0 28 March 2014
SRK Consulting Page 157
To date, there has been no aquifer tests or groundwater sampling conducted directly within the Cuffley Lode. However, groundwater has been sampled from many locations around Cuffley within the RBA. The chemistry is variable, but the salinity is within the range of 5,000 to 8,000 mg/L and pH values being neutral to alkaline at 7 to 8.5. The chemistry is mainly sodium-chloride type and has elevated arsenic and antimony, which is associated with the mineralisation.
The risk to groundwater users and surface water through extraction at Cuffley is considered to be minimal. This is due to no groundwater users being present within the vicinity of Cuffley and the RBA being too saline and yields too low to be a feasible target. In addition, the perched SAA, which is associated with the soaks and surface water system is disconnected from the RBA. This has been observed via long term monitoring of several bores within the RBA and SAA. It is expected that the cone of depression associated with dewatering Cuffley will mimic that seen at the Augusta Mine, being predominately north to south in direction, with minimal drawdown across strike. However, due to the proximity of Augusta to Cuffley and the access decline between, the cones of depression will merge between the two mines.
16.11.2 Dewatering Dewatering Cuffley internally is proposed to be via a rising main. It is expected that the Augusta dewatering has already removed a large amount of water and decreased the head pressure at Cuffley. Removal of process water and ground water will be achieved by a sole pump station located at the 960 mRL. The pump station will comprise of dual Weartuff WT084 mono pumps that have a capacity to each pump 240 m of total dynamic head with a total system flow of 25 L/s. The 960 mRL monos pumps will direct water to surface via a planned 960 mRL rising main (which will be situated within the exhaust shaft).
The lower working levels will utilise electric Flygt pumps to direct water to the 960 mRL mono pumps. This system will need to be extended as the mine progresses vertically. This will occur with the assistance of another currently owned WT084 which can be used as a travelling mono pump, allowing it to be positioned where required at either the Augusta or Cuffley deposit.
16.12 Mineral Reserve Schedule
16.12.1 Development Schedule Development towards the Cuffley Lode commenced in the second half of calendar year (CY) 2013 and is anticipated to be completed during the first quarter of CY2016.
The maximum capital development rates are dependent on the number of headings available for a single jumbo. The estimated capital development advance rates per month used in the development schedule is shown in Table 16-11.
Table 16-11: Jumbo Production Rates
Headings Available 1 2 3
1 Jumbo (m/mth) 140 160 180
The handheld development rates are based upon the assumptions as shown in Table 16-12. The waste development and production development are undertaken by different crews. The production development production rate is less than the waste development rate as it allows time for face sampling and poorer ground conditions.
PFAIR\MULL\LIDB\EBBE\mota PLI014_Costerfield_Operations_NI_43 101_Master_Rev0 28 March 2014
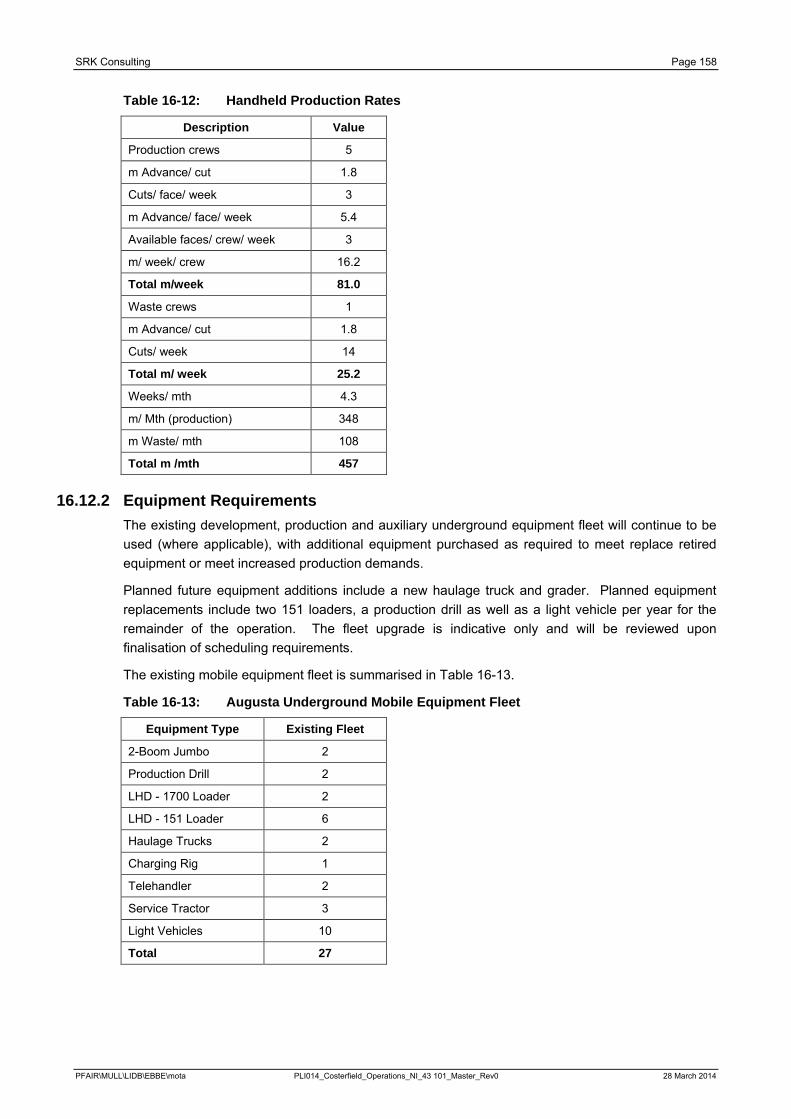
SRK Consulting Page 158
Table 16-12: Handheld Production Rates
Description Value
Production crews 5
m Advance/ cut 1.8
Cuts/ face/ week 3
m Advance/ face/ week 5.4
Available faces/ crew/ week 3
m/ week/ crew 16.2
Total m/week 81.0
Waste crews 1
m Advance/ cut 1.8
Cuts/ week 14
Total m/ week 25.2
Weeks/ mth 4.3
m/ Mth (production) 348
m Waste/ mth 108
Total m /mth 457
16.12.2 Equipment Requirements The existing development, production and auxiliary underground equipment fleet will continue to be used (where applicable), with additional equipment purchased as required to meet replace retired equipment or meet increased production demands.
Planned future equipment additions include a new haulage truck and grader. Planned equipment replacements include two 151 loaders, a production drill as well as a light vehicle per year for the remainder of the operation. The fleet upgrade is indicative only and will be reviewed upon finalisation of scheduling requirements.
The existing mobile equipment fleet is summarised in Table 16-13.
Table 16-13: Augusta Underground Mobile Equipment Fleet
Equipment Type Existing Fleet
2-Boom Jumbo 2
Production Drill 2
LHD - 1700 Loader 2
LHD - 151 Loader 6
Haulage Trucks 2
Charging Rig 1
Telehandler 2
Service Tractor 3
Light Vehicles 10
Total 27
PFAIR\MULL\LIDB\EBBE\mota PLI014_Costerfield_Operations_NI_43 101_Master_Rev0 28 March 2014
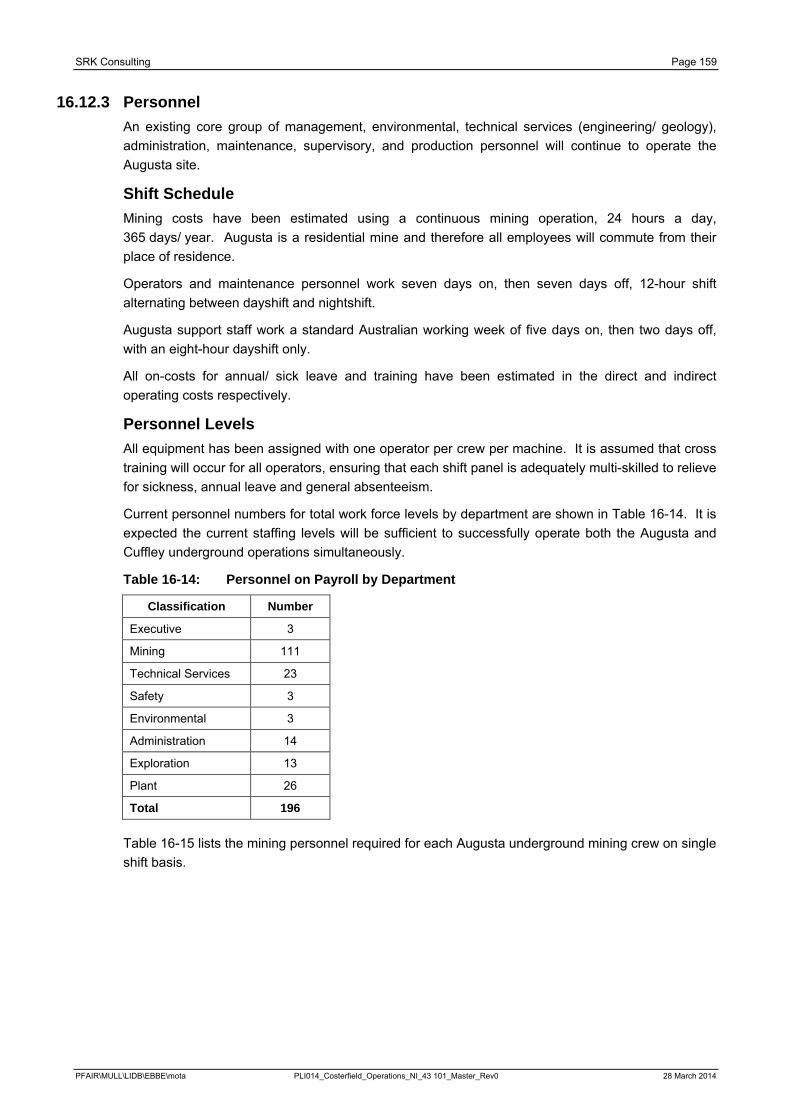
SRK Consulting Page 159
16.12.3 Personnel An existing core group of management, environmental, technical services (engineering/ geology), administration, maintenance, supervisory, and production personnel will continue to operate the Augusta site.
Shift Schedule Mining costs have been estimated using a continuous mining operation, 24 hours a day, 365 days/ year. Augusta is a residential mine and therefore all employees will commute from their place of residence.
Operators and maintenance personnel work seven days on, then seven days off, 12-hour shift alternating between dayshift and nightshift.
Augusta support staff work a standard Australian working week of five days on, then two days off, with an eight-hour dayshift only.
All on-costs for annual/ sick leave and training have been estimated in the direct and indirect operating costs respectively.
Personnel Levels All equipment has been assigned with one operator per crew per machine. It is assumed that cross training will occur for all operators, ensuring that each shift panel is adequately multi-skilled to relieve for sickness, annual leave and general absenteeism.
Current personnel numbers for total work force levels by department are shown in Table 16-14. It is expected the current staffing levels will be sufficient to successfully operate both the Augusta and Cuffley underground operations simultaneously.
Table 16-14: Personnel on Payroll by Department
Classification Number
Executive 3
Mining 111
Technical Services 23
Safety 3
Environmental 3
Administration 14
Exploration 13
Plant 26
Total 196
Table 16-15 lists the mining personnel required for each Augusta underground mining crew on single shift basis.
PFAIR\MULL\LIDB\EBBE\mota PLI014_Costerfield_Operations_NI_43 101_Master_Rev0 28 March 2014
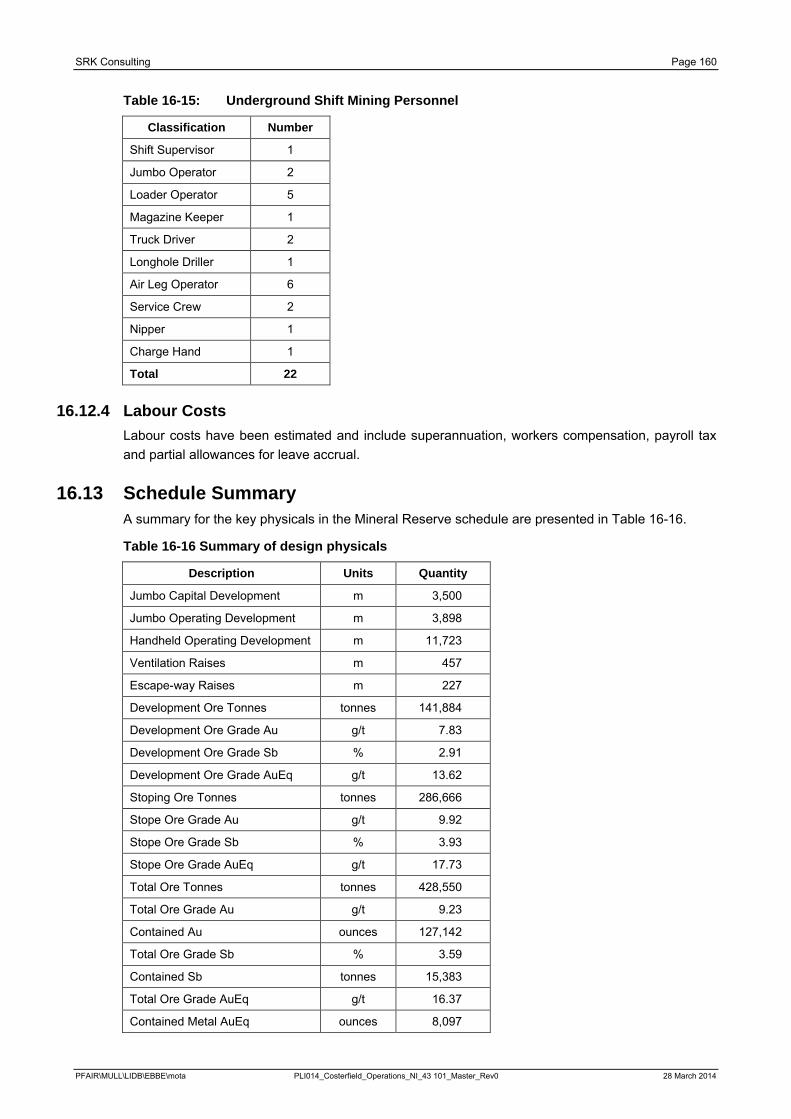
SRK Consulting Page 160
Table 16-15: Underground Shift Mining Personnel
Classification Number
Shift Supervisor 1
Jumbo Operator 2
Loader Operator 5
Magazine Keeper 1
Truck Driver 2
Longhole Driller 1
Air Leg Operator 6
Service Crew 2
Nipper 1
Charge Hand 1
Total 22
16.12.4 Labour Costs Labour costs have been estimated and include superannuation, workers compensation, payroll tax and partial allowances for leave accrual.
16.13 Schedule Summary A summary for the key physicals in the Mineral Reserve schedule are presented in Table 16-16.
Table 16-16 Summary of design physicals
Description Units Quantity
Jumbo Capital Development m 3,500
Jumbo Operating Development m 3,898
Handheld Operating Development m 11,723
Ventilation Raises m 457
Escape-way Raises m 227
Development Ore Tonnes tonnes 141,884
Development Ore Grade Au g/t 7.83
Development Ore Grade Sb % 2.91
Development Ore Grade AuEq g/t 13.62
Stoping Ore Tonnes tonnes 286,666
Stope Ore Grade Au g/t 9.92
Stope Ore Grade Sb % 3.93
Stope Ore Grade AuEq g/t 17.73
Total Ore Tonnes tonnes 428,550
Total Ore Grade Au g/t 9.23
Contained Au ounces 127,142
Total Ore Grade Sb % 3.59
Contained Sb tonnes 15,383
Total Ore Grade AuEq g/t 16.37
Contained Metal AuEq ounces 8,097
PFAIR\MULL\LIDB\EBBE\mota PLI014_Costerfield_Operations_NI_43 101_Master_Rev0 28 March 2014
SRK Consulting Page 161
17 Recovery Methods 17.1 Brunswick Processing Plant
The currently operational Brunswick Processing Plant operates 24 hours/ day, 7 days/ week and processes a sulphide gold-antimony ore. Operation of the crushing plant is restricted to 10 hours/ day, to minimise the effects of noise on the surrounding neighbours. There is also only a 5 hour crushing shift on Saturday and no crushing on Sundays.
The surface crushing and screening system processes underground feed down to a particle size range suitable for milling through an existing ball mill circuit on site. With the inclusion of the portable crushing unit, the capacity of the plant has been successfully upgraded to 10,000 t/mth.
The processing plant comprises of a diesel powered mobile crushing plant which has 16 mm feed screen on recirculating load with an impact crusher. The primary crushed product then forms feed for the original two-stage crushing circuit which utilises the two fine ore bins, two milling stages in series with classification and gravity concentration in closed circuit. The flotation circuit comprises of a rougher, scavenger and single stage cleaner circuit for the production of an antimony/ gold flotation concentrate. The gravity gold concentrates can be either blended with the final flotation concentrate and bagged for shipment to customers in China or further refined via tabling to make a gravity concentrate which is sent to a refinery. The current flotation tailings are sent to a tailings storage facility to the north of the Brunswick Processing Plant. Figure 17-1 illustrates the current Brunswick Processing Plant flowsheet.
17.1.1 Crushing and Screening Circuit The crushing and screening plant consists of primary stage crushing through a diesel powered impact crusher with 16 mm screen on recirculating load. This crushed ore is conveyed to two fine ore bins in parallel utilising the existing jaw crushing circuit as transportation of ore to these bins, each of 120 t capacity. The previously used two stages of jaw crushing circuit is still available for use for redundancy, the primary jaw set at 45 mm gap and the secondary intermeshing with intermediate screening. Both jaw crushers operate in open circuit. This delivers a product of approximately 50% passing 5 mm. A re-feeder system is also utilised so that crushed ore can be stockpiled on the ground in the event the ore bins are full. Crushed ore can then be fed from the stockpile directly into the primary ball mill as needed.
17.1.2 Milling Circuit The fine ore is reclaimed from the bins or stockpile via feeders which discharge onto the primary mill feed conveyor belt as feed to the milling circuit. The milling circuit comprises of two ball mills in series, both in closed circuit. The primary mill operates in closed circuit with a “DSM” screen, with screen oversize returning to the mill and undersize being fed to a centrifugal gravity concentrator to recover a small mass high grade concentrate that is sent either to the concentrate thickener or to gold room for tabling. The gravity concentrate is sent direct to refinery as a separate saleable product. The gravity tailing is pumped to classifying cyclones, the overflow of which becomes the flotation plant feed and the underflow is sent to the secondary ball mill for further size reduction. The secondary ball mill discharge is combined with the DSM screen undersize as feed to the centrifugal gravity concentrator.
A closed circuit mobile crushing plant (Powerscreen XH320SR) with a screen aperture of 16 mm was trialled mostly during September 2012 to assess the impact it would have on the throughput of the existing processing plant. Results proved that this additional crushing capacity was able to improve throughput to 10,000 t/mth. A larger capacity unit (Finlay Terex) was employed on a hire
PFAIR\MULL\LIDB\EBBE\mota PLI014_Costerfield_Operations_NI_43 101_Master_Rev0 28 March 2014
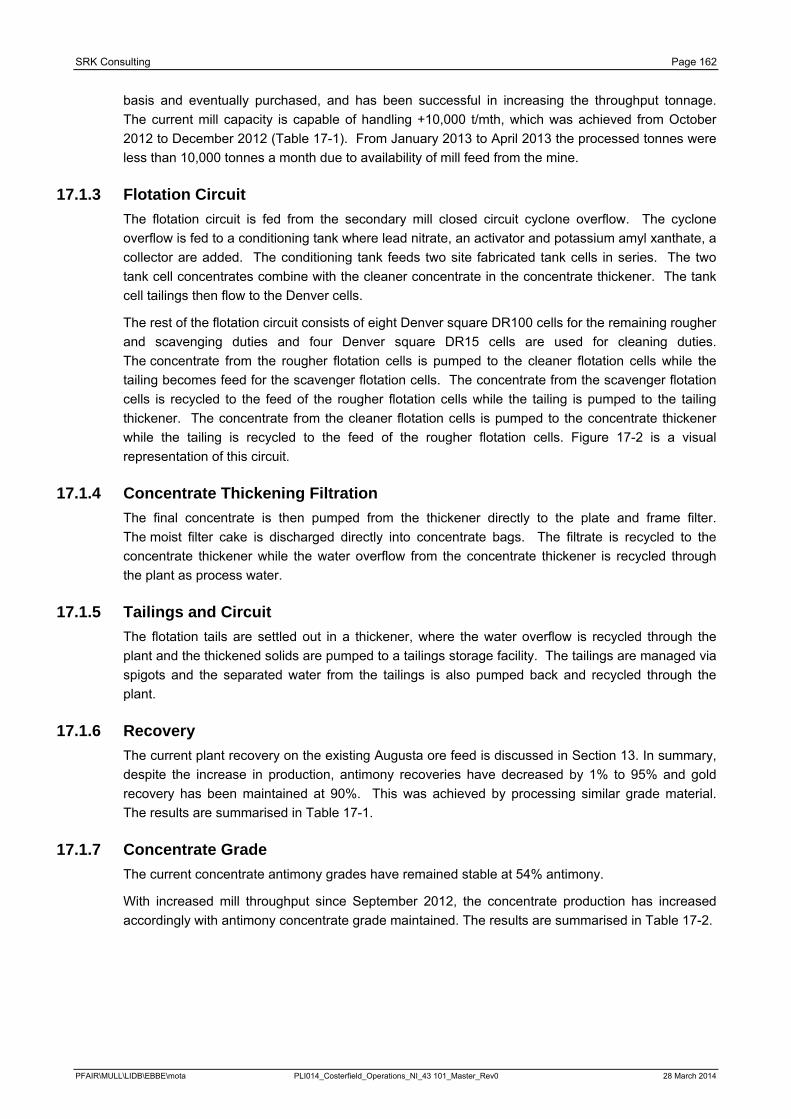
SRK Consulting Page 162
basis and eventually purchased, and has been successful in increasing the throughput tonnage. The current mill capacity is capable of handling +10,000 t/mth, which was achieved from October 2012 to December 2012 (Table 17-1). From January 2013 to April 2013 the processed tonnes were less than 10,000 tonnes a month due to availability of mill feed from the mine.
17.1.3 Flotation Circuit The flotation circuit is fed from the secondary mill closed circuit cyclone overflow. The cyclone overflow is fed to a conditioning tank where lead nitrate, an activator and potassium amyl xanthate, a collector are added. The conditioning tank feeds two site fabricated tank cells in series. The two tank cell concentrates combine with the cleaner concentrate in the concentrate thickener. The tank cell tailings then flow to the Denver cells.
The rest of the flotation circuit consists of eight Denver square DR100 cells for the remaining rougher and scavenging duties and four Denver square DR15 cells are used for cleaning duties. The concentrate from the rougher flotation cells is pumped to the cleaner flotation cells while the tailing becomes feed for the scavenger flotation cells. The concentrate from the scavenger flotation cells is recycled to the feed of the rougher flotation cells while the tailing is pumped to the tailing thickener. The concentrate from the cleaner flotation cells is pumped to the concentrate thickener while the tailing is recycled to the feed of the rougher flotation cells. Figure 17-2 is a visual representation of this circuit.
17.1.4 Concentrate Thickening Filtration The final concentrate is then pumped from the thickener directly to the plate and frame filter. The moist filter cake is discharged directly into concentrate bags. The filtrate is recycled to the concentrate thickener while the water overflow from the concentrate thickener is recycled through the plant as process water.
17.1.5 Tailings and Circuit The flotation tails are settled out in a thickener, where the water overflow is recycled through the plant and the thickened solids are pumped to a tailings storage facility. The tailings are managed via spigots and the separated water from the tailings is also pumped back and recycled through the plant.
17.1.6 Recovery The current plant recovery on the existing Augusta ore feed is discussed in Section 13. In summary, despite the increase in production, antimony recoveries have decreased by 1% to 95% and gold recovery has been maintained at 90%. This was achieved by processing similar grade material. The results are summarised in Table 17-1.
17.1.7 Concentrate Grade The current concentrate antimony grades have remained stable at 54% antimony.
With increased mill throughput since September 2012, the concentrate production has increased accordingly with antimony concentrate grade maintained. The results are summarised in Table 17-2.
PFAIR\MULL\LIDB\EBBE\mota PLI014_Costerfield_Operations_NI_43 101_Master_Rev0 28 March 2014
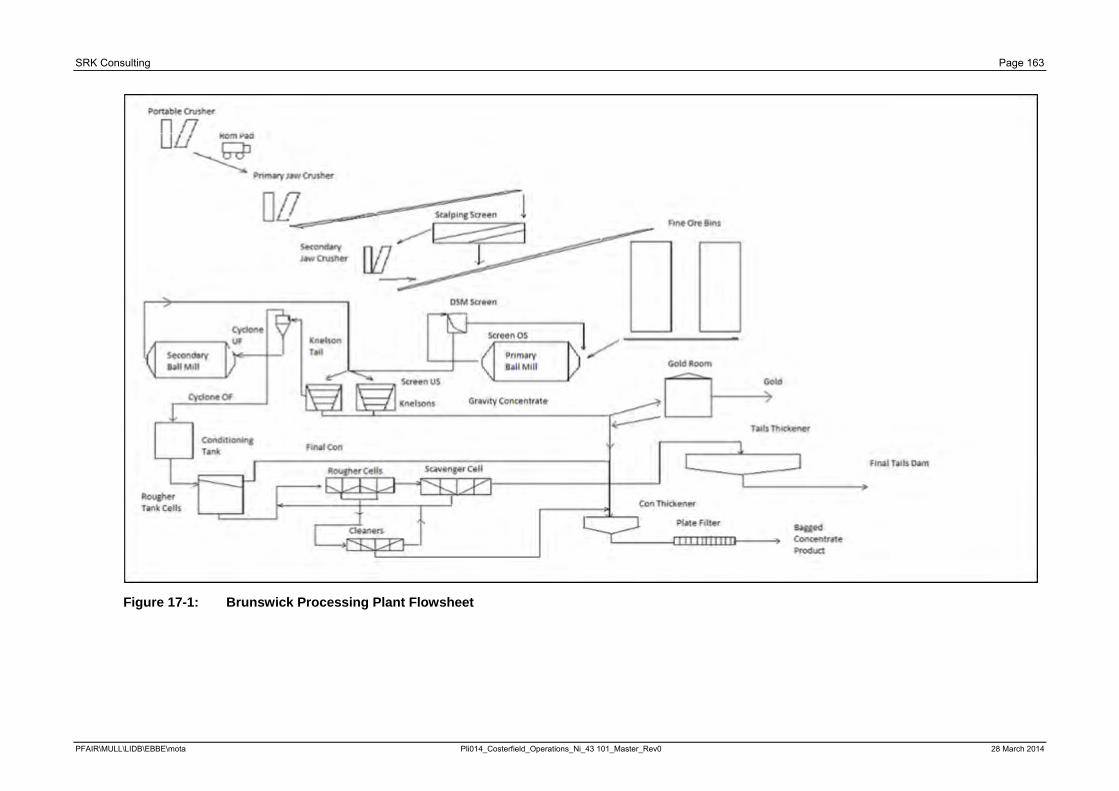
SRK Consulting Page 163
Figure 17-1: Brunswick Processing Plant Flowsheet
PFAIR\MULL\LIDB\EBBE\mota Pli014_Costerfield_Operations_Ni_43 101_Master_Rev0 28 March 2014
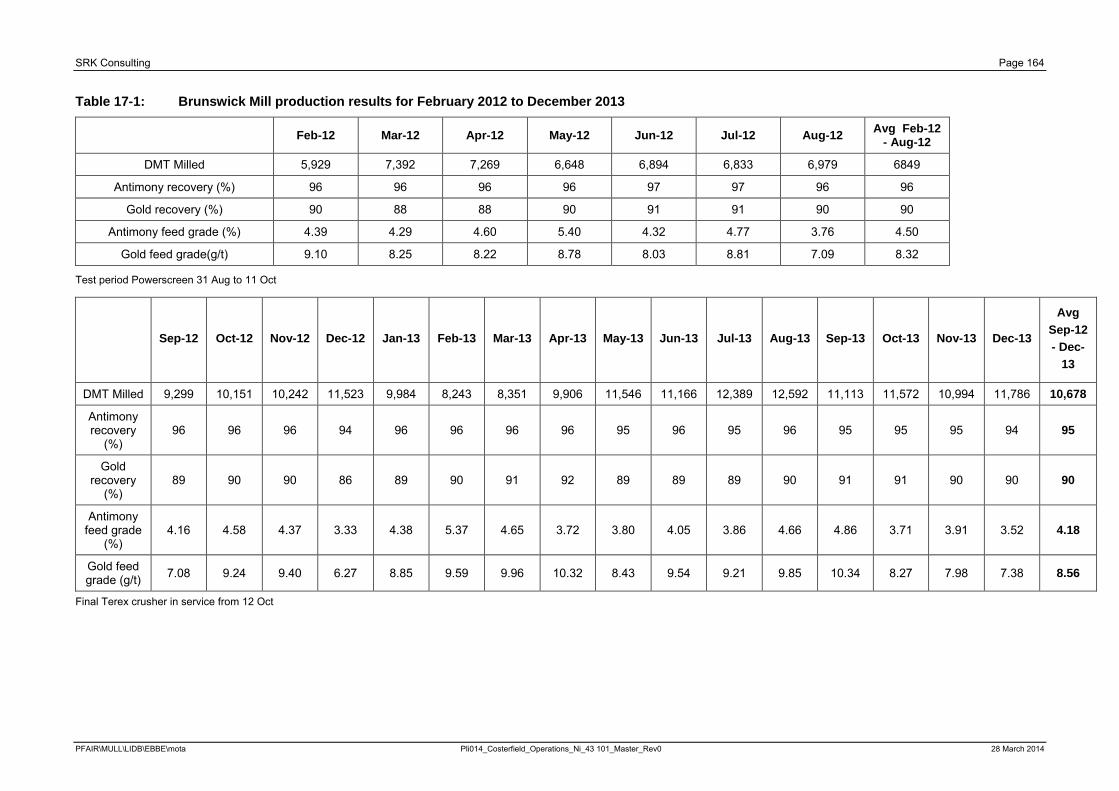
SRK Consulting Page 164
Table 17-1: Brunswick Mill production results for February 2012 to December 2013
Feb-12 Mar-12 Apr-12 May-12 Jun-12 Jul-12 Aug-12 Avg Feb-12 - Aug-12
DMT Milled 5,929 7,392 7,269 6,648 6,894 6,833 6,979 6849
Antimony recovery (%) 96 96 96 96 97 97 96 96
Gold recovery (%) 90 88 88 90 91 91 90 90
Antimony feed grade (%) 4.39 4.29 4.60 5.40 4.32 4.77 3.76 4.50
Gold feed grade(g/t) 9.10 8.25 8.22 8.78 8.03 8.81 7.09 8.32
Test period Powerscreen 31 Aug to 11 Oct
Sep-12 Oct-12 Nov-12 Dec-12 Jan-13 Feb-13 Mar-13 Apr-13 May-13 Jun-13 Jul-13 Aug-13 Sep-13 Oct-13 Nov-13 Dec-13
Avg Sep-12 - Dec-
13
DMT Milled 9,299 10,151 10,242 11,523 9,984 8,243 8,351 9,906 11,546 11,166 12,389 12,592 11,113 11,572 10,994 11,786 10,678
Antimony recovery
(%) 96 96 96 94 96 96 96 96 95 96 95 96 95 95 95 94 95
Gold recovery
(%) 89 90 90 86 89 90 91 92 89 89 89 90 91 91 90 90 90
Antimony feed grade
(%) 4.16 4.58 4.37 3.33 4.38 5.37 4.65 3.72 3.80 4.05 3.86 4.66 4.86 3.71 3.91 3.52 4.18
Gold feed grade (g/t) 7.08 9.24 9.40 6.27 8.85 9.59 9.96 10.32 8.43 9.54 9.21 9.85 10.34 8.27 7.98 7.38 8.56
Final Terex crusher in service from 12 Oct
PFAIR\MULL\LIDB\EBBE\mota Pli014_Costerfield_Operations_Ni_43 101_Master_Rev0 28 March 2014
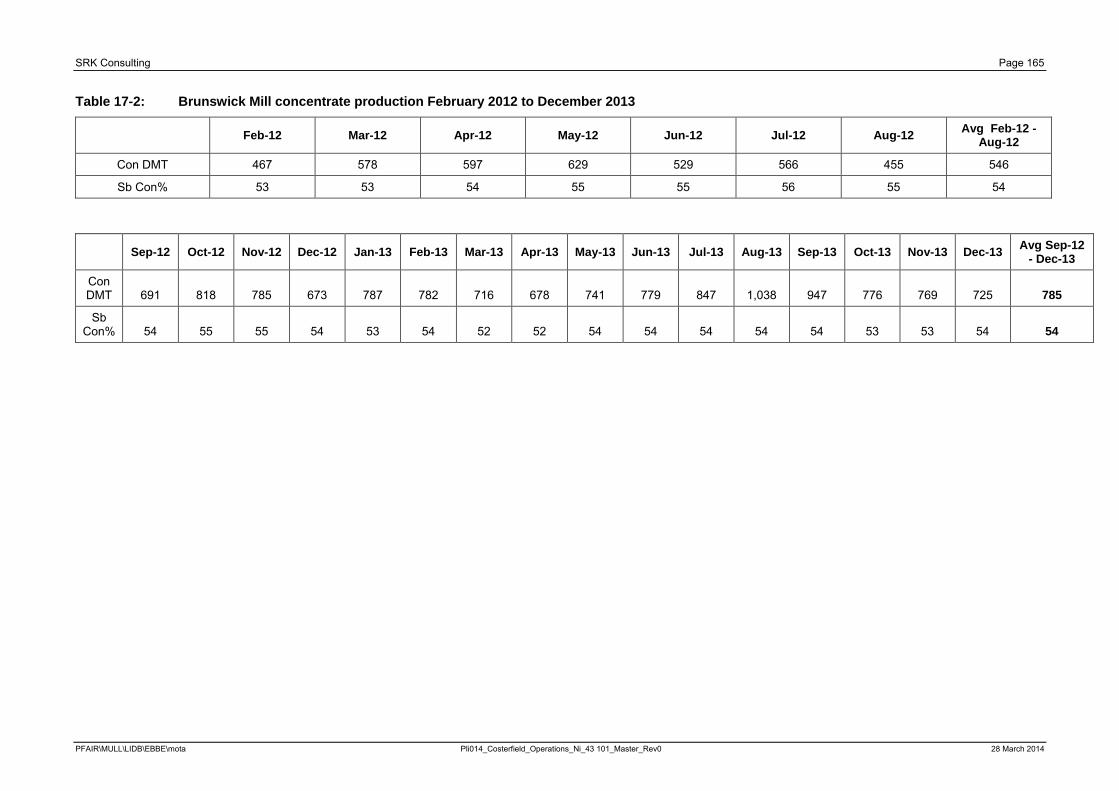
SRK Consulting Page 165
Table 17-2: Brunswick Mill concentrate production February 2012 to December 2013
Feb-12 Mar-12 Apr-12 May-12 Jun-12 Jul-12 Aug-12 Avg Feb-12 - Aug-12
Con DMT 467 578 597 629 529 566 455 546
Sb Con% 53 53 54 55 55 56 55 54
Sep-12 Oct-12 Nov-12 Dec-12 Jan-13 Feb-13 Mar-13 Apr-13 May-13 Jun-13 Jul-13 Aug-13 Sep-13 Oct-13 Nov-13 Dec-13 Avg Sep-12 - Dec-13
Con DMT 691 818 785 673 787 782 716 678 741 779 847 1,038 947 776 769 725 785
Sb Con% 54 55 55 54 53 54 52 52 54 54 54 54 54 53 53 54 54
PFAIR\MULL\LIDB\EBBE\mota Pli014_Costerfield_Operations_Ni_43 101_Master_Rev0 28 March 2014
SRK Consulting Page 166
17.2 Plant Upgrade Following the increased crushing capacity installation, all critical pumps were set up with duty and standby in 2013 and the gold room was upgraded to increase gravity gold handling capacity.
On the basis of current plant performance at higher throughput, it has been determined that a rolling program of minor plant improvements will be completed to continue to improve plant reliability and possibly slightly improve the current performance. Planned for 2014 is refurbishment of the flotation section, cleaner capacity increase and concentrate slurry storage surge installation. The remainder of the plant, including milling, should remain unchanged. These potential upgrades are aimed at increasing reliability, efficiency and maintaining recovery. Figure 17-2 illustrates the proposed upgraded processing plant flowsheet.
17.2.1 Crushing and Screening Circuit The initial trial in September 2012 of a portable crusher was able to establish the improvements in capacity of the mill, which has been maintained at over 10,000 t/mth (ore feed dependant) with the larger portable crushing unit.
By utilising the existing crushing plant conveyors and fine ore bins, the crushed product from the portable crushing plant can be transferred at finer feed size into the ore bins twice a shift to provide consistent feed to the existing milling circuit.
17.2.2 Milling Circuit The milling circuit will remain basically unchanged. Duty/stand-by pumps have been installed on the primary mill discharge hopper. It has been identified during increased throughput trials in December 2012 that the secondary mill recirculation load is the bottleneck of the current milling circuit. This can only be rectified by installing a larger secondary mill if the current flotation feed size distribution is to be maintained.
17.2.3 Flotation Circuit Due to the increased throughput the current flotation circuit has reduced volumetric capacity, and corresponding retention time. Due to the recirculating flows in the flotation section, the cleaner circuit is the bottleneck. The cleaner circuit capacity will be increased in 2014 from four Denver square DR15 cells to six Denver square DR15 cells via refurbishment of off line equipment.
17.2.4 Concentrate Thickening and Filtration A two-stage inline slurry sampler has been installed and was being commissioned at the time of the site visit in March 2014. This shall improve the sampling accuracy of the final concentrate.
The planned installation of an agitated concentrate storage tank between the thickener and filtration steps will further improve overall plant uptime and reliability.
17.2.5 Tailings Circuit The tailings thickener has sufficient capacity to handle the increased tonnage rate. The average tails thickener underflow density has been maintained at around 50% (+/- 10%). This has been achieved since September 2012 processing at increased rates. A duty/ stand-by tailings pump arrangement has been installed on the tails thickener. Additional TSF storage capacity is to be increased during 2014 with a further lift on either the Bombay TSF or Brunswick TSF. The Bombay TSF lift will provide an additional 183,000 m3 of storage and the Brunswick TSF will provide an additional 197,000 m3 of storage. Both work plan variations are at the local Council planning permit
PFAIR\MULL\LIDB\EBBE\mota Pli014_Costerfield_Operations_Ni_43 101_Master_Rev0 28 March 2014
SRK Consulting Page 167
amendment stage. The aim is to proceed with the Brunswick TSF once the required approvals are received. At this stage, the Brunswick TSF embankment raise construction works are scheduled to commence in the second quarter of 2014. This raise will provide sufficient tailings storage capacity until the end of the second quarter of 2016.
17.2.6 Reagent Mixing and Storage No upgrade work is anticipated for the reagent mixing and storage area.
17.2.7 Recovery All improvements planned to the existing circuit will be to maintain current levels of recovery.
17.2.8 Services Water The water services at the Brunswick Processing Plant consist of the raw water, process water and excess water disposal. The plant operates in a positive water balance situation with excess water being lost to the atmosphere by evaporation which is accelerated by the use of an evaporator system at the Brunswick Pit and reverse osmosis at the processing plant. The current reverse osmosis plant is a hired 0.5 ML/day unit and a 2.0 ML/day unit will be installed in 2014.
The process water supply consists of concentrate thickener overflow, tailing thickener overflow and TSF decant return water. Process water is stored in and distributed from a dedicated tank. TSF decant water is stored in a pond adjacent to the plant. As the site is in a positive water balance, adequate process water supplies are available.
Air The Brunswick Concentrator requires both low and high pressure air supplies. Currently, three separate low pressure blowers supply the rougher, scavenger and cleaner cells, with existing tank cells running off high pressure air. The high pressure air supply was upgraded in 2013 to increase the capacity and availability of high pressure air. The filter press runs off high pressure air.
Power Electrical power is currently supplied to the Brunswick Processing Plant and associated mining infrastructure from the Powercor Bendigo Zone Substation. The Brunswick supply consists of 1,000 kVA at 240/415 V and is sufficient for the current capacity of approximately 10,000 t/mth. The current calculated peak load is estimated at 1000 kVA and occurs when all the primary crushing circuit is operational (with the jaw crushers not running – however if the mobile crusher unit is not operable the existing open circuit jaw crushing circuit can be reinstated).
The hired 0.5 ML/day reverse osmosis plant runs off mains power, however the evaporator set up on the Brunswick pit runs via diesel generation. The new 2.0 ML/day reverse osmosis plant to be installed in 2014 will also be powered via diesel generation.
PFAIR\MULL\LIDB\EBBE\mota Pli014_Costerfield_Operations_Ni_43 101_Master_Rev0 28 March 2014
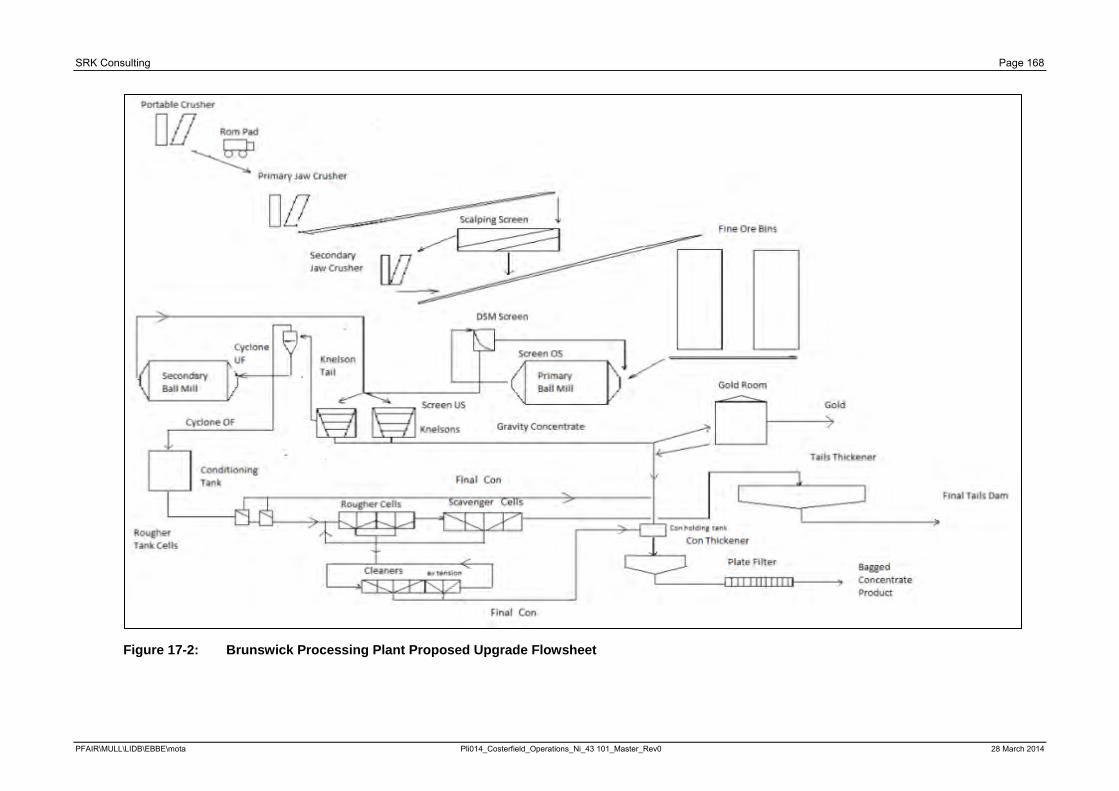
SRK Consulting Page 168
Figure 17-2: Brunswick Processing Plant Proposed Upgrade Flowsheet
PFAIR\MULL\LIDB\EBBE\mota Pli014_Costerfield_Operations_Ni_43 101_Master_Rev0 28 March 2014
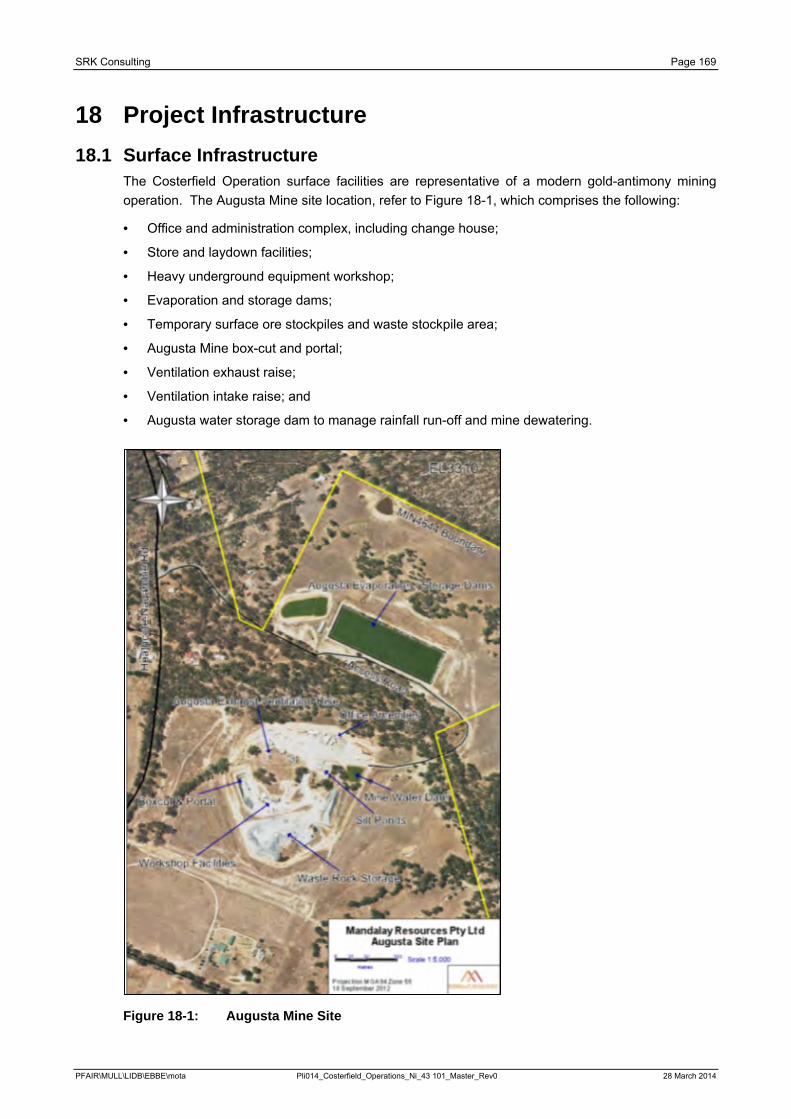
SRK Consulting Page 169
18 Project Infrastructure 18.1 Surface Infrastructure
The Costerfield Operation surface facilities are representative of a modern gold-antimony mining operation. The Augusta Mine site location, refer to Figure 18-1, which comprises the following:
· Office and administration complex, including change house;
· Store and laydown facilities;
· Heavy underground equipment workshop;
· Evaporation and storage dams;
· Temporary surface ore stockpiles and waste stockpile area;
· Augusta Mine box-cut and portal;
· Ventilation exhaust raise;
· Ventilation intake raise; and
· Augusta water storage dam to manage rainfall run-off and mine dewatering.
Figure 18-1: Augusta Mine Site
PFAIR\MULL\LIDB\EBBE\mota Pli014_Costerfield_Operations_Ni_43 101_Master_Rev0 28 March 2014
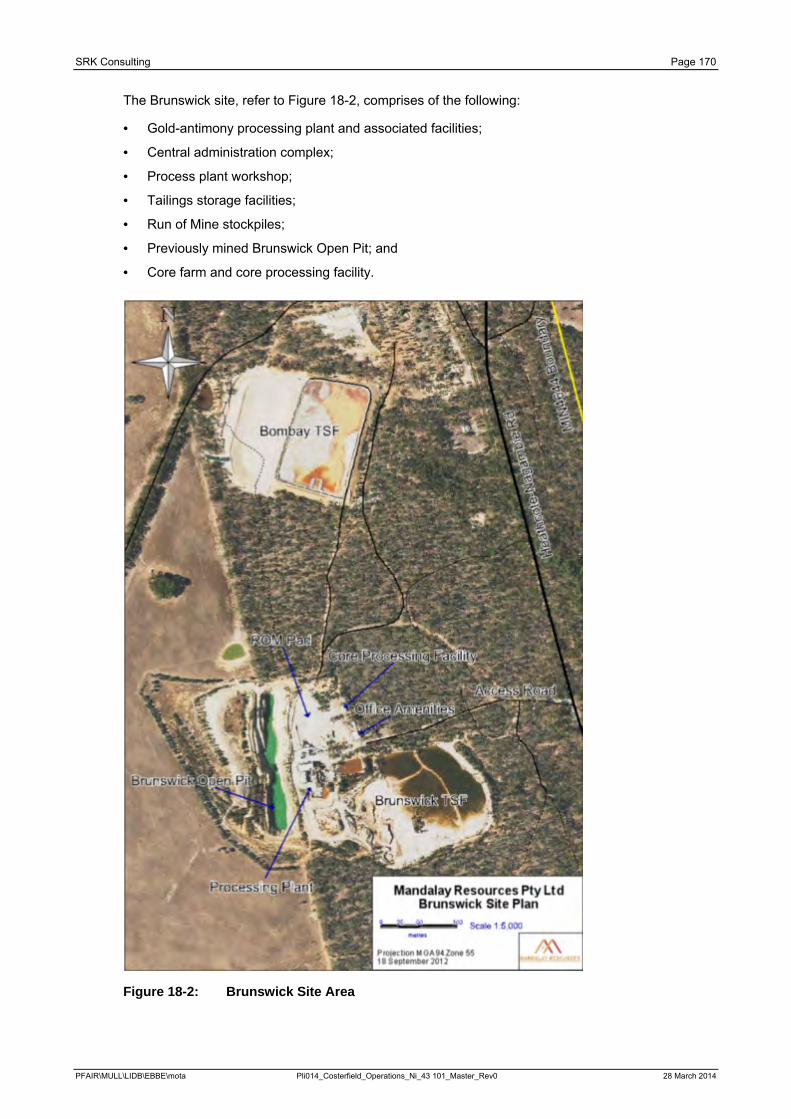
SRK Consulting Page 170
The Brunswick site, refer to Figure 18-2, comprises of the following:
· Gold-antimony processing plant and associated facilities;
· Central administration complex;
· Process plant workshop;
· Tailings storage facilities;
· Run of Mine stockpiles;
· Previously mined Brunswick Open Pit; and
· Core farm and core processing facility.
Figure 18-2: Brunswick Site Area
PFAIR\MULL\LIDB\EBBE\mota Pli014_Costerfield_Operations_Ni_43 101_Master_Rev0 28 March 2014
SRK Consulting Page 171
18.2 Augusta Mine Underground Infrastructure Underground infrastructure within the Augusta Mine is extensive and includes a 4.5 m wide by 4.8 m high access decline extending from surface to around 870 mRL, as at the end of April 2013. The gradient of the decline is 1:7.
The mine has primary ventilation infrastructure installed comprising of two single stage 132 kW axial fans located at the 1020 mRL. The return airway consists of a 3 m diameter raise from surface to the 1020 mRL, with a series of short raises progressively extended from the 1020 mRL to depth, that as of April 2013, extend to the 900 mRL or approximately 280 m below surface. Fresh air is supplied via the decline portal with secondary fans positioned in the decline force ventilating levels.
The mine dewatering system consists of a staged pump station system that pumps mine water (groundwater inflows and mine process water) directly to the surface where it flows through a series of silt ponds before being directed to the evaporation/ storage dams adjacent to the Augusta Surface facilities.
An underground crib room exists at the 1085 mRL and the underground magazine exists at the 1020 mRL.
In addition to the fixed plant, Mandalay owns, operates and maintains all mobile mining equipment including jumbo development drills, production drill, loaders, trucks, and ancillary equipment required to undertake mining operations.
18.3 Tailings Storage Since operations began in the 1970s, two tailings dams have been constructed and operated, one of which have since been decommissioned and partially rehabilitated:
· Brunswick TSF; and
· Bombay TSF, that is currently operational.
Both TSF dams were constructed based on a turkeys nest type design with earthen embankments.
All tailings are currently deposited in the Bombay TSF, on which a two metre lift was completed in the second half of 2013. This expansion brings the total storage capacity of the Bombay TSF to 361,000 m3 and will enable tailings to be deposited until around mid-2014.
Additional TSF storage capacity is to be increased during 2014 with a further lift on either the Bombay TSF or Brunswick TSF. Mandalay has applied to the DSDBI and the City of Greater Bendigo to reconstruct and raise the old Brunswick TSF facility and raise the height of the Bombay TSF.
The Bombay TSF lift will provide an additional 183,000 m3 of storage and the Brunswick TSF will provide an additional 197,000 m3 of storage. The current strategy is to proceed with the Brunswick TSF once the required approvals are received. The Brunswick TSF embankment raise construction works are scheduled to commence in the second quarter of calendar year 2014. This raise will provide sufficient tailings storage capacity until the end of the second quarter of calendar year 2016.
Use of the Brunswick Open Pit as a potential future tailings storage facility will require comprehensive assessment before being pursued, but there are precedents for this type of tailings storage approach being used in the region Victoria.
PFAIR\MULL\LIDB\EBBE\mota Pli014_Costerfield_Operations_Ni_43 101_Master_Rev0 28 March 2014
SRK Consulting Page 172
18.4 Power Supply The Costerfield Operation purchases electricity directly from the main national electricity grid and has connections at both the Brunswick Processing Plant and Augusta Mine.
The Costerfield Operation has an existing arrangement for High Voltage electrical supply of 2,353 kVA at the Augusta Mine and a 1,000 kVA supply at the Brunswick Processing Plant.
Powercor owns and manages the central Victorian electrical distribution infrastructure. Energy Australia (formerly Tru Energy) is the current electrical retailer.
Mandalay approached Powercor in September 2011 regarding three projected load growth scenarios. The chosen load growth scenario has indicated that an upgrade to the Powercor distribution infrastructure will be required to meet a maximum forecasted demand growth to 3,200 kVA at Augusta/ Cuffley and 1,400 kVA at Brunswick.
The upgrade will result in the existing supply point for Augusta remaining unchanged, an upgrade to the Brunswick connection point and a new 22 kV supply to Cuffley.
Powercor has provided a budget estimate of AUD5.7 M for the high voltage upgrade. It has been assumed that the 22 kV upgrade will not be commissioned until June 2015. In the meantime, any shortfalls in power require the use of diesel generates.
A diesel generator installation at Augusta consists of two 750 kVA generators supplied by independent 20,000 L fuel tank.
18.5 Power Reticulation Power for the Augusta underground operations is fed from a high voltage 22 kV Powercor feed that feeds:
· •The surface switch room via a 1 MVA transformer that steps the voltage down to 415 V; and
· •The surface switchyard via a 2 MVA transformer that steps the voltage down to 11 kV.
The 415 V supply is stepped up to 1000 volt via a 750 kVA transformer that feeds the heavy equipment workshop on surface and is also fed underground via a service hole to 3 Level to service all 1000 V requirements in the upper levels of the Augusta Mine.
The 11 kV supply is fed underground via a service hole to a 1.5 MVA substation located at the 1020 mRL. From this location, the substation steps the voltage down to 1000 volt and the power is reticulated to the working areas via cable and distribution boxes.
An additional 1.5 MVA 11 kV substation has been installed at the 935 mRL to service mine working load requirements below this level.
The Augusta Mine also has low voltage (415 V) power delivered underground from surface to 3 Level through a cased service hole. The 415 V feed also supplies surface facilities such as air compressors, workshop and all office amenities.
A Power Factor Correction Unit, installed in 2013 on the 11 kV mine supply, increases the effective use and availability of power to the mine.
18.6 Water Supply Water for the Augusta underground and surface operations is sourced from the Augusta Mine Dam at the entrance to the site. Excess mine water that is not consumed by operations is pumped from the Augusta Mine Dam to an evaporation pond and storage dam facility adjacent to the Augusta Mine that has a total storage capacity of 140 ML.
PFAIR\MULL\LIDB\EBBE\mota Pli014_Costerfield_Operations_Ni_43 101_Master_Rev0 28 March 2014
SRK Consulting Page 173
The Brunswick Processing Facility sources water from a number of sources including recycled process water from the Bombay TSF as well as standing water within the old Brunswick Pit.
The site is licenced to extract 179 ML per year from the Augusta underground workings, Brunswick bore and South Costerfield Shaft. An application to increase this to 700 ML per annum has been submitted to Goulburn-Murray Water for approval to satisfy the forecasted combined dewatering output for both Augusta and Cuffley.
Mandalay does not have a permit to discharge water from either of its Costerfield Operation sites.
18.7 Waste Rock Storage The waste rock storage facility located within the Augusta Mine footprint is currently at approved capacity with regards to both size and height, resulting in all underground waste being trucked off the mine site to the Brunswick TSF and the Bombay TSF for capping purposes.
Some waste rock will be required to construct future lifts of the Bombay and Brunswick TSFs.
The additional waste storage requirement above the 150,000 m3 Augusta Waster Storage Facility will be satisfied by stockpiling additional capping material at either the Bombay TSF or the Brunswick TSF, increasing the current Augusta Waste Storage Facility, or establishing an alternative waste storage site.
Each option may require the rehabilitation bond to be reviewed as construction of waste rock storage facilities could impact mine closure plan provisions, depending on whether the waste storage facilities would be permitted as permanent or temporary.
Campaigns of sizing selected portions of the waste material are also conducted to generate screened rock for underground cemented rock fill (CRF) backfill requirements. Filling of mining voids using CRF steadily reduces the waste rock storage requirements and has been factored into the mine plan.
18.8 Water Management Groundwater is currently pumped to the Augusta evaporation ponds which comprises of three dams with a total storage capacity of 160 ML.
The Brunswick Open Pit consists of a disused open cut mine located to the western side of the Brunswick Processing Facility. It is used for water storage and has a capacity at freeboard of approximately 160 ML, resulting in a total site storage capacity of approximately 318 ML.
Whilst the process plant utilises water from a closed circuit, make-up process water is required to supplement water evaporated at the tailings dam. Total evaporation / water disposal capacity is currently estimated at approximately 371 ML per year assuming average Heathcote climatic conditions.
Total inflows are currently estimated from water balance data to be approximately 492 ML per year plus 52 ML per year of rainfall. Hence, the current disposal of mine and process water presents a significant challenge to the mine as a further 173 ML per year of evaporation capacity is required to dispose of the current water disposal requirements.
It has been identified that additional infrastructure needs to be constructed to ensure sufficient capacity is available to not only to dispose of Augusta Mine water but also additional inflows from the Cuffley access development and mining operations.
Mandalay has recently purchased 30 Ha of land within the Costerfield district and has commenced designing an evaporation facility with a net effective evaporation surface of approximately 20 Ha.
PFAIR\MULL\LIDB\EBBE\mota Pli014_Costerfield_Operations_Ni_43 101_Master_Rev0 28 March 2014
SRK Consulting Page 174
It is envisaged that this facility will be constructed and commissioned in the third quarter 2014, pending receipt of all required approvals.
Mandalay has also submitted an application to the EPA to construct and operate a reverse osmosis water treatment plant to produce 2ML of treated water per day, which will be discharged to a local waterway 6 months per year. If the application is approved, the plant is expected to be operational in the third quarter of 2014.
With the new evaporation facility and reverse osmosis water treatment plant operational, water disposal requirements will be met for at least the next three years.
18.9 Augusta to Brunswick ROM Pad Transport As the Augusta Mine and Brunswick Processing Plant are divided by the Heathcote-Nagambie Road, all ROM product must be trucked between the two sites by an independent contractor. The road distance between the two sites is approximately 3 km and trucking is undertaken using a fleet of single body road trucks, each of 13 t capacity. Correct load weight is achieved via the use of a load cell system on the contractor’s surface loader.
The average cost of the trucking has been calculated at AUD3.85 per tonne delivered to the Brunswick ROM pad. This cost has been incorporated into the Costerfield Operations financial model.
18.10 Diesel Storage A self bunded diesel storage tank of 60,000 L capacity exists at the Augusta Mine site. This diesel storage caters for all underground and surface diesel needs for both Augusta and Brunswick.
18.11 Explosive Storage The current Augusta Magazine is located at the 1020 Level and is operated under the control of the designated black ticket holder on behalf of Mandalay who is the licensee. Table 18-1 states the current Augusta Magazine licence allowances.
Table 18-1: Current Augusta Licence Maximum Quantities and Types of Explosives
Class Code Type of Explosive Maximum Quantity
1.1D Blasting Explosives 40,000 kg
1.1D Detonating Cord 10,000 m
1.1B Detonators 21,000 items
18.12 Maintenance Facilities A surface maintenance workshop facility is located adjacent to the box-cut at Augusta. At present, all servicing and maintenance activities are undertaken on surface as no facility exists underground within the Augusta Mine. An underground workshop facility has been included at Cuffley to allow basic maintenance and daily servicing to be performed underground.
A small maintenance/ boilermaker workshop exists at Brunswick to assist with undertaking minor maintenance activities.
18.13 Housing and Land Mandalay owns ten land allotments surrounding the Augusta and Brunswick sites. Of these properties, five have residential dwellings with the remaining five consisting of vacant land. The residential dwellings are used as temporary housing for company employees.
PFAIR\MULL\LIDB\EBBE\mota Pli014_Costerfield_Operations_Ni_43 101_Master_Rev0 28 March 2014
SRK Consulting Page 175
The land allotment located on Peels Lane, Costerfield South, acts an offset area for the Mandalay’s mining and processing activities. It has been identified that the Peels Lane Offset has ‘the potential to generate a total of 4.35 habitat hectares’ and associated large trees (Biosis Research, 2005).
The Peels Lane Offset was purchased as part of the Work Plan for MIN 4644 and acted as an offset for the vegetation loss due to the construction of the Augusta Mine Site. The offset site will also be used to meet the offset requirements for the planned Bombay TSF lift.
PFAIR\MULL\LIDB\EBBE\mota Pli014_Costerfield_Operations_Ni_43 101_Master_Rev0 28 March 2014
SRK Consulting Page 176
19 Market Studies and Contracts 19.1 Concentrate Transport
The concentrate is discharged directly into 1.5 t capacity bulk bags ready for transportation. The concentrate bags are loaded onto a roadtrain that transports the concentrate by road from the Brunswick Processing Plant to the Port of Melbourne. The average payload of each B-double3 roadtrain is approximately 42 t.
At the Port of Melbourne, the concentrate bags are loaded into shipping containers that are then stacked until required for ship loading. Shipments are scheduled once per month and consist of between 600 to 900 wet metric tonnes of concentrate.
Ships depart Melbourne for Shanghai Port in China where the concentrate is transported through Changsha and onto the customer’s smelter at Chenzhou in the province of Hunan.
A third party trucking company collects the concentrate from the Brunswick site, transports, stores and loads the concentrate. The concentrate charges for transport from the Brunswick concentrate pad onto the ship in Melbourne has been estimated at AUD195 per dry metric tonne (dmt).
19.2 Marketing Costerfield is a combined gold and antimony mine with the business being sensitive to the price of both metals. Antimony is not traded on international metal exchanges, with prices being agreed upon between producer and consumer. Pricing is dependent on the quality and form of antimony product sold.
The comments in this section are based on a study completed by Roskill in 2012 (Refer Section 3) and additional communications from Mandalay.
Globally, world antimony production peaked in 2011 at an estimated 203,500 t due to continued growth in Chinese demand (Roskill, 2012), refer to Figure 19-1. Additional data made available by Mandalay demonstrates that supply and demand will largely be in balance and no materials impacts on the price based on supply/ demand are anticipated
The Augusta Mine produced 1,577 t in 2011, accounting for about 0.8% of the world market (Mandalay, 2012), tis has increased to 5,127 t in 2013 accounting for about 5% of the world market. (pers comm Mandalay March 2014)
3 A B double roadtrain consists of a prime mover towing a specialised lead trailer that has a fifth-wheel mounted on the rear towing another semi-trailer, resulting in two articulation points.
PFAIR\MULL\LIDB\EBBE\mota Pli014_Costerfield_Operations_Ni_43 101_Master_Rev0 28 March 2014
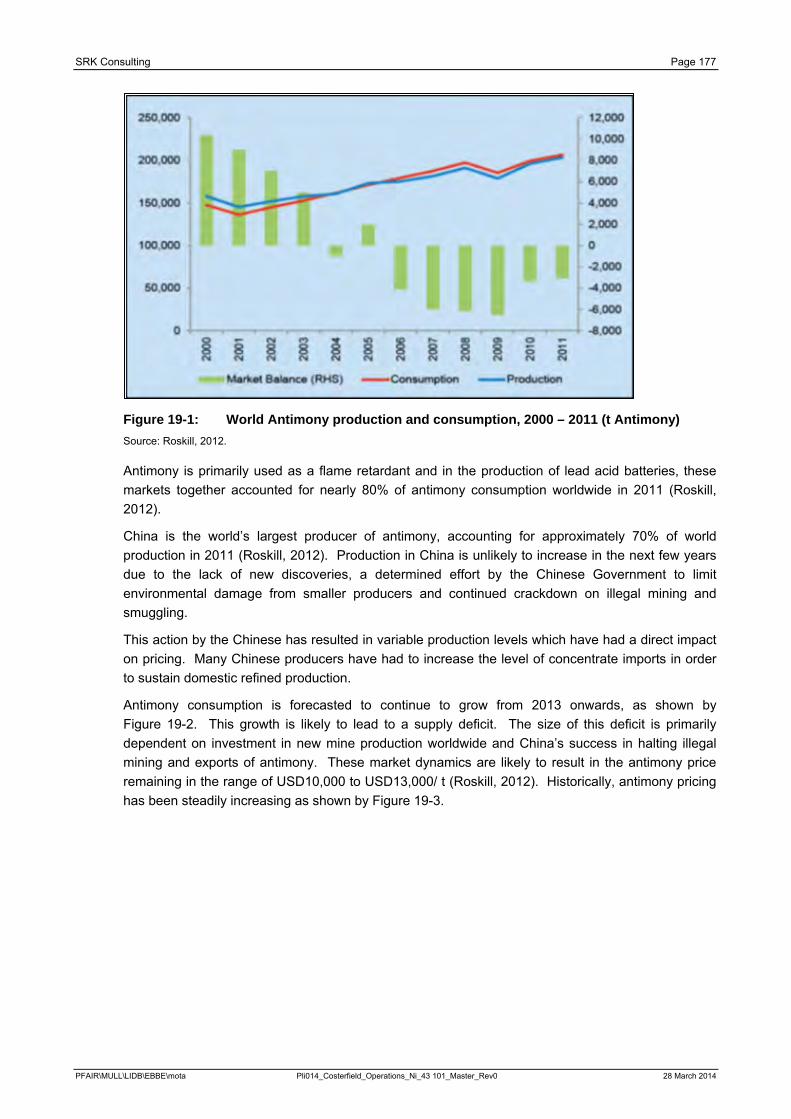
SRK Consulting Page 177
Figure 19-1: World Antimony production and consumption, 2000 – 2011 (t Antimony) Source: Roskill, 2012.
Antimony is primarily used as a flame retardant and in the production of lead acid batteries, these markets together accounted for nearly 80% of antimony consumption worldwide in 2011 (Roskill, 2012).
China is the world’s largest producer of antimony, accounting for approximately 70% of world production in 2011 (Roskill, 2012). Production in China is unlikely to increase in the next few years due to the lack of new discoveries, a determined effort by the Chinese Government to limit environmental damage from smaller producers and continued crackdown on illegal mining and smuggling.
This action by the Chinese has resulted in variable production levels which have had a direct impact on pricing. Many Chinese producers have had to increase the level of concentrate imports in order to sustain domestic refined production.
Antimony consumption is forecasted to continue to grow from 2013 onwards, as shown by Figure 19-2. This growth is likely to lead to a supply deficit. The size of this deficit is primarily dependent on investment in new mine production worldwide and China’s success in halting illegal mining and exports of antimony. These market dynamics are likely to result in the antimony price remaining in the range of USD10,000 to USD13,000/ t (Roskill, 2012). Historically, antimony pricing has been steadily increasing as shown by Figure 19-3.
PFAIR\MULL\LIDB\EBBE\mota Pli014_Costerfield_Operations_Ni_43 101_Master_Rev0 28 March 2014
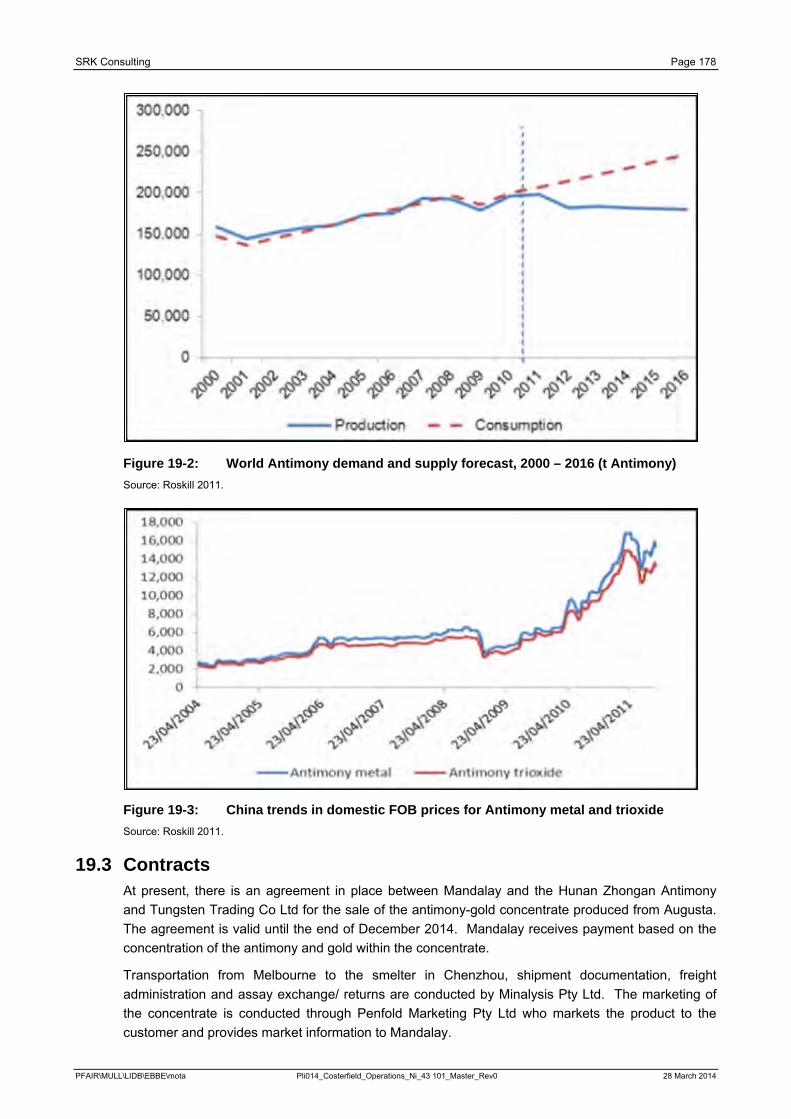
SRK Consulting Page 178
Figure 19-2: World Antimony demand and supply forecast, 2000 – 2016 (t Antimony) Source: Roskill 2011.
Figure 19-3: China trends in domestic FOB prices for Antimony metal and trioxide Source: Roskill 2011.
19.3 Contracts At present, there is an agreement in place between Mandalay and the Hunan Zhongan Antimony and Tungsten Trading Co Ltd for the sale of the antimony-gold concentrate produced from Augusta. The agreement is valid until the end of December 2014. Mandalay receives payment based on the concentration of the antimony and gold within the concentrate.
Transportation from Melbourne to the smelter in Chenzhou, shipment documentation, freight administration and assay exchange/ returns are conducted by Minalysis Pty Ltd. The marketing of the concentrate is conducted through Penfold Marketing Pty Ltd who markets the product to the customer and provides market information to Mandalay.
PFAIR\MULL\LIDB\EBBE\mota Pli014_Costerfield_Operations_Ni_43 101_Master_Rev0 28 March 2014
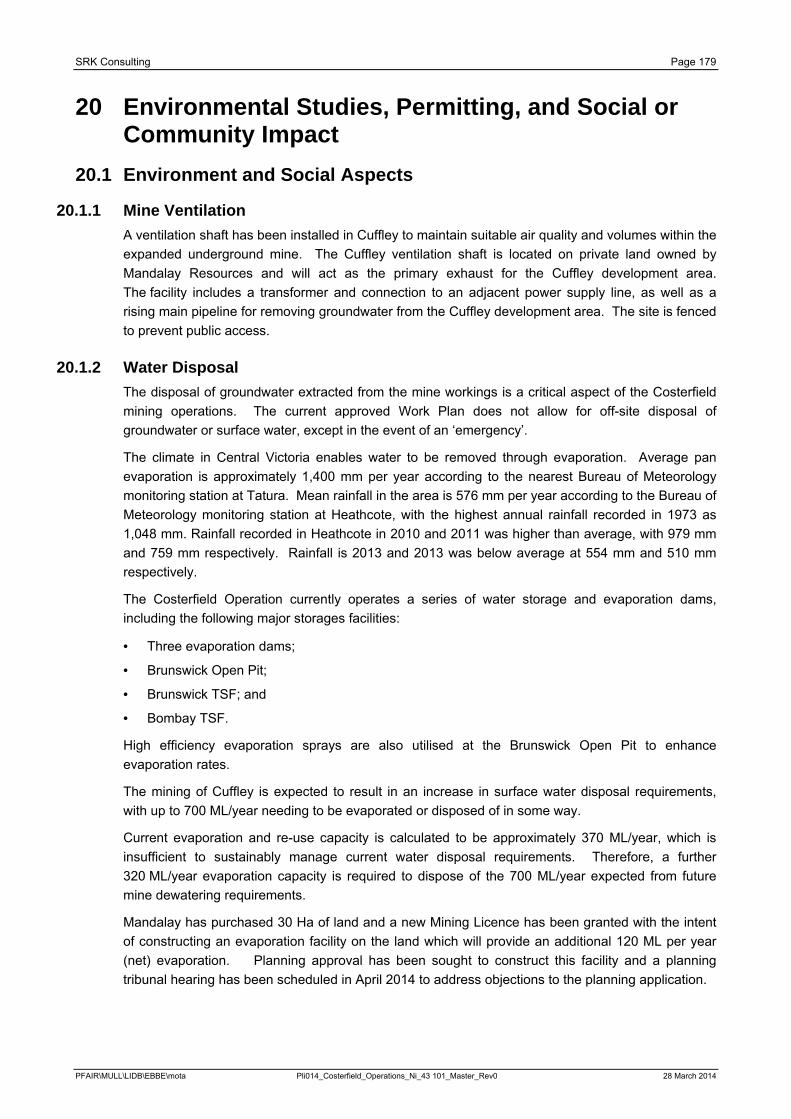
SRK Consulting Page 179
20 Environmental Studies, Permitting, and Social or Community Impact
20.1 Environment and Social Aspects
20.1.1 Mine Ventilation A ventilation shaft has been installed in Cuffley to maintain suitable air quality and volumes within the expanded underground mine. The Cuffley ventilation shaft is located on private land owned by Mandalay Resources and will act as the primary exhaust for the Cuffley development area. The facility includes a transformer and connection to an adjacent power supply line, as well as a rising main pipeline for removing groundwater from the Cuffley development area. The site is fenced to prevent public access.
20.1.2 Water Disposal The disposal of groundwater extracted from the mine workings is a critical aspect of the Costerfield mining operations. The current approved Work Plan does not allow for off-site disposal of groundwater or surface water, except in the event of an ‘emergency’.
The climate in Central Victoria enables water to be removed through evaporation. Average pan evaporation is approximately 1,400 mm per year according to the nearest Bureau of Meteorology monitoring station at Tatura. Mean rainfall in the area is 576 mm per year according to the Bureau of Meteorology monitoring station at Heathcote, with the highest annual rainfall recorded in 1973 as 1,048 mm. Rainfall recorded in Heathcote in 2010 and 2011 was higher than average, with 979 mm and 759 mm respectively. Rainfall is 2013 and 2013 was below average at 554 mm and 510 mm respectively.
The Costerfield Operation currently operates a series of water storage and evaporation dams, including the following major storages facilities:
· Three evaporation dams;
· Brunswick Open Pit;
· Brunswick TSF; and
· Bombay TSF.
High efficiency evaporation sprays are also utilised at the Brunswick Open Pit to enhance evaporation rates.
The mining of Cuffley is expected to result in an increase in surface water disposal requirements, with up to 700 ML/year needing to be evaporated or disposed of in some way.
Current evaporation and re-use capacity is calculated to be approximately 370 ML/year, which is insufficient to sustainably manage current water disposal requirements. Therefore, a further 320 ML/year evaporation capacity is required to dispose of the 700 ML/year expected from future mine dewatering requirements.
Mandalay has purchased 30 Ha of land and a new Mining Licence has been granted with the intent of constructing an evaporation facility on the land which will provide an additional 120 ML per year (net) evaporation. Planning approval has been sought to construct this facility and a planning tribunal hearing has been scheduled in April 2014 to address objections to the planning application.
PFAIR\MULL\LIDB\EBBE\mota Pli014_Costerfield_Operations_Ni_43 101_Master_Rev0 28 March 2014
SRK Consulting Page 180
Mandalay has also submitted an application to the EPA to construct and operate a reverse osmosis water treatment plant to produce 2ML of treated water per day, which will be discharged to a local waterway 6 months per year. If the application is approved, the plant is expected to be operational in the third quarter of 2014.
With the new evaporation facility and reverse osmosis water treatment plant operational, water disposal requirements will be met for at least the next three years.
20.1.3 Waste Rock Waste rock that is surplus to underground backfilling requirements is stockpiled on the surface in various locations. Testing of the waste rock has confirmed that the material is non-acid generating and therefore does not pose a risk associated with acid mine drainage.
Waste rock is currently stockpiled next to the Augusta Mine box-cut, with the maximum height and shape of the stockpile prescribed in the approved Work Plan. The approved Work Plan requires that this stockpile will be removed on closure in order to return the land to the prior use as grazing pasture. The waste rock will ultimately be used to fill the box-cut and cap the TSFs.
Waste rock has also been transported to the old Brunswick TSF, and has been used to permanently cap part of the TSF in accordance with the approved rehabilitation plan.
At the end of August 2012, the waste rock stockpile next to the Augusta Mine box-cut had reached its approved maximum capacity and some waste rock has been transported to the Brunswick TSF as capping material in preparation for the final closure of the facility. Waste rock has also been transported to the Bombay TSF to increase the height of the TSF.
Surplus waste rock will continue to be stored on the surface for future TSF lifts. A number of different locations are being considered for future waste rock storage, some of which will require a variation to the Work Plan. Waste rock will also be used in backfilling of the underground stopes, thereby reducing the quantity of waste rock brought to the surface. There is some opportunity to reduce the volume of waste rock to be stored through the re-use of the rock as engineering fill by third parties. The DSDBI has approved such off-site use, and markets are being investigated to evaluate whether significant volumes of rock can be managed in this manner, thereby reducing on site waste rock storage requirements. However, sufficient waste rock will need to be retained in order to fulfil rehabilitation and TSF expansion requirements.
20.1.4 Tailings Disposal Mandalay has applied to the DSDBI and the City of Greater Bendigo to reconstruct and raise the old Brunswick TSF facility and raise the height of the Bombay TSF. If approved, these facilities will provide sufficient tailings storage capacity for at least the next five years production. Additional description is provided in Section 18.3.
20.2 Impacts
20.2.1 Air Quality The approved Environmental Monitoring Plan for the Augusta Mine includes an air quality monitoring programme based on eight dust deposition gauges at various locations surrounding the Costerfield Operation and has been designed to confirm dust emissions remain below the prescribed limits. The monitoring data is provided to the regulatory authorities and Community Representatives through the quarterly Environmental Review Committee meetings. Given the similar nature of the activities associated with the deepening of the Augusta Mine, the current air quality monitoring programme is expected to be appropriate going forward.
PFAIR\MULL\LIDB\EBBE\mota Pli014_Costerfield_Operations_Ni_43 101_Master_Rev0 28 March 2014
SRK Consulting Page 181
Control measures in place to manage dust emissions from the operations currently and going forward include;
· Road watering programme;
· Moisture control of mill feed during processing; and
· Maintaining moisture on TSFs and waste rock stockpiles.
Operation of exhaust ventilation shafts is not currently a source of dust emissions, and future ventilation arrangements will not contribute to dust emissions.
20.2.2 Groundwater Deepening of the Augusta Mine and the potential development of the Cuffley Lode is expected to result in an increase in groundwater ingress into the underground workings and therefore will result in an increase in mine dewatering rates. It has not been possible to accurately estimate future dewatering rates, however, a maximum dewatering rate of 700 ML/year has been assumed based on experience to date, compared to current dewatering rate of approximately 600 ML/year. A groundwater licence to extract 700 ML per year has been granted by Goulburn-Murray Water.
A conceptual hydrogeological model has been developed for the site based on current groundwater monitoring data. The model shows a cone of depression in the bedrock aquifer trending in a north to south orientation, parallel to the deposits, as shown in Figure 20-1.
PFAIR\MULL\LIDB\EBBE\mota Pli014_Costerfield_Operations_Ni_43 101_Master_Rev0 28 March 2014
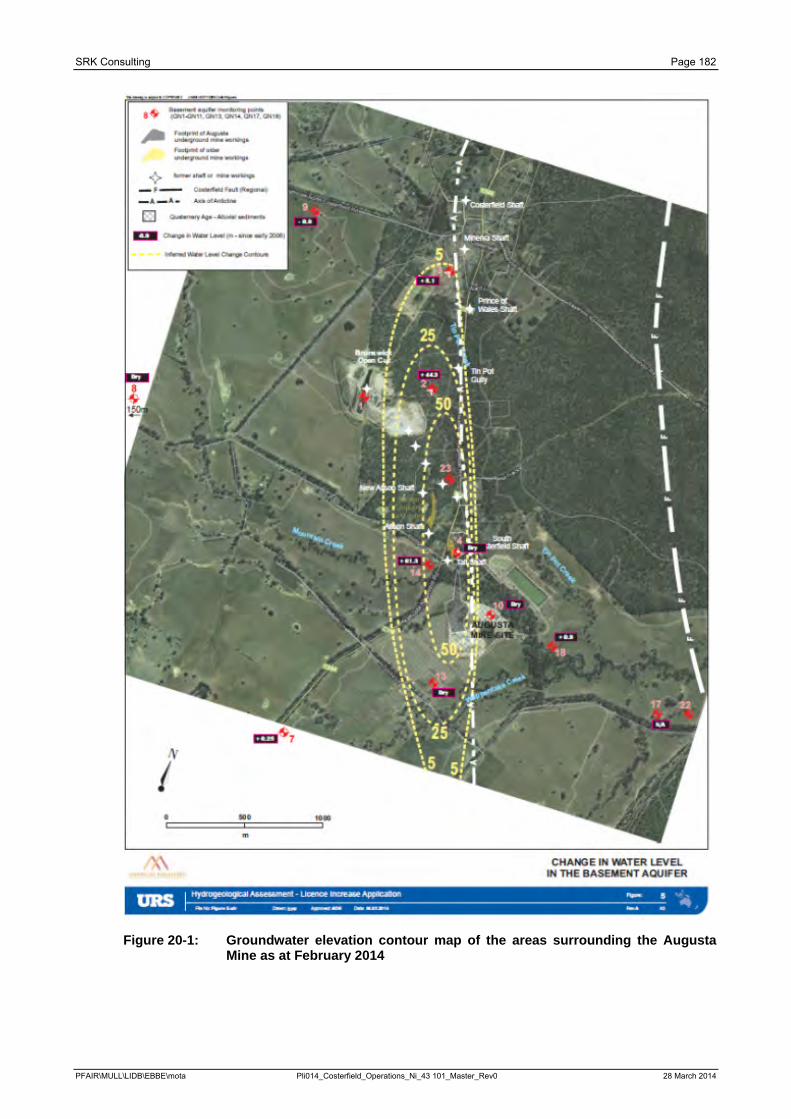
SRK Consulting Page 182
Figure 20-1: Groundwater elevation contour map of the areas surrounding the Augusta Mine as at February 2014
PFAIR\MULL\LIDB\EBBE\mota Pli014_Costerfield_Operations_Ni_43 101_Master_Rev0 28 March 2014
SRK Consulting Page 183
The current cone of depression indicates some dewatering has already occurred along the line of the Cuffley Lode. The cone of depression is expected to extend north as development proceeds north from the Augusta Mine to the Cuffley Lode.
The conceptual hydrogeological model indicates that the Augusta and Cuffley deposits are located in the regional groundwater aquifer. The regional groundwater aquifer is confined to semi-confined and comprises of Silurian siltstones and mudstones. Groundwater flow within this regional aquifer is through fractures and fissures within the rock. This is overlain by a perched alluvial aquifer comprising of recent gravels, sands and silt. The perched alluvial aquifer is connected to the surface water system.
Based on the monitoring data and the conceptual hydrogeological model, it appears that the current dewatering activities at Augusta do not affect the alluvial aquifer. Therefore, there is no impact to local landowners or the surface water system.
20.2.3 Noise The approved Environmental Monitoring Plan for the Costerfield Operation includes a noise monitoring programme which comprises routine attended and unattended noise monitoring at five locations, and reactive monitoring at sensitive receptors in the event of complaints or enquiries. Monitoring is carried out in accordance with EPA Victoria’s SEPP N1 policy.
Noise from the operations is a sensitive issue for near neighbours, and the company operates a 24-hour, 7 days a week complaints line to deal with noise complaints or any other issues from members of the public. The Company’s Complaints Procedure includes processes to record complaints, identify and implement immediate and longer term actions. All complaints are discussed at the quarterly Environmental Review Committee meetings.
The proposed expansion of the current Costerfield Operation is not expected to significantly change the nature of noise emissions from the site. Construction of new waste rock storage, TSF or evaporation facilities may require some additional noise monitoring which will be identified as part of the WPV approval process. Existing resources and procedures are expected to be adequate to accommodate any required modifications to the noise monitoring programme.
20.2.4 Blasting and Vibration DSDBI prescribes blast vibration limits for the protection of buildings and public amenity. The Company has procedures in place and monitoring equipment to measure blast vibration levels in order to assess compliance with the prescribed limits.
20.2.5 Native Vegetation The Costerfield Operation has been developed with the aim of avoiding and minimising impacts on native vegetation. Where native vegetation has been impacted, the Company has obligations to secure native vegetation offsets.
Mandalay purchased approved native vegetation offset at Peels Lane in Costerfield to fulfil obligations relating to Victoria’s Native Vegetation Management – A Framework for Action associated with the original clearing of native vegetation at the Augusta Mine site and the Bombay TSF.
The Peels Lane offset site has been assessed as containing 4.35 habitat hectares of various Ecological Vegetation Classes (EVCs) and associated large trees, in accordance with the framework guidelines. Offset obligations for the Costerfield Operations activities to date has required the securing of 0.504 habitat hectares of various EVCs plus a number of old trees and consequently Mandalay retains a surplus of native vegetation offset for potential future needs.
PFAIR\MULL\LIDB\EBBE\mota Pli014_Costerfield_Operations_Ni_43 101_Master_Rev0 28 March 2014
SRK Consulting Page 184
The proposed expansion of the Costerfield Operation is expected to have minimal impact on native vegetation and the Peel Lane site is anticipated to contain sufficient offset credits to meet the site’s foreseeable future needs.
20.2.6 Visual Amenity The key aspect of the Costerfield Operation that may affect visual amenity is the construction of new groundwater evaporation facilities.
Community consultation will take place as part of the planning for any such facilities, and mitigation measures will be investigated and implemented where appropriate. Screening vegetation shall be considered as part of the design of each of these facilities, in consultation with the relevant land manager and near neighbours.
20.2.7 Heritage A heritage survey of the South Costerfield Shaft, Alison and New Alison surface workings was completed by LRGM Consultants in the first quarter of 2012. The purpose of this survey was to identify and record cultural heritage features in these areas of interest that exist within the current Mining Licence (ML4644).
The survey identified that no features of higher than local cultural heritage significance were identified, with the following features of local cultural heritage significance being noted:
· South Costerfield (Tait’s) Mine Shaft;
· Old Alison Mine Shaft; and
· New Alison Mine Shaft.
The expansion of the mining operations is not anticipated to result in any disturbance of historic mine workings or other heritage features.
The Taungurung Clans Aboriginal Corporation is the Registered Aboriginal Party designated as the traditional owners of the land on which Mining Licence MIN4644 is located. The footprint of the mine expansion does not fall into any designated Areas of Cultural Heritage Sensitivity, as per Map 7824 Heathcote, Department of Planning and Community Development, July 2012, therefore, it is not anticipated that the development plans will trigger the need for a Cultural Heritage Management Plan. However, Mandalay acknowledges the requirements of the Aboriginal Heritage Act and Regulations in relation to the protection of Aboriginal Cultural Heritage.
20.2.8 Community The Costerfield Operation is one of the largest employers in the region and is a significant contributor to the local economy. Mandalay preferentially employs appropriately skilled personnel from the local community and sources goods and services from local suppliers wherever possible.
Mandalay has developed and implemented the Costerfield Operations Community Engagement Plan, which has been approved by the DSDBI in accordance with the requirements of the MRSD Act. This Plan sets the framework for communication with all of the business’ stakeholders to ensure transparent and ongoing consultative relationships are developed and maintained.
The Community Engagement Plan includes processes to manage community inquiries and complaints to ensure timely and effective responses to issues affecting members of the community.
Activities associated with community engagement in relation to the proposed expansion of the current Costerfield Operation, are described in a general sense within the Community Engagement Plan.
PFAIR\MULL\LIDB\EBBE\mota Pli014_Costerfield_Operations_Ni_43 101_Master_Rev0 28 March 2014
SRK Consulting Page 185
Key stakeholders for the mine expansion project are near neighbours, the regulatory authorities and the Company’s Environmental Review Committee. Most of these stakeholders have been provided with an initial briefing on the proposed expansion plans through either the Environmental Review Committee quarterly meetings or during individual meetings with key regulators.
Community engagement is considered to be most important in relation to construction of new evaporation facilities. Whilst several of the land owners in close proximity to the proposed evaporation facility have objected to the planning application, the local Council has endorsed the project as an appropriate water management infrastructure to sustain ongoing mining activities at Costerfield.
The current Community Engagement Plan is considered an appropriate framework to address the needs of stakeholders through the planning and implementation of the proposed mine expansion.
Mandalay has instituted a quarterly Environmental Review Committee which involves community and regulatory representatives, and this forum gives all parties the opportunity to find out about current and future issues at the mine and to provide their input.
20.2.9 Mine Closure and Revegetation The MRSD Act requires proponents to identify rehabilitation requirements as part of the Work Plan approvals process, and ensures that rehabilitation bonds are lodged in the form of a bank guarantee to cover the full cost of rehabilitation up front, prior to commencing work. Rehabilitation bonds are also reviewed on a regular basis to ensure that unit cost assumptions and the scope of work is kept up to date. WPVs will also trigger a review of the rehabilitation bond if the work to be carried out affects final rehabilitation.
Mandalay has developed a Mine Closure Plan, which provides an overview of the various aspects of closure and rehabilitation that have been included in the rehabilitation bond calculation and reflects the rehabilitation requirements described in the approved Work Plans and Variations.
The Mine Closure Plan describes how the Augusta site, including the box-cut, waste rock storage, office area and evaporation dams, will be rehabilitated back to its former land use as grazing pasture. The mine decline will be blocked and the portal backfilled with waste rock, with the box-cut being levelled back to its original surface contours. Topsoil and subsoil have been stored on site to facilitate the final vegetation.
The rehabilitation plan for the Brunswick site includes removal of all plant and returning the disturbed area back to native forest to create a safe and stable landform that can be used for passive recreation. The TSFs will be dried out, capped with waste rock and topsoil and planted with native vegetation. The plan includes provisions for monitoring the TSFs post closure.
The rehabilitation bond associated with the Company’s Mining Licence MIN4644 was reviewed and increased in mid-2012.
20.3 Regulatory Approvals
20.3.1 Work Plan Variation Future changes to mining activities such as potential changes to waste rock storage facilities will require a WPV to be approved. The DSDBI facilitates this approval process and will engage with relevant referral authorities, as required. The DSDBI may prescribe certain conditions on the approval, which may include amendments to the environmental monitoring programme. The Work Plan approval process involves a thorough consultation process with regulatory authorities, and any conditions or proposed amendments requested to the WPV are generally negotiated to the satisfaction of both parties.
PFAIR\MULL\LIDB\EBBE\mota Pli014_Costerfield_Operations_Ni_43 101_Master_Rev0 28 March 2014
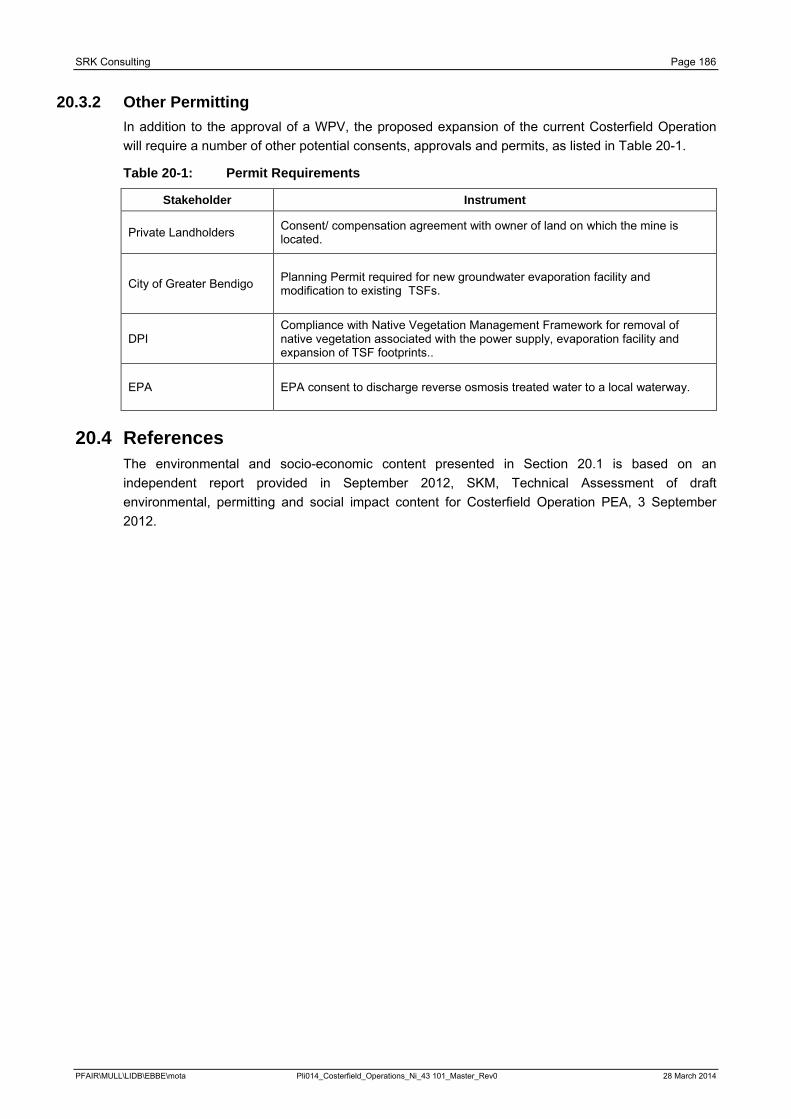
SRK Consulting Page 186
20.3.2 Other Permitting In addition to the approval of a WPV, the proposed expansion of the current Costerfield Operation will require a number of other potential consents, approvals and permits, as listed in Table 20-1.
Table 20-1: Permit Requirements
Stakeholder Instrument
Private Landholders Consent/ compensation agreement with owner of land on which the mine is located.
City of Greater Bendigo Planning Permit required for new groundwater evaporation facility and modification to existing TSFs.
DPI Compliance with Native Vegetation Management Framework for removal of native vegetation associated with the power supply, evaporation facility and expansion of TSF footprints..
EPA EPA consent to discharge reverse osmosis treated water to a local waterway.
20.4 References The environmental and socio-economic content presented in Section 20.1 is based on an independent report provided in September 2012, SKM, Technical Assessment of draft environmental, permitting and social impact content for Costerfield Operation PEA, 3 September 2012.
PFAIR\MULL\LIDB\EBBE\mota Pli014_Costerfield_Operations_Ni_43 101_Master_Rev0 28 March 2014
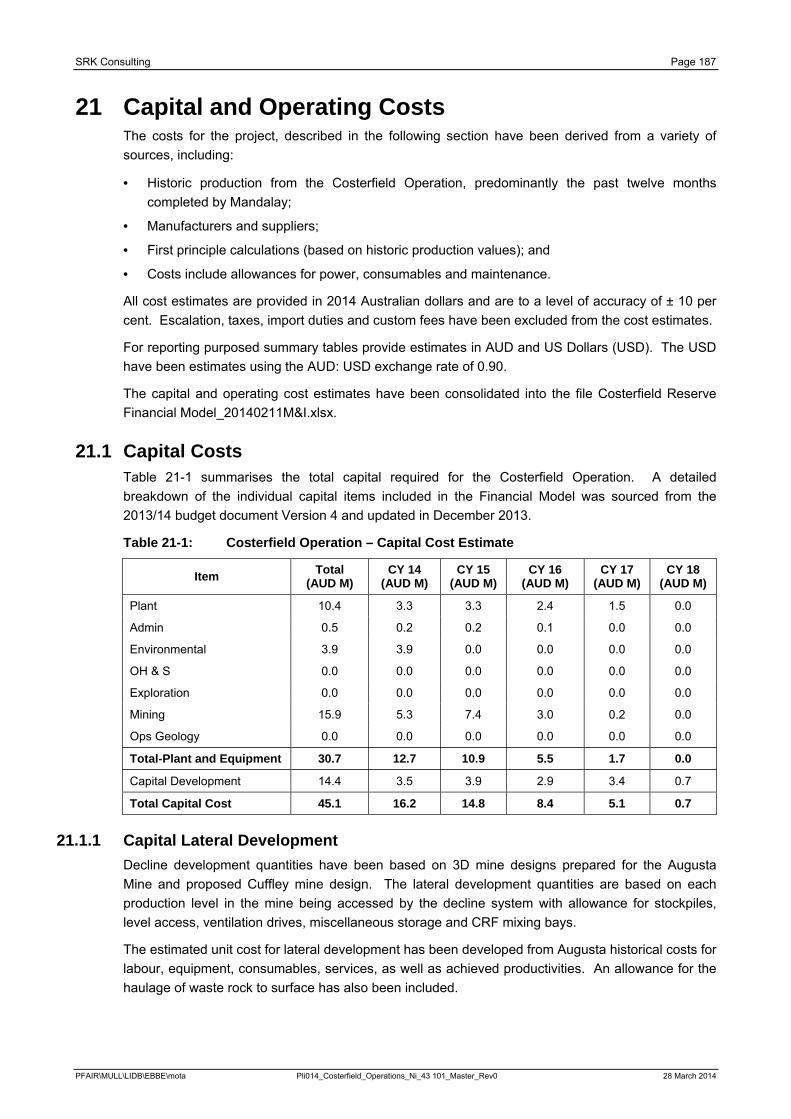
SRK Consulting Page 187
21 Capital and Operating Costs The costs for the project, described in the following section have been derived from a variety of sources, including:
· Historic production from the Costerfield Operation, predominantly the past twelve months completed by Mandalay;
· Manufacturers and suppliers;
· First principle calculations (based on historic production values); and
· Costs include allowances for power, consumables and maintenance.
All cost estimates are provided in 2014 Australian dollars and are to a level of accuracy of ± 10 per cent. Escalation, taxes, import duties and custom fees have been excluded from the cost estimates.
For reporting purposed summary tables provide estimates in AUD and US Dollars (USD). The USD have been estimates using the AUD: USD exchange rate of 0.90.
The capital and operating cost estimates have been consolidated into the file Costerfield Reserve Financial Model_20140211M&I.xlsx.
21.1 Capital Costs Table 21-1 summarises the total capital required for the Costerfield Operation. A detailed breakdown of the individual capital items included in the Financial Model was sourced from the 2013/14 budget document Version 4 and updated in December 2013.
Table 21-1: Costerfield Operation – Capital Cost Estimate
Item Total (AUD M)
CY 14 (AUD M)
CY 15 (AUD M)
CY 16 (AUD M)
CY 17 (AUD M)
CY 18 (AUD M)
Plant 10.4 3.3 3.3 2.4 1.5 0.0
Admin 0.5 0.2 0.2 0.1 0.0 0.0
Environmental 3.9 3.9 0.0 0.0 0.0 0.0
OH & S 0.0 0.0 0.0 0.0 0.0 0.0
Exploration 0.0 0.0 0.0 0.0 0.0 0.0
Mining 15.9 5.3 7.4 3.0 0.2 0.0
Ops Geology 0.0 0.0 0.0 0.0 0.0 0.0
Total-Plant and Equipment 30.7 12.7 10.9 5.5 1.7 0.0
Capital Development 14.4 3.5 3.9 2.9 3.4 0.7
Total Capital Cost 45.1 16.2 14.8 8.4 5.1 0.7
21.1.1 Capital Lateral Development Decline development quantities have been based on 3D mine designs prepared for the Augusta Mine and proposed Cuffley mine design. The lateral development quantities are based on each production level in the mine being accessed by the decline system with allowance for stockpiles, level access, ventilation drives, miscellaneous storage and CRF mixing bays.
The estimated unit cost for lateral development has been developed from Augusta historical costs for labour, equipment, consumables, services, as well as achieved productivities. An allowance for the haulage of waste rock to surface has also been included.
PFAIR\MULL\LIDB\EBBE\mota Pli014_Costerfield_Operations_Ni_43 101_Master_Rev0 28 March 2014
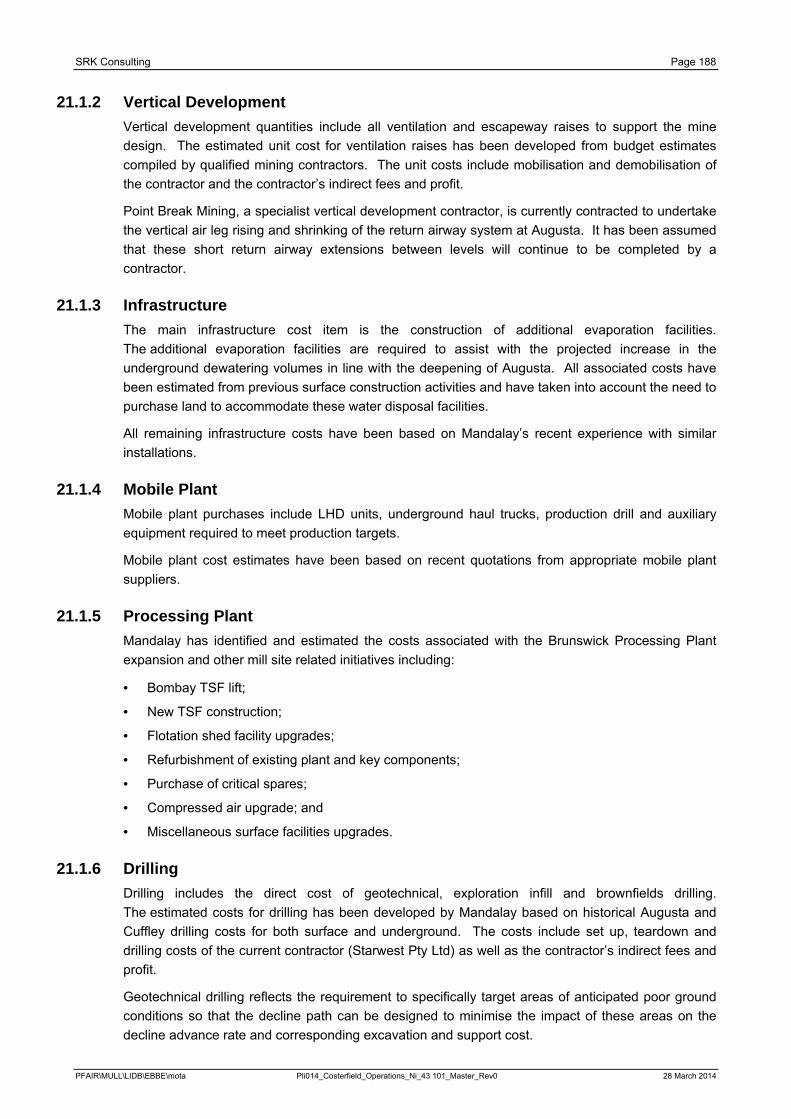
SRK Consulting Page 188
21.1.2 Vertical Development Vertical development quantities include all ventilation and escapeway raises to support the mine design. The estimated unit cost for ventilation raises has been developed from budget estimates compiled by qualified mining contractors. The unit costs include mobilisation and demobilisation of the contractor and the contractor’s indirect fees and profit.
Point Break Mining, a specialist vertical development contractor, is currently contracted to undertake the vertical air leg rising and shrinking of the return airway system at Augusta. It has been assumed that these short return airway extensions between levels will continue to be completed by a contractor.
21.1.3 Infrastructure The main infrastructure cost item is the construction of additional evaporation facilities. The additional evaporation facilities are required to assist with the projected increase in the underground dewatering volumes in line with the deepening of Augusta. All associated costs have been estimated from previous surface construction activities and have taken into account the need to purchase land to accommodate these water disposal facilities.
All remaining infrastructure costs have been based on Mandalay’s recent experience with similar installations.
21.1.4 Mobile Plant Mobile plant purchases include LHD units, underground haul trucks, production drill and auxiliary equipment required to meet production targets.
Mobile plant cost estimates have been based on recent quotations from appropriate mobile plant suppliers.
21.1.5 Processing Plant Mandalay has identified and estimated the costs associated with the Brunswick Processing Plant expansion and other mill site related initiatives including:
· Bombay TSF lift;
· New TSF construction;
· Flotation shed facility upgrades;
· Refurbishment of existing plant and key components;
· Purchase of critical spares;
· Compressed air upgrade; and
· Miscellaneous surface facilities upgrades.
21.1.6 Drilling Drilling includes the direct cost of geotechnical, exploration infill and brownfields drilling. The estimated costs for drilling has been developed by Mandalay based on historical Augusta and Cuffley drilling costs for both surface and underground. The costs include set up, teardown and drilling costs of the current contractor (Starwest Pty Ltd) as well as the contractor’s indirect fees and profit.
Geotechnical drilling reflects the requirement to specifically target areas of anticipated poor ground conditions so that the decline path can be designed to minimise the impact of these areas on the decline advance rate and corresponding excavation and support cost.
PFAIR\MULL\LIDB\EBBE\mota Pli014_Costerfield_Operations_Ni_43 101_Master_Rev0 28 March 2014
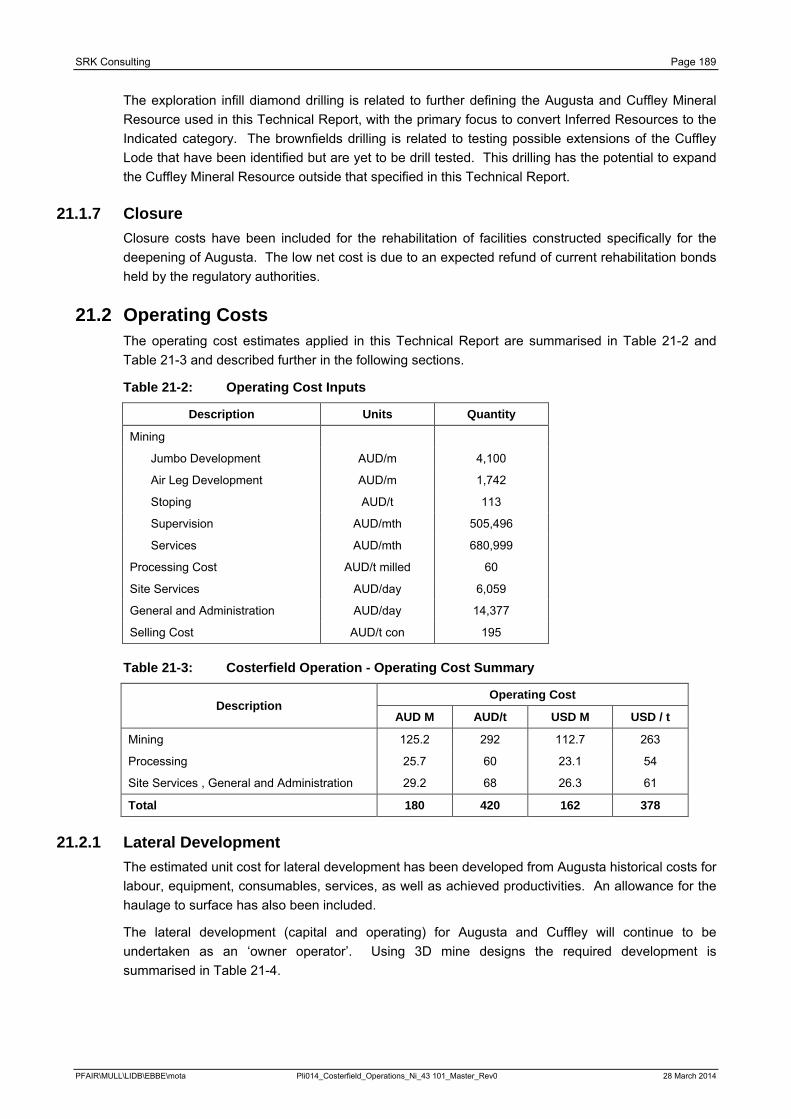
SRK Consulting Page 189
The exploration infill diamond drilling is related to further defining the Augusta and Cuffley Mineral Resource used in this Technical Report, with the primary focus to convert Inferred Resources to the Indicated category. The brownfields drilling is related to testing possible extensions of the Cuffley Lode that have been identified but are yet to be drill tested. This drilling has the potential to expand the Cuffley Mineral Resource outside that specified in this Technical Report.
21.1.7 Closure Closure costs have been included for the rehabilitation of facilities constructed specifically for the deepening of Augusta. The low net cost is due to an expected refund of current rehabilitation bonds held by the regulatory authorities.
21.2 Operating Costs The operating cost estimates applied in this Technical Report are summarised in Table 21-2 and Table 21-3 and described further in the following sections.
Table 21-2: Operating Cost Inputs
Description Units Quantity
Mining
Jumbo Development AUD/m 4,100
Air Leg Development AUD/m 1,742
Stoping AUD/t 113
Supervision AUD/mth 505,496
Services AUD/mth 680,999
Processing Cost AUD/t milled 60
Site Services AUD/day 6,059
General and Administration AUD/day 14,377
Selling Cost AUD/t con 195
Table 21-3: Costerfield Operation - Operating Cost Summary
Description Operating Cost
AUD M AUD/t USD M USD / t
Mining 125.2 292 112.7 263
Processing 25.7 60 23.1 54
Site Services , General and Administration 29.2 68 26.3 61
Total 180 420 162 378
21.2.1 Lateral Development The estimated unit cost for lateral development has been developed from Augusta historical costs for labour, equipment, consumables, services, as well as achieved productivities. An allowance for the haulage to surface has also been included.
The lateral development (capital and operating) for Augusta and Cuffley will continue to be undertaken as an ‘owner operator’. Using 3D mine designs the required development is summarised in Table 21-4.
PFAIR\MULL\LIDB\EBBE\mota Pli014_Costerfield_Operations_Ni_43 101_Master_Rev0 28 March 2014
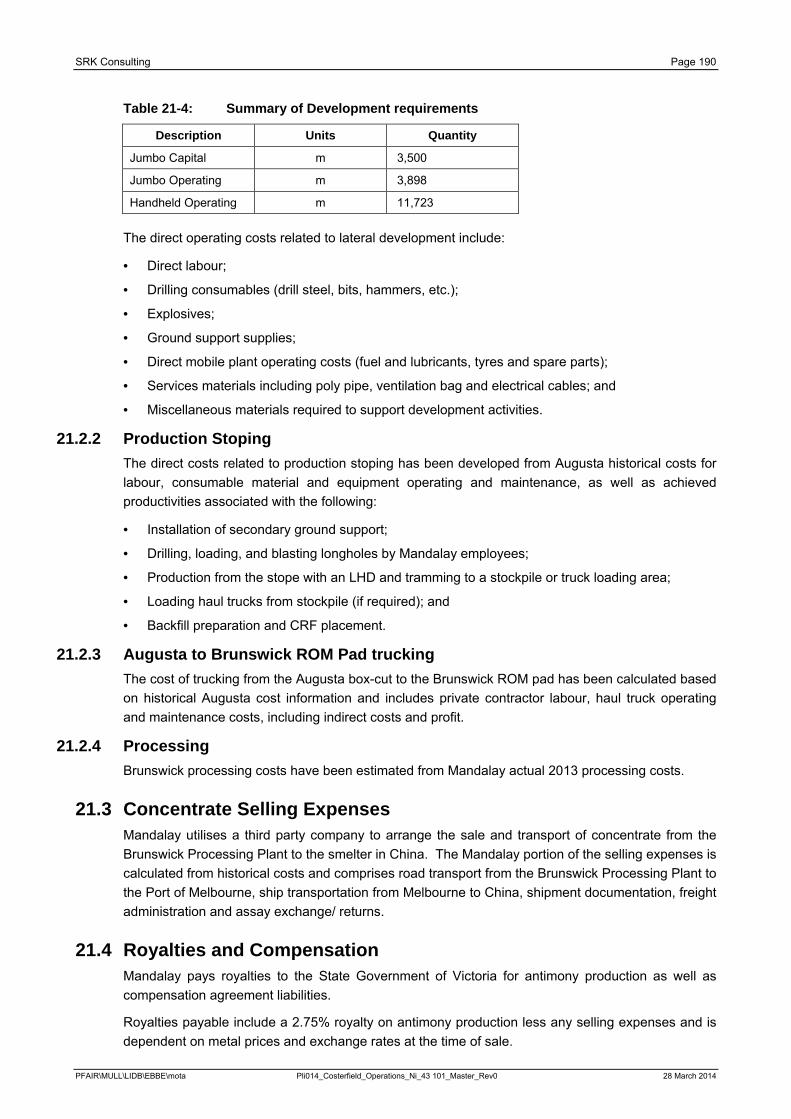
SRK Consulting Page 190
Table 21-4: Summary of Development requirements
Description Units Quantity
Jumbo Capital m 3,500
Jumbo Operating m 3,898
Handheld Operating m 11,723
The direct operating costs related to lateral development include:
· Direct labour;
· Drilling consumables (drill steel, bits, hammers, etc.);
· Explosives;
· Ground support supplies;
· Direct mobile plant operating costs (fuel and lubricants, tyres and spare parts);
· Services materials including poly pipe, ventilation bag and electrical cables; and
· Miscellaneous materials required to support development activities.
21.2.2 Production Stoping The direct costs related to production stoping has been developed from Augusta historical costs for labour, consumable material and equipment operating and maintenance, as well as achieved productivities associated with the following:
· Installation of secondary ground support;
· Drilling, loading, and blasting longholes by Mandalay employees;
· Production from the stope with an LHD and tramming to a stockpile or truck loading area;
· Loading haul trucks from stockpile (if required); and
· Backfill preparation and CRF placement.
21.2.3 Augusta to Brunswick ROM Pad trucking The cost of trucking from the Augusta box-cut to the Brunswick ROM pad has been calculated based on historical Augusta cost information and includes private contractor labour, haul truck operating and maintenance costs, including indirect costs and profit.
21.2.4 Processing Brunswick processing costs have been estimated from Mandalay actual 2013 processing costs.
21.3 Concentrate Selling Expenses Mandalay utilises a third party company to arrange the sale and transport of concentrate from the Brunswick Processing Plant to the smelter in China. The Mandalay portion of the selling expenses is calculated from historical costs and comprises road transport from the Brunswick Processing Plant to the Port of Melbourne, ship transportation from Melbourne to China, shipment documentation, freight administration and assay exchange/ returns.
21.4 Royalties and Compensation Mandalay pays royalties to the State Government of Victoria for antimony production as well as compensation agreement liabilities.
Royalties payable include a 2.75% royalty on antimony production less any selling expenses and is dependent on metal prices and exchange rates at the time of sale.
PFAIR\MULL\LIDB\EBBE\mota Pli014_Costerfield_Operations_Ni_43 101_Master_Rev0 28 March 2014
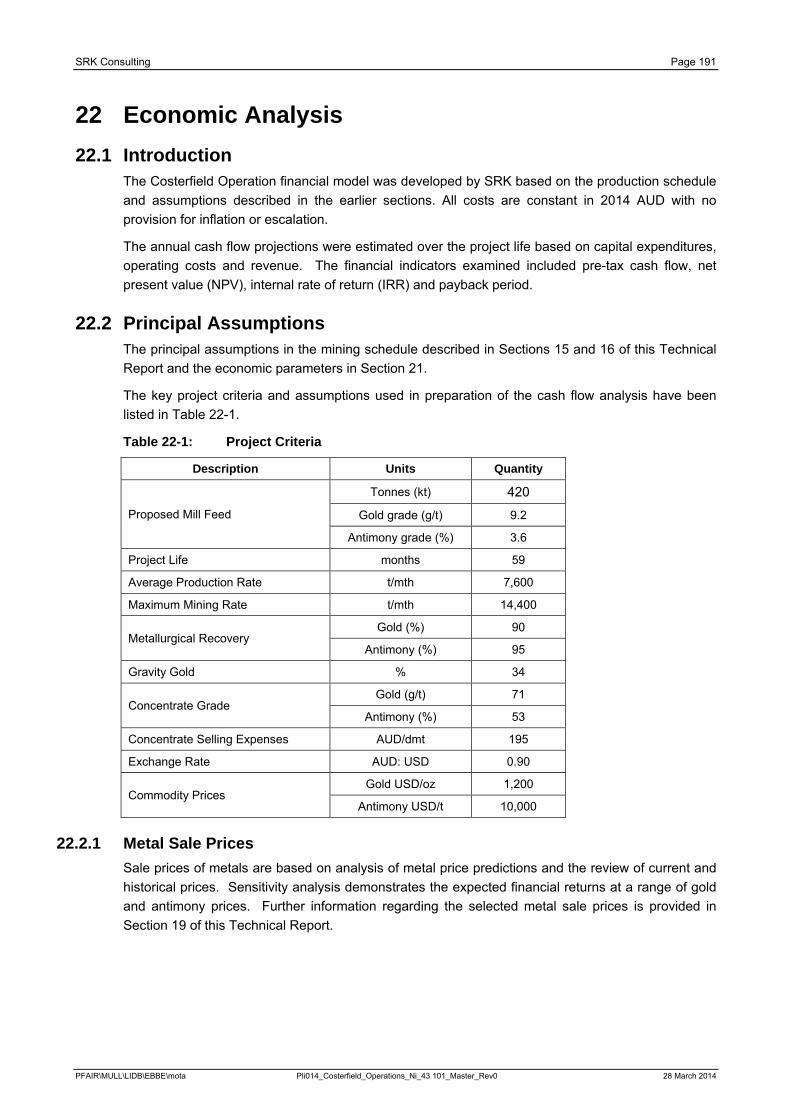
SRK Consulting Page 191
22 Economic Analysis 22.1 Introduction
The Costerfield Operation financial model was developed by SRK based on the production schedule and assumptions described in the earlier sections. All costs are constant in 2014 AUD with no provision for inflation or escalation.
The annual cash flow projections were estimated over the project life based on capital expenditures, operating costs and revenue. The financial indicators examined included pre-tax cash flow, net present value (NPV), internal rate of return (IRR) and payback period.
22.2 Principal Assumptions The principal assumptions in the mining schedule described in Sections 15 and 16 of this Technical Report and the economic parameters in Section 21.
The key project criteria and assumptions used in preparation of the cash flow analysis have been listed in Table 22-1.
Table 22-1: Project Criteria
Description Units Quantity
Proposed Mill Feed
Tonnes (kt) 420
Gold grade (g/t) 9.2
Antimony grade (%) 3.6
Project Life months 59
Average Production Rate t/mth 7,600
Maximum Mining Rate t/mth 14,400
Metallurgical Recovery Gold (%) 90
Antimony (%) 95
Gravity Gold % 34
Concentrate Grade Gold (g/t) 71
Antimony (%) 53
Concentrate Selling Expenses AUD/dmt 195
Exchange Rate AUD: USD 0.90
Commodity Prices Gold USD/oz 1,200
Antimony USD/t 10,000
22.2.1 Metal Sale Prices Sale prices of metals are based on analysis of metal price predictions and the review of current and historical prices. Sensitivity analysis demonstrates the expected financial returns at a range of gold and antimony prices. Further information regarding the selected metal sale prices is provided in Section 19 of this Technical Report.
PFAIR\MULL\LIDB\EBBE\mota Pli014_Costerfield_Operations_Ni_43 101_Master_Rev0 28 March 2014
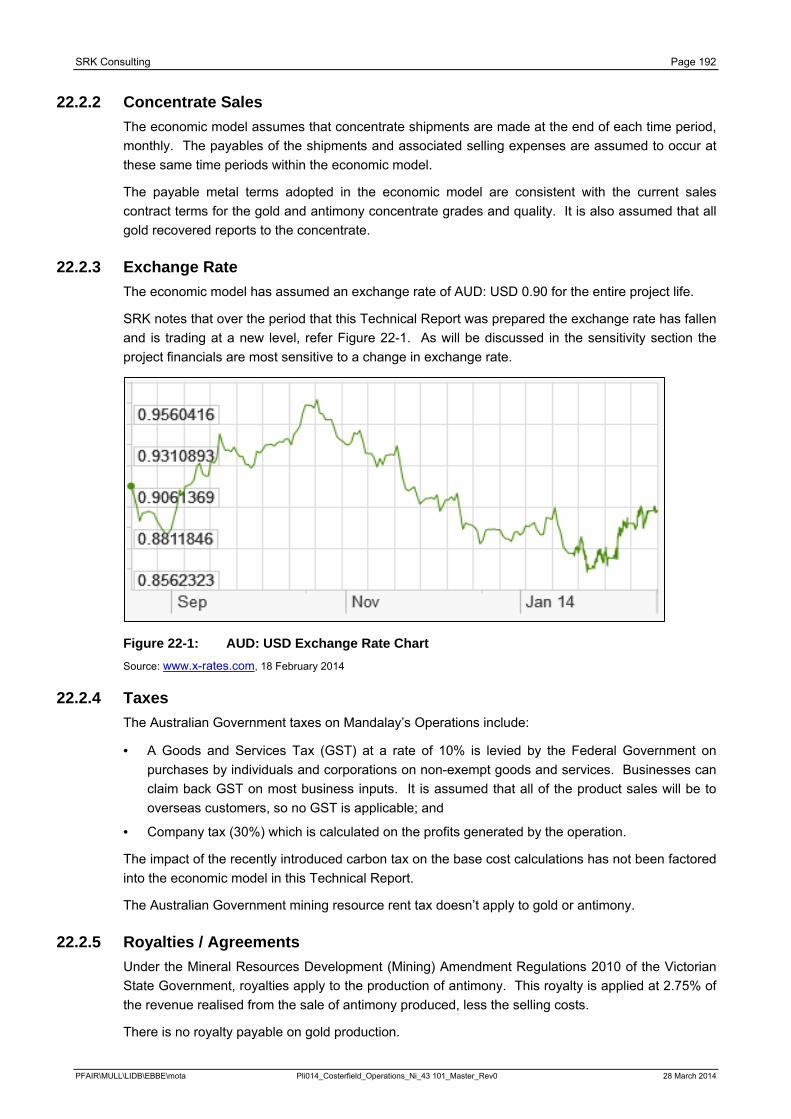
SRK Consulting Page 192
22.2.2 Concentrate Sales The economic model assumes that concentrate shipments are made at the end of each time period, monthly. The payables of the shipments and associated selling expenses are assumed to occur at these same time periods within the economic model.
The payable metal terms adopted in the economic model are consistent with the current sales contract terms for the gold and antimony concentrate grades and quality. It is also assumed that all gold recovered reports to the concentrate.
22.2.3 Exchange Rate The economic model has assumed an exchange rate of AUD: USD 0.90 for the entire project life.
SRK notes that over the period that this Technical Report was prepared the exchange rate has fallen and is trading at a new level, refer Figure 22-1. As will be discussed in the sensitivity section the project financials are most sensitive to a change in exchange rate.
Figure 22-1: AUD: USD Exchange Rate Chart Source: www.x-rates.com, 18 February 2014
22.2.4 Taxes The Australian Government taxes on Mandalay’s Operations include:
· A Goods and Services Tax (GST) at a rate of 10% is levied by the Federal Government on purchases by individuals and corporations on non-exempt goods and services. Businesses can claim back GST on most business inputs. It is assumed that all of the product sales will be to overseas customers, so no GST is applicable; and
· Company tax (30%) which is calculated on the profits generated by the operation.
The impact of the recently introduced carbon tax on the base cost calculations has not been factored into the economic model in this Technical Report.
The Australian Government mining resource rent tax doesn’t apply to gold or antimony.
22.2.5 Royalties / Agreements Under the Mineral Resources Development (Mining) Amendment Regulations 2010 of the Victorian State Government, royalties apply to the production of antimony. This royalty is applied at 2.75% of the revenue realised from the sale of antimony produced, less the selling costs.
There is no royalty payable on gold production.
PFAIR\MULL\LIDB\EBBE\mota Pli014_Costerfield_Operations_Ni_43 101_Master_Rev0 28 March 2014
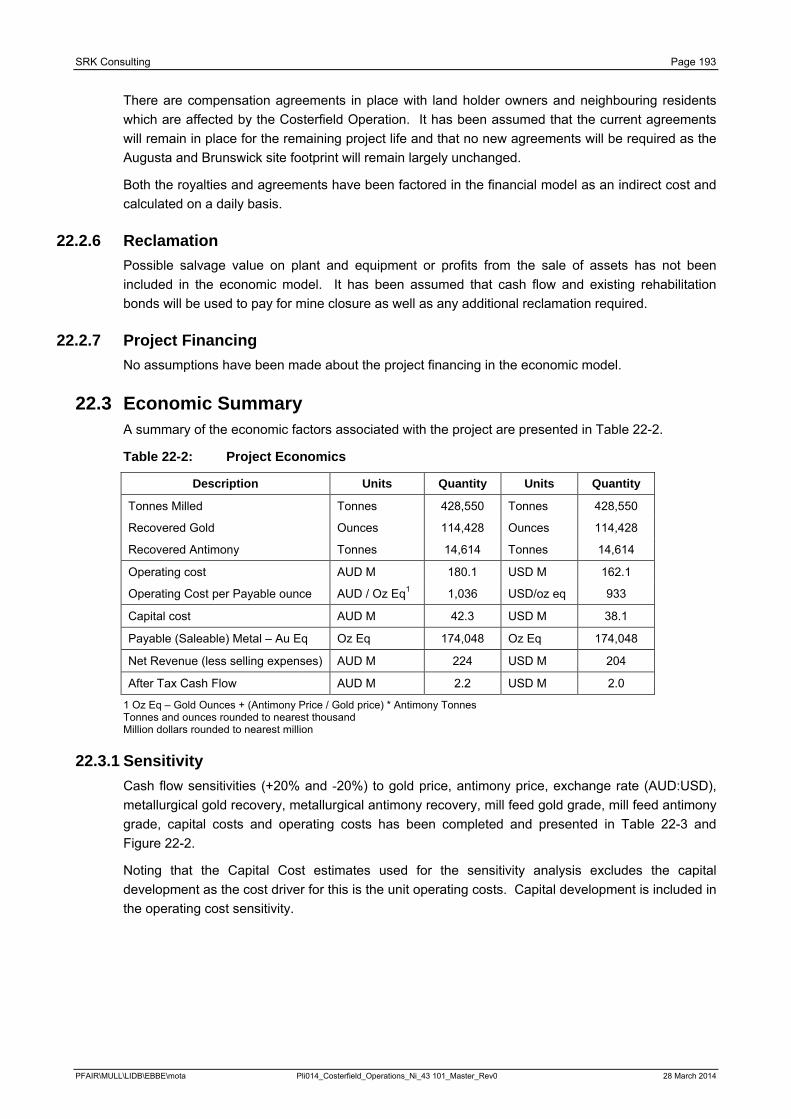
SRK Consulting Page 193
There are compensation agreements in place with land holder owners and neighbouring residents which are affected by the Costerfield Operation. It has been assumed that the current agreements will remain in place for the remaining project life and that no new agreements will be required as the Augusta and Brunswick site footprint will remain largely unchanged.
Both the royalties and agreements have been factored in the financial model as an indirect cost and calculated on a daily basis.
22.2.6 Reclamation Possible salvage value on plant and equipment or profits from the sale of assets has not been included in the economic model. It has been assumed that cash flow and existing rehabilitation bonds will be used to pay for mine closure as well as any additional reclamation required.
22.2.7 Project Financing No assumptions have been made about the project financing in the economic model.
22.3 Economic Summary A summary of the economic factors associated with the project are presented in Table 22-2.
Table 22-2: Project Economics
Description Units Quantity Units Quantity
Tonnes Milled Tonnes 428,550 Tonnes 428,550
Recovered Gold Ounces 114,428 Ounces 114,428
Recovered Antimony Tonnes 14,614 Tonnes 14,614
Operating cost AUD M 180.1 USD M 162.1
Operating Cost per Payable ounce AUD / Oz Eq1 1,036 USD/oz eq 933
Capital cost AUD M 42.3 USD M 38.1
Payable (Saleable) Metal – Au Eq Oz Eq 174,048 Oz Eq 174,048
Net Revenue (less selling expenses) AUD M 224 USD M 204
After Tax Cash Flow AUD M 2.2 USD M 2.0
1 Oz Eq – Gold Ounces + (Antimony Price / Gold price) * Antimony Tonnes Tonnes and ounces rounded to nearest thousand Million dollars rounded to nearest million
22.3.1 Sensitivity Cash flow sensitivities (+20% and -20%) to gold price, antimony price, exchange rate (AUD:USD), metallurgical gold recovery, metallurgical antimony recovery, mill feed gold grade, mill feed antimony grade, capital costs and operating costs has been completed and presented in Table 22-3 and Figure 22-2.
Noting that the Capital Cost estimates used for the sensitivity analysis excludes the capital development as the cost driver for this is the unit operating costs. Capital development is included in the operating cost sensitivity.
PFAIR\MULL\LIDB\EBBE\mota Pli014_Costerfield_Operations_Ni_43 101_Master_Rev0 28 March 2014
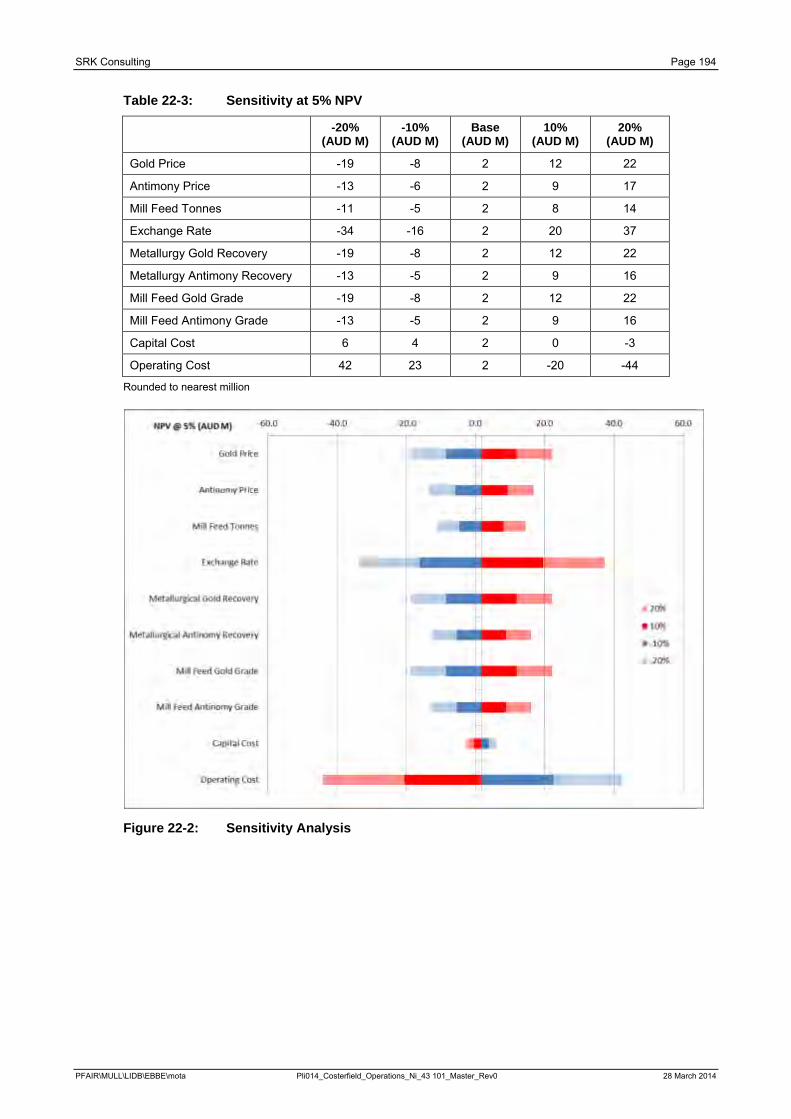
SRK Consulting Page 194
Table 22-3: Sensitivity at 5% NPV
-20% (AUD M)
-10% (AUD M)
Base (AUD M)
10% (AUD M)
20% (AUD M)
Gold Price -19 -8 2 12 22
Antimony Price -13 -6 2 9 17
Mill Feed Tonnes -11 -5 2 8 14
Exchange Rate -34 -16 2 20 37
Metallurgy Gold Recovery -19 -8 2 12 22
Metallurgy Antimony Recovery -13 -5 2 9 16
Mill Feed Gold Grade -19 -8 2 12 22
Mill Feed Antimony Grade -13 -5 2 9 16
Capital Cost 6 4 2 0 -3
Operating Cost 42 23 2 -20 -44
Rounded to nearest million
Figure 22-2: Sensitivity Analysis
PFAIR\MULL\LIDB\EBBE\mota Pli014_Costerfield_Operations_Ni_43 101_Master_Rev0 28 March 2014
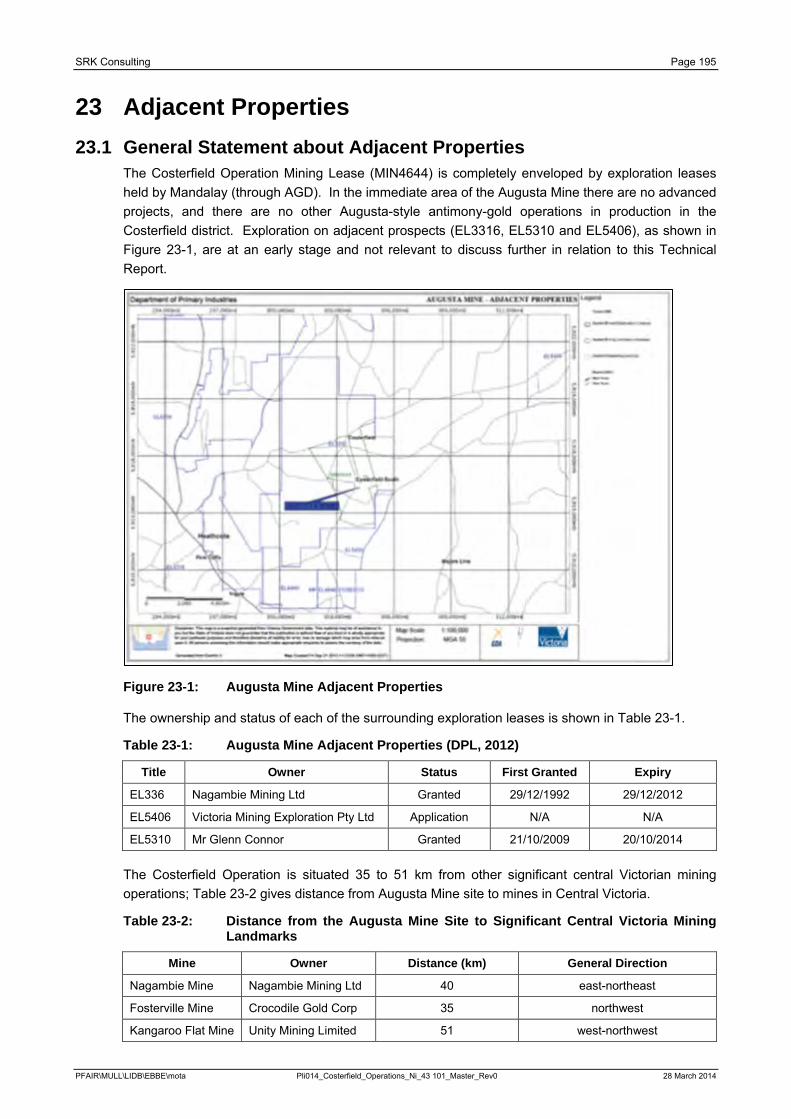
SRK Consulting Page 195
23 Adjacent Properties 23.1 General Statement about Adjacent Properties
The Costerfield Operation Mining Lease (MIN4644) is completely enveloped by exploration leases held by Mandalay (through AGD). In the immediate area of the Augusta Mine there are no advanced projects, and there are no other Augusta-style antimony-gold operations in production in the Costerfield district. Exploration on adjacent prospects (EL3316, EL5310 and EL5406), as shown in Figure 23-1, are at an early stage and not relevant to discuss further in relation to this Technical Report.
Figure 23-1: Augusta Mine Adjacent Properties
The ownership and status of each of the surrounding exploration leases is shown in Table 23-1.
Table 23-1: Augusta Mine Adjacent Properties (DPL, 2012)
Title Owner Status First Granted Expiry
EL336 Nagambie Mining Ltd Granted 29/12/1992 29/12/2012
EL5406 Victoria Mining Exploration Pty Ltd Application N/A N/A
EL5310 Mr Glenn Connor Granted 21/10/2009 20/10/2014
The Costerfield Operation is situated 35 to 51 km from other significant central Victorian mining operations; Table 23-2 gives distance from Augusta Mine site to mines in Central Victoria.
Table 23-2: Distance from the Augusta Mine Site to Significant Central Victoria Mining Landmarks
Mine Owner Distance (km) General Direction
Nagambie Mine Nagambie Mining Ltd 40 east-northeast
Fosterville Mine Crocodile Gold Corp 35 northwest
Kangaroo Flat Mine Unity Mining Limited 51 west-northwest
PFAIR\MULL\LIDB\EBBE\mota Pli014_Costerfield_Operations_Ni_43 101_Master_Rev0 28 March 2014
SRK Consulting Page 196
24 Other Relevant Data and Information Additional information that is deemed relevant to ensure this Technical Report is understandable and not misleading is discussed in the sections below.
24.1 Remnant Mining Remnant mineralisation exists above the 1049 mRL, primarily in E Lode and to a lesser extent W Lode. This remnant mineralisation has remained in situ as pillars to support the local ground stability when difficult mining conditions were encountered or the mining shapes did not prove to be economically viable when mining was conducted.
There is an opportunity to recover this material and realise its value; however, at this stage of assessment sound methodologies to identify the hazards associated with remnant mining to ensure higher levels of safety and improved extraction efficiency have not yet been determined. For this reason, the remnant mineralisation has not been included in the Technical Report.
However, Mandalay expects to progressively target remnant areas as a source of higher grade mineralisation and to support increased mining production rates as sound methodologies for planning are devised and implemented.
PFAIR\MULL\LIDB\EBBE\mota Pli014_Costerfield_Operations_Ni_43 101_Master_Rev0 28 March 2014
SRK Consulting Page 197
25 Interpretation and Conclusions 25.1 Geology
SRK makes the following observations regarding sample collection:
· Historically, core recovery was an issue for all methods of drilling at the Augusta area. Mandalay has employed methods of drilling and associated procedures to ensure the highest recovery possible. Where recovery is <90%, a repeat hole is drilled via a wedge;
· Information gained from historical drilling is still used in resource estimation. However, because much of the drilled area has already been depleted by mining, the associated risk is reduced significantly;
· Surveying of the collar and downhole follows industry best practice given the location of drill collars and the expected deviation encountered during drilling. As such, potential for significant impact on results is minimised;
· The nature of geological information collected during the logging process is considered to be in line with industry best practice and consistent with other systems employed at narrow-vein deposits; and
· Drilling pattern and density are also considered to be appropriate because sectional based intersections allow for the best possible interpretation. Where required, infill drilling is utilised to gain additional information to assist in the interpretation and estimation processes.
SRK makes the following observations regarding sample preparation and assaying:
· Sampling is of a consistent and of a repeatable nature, with appropriate QA/QC methodologies employed. The assay method used is also considered to be appropriate for this style of mineralisation;
· There is no documentation detailing visits by Mandalay personnel to the Onsite laboratories in Bendigo. SRK recommends that in the future, the lab visits and any related observations, discussions, actions, outcomes, recommendations are formally documented. A lab audit checklist could be compiled to serve as a basis for the documentation;
· The level of compliance and bias displayed by the standard reference material samples is good and demonstrates the reliability of the gold and antimony grades used to inform the Mineral Resource estimate;
· The fact that around 24% of blank samples exceeded the acceptable threshold is of concern and requires investigation. Given the very Gold high grades at the mine, it is not considered by SRK to be an issue that will have any material impact on the Mineral Resource Estimate;
· The poor reproducibility observed in the gold assays for duplicate pulps assayed by Onsite and ALS suggests that Onsite may be undercalling higher-grade assays. SRK recommends that the check assay program be continued to increase the number of samples in the dataset to add support to the observations. The good assay accuracy observed in the results from the CRM standards in 2013 suggests that the situation has improved somewhat; and
· Security of samples being transported to the laboratory is adequate. The storage facilities for returned pulps are currently being improved.
SRK makes the following observations regarding the Mineral Resource estimate:
· The substantial increases in tonnages is mainly due to infill drilling, which has facilitated the upgrade of material previously classified as Inferred and Possible Resource Categories to Indicated and\ or Measured;
PFAIR\MULL\LIDB\EBBE\mota Pli014_Costerfield_Operations_Ni_43 101_Master_Rev0 28 March 2014
SRK Consulting Page 198
· SRK has only used the Inferred, Indicated and Measured Resource Categories, and has not used the Possible Resource Category. This has added new Resources because the Possible material is not reported;
· Modifications made to the geological models, the definition of the domains and differences in the estimation parameters has also influenced the changes in the estimates;
· Mineralisation with a sparser drill spacing such as Cuffley Lode and parts of N Main Lode benefit substantially from any additional structural information that can feed into the geological model to guide definition of the domains and resource modelling; and
· Reconciliation results show good precision and reasonable accuracy between the resource block model data and the processing plant data. Unquantified errors such as stockpiling, ore-waste misallocation, and unplanned (mineralised) dilution influenced the reconciliation data. Over the period, the ounces of Gold predicted by the model were 16% lower than produced by the plant. The tonnes of Antimony predicted by the model were 6% lower than produced by the plant. Antimony reconciliation improved markedly in the latter half of the year. Reconciliation data was similar in 2012, with the Gold 14% lower and the Antimony 3% lower.
In SRK’s opinion, the geological data used to inform the Augusta and Cuffley Mineral Resource estimates were collected in line with industry best practice as defined in the Canadian Institute of Mining and Metallurgy and Petroleum (CIM) Exploration Best Practice Guidelines and the CIM Mineral Resource, Mineral Reserve Best Practice Guidelines. As such, the data are suitable for use in the estimation of mineral resources. The reconciliation results also give confidence to the sample collection procedures, the quality of the assays, and the resource estimation methodology.
25.2 Mining SRK makes the following observations regarding the mining operations:
· Inferred resources have not been included in the economic evaluation.
· The potential exists to convert Inferred Resources that are not included in the Mineral Reserve into the LoM plan that have the potential to improve the project economics.
· There has been a history of conversion of Inferred to Indicated Resources resulting in additional Resources form outside the Mineral Reserve being included in mine plans.
· Mandalay has demonstrated an ability to refine and improve mining method and productivity based on continuing to increase and improve the geological information and thus mine designs and planning.
PFAIR\MULL\LIDB\EBBE\mota Pli014_Costerfield_Operations_Ni_43 101_Master_Rev0 28 March 2014
SRK Consulting Page 199
PFAIR\MULL\LIDB\EBBE\mota Pli014_Costerfield_Operations_Ni_43 101_Master_Rev0 28 March 2014
26 Recommendations 26.1 Geology
The Costerfield Property is an advanced property and Mandalay has a history of successful exploration and mining on the Property. SRK has observed that the degree of technical competency evident in the work performed by Mandalay geologists is high, particularly in the structural analysis of the local geology. This has contributed to the successes that have been realised at the Costerfield project. Therefore, SRK is not in a position to recommend a work program that would add value to the existing work plans.
26.2 Mining Based on the findings of this Technical Report the following recommendations are provided:
Continue the resource definition to determine potential to introduce additional resources form Cuffley into Reserve and the mien plan.
Undertake more detailed scheduling work to smooth the development and production profile; and
Continue to refine and review mining methods and capital development designs to enable additional resources currently below the cut-off grade to be included in the mine plan.
26.3 General Other recommendations and actions currently underway by Mandalay and endorsed by SRK include:
Continue efforts to further develop and refine the water management strategy; and
Continue to improve the strategy for increasing TSF capacity.
Compiled by
Mr Peter Fairfield
Principal Consultant (Project Evaluations)
Peer Reviewed by
Ms Anne-Marie Ebbels
Principal Consultant (Mining)
The Effective Date of this Report is 31 December 2013.
This report was signed 28 March 2014
SRK Consulting Page 200
27 References SRK 2013, Mandalay Resources Corporation, Costerfield Operation, Victoria, Australia; Preliminary
Economic Assessment, September 2013.
Biosis Research, 2005. Flora, Fauna and habitat hectare values of native vegetation at Peels Lane, Costerfield South, Victoria.
Edwards et al. 1998. Heathcote and Parts of Woodlawn & Echuca 1:100,000 Map Area Geological Report, Geological Survey Report No. 108.
Evans-Wheeler J. 2007. Expert Tenement report. Memo to AGD from Tenements Administration Services.
Fredericksen D. 2009. Costerfield Gold and Antimony Project, Augusta and Brunswick Deposits. Fredericksen Geological Solutions Pty Ltd.
Fredericksen D. 2011. Augusta Project Mineral Resource Estimate for Mandalay Resources – Costerfield Operations. Fredericksen Geological Solutions Pty Ltd.
Haines Surveys, 2005; Job 0599 Costerfield Gravity Survey AGD Operations Pty Ltd.
Hanson N. February (1995) Costerfield Project Brunswick Reef Mine Resource Modelling and Estimations, Imago, Unpub. Report for Australian Gold Development NL
Huxtable D. August 1972. Ore Potential of Brunswick Reef, Internal Mid-East Minerals NL report.
Kitch R. 2001. Independent Fairness Valuation of Costerfield Joint Venture Rob. Kitch and Associates Pty Ltd Unpublished Report for AGD Mining Ltd.
MODA. September 2005. Augusta Project Mineral Resources and Ore Reserves Assessment. For AGD Operations Pty. Ltd.
Shakesby R.A. 1998. Notes on Visit to the Costerfield Project, 23rd and 24th July 1998, Unpublished Report for AGD Mining Pty Ltd.
Snowden, 2012. Mandalay Resource Corporation: Costerfield (Augusta) Gold-Antimony Mine: Mineral Resource and Mineral Reserve Estimate. Project No. 03151. NI 43-101 Technical Report.
Stock, E., & Zaki, N., 1972; Antimony Dispersion Patterns at Costerfield. Mining and Geological Journal Vol. 7 No. 2 (1972) Geological Survey of Victoria.
Stockton I. August 1998. Brunswick Shear Project Prefeasibility Study.
Stoker, P.T., 2006. Newmont Australia Technical Services Sampling Notes. AMC Report. January 2006, 03-05pp
Systems Exploration Project #40, 2005; Petrophysical Results Mesoscale Laboratory Data, October 2005.
Thomas D.E. 1937. Some notes on the Silurian Rocks of the Heathcote Area, Mining and Geological Journal Vol. 1 No. 1 Geological Survey of Victoria.
Thomas D.E. 1941. Parish of Costerfield 1:31,680 Geological Map. Mines Department of Victoria.
UTS, 2008. UTS Geophysics Logistics Report for a Detailed Magnetic, Radiometric and Digital Terrain Survey for the Costerfield Project, carried out on behalf of AGD Operations Pty Ltd. (UTS Job #B054).
PFAIR\MULL\LIDB\EBBE\mota Pli014_Costerfield_Operations_Ni_43 101_Master_Rev0 28 March 2014
SRK Consulting Page 201
VandenBerg, A.H.M., Willman, C.E., Maher, S., Simons, B.A., Cayley, R.A., Taylor, D.H., Morand, V.J., Moore, D.H. & Radojkovic, A., 2000. The Tasman Fold Belt System in Victoria. Geological Survey of Victoria Special Publication.
Weber and Associates. December 2004. Resource Calculations: Brunswick Mine Area (2004). For AGD Operations Pty. Limited.
Webster, R. 2008. Resource estimate of the Augusta Deposit, Costerfield Victoria Australia. Technical Report prepared for AGD Operations. AMC Consultants Pty Ltd.
Zonge, 2012; Report No. 944, Costerfield Downhole Induced Polarisation and Downhole Self Potential Surveys, Logistics Summary, November 2011 for Mandalay Resources, Compiled by S. Mann, March 2012, Zonge Engineering and Research Organisation (Australia) Pty Ltd.
PFAIR\MULL\LIDB\EBBE\mota Pli014_Costerfield_Operations_Ni_43 101_Master_Rev0 28 March 2014