Embed Size (px)
Citation preview

Report prepared for Department of the Environment
Costs and benefits of Australia phasing-down mercury
MAY 2015FINAL REPORT

Marsden Jacob AssociatesFinancial & Economic Consultants
ABN 66 663 324 657ACN 072 233 204
Internet: http://www.marsdenjacob.com.auE-mail: [email protected]
Melbourne office:Postal address: Level 3, 683 Burke Road, CamberwellVictoria 3124 AUSTRALIATelephone: +61 3 9882 1600Facsimile: +61 3 9882 1300
Perth office:Level 1, 220 St Georges Terrace, Perth Western Australia, 6000 AUSTRALIATelephone: +61 8 9324 1785Facsimile: +61 8 9322 7936
Sydney office:Phil PickeringTelephone: +61 434 884 220Rod CarrTelephone: +61 418 765 393
Author: Alex Marsden, Elizabeth O’Brien, Peter [email protected]
This report has been prepared in accordance with the scope of services described in the contract or agreement between Marsden Jacob Associates Pty Ltd ACN 072 233 204 (MJA) and the Client. Any findings, conclusions or recommendations only apply to the aforementioned circumstances and no greater reliance should be assumed or drawn by the Client. Furthermore, the report has been prepared solely for use by the Client and Marsden Jacob Associates accepts no responsibility for its use by other parties.
Copyright © Marsden Jacob Associates Pty Ltd 2015

MARSDEN JACOB ASSOCIATES
TABLE OF CONTENTSPage
Executive summary..............................................................................i
1. Introduction..................................................................................11.1 Ratifying the Minamata Convention....................................................................11.2 Key obligations of the Convention.......................................................................41.3 Project approach and scope................................................................................5
2. Cost benefit analysis.....................................................................82.1 Cost benefit analysis overview............................................................................82.2 Sensitivity analysis............................................................................................102.3 Likely impact on consumers..............................................................................13
3. Regulatory burden analysis..........................................................153.1 Regulatory burden costs by industry.................................................................153.2 Regulatory burden summary and conclusions...................................................19
4. Government costs.......................................................................204.1 Impacted agencies............................................................................................204.2 Costs..................................................................................................................214.3 Conclusion.........................................................................................................26
5. Industry costs.............................................................................285.1 Industries with potential air emissions..............................................................305.2 Cane growers.....................................................................................................375.3 Dental practices................................................................................................415.4 Lighting sector...................................................................................................475.5 Waste and recycling sector...............................................................................565.6 Oil and gas production.......................................................................................56
6. Health and environmental outcomes............................................606.1 Overview...........................................................................................................606.2 Approach...........................................................................................................606.3 Environmental benefits......................................................................................606.4 Health benefits of phasing-down mercury.........................................................686.5 Workplace safety benefits.................................................................................76
Appendix A: Details of the scenarios considered.................................78
Appendix B: Risks and uncertainties..................................................81
Appendix C: Cost benefit and regulatory burden framework................87
Appendix D: Industry consultation.....................................................91
Department of the EnvironmentCosts and benefits of ratifying the Minamata Convention on Mercury
MARSDEN JACOB ASSOCIATES
LIST OF TABLES Page
Table 1: Scenarios 2A, 2B and 2C Average Annual Regulatory Costs to Business..............................iiiTable 2: Summary of costs and benefits.............................................................................................7Table 3: Cost benefit analysis results for scenarios 2A, 2B and 2C (Note values are provided in millions)...............................................................................................................................................9Table 4: Sensitivity analysis showing the Net Present Value for each scenario................................10Table 5: Assumptions applied to key variables in most likely, best and worst case outcomes.........11Table 6: Cost benefit analysis results for scenarios 2A, 2B and 2C (Note values are provided in millions).............................................................................................................................................12Table 7: Government impacts by Article...........................................................................................25Table 8: Summary of Government costs...........................................................................................26Table 9: Industry impacts by Article..................................................................................................29Table 10: Estimated air emissions of mercury and compounds 2013-14..........................................33Table 11: Estimated numbers of dentists and installations required.................................................46Table 12: Mercury vapour street light stocks (in 2015).....................................................................51Table 13: Mercury vapour and equivalent non-mercury technology used in analysis.......................54Table 14: Mercury Concentration in Sediment of Albany, WA...........................................................63Table 15: Mercury Concentrations in Fish in Australia.......................................................................64Table 16: Annual loss of IQ points in Australian population due to maternal mercury in hair...........71Table 17: Spadaro and Rabl’s estimate of harm caused per kg of mercury released into the environment......................................................................................................................................72Table 18: Australian estimate of harm caused per kg of mercury (benefit transfer).........................72Table 19: Total mass of mercury prevented from entering environment (kg/yr)...............................75Table 20: Total value of the mercury prevented from entering the environment ($ million)............75Table 21: Reduction in incidence of work incidents involving mercury.............................................77Table 22: Cost estimation for power generation upgrades required to meet BAT/BEP guidance......83Table 23: United States mercury limits under the Mercury and Air Toxics Standards.......................84Table 24: Mercury emissions from newer coal-fired power stations in Australia...............................85Table 25: Summary costs and benefits..............................................................................................88
LIST OF FIGURESPage
Figure 1: Net Benefits and Benefit Cost Ratio for each scenario.........................................................iiiFigure 2: Parties and Signatories to the Minamata Convention globally.............................................3Figure 3: Likely Timeline for entry into force of the Minamata Convention.........................................4Figure 4: Summary of the cost benefit analysis ($ millions)................................................................8Figure 5: Modelled phase out of mercury vapour lamps for RBM......................................................18Figure 6: Comparison of bud germination at 120 days for differing pesticide treatments................39Figure 7: Estimated phase-out of HPMV lamps under base case and phase-down scenarios............53Figure 8: Mercury emission hot spots – highlighting the spatial distribution of anthropogenic mercury emissions.............................................................................................................................62Figure 9: Priority pollutants for each region of the Great Barrier Reef.............................................66Figure 10: Expected mercury emissions under the base case and scenarios 2A, 2B and 2C............73
Department of the EnvironmentCosts and benefits of ratifying the Minamata Convention on Mercury

MARSDEN JACOB ASSOCIATES
Executive summaryMercury is a persistent global pollutant. Exposure to mercury poses a serious risk to the environment and human health worldwide. The World Health Organisation has suggested that mercury may have no threshold below which some adverse effects do not occur.1
The Minamata Convention on Mercury (the Convention) is a multilateral environmental agreement that addresses the adverse effects of mercury through practical actions to protect human health and the environment from anthropogenic emissions and releases of mercury and mercury compounds.
Australia signed the Convention and is now considering phasing-down mercury emissions and ratifying the Convention to become a full Party to the Convention. Ratification of the Convention would legally bind Australia to the Convention’s obligations.
A team lead by Marsden Jacob Associates was commissioned by the Commonwealth Department of the Environment to undertake a cost benefit analysis of phasing-down mercury emissions and ratification of the Convention. The analysis also assesses the predicted regulatory burden from ratification. This report summarises our findings on the likely impacts from Australia’s ratification of the Convention and other options to phase-down mercury in Australia.
Approach
Two forms of economic analysis were undertaken in order to assess the impact from a national phase-down of mercury in response to Australia’s ratification of the Convention:
a cost benefit analysis which considers the likely cost to government and industry as well as benefits to the community (in terms of health and environmental benefits2) of each scenario compared to a base case.
a regulatory burden measurement to estimate the costs borne by industry to comply with amended regulations under the ratification scenarios.
To inform the analysis, Marsden Jacob reviewed previously published reports and undertook consultation with industry stakeholders to ensure that impacts to industry were appropriately and adequately captured. In addition, the Department facilitated liaisons with relevant government agencies and Departments regarding to changes required to facilitate the ratification of the Convention.
Scenarios
In order to identify the costs and benefits of a national phase-down of mercury, Marsden Jacob, in conjunction with the Department, developed two primary scenarios that align to international best practice:
1. Scenario 1 (base case): Under the base case scenario we consider what will occur if the Convention is not ratified by Australia.
1 World Health Organization, Mercury in Healthcare – Policy paper, 2006 www.who.int/water_sanitation_health/medicalwaste/mercurypolpap230506.pdf
2 Note that while mercury is a global pollutant, the cost-benefit analysis only considers the impact of Australia’s mercury emissions on the Australian population and environment.
Department of the EnvironmentCosts and benefits of ratifying the Minamata Convention on Mercury
ES.i

MARSDEN JACOB ASSOCIATES
2. Scenario 2 (phase-down of mercury): In the alternative scenario we consider what will occur if a national phase-down of mercury takes place such that Australia satisfies the requirements to ratify the Convention. We also consider what will occur if Australia goes beyond those requirements to address specific domestic activities that significantly contribute to Australia’s mercury emissions and releases.
Under the phase-down scenario three sub-options were considered:
Scenario 2A: Australia undertakes the minimum actions required to meet the Minamata Convention; and
Scenarios 2B and 2C: Australia undertakes further actions beyond the minimums required by the Convention in specific areas – dental amalgam and mercury containing pesticides.
Scenario 2B considers additional actions for the removal of waste amalgam from dental practices (akin to an expansion of the now completed Victorian Dentists For Cleaner Water program); and
Scenario 2C considers both the removal of waste amalgam from dental practices and the early phase-out of mercury-containing pesticides whereby manufacture ceases in 2017 rather than 2020 (under the minimum requirements scenario).
Under both the base case and ratification scenario the Convention is assumed to be globally ratified and come into effect by 2016. As the Convention restricts trade of mercury and mercury related products, the ratification of the Convention by other countries would impact on Australia domestically regardless of Australia’s decision to ratify. As mercury is a global pollutant the commencement of the Convention globally would impact on mercury concentrations in Australia which derive from changes in other country’s emission levels. However, for the purposes of this analysis, we have only considered the impact of Australia’s mercury emissions on the Australian population and environment.
A more detailed description of each of the scenarios has been provided in Appendix A.
Results of the cost benefit analysis
The results of the cost benefit analysis are summarised using two main metrics:
Net present value, which is the present value of benefits delivered by the policy less the present value of costs incurred. It measures the expected benefit (or cost) to society of implementing each scenario.
Benefit Cost Ratio, which is the ratio of the present value of benefits to present value of costs.
For each of the scenarios (2A, 2B and 2C) a ‘most likely’ outcome has been identified and is the focus of the analysis. In addition a ‘best case’ and ‘worst case’ outcome has been developed as a sensitivity analysis.
The ‘most likely’ net present values for scenarios 2A, 2B and 2C are estimated to be $145.4 million, $148.6 million and $207.0 million respectively3.
3 All values in the cost benefit are provided in 2015 Australian dollar values and are calculated in real terms. These “Most likely” values are calculated using a 7% real discount rate.
Department of the EnvironmentCosts and benefits of ratifying the Minamata Convention on Mercury
ES.ii

MARSDEN JACOB ASSOCIATES
Scenario 2C has the greatest net present value under the ‘most likely’ case and is therefore expected to deliver the greatest benefit to the community. However, Scenario 2A has the highest Benefit Cost Ratio. These results are summarised in Figure 1.
Figure 1: Net Benefits and Benefit Cost Ratio for each scenario
Source: Marsden Jacob analysis
Results from the regulatory burden measurement
Regulatory burden measurement (RBM) was undertaken in line with guidance4 and focuses only on private sector costs and those of Government Owned Corporations.
The RBM values are provided as a simple average of costs to industry over the first 10 year period (2016 to 2025) using 2015 values. These costs include administrative compliance costs, substantive compliance costs and delay costs.
Table 1: Scenarios 2A, 2B and 2C Average Annual Regulatory Costs to Business
Average annual regulatory costs (from business as usual)
Change in costs Scenario 2AMinimum Requirements
Scenario 2B Ratification+ Amalgam
Separators
Scenario 2C Ratification+ Early
removal of Shirtan+ Amalgam Separators
Sugar Cane Growers $0 $0 $8,400
Dental $0 $4,067,540 $4,067,540
Public Lighting $12,589,794 $12,589,794 $12,589,794
Total $12,589,794 $16,657,334 $16,665,734
Government activities impacted
Commonwealth, State and Territory Governments all have a role in Australia’s regulation of mercury. The international trade in mercury and mercury-added products is primarily controlled by the Commonwealth, while mercury emissions from point sources and the manufacture of
4 Department of Prime minister and Cabinet, Regulatory Burden Measurement Framework, Guidance Note February 2015, www.dpmc.gov.au/office-best-practice-regulation/publication/regulatory-burden-measurement-framework-guidance-note
Department of the EnvironmentCosts and benefits of ratifying the Minamata Convention on Mercury
ES.iii
MARSDEN JACOB ASSOCIATES
mercury-added products are primarily regulated through licence arrangements implemented at a State and Territory level basis.
The following Commonwealth agencies have been identified as needing to take action to ensure Australia meets obligations under the Convention:
Department of the Environment;
Department of Health;
Australian Pesticides and Veterinary Medicines Authority;
Australian Customs and Border Protection Service;
Department of Industry and Science; and
Department of Defence.
Costs associated with amended regulations and changes to government activity related to the control of mercury were considered in terms of setup costs and changes to ongoing costs. In each case the costs are estimated to be minimal.
Industries impacted
Marsden Jacob’s analysis identified that industry impacts are driven by four Articles of the Convention. The following table maps the impact from each of the four Articles to the key industry impacts.
Table 2: Impact from each of the four Articles to the key industry impacts
Under the ‘most likely’ outcome minimum ratification scenario (2A) only cane growers and street lighting customers would be impacted directly.
Environmental and health benefits
Environmental impacts from changes which reduce mercury emissions and releases to land or water would likely benefit key environmental assets such as the Great Barrier Reef. However, these benefits have not been valued in the analysis as concentrations of mercury in receiving environments and levels of mercury at which adverse impacts on receiving environments are observed is not well established in the literature. For these reasons, with the exception of carbon savings from adoption of more energy efficient non-mercury street lights, environmental benefits are only qualitatively discussed in the cost benefit analysis. Quantitative results of the cost benefit analysis, presented earlier, should be viewed in this light.
Department of the EnvironmentCosts and benefits of ratifying the Minamata Convention on Mercury
ES.iv

MARSDEN JACOB ASSOCIATES
Human health impacts of mercury exposure, by contrast, have been well documented and researched. Human exposure to methylmercury occurs primarily through ingestion of seafood and freshwater fish.
Mercury exposure has been associated with a range of health effects including neurological effects, effects on the kidneys and cardiovascular effects. The most studied outcomes of mercury effects are cognitive development in children in particular loss of Intelligence Quotient (IQ) and developmental effects.
To calculate the loss of IQ related to maternal hair mercury the following equation has been applied:
Loss of IQ per child = Dose response relationship x maternal hair concentration
This is consistent with the approach used by a study conducted by United States Environmental Protection Agency’s Regulatory Impact Analysis for the Final Mercury and Air Toxics Standards in 20115.
Applying the approach used in previous studies the health costs of mercury emissions in Australia have been estimated at $4,862/kg.
This ‘most likely’ outcome results in present value health benefits of $166.71 million under scenario 2A across the 20 year timeframe of the analysis. These benefits are estimated to increase to $214.26 million and $273.10 million respectively under scenarios 2B and 2C.
Additional health benefits have been identified where changes introduced to meet obligations under the Convention would reduce or eliminate health and safety incidents. These have been quantified at contributing present value benefits of $1.49 million under each ratification scenario (2A, 2B, and 2C) for the ‘most likely’ case.
5 United States Environmental Protection Agency (2011) Regulatory Impact Analysis for the Final Mercury and Air Toxics Standards, EPA-452/R-11-011 December 2011. Available at: http://www.epa.gov/ttnecas1/regdata/RIAs/matsriafinal.pdf
Department of the EnvironmentCosts and benefits of ratifying the Minamata Convention on Mercury
ES.v

1. IntroductionExposure to mercury poses a serious risk to the environment and human health worldwide. It can cause a range of serious health impacts which can include cognitive impairment (mild mental retardation), permanent damage to the central nervous system, kidney and heart disease, infertility, and respiratory, digestive and immune problems. The World Health Organisation strongly advises that pregnant women, infants, and children in particular avoid exposure to excess mercury.6 Mitigating and resolving the problems caused by mercury can be costly, particularly in regard to remediation.
The most common sources of environmental and human exposure to mercury in Australia include; certain species of fish, air emissions from coal-fired power stations and non-ferrous metal smelters, mercury-containing pesticides, damaged fluorescent and low-energy lamps, leaking mercury-containing thermometers and batteries, and amalgam dental fillings. At their end-of-life, many of these products are sent to landfill or incinerated, resulting in further emissions and releases of mercury into the environment. Mercury in the environment can also threaten the health of wildlife which can be exposed to mercury through their food sources.
One of the key approaches to addressing the issue of mercury exposure is to prevent its emission and release from anthropogenic (human-generated) sources.
The Minamata Convention on Mercury (the Convention) is a multilateral environmental agreement that addresses the adverse effects of mercury through practical actions to protect human health and the environment from anthropogenic emissions and releases of mercury and mercury compounds.
Australia signed the Convention on 10 October 2013 and is now considering ratifying the Convention to become a full Party to it. Ratification of the Convention would legally bind Australia to the Convention’s obligations.
Marsden Jacob Associates, with support from Toxikos, were commissioned by the Commonwealth Department of the Environment (the Department) to undertake a cost benefit analysis of ratification of the Convention including a regulatory burden measurement of private sector costs associated with ratification.
The results from this analysis are presented in this report. Marsden Jacob understands that this analysis will be used to support a Regulatory Impact Statement (RIS) which the Department is preparing. The RIS will recommend whether Australia should ratify the Convention.
1.1 Ratifying the Minamata ConventionThe Convention is a global treaty to protect human health and the environment from the adverse effects of mercury.
The Convention requires ratified Parties to address mercury throughout its lifecycle, including its production, its intentional use in products and processes, its unintentional release from industrial activity, through to end-of-life aspects including water, contaminated sites and long-term storage.
The Convention was agreed at the fifth session of the Intergovernmental Negotiating Committee in Geneva, Switzerland on 19 January 2013.
6 World Health Organisation (2013) ‘Factsheet No361: Mercury and Health’, last updated September 2013. Accessed 16 May 2015. Available at: http://www.who.int/mediacentre/factsheets/fs361/en/
Department of the EnvironmentCosts and benefits of ratifying the Minamata Convention on Mercury
1

Ratification of the Convention
Ratification of the Convention7 would elevate Australia to be a “Party to the Convention” and legally bind Australia to the Convention’s obligations once the Convention enters into force.8
The ratification process involves sending a formal letter to the UN agreeing the Convention applies to Australia (an instrument of ratification).
Achieving Party status will allow Australia to participate in important decision-making for the Convention by its Conference of the Parties. Importantly, this includes negotiation of guidance on best available techniques and best environmental practices (BAT/BEP) which will be agreed at Conferences of the Parties and required to be followed by Parties.9
In order to participate as a Party to the Convention at the first Conference of the Parties, Australia would optimally ratify the Convention around the time the Convention comes into force to allow planning for the first Conference of the Parties and participation in important decision-making processes for the finer technicalities of the Convention.
These technicalities include; the adoption of guidance on trade provisions and certification for mercury trade, guidance for atmospheric emissions, financial and reporting arrangements, and the election of members to the Implementation and Compliance Committee.
When will the Convention come into force?
The Convention will enter into force 90 days after 50 countries have ratified, with the first Conference of the Parties to be held within 12 months of the treaty being enacted.
If Australia is among the first 50 countries to ratify, the Convention will become legally binding when the Convention enters into force. Alternatively, if Australia is not among the first 50 countries to ratify, the Convention will bind Australia 90 days after the instrument of ratification. Countries are ‘Parties to the Convention’ only when the Convention becomes binding on them.
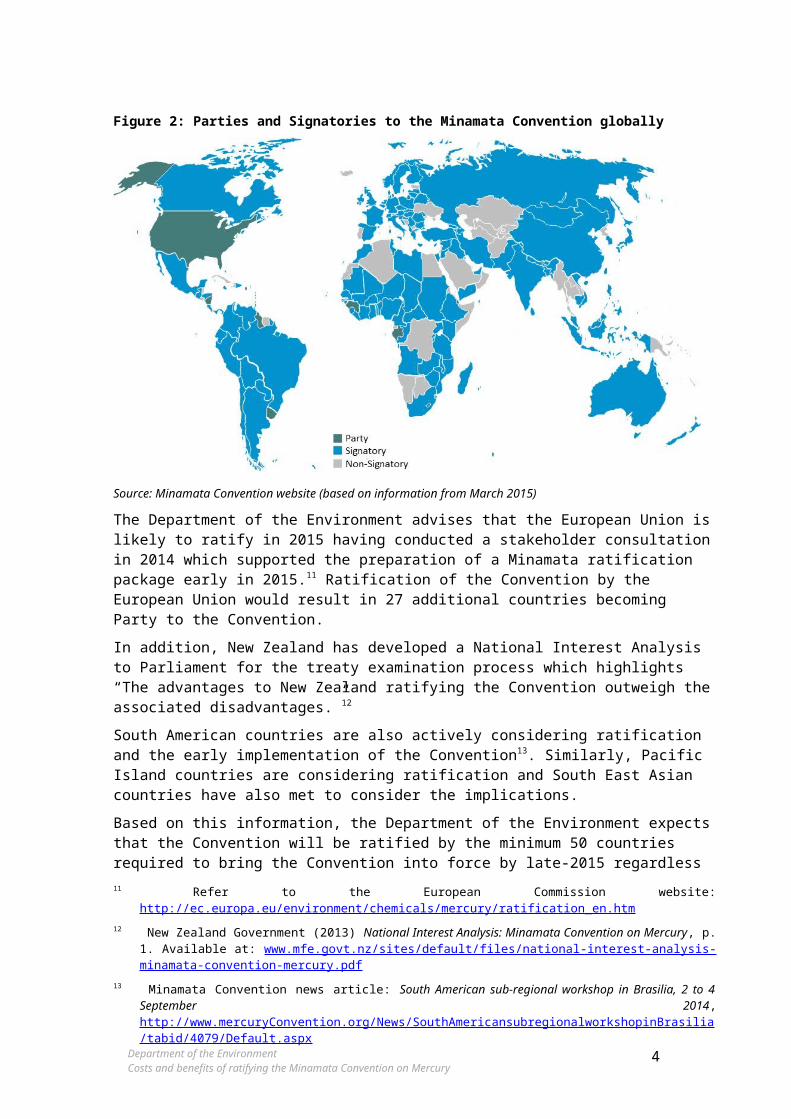
There are currently 128 signatories to the Convention and 10 countries have already ratified and are Parties to the Convention10 (Figure 2).
7 Australia is currently a signatory to the Convention. Being a signatory does not create any legally binding obligation but does demonstrate the intent to examine the treaty domestically and consider ratifying it. If Australia ratifies, it will automatically become a Party to the Convention once the Convention comes into force. At that time, Australia would be legally bound by the obligations in the Convention unless specific exemptions had been sought.
8 the Convention will enter into force once the Convention comes into force (90 days after 50 countries have ratified)9 As set out in detail in section 5.1, Article 8 paragraph 8 stipulates that the guidance on best available techniques and
best environmental practices will be adopted at the first meeting of the parties. Article 9 also includes provision for guidance on best available techniques and best environmental practices – but the timing is not stipulated.
10 As at 12 April 2015 Djibouti, Gabon, Guinea, Guyana, Lesotho, Monaco, Nicaragua, Seychelles, United States of America, and Uruguay are all Parties to the Convention having ratified the Convention subsequent to becoming Signatories. For an up-to-date list of signatories, refer to: http://www.MercuryConvention.org/Countries/tabid/3428/Default.aspx
Department of the EnvironmentCosts and benefits of ratifying the Minamata Convention on Mercury
2

Figure 2: Parties and Signatories to the Minamata Convention globally
Source: Minamata Convention website (based on information from March 2015)
The Department of the Environment advises that the European Union is likely to ratify in 2015 having conducted a stakeholder consultation in 2014 which supported the preparation of a Minamata ratification package early in 2015.11 Ratification of the Convention by the European Union would result in 27 additional countries becoming Party to the Convention.
In addition, New Zealand has developed a National Interest Analysis to Parliament for the treaty examination process which highlights “The advantages to New Zealand ratifying the Convention outweigh the associated disadvantages.”12
South American countries are also actively considering ratification and the early implementation of the Convention13. Similarly, Pacific Island countries are considering ratification and South East Asian countries have also met to consider the implications.
Based on this information, the Department of the Environment expects that the Convention will be ratified by the minimum 50 countries required to bring the Convention into force by late-2015 regardless of Australia’s decision. The exact timing of ratification by 50 countries is unknown – but it is necessary to consider the likely timings to identify the timeframe before the first Conference of the Parties. The following paragraphs set out a likely timeframe for the Convention entering into force and the first Conference of the Parties.
If the Convention is ratified by the 50th country in late-2015 (e.g. October 2015), then it will enter into force in early-2016 and the first Conference of the Parties would be held in either late-2016 or early 2017.
Figure 3 summarises this likely timeline and highlights that from the date the Convention comes into force, the import and export of mercury will begin to be restricted, and manufacture and trade of specified mercury containing products will be restricted from 2020 onwards. This will occur 11 Refer to the European Commission website: http://ec.europa.eu/environment/chemicals/mercury/ratification_en.htm 12 New Zealand Government (2013) National Interest Analysis: Minamata Convention on Mercury, p. 1. Available at:
www.mfe.govt.nz/sites/default/files/national-interest-analysis-minamata-convention-mercury.pdf 13 Minamata Convention news article: South American sub-regional workshop in Brasilia, 2 to 4 September 2014 ,
http://www.mercuryConvention.org/News/SouthAmericansubregionalworkshopinBrasilia/tabid/4079/Default.aspx Department of the EnvironmentCosts and benefits of ratifying the Minamata Convention on Mercury
3
regardless of Australia’s decision to ratify the Convention, as other countries who become Parties to the Convention will still be meeting its obligations. The key obligations under the Convention are summarised in section 1.2.
Figure 3: Likely Timeline for entry into force of the Minamata Convention
1.2 Key obligations of the ConventionThe Convention consists of 35 Articles and 5 Annexes detailing obligations which seek to “protect the human health and the environment from anthropogenic emissions and releases of mercury and mercury compounds”14.
The Convention sets out a number of ‘firm’ obligations – which impose specific requirements, as well as a number actions which Parties to the Convention may endeavour to undertake (but which are not specifically required).
The following briefly summarises the key obligations the Convention imposes on Parties:
Restrictions to mercury supply sources and trade (Article 3) such as ensuring no development of new mercury mines, phasing out primary mercury production; and restricting the export and import of mercury in the absence of written consent agreements between countries;
Phase-out of manufacture, import and export of specific mercury-added products (Article 4) including batteries, switches and relays, various lighting products with mercury content exceeding set limits and all mercury vapour lights, cosmetics with mercury content above a set limit, pesticides, biocides and topical antiseptics, and various non-electrical measuring devices where no mercury-free alternative is available (as listed in Annex A of the Convention).
Phase-out of specific manufacturing processes in which mercury or mercury compounds are used (Article 5) such as various chemical productions and production in which mercury or mercury compounds are used as a catalyst (as listed in Annex B of the Convention).
Develop initiatives to reduce artisanal and small-scale gold mining (Article 7) in which mercury amalgamation is used to extract gold from ore.
Control or reduce air emissions of mercury and mercury compounds (Article 8) for source categories listed in Annex D of the Convention (includes coal-fired generation, smelting and roasting processes for specific non-ferrous metals, waste incineration facilities and cement clinker production facilities).
14 United Nations Environment Programme (October 2013) Minamata Convention on Mercury: Text and Annexes, p. 6 A full copy of the Convention is available from the UNEP Minamata Convention on Mercury website: http://www.mercuryConvention.org/Convention/tabid/3426/Default.aspx.
Department of the EnvironmentCosts and benefits of ratifying the Minamata Convention on Mercury
4

Control or reduce releases of mercury and mercury compounds (Article 9) to land and water from relevant point sources (not otherwise listed in the Convention) by undertaking appropriate measures such as setting limit values, use of best available techniques and best environmental practice and promoting alternative measures.
Ensure the environmentally sound interim storage of mercury (Article 10) in accordance with relevant sections of the Basel Convention; and
Control and manage mercury wastes (Article 11) in accordance with the relevant sections of the Basel Convention (to which Australia is already a Party).
The Convention also requires Parties to contribute financially towards activities undertaken for the Convention’s administration; as well as fulfilling a number of reporting, monitoring and information exchange requirements.
1.3 Project approach and scopeThe purpose of this report is to present a clear, concise and comprehensive explanation of likely costs and benefits from Australia’s decision to phase-down mercury, positioning the country to become a ratified Party to the Minamata Convention.
1.3.1 ScenariosIn order to identify the costs and benefits of a national phase-down of mercury, Marsden Jacob, in conjunction with the Department, developed two primary scenarios for ease of reference and align to international best practice:
1. Scenario 1 (base case): Under the base case scenario we consider what will occur if the Convention is not ratified by Australia.
2. Scenario 2 (phase-down of mercury): In the alternative scenario we consider what would occur if a national phase-down of mercury took place such that Australia satisfies the requirements to ratify the Convention. We also consider what would occur if Australia went beyond those requirements to address specific domestic activities that significantly contribute to Australia’s mercury emissions and releases.
Under the phase-down scenario three sub-options were considered:
Scenario 2A: Australia undertakes the minimum actions required to meet the Minamata Convention; and
Scenarios 2B and 2C: Australia undertakes further actions to the minimums required by the Convention in specific areas – dental amalgam and mercury containing pesticides.
Scenario 2B considers additional actions for the removal of waste amalgam from dental practices (akin to an expansion of the now completed Victorian Dentists For Cleaner Water program); and
Scenario 2C considers both the removal of waste amalgam from dental practices AND the early phase-out of mercury-containing pesticides whereby manufacture ceases in 2017 rather than 2020 (under the minimum requirements scenario).
Importantly there is sufficient evidence to suggest that the Convention will come into force regardless of Australia’s participation in the Convention. As such, regardless of the scenario we assume the Convention comes into force from early 2016.
Department of the EnvironmentCosts and benefits of ratifying the Minamata Convention on Mercury
5

Further details of the scenarios applied in the analysis are provided in Appendix A.
Cost benefit analysis
The cost benefit analysis seeks to determine the incremental impact of the ratification scenario compared to the base case (non-ratification) scenario considering likely cost impacts on business, government, and the wider community and benefits to human health and the environment.
To do this, costs and benefits were identified under each scenario and the net present value of the alternative scenario was then assessed relative to the base case.
The analysis was undertaken over a 20 year period (2016 to 2035) as it has been determined that the majority of costs will be up-front, while the benefits stream will continue to increase over time. Costs and benefits beyond the 20 year period are uncertain and as such, we assume any material differences between the base case and phase-down scenarios would be negligible beyond this point.
The cost benefit analysis result was tested through sensitivity analyses of alternative discount rates and key cost and benefit variables.
Regulatory Burden Measurement
The regulatory burden of the phase-down scenario relative to the base case was quantified in a manner consistent with Government guidance on Regulatory Burden Measurement (RBM)15.
The RBM focuses only on private sector costs and those of Government Owned Corporations.
Values in the RBM are provided as a simple average of costs to industry over the first 10 year period and are disaggregated by cost types (administrative, substantive and delay costs).
A detailed description of the cost benefit analysis and regulatory burden frameworks applied in this report are included in Appendix C.
Costs and benefits
Marsden Jacob classified costs and benefits under the groupings set out in Table 3.
It is important to note that while mercury is a global pollutant, the cost-benefit analysis only considers the impact of Australia’s mercury emissions on the Australian population and environment.
To inform the development of this report, Marsden Jacob conducted brief interviews and questionnaires with a range of industry stakeholders. Details of the contacts made through this process are provided in an appendix to this report (Appendix D).
15 Department of Prime minister and Cabinet, Regulatory Burden Measurement Framework, Guidance Note February 2015, www.dpmc.gov.au/office-best-practice-regulation/publication/regulatory-burden-measurement-framework-guidance-note
Department of the EnvironmentCosts and benefits of ratifying the Minamata Convention on Mercury
6

Table 3: Summary of costs and benefits
StakeholderScenario 1Base Case (non-ratification)
Ratification prior to mid-2016
Scenario 2AMinimum Requirement to ratify
Scenario 2BInterception / removal of amalgam waste from dental practices
Scenario 2CEarly phase-out of mercury-containing pesticides (2017) and removal of waste amalgam from dental practices
Costs
Government As per current costs
Costs associated with meeting ratification: Development of guidelines Financial resources required and mechanisms Regulation, compliance costsChanges to ongoing regulation, compliance costs.
Similar to 2A Similar to 2A
IndustryAs per current costs but with potential for trade-related measures
Costs associated with meeting ratification: Increased costs to implement Phase-out by 2020
of mercury-added products Costs for new and existing point sources (e.g.
gold production and coal fired power)Changes to ongoing costs (and revenues) as a result of ratification.
Similar to 2AIncreased costs for installation and operation of mercury traps and separators
Similar to 2AIncreased costs for early phase out of mercury-containing pesticides.Increased costs for installation and operation of mercury traps and separators.
Benefits/avoided costs
Health outcomes
Health outcomes consistent with current trends/ experience but with some improvement due to other Countries’ decision to ratify
Potential for improved health outcomes within Australia as a direct result of changes made by Australia.
Benefits from increased removal of mercury from Sewerage system
Benefits from early phase out of mercury-containing pesticides.Benefits from increased removal of mercury from Sewerage system.
Environmental outcomes
Environmental outcomes consistent with current trends./ experience but with some improvement due to other Countries’ decision to ratify
Potential for improved environmental outcomes within Australia as a direct result of changes made by Australia.
Benefits from increased removal of mercury from Sewerage system
Benefits from early phase out of mercury-containing pesticides.Benefits from increased removal of mercury from Sewerage system.
Department of the EnvironmentCosts and benefits of ratifying the Minamata Convention on Mercury
7
Department of the EnvironmentCosts and benefits of ratifying the Minamata Convention on Mercury
8

2. Cost benefit analysis 2.1 Cost benefit analysis overviewResults of the cost benefit analysis are summarised in Table 4 and Figure 4.
The results include two main metrics:
Net Present Value (NPV), which is the Present Value (PV) of benefits delivered by the policy less the PV of costs incurred. It measures the expected benefit (or cost) to society of implementing each scenario.
Benefit Cost Ratio (BCR), which is the ratio of the PV of benefits to PV of costs.
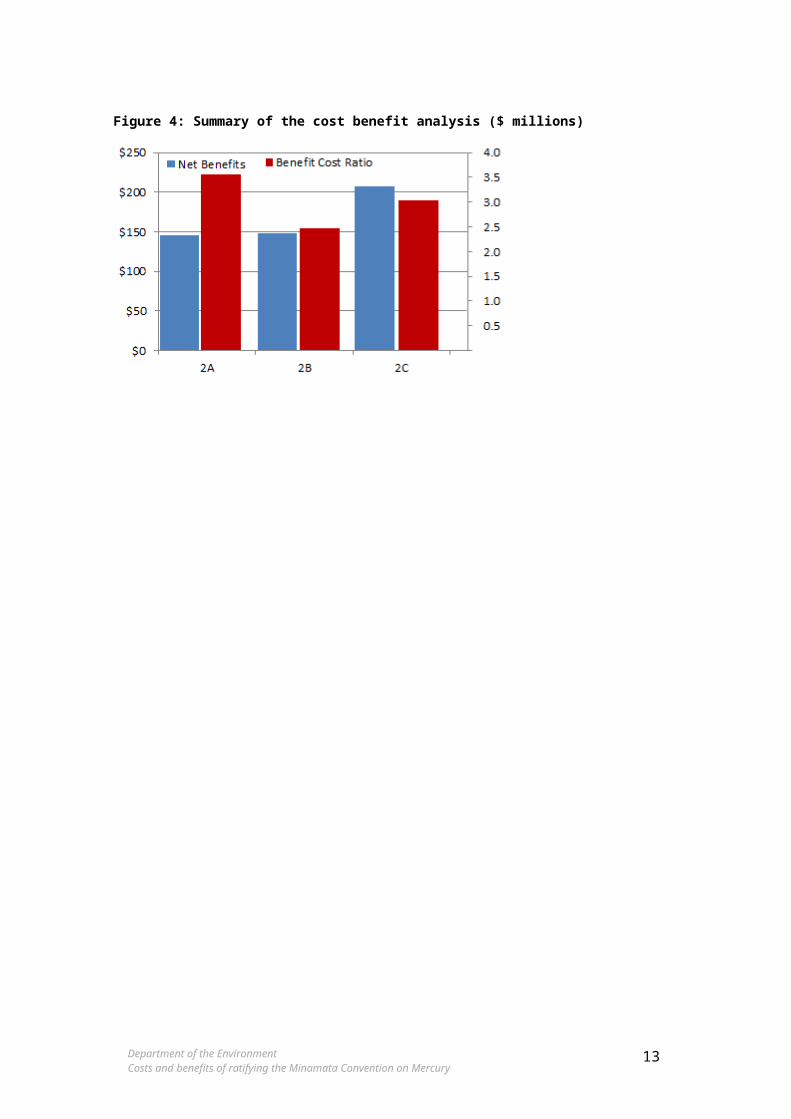
For each of the scenarios (2A, 2B and 2C) ‘most likely’ case NPV and BCR estimates are provided16 in Table 4 and in Figure 4. The NPV values for scenarios 2A, 2B and 2C are estimated to be $145.4 million, $148.6 million and $207.0 million respectively 17. Option 2C has the greatest NPV and is therefore expected to deliver the greatest benefit to the community. However, Option 2A has the highest BCR.
This outcome reflects likely greater benefits for similar costs compared to Option 2A and Option 2B. The key drivers of this outcome, in particular the early phase out of mercury-containing pesticides under Option 2C - leading to substantial health and environmental benefits at relatively low cost - are discussed further in section 6.
Figure 4: Summary of the cost benefit analysis ($ millions)
16 Note that best case and worst case figures are provided in Appendix A.17 All values in the cost benefit are provided in 2015 Australian dollar values and are calculated in real terms. These
“Most likely” values are calculated using a 7% real discount rate.Department of the EnvironmentCosts and benefits of ratifying the Minamata Convention on Mercury
9
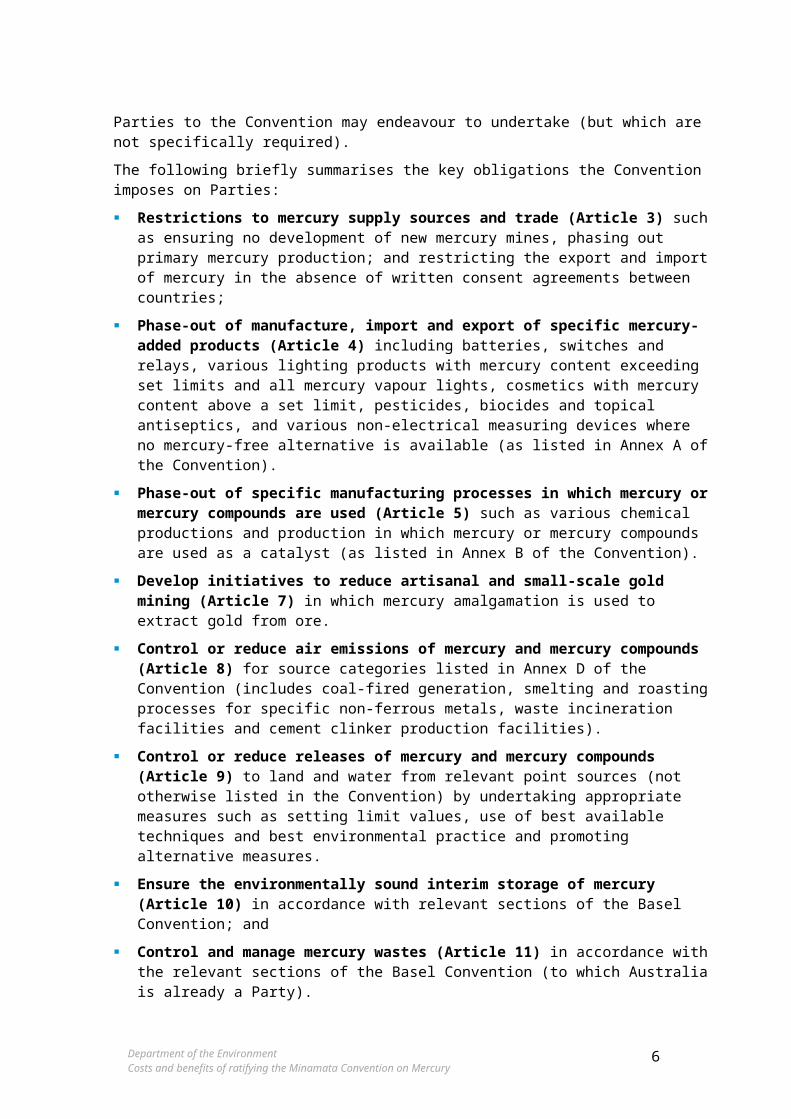
Table 4: Cost benefit analysis results for scenarios 2A, 2B and 2C (Note values are provided in millions)
Minimum Requirements
Ratification+ Amalgam
Separators
Ratification+ Early phase out
of mercury-containing pesticides+ Amalgam
separatorsScenario 2A
(Ratification) Scenario 2B Scenario 2C
Stakeholder
Costs $ (millions)
Government
Article 13 – Financial contributions
$1.3 $1.3 $1.3
Dept of the Environment $2.6 $2.6 $2.6Other $0.0 $0.0 $0.0
Industry
Article 8- Air Emissions $0.0 $0.0 $0.0Cane Growers $0.5 $0.5 $0.9Dental $0.0 $44.3 $44.3Public Lighting $52.6 $52.6 $52.6Oil & Gas $0.0 $0.0 $0.0
Benefits/avoided costs $ (millions)
Health outcomes
Reduction in Mercury emissions and releases
$166.7 $214.3 $273.1
Reduced Health & Safety Costs
$1.5 $1.5 $1.5
Environmental outcomes
Carbon Savings (public lighting)
$3.2 $3.2 $3.2
Energy Savings (public lighting)
$30.9 $30.9 $30.9
Environmental benefits Not Quantified Not Quantified Not Quantified
Totals
Total Cost $57.0 $101.2 $101.7Total Benefit $202.3 $249.9 $308.7Net Benefits $145.4 $148.6 $207.0Benefit Cost Ratio 3.6 2.5 3.0
Department of the EnvironmentCosts and benefits of ratifying the Minamata Convention on Mercury
10

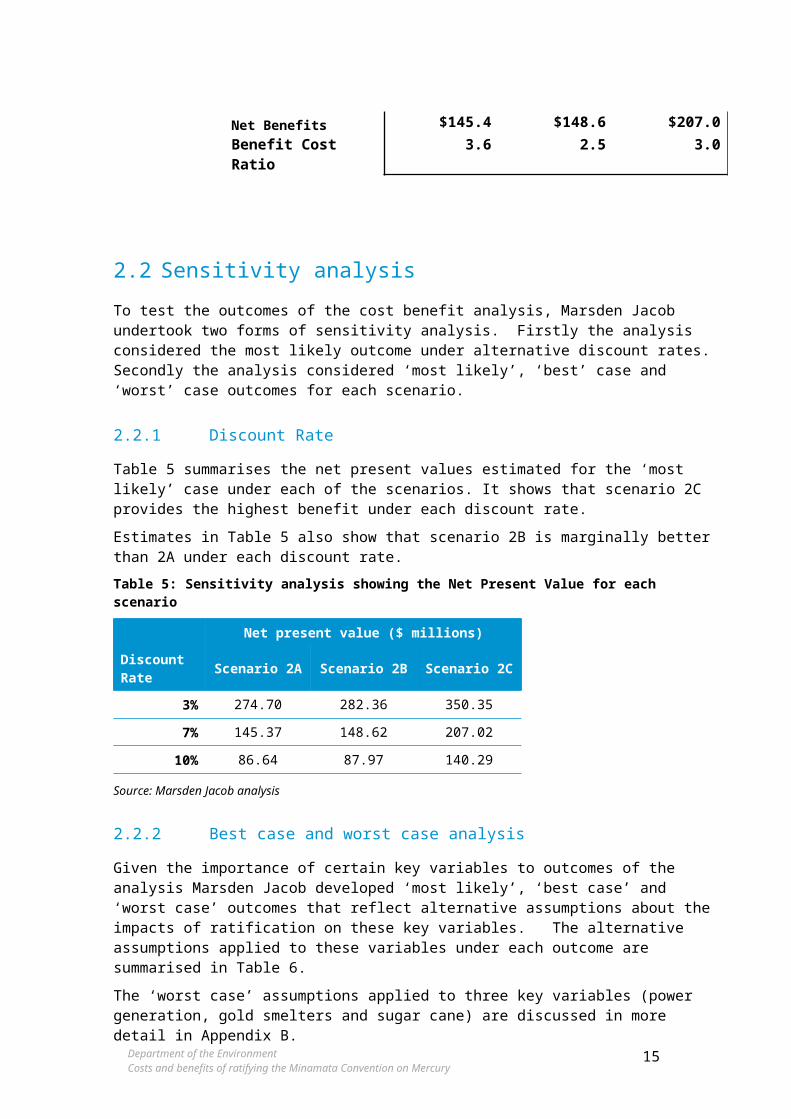
2.2 Sensitivity analysisTo test the outcomes of the cost benefit analysis, Marsden Jacob undertook two forms of sensitivity analysis. Firstly the analysis considered the most likely outcome under alternative discount rates. Secondly the analysis considered ‘most likely’, ‘best’ case and ‘worst’ case outcomes for each scenario.
2.2.1 Discount RateTable 5 summarises the net present values estimated for the ‘most likely’ case under each of the scenarios. It shows that scenario 2C provides the highest benefit under each discount rate.
Estimates in Table 5 also show that scenario 2B is marginally better than 2A under each discount rate.
Table 5: Sensitivity analysis showing the Net Present Value for each scenario
Net present value ($ millions)
Discount Rate Scenario 2A Scenario 2B Scenario 2C
3% 274.70 282.36 350.35
7% 145.37 148.62 207.02
10% 86.64 87.97 140.29
Source: Marsden Jacob analysis
2.2.2 Best case and worst case analysisGiven the importance of certain key variables to outcomes of the analysis Marsden Jacob developed ‘most likely’, ‘best case’ and ‘worst case’ outcomes that reflect alternative assumptions about the impacts of ratification on these key variables. The alternative assumptions applied to these variables under each outcome are summarised in Table 6.
The ‘worst case’ assumptions applied to three key variables (power generation, gold smelters and sugar cane) are discussed in more detail in Appendix B.
Department of the EnvironmentCosts and benefits of ratifying the Minamata Convention on Mercury
11

Table 6: Assumptions applied to key variables in most likely, best and worst case outcomes
Variable Most likely case Worst case Best case
Power generation
No new power facilities or no additional requirements
(no cost & no mercury saved)
2 new power facilities with additional requirements
(additional cost and additional mercury
saved)
No new power facilities or no additional requirements
(no cost & no mercury saved)
Gold smelters
No new facilities or no additional requirements
(no cost & no mercury saved)
2 new facilities with additional requirements
(additional cost and additional mercury
saved)
No new facilities or no additional requirements
(no cost & no mercury saved)
Sugar cane pesticide on germination rates
No impact on sugar cane germination
Annual impact on sugar cane germination
No impact on sugar cane germination
Public lighting – asset replacement
Average light replacement costs $400
Average light replacement costs $550
Average light replacement costs $200
Greenhouse gas savings from public lighting
Value of tonne of CO2e = $13.95
Value of tonne of CO2e = $9.50
Value of tonne of CO2e = $30.00
Health and safety benefits
30% reduction in workplace incidents
10% reduction in workplace incidents
60% reduction in workplace incidents
Health benefits of a reduction in mercury
Health damage per kg of Mercury = $4,862
Health damage per kg of Mercury = $1,828
Health damage per kg of Mercury = $6,024
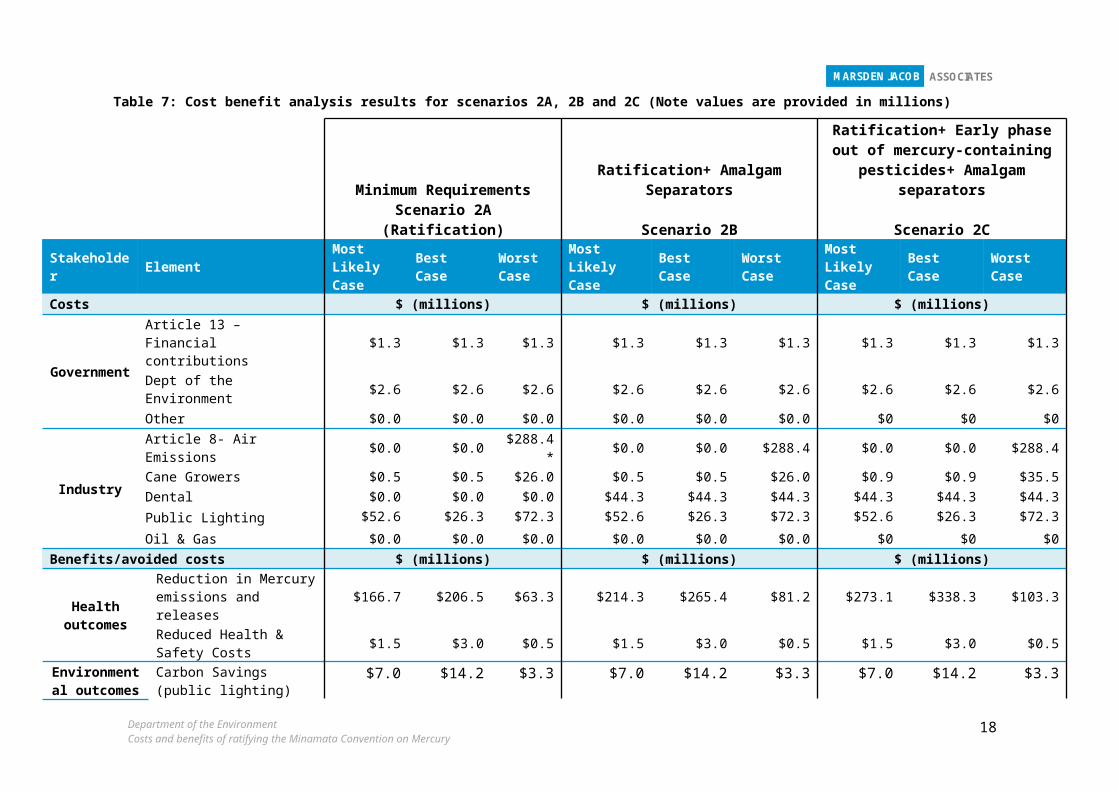
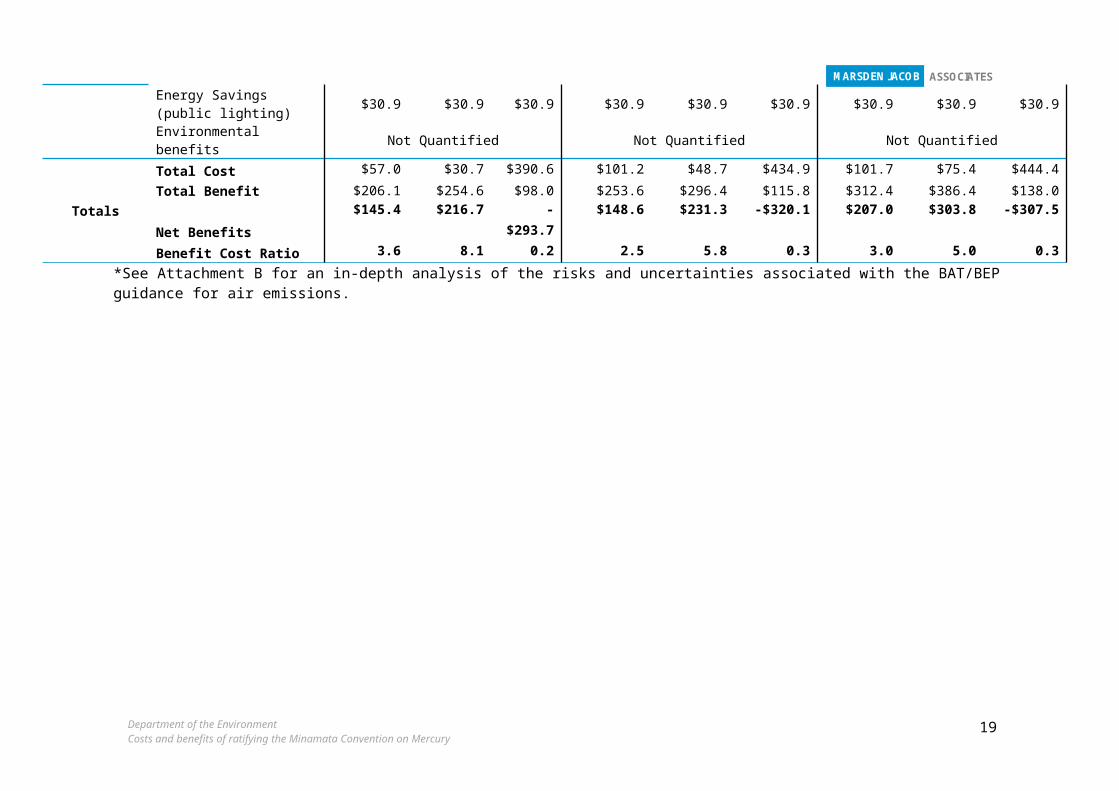
For each of the scenarios (2A, 2B and 2C) ‘most likely’ case, ‘best case’ and ‘worst case’ net present value and BCR estimates are provided in Table 7.
It can be seen that Scenario 2C has the highest NPV under both the ‘most likely’ case and ‘best case’ outcomes but Scenario 2A has the highest (smallest loss) NPV under the ‘worst case’ outcome and the highest (or equal highest) BCR under all outcomes.
Department of the EnvironmentCosts and benefits of ratifying the Minamata Convention on Mercury
12
MARSDEN JACOB ASSOCIATES
Table 7: Cost benefit analysis results for scenarios 2A, 2B and 2C (Note values are provided in millions)
Minimum Requirements Ratification+ Amalgam Separators
Ratification+ Early phase out of mercury-containing pesticides+
Amalgam separatorsScenario 2A (Ratification) Scenario 2B Scenario 2C
Stakeholder Element Most Likely Case Best Case Worst
CaseMost Likely Case Best Case Worst Case Most Likely
Case Best Case Worst Case
Costs $ (millions) $ (millions) $ (millions)
Government
Article 13 – Financial contributions $1.3 $1.3 $1.3 $1.3 $1.3 $1.3 $1.3 $1.3 $1.3
Dept of the Environment $2.6 $2.6 $2.6 $2.6 $2.6 $2.6 $2.6 $2.6 $2.6Other $0.0 $0.0 $0.0 $0.0 $0.0 $0.0 $0 $0 $0
Industry
Article 8- Air Emissions $0.0 $0.0 $288.4* $0.0 $0.0 $288.4 $0.0 $0.0 $288.4Cane Growers $0.5 $0.5 $26.0 $0.5 $0.5 $26.0 $0.9 $0.9 $35.5Dental $0.0 $0.0 $0.0 $44.3 $44.3 $44.3 $44.3 $44.3 $44.3Public Lighting $52.6 $26.3 $72.3 $52.6 $26.3 $72.3 $52.6 $26.3 $72.3
Oil & Gas $0.0 $0.0 $0.0 $0.0 $0.0 $0.0 $0 $0 $0Benefits/avoided costs $ (millions) $ (millions) $ (millions)
Health outcomes
Reduction in Mercury emissions and releases $166.7 $206.5 $63.3 $214.3 $265.4 $81.2 $273.1 $338.3 $103.3
Reduced Health & Safety Costs $1.5 $3.0 $0.5 $1.5 $3.0 $0.5 $1.5 $3.0 $0.5
Environmental outcomes
Carbon Savings (public lighting) $7.0 $14.2 $3.3 $7.0 $14.2 $3.3 $7.0 $14.2 $3.3
Energy Savings (public lighting) $30.9 $30.9 $30.9 $30.9 $30.9 $30.9 $30.9 $30.9 $30.9
Environmental benefits Not Quantified Not Quantified Not Quantified
Totals
Total Cost $57.0 $30.7 $390.6 $101.2 $48.7 $434.9 $101.7 $75.4 $444.4
Total Benefit $206.1 $254.6 $98.0 $253.6 $296.4 $115.8 $312.4 $386.4 $138.0
Net Benefits $145.4 $216.7 -$293.7 $148.6 $231.3 -$320.1 $207.0 $303.8 -$307.5
Benefit Cost Ratio 3.6 8.1 0.2 2.5 5.8 0.3 3.0 5.0 0.3
*See Attachment B for an in-depth analysis of the risks and uncertainties associated with the BAT/BEP guidance for air emissions.
Department of the EnvironmentCosts and benefits of ratifying the Minamata Convention on Mercury
13

MARSDEN JACOB ASSOCIATES
2.2.3 Cost benefit analysis driversIt is important to note the differing costs of mercury reduction - even under a ‘worst case’ outcome - relevant to the likely reduction in mercury output.
Ceasing the manufacture (and import and export) of mercury-containing pesticides under Article 4 is expected to prevent approximately 5,280 kilograms of mercury entering the Australian environment per annum after 2020 at an annual cost of $3,937,500 (under the ‘worst case’ outcome). This equates to $746 per kilogram of mercury per annum.
In contrast improving mercury capture at coal fired power stations (under the ‘worst case’ outcome) is expected to save around 14.5 kilograms of mercury per power station per annum at a cost of $224 million in capital and $2.40 million in operating costs. As new power stations are not expected to be developed until late in the cost benefit period this equates to $3.26 million per kilogram of mercury per annum.
2.3 Likely impact on consumersIn considering the costs of a phase-down in mercury it is useful to consider whether costs imposed on business and government through requirements to reduce mercury usage and/or emissions are likely to be passed on to consumers. The extent to which costs are able to be passed on and therefore the likely impact to consumers will vary depending on the industry structure and the form of cost imposed.
To consider the impact on consumers it is necessary to first dissect the form of costs that arise for business and government.
2.3.1 Forms of costs for business and governmentThe costs imposed on industry and government identified in the cost benefit analysis include some costs which would directly impact a company’s “bottom line” and other costs which represent an “opportunity cost”.
Bottom line costs
Additional requirements imposed through the phase-down in Mercury will impact on a company’s total costs of operation under the following circumstances:
staff costs are increased by either requiring additional staff or paying existing staff more for either longer hours or more responsibility; or
capital or operating costs increase as a result of additional compliance requirements.
Costs of this kind will impact on a company’s total costs of operation and may be passed on to consumers.
Opportunity costs
Some costs such as the reallocation of staff and management time can be considered an opportunity cost as staff and management costs may not increase (where staff and management are not paid by the hour). This is particularly likely where the additional costs are not substantial. In this case the imposition of a new requirement may prevent the staff from undertaking other roles - such as business development. Alternatively the additional tasks may impact on staff and management’s personal time.
Department of the EnvironmentCosts and benefits of ratifying the Minamata Convention on Mercury
14

MARSDEN JACOB ASSOCIATES
Costs of this kind do not impact directly on a company’s total costs of operation and so are not likely to be passed on to consumers.
2.3.2 Ability of industry to pass on costs to consumersWhere a company’s total cost of operations are increased they may seek to pass on these additional costs to consumers.18 However, the ability of a company to pass on higher costs to consumers will vary from one product to another19 and is beyond the scope of this cost benefit analysis.
It is likely some costs will be passed on to consumers, however, this will not be uniform across the industries considered in this analysis.
18 It is noted that industry did not indicate whether any individual costs would be passed on to consumers.19 Factors influencing a company’s ability to pass on higher costs to consumers will include: levels of buyer power and supplier power; availability of substitutes; threat of entry; and existing levels of competition in the market for that product.
Department of the EnvironmentCosts and benefits of ratifying the Minamata Convention on Mercury
15
MARSDEN JACOB ASSOCIATES
3. Regulatory burden analysis Regulatory burden measurement (RBM) was undertaken in line with guidance20 and focuses only on private sector costs and those of Government Owned Corporations.
The RBM values are provided as a simple average of costs to industry over the first 10 year period (2016 to 2025) using 2015 values and have been disaggregated by cost types:
administrative compliance costs - costs that are primarily driven by the need to demonstrate compliance with the Convention such as annual reporting.
substantive compliance costs –which are directly attributable to ratification and which fall outside of the usual business costs these costs may include the capital costs of plant upgrades as well as operational costs from process changes or additional staff training.
delay costs - include the time taken for the preparation of applications (referred to as application delay) and the time taken for approval (referred to as approval delay). Estimating the cost savings relating to removing delays requires a strong understanding of the realistically achievable timeframes, the likely delays which could be avoided, and the value (potential cost) of any avoidable delay.
The regulatory burden analysis aligns with the ’most likely’ outcome analysis of industry impacts and so does not include costs that are only identified under the ‘best’ or ‘worst’ case outcomes.
3.1 Regulatory burden costs by industryThe regulatory burden costs for each of the industries impacted are discussed in turn below.
3.1.1 Industries with potential air emissionsFor industries with potential air emissions the costs identified in the initial 10 year period are costs associated with contributing to preparation of the national plan – however as it is not compulsory for Australia to prepare a National plan, nor is it compulsory for industry to contribute to the plan these costs are not considered regulatory burden.21 No other costs were identified through discussions with industry and government as the Convention was determined to have negligible impact on existing facilities, and no new facilities are expected to be developed in the initial 10 year period.
The average regulatory burden for industries with potential air emissions under each scenario (2A, 2B and 2C) over the period from 2016 to 2025 is $0 per annum.
3.1.2 Sugarcane GrowersAs detailed in the cost benefit analysis, the phase out of mercury-containing pesticides would impact on a number of stakeholder groups – namely sugarcane growers (who use a mercury-containing
20 Department of Prime Minister and Cabinet (2015) Regulatory Burden Measurement Framework, Guidance Note February 2015, www.dpmc.gov.au/office-best-practice-regulation/publication/regulatory-burden-measurement-framework-guidance-note
21 According to the Convention, a Party with relevant sources shall take measures to control emissions and releases, and may prepare a national plan setting out the measures to be taken to control emissions and releases, and its expected targets, goals and outcomes. Any plan shall be submitted to the Conference of the Parties within four years of the date of entry into force of the Convention for that Party.
Department of the EnvironmentCosts and benefits of ratifying the Minamata Convention on Mercury
16
MARSDEN JACOB ASSOCIATES
pesticide), Crop Care (who distribute the mercury-containing pesticide), and Alpha Chemicals (who manufacture the mercury-containing pesticide).
A range of potential costs were considered and discussed with the industry peak body.
A range of potential substantive compliance costs were considered – but no costs were identified through discussions with industry stakeholders and government for Scenario 2A. Costs considered included:
capital cost on changing machinery to add sprayers;
cost difference of alternative products; and
effectiveness of alternative products;
A potential offset benefit was identified, as the alternative product also provides protection against other fungi and diseases. Industry advised that the removal of mercury-containing pesticides from the market would impact on changes in emergence and budding in adverse conditions, however, published research has found that alternative pesticides (that do not contain mercury) have a greater benefit to emergence and budding in adverse conditions (see section 5.2).
The full discussion of the costs and benefits of each scenario is set out in section 5.2.
Scenario 2A and 2B
The regulatory burden for sugarcane growers under scenario 2A is $0 per annum.
The average regulatory burden for sugarcane growers under scenario 2A and 2B over the period from 2016 to 2025 is $0 per annum.
Scenario 2C
Under scenario 2C mercury-containing pesticides are phased out early (2017). This brings forward the phase out period to the point where the alternative product (flutriafol) may still be a proprietary product and so may cost more than the existing mercury-containing product. The increased costs would only arise for one year and are estimated at $84,00022.
The average regulatory burden for sugarcane growers under scenario 2C over the period from 2016 to 2025 is $8,400 per annum.
3.1.3 DentalIn assessing the regulatory burden for dental industries Marsden Jacob considered the impact of ratification on both manufacturers of amalgam and dental surgeries.
No regulatory burden impacts were identified through discussions with industry and government under Scenario 2A on either manufacturers of amalgam or dental surgeries.
Marsden Jacob considered whether there would be additional administrative costs for mercury imports – however, these appear unchanged from the base case. The full discussion of the costs and benefits of each scenario is set out in section 5.3.
Scenario 2A
No regulatory burden costs were identified for dental industries under Scenario 2A.
22 Research indicates that Shirtan cost $27.50/ha and Sinker costs $29.00/ha across 56,000 hectares of cane plantingDepartment of the EnvironmentCosts and benefits of ratifying the Minamata Convention on Mercury
17

MARSDEN JACOB ASSOCIATES
Scenario 2B
Scenario 2B would drive substantive compliance costs for dentists as 9,801 dentists would be required to install and maintain amalgam separators at an installation cost of $900 and an annual waste collection and recycling cost of $500.
Based on installations commencing in 2017 and being phased over a 4 year period the Regulatory burden would be an average of $4,068,000 per annum over the first 10 years (2016 to 2025).
Scenario 2C
As per Scenario 2B, the Regulatory burden would be an average of $4,068,000 per annum over the first 10 years (2016 to 2025).
3.1.4 LightingLighting is impacted under Article 4, mercury-added products, and is considered in terms of domestic and commercial lighting as well as public lighting. The full discussion of the costs and benefits of each scenario is set out in section 3.1.4.
Domestic and commercial lighting
No regulatory burden costs were identified though discussions with industry stakeholders and government for domestic and commercial lighting.
Public lighting
The ownership, responsibilities and governance structures surrounding street lighting assets are complex and vary depending on the type of installation and maintenance arrangements. However, the ownership can be largely separated in terms of the Australian Standards classifications for Category P (residential streets and public open spaces) and Category V (main or major road) lighting.
Mercury vapour street lighting on minor, residential roads in Australia tends to be managed by electricity distribution networks on behalf of local councils on the basis that the lamps are attached to the electricity network power poles. In most circumstances, the maintenance of these lights by the network businesses requires these assets to be ‘gifted’ to the distribution business.
Distribution businesses are only responsible for a very small proportion of main road lighting. Government departments, such as main roads departments, who tend to be responsible for both the management and the costs associated with main road lighting.
Under ratification of the Convention, Marsden Jacob analysis outlined in section 3.1.4 details that only lower wattage street lighting on residential roads (50W, 80W, and 125W) will be phased out more quickly than the current trends would predict. Higher wattage lighting on main roads (250W, 400W, and 700W lamps) would be unaffected by ratification.
For the RBM the Department advised that a different assumption on phase out should be used compared to the cost benefit analysis. For RBM that the phase out of mercury vapour lamps should be modelled so that the numbers of lamps follow the base case up to the year 2020 and then step down rapidly in one year (thereafter following the ratification scenario used in the cost benefit analysis). This is depicted by the red line in Figure 5.
Department of the EnvironmentCosts and benefits of ratifying the Minamata Convention on Mercury
18
MARSDEN JACOB ASSOCIATES
Figure 5: Modelled phase out of mercury vapour lamps for RBM
For street lighting Marsden Jacob modelled that ratification would bring forward capital replacement programs, which can be classified as a substantive compliance cost. It should be noted that the “step down” (following the based case to 2020, then stepping down to the ratification scenario from 2021 onwards) in mercury vapour lamps in 2020 makes no change to the RBM compared to the ratification scenario used in the cost benefit analysis. This is because the total cost is the same and still occurs in the period for RBM (10 years).
The average cost over the first 10 years of this compliance cost is $12.59 million. This cost is offset by both energy savings and greenhouse gas savings. This saving is realised by the users (i.e. local councils) who pay the energy costs and therefore is not an offset on the regulatory burden for distribution businesses.
3.1.5 Waste and recyclingNo regulatory burden costs were identified through discussions with industry and government for the waste and recycling sector. The full discussion of the costs and benefits of each scenario is set out in section 3.1.5.
3.1.6 Oil and GasNo regulatory burden was identified for the oil and gas industry within the duration of the regulatory burden assessment.
Department of the EnvironmentCosts and benefits of ratifying the Minamata Convention on Mercury
19

MARSDEN JACOB ASSOCIATES
3.2 Regulatory burden summary and conclusionsRegulatory burden summary for each scenario are summarised in the tables provided
Scenarios 2A, 2B and 2C Average Annual Regulatory Costs to Business
Average annual regulatory costs (compared to business as usual)
Change in costs Scenario 2AMinimum Requirements
Scenario 2B Ratification+ Amalgam Separators
Scenario 2C Ratification+ Early removal of Shirtan+ Amalgam Separators
Coal-fired Generation $0 $0 $0
Aluminium $0 $0 $0Cement $0 $0 $0Non Ferrous Metal Smelting (Gold, Lead, Zinc, Copper)
$0 $0 $0
Waste Incineration $0 $0 $0
Sugar Cane Growers $0 $0 $8,400
Oil and Gas $0 $0 $0Dental $0 $4,067,540 $4,067,540Public Lighting $12,589,794 $12,589,794 $12,589,794 Total $12,589,794 $16,657,334 $16,665,734
Department of the EnvironmentCosts and benefits of ratifying the Minamata Convention on Mercury
20

MARSDEN JACOB ASSOCIATES
4. Government costsCommonwealth, State and Territory Governments all have a role in Australia’s regulation of mercury. The international trade in mercury and mercury-added products is primarily controlled by the Commonwealth, while mercury emissions from point sources and the manufacture of mercury-added products are primarily regulated through licence arrangements implemented at a State and Territory level basis.
Marsden Jacob’s investigation has focused primarily on Commonwealth Government impacts. As is discussed below, this is because we were advised a number of the requirements of the Convention are already being met via national agreements.
4.1 Impacted agenciesCommonwealth
The following Commonwealth agencies have been identified as needing to take action to ensure Australia meets obligations under the Convention:
Department of the Environment – the Department would be responsible for ratification and ensuring that plans and guidelines are developed and meet requirements;
Department of Health – in relation to education and information for people working with mercury, research and possible deregistration of products;
Australian Pesticides and Veterinary Medicines Authority – in relation to the registration of pesticides;
Australian Customs and Border Protection Service – changes to monitoring, and possible compliance and enforcement around trade in mercury and mercury-added products; and
Department of Industry and Science – ensuring that any contributions to mercury research are shared or communicated consistent with the Convention expectations; and
Department of Defence– impacts of mercury restrictions on its activities given the Convention’s exclusion of military related uses in a number of Articles.
State/Territory based agencies
Beyond the potential impact on state utilities, which is considered in the industry costs section23, no cost impacts on State or Territory governments were identified.24
23 We note that local Governments and some State Government will be directly impacted in relation to street lighting and coal fired power generation. As these impacts are related to government agents performing functions in a manner akin to industry participants rather than acting in regulatory capacity these impacts are considered in the relevant subsections of the Industry Costs section of this report.
24 This position was supported through informal discussions with one State.Department of the EnvironmentCosts and benefits of ratifying the Minamata Convention on Mercury
21
MARSDEN JACOB ASSOCIATES
4.2 CostsThere are several types of government costs which would occur under the phase-down scenarios which would not arise in the base case scenario. These costs are categorised as “setup costs”25 and “ongoing costs”:
Set up costs – the costs of transitioning to the new requirements in capital costs, staff time, management time and consultant fees per annum during the changeover period.
These include: costs to negotiate ratification; and cost to ensure regulation and guidelines meet obligations under the Convention which may involve either amending existing documents and/or developing new regulations and guidelines. “One off” implementation costs that arise at or near the start of the convention are also included in this classification of costs.
ongoing costs in staff time, management time and consultant fees per annum.
These include changes to compliance monitoring and regulatory regimes e.g. due to change export/ import restrictions, or need to demonstrate compliance of national plans etc.
To quantify the cost impacts associated with ratification, Marsden Jacob was informed by discussion undertaken between the Department and other government entities as well as information gathered as part of those discussed.
In addition, Marsden Jacob undertook discussions with a number of government departments and statutory bodies. The entities consulted in forming this report are listed in Appendix C.
Impacts for each of type of government costs (setup costs and ongoing costs) are outlined in turn with reference to these discussions and research undertaken as part of the project.
The Department of the Environment indicates that an ongoing allocation of two full time employees (equating to around $250,000 per annum) is expected to cover setup costs such as ratification, as well as ongoing costs such as the administration and reporting of the Convention. The main components of setup and ongoing costs are discussed in more detail below.
4.2.1 Setup costsSetup costs will be incurred primarily by the Department of the Environment with some inputs required from other government agencies.
Four main setup activities have been identified:
ratification of the Convention;
developing, in conjunction with Australian Customs and Border Protection Service, a general notification process for mercury imports;
reporting on point sources; and,
deregistration costs for mercury-added products.
Each of these activities are described in turn.
Ratification of the Convention
Should Australia decide to ratify the Minamata Convention, the Department of the Environment will be the agency responsible for meeting Australia’s obligations within the Convention.
25 Also known as “changeover costs”Department of the EnvironmentCosts and benefits of ratifying the Minamata Convention on Mercury
22
MARSDEN JACOB ASSOCIATES
Funds from the Department’s existing budget could be allocated towards:
attendance at the Conferences of the Parties; and,
arranging and agreeing any necessary consents with trading parties (as applicable).
General notification to the Secretariat
The Department indicates that under Article 3, it is proposed that Australia would develop a general notification to set out any terms and conditions under which Australia provides its consent as an importer of mercury.
Reporting on point sources
The National Pollutant Inventory, as Australia’s national pollutant release and transfer register, satisfies the obligation within the Minamata Convention that requires Parties to collect and disseminate information on annual quantities of mercury and mercury compounds that are emitted, released and disposed of through human activities.
Development of guidance
If Australia ratifies the Convention, a key set up cost will be negotiation of guidance for best available techniques and best environmental practices applicable under Article 8. This process will require input from Australian State and Territory governments, industry, and the community, and negotiation with other countries at the Intergovernmental Negotiating Committee and with Parties in advance of, and at the first Conference of the Parties.
The Department of the Environment will coordinate consultation on the guidance and have indicated that they will incorporate this within the planned Departmental budget.
Deregistration costs of mercury added products
Under Article 4 and Annex A of the Convention the manufacture, import and export of specific mercury added products is phased-out. The domestic deregistration of listed products appears to be an effective method to ensure that specified products are no longer manufactured or imported for sale in Australia. Examples of products where deregistration could occur are mercury containing topical antiseptics (registered by the Therapeutic Goods Administration) as well as pesticides and biocides (registered by the Australian Pesticides and Veterinary Medicines Authority).26
As consultation on ending the use of the products has commenced, (as part of the consultation on the Convention) it appears that the costs of product deregistration to government would be minimal.
Mercury containing topical antiseptics
By 2020, the manufacture, import and export of mercury topical antiseptics (mercurochrome 1% and mercurochrome 2%) will be restricted in accordance with Part 1 of Annex A under the phase-down scenarios.
Topical antiseptics, as with other therapeutic goods, must be entered in the Australian Register of Therapeutic Goods (ARTG) before they can be lawfully supplied in or exported from Australia - unless otherwise authorised by the Therapeutic Goods Administration (TGA).
26
Department of the EnvironmentCosts and benefits of ratifying the Minamata Convention on Mercury
23
MARSDEN JACOB ASSOCIATES
The TGA provided correspondence to the effect that phase out of these products would have minimal impact:
In Australia there are two topical antiseptics containing mercury that are registered on the Australian Register of Therapeutic Goods (ARTG) (Mercurochrome 1% and Mercurochrome 2%). To our knowledge these products are not being sold commercially in Australia. Therefore the impact of a phase out will be minimal.27
Non-electronic measuring devices
By 2020, the manufacture, import and export of mercury containing non-electronic measuring devices listed in Part 1 of Annex A would be restricted under the phase-down scenarios.
This list of non-electronic measuring devices includes mercury containing thermometers and sphygmomanometers (blood pressure meters). Both medical thermometers and all blood pressure meters are listed on the ARTG which is administered by the TGA on behalf of the Commonwealth Department of Health.
Therapeutic goods must be entered in the ARTG before they can be lawfully supplied in or exported from Australia (unless otherwise authorised by the TGA). Hence, removal of these items from the ARTG by 2020 would ensure Australia is compliant with these obligations within the Convention.
The TGA has indicated that the proposed phase out of measuring devices listed in Part 1 of Annex A would not impose any additional costs:
The Therapeutic Goods Administration has no objections to accepting the proposed phase out of measuring devices listed in Part 1 of Annex A of the Minamata Convention. Thermometers and sphygmomanometers containing mercury are being replaced by digital products reflective of medical technological advances.28
Pesticides and biocides
The manufacture, import or export of pesticides and biocides are also listed under Part 1 of Annex A of the Convention as being phased-out by 2020 under the phase-down scenarios. In Australia, the only mercury-containing pesticide which would be impacted by this obligation of the Convention is registered under the trading name of Shirtan®.
Before agricultural and veterinary chemicals, such as Shirtan, can be sold in Australia they must first be registered with the Australian Pesticides and Veterinary Medicines Authority (APVMA). The APVMA is a statutory body established in 1993 with responsibilities outlined in the Agricultural and Veterinary Chemicals (Administration) Act 1992 and the Agricultural and Veterinary Chemicals Code Act 1994. The APVMA resides within the Agriculture portfolio.
From an administrative perspective, deregistration of Shirtan® by the APVMA would involve minimal costs to government.
4.2.2 Ongoing costsDiscussions with relevant government stakeholders have revealed the majority of ongoing requirements stipulated in the Convention are minimal and impose negligible costs. In many instances, this is due to Australia’s existing standards – such as reporting of mercury emissions and transfers in the National Pollutant Inventory.
27 Correspondence from the Department of Health on the impact of the Minamata Convention on mercury dated 5 March 2015.
28 Correspondence from the Department of Health on the impact of the Minamata Convention on mercury dated 5 March 2015.
Department of the EnvironmentCosts and benefits of ratifying the Minamata Convention on Mercury
24
MARSDEN JACOB ASSOCIATES
Outside of the Department of the Environment, the only potential ongoing cost imposed on government identified was on Australian Customs and Border Protection Service (ACBPS).
Customs and Border Protection
The ACBPS manages the security and integrity of Australia’s borders.
Should Australia ratify the Convention, trade in prohibited and restricted mercury and mercury added-products would be monitored and controlled by the ACBPS.
In forming lists of prohibited and restricted imports, the ACBPS refers directly to relevant government department managed lists and international Conventions as applicable29.
Antibiotics – permits issues by the Minister for Health and requests to import processed by the Therapeutic Goods Administration. Refers to traditional antibiotics such as penicillin, tetracyclines and other substances including the sulpha drugs, nitrofurazones, dapsone and rifampicin. Anti-viral medicaments are not antibiotics.
Hazardous waste – permits issued by the Minister for the Environment and requests to import processed by the Hazardous Waste Section of the Department of the Environment. Refers to waste defined by the Basel Convention, of which mercury is included.
Incandescent lamps - permits issues by the Minister for Industry and requests to import processed by the Energy Efficiency Branch of the Department of Industry. Refers to the general lighting service that have attributes as specified in Australian Standard AS 4934.2-2011 Incandescent lamps and general lighting services Part 2: Minimum Energy Performance Standards (MEPS) requirements.
Pesticides and other hazardous chemicals - requests to import or export pesticides listed on the Rotterdam Convention on the Prior Informed Consent Procedure for Certain Hazardous Chemicals and Pesticides in International Trade (the Rotterdam Convention) and the Stockholm Convention on Persistent Organic Pollutants (the Stockholm Convention) are administered by the Department of Agriculture30. Requests to import or export industrial chemicals listed on the Rotterdam or Stockholm Conventions are administered by the National Industrial Chemicals Notification and Assessment Scheme under the Industrial Chemicals (Notification and Assessment) Regulations 1990, along with the Customs import and export regulations in some instances.
Therapeutic drugs and substances - permits issued by the Minister for Health and requests to import processed by the Therapeutic Goods Administration. Drugs and substances including abortifacients, aphrodisiacs and others controlled for health reasons. This also includes laetrile and thalidomide.
It was noted that the ACBPS currently monitor imports for a broad range of other hazardous chemicals such as Asbestos Containing Materials, chemicals banned under the Stockholm Convention and ozone depleting substances under the Montreal Protocol on Substances that Deplete the Ozone Layer, and synthetic greenhouse gases under the Kyoto Protocol. Within this framework it was proposed that the ratification of the Minamata Convention would impose negligible additional costs.
29 Refer to Customs website for details: http://www.customs.gov.au/site/page4369.asp 30 under the Agricultural and Veterinary Chemicals (Administration) Regulations 1995 and the Australian Customs and
Border Protection Service under the Customs (Prohibited Exports) Regulations 1958 and Customs (Prohibited Imports) Regulations 1956
Department of the EnvironmentCosts and benefits of ratifying the Minamata Convention on Mercury
25

MARSDEN JACOB ASSOCIATES
Department of Defence
The Department of Defence indicated that they are currently auditing their use of mercury-added products. The Department of Defence indicated that they plan to minimise, and if possible eliminate, their reliance on mercury added products. However, the Department of Defence propose to use the exclusion available under Annex A of the Convention:
The following products are excluded from this Annex:
(a) Products essential for civil protection and military uses;
Using this exclusion, the phase-down scenarios does not impose any additional costs over the base case.
4.2.3 Compliance with specific ArticlesIn addition to discussions with relevant Departments, Marsden Jacob reviewed the requirements of the Convention to ensure all elements were captured.
The following table summarises the Articles identified as requiring government action and the actions involved under the ratify scenario.
Table 8: Government impacts by Article
Article Description Impact Bases for estimate
Article 13 – Financial contributions
Each Party to the Convention is required to provide, within it capabilities, resources in respect of national activities that are intended to implement the Convention.
$120,000 per annum
Based on Australia’s contribution of to the Stockholm and Basel Conventions, which each uses percentage based funding mechanisms.31
Article 14 – Capacity Building
Parties shall cooperate and provide, within their respective capabilities, timely and appropriate capacity building and technical assistance to developing country Parties.
$0
Existing funding to the Asian-Pacific region managed by Department of Foreign Affairs and Trade are expected to be able to be allocated towards initiatives which would meet the requirements of this Article.
Article 17 – Information Exchange
Each Party shall facilitate the exchange of information in relation to mercury and mercury compounds as specified under the Article either directly or through the Secretariat, or in cooperation with other relevant organisations. Each Party shall designate a national focal point for the exchange of information under the Convention, including with regard to the consent of importing Parties under Article 3.
Minimal(included in
Department of the
Environment estimates)
Information exchange covers scientific, technical, economic and legal, and health and safety information, however the Article is non-specific as to any direct action required from Party’s. Australia’s national focal point for exchange of information will rest with the Department of the Environment. Any costs associated with information exchange under this would be absorbed within Department costs outlined above.
31 Estimate considered that the US has already ratified the Minamata Convention and is not a Party to either the Stockholm or Basel Conventions. The inclusion of the US as Party is likely to reduce the overall contribution required from other Parties (including Australia), as such the estimated costs for the Minamata Convention are considered conservative.
Department of the EnvironmentCosts and benefits of ratifying the Minamata Convention on Mercury
26
MARSDEN JACOB ASSOCIATES
Article 18 – Public information
Each Party shall promote and facilitate provision to the public of available information on health and environment effects; alternatives to mercury; topics included in paragraph1 Article 17 – information exchange; result of research, development and monitoring; and activities undertaken to meet obligations under the Convention.Education, training and public awareness related to the effects of exposure to mercury and mercury compounds on human health and the environment.
Minimal additional
requirements(absorbed with existing budgets
of the Departments
and government
agencies)
Reporting on activities undertaken to meet obligation under the Convention has been included in the Department’s estimate
Article 19 – Research, development & monitoring
$0
Existing funding to the Asian-Pacific region managed by Department of Foreign Affairs and Trade are expected to be able to be allocated towards initiatives which would meet the requirements of this Article.
Article 21 – Reporting
Reporting to the Conference of the Parties, through the Secretariat, on measure taken to implement the provision of the Convention. Includes reporting information outlined in Articles 3,5,7,8 and 9.
Minimal(included in
Department of the
Environment estimates)
The timing and format of reporting will be decided at the first meeting of the Parties. However, based on the Basel Convention requirements, costs based on a three year reporting cycle have been estimated by the Department.
Article 22 – Monitoring data
Effectiveness evaluation $0
Appears will be undertaken as part of the Conference of the Parties process relying on data provided under other articles (eg. Article 21).
4.3 ConclusionIn relation to each of these Articles, the Department has suggested that some minor costs may be incurred; however, resources will be limited to the existing two full time employees and would therefore be managed within the current budget. The government costs are listed in Table 9.
Table 9: Summary of Government costs
Activity Estimated annual cost NPV of estimated cost (7% over 20 years)
Article 13 – Financial contributions $120,000 $1,270,000
Department of the Environment budget $250,000 $2,650,000
Other government departments $0 $0
Total $370,000 $3,920,000
Department of the EnvironmentCosts and benefits of ratifying the Minamata Convention on Mercury
27

MARSDEN JACOB ASSOCIATES
Department of the EnvironmentCosts and benefits of ratifying the Minamata Convention on Mercury
28

MARSDEN JACOB ASSOCIATES
5. Industry costs A review of submissions to the Department’s consultation process undertaken in 2014 identified the following industries as likely to be impacted by Australia ratifying the Convention:
1. Industries with potential air emissions
a. Coal fired power generation and industrial boilers;
b. Non-ferrous metals smelting and roasting (lead, zinc, copper and industrial gold);
c. Waste incineration;
d. Cement;
2. Cane growers;
3. Dental practices;
4. Lighting sector;
5. Waste and recycling sector; and
6. Oil and gas production;
Marsden Jacob’s analysis has identified that industry impacts are driven by four Articles of the Convention.
Table 10 maps the impact from each of the four Articles to the key industry impacts.
Department of the EnvironmentCosts and benefits of ratifying the Minamata Convention on Mercury
29

MARSDEN JACOB ASSOCIATES
Table 10: Industry impacts by Article
Key Industries
Article Dental Cane GrowersCoal-fired Generation
including in Aluminium Production
Non-Ferrous Mining Cement Other
Key
Artic
les
4Mercury added
products
Amalgam Mercury-containing pesticides
Street Lighting
8Emissions
New plantExisting plant
New plantExisting plant
New plantExisting plant
Waste Incineration & Coal fired boilersNew plantExisting plant
11Wastes
Amalgam - sink waste interceptors
Fly ash Recycling
3Supply sources
and trade
Phase-down of amalgam 2 of 9 measures in Part 2 Annex A
Department of the EnvironmentCosts and benefits of ratifying the Minamata Convention on Mercury
30

MARSDEN JACOB ASSOCIATES
5.1 Industries with potential air emissions Article 8 of the Convention sets out requirements for controlling, and where feasible reducing emissions of mercury and mercury compounds to the atmosphere from a number of specified point source categories. Point source categories are set out in Annex D of the Convention. These include:
Coal-fired power plants;
Coal-fired industrial boilers;
Smelting and roasting processes used in the production of non-non-ferrous metals (lead, zinc, copper and industrial gold);
Waste incineration facilities; and
Cement clinker production facilities.
Importantly, each Party to the Convention may establish criteria to identify the sources (e.g. individual facilities) covered within a source category listed in Annex D. The criteria for identifying point sources within a category is flexible so long as those criteria for any category includes at least 75 per cent of the emissions from that category (Article 8 Paragraph 2(b)).
Note, while aluminium production is not specifically mentioned in Annex D, many aluminium refineries and smelters include coal-fired power generation - which is included – and hence this section of the report would also be relevant to this sector.
5.1.1 New sources and existing sourcesThe structure of Article 8 differentiates between existing sources of emissions (emissions from existing plants and facilities) and new emissions (emissions from either existing plant which has undergone ‘substantial modification’32 or new plant and facilities).
New sources are also defined with reference to the date of entry of force of the Convention. New sources are sources for which the construction or substantial modification of which is commenced at least one year after the date of entry into force of the Convention. 33 Existing sources are defined as any sources which are not defined as a new source. 34
Using the timetable set out in section 1.1, we assume that new sources are those where construction commences after early 2017. This assumption is based on the Convention entering into force in early 2016 – consistent with the remainder of the report.
The obligations required for existing and new sources differ. These are considered in turn.
Existing sources
For existing sources each Party to the Convention is required to select one or more of five possible measures for implementation within 10 years of the Convention coming into force. The five measures are:
32 ‘Substantial modification’ means modification that results in a significant increase in emissions, excluding any change in emissions resulting from by-product recovery (as applicable). Each Party to the Convention must (individually, in relation to its own matters) decide whether a modification is substantial or not. See Article 8, paragraph 2(d) of the Conventions.
33 Article 8, Paragraph 434 Article 8, Paragraph 5.
Department of the EnvironmentCosts and benefits of ratifying the Minamata Convention on Mercury
31
MARSDEN JACOB ASSOCIATES
(a) A quantified goal for controlling and, where feasible, reducing emissions from relevant sources;
(b) Emission limit values for controlling and, where feasible, reducing emissions from relevant sources;
(c) The use of best available techniques and best environmental practices to control emissions from relevant sources;
(d) A multi-pollutant control strategy that would deliver co-benefits for control of mercury emissions;
(e) Alternative measures to reduce emissions from relevant sources.
In discussions with industry and the Department, Marsden Jacob considers the least costly option to enable Australia’s compliance with the Convention is the introduction of (b) Emission limit values for controlling and, where feasible, reducing emissions from relevant sources.
It is also noted that the selection of measures under the Convention should “take into account its national circumstances, and the economic and technical feasibility and affordability of the measures.”35 Marsden Jacob’s interpretation is that the Convention does not seek to impose mercury emission reduction measures to the extent that prevent individual plants or being viable. Similarly, recognition of national circumstances may be interpreted in Australia’s context in a number of different ways – including requirement for economies of scale, isolation factors and lack of alternative treatment or production methods (such as might be available in interconnected or larger European and American economies).
New sources
Article 8, Paragraph 4 of the Convention specifies the
For its new sources, each Party shall require the use of best available techniques and best environmental practices to control and, where feasible, reduce emissions, as soon as practicable but no later than five years after the date of entry into force of the Convention for that Party. A Party may use emission limit values that are consistent with the application of best available techniques.
The guidance on best available techniques (BAT) and best environmental practices (BEP) is currently being developed by a technical working group. The guidance will be discussed at the next Intergovernmental Negotiating Committee (around the start of 2016) and then negotiated and agreed at the first Conference of the Parties (expected to occur in late 2016 or early 2017).
Due to the current status of the guidance (draft and confidential) and the unknown outcomes of the multi-staged process prior to implementation it is not possible to predict the requirements (and resulting costs and benefits) of the guidance.
The remainder of this section sets out and discusses the ‘most likely’ outcome that would arise.
Potential risks raised by the unknown nature of the BAT and BEP guidance is discussed more fully in Appendix B.
35 Minamata Convention on Mercury, Article 8, paragraph 5, p.20Department of the EnvironmentCosts and benefits of ratifying the Minamata Convention on Mercury
32

MARSDEN JACOB ASSOCIATES
5.1.2 Non-ferrous metalsFor the purpose of the Convention ‘non-ferrous metals’ refers to lead, zinc, copper and industrial gold. Smelting and roasting processes associated with the production of these metals.
In Australia, the roasting of gold is the largest point source of mercury emissions into the atmosphere. The Gidji gold smelting facility North of Kalgoorlie releases approximately three tonnes of mercury per annum36 however, current upgrades to the smelter facility will reduce this amount within the next four years irrespective of the Convention. Additional benefits will arise from the current planned upgrades as the facilities will be able to meet their existing State-based environmental conditions.37
Base case
Under the base case we assume current operations would continue in line with existing planned upgrades. We also considered the likelihood of new or substantially modified facilities.
Based on consultation, no new facilities are expected for lead, zinc and copper in the next 20 years. New industrial gold facilities are possible within the study period with up to two facilities being considered feasible. However discussions with industry suggest that if one or more new gold smelters were developed, the suggested timing for these would be around 15 years from now (around 2025).
Ratification
Potential new industrial gold facilities could face additional capital and operating costs if Australia ratifies the Convention and technology requirements under guidelines are more expensive than technology which would be employed otherwise. However, there is a large uncertainty on longer term need for new facilities and no new gold facilities are expected in within the immediate 10 years. Given the uncertainty over whether a new facility will be needed, the current legislative requirements that would be imposed on a new facility as well as the requirements that would be imposed under the convention, the additional costs were considered to be negligible under the ‘most likely’ outcome. Indicative costs (and mercury capture) are discussed under the ‘worst case’ outcome in Appendix B.
Conclusion
Based on discussions with industry and government Marsden Jacob concluded that ratification could impose small set up costs on industry in providing voluntary contributions to a (likely) national plan, but is unlikely to impose costs on existing facilities. While ratification could impose costs on any new facilities constructed, as new facilities are only considered probable for industrial gold and these are not likely within the immediate 10 year period and are uncertain beyond this period costs associated with non-ferrous metal obligations do not feature under the ‘most likely’ outcome of Marsden Jacob’s cost benefit analysis.38
5.1.3 Coal-fired power generationThere are 37 coal fired power stations in Australia that are used to generate electricity. Through the incineration process to produce electricity whereby coal is burned, trace amounts of mercury embedded in the coal are released.
36 National Pollutant Inventory, 2012/2013 www.npi.gov.au 37 http://superpit.com.au/Environment/AirQuality/SulphurDioxideManagement/tabid/128/Default.aspx38 Costs imposed on industry are modelled under the ‘worst case’ outcome in Appendix B.
Department of the EnvironmentCosts and benefits of ratifying the Minamata Convention on Mercury
33

MARSDEN JACOB ASSOCIATES
Australian coal is relatively low in mercury content (in comparison to countries such as the United States of America) and the mercury content varies from one resource to another. Estimated air emissions for some of Australia’s coal power stations are provided in Table 11. It is noted that the four largest emitters are Victorian based which is attributed to the lower calorific value of Victorian brown coal and a higher mercury content in these coal resources.
Table 11: Estimated air emissions of mercury and compounds 2013-14
Plant LocationEstimated Air Emissions of Mercury (Kg)
GDF SUEZ Hazelwood Morwell-VIC 450
Loy Yang B Power Station Traralgon-VIC 437
EnergyAustralia Yallourn Yallourn North-VIC 360
AGL Loy Yang Traralgon-VIC 188
Northern Power Station Port Augusta-SA 148
Callide Power Plant Biloela-QLD 127
Stanwell Power Station Gracemere-QLD 107
Callide Power Station (A & B) Biloela-QLD 103
Gladstone Power Station Gladstone-QLD 92
Muja Power Station Collie-WA 72
Eraring Power Station Eraring-NSW 59
Tarong Power Station Nanango-QLD 49
Collie Power Station Collie-WA 49
Bayswater Power Station Muswellbrook-NSW 41
Source: National Pollutant Inventory, 2013/2014 mercury and compounds
Base case
The Electricity Supply Association of Australia (ESAA) notes:
“Forecasts of electricity demand indicate that there is no need for additional generation capacity, of any fuel source, for at least a decade. Falling demand for electricity has resulted in a significant oversupply of generation capacity.” 39
The ESAA noted that eight power stations were built in the previous 20 year period and that “it is impossible to accurately forecast demand beyond 2025 or foresee the type of generation technology required.” 40
The ESAA’s advice is consist with information contained in the Australian Energy Regulator’s annual State of the Energy Market Report. The 2014 report outlined that “muted demand and climate change policies contributed to over 2,000 MW of coal plant being shut down or periodically taken offline in
39 Electricity Supply Association of Australia submission to Marsden Jacob and the Department of the Environment in response to questions posed (unpublished), March 2015
40 Electricity Supply Association of Australia submission to Marsden Jacob and the Department of the Environment in response to questions posed (unpublished), March 2015
Department of the EnvironmentCosts and benefits of ratifying the Minamata Convention on Mercury
34

MARSDEN JACOB ASSOCIATES
2012–13” and highlighted that “For the first time in the NEM’s history, no new capacity would be required in any NEM region to maintain supply–demand adequacy for the next 10 years.”41
During the course of the project AGL Energy Limited, announced a new policy to “decarbonisation of electricity generation”. 42 Importantly, the policy states that AGL will not build, finance or acquire new conventional coal-fired power stations in Australia43 and that AGL will not extend the operating life of any of its existing coal-fired power stations.
Despite these changes in trends, some new coal fired generation projects may be proposed within the latter part of the cost benefit analysis timeframe. Australian Energy Market Operator lists proposed generation projects that are ‘advanced’ or publicly announced. At July 2014 it listed around 20,000 MW of proposed capacity across the NEM, 10.6 per cent of which related to coal generation projects.44
Given the information provided Marsden Jacob agreed with industry to use a range of zero to two coal fired power stations being built around the year 2030.
Ratification
Under the most likely outcome it was considered that no additional costs would be incurred and no change in mercury emissions would occur. This outcome would arise either if no new facilities are constructed, or if the BAT and BEP guidance does not impose additional requirements beyond business as usual levels.
5.1.4 AluminiumWhile Aluminium production is not specifically listed under Article 845 a number of aluminium refineries and smelters include coal-fired power generation and/or coal-fired industrial boilers.
In aluminium production mercury is released from two principal sources:
the combustion of coal (at alumina refineries); and
emissions from the alumina refining process.
Only mercury emissions released through the combustion of coal are currently captured by the wording under Article 8.
In discussions with aluminium industry it was noted that Appendix D could be expanded in the future to include emissions from the alumina refining processes. While this may be the case, such an assumption is beyond the scope of Marsden Jacob’s cost benefit analysis and so is not considered further.
41 Australian Energy Regulator (2014) State of the Energy Market Report, p. 34. 42 AGL Energy Limited (2015), AGL policy to provide pathway to decarbonisation of electricity generation, media
release dated 17 April 2015, accessed 30 April 2015. Available at: www.agl.com.au/about-agl/media-centre/article-list/2015/april/agl-policy-to-provide-pathway-to-decarbonisation-of-electricity-generation and
AGL Energy Limited (2015) AGL Greenhouse Gas Policy, 17 April 2015, accessed 30 April 2015. Available at: http://www.agl.com.au/~/media/AGL/About%20AGL/Documents/Media%20Center/Corporate%20Governance%20Policies%20Charter/1704015_GHG_Policy_Final.pdf
43 Without Carbon Capture and Storage44 Australian Energy Regulator (2014) State of the Energy Market Report, p. 32 and Figure 1.13 on p. 35.45 See Appendix D of the Convention which lists lead, zinc, copper and industrial gold as the non-ferrous metals which
are covered by the Convention.Department of the EnvironmentCosts and benefits of ratifying the Minamata Convention on Mercury
35

MARSDEN JACOB ASSOCIATES
Given that aluminium industry’s interest in Article 8 is based on coal-fired generation the same figures were applied to the aluminium as for was for the coal fired generation sector.
5.1.5 CementMercury is introduced into the clinker burning process via both, raw materials and fuels. The mercury content of these inputs varies, with raw materials (such as limestone and clay or their natural mix, lime marl, and sand) containing lower mercury content per kilogram than fuel used in the cement industry (such as coal, or other fuels).46 The burning process releases the trace mercury content of these inputs as emissions.
The Cement Industry Federation indicated that there are three companies with five integrated cement and clinker facilities in Australia. Industry also commented that mercury emissions from Australian cement facilities compare well to emissions from international facilities.
National Pollution Inventory data suggests that integrated cement plant mercury emissions in 2012-13 equated to 0.013 grams per tonne of clinker. This is an order of magnitude less than the European Union legislated limit47 which is equivalent to around 0.11 to 0.13 grams per tonne of clinker.
Base case
The cement industry indicates that it is highly unlikely that any new facilities would be developed in the next 20 years. It was also noted that no new facilities were constructed during the previous 20 years (between 1995 and 2015). However, all operating integrated cement plants underwent significant technology upgrades to reduce emissions over this time period.
Ratification
Of the five current facilities only one plant (in Queensland) is not covered by an existing emission limit value through state approvals, however, the current licence is for this plant is still likely to meet the obligations of Article 8 due to the range of measures within the Convention that can be applied to existing plant.
Conclusion
Through consultation industry confirmed that no ongoing costs are expected for existing facilities and no new facilities are expected to be constructed during the next 20 years.
As such, no impact has been estimated for the cement industry as a result of ratification for the cost benefit analysis.
5.1.6 Waste incineration“Incineration is a combustion process that uses rapid oxidation, excess air and high temperatures to produce conditions whereby hazardous and toxic waste products are thermally broken down and
46 European Cement Research Academy (2013) Technical Report: Guidance Document on BAT-BEP for Mercury in the Cement Industry - Initial Outline (TR-ECRA 0049a/2013/M), 31 May 2013, Table 3 and Table 4 on p. 9. Available at: http://www.unep.org/chemicalsandwaste/Portals/9/CSI_Hg-Report_final_10_06_13.pdf
47 European Regulation states a maximum 0.050 mg/Nm 3 (~0.11 to 0.13 g/t-clinker). See Alan Kreisberg (2013) Rationale, objectives and priority areas of the Cement Industry Partnership on Mercury, PowerPoint presentation to the UNEP Cement Industry Partnership Geneva Meeting on 18 June 18 2013. Available at: http://www.unep.org/chemicalsandwaste/Mercury/GlobalMercuryPartnership/MercuryreleasesfromtheCementIndustry/Meetings/tabid/106280/Default.aspx
Department of the EnvironmentCosts and benefits of ratifying the Minamata Convention on Mercury
36
MARSDEN JACOB ASSOCIATES
destroyed.”48 Where waste contains mercury or traces of mercury, the incineration process releases mercury emissions.
Australia has not traditionally used waste incineration as a method for solid waste disposal. However, there have been four recent approvals for waste incineration facilities in Western Australia – and one further facility is currently under assessment, also in Western Australia.
Three of the facilities are waste to energy projects based on gasification. Only one facility is based on full incineration of the waste.
Base case
Four waste incineration facilities have gained approval in Western Australia, but at this stage none of the facilities have commenced construction. It is unknown how many facilities additional new facilities will be planned throughout Australia in the period to 2035.
Ratification
Under the Convention new facilities are defined broadly as “the construction or substantial moderation of which is commenced at least one year after the date of entry into force of the Convention.” Depending on the timing of construction, some or all of the four facilities with existing approvals could be classified as either existing facilities or new facilities.
The West Australian Environment Protection Authority49 has prepared informal advice under section 16(e) of the Environmental Protection Act (Western Australia) 1986 on best practice for waste incineration.50
From the Authority’s advice it appears that Western Australia already adopts best practice techniques in granting approvals. This view was confirmed in discussions with staff from the Office of Environment Protection Authority. Further, these discussions suggested that similar advice and sources of information on best practice have been used by the Authority in approving the plants as would inform the BAT and BEP guidance. For this reason, it is likely that the Western Australian plants are likely to already align with international BAT and BEP guidance.
Conclusion
The four waste incineration facilities which have gained approval in Western Australia, but for which construction is yet to commence are likely incorporate best practice techniques akin to the likely BAT and BEP guidance to be developed under the Convention. It is unknown how many other new waste incineration facilities are likely to arise in other parts of Australia.
As legislative requirements for solid waste incineration have not been set for other jurisdictions, the West Australian requirements are likely to be used as a starting point for other states. For this reason Marsden Jacob concluded that ratification would not impose any additional costs on new facilities..
48 Unilabs Environmental (1999) Characterisation and Estimation of Dioxin and Furan Emissions from Waste Incineration Facilities, report prepared for Environment Australia, June 1999, p. 34.
49 Western Australia being the only State that is known to have currently approved waste incineration facilities.50 Environmental and health performance of waste to energy technologies, 4 April 2013
www.epa.wa.gov.au/Policies_guidelines/strategicadvice/Pages/default.aspx?cat=Strategic%20Advice&url=Policies_guidelines/strategicadvice
Department of the EnvironmentCosts and benefits of ratifying the Minamata Convention on Mercury
37

MARSDEN JACOB ASSOCIATES
5.2 Cane growersMercury is used in some pesticides and biocides. However, in Australia only one product registered with the Australian Pesticides and Veterinary Medicines Authority (APVMA) is listed as containing mercury. Shirtan® is a mercury-containing pesticide that is widely used by sugarcane growers for the control of pineapple disease (caused by the fungus Ceratocyctis paradoxa).
Growers that use Shirtan® apply the chemical to sugarcane setts prior to planting (approximately every four to six years). While there are alternative products available (discussed below) the mercury-containing pesticide has substantial market penetration with around 80% of new plantings being treated (equating to an average of 44,000 litres per year over the period 2011 to 2014).
The active ingredient of Shirtan is 120 grams of mercury, present as methoxyethylmercuric chloride (referred to as MEMC) per litre.51
Sugarcane planting
Sugarcane is a semi-perennial crop and individual fields are only replanted every four to six years. Sugarcane is planted by using cuttings (referred to as “setts”).
Sugarcane is cut annually and in the intervening years- between replanting, the root stock and base of the plant are left in place.
Cane farmers indicate that planting is the most expensive part of the cropping cycle and disease management is a key element of planting.
Relevant Articles of the Convention
Article 4 (mercury-added products) restricts the manufacture, import or export of mercury-added products after a specified phase-out date. Pesticides, biocides and topical antiseptics have a compulsory phase-out date of 2020.
Article 4 also requires Parties to collect and maintain information on mercury-added products and their alternatives and make this information publically available.
Article 4 does not specifically require the APVMA to remove mercury-containing pesticides from its list of registered products – however, as discussed in section 4.2, it is recognised that this would provide a mechanism to ensure the product ceases to be produced and used.
Alternative products
Alternative non-mercury pesticides are available on the market. A range of propiconazole based pesticides are available under differing trade names and are registered for control of both pineapple sett rot and smut.
Sinker® is a relatively new flutriafol-based pesticide that is currently a proprietary formulation used for the control of sugarcane smut and pineapple disease – however, alternative flutriafol-based pesticides are likely to become available in approximately 3 years.52 Once competitors using flutriafol-based pesticides are able to enter the market, costs are expected to drop and be more competitive with the current mercury-containing pesticide.
51 Crop care Australia, Material Safety Data Sheet Shirtan Liquid Fungicide, 201152 Once the data used for registration with APVMA becomes publicly available – Information provided by Crop care
Department of the EnvironmentCosts and benefits of ratifying the Minamata Convention on Mercury
38

MARSDEN JACOB ASSOCIATES
Previous analysis indicated that propiconazole-based fungicides cost approximately half that of the mercury-containing pesticide53 (which costs $27)54 and these relative costs were confirmed in discussions with the industry.
Some industry participants suggest that the popularity of the mercury-containing pesticide is due a belief that the chemical stimulates rapid germination of sugarcane relative to alternative products – particularly in adverse conditions (such as cold weather). Crop Care reportedly spoke with researchers who estimated that each year around 10% to 20% of the sugarcane crop planted is at risk due to poor conditions and that it is under these conditions that they believe the mercury-containing pesticide is advantageous. Crop Care estimated that the risk to crops might be realised 30% of the time (if the mercury-containing pesticide weren’t used) – equating to 3,150 hectares. Where crops are damaged the most likely response is to replant the crop at a cost of $1,000 to $1,500 per hectare. This information would value the loss of Shirtan at $3,937,500 per annum. There is no published scientific information available that supports this belief. Given the uncertain nature of this value it was not included under the most likely case assessment.
The belief that the mercury-containing pesticide improves germination rates was reported in an (unsighted) journal article from 197055, this has since been disproven by more recent studies that found:
“results from the current study indicated that MEMC [the mercury-containing pesticide] did not provide higher or faster germination compared to the two triazole fungicides or the uninoculated control. The reason for the discrepancy between the current and the previous study is not clear.” 56
Selected results from an experiment of this more recent research analysis are displayed in Figure 6. The mercury-containing pesticide is listed as MEMC (referring to the active ingredient) and has a germination rate of only 14% in comparison to 23% for the flutriafol-based product. In the text accompanying the graph it is observed that:
“conditions were cold and wet after a late winter planting.”
These planting conditions appear to align with the description of “adverse conditions” that industry stakeholders are primarily concerned about. It follows that more recent research has found that existing mercury-free alternative products have a greater beneficial impact on sugarcane germination than the mercury-containing pesticide, even when used in adverse conditions.
53 Dent Siobhan, Switala John and O’Sullivan Mark, Modelling the role of an assumed “eco-efficient” production system: Queensland’s sugar cane industry, presentation at Outlook 2003.
54 Information provided by cropcare55 Steindl DRL (1970) The control of pineapple disease and the stimulation of germination in cane setts in Queensland.
Sugarcane Pathol Newsl 5:53–5456 Bhuiyan S. A. Croft B. J. & Tucker G. R. Efficacy of the fungicide flutriafol for the control of pineapple sett rot of
sugarcane in Australia, Australasian Plant Pathol. (2014) 43:413–419 DOI 10.1007/s13313-014-0282-y
Department of the EnvironmentCosts and benefits of ratifying the Minamata Convention on Mercury
39

MARSDEN JACOB ASSOCIATES
Figure 6: Comparison of bud germination at 120 days for differing pesticide treatments
Source: Crop care media release 23 May 2013, Crop Care launches Sinker fungicide in sugarcane
Alpha Chemicals (who manufacture the mercury-containing pesticide) believe that the popularity of the mercury-containing pesticide was because organic-based pesticides can become less effective over time if not managed properly, as fungi can develop a tolerance to the product. It is important to note however, that pesticide resistance management plans are standard practice (and can include integrated disease management programs) in order to ensure that the products are used appropriately and manage resistance without sacrificing disease control.
Base case
Under the base case, it appears that the mercury-containing pesticide would continue to be used at its current level into the foreseeable future.
It was noted that if Australia does not ratify the Convention, then importing mercury for the production of the mercury-containing pesticide would only be possible from other countries which have not ratified57. Alpha Chemicals indicated that this was not a concern as a source of mercury (from a waste stream) had been identified within Australia.
Ratification
Under the phase-down scenarios, the manufacture of the mercury-containing pesticide would have to cease by 2020. While one of the alternative products is cheaper (and the other product is the same price) – this cost differential represents a transfer between parties and does not impact on economic costs for Australia as a whole – as both products are manufactured in Australia.
57 Under Article 3 Paragraph 6b parties to the Convention are prohibited from exporting Mercury to non-parties for a prohibited use and the manufacture of Shirtan is a prohibited use under Article 4 and Annex A.
Department of the EnvironmentCosts and benefits of ratifying the Minamata Convention on Mercury
40

MARSDEN JACOB ASSOCIATES
The Canegrowers association indicated that there are negligible costs in changing from one pesticide to another. From discussions with the distributor of the mercury-containing pesticide, it appears likely that under a phase-down scenarios, their agents may need to spend more time with cane growers educating them on the need to change and alternative products.
The impact of ratification on mercury released
The average amount of Shirtan (the mercury-containing pesticide) used in recent years is 44,000 litres per annum. This equates to 5,280 kg of elemental mercury being released into the Australian environment each year.
Evidence of “significantly increased” mercury residues in soils throughout sugarcane growing regions has not been detected by Sugar Research Australia.58 The Department of the Environment noted that the form of mercury in this pesticide does not readily transport through the soil profile, rather it is more likely to attach to soil particles and flow overland, becoming agricultural runoff. Mercury in water bodies is primarily associated with dissolved organic matter and suspended particulate matter such as clay particles. These particulates eventually settle into sediment layers.
Great Barrier Reef sediment cores have identified mercury concentrations of up to 100µg kg-1, an order of magnitude higher than background concentrations. These concentrations were attributed to the contemporary application of mercury-based pesticides on sugarcane farms.59
5.2.1 Scenario 2CScenario 2C considers the impact if the manufacture and use of mercury-containing pesticides were phased out early (in 2017) rather than in 2020 as stipulated in the Annex A of the Convention.
From discussions with the Canegrowers association Marsden Jacob understands that the costs to cane growers would not alter significantly if the mercury-containing pesticide were removed from production and use earlier than 2020.
However, it is expected that an early phase out would impose additional costs on Crop Care and the distributors of other alternative products through increased resourcing of advisors and sales staff to assist farmers in the change to alternative products . While these costs are not readily estimated across a competitive market in Marsden Jacob’s experience it is reasonable to double the estimated resources required to achieve a transition to alternative products in under half the time.
It is noted that if mercury-containing pesticides were phased-out in 2017, then it appears likely that the non-mercury product Sinker (which may be the preferred alternative product) will still be priced at a higher cost than the current mercury-containing pesticide Shirtan. This does not appear in the cost benefit analysis as it is a transfer between stakeholders – but does impose a regulatory burden on canegrowers60. In addition, bringing forwards the date for the phase-out of mercury-containing pesticides would reduce the ability for Alpha Chemicals (who manufacture Shirtan) to restructure its business.
58 Canegrowers Association submission to the Department of the Environment’s Public Consultation Paper on the possible ratification of the Minamata Convention, dated 30 June 2014.
59 GBRMPA, Water Quality Guidelines for the Great Barrier Reef Marine Park: Revised Edition 2010, p. 74.60 Due to the differing focus of the cost benefit analysis and the regulatory burden measurement this cost appears as a
regulatory burden – but not as a Department of the EnvironmentCosts and benefits of ratifying the Minamata Convention on Mercury
41

MARSDEN JACOB ASSOCIATES
5.3 Dental practicesIt is important to note that the Convention does not prohibit the manufacture, import, export or use of amalgam fillings. Instead Parties are required to undertake measures to phase-down the use of amalgam.
Dental amalgam containing mercury is a material used for dental fillings – both in Australia and globally. The usage of dental amalgam in Australia is declining and currently comprises roughly 25% of the new fillings in Australia61.
The majority of dental filling now make use of alternative products such as resin composite and glass-ionomer. The industry reports that the declining use of dental amalgam is largely due to increasing consumer preference for tooth-coloured alternatives62. This trend appears to be continuing despite the alternatives being higher cost (roughly 50% to 100% more expensive) and potentially having shorter useful life.63
Under the Convention, Article 4 requires Parties to undertake measures to phase-down the use of dental amalgam. Specifically, Parties are required to undertake two or more of the measures listed in the Convention to phase-down the use of dental amalgam.64 Australia is already compliant with this obligation.
Articles 3 and 11 which deal with mercury trade and management of mercury waste respectively are also of relevance to the dental industry. Mercury is (or could be) imported under Article 3 for the purpose of dental amalgam manufacture, however trade in mercury for this purpose is not restricted. Waste dental amalgam can be captured by installing separation devices at dental surgeries – preventing the waste amalgam entering waste water systems.
Although, installation of separators is not strictly required under the Convention, Marsden Jacob has conducted analysis on the likely costs and benefits of facilitating installation of these devices in surgeries across Australia as part of sub-option 2B under the phase-down scenario.
In assessing the costs and benefits of ratifying it is necessary to consider the impact of the Convention (under both ratification and base case scenarios) on the:
61 According to separate submissions by the Australian Dental Industry Association and Australian Dental Association to the Department of the Environment’s Minamata Convention On Mercury Ratification Consultation and discussions with dental industry experts
62 Department of Health (2014) Submission to Department of the Environment: Ratification of the Minamata Conventions Consultation, 17 July 2014, p. 2
63 Based on discussions with dental industry experts64 Listed measures in Annex A part II which apply under Article 4, paragraph 3 include:
(i) setting national objectives aiming at dental caries prevention and health promotion, thereby minimizing the need for dental restoration;
(ii) Setting national objectives aiming at minimizing its use; (iii) Promoting the use of cost-effective and clinically effective mercury-free alternatives for dental restoration; (iv) Promoting research and development of quality mercury-free materials for dental restoration; (v) Encouraging representative professional organizations and dental schools to educate and train dental
professionals and students on the use of mercury-free dental restoration alternatives and on promoting best management practices;
(vi) Discouraging insurance policies and programmes that favour dental amalgam use over mercury-free dental restoration;
(vii) Encouraging insurance policies and programmes that favour the use of quality alternatives to dental amalgam for dental restoration;
(viii) Restricting the use of dental amalgam to its encapsulated form;(ix) Promoting the use of best environmental practices in dental facilities to reduce releases of mercury and mercury
compounds to water and land.Department of the EnvironmentCosts and benefits of ratifying the Minamata Convention on Mercury
42

MARSDEN JACOB ASSOCIATES
manufacture, import and export of dental amalgam; and
use of amalgam for dental fillings in Australia.
In addition Scenario 2 B requires consideration of the costs and benefits of installing amalgam separators in all dental clinics.
5.3.1 Base caseUnder the base case where Australia does not ratify the Convention, any changes in costs after ratification compared to the current costs will be driven by changes in Australia’s ability to:
import mercury for continued manufacture of dental amalgam; and
import and export amalgam.
These points are considered in turn below.
Australia’s ability to import mercury
Australia’s ability to import mercury for continued manufacture of dental amalgam depends largely on decisions by other countries in relation to the future of mercury. The Convention does not restrict trade in mercury for dental amalgam (subject to consents being agreed between Parties); however other restrictions will result in the mining of “new” mercury becoming less common over time as the Convention restricts the development of new mercury mines. As such, the supply of mercury internationally could reasonably reduce as a consequence of the Convention coming into force.
Marsden Jacob does not expect that Convention will impact the supply of mercury to Australia for dental amalgam in the immediate future (10 to 15 years).
For the purpose of the cost benefit analysis, changes which depend on other countries actions are assumed to be the same, regardless of Australia’s decision to ratify. As such there is no difference as these changes would occur in both the base and ratification cases and as such the impacts net off.
According to the Dental Industry Association “There is only one Australian producer of dental amalgam, SDI Limited, which requires approximately twenty tons of mercury per year to support its manufacturing processes.” 65 In addition, Kerr Australia was identified as importing and exporting amalgam fillings.
The Dental Industry Association also commented that “Around 98% of the mercury needed by SDI Limited for production of dental amalgam is imported. Australia has a domestic mercury recycling operator, Ecocycle Australia, which processes approximately 350 kilograms of mercury annually which is on-sold to SDI.” 66
The Convention will have competing and opposite impacts on recycling of mercury which will vary depending on whether Australia ratifies or not. Some sources of mercury (such as streetlights and lamps) will reduce over time as international manufacturers are likely to move to alternative products.
In contrast, sources of waste mercury from captured smelters, refineries and oil and gas production appears to have increased in recent years. Under the base case it remains unclear whether recycling could generate sufficient mercury to meet supply for dental amalgam in the absence of mercury imports.
65 Australian Dental Industry Association (2014) Submission on the Minamata Convention On Mercury Ratification, 30 June 2014, p. 7
66 Australian Dental Industry Association (2014) Submission on the Minamata Convention On Mercury Ratification, 30 June 2014, p. 7
Department of the EnvironmentCosts and benefits of ratifying the Minamata Convention on Mercury
43

MARSDEN JACOB ASSOCIATES
Import and export amalgam
In addition to supplying the Australian market, SDI Limited manufactures dental products for export – including mercury based amalgam.
It is noted that should the supply of mercury to Australia become limited (discussed above), then the ability for Australian manufacture of amalgam would be limited and as such the ability to continue exporting to other countries becomes mute
The future demand for amalgam in Australia, and the future overseas demand under the base case are each discussed in turn.
Future demand for mercury based dental amalgam in Australia
A number of factors discussed above suggest that continued use of amalgam after 2020 may reduce regardless of Australia’s decision to ratify.
Firstly, the use of mercury based amalgam appears to be reducing over time as a result of individual preference for “white filling” substitutes. The Department of Health submitted to the Department’s consultation on ratification of the Minamata Convention that:
“Amalgam use has been declining rapidly in Australia in the last few years due to a response to the demand for "white fillings". The impact that a phase-down would have on the dental restorative materials industry does not appear to be great. There are only two active suppliers of amalgam in Australia and use is declining. 67
Secondly, ratification of the Convention by larger international markets may influence decisions by the suppliers of mercury based amalgam to Australia (e.g. SDI Limited and Kerr Australia).
Future export of mercury based dental amalgam
Dental amalgam capsules are exported from Australia, so permission to import would need to be given by the country receiving the imports. On the basis the Convention stipulates the phasing down of dental amalgam, this appears likely to happen unless the country chooses to ban amalgam fillings. To date a small number of countries – such as Sweden, Norway and Denmark have chosen to ban amalgam fillings. However, this decision would be considered independent of the Minamata Convention.
5.3.2 RatificationUnder the phase-down scenarios, where Australia does ratify the Convention and adheres to the Convention requirements, impacts to the dental industry would be driven by:
any measures Australia chooses to undertake with regards to facilitating the phase-down of amalgam consistent with Article 4; and
impacts on mercury for imports and mercury products for exports.
As noted above the introduction of the Convention will potentially have some impacts on international trade in mercury and mercury added products – but following discussions with stakeholders it was concluded that the impacts will be the same whether Australia ratifies or not. For this reason it does not impact on the Cost Benefit Analysis and is not considered further.
67 Department of Health (2014) Submission to Department of the Environment: Ratification of the Minamata Conventions Consultation, 17 July 2014, p. 2
Department of the EnvironmentCosts and benefits of ratifying the Minamata Convention on Mercury
44

MARSDEN JACOB ASSOCIATES
Options to meet Article 4 measures
Under Article 4, paragraph 3 of the Convention, Parties are required to undertake specific measures for the mercury-added products. For dental amalgam these are:
Measures to be taken by a Party to phase-down the use of dental amalgam shall take into account the Party’s domestic circumstances and relevant international guidance and shall include two or more of the measures from the following list:
(i) setting national objectives aiming at dental caries prevention and health promotion, thereby minimizing the need for dental restoration;
(ii) Setting national objectives aiming at minimizing its use;
(iii) Promoting the use of cost-effective and clinically effective mercury-free alternatives for dental restoration;
(iv) Promoting research and development of quality mercury-free materials for dental restoration;
(v) Encouraging representative professional organizations and dental schools to educate and train dental professionals and students on the use of mercury-free dental restoration alternatives and on promoting best management practices;
(vi) Discouraging insurance policies and programmes that favour dental amalgam use over mercury-free dental restoration;
(vii) Encouraging insurance policies and programmes that favour the use of quality alternatives to dental amalgam for dental restoration;
(viii) Restricting the use of dental amalgam to its encapsulated form;
(ix) Promoting the use of best environmental practices in dental facilities to reduce releases of mercury and mercury compounds to water and land.
From discussions with the Department and stakeholders Australia appears to be compliant with at least two of these measures. In particular:
Australia is updating its oral health plan68 to cover 2015 to 2024 (aligning with measure i);
professional organizations and dental schools already educate and train dental professionals and students on the use of mercury-free dental restoration (aligning with measure v); and
in Australia no insurance policies and programmes favour dental amalgam use over mercury-free dental restoration (aligning with measure vi).
Given that Australia is already compliant with the requirement to meet two or more measures, no additional costs or benefits are expected to arise as a result of ratification.
5.3.3 Scenario 2B – Ratification with dental amalgam separators encouraged by government
The primary source of mercury waste from dental amalgam is through the removal of old fillings. Some mercury residue also enters the waste water streams when new mercury fillings are installed.
68 The National Advisory Committee on Oral Health is drafting the new 2014-2023 national oral health plan for the COAG Health Council’s endorsement http://oralhealthplan.com.au/
Department of the EnvironmentCosts and benefits of ratifying the Minamata Convention on Mercury
45

MARSDEN JACOB ASSOCIATES
To reduce mercury releases to the environment the Australian Dental Association (Victorian Branch), the Victorian water industry and the Victoria Environmental Protection Authority ran the ‘Dentists for Cleaner Water Program’ between 2008 and 2011. The program facilitated the installation of dental amalgam traps and separators in private sector dental practices across the state.
As part of the cost benefit analysis the Department of the Environment sought analysis of a further scenario (2B) Ratification with dental amalgam separators encouraged by government.
Marsden Jacob developed this scenario based on an evaluation of the Dentists for Cleaner Water program, interviews and other data sources. Marsden Jacob has conducted a brief investigation into the cost and benefits of facilitating a similar program or extension to the initiative across Australia.
The Dentists for Cleaner Water Project (DCWP) was a voluntary amalgam separate installation and case rebate program that ran for three years between July 2008 and June 2011. The DCWP rebate program resulted in the installation of a total of 725 amalgam separators being installed serving about 1,454 dental chairs across Victoria for a total government investment of $1 million.69
An evaluation of the program estimated that the amalgam wasted collected by CMA over the three and a half years of collections data, gives an annual average mercury collection rate of about 324 kg/yr (based on drained net weight calculations and an assumed 30% moisture factor).70 Divided across the 725 amalgam separators (and assuming one amalgam separator per dental practice), this equates to 0.45 kg/yr of mercury being collected per separator.
Amalgam separators
Amalgam separators complying with International Standard ISO 11143:2008 are capable of 95% amalgam removal, and can greatly reduce mercury loads to sewers from individual dental surgeries.
The standard addresses the characteristics of three types of dental amalgam separators, these being:
Centrifugal System: These systems use centrifugal force to draw out amalgam particles from the wastewater.
Sedimentation System: These systems reduce the speed of wastewater flow, which allows amalgam particles to settle out of the wastewater.
Filter System: Depending on the type of filter used, these separators remove not only coarser amalgam particles but also some finer and colloidal amalgam particles.
In Australia there are several suppliers of amalgam separators which are predominately supplied by Cattani Australia, Ecocycle Australia, Durr Dental, Ritter Dental (formerly Gritter Dental) and Sirona Dental Systems.
Costs
Currently Victoria is the only state with a large number of amalgam separators. Based on Australian Bureau of Statistics business data and assuming that 90% of dentists would undertake some work that may release mercury the breakdown of installations required is set out in Table 12 and gives a total of 11,862 dental surgeries.
69 DCWP Evaluation Report, p. v70 DCWP, p. vii
Department of the EnvironmentCosts and benefits of ratifying the Minamata Convention on Mercury
46

MARSDEN JACOB ASSOCIATES
Table 12: Estimated numbers of dentists and installations required
State Numbers of dentists
Number of installations required
New South Wales 4,224 3,802
Victoria 2,915 1,749
Queensland 2,291 2,062
South Australia 820 738
Western Australia 1,176 1,058
Tasmania 150 135
Northern Territory 59 53
Australian Capital Territory 224 202
Currently Unknown 3 3
TOTAL 11,862 9,801
Source: ABS data – counts of business entry and exit - Operating at end of financial year 2013
A broad range of installation costs and annual servicing fees were reported. For the Cost Benefit Analysis the prices quoted by CMA ecocycle ($900 installation and $500 annual servicing) were used.
Mercury Removed
The evaluation of Dentists for Cleaner Water reported alternative estimates of the mercury recovered.
To ensure a realistic estimate Marsden Jacob used the Victorian forecast estimate of 95kg of mercury from 725 surgeries giving a recovery rate of 0.13 kg per surgery per year.7172
If expanded across 90% of the 11,862 surgeries across Australia this would result in the recovery of 1,284 kilograms per annum.73
Discussions with a large water utility74 indicated that mercury in the sewer system was largely captured in biosolids – which depending on the utility and contaminant levels – may be used as a form of soil improver for agricultural areas. Marsden Jacob considered whether the improved value of biosolids should be included in the cost benefit analysis – however, the water utility advised that other contaminants (particularly copper) are a more important limiting factor on the use of the biosolids and that Mercury levels are found to be at or below ambient levels of mercury in the soil. For this reason the benefit assessment focussed only on the reduced quantity of mercury released to the environment.
5.4 Lighting sectorA number of lights used at either a domestic or commercial level include some quantity of mercury. Mercury-containing lamps include small compact fluorescent lamps (CFLs) used mostly in homes,
71 URS, Evaluation of Dentists for Cleaner Water, 2013 See Table 5-4.72 Analysis of data provided in the Australian Dental Industry Association submission to the 2014 Minamata consultation
reveals a higher estimate of 0.214 kg per unit per annum (314 kg of Hg across 664 Units over 2.2 years)73 For the purpose of the cost benefit analysis it was assumed that these interception units would be installed over a four
year period.74 West Australian Water Corporation
Department of the EnvironmentCosts and benefits of ratifying the Minamata Convention on Mercury
47

MARSDEN JACOB ASSOCIATES
linear fluorescent lamps (LFLs) or linear fluorescent tubes commonly used in offices, and high intensity discharge lamps such as high pressure mercury vapour lamps (HPMVs) used for street lighting and sports grounds.
Article 4 of the Convention restricts the manufacture, import or export of mercury-added CFLs and LFLs with mercury quantities above specified limits and all HPMVs by 2020. In the absence of Australia seeking an exemption, under a phase-down scenarios, the manufacture, import and export of these products would be prohibited after 2020.
Alternative non-mercury products are widely available. These include traditional incandescent lamps (which are relatively less energy efficient) and light-emitting diode (LED) lights. High pressure sodium vapour lights and other energy efficient alternatives are also available as an alternative to HPMV lamps.
5.4.1CFLs and LFLsLarge amounts of mercury (up to 40 mg per lamp) was previously a characteristic of CFLs and LFLs. Developments in manufacturing technologies have significantly reduced the mercury content in fluorescent lamps, with most lamps being manufactured globally containing less than 10 to 5 mg per lamp75. In addition, the Australian Standard (AS/NSZ 4782 series), which applies to fluorescent lamps, is voluntary but typically requires ‘best practice’ technology. The following are relevant to Australia’s ratification the Convention:
CFLs (used mostly in homes) are required by an Australian Standard to have a maximum of 5 mg of mercury per bulb; and
LFLs (used in most commercial and public buildings) are required by an Australian Standard to contain less than 15 mg of mercury per tube76.
Industry stakeholders advise that CFLs and LFLs available in Australia already conform to maximum mercury content requirements outlined in Annex A of the Convention. For this reason ratification is not expected to have any impact on CFLs and LFLs.
5.4.2 Mercury vapour streetlights (HPMVs)In 2010, there were roughly 2.28 million streetlights nationally in Australia. Of these, approximately 1.39 million (or 61 per cent) were HPMV lamps77. By 2015, Marsden Jacob estimates the number of HPMV lamps remaining in service had fallen to just under 1 million78.
HPMV streetlights are predominately owned and maintained by distribution companies, local councils and other government organisations and statutory bodies in Australia.
75 Hu, Yuanan; Cheng, Hefa (2012) Mercury risk from fluorescent lamps in China: Current status and future perspective, Environment International, 2012, Vol.44, pp.141-150 [Peer Reviewed Journal]
Aman, MM; Jasmon, GB; Mokhlis, H; Bakar, AHA (2013) Analysis of the performance of domestic lighting lamps, Energy Policy, 2013, Vol.52, pp. 482-500 [Peer Reviewed Journal]
76 Refer to Australian Standards AS/NSZ 4782 series; http://www.environment.gov.au/protection/national-waste-policy/mercury-containing-lamps ; and http://www.austlii.edu.au/au/legis/cth/num_reg_es/ciar20087n256o2008622.html#_Toc216078647
77 Source: Commonwealth of Australia (2011) ‘Draft Strategy paper: Street Light Strategy’, prepared by Ironbark Sustainability on behalf of the Equipment Energy Efficiency Program, a join initiative of Australian, State and Territory and New Zealand Governments, July 2011. Available at: http://www.energyrating.gov.au/wp-content/uploads/Energy_Rating_Documents/Library/Lighting/Street_Lighting/Draft-streetlight-Strategy.pdf
78 Based on Marsden Jacob analysis of regulatory proposal submissions by distribution businesses to the Australian Energy Regulator, discussions with industry stakeholders, and Marsden Jacob estimates.
Department of the EnvironmentCosts and benefits of ratifying the Minamata Convention on Mercury
48

MARSDEN JACOB ASSOCIATES
A number of factors are currently in play which mean that the current phase-out of these mercury vapour lights is already underway, expected to continue and may potentially accelerate regardless of Australia’s decision to ratify the Minamata Convention. These include:
Changes to the relative costs of alternative (low or no-mercury) products such as LED and high pressure sodium vapour lights have changed the economics of streetlight investments with regards to balancing capital installation costs, maintenance costs and energy costs. Alternative LED and high pressure sodium vapour lights offer a lower energy usage (for the same light output); and generally have a lower cost maintenance schedule compared to mercury vapour alternatives.
Improvements and introduction of these technologies underpins the growing trend in street light customers moving away from mercury vapour options.
Discussions with industry experts and previous analysis cited by Marsden Jacob have highlighted that the business case for non-mercury lights currently provides a pay back of less than 10 years (estimated to be 5-6 years in Victoria). Experts have suggested that by the end of 2017, the Victorian mercury vapour stock will have been reduced by 90 per cent due to local councils choosing to retire old mercury vapour lamps. Similarly, discussions with Energex pointed to these cost savings as the driver for change as far back as 1990 from HPMV to sodium vapour lights.79
Changes to Australian Standard’s 1158 Series for Category V installations (main or major roads) in 2010 which required that mercury vapour technology is not used in new Category V installations and further proposed changes to the energy efficiency design requirements for these installations which will effectively preclude use of mercury vapour lamps for Category V installations on energy efficiency grounds.
Although Australian Standard’s for Category V and Category P (residential streets and public open spaces) are voluntary, these are widely accepted and adhered to by industry.
Changes to Category V installations impacts higher wattage lights ( 250W, 400W, 700W and some 125W mercury vapour lamps) but would not impact lower wattage mercury vapours used residential streets . Traffic and roads authorities and transport departments tend to be responsible for the installation and upkeep of these light types as the article roads are considered State infrastructure. Number of mercury vapour installation for these users is already declining. Marsden Jacob estimates that these lights represent only 8 per cent of the total number of mercury vapour lights installed in Australia. The relatively small current numbers and the changes to the Standards are considered likely to influence the phase-out of these lights in the absence of ratification. As such, we assume 250W, 400W, and 700W mercury vapour lamps are not impacted by the ratification decision. (Note: numbers of these lights have been included in the analysis to provide a complete picture, however the modelling phases the number of these lights down to zero under both the base case and the phase-down scenarios at the same rate – hence the net influence on the CBA is zero).
Under both the base case and the phase-down scenarios this phase out of mercury vapour streetlights for both minor and main roads is expected to continue. Main road lights (250W, 400W, and 700W lamps) are expected to be phased out at the same rate regardless of ratification, however, as outlined below, the replacement of minor, residential lights (50W, 80W and 125W lamps) by non-mercury alternatives is likely to be accelerated if Australia ratifies.
79 According to discussions with street lighting industry experts, business cases for replacement of mercury vapour street lights in Western Australia and Victoria; and discussions with Energex.
Department of the EnvironmentCosts and benefits of ratifying the Minamata Convention on Mercury
49

MARSDEN JACOB ASSOCIATES
Future supply of mercury vapour streetlights
Although a number of light types and fixtures are constructed from imported parts in Australia, there is no manufacture of mercury vapour globes in Australia. As such, Australia is dependent on imports for the supply of the mercury vapour globes for use in street light fixtures.
Mercury vapour globes used in Australian street lights are generally subject to a 3 to 4 year replacement cycle to ensure the brightness of lamps meet with Australian lighting standards. As such, the future availability of globes requires consideration under both the base case (non-ratification) and phase-down scenarios.
Ratification and continued supply by exporting countries
Ratification of the Convention by countries which currently manufacture and export this technology will impact Australia’s ability import this technology after 2020.
Discussions with street lighting suppliers in Australia indicated that the majority of mercury vapour lamps are now manufactured in India and China. While it is unknown whether India intends to ratify, Marsden Jacob were advised that China is considering ratification of the Convention. Should China choose to ratify the Convention, the supply of mercury vapour lamps to Australia may be restricted after 2020.
Changes in the global lighting market
Even if an exporting country chooses not to ratify the Convention, the global nature of the lighting market may cause individual manufacturers to suspend production of mercury vapour lights.
These changes are likely to be driven by demand side changes. Of note, mercury vapour streetlights are being phased-out in the US and EU markets:
The US has already ratified the Convention and has had domestic policies to phase out mercury vapour lamps since 1 January 200880.
Recent changes to Energy Related Products (ErP) legislation have banned mercury vapour lamps effective from April 2015. International street lighting provider, Sylvania, commented: “All EU-28 countries as well as Switzerland, Turkey and Norway are banning the sale of these lamps so specifies, contractors and end-users are legally obliged to change their lamps.”81
Based on this information, as well as domestic economic and changing regulatory environments impacting streetlights, Marsden Jacob has assumed that mercury vapour street lighting on residential roads (50W, 80W, and 125W lamps) will be:
phased out by 2030 (at the latest) under the base case (non-ratification) scenario, but that
phase out will be accelerated under the phase-down scenarios such that remaining mercury vapour streetlight numbers are negligible after 2023.
The lagged phased out time of 2023 (compared to restriction taking effect in 2020) for residential street lights is due to:
Street light owners replacing lamps at the end 3-4 year maintenance cycles; and
80 United States of America (2013) United States of America: Notification Under Article 4, Paragraph 2, p.3. Available at: http://www.mercuryconvention.org/Portals/11/documents/submissions/USA%20declaration_Art%204%20para%202.pdf
81 Havells Sylvania (2014) ‘Sylvania Relimina is the Answer to Merucry Replacement’, press release dated 1 April 2014. Accessed 12 April 2015. Available at: http://www.havells-sylvania.com/en_DK/press-centre/sylvania-relumina-is-the-answer-to-mercury-replacement
Department of the EnvironmentCosts and benefits of ratifying the Minamata Convention on Mercury
50

MARSDEN JACOB ASSOCIATES
Allowance for a small amount of stockpiling of lamps, such that bulk replacement of lamps and associated lamp fixtures (which generally have a 10 to 20 year life span) can be optimised where retrofit of non-mercury vapour globes is not possible.
Disposal of mercury vapour lights
The safe disposal of mercury vapours lights is indirectly covered by the Convention through the reference in Article 11 to the Basel Convention.
CFLs and LFLs available within Australia would not be captured under the Minamata Convention due to the low quantities of mercury present in these types of lights in Australia.
The Basel Convention does however recommend the separation of waste containing mercury from other wastes, when feasible, and recovery of the mercury from these sources. Further, technical guidelines for mercury under the Basel Convention require consideration of a number of items for design of collection programmes applicable to CFLs and LFLs – of which FluoroCycle is one example of an Australian program already targeting these lamps82.
FluoroCycle also covers mercury vapour lamps used for streetlights. This voluntary industry-led product stewardship program seeks to increase the national recycling rate of wastes mercury-containing lamps to help reduce the amount of mercury being sent to landfill. Companies that are signatories to the scheme make a commitment to recycle all their waste mercury-containing lamps.
FluoroCycle has 230 signatories including commercial users, building and facilities managers, government departments, recyclers and others involved in the recycling and re-use process.
Currently, Ausgrid, SA Power Networks, CitiPower/Powercor, Endeavour Energy and Essential Energy are all signatories to the scheme and have committed to recycle all their waste street lighting.
Mercury streetlights active in these distribution networks are estimated to account for approximately 25 per cent of all Australian streetlights.
From discussions with FluoroCycle, Marsden Jacob understands a number of other Australian distribution businesses, responsible for the maintenance of street lights (and therefore the disposal of waste mercury vapour lamps) are also considering becoming signatories to the scheme and may already recycle streetlight waste. However, a significant proportion of Australia’s street lights continue to be disposed to land fill.
Each mercury vapour lamp can contain up to 200 milligrams of mercury - more than ten times the amount found in a fluorescent light in a typical office building. 83 As FluoroCycle states:
“It is the accumulation of mercury in landfill across Australia that is a cause for concern across the wider environment. .... Mercury in landfill converts to the toxic methylmercury and spreads through the wider environment through air, water and soil.”84
The following table outlines the number of mercury vapour street lights estimated to be currently in service throughout Australia by wattage. It shows that the vast proportion of HPMV lights are 80W (65 per cent). These lights are predominately installed in NSW and Victoria which are estimated to
82 Basel Convention, Technical guidelines for the environmental sound management of wastes consisting of elemental mercury and wastes containing or contaminated with mercury, available at: http://www.basel.int/Implementation/MercuryWastes/TechnicalGuidelines/tabid/2380/Default.aspx
83 Hon Amanda Rishworth MP (2013) ‘Industry recognised for fluror-light recycling’ media release dated 14 June 2013. Refer to: http://www.fluorocycle.org.au/pdf/media/Media%20Release%20-%20Industry%20recognised%20for%20fluoro-light%20recycling%20-%2014%20June%202013.pdf
84 FluroCycle webpage (undated) ‘Why should we recycle our waste lighting?’ Accessed 14 April 2015. Refer to: http://www.fluorocycle.org.au/why-recycle.php
Department of the EnvironmentCosts and benefits of ratifying the Minamata Convention on Mercury
51

MARSDEN JACOB ASSOCIATES
have 187,000 and 151,000 of these lights installed respectively; the second highest number of lights (by wattage) is 50W and these light types are predominately installed in Queensland.
Table 13: Mercury vapour street light stocks (in 2015)
Type of light Number of HPMV street lights Proportion Treatment in CBA
50W MV 258,414 25% Assumed phase out by 2030 under base case
and 2023* under ratification.
80W MV 666,087 65%
125W MV 19,734 2%
250W MV 48,735 5%Phase out not impacted
by ratification.400W MV 18,800 2%
Other 13,810 1%
Total 1,393,080 100%
Source: Marsden Jacob analysis of AER regulatory proposals, estimates provided by distribution businesses, and Marsden Jacob estimates
*2023 phase-out date includes a lagged response to restrictions taking effect in 2020 to account for optimised replacement cycles and stockpiling of globes to manage this optimisation.
As the Basel Convention (and consequently the Minamata Convention) does not provide for any specific measures to be undertaken in relation to disposal of waste mercury-containing lamps, our analysis has not included the quantification avoided mercury waste to landfill.
However, data contained in this section may be informative for other programs and initiatives with similar goals to the Minamata Convention.
5.4.3 Base caseUnder the base case, where Australia does not ratify the Convention:
The phase-out of mercury vapour streetlights will continue.
The globe supply of mercury vapour lamps for import to Australia will be reduced after 2020 and these products will not be available post-203085.
5.4.4 RatificationUnder the phase-down scenarios, Australia will be required to restrict the import of HPMV lamps after 2020. The effect of this restriction would be to bring forward the current phase-out of mercury vapour street lights on residential streets which account for the majority of street lighting in Australia.86
We estimate that the number of active HPMV lamps in Australia after 2023 will be negligible. High wattage mercury vapour lights on main roads (350W, 400W, and 700W lamps) would be phased out by 2020 under both the base case and the phase-down scenarios as a result of changed Australian Standards for Category V roads and consistent with current trends.
85 The latest phase-out date should exporting countries seek the maximum two five year exemption periods for phase-out of HPMV lamps.
86 Victoria is the exception where Councils have been proactive to replacing this technology with more energy efficient alternatives, such that industry experts estimate that 90% of the Victoria HPMV stock will have already been replaced by 2020.
Department of the EnvironmentCosts and benefits of ratifying the Minamata Convention on Mercury
52

MARSDEN JACOB ASSOCIATES
Current phase out of residential street lights (50W, 80W and 125W lamps) will be phased out by 2030 under the base case – consistent with current trends and economics. Phase out will be accelerated under the phase-down scenarios as industry responds to forthcoming 2020 restrictions by proactively replacing lamps. The lagged phased out time of 2023 (compared to restriction taking effect in 2020) results from optimisation of maintenance and replacement cycles and stockpiling of globes to cater for this.
Figure 8 shows the phase out of HPMV lamps under the base case and phase-down scenarios for Australia. Note that Marsden Jacob’s analysis assumes that lamps with wattage levels above 250 watts would be phased out by 2020 regardless of the scenario due to expected updates to Australian Standards for main roads.
As such, the difference between the base case and phase-down scenarios is limited to varied phase-out rates for 50W, 80W and 125W lamps across Australia.
Figure 7: Estimated phase-out of HPMV lamps under base case and phase-down scenarios
Source: Ironbark Sustainability (2011), Marsden Jacob analysis of AER regulatory proposals and Marsden Jacob estimates
Note: The ‘kink’ in the phase out curves at 2020 results from the phase-out of higher wattage lamps occurring under both the base case and phase-down scenario by 2020. Under the cost benefit analysis the phase out of these lamps nets to zero, however these lamps have been included in graphs and analysis for completeness purposes.
Assuming that disposal of street lamps by energy distribution businesses aligns with current waste disposal regulations and is not captured by the Convention, no substantial benefits would result from the reduction in mercury due to the early replacement of these lights.
However, early replacement under the phase-down scenarios would bring forward:
capital investment (replacing the lights earlier);
energy efficiency benefits (and cost savings); and
greenhouse gas savings.
Department of the EnvironmentCosts and benefits of ratifying the Minamata Convention on Mercury
53

MARSDEN JACOB ASSOCIATES
Marsden Jacob understands from industry experts that the hardware for alternative technologies is comparability priced (allowing for differing maintenance schedules) to mercury vapour equivalents over the life of the technology but are more energy efficient.
For the purpose of our analysis, we have estimated energy efficiency and greenhouse gas emission savings based on the following substitutions: 87
Table 14: Mercury vapour and equivalent non-mercury technology used in analysis
Mercury vapour lamp Alternative non-mercury substituteEnergy saving (%)Lamp type AEMO Wattage
(W)*Lamp type AEMO Wattage
(W)*
50W MV 64.3 CFL 32W 36.6 43.1%
80W MV 95.1 CFL 42W 60.3 36.6%
125W MV 141.4 70W MH 82.6 41.6%
250W MV 270.7 150W Std HPS 172.1 36.4%
400W MV 430.2 250W Std HPS 273.0 36.5%
700W MV 737.8 400W Std HPS 440.0 40.4%
Source: Marsden Jacob analysis and AEMO Unmetered load tables CFL= Compact Florescent Lamp; MH = Metal Halide; Std HPS = Standard High Pressure Sodium*Average for NEM jurisdictions
Bringing forward capital investment
Under the phase-down scenarios the capital investment of replacing the lights will be brought forward by up to 7 years. Marsden Jacob’s analysis assumes the following nominal average costs per street light for installation and capital costs associated with switching from mercury vapour to alternative light technologies:
Best case outcome: $200 per lamp. The ‘best case’ outcome assumes that most lamps can be readily changed over without substantial changes to the surrounding light fixture such as lamp casing, brackets or pole fixtures.
Worst case outcome: $500 per lamp. This scenario captures the full cost of installing a non-mercury vapour lamp according to current distribution network service providers price lists.
Most likely outcome: $400 per lamp. The most likely outcome represents that most replacement of mercury vapour lamps would likely cost street light customers the standard full rate replacement cost, however there may be instances where retrofit of lamps only (with minimal changes to surrounding fixtures) would be possible.
Marsden Jacob notes that the actual cost of capital replacement of street lights would vary significantly from these estimates. This is because globe technology changes do not often occur in isolation. Rather upgrades to street light fixtures may coincide with undergrounding of power line projects, upgrades to existing power poles or independently of distribution network infrastructure decisions. For this reason, the estimates provided in this report should not be taken to represent the cost to any individual street light customer.
Under the most likely scenario, using a nominal average value of $400 per street light and a discount rate of 7 per cent, bringing forward capital investment increases the cost by a present value of $34.23
87 Marsden Jacob notes that multiple light technologies may replace mercury vapour lamps. This analysis has been completed for indicative purposes only and does not constitute recommended replacement options.
Department of the EnvironmentCosts and benefits of ratifying the Minamata Convention on Mercury
54

MARSDEN JACOB ASSOCIATES
million. This falls to $17.11 million (net present value) under the ‘best case’ outcome and increases to $47.06 million (net present value) under the ‘worst case’ outcome.
Energy consumption savings
Assuming streetlights across Australian are active for an average of 11 hours per day (average number of ‘dark hours’), and that the cost of supply for electricity to streetlights remains consistent with current tariff rates:
479,223 MW of electricity would be saved between 2016 and 2030; and these
energy savings are valued at $30. 86 million (net present value).
Greenhouse gas emissions
Marsden Jacob’s analysis on the value of emission reductions resultant from the early replacement of mercury vapour street lights with more efficient non-mercury alternatives could result in a greenhouse gas savings of approximately 382,000 tonnes (tCo2-e)88.
While value of emissions in Australian policy contexts is no longer certain, using a value of $13.95/tCO2-e gives a present value of $3.25 million. This represents Marsden Jacob’s most likely outcome.
A ‘high price’ and ‘low price’ outcome for greenhouse case emissions (aligning to ‘best case’ and ‘worst case’ scenarios) was also developed. These assume the carbon emissions are valued at:
$30/ tCO2-e (best case outcome) which values benefits due to carbon savings at $6.98 million (net present value);
$9.50/ tCO2-e (worst case outcome) which values carbon savings at $2.21 million (net present value).89
5.4.5 ConclusionRegardless of Australia’s decision to ratify, the phase out of mercury vapour lamps is currently underway and this is expected to continue.
Under both the base case and phase-down scenarios mercury vapour lamps on main roads are expected to be phased out by 2020. This is due to changes to the Australian Standard impacting Category V roads (main or major roads) and current phase out trends which mean these light currently only account for 8 per cent of mercury vapour lights in Australia. The current phase out rates and small number of these lamps mean that the decision to ratify the Minamata Convention would have, at best, a trivial impact on costs and benefits, hence these are assumed to be the same under the two scenarios.
For minor road street lights, we assume the current phase-out continues but is accelerated under the phase-down scenarios. Marsden Jacob estimates there are just under 950,000 50W, 80W, and 125W lamps currently installed in residential streets and public open spaces across Australia and that these represent 92 per cent of the mercury vapour street lighting stock.
88 Marsden Jacob’s analysis made use of standard greenhouse gas emission conversion rates averaged for Australia and the kW energy consumption values predicted in our analysis.
89 Values of CO2e were based on ‘low price’ scenario: use $9.50/t CO2-e to reflect a value of carbon represented by international carbon units and the RET Review modelling. ‘Central price’ is based on the average Emissions Reduction Fund 1st auction price paid of $13.95/t CO2-e. ‘High price’ scenario uses $30/t CO2-e based on the central price series from modelling done by Treasury for the Climate Change Authority’s Targets and Progress Review and the medium term traded carbon price.
Department of the EnvironmentCosts and benefits of ratifying the Minamata Convention on Mercury
55

MARSDEN JACOB ASSOCIATES
Under the base case, these lamps are expected to be phased out by 2030 at the latest due the changing economics of alternative substitutes, and other countries’ decisions to ratify the Convention which would restrict Australia’s ability to import lamps.
Under the phase-down scenarios, the phase-out of these lamps will be accelerated as street light customers proactively replace lamps in anticipation of the 2020 restriction date. The number of remaining lamps would be insignificant beyond 2023. The lagged phase-out date accounts for the optimisation of replacement with existing maintenance cycles and a small amount of stockpiling of globes to cater for this optimisation.
Assuming maintenance cycles are broadly similar across the alternative non-mercury lamps installed90, the accelerated phase-out will deliver a net cost of $18.47 million.
Should Australia ratify, local councils and main roads authorities will have to initiate early replacement of an estimated 440,600 HPMV lamps sooner than they would otherwise have done Bringing forward the replacement of these lamps by between 1 and 7 years entails a cost to bring forward capital expenditure valued at $52.58 million, however this cost is be partly offset by energy savings of $30.87 million and carbon emissions reductions valued at $3.25 million.
5.5 Waste and recycling sector Article 11 “Mercury wastes” requires Parties to the Convention to take a number of measures with regards to mercury waste management and recycling.
Under paragraph 3(a) of Article 11, Parties are required to take appropriate measures so that mercury waste is managed in a sound manner, taking into account guidelines developed under the Basel Convention (to which Australia is already a Party).
Australia’s compliance with the Basel Convention means that any incremental impacts arising from Australia’s ratification of the Minamata Convention are likely to be minimal.
From discussions with various stakeholders it appears likely that the Convention will drive an increase in some mercury containing wastes – such as the additional flue gases that will be required to be captured in fabric filters while decreasing mercury emissions.
Importantly the costs for disposal of mercury wastes – are captured under the costs for each of the source areas and so are not considered again here.
5.6 Oil and gas production5.6.1 Obligations under the ConventionWhile oil and gas production is not specifically mentioned in the Convention, it is potentially impacted by Article 9 – Releases which focuses on land and water releases of mercury for “significant anthropogenic point sources”.
If Australia were to ratify, the key impacts arising under Article 9 are:
Australia may develop a national plan (within 4 years) outlining control measures that will be implemented;
90 Marsden Jacob notes that there is some evidence to suggest that maintenance cycles are less frequent for alternative lamp technologies, however the failure rates particularly towards the end of the lights life as less well tested by the current market.
Department of the EnvironmentCosts and benefits of ratifying the Minamata Convention on Mercury
56

MARSDEN JACOB ASSOCIATES
controls would need to be introduced on significant anthropogenic point sources (Note: no timeframe is specified) and the simplest control measure would be the implementation of release limit values91 - importantly this covers both new and existing sources; and
Australia would also need to identify the relevant point source categories (within 3 years) and maintain an inventory of releases from relevant sources (within 5 years).
While Article 9 includes provisions for adopting guidance on Best Available Techniques and Best Environmental Practice these are not yet developed and the timing is uncertain – so they are not included in the Cost Benefit Analysis.92 Article 9 also does not stipulate that new sources must comply with Best Available Techniques and Best Environmental Practice guidance.
Following discussions with the Department of the Environment it was assumed that existing sources would need to be managed within 10 years.
5.6.2 Mercury in petroleum and gas reserves Mercury levels vary from one reserve to another.
Some examples of quoted measures of mercury are:
200-250 parts per billion of mercury for a particular reserve in Bass Strait93; and
Measurements taken from a Browse exploration well indicate that reservoir fluids may contain mercury, with concentrations expected to range between 38 and 83 μg/Sm3 [microgram of mercury per standard cubic meter] in the gas stream and between 35 and 41 μg/Sm3 in the condensate stream.94
Current legislative arrangements (Commonwealth legislation)
In Commonwealth waters95 and state waters where the State has conferred functions and powers on NOPSEMA96, mercury is managed through Environmental Plans required under the Offshore Petroleum and Greenhouse Gas Storage (Environment) Regulations 2009.
The legislation is objective based and so does not include specific release limit values. However, regulation 10A specifies the Criteria for acceptance of environment plan.
Individual Environmental Plans may set release limit values for that project – which (following discussions with the Department of the Environment) would appear to fall within the definition of Article 9 Paragraph 5.
The legislation sets a requirement that all risks are managed to be “As Low As Reasonably Practicable” (ALARP).
91 Other potential measures (specified under Article 9 Paragraph 5) are (b) The use of best available techniques and best environmental practices to control releases from relevant sources;(c) A multi-pollutant control strategy that would deliver co-benefits for control of mercury releases;(d) Alternative measures to reduce releases from relevant sources.
92 Its also worth noting that if Australia ratifies then the Government would get to have input on the Best Available Techniques and Best Environmental Practice guidance.
93 http://www.exxonmobil.com.au/Australia-English/PA/Files/publications_mercury.pdf94 (Browse FLNG Development Draft Environmental Impact Statement EP BC 2013/7079, November 2014 Page 55)
http://www.woodside.com.au/Our-Business/Browse/Pages/Draft-Environmental-Impact-Statement.aspx95 between 3 to 200 nautical miles from the coast96 http://www.industry.gov.au/resource/UpstreamPetroleum/OffshorePetroleumExplorationinAustralia/Documents/
AustralianPetroleumNews.pdf Department of the EnvironmentCosts and benefits of ratifying the Minamata Convention on Mercury
57
MARSDEN JACOB ASSOCIATES
5.6.3 Potential points of mercury releases in oil and gas productionFive potential releases of mercury were identified in conversations with industry and NOPSEMA (drill cuttings, produced water, mercury in the petroleum and gas streams, air emissions of mercury and disposal of mercury). These are summarised in turn below.
Drill cuttings
Drilling mud sometimes includes barite, which is added for its high specific gravity.97 Barite can include low levels of mercury and while there is no quality specification for barite it appears that mercury levels of less than 1 part per million98.
Produced Water
Formation water (water released from the geological formations) and condensed water (collected from the gaseous phase of the petroleum and natural gas) are collectively referred to as produced water.
Depending on the site (and the levels of mercury) - produced water can be treated and mercury removed – prior to disposal.
However, as mercury tends to be hydrophobic and, it tends to gravitate into the hydrocarbon reservoir itself, so the levels in produced formation water tend to be very low (e.g. order of magnitude lower than ANZECC release guidelines, even for bioaccumulation).
Mercury in the petroleum and gas streams
Mercury tends to bind to the gas phase of the natural gas and is removed before and/or during the LNG process trains.
Depending on the mercury content of the local geology, some plants use specific mercury removal units which capture the mercury onto an adsorbent material that is replaced periodically and disposed of as hazardous waste.
Air emissions of mercury
Air emissions of mercury from petroleum and gas facilities are not covered by the Convention as there is a specific list of industries covered by air emissions.
Disposal of mercury
Wastes containing mercury are already covered by the Basel Convention, and the Minamata Convention does not impose additional requirements on wastes.
97 Barite (BaSO4) is a mineral consisting of barium sulfate.98
Department of the EnvironmentCosts and benefits of ratifying the Minamata Convention on Mercury
58

MARSDEN JACOB ASSOCIATES
5.6.4 Conclusions
Existing facilities
For existing facilities, controls would need to be introduced on significant anthropogenic point sources and the simplest control measure would be the implementation of release limit values. As noted above – while the timing is unclear it is assumed that this would need to occur within ten years of the Convention being introduced.
From discussions with industry it appears that most offshore facilities already have release limit values as part of their environmental plan – or commit to adherence to published levels such ANZECC Water Quality Guidelines.
New facilities
Article 9 also does not stipulate that new sources must comply guidance higher standard than existing sources.
It is noted that the legislation for covering petroleum activities in Commonwealth waters sets a requirement that all risks are managed to be “As Low As Reasonably Practicable” (ALARP) and some proponents appear to state that they have risks which are reduced to ALARP where they are using Best Available Technology.99
Accordingly it appears that the current legislative requirements (for at least off shore oil and gas) are likely to meet any future requirements (even though these are beyond the scope of the cost benefit analysis).
99 See Browse FLNG Development Draft Environmental Impact Statement EP BC 2013/7079, November 2014 Page 55Department of the EnvironmentCosts and benefits of ratifying the Minamata Convention on Mercury
59

MARSDEN JACOB ASSOCIATES
6. Health and environmental outcomes6.1 OverviewExposure to mercury poses a serious risk to the environment and human health worldwide. The World Health Organisation has suggested that mercury may have no threshold below which some adverse effects do not occur. It can cause a range of serious health impacts which can include cognitive impairment (mild mental retardation), permanent damage to the central nervous system, kidney and heart disease, infertility, and respiratory, digestive and immune problems. The World Health Organisation strongly advises that pregnant women, infants, and children in particular avoid exposure to excess mercury.100 Mitigating and resolving the problems caused by mercury can be costly, particularly in regard to remediation.
The most significant benefits that would arise from Australia’s ratification of the Minamata Convention would be improved environmental and health outcomes.
Identifying the benefits and linking these to action undertaken in Australia is complicated by the ability for mercury emissions to move globally through atmospheric and ocean processes.
In considering health and environmental benefits arising from ratification the following simplifying assumptions were used:
mercury that is likely to be disposed of through hazardous waste or recycling processes is unlikely to enter the environment;
all mercury emissions were considered equally toxic irrespective of medium (air, land or water) and the form of mercury (elemental mercury and mercury compounds); and
the analysis focuses only on Australian emissions impacted by the Convention and the resulting benefit to the Australian population and environment.
6.2 Approach In assessing the benefits Marsden Jacob considered the benefits arising from:
improved environmental conditions;
improved health across the Australian population; and
reduced incidence of workplace accidents involving mercury exposure.
These benefits are considered in turn below. However, due to the lack of firm data the improved environmental conditions are only considered qualitatively.
6.3 Environmental benefitsMercury is found naturally in small quantities throughout the environment in both the atmosphere and in aquatic and terrestrial ecosystems. However human-generated release of mercury into the environment can result in concentrations of mercury which are harmful to the environment.
In particular, mercury released into the air may settle into water bodies and affect water quality. Once mercury settles in water bodies, it is transferred to methylmercury (bioavailable mercury) through microbial activity.100 WHO 2013, ‘Mercury and Health’, Factsheet No361, http://www.who.int/mediacentre/factsheets/fs361/en/.
Department of the EnvironmentCosts and benefits of ratifying the Minamata Convention on Mercury
60
MARSDEN JACOB ASSOCIATES
Methylmercury may then accumulate in fish at levels that may harm the fish and the other animals that eat them. Birds and mammals that eat fish are more exposed to methylmercury than other animals in water ecosystems. Similarly, humans are impacted predominately from the consumption of fish containing high concentrations of methylmercury.
By extension, predators that eat fish-eating animals are also at risk due to increased mercury emissions in the environment.
The US Environmental Protection Agency states the effects of methylmercury exposure on wildlife as including mortality (death), reduced fertility, slower growth and development and abnormal behaviour that affects survival, depending on the level of exposure. In addition, research indicates that the endocrine system of fish, which plays an important role in fish development and reproduction, may be altered by the levels of methylmercury found in the environment.101
Tracing the impact of mercury emissions in the environment is challenging for a number of reasons:
Firstly, mercury accumulation in water bodies depends on mercury emitted from local, regional, national, and international sources.
Secondly, the amount of methylmercury in fish in different waterbodies is a function of a number of factors beyond the amount of mercury deposited from the atmosphere, including local non-air releases of mercury, naturally occurring mercury in soils, the physical, biological, and chemical properties of different waterbodies and the age, size and types of food the fish eats. As a result, fish from lakes with similar local sources of methylmercury can have significantly different methylmercury concentrations and the releases may have variable detrimental effects depending on the ability for the system to absorb the excess quantities.
In Australia, there is a paucity of data for environmental levels of mercury which prevents a quantitative analysis of the likely benefits arising from ratification of the Convention.
This section provides a summary of information collated for Australia which is relevant to the environmental impacts from mercury emissions in Australia, however the information does not contribute directly to the cost benefit analysis.
101 United States Environmental Protection Authority website, Environmental Effects: Fate and Transport and Ecological Effects of Mercury, accessed 13 April 2015. Available at: http://www.epa.gov/mercury/eco.htm
Department of the EnvironmentCosts and benefits of ratifying the Minamata Convention on Mercury
61

MARSDEN JACOB ASSOCIATES
6.3.1 Spatial distribution of mercury emissions and concentrationsA 2009 report by the CSIRO provides an overview of both mercury emissions and mercury levels across Australia102. Key findings from this work are displayed graphically in Figure 8. Hotspots can be identified around known point sources of mercury emissions such as Kalgoorlie in Western Australia and the Latrobe Valley in Victoria.
Figure 8: Mercury emission hot spots – highlighting the spatial distribution of anthropogenic mercury emissions
Source: National Pollutant Inventory, Unpublished 2015
6.3.2 Environmental levels of mercury in AustraliaThere is limited information about ambient mercury levels in Australia with many studies focussing on potential pollution sources. A recent study conducted in Albany, Western Australia by Goetze and Mackey has analysed mercury levels in sediments103. The data is shown in Table 15. Only one sample exceeded the high trigger level in the ANZECC guidelines for mercury in sediments. The high and low trigger levels are 1 mg/kg and 0.15 mg/kg respectively.102 Cope, M. E., Hibberd, M. F., Lee, S., Malfroy, H. R., McGregor, J. R., Meyer, C. P., Morrison, A. L., Nelson, P. F.
(2009). The Transportation and Fate of Mercury in Australia: Atmospheric Transport Modelling and Dispersion . Appendix 1 to Report RFT 100/0607 to Department of Environment, Water, Heritage & the Arts, The Centre for Australian Weather and Climate Research, 60 pp
103 Goetze R & Mackey P. (2011) Selenium and mercury concentrations in the sediments and pilchards (Sardinops sagax) of King George Sound and the broader Albany waters, Albany Port Authority, 2011
Department of the EnvironmentCosts and benefits of ratifying the Minamata Convention on Mercury
62

MARSDEN JACOB ASSOCIATES
Table 15: Mercury Concentration in Sediment of Albany, WA
Sample location Date of sample
Sediment concentrationmg/kg Dry Weight
Total Bioavailable
King George Sound April 2011 <0.2 <0.2
King River mouth April 2011 0.7 <0.2
Kalgan River mouth April 2011 0.58 <0.2
Princess Royal Harbour April 2011 0.23 <0.2
Wellstead Estuary April 2011 3.6* <0.2
Shannon River April 2011 <0.2 <0.2Note: *Exceeds the ANZECC Guideline high trigger value 1 mg/kg
Goetze and Mackey, 2011
A second study conducted in Port Curtis in Queensland104 found mean concentrations of mercury of 0.01 mg/kg in sediments with the maximum value of 0.055 mg/kg.
A further study conducted in Port Curtis, found mean mercury levels in sediments of 0.02 mg/kg with the 95th percentile level of 0.2 mg/kg. The 95th percentile concentration exceeded the low trigger level in the ANZECC guidelines.105
6.3.3 Mercury levels in fishA number of studies have investigated the levels of mercury in fish in Australia. The following table summarises the publicly available data (Table 2). As shown in Table 2 a number of fish species have been found to have mercury exceeding the Food Standard Australia and New Guidelines for mercury in fish.106
104 Jones MA, Stauber J, Apte S, Simpson S, Vicente-Beckett V, Johnson R, Duivenvoorden L (2011) A risk assessment approach to contaminants in Port Curtis, Queensland, Australia Mar Pollut Bull. 2005;51(1-4):448-58. Epub 2004 November 2011
105 Port Curtis Integrated Monitoring Program (2012) Port Curtis Ecosystem Health Report 2008-2010. Available at www.pcimp.com.au
106 Food Standards Australia New Zealand (2004) Mercury in fish – Background to the mercury in fish advisory statement, March 2004. Available at: http://www.foodstandards.gov.au/publications/Pages/Mercury-in-fish---background-to-the-mercury-in-fish-advisory-statement.aspx
Department of the EnvironmentCosts and benefits of ratifying the Minamata Convention on Mercury
63
MARSDEN JACOB ASSOCIATES
Table 16: Mercury Concentrations in Fish in Australia
Sample location Date of sample Fish species
Concentrationµg/g wet weight
Gippsland LakesSource (Fabris, G., Theodoropoulos, T., Sheehan, A. and Abbott, B.(1999))
Lake Wellington 1997 Black Bream - Acanthopagrus butcheri 0.35
Blonde Bay 1997 Black Bream - Acanthopagrus butcheri 0.17
Spoon Bay 1997 Black Bream - Acanthopagrus butcheri 0.24
Masons Bay 1997 Black Bream - Acanthopagrus butcheri 0.22
Lake Victoria 1997 Black Bream - Acanthopagrus butcheri 0.24
Point King 1997 Black Bream - Acanthopagrus butcheri 0.18
Tambo 1997 Black Bream - Acanthopagrus butcheri 0.22
Swan Bay 1997 Black Bream - Acanthopagrus butcheri 0.2
Flanagan Island 1997 Black Bream - Acanthopagrus butcheri 0.18
Jones Bay 1997 Black Bream - Acanthopagrus butcheri 0.16
Mean 1997 Gippsland Lakes 1997 Black Bream - Acanthopagrus butcheri
0.220.18107
Mean 1978-79 Gippsland Lakes 1978-79 Black Bream - Acanthopagrus butcheri 0.111
Source - Food Standards Australia New Zealand (2005)
Wildcaught (Australia) 2003/04 Abalone 0.0005
Eel 0.211
Lobster 0.048
Mackerel 0.072
Prawn 0.040
Scallop 0.005
Pink Snapper 0.190
Coral Trout 0.126
Tuna 0.343
Whiting 0.023
Aquaculture (Australia) 2003/04 Barramundi 0.022
Marron 0.040
Red Claw 0.010
Yabby 0.060
Eel 0.055
Kingfish (Yellowtail) 0.040
107
Department of the EnvironmentCosts and benefits of ratifying the Minamata Convention on Mercury
64

MARSDEN JACOB ASSOCIATES
Source - Food Standards Australia New Zealand (2011)
Unknown Unknown Prawns 0.014108
Fish portions, frozen 0.0402
Fish fillets battered 0.122
Tuna, canned in brine 0.0292
Prawns 0.012109
Fish portions, frozen 0.0193
Fish fillets battered 0.0153
Tuna, canned in brine 0.0084 3
Source - NSW Health Department (2001)
NSW 1997-98 Shark0.48110
2.3111
Swordfish0.984
1.655
Marlin0.574
0.955
Fin fish (generally) 0.154
Source - Goetze R. and Mackey P. (2011)
Albany 2011 Pilchard (Sardinops sagax) 0.0424
Bremer Bay 2011 Pilchard (Sardinops sagax) 0.0524
Esperance 2011 Pilchard (Sardinops sagax) 0.0584
Notes: 1. Exceeds ANZFA standard= 0.5 µg/g2. Exceeds Standard A 12 1mg/kg (NSW Health Department (2001))3. Exceeds FSANZ 2004 (upper) = 1.0mg/kg4. Exceeds FSANZ, 2004 (lower) = 0.5mg/kg5. Exceeds FSANZ 2004 (crustacean/mollusc)= 0.5mg/kg
6.3.4 Great Barrier ReefGiven the high environmental values of the Great Barrier Reef and the presence of industries with potential mercury emissions (sugarcane, aluminium at Gladstone, and coal-fired generation), we specifically considered whether mercury levels could be attributed to environmental damage.
Water quality issues and objectives
The 2013 Reef Water Quality Protection Plan identified the key pollutants in the region as:
108
109
110
111
Department of the EnvironmentCosts and benefits of ratifying the Minamata Convention on Mercury
65

MARSDEN JACOB ASSOCIATES
“Sediment, nutrients and pesticides leaving agricultural land and draining into the reef lagoon remain the largest contributors to elevated pollutant levels.” 112
A breakdown of the key pollutants for each region of the Great Barrier Reef is set out in Figure 9. The matrix shows that pesticides pose a very high risk in the Burdekin and Mackay Whitsunday Regions.
Figure 9: Priority pollutants for each region of the Great Barrier Reef
Great Barrier Reef sediment cores have identified mercury concentrations of up to 100µg kg-1, an order of magnitude higher than background concentrations. These concentrations were attributed to the contemporary application of mercury-based pesticides on sugarcane farms.113
According to recent research, coral reefs are under threat from land-based pollutants, with the vulnerability of the early life stages of coral being a particular concern. This research found that the pesticide with the active ingredient of methoxyethylmeruric chloride (the mercury-containing pesticide used on sugarcane in Australia) is extremely toxic to corals at barely detectable concentrations, affecting coral fertilisation and metamorphosis, and causing coral bleaching and host tissue death.114 Mass spawning on the Great Barrier Reef generally occurs during November and December each year, often coinciding with the first rains of the wet season in tropical North Queensland potentially increasing the risk of contamination from agricultural runoff. The use of methoxyethylmeruric chloride is banned in many countries due to its adverse effects on the environment.115
6.3.5 Valuing impacts on ecosystem servicesMarsden Jacob did consider whether environmental benefits of ratification could be assessed using a valuation methodology such as ecosystem services. In particular “provisioning services” (valuing services provided by the environment such as food and fresh water) appear to be directly affected by mercury and can potentially be valued.
112 Reef Water Quality Protection Plan 2013 www.reefplan.qld.gov.au/resources/assets/reef-plan-2013.pdf accessed 7 April 2015, Page 5,
113 GBRMPA, Water Quality Guidelines for the Great Barrier Reef Marine Park: Revised Edition 2010, p. 74114 Negri, A et al. 2007, ‘Insecticides and a fungicide affect multiple coral life stages’, Marine Ecology Progress Series,
vol.330, pp.127-137.115 Bhuiyan, S.A; Croft, B.J & Tucker, G.R 2014, ‘Efficacy of the fungicide flutriafol for the control of pineapple sett rot
of sugarcane in Australia’, Australasian Plant Pathology, vol. 43, p. 418.Department of the EnvironmentCosts and benefits of ratifying the Minamata Convention on Mercury
66

MARSDEN JACOB ASSOCIATES
Review of previous studies
Marsden Jacob undertook a literature review to identify previous studies that have estimated the value of ecosystem impacts from mercury emissions or the benefit that would arise from reduced ecosystem impacts if mercury were phased down.
A limited number of values relating to environmental damage or ecosystem services were identified.
The United Nations Environment Programme reported that in 2008 the global environmental external costs due to human activity included … USD 22 billion due to mercury emissions.116
It appears that this valuation117 includes both the health effect on humans and the impact on the environment and therefore should not be considered separately from health benefits (discussed in section 6.4 of this report).
The development of the Minamata Convention has prompted a number of studies on Mercury contamination at both an international level118 and a jurisdiction level119. It is instructive to note that none of these reports value the ecosystem damage attributable to mercury or the benefits that would arise from a phase-down of Mercury.
The literature review did identify some studies that valued the costs of fishing advisory notices on recreational and commercial fishing (as a result of high mercury levels)120.
Estimating values for Australia
As fish and other seafood are a key source of food and are a segment of the ecosystem where mercury is known to bio-magnify (increase through the food chain) the potential for valuation was considered.
However, valuation was not pursued further for two reasons. Firstly, there is a lack of literature on agreed methodologies for valuing environmental damage arising from mercury emissions. Secondly there is a lack of data linking mercury emissions in Australia to resultant levels of mercury in fish or resultant impacts on key environmental assets such as the Great Barrier Reef.
Finally the potential impact on Australia’s fisheries was considered. However, Australia currently has limited guidance on the consumption of seafood, which is reviewed as required121. Importantly Australia doesn’t have a history of closing fisheries due to mercury contamination. As such the likely benefit of reduced mercury in fish would be relatively small with the most likely impacts arising from pregnant women and infants no longer being warned on potential health effects.
In conclusion, it appears likely that reduced mercury emissions and releases to land or water would result in environmental benefits including to key environmental assets such as the Great Barrier Reef. However, these benefits are not readily valued and so are noted qualitatively in the cost benefit analysis.
116 United Nations Environment Program, Costs of Inaction on the Sound Management of Chemicals, 2013117 While this global value ($22 Billion) is reported, the supporting calculation was not identified. 118 For example: UNEP, Global Mercury Assessment, 2013 - Sources, Emissions, Releases and Environmental Transport119 See ICF International (2014) Study on EU Implementation of the Minamata Convention on Mercury Draft Final Report
(revised), 30 June 2014120 Jakus P, McGuinness M, and Krupnick A (2002) The Benefits and Costs of Fish Consumption Advisories for Mercury,
October 2002 http://ageconsearch.umn.edu/bitstream/10853/1/dp020055.pdf 121
Department of the EnvironmentCosts and benefits of ratifying the Minamata Convention on Mercury
67

MARSDEN JACOB ASSOCIATES
6.4 Health benefits of phasing-down mercury6.4.1 Health effects of mercuryHuman exposure to methylmercury occurs primarily through ingestion of seafood and freshwater fish.
Mercury exposure has been associated with a range of health effects including neurological effects, effects on the kidneys and cardiovascular effects.122
Although other health outcomes have been associated with exposure to mercury, loss of IQ123 is the most robust and is believed to have the most reliable dose response relationships. As the critical effect of mercury is considered to be developmental, brain toxicity methyl mercury intake by pregnant women is of primary concern.124
The following sections detail available research on mercury exposures and loss of IQ. The subsequent section then summarises our treatment of these effect in the cost benefit analysis.
Evidence of effects on cognitive development
The most studied outcomes of mercury effects are cognitive development in children in particular loss of IQ and developmental effects. The effects of mercury on the developing brain are similar to those observed for lead exposure in terms of loss of IQ, impacts on motor activities and attention disorders the most commonly observed outcomes associated with biomarkers of mercury exposure such as blood and hair mercury. As such loss of IQ is commonly used as the basis of health risk assessments for mercury and associated cost benefit analyses.
Three longitudinal developmental studies were conducted in the Seychelles Islands, the Faroe Islands, and New Zealand.
The subjects of the Seychelles longitudinal prospective study were 779 mother-infant pairs from a fish-eating population125 . Infants were followed from birth to 5.5 years of age, and assessed at various ages on a number of standardized neuropsychological endpoints. The independent variable was maternal-hair mercury levels.
The Faroe Islands study was a longitudinal study of about 900 mother-infant pairs.126 The main independent variable was cord-blood mercury; maternal-hair mercury was also measured. At 7 years of age, children were tested on a variety of tasks designed to assess function in specific behavioural domains.
The New Zealand study was a prospective study in which 38 children of mothers with hair mercury levels during pregnancy greater than 6 ppm were matched with children whose mothers had lower hair
122 Agency Toxic Substances and Disease Registry, ATSDR (1999), Toxicological Profile for Mercury. Available at http://www.atsdr.cdc.gov/toxprofiles/tp46.pdf
USEPA (2011), Regulatory Impact Analysis for the Final Mercury and Air Toxics Standards, EPA-452/R-11-011 December 2011. Available at http://www.epa.gov/ttnecas1/regdata/RIAs/matsriafinal.pdf
123 Intelligence Quotient124 Shimshack JP, Ward MB (2010) Mercury advisories and household health tradeoffs. J Health Econ, 29:674–685125 Refer to: Myers et al., 1995a-c, 1997; Davidson et al., 1995, 1998126 Grandjean P, Weihe P, White RF, Debes F, Araki S, Yokoyama K, Murata K, Sørensen N, Dahl R, Jørgensen PJ:
(1997) Cognitive deficit in 7-year-old children with prenatal exposure to methylmercury. Neurotoxicol Teratol 19:417–428
Department of the EnvironmentCosts and benefits of ratifying the Minamata Convention on Mercury
68

MARSDEN JACOB ASSOCIATES
mercury levels.127. At 6 years of age, a total of 237 children were assessed on a number of neuropsychological endpoints similar to those used in the Seychelles study.
Health effects in previous cost benefit analysis
Several cost-benefit analyses have been conducted internationally to inform decisions in relation to actions to reduce mercury levels:
United States Environmental Protection Agency (USEPA) (2011) Regulatory Impact Analysis for the Final Mercury and Air Toxics Standards, EPA-452/R-11-011 December 2011128 (the USEPA Study);
Trasande L, et. al. (2006), Applying cost analyses to drive policy that protects children: mercury as a case study. Ann N Y Acad Sci., 1076:911-23 (the Transande Study);
Bellanger M., et al (2013), Economic benefits of methylmercury exposure control in Europe: Monetary value of neurotoxicity prevention, Environmental Health 2013, 12:3; and
Pichery, C., Bellanger, M, et. al (2012), Economic evaluation of health consequences of prenatal methylmercury exposure in France, Environmental Health 2012, 11:53.
In all these analyses the health outcome used as the basis of the health risk assessment is loss of IQ in children.
All the health risk assessments have used dose-response relationships that relate loss of IQ in children with maternal blood or hair mercury levels or cord blood mercury levels, however the dose response relationship varies between the studies
The dose response relationship used by the USEPA study (2011) has been derived using data from Faroe Islands, Seychelle Islands and New Zealand cohort studies. The resulting response relationship is a loss of 0.18 IQ points/ppm maternal hair mercury per child.
What this means is that for each child there is a loss of IQ points associated with a 1ppm increase in mercury levels in their mother’s hair. It is assumed that no adverse effects are observed at maternal blood levels below 3.5 µg/L.
The Trasande study (2006) derived dose response relationships from only the Faroe Islands and Seychelle Island studies and consequently obtained dose response relationships higher than those derived by the USEPA. The dose-response relationship used in the Trasande study suggests a loss of 0.465 IQ points/ppm maternal hair mercury and 0.093 IQ points/ppb of mercury in cord blood. These values are higher than those used by the USEPA study (2011).
For the purpose of this CBA both sets of dose response relationships have been used. The USEPA study (2011) estimates have been used as the core analysis with the Trasande (2006) values used in a sensitivity analysis to give a higher bound of the potential impact.
127 Kjellstrom, T; Kennedy, P; Wallis, S; et al. (1986) Physical and mental development of children with prenatal exposure to mercury from fish. Stage 1: Preliminary test at age 4. Natl Swed Environ Protec Bd, Rpt 3080 (Solna, Sweden); and
Kjellstrom, T; Kennedy, P; Wallis, S; et al. (1989) Physical and mental development of children with prenatal exposure to mercury from fish. Stage 2: Interviews and psychological tests at age 6. Natl Swed Environ Prot Bd, Rpt 3642 (Solna, Sweden)
128 Available at http://www.epa.gov/ttnecas1/regdata/RIAs/matsriafinal.pdf Department of the EnvironmentCosts and benefits of ratifying the Minamata Convention on Mercury
69

MARSDEN JACOB ASSOCIATES
Mercury levels in the Australian population
The only available Australian data on maternal blood mercury levels is from studies conducted in Perth and the south-west of Western Australia.129
This study found that mean maternal blood mercury levels were 0.83 µg/L with the highest value of 5.8 µg/L.
The USEPA has determined that the conversion of maternal blood mercury to maternal hair mercury is at a ratio of 1:250. Converting the maternal blood mercury levels in the Western Australian cohort to maternal hair mercury results in concentrations of 0.21ppm (mean) and 1.5ppm (max).
The Western Australian study found that 5% of women in the cohort had blood mercury levels above the no effects level of 3.5 µg/L. The source of mercury in blood was attributed to consumption of fish and seafood. These findings are consistent with other studies conducted overseas. The conclusion that all methyl mercury exposure is due to fish and seafood consumption is also consistent with the findings of the most recent Australian Total Diet Survey (ATDS).130
Assuming that the Western Australian results are applicable to the Australian population, the loss of IQ and associated economic costs associated with mercury in Australia can be estimated.
From Table 2 the mercury levels in fish from various locations in Australia are similar. The ATDS concludes that exposure to methyl mercury in Australia is due almost entirely to the eating of fish and shellfish, it appears that the extrapolation of the Western Australian blood and hair mercury levels to the whole Australian population is a reasonable assumption.
According the ABS 2011 Census data, in Australia there are 7,581,899 women of child bearing age (15-44 years). The current fertility rate is 1.93/1000 live births per year131. In 2013 this translated to 14,633 births.
Assuming that 5% of women of child bearing age, as found in the Western Australian study, have blood mercury levels above the no effects level of 3.5 µg/L, this translates to 732 children born in 2013 in Australia that may be affected by exposure to mercury.
Calculation of IQ losses in Australia
To calculate the loss of IQ related to maternal hair mercury the following equation has been applied:
Loss of IQ per child = Dose response relationship x maternal hair concentration
This is consistent with the approach used by the USEPA study.
Using this approach and applying the birth rates for Australia in 2013, the loss of IQ has been calculated for four scenarios based on the USEPA study dose relationship, and the Transande Study dose relationships for each of the mean and maximum hair mercury levels estimated from the Western Australian study:
1. USEPA dose response relationship (loss of 0.18 IQ points/ppm maternal hair mercury per child) and mean hair mercury levels (0.21ppm);
2. USEPA dose response relationship and maximum hair mercury levels (1.5ppm);
129 Hinwood, AL., Callan, A.C., Ramalingam, M., Boyce, M., Heyworth, J., McCafferty, P and Odland, J.O., (2013) Cadmium, lead and mercury exposure in non-smoking pregnant women . Environmental Research, October 2013, 126. 118-124.
130 Food Standards Australia New Zealand (2013) Mercury in Fish – Advice on Fish Consumption. FSANZ. Canberra.131 ABS, 2013
Department of the EnvironmentCosts and benefits of ratifying the Minamata Convention on Mercury
70

MARSDEN JACOB ASSOCIATES
3. Trasande dose response relationship (a loss of 0.465 IQ points/ppm maternal hair mercury) and mean hair mercury levels (0.21ppm); and
4. Trasande dose response relationship and maximum hair mercury levels (1.5ppm).
Assuming a linear dose relationship above maternal blood mercury levels of 3.5 µg/L, the results of the risk calculations for the estimated number of affected children in 2013 in Australia are shown in Table 17 for each these scenarios.
Essentially, the table outlines the current expected loss of IQ points for Australia given the current mercury levels in the population.
Table 17: Annual loss of IQ points in Australian population due to maternal mercury in hair
Scenario Loss of IQ points
1. USEPA dose response relationship and mean hair mercury levels 36
2. USEPA dose response relationship and maximum hair mercury levels 191
3. Trasande dose response relationship and mean hair mercury levels 92
4. Trasande dose response relationship and maximum hair mercury levels 494
Source: Toxikos analysis
6.4.2 Valuation of loss of IQValuation of the loss of IQ in children has been valued as part of previous analysis of the impacts of mercury and other heavy metals.
A previous review of literature undertaken by Spadaro and Rabl in 2008 identified five estimates ranging from US2005$4,500 to US2005$22,300 per IQ point and concluded that US2005$18,000 per IQ point was a suitable value (values in US$2005). 132Converting this to Australian dollars and escalating this value by CPI to obtain a 2016 value gives a total of AU2016$30,030 per IQ point lost. This value is for the United States and so cannot be applied to Australia without further consideration.
However, the range of values are worthy of further consideration. The values in the studies reviewed by Spadaro and Rabl when converted to Australian dollars and 2016 values range from $11,290 per IQ point (28% of the value used by Spadaro and Rabl) to $37,204 per IQ point (124% of the value used by Spadaro and Rabl).
132 Spadaro JV, Rabl A: Global health impacts and costs due to mercury emissions. Risk Analysis 2008, 28(3):603–613, p. 609 cites the following estimates:
Lutter (2000) indicates US$4,500 per IQ point;
Grosse et al. (2002) estimate US$14,500 per IQ point;
Muir and Zegarac (2001) estimate US$15,000 per IQ point;
Rice and Hammitt (2005) indicate US$16,500 per IQ point; and
Trasande et al. (2005) indicate US$22,300 per IQ point.Department of the EnvironmentCosts and benefits of ratifying the Minamata Convention on Mercury
71

MARSDEN JACOB ASSOCIATES
6.4.3 Estimation of the value of the harm caused by mercury Based on the value per IQ point lost and developing a Dose – Response formula, Spadaro and Rabl provided a 2008 estimate of the value of the harm caused by mercury of $4,380 US$ per kilogram of mercury released to the environment in the United States and a global estimate of $1,500 US$/kg – assuming a threshold above which mercury levels have an impact on the child’s IQ. 133
Table 18: Spadaro and Rabl’s estimate of harm caused per kg of mercury released into the environment
United States Global Average
US$/kg (2008)
With threshold $4,380 $1,500
Without threshold $9,993 $3,400
Source: Spadaro JV, Rabl A (2008): Global health impacts and costs due to mercury emissions. Risk Analysis, Vol.28, No. 3, 2008
Spadaro and Rabl also propose a formula for identifying the likely cost in other countries (referred to as benefit transfer).
The United States costs based on the IQ decrement is adjusted to other countries using the Gross Domestic Product (GDP) per capita expressed as Purchasing Power Parity (PPP) as a weighting factor. Where Ci is a damage cost in a specific country and CUSA is the damage cost in the United States.
Ci = CUSA
(GDPppp / capita)i
(GDPppp / capita)USA
Using this formula the value of mercury costs as it would apply in Australia is AU2016$4,862/kg as set out in Table 19.
Table 19: Australian estimate of harm caused per kg of mercury (benefit transfer)
Harm /kg mercury
USD$ (2008) AUD$ (2016)
With threshold $2,028 $4,862
Without threshold $4,598 $11,093
Source: Marsden Jacob analysis
Using the variation on estimates for IQ loss outlined in section 6.4.2 (28% to 124%) a low and high estimate of the harm caused per kilogram of mercury emitted was calculated for use in a sensitivity analysis. This produced a low value of $1,828 and a high value of $6,024.
133 Spadaro JV, Rabl A: Global health impacts and costs due to mercury emissions. Risk Analysis 2008, 28(3):603–613. www.arirabl.com/publications/spadarorabl-hg08-fig.pdf
Department of the EnvironmentCosts and benefits of ratifying the Minamata Convention on Mercury
72

MARSDEN JACOB ASSOCIATES
6.4.4 ConclusionHuman exposure to mercury occurs primarily through ingestion of seafood and freshwater fish containing methylmercury. Although anthropogenic emissions of mercury tend not to be bioavailable, all forms of mercury can be transformed to methylmercury through aquatic processes.
Although mercury exposure has been associated with a range of health effects including neurological effects, effects on the kidneys and cardiovascular effects, the loss of IQ on the population resultant from developmental brain toxicity methyl mercury intake by pregnant women is of primary concern as there is a direct impact on the developing foetus in utero.
Previous studies have developed a benefit transfer methodology which when applied to Australia estimates the likely impact of mercury emissions at $4,862 per kilogram of mercury.
6.4.5 Quantifying the reduction in the amount of mercury emitted
Base case
Under the base case scenario it is expected that mercury emissions would remain steady in the short term and would continue to increase in the future as mercury emitting sources are expanded and the construction of new sources is undertaken.
Ratification
Under the phase-down scenarios it is expected that there would be a step change in mercury emissions in the short term, while mercury emissions are likely to remain stable in the long term as new sources in the future would be subject to stringent controls. The expected mercury emissions are shown in Figure 10. It can be seen that the base case remains steady until 2030 when it has been identified that new sources could be developed.
Department of the EnvironmentCosts and benefits of ratifying the Minamata Convention on Mercury
73
MARSDEN JACOB ASSOCIATES
Figure 10: Expected mercury emissions under the base case and scenarios 2A, 2B and 2C
0
2,000
4,000
6,000
8,000
10,000
12,000
14,000
16,000
18,000
20,000
Estim
ated
Mer
cury
Em
issio
ns
Year
Basecase
2A
2B
2C
The total mass of mercury prevented from entering the environment is set out in Table 20 and the value of these savings is set out in Table 21.
For each of the scenarios (2A, 2B and 2C) a low and high estimate is provided based on the range of possible new facilities under article 8.
Department of the EnvironmentCosts and benefits of ratifying the Minamata Convention on Mercury
74

MARSDEN JACOB ASSOCIATES
Table 20: Total mass of mercury prevented from entering environment (kg/yr)
Year number 1 2 3 4 5 6-14 15 16 17 18 19 20
Year 2016 2017 2018 2019 2020 2021-2029 2030 2031 2032 2033 2034 2035
2A 0 0 0 0 0 5,280 5,280 5,280 5,280 5,280 5,280 5,280
2B 0 0 321 642 963 6,564 6,564 6,564 6,564 6,564 6,564 6,564
2C 0 0 5,601 5,922 6,243 6,564 6,564 6,564 6,564 6,564 6,564 6,564
Table 21: Total value of the mercury prevented from entering the environment ($ million)
Year number
1 2 3 4 5 6-14 15 16 17 18 19 20Present Value
2016 2017 2018 2019 2020 2021-2029 2030 2031 2032 2033 2034 2035
2A $0.00 $0.00 $0.00 $0.00 $0.00 $25.67 $25.67 $25.67 $25.67 $25.67 $25.67 $25.67 $166.71
2B $0.00 $0.00 $1.56 $3.12 $4.68 $31.92 $31.92 $31.92 $31.92 $31.92 $31.92 $31.92 $214.26
2C $0.00 $0.00 $27.23 $28.79 $30.36 $31.92 $31.92 $31.92 $31.92 $31.92 $31.92 $31.92 $273.11
Department of the EnvironmentCosts and benefits of ratifying the Minamata Convention on Mercury
75

6.5 Workplace safety benefits A final potential benefit of ratification is a reduction in acute mercury exposure – such as through a workplace accident.
Ratification of the Convention appears likely to reduce the exposure of some workers to mercury – such as ceasing the use of mercury-containing pesticide by canegrowers and reduced use of mercury vapour lamps. In contrast, there is potentially a small increase in the number of workers employed in mercury disposal and mercury recycling.
Workers compensation data
In considering the cost of mercury and mercury compounds in workplace injuries and illness Marsden Jacob sought data workers compensation data from the National Data Set for Compensation-Based Statistics. The National Data Set contains accepted workers’ compensation claims, which are derived from state, territory and Commonwealth workers’ compensation authorities.
Within the National Data Set incidents relating to mercury and mercury compounds can be identified as all incidents are classified using the Type of Occurrence Classification System (TOOCS). TOOCS uses four classifications to describe the type of injury or disease sustained by the worker and the way in which it was inflicted:
Nature of Injury/Disease;
Bodily Location of Injury/Disease;
Mechanism of Injury/Disease; and
Agency.
The agency (also referred to as the breakdown agency) identifies the object, substance or circumstance that was principally involved in, or most closely associated with, the point at which things started to go wrong and which ultimately led to the most serious injury or disease.
There is a category within agency for mercury and mercury compounds – which allows ready identification of these incidents.
Due to the low number of incidents, Safe Work Australia were not able to provide134 an annual breakdown of incidents of compensation paid.
However, over the period 2000-01 to 2011-12, the total number of accepted claims was 59 and the total compensation paid was $687,167. Over the 11 year period this equates to an average of 5.3 claims per year and average value of compensation paid as $57,264.
Estimating the total value of workplace injuries and illnesses
Reliable data on the total cost of workplace injuries and illnesses for Australia is not available for each year, or by category. However, reasonable estimates can be derived by comparing the annual value of WorkCover payments with the total estimated cost of injury and illness reported by Safe Work Australia in The cost of work-related injury and illness for Australian employers, workers, and the community, 2008–09.
134 Due to confidentiality concerns.Department of the EnvironmentCosts and benefits of ratifying the Minamata Convention on Mercury
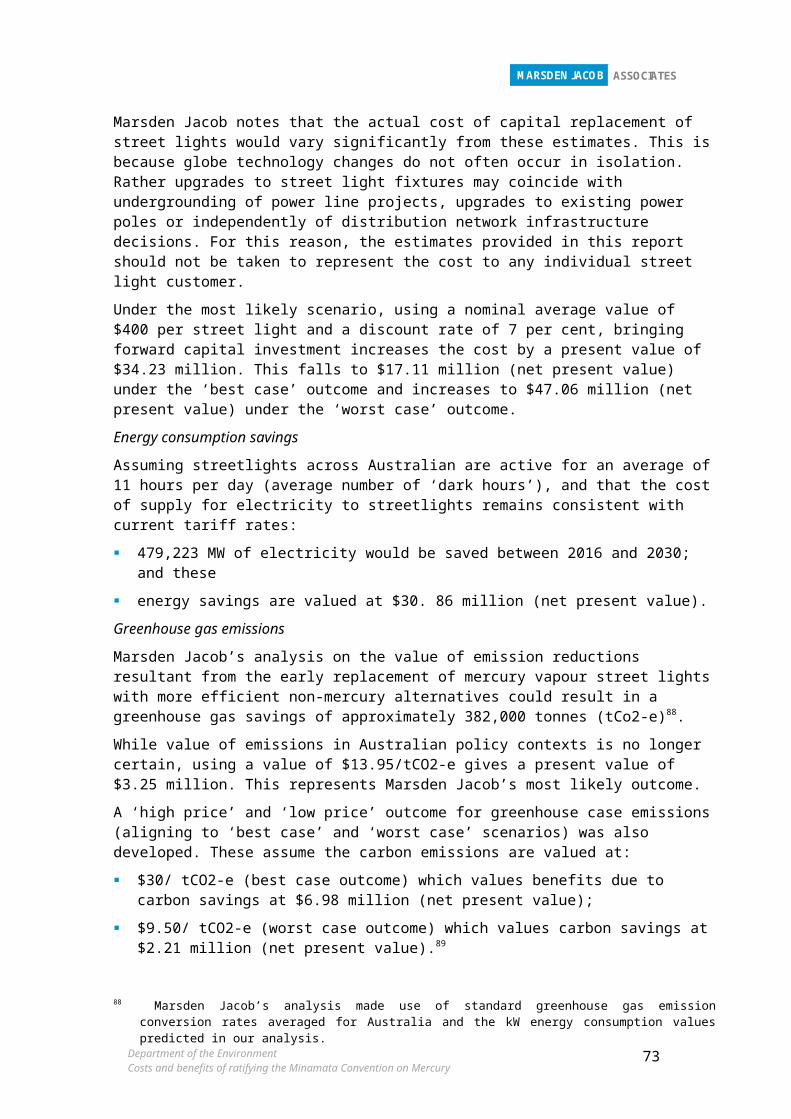
The cost of work-related injury and disease to workers, their employers and the community for the 2008–09 financial year data is estimated to be $60.6 billion. This can be compared to the estimated workers compensation premiums paid by employers ($6.5 billion in the 2008–09 financial year).135
This indicates that across all injuries on average the total cost of injury and illness is 10 times the compensation paid.
Using this multiplier the average total value of workplace injuries and illnesses relating to mercury and mercury compounds is $573,000.136
Estimating the impact ratifying the Convention on workplace injuries involving mercury
Given the opaque nature of the workers compensation data it is not possible to reliably determine the impact that ratifying the Convention would have on reducing workplace injuries and illnesses.
However, it appears likely that under the base case there will be some reduction in workplace incidents as imported mercury products are phased out.
It also appears reasonable that Australia choosing to ratify the Convention would reduce these incidents further – but the extent of this is not easily determined. For this reason Marsden Jacob modelled a 10% reduction, a 30% reduction and 60% reduction in workplace incidents attributable to ratifying the Convention. These scenarios and the resulting benefit are set out in Table 22.
The timing of the reduction of exposure will vary from one industry to another as the various articles take effect and as industry prepares for the implementation of each Article. For simplicity it was assumed that the benefit would commence in 2019.
Table 22: Reduction in incidence of work incidents involving mercury
Scenario % reduction in incidents Annual Benefit (commencing 2019)
Present Value (2019-2035)
7% discount rate
Low 10% $62,470 $497,865
Medium 30% $187,409 $1,493,595
High 60% $374,818 $2,987,189
135 Safework Australia, The cost of work-related injury and illness for Australian employers, workers, and the community, 2008–09. Page 28
136 This figure assumes that all compensation data is given in 2015 values.Department of the EnvironmentCosts and benefits of ratifying the Minamata Convention on Mercury

Appendix A: Details of the scenarios consideredScenario 1: Base caseUnder the base case Australia chooses not to phase-down mercury and does not ratify the Minamata Convention. While Australia is a signatory to the Convention this does not create any legal obligations if Australia does not ratify.
For clarity we assume the base case has the following characteristics:
no significant change in industry numbers would occur as a direct response to Australia not ratifying – that is, non-ratification will not lead to the development of new industries manufacturing mercury based products or otherwise mercury processing facilities re-locating to Australia.
existing plants would not change from their current processes or practices as a direct result of a non-ratification decision. (It is noted that some plants may already have plans to reduce mercury usage or emissions and these are captured in the Industry costs section (section5) in both the base case and phase-down scenarios).
For many industries the base case would represent minimal change from the current circumstances. However, the Convention coming into force and decisions by some key trading patterns in relation to ratification, would impact Australia’s ability to import mercury and mercury-added products in the future. The base case forms that basis for the identification of business as usual costs – which are used in the assessment of regulatory burden.
Under both the base case and the phase-down scenarios, some other government policies may impact on Mercury emissions. For example, a National Clean Air Agreement is currently being consulted on which could potentially impact on mercury emissions137. However, given the current status of this policy (consultation on a discussion paper) the impacts of this agreement have not been included in this cost benefit analysis.
Scenario 2: Phase-down of mercury Under this scenario, Australia will actively identify a number of measures to phase-down mercury, and as such, will be in a position to ratify the Minamata Convention. Marsden Jacob assumes that ratification will broadly align with the following timetable:
the Convention is ratified by the 50th country in late-2015 (eg. October 2015);
the Convention will enter into force in early-2016 and
the first Conference of the Parties would be held in either late-2016 or early 2017.
Marsden Jacob assumes that Australia would ratify the Convention ahead of the first Conference of the Parties. As the timing is uncertain, this scenario conservatively suggests ratification occurs prior to mid-2016. This timing would also allow preparation ahead of the first Conference of the Parties.
Once Australia becomes a Party to the Convention and the Convention comes into force, Australia will be legally bound by the obligations in the Convention.
137 www.environment.gov.au/protection/air-quality/national-clean-air-agreement Department of the EnvironmentCosts and benefits of ratifying the Minamata Convention on Mercury

Timing for meeting obligations is detailed in each of the Articles of the Convention. Some obligations apply immediately following the date of entry into force of the Convention by a Party, while others are required within a set period of this date.
Further, in certain circumstances, exemptions may be permitted which would extend (but not eliminate) specified phase-out timeframes (e.g. trade in mercury where certified written contest is demonstrated).
The following assumptions have been used to inform the phase-down scenarios for the purpose of this cost benefit analysis:
Imports of mercury to Australia are restricted from 2016-onwards to permitted uses. Trade consent agreed for the purposes of mercury use in the manufacture of mercury-containing pesticides from 2016 to 2020 only. No exemptions sought.
All products listed in Annex A are phased-out in accordance with initial dates (by 2020). This includes mercury vapour streetlights which would no longer be able to be imported after 2020; and production of mercury-containing pesticides – which would be banned after 2020. No exemptions sought.
Sub options under the phase-down of mercury scenario
Under the ratify scenario three sub-options were considered:
Scenario 2A - Australia undertakes the minimum actions required to meet the Minamata Convention; and
Australia undertakes further actions to those required by the Convention in two specific areas:
Scenario 2B - Interception and removal of waste amalgam from dental practices (an expansion of the Victorian Dentists For Cleaner Water program); and
Scenario 2C early phase-out of mercury-containing pesticides – manufacture to cease in 2017 rather than 2020 and removal of waste amalgam from dental practices.
Considerations in developing the cost benefit analysisIn developing and considering the scenarios Marsden Jacob identified some key considerations.
Impact of the Convention on the current arrangementsIn assessing the base case (non-ratification) it is important to note that the scenario will differ from the current situation in a number of ways due to the impact of the Convention entering into force. In particular it is expected that the base case would vary from the current situation in terms of:
Trade in mercury will reduce over time from 2016-onwards; and
Availability of mercury-added products for import would be reduced after 2020. Of the products listed in Annex A, Australia only manufactures dental amalgam. The availability of other mercury added products138 to the Australia market therefore depends on decisions by trading partners to exempt certain products or otherwise not ratify.
138 Such as certain batteries, switches and relays; various lighting products with mercury content exceeding set limits; all mercury vapour lights; cosmetics with mercury content above a set limit; pesticides, biocides and topical antiseptics; and various non-electrical measuring devices where no mercury-free alternative is available.
Department of the EnvironmentCosts and benefits of ratifying the Minamata Convention on Mercury
Given that a number of significant markets have either ratified (US) or intend to ratify (EU and China), trading partners who manufacture these products adapt their products to match the requirements of customers from countries that have ratified.
Uncertainty in predicting future impactsThe exact outcome of ratifying the Convention cannot be determined at this point due to the difficulties of predicting future industry scenarios.
By way of example, to accurately estimate the costs and benefits of Article 8 of the Convention on one industry (such as coal-fired power generation) it is necessary to know:
the number, timing and scale of the construction of (or upgrade of) coal-fired power generation up to 2035;
the current legislative requirements (e.g. state Environmental Protection approvals) that are in place for facilities that don’t operate in all jurisdictions and the resultant costs and emission levels;
the content and effect of the guidance on best available techniques and best environmental practice supporting Article 8 and the resultant costs and emission levels; and
the competitive interaction between coal-fired power generation and alternative generation sources.
To overcome this inherent difficulty, Marsden Jacob envisaged a likely outcome of the Convention for each industry, based on detailed discussions with industry experts as well as government officials.
Department of the EnvironmentCosts and benefits of ratifying the Minamata Convention on Mercury

Appendix B: Risks and uncertaintiesThe exact outcome of ratifying the Convention cannot be determined at this point with certainty due to the difficulties of predicting future industry scenarios.
By way of example, to accurately estimate the costs and benefits of Article 8 of the Convention on one industry (such as coal-fired power generation) it is necessary to know:
the number, timing and scale of the construction of (or upgrade of) coal-fired power generation up to 2035;
the current legislative requirements (eg. state Environmental Protection approvals) that are in place for facilities that don’t operate in all jurisdictions and the resultant costs and emission levels;
the content and effect of the guidance on best available techniques and best environmental practice supporting Article 8 and the resultant costs and emission levels; and
the competitive interaction between coal-fired power generation and alternative generation sources.
To overcome this inherent difficulty, Marsden Jacob envisaged a likely outcome of the Convention for each industry, based on detailed discussions with industry experts as well as government officials.
Two key areas are discussed in detail below that drive changes to both the costs and benefits under the ‘worst case’ outcome compared to the most likely outcome.
The points relate to the nature and content of Best Available Techniques and Best Environmental Practice (BAT and BEP) guidance under Article 8 and whether the current pesticide used during sugar cane planting has an impact on germination rates. These points are discussed in turn below.
6.5.1 BAT and BEP guidance under Article 8Article 8, Paragraph 4 of the Convention specifies the
For its new sources, each Party shall require the use of best available techniques and best environmental practices to control and, where feasible, reduce emissions, as soon as practicable but no later than five years after the date of entry into force of the Convention for that Party. A Party may use emission limit values that are consistent with the application of best available techniques.
The guidance on BAT and BEP is currently being developed by a technical working group. The guidance will then be discussed at the Intergovernmental Negotiating Committee (around the start of 2016) and then will be negotiated and agreed at the first Conference of the Parties (expected to occur in late 2016 or early 2017).
If Australia becomes a ratified Party to the Convention, the BAT/BEP guidance could not be adopted without Australia’s acceptance.
Due to the current status of the guidance (draft and confidential) and multiple steps prior to implementation, it is not possible to predict the requirements (and resulting costs and benefits) of the guidance.139
139 Note: a potential transitional issue for new facilities as well as substantial modifications of existing plants under Article 8 the Convention was also identified. This issue is likely to affect facilities that have already been granted approval but will not have started construction until after early 2017.
Department of the EnvironmentCosts and benefits of ratifying the Minamata Convention on Mercury

For this reason Marsden Jacob considered two alternative outcomes and consulted on these outcomes with industry and the Department:
“Low bar” guidance: aims to bring all countries up to an OECD level and would not impose any costs (or result in any mercury reductions) compared to a “business as usual” situation in Australia; and
“High bar” guidance: takes a literal interpretation of “best available techniques” and identifies leading edge technology and approaches from around the world and indicates that these forms of technologies and approaches should be used.
It should be noted that estimating the costs of guidance on BAT and BEP requires a prediction of the number of new facilities (or substantially modified facilities) that will be constructed in the next 20 years, as well as a simplifying assumption that state based environmental approvals do not alter over this period.140
As discussed in detail in section 5.1, new facilities (or substantial modification of existing facilities) is considered quite unlikely for base metal smelting and cement clinker. In addition it appears likely that current approvals for waste incineration are set at a BAT and BEP level. For this reason, the uncertainty only relates to possible new facilities for gold smelting and coal fired power generation.
Gold smelting
For gold smelting only two current facilitates were identified – both operating in Western Australia. It is considered unlikely that any new gold smelting facilities would be constructed in the next 10 years (prior to 2025). Beyond that timeframe it was considered possible that zero, one or two facilities could be constructed – with the year 2030 used in the model.
Under the ‘most likely’ outcome it was determined that either no facilities are constructed or the BAT and BEP guidance does not require any additional constraints beyond Business As Usual costs. This would result in no change in mercury emissions (ie. no mercury saved) and no additional costs.
Under the ‘worst case’ outcome – it is assumed that two new facilities are constructed in 2030 and based on consultation with industry indicative costs (based on upgrades to the existing facilities) were estimated at $40 million capital investment per facility.
The quantity of mercury captured due to BAT and BEP guidance will depend on the nature of the gold processed and the business as usual level of environmental legislation. For this reason 100 kilograms of mercury per facility per year was used as an indicative figure only.
It should be noted that these numbers ($40 million capital investment and 100 kg of mercury) are estimated only without knowing the content of the guidance on best available technology and best environmental practices or the Business as Usual costs from the environmental legislative requirements that currently would be applied.
140 18It should be noted that if the BAT/BEP guidance is strict then this will impose additional costs on new facilities, but not on existing facilities. This does create an incentive to continue to operate existing facilities for longer, rather than to invest in new facilities. This incentive would potentially delay the construction of new facilities and so could increase the level of mercury emissions (over the base case) in the short to medium term. Industry did not identify this perverse incentive during consultation and (as noted below) there not expected to be new facilities in some industries and there is substantial uncertainty in the likely number of new facilities in other industries. For this reason this potential for a perverse incentive is noted, but is not considered quantitatively.
Department of the EnvironmentCosts and benefits of ratifying the Minamata Convention on Mercury

Coal fired power generation
For coal fired power generation, it is considered unlikely that any facilities would be constructed in the next 10 years (prior to 2025). Beyond that timeframe it was considered possible that zero, one or two facilities could be constructed – with the year 2030 used in the model.
Discussions with Australia’s representative to the Minamata Convention Technical Expert Working Group – developing the guidance on best available techniques and best environmental practices - noted that an existing document the Process Optimisation Guide141 provide a useful guide to the likely form and content of the guidance for power generation.
Based on the Process Optimisation Guide, Table 23 collates possible upgrades required and estimates the costs. It should be noted that these are only estimates made knowing the content of the best available techniques guidance or the Business as Usual costs from the environmental legislative requirements that will exist in the future.
Table 23: Cost estimation for power generation upgrades required to meet BAT/BEP guidance.
Capital costs Operating costs Units Year
Escalated and converted values
Capital costs$AUD 2016
Operating costs
$AUD 2016
Fabric Filter $60,000,000 AUD 2007 $54,775,410 $0
Activated Carbon Injection $1,296,000 $600,000 USD 2006 $1,509,882 $699,020
Activated Carbon Disposal $1,430,000 USD 2006 $0 $1,665,997
Flue-gas desulfurization $86,400,000 USD 2008 $95,194,969 $0
Selective catalytic reduction $66,100,000 USD 2008 $72,828,559 $0
Total $214,196,000 $2,060,000 $224,751,880 $2,398,246Note: The costs provided from the Process Optimisation Guide are for a 360 MW plant
Industry also identified additional monitoring as a potential cost item – but the Department of the Environment suggested that it appeared unlikely that additional monitoring would be required under the BAT/BEP guidance compared to the business as usual costs.
In reality, adding $224 million to the cost of a coal fired power station may make it uncompetitive and an alternative form or generation may be built instead (eg. a Combined Cycle Gas Turbine). In this case, the cost impact on the Australian community would only be the cost difference between coal fired generation and the next best source. However, estimating the competitive nature of electricity generation is out of scope for this cost benefit – so the total estimated cost is used – recognising that this may be a conservative estimate (ie. high estimate of the cost).
The modelled capital cost increase ($224 million) represents around a 15% increase in capital cost for a non-critical 360 megawatt coal fired power station. Importantly these costs appear in the “worst case” cost benefit analysis for the phase-down scenarios but not under the most likely case for each scenario.
These costs are excluded from the most likely outcome – and are included in the ‘worst case’ – because for these costs to be realised at this scale all of the following factors would need to occur:141 UNEP, Process Optimization Guidance for Reducing Mercury Emissions from Coal Combustion in Power Plants,
November 2010Department of the EnvironmentCosts and benefits of ratifying the Minamata Convention on Mercury

new facilities would need to be constructed (or existing facilities would need to be substantially modified);
guidance on best available technology and best environmental practice aligns with the “high bar” description;
State level environmental requirements (representing the “business as usual” cost) are not tightened over the intervening period for mercury or other flue gases which would have a co-benefit on mercury emissions (such as nitrogen oxides and sulphur dioxide)142;
costs of technology do not decrease over the intervening period; and
coal fired power remains the best energy source despite the increase in cost.
Potential impact of ratification on mercury emitted by coal fired generation
Due to the industry’s advice that they anticipate to be in compliance with the requirement to have emission limit values, ratification would have no impact on the mercury emitted from existing coal-fired power generation.
For new and substantially modified coal-fired power generation the benefits will depend on both the strictness of the best available techniques guidance and the number of new (or substantially modified) plants built.
Under a “low bar” scenario there would be no impact on mercury emitted.
Under the “high bar” scenario there would be an impact on mercury emitted – and this can be estimated as set out below.
Under a high bar scenario it is assumed that mercury emissions are set at world leading standards. The United States Mercury and Air Toxics Standards are seen as a reasonable proxy for world leading standards – although it is recognised that world leading standards may be more stringent. The mercury limits for the United States Mercury and Air Toxics Standards are set out inTable 24.
Table 24: United States mercury limits under the Mercury and Air Toxics Standards
Coal type lb/ GWh kg/ GWh
New- Not Low Rank Virgin Coal 0.0002 0.00009
New- Low Rank Virgin Coal 0.04 0.018
Source: http://www.met.net/1mats.aspx
Note: Unit designed for low rank virgin coal subcategory means any coal-fired EGU that is designed to burn and that is burning non agglomerating virgin coal having a calorific value (moist, mineral matter-free basis) of less than 19,305 kJ/kg (www.law.cornell.edu/cfr/text/40/63.10042) In comparison NSW thermal coal has a calorific value of around 26,000 kJ/kg.
Under the United States standard low rank coal has a calorific value of less than 19,305 kJ/kg143. Using this definition it appears that Australian coals (other than Victorian brown coal) would be defined as not low rank coal144
142 It is noted that this assumption is a requirement for determining Business As Usual costs.143 www.law.cornell.edu/cfr/text/40/63.10042
Department of the EnvironmentCosts and benefits of ratifying the Minamata Convention on Mercury
These standards can be compared to the mercury emissions published in the National Pollutant Inventory for relatively newly constructed coal-fired power stations145 – which are set out in Table 25.
Table 25: Mercury emissions from newer coal-fired power stations in Australia
Facility name 2011/12 Mercury Air Emissions (kg) 2011/12
GWh
Mercury Air Emissions
g/GWh
Stanwell Power Station [Gracemere-QLD] 40.0 7,333 5.45
Tarong North PS [Nanango-QLD] 20.0 2,752 7.27
Kogan Creek Power Station [Brigalow-QLD] 14.1 4,697 3.00
Redbank Power [Warkworth-NSW] 0.37 1,036 0.36
Millmerran Power [Millmerran-QLD] 0.16 5,907 0.03
Source: Energy outputs in GWh for 2011/2012 from Australian Energy Market Operator NEM-wide historical information report 2012
Mercury emissions for 2011/12 from the National Pollution Inventory
If these power stations were to meet the US Mercury and Air Toxics Standards for Not Low Rank Virgin Coal then the mercury emissions for each power station would reduce to less than one kilogram per annum. Across the five power stations this would result in an average reduction of mercury by 14.5 kilograms per annum.
In addition to reductions in mercury emitted, the introduction of high bar best available techniques guidance would have co-benefits in reduced emissions of sulfur dioxide (SO2)and nitrogen oxides (NO, N2O and NO2).
6.5.2 Cane growersSome industry participants suggest that the popularity of the current mercury-containing pesticide (Shirtan) is due to a belief that the chemical stimulates rapid germination of sugarcane relative to alternative products – particularly in adverse conditions (such as cold weather). Crop Care reportedly spoke with researchers who estimated that each year around 10% to 20% of the sugarcane crop planted is at risk due to poor conditions and that it is under these conditions that they believe the mercury-containing pesticide is advantageous. Crop Care estimated that the risk to crops might be realised 30% of the time (if the mercury-containing pesticide weren’t used) – equating to 3,150 hectares. Where crops are damaged the most likely response is to replant the crop at a cost of $1,000 to $1,500 per hectare. This information would value the loss of Shirtan at $3,937,500 per annum. However, there is no published scientific information available that supports this belief and it appears to contradict published data (see Figure 6 on page 40). Given the uncertain nature of this value it was not included under the most likely case assessment – and is only included in the ‘worst case’ outcome.
144 www.coalmarketinginfo.com/coal-basics/ 145 Energy Supply Association of Australia identified 8 power stations built in the period from 1995 to 2015. Of these two
were omitted as they lie outside the National Electricity Market (located in WA) and one was omitted due to difficulty in identifying the corresponding NPI data.
Department of the EnvironmentCosts and benefits of ratifying the Minamata Convention on Mercury

Department of the EnvironmentCosts and benefits of ratifying the Minamata Convention on Mercury

Appendix C: Cost benefit and regulatory burden frameworkFor this engagement, Marsden Jacob undertook a Cost Benefit Analysis and a Regulatory Burden Measurement consistent with Australian Government policy.
The Cost Benefit Analysis considers the expected cost impacts on, and benefits to, business, government, and the wider community that would arise from ratifying or not ratifying the Convention, as well as identifying and assessing the costs and benefits to human health and the environment. The final Cost Benefit Analysis identifies the Net Present Value over 20 years, distribution of costs and benefits and includes a number of sensitivity analysis.
The Regulatory Burden Measurement (RBM) focuses on quantifying the regulatory burden for industry (and Government Owned Corporations as applicable) only. The RBM consists of a simple average annual cost over a 10 year period.
The framework and process to be used in undertaking the Cost Benefit Analysis and Regulatory Burden Measurement are briefly outlined in this section.
Cost Benefit AnalysisThe Cost Benefit Analysis has been undertaken in line with guidance published in July 2014 by the Department of Prime Minister and Cabinet.146
The Cost Benefit Analysis seeks to determine the incremental impact of the ratify scenario compared to the base case (non-ratification) scenario. To do this, Marsden Jacob identified the range of impacts accruing to categories of stakeholders and then compare net present value of the two scenarios.
146 Department of Prime minister and Cabinet, Cost Benefit Analysis, Guidance Note July 2014, www.dpmc.gov.au/office-best-practice-regulation/publication/cost-benefit-analysis-guidance-note
Department of the EnvironmentCosts and benefits of ratifying the Minamata Convention on Mercury

Stakeholder groups
Marsden Jacob classified costs and benefits under the groupings set out in Table 26.
Table 26: Summary costs and benefits
Stakeholder Base Case (non-ratification) Ratification prior to 2016
Costs
Government As per current costs
Costs associated with meeting ratification: Development of guidelines Financial resources required and mechanisms Regulation, compliance costsChanges to ongoing regulation, compliance costs.
IndustryAs per current costs but with potential for trade-related measures
Costs associated with meeting ratification: Increased costs to implement Phase-out by
2020 of mercury-added products Costs for new and existing point sources (e.g.
gold production and coal fired power)Changes to ongoing costs (and revenues) as a result of ratification.
Benefits/avoided costs
Health outcomes
Health outcomes consistent with current trends/ experience but with some improvement due to other Countries’ decision to ratify
Potential for improved health outcomes within Australia as a direct result of changes made by Australia.
Environmental outcomes
Environmental outcomes consistent with current trends./ experience but with some improvement due to other Countries’ decision to ratify
Potential for improved environmental outcomes within Australia as a direct result of changes made by Australia.
Cost types
When considering cost impacts for both business and government Marsden Jacob sought to identify “set up” or “changeover costs” separately from ongoing costs. For clarity we propose to use the following definitions:
changeover costs – the costs of transitioning to the new requirements in capital costs, staff time, management time and consultant fees per annum during the changeover period; and
ongoing costs in staff time, management time and consultant fees per annum.
Changeover costs are likely to appear as an increase in costs occurred in Year 1 but may also appear later in the study period as certain aspect of the Convention come into forced after a period of time. The costs attributable to ratification are those changeover costs which would not have occurred in the absence of ratification or otherwise have been brought forward in time as a result of ratification.
Department of the EnvironmentCosts and benefits of ratifying the Minamata Convention on Mercury

Ongoing costs will appear as the annual cost of compliance from Year 2 onwards (under the Convention). In order to inform understanding of ongoing costs attributable to the Convention Marsden Jacob will seek information from industry and Government as to:
current costs – the cost of compliance with the current regulations given as an average costs in terms of staff time, management time and consultant fees per annum; and
future costs (absent the Convention) – if the Convention is not ratified are current costs a good estimate of future costs? (Note: these may be the same as the current costs, or future projections based on current costs).
Based on the above definitions Marsden Jacob established the costs for the first year and subsequent years of the study as follows:
First year cost impact = changeover costs + ongoing costs – current costs
Ongoing cost impact = ongoing costs – future costs (absent the Convention)
Approach to estimating the cost of staff time
The staff time costs identified in this assessment tended to be portions of an employee or one to two employees at the most. For this reason, in estimating the cost of staff time the approach used was to focus on the “marginal cost” of staff time.
Using this approach Marsden Jacob considered the Staff salary and on-costs as well as overheads that are directly linked to an individual staff member (eg. telephone, computer and cars). This approach ignores broader corporate overheads such as building costs and corporate functions such as Human Resources and finance on the basis that these costs would not be impacted by the change in a portion of an employee or individual employees.
As the Convention impacts a broad range of industries and government agencies the likely costs will vary from one industry to another. Unless an industry indicated otherwise an assumed cost of $100,000 per Full Time Employee was used. The only variations to this value were for the Department of the Environment where it was assumed that 2 Full Time Equivalents was $250,000.
Benefit types
Where applicable, benefits are categorised using the same terminologies that applied for costs (i.e. changeover benefits and ongoing benefits). However, benefits are more likely to appear as ‘avoided costs’ in the phase-down scenario or ‘avoided losses’. Health and environmental benefits in particular, lend themselves to this type of classification.
Discount rates
The costs and benefits from ratification will be presented as a net present value of the 20 year study period.
Consistent with OBPR requirements and guidance, Marsden Jacob applied a number of discount rates which reflect the time value of money and the opportunity cost for investment (in the case of business costs).
Department of the EnvironmentCosts and benefits of ratifying the Minamata Convention on Mercury

An annual real discount rate of 7 per cent will be used as the standard discount rate. In addition, Marsden Jacob will perform sensitivity analysis based on real discount rates of 3 per cent and 10 per cent.
Sensitivity analysis
A number of the inputs into modelling are uncertain, as such we will perform a number of sensitivity analyses for by identifying an ‘optimistic’ and ‘pessimistic’ estimate of each input. In addition, if there are 1 or 2 variables that dominate the cost benefit outcome, we will consider a sensitivity analysis of these individual inputs.
Regulatory Burden MeasurementRegulatory burden measurement (RBM) has been be undertaken in line with guidance147 and focuses only on private sector costs and those of Government Owned Corporations.
The RBM values are provided as a simple average of costs to industry over the first 10 year period and will be disaggregated by cost types:
administrative compliance costs - costs that are primarily driven by the need to demonstrate compliance with the Convention such as annual reporting.
substantive compliance costs –which are directly attributable to ratification and which fall outside of the usual business costs these costs may include the capital costs of plant upgrades as well as operational costs from process changes or additional staff training.
delay costs - include the time taken for the preparation of applications (referred to as application delay) and the time taken for approval (referred to as approval delay). Estimating the cost savings relating to removing delays requires a strong understanding of the realistically achievable timeframes, the likely delays which could be avoided, and the value (potential cost) of any avoidable delay.
Regulatory burden measurement focuses on the costs that are imposed on industry – that would not otherwise be incurred. Costs from actions that industry would undertake anyway or are requirements of existing legislation are considered “Business as usual” costs and are excluded.
147 Department of Prime minister and Cabinet, Regulatory Burden Measurement Framework, Guidance Note February 2015, www.dpmc.gov.au/office-best-practice-regulation/publication/regulatory-burden-measurement-framework-guidance-note
Department of the EnvironmentCosts and benefits of ratifying the Minamata Convention on Mercury

Appendix D: Industry consultation Public consultation by the Department of the Environment
The Department undertook a public consultation process in 2014 which sought comment on each of the key Articles of the Convention. 148
A Consultation Paper149 was published in March 2014 and submissions were invited by 30 June 2014.
The Consultation Paper highlighted the obligations of the Convention which would require action if Australia became a Party by ratifying the Convention. Comments were sought from all interested stakeholders on the impacts on Australia of meeting obligations of the Convention.
Following a review of the submissions received in responses to the Consultation Paper and research previously undertaken by the Department, a number of areas have been identified as potentially requiring change from industry. Impacted industries include:
1. Industries with potential air emissions
a. Coal fired power generation and industrial boilers;
b. Non-ferrous metals smelting and roasting (lead, zinc, copper and industrial gold);
c. Waste incineration;
d. Cement;
2. Cane Growers;
3. Dental;
4. Lighting;
5. Waste and recycling sector; and
6. Oil and gas production;
The Department has previously identified that there are 14 Articles of the Convention which will require Australia’s action if Australia becomes Party to the Convention.
Follow up consultation for this project
Marsden Jacob surveyed and had a number of discussions with industry stakeholders in order to inform the development of the industry impact analysis.
148 Refer to the Department’s website: http://www.environment.gov.au/protection/chemicals-management/mercury 149 www.environment.gov.au/system/files/pages/6f253b28-f22f-4002-92fe-6f9824d531b6/files/minamata-convention-
invitation-comment.pdfDepartment of the EnvironmentCosts and benefits of ratifying the Minamata Convention on Mercury

Table 27: Details of the organisations consulted and the topics discussed
Organisation Consulted Topic
Minerals Council Mining – esp. Article 8 & Non Ferrous metals & coal mining
Cement Industry Federation Cement Industry esp. Article 8
Energy Supply Association esp. Article 8
Aluminium Council esp. Article 8
Cane Growers Discussed Shirtan and alternatives
Crop Care Discussed Shirtan and alternatives
Alpha Chemicals Discussed Shirtan and other products
NOPSEMA Mercury in petroleum and gas
APPEA Mercury in petroleum and gas
WA Dept of Mines and Petroleum Mercury in petroleum and gas
WA Department of Health Data on mercury in people
WA Dept of Environmental Regulation Data on mercury in environment
Safe Work Australia Data on workers compensation claims relating to mercury
WA Water Corporation Discussed mercury in sewerage and WWTP sludge
Ecocycle Discussed mercury sources and recycling
SDI Limited Discussed impact of reduced mercury imports on dental amalgam and use of recycled amalgam
Australian Dental Association (ADA)
Discussed use of mercury in dental amalgam and mercury separator costs
Australian Dental Industry Association (ADIA)
Discussed use of mercury in dental amalgam and mercury separator costs
Ironbark Sustainability Discussed quantum of mercury vapour streetlights in Australia and the status of current replacement programs
Department of State Development Discussed updates to energy efficiency standards for lighting
Energex Discussed mercury vapour streetlight, replacement programs and lamp distributors
Gerald Lighting Discussed sales of mercury vapour streetlights and demand going forward
Qld Department of Environment and Heritage Protection
Data on mercury in environment
Qld Department of Science, Information Technology, Innovation and the Arts
Data on mercury in environment
CSIRO Discussed data on mercury in environment
Department of the EnvironmentCosts and benefits of ratifying the Minamata Convention on Mercury