Embed Size (px)
Citation preview
Costs and Benefits of Smart Feeder Switching
Quantifying theOperating Value of SFS
F INAL REPORT | MAY 31, 2014
NRECA-DOE SMART GRID DEMONSTRATION PROJECT | DE-OE0000222

Prepared by
David PinneyCooperative Research Network
National Rural Electric Cooperative Association4301 Wilson Boulevard
Arlington, Virginia 22203-1860
for
U.S. DOE/NETLMorgantown Campus
3610 Collins Ferry RoadPO Box 880
Morgantown WV 26507-0880
NRECA-DOE SMART GRID DEMONSTRATION PROJECT | DE-OE0000222
project manager: craig miller, phd principal investigator: tom lovas

The National Rural Electric Cooperative Association
NRECA is the national service organization for more than 900 not-for-profit rural electric cooperatives and public power districts providing retail electric service to more than 42 million consumers in 47 states and whose retail sales account for approximately 12 percent of total electricity sales in the United States.
NRECA’s members include consumer-owned local distribution systems — the vast majority — and 66 generation and transmission (G&T) cooperatives that supply wholesale power to their distribution cooperative owner-members. Distribution and G&T cooperatives share an obligation to serve their members by providing safe, reliable and affordable electric service.
About CRN
NRECA’s Cooperative Research Network™ (CRN) manages an extensive network of organizations and partners in order to conduct collaborative research for electric cooperatives. CRN is a catalyst for innovative and practical technology solutions for emerging industry issues by leading and facilitating collaborative research with co-ops, industry, universities, labs, and federal agencies.
CRN fosters and communicates technical advances and business improvements to help electric cooperativescontrol costs, increase productivity, and enhance service to their consumer-members. CRN products, services and technology surveillance address strategic issues in the areas:
• Cyber Security• Consumer Energy Solutions• Generation & Environment• Grid Analytics
CRN research is directed by member advisors drawn from the more than 900 private, not-for-profit, consumer-owned cooperatives who are members of NRECA.
Contact Information
National Rural Electric Cooperative AssociationCooperative Research Network ™4301 Wilson BoulevardArlington, VA 22203-1860703.907.5500
• Next Generation Networks• Renewables• Resiliency• Smart Grid

Costs and Benefits of Smart Feeder Switching –
Quantifying the Operating Value of SFS May 31, 2014
–i–
Table of Contents
Page
Foreword ....................................................................................................................................... iv
Acknowledgments ..........................................................................................................................v
Abstract ...........................................................................................................................................1
Executive Summary of Results .....................................................................................................1
Research Questions ........................................................................................................................1
Technology Description .................................................................................................................1
Automated Fault Location, Isolation, and Restoration (FLIR) ..................................................2
Feeder Switching for Load Balancing .......................................................................................2
Field Deployments ..........................................................................................................................2
Adams Electric Cooperative ......................................................................................................2
Motivation .........................................................................................................................2
Installation Description .....................................................................................................2
Planning Experience .........................................................................................................3
Deployment Status ............................................................................................................4
Deployment Lessons Learned ...........................................................................................4
Realized Benefits ..............................................................................................................4
Adams-Columbia Cooperative...................................................................................................4
Motivation .........................................................................................................................4
Installation Description .....................................................................................................4
Deployment Status ............................................................................................................6
Clarke Electric Cooperative .......................................................................................................6
Motivation .........................................................................................................................6
Installation Description .....................................................................................................6
Deployment Status ............................................................................................................6
Lessons Learned................................................................................................................6
Realized Benefits ..............................................................................................................6
EnergyUnited .............................................................................................................................7
Motivation .........................................................................................................................7
Installation Description .....................................................................................................7
Planning Experience .........................................................................................................8
Deployment Status ............................................................................................................8
Deployment Lessons Learned ...........................................................................................9
Kotzebue Electric Association ...................................................................................................9
Motivation .........................................................................................................................9
Installation Description .....................................................................................................9
Planning Experience .......................................................................................................11
Deployment Status ..........................................................................................................11

Costs and Benefits of Smart Feeder Switching –
Quantifying the Operating Value of SFS May 31, 2014
–ii–
Owen Electric Cooperative ......................................................................................................12
Installation Description ...................................................................................................12
Planning Experience .......................................................................................................12
Deployment Status ..........................................................................................................12
Salt River Electric ....................................................................................................................12
Motivation .......................................................................................................................12
Installation Description ...................................................................................................12
Deployment Status ..........................................................................................................13
Lessons Learned..............................................................................................................13
Realized Benefits ............................................................................................................13
Snapping Shoals Electric Membership Corporation ................................................................14
Motivation .......................................................................................................................14
Installation Description ...................................................................................................14
Planning Experience .......................................................................................................15
Deployment Status ..........................................................................................................15
Deployment Lessons Learned .........................................................................................15
Realized Benefits ............................................................................................................15
Washington-St. Tammany Electric Cooperative .....................................................................16
Motivation .......................................................................................................................16
Installation Description ...................................................................................................16
Planning Experience .......................................................................................................18
Deployment Status ..........................................................................................................18
Cost-benefit Methodology ...........................................................................................................18
SFS Benefits.............................................................................................................................18
SFS Costs .................................................................................................................................20
Modeling Extension .....................................................................................................................20
Cost Calculation Approach ......................................................................................................22
Benefits Calculation Approach ................................................................................................23
Data Requirements and Sources.................................................................................................23
SFS Model Library ..................................................................................................................23
SFS Cost/Benefit Calculations .................................................................................................25
References .....................................................................................................................................27

Costs and Benefits of Smart Feeder Switching –
Quantifying the Operating Value of SFS May 31, 2014
–iii–
List of Figures
Page
Figure 1. AEC Communications System Design and Switch Sites ................................................ 3
Figure 2. ACEC Substation Map with New Connectivity and Switch Settings ............................. 5
Figure 3. EU Project One-Line Diagram ........................................................................................ 8
Figure 4. KEA Primary Distribution One-Line Diagram ............................................................. 10
Figure 5. KEA Feeder 4 One-Line Diagram ................................................................................. 11
Figure 6. SSEMC AST Regions: Existing in Yellow, Project Additions in Blue ........................ 14
Figure 7. Washington-St. Tammany Transmission Network ....................................................... 17
Figure 8. Smart Feeder Switching Benefits .................................................................................. 19
Figure 9. SFS Analysis Modeling Framework ............................................................................. 21
Figure 10. SFS Cost Calculation Methodology ............................................................................ 22
List of Tables
Page
Table 1. ACEC Hardware and Software Costs ................................................................................5
Table 2. Salt River Post-Project Outages and Customer-Minutes Saved ......................................13
Table 3. First Order Benefits .........................................................................................................19
Table 4. Second Order Benefits .....................................................................................................20
Table 5. SFS Cost Categories ........................................................................................................20
Table 6. Data Sets in the Model Library ........................................................................................23
Table 7. Data Requirements of SFS Cost-Benefit Model ..............................................................25
NRECA – DOE Smart Grid Demonstration Project | DE-OE0000222
–iv–
FOREWORD
The National Rural Electric Cooperative Association (NRECA) has organized the NRECA-U.S.
Department of Energy (DOE) Smart Grid Demonstration Project (DE-OE0000222) to install and
study a broad range of advanced Smart Grid technologies in a demonstration that involved 23
electric cooperatives in 12 states. For purposes of evaluation, the technologies deployed have
been classified into three major sub-classes, each consisting of four technology types.
Enabling Technologies: Advanced Metering Infrastructure
Meter Data Management Systems
Telecommunications
Supervisory Control and Data Acquisition
Demand Response: In-Home Displays & Web Portals
Demand Response Over AMI
Prepaid Metering
Interactive Thermal Storage
Distribution Automation: Renewables Integration
Smart Feeder Switching
Advanced Volt/VAR Control
Conservation Voltage Reduction
To demonstrate the value of implementing the Smart Grid, NRECA has prepared a series of
single-topic studies to evaluate the merits of project activities. The study designs have been
developed jointly by NRECA and DOE. This document is the final report on one of those topics.
DISCLAIMER
The views as expressed in this publication do not necessarily reflect the views of the U.S.
Department of Energy or the United States Government.

Costs and Benefits of Smart Feeder Switching –
Quantifying the Operating Value of SFS May 31, 2014
–v–
ACKNOWLEDGMENTS
We are grateful for the input from the following, without which this report would not have been
possible:
James Bridges, VP of Engineering, Owen Electric Cooperative
Steve Estes, System Engineer, EnergyUnited
Bryan Jones, Distribution Engineer, Washington-St. Tammany Electric Cooperative
Gerald Schmitz, Electrical Engineer, Adams-Columbia Electric Cooperative
Michael Milligan, Manager of Engineering, Snapping Shoals Electric Membership
Corporation
Timothy Sharp, COO, Salt River Electric Cooperative
Craig Thompson, Partner, Thompson Engineering
James Thompson, General Manager, Adams Electric Cooperative
Brad Wilson, Manager of Engineering, Clarke Electric Cooperative

Costs and Benefits of Smart Feeder Switching –
Quantifying the Operating Value of SFS May 31, 2014
–1–
ABSTRACT
This report discusses the deployment experience at nine rural electrical cooperative utilities of
distribution automation technologies applied to Smart Feeder Switching (SFS) applications. We
investigate the suitability of models to represent and predict the benefits of these technologies,
with extensions to automating screening and engineering analysis for future deployments. This
study defines an analytical methodology for quantifying the value of two SFS operational
benefits: (1) more rapid restoration following a fault and (2) reduced losses through feeder
load balancing. It also conveys a listing of SFS benefits and costs, identifying those deemed to
have first order impacts, and compares projected values with field study results from National
Rural Electric Cooperative Association (NRECA) Smart Grid Demonstration Project
participants. In addition, it defines a logical modeling framework and analytics process for
evaluating costs and benefits.
EXECUTIVE SUMMARY OF RESULTS
1. Gaining experience with increasingly prevalent distribution automation technology was an
important driver behind cooperative participation in these demonstrations.
2. Non-labor costs were consistent per automated switch, but costs per customer average
interruption duration index (CAIDI) minute of improvement, when calculable, were
variable due to the diverse system types under study.
3. Multiple cooperatives were able to bring large percentages (30%–50%) of their feeders into
configurations that enabled self-healing through back-feeds and automatic source transfers.
RESEARCH QUESTIONS
Field Trials:
In the co-ops that installed hardware, what were the expected and realized benefits for
reliability and feeder balance?
What are best practices and common “gotchas” across all deployments?
How do the benefits accrue to the cooperative, co-op members, and upstream power
providers?
What are the impacts of these technologies on maintenance efforts?
Model Extensions:
Can we accurately represent reliability impacts of smart feeder switching technologies
via powerflow models?
What feeder characteristics are correlated with what benefits, and can this information
lead to a system screener to locate candidates for technology installation?
TECHNOLOGY DESCRIPTION
Smart Feeder Switching (SFS) employs hardware, software, and procedural components to
perform automated switching actions on distribution feeder systems. It creates (1) a “self-
healing” system that can locate and isolate faults and automatically restore service, and (2) a
more efficient network that reduces distribution system losses through load balancing across
feeders.
Distribution feeders can be designed in a loop or radial configuration. Loop configurations have
more than one power source, whereas radial configurations have a single power source. Radial
feeder design typically is used for feeders covering large geographic areas in remote locations.
Costs and Benefits of Smart Feeder Switching –
Quantifying the Operating Value of SFS May 31, 2014
–2–
Utilities usually design feeders in loop configurations, when economically feasible. A loop
configuration allows utilities to restore power from another source in the event of a system fault.
Automated Fault Location, Isolation, and Restoration (FLIR)
In general, utilities have not implemented SFS systems at distribution-level voltages; therefore,
system operators usually do not monitor the distribution system. When customers lose power due
to a fault on a distribution line, utility operators usually are not aware of the service interruption
until they receive a customer call. It can take several hours for utility crews to determine the fault
location once they are dispatched. SFS enables remote monitoring of distribution system
equipment and automates the fault location, isolation, and restoration processes so that electric
service usually can be restored in minutes.
Feeder Switching for Load Balancing
Feeder switching for load balancing is the process of transferring loads from one feeder to
another to balance the total load across multiple feeders and transformers, thus reducing line
losses, calculated as the square of line current.
FIELD DEPLOYMENTS
Nine cooperatives completed SFS projects. Descriptions of the deployments follow.
Adams Electric Cooperative
Motivation
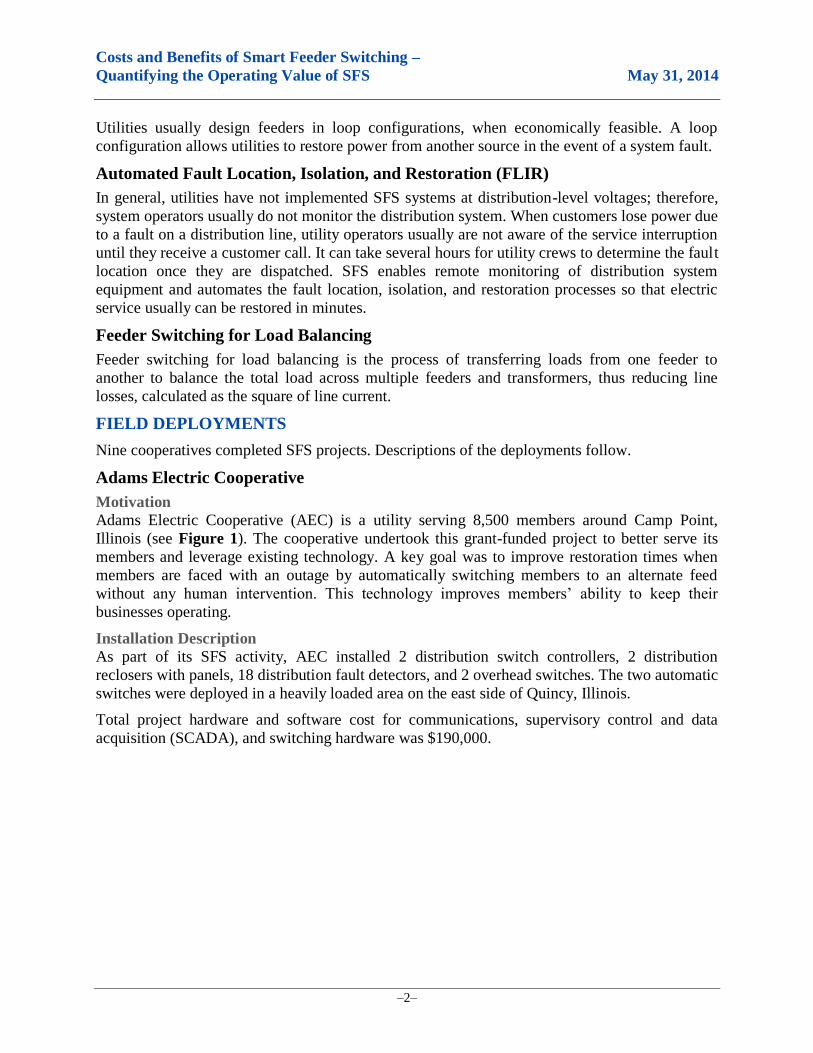
Adams Electric Cooperative (AEC) is a utility serving 8,500 members around Camp Point,
Illinois (see Figure 1). The cooperative undertook this grant-funded project to better serve its
members and leverage existing technology. A key goal was to improve restoration times when
members are faced with an outage by automatically switching members to an alternate feed
without any human intervention. This technology improves members’ ability to keep their
businesses operating.
Installation Description
As part of its SFS activity, AEC installed 2 distribution switch controllers, 2 distribution
reclosers with panels, 18 distribution fault detectors, and 2 overhead switches. The two automatic
switches were deployed in a heavily loaded area on the east side of Quincy, Illinois.
Total project hardware and software cost for communications, supervisory control and data
acquisition (SCADA), and switching hardware was $190,000.
Costs and Benefits of Smart Feeder Switching –
Quantifying the Operating Value of SFS May 31, 2014
–3–
Figure 1. AEC Communications System Design and Switch Sites
Planning Experience
Engineering planning began with D/A switch site selection. Due to its St. Anthony West feeder's
heavy commercial loads, the cooperative considers it an area of critical importance. The project
was designed such that, if the St. Anthony West's normal feed was lost, the St. Anthony North
feeder would pick up this area as an alternate feed. AEC prefers overhead D/A switches over
underground D/A switches due to ease of install, cost, and configuration safety. With this in
mind, AEC determined physical D/A switch placement using geographic information system
(GIS) maps and a site visit, taking pole placement and normal opens into consideration.
A fault magnitude (coordination study) was performed to determine the settings necessary in the
D/A controls for proper operation of the D/A switches. AEC had to determine the time-current
curves, pick-up, and number of operations in all of the over-current devices up- and down-line of
the D/A switches. This was achieved via a Milsoft Windmil model, device TCC specifications,
and a coordination work sheet.
The cooperative also performed a coordination study to determine proper programming for the
D/A switches, given system conditions and programming of existing 6801 control fields.
Engineering and operations personnel reviewed all of the 6801 control fields, considering, for
example, using the D/A switch to act as an over-current device that would open before the
substation Nova reclosers would go to lock-out, and not allowing the alternate feed to close into

Costs and Benefits of Smart Feeder Switching –
Quantifying the Operating Value of SFS May 31, 2014
–4–
a fault if a fault was present in between the D/A switches. AEC took into account programming
that would minimize the outage time and assist in troubleshooting the outage.
A communication propagation study also was required. A line-of-sight study via GIS maps was
conducted to determine the height of the AEC master radio antenna and the distance to the north
D/A switch. This also provided the distance and height of the north and south D/A switches. On-
site RSS tests were conducted using a 30’ test MDS 9710 SCADA radio and antenna located at
the proposed north D/A switch site. A received signal strength indicator (RSSI) reading of 80Db
from AEC’s master SCADA radio was considered more than adequate for reliable SCADA
communication. No in-house equipment was available to test the peer-to-peer RSS, so AEC used
the following method to determine whether a reliable peer-to-peer communication could be
established: two bucket trucks were raised to a height of 30’ to establish that a clear line of sight
between the two peer-to-peer locations was available and the span did not exceed the distance
limits of the two radios per S&C specifications.
Deployment Status
The installation of the distribution automation switches was completed in May 2012, and the
system has been active since then.
Deployment Lessons Learned
AEC had no problems with installing and bringing the SCADA communication on line.
However, with peer-to-peer communication, there was an issue with radio frequency (RF)
interference from the Holiday Inn building in proximity to the north D/A switch. This required
moving the peer-to-peer antenna one pole span to the south. It was not foreseen that RF
interference would be a problem in the original location.
The S&C automatic controllers are functioning correctly but, in the start-up process, AEC had
some difficulty in programming the controllers due to manufacturing problems: the wrong
firmware was installed in the controllers.
Schweitzer underground and overhead fault indicators were easy to install and met the
cooperative's needs. It is foreseen that these indicators will help with trouble shooting faults.
Realized Benefits
The cooperative has not experienced any faults, loss of voltage, single phasing, etc. on the
distribution system where the distribution automation switches have been installed. Even though
the switches have not yet operated, installing them and learning about their capabilities has
improved the resiliency of the distribution system and provided experience to AEC engineers for
future distribution automation projects.
Adams-Columbia Cooperative
Motivation
Adams-Columbia Cooperative (ACEC) is a cooperatively owned utility serving 36,000 members
around Friendship, Wisconsin. ACEC's service territory was hit by severe storms in 2001, which
led to making system resiliency a priority.
Installation Description
ACEC installed 10 distribution reclosers—4 overhead and 6 underground. All reclosers were
outfitted with automatic controls and communications capabilities. The SCADA system also
installed as part of the Smart Grid Demonstration is the point of control for these smart switches.

Costs and Benefits of Smart Feeder Switching –
Quantifying the Operating Value of SFS May 31, 2014
–5–
Although the reclosers can be human operated remotely, their role in the smart switching scheme
is to report back system conditions to SCADA and then take orders to reconfigure the system
from the smart grid software (Yukon Feeder Automation).
The utility's feeders are all in radial configurations. Currently, a limited amount of back-feeding
is possible through switches normally open. This project increases the number of interconnection
points and hence opportunities for power restoration in fault conditions.
Total hardware and software costs for this project were $414,000, which breaks down as follows
(Table 1):
Table 1. ACEC Hardware and Software Costs
Hardware Description Quantity Unit Cost Extd Cost
OH distribution switches with controls 4 $22,792 $91,168
Underground switches with controls 6 $39,970 $239,820
Radio communication equipment, 5.8 Ghz 2 $2,245 $4,491
Radio communication equipment, 900 MHz 13 $2,245 $29,191
Radio communication equipment, 200 MHz 9 $2,245 $20,209
Eqpt Cost $384,878
Shipping (2%) $7,698
Sales Tax (5.5%) $21,592
TOTAL HW/SW $414,168
New switch locations relative to substations are shown in Figure 2.
Figure 2. ACEC Substation Map with New Connectivity and Switch Settings
Costs and Benefits of Smart Feeder Switching –
Quantifying the Operating Value of SFS May 31, 2014
–6–
Deployment Status
All hardware has been deployed as of November 1, 2013. The system passed a brief outage
test—when the test recloser was opened, feeders reconfigured as designed.
The system is expected to operate once a year when it is ready, so data volume for verification
and resiliency benefit estimation is expected only after many years of system operation. There is
a possibility of field testing with additional induced faults.
Clarke Electric Cooperative
Motivation
Clarke Electric Cooperative is a utility serving 5,200 customers in portions of eight counties in
South Central Iowa. The primary motivation for this project was to improve operational
efficiency for the cooperative and increase reliability for the members.
Installation Description
The SFS activity includes distribution switches/controllers at 21 field switch locations,
distribution reclosers and automation equipment at 33 locations, and monitoring and control
software.
The communications activity involved design and installation of radio backhaul equipment and
associated communications equipment to link Clarke’s control center with DA at the 54 remote
locations.
An additional SCADA activity was intended for the installation of both hardware and software
for a small-scale SCADA system, which supports the smart feeder activity. In addition,
Distribution Fault Anticipator monitors will be installed on all three feeders at one substation.
This equipment and software will help determine potential distribution hardware that needs to be
addressed. This will improve power delivery reliability and information transfer accuracy.
Deployment Status
Installation is complete and the hardware is functioning correctly in the field.
Lessons Learned
Brad Wilson, engineering manager at Clarke EC, shared his lessons learned: “Understand zoning
and ordinances for the placement of towers. We had to relocate a tower that was installed too
close to a roadway, assure that the engineering consultant is intimately familiar with the specific
technology being implemented, and plan for extensive training for internal personnel. In fact, the
internal personnel need to be involved in the installation and setup of the system if they will be
assuming ownership after the project is completed.”
Realized Benefits
Clarke has implemented a self-healing scheme with the project switches that performs within
minutes what were previously 4 hours of manual switching procedures. Both DA switches and
electronically controlled reclosers operate in a sequence to restore service to feeders served from
one substation, which had a history of transmission reliability issues.
The cooperative also has received some benefit from having switches that can be remotely
operated instead of requiring a truck roll. Utilization of these capabilities, as well as the self-
healing scheme, will increase as operational experience increases and engineering analysis
continues. Clarke looks forward to adding more “brains” into the control software of these smart
devices in the future.

Costs and Benefits of Smart Feeder Switching –
Quantifying the Operating Value of SFS May 31, 2014
–7–
EnergyUnited
Motivation
EnergyUnited (EU) is a cooperatively owned utility serving 121,000 customers around
Statesville, North Carolina.
One of EU's top corporate goals is service reliability. Its current reliability rating is 99.98, but it
is focusing on smart grid technologies with the intent of improving reliability for members as
well as increasing overall efficiency.
Since EU's electric service area spans 19 counties throughout North Carolina, travel time
sometimes increases the time required to complete restoration. For this reason, EU piloted an
SFS project to test and demonstrate how this smart grid technology can increase reliability for
members.
Installation Description
Currently EU has a 12.5 kV delivery, known as the Boomer Delivery. From this delivery, it has
one circuit coming out, known as the Boomer Circuit. This circuit goes for several miles and is
located at the far end of its service territory. When power is lost from its service provider, it can
take a considerable amount of time for a crew to reach the site. Once service crews are at the site
and have determined that the outage is caused by a loss of the source, EU may back-feed this
circuit from another substation and circuit located approximately 8.5 miles away. Because the
back-feed is a fairly good distance from the Boomer Delivery, there is a limit as to how much of
the circuit can be back-fed. During lightly loaded periods, the entire circuit can be back-fed.
During more heavily loaded periods, EU can back-feed only a portion of the circuit. It can take
between an hour to 3 hours for crews to complete this back-feed and restore power to our
members. The Boomer Delivery is located at the end of a fairly long circuit owned by Duke
Energy. Because there is such a long distribution feeder serving this delivery, outages of the
source are not uncommon.
To provide greater reliability to members, EU proposed automating this back-feed using
distribution automation and the existing SCADA system. The automated system monitors the
loading on the circuit at all times. A monitoring system is placed at the source of the delivery to
sense a loss of source. In that event, the automated system determines the loading at the time just
before the outage occurred. Based on this information, the automated system determines if the
entire circuit, or only a portion, can be back-fed. Depending on the outcome of this decision, the
automated system operates a series of 2 reclosers and 3 switches out on the circuit and completes
the appropriate back-feed. Once power is restored to the source and EU has confirmed with the
delivery provider that the outage is over, EU personnel trigger the system to undo the back-feed
and return the circuit to normal operation.
Automating the back-feed system takes what typically would have been a 1- to 3-hour outage
and reduces it to less than 5 minutes in most cases.
Total smart feeder switching project cost was $214,000, of which $138,000 was hardware and
software purchased for the activity. Figure 3 shows EU’s one-line diagram.

Costs and Benefits of Smart Feeder Switching –
Quantifying the Operating Value of SFS May 31, 2014
–8–
Figure 3. EU Project One-Line Diagram
Planning Experience
EU requires a business case for all projects outside the scope of routine business operations and
with costs greater than $ 1,000.
There were two key drivers for the project in the business plan. One was the recognition that
distribution automation systems are increasingly commonplace and that there is a need to test
and build expertise in operating these systems. The second driver was the frequent source
outages on the remote Boomer feeder: “…automated switching system would eliminate the need
for crews to travel to Boomer and would reduce the outage time to almost nothing. In the last 5
years, this delivery point has been out a total of almost 45 hours. Through the existing back-feed
process, EU crews have been able to cut that to less than half. The proposed distribution
automation system would have reduced that to a little over 3 hours. CMI (Customer Minutes
Interrupted) would be reduced by 90%... Based on an outage history over the last 5 years, we
estimate that this project will save approximately 0.75 CAIDI minutes per year. At a total project
cost of $250,000, this equates to a cost per CAIDI minute of $333,000.” [9]
Communications were seen as a particular challenge: hills and rugged terrain make line-of-sight
communications difficult and existing communications infrastructure is sparse.
Deployment Status
EU is finishing the installation, with an expected completion date in mid-November 2013. All
hardware has been delivered, and EU is in the process of changing some poles out and installing
switches and other equipment. Once that is complete, Siemens will complete installation of the
controllers and commission the system.

Costs and Benefits of Smart Feeder Switching –
Quantifying the Operating Value of SFS May 31, 2014
–9–
Deployment Lessons Learned
“Communications paths are the most critical element. The switching schemes and logic is
actually a fairly simple thing. The real key is making sure all the devices can communicate well.”
[10]
Kotzebue Electric Association
Motivation
Kotzebue Electric Association (KEA) is a cooperatively owned utility serving 1,264 customers
around Kotzebue, Alaska. Its distribution system is not connected to the North American grid,
and it operates all of its own generation assets. Because of this, it faces black-start situations
atypical of those found at most distribution cooperatives.
Kotzebue frequently experiences temperatures below 40 degrees Fahrenheit and winds in excess
of 50 MPH. Due to these conditions, even routine distribution system maintenance is difficult
and places linemen at risk.
As rural residents in northwestern Alaska, KEA consumer-members face some of the highest
costs anywhere in the nation. In 2008, residential power rates in the region varied from $.48/kWh
in Kotzebue (up from $.39/kWh in 2007). KEA is working to implement long-term energy
options, which currently include battery storage and 3 MW of wind generation, to assist its
members in reducing their energy requirements.
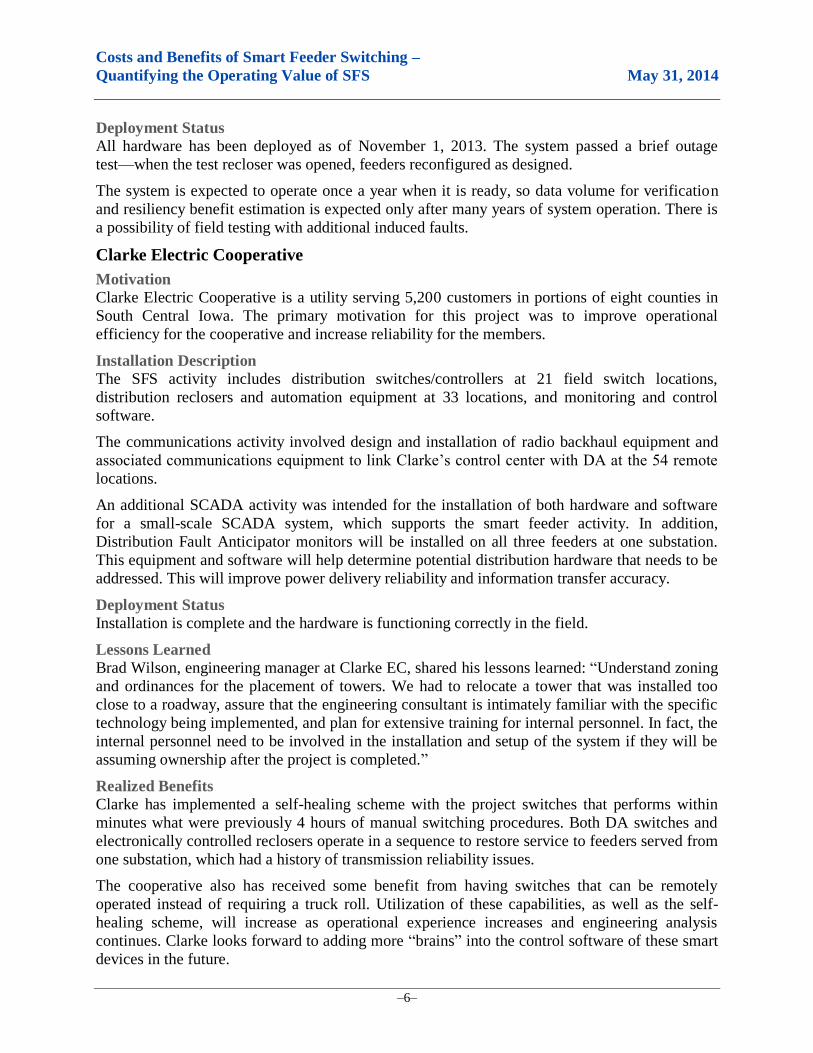
Installation Description
KEA extended its use of automatic feeder switching capabilities with two pad mount, SCADA-
controlled switches. This project doubled the number of automated switches at the utility,
bringing all four feeders in the system under remote control.
The additional switches allow for sectionalizing in response to construction and maintenance
needs. They also provide load shedding capabilities that do not require manual intervention by
work crews. In the case of a black-start of the system, remote control of all four feeders allows
easier service restoration and better power quality for consumers (due to reduced inrush
currents), as each half of the load in the system can now be brought up individually.
Total smart feeder switching project cost was $333,000, of which $308,000 was hardware and
software purchased for the activity.
The additional switches (numbers 3 and 4) are indicated in Figures 4 and 5, the system’s one-
line diagrams.
Costs and Benefits of Smart Feeder Switching –
Quantifying the Operating Value of SFS May 31, 2014
–10–
Figure 4. KEA Primary Distribution One-Line Diagram

Costs and Benefits of Smart Feeder Switching –
Quantifying the Operating Value of SFS May 31, 2014
–11–
Figure 5. KEA Feeder 4 One-Line Diagram
Planning Experience
The original engineering design for this project was done in 2003 for a Rural Utilities Service
(RUS)-funded installation of the original two pad mount switches.
Deployment Status
All hardware is deployed, tested, and operating correctly.

Costs and Benefits of Smart Feeder Switching –
Quantifying the Operating Value of SFS May 31, 2014
–12–
Owen Electric Cooperative
Owen Electric Cooperative is a utility serving 57,462 consumer-members around Owenton,
Kentucky.
This smart feeder switching project aimed to provide redundant power to a municipal sewage
treatment plan. Due to EPA regulations, the plant requires a highly reliable power supply to
avoid negative environmental impacts that could result from plant shutdown. Owen could offer
this capability more cheaply than backup generation by providing access to a second feeder
source activated instantly via smart feeder switching.
Installation Description
Owen's SFS activity was targeted at two sites that will be able to automatically switch load using
communication, switches, fault indicators and controls. In support, communications
infrastructure was upgraded, including licensed fiber/microwave communications links between
the Fulsom and Walton substations, and radio equipment was installed at 42 sites as support for
this and other activities.
Total project costs for hardware and software were $107,000.
Planning Experience
Previous experience with automatic source transfer on a remote feeder serving a large residential
subdivision provided the inspiration for this project. Multiple automatic service restoration
events were achieved on this previous project, and telemetry capabilities have also been used to
assist in other restoration events.
Deployment Status
The project hardware has been installed and in operation for over one year.
One source loss occurred during a period of high load. The switching system was not able to
automatically restore service. When hardware was returned to the manufacturer for service,
mechanical switch problems and a damaged control circuit board were discovered. The sewage
treatment plant did lose power, but the outage was such that no regulatory fines were incurred.
Salt River Electric
Motivation
Salt River Electric is a utility serving 47,411 consumer-members around Bardstown, Kentucky.
Salt River found that a majority of its outages in 2009 and 2010 were due to source losses at
substations, due to transmission problems. Lacking direct control at the transmission level, the
cooperative sought a method to improve reliability for its customers through smart feeder
switching and redundant transmission sources.
Installation Description
The Smart Feeder activity includes the installation of 29 S&C IntelliRupter distribution switches
with controllers. Also included in this activity is communications equipment required to make
this equipment work.
A total of 25 switches were installed at normal opens between pairs of feeders in Salt River's
system. Out of 100 circuits, 50 are now connected via this project hardware. In these 50 linked circuits, should an outage occur on either feeder or substation, the switches are configured to
automatically back-feed from unaffected circuits, if feasible. This involves an automatic testing

Costs and Benefits of Smart Feeder Switching –
Quantifying the Operating Value of SFS May 31, 2014
–13–
protocol, including voltage-based load testing and test reclosing operations. Delays of 2.5
minutes have been added to these automated switching operations to keep the switches from
fighting other equipment, notably control systems at the transmission level. Switches also are
able to be operator controlled remotely via SCADA.
Four additional switches were installed to create a looped circuit. These switches are intended for
fault isolation.
Circuits for this project were selected based on historical load from all seasons. Pairs were
selected for smart feeder switching in cases where the engineers were confident that each circuit
could back-feed the other regardless of load level. Additional pairs of circuits could have been
joined, but during times of high load, back-feed could not be guaranteed.
The total project cost is $1.32 million, of which $817,000 is hardware and software purchased
for the activity.
Deployment Status
The system has been installed and operational since mid-2012.
Lessons Learned
Out of 29 switches installed, four had hardware or software problems that required vendor
intervention. It was also found that the automation potential of the switches was excellent, but
this also led to a lengthy and complicated configuration process. The software interface for this
process is a potential area of improvement.
Realized Benefits
These switches also are useful for maintenance and sectionalizing. Co-op engineers estimated
that they are used for these purposes once every 3 days. The co-op staff also appreciates
automatic restoration events that occur in the middle of the night, which previously would have
required manual intervention.
Typical outage times before the system was active amounted to multiple hours. In instances in
which the smart feeder switches operate, this time has been reduced to minutes. The System
Average Interruption Duration Index (SAIDI) scores have been trending downward for the past
couple of years at Salt River. A survey of recent outages and outage time saved due to the smart
feeder switching follows.
Table 2. Salt River Post-Project Outages and Customer-Minutes Saved
Outage ID Customers Minutes Saved Customer-Minutes Saved
1 671 33 22,143
2 450 45 20,250
3 800 43 34,400
4 498 60 29,880
5 222 150 33,300
6 18 90 1,620
7 358 180 64,440
8 1795 50 89,750
9 481 21 10,101
10 412 21 8,652
11 344 45 15,480
12 261 124 32,364
13 137 125 17,125

Costs and Benefits of Smart Feeder Switching –
Quantifying the Operating Value of SFS May 31, 2014
–14–
Table 2. Salt River Post-Project Outages and Customer-Minutes Saved (continued)
Outage ID Customers Minutes Saved Customer-Minutes Saved 14 300 206 61,800
15 450 90 40,500
TOTAL 481,805
Snapping Shoals Electric Membership Corporation
Motivation
Snapping Shoals Electric Membership Corporation (SSEMC) is a utility serving 91,000
customers around Covington, Georgia. This project was undertaken to improve system
reliability, maintenance, and operational capabilities.
Installation Description
SSEMC's SFS activity significantly upgraded feeder switching capabilities. Following the
upgrade, which encompasses 100 new SCADA-controlled reclosers, SSEMC has approximately
31% (28,000+ meters) of its customers within a zone capable of automatic restoration, and all
but a few substations can be switched out of service remotely. As part of the project, some work
was done on upgrading the SCADA system to handle these automation-capable reclosers and
adding some fiber optic communications runs and Ethernet radios to the required field reclosers
as necessary.
Project hardware comprised 97 Cooper NOVA reclosers and 3 S&C IntelliRupter PulseClosers.
A majority of the switches were deployed as pairs, protecting customers in an automatic source
transfer (AST) scheme, while the rest are independently deployed at normally open points. The
independent devices are not automated but serve two critical roles by (1) facilitating outage
restorations for pairs of feeders and (2) potentially being used for preplanned switching. The
communications backbone is mostly single-mode fiber. Some of the more remote devices are
served with Ethernet radios. (See Figure 6 for a map of SSEMC’s AST regions.)
Total project cost is $4.11 million, of which $2.11 million is hardware and software purchased
for the activity.
Figure 6. SSEMC AST Regions: Existing in Yellow, Project Additions in Blue
Costs and Benefits of Smart Feeder Switching –
Quantifying the Operating Value of SFS May 31, 2014
–15–
Planning Experience
SSEMC's first experience with smart feeder switching came in 2001. Following some outages to
a large commercial customer, the cooperative decided to install an S&C Electric IntelliTeam
AST system. This system detects outage on a primary feeder, switches load to a back-up feeder
with no human intervention, and returns service to the primary feeder after power restoration.
This technology has been a success, preventing 10 outages while serving up to 3 MW of load for
approximately 60 customers over its past 12 years in service. However, the IntelliTeam system
was not able to communicate with the SCADA system, limiting its operational potential.
In the years following this initial AST experience, SSEMC deployed several more schemes
serving dense commercial zones, using controls that also were selected for the Smart Grid
Demonstration Project. The new schemes were designed using a decentralized approach, with
SCADA playing a supervisory role. The switching schemes restored power in much the same
way as the original IntelliTeam, but they also updated SCADA after events happened and
allowed the SCADA to take manual control when necessary.
Deployment Status
The hardware is deployed and the system was put into operation this year. Outage records and
switching operations are being retained to quantify the value of the system.
Deployment Lessons Learned
From a distribution system employee’s perspective, SFS can be scary. Most employees are not
accustomed to working with technology that can automatically re-route power. Extensive
training is required by some departments, but SSEMC encourages employees from all
departments to attend. The results from the training have been fascinating, especially regarding
employees who attend only because they are curious. Linemen initially had many questions
about the safety aspects of automation. After training and experience with the system, they see
how quickly narrowing down the scope of an outage reduces the pressure on line crews. The
temptation to rush is reduced once most of the lights are on, thus enhancing safety. With
participation comes better understanding, new ideas, acceptance, and results. What SSEMC has
learned is that SFS is much more than technology. There is much more to learn, and the
cooperative appreciates the opportunity that this grant has afforded.
SSEMC's system also is creating a great deal of outside interest, including an article in a recent
issue of the trade journal Transmission and Distribution World [8]. Outside parties are most
interested in how the cooperative has created a solution that goes beyond the individual
components and demonstrates a comprehensive technology plan.
Realized Benefits
SCADA and switch automation used to assist with outage restorations has worked very well.
Power can be restored safely, faster, and with fewer employees than before. In 2012, SSEMC
experienced 16 events for which AST was used to address outages, thus preventing more than
11,000 consumer-hours of outage time. In five of those events, AST schemes automatically
switched, preventing some customers from experiencing any service interruption. In that same
year, more than 200 faults were automatically located. Most of those faults did not result in an
outage, but the root cause was found about 75% of the time.
System maintenance also was improved, with savings realized through SFS. In spring 2013,
several substations underwent routine testing, during which station unloading was accomplished

Costs and Benefits of Smart Feeder Switching –
Quantifying the Operating Value of SFS May 31, 2014
–16–
quickly via remote switching. Normally, if everything goes as planned, testing is done during
normal business hours with time to spare but, if there is a problem, restoring load can be delayed
until after hours or even into the following day. In separate incidents, problems were discovered
at two substations; it was after 10 p.m. before repairs were done on one of the stations, but
dispatch was able to switch all 6 feeders back to normal from the office. Traditionally, this would
have tied up a truck and one or two people at each open point on overtime, or the system would
have been left as abnormal until the following day.
When problems were found on substations and the repairs pushed return switching past normal
working hours, the new equipment saved man hours in switching the substation out of service via
SCADA. However, the bulk of the benefit is the savings in crews and equipment on overtime,
not just actively working, but also waiting on the repairs to be done for follow-up work.
The new equipment also has improved preplanned substation switching. Before the new
equipment was installed, dispatch had to come to work at 6 a.m. to have a substation manually
switched out of service by 8 a.m. for testing. With SCADA-enabled devices in place, the same
switching can be done in about 30 minutes from the office.
Washington-St. Tammany Electric Cooperative
Motivation
Washington-St. Tammany Electric Cooperative (WSTE) is a utility serving 51,000 members
north of New Orleans, Louisiana. The objective of this project was to improve the reliability of
the system's transmission component, moving toward a self-healing capability. Hurricanes are a
frequent hazard in the utility's service area, thus increasing the risk of large outages.
Installation Description
WSTE owns and operates 30 distribution substations served by 69 kV transmission lines. Unlike
most cooperatives, WSTE owns transmission assets, including 180 miles of transmission lines.
These, in turn, serve more than 5,000 miles of distribution line.
There are three components to the project—the SFS components, the SCADA system for
control, and the supporting communications infrastructure. The communications infrastructure
project includes fiber optic equipment at 14 substations. The SCADA system includes software
and hardware requirements to implement advanced transmission and distribution automation
projects. The SFS component involves installation of 24 transmission breaker relays and 27
transmission voltage monitoring systems in distribution substations.
Breaker relays are designed to operate in pairs to isolate faults, reclose in cases of momentary
faults, and operate under SCADA control remotely. In concert with these capabilities, WSTE is
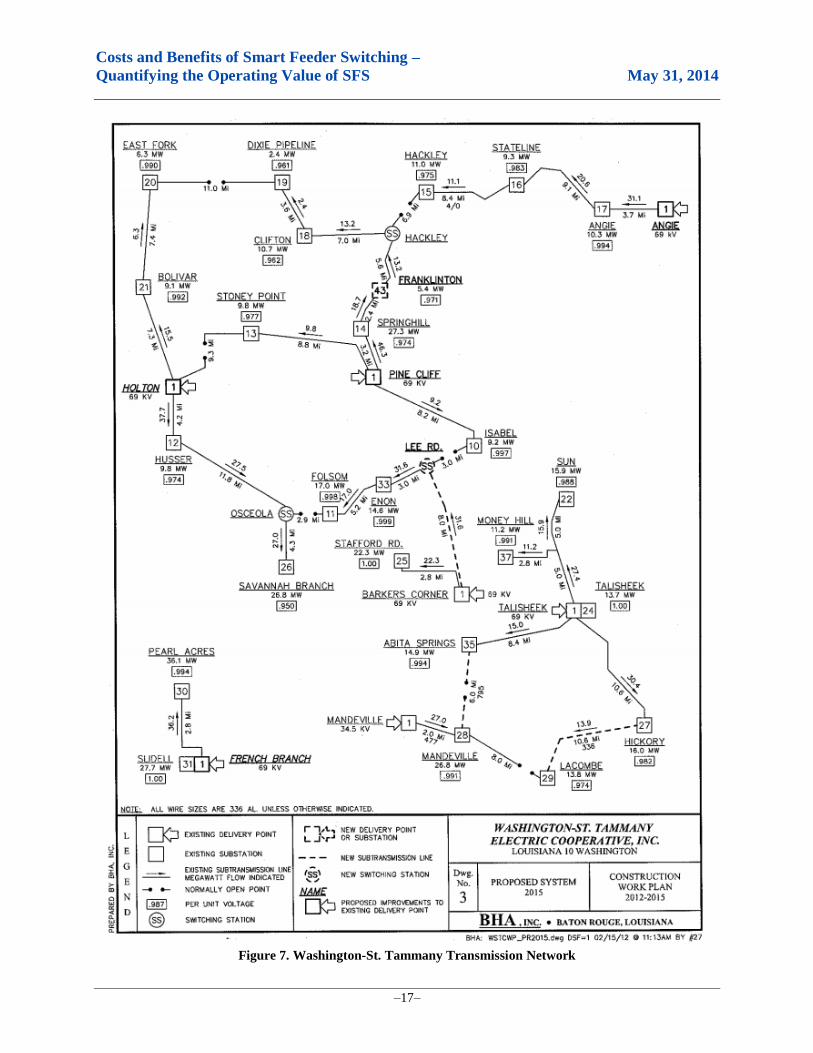
closing the normal opens in its transmission network (see Figure 7). As a result, all substations
will be served by 2 to 4 sources, and the long-term plan is to connect all substations in a heavily
meshed network.
The total project cost is $6.36 million, of which $3.31 million comprises hardware and software
purchased for the activity.
Costs and Benefits of Smart Feeder Switching –
Quantifying the Operating Value of SFS May 31, 2014
–17–
Figure 7. Washington-St. Tammany Transmission Network

Costs and Benefits of Smart Feeder Switching –
Quantifying the Operating Value of SFS May 31, 2014
–18–
Planning Experience
WSTE’s transmission reliability strategy has been part of its engineering work plans for many
years. In choosing to pursue upgrades of the transmission system instead of the distribution
system, WSTE emphasized cutting down on transmission outages which, while rarer than
distribution outages, affected more customers, since they cut off power to multiple substations.
Furthermore, transmission faults on this rural system typically take line crews multiple hours to
isolate and clear. When fully operational, the new automated switching scheme and multi-source
transmission network will take the length of these outages from hours to less than a minute.
SCADA and communications assets installed as part of this project will serve as a template for
extending similar SFS capabilities to the distribution system.
Deployment Status
Deployment of the communications components of this project is ongoing and is expected to be
completed by the end of 2013. During communications planning, a fiber optic option was found
to be more economical than the original microwave/radio system, requiring schedule changes.
COST-BENEFIT METHODOLOGY
The following sections provide details about the SFS benefits and the cost methodology
developed as part of this study.
SFS Benefits
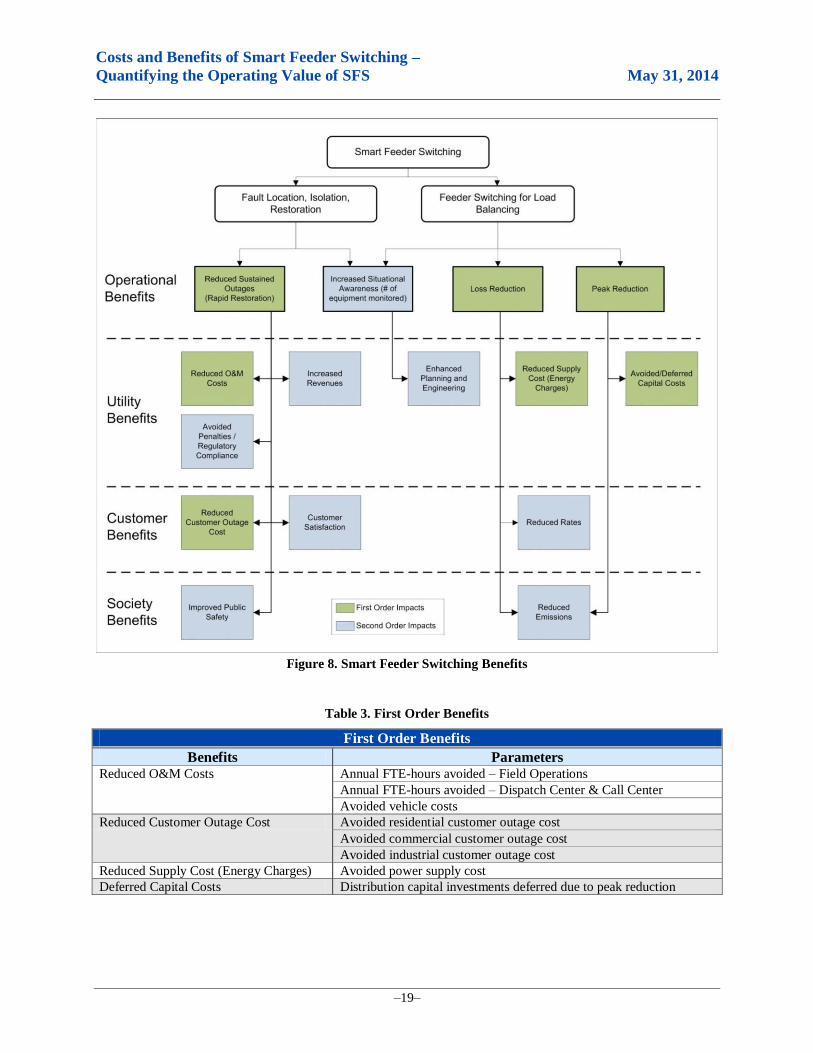
SFS benefits were defined within three different domains. First, they were identified as deriving
from either (1) Fault Location, Isolation, and Restoration; or (2) Feeder Switching for Load
Balancing. Although these two functional areas both utilize switching, their control algorithms
and grid impacts are quite different. Thus, this breakdown helped to determine the costs and
benefits of each area.
Second, they were assigned to either a stakeholder category or, for benefits independent of a
particular stakeholder group, to the “operational benefit” category. Each of these operational
benefits can be baselined and measured easily. The first two domains are depicted in Figure 8.
Finally, benefits were categorized as having either first or second order impacts. First order
impacts are considered to be the main drivers of SFS systems. Tables 3 and 4 depict first and
second order benefits, respectively, and also include parameters needed to calculate the benefit.
Some benefit areas, such as reduced O&M costs, represent more than one sub-benefit group and
need to be calculated separately and summed up at the end. Therefore, parameters needed to
calculate each sub-benefit area also are listed in these tables.
Costs and Benefits of Smart Feeder Switching –
Quantifying the Operating Value of SFS May 31, 2014
–19–
Figure 8. Smart Feeder Switching Benefits
Table 3. First Order Benefits
First Order Benefits
Benefits Parameters Reduced O&M Costs Annual FTE-hours avoided – Field Operations
Annual FTE-hours avoided – Dispatch Center & Call Center
Avoided vehicle costs
Reduced Customer Outage Cost Avoided residential customer outage cost
Avoided commercial customer outage cost
Avoided industrial customer outage cost
Reduced Supply Cost (Energy Charges) Avoided power supply cost
Deferred Capital Costs Distribution capital investments deferred due to peak reduction
Costs and Benefits of Smart Feeder Switching –
Quantifying the Operating Value of SFS May 31, 2014
–20–
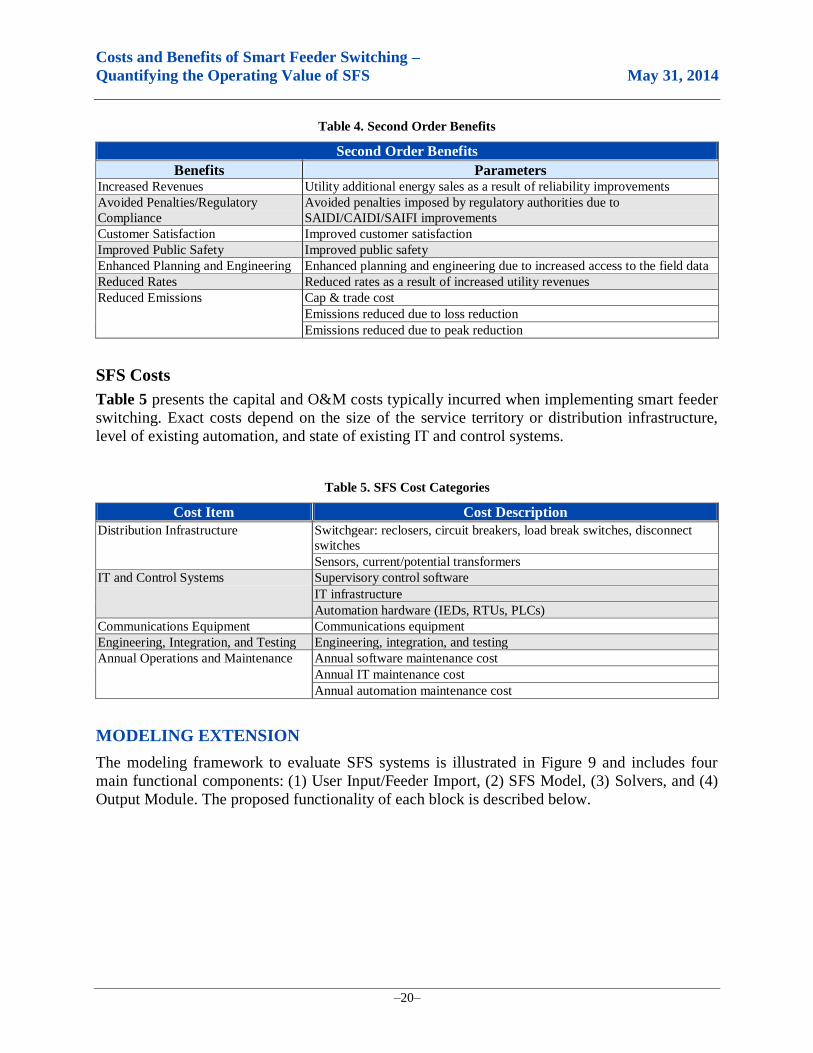
Table 4. Second Order Benefits
Second Order Benefits
Benefits Parameters Increased Revenues Utility additional energy sales as a result of reliability improvements
Avoided Penalties/Regulatory
Compliance
Avoided penalties imposed by regulatory authorities due to
SAIDI/CAIDI/SAIFI improvements
Customer Satisfaction Improved customer satisfaction
Improved Public Safety Improved public safety
Enhanced Planning and Engineering Enhanced planning and engineering due to increased access to the field data
Reduced Rates Reduced rates as a result of increased utility revenues
Reduced Emissions Cap & trade cost
Emissions reduced due to loss reduction
Emissions reduced due to peak reduction
SFS Costs
Table 5 presents the capital and O&M costs typically incurred when implementing smart feeder
switching. Exact costs depend on the size of the service territory or distribution infrastructure,
level of existing automation, and state of existing IT and control systems.
Table 5. SFS Cost Categories
Cost Item Cost Description
Distribution Infrastructure Switchgear: reclosers, circuit breakers, load break switches, disconnect
switches
Sensors, current/potential transformers
IT and Control Systems Supervisory control software
IT infrastructure
Automation hardware (IEDs, RTUs, PLCs)
Communications Equipment Communications equipment
Engineering, Integration, and Testing Engineering, integration, and testing
Annual Operations and Maintenance Annual software maintenance cost
Annual IT maintenance cost
Annual automation maintenance cost
MODELING EXTENSION
The modeling framework to evaluate SFS systems is illustrated in Figure 9 and includes four
main functional components: (1) User Input/Feeder Import, (2) SFS Model, (3) Solvers, and (4)
Output Module. The proposed functionality of each block is described below.

Costs and Benefits of Smart Feeder Switching –
Quantifying the Operating Value of SFS May 31, 2014
–21–
Figure 9. SFS Analysis Modeling Framework
User Input/Feeder Import: There are two types of inputs in this framework: user inputs and
model import. User inputs include unit cost data, design parameters or preferences, financial
parameters, feeder load data, and model configuration parameters, which are needed to perform
cost and benefit calculations.
Feeder import is a specific feature that can be used to import distribution system models from
commercially available software, such as Windmill, CYME, or SynerGEE. Utilizing these
models will improve the accuracy of benefit estimations. It is also recommended to keep a
library of typical distribution feeders in this model so that users may select a feeder that
represents their system in case the distribution model is not available. Pacific Northwest National
Laboratory (PNNL) has completed a Feeder Taxonomy project and has identified typical
distribution feeders in the U.S. that can be leveraged in this effort.
SFS Model: SFS Model is located at the core of this framework, where three main
functions will be accomplished:
Input/Output Data Processing: Input data are converted to a format that solvers such as
GridLAB-D can utilize. Output data are formatted for analysis reporting.
Simulation scenarios: User-defined scenarios will be simulated.
Costs Calculations: SFS Model will calculate costs based on user-provided data and
default data available in its library. Cost calculation methodology is described in detail
in the following sections.
Benefits calculations: Simulation results processed to calculate the monetary benefits
listed in Tables 2 and 3.

Costs and Benefits of Smart Feeder Switching –
Quantifying the Operating Value of SFS May 31, 2014
–22–
Solvers: Solvers include power system analysis software such as GridLAB-D, optimization
engines such as CPLEX, and market simulation software such as PROMOD. It is expected
that the majority of analysis can be done using GridLAB-D.
GridLAB-D is a power analysis software application with capabilities for modeling and
simulating new smart grid technologies. The software has diverse functionality for
running analyses on transmission, distribution, and market systems. We propose use of
the Distribution Analysis module to perform time-series distribution load flow analysis
and estimate the power loss and peak reduction, and the Reliability module to
determine the improvements in reliability indices.
Output Module: This module would generate tabular and graphical results, including
inputs (design, financial, simulation parameters, etc.); derived inputs (customer outage
costs, reduced losses, reliability indices, annual capital and O&M costs, etc.); annual
costs/benefits in dollar amounts ($) and cost/benefit ratios (%); annual trend lines of
reliability improvements/loss reductions/peak reductions; pie chart of cost/benefits; and bar
chart of annual cost/benefits.
Cost Calculation Approach
The SFS analysis process will leverage the SFS deployment cost data that will be obtained from
cooperatives, as they tend to be more accurate than generic integration and O&M cost estimates.
A proposed methodology for a cooperative to calculate SFS cost items is illustrated in Figure 10.
Figure 10. SFS Cost Calculation Methodology
In the case that unit cost data and proposed SFS design parameters are available, the user will be
prompted to enter unit cost data, such as installed cost of reclosers, load break switch, etc.
Necessary SFS system cost line items will be defined in the cost calculation tool. If a preliminary
design already has been completed, the user will be able to enter design parameters, such as
number of switches, type of switches, and type of communication system.
If the user does not have the unit cost data or preliminary design available, then a high-level cost
estimate will be provided by the tool. To achieve this, the user will be asked to provide high-
level design preferences. The cost model would include default unit cost data derived from
Costs and Benefits of Smart Feeder Switching –
Quantifying the Operating Value of SFS May 31, 2014
–23–
cooperative-supplied cost data. The user will be able to select from this cost library to define the
cost of specific devices.
User input cost and design data and default cost items will be used by the cost estimator to
determine SFS solution capital and O&M costs.
Benefits Calculation Approach
The benefit analysis will entail both data calculations based on acquired performance data (in the
case of peak load reduction) and more complex model simulation (as needed for loss reduction).
The SFS analysis process will allow users to import industry-standard distribution system models
from vendor products such as Windmill, CYME, and SynerGEE. This will enable the user to
establish custom-tailored models that will closely resemble their distribution system parameters
and obtain results relevant to their desired scenarios.
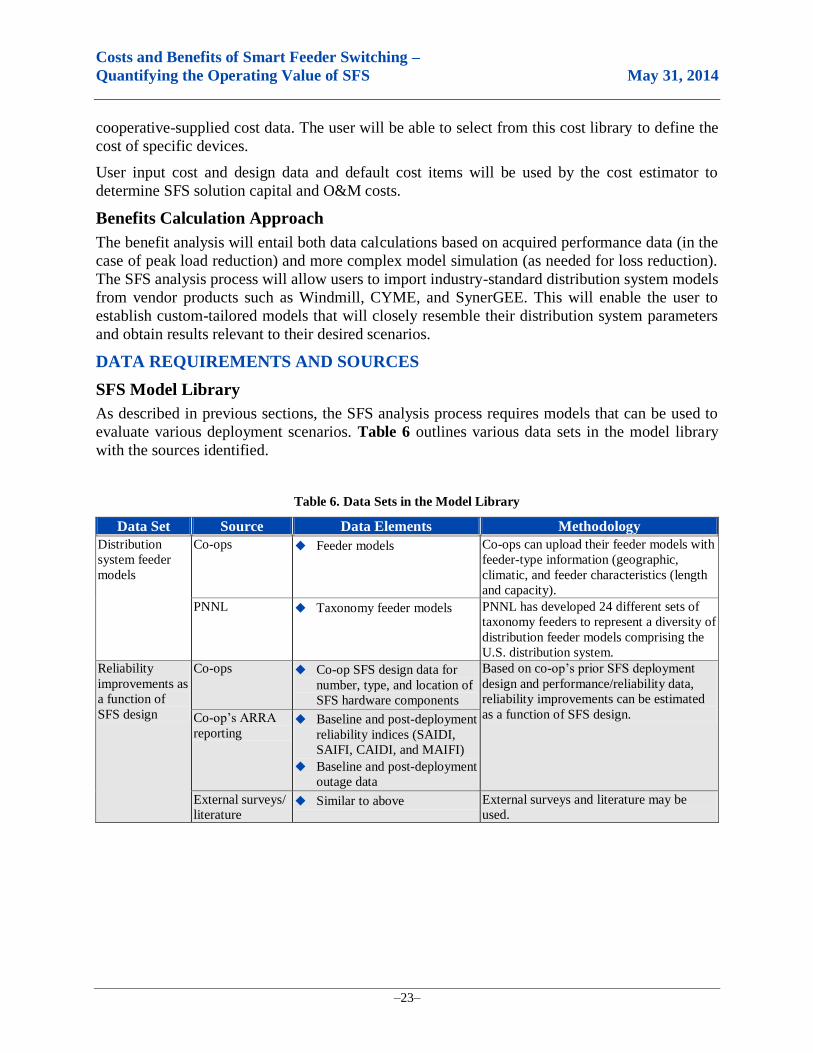
DATA REQUIREMENTS AND SOURCES
SFS Model Library
As described in previous sections, the SFS analysis process requires models that can be used to
evaluate various deployment scenarios. Table 6 outlines various data sets in the model library
with the sources identified.
Table 6. Data Sets in the Model Library
Data Set Source Data Elements Methodology
Distribution
system feeder
models
Co-ops Feeder models Co-ops can upload their feeder models with
feeder-type information (geographic,
climatic, and feeder characteristics (length
and capacity).
PNNL Taxonomy feeder models PNNL has developed 24 different sets of
taxonomy feeders to represent a diversity of
distribution feeder models comprising the
U.S. distribution system.
Reliability
improvements as
a function of
SFS design
Co-ops Co-op SFS design data for
number, type, and location of
SFS hardware components
Based on co-op’s prior SFS deployment
design and performance/reliability data,
reliability improvements can be estimated
as a function of SFS design. Co-op’s ARRA
reporting Baseline and post-deployment
reliability indices (SAIDI,
SAIFI, CAIDI, and MAIFI)
Baseline and post-deployment
outage data
External surveys/
literature Similar to above External surveys and literature may be
used.

Costs and Benefits of Smart Feeder Switching –
Quantifying the Operating Value of SFS May 31, 2014
–24–
Table 6. Data Sets in the Model Library (continued)
Data Set Source Data Elements Methodology Loss and peak
reduction as a
function of
amount of
transferred load
Co-op’s ARRA
reporting SFS event information (such
as amount of load transfer,
duration, etc.)
Baseline and post-deployment
8760 feeder- loading data
(kW, kVAR, kVA)
Baseline and post-deployment
equipment overload data
Baseline and post-deployment
distribution losses and power
factor
Based on co-op’s prior SFS deployment
design and operational data, loss
reduction/peak reduction can be estimated
as a function of amount of transferred loads
for various feeder types.
External
surveys/literature Similar to above External surveys and literature will be used.
Customer outage
costs as a
function of
reliability
indices
Co-ops Residential customer outage
cost
Commercial customer outage
cost
Industrial customer outage
cost
Calculate customer outage costs for various
customer classifications.
External
surveys/literature Similar to above External surveys and literature will be used.
ICE Calculator Outage cost DOE’s Interruption Cost Estimate (ICE)
calculator is an extensive tool for
estimating the customer outage costs of
various customer classifications.
Estimation is based on several realistic
assumptions and can be customizable for
various geographic areas and different
customer characteristics.
O&M cost
reduction as a
function of
reliability
indices
Co-op’s ARRA
reporting Baseline and post-deployment
O&M costs
Calculate the reduction in O&M costs due
to the SFS deployments.
External
surveys/literature Baseline and post-deployment
O&M costs
External surveys and literatures will be
used.
Financial Data Co-ops Average annual retail energy
rate ($/kWh); average annual
purchase power rate ($/kWh);
inflation rate; tax rate; GDP;
average field, dispatch center,
and call center operations
labor rate ($/hour); and
expected life time of SFS
project (years)
Calculate various financial factors listed.
External
surveys/literature Similar to above External surveys and literature will be used.
Cost Data Co-op’s ARRA
reporting T&D infrastructure costs, IT
and control systems,
communication hardware
costs, and annual O&M costs
Calculate financial factors.
External
surveys/literature Similar to above External surveys and literature will be used.
Costs and Benefits of Smart Feeder Switching –
Quantifying the Operating Value of SFS May 31, 2014
–25–
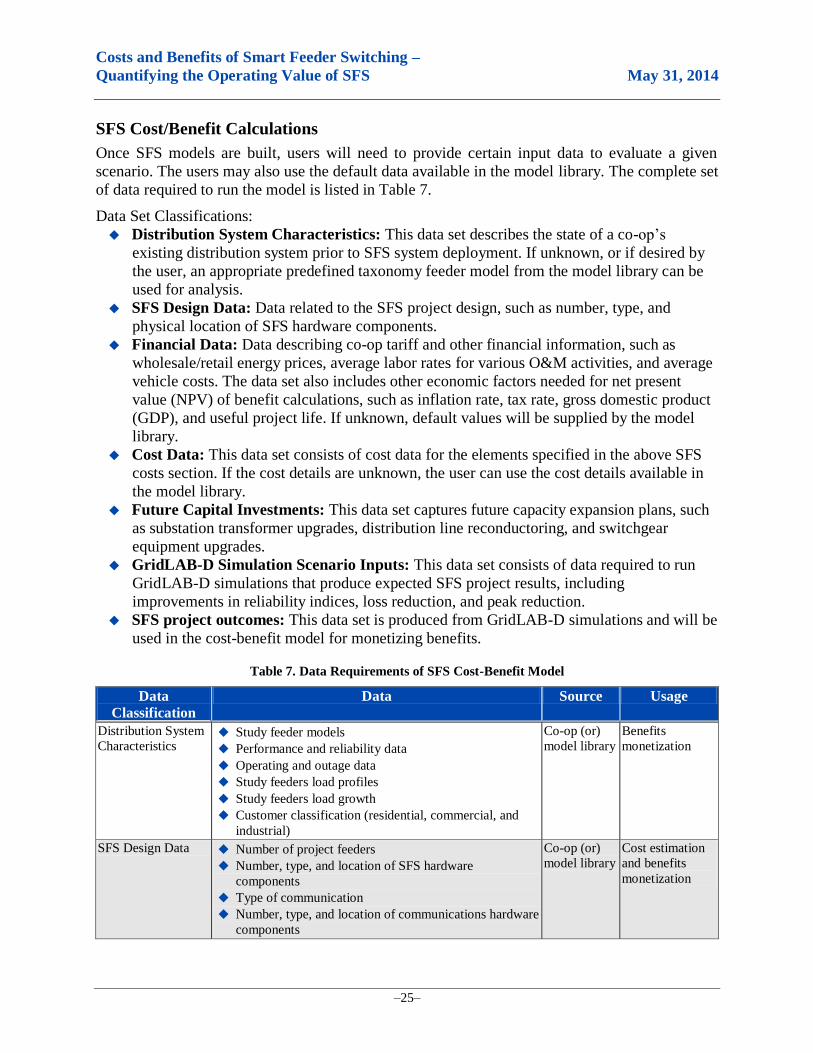
SFS Cost/Benefit Calculations
Once SFS models are built, users will need to provide certain input data to evaluate a given
scenario. The users may also use the default data available in the model library. The complete set
of data required to run the model is listed in Table 7.
Data Set Classifications:
Distribution System Characteristics: This data set describes the state of a co-op’s
existing distribution system prior to SFS system deployment. If unknown, or if desired by
the user, an appropriate predefined taxonomy feeder model from the model library can be
used for analysis.
SFS Design Data: Data related to the SFS project design, such as number, type, and
physical location of SFS hardware components.
Financial Data: Data describing co-op tariff and other financial information, such as
wholesale/retail energy prices, average labor rates for various O&M activities, and average
vehicle costs. The data set also includes other economic factors needed for net present
value (NPV) of benefit calculations, such as inflation rate, tax rate, gross domestic product
(GDP), and useful project life. If unknown, default values will be supplied by the model
library.
Cost Data: This data set consists of cost data for the elements specified in the above SFS
costs section. If the cost details are unknown, the user can use the cost details available in
the model library.
Future Capital Investments: This data set captures future capacity expansion plans, such
as substation transformer upgrades, distribution line reconductoring, and switchgear
equipment upgrades.
GridLAB-D Simulation Scenario Inputs: This data set consists of data required to run
GridLAB-D simulations that produce expected SFS project results, including
improvements in reliability indices, loss reduction, and peak reduction.
SFS project outcomes: This data set is produced from GridLAB-D simulations and will be
used in the cost-benefit model for monetizing benefits.
Table 7. Data Requirements of SFS Cost-Benefit Model
Data
Classification
Data Source Usage
Distribution System
Characteristics Study feeder models
Performance and reliability data
Operating and outage data
Study feeders load profiles
Study feeders load growth
Customer classification (residential, commercial, and
industrial)
Co-op (or)
model library
Benefits
monetization
SFS Design Data Number of project feeders
Number, type, and location of SFS hardware
components
Type of communication
Number, type, and location of communications hardware
components
Co-op (or)
model library
Cost estimation
and benefits
monetization

Costs and Benefits of Smart Feeder Switching –
Quantifying the Operating Value of SFS May 31, 2014
–26–
Table 7. Data Requirements of SFS Cost-Benefit Model (continued)
Data
Classification
Data Source Usage
Financial Data Average annual retail energy rate ($/kWh)
Average annual purchase power rate ($/kWh)
Inflation rate
Tax rate
GDP
Average field operations labor rate ($/hour)
Average dispatch center and call center operations labor
rate ($/hour)
Average vehicle costs per fault location, isolation, and
restoration event
Expected life time of SFS project (years)
Co-op (or)
model library
Cost estimation
and benefits
monetization
Cost Data T&D Infrastructure costs
IT and control systems
Communication hardware costs
Annual O&M costs
Co-op (or)
model library
Cost estimation
GridLAB-D
Simulation
Scenarios Inputs
Updated feeder models with SFS design components
Feeder switching sequence for load balancing event
(switch positions)
Feeder switching sequence for fault location, isolation,
and restoration event (Switch positions)
Event duration
Event frequency (/yr)
Device settings (substation transformer LTC, capacitor
bank, etc.)
Co-op Benefits
monetization
SFS project
outcomes Reliability indices improvements (SAIDI, CAIDI, and
SAIFI)
Loss reduction (kWh)
Peak reduction (kW)
GridLAB-D
simulations
Benefits
monetization
Costs and Benefits of Smart Feeder Switching –
Quantifying the Operating Value of SFS May 31, 2014
–27–
REFERENCES
1. “Reliability Improvements from the Application of Distribution Automation
Technologies—Initial Results, Smart Grid Investment Grant Program.” December 2012.
2. Sullivan, M. J. 2009. “Estimated Value of Service Reliability for Electric Utility Customers
in the United States.”
3. “Evaluating Smart Grid Reliability Benefits for Illinois, The National Association of
Regulatory Utility Commissioners.” A report for the Illinois Commerce Commission,
funded by the U.S. Department of Energy.
4. Price, S., and M. McGranaghan. 2006. “Value of Distribution Automation Applications.”
California Energy Commission, PIER.
5. “Methodological Approach for Estimating the Benefits and Costs of Smart Grid
Demonstration Projects, EPRI report.”
6. Brown, D. L., et al. 1991. “Prospects for Distribution Automation at Pacific Gas & Electric
Company.” Power Delivery, IEEE Transactions 6(4), 1946–1954.
7. Interruption Cost Estimate (ICE) Calculator, available at: http://icecalculator.com/.
8. Available at: http://tdworld.com/overhead-distribution/snapping-shoals-makes-smart-
switch
9. EnergyUnited Business Plan.
10. Personal communication, Steve Estes, System Engineer at EnergyUnited.