Embed Size (px)
Citation preview

MFR PAPER 1137
With proper equipment and knowledge, the spiny lobster fishery off Florida can be quite profitable.
Both Bruno G. Noetzel and Mikolaj G. Wojnowski are with the Economic and Marketing Research Division, National Marine Fisheries Service, NOAA, Washington, DC 20235.
Costs and Earnings in the Spiny Lobster Fishery, Florida Keys
gross tons in the early 1950's to about 30 gross tons in the latest years. As still another indication of increased fishing activity, the average number of traps rose from 80 to 440 per fishing craft.
In 1973, about 20 percent of landings on Florida's west coast came from lobstering in distant waters in the Caribbean off the coasts of Nicaragua and Honduras. The distant water fleet operates mainly out of the St. Peters-
BRUNO G. NOETZEL and MIKOLAJ G. WOJNOWSKI
INTRODUCTION
The spiny lobster (Panlilirus argus) occupies a prominent place on the list of highest valued seafood items accepted by the U.S. consumer. In terms of unit value to the fishermen, it is surpassed only by the scallops (meat), the American lobster, some clams, and some shrimps I. The great majority of spiny lobsters caught by U.S. fishermen are landed in Florida ports. In 1973, out of 11.1 million pounds of total Florida landings, valued at $11.6 million, 45 percent by weight (46 percent by value) were landed on Florida's west coast with the remainder occurring on the east coast2
.
Florida's west coast fishery for spiny lobster has been growing rapidly over the past 25 years. The number of vessels and boats (vessels have a capacity of 5 net tons or more, boats a capacity of less) registered for this fishery increased from 71 in 1950 to 337 in 1971, with the number of traps going from 5,715 to 147,037 during that period (Table 1). The value of landings rose from around $200,000 a year in the early 1950's to over $5 million in the early 1970's. A fivefold increase both in landings and in price at dockside brought about this rise in value (Fig. I).
Parallel to the changes in number, the size of the average vessel in this fishery also increased from about 10
I Fisheries of the United States, 1973, Current Fishery Statistics No. 6400, Department of Commerce, National Oceanic and Atmospheric Administration, National Marine Fisheries Service, Washington, D. c., March 1974. 'For statistical purposes, the county line between Dade and Monroe counties in southern Florida is used as the dividing line for Florida's east coast and west coast landings.
Table 1.-Florlda west coast spiny lobster fishery: Number of vessels, boats, pots, and fishermen; years 1950-1971.
Number of Vessels ' total Number of Number of fishermen Year vessels' gross tonnage boals' On vessels
t950 2 17 69 4 1955 2 20 61 4 1960 16 171 152 29 1965 26 306 166 56 1966 56 624 210 104 1967 75 1.169 224 143 1966 137 3.433 135 323 1969 92 2,165 176 164 1970 123 3,534 214 267 1971 142 4,184 195 364
IVessel : A commercial fishing craN having a capacity of 5 net tons or more. 2Boat: A commercial fishing craft having a capacity of less than 5 net tons.
On boats
90 61
192 306 300 330 214 255 331 259
Number of Traps
5.715 12.700 54 .640 69.700 74.550 91,600 96,500 96,955
150,050 t47 ,037
Source : Fishery Statistics of the United States. various years. Department of Commerce, National Oceanic and Atmospheric Administration, National Marine Fisheries Service (former Bureau of Commercial Fisheries), Washington, D.C.
7 7
6 8
5
CO 0 Z4
~ Z 2 j 3 i
2
Figure 1,-Florlda west coast: Spiny lob,ter landings, year. 194&-1973,
25
SpllHing lobster tails prior to packaging for restaurant use.
burg-Tampa area. According to Holmsen (1972), vessels in this fleet are 50 to 80 feet in length and fish about 400 traps . The trip length is 60 to 90 days and the catch is landed in the form of frozen tails.
The remaining 80 percent of landings originated in local waters along the Florida Keys. Vessels and boats in this local fishery are based mainly in Key West and Marathon, and are, in general , smaller than vessels in the distant water fishery . It is this fleet of small vessels and boats that is the subject of the present analysis.
THE FISHERY Laws and Regulations
By State law, a license is required of all boats and vessels (and other craft) equipped to take saltwater products from the tide or salt waters of the State. A certificate of registration is issued with each license sold. The fishing season for spiny lobster is closed between 31 March and I August of each year. Traps may be placed in the water 10 days prior to the opening of the season, and must be removed within 5 days after closure. Traps that may be used are of wood slat , in size not to exceed 3 x 3 x 2 feet, or the equivalent in cubic feet. Each trap has a buoy attached to it except where the traps are tied together
26
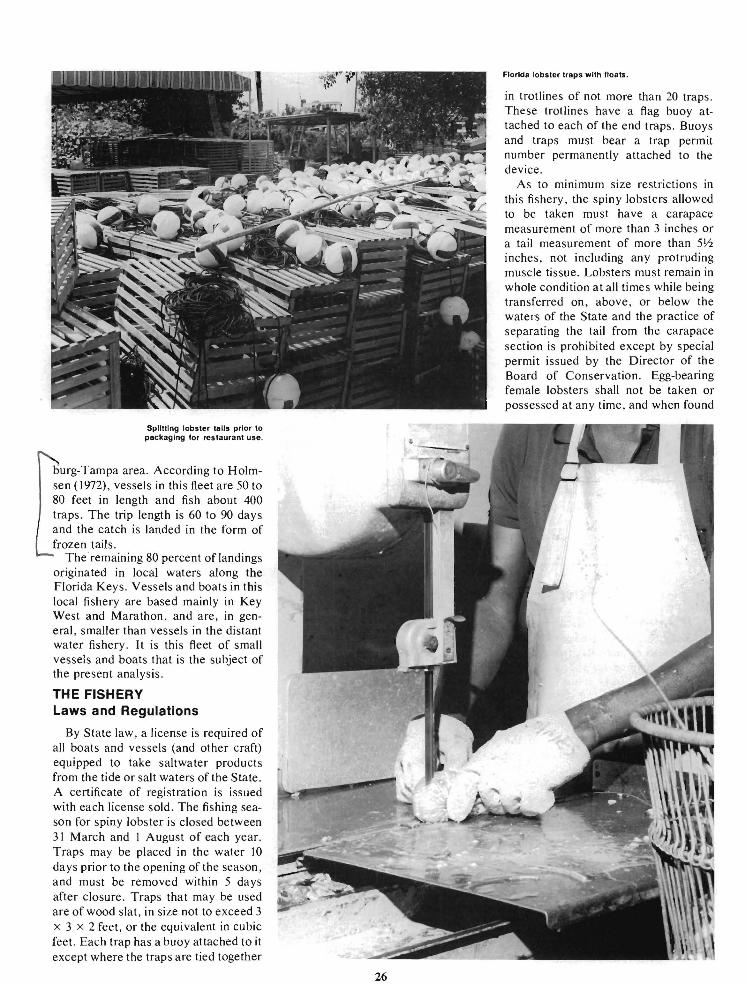
Florida lobster traps with floats.
in trotlines of not more than 20 traps . These trotlines have a flag buoy attached to each of the end traps. Buoys and traps must bear a trap permit number permanently attached to the device.
As to minimum size restrictions in this fishery, the spin y lobsters allowed to be taken must have a carapace measurement of more than 3 inches or a tail measurement of more than 5Y2 inches, not including any protruding muscle tissue. Lobsters must remain in whole condition at aU times while being transferred on, above , or below the waters of the State and the practice of separating the tail from the carapace section is prohibited except by special permit issued by the Director of the Board of Conservation. Egg-bearing female lobsters shall not be taken or possessed at any time, and when found

in traps they must be immediately returned to the water free, alive, and unharmed. The practice of stripping egg-bearing lobsters in order to remove the eggs is prohibited .
Fishing Operations
Fishing grounds are located along the reefs on both sides of the Florida Keys, approximately 3-6 miles from port. Spiny lobsters are usually caught in less than 30 feet of water, but they exist in much greater depths where there is a rocky bottom (Smith 1958). The I-day trips consist of returning in the early morning to the area where the fisherman's traps were placed in water before; working the traps, i.e., hauling, removing the catch , repairing the traps if necessary, brushing them clean of fouling organisms, rebaiting, and placing them back in water in their approximate original location; and returning to port in the late afternoon for unloading.
The number of traps that can be handled depends on the size of the
Rinsing lobster prior to cooking.
crew (one or two men), their skills, and on the location of the trap hauler. With one man on board and the hauler located aft of the boat, up to 120 traps can be handled. With two men on board and the"""Same winch location, the number of handled traps will increase to~With the winch mounted at the side of the boat, from where the operator has also control of the boat, the number of handled traps increases to 150 and 250, respectively. Fish heads (grouper), canned sardines, or pieces of cow hide are used as bait. The catch is stored in wet burlap bags3.
Some of the vessels and boats are equipped (in addition to lobster traps) with lines and hooks for finfish (grouper, snapper), or with stone crab pots . These are then able to switch to other fishing, mainly towards the end of the season when lobsters are less available, and to extend fishing into the offseason months (April-July) .
3Cope (1959) gives a detailed description of gear and fishing methods in this fishery .
27
THE SAMPLE Included in our sample for this
analysis are 9 vessels and 12 boats, ranging in length from 26 to 40 feet ' . The average vessel in the sample is 35 feet long, and the average boat 33 feet. The average horsepower of the propulsion engines is 190 hp on the vessels and 120 hp on the boats. Diesel engines, marine gasoline engines, and converted automobile engines are used. The hulls of three of the vessels are made offiber glass (newer vessels), the remaining vessels and aJl the boats are of wooden construction. Data on operations of these craft were provided for two fuJI lobster seasons, 1972173 and 1973174 , with additional data for April-July, 1973 (off season). At least 50 percent of gross revenue produced by each craft during either one of these two seasons is from lobstering. All the vessels and boats are based in Key West and Marathon, Fla. 'This size range comprises 70 percent of tbe vessels and probably all of the 234 boats registered in Monroe County for spiny lobster fishing in 1972.

Typical Florida lobster traps.
REVENUE AND COST STRUCTURE
The average vessel in the sample produced $19,900 of gross revenue per season (8 months), while the average boat produced $11,100. In addition, 60 percent of the vessels and 50 percent of the boats had revenues from finfish landings during the four off-season months, which amounted to $2,100 per vessel and $1,700 per boat".
'State laws prohibit fishing for stone crab between June I and October 15 each year.
The distinction made between gross revenue earned by vessels and that earned by boats is based on results obtained from a linear regression analysis6
• The majority of the vessels have a crew of two, while the majority of the boats carry one man. This fact
61n this regression analysis gross revenue figures (dependent variable) were related to the size of a craft and to the number of days fishing (explanatory variables). In addition . a dummy variable was used to indicate a vessel (I) or a boat (0). BOlh Ihe coefficient of determination for regression (R '). and the regression coefficient for the dummy variable were found statistically significant at the I-percent and 5-percent levels, respectively .
28
primarily explains the higher productivity of vessels (more traps hauled per day).
Other factors which contributed to the variance in gross revenue were:
A. The extent of fishing for species other than lobster during the season 7
• Vessels and boats which had more than 25 percent of their total gross revenue derived from catching stone crab and finfish, were able to produce, ceteris paribus, significantly higher revenues during a season than those craft engaged primarily in lobstering (over 75 percent of gross revenue derived from lobster fishing). In addition to the difference in total gross revenue per season there is also a distinctive pattern in the monthly distribution of revenue earned by each of these two groups. Vessels and boats in the latter group have peak earnings in October (about 20 percent of total), with revenues in following months falling rapidly to a low of 4 percent in March (end of season). The other group, with a higher share of other species in landings, displays a more level distribution of revenues, particularly in the last three months of the season (see Fig. 2). 8 . The size of the craft expressed in terms of length was found to be a
'In a regression analysis, we used dummy variables for various levels of gross revenue from other than lobster fishing (expressed in percent of total gross revenue) . together with the same two explanatory variables (size and days fishing).
20 c:::J LOBSTERING h''''-'10THER FISHING
15
A 10
5
0
15r-- - r--
r-B -
10 -
5 ~I'~~~lil~ O--~~~~~~~~~
Aug. Sep. Oct. Nov. Dec. Jan. Feb. Mar.
Figure 2.-Sample vessels and boats : Monthly distribution of gross revenue during the season (percent o' total).

factor in explaining the variance in gross revenue. As a result, it was decided to split the sample into two size categories: below and over the mean lengths for vessels (35 feet) and boats (33 feet).
Costs of vessel/boat operations were incurred both during the season and during the off-season, even in cases where there was no revenue recorded for the off-season months. In preparation for the season, a considerable cost is incurred for hull and engine repairs. The same applies to purchases or construction of new traps or other fishing gear. Consequently, the cost analysis is based on 12 months of operations with combined revenues, where appropriate . Table 2 presents average revenues from various sources, and average costs of operations per craft per year.
Within the vessel group, costs amount to 54 percent of gross revenue for both small and large vessels . Within the boat group, the subgroup of larger boats with relatively high shares ofl crab and finfish in landings (last column in Table 2) demonstrates a markedly lower cost ratio (40 percent) as compared to the remainIng two subgroups (58 and 61 percent) . Those larger boats produced a significantly higher gross revenue in comparison to those in the remaining two subgroups (by 34 and 11 percent, respectively), and at a lower cost (by 7 and 26 percent, respectively).
Traps constitute the highest single cost item. However, the actual cost of traps is higher than that presented here. Figures in Table 2 do not include the cost of the operator's labor in repairing and/or constructing traps. It takes one hour of work to build a new trap from purchased material. A new trap costs about $9.
Repairs and maintenance is another field of activity where the operator needs to economize on expenses. A great deal of work is done by himself, which is not accounted for in the records.
No share system is in use on these vessels. The most common way of crew remumeration is to pay a lump sum of $35 to $45 per trip , depending on the workload, time spent, catch, etc . In general, the crew wage is a low expense item, except for the larger vessels where it amounted to 28 percent of total operating costs.
Table 2.-5plny lobster vessel and boat operations, Florida Keys: Cost and earnings per craft per year, by size 01 craft and type 01 operation.
Vessels Boats
Size of craft less Ihan 35 ft over 35 I! less than 33 I! over 33 I!
Type of operation 1 2 1 1
(1) Gross revenue: $ % $ % $ % $ % $ % Lobster 6.731 50.7 22.132 91.7 9.956 96.5 10.898 87.9 8.163 59.2 Crab 72 0.7 16 0.1 130 1.3 434 3.5 1.369 10.0 Finfish 4.284 38.6 1.996 8.2 228 2.2 1.066 8.6 4.251 30.8
Total revenue 11.087 100.0 24.144 100.0 10.314 100.0 12.398 100.0 13.783 100.0
(2) Expendilures: Fuel & oil 890 897 519 485 577 Bait 104 1.547 504 558 316 Groceries 82 309 28 97
Wages 3,675 545 484 Repairs 1.910 2.113 2,178 1.628 1.724 Traps & other gear 2.711 4.217 2.159 4.168 2,721 Miscellaneous 245 150 58 92 228
Total expenditures 5.942 53 .6 12.908 535 5.991 58.1 7.512 60.6 5.566 40.4
Gross profit (1 less 2) 5.145 46.4 11 ,236 46.5 4.323 41.9 4,886 39.4 8,217 59.6
lType of operation : l-more than 75% of gross revenue earned from lobster landings. 2-le55 than 75% of gross revenue earned from lobster landings.
Table 3.-Splny lobster vessel and boat operations, Florida Keys: Calculation 01 depreciation and Interest on investment.
Vessels Boats
Item Unil Under 35 ft
(1) Inilial cost' dollars 13.000 (2) Usefuf life-years number 15 (3) Average age-years number 21 (4) Allowance for
depreciation dollars (5) Average value
of cral! dollars '6.000 (6) Value of Iraps' dollars 4.500 (7) Total investmenl (5+6) dollars 10.500 (8) Interest on investment
at 8 percentS dollars 840
lEstimates based on cost of similar craft in other fisheries. 2Estimated market value based on information from fishermen . :JAverage value = initial cost - 0.5 (accumulated depreciation) . '500 traps per vessel, and 400 traps per boat at $9 per trap. sApproximate yield on government bonds.
24
20
CJl 16 0:: <! ...J ...J 0 0
0 12 z <! CJl :;) 0 I f- e
4
o >35ft >35ft '---.r-------/
VESSELS
>33ft <33ft >33f1 \ /
BOATS
Over 35 I! Under 33 I! Over 33 fl
17.000 9,000 11.000 15 15 15 10 20 18
1.133
'11 ,355 '4,000 '5,000 4.500 3.600 3,600
15.835 7,600 8,600
1.267 608 688
GROSS FISHING
{ D FROM OTHER
REVENUE V/'l FROM
COSTS OF OPERATION
l::LJ LOBSTE RING
D INTEREST ON INVESTMENT
~ OPERATOR'S ~ MANAGEMENT
II OPERATOR'S LABOR
>-t:: z :;)CJl f-fo::CJl 00 0..<..) a.. o
IICASH EXPENDITURE a DEPRECIATION
Figure 3.-Return to labor, management, and Investment per craft per year.
29

Lobster being cooked.
Cost of bait is significantly lower on vessels and boats engaged to a greater extent in finfish fishing where part of the catch is used as bait for lobstering.
Prices for lobster and fish are fairly stable over the year. There is no auctioning involved in disposing of the catch. The fishermen accept whatever price is paid at the time by the buying firms. Those firms provide short term financing to the fishermen and keep ac-
counting records for them. Data presented in Table 2 are based on those records.
RETURNS TO CAPITAL AND LABOR
Expenditures in Table 2 represent only part of the costs involved in these fishing operations. The cost of the craft itself in the form of depreciation allow-
30
ance (fixed costs) has to be accounted for. Also, the implicit costs (or opportunity costs) of capital, and the operator's labor and management have to be added to arrive at the final results of this economic activity.
Table 3 presents estimates of the annual allowance for depreciation, based on available information on the initial cost, useful life, and average age of craft in a given group. Traps are not depreciated in these estimates because the high expenditures in Table 2 (traps and other gear) indicate that this is an annual expense already accounted for8
.
Cope (1959) confirms this assumption stating that most traps must be replaced at the end of a single fishing season. Some other fixed costs, like registration fees and fishing permits, are already accounted for under miscellaneous expenditures in Table 2. No insurance costs were recorded. Except for single cases (new vessels), marine insurance is generally not carried for these craft.
The implicit cost (opportunity cost) of invested capital is the estimated fair return to total investment (craft and traps) in the business, regardless of the, actual amount of debt. It is the amount of interest that could be earned by investing this capital in some other business, or in securities, An 8 percent interest rate was assumed for these calculations (see Table 3).
Opportunity cost of labor is the estimated value of the operator's time spent on fishing, repairing his vessel, and building or repairing traps. It indicates what the operator could have earned working in the same capacity for someone else. Available data on fishing effort indicate that an average vessel was out at sea 105 days per season, while a boat was out 95 days. At an average of 10 hours per day, this translates into 1,050 and 950 hours, respectively, of the owner's labor when fishing. In addition to this, it is estimated that the owner of either vessel or boat spent 800 hours per year repairing the craft, repairing or making new traps, or fishing during the off-season months. Thus, at a value of $3.00 per
'On the average there are 500 traps registered per vessel and 400 traps per boat. The purchase price of a trap complete with buoy and rope is about $9. The cost of material included is about 60-70 percent of this price.

Table 4.-Spiny lobster vessel and boat operations, Florida Keys: Returns to labor, management, and Investment, per craft per year.
Size of craft Type of operation·
(1) Gross revenue (2) Expenditures (3) Depreciation (4) Charge for interest
on investment (8%) (5) Charge for operator's
labor (6) Charge for operator's
management
Summary Return to labor management
and investment (1 less 2 and 3)
Return to labor and management (1 less 2. 3, and 4)
Return to investment (1 less 2. 3, 5. and 6)
Vessels
Less than 35 ft Over 35 It
2
Less than 33 ft
t
Boats
Over 33 It
2
_______ •••.. __________ .•....... ________ Dollars ______ •..••••• _________ ...•.• ____________ •...• _________ _
11.087 24.144 10,314 12,398 13.783 5.942 12,908 5,991 7,512 5,566
1.133
840 1.267 608 688 688
5.550 5.550 5,250 5,250 5,250
1,109 2,414 1.03 1 1,240 1.378
5,145 10,103 4,323 4,886 8.217
4.305 8.836 3.715 4.198 7.529
- 1,514 2.139 -1 .958 -1.604 1,589
'Type of operation: 1-more than 75% of gross revenue earned from lobster landings. 2-less than 75% of gross revenue earned from lobster landings.
compared to the average of 105 days per season for all vessels. It seems reasonable to conclude that fishing time is accountable for the difference between a profitable and unprofitable operation. With increasing age, breakdowns of a craft become more frequent, the requirements for repairs are intensified, and fishing time is cut down. Replacement of the old small craft with newer vessels and extending fishing (for other species) beyond the lobster season will most probably make this fishery more efficient.
The rather large number of vessels and boats with positive returns demonstrate that participation in this fishery can be made a profitable venture.
LITERATURE CITED Cope , C. E. 1959. Spiny lobster gear and fishing
methods. U.S . Fish Wild!. Servo Fish. Leaf!. hour9, the total charge for operator's
labor is estimated at $5 ,550 for a vessel , and $5 ,250 for a boat.
Opportunity cost of management is the estimated value of the operator's handling his business (decision-making and risk-taking). It indicates what the operator could have earned managing another similar business. We estimate this cost as 10 percent of gross revenue lO
.
negative returns spent essentially less time fishing than those in the two groups showing profits. The smaUer vessels (less than 35 feet). for example, ~~~~'1l"i1(1J~~~~in.;;-;;-T:;;k.;'~
With these adjustments for depreciation and opportunity costs, the net returns to labor, management, and investment are as shown in Table 4. Positive returns on investment were effectuated by the group of larger vessels (on the average $2,139, or 13.5 percent of total investment) and by the group of larger boats with more than 25 percent of revenue earned from other than lobster fishing (on the average $1,589, or 18.5 percent of total investment). The remaining groups ended up with negative returns. In these latter groups, the amounts of gross profit as shown in Table 2 do not even compensate for the operator's labor. Nothing is left to pay for the management of his business, and his investment is earning no interest (Fig. 3).
In general, vessels and boats with
9This is a conservative figure compared to the amount of $35-$45 per day fishing, paid to a hired crewman. IOThe authors considered this a reasonable esti· mate . The same estimate is used by Fredrick J. Smith, Oregon State University Extension Service, Marine Advisory Program, in Understanding and Using Marine Economics Data Sheets, S .G. N. 24, November 1973.
were fishing only 72 days per season, as
MFR Paper 1137. From Marine Fisheries Review, Vol. 37, No.4, April 1975. C,opies of rhis paper, in limited numbers, are available from 083, Technical Informarion Division, Environmental Science Information Cenrer, NOAA, Washingron, DC 20235.
31