Embed Size (px)
Citation preview

Costs Associated WithDevelopment andImplementation ofComprehensive NutrientManagement Plans
Part I—Nutrient Management,Land Treatment, Manure andWastewater Handling andStorage, and Recordkeeping
June 2003

Issued June 2003
The U.S. Department of Agriculture (USDA) prohibits discrimination in allits programs and activities on the basis of race, color, national origin, sex,religion, age, disability, political beliefs, sexual orientation, or marital orfamily status. (Not all prohibited bases apply to all programs.) Persons withdisabilities who require alternative means for communication of programinformation (Braille, large print, audiotape, etc.) should contact USDA’sTARGET Center at (202) 720-2600 (voice and TDD).
To file a complaint of discrimination, write USDA, Director, Office of CivilRights, Room 326W, Whitten Building, 14th and Independence Avenue, SW,Washington, DC 20250-9410 or call (202) 720-5964 (voice and TDD). USDAis an equal opportunity provider and employer.
i
Acknowledgments
This publication presents the results of USDA's assessment of the costs fordeveloping and implementing Comprehensive Nutrient Management Plans(CNMPs) with a focus on manure and wastewater handling and storage,nutrient management, land treatment, and record keeping. A subsequentpublication (Part II) will detail the costs for addressing the CNMP planningconsideration elements—feed management and alternative use options. Theassessment was conducted by the following team:
Larry Edmonds, Natural Resources Conservation Service, economistNoel Gollehon, Economic Research Service, economistRobert L. Kellogg, Natural Resources Conservation Service, naturalresource policy analystBarry Kintzer, Natural Resources Conservation Service, nationalenvironmental engineerLynn Knight, Natural Resources Conservation Service, economistCharles Lander, Natural Resources Conservation Service, nutrientmanagement specialistJerry Lemunyon, Natural Resources Conservation Service, agronomistDan Meyer, Natural Resources Conservation Service, agricultural engineer(team leader)David C. Moffitt, Natural Resources Conservation Service, environmentalengineerJerry Schaefer, Natural Resources Conservation Service, economist
The study was conducted under the direction of Tom Christensen, Direc-tor, Animal Husbandry and Clean Water Programs Division, and Peter
Smith, Director, Resource Economics and Social Sciences Division, NaturalResources Conservation Service. Patty Lawrence assisted with the prepa-ration of the report. Stephen Ott, Animal and Plant Health InspectionService, provided assistance with analysis of the National Animal HealthMonitoring System survey results. Jim Burt at the National AgriculturalStatistics Service provided assistance with the Census of Agriculture data-base. Mary Mattinson edited the report and prepared the layout. Doug
Dupin and Karl Musser prepared the maps.

ii
Costs Associated with Development and Implementation of Comprehensive Nutrient Management Plans
Part I—Nutrient Management, Land Treatment, Manure and Wastewater Handling and Storage, and Recordkeeping
iii
Contents:
Costs Associated with Developmentand Implementation of Comprehensive
Nutrient Management Plans
Part I—Nutrient Management, Land Treatment,Manure and Wastewater Handling and Storage,and Recordkeeping
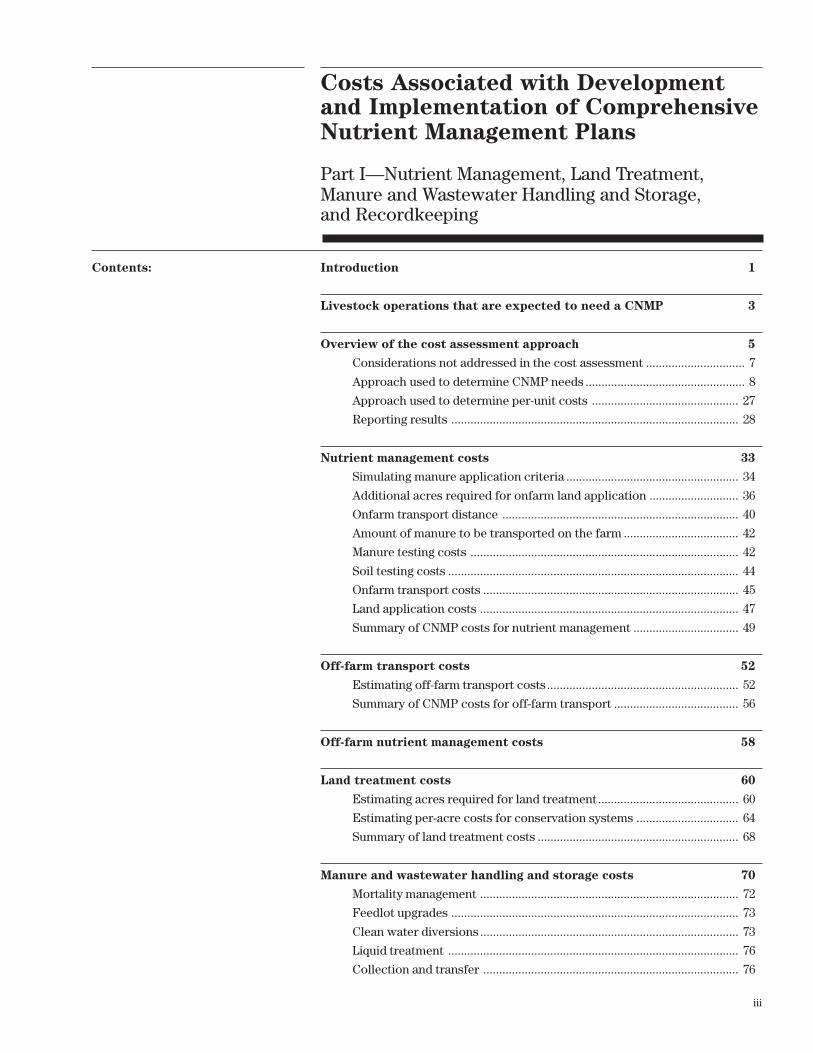
Introduction 1
Livestock operations that are expected to need a CNMP 3
Overview of the cost assessment approach 5
Considerations not addressed in the cost assessment ............................... 7
Approach used to determine CNMP needs .................................................. 8
Approach used to determine per-unit costs .............................................. 27
Reporting results .......................................................................................... 28
Nutrient management costs 33
Simulating manure application criteria ...................................................... 34
Additional acres required for onfarm land application ............................ 36
Onfarm transport distance .......................................................................... 40
Amount of manure to be transported on the farm .................................... 42
Manure testing costs .................................................................................... 42
Soil testing costs ........................................................................................... 44
Onfarm transport costs ................................................................................ 45
Land application costs ................................................................................. 47
Summary of CNMP costs for nutrient management ................................. 49
Off-farm transport costs 52
Estimating off-farm transport costs ............................................................ 52
Summary of CNMP costs for off-farm transport ....................................... 56
Off-farm nutrient management costs 58
Land treatment costs 60
Estimating acres required for land treatment ............................................ 60
Estimating per-acre costs for conservation systems ................................ 64
Summary of land treatment costs ............................................................... 68
Manure and wastewater handling and storage costs 70
Mortality management ................................................................................. 72
Feedlot upgrades .......................................................................................... 73
Clean water diversions ................................................................................. 73
Liquid treatment ........................................................................................... 76
Collection and transfer ................................................................................ 76

iv
Costs Associated with Development and Implementation of Comprehensive Nutrient Management Plans
Part I—Nutrient Management, Land Treatment, Manure and Wastewater Handling and Storage, and Recordkeeping
Storage of solid wastes ................................................................................ 80
Storage of slurry wastes, liquid wastes, and contaminated runoff ......... 81
Settling basins ............................................................................................... 84
Conservation practices for pastured livestock .......................................... 86
Summary of CNMP costs for manure and wastewater handling ............. 89
and storage
Recordkeeping Costs 92
CNMP development costs 93
Estimating the costs of developing CNMPs ............................................... 95
Summary of costs for CNMP development .............................................. 103
Summary of CNMP development and implementation costs 105
References 108
Appendixes
A Profile of Farms with Livestock, 1997 ................................................ A–1
B Estimating Recoverable Manure and Modeling Land ....................... B–1
Application
C Comparison of Size Class Categories Used in the Report ............... C–1
to EPA Size Class Categories
D Conservation Systems for Cropland in Land Resource ................... D–1
Regions S, M, and R
E CNMP Needs and Costs for Manure and Wastewater Handling ..... E–1
and Storage
Table 1 CNMP farms by dominant livestock type 5
Table 2 Model farms for dairies 11
Table 3 Model farms for layers 13
Table 4 Model farms for swine 16
Table 5 Model farms for fattened cattle, confined heifers, veal, 19
turkeys, broilers, and pullets
Table 6 Number of CNMP farms by dominant livestock type and 29
farm size class
Tables

v
Costs Associated with Development and Implementation of Comprehensive Nutrient Management Plans
Part I—Nutrient Management, Land Treatment, Manure and Wastewater Handling and Storage, and Recordkeeping
Table 7 States and number of CNMP farms corresponding to USDA 30
Farm Production Regions
Table 8 Number of CNMP farms in relation to application rate criteria 35
Table 9 Summary of onfarm acres required to meet CNMP application 36
criteria
Table 10 Onfarm acres required to meet CNMP application criteria 37
and farms with excess manure, by livestock type
Table 11 Onfarm transport distance 41
Table 12 Amount of manure for onfarm transport and application 43
Table 13 Number of acres per soil test according to Land Resource 45
Region
Table 14 Annual nutrient management costs per farm, by livestock 50
type and farm size
Table 15 Annual nutrient management costs per farm, by farm 51
production region
Table 16 Off-farm transport distance 54
Table 17 Amount of manure for off-farm transport 55
Table 18 Annual off-farm transport costs per farm, by livestock type 56
and farm size
Table 19 Annual off-farm transport costs per farm, by farm production 57
region
Table 20 Nutrient management costs for additional acres on manure 59
receiving farms with manure applied because of CNMP
implementation
Table 21 Total acres that would receive manure over time after CNMP 61
implementation
Table 22 Acres with manure applied and with sheet and rill erosion 62
rates above T
Table 23 Average cost per acre for conservation systems needed to 64
control sheet and rill erosion
vi
Costs Associated with Development and Implementation of Comprehensive Nutrient Management Plans
Part I—Nutrient Management, Land Treatment, Manure and Wastewater Handling and Storage, and Recordkeeping
Table 24 Annual land treatment costs per farm, by livestock type 68
and farm size
Table 25 Annual land treatment costs per farm, by farm production 69
region
Table 26 Cost estimates for liquid collection with flush systems for 78
dairy farms
Table 27 Per-unit cost estimates for liquid storage 83
Table 28 Per-unit cost estimate for slurry storage 83
Table 29 Per-unit cost estimates for runoff storage ponds 85
Table 30 Annual cost per farm for each manure and wastewater 89
handling and storage component
Table 31 Annual manure and wastewater handling and storage cost 91
per farm, by livestock type and farm size
Table 32 Annual manure and wastewater handling and storage cost 91
per farm, by farm production region
Table 33 Annual average recordkeeping costs per farm, by livestock 93
type and farm size
Table 34 Core work products and specific tasks associated with 95
CNMP elements
Table 35 Technical assistance hours per farm as derived from RTT 98
estimates and size adjustment factor for model farms
Table 36 CNMP development hours per farm, by livestock type and 103
farm size
Table 37 CNMP development hours per farm, by farm production 104
region
Table 38 Annual CNMP costs per farm, by livestock type and farm size 105
Table 39 Annual CNMP costs per farm, by farm production region 107
vii
Costs Associated with Development and Implementation of Comprehensive Nutrient Management Plans
Part I—Nutrient Management, Land Treatment, Manure and Wastewater Handling and Storage, and Recordkeeping
Figures Figure 1 CNMP farms (257,201 farms) 4
Figure 2 CNMP farms with milk cows as the dominant livestock type 10
and more than 35 milk cow animal units (79,318 farms)
Figure 3 CNMP farms with layers as the dominant livestock type and 12
more than 35 layer animal units (4,052 farms)
Figure 4 CNMP farms with swine as the dominant livestock type and 15
more than 35 swine animal units (32,955 farms)
Figure 6 CNMP farms with broilers as the dominant livestock type 22
and more than 35 broiler animal units (16,251 farms)
Figure 7 CNMP farms with turkeys as the dominant livestock type and 23
more than 35 turkey animal units (3,213 farms)
Figure 8 CNMP farms with pullets as the dominant livestock type and 24
more than 35 pullet animal units (1,274 farms)
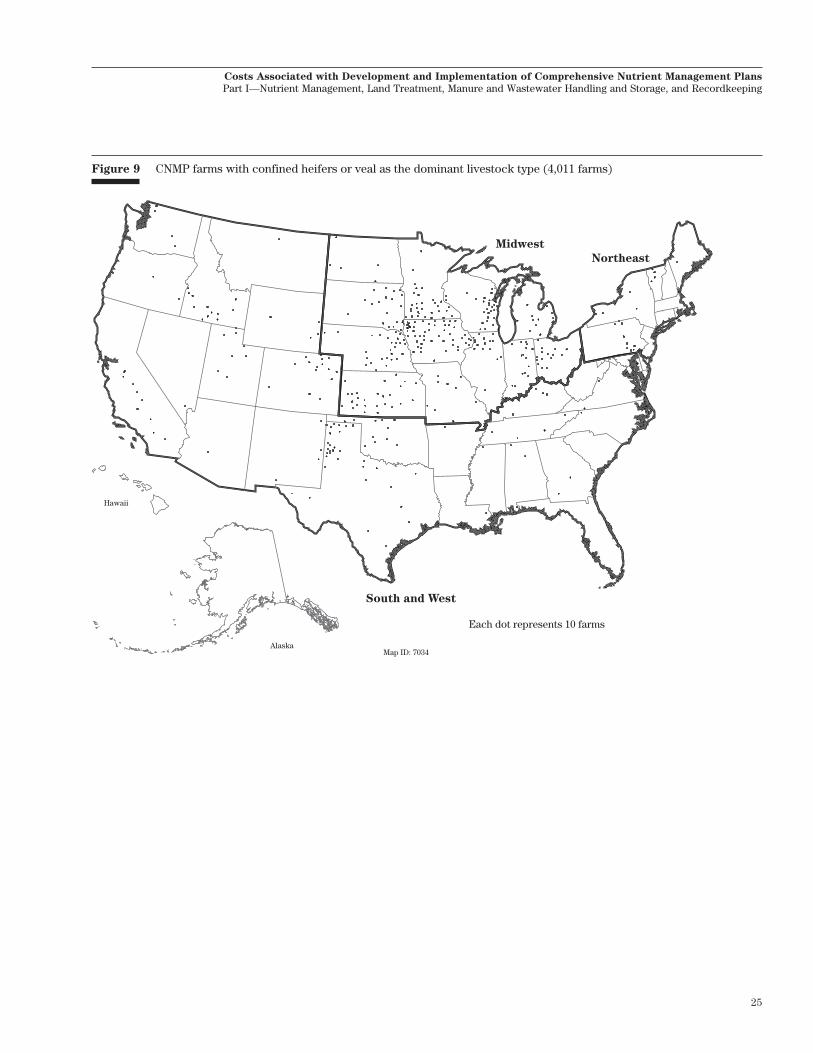
Figure 9 CNMP farms with confined heifers or veal as the dominant 25
livestock type (4,011 farms)
Figure 10 CNMP farms with pastured livestock types (61,272 farms) 26
Figure 11 CNMP farms with less than 35 animal units of milk cows, 27
swine, poultry, or fattened cattle (42,565 farms)
Figure 12 CNMP farms that produce more than 10 tons of phosphorus 31
per year (19,746 farms)
Figure 13 CNMP farms that produce 4 to 10 tons of phosphorus per 32
year (39,437 farms)
Figure 14 Additional onfarm acres required to meet CNMP application 38
criteria on CNMP farms (7.6 million acres)
Figure 15 CNMP farms with excess manure after implementing CNMPs 39
(71,999 farms)
Figure 16 Land resource regions 44
Figure 17 Additional off-farm acres required to meet CNMP application 58
criteria (4.0 million acres)
Figure 18 Onfarm acres with manure applied and sheet and rill erosion 63
rates above T (5.9 million acres)

1
Costs Associated with Development and Implementation
of Comprehensive Nutrient Management Plans
Part I—Nutrient Management, Land Treatment, Manure and
Wastewater Handling and Storage, and Recordkeeping
Introduction
Animal agriculture has changed dramatically over thelast two decades (Kellogg et al., 2000). Livestockpopulations have become more spatially concentratedin high-production areas. Small- and medium-sizedlivestock operations have been replaced by largeoperations at a steady rate. The total number of live-stock has remained relatively unchanged, but theaverage number of livestock per operation has in-creased and more livestock are kept in confinement.These changes in animal agriculture have resulted inincreased concern about the utilization and disposal ofanimal waste. As livestock production has becomemore spatially concentrated, the amount of manurenutrients relative to the land available for applicationhas grown. In some high-production areas, the amountof manure produced exceeds the capacity of the landto assimilate manure nutrients (Lander et al., 1998;Kellogg et al., 2000).
In October 1997, the U.S. Department of Agriculture(USDA) and the U.S. Environmental Protection Agency(EPA) were directed to work with other Federal agen-cies and the public to develop a Clean Water ActionPlan (CWAP) that would chart a course toward fulfill-ing the goal of the Clean Water Act–"fishable andswimmable" water for all Americans. One of the keyactions in the Clean Water Action Plan, released inFebruary 1998, called for USDA and EPA to develop ajoint unified national strategy to minimize the environ-mental and public health impacts of animal feedingoperations. USDA and EPA released the Unified
National Strategy for Animal Feeding Operations inMarch 1999 (USDA-EPA, 1999). The Strategy estab-lished a national performance expectation that allanimal-feeding operations should develop and imple-ment technically sound, economically feasible, andsite-specific Comprehensive Nutrient ManagementPlans (CNMPs) to minimize impacts on water quality.It envisioned that this accomplishment should beachieved over a 10-year implementation period. TheStrategy also called for a cost analysis to define thepotential financial impacts of the initiative.
In December 2000, the Natural Resources Conserva-tion Service (NRCS) released the Comprehensive
Nutrient Management Planning Technical Guidance
to provide guidance for the development of CNMPs,whether they are developed in the context of a USDAvoluntary incentive program or as a means to help alivestock operation comply with the EPA’s NationalPollutant Discharge Elimination System permit re-quirements (USDA, NRCS, 2000a). The TechnicalGuidance is not a sole source reference for developingCNMPs. Rather, it is used in conjunction with theNRCS conservation planning process, as contained inthe NRCS National Planning Procedures Handbook.
As defined in the Technical Guidance, a Comprehen-sive Nutrient Management Plan is a conservationsystem that is unique to animal feeding operations. Itincludes a set of conservation practices and manage-ment activities that address natural resource concernsdealing with manure and organic by-products and theirpotential impacts on water quality. A CNMP addressesthe following elements:
1. Manure and Wastewater Handling and Storage.
This element addresses activities associated with theproduction facility, feedlot, manure and wastewaterstorage and treatment structures and areas, and anyareas used to facilitate transfer of manure and waste-water. Generally, a combination of conservationpractices and management activities are needed, suchas manure storage, clean and contaminated waterdiversions, manure collection and transfer, runoffstorage ponds, and mortality management.
2. Land Treatment Practices. This element ad-dresses activities associated with fields where manureand organic by-products are applied. Generally, thiselement deals with the establishment of erosion con-trol practices on land receiving manure, such as resi-due management, contouring, and terraces.
3. Nutrient Management. This element addressesactivities associated with land application of all nutri-ents and organic by-products to meet crop needs andminimize potential adverse impacts to the environ-ment and public health. Generally, this includes plan-ning and applying nutrients with consideration of form
2
Costs Associated with Development and Implementation of Comprehensive Nutrient Management Plans
Part I—Nutrient Management, Land Treatment, Manure and Wastewater Handling and Storage, and Recordkeeping
(e.g., manure, wastewater, commercial fertilizer, cropresidue, legumes, and irrigation water), time of appli-cation, application rate, and application method.
4. Recordkeeping. This element addresses the docu-mentation of management and implementation activi-ties associated with a CNMP. Typically, this includesrecording soil tests, manure tests, manure and waste-water field application dates and rates, acres applied,manure transfers, and operations and maintenanceactivities.
5. Feed Management. This element addresses activi-ties that improve feed delivery, reduced feed wastage,or increased nutrient uptake by livestock to reduce thenutrient content of manure. Feed management is aplanning consideration and is not based on specificcriteria.
6. Other Utilization Activities. This element ad-dresses alternatives to land application of manure,such as energy production (e.g., burning, methanegeneration and conversion to other fuels), nutrientstabilization and extraction for commercial fertilizersor other products, composting or pelletizing, andmixing or co-composting with other by-products toproduce specialized use materials. Alternatives to landapplication are planning considerations and are notbased on specific criteria.
A CNMP would be constructed to meet specific crite-ria for the first four elements. The last two elements,however, are planning considerations, and do not havea specific set of criteria associated with them. That is,feed management and alternatives to land applicationmay be part of an individual CNMP depending on theproducer’s goals and preferences, but if the produceris not interested in these alternatives, the objectives ofthe CNMP would be met using only the first fourelements.
This publication (Part I) presents the results of USDA'sassessment of the costs for developing and implement-ing CNMPs based on NRCS criteria for the first fourelements. Definitive information on CNMP costs isneeded to develop policy, formulate budgets, andprovide insight for the implementation of financialassistance programs, such as the EnvironmentalQuality Incentive Program (EQIP). In a subsequent
publication (Part II), the potential for reducing CNMPcosts with feed management options and the addi-tional costs associated with alternatives to land appli-cation of manure will be explored. In addition topresenting the results of the cost assessment, Part Ialso provides a detailed documentation of datasources, modeling assumptions, and other informationon how the assessment was conducted.
The first step in the assessment process is to identifythe number of livestock operations that are expectedto need a CNMP, which is presented in the next sec-tion. This is followed by an overview of the cost as-sessment process, and then by sections that presentthe cost estimates and detailed methods and assump-tions used to estimate costs for each of the four ele-ments. Also estimated are CNMP development costs,off-farm transport costs, and costs associated with off-farm land application. This publication concludes witha summary of CNMP costs broken down by livestocksector, farm size, and region of the country.

3
Costs Associated with Development and Implementation of Comprehensive Nutrient Management Plans
Part I—Nutrient Management, Land Treatment, Manure and Wastewater Handling and Storage, and Recordkeeping
Livestock operations thatare expected to need aCNMP
Assessing CNMP costs begins with estimating thenumber of livestock operations that are expected toneed a CNMP. As indicated in the introduction, theUnified National Strategy for Animal Feeding Opera-
tions stipulated that all animal feeding operationsshould have CNMPs to minimize the impacts of ma-nure and manure nutrients on water quality. EPAdefines an animal feeding operation as a "Lot or facil-ity where animals have been, are, or will be stabled orconfined and fed or maintained for a total of 45 days ormore in any 12-month period, and where crops, vegeta-tion forage growth, or post-harvest residues are notsustained over any portion of the lot or facility in thenormal growing season."
The best information source available on farms andcharacteristics of farms in the United States is theCensus of Agriculture. The Census of Agriculture hasinformation about the number and types of livestockon each farm. However, the census provides no infor-mation on how the animals are raised or to whatextent or how long animals are held in confinement.Consequently, it is not possible to identify whether ornot a farm in the census database is an animal feedingoperation.
Farms that are expected to need a CNMP were there-fore identified on the basis of the number and types oflivestock on the farm and an estimate of the amount ofmanure produced annually by those livestock. The1997 Census of Agriculture, which is the most recentcensus available, was used to make the determination.Farms with significant numbers of fattened cattle,poultry, and swine would clearly need a CNMP, sincethese livestock types are almost always raised in aconfined setting. Dairies would also be expected toneed a CNMP, since milk cows are confined for atleast portions of the time each day for milking. Farmswith an incidental number of these confined livestocktypes, however, would not be expected to implement aCNMP, even if the animals were confined. Similarly,most farms with pastured livestock types, such as beefcattle, horses, and sheep, would not meet the EPAdefinition of an animal feeding operation, and so
would not need a CNMP. However, some of the farmswith pastured livestock types would be expected toneed a CNMP if a significant amount of recoverablemanure is produced on the farm.
Three criteria were developed to identify farms thatmay need a CNMP, with each criterion addressing aseparate segment of the livestock operations as repre-sented in the census database.
The first criterion is used to identify farms with toofew livestock to be considered as a farm that wouldneed a CNMP. It is based on a profile of farms withlivestock in the United States, presented in appendixA. The profile reveals that, of the 1,911,859 farms inthe United States in 1997, two-thirds—1,315,051 farms(69%)—reported some kind of livestock on the farm orreported livestock sales. About 27 percent of thesefarms (361,031 farms) were "farms with few livestock."Farms with few livestock were farms with
• less than 4 animal units of any combination offattened cattle, milk cows, swine, chickens, andturkeys; and
• less than 8 animal units of cattle other thanfattened cattle or milk cows; and
• less than 10 horses, ponies, mules, burros, ordonkeys; and
• less than 25 sheep, lambs, or goats; and• less than $5,000 in gross sales of specialty live-
stock products.An animal unit (AU) represents 1,000 pounds of liveweight.
About 75 percent of the farms with few livestock hadonly pastured livestock types; 23 percent had at leastsome fattened cattle, milk cows, swine, chickens, orturkeys; and about 2 percent primarily had specialtylivestock with gross sales of specialty livestock prod-ucts below $5,000. The average of gross livestock salesper farm was only $2,149, and no livestock sales werereported for 34 percent of the farms. These farms areexpected to be too small to need a CNMP.
The second criterion for a farm that would need aCNMP was based on the amount of recoverable ma-nure produced. Recoverable manure is the portion ofmanure that could be collected from the facility forland application or other use. Recoverable manure andmanure nutrients were estimated for each farm in thecensus using procedures presented in appendix B.Included are estimates of recoverable manure for beef
4
Costs Associated with Development and Implementation of Comprehensive Nutrient Management Plans
Part I—Nutrient Management, Land Treatment, Manure and Wastewater Handling and Storage, and Recordkeeping
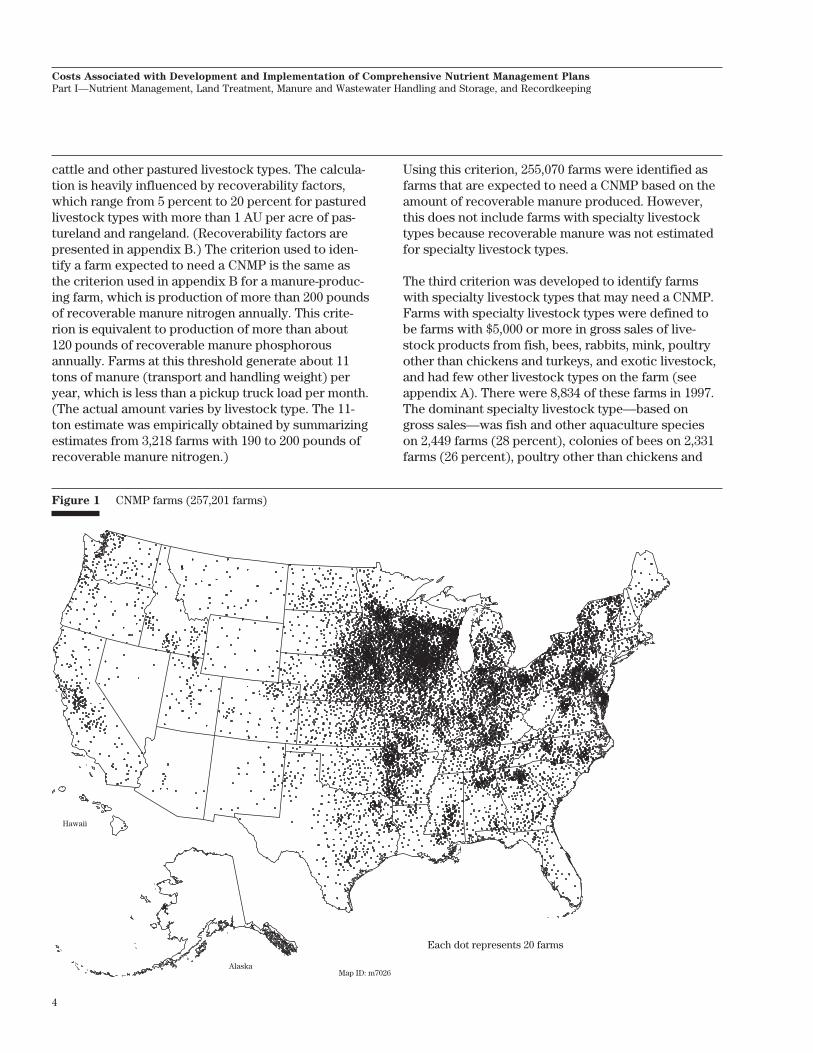
cattle and other pastured livestock types. The calcula-tion is heavily influenced by recoverability factors,which range from 5 percent to 20 percent for pasturedlivestock types with more than 1 AU per acre of pas-tureland and rangeland. (Recoverability factors arepresented in appendix B.) The criterion used to iden-tify a farm expected to need a CNMP is the same asthe criterion used in appendix B for a manure-produc-ing farm, which is production of more than 200 poundsof recoverable manure nitrogen annually. This crite-rion is equivalent to production of more than about120 pounds of recoverable manure phosphorousannually. Farms at this threshold generate about 11tons of manure (transport and handling weight) peryear, which is less than a pickup truck load per month.(The actual amount varies by livestock type. The 11-ton estimate was empirically obtained by summarizingestimates from 3,218 farms with 190 to 200 pounds ofrecoverable manure nitrogen.)
Using this criterion, 255,070 farms were identified asfarms that are expected to need a CNMP based on theamount of recoverable manure produced. However,this does not include farms with specialty livestocktypes because recoverable manure was not estimatedfor specialty livestock types.
The third criterion was developed to identify farmswith specialty livestock types that may need a CNMP.Farms with specialty livestock types were defined tobe farms with $5,000 or more in gross sales of live-stock products from fish, bees, rabbits, mink, poultryother than chickens and turkeys, and exotic livestock,and had few other livestock types on the farm (seeappendix A). There were 8,834 of these farms in 1997.The dominant specialty livestock type—based ongross sales—was fish and other aquaculture specieson 2,449 farms (28 percent), colonies of bees on 2,331farms (26 percent), poultry other than chickens and
Hawaii
AlaskaMap ID: m7026
Each dot represents 20 farms
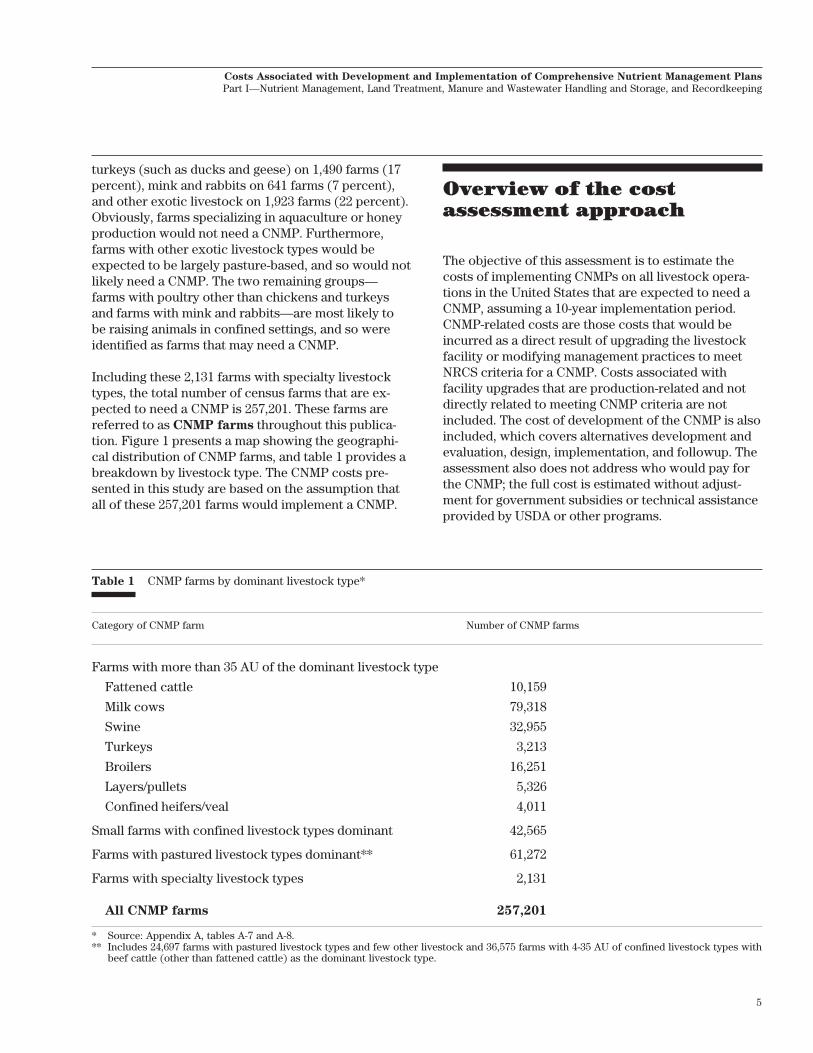
Figure 1 CNMP farms (257,201 farms)
5
Costs Associated with Development and Implementation of Comprehensive Nutrient Management Plans
Part I—Nutrient Management, Land Treatment, Manure and Wastewater Handling and Storage, and Recordkeeping
turkeys (such as ducks and geese) on 1,490 farms (17percent), mink and rabbits on 641 farms (7 percent),and other exotic livestock on 1,923 farms (22 percent).Obviously, farms specializing in aquaculture or honeyproduction would not need a CNMP. Furthermore,farms with other exotic livestock types would beexpected to be largely pasture-based, and so would notlikely need a CNMP. The two remaining groups—farms with poultry other than chickens and turkeysand farms with mink and rabbits—are most likely tobe raising animals in confined settings, and so wereidentified as farms that may need a CNMP.
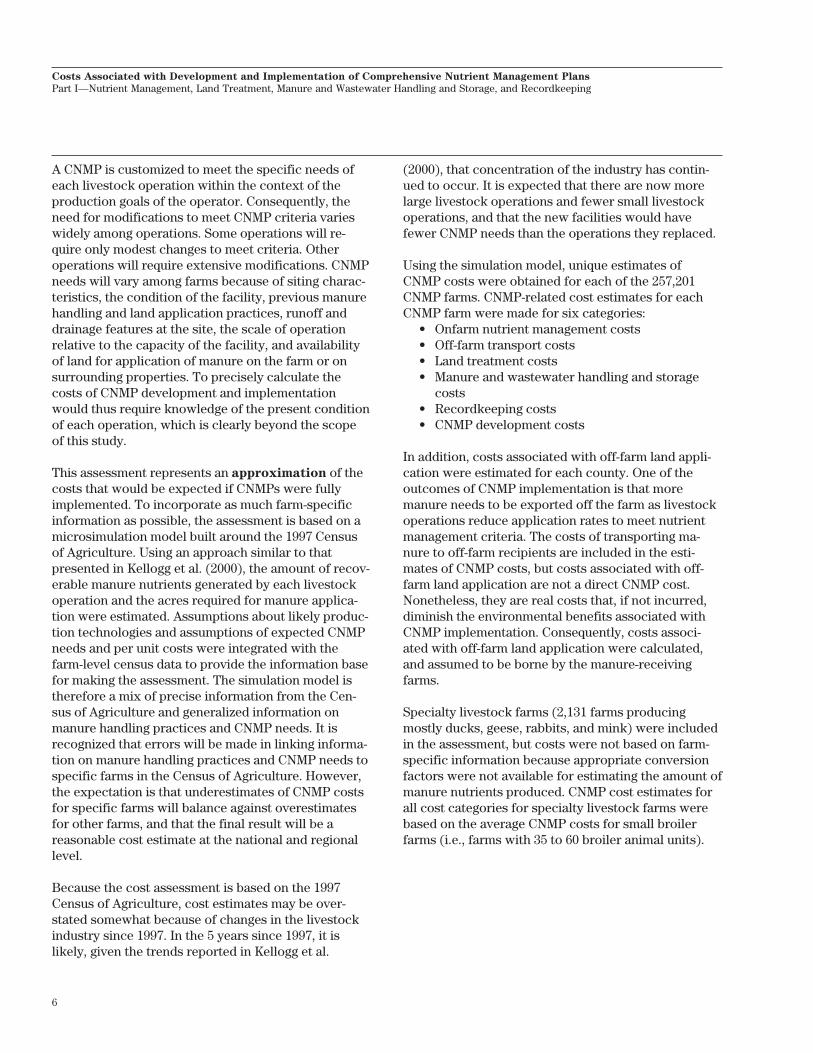
Including these 2,131 farms with specialty livestocktypes, the total number of census farms that are ex-pected to need a CNMP is 257,201. These farms arereferred to as CNMP farms throughout this publica-tion. Figure 1 presents a map showing the geographi-cal distribution of CNMP farms, and table 1 provides abreakdown by livestock type. The CNMP costs pre-sented in this study are based on the assumption thatall of these 257,201 farms would implement a CNMP.
Overview of the costassessment approach
The objective of this assessment is to estimate thecosts of implementing CNMPs on all livestock opera-tions in the United States that are expected to need aCNMP, assuming a 10-year implementation period.CNMP-related costs are those costs that would beincurred as a direct result of upgrading the livestockfacility or modifying management practices to meetNRCS criteria for a CNMP. Costs associated withfacility upgrades that are production-related and notdirectly related to meeting CNMP criteria are notincluded. The cost of development of the CNMP is alsoincluded, which covers alternatives development andevaluation, design, implementation, and followup. Theassessment also does not address who would pay forthe CNMP; the full cost is estimated without adjust-ment for government subsidies or technical assistanceprovided by USDA or other programs.
Table 1 CNMP farms by dominant livestock type*
Category of CNMP farm Number of CNMP farms
Farms with more than 35 AU of the dominant livestock type
Fattened cattle 10,159
Milk cows 79,318
Swine 32,955
Turkeys 3,213
Broilers 16,251
Layers/pullets 5,326
Confined heifers/veal 4,011
Small farms with confined livestock types dominant 42,565
Farms with pastured livestock types dominant** 61,272
Farms with specialty livestock types 2,131
All CNMP farms 257,201
* Source: Appendix A, tables A-7 and A-8.** Includes 24,697 farms with pastured livestock types and few other livestock and 36,575 farms with 4-35 AU of confined livestock types with
beef cattle (other than fattened cattle) as the dominant livestock type.
6
Costs Associated with Development and Implementation of Comprehensive Nutrient Management Plans
Part I—Nutrient Management, Land Treatment, Manure and Wastewater Handling and Storage, and Recordkeeping
A CNMP is customized to meet the specific needs ofeach livestock operation within the context of theproduction goals of the operator. Consequently, theneed for modifications to meet CNMP criteria varieswidely among operations. Some operations will re-quire only modest changes to meet criteria. Otheroperations will require extensive modifications. CNMPneeds will vary among farms because of siting charac-teristics, the condition of the facility, previous manurehandling and land application practices, runoff anddrainage features at the site, the scale of operationrelative to the capacity of the facility, and availabilityof land for application of manure on the farm or onsurrounding properties. To precisely calculate thecosts of CNMP development and implementationwould thus require knowledge of the present conditionof each operation, which is clearly beyond the scopeof this study.
This assessment represents an approximation of thecosts that would be expected if CNMPs were fullyimplemented. To incorporate as much farm-specificinformation as possible, the assessment is based on amicrosimulation model built around the 1997 Censusof Agriculture. Using an approach similar to thatpresented in Kellogg et al. (2000), the amount of recov-erable manure nutrients generated by each livestockoperation and the acres required for manure applica-tion were estimated. Assumptions about likely produc-tion technologies and assumptions of expected CNMPneeds and per unit costs were integrated with thefarm-level census data to provide the information basefor making the assessment. The simulation model istherefore a mix of precise information from the Cen-sus of Agriculture and generalized information onmanure handling practices and CNMP needs. It isrecognized that errors will be made in linking informa-tion on manure handling practices and CNMP needs tospecific farms in the Census of Agriculture. However,the expectation is that underestimates of CNMP costsfor specific farms will balance against overestimatesfor other farms, and that the final result will be areasonable cost estimate at the national and regionallevel.
Because the cost assessment is based on the 1997Census of Agriculture, cost estimates may be over-stated somewhat because of changes in the livestockindustry since 1997. In the 5 years since 1997, it islikely, given the trends reported in Kellogg et al.
(2000), that concentration of the industry has contin-ued to occur. It is expected that there are now morelarge livestock operations and fewer small livestockoperations, and that the new facilities would havefewer CNMP needs than the operations they replaced.
Using the simulation model, unique estimates ofCNMP costs were obtained for each of the 257,201CNMP farms. CNMP-related cost estimates for eachCNMP farm were made for six categories:
• Onfarm nutrient management costs• Off-farm transport costs• Land treatment costs• Manure and wastewater handling and storage
costs• Recordkeeping costs• CNMP development costs
In addition, costs associated with off-farm land appli-cation were estimated for each county. One of theoutcomes of CNMP implementation is that moremanure needs to be exported off the farm as livestockoperations reduce application rates to meet nutrientmanagement criteria. The costs of transporting ma-nure to off-farm recipients are included in the esti-mates of CNMP costs, but costs associated with off-farm land application are not a direct CNMP cost.Nonetheless, they are real costs that, if not incurred,diminish the environmental benefits associated withCNMP implementation. Consequently, costs associ-ated with off-farm land application were calculated,and assumed to be borne by the manure-receivingfarms.
Specialty livestock farms (2,131 farms producingmostly ducks, geese, rabbits, and mink) were includedin the assessment, but costs were not based on farm-specific information because appropriate conversionfactors were not available for estimating the amount ofmanure nutrients produced. CNMP cost estimates forall cost categories for specialty livestock farms werebased on the average CNMP costs for small broilerfarms (i.e., farms with 35 to 60 broiler animal units).
7
Costs Associated with Development and Implementation of Comprehensive Nutrient Management Plans
Part I—Nutrient Management, Land Treatment, Manure and Wastewater Handling and Storage, and Recordkeeping
Considerations not addressed inthe cost assessment
The assessment did not address Federal, State, andlocal regulatory requirements associated with animalfeeding operations. Many States have, or are in theprocess of, adopting regulations that would requiresome livestock operations to implement systems thatare equivalent to a CNMP or part of a CNMP. Some ofthese regulations impose stricter requirements thanrepresented by the NRCS CNMP guidelines. Consider-ation of regulatory trends was given, however, to thedetermination of CNMP needs, particularly for largeoperations.
This assessment did not attempt to account for theimplementation of CNMPs or elements of CNMPssince 1997. Consequently, part of the costs presentedin this assessment may have already been borne bysome livestock operations.
Cost estimates may be overstated somewhat becausethey do not account for innovation and technologicaladvances that are expected to occur as the CNMPinitiative is implemented. Implementing CNMPs onnearly 260,000 livestock operations within a 10-yearperiod is an ambitious undertaking. It is expected thatefficiencies will arise both in CNMP development andin implementing manure-handling practices during theimplementation. Technological advancements inequipment and in the design of structures for handlingand treating manure may also arise, reducing costs. Itis impossible to foresee where these innovations andefficiencies will occur or how much they may reducethe total costs, but cost savings could occur.
No attempt was made to account for payment byrecipients for manure exported off the farm or chargesto the livestock operation by recipients for acceptingthe manure. A variety of payment arrangements pres-ently exist, depending on traditions and marketsestablished in the production region, the type of ma-nure, and existing State and local regulations. In somecases the livestock operator is responsible for applyingthe manure to the recipient’s land. For the purposes ofthis cost assessment, it is assumed that all manureexported off the farm would be given and acceptedwithout payment, the livestock operation bears thecost of transporting the manure to the manure-receiv-ing farm, and the off-farm land application cost isborne by the recipient.
No account was made of the financial benefits thatmay be realized because of CNMP implementation,including any savings in commercial fertilizer costs onthe additional acreage that will receive manure appli-cations. The nutrient value of manure is consideredone of the many benefits of implementing CNMPs.Other benefits, which are more difficult to put intoeconomic terms, include the value of manure as a soilamendment, enhanced waterholding capacity of thesoil due to increased organic matter in the soil, en-hancement of animal health with improved manurehandling, water quality enhancement both on the farm
CNMP development and implementation
costs are not estimates of the costs to
producers of complying with EPA
regulations
The largest livestock operations and operationsthat may pose a risk to the environment becauseof location are regulated by the U.S. Environmen-tal Protection Agency. Under the National Pollut-ant Discharge Elimination System (NPDES),Concentrated Animal Feeding Operations(CAFOs) are required to have permits to ensurethat the operation of the facility does notthreaten water quality. In December 2002, EPAannounced revisions to the CAFO rule. Under thenew rule all large CAFOs will be required toapply for a permit, submit an annual report, anddevelop and follow a plan for handling manureand wastewater. EPA estimates that the CAFOrule will affect about 15,500 operations nation-wide.
It was not the purpose of this publication toestimate the costs to livestock operations ofcomplying with EPA regulations, but rather toestimate the costs for the development andimplementation of Comprehensive NutrientManagement Plans (CNMPs). The costs associ-ated with regulation may be more or less than thecosts of developing and implementing a CNMP,depending on the specific location and character-istics of the facility. Cost estimates presented inthis publication are for the 257,201 operationswith confined livestock that are expected to needa CNMP.
8
Costs Associated with Development and Implementation of Comprehensive Nutrient Management Plans
Part I—Nutrient Management, Land Treatment, Manure and Wastewater Handling and Storage, and Recordkeeping
and off the farm, and soil erosion reduction associatedwith the land treatment practices installed on acresreceiving manure. No attempt was made to offsetCNMP costs for any of these benefits.
No attempt was made to adjust costs for inflation,even though it is recognized that some cost increaseswill occur over the 10-year implementation period. Tomake this adjustment, one would need to know therate at which CNMPs would be implemented, whichwill depend on regulatory incentives, financial incen-tives, and the availability of technical assistance. Costestimates reported here may therefore be understatedto some extent, depending on the rate of inflation andimplementation over the next 10 years.
This cost assessment also does not account for costsavings that could be realized by improvements in feedmanagement. Agricultural research has shown that theamount of nitrogen and phosphorus in animal feed cansometimes be reduced without endangering animalhealth. For some livestock types, feed additives havebeen developed (such as phytase) that enable live-stock to convert more of the phosphorus in animalfeed to animal tissue, thereby reducing the quantity ofphosphorus needed in the feed and the resultingamount of phosphorus that is excreted. Feed manage-ment practices can reduce the number of acres re-quired to meet CNMP land application criteria. Noattempt was made in this assessment to adjust thecalculations of recoverable manure nutrients for feedmanagement practices. To the extent that feed man-agement practices are already in place, the cost esti-mate presented here will overstate costs. (An assess-ment of the potential reductions in CNMP costs associ-ated with feed management practices will be ad-dressed in Part II, which will be published subsequentto this publication.)
The model simulation shows that alternatives to landapplication of manure are needed in some regions ofthe country. Under the assumptions of the modelsimulation, 248 counties do not have adequate land toassimilate the manure produced in those countieswhen applied at rates that meet CNMP criteria (seeappendix B). Most of these counties are co-located,reducing the opportunity to transport the manure tosurrounding counties for land application. The amountof county-level excess manure represents about 16percent of the total recoverable manure nutrientsproduced by all CNMP farms in the country. Included
in the cost assessment are estimates of the cost oftransporting this county-level excess manure off thefarm, but no other costs are estimated for the disposalor use of this manure. (The costs of alternatives toland application that are associated with CNMP imple-mentation will also be addressed in Part II.)
Approach used to determine CNMPneeds
The most challenging aspect of the cost assessment isdefining CNMP needs. Different approaches were usedfor each of the CNMP elements, taking advantage of asmuch farm-specific information as possible.
CNMP needs for the nutrient management
element and off-farm transport
CNMP needs for the nutrient management elementwere determined by the amount of manure producedon each farm and the additional number of acresrequired to meet CNMP land application criteria oneach farm. Two land application scenarios were con-structed:
• A baseline scenario, designed to simulate landapplication of manure before implementation ofCNMPs, and
• An after CNMP scenario, designed to simulateland application at rates that correspond toNRCS nutrient management criteria.
The difference in the number of acres with manureapplied between the two scenarios defines the addi-tional acres needed to meet CNMP criteria. Estimateswere also made for the amount of manure exported offthe farm to surrounding properties, defining CNMPneeds for off-farm transport. The number of acresrequired for off-farm land application of the exportedmanure were determined and used to estimate off-farm land application costs associated with CNMPimplementation.
CNMP needs for the land treatment element
A CNMP includes criteria for erosion control on acresreceiving manure to protect water quality. The Na-tional Resources Inventory (NRI) provides estimatesof sheet and rill erosion at the county level, whichwere used to assess the need for land treatment prac-tices. NRI data for the year 1997 were used to corre-spond to the timeframe represented by the censusdatabase.

9
Costs Associated with Development and Implementation of Comprehensive Nutrient Management Plans
Part I—Nutrient Management, Land Treatment, Manure and Wastewater Handling and Storage, and Recordkeeping
CNMP needs for the manure and wastewater
handling and storage element
Manure and wastewater storage and handling includescomponents and activities associated with the produc-tion facility, feedlot, storage structures and areas, andany areas or mechanisms used to facilitate transfer ofmanure and wastewater. Manure and wastewaterstorage and handling needs are specific to the produc-tion technology on the farm. Data at the national levelare not available on CNMP needs for this element, norcan CNMP needs be derived from other databases, aswas done for nutrient management, land treatment,and off-farm export. CNMP needs for manure andwastewater handling and storage components wereestimated by a team of experts using a consensusapproach to approximate what the needs might be.The team of experts consisted of agricultural engi-neers, environmental engineers, economists, andagronomists with extensive experience working withlivestock producers and government technical assis-tance programs. Team members also consulted withother experts who had knowledge about specificindustries or areas of the country.
CNMP needs for the manure and wastewater handlingand storage element were defined based on typical, ordominant, production technologies, livestock type,farm size, and production region. Production technolo-gies ranged from simple (no storage, daily spreading,for example) to complex (liquid collection systemswith lagoons, for example). These production tech-nologies were then assigned to farms in the censusbased on the dominant livestock type, farm size, andproduction region for the census farm. In many cases asingle production technology was assigned to a censusfarm. In other cases, however, there was more thanone production technology that would be expected fora given farm size in a given production region. Wheremore than one production technology was assigned toa census farm, the probability that each productiontechnology would occur was also assigned.
The basic set of production technologies was definedin terms of representative farms for each livestocktype. Representative farms define broad groups oflivestock production facilities that, within a livestocksector, have similar characteristics for managing thelivestock and managing the manure; in other words, ahypothetical farm with a typical animal waste handlingsystem for a given livestock type. This set of represen-tative farms was expanded to a larger set of model
farms by adding the dimensions of size and location.Size categories for the dominant livestock type wereselected to reflect differences in production technolo-gies by farm size. Geographic regions generally re-flected major production regions with further delinea-tion by climate, where climate would be expected toinfluence the kind of production system found in theregion. Not all representative farms are present ineach size class and location. Each model farm is thus arepresentative farm of a certain size in a specifiedlocation.
Representative farms were derived from two sourcesof information—farmer surveys and expert judgment.Results from farmer surveys were available for dairies,swine, and layers. These surveys were not conductedfor the specific purpose of inventorying manure-handling practices on farms, but did include questionsabout the production technologies in use and a fewquestions about manure management. A team of USDAexperts evaluated the survey results and identified thedominant manure management technologies, basingthem on manure handling characteristics as much aspossible. Only the most dominant technologies wereincluded; technologies that occurred relatively infre-quently in survey results were discarded. Farmersurvey results were not available for fattened cattle,veal, confined heifers, broilers, pullets, or turkeys. Forthese livestock types, representative farms werederived by the team of USDA experts based on theirknowledge of industry practices.
In addition to providing a structure for deriving CNMPneeds for the manure and wastewater handling andstorage element, this analytical framework was usedto assign costs related to manure testing andrecordkeeping. A slightly expanded version of theframework was used to estimate CNMP developmentcosts and used in appendix B to parameterize thesimulation model for estimating recoverable manurenutrients and tons of manure for handling and trans-port.
Model farms for dairy. Five representative farmswere derived for dairy based on a 1996 National Ani-mal Health Monitoring System (NAHMS) survey of2,542 dairies in 20 states (USDA, APHIS, 1996). Thesurvey included questions about the manure storagefacilities on the farm and the frequency of manurespreading. Production technologies for dairies were
10
Costs Associated with Development and Implementation of Comprehensive Nutrient Management Plans
Part I—Nutrient Management, Land Treatment, Manure and Wastewater Handling and Storage, and Recordkeeping
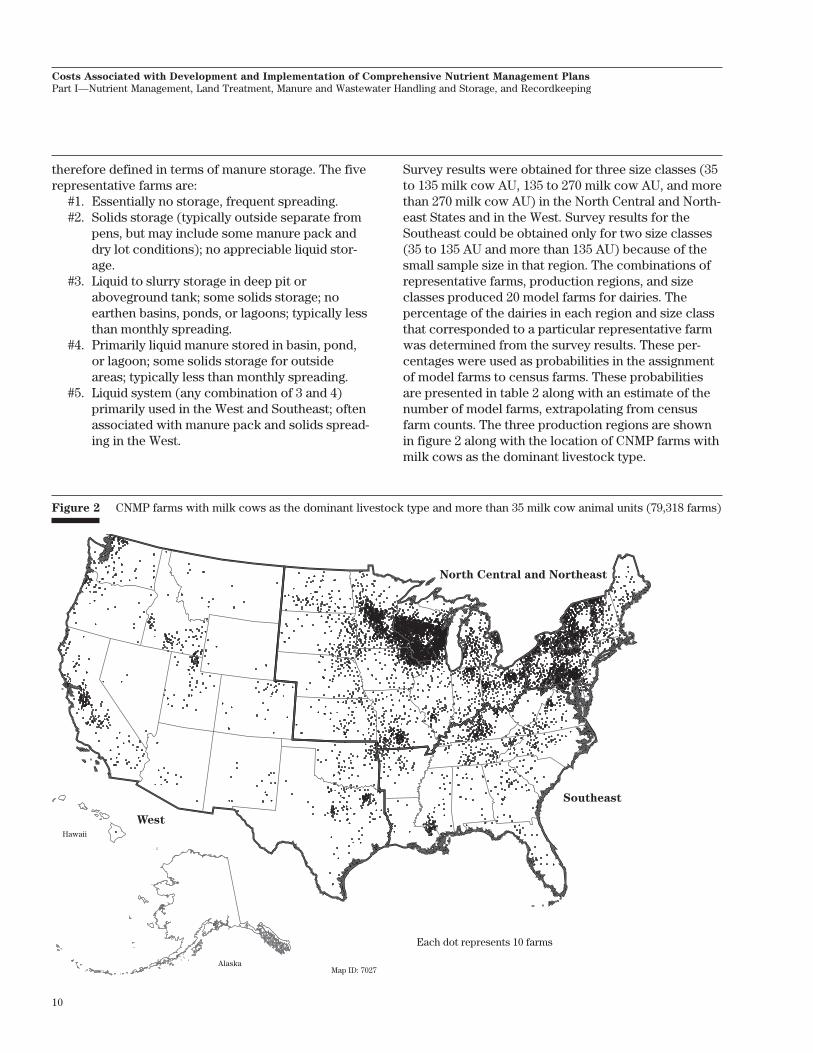
Figure 2 CNMP farms with milk cows as the dominant livestock type and more than 35 milk cow animal units (79,318 farms)
Hawaii
AlaskaMap ID: 7027
Each dot represents 10 farms
North Central and Northeast
Southeast
West
therefore defined in terms of manure storage. The fiverepresentative farms are:
#1. Essentially no storage, frequent spreading.#2. Solids storage (typically outside separate from
pens, but may include some manure pack anddry lot conditions); no appreciable liquid stor-age.
#3. Liquid to slurry storage in deep pit oraboveground tank; some solids storage; noearthen basins, ponds, or lagoons; typically lessthan monthly spreading.
#4. Primarily liquid manure stored in basin, pond,or lagoon; some solids storage for outsideareas; typically less than monthly spreading.
#5. Liquid system (any combination of 3 and 4)primarily used in the West and Southeast; oftenassociated with manure pack and solids spread-ing in the West.
Survey results were obtained for three size classes (35to 135 milk cow AU, 135 to 270 milk cow AU, and morethan 270 milk cow AU) in the North Central and North-east States and in the West. Survey results for theSoutheast could be obtained only for two size classes(35 to 135 AU and more than 135 AU) because of thesmall sample size in that region. The combinations ofrepresentative farms, production regions, and sizeclasses produced 20 model farms for dairies. Thepercentage of the dairies in each region and size classthat corresponded to a particular representative farmwas determined from the survey results. These per-centages were used as probabilities in the assignmentof model farms to census farms. These probabilitiesare presented in table 2 along with an estimate of thenumber of model farms, extrapolating from censusfarm counts. The three production regions are shownin figure 2 along with the location of CNMP farms withmilk cows as the dominant livestock type.

11
Costs Associated with Development and Implementation of Comprehensive Nutrient Management Plans
Part I—Nutrient Management, Land Treatment, Manure and Wastewater Handling and Storage, and Recordkeeping
Table 2 Model farms for dairies
Region and size class Representative farms Percent Number Estimatedof farms of farms number ofin group in census farms in group
North Central and Northeast*
35-135 AU #1: no storage 29 — 15,385#2: solids storage 47 — 24,935#3: liquid storage—deep pit or slurry 7 — 3,714#4: liquid storage—basin, pond, lagoon 17 — 9,019All 100 53,053
135-270 AU #1: no storage 15 — 1,303#2: solids storage 28 — 2,433#3: liquid storage—deep pit or slurry 14 — 1,216#4: liquid storage—basin, pond, lagoon 43 — 3,736All 100 8,688
> 270 AU #2: solids storage 14 — 366#3: liquid storage—deep pit or slurry 18 — 471#4: liquid storage—basin, pond, lagoon 68 — 1,779All 100 2,616
Southeast**35-135 AU #2: solids storage 59 — 2,566
#5: any liquid storage 41 — 1,783All 100 4,349
> 135 AU #2: solids storage 30 — 845#5: any liquid storage 70 — 1,970All 100 2,815
West***35-135 AU #2: solids storage 50 — 1,175
#5: any liquid storage, manure pack 50 — 1,174All 100 2,349
135-270 AU #2: solids storage 11 — 200#5: any liquid storage, manure pack 89 — 1,625All 100 1,825
> 270 AU #5: any liquid storage, manure pack 100 3,623 3,623
All farms 79,318 79,318
* NAHMS survey states include MN, IA, MO, WI, IL, MI, IN, OH, PA, NY, IL, and VT. States added to the group include ND, SD, NE, KS, NJ,MD, DE, MA, CT, RI, NH, and ME.
** NAHMS survey states include KY, TN, and FL. States added to the group include VA, WV, NC, SC, GA, AL, MS, AR, and LA.*** NAHMS survey states include CA, OR, WA, ID, NM, and TX. States added to the group include HI, AK, AZ, UT, NV, MT, WY, CO, and OK.
12
Costs Associated with Development and Implementation of Comprehensive Nutrient Management Plans
Part I—Nutrient Management, Land Treatment, Manure and Wastewater Handling and Storage, and Recordkeeping
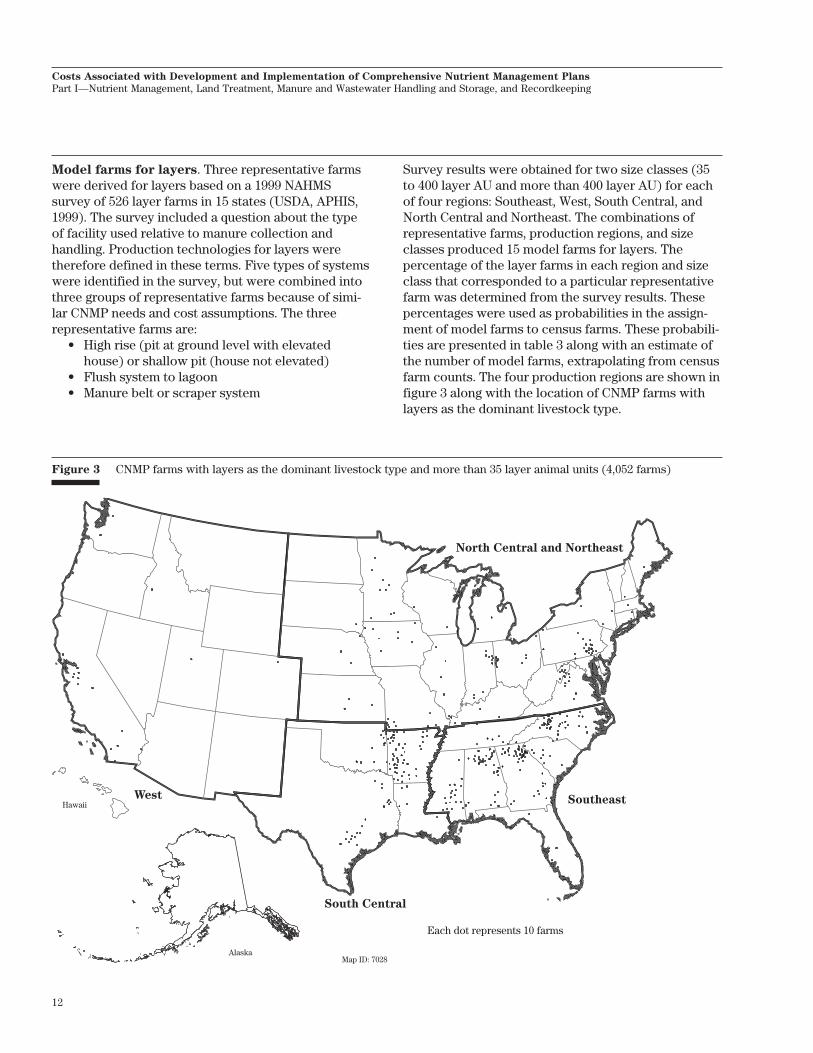
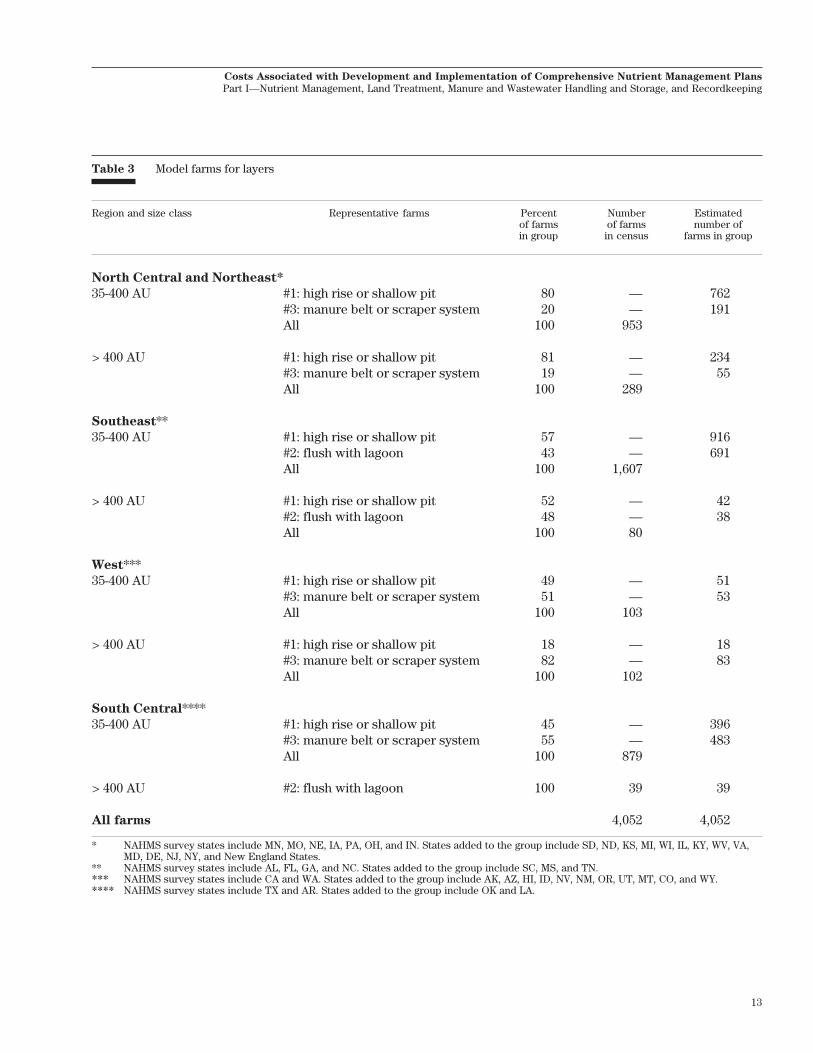
Model farms for layers. Three representative farmswere derived for layers based on a 1999 NAHMSsurvey of 526 layer farms in 15 states (USDA, APHIS,1999). The survey included a question about the typeof facility used relative to manure collection andhandling. Production technologies for layers weretherefore defined in these terms. Five types of systemswere identified in the survey, but were combined intothree groups of representative farms because of simi-lar CNMP needs and cost assumptions. The threerepresentative farms are:
• High rise (pit at ground level with elevatedhouse) or shallow pit (house not elevated)
• Flush system to lagoon• Manure belt or scraper system
Survey results were obtained for two size classes (35to 400 layer AU and more than 400 layer AU) for eachof four regions: Southeast, West, South Central, andNorth Central and Northeast. The combinations ofrepresentative farms, production regions, and sizeclasses produced 15 model farms for layers. Thepercentage of the layer farms in each region and sizeclass that corresponded to a particular representativefarm was determined from the survey results. Thesepercentages were used as probabilities in the assign-ment of model farms to census farms. These probabili-ties are presented in table 3 along with an estimate ofthe number of model farms, extrapolating from censusfarm counts. The four production regions are shown infigure 3 along with the location of CNMP farms withlayers as the dominant livestock type.
Figure 3 CNMP farms with layers as the dominant livestock type and more than 35 layer animal units (4,052 farms)
Hawaii
AlaskaMap ID: 7028
Each dot represents 10 farms
South Central
SoutheastWest
North Central and Northeast
13
Costs Associated with Development and Implementation of Comprehensive Nutrient Management Plans
Part I—Nutrient Management, Land Treatment, Manure and Wastewater Handling and Storage, and Recordkeeping
Table 3 Model farms for layers
Region and size class Representative farms Percent Number Estimatedof farms of farms number ofin group in census farms in group
North Central and Northeast*
35-400 AU #1: high rise or shallow pit 80 — 762#3: manure belt or scraper system 20 — 191All 100 953
> 400 AU #1: high rise or shallow pit 81 — 234#3: manure belt or scraper system 19 — 55All 100 289
Southeast**35-400 AU #1: high rise or shallow pit 57 — 916
#2: flush with lagoon 43 — 691All 100 1,607
> 400 AU #1: high rise or shallow pit 52 — 42#2: flush with lagoon 48 — 38All 100 80
West***35-400 AU #1: high rise or shallow pit 49 — 51
#3: manure belt or scraper system 51 — 53All 100 103
> 400 AU #1: high rise or shallow pit 18 — 18#3: manure belt or scraper system 82 — 83All 100 102
South Central****35-400 AU #1: high rise or shallow pit 45 — 396
#3: manure belt or scraper system 55 — 483All 100 879
> 400 AU #2: flush with lagoon 100 39 39
All farms 4,052 4,052
* NAHMS survey states include MN, MO, NE, IA, PA, OH, and IN. States added to the group include SD, ND, KS, MI, WI, IL, KY, WV, VA,MD, DE, NJ, NY, and New England States.
** NAHMS survey states include AL, FL, GA, and NC. States added to the group include SC, MS, and TN.*** NAHMS survey states include CA and WA. States added to the group include AK, AZ, HI, ID, NV, NM, OR, UT, MT, CO, and WY.**** NAHMS survey states include TX and AR. States added to the group include OK and LA.
14
Costs Associated with Development and Implementation of Comprehensive Nutrient Management Plans
Part I—Nutrient Management, Land Treatment, Manure and Wastewater Handling and Storage, and Recordkeeping
Model farms for swine. Five representative farmswere derived for swine based on two farmer surveys: a1995 NAHMS survey of 1,477 swine farms in 16 states(USDA, APHIS, 1995), and a 1998 Agricultural Re-source Management Study (ARMS) survey on 1,600swine farms in 21 states (USDA, ERS, 2000). Thesurveys included questions about the type of facilityused to rear swine and the type of manure handlingand storage system. Production technologies for swinewere therefore defined in these terms. The initialbreakdown was made using the NAHMS survey re-sults. The ARMS survey results were used to updatethe representation of confinement facilities that hadstorage ponds or lagoons and used to estimate repre-sentation in the West. The representative farms are:
#1 Total confinement with liquid system includinglagoon.
#2 Total confinement with slurry system, nolagoon.
#3 Open building with outside access and liquid toslurry system (holding pit under slat or openflush gutter).
#4 Open building with outside access and semi-solid to solid wastes (mechanical scraper/tractor scrape/hand clean).
#5 Pasture or lot with or without hut.
Survey results were obtained for two size classes (35to 500 swine AU and more than 500 swine AU) in theWest and the North Central and Northeast. A differentsize class breakdown (35 to 100 swine AU and morethan 100 swine AU) was necessary for the Southeast
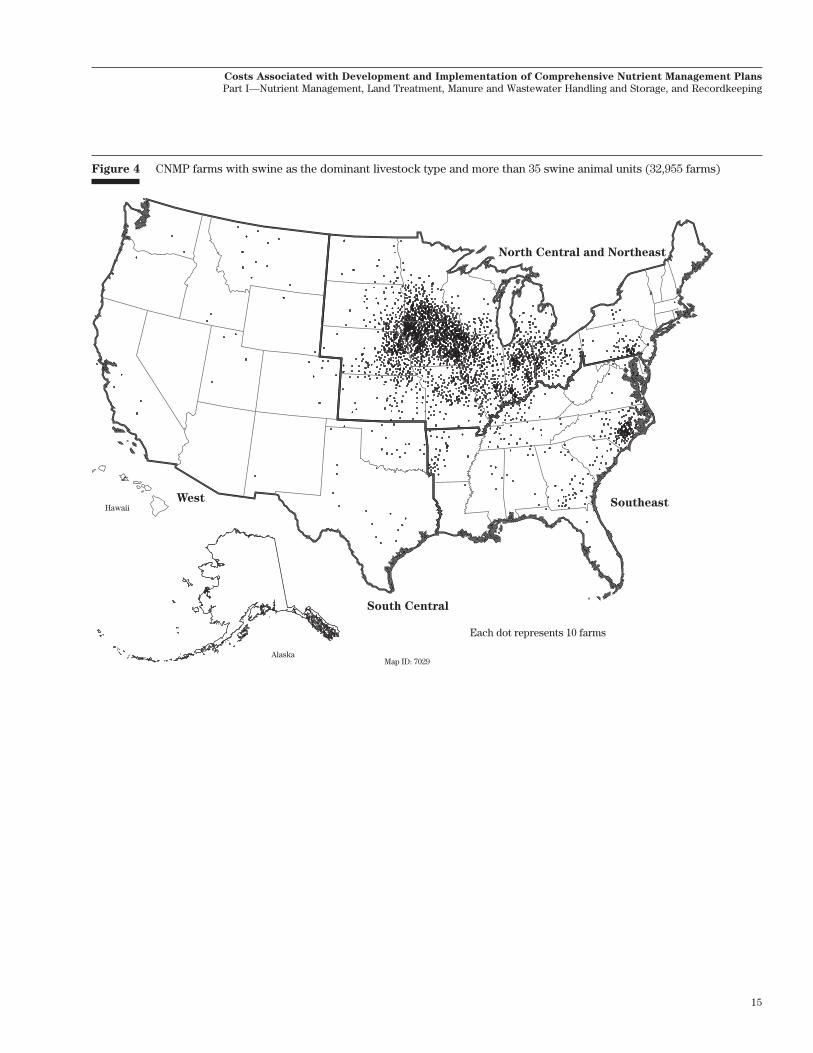
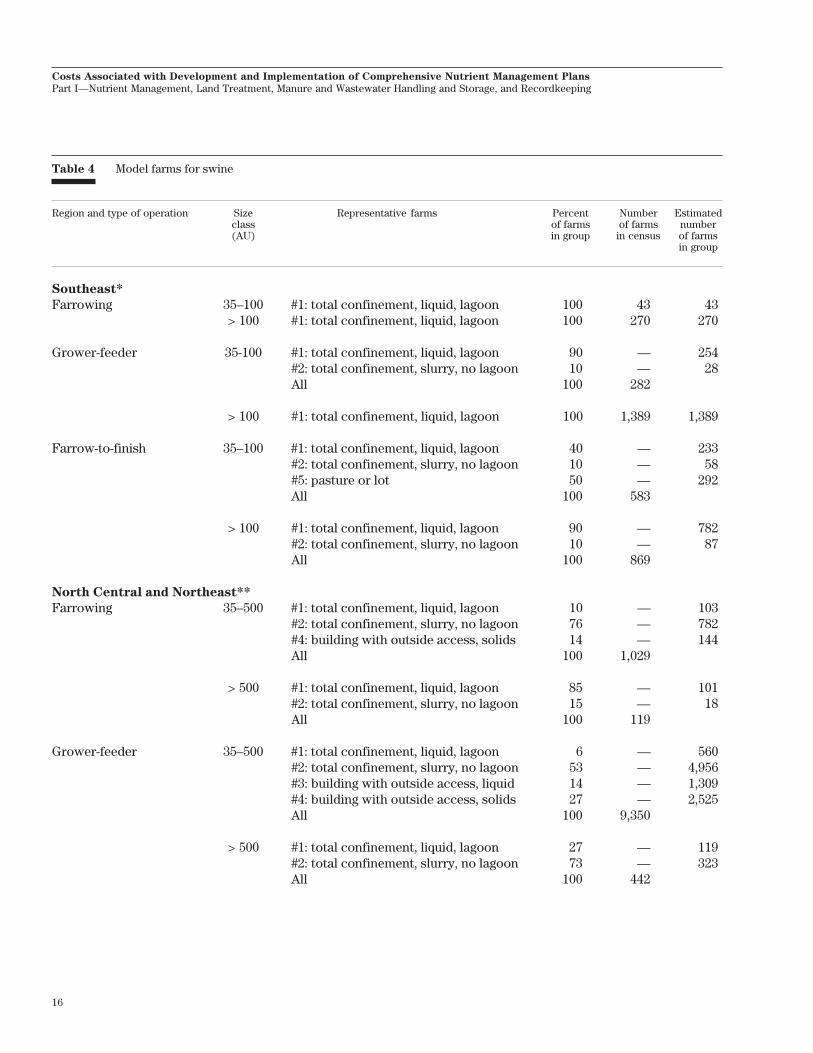
because production technologies for farms with morethan 100 swine AU were not diverse in that region. Thesurvey showed that production technologies alsovaried according to the type of swine facility. Thus,survey results were also broken down by farms thatwere primarily farrowing operations, primarily grower-feeder operations, or a combination of both (farrow-to-finish operations). The combinations of type of opera-tion, region, size class, and representative farms pro-duced 36 model farms for swine. The type of operationfor census farms was inferred based on the relativenumbers of breeding hogs and hogs for slaughterreported for each farm. Farms with more than 75percent of the swine AU consisting of breeding hogswere identified as farrowing operations. Farms withmore than 75 percent of the swine AU consisting ofhogs for slaughter were identified as grower-feederoperations. All other swine farms were identified asfarrow-to-finish operations.
The percentage of the swine farms in each region, sizeclass, and type of operation that corresponded to aparticular representative farm was determined fromthe survey results. These percentages were used asprobabilities in the assignment of model farms tocensus farms. These probabilities are presented intable 4 along with an estimate of the number of modelfarms, extrapolating from census farm counts. Thethree production regions are shown in figure 4 alongwith the location of CNMP farms with swine as thedominant livestock type.
15
Costs Associated with Development and Implementation of Comprehensive Nutrient Management Plans
Part I—Nutrient Management, Land Treatment, Manure and Wastewater Handling and Storage, and Recordkeeping
Figure 4 CNMP farms with swine as the dominant livestock type and more than 35 swine animal units (32,955 farms)
Hawaii
AlaskaMap ID: 7029
Each dot represents 10 farms
South Central
SoutheastWest
North Central and Northeast
16
Costs Associated with Development and Implementation of Comprehensive Nutrient Management Plans
Part I—Nutrient Management, Land Treatment, Manure and Wastewater Handling and Storage, and Recordkeeping
Table 4 Model farms for swine
Region and type of operation Size Representative farms Percent Number Estimatedclass of farms of farms number(AU) in group in census of farms
in group
Southeast*
Farrowing 35–100 #1: total confinement, liquid, lagoon 100 43 43> 100 #1: total confinement, liquid, lagoon 100 270 270
Grower-feeder 35-100 #1: total confinement, liquid, lagoon 90 — 254#2: total confinement, slurry, no lagoon 10 — 28All 100 282
> 100 #1: total confinement, liquid, lagoon 100 1,389 1,389
Farrow-to-finish 35–100 #1: total confinement, liquid, lagoon 40 — 233#2: total confinement, slurry, no lagoon 10 — 58#5: pasture or lot 50 — 292All 100 583
> 100 #1: total confinement, liquid, lagoon 90 — 782#2: total confinement, slurry, no lagoon 10 — 87All 100 869
North Central and Northeast**
Farrowing 35–500 #1: total confinement, liquid, lagoon 10 — 103#2: total confinement, slurry, no lagoon 76 — 782#4: building with outside access, solids 14 — 144All 100 1,029
> 500 #1: total confinement, liquid, lagoon 85 — 101#2: total confinement, slurry, no lagoon 15 — 18All 100 119
Grower-feeder 35–500 #1: total confinement, liquid, lagoon 6 — 560#2: total confinement, slurry, no lagoon 53 — 4,956#3: building with outside access, liquid 14 — 1,309#4: building with outside access, solids 27 — 2,525All 100 9,350
> 500 #1: total confinement, liquid, lagoon 27 — 119#2: total confinement, slurry, no lagoon 73 — 323All 100 442
17
Costs Associated with Development and Implementation of Comprehensive Nutrient Management Plans
Part I—Nutrient Management, Land Treatment, Manure and Wastewater Handling and Storage, and Recordkeeping
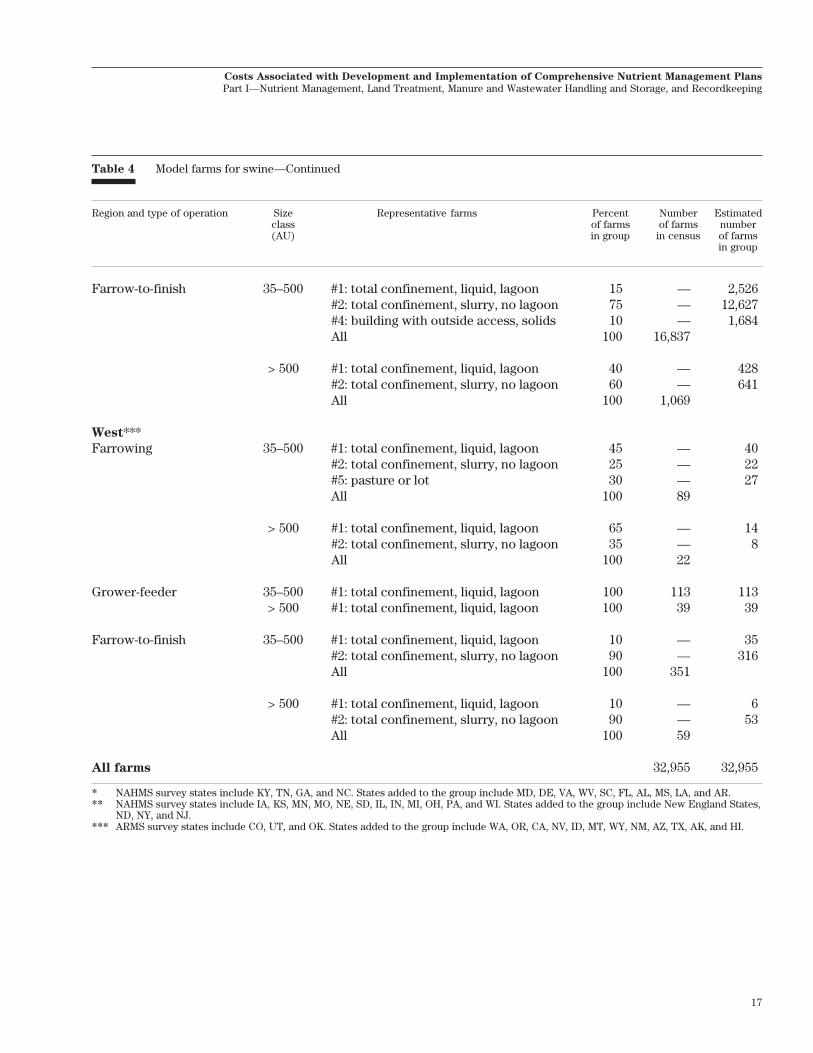
Table 4 Model farms for swine—Continued
Region and type of operation Size Representative farms Percent Number Estimatedclass of farms of farms number(AU) in group in census of farms
in group
Farrow-to-finish 35–500 #1: total confinement, liquid, lagoon 15 — 2,526#2: total confinement, slurry, no lagoon 75 — 12,627#4: building with outside access, solids 10 — 1,684All 100 16,837
> 500 #1: total confinement, liquid, lagoon 40 — 428#2: total confinement, slurry, no lagoon 60 — 641All 100 1,069
West***Farrowing 35–500 #1: total confinement, liquid, lagoon 45 — 40
#2: total confinement, slurry, no lagoon 25 — 22#5: pasture or lot 30 — 27All 100 89
> 500 #1: total confinement, liquid, lagoon 65 — 14#2: total confinement, slurry, no lagoon 35 — 8All 100 22
Grower-feeder 35–500 #1: total confinement, liquid, lagoon 100 113 113> 500 #1: total confinement, liquid, lagoon 100 39 39
Farrow-to-finish 35–500 #1: total confinement, liquid, lagoon 10 — 35#2: total confinement, slurry, no lagoon 90 — 316All 100 351
> 500 #1: total confinement, liquid, lagoon 10 — 6#2: total confinement, slurry, no lagoon 90 — 53All 100 59
All farms 32,955 32,955
* NAHMS survey states include KY, TN, GA, and NC. States added to the group include MD, DE, VA, WV, SC, FL, AL, MS, LA, and AR.** NAHMS survey states include IA, KS, MN, MO, NE, SD, IL, IN, MI, OH, PA, and WI. States added to the group include New England States,
ND, NY, and NJ.*** ARMS survey states include CO, UT, and OK. States added to the group include WA, OR, CA, NV, ID, MT, WY, NM, AZ, TX, AK, and HI.
18
Costs Associated with Development and Implementation of Comprehensive Nutrient Management Plans
Part I—Nutrient Management, Land Treatment, Manure and Wastewater Handling and Storage, and Recordkeeping
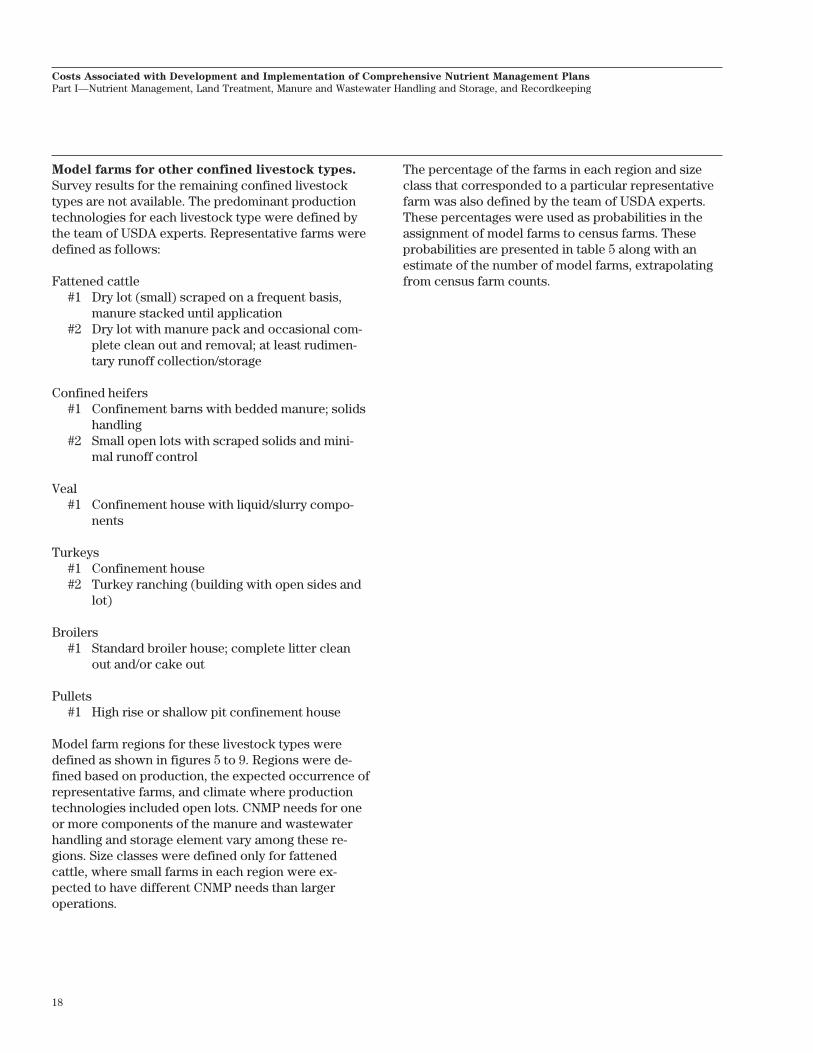
Model farms for other confined livestock types.
Survey results for the remaining confined livestocktypes are not available. The predominant productiontechnologies for each livestock type were defined bythe team of USDA experts. Representative farms weredefined as follows:
Fattened cattle#1 Dry lot (small) scraped on a frequent basis,
manure stacked until application#2 Dry lot with manure pack and occasional com-
plete clean out and removal; at least rudimen-tary runoff collection/storage
Confined heifers#1 Confinement barns with bedded manure; solids
handling#2 Small open lots with scraped solids and mini-
mal runoff control
Veal#1 Confinement house with liquid/slurry compo-
nents
Turkeys#1 Confinement house#2 Turkey ranching (building with open sides and
lot)
Broilers#1 Standard broiler house; complete litter clean
out and/or cake out
Pullets#1 High rise or shallow pit confinement house
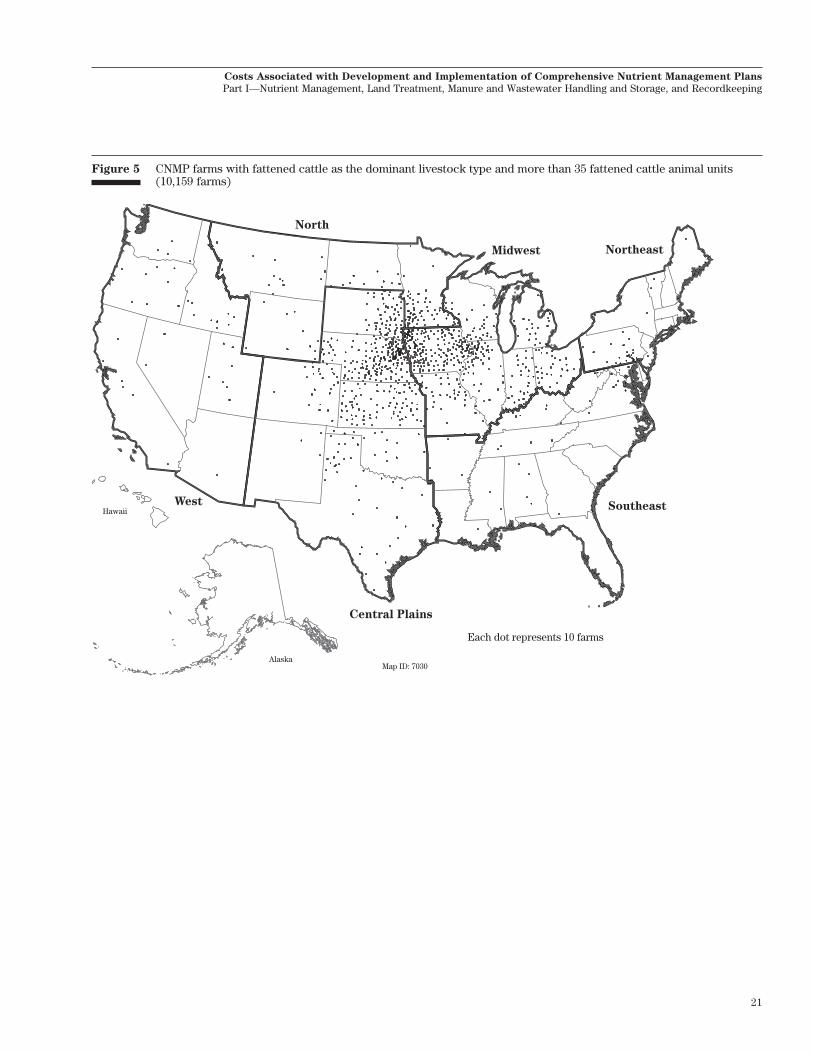
Model farm regions for these livestock types weredefined as shown in figures 5 to 9. Regions were de-fined based on production, the expected occurrence ofrepresentative farms, and climate where productiontechnologies included open lots. CNMP needs for oneor more components of the manure and wastewaterhandling and storage element vary among these re-gions. Size classes were defined only for fattenedcattle, where small farms in each region were ex-pected to have different CNMP needs than largeroperations.
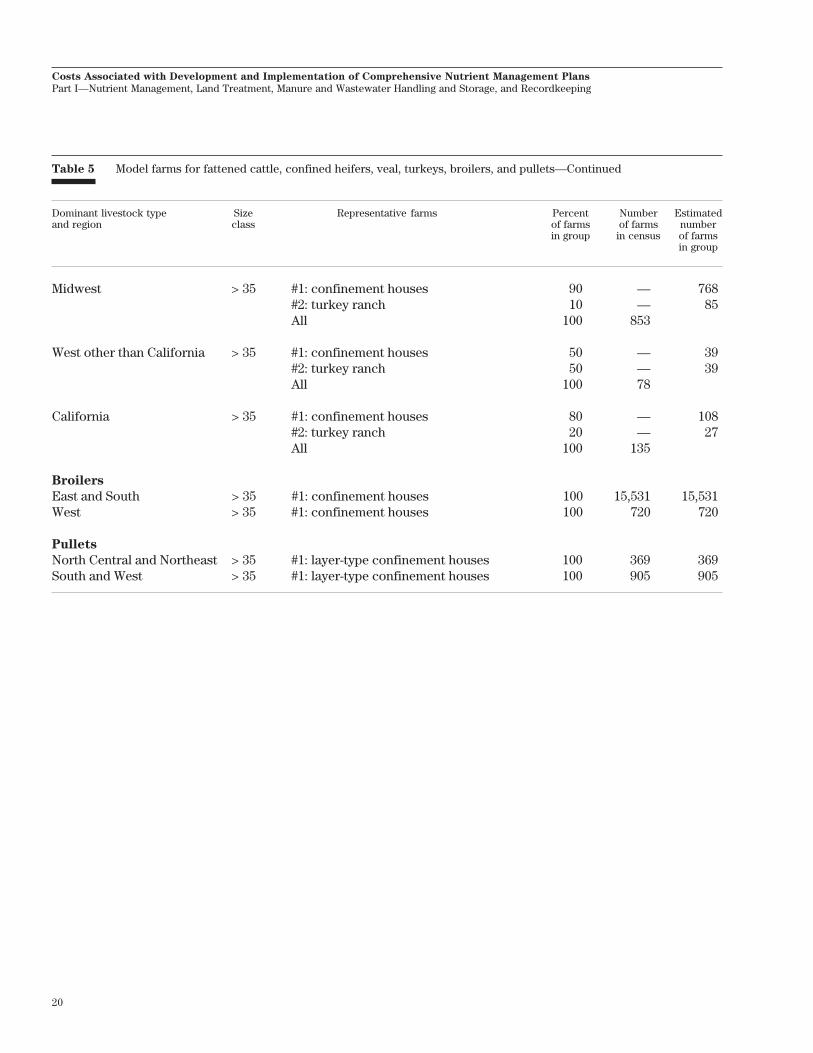
The percentage of the farms in each region and sizeclass that corresponded to a particular representativefarm was also defined by the team of USDA experts.These percentages were used as probabilities in theassignment of model farms to census farms. Theseprobabilities are presented in table 5 along with anestimate of the number of model farms, extrapolatingfrom census farm counts.

19
Costs Associated with Development and Implementation of Comprehensive Nutrient Management Plans
Part I—Nutrient Management, Land Treatment, Manure and Wastewater Handling and Storage, and Recordkeeping
Table 5 Model farms for fattened cattle, confined heifers, veal, turkeys, broilers, and pullets
Dominant livestock type Size Representative farms Percent Number Estimatedand region class of farms of farms number
in group in census of farmsin group
Fattened cattle
Northeast > 35 #1: scrape and stack 100 277 277
Southeast > 35 #1: scrape and stack 30 — 111#2: manure pack, runoff collection 70 — 260All 100 371
Midwest 35–500 #1: scrape and stack 30 — 748#2: manure pack, runoff collection 70 — 1,746All 100 2,494
> 500 #2: manure pack, runoff collection 100 1,504 1,504
North 35–500 #2: manure pack, runoff collection 100 925 925> 500 #2: manure pack, runoff collection 100 52 52
Central Plains 35–1,000 #2: manure pack, runoff collection 100 3,499 3,499> 1,000 #2: manure pack, runoff collection 100 666 666
West 35–500 #2: manure pack, runoff collection 100 252 252> 500 #2: manure pack, runoff collection 100 119 119
All 10,159 10,159
Confined heifers
Northeast > 35 #1: confinement barn/bedded manure 70 — 117#2: open lots with scraped solids 30 — 50All 100 167
Midwest > 35 #1: confinement barn/bedded manure 40 — 974#2: open lots with scraped solids 60 — 1,462All 100 2,436
South and West > 35 #2: open lots with scraped solids 100 1,240 1,240
Veal > 35 #1: confinement house 100 168 168
Turkeys
East > 35 #1: confinement houses 90 — 1,266#2: turkey ranch 10 — 141All 100 1,407
South Central > 35 #1: confinement houses 100 740 740
20
Costs Associated with Development and Implementation of Comprehensive Nutrient Management Plans
Part I—Nutrient Management, Land Treatment, Manure and Wastewater Handling and Storage, and Recordkeeping
Table 5 Model farms for fattened cattle, confined heifers, veal, turkeys, broilers, and pullets—Continued
Dominant livestock type Size Representative farms Percent Number Estimatedand region class of farms of farms number
in group in census of farmsin group
Midwest > 35 #1: confinement houses 90 — 768#2: turkey ranch 10 — 85All 100 853
West other than California > 35 #1: confinement houses 50 — 39#2: turkey ranch 50 — 39All 100 78
California > 35 #1: confinement houses 80 — 108#2: turkey ranch 20 — 27All 100 135
Broilers
East and South > 35 #1: confinement houses 100 15,531 15,531West > 35 #1: confinement houses 100 720 720
Pullets
North Central and Northeast > 35 #1: layer-type confinement houses 100 369 369South and West > 35 #1: layer-type confinement houses 100 905 905
21
Costs Associated with Development and Implementation of Comprehensive Nutrient Management Plans
Part I—Nutrient Management, Land Treatment, Manure and Wastewater Handling and Storage, and Recordkeeping
Figure 5 CNMP farms with fattened cattle as the dominant livestock type and more than 35 fattened cattle animal units(10,159 farms)
Hawaii
AlaskaMap ID: 7030
Each dot represents 10 farms
Central Plains
SoutheastWest
NortheastMidwest
North
22
Costs Associated with Development and Implementation of Comprehensive Nutrient Management Plans
Part I—Nutrient Management, Land Treatment, Manure and Wastewater Handling and Storage, and Recordkeeping
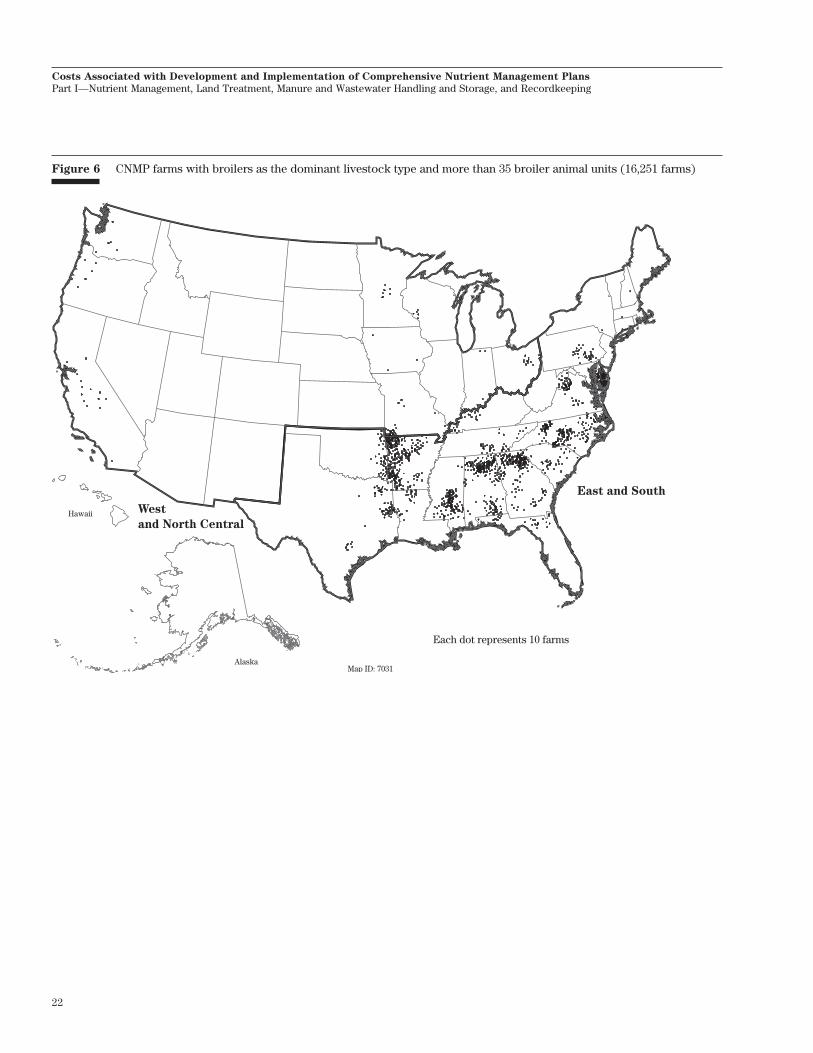
Figure 6 CNMP farms with broilers as the dominant livestock type and more than 35 broiler animal units (16,251 farms)
Hawaii
AlaskaMap ID: 7031
Each dot represents 10 farms
East and South
West
and North Central

23
Costs Associated with Development and Implementation of Comprehensive Nutrient Management Plans
Part I—Nutrient Management, Land Treatment, Manure and Wastewater Handling and Storage, and Recordkeeping
Figure 7 CNMP farms with turkeys as the dominant livestock type and more than 35 turkey animal units (3,213 farms)
Hawaii
AlaskaMap ID: 7028
Each dot represents 10 farms
South Central
East
West
(without CA)
CA
Midwest
24
Costs Associated with Development and Implementation of Comprehensive Nutrient Management Plans
Part I—Nutrient Management, Land Treatment, Manure and Wastewater Handling and Storage, and Recordkeeping
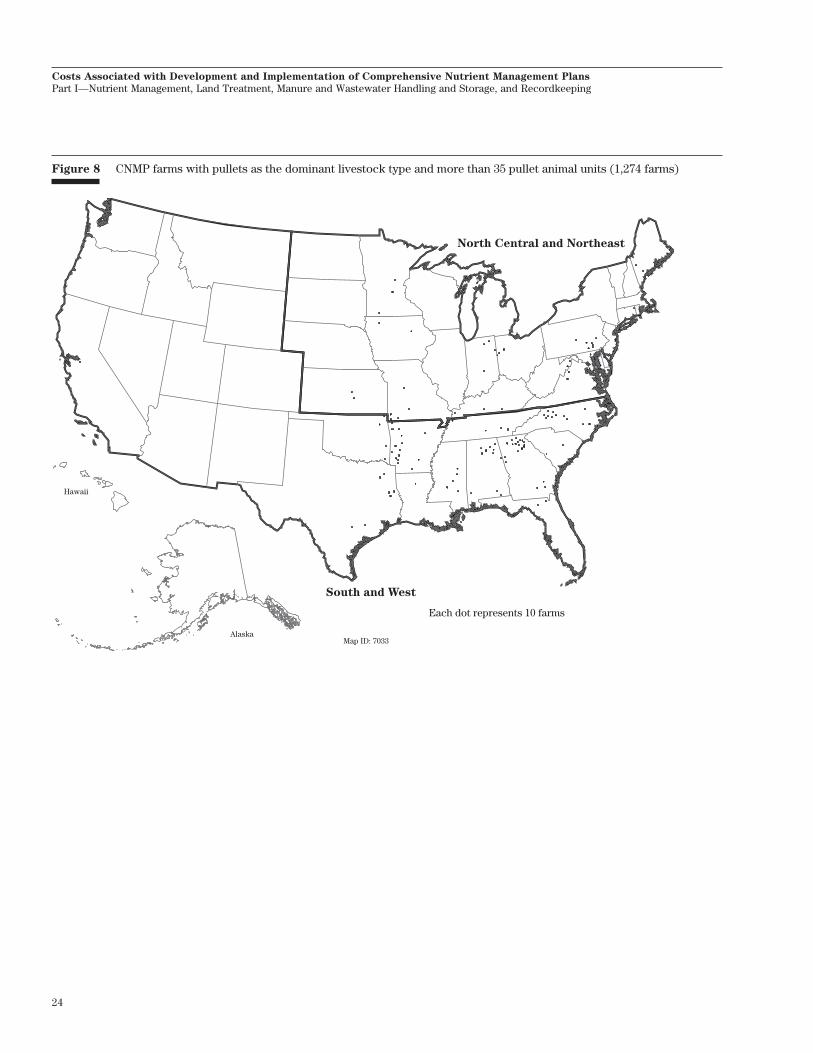
Figure 8 CNMP farms with pullets as the dominant livestock type and more than 35 pullet animal units (1,274 farms)
Hawaii
AlaskaMap ID: 7033
Each dot represents 10 farms
South and West
North Central and Northeast
25
Costs Associated with Development and Implementation of Comprehensive Nutrient Management Plans
Part I—Nutrient Management, Land Treatment, Manure and Wastewater Handling and Storage, and Recordkeeping
Figure 9 CNMP farms with confined heifers or veal as the dominant livestock type (4,011 farms)
Hawaii
AlaskaMap ID: 7034
Each dot represents 10 farms
South and West
Midwest
Northeast

26
Costs Associated with Development and Implementation of Comprehensive Nutrient Management Plans
Part I—Nutrient Management, Land Treatment, Manure and Wastewater Handling and Storage, and Recordkeeping
Figure 10 CNMP farms with pastured livestock types (61,272 farms)
Hawaii
AlaskaMap ID: 7036
Each dot represents 10 farms
South
Northeast
Midwest
Lake States
Northern Plains and Mountain States
West
Model farms for pastured livestock types. Costsassociated with conservation practices for pasturedlivestock are grouped under the manure and wastewa-ter storage and handling element, although they in-clude some costs associated with pasture managementthat would be expected to be included in a CNMP forthese farms. As shown in appendix A, 24,697 farmswith pastured livestock and few other livestock quali-fied as farms that may need a CNMP because of theamount of recoverable manure that would potentiallybe produced on these farms. An additional 36,575farms had less than 35 AU of confined livestock types,but had beef cattle as the dominant livestock type onthe farm. These two groups comprise the set of farmsfor which CNMP needs are defined for farms withpastured livestock. Four representative farms wereidentified for this group of farms:
#1 Pasture with heavy use area#2 Pasture with windbreak and/or shelterbelt
#3 Pasture with lot and scrape-and-stack manurehandling
#4 Pasture with barn for shelter
Six production regions were defined, as well as twosize classes for the Northeast. The six productionregions are shown in figure 10. Representative farmswere assigned to each region as follows:
South—#1: pasture with heavy use protection (17,731farms)
Midwest—#3: pasture with lot (13,950 farms)
Lake States—#4: pasture with barn (5,896 farms)
Northeast, less than 70 AU—#4: pasture with barn(5,299 farms)
Northeast, more than 70 AU—#1: pasture withheavy use protection (2,133 farms)

27
Costs Associated with Development and Implementation of Comprehensive Nutrient Management Plans
Part I—Nutrient Management, Land Treatment, Manure and Wastewater Handling and Storage, and Recordkeeping
Northern Plains and Mountain States—#2: pasturewith windbreak/shelterbelt (13,840 farms)
West Coast—#2: pasture with windbreak/shelterbelt(2,423 farms)
Small farms with confined livestock types. Farmswith less than 35 AU where confined livestock typeswere dominant (42,565 farms) were judged to be toodiverse with respect to the type of production tech-nologies employed in producing livestock to apply anapproach to estimating CNMP needs based on repre-sentative farms. They generally also have a morediverse collection of livestock types. These smallfarms tend to use small lots and pastured environ-ments to a greater extent than larger farms. Further-more, CNMPs for these smaller farms would likelyaddress only a subset of the components that would beaddressed for larger farms, focusing on situations and
practices associated with environmental impacts. Thespatial distribution of these small farms is shown infigure 11. Manure and wastewater handling and stor-age costs for this group of farms were based on costsderived for small dairies (see section Manure andWastewater Handling and Storage Costs).
Approach used to determineper-unit costs
Per-unit costs are the costs for specific equipment,installed structures, or activities that are needed tomeet CNMP criteria. Most per-unit cost estimates werebased on economic studies reported in the literature oron costs compiled in the NRCS Field Office TechnicalGuides. Per-unit costs from these sources often vary,reflecting regional differences in costs or differences
Figure 11 CNMP farms with less than 35 animal units of milk cows, swine, poultry, or fattened cattle (42,565 farms)
Hawaii
AlaskaMap ID: 7035
Each dot represents 10 farms
28
Costs Associated with Development and Implementation of Comprehensive Nutrient Management Plans
Part I—Nutrient Management, Land Treatment, Manure and Wastewater Handling and Storage, and Recordkeeping
in how livestock operations are managed. The ap-proach taken in this study was to select or derive per-unit cost values that would generally be representativeof the livestock industry as a whole, and avoid per-unitcost estimates that were specific to a small set ofoperations. An effort was also made to keep per-unitcosts consistent among the various items and activi-ties so that differences in CNMP-related costs wouldbe clearly attributable to differences in CNMP needsamong livestock operations. The resulting cost esti-mates for a particular farm as estimated in this studyare therefore not expected to correspond exactly toobserved CNMP-related costs for individual opera-tions. It is expected, however, that per-farm costestimates overall will be reasonable approximations ofthe average CNMP costs for a group of livestockoperations.
For the most part, per-unit cost estimates used in thisstudy correspond to prices for the period 1995 to 2000.Wherever possible, per-unit costs were taken from themost recent sources. When older sources were all thatwere available, costs were converted to the year 2000prices.
Conventions were adopted for per-unit costs related tolabor and capital investment. The per-unit cost forlabor was set at $10 per hour for all activities. The $10per hour labor rate is intended to represent a low-skill,full time permanent employee’s salary. Many of thesmaller livestock operations, however, will not employhired labor, and the activities will be performed by theoperator who could have a much higher opportunitycost for time than $10 per hour.
All costs reported in the paper are annual costs. Capi-tal costs for equipment and installed structures wereconverted to annual costs by amortizing the total costover a 10-year period assuming a discount rate of 8percent. To the extent that livestock operations re-ceive subsidies from government programs to pur-chase or finance capital investment, the CNMP costsestimated in this study will be somewhat overstated.
Economies of scale are expected for most per-unitcosts. Larger operations often can conduct an activityfor less cost per animal unit than smaller operations.Adjustments were made for economies of scale in theper-unit cost estimates used in the study where therewas a reasonable basis for making the adjustment.
Reporting results
This cost assessment was designed to provide esti-mates of CNMP-related costs at the national andregional level and for major livestock productionregions. Whereas estimates of manure production andacres needed for manure application are reasonableestimates at the county level, the assumptions andinformation pertaining to CNMP needs and costs aretoo generalized to provide cost estimates at the countyor even the state level. Extrapolation of CNMP costestimates to states and counties is therefore not anappropriate application of the cost assessment.
CNMP cost estimates are summarized and reported bydominant livestock type, by farm size, and by the 10USDA farm production regions.
Three size classes of farms were derived based on theamount of manure phosphorus produced on eachfarm. Farms producing more than 10 tons (20,000pounds) of manure phosphorus annually were catego-rized as large farms, shown in figure 12. Farms produc-ing 4 to 10 tons (8,000 to 20,000 pounds) of manurephosphorus annually were categorized as mediumfarms, shown in figure 13. Farms with less than 4 tonsof manure phosphorus were categorized as smallfarms. The number of CNMP farms by farm size anddominant livestock type is presented in table 6. The setof large farms includes most of the census farmsidentified in appendix A as potential concentratedanimal feeding operations (CAFOs) with more than1,000 EPA animal units, plus additional farms thatproduce an equivalent amount of manure nutrients.The 4-ton limit used to define the set of medium-sizefarms corresponds roughly to the 300 EPA animal unitthreshold. (A comparison to the EPA size class catego-ries is presented in appendix C.)
States and CNMP farm counts corresponding to the 10farm production regions are shown in table 7.
Maps of county-level estimates of farm counts, acresrequired for land application, and recoverable manurenutrients are also presented in this publication. Sincethese variables were calculated directly from dataelements in the Census of Agriculture or the NRI, it isappropriate to present these data at the county level.Dots are used in these maps to represent the numberof farms, acres, or amount of manure nutrients. For
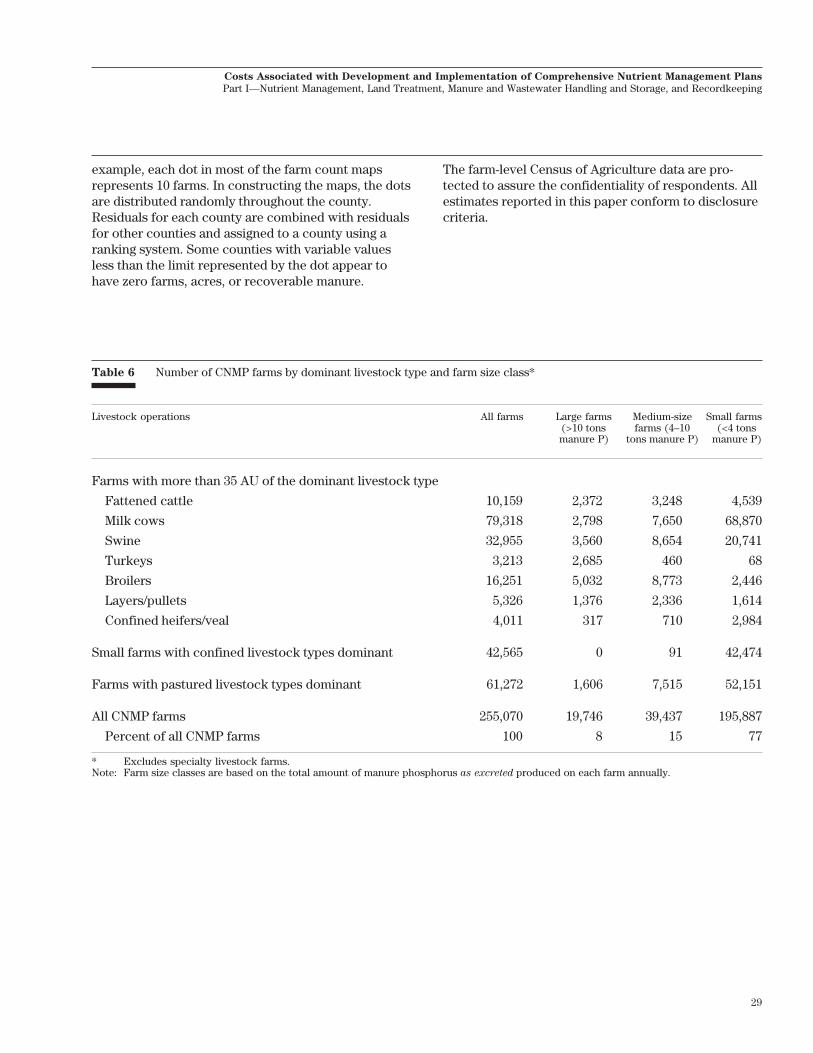
29
Costs Associated with Development and Implementation of Comprehensive Nutrient Management Plans
Part I—Nutrient Management, Land Treatment, Manure and Wastewater Handling and Storage, and Recordkeeping
example, each dot in most of the farm count mapsrepresents 10 farms. In constructing the maps, the dotsare distributed randomly throughout the county.Residuals for each county are combined with residualsfor other counties and assigned to a county using aranking system. Some counties with variable valuesless than the limit represented by the dot appear tohave zero farms, acres, or recoverable manure.
Table 6 Number of CNMP farms by dominant livestock type and farm size class*
Livestock operations All farms Large farms Medium-size Small farms(>10 tons farms (4–10 (<4 tonsmanure P) tons manure P) manure P)
Farms with more than 35 AU of the dominant livestock type
Fattened cattle 10,159 2,372 3,248 4,539
Milk cows 79,318 2,798 7,650 68,870
Swine 32,955 3,560 8,654 20,741
Turkeys 3,213 2,685 460 68
Broilers 16,251 5,032 8,773 2,446
Layers/pullets 5,326 1,376 2,336 1,614
Confined heifers/veal 4,011 317 710 2,984
Small farms with confined livestock types dominant 42,565 0 91 42,474
Farms with pastured livestock types dominant 61,272 1,606 7,515 52,151
All CNMP farms 255,070 19,746 39,437 195,887
Percent of all CNMP farms 100 8 15 77
* Excludes specialty livestock farms.Note: Farm size classes are based on the total amount of manure phosphorus as excreted produced on each farm annually.
The farm-level Census of Agriculture data are pro-tected to assure the confidentiality of respondents. Allestimates reported in this paper conform to disclosurecriteria.
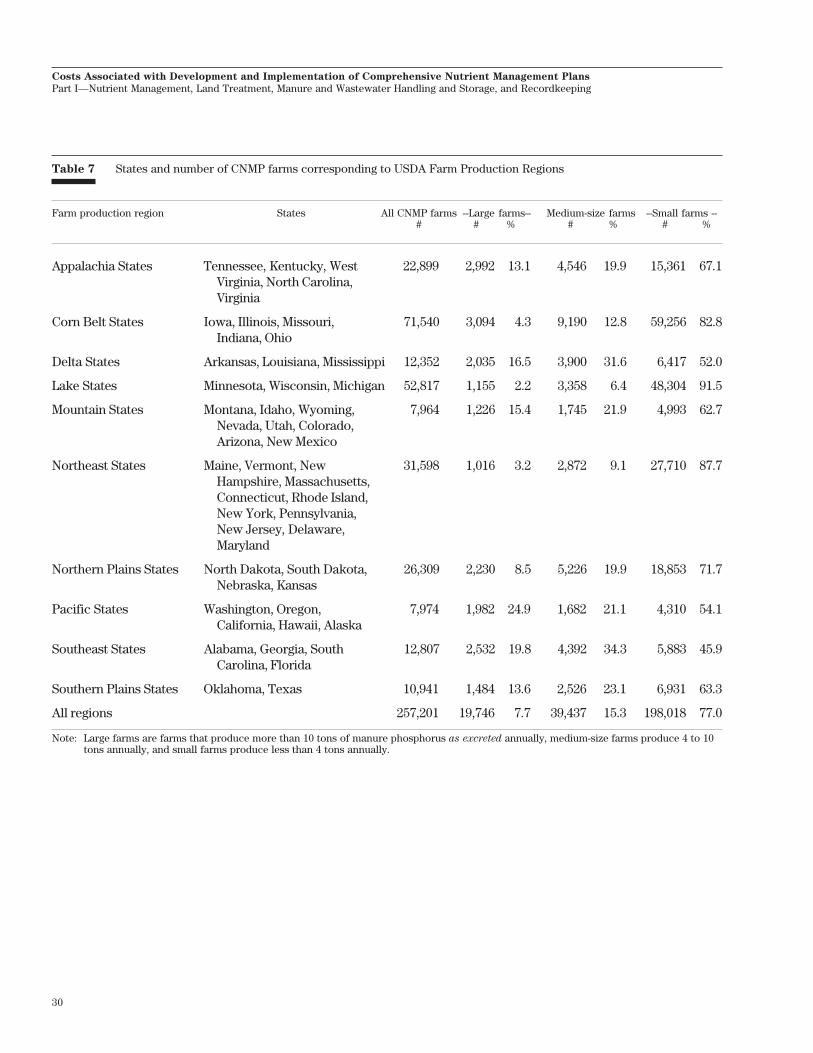
30
Costs Associated with Development and Implementation of Comprehensive Nutrient Management Plans
Part I—Nutrient Management, Land Treatment, Manure and Wastewater Handling and Storage, and Recordkeeping
Table 7 States and number of CNMP farms corresponding to USDA Farm Production Regions
Farm production region States All CNMP farms --Large farms-- Medium-size farms --Small farms --# # % # % # %
Appalachia States Tennessee, Kentucky, West 22,899 2,992 13.1 4,546 19.9 15,361 67.1Virginia, North Carolina,Virginia
Corn Belt States Iowa, Illinois, Missouri, 71,540 3,094 4.3 9,190 12.8 59,256 82.8Indiana, Ohio
Delta States Arkansas, Louisiana, Mississippi 12,352 2,035 16.5 3,900 31.6 6,417 52.0
Lake States Minnesota, Wisconsin, Michigan 52,817 1,155 2.2 3,358 6.4 48,304 91.5
Mountain States Montana, Idaho, Wyoming, 7,964 1,226 15.4 1,745 21.9 4,993 62.7Nevada, Utah, Colorado,Arizona, New Mexico
Northeast States Maine, Vermont, New 31,598 1,016 3.2 2,872 9.1 27,710 87.7Hampshire, Massachusetts,Connecticut, Rhode Island,New York, Pennsylvania,New Jersey, Delaware,Maryland
Northern Plains States North Dakota, South Dakota, 26,309 2,230 8.5 5,226 19.9 18,853 71.7Nebraska, Kansas
Pacific States Washington, Oregon, 7,974 1,982 24.9 1,682 21.1 4,310 54.1California, Hawaii, Alaska
Southeast States Alabama, Georgia, South 12,807 2,532 19.8 4,392 34.3 5,883 45.9Carolina, Florida
Southern Plains States Oklahoma, Texas 10,941 1,484 13.6 2,526 23.1 6,931 63.3
All regions 257,201 19,746 7.7 39,437 15.3 198,018 77.0
Note: Large farms are farms that produce more than 10 tons of manure phosphorus as excreted annually, medium-size farms produce 4 to 10tons annually, and small farms produce less than 4 tons annually.
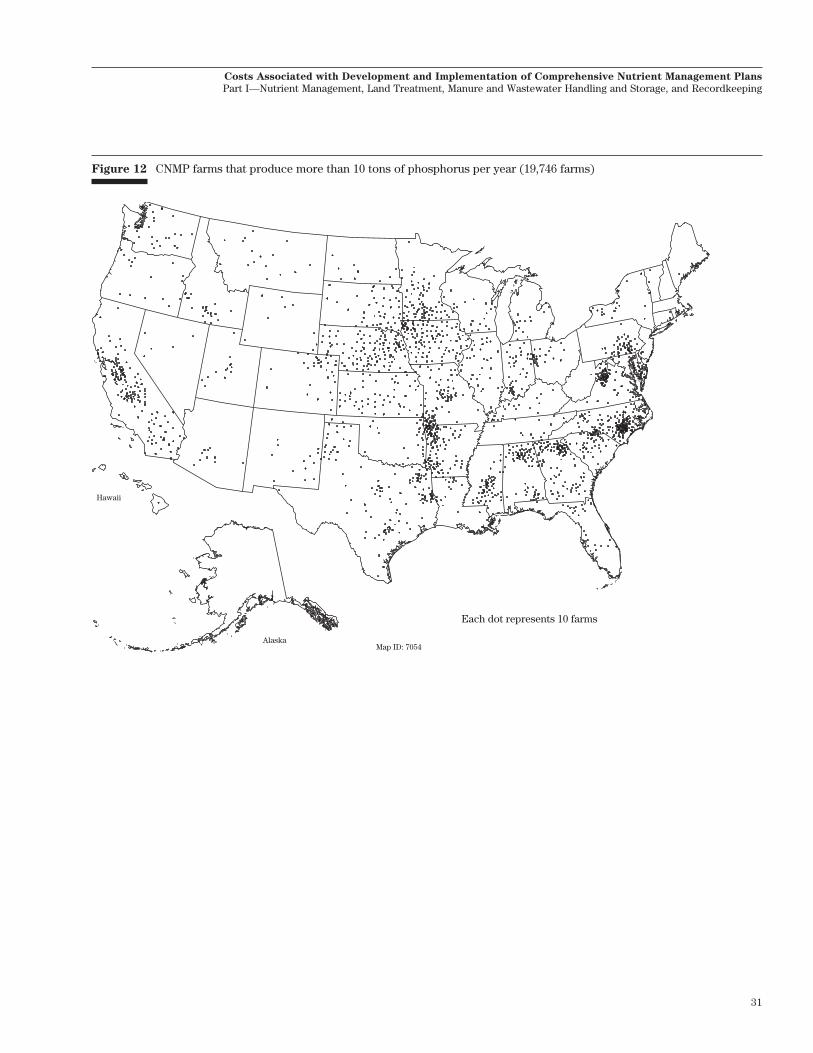
31
Costs Associated with Development and Implementation of Comprehensive Nutrient Management Plans
Part I—Nutrient Management, Land Treatment, Manure and Wastewater Handling and Storage, and Recordkeeping
Figure 12 CNMP farms that produce more than 10 tons of phosphorus per year (19,746 farms)
Hawaii
AlaskaMap ID: 7054
Each dot represents 10 farms
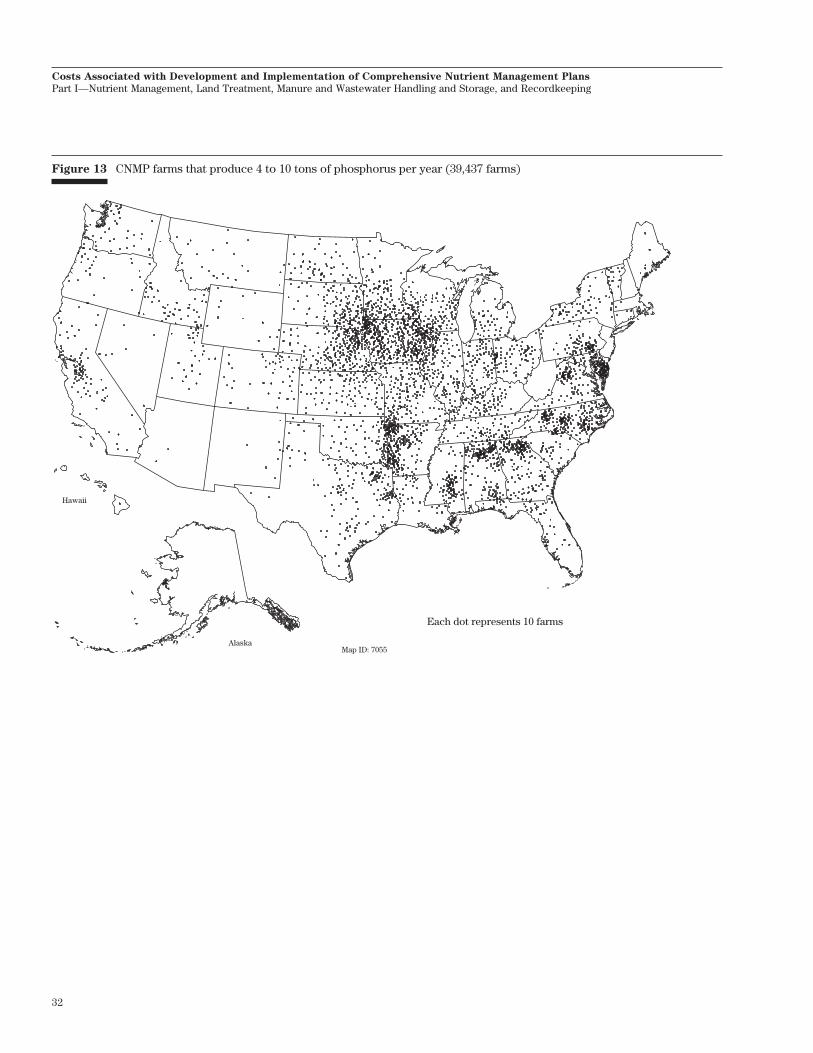
32
Costs Associated with Development and Implementation of Comprehensive Nutrient Management Plans
Part I—Nutrient Management, Land Treatment, Manure and Wastewater Handling and Storage, and Recordkeeping
Figure 13 CNMP farms that produce 4 to 10 tons of phosphorus per year (39,437 farms)
Hawaii
AlaskaMap ID: 7055
Each dot represents 10 farms
33
Costs Associated with Development and Implementation of Comprehensive Nutrient Management Plans
Part I—Nutrient Management, Land Treatment, Manure and Wastewater Handling and Storage, and Recordkeeping
Nutrient management costs
The nutrient management element of a CNMP ad-dresses the requirements for land application of ma-nure nutrients. Land application is the preferredmethod of utilizing manure since these materials cansupply large amounts of nutrients for crop growth,thereby reducing the need to apply commercial fertiliz-ers. CNMP criteria are established to provide foradequate nutrients for crop growth and to minimizethe potential for adverse environmental effects.
Costs for nutrient management were developed basedon the implementation requirements of a nutrientmanagement plan as defined in the NRCS NutrientManagement Policy (General Manual, Title 190, Part402) (USDA, NRCS, 1999) and the NRCS ConservationPractice Standard, Nutrient Management (Code 590).The primary criteria within these policy documents arethat land application rates of nutrients be based uponLand Grant University nutrient application recommen-dations. The NRCS criteria for implementing a nutrientmanagement plan include the use of current soil tests,manure testing to determine nutrient content, docu-mented or realistic yield goals, and Land Grant Univer-sity recommendations for determining nutrient appli-cation rates.
Nutrient management plans also address the methodand timing of manure and wastewater application toreduce losses of valuable manure nutrients (primarilynitrogen) that occur during and after land application.By reducing these losses, the amount of manure nutri-ents made available for crop growth is increased andthe potential for environmental impacts is decreased.For example, a common management action in anutrient management plan would be for liquid manureapplications by injection into the soil, rather thansurface applied. This would minimize nitrogen lossesbecause of volatilization and runoff and reduce thepotential for phosphorus losses in runoff or soil ero-sion. Nutrient management plans also reflect operatordecisions to change existing crop rotations to betteruse manure nutrients produced on the farm. (Erosioncontrol practices, which are part of the land treatmentelement of a CNMP, further contribute to reducingmanure nutrient losses.)
NRCS policy permits manure application rates that aredetermined using either a nitrogen or phosphorusstandard. Manure application rates that are based on anitrogen standard would supply all the nitrogen recom-mended for the crop. They also account for the nitro-gen volatilization losses and other losses that occurduring and after land application. Manure applied at anitrogen standard usually results in overapplication ofphosphorus. NRCS policy permits use of the nitrogenstandard on sites for which there is a recommendationto apply phosphorus, or when the use of a risk assess-ment tool has determined that the site has acceptablerisk for off-site transport of phosphorus. (The Phos-phorus Index is currently the most widely used riskassessment tool for this purpose.)
Manure application rates that are based on a phospho-rus standard supply only the amount of phosphorusthat is recommended based on current soil tests or afunction of the phosphorus content of plant biomassremoved at harvest. Manure applied based on thephosphorus standard will not usually supply the rec-ommended amount of nitrogen, necessitating theapplication of additional nitrogen from other sources.When using the phosphorus standard, NRCS policypermits an application of phosphorus equal to theamount of phosphorus contained in the biomass ofmultiple years of crops grown on the site, if the nitro-gen recommendation rate for the first year is notexceeded. This allows farms that have enough land tocontinue to apply manure based on a nitrogen stan-dard, but rotate manure applications to other sites sothat a single site receives manure infrequently. Conse-quently, operations with sufficient land can meetnutrient management criteria without actually apply-ing manure at rates based on a phosphorus standard,which is sometimes difficult to achieve with existingapplication equipment and is more costly to implementthan a nitrogen standard. Operations without sufficientland, however, will eventually need to apply manurebased on a phosphorus standard on all availableonfarm acres as the phosphorus levels build up in thesoil, or else export the manure off-farm for land appli-cation or alternative use.
The cost of nutrient management associated withCNMPs was determined by estimating the cost of soiltesting, the cost of manure testing, the cost of trans-porting manure to the application site on the farm, and

34
Costs Associated with Development and Implementation of Comprehensive Nutrient Management Plans
Part I—Nutrient Management, Land Treatment, Manure and Wastewater Handling and Storage, and Recordkeeping
the cost of onfarm land application. Onfarm landapplication costs were based on the additional acres
required to meet nutrient management criteria asproducers shift from existing rates of application tolower rates of application. Additional acres will also berequired because of the increase in the amount ofmanure that is recoverable as producers upgrade theirmanure collection and transfer equipment and prac-tices. Onfarm transport costs were based on the in-
crease in the onfarm distance manure is transportedwhen the number of acres receiving manure increasesand on the change in the amount of manure to betransported on the farm.
Simulating manure applicationcriteria
The first step in estimating nutrient management costswas to estimate the amount of manure produced oneach farm that would be available for land application(i.e., recoverable manure.) The second step was toestimate the acres available for manure application oneach farm. The third step was to estimate the addi-tional number of acres required to meet nutrientmanagement criteria. The methods used to make theseestimates are presented in appendix B. To determinethe additional acres required, two land applicationscenarios were used:
• Baseline scenario, which simulates land applica-tion of manure prior to CNMP implementation
• After-CNMP scenario, which simulates landapplication of manure after CNMP implementa-tion
The baseline scenario simulates manure applicationpractices for about the year 1997, which coincideswith the most recent Census of Agriculture data andpre-dates CNMP implementation. Anecdotal evidenceand limited information from farmer surveys indicatethat manure application practices vary considerably.In general, manure seldom is applied at rates belowthe nitrogen standard, even when commercial fertiliz-ers also are applied. Application rates exceeding thenitrogen standard are common. In extreme casesmanure application rates were reported to be severaltimes greater than the nitrogen standard.
A combination of application rates similar to thenitrogen standard and application rates above thenitrogen standard were used to represent the baselinescenario. The model simulated manure applicationrates above the nitrogen standard for permanentpasture, cropland used as pasture, and nine feed andforage crops. For farms that had enough land foronfarm application, application rates for this group ofcrops and pastureland were set at one and one-halftimes the amount of nitrogen taken up and removed atharvest plus an adjustment for nitrogen loss duringand after application. For farms that did not havesufficient land at these application rates, applicationrates were increased to twice the amount of nitrogentaken up and removed at harvest plus the adjustmentfor losses. Application rates similar to nitrogen-stan-dard application rates were used for other crops. (Fordetails on how the baseline scenario was constructed,see appendix B.)
The after-CNMP scenario simulates manure applica-tion practices after all CNMP farms have implementedCNMPs. Manure application rates depend on theamount of acreage available for manure application oneach farm and whether nitrogen or phosphorus wasthe limiting nutrient. If phosphorus was the limitingnutrient, land application on farms without enoughacres to meet a phosphorus standard was simulatedusing phosphorus-based application rates for all cropsand pastureland. For manure-producing farms that hadenough acres to meet a phosphorus standard, landapplication was simulated using nitrogen-based appli-cation rates for all crops and pastureland. For a fewCNMP farms (1,379 farms), nitrogen was the limitingnutrient. For these farms, land application was simu-lated using a nitrogen standard. (For details on howthe after-CNMP scenario was constructed, see appen-dix B.)
Some farms have excess manure (farm-level excessmanure), which they will need to export off the farmfor land application on surrounding properties or usein alternative ways. To meet CNMP application criteriaon farms with excess manure in both land applicationscenarios, more manure will be exported off the farmafter CNMPs are implemented, reducing the amountapplied on the farm. Other farms will have enoughland in the baseline scenario, but will have excess

35
Costs Associated with Development and Implementation of Comprehensive Nutrient Management Plans
Part I—Nutrient Management, Land Treatment, Manure and Wastewater Handling and Storage, and Recordkeeping
manure in the after-CNMP scenario. The number offarms with excess manure in the after-CNMP scenariois about 50 percent higher than in the baseline sce-nario, as shown below and in appendix B.
Baseline After-CNMPscenario scenario
Farms with excess manure 47,562 71,999
Farms without excess manure 207,508 183,071
All CNMP farms 255,070 255,070(excluding farms withspecialty livestock types)
The majority of CNMP farms (72 percent) had enoughacres to meet a phosphorus standard, and so it wasassumed they could meet CNMP criteria by applyingmanure at nitrogen standard rates (table 8). None ofthese 183,071 farms has excess manure, by definition.The remaining farms—71,999 farms—would need toapply manure at phosphorus-standard rates and willhave excess manure after CNMPs are implemented.About two-thirds of the farms with excess manureafter CNMPs are implemented (47,562 farms) also hadexcess manure in the baseline scenario, indicating thatthey were already exporting some or all of their ma-nure off the farm prior to CNMP implementation. The
remaining one-third (24,437 farms) had enough acresfor onfarm application at application rates simulatedin the baseline scenario, but did not have enough acresto meet CNMP application criteria, and so must exporta portion of their manure off the farm after CNMPs areimplemented.
Large farms (farms with more than 10 tons of manurephosphorus produced annually) are disproportionatelyrepresented in the set of farms with excess manure.About 79 percent of the 19,746 large farms had excessmanure after CNMPs were implemented (table 8).Thus, only 21 percent of large farms had enough acresto meet CNMP application criteria. About half of themedium-size farms also had excess manure afterCNMPs were implemented. Most of the small farmshad enough acres to meet CNMP application criteria(81 percent). Even so, about half of the farms withoutenough land were small farms.
This approach to simulating application rate criteriafor nutrient management plans somewhat understatesthe onfarm acres required by the 183,071 farms withenough acres to meet a phosphorus standard andsomewhat overstates the onfarm acres required by the71,999 farms without enough acres. Some of the farmswithout enough acres would be able to meet nutrient
Table 8 Number of CNMP farms in relation to application rate criteria*
Farm group All CNMP farms --Large farms-- Medium-size farms ---Small farms---# % # % # % # %
Farms with enough acres to meet CNMP 183,071 71.8 4,103 20.8 20,469 51.9 158,499 80.9nutrient management criteria (application atnitrogen-standard rates)
Farms without enough acres to meet CNMP 71,999 28.2 15,643 79.2 18,968 48.1 37,388 19.1nutrient management criteria (applicationat phosphorus-standard rates)**
Farms without excess manure in the 24,437 9.6 4,146 21.8 5,974 15.1 14,317 7.3baseline scenarioFarms with excess manure in the baseline 47,562 18.6 11,497 58.2 12,994 32.9 23,071 11.8scenario
Farms with no acres available for application 22,101 8.7 3,907 19.8 4,913 12.5 13,281 6.8Farms with acres available for application 25,461 9.9 7,590 38.4 8,081 20.5 9,790 5.0
* Excludes CNMP farms with specialty livestock types.** A small number of farms with nitrogen as the limiting nutrient applied manure at nitrogen-standard rates.

36
Costs Associated with Development and Implementation of Comprehensive Nutrient Management Plans
Part I—Nutrient Management, Land Treatment, Manure and Wastewater Handling and Storage, and Recordkeeping
management criteria using nitrogen-standard applica-tion rates rather than the phosphorus-standard appli-cation rates simulated in the model if a risk assess-ment tool indicates that the site has acceptable risk foroff-site transport of phosphorus. Other farms in thisgroup would be able to apply manure at nitrogen-standard rates for at least a few years until the soilphosphorus level approached the threshold. Con-versely, some farms with enough acres to meet aphosphorus standard may have a long history of ma-nure applications and if soil phosphorus tests indicatethat phosphorus-standard application rates are neededon most or all of the acres, they would not be able toapply manure at nitrogen-standard rates. In the overallcost assessment, the overestimate of acres requiredfor one group of farms is expected to offset the under-estimate of acres required for the other group offarms.
Additional acres required foronfarm land application
Land application costs associated with CNMP imple-mentation are based on the additional acres requiredfor onfarm land application. Acres required for landapplication were estimated for the baseline scenarioand for the after-CNMP scenario. As shown in table 9and in appendix B, an additional 7.6 million acres onCNMP farms will have manure applied after CNMPsare implemented, averaging about 30 acres per farm.Additional acres with manure applied averaged morethan 50 acres per farm for fattened cattle farms, swinefarms, turkey farms, and farms with confined heifersor veal (table 10). For the set of farms that needed toapply at phosphorus-standard rates and had acresavailable, the additional acres with manure appliedaveraged 156 acres per farm (table 9). Nearly all
Table 9 Summary of onfarm acres required to meet CNMP application criteria*
Farm group Number of Total acres Onfarm acres Onfarm acres Onfarm acres AdditionalCNMP farms on farm available for with manure with manure onfarm
manure applied, base- applied, acres withapplication line scenario after-CNMP manure
scenario applied
All CNMP farmsTotal 255,070 128,884,869 84,843,415 7,187,142 14,814,334 7,627,193Per-farm 505 333 28 58 30
Farms with enough acres to meetCNMP nutrient management criteria
Total 183,071 112,198,700 77,512,694 3,678,434 7,483,613 3,805,179Per-farm 613 423 20 41 21
Farms without enough acres to meetCNMP nutrient management criteria
Total 71,999 16,686,169 7,330,722 3,508,708 7,330,722 3,822,014Per-farm 232 102 49 102 53
Farms without excess in baseline scenarioTotal 24,437 9,296,904 5,850,450 2,028,436 5,850,450 3,822,014Per-farm 380 239 83 239 156
Farms with excess in baseline scenarioFarms with no acres available for 22,101 0 0 0 0 0applicationFarms with acres available for application
Total 25,461 7,389,265 1,480,272 1,480,272 1,480,272 0Per-farm 290 58 58 58 0
* Excludes CNMP farms with specialty livestock types.
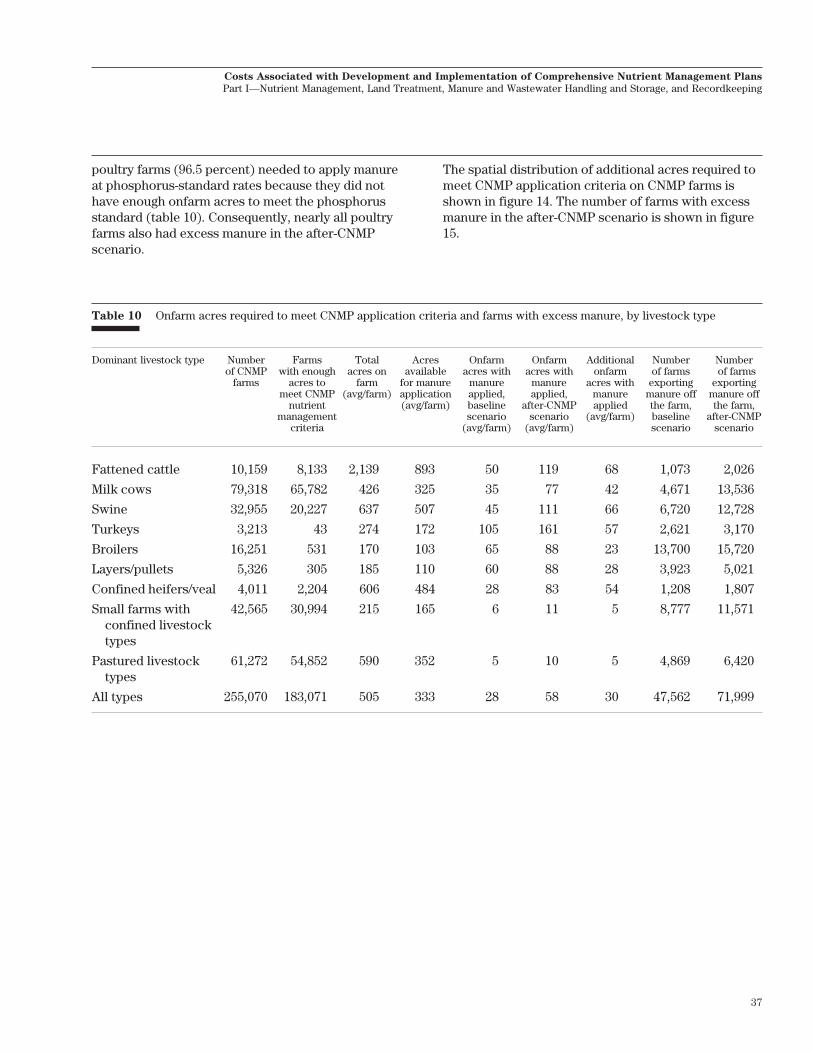
37
Costs Associated with Development and Implementation of Comprehensive Nutrient Management Plans
Part I—Nutrient Management, Land Treatment, Manure and Wastewater Handling and Storage, and Recordkeeping
poultry farms (96.5 percent) needed to apply manureat phosphorus-standard rates because they did nothave enough onfarm acres to meet the phosphorusstandard (table 10). Consequently, nearly all poultryfarms also had excess manure in the after-CNMPscenario.
The spatial distribution of additional acres required tomeet CNMP application criteria on CNMP farms isshown in figure 14. The number of farms with excessmanure in the after-CNMP scenario is shown in figure15.
Table 10 Onfarm acres required to meet CNMP application criteria and farms with excess manure, by livestock type
Dominant livestock type Number Farms Total Acres Onfarm Onfarm Additional Number Numberof CNMP with enough acres on available acres with acres with onfarm of farms of farms
farms acres to farm for manure manure manure acres with exporting exportingmeet CNMP (avg/farm) application applied, applied, manure manure off manure off
nutrient (avg/farm) baseline after-CNMP applied the farm, the farm,management scenario scenario (avg/farm) baseline after-CNMP
criteria (avg/farm) (avg/farm) scenario scenario
Fattened cattle 10,159 8,133 2,139 893 50 119 68 1,073 2,026
Milk cows 79,318 65,782 426 325 35 77 42 4,671 13,536
Swine 32,955 20,227 637 507 45 111 66 6,720 12,728
Turkeys 3,213 43 274 172 105 161 57 2,621 3,170
Broilers 16,251 531 170 103 65 88 23 13,700 15,720
Layers/pullets 5,326 305 185 110 60 88 28 3,923 5,021
Confined heifers/veal 4,011 2,204 606 484 28 83 54 1,208 1,807
Small farms with 42,565 30,994 215 165 6 11 5 8,777 11,571confined livestocktypes
Pastured livestock 61,272 54,852 590 352 5 10 5 4,869 6,420types
All types 255,070 183,071 505 333 28 58 30 47,562 71,999

38
Costs Associated with Development and Implementation of Comprehensive Nutrient Management Plans
Part I—Nutrient Management, Land Treatment, Manure and Wastewater Handling and Storage, and Recordkeeping
Figure 14 Additional onfarm acres required to meet CNMP application criteria on CNMP farms (7.6 million acres)
Hawaii
AlaskaMap ID: 7056
Each dot represents 1,000 acres
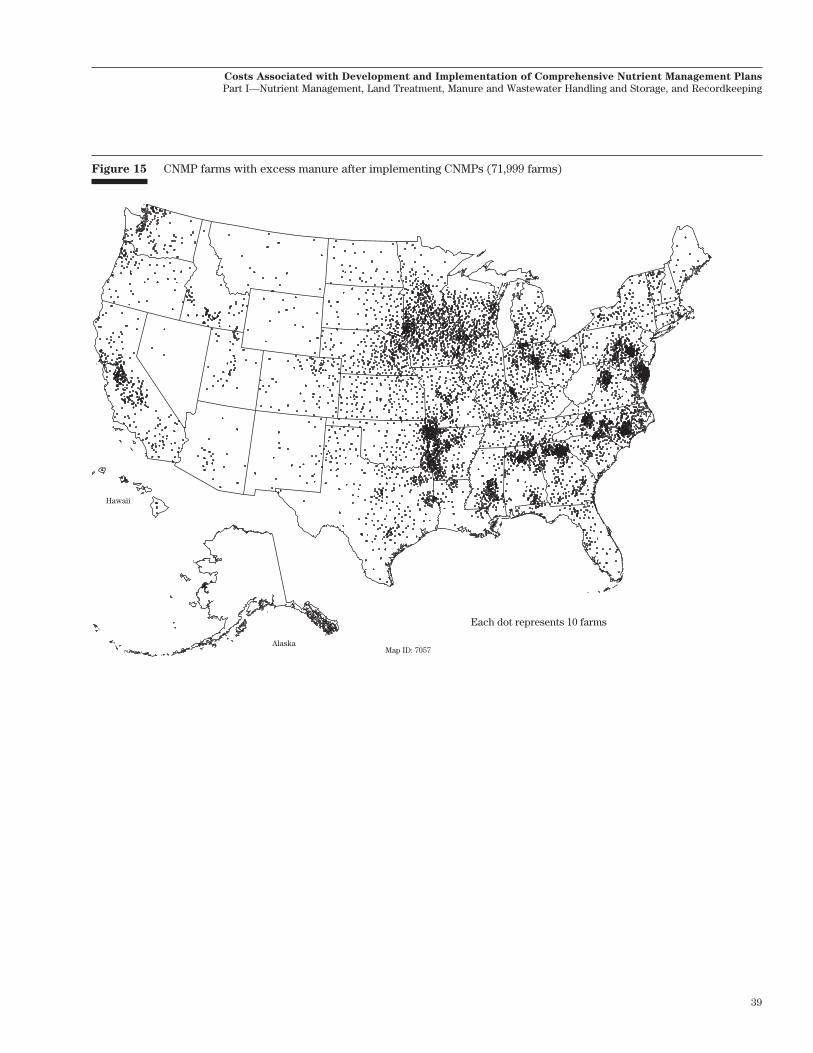
39
Costs Associated with Development and Implementation of Comprehensive Nutrient Management Plans
Part I—Nutrient Management, Land Treatment, Manure and Wastewater Handling and Storage, and Recordkeeping
Figure 15 CNMP farms with excess manure after implementing CNMPs (71,999 farms)
Hawaii
AlaskaMap ID: 7057
Each dot represents 10 farms

40
Costs Associated with Development and Implementation of Comprehensive Nutrient Management Plans
Part I—Nutrient Management, Land Treatment, Manure and Wastewater Handling and Storage, and Recordkeeping
Onfarm transport distance
Onfarm transport costs are determined in part by thedistance manure is transported. For each CNMP farm,the average onfarm transport distance was estimatedfor both the baseline scenario and the after-CNMPscenario.
The average onfarm transport distance was calculatedfor each farm using an approach published by Fleming,Babcock, and Wang (1998). The average transportdistance is derived from an estimate of the "searchablearea," which is based on the proportion of land on afarm that is available for manure application. Fleminget al. defined the searchable area as a square, contigu-ous block. Assuming the block was x miles on eachside, the searchable area would be x2. Within thisblock are the fields on which manure would be ap-plied. These fields are assumed to be randomly distrib-uted and of equal size, thus forming a grid of cells. Onecould calculate the distance from any cell to any othercell, sum up the distances, and divide by the number ofcells in the grid to get an average distance. The short-est distance would be zero, and the longest possibledistance would be 2x. Fleming et al. argues that as theblock is divided into smaller and smaller fields, thedistribution of possible distances approaches a normaldistribution, and thus a median distance could be usedto approximate the mean distance. The median dis-tance is the shortest distance plus the longest distancedivided by 2, which is equal to x. Thus, the averagedistance is simply the square root of the searchablearea.
Fleming et al. defined the searchable area in squaremiles as:
Searchable area = ×× × × ×
NMQ
NC640 α β γ
Where:Q = manure volumeNM = manure nutrient concentrationNC = crop nutrient uptake, or application rate crite-
ria in quantity of nutrient per acreα = proportion of cropland and pasturelandβ = proportion of cropland and pastureland suit-
able for manure applicationγ = proportion of acres where manure is accepted
The term (NM × Q)/NC is the number of acres requiredfor manure application to meet whatever land applica-tion criteria are used. The term 1/640 converts acres tosquare miles. The term 1/(α × β × γ) adjusts the search-able area upward to account for the diversity of landuse on the farm and the willingness of the farmer toaccept manure. For CNMP farms, the willingness toaccept manure was set equal to one, so this termreduces to 1/(α × β). If all of the land on the farm waseither cropland or pastureland that was available forland application of manure, then α × β would be 1 andthe searchable area would simply be the acres re-quired for manure application, and the average trans-port distance would be the square root of that area. Inthe case of a similar farm that also had a wooded area,α would be less than one and the searchable areawould be larger than the area of land required formanure application; thus the average transport dis-tance would be longer. Similarly, the average transportdistance would be longer if some of the cropland andpastureland were not suitable for land application ofmanure (such as vegetable crops or fruit orchards)because β would be less than one. Thus, the morediverse the land use on a farm, the longer the onfarmtransport distance.
This is not an ideal estimate of transport distancebecause the underlying assumptions would not holdfor most livestock operations. Most operations wouldapply manure to fields that were closest to the con-finement facility, rather than randomly throughout thefarm. Moreover, estimating the average distance as thesquare root of the searchable area is strictly appropri-ate only when the number of fields is large. Since thefunction implicitly assumes that the size of a fieldcannot be smaller than the area where manure isapplied on each trip, the number of fields will not belarge for all farms. For these reasons, this functionoverstates the onfarm transport distance for farmsthat are largely contiguous and square. For farms thatare not contiguous, or that are more rectangular, thefunction may understate the transport distance. Never-theless, the function is readily solved with data fromthe Census of Agriculture and provides a consistentbasis for estimating average transport distance foreach farm.
For the baseline scenario, the term (NM × Q)/NC wasreplaced by the acres on which manure was appliedon each farm. For the after-CNMP scenario, the term(NM × Q)/NC was replaced by the acres required to
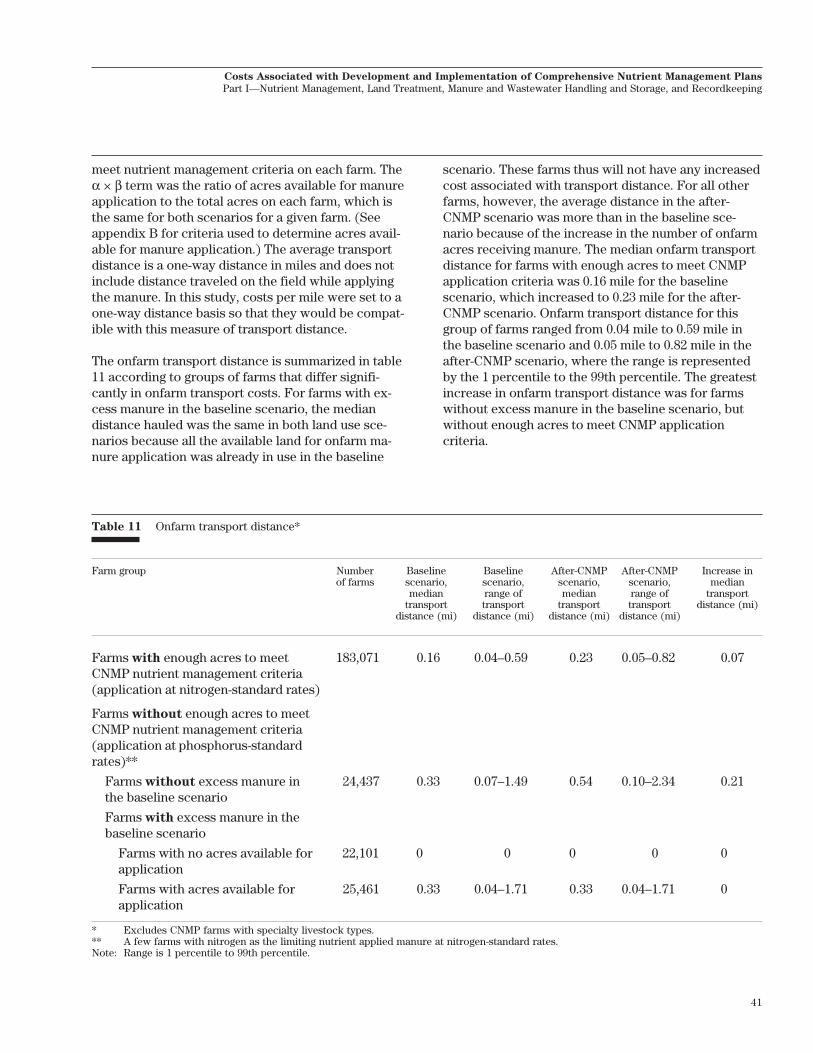
41
Costs Associated with Development and Implementation of Comprehensive Nutrient Management Plans
Part I—Nutrient Management, Land Treatment, Manure and Wastewater Handling and Storage, and Recordkeeping
meet nutrient management criteria on each farm. Theα × β term was the ratio of acres available for manureapplication to the total acres on each farm, which isthe same for both scenarios for a given farm. (Seeappendix B for criteria used to determine acres avail-able for manure application.) The average transportdistance is a one-way distance in miles and does notinclude distance traveled on the field while applyingthe manure. In this study, costs per mile were set to aone-way distance basis so that they would be compat-ible with this measure of transport distance.
The onfarm transport distance is summarized in table11 according to groups of farms that differ signifi-cantly in onfarm transport costs. For farms with ex-cess manure in the baseline scenario, the mediandistance hauled was the same in both land use sce-narios because all the available land for onfarm ma-nure application was already in use in the baseline
scenario. These farms thus will not have any increasedcost associated with transport distance. For all otherfarms, however, the average distance in the after-CNMP scenario was more than in the baseline sce-nario because of the increase in the number of onfarmacres receiving manure. The median onfarm transportdistance for farms with enough acres to meet CNMPapplication criteria was 0.16 mile for the baselinescenario, which increased to 0.23 mile for the after-CNMP scenario. Onfarm transport distance for thisgroup of farms ranged from 0.04 mile to 0.59 mile inthe baseline scenario and 0.05 mile to 0.82 mile in theafter-CNMP scenario, where the range is representedby the 1 percentile to the 99th percentile. The greatestincrease in onfarm transport distance was for farmswithout excess manure in the baseline scenario, butwithout enough acres to meet CNMP applicationcriteria.
Table 11 Onfarm transport distance*
Farm group Number Baseline Baseline After-CNMP After-CNMP Increase inof farms scenario, scenario, scenario, scenario, median
median range of median range of transporttransport transport transport transport distance (mi)
distance (mi) distance (mi) distance (mi) distance (mi)
Farms with enough acres to meet 183,071 0.16 0.04–0.59 0.23 0.05–0.82 0.07CNMP nutrient management criteria(application at nitrogen-standard rates)
Farms without enough acres to meetCNMP nutrient management criteria(application at phosphorus-standardrates)**
Farms without excess manure in 24,437 0.33 0.07–1.49 0.54 0.10–2.34 0.21the baseline scenario
Farms with excess manure in thebaseline scenario
Farms with no acres available for 22,101 0 0 0 0 0application
Farms with acres available for 25,461 0.33 0.04–1.71 0.33 0.04–1.71 0application
* Excludes CNMP farms with specialty livestock types.** A few farms with nitrogen as the limiting nutrient applied manure at nitrogen-standard rates.Note: Range is 1 percentile to 99th percentile.

42
Costs Associated with Development and Implementation of Comprehensive Nutrient Management Plans
Part I—Nutrient Management, Land Treatment, Manure and Wastewater Handling and Storage, and Recordkeeping
Amount of manure to be trans-ported on the farm
In addition to the transport distance, onfarm transportcosts are also determined by the amount of manuretransported for onfarm application. Separate estimateswere made for solids and for manure handled as aliquid or slurry. Estimates were made by convertingtons of recoverable manure to tons at hauling weightfor solids and to tons of manure and wastewater forfarms with liquid or slurry systems. The amount ofwastewater collected in runoff storage ponds was alsoestimated, allowing for regional differences in precipi-tation. The hauling weight for solids includes theweight of bedding. The methods used to make theseestimates are presented in appendix B.
For farms without enough acres available to apply allof the manure produced, only a portion of the recover-able manure was transported on the farm. The remain-ing manure and wastewater were transported off thefarm. (Costs associated with off-farm transport areaddressed in the next section.) The quantity of manureto be applied on each farm was determined based onthe percentage of manure nutrients that was appliedon the farm to meet the criteria established for each ofthe two land application scenarios.
The amount of manure for onfarm transport andapplication is shown in table 12. For farms that did nothave enough acres to meet application criteria in theafter-CNMP scenario, the amount of manure trans-ported on farm was less in the after-CNMP scenariothan in the baseline scenario. To meet nutrient man-agement criteria, these farms were applying manure atlower rates in the after-CNMP scenario than in thebaseline scenario, and since onfarm acres were lim-ited, had to export more of their manure off the farm.(A decrease in the amount of solids for onfarm trans-port and application also occurred because of achange in the consistency of manure for some dairiesas a result of CNMP implementation. See the sectionManure and Wastewater Handling and Storage andappendix B for details about the calculation of recov-erable manure for model farms.)
Manure testing costs
Land application of manure should be based on ma-nure testing to make sure the appropriate amount ofnutrients are applied and the need for supplementalcommercial fertilizer applications is identified. Testingprovides a nutrient analysis of the manure, thus allow-ing producers to make the best use of onfarm acreagefor land application and minimize off-farm export. Ifmanure is exported to manure receiving farms, therecipients will most likely require a nutrient analysis.Producers employing feed management practices toreduce manure nutrients also would benefit frommanure testing. Calculations of manure nutrients usingstandard conversion factors or table values are suit-able for design and planning, but manure testing isexpected to be a component of most CNMPs. The needfor accurate information for farms with small amountsof manure, however, is not critical, and use of tablevalues generally would be acceptable. Thus, it wasassumed that all farms with more than 35 animal unitswould conduct manure testing. Smaller farms woulduse table values, and thus would have no manuretesting costs.
The need for manure testing is determined by thetiming of manure application to the land, which is inturn influenced by manure storage capacity. Thefrequency of manure sampling varies according to thetype of manure handling system on the farm. Poultryfarms that handle manure as a solid would generallyhave a 365-day storage capacity under CNMP guide-lines, and thus would be expected to land apply ma-nure only once a year. Thus, manure testing for nutri-ent content would be done only once per year forthese farms. For most other farms that primarilyhandle manure as a solid, manure application is as-sumed to occur twice per year (180 days of storage),and thus manure testing would be done twice per year.Because of the potential for year-round cropping in theSoutheast, minimum storage capacity needs wereassumed to be 90 days, and manure testing would beexpected four times a year. For liquid systems andoperations with runoff collection ponds, minimumstorage capacity was assumed to be 180 days, andmanure sampling would coincide with the land appli-cation of the collected wastewater twice per year.Slurry systems were generally defined as having stor-age equivalent to 120 days, resulting in manure sam-pling three times per year.
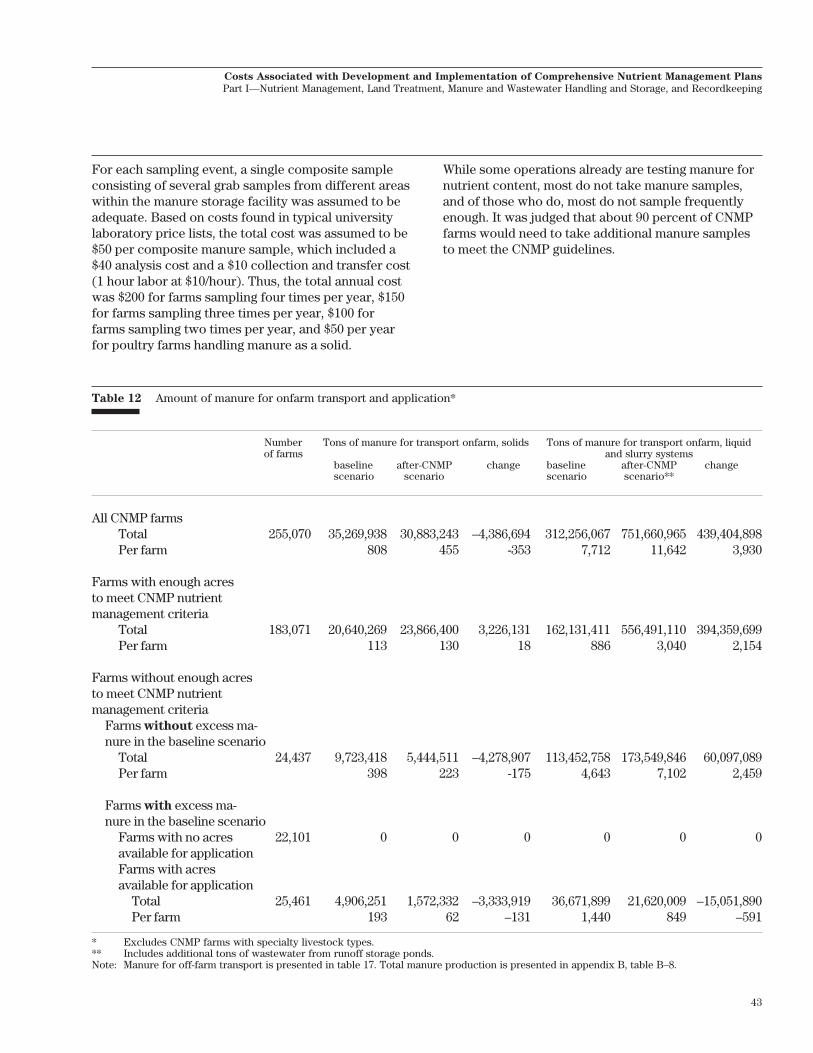
43
Costs Associated with Development and Implementation of Comprehensive Nutrient Management Plans
Part I—Nutrient Management, Land Treatment, Manure and Wastewater Handling and Storage, and Recordkeeping
For each sampling event, a single composite sampleconsisting of several grab samples from different areaswithin the manure storage facility was assumed to beadequate. Based on costs found in typical universitylaboratory price lists, the total cost was assumed to be$50 per composite manure sample, which included a$40 analysis cost and a $10 collection and transfer cost(1 hour labor at $10/hour). Thus, the total annual costwas $200 for farms sampling four times per year, $150for farms sampling three times per year, $100 forfarms sampling two times per year, and $50 per yearfor poultry farms handling manure as a solid.
While some operations already are testing manure fornutrient content, most do not take manure samples,and of those who do, most do not sample frequentlyenough. It was judged that about 90 percent of CNMPfarms would need to take additional manure samplesto meet the CNMP guidelines.
Table 12 Amount of manure for onfarm transport and application*
Number Tons of manure for transport onfarm, solids Tons of manure for transport onfarm, liquidof farms and slurry systems
baseline after-CNMP change baseline after-CNMP changescenario scenario scenario scenario**
All CNMP farmsTotal 255,070 35,269,938 30,883,243 –4,386,694 312,256,067 751,660,965 439,404,898Per farm 808 455 -353 7,712 11,642 3,930
Farms with enough acresto meet CNMP nutrientmanagement criteria
Total 183,071 20,640,269 23,866,400 3,226,131 162,131,411 556,491,110 394,359,699Per farm 113 130 18 886 3,040 2,154
Farms without enough acresto meet CNMP nutrientmanagement criteria
Farms without excess ma-nure in the baseline scenario
Total 24,437 9,723,418 5,444,511 –4,278,907 113,452,758 173,549,846 60,097,089Per farm 398 223 -175 4,643 7,102 2,459
Farms with excess ma-nure in the baseline scenario
Farms with no acres 22,101 0 0 0 0 0 0available for applicationFarms with acresavailable for application
Total 25,461 4,906,251 1,572,332 –3,333,919 36,671,899 21,620,009 –15,051,890Per farm 193 62 –131 1,440 849 –591
* Excludes CNMP farms with specialty livestock types.** Includes additional tons of wastewater from runoff storage ponds.Note: Manure for off-farm transport is presented in table 17. Total manure production is presented in appendix B, table B–8.
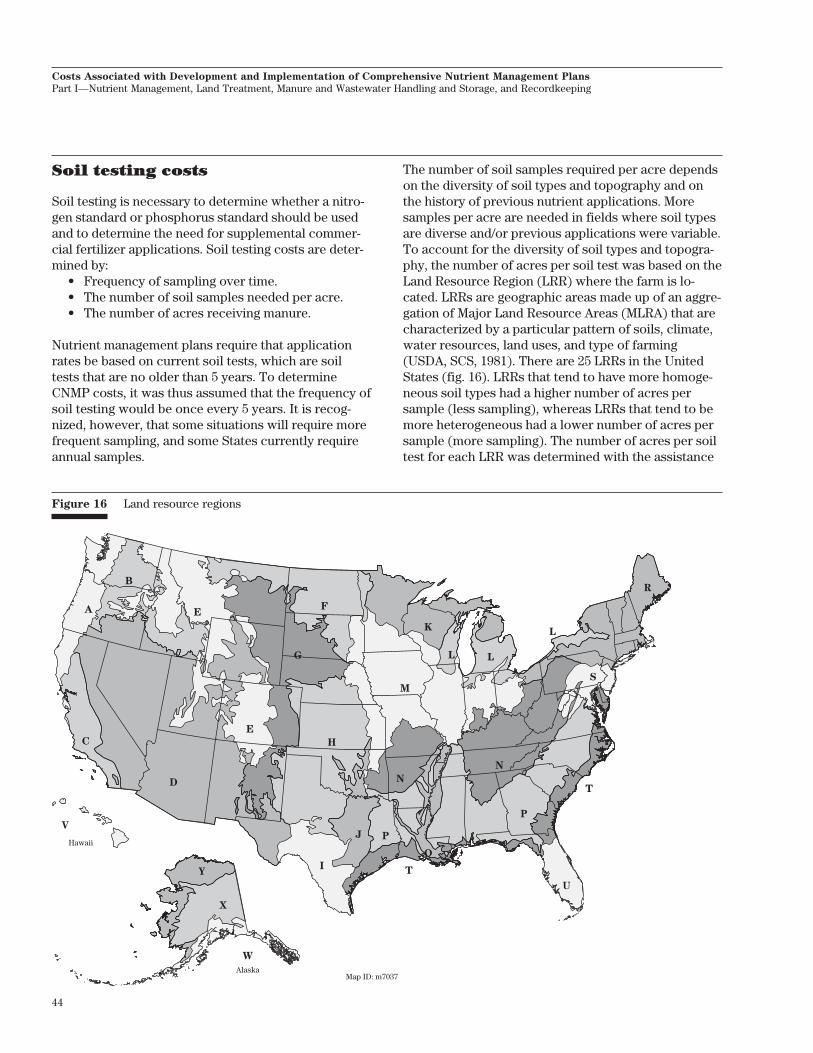
44
Costs Associated with Development and Implementation of Comprehensive Nutrient Management Plans
Part I—Nutrient Management, Land Treatment, Manure and Wastewater Handling and Storage, and Recordkeeping
Soil testing costs
Soil testing is necessary to determine whether a nitro-gen standard or phosphorus standard should be usedand to determine the need for supplemental commer-cial fertilizer applications. Soil testing costs are deter-mined by:
• Frequency of sampling over time.• The number of soil samples needed per acre.• The number of acres receiving manure.
Nutrient management plans require that applicationrates be based on current soil tests, which are soiltests that are no older than 5 years. To determineCNMP costs, it was thus assumed that the frequency ofsoil testing would be once every 5 years. It is recog-nized, however, that some situations will require morefrequent sampling, and some States currently requireannual samples.
The number of soil samples required per acre dependson the diversity of soil types and topography and onthe history of previous nutrient applications. Moresamples per acre are needed in fields where soil typesare diverse and/or previous applications were variable.To account for the diversity of soil types and topogra-phy, the number of acres per soil test was based on theLand Resource Region (LRR) where the farm is lo-cated. LRRs are geographic areas made up of an aggre-gation of Major Land Resource Areas (MLRA) that arecharacterized by a particular pattern of soils, climate,water resources, land uses, and type of farming(USDA, SCS, 1981). There are 25 LRRs in the UnitedStates (fig. 16). LRRs that tend to have more homoge-neous soil types had a higher number of acres persample (less sampling), whereas LRRs that tend to bemore heterogeneous had a lower number of acres persample (more sampling). The number of acres per soiltest for each LRR was determined with the assistance
Figure 16 Land resource regions
Hawaii
AlaskaMap ID: m7037
W
V
X
YI
J P
P
U
T
T
S
R
O
N
N
M
K
L L
L
C
D
E
G
F
H
EA
B
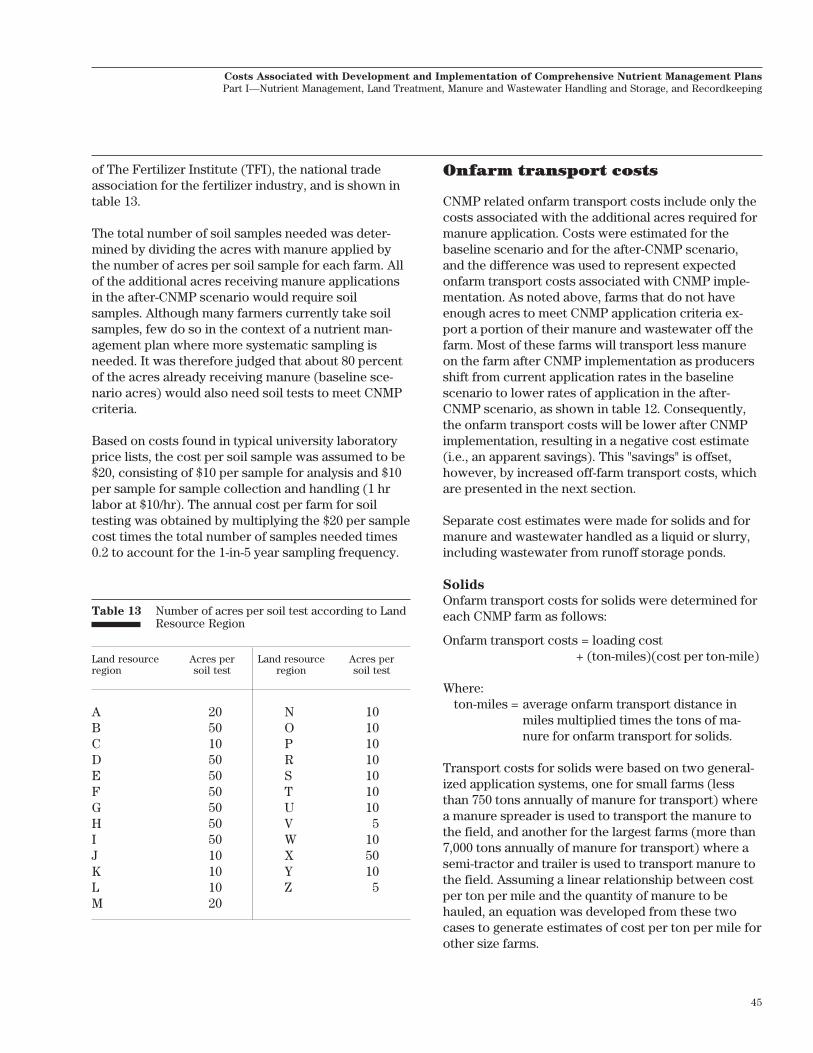
45
Costs Associated with Development and Implementation of Comprehensive Nutrient Management Plans
Part I—Nutrient Management, Land Treatment, Manure and Wastewater Handling and Storage, and Recordkeeping
of The Fertilizer Institute (TFI), the national tradeassociation for the fertilizer industry, and is shown intable 13.
The total number of soil samples needed was deter-mined by dividing the acres with manure applied bythe number of acres per soil sample for each farm. Allof the additional acres receiving manure applicationsin the after-CNMP scenario would require soilsamples. Although many farmers currently take soilsamples, few do so in the context of a nutrient man-agement plan where more systematic sampling isneeded. It was therefore judged that about 80 percentof the acres already receiving manure (baseline sce-nario acres) would also need soil tests to meet CNMPcriteria.
Based on costs found in typical university laboratoryprice lists, the cost per soil sample was assumed to be$20, consisting of $10 per sample for analysis and $10per sample for sample collection and handling (1 hrlabor at $10/hr). The annual cost per farm for soiltesting was obtained by multiplying the $20 per samplecost times the total number of samples needed times0.2 to account for the 1-in-5 year sampling frequency.
Onfarm transport costs
CNMP related onfarm transport costs include only thecosts associated with the additional acres required formanure application. Costs were estimated for thebaseline scenario and for the after-CNMP scenario,and the difference was used to represent expectedonfarm transport costs associated with CNMP imple-mentation. As noted above, farms that do not haveenough acres to meet CNMP application criteria ex-port a portion of their manure and wastewater off thefarm. Most of these farms will transport less manureon the farm after CNMP implementation as producersshift from current application rates in the baselinescenario to lower rates of application in the after-CNMP scenario, as shown in table 12. Consequently,the onfarm transport costs will be lower after CNMPimplementation, resulting in a negative cost estimate(i.e., an apparent savings). This "savings" is offset,however, by increased off-farm transport costs, whichare presented in the next section.
Separate cost estimates were made for solids and formanure and wastewater handled as a liquid or slurry,including wastewater from runoff storage ponds.
Solids
Onfarm transport costs for solids were determined foreach CNMP farm as follows:
Onfarm transport costs = loading cost+ (ton-miles)(cost per ton-mile)
Where: ton-miles = average onfarm transport distance in
miles multiplied times the tons of ma-nure for onfarm transport for solids.
Transport costs for solids were based on two general-ized application systems, one for small farms (lessthan 750 tons annually of manure for transport) wherea manure spreader is used to transport the manure tothe field, and another for the largest farms (more than7,000 tons annually of manure for transport) where asemi-tractor and trailer is used to transport manure tothe field. Assuming a linear relationship between costper ton per mile and the quantity of manure to behauled, an equation was developed from these twocases to generate estimates of cost per ton per mile forother size farms.
Table 13 Number of acres per soil test according to LandResource Region
Land resource Acres per Land resource Acres perregion soil test region soil test
A 20 N 10B 50 O 10C 10 P 10D 50 R 10E 50 S 10F 50 T 10G 50 U 10H 50 V 5I 50 W 10J 10 X 50K 10 Y 10L 10 Z 5M 20
46
Costs Associated with Development and Implementation of Comprehensive Nutrient Management Plans
Part I—Nutrient Management, Land Treatment, Manure and Wastewater Handling and Storage, and Recordkeeping
Capital costs for the small farm system were based ona 138-bushel (4.1 ton) manure spreader with an annualcost of $2,344 and a 105-horsepower (hp) tractor used10 percent of the time for manure transport with anannual cost of $655, amortizing the total cost over 10years with an 8 percent interest rate. The total annualcapital cost is thus $2,999 per year. Operating costswere based on a study by Oregon State UniversityExtension Service (1982), which reported annualoperating costs of $2,277 for this kind of system,including 123 hours of operator time per year to trans-fer the manure from the farm to the field. Operatingcosts reported in that study were converted to 2000costs using a suitable price index. The total annualcapital and operating cost converts to $42.89 per hour.Assuming a typical travel speed for onfarm hauling of10 miles per hour, the cost is $1.03 per ton per mile.
Capital and operating costs for the large farm systemwere based on contract transport using a large semi-truck. The contract cost for this system was reportedby Wimberly and Goodwin (2000) to be $0.24 per tonper mile.
The following function was used to estimate the costper ton per mile for solids transport as a function ofthe amount of solids to be hauled on the farm.
x = tons of solids hauled on farma = $ per ton per mile
If x < 750, then a = $1.03If x > 7,000, then a = $0.24If 750 < x < 7,000, then
a=1.03-x-750
7,000-7501.03-0.24
( )( ) × ( )
In addition to the cost per ton per mile, solids systemsalso have a cost associated with loading, which is afunction of the tons hauled. The loading cost used forall sizes of operations was $1.00 per ton, which wasalso taken from Wimberley and Goodwin (2000).
Manure and wastewater handled as a liquid or
slurry
Cost estimates for the transport of manure and waste-water as a liquid or slurry (including wastewater fromrunoff storage ponds) were based on two generalizedapplication systems: for farms with less than 1,000tons of liquid or slurry manure to be transported
annually, and for farms with more than 1,000 tons. Thesmall farm system is based on using a tank wagon totransport the manure and wastewater, which was alsoused for land application. The system for larger farmsassumes the wastewater would be pumped throughpipes to the application site and applied using anirrigation system.
Onfarm transport costs for the small farms weredetermined for each CNMP farm as follows:
Onfarm transport costs = ton-miles × cost per ton-mile
where ton-miles is the average onfarm transport dis-tance in miles multiplied times the tons of wastewaterfor onfarm transport in a tank wagon.
For the larger farms where pumping is used to trans-port liquids, onfarm transport costs are estimated asthe cost per mile of pipe multiplied by the maximumdistance that the wastewater is transported on thefarm.
A pump is needed to transfer the wastewater from thestorage pond to the tank wagon for the smaller farms,and to transport the wastewater to the field applica-tion site for the larger farms. The cost of the pump isincluded in the transfer component of the manure andwastewater handling and storage element, and so isnot included here.
Capital costs for the small farm system (<1,000 tons)were based on a 3,200-gallon (12 ton) tank wagon withan annual cost of $2,780 and a 105-hp tractor used 20percent of the time for manure transport with anannual cost of $1,309, amortizing the total cost over 10years with an 8 percent interest rate. Total annualcapital cost is thus $4,089. Operating costs were basedon the study by Oregon State University ExtensionService (1982), which reported annual operating costsof $5,344 for this kind of system (after converting to2000 costs). Based on the 314 hours of operation peryear reported in the study, total capital and operatingcosts convert to $30.03 per hour. Assuming a typicaltravel speed for onfarm hauling of 10 miles per hour,the cost is $0.23 per ton per mile.
For the larger farms, transport cost was based on thelength of installed pipe needed to transport wastes tothe furthest point of application. The distance to thefurthest point of application on each farm, followingfrom the modeling assumptions used to estimate the

47
Costs Associated with Development and Implementation of Comprehensive Nutrient Management Plans
Part I—Nutrient Management, Land Treatment, Manure and Wastewater Handling and Storage, and Recordkeeping
average transport distance, is two times the averagetransport distance. (The maximum possible distance,assuming the farm is square-shaped with a distance ofx on each side, would be 2x, where x is estimated asthe square root of the searchable area.)
Pipe and installation costs were taken from the NRCSField Office Technical Guide, average cost lists. Thepipe was assumed to be polyvinyl chloride (PVC) pipe6 inches in diameter, which costs about $1.50 per foot.The installation cost (including trenching, bedding,fitting, backfilling, and concrete thrust blocks) wasestimated to be $2.34 per foot. A contingency factor of20 percent was applied to account for variations inpipe size, added costs for road crossings, and moredifficult installation sites. (Most NRCS planning engi-neering cost estimates of this nature include a 20percent contingency factor to cover unforeseen itemsnot identified in the preliminary investigations.) Thus,the average cost per foot is expected to be about$4.61. One mile of installed pipe (5,280 feet) thus costs$24,340. The annual cost (amortized over 10 years at 8percent interest) is $3,626 per mile.
Land application costs
Land application costs associated with CNMP imple-mentation are determined by:
• Acres required for land application• Cost per acre for land application• Loading costs for application of solids on large
farms• Calibration costs for land application equipment
Costs were estimated for the baseline scenario and forthe after-CNMP scenario, and the difference was usedto represent expected onfarm land application costsrelated to CNMP implementation. Separate cost esti-mates were made for solids and for manure and waste-water handled as a liquid or slurry, including wastewa-ter from runoff storage ponds.
Solids
The cost per acre for land application of solids wasbased on two generalized application systems: forsmall farms (less than 750 tons annually of manure fortransport) where a small manure spreader is used (thesame system used for onfarm transport costs), and forthe larger farms with more than 7,000 tons annually ofmanure for transport where a large manure spreader is
used. Assuming a linear relationship between cost peracre and the volume of manure to be applied, anequation was developed from these two cases togenerate estimates of cost per acre for other sizefarms.
Capital and operating costs for the small farm system(<750 tons) are the same as those reported above forthe small farm system used to estimate transport costs(138 bushel manure spreader), which were $42.89 perhour. Assuming a travel speed for application of 4miles per hour and a 15-foot spread width provides acost estimate of $5.90 per acre.
Capital costs for the large farm system (>7,000 tons)were based on a 510-bushel (15.3 ton) manurespreader with an annual cost of $3,708 and a 105-hptractor used 10 percent of the time for transport ofmanure with an annual cost of $655, amortizing thetotal cost over 10 years with an 8 percent interest rate.The total annual capital cost is thus $4,363. Operatingcosts were based on the study by Oregon State Univer-sity Extension Service (1982), which reported annualoperating costs of $4,720 for this kind of system afterconverting to 2000 costs. Operating costs included 255operating hours per year, as well as fuel, oil, and othercosts. Based on 255 hours of operation per year, totalcapital and operating costs are $35.62 per hour. As-suming a travel speed for application of 4 miles perhour and a 20-foot spread width provides a cost esti-mate of $3.67 per acre.
The following function was used to estimate the costper acre for solids according to the amount of solids tobe applied on the farm:
x=tons of solids applied on the farma= $ per acre
If x < 750, then a= $5.90If x > 7,000, then a=$3.67If 750 < x < 7,000, then
a= 5.90 -x-750
7,000-7505.90-3.67( )
×( )
In addition to the costs per acre, solids systems alsohave a cost associated with calibration of the manurespreader. Sometimes these services can be obtainedfree from local extension services or other programs.It was therefore assumed that 10 percent of the farms
48
Costs Associated with Development and Implementation of Comprehensive Nutrient Management Plans
Part I—Nutrient Management, Land Treatment, Manure and Wastewater Handling and Storage, and Recordkeeping
either were obtaining this service free or had alreadyincorporated the practice into their routine. For theremaining 90 percent of the farms, an annual cost of$190 per farm was assigned to cover manure calibra-tion. This cost assumes the purchase of two wheelscales for $1,000, which converts to $150 annualcapital cost, and two calibration events per year eachrequiring 2 hours at $10 per hour, which results in $40annual operating cost.
For farms with less than 7,000 tons of solids to be landapplied annually, it was assumed that the manurespreader would be used to transport the manure fromthe farm to the field, requiring no additional handling.For farms with more than 7,000 tons of solids, how-ever, it was assumed that a large semi-truck would beused to transport the manure (see previous section ononfarm transport costs) because of the greater capac-ity of the semi-truck and thus the lower transport cost.In this case the manure would be off-loaded at theedge of the field and then re-loaded into a manurespreader for application. Thus, for farms with morethan 7,000 tons of solids, an additional re-loading costof $1.00 per ton would be incurred.
Manure and wastewater handled as a liquid or
slurry
Cost estimates for land application of manure andwastewater as a liquid or slurry (including wastewaterform runoff storage ponds) were based on the sametwo generalized application systems used to estimateonfarm transport costs—one for farms with less than1,000 tons of liquid or slurry manure to be transportedannually and one for farms with more than 1,000 tons.The small farm system is based on using a tank wagonto transport and apply the manure and wastewater.The system for larger farms assumes the wastewaterwould be pumped through pipes to the application siteand applied using an irrigation system.
Capital and operating costs for the small farm system(<1,000 tons) are the same as those reported above forthe small farm system used to estimate transport costs(3,200 gallon tank wagon), which were $30.03 perhour. Assuming a travel speed for application of 4miles per hour and a 10-foot spread width provides acost of $6.19 per acre.
In addition to the costs per acre, small liquid systemsalso have a cost associated with calibration of theliquid manure spreader. It is assumed calibration takes
1 hour per calibration and two calibration events peryear. At an operator cost of $10 per hour, the calibra-tion cost is $20 per farm.
The cost estimate for larger farms (>1,000 tons) wasbased on a study by Bennett, Osburn, Fulhage, andPfost (1994) on waste handling and application costsfor pumped irrigation systems. Costs reported in thatstudy were converted to 2000 costs using a suitableprice index. The cost of the pump is included in thetransfer component of the manure and wastewaterhandling and storage element, and so is not includedhere. Capital costs were based on the costs of a travel-ing fixed spray gun with 500 gallon per minute capac-ity. The annual cost for this spray gun is $2,969 afteramortizing the total cost over 10 years with an 8 per-cent interest rate. To convert this cost to a cost peracre basis, the capacity of the system was assumed tobe 2,000 acres per year (assuming the application rateof the traveling gun was 500 gallons per minute andthe gun could be used 180 days per year at 16 hoursper day). The capital costs were thus $1.48 per acre.
Operating costs were computed based on informationreported in table 17 by Bennett, Osburn, Fulhage, andPfost for a 100-cow herd. The following table valueswere used: 57 acre-inches pumped per year, 22 acresused for land application, and 16 hours annually for setup times. These values were used to calculate a settime of 0.73 hour per acre. Pipe laying and check timewere 25 percent and 12.5 percent, respectively, of theset-up time. Total labor time was thus 22 hours, or 1hour per acre. Using a labor rate of $10 per hour, thetotal operating cost for a 100-cow herd was $10 peracre.
Bennett, Osburn, Fulhage, and Pfost also reportedsignificant per unit operating cost reductions as thescale of the operation increased. The relationship theyfound between farm size and total operating costs ofthe irrigation system is shown below.
Cows per Acres Total Operating Sizefarm w/manure operating cost per adjustment
applied cost head factorper farm
100 22 1,098 10.98 1.000200 33 1,683 8.42 0.766300 41 2,156 7.19 0.655500 61 3,213 6.43 0.585750 80 4,316 5.75 0.5241,000 100 5,515 5.52 0.502
49
Costs Associated with Development and Implementation of Comprehensive Nutrient Management Plans
Part I—Nutrient Management, Land Treatment, Manure and Wastewater Handling and Storage, and Recordkeeping
(This information includes some operating costs weincluded in transport costs and in the manure andwastewater handling and storage element.)
This relationship was used to adjust the $10 per acrecost estimate for a small farm applying wastewater on22 acres (100-cow herd) to a medium-size farm apply-ing wastewater on 41 acres (300-cow herd) and alarger farm applying wastewater on 100 acres (1,000-cow herd). The per-acre estimate for the medium sizefarm is $6.55, and the per-acre estimate for the largerfarm is $5.02. Using these three estimates of per-acrecosts, the following function was derived for use inestimating the operating cost per acre according to thenumber of acres with manure applied on the farm:
x = acres with manure applied on the farm
a = operating cost per acre
If x < 22, then a= $10
If 22< x <41, then a=10-x-22
41-2210-6.55
( )( ) × ( )
If 41< x< 100, then a=6.55-x-41
100-416.55-5.02
( )( ) × ( )
If x > 100, then a=$5.02
Calibration costs for the larger farms that use a biggun application method were assumed incidental tothe cost of the big gun. It was assumed that a flowmeter on the gun or pump would be used to determinethe amount of application. Calculating wastewaterapplied over a measured area is a simple calibration.No calibration costs were assigned to the larger farmsthat apply their liquid using a big gun.
Summary of CNMP costs fornutrient management
The annual average cost for the nutrient managementelement of a CNMP was estimated to be $1,043 perfarm (table 14). This breaks down into an average of$15 per farm for soil testing costs, $54 per farm formanure testing costs, $636 per farm for onfarm trans-port costs, and $338 per farm for land applicationcosts on additional onfarm acres needed to meetCNMP criteria. The highest per-farm cost was fordairies, which averaged $2,101 per farm per year.
Fattened cattle farms and swine farms were also high,averaging $1,655 and $1,601 per farm respectively.Confined heifer farms and veal farms were the nexthighest, averaging $1,153 per farm. The relatively highnutrient management cost for confined heifers andveal is not unexpected because one of the criteria usedto identify a confined heifer or veal farm in the censuswas few pastureland or rangeland acres (see appendixA.) The remaining farms had low nutrient managementcosts ranging from $180 to $248 per farm. These esti-mates are deceptive for poultry farms and large farmsgenerally, however, because many have negative costs(i.e., "savings") for onfarm transport that will be offsetby higher off-farm transport costs.
Differences in nutrient management costs according tofarm size were not pronounced (table 14). Large farmshad the highest average cost, but small farms averagedwithin $100 of the cost for medium-size farms. Onfarmtransport costs for small farms actually averaged morethan for large farms, reflecting the "savings" thatoccurs for large farms with few acres available forland application. Differences by farm size were pro-nounced for land application costs, as would be ex-pected.
On a per-farm basis, nutrient management costs werehighest in the Northeast and lowest in the Delta States(table 15). Most regional differences in costs reflectdifferences in onfarm transport costs, which in turnare heavily influenced by the proportion of large farmsand poultry farms in the region. Land application costswere about the same for all regions, varying by lessthan $150 per farm among the 10 regions.
Overall, annual nutrient management costs totaled$268 million. Costs in the Corn Belt region, the LakeStates, and the Northeast region comprised aboutthree-fourths of this total cost.
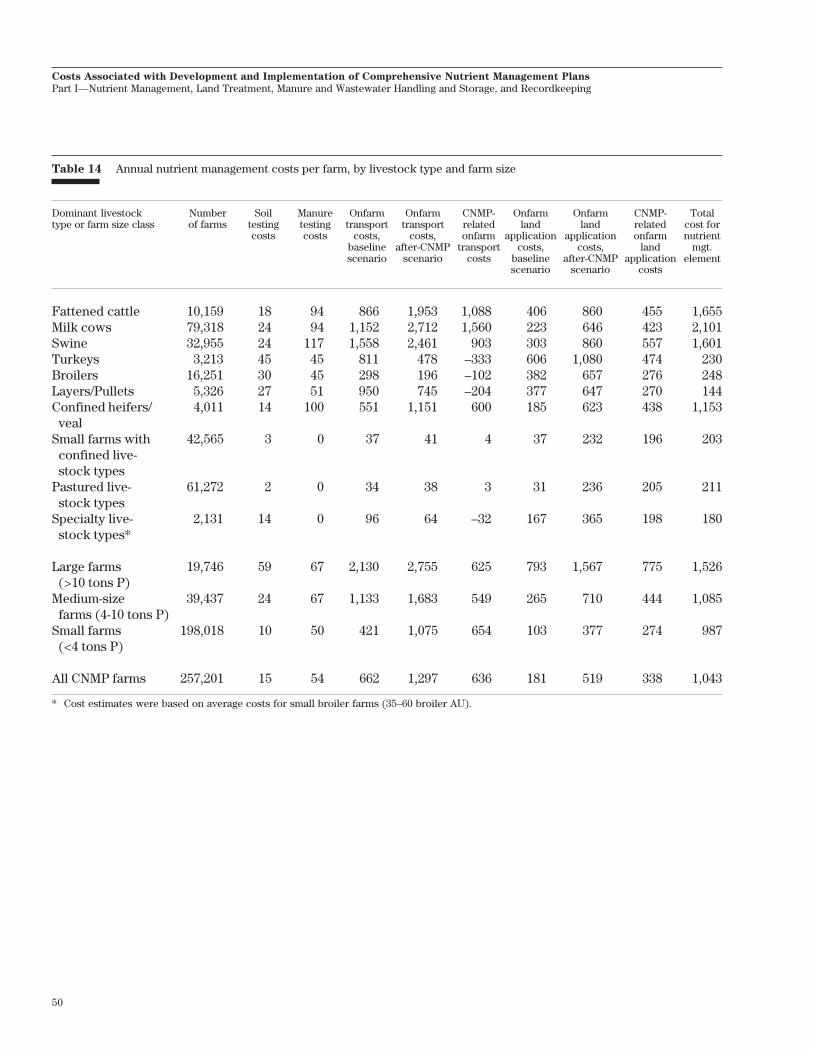
50
Costs Associated with Development and Implementation of Comprehensive Nutrient Management Plans
Part I—Nutrient Management, Land Treatment, Manure and Wastewater Handling and Storage, and Recordkeeping
Table 14 Annual nutrient management costs per farm, by livestock type and farm size
Dominant livestock Number Soil Manure Onfarm Onfarm CNMP- Onfarm Onfarm CNMP- Totaltype or farm size class of farms testing testing transport transport related land land related cost for
costs costs costs, costs, onfarm application application onfarm nutrientbaseline after-CNMP transport costs, costs, land mgt.scenario scenario costs baseline after-CNMP application element
scenario scenario costs
Fattened cattle 10,159 18 94 866 1,953 1,088 406 860 455 1,655Milk cows 79,318 24 94 1,152 2,712 1,560 223 646 423 2,101Swine 32,955 24 117 1,558 2,461 903 303 860 557 1,601Turkeys 3,213 45 45 811 478 –333 606 1,080 474 230Broilers 16,251 30 45 298 196 –102 382 657 276 248Layers/Pullets 5,326 27 51 950 745 –204 377 647 270 144Confined heifers/ 4,011 14 100 551 1,151 600 185 623 438 1,153
vealSmall farms with 42,565 3 0 37 41 4 37 232 196 203
confined live-stock types
Pastured live- 61,272 2 0 34 38 3 31 236 205 211stock types
Specialty live- 2,131 14 0 96 64 –32 167 365 198 180stock types*
Large farms 19,746 59 67 2,130 2,755 625 793 1,567 775 1,526(>10 tons P)
Medium-size 39,437 24 67 1,133 1,683 549 265 710 444 1,085farms (4-10 tons P)
Small farms 198,018 10 50 421 1,075 654 103 377 274 987(<4 tons P)
All CNMP farms 257,201 15 54 662 1,297 636 181 519 338 1,043
* Cost estimates were based on average costs for small broiler farms (35–60 broiler AU).
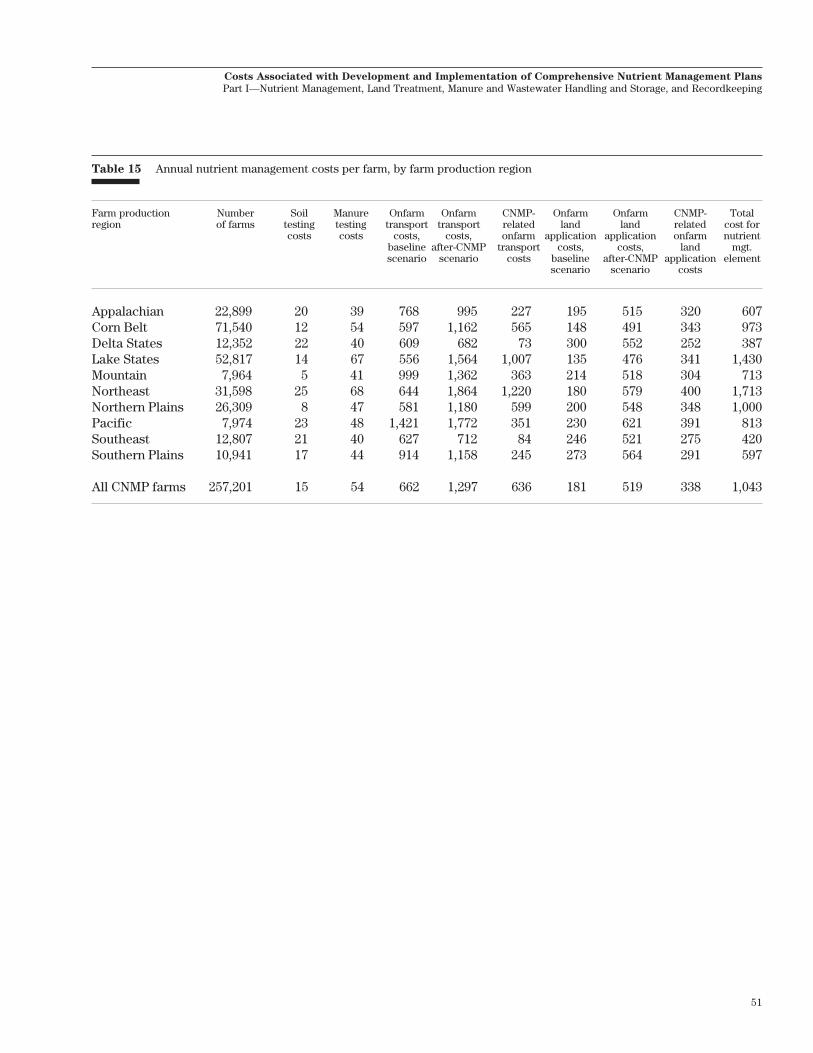
51
Costs Associated with Development and Implementation of Comprehensive Nutrient Management Plans
Part I—Nutrient Management, Land Treatment, Manure and Wastewater Handling and Storage, and Recordkeeping
Table 15 Annual nutrient management costs per farm, by farm production region
Farm production Number Soil Manure Onfarm Onfarm CNMP- Onfarm Onfarm CNMP- Totalregion of farms testing testing transport transport related land land related cost for
costs costs costs, costs, onfarm application application onfarm nutrientbaseline after-CNMP transport costs, costs, land mgt.scenario scenario costs baseline after-CNMP application element
scenario scenario costs
Appalachian 22,899 20 39 768 995 227 195 515 320 607Corn Belt 71,540 12 54 597 1,162 565 148 491 343 973Delta States 12,352 22 40 609 682 73 300 552 252 387Lake States 52,817 14 67 556 1,564 1,007 135 476 341 1,430Mountain 7,964 5 41 999 1,362 363 214 518 304 713Northeast 31,598 25 68 644 1,864 1,220 180 579 400 1,713Northern Plains 26,309 8 47 581 1,180 599 200 548 348 1,000Pacific 7,974 23 48 1,421 1,772 351 230 621 391 813Southeast 12,807 21 40 627 712 84 246 521 275 420Southern Plains 10,941 17 44 914 1,158 245 273 564 291 597
All CNMP farms 257,201 15 54 662 1,297 636 181 519 338 1,043
52
Costs Associated with Development and Implementation of Comprehensive Nutrient Management Plans
Part I—Nutrient Management, Land Treatment, Manure and Wastewater Handling and Storage, and Recordkeeping
Off-farm transport costs
Farms with excess manure after CNMPs are imple-mented need to transport the excess manure to sur-rounding properties for land application. Although thecost of off-farm land application is not included as adirect CNMP-related cost, it is assumed in this assess-ment that the livestock operation would bear the costof off-farm transport.
As shown in table 8 and figure 15, 71,999 farms haveCNMP-related off-farm transport costs. About two-thirds of these farms were already exporting some orall of their manure off the farm in the baseline sce-nario. As shown in the previous section, some of thesefarms exhibited a "cost savings" in terms of onfarmtransport costs because the amount of manure appliedon the farm decreased as producers shifted fromcurrent application rates to lower application rates inthe after-CNMP scenario. This cost savings is offset byhigher off-farm transport costs.
Off-farm transport costs are determined by the amountof manure to be exported and the off-farm distance themanure is transported. The distance manure is trans-ported is a function of the acres required for manureapplication on manure receiving farms, which in turnis determined by the number of acres available formanure application and the application rate criteria.Application rate criteria for manure receiving farmswere modeled the same as for CNMP farms in theafter-CNMP scenario—application at nitrogen-standard rates. These application rate criteria formanure receiving farms were the same for both landapplication scenarios. (For details on land availablefor manure application and application rate criteria formanure receiving farms, see appendix B.)
In most counties sufficient acreage exists for off-farmland application of manure in accordance with NRCSnutrient management criteria. However, in some areasof the country the production of manure nutrients is solarge that even if all the land available for manure ap-plication (under the assumptions of the model simula-tion) had manure applied, there would still be excessmanure. This excess manure is categorized as county-level excess manure. There were 248 counties thathad county-level excess manure in the after-CNMP
scenario. (For more details on the calculation ofcounty-level excess manure and the counties withexcess manure, see appendix B.)
Altogether, the 71,999 farms without enough acres tomeet CNMP application criteria export off the farmabout two-thirds of all the recoverable manure pro-duced after CNMPs are implemented (see appendix B,table B–13). About half of the recoverable manurenutrients are transported off the farm for applicationon surrounding properties within the county, and theremainder—about 16 percent—is county-level excess.Costs associated with manure exported off the farmfor land application are called within-county trans-
port costs.
County-level excess manure cannot be land appliedwithin the county, but in most cases still must betransported off the farm. Costs associated with dis-posal and utilization of this county-level excess ma-nure will be evaluated in Part II of this study, forth-coming. For the present study, however, a roughestimate is made for the costs of transporting themanure off the farm to a central processing facility inan adjacent county. Costs associated with export ofcounty-level excess manure are called out-of-county
transport costs.
Estimating off-farm transportcosts
Off-farm transport costs were estimated for thebaseline scenario and for the after-CNMP scenario,and the difference was used to represent expected off-farm transport costs associated with CNMP implemen-tation. This approach was modified for farms in coun-ties with excess manure. In these counties each farm’sshare of the county-level excess manure in the after-CNMP scenario was estimated and used to calculateout-of-county transport costs for each farm. For theportion of manure applied within the county, off-farmexport costs were calculated as the difference be-tween the baseline scenario and the after-CNMPscenario, as in counties without excess manure. Forcounty-level excess manure, however, off-farm trans-port costs were based on all of the county-level excessmanure estimated for each farm in the after-CNMPscenario. The transport distance used in the calcula-tion for out-of-county export was the maximum off-

53
Costs Associated with Development and Implementation of Comprehensive Nutrient Management Plans
Part I—Nutrient Management, Land Treatment, Manure and Wastewater Handling and Storage, and Recordkeeping
farm transport distance in the county increased by 25percent to simulate transporting the waste to a centralprocessing facility in an adjacent county.
Separate cost estimates were made for solids and formanure and wastewater handled as a liquid or slurryusing the same costs used to estimate onfarm trans-port costs. Within-county transport costs for solidswere determined for each CNMP farm as follows:
Within-county transport costs = loading cost +(ton-miles)(cost per ton-mile)
where ton-miles is the average off-farm transportdistance in miles multiplied times the tons of manurefor within-county transport. Out-of-county transportcosts for solids are calculated in the same mannerexcept that the transport distance was based on themaximum off-farm transport distance increased by 25percent and the tons of manure for out-of-countytransport. The cost per ton mile is the same as foronfarm transport.
Off-farm transport costs for manure as a liquid orslurry, including wastewater from runoff storageponds, were also calculated in the same manner as foronfarm transport costs. For the larger farms wherepumping is used to transport liquids, off-farm transportcosts are estimated as the cost per mile of pipe multi-plied by the maximum distance that the wastewater istransported, and then increasing that estimate by 25percent.
The average off-farm hauling distance was calculatedfor each farm using the same formula used to calculateonfarm hauling distance, but the terms in the equationwere estimated differently. The term NM × Q, theamount of manure nutrients available for application,was estimated as the amount of farm-level excessmanure nitrogen for each farm excluding the farm’sshare of county-level excess manure nitrogen. NC isthe average nitrogen application rate on acres in thecounty receiving manure. Since manure-receivingfarms applied manure at nitrogen-standard rates inboth scenarios, this term is about the same for bothscenarios. (The after-CNMP scenario included addi-tional acres on manure-receiving farms that couldhave yields different from the acres included in thebaseline scenario, thus resulting in slightly differentvalues of NC for the two scenarios.) The willingness toaccept manure, measured by γ was set at 0.5 to simu-
late that only 50 percent of the suitable manure-receiv-ing farm acres in the county were used for manure
application in the model simulation. The 1
α β× term
was estimated using county-level statistics on totalacres and cropland and pastureland acres available forland application of manure.
The willingness to accept manure can have a signifi-cant impact on the off-farm transport distance calcula-tion, and thus on off-farm transport costs. It is notknown what the willingness to accept is, but it isunlikely that it will be much higher than 50 percent inmost areas of the country. Farmer survey resultssuggest that the percentage of acres actually receivingmanure is much lower (Padgitt et al., 2000). In areas ofhigh livestock production, however, the willingness toaccept manure by nonlivestock producers is expectedto be higher than in other areas because manure hasbeen exported to surrounding properties for severalyears. To the extent that the 50 percent level is toohigh, these estimates of transport costs will be under-stated.
In counties with concentrated livestock production,the distance estimates are also likely to be under-stated. Livestock operations will be competing for arelatively scarce supply of off-farm acres available forapplication. The distance function does not accountfor this competition; it implicitly assumes that live-stock operations are dispersed enough so that the off-farm acres needed would not be in use by anotherlivestock operation.
Average off-farm transport distances were calculatedfor both the baseline scenario and the after-CNMPscenario. Table 16 summarizes the off-farm transportdistance for counties with and without enough land.Farms without excess manure in the baseline sce-nario did not export manure off the farm prior toimplementing a CNMP, so transport distance for thebaseline scenario was zero. The median transportdistance for these farms after CNMP implementationwas about 0.4 mile both in counties with and withoutenough land. Farms with excess manure in thebaseline scenario were already exporting manure offthe farm, and needed to increase the amount exportedafter CNMP implementation. Median off-farm trans-port distance for farms with excess manure in thebaseline scenario was higher—0.6 mile in countieswith enough land and 0.8 mile in counties without

54
Costs Associated with Development and Implementation of Comprehensive Nutrient Management Plans
Part I—Nutrient Management, Land Treatment, Manure and Wastewater Handling and Storage, and Recordkeeping
enough land. Farms with excess manure in thebaseline scenario in counties without enough land hadalmost no increase in transport distance because all ofthe available land was already receiving manure.(There were 64 counties without enough land afterCNMPs were implemented that had enough land in thebaseline scenario; farms in these counties had someoff-farm capacity for land application, thus explainingthe slight increase in transport distance for thesefarms. See appendix B for more details on off-farmland application.) Farm-level excess manure on farmsin counties without enough land was exported out ofthe county in the simulation model using the maximumtransport distance in the county, which ranged from0.7 to 12.6 miles among counties without enough land.(These estimates do not include the 25 percent in-crease used for the cost calculations.)
The amount of manure to be transported off the farmwas calculated as the difference between total manureproduced and the amount applied on the farm. Theout-of-county portion was calculated for each farm bydistributing the total amount for the county to eachfarm in proportion to the amount of recoverable ma-nure produced on each farm. Table 17 presents per-farm estimates of the tons of manure for off-farmtransport both within the county and out of the county.(For farms with excess manure in the baseline sce-nario in counties without enough land, there was aslight decrease in the solids exported within thecounty, reflecting a change in the consistency ofmanure for some dairies as a result of CNMP imple-mentation. The increase in liquid and slurry manureexported for application within the county for thesefarms reflects the additional land application capacityin the 64 additional counties without enough land inthe after-CNMP scenario.)
Table 16 Off-farm transport distance*
Farm group Number Baseline Baseline After- After- Increase Maximum Maximumof farms scenario, scenario, CNMP CNMP in the transport transport
median range of scenario, scenario, median distance distance intransport transport median range of transport in county, county,distance distance transport transport distance median range(miles) (miles) distance distance (miles) (miles) (miles)
(miles) (miles)
Farms without excess manure in the baseline scenario
Counties with enough land 18,481 0 0 0.38 0.06-2.71 0.38 NA NA
Counties without enough land 5,956 0 0 0.37 0.04-1.98 0.37 3.31 0.69-12.62
Farms with excess manure in the baseline scenario
Counties with enough land 28,362 0.46 0.08-5.63 0.57 0.09-6.52 0.11 NA NA
Counties without enough land** 19,200 0.76 0.10-3.59 0.77 0.11-3.52 0.01 2.68 0.95-12.62
* Excludes CNMP farms with specialty livestock types.** 64 of these counties did not have county-level excess manure in the baseline scenario and so had some additional capacity to receive
off-farm manure applications in the after-CNMP scenario, explaining the slight increase in the average transport distance for thisgroup.
Notes: Counties without enough land pertain to the after-CNMP scenario.NA=not applicable.Range is 1 percentile to 99th percentile.

55
Costs Associated with Development and Implementation of Comprehensive Nutrient Management Plans
Part I—Nutrient Management, Land Treatment, Manure and Wastewater Handling and Storage, and Recordkeeping
Table 17 Amount of manure for off-farm transport*
Number - - - - - - - - - - - - - - - - - - - - - - - - - Within county transport - - - - - - - - - - - - - - - - - - - - - - - - - Out-of-county transportof CNMP
farms - - - - - - - - - - - - - Solids - - - - - - - - - - - - - - - - - - - - - - - Liquid and slurry - - - - - - - - - - Solids Liquid andslurry
baseline after-CNMP change baseline after-CNMP change after-CNMP after-CNMPscenario scenario scenario scenario** scenario scenario**
All CNMP farms
Total 71,999 25,502,456 38,154,690 12,652,234 128,457,934 523,834,330 395,376,396 9,476,428 127,555,359Per farm 354 530 176 1,784 7,276 5,491 132 1,772
Farms without excess manure in the baseline scenario
Counties with enough landTotal 18,481 0 4,615,217 4,615,217 0 122,611,788 122,611,788 0 0Per farm 0 250 250 0 6,634 6,634 0 0
Counties without enough landTotal 5,956 0 701,805 701,805 0 23,658,990 23,658,990 813,336 26,328,966Per farm 0 118 118 0 3,972 3,972 137 4,421
Farms with excess manure in the baseline scenario
Counties with enough landTotal 28,362 19,895,674 27,258,182 7,362,509 96,025,905 306,936,870 210,910,965 0 0Per farm 701 961 260 3,386 10,822 7,436 0 0
Counties without enough land***Total 19,200 5,606,081 5,578,158 -27,924 32,428,643 70,605,252 38,176,609 8,662,956 101,221,972Per farm 292 291 -1 1,689 3,677 1,988 451 5,272
* Excludes CNMP farms with specialty livestock types.** Includes additional tons of wastewater from runoff storage ponds installed to meet CNMP criteria.*** 64 of these counties did not have county-level excess manure in the baseline scenario and so had some additional capacity to receive
off-farm manure applications in the after-CNMP scenario.Note: Counties without enough land pertain to the after-CNMP scenario.
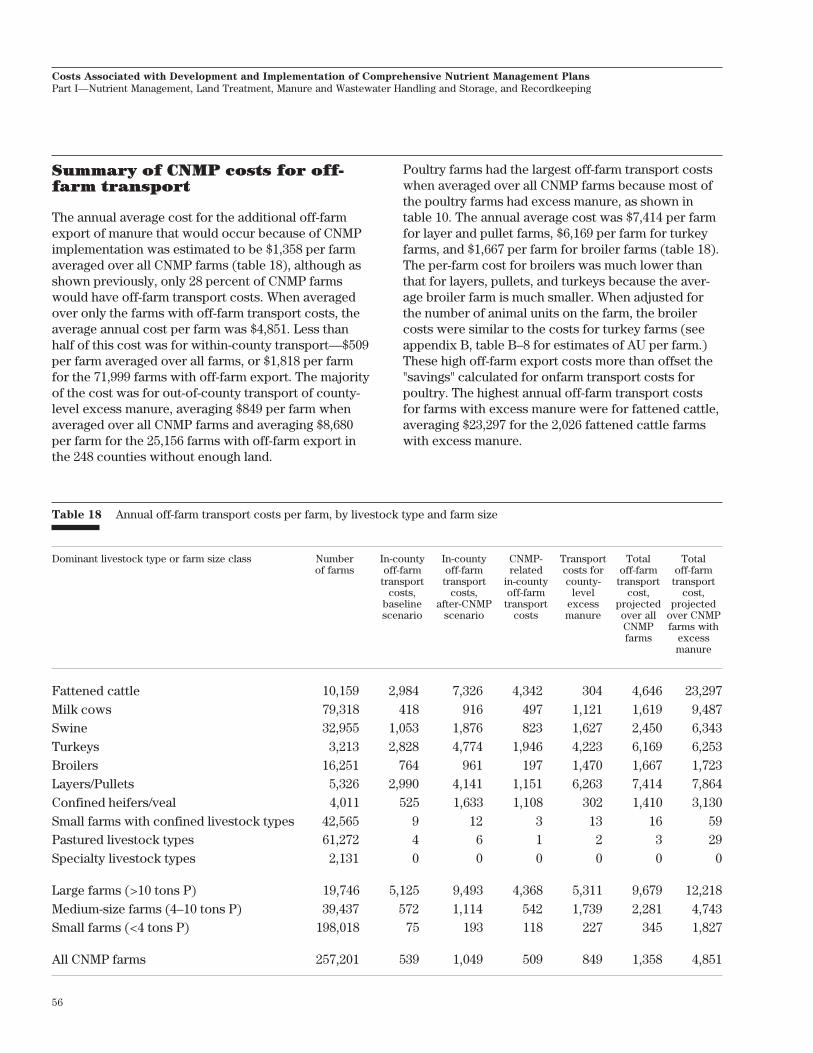
56
Costs Associated with Development and Implementation of Comprehensive Nutrient Management Plans
Part I—Nutrient Management, Land Treatment, Manure and Wastewater Handling and Storage, and Recordkeeping
Summary of CNMP costs for off-farm transport
The annual average cost for the additional off-farmexport of manure that would occur because of CNMPimplementation was estimated to be $1,358 per farmaveraged over all CNMP farms (table 18), although asshown previously, only 28 percent of CNMP farmswould have off-farm transport costs. When averagedover only the farms with off-farm transport costs, theaverage annual cost per farm was $4,851. Less thanhalf of this cost was for within-county transport—$509per farm averaged over all farms, or $1,818 per farmfor the 71,999 farms with off-farm export. The majorityof the cost was for out-of-county transport of county-level excess manure, averaging $849 per farm whenaveraged over all CNMP farms and averaging $8,680per farm for the 25,156 farms with off-farm export inthe 248 counties without enough land.
Poultry farms had the largest off-farm transport costswhen averaged over all CNMP farms because most ofthe poultry farms had excess manure, as shown intable 10. The annual average cost was $7,414 per farmfor layer and pullet farms, $6,169 per farm for turkeyfarms, and $1,667 per farm for broiler farms (table 18).The per-farm cost for broilers was much lower thanthat for layers, pullets, and turkeys because the aver-age broiler farm is much smaller. When adjusted forthe number of animal units on the farm, the broilercosts were similar to the costs for turkey farms (seeappendix B, table B–8 for estimates of AU per farm.)These high off-farm export costs more than offset the"savings" calculated for onfarm transport costs forpoultry. The highest annual off-farm transport costsfor farms with excess manure were for fattened cattle,averaging $23,297 for the 2,026 fattened cattle farmswith excess manure.
Table 18 Annual off-farm transport costs per farm, by livestock type and farm size
Dominant livestock type or farm size class Number In-county In-county CNMP- Transport Total Totalof farms off-farm off-farm related costs for off-farm off-farm
transport transport in-county county- transport transportcosts, costs, off-farm level cost, cost,
baseline after-CNMP transport excess projected projectedscenario scenario costs manure over all over CNMP
CNMP farms withfarms excess
manure
Fattened cattle 10,159 2,984 7,326 4,342 304 4,646 23,297Milk cows 79,318 418 916 497 1,121 1,619 9,487Swine 32,955 1,053 1,876 823 1,627 2,450 6,343Turkeys 3,213 2,828 4,774 1,946 4,223 6,169 6,253Broilers 16,251 764 961 197 1,470 1,667 1,723Layers/Pullets 5,326 2,990 4,141 1,151 6,263 7,414 7,864Confined heifers/veal 4,011 525 1,633 1,108 302 1,410 3,130Small farms with confined livestock types 42,565 9 12 3 13 16 59Pastured livestock types 61,272 4 6 1 2 3 29Specialty livestock types 2,131 0 0 0 0 0 0
Large farms (>10 tons P) 19,746 5,125 9,493 4,368 5,311 9,679 12,218Medium-size farms (4–10 tons P) 39,437 572 1,114 542 1,739 2,281 4,743Small farms (<4 tons P) 198,018 75 193 118 227 345 1,827
All CNMP farms 257,201 539 1,049 509 849 1,358 4,851
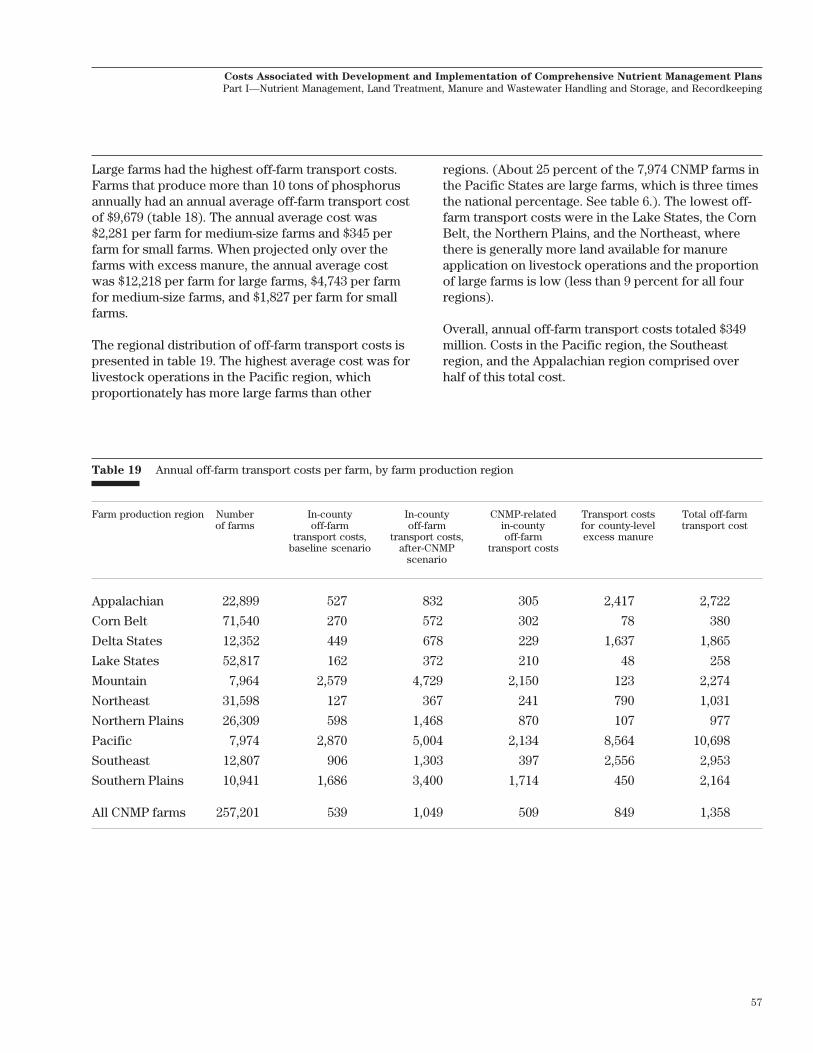
57
Costs Associated with Development and Implementation of Comprehensive Nutrient Management Plans
Part I—Nutrient Management, Land Treatment, Manure and Wastewater Handling and Storage, and Recordkeeping
Large farms had the highest off-farm transport costs.Farms that produce more than 10 tons of phosphorusannually had an annual average off-farm transport costof $9,679 (table 18). The annual average cost was$2,281 per farm for medium-size farms and $345 perfarm for small farms. When projected only over thefarms with excess manure, the annual average costwas $12,218 per farm for large farms, $4,743 per farmfor medium-size farms, and $1,827 per farm for smallfarms.
The regional distribution of off-farm transport costs ispresented in table 19. The highest average cost was forlivestock operations in the Pacific region, whichproportionately has more large farms than other
regions. (About 25 percent of the 7,974 CNMP farms inthe Pacific States are large farms, which is three timesthe national percentage. See table 6.). The lowest off-farm transport costs were in the Lake States, the CornBelt, the Northern Plains, and the Northeast, wherethere is generally more land available for manureapplication on livestock operations and the proportionof large farms is low (less than 9 percent for all fourregions).
Overall, annual off-farm transport costs totaled $349million. Costs in the Pacific region, the Southeastregion, and the Appalachian region comprised overhalf of this total cost.
Table 19 Annual off-farm transport costs per farm, by farm production region
Farm production region Number In-county In-county CNMP-related Transport costs Total off-farmof farms off-farm off-farm in-county for county-level transport cost
transport costs, transport costs, off-farm excess manurebaseline scenario after-CNMP transport costs
scenario
Appalachian 22,899 527 832 305 2,417 2,722
Corn Belt 71,540 270 572 302 78 380
Delta States 12,352 449 678 229 1,637 1,865
Lake States 52,817 162 372 210 48 258
Mountain 7,964 2,579 4,729 2,150 123 2,274
Northeast 31,598 127 367 241 790 1,031
Northern Plains 26,309 598 1,468 870 107 977
Pacific 7,974 2,870 5,004 2,134 8,564 10,698
Southeast 12,807 906 1,303 397 2,556 2,953
Southern Plains 10,941 1,686 3,400 1,714 450 2,164
All CNMP farms 257,201 539 1,049 509 849 1,358
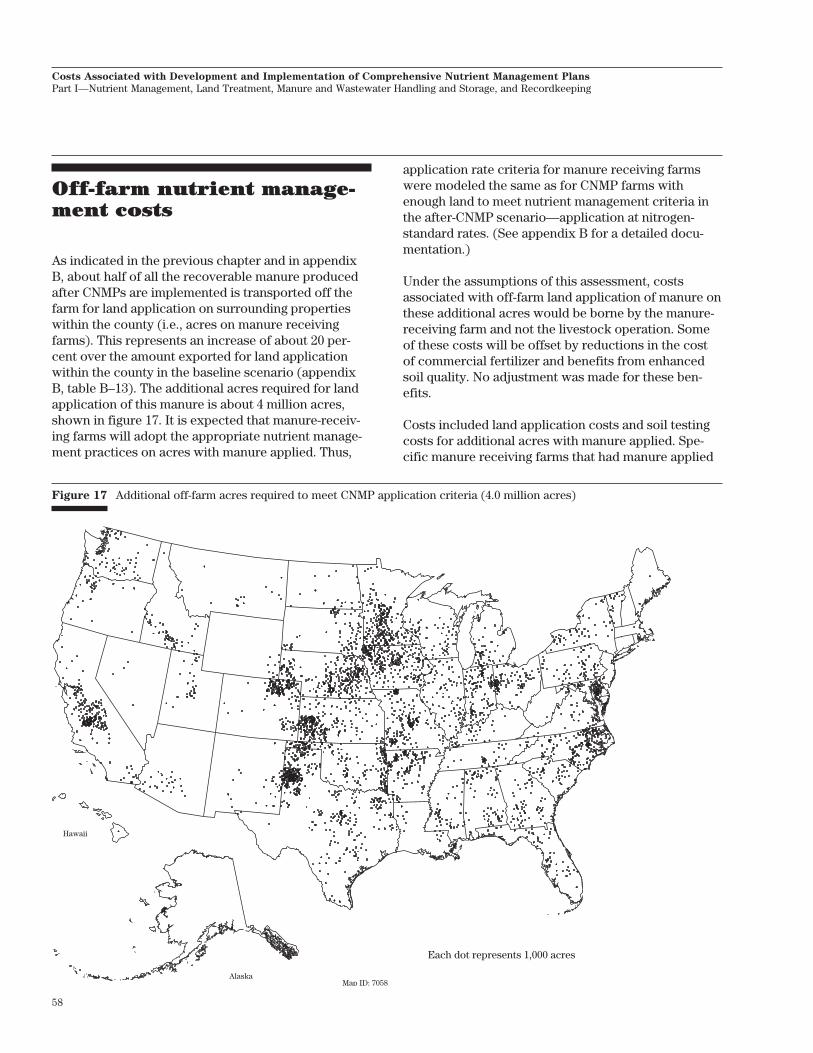
58
Costs Associated with Development and Implementation of Comprehensive Nutrient Management Plans
Part I—Nutrient Management, Land Treatment, Manure and Wastewater Handling and Storage, and Recordkeeping
Off-farm nutrient manage-ment costs
As indicated in the previous chapter and in appendixB, about half of all the recoverable manure producedafter CNMPs are implemented is transported off thefarm for land application on surrounding propertieswithin the county (i.e., acres on manure receivingfarms). This represents an increase of about 20 per-cent over the amount exported for land applicationwithin the county in the baseline scenario (appendixB, table B–13). The additional acres required for landapplication of this manure is about 4 million acres,shown in figure 17. It is expected that manure-receiv-ing farms will adopt the appropriate nutrient manage-ment practices on acres with manure applied. Thus,
application rate criteria for manure receiving farmswere modeled the same as for CNMP farms withenough land to meet nutrient management criteria inthe after-CNMP scenario—application at nitrogen-standard rates. (See appendix B for a detailed docu-mentation.)
Under the assumptions of this assessment, costsassociated with off-farm land application of manure onthese additional acres would be borne by the manure-receiving farm and not the livestock operation. Someof these costs will be offset by reductions in the costof commercial fertilizer and benefits from enhancedsoil quality. No adjustment was made for these ben-efits.
Costs included land application costs and soil testingcosts for additional acres with manure applied. Spe-cific manure receiving farms that had manure applied
Figure 17 Additional off-farm acres required to meet CNMP application criteria (4.0 million acres)
Hawaii
AlaskaMap ID: 7058
Each dot represents 1,000 acres
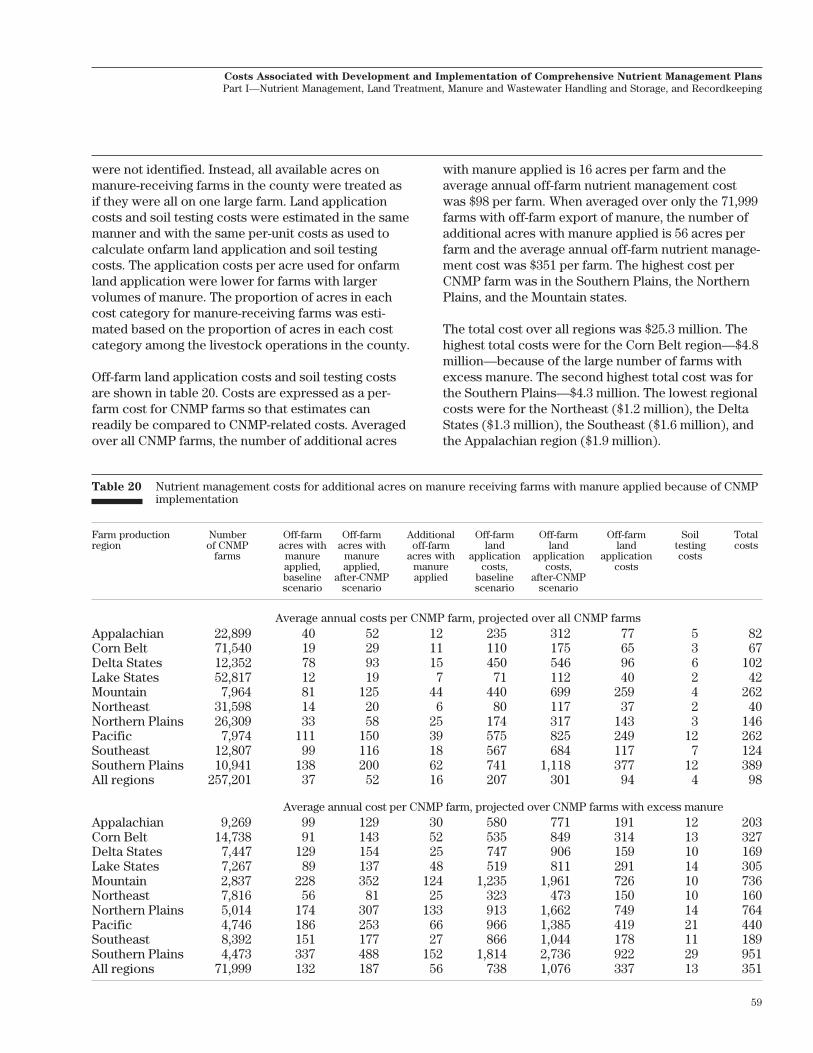
59
Costs Associated with Development and Implementation of Comprehensive Nutrient Management Plans
Part I—Nutrient Management, Land Treatment, Manure and Wastewater Handling and Storage, and Recordkeeping
were not identified. Instead, all available acres onmanure-receiving farms in the county were treated asif they were all on one large farm. Land applicationcosts and soil testing costs were estimated in the samemanner and with the same per-unit costs as used tocalculate onfarm land application and soil testingcosts. The application costs per acre used for onfarmland application were lower for farms with largervolumes of manure. The proportion of acres in eachcost category for manure-receiving farms was esti-mated based on the proportion of acres in each costcategory among the livestock operations in the county.
Off-farm land application costs and soil testing costsare shown in table 20. Costs are expressed as a per-farm cost for CNMP farms so that estimates canreadily be compared to CNMP-related costs. Averagedover all CNMP farms, the number of additional acres
with manure applied is 16 acres per farm and theaverage annual off-farm nutrient management costwas $98 per farm. When averaged over only the 71,999farms with off-farm export of manure, the number ofadditional acres with manure applied is 56 acres perfarm and the average annual off-farm nutrient manage-ment cost was $351 per farm. The highest cost perCNMP farm was in the Southern Plains, the NorthernPlains, and the Mountain states.
The total cost over all regions was $25.3 million. Thehighest total costs were for the Corn Belt region—$4.8million—because of the large number of farms withexcess manure. The second highest total cost was forthe Southern Plains—$4.3 million. The lowest regionalcosts were for the Northeast ($1.2 million), the DeltaStates ($1.3 million), the Southeast ($1.6 million), andthe Appalachian region ($1.9 million).
Table 20 Nutrient management costs for additional acres on manure receiving farms with manure applied because of CNMPimplementation
Farm production Number Off-farm Off-farm Additional Off-farm Off-farm Off-farm Soil Totalregion of CNMP acres with acres with off-farm land land land testing costs
farms manure manure acres with application application application costsapplied, applied, manure costs, costs, costsbaseline after-CNMP applied baseline after-CNMPscenario scenario scenario scenario
Average annual costs per CNMP farm, projected over all CNMP farmsAppalachian 22,899 40 52 12 235 312 77 5 82Corn Belt 71,540 19 29 11 110 175 65 3 67Delta States 12,352 78 93 15 450 546 96 6 102Lake States 52,817 12 19 7 71 112 40 2 42Mountain 7,964 81 125 44 440 699 259 4 262Northeast 31,598 14 20 6 80 117 37 2 40Northern Plains 26,309 33 58 25 174 317 143 3 146Pacific 7,974 111 150 39 575 825 249 12 262Southeast 12,807 99 116 18 567 684 117 7 124Southern Plains 10,941 138 200 62 741 1,118 377 12 389All regions 257,201 37 52 16 207 301 94 4 98
Average annual cost per CNMP farm, projected over CNMP farms with excess manureAppalachian 9,269 99 129 30 580 771 191 12 203Corn Belt 14,738 91 143 52 535 849 314 13 327Delta States 7,447 129 154 25 747 906 159 10 169Lake States 7,267 89 137 48 519 811 291 14 305Mountain 2,837 228 352 124 1,235 1,961 726 10 736Northeast 7,816 56 81 25 323 473 150 10 160Northern Plains 5,014 174 307 133 913 1,662 749 14 764Pacific 4,746 186 253 66 966 1,385 419 21 440Southeast 8,392 151 177 27 866 1,044 178 11 189Southern Plains 4,473 337 488 152 1,814 2,736 922 29 951All regions 71,999 132 187 56 738 1,076 337 13 351
60
Costs Associated with Development and Implementation of Comprehensive Nutrient Management Plans
Part I—Nutrient Management, Land Treatment, Manure and Wastewater Handling and Storage, and Recordkeeping
Land treatment costs
Runoff and soil erosion need to be at acceptable levelson fields where manure is applied to prevent manureand manure nutrients from being carried to rivers andstreams with the runoff. A CNMP therefore includescriteria for soil erosion control on land on whichmanure is applied. At a minimum the conservationsystems that need to be installed as part of a CNMPmust meet NRCS Quality Criteria for soil erosion (seesection III of the Field Office Technical Guide). Pres-ently, States have established that the quality criterionfor soil erosion is the sustainability level for cropproduction. The sustainability level of soil for cropproduction is also referred to as the soil loss tolerancelevel, or T. Fields with erosion rates greater than Tneed to have conservation practices installed thatwould reduce the erosion rate to T or less beforemanure can be applied.
Land treatment costs were calculated for all onfarmacres where manure would be applied after CNMPimplementation. Erosion controls would also be ex-pected to apply to off-farm land application. In themodel simulation, however, it was assumed that landon manure-receiving farms with erosion rates greaterthan T would not be available for manure applicationbecause of the potential for additional costs. (Seeappendix B for criteria on land available for manureapplication.) It was also assumed that CNMP farmswould bear the costs of land treatment rather thanseek options to onfarm land application.
Estimating acres required forland treatment
The number of acres for which land treatment prac-tices would be expected depends on the number ofonfarm acres needed for manure application to meetCNMP application criteria and the portion of thoseacres that have soil erosion rates greater than T.
For calculating land treatment costs, application ratecriteria for the after-CNMP scenario differed fromcriteria used to calculate nutrient management costs.Acres that would potentially need land treatmentwould include all the acres that would receive manureover all the years. Thus, for calculating land treatment
costs, application rate criteria for the after-CNMPscenario were simulated using phosphorus-basedapplication rates for all farms where phosphorus wasthe limiting nutrient. Nitrogen-based application rateswere used only for farms where nitrogen was thelimiting nutrient. (Nitrogen was the limiting nutrienton only a few farms.) The number of acres that wouldreceive manure over time includes about 9.8 millionmore acres than the 14.8 million used to calculatenutrient management costs in the after-CNMP sce-nario. (See appendix B for details on how land withmanure applied was estimated.)
The number of acres with manure applied over time ispresented in table 21, categorized by Land ResourceRegions. The Land Resource Region was the geo-graphic unit used to define land treatment needs andcosts because soils, climate, water resources, landuses, and type of farming tend to be similar withineach region. (A map of Land Resource Regions ispresented in figure 16.) The model simulation showsthat manure would be applied on 24.6 million onfarmacres over time, equivalent to an average of 96 acresper CNMP farm. The vast majority was cropland acres;pastureland acres comprised only about 11 percent ofthe total.
Only a portion of these acres, however, would haveerosion at rates greater than T. The National Re-sources Inventory (NRI) was used to obtain estimatesof existing soil erosion rates (USDA, ERS, 2000b). Thesoil erosion rates contained in the NRI were calculatedusing the Universal Soil Loss Equation (USLE), whichis an estimate of sheet and rill erosion that is causedby rainfall and runoff. (Land treatment to control winderosion was not included in the analysis since thepurpose of a CNMP is to protect water quality.)
NRI data for the year 1997 were used, which is themost recent year for which NRI data exist for the fullset of NRI sample points. County-level estimates of thenumber of acres with erosion rates of T to 2T, 2T to4T, and greater than 4T were obtained from the NRIdatabase. Separate estimates were made for croplandand pastureland. The percentage of cropland andpastureland acres in each county that was in eacherosion category was calculated. These percentageswere then applied to the cropland and pasturelandacreage on each farm in the Census of Agriculture toestimate the acres on each farm that were in eacherosion category. Since NRI data are for counties, and

61
Costs Associated with Development and Implementation of Comprehensive Nutrient Management Plans
Part I—Nutrient Management, Land Treatment, Manure and Wastewater Handling and Storage, and Recordkeeping
not individual farms, it was necessary to assume thatall acres receiving manure on a farm had the sameerosion profile as the county.
About 5.9 million onfarm acres are expected to havemanure applied and have sheet and rill erosion ratesgreater than T after CNMPs are implemented (table22). This subset represents about 24 percent of theacres with manure applied on CNMPs over time. TheLand Resource Region S, which is in the Northeast,had the highest proportion of manured acres witherosion rates above T—47 percent. Other regions withrelatively high proportions of manured acres with
erosion rates greater than T were R (34 percent, alsoin the Northeast), N (31 percent), P (29 percent), andM (27 percent). These five regions contain 82 percentof all the manured acres with erosion rates above T.Onfarm acres with manure applied and sheet and rillerosion rates above T are shown in figure 18. Thereare few acres in the West because of low rainfall andfew cropland acres.
As shown in table 22, the bulk (55 percent) of themanured acres with erosion rates above T were forcropland with sheet and rill erosion rates between Tand 2T. Cropland acres with erosion rates between 2T
Table 21 Total acres that would receive manure over time after CNMP implementation
Land resource region Number Cropland Pastureland Total Acres perof farms acres with acres with CNMP farm
manure applied manure applied
A 2,127 135,372 59,057 194,429 91B 2,849 170,870 41,705 212,575 75C 3,432 432,909 65,148 498,057 145D 3,050 206,426 39,302 245,729 81E 1,211 76,555 18,451 95,006 78F 5,476 667,232 45,477 712,709 130G 3,597 348,381 36,013 384,394 107H 11,358 1,077,157 141,890 1,219,047 107I 707 26,549 15,642 42,192 60J 3,243 153,430 101,452 254,882 79K 26,870 2,463,985 108,785 2,572,770 96L 11,504 1,274,577 60,164 1,334,741 116M 89,240 8,758,072 429,473 9,187,545 103N 32,171 1,514,743 607,140 2,121,884 66O 1,041 40,110 21,818 61,928 59P 23,770 1,365,719 579,174 1,944,893 82R 14,694 1,500,260 105,557 1,605,817 109S 13,429 1,160,135 149,806 1,309,941 98T 4,508 492,651 42,335 534,986 119U 608 27,523 30,469 57,992 95V 154 13 6,291 6,304 41W 31 3,350 10 3,360 108
All regions 255,070 21,896,019 2,705,160 24,601,179 96
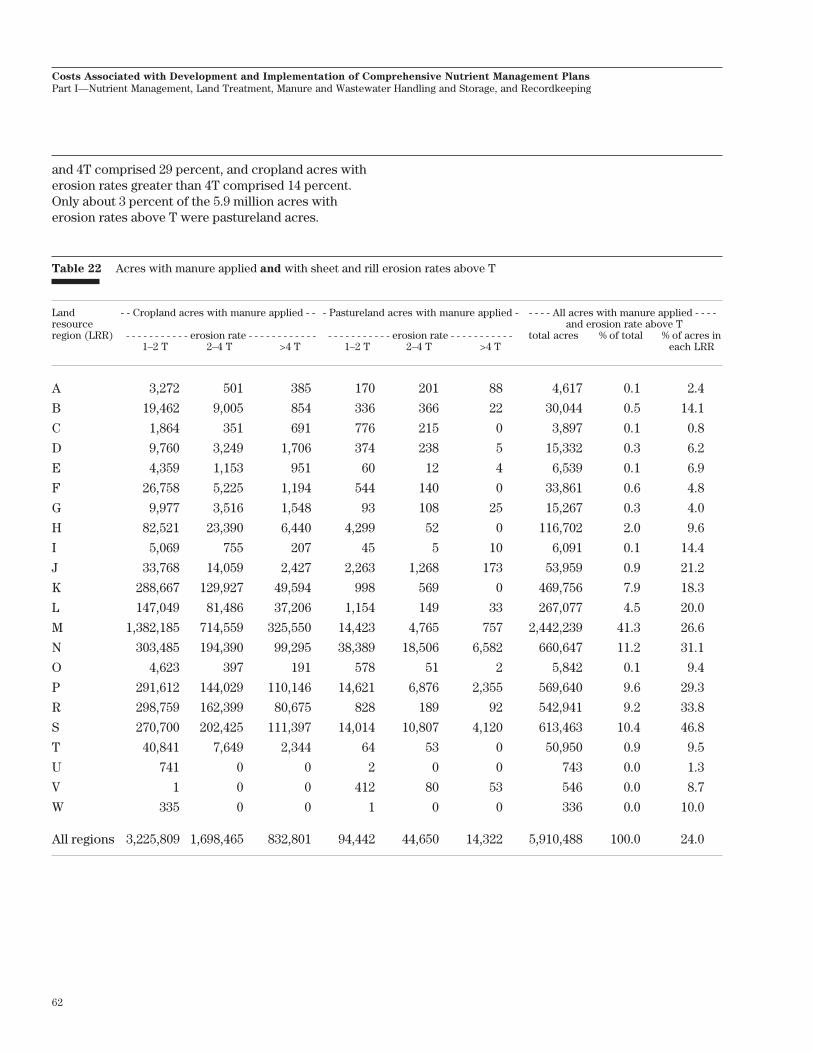
62
Costs Associated with Development and Implementation of Comprehensive Nutrient Management Plans
Part I—Nutrient Management, Land Treatment, Manure and Wastewater Handling and Storage, and Recordkeeping
Table 22 Acres with manure applied and with sheet and rill erosion rates above T
Land - - Cropland acres with manure applied - - - Pastureland acres with manure applied - - - - - All acres with manure applied - - - -resource and erosion rate above Tregion (LRR) - - - - - - - - - - - erosion rate - - - - - - - - - - - - - - - - - - - - - - - erosion rate - - - - - - - - - - - total acres % of total % of acres in
1–2 T 2–4 T >4 T 1–2 T 2–4 T >4 T each LRR
A 3,272 501 385 170 201 88 4,617 0.1 2.4
B 19,462 9,005 854 336 366 22 30,044 0.5 14.1
C 1,864 351 691 776 215 0 3,897 0.1 0.8
D 9,760 3,249 1,706 374 238 5 15,332 0.3 6.2
E 4,359 1,153 951 60 12 4 6,539 0.1 6.9
F 26,758 5,225 1,194 544 140 0 33,861 0.6 4.8
G 9,977 3,516 1,548 93 108 25 15,267 0.3 4.0
H 82,521 23,390 6,440 4,299 52 0 116,702 2.0 9.6
I 5,069 755 207 45 5 10 6,091 0.1 14.4
J 33,768 14,059 2,427 2,263 1,268 173 53,959 0.9 21.2
K 288,667 129,927 49,594 998 569 0 469,756 7.9 18.3
L 147,049 81,486 37,206 1,154 149 33 267,077 4.5 20.0
M 1,382,185 714,559 325,550 14,423 4,765 757 2,442,239 41.3 26.6
N 303,485 194,390 99,295 38,389 18,506 6,582 660,647 11.2 31.1
O 4,623 397 191 578 51 2 5,842 0.1 9.4
P 291,612 144,029 110,146 14,621 6,876 2,355 569,640 9.6 29.3
R 298,759 162,399 80,675 828 189 92 542,941 9.2 33.8
S 270,700 202,425 111,397 14,014 10,807 4,120 613,463 10.4 46.8
T 40,841 7,649 2,344 64 53 0 50,950 0.9 9.5
U 741 0 0 2 0 0 743 0.0 1.3
V 1 0 0 412 80 53 546 0.0 8.7
W 335 0 0 1 0 0 336 0.0 10.0
All regions 3,225,809 1,698,465 832,801 94,442 44,650 14,322 5,910,488 100.0 24.0
and 4T comprised 29 percent, and cropland acres witherosion rates greater than 4T comprised 14 percent.Only about 3 percent of the 5.9 million acres witherosion rates above T were pastureland acres.
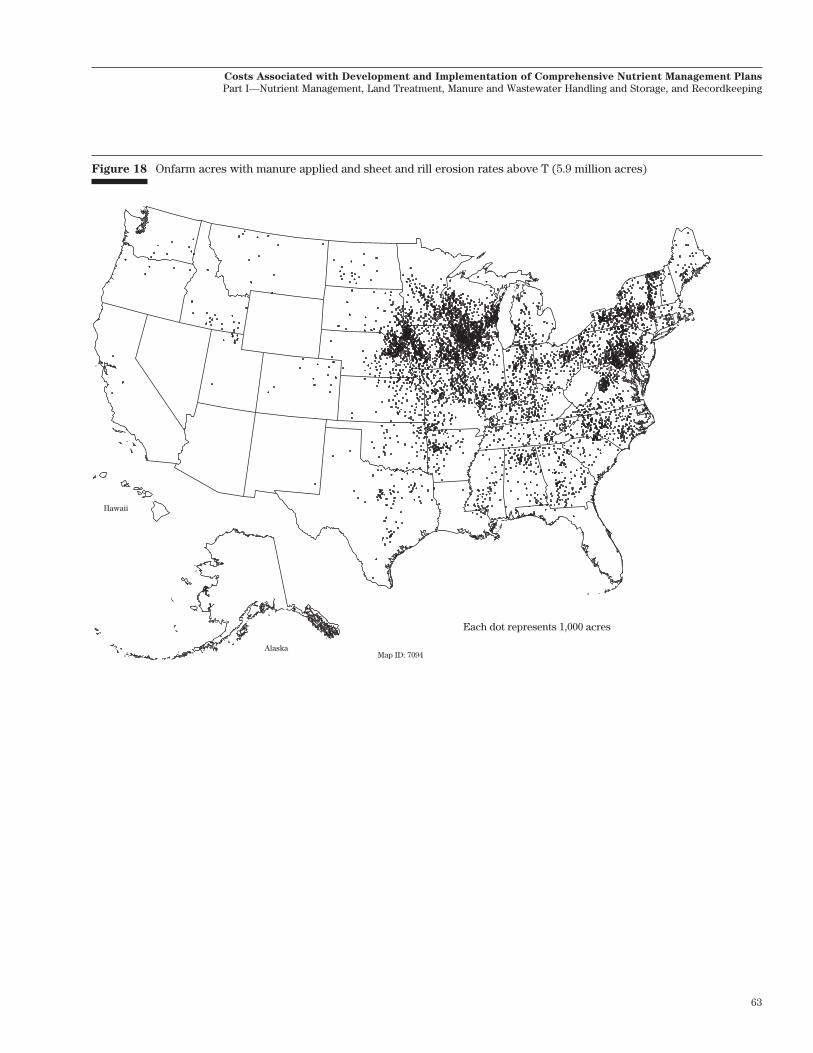
63
Costs Associated with Development and Implementation of Comprehensive Nutrient Management Plans
Part I—Nutrient Management, Land Treatment, Manure and Wastewater Handling and Storage, and Recordkeeping
Figure 18 Onfarm acres with manure applied and sheet and rill erosion rates above T (5.9 million acres)
Hawaii
AlaskaMap ID: 7094
Each dot represents 1,000 acres
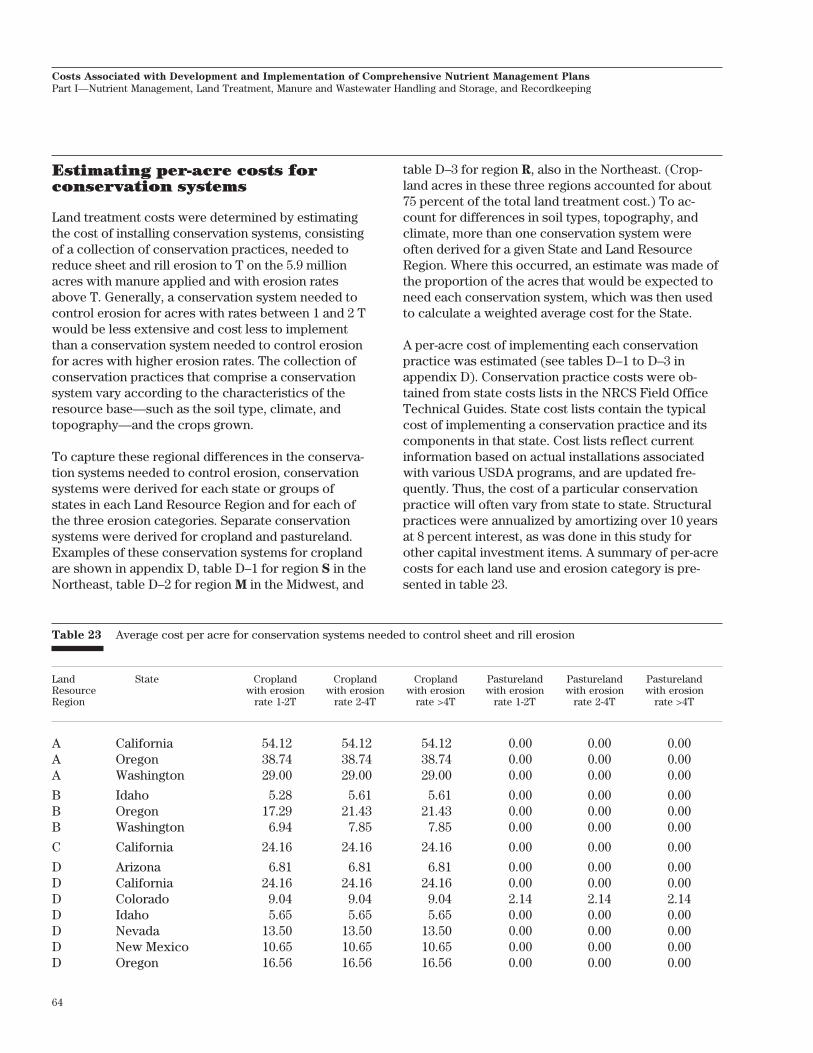
64
Costs Associated with Development and Implementation of Comprehensive Nutrient Management Plans
Part I—Nutrient Management, Land Treatment, Manure and Wastewater Handling and Storage, and Recordkeeping
Table 23 Average cost per acre for conservation systems needed to control sheet and rill erosion
Land State Cropland Cropland Cropland Pastureland Pastureland PasturelandResource with erosion with erosion with erosion with erosion with erosion with erosionRegion rate 1-2T rate 2-4T rate >4T rate 1-2T rate 2-4T rate >4T
A California 54.12 54.12 54.12 0.00 0.00 0.00A Oregon 38.74 38.74 38.74 0.00 0.00 0.00A Washington 29.00 29.00 29.00 0.00 0.00 0.00
B Idaho 5.28 5.61 5.61 0.00 0.00 0.00B Oregon 17.29 21.43 21.43 0.00 0.00 0.00B Washington 6.94 7.85 7.85 0.00 0.00 0.00
C California 24.16 24.16 24.16 0.00 0.00 0.00
D Arizona 6.81 6.81 6.81 0.00 0.00 0.00D California 24.16 24.16 24.16 0.00 0.00 0.00D Colorado 9.04 9.04 9.04 2.14 2.14 2.14D Idaho 5.65 5.65 5.65 0.00 0.00 0.00D Nevada 13.50 13.50 13.50 0.00 0.00 0.00D New Mexico 10.65 10.65 10.65 0.00 0.00 0.00D Oregon 16.56 16.56 16.56 0.00 0.00 0.00
Estimating per-acre costs forconservation systems
Land treatment costs were determined by estimatingthe cost of installing conservation systems, consistingof a collection of conservation practices, needed toreduce sheet and rill erosion to T on the 5.9 millionacres with manure applied and with erosion ratesabove T. Generally, a conservation system needed tocontrol erosion for acres with rates between 1 and 2 Twould be less extensive and cost less to implementthan a conservation system needed to control erosionfor acres with higher erosion rates. The collection ofconservation practices that comprise a conservationsystem vary according to the characteristics of theresource base—such as the soil type, climate, andtopography—and the crops grown.
To capture these regional differences in the conserva-tion systems needed to control erosion, conservationsystems were derived for each state or groups ofstates in each Land Resource Region and for each ofthe three erosion categories. Separate conservationsystems were derived for cropland and pastureland.Examples of these conservation systems for croplandare shown in appendix D, table D–1 for region S in theNortheast, table D–2 for region M in the Midwest, and
table D–3 for region R, also in the Northeast. (Crop-land acres in these three regions accounted for about75 percent of the total land treatment cost.) To ac-count for differences in soil types, topography, andclimate, more than one conservation system wereoften derived for a given State and Land ResourceRegion. Where this occurred, an estimate was made ofthe proportion of the acres that would be expected toneed each conservation system, which was then usedto calculate a weighted average cost for the State.
A per-acre cost of implementing each conservationpractice was estimated (see tables D–1 to D–3 inappendix D). Conservation practice costs were ob-tained from state costs lists in the NRCS Field OfficeTechnical Guides. State cost lists contain the typicalcost of implementing a conservation practice and itscomponents in that state. Cost lists reflect currentinformation based on actual installations associatedwith various USDA programs, and are updated fre-quently. Thus, the cost of a particular conservationpractice will often vary from state to state. Structuralpractices were annualized by amortizing over 10 yearsat 8 percent interest, as was done in this study forother capital investment items. A summary of per-acrecosts for each land use and erosion category is pre-sented in table 23.
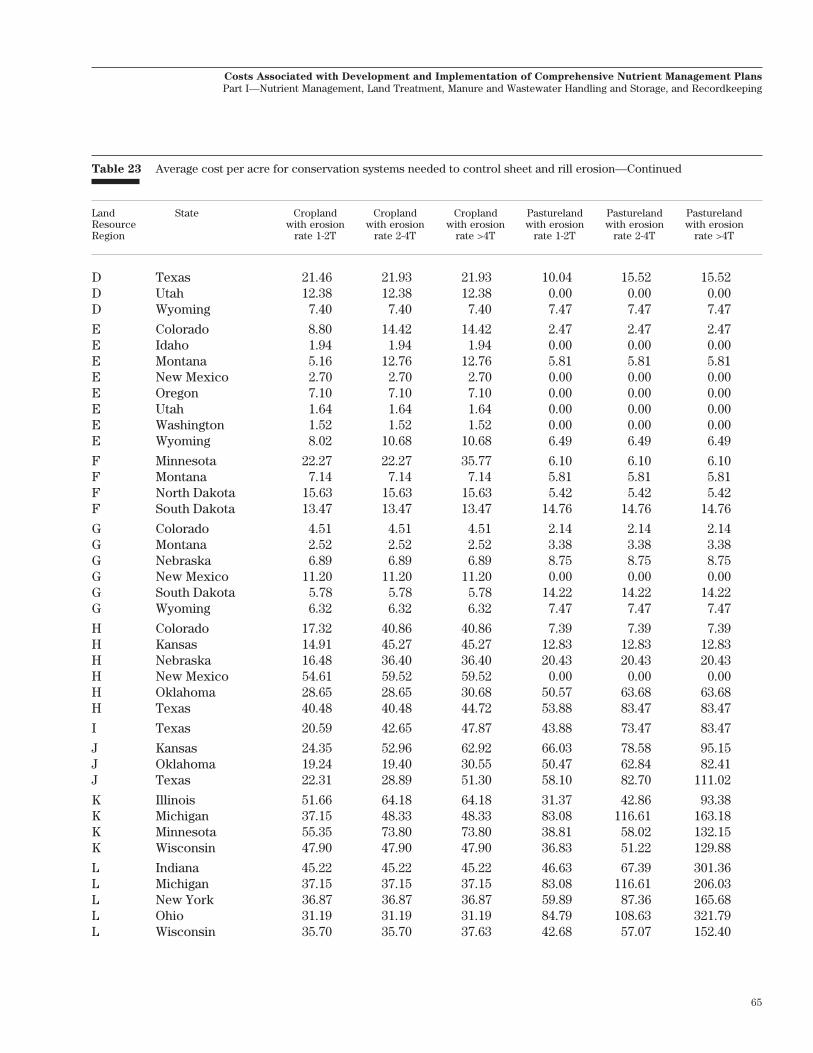
65
Costs Associated with Development and Implementation of Comprehensive Nutrient Management Plans
Part I—Nutrient Management, Land Treatment, Manure and Wastewater Handling and Storage, and Recordkeeping
Table 23 Average cost per acre for conservation systems needed to control sheet and rill erosion—Continued
Land State Cropland Cropland Cropland Pastureland Pastureland PasturelandResource with erosion with erosion with erosion with erosion with erosion with erosionRegion rate 1-2T rate 2-4T rate >4T rate 1-2T rate 2-4T rate >4T
D Texas 21.46 21.93 21.93 10.04 15.52 15.52D Utah 12.38 12.38 12.38 0.00 0.00 0.00D Wyoming 7.40 7.40 7.40 7.47 7.47 7.47
E Colorado 8.80 14.42 14.42 2.47 2.47 2.47E Idaho 1.94 1.94 1.94 0.00 0.00 0.00E Montana 5.16 12.76 12.76 5.81 5.81 5.81E New Mexico 2.70 2.70 2.70 0.00 0.00 0.00E Oregon 7.10 7.10 7.10 0.00 0.00 0.00E Utah 1.64 1.64 1.64 0.00 0.00 0.00E Washington 1.52 1.52 1.52 0.00 0.00 0.00E Wyoming 8.02 10.68 10.68 6.49 6.49 6.49
F Minnesota 22.27 22.27 35.77 6.10 6.10 6.10F Montana 7.14 7.14 7.14 5.81 5.81 5.81F North Dakota 15.63 15.63 15.63 5.42 5.42 5.42F South Dakota 13.47 13.47 13.47 14.76 14.76 14.76
G Colorado 4.51 4.51 4.51 2.14 2.14 2.14G Montana 2.52 2.52 2.52 3.38 3.38 3.38G Nebraska 6.89 6.89 6.89 8.75 8.75 8.75G New Mexico 11.20 11.20 11.20 0.00 0.00 0.00G South Dakota 5.78 5.78 5.78 14.22 14.22 14.22G Wyoming 6.32 6.32 6.32 7.47 7.47 7.47
H Colorado 17.32 40.86 40.86 7.39 7.39 7.39H Kansas 14.91 45.27 45.27 12.83 12.83 12.83H Nebraska 16.48 36.40 36.40 20.43 20.43 20.43H New Mexico 54.61 59.52 59.52 0.00 0.00 0.00H Oklahoma 28.65 28.65 30.68 50.57 63.68 63.68H Texas 40.48 40.48 44.72 53.88 83.47 83.47
I Texas 20.59 42.65 47.87 43.88 73.47 83.47
J Kansas 24.35 52.96 62.92 66.03 78.58 95.15J Oklahoma 19.24 19.40 30.55 50.47 62.84 82.41J Texas 22.31 28.89 51.30 58.10 82.70 111.02
K Illinois 51.66 64.18 64.18 31.37 42.86 93.38K Michigan 37.15 48.33 48.33 83.08 116.61 163.18K Minnesota 55.35 73.80 73.80 38.81 58.02 132.15K Wisconsin 47.90 47.90 47.90 36.83 51.22 129.88
L Indiana 45.22 45.22 45.22 46.63 67.39 301.36L Michigan 37.15 37.15 37.15 83.08 116.61 206.03L New York 36.87 36.87 36.87 59.89 87.36 165.68L Ohio 31.19 31.19 31.19 84.79 108.63 321.79L Wisconsin 35.70 35.70 37.63 42.68 57.07 152.40
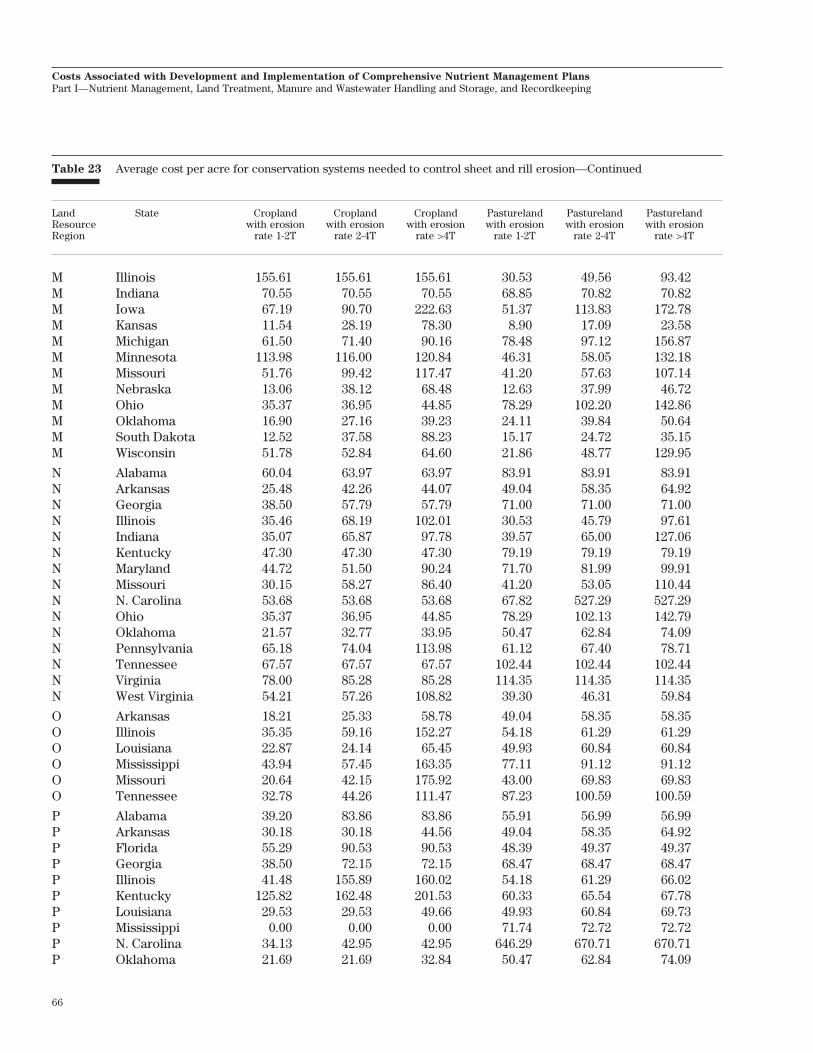
66
Costs Associated with Development and Implementation of Comprehensive Nutrient Management Plans
Part I—Nutrient Management, Land Treatment, Manure and Wastewater Handling and Storage, and Recordkeeping
Table 23 Average cost per acre for conservation systems needed to control sheet and rill erosion—Continued
Land State Cropland Cropland Cropland Pastureland Pastureland PasturelandResource with erosion with erosion with erosion with erosion with erosion with erosionRegion rate 1-2T rate 2-4T rate >4T rate 1-2T rate 2-4T rate >4T
M Illinois 155.61 155.61 155.61 30.53 49.56 93.42M Indiana 70.55 70.55 70.55 68.85 70.82 70.82M Iowa 67.19 90.70 222.63 51.37 113.83 172.78M Kansas 11.54 28.19 78.30 8.90 17.09 23.58M Michigan 61.50 71.40 90.16 78.48 97.12 156.87M Minnesota 113.98 116.00 120.84 46.31 58.05 132.18M Missouri 51.76 99.42 117.47 41.20 57.63 107.14M Nebraska 13.06 38.12 68.48 12.63 37.99 46.72M Ohio 35.37 36.95 44.85 78.29 102.20 142.86M Oklahoma 16.90 27.16 39.23 24.11 39.84 50.64M South Dakota 12.52 37.58 88.23 15.17 24.72 35.15M Wisconsin 51.78 52.84 64.60 21.86 48.77 129.95
N Alabama 60.04 63.97 63.97 83.91 83.91 83.91N Arkansas 25.48 42.26 44.07 49.04 58.35 64.92N Georgia 38.50 57.79 57.79 71.00 71.00 71.00N Illinois 35.46 68.19 102.01 30.53 45.79 97.61N Indiana 35.07 65.87 97.78 39.57 65.00 127.06N Kentucky 47.30 47.30 47.30 79.19 79.19 79.19N Maryland 44.72 51.50 90.24 71.70 81.99 99.91N Missouri 30.15 58.27 86.40 41.20 53.05 110.44N N. Carolina 53.68 53.68 53.68 67.82 527.29 527.29N Ohio 35.37 36.95 44.85 78.29 102.13 142.79N Oklahoma 21.57 32.77 33.95 50.47 62.84 74.09N Pennsylvania 65.18 74.04 113.98 61.12 67.40 78.71N Tennessee 67.57 67.57 67.57 102.44 102.44 102.44N Virginia 78.00 85.28 85.28 114.35 114.35 114.35N West Virginia 54.21 57.26 108.82 39.30 46.31 59.84
O Arkansas 18.21 25.33 58.78 49.04 58.35 58.35O Illinois 35.35 59.16 152.27 54.18 61.29 61.29O Louisiana 22.87 24.14 65.45 49.93 60.84 60.84O Mississippi 43.94 57.45 163.35 77.11 91.12 91.12O Missouri 20.64 42.15 175.92 43.00 69.83 69.83O Tennessee 32.78 44.26 111.47 87.23 100.59 100.59
P Alabama 39.20 83.86 83.86 55.91 56.99 56.99P Arkansas 30.18 30.18 44.56 49.04 58.35 64.92P Florida 55.29 90.53 90.53 48.39 49.37 49.37P Georgia 38.50 72.15 72.15 68.47 68.47 68.47P Illinois 41.48 155.89 160.02 54.18 61.29 66.02P Kentucky 125.82 162.48 201.53 60.33 65.54 67.78P Louisiana 29.53 29.53 49.66 49.93 60.84 69.73P Mississippi 0.00 0.00 0.00 71.74 72.72 72.72P N. Carolina 34.13 42.95 42.95 646.29 670.71 670.71P Oklahoma 21.69 21.69 32.84 50.47 62.84 74.09

67
Costs Associated with Development and Implementation of Comprehensive Nutrient Management Plans
Part I—Nutrient Management, Land Treatment, Manure and Wastewater Handling and Storage, and Recordkeeping
Table 23 Average cost per acre for conservation systems needed to control sheet and rill erosion—Continued
Land State Cropland Cropland Cropland Pastureland Pastureland PasturelandResource with erosion with erosion with erosion with erosion with erosion with erosionRegion rate 1-2T rate 2-4T rate >4T rate 1-2T rate 2-4T rate >4T
P S. Carolina 167.16 212.98 261.23 79.19 102.74 104.68P Tennessee 108.49 138.32 170.07 94.99 100.51 102.44P Texas 31.45 35.56 57.05 58.10 82.70 99.84P Virginia 48.45 64.10 64.10 93.20 121.03 121.03
R Connecticut 80.93 220.51 306.73 147.33 370.40 473.12R Maine 84.50 228.46 288.92 162.74 424.21 521.57R Massachusetts 75.84 257.79 401.50 99.65 371.91 470.48R N. Hampshire 89.40 396.49 407.16 164.97 641.82 834.19R New Jersey 75.50 226.57 280.64 145.86 391.17 496.91R New York 59.36 183.01 215.80 114.33 284.41 366.04R Ohio 55.37 258.25 417.77 276.13 653.21 887.11R Pennsylvania 85.95 188.83 316.70 149.43 300.74 345.54R Rhode Island 89.47 245.08 307.54 346.78 638.14 774.89R Vermont 66.73 182.51 243.06 157.20 374.21 491.73
S Delaware 75.32 162.63 162.63 106.50 209.57 237.28S Maryland 76.92 135.37 135.37 138.73 244.22 273.12S Massachusetts 89.16 205.58 205.58 264.51 288.27 288.27S New Jersey 77.06 143.27 143.27 78.87 142.46 159.02S New York 62.19 173.46 173.46 122.12 131.40 131.40S Pennsylvania 86.50 226.21 226.21 78.87 142.46 159.02S Virginia 70.79 135.27 135.27 129.64 407.31 487.96S West Virginia 68.88 164.96 164.96 59.99 100.67 111.92
T Delaware 60.90 90.11 142.49 57.48 116.25 116.25T Florida 58.85 58.85 58.85 52.49 75.31 75.31T Georgia 38.50 57.79 57.79 69.74 69.74 69.74T Louisiana 22.87 24.14 65.45 60.84 60.84 60.84T Maryland 58.02 92.33 154.17 54.35 138.59 138.59T Mississippi 37.99 37.99 37.99 79.19 102.74 102.74T N. Carolina 60.43 60.43 60.43 50.55 74.97 74.97T New Jersey 73.62 127.80 237.64 53.25 53.25 53.25T S. Carolina 48.79 48.79 48.79 79.19 102.74 102.74T Texas 14.00 22.23 74.68 0.00 82.70 82.70T Virginia 49.53 49.53 49.53 93.20 117.89 117.89
U Florida 54.16 54.16 54.16 46.96 46.96 46.96
V Hawaii 24.16 24.16 24.16 0.00 0.00 0.00
W Alaska 24.16 24.16 24.16 0.00 0.00 0.00
Note: A zero cost was used for some states where there were very few pastureland acres with manure applied and with erosion rates above T.

68
Costs Associated with Development and Implementation of Comprehensive Nutrient Management Plans
Part I—Nutrient Management, Land Treatment, Manure and Wastewater Handling and Storage, and Recordkeeping
Summary of land treatment costs
Land treatment costs were estimated by multiplyingthe number of acres expected to need erosion controltimes the per-acre cost for the conservation systemsrequired. An adjustment factor was applied to thenumber of manured acres in each erosion category toaccount for erosion control practices that have beenimplemented since 1997. It was judged that about 10percent of the acres with erosion rates above T havehad conservation systems installed or adopted since1997.
The annual average cost for the land treatment ele-ment of a CNMP was estimated to be $1,721 per farm(table 24). Costs ranged from an average of $1,267 for
small farms to $3,925 for large farms. The highestaverage cost was for swine farms ($3,615 per farm)because most swine are produced in the Midwest andthe East where most of the acres with sheet and rillerosion occur. Land treatment costs were highest inthe Northeast region where the average cost was$4,465 per farm (table 25). Average cost exceeded thenational average in the Appalachian and Corn Beltregions. The lowest land treatment costs were in thePacific ($67 per farm) and Mountain regions ($77 perfarm).
Overall, annual land treatment costs totaled $443million. Costs in the Northeast and the Corn Beltregions comprised over two-thirds of this total cost.
Table 24 Annual land treatment costs per farm, by livestock type and farm size
Dominant livestock type or farm size class Number Land Land Total landof farms treatment treatment treatment
costs on costs on costscropland pastureland
Fattened cattle 10,159 2,586 27 2,613
Milk cows 79,318 2,606 54 2,660
Swine 32,955 3,576 39 3,615
Turkeys 3,213 2,407 985 3,391
Broilers 16,251 826 393 1,220
Layers/Pullets 5,326 1,429 256 1,685
Confined heifers/veal 4,011 2,026 0 2,026
Small farms with confined livestock types 42,565 336 15 351
Pastured livestock types 61,272 344 13 357
Specialty livestock types 2,131 390 244 634
Large 19,746 3,565 359 3,925
Medium 39,437 2,749 147 2,897
Small 198,018 1,238 29 1,267
All CNMP farms 257,201 1,648 73 1,721

69
Costs Associated with Development and Implementation of Comprehensive Nutrient Management Plans
Part I—Nutrient Management, Land Treatment, Manure and Wastewater Handling and Storage, and Recordkeeping
Table 25 Annual land treatment costs per farm, by farm production region
Farm production region Number Land Land Total landof farms treatment treatment treatment
costs on costs on costscropland pastureland
Appalachian 22,899 1,582 572 2,154
Corn Belt 71,540 2,286 26 2,312
Delta States 12,352 175 128 302
Lake States 52,817 983 6 990
Mountain 7,964 68 9 77
Northeast 31,598 4,447 18 4,465
Northern Plains 26,309 392 3 395
Pacific 7,974 58 10 67
Southeast 12,807 1,181 42 1,223
Southern Plains 10,941 283 51 334
All CNMP farms 257,201 1,648 73 1,721

70
Costs Associated with Development and Implementation of Comprehensive Nutrient Management Plans
Part I—Nutrient Management, Land Treatment, Manure and Wastewater Handling and Storage, and Recordkeeping
Manure and wastewaterhandling and storage costs
Manure and wastewater storage and handling includescomponents and activities associated with the produc-tion facility, feedlot, manure and wastewater storageand treatment structures and areas, and any areas ormechanisms used to facilitate transfer of manure andwastewater. For most CNMPs, addressing this elementrequires a combination of conservation practices,management activities, and facility upgrades designedto meet the production needs of the livestock opera-tion while addressing environmental concerns specificto each operation. Manure and wastewater storage andhandling needs are highly specific to the condition andlocation of each facility, and differ from farm to farm.
This study adopts a generalized approach to estimat-ing needs and costs for this element by identifyingmajor cost items and making broad assumptions aboutCNMP needs. There are many types of CNMP-relatedcosts on specific farms, and it is impractical to simu-late the full array of potential cost items. This analysisfocuses on the needs and costs that generally wouldbe representative of the industry. Needs and costswere identified so that they would reasonably repre-sent alternatives. For example, composting was se-lected as the basis for estimating the costs of manag-ing mortality on poultry and swine farms. There areacceptable alternatives to composting, but the costsgenerally are about the same. The needs and costsassigned to a specific farm in the model simulationmay differ from those that would be identified for aspecific farm in an actual CNMP. However, it is ex-pected that the overall estimates derived from themodel simulation will be representative of the totalCNMP costs for this element.
The analytical framework used to derive CNMP needsand costs for the manure and wastewater handling andstorage element is based on the model farms describedpreviously (see tables 2–5). Components of the ma-nure and wastewater storage and handling elementwere identified for each model farm. Not every modelfarm has every component. The objective was todefine adequate components to meet the criteriaestablished in the NRCS CNMP Technical Guidanceand applicable NRCS conservation practice standards.
The team was guided by the NRCS Agricultural WasteManagement Field Handbook (AWMFH) (NRCS, 1992).The appropriate components of a typical manuremanagement system for each model farm were basedon chapter 9 of the AWMFH. Major cost items formanure and wastewater storage and handling arebroken down into the following components:
• Mortality management (poultry and swine)• Lot upgrades• Clean water diversions (including roof runoff
management, earthen berms, and grassed water-ways)
• Liquid treatment (small dairies)• Collection and transfer (including solids, liquid,
contaminated runoff, and pumping)• Settling basins• Solids storage• Liquid storage• Slurry storage• Runoff storage ponds
In all but one case, it was assumed that farms wouldnot switch from one production system to another(i.e., switch from one representative farm to another)because of implementing a CNMP. An exception wasmade, however, for large dairies in the Dairy Belt thatreported a solids-based manure handling system in thefarmer surveys. The team felt that these large dairieswould find it too labor intensive to continue to handlemanure as a solid and meet CNMP criteria, and wouldconvert to a liquid system with a waste storage pond.
Cost estimates for conservation practices for pasturedlivestock are included in the manure and wastewaterhandling and storage element. Components for farmswith pastured livestock types include:
• Fencing• Water well• Watering facility• Heavy use area protection• Windbreak or shelter break establishment• Solids storage• Filter strip
Manure and wastewater handling and storage costswere estimated for the system associated with thedominant livestock type on each farm. Many of thesefarms, however, have other confined livestock typeson the farm. The assumption was made that costsassociated with addressing CNMP needs for the sec-ondary livestock types on the farm, for the most part,
71
Costs Associated with Development and Implementation of Comprehensive Nutrient Management Plans
Part I—Nutrient Management, Land Treatment, Manure and Wastewater Handling and Storage, and Recordkeeping
could be incorporated into the system costs for thedominant livestock type. Any additional costs wereassumed minor and were not estimated. For severalcomponents, however, costs were based on theamount of recoverable manure produced on the farm(handling and transport weight), which includedrecoverable manure from all livestock types on thefarm. (See appendix B for details on the calculation ofrecoverable manure and the amount for handling andtransport.)
CNMP costs for the manure and wastewater storageand handling element were estimated for each farm.Costs were defined on a per-animal or per-animal-unitbasis wherever possible so that the final cost estimatewould more closely represent the existing productioncapacity of each individual operation. For poultry,costs were estimated on a per-house basis. For thispurpose it was assumed a broiler house would hold25,000 birds, a layer or pullet house would hold 50,000birds, and a turkey house would hold 5,000 birds forslaughter or 8,000 birds for breeding.
To obtain estimates of CNMP-related costs for manureand wastewater handling and storage components,information is needed on per-unit costs and on CNMPneeds for each component. Most per-unit cost esti-mates were based on literature values or values takenfrom the NRCS Field Office Technical Guide.
However, no data are available on CNMP needs forthis element, nor can CNMP needs be derived fromother databases, as was done for nutrient managementcosts, land treatment costs, and off-farm export costs.CNMP needs for manure and wastewater handling andstorage components were estimated by a team ofexperts using a consensus approach to approximatewhat the needs might be. The team of experts con-sisted of agricultural engineers, environmental engi-neers, economists, and agronomists with extensiveexperience working with livestock producers andgovernment technical assistance programs. Teammembers also consulted with other experts who hadknowledge about specific industries or areas of thecountry.
To simplify the process of estimating CNMP needs forthis element, three groups of "virtual" farms wereestablished: the 25 percent of farms with the lowestneeds, the 25 percent of farms with the highest needs,and the 50 percent of farms with average needs. For
each of the three groups, the percentage of farmsneeding upgrades was estimated by the team. The finalestimate of CNMP needs for each component was thenobtained as a weighted total. CNMP needs were esti-mated as percentages that can be interpreted in twoways:
• The percentage of the total cost that the averagefarm would incur in upgrading facilities to meetCNMP guidelines.
• The percentage of farms in a group that wouldneed to add a component, incurring the full cost.
These two interpretations of the needs percentagesare analytically equivalent. However, one of these twointerpretations may be more appropriate than theother for specific components.
Separate cost estimates were made for capital expen-ditures (equipment and structures), operating costs,and maintenance costs. All costs are presented asannual costs. Capital costs are converted to annualcosts by amortizing the total cost over 10 years withan 8 percent interest rate. Operating costs are largelylabor costs, but also include fuel and other costswhere appropriate. The standard wage rate used forlabor was $10 per hour. Maintenance costs wereestimated as 3 percent of the capital costs.
Specific estimates of CNMP needs and costs for eachcomponent were made for farms with more than 35AU of confined livestock types. Farms with less than35 AU where confined livestock types were dominant(42,565 farms) were judged to be too diverse withrespect to the type of production technologies em-ployed in producing livestock to apply the standard setof representative farms. Small farms tend to use smalllots and pastured environments to a greater extentthan the larger farms for which the set of representa-tive farms were derived. Furthermore, CNMPs forthese smaller farms would most likely address only asubset of the components that would be addressed forlarger farms, focusing on situations and practicesassociated with environmental impacts. (Pasturedlivestock farms with less than 35 AU were not explic-itly excluded, but few were included in the set offarms that may need a CNMP because of the smallquantities of recoverable manure produced.)
Manure and wastewater handling and storage costs forfarms with less than 35 AU of confined livestock types(and where pastured livestock were not dominant)

72
Costs Associated with Development and Implementation of Comprehensive Nutrient Management Plans
Part I—Nutrient Management, Land Treatment, Manure and Wastewater Handling and Storage, and Recordkeeping
were estimated based on costs derived for smalldairies. (Most of these farms either had milk cows orswine as the dominant livestock type. See appendix A,table A–5.) Operating costs per AU were estimatedusing the average capital cost for dairies with 35 to 60AU. Capital costs per AU were estimated as 50 percentof the average capital cost for dairies with 35 to 60 AU.The total manure and wastewater handling and stor-age costs for these small farms were obtained bymultiplying the per-AU costs times the number of AUfor confined livestock types on the farm.
A description of each component and how the costswere derived follows. The per-unit costs and assump-tions of CNMP needs derived by the team of expertsfor each model farm are summarized in appendix E.The overall cost estimates for manure and wastewaterhandling and storage are presented in the last part ofthis section.
Mortality management
The cost of mortality management is included for allpoultry and swine farms. For dairy and fattened cattle,it was assumed that existing mortality managementpractices would be adequate in most cases. Variousacceptable methods are used to manage poultry andswine mortality, such as composting, incineration,burial pits, and freezing. Composting was selected asthe representative technology for assessing CNMPcosts.
Poultry
The cost of mortality management for poultry wasdetermined on a per-house basis. A concrete slabcovered with a timber structure comprised thecomposting facility. Capital and operating costs of thestructure were based on costs reported by the NorthCarolina Cooperative Extension (1999) for a 100,000-bird broiler flock. The cost of the timber structure andconcrete floor was $3,600, and the cost of water ser-vice for the facility was $150, resulting in an annualcapital cost of $559. Operating costs included labor(27.5 hours per flock at $10 per hour) and machineryrental ($20 per hour at 51 hours per year), for a total of$2,533 per year. For the 25,000-bird broiler house usedas the standard house size in this study, annual costswere $140 for capital and $633 for operating costs.
Costs for the other poultry livestock types were esti-mated by prorating the cost for broilers based oncapacity needed for the other poultry types. The ca-pacity needed was estimated using a method pub-lished by the North Carolina Cooperative Extension(1996). Maximum capacity was estimated by multiply-ing the expected daily death rate by the market weight(maximum weight), and then multiplying by the num-ber of birds per house. Although mortality takes placethroughout the production cycle with birds at variousweights, for most operations the majority of the massthat must be dealt with occurs near the end of theproduction cycle when birds are closest to their mar-ket weight. To ensure adequate composter space,capacity needed is based on the greatest demand inorder to handle the larger bird mortality. Calculationsare shown in the chart that follows:
Poultry type Birds Market Mortal- Mortal- Ann. Ann.per house weight ity ity capital oper-
(lb/bird) rate rate cost ating(%) (lb/d) per cost
house per($) house
($)
Broilers 25,000 4.5 0.1 113 140 633
Layers & pullets 50,000 4.0 0.033 66 82 371
Turkeys 5,000 19.2 0.080 77 96 433for slaughter
Turkeys 8,000 18.8 0.100 150 187 846for breeding
CNMP needs for mortality management for poultrywere judged to be lower for the larger operations andhigher for turkey operations. CNMP needs were as-signed as follows:
• 45 percent for broiler and pullet farms with lessthan 220 AU
• 15 percent for broiler and pullet farms with morethan 220 AU
• 45 percent for layer farms with less than 400 AU• 15 percent for layer farms with more than 400 AU• 60 percent for turkey farms with less than 220
AU• 30 percent for turkey farms with more than 220
AU

73
Costs Associated with Development and Implementation of Comprehensive Nutrient Management Plans
Part I—Nutrient Management, Land Treatment, Manure and Wastewater Handling and Storage, and Recordkeeping
Swine
Estimates of mortality management costs for swinewere based on a composting facility consisting of aconcrete pad with walls constructed of large roundbales and covered with a tarp, and a fence to keepanimals out. Included in the system are a carcasscutter and grinder. (Costs for this system are de-scribed by Ken Foster in Cost Analysis of Swine
Mortality Composting, Purdue University.)
The annual cost of the cutter and grinder is $1,248,which would need to be incurred only once per opera-tion regardless of the size of the operation. Othercapital costs (concrete slab, fence, tarp, bales) werereported by Foster for a farrow-to-finish operationwith a maximum capacity of about 250 animal units tobe $549 per year. Annual operating costs (labor, saw-dust, fuel, and utilities) for this system were reportedto be $350 per year. On an animal unit basis, thesecosts convert to $2.20 per animal unit for the addi-tional capital costs and $1.40 per animal unit for oper-ating costs.
Because swine operations have only recently begun toaddress mortality management practices as an integralpart of their operation, CNMP needs were set at 70percent for all sizes and types of swine operations.
Feedlot upgrades
The cost of feedlot upgrades was applied only to cattleon feed (fattened cattle and confined heifers) andconsists of improving the open lot area where cattleare held to ensure the proper functioning of collectionsystems. It includes grading to enhance drainage and aconcrete pad to protect drainage collection and diver-sion areas during manure collection activities. (Theselot upgrades exclude the costs of berm constructionfor diverting contaminated water into the storagepond, which are costed separately.)
A 750-head fattened cattle operation was used as abasis for deriving representative costs for this compo-nent. Costs were estimated assuming installation of111 cubic yards of concrete (6,000 square feet) at $200per cubic yard, and 1,700 cubic yards of earthmovingand shaping at $2.00 per cubic yard. (These costs weretaken from the Iowa State Beef Feedlot SystemManual—PM 1867, January 2001.) The total capital
cost is thus $25,600 per 750-head operation, or $34 perhead. The amortized annual cost is $5.09 per head.
Most operations typically have addressed this compo-nent as a part of their existing management systems,so needs were judged to be comparatively low, asfollows:
• 15 percent for fattened cattle farms with a scrapeand stack operation
• 30 percent for confined heifer farms with ascrape and stack operation
• 30 percent for the smaller fattened cattle farmswith manure pack
• 5 percent for the larger fattened cattle farms withmanure pack
Clean water diversions
Clean water diversions are used to minimize theamount of rainfall runoff that can come in contact withareas of the animal production operation where ma-nure and wastewater are present, primarily the openlot areas. The types of clean water diversions used inthis study were roof runoff management, earthenberms with a surface outlet, earthen berms with under-ground pipe outlets, and grassed waterways. Becausediversions were only essential for operations with anopen lot, clean water diversions were not applied tooperations that only confined animals in buildings.
Roof runoff management
Gutters and downspouts were used to capture rainfallon the roofs of buildings to route the water from theproduction area. This kind of clean water diversionwas applied to dairy, turkey, and swine operations thatprovided outside access to animals. Fattened cattleoperations were not included because typically theseanimals are raised in a feedlot without any buildings orstructures within the confinement area.
The per-unit costs used were taken from the NRCSField Office Technical Guide, Section 1, Annual CostList. The installation cost for a standard gutter anddownspout used in most areas of the United States is$2.25 per foot. In areas of higher rainfall, such as theSoutheast, a larger gutter is needed at a cost of $4.50per foot. Since downspouts are often damaged byanimals and machinery, repairs and maintenancewere assumed to be an additional 7 percent of the

74
Costs Associated with Development and Implementation of Comprehensive Nutrient Management Plans
Part I—Nutrient Management, Land Treatment, Manure and Wastewater Handling and Storage, and Recordkeeping
installation cost. (This 7 percent is in addition to themaintenance costs estimated as 3 percent of all capitalcosts, bringing the total percentage for maintenancecost for this component to 10 percent.) The estimatedquantities of gutters and downspouts used per typeand location of facility were based on average buildingsize and typical building capacities. Dairy costs werebased on 200 feet of gutters and 40 feet of downspoutsfor a 100-cow dairy, and converted to a per-head basis.The annual capital cost for dairies, including mainte-nance and repair, was $2.37 per head in the Southeastand $1.18 per head for other regions. For turkeyranches, the annual capital cost was $473 per house,assuming 800 feet of gutter and 160 feet of down-spouts per house. For swine farms with buildings andoutside access, the annual capital cost was $0.85 peranimal unit, based on 200 feet of gutter and 40 feet ofdownspouts for a 140-AU operation.
Roof runoff management has been a neglected compo-nent on some systems, but is commonly present onother systems. Larger operations are expected to havefewer needs than smaller operations. CNMP needswere assigned as follows:
• 30 percent for swine farms with buildings andoutside access
• 90 percent for turkey ranches• 80 percent for Dairy Belt dairies #1 and #2 (solids
systems) with up to 270 AU• 45 percent for Dairy Belt dairies #1 and #2 with
more than 270 AU• 40 percent for all other dairies
Earthen berms with underground pipe outlets
This type of clean water diversion was used for fat-tened cattle operations with a manure pack method ofmanaging waste as well as for all dairy operations.These operations generally take advantage of the reliefof the land to provide drainage within the lot. Often,these operations have dry or intermittent streams(swales) that run through the feedlot areas. To controlclean water upgradient of the lot, a small earthen bermis installed across the swale above the feedlot or lot tocatch the clean runoff and then outlet the waterthrough an underground pipe to some point down-stream of the feedlot area.
The cost of installing the earthen berm associated withthis system addressed the cost of hauling and shapingactivities. The berm used for this type of system isconsiderably shorter than those for other diversion
practices because its only function is to create atemporary pool that will drain out through the under-ground pipe. Although the berm length is considerablyshorter than the other berms described in this section,it is usually higher to create sufficient hydraulic pres-sure to discharge through a long pipeline. The as-sumed dimensions of the berm were based on a trap-ezoidal shape with an 8-foot top width, 3 horizontal to1 vertical side slopes, and 3 feet of average height (1.9cubic yards per foot of length) for a length of 30 feetper berm. The cost per cubic yard was $2 installed, or$115 per berm. The estimate for the underground out-let pipe was based on a 12-inch diameter corrugatedmetal pipe, and unit costs reflect the cost of pipe andinstallation activities, such as excavation, laying thepipe, and backfill. Lengths were estimated based onprofessional judgment of a typical distance through afeedlot based on a particular size of operation. Largeroperations could require more than one berm and pipeoutlet per feedlot. Per-unit costs were taken from theNRCS Field Office Technical Guide, Section 1, AnnualCost List. Cost estimates were developed for threedifferent-sized operations as follows.
Number Linear Pipe Number Berm Total Cost Annualof feet of cost of 30- cost cost per cost peranimals pipe per foot ($) installed animal animal
foot ($) berms ($) ($) ($)
75 200 12 1 115 2,515 34 5.07
150 360 12 1 115 4,435 30 4.47
600 1,200 12 3 345 14,745 25 3.58
Using these three cost estimates, the following ruleswere established for assigning costs to farms on a per-head basis:
• If the number of head is less than 100, then thecost per head is $5.07.
• If the number of head is between 100 and 300,then the cost per head is $4.47.
• If the number of head is more than 300, then thecost per head is $3.58.
Most of these operations already have this practice inplace or do not need it because of the characteristicsof the terrain near the facility. Some systems in someregions of the country, however, were judged to haverelatively high needs. CNMP needs were assigned asfollows:
• 20 percent for the smaller fattened cattle farms• 10 percent for the larger fattened cattle farms
75
Costs Associated with Development and Implementation of Comprehensive Nutrient Management Plans
Part I—Nutrient Management, Land Treatment, Manure and Wastewater Handling and Storage, and Recordkeeping
• 50 percent for dairy representative farm #1(Dairy Belt)
• 50 percent for dairy representative farm #2 inDairy Belt with <270 AU
• 30 percent for dairy representative farm #2 inDairy Belt with >270 AU
• 20 percent for dairy representative farm #2 inWest and Southeast
• 30 percent for dairy representative farm #3• 40 percent for dairy representative farm #4• 20 percent for dairy representative farm #5 in
Southeast and in West with <270 AU• 10 percent for dairy representative farm #5 in
West with >270 AU
Grassed waterways
Grassed waterways are shaped channels that areseeded to establish vegetation. They are used for cleanwater diversion in areas that receive sufficient annualrainfall that vegetation can be maintained naturallyand where the runoff-contributing watershed is rela-tively small. These waterways are more efficient thanan earthen berm because they can handle larger flowswithout concern of erosion. This is a typical practiceused east of the Mississippi River. This practice wasused to represent the clean water diversion treatmentneeds for fattened cattle operations and confinedheifer operations that utilize a stack and scrape ma-nure management system. Only 15 percent of theseoperations were assumed to need to install this prac-tice because of its common use.
All grassed waterways were assumed to be 30 feetwide. The length varies by the size of the operation.Per-unit costs were taken from the NRCS Field OfficeTechnical Guide, Section 1, Annual Cost List. The costof installing a grassed waterway involves grading andshaping the channel, which costs $115 per acre, andseeding, which costs $125 per acre. The total cost is$240 an acre or $36 per acre annually. Lengths wereestimated based on professional judgment of a typicaldistance to bypass a feedlot for two sizes of farms andthen converted to a per-head cost, as follows:
Number Linear Acres Total Annual Annualof feet of cost cost cost peranimals waterway installed ($) animal
($) ($)
150 1,200 0.83 199 30 0.20
600 1,800 1.24 298 44 0.08
The $0.20 cost per head was assigned to all operationswith less than 500 head, and the $0.08 cost per headwas assigned to operations with more than 500 head.
Earthen berms with surface outlet
Earthen berms with a surface outlet are shapedmounds of uniform cross section made of soil to serveas an intercept upslope of an open lot to divert cleanwater around the lot to a stable natural outlet. Thisclean water diversion practice was used only on tur-key and swine operations that have an open lot as partof the production area. Per-unit costs were taken fromthe NRCS Field Office Technical Guide, Section 1,Annual Cost List.
All open lots were assumed to have a diversion alongtwo sides. Installation involved primarily earth haulingand shaping activities. The assumed dimensions of theberm were based on a trapezoidal shape with an 8-foottop width, 3 horizontal to 1 vertical side slopes, and 2feet of height for a running volume of 1 cubic yard ofdiversion per foot of length. The cost per linear footwas $2.00 installed.
For a swine operation with open lot access and 900animals (100 animal units), typically 460 square feet ofloafing area is provided per animal unit, or 46,000square feet. Assuming a square lot, the dimension of aside would be 214 feet. Assuming the diversion wouldbe wrapped around two sides, the total length wouldbe 428 feet for a total cost of $856. The amortizedannual cost would be $128 per year or $1.28 per animalunit per year. CNMP needs for these operations werejudged to be 20 percent for swine representative farm#4 (building with outside access) and 50 percent forswine farm #5 (pasture or lot).
A typical turkey operation would raise approximately5,000 birds per house. One house is equivalent to 75animal units. Assuming the lot area provided 460square feet per animal unit (the same as the propor-tional area per animal unit provided for swine) thearea of a turkey lot would be 34,500 square feet, or alot with sides measuring 185 feet. The total length ofthe berm would be 370 feet and would cost $740. Theamortized annual cost would be $111 per year perhouse. CNMP needs were judged to be 40 percent forturkey ranches.

76
Costs Associated with Development and Implementation of Comprehensive Nutrient Management Plans
Part I—Nutrient Management, Land Treatment, Manure and Wastewater Handling and Storage, and Recordkeeping
Liquid treatment
Small dairy operations that remove solids daily orweekly would continue to handle their manure as asolid and use a liquid treatment approach to handle theliquid component. Generally, cows on these operationsare kept on pasture most of the day. However, they arebrought in to be milked, and as a result spend sometime in an open lot. During storms, runoff from theopen lot would contain manure and related wastes, butthis would normally be a small volume. Milk-housewashings would also generate small amounts of waste-water. For these operations it was assumed that therunoff and milk-house washings could be handled witha biofilter. A biofilter is a small, vegetated area thatfunctions similar to a wetland by capturing the runoffand bioprocessing it through infiltration of nutrientsinto the soil for use by the vegetation. Use of a biofilterfor liquid treatment precludes the need for collection,transfer, or storage of liquid wastes on these farms.
For the purposes of this simulation, the biofilter wasassumed to be a vegetated filter strip of 12,000 squarefeet, at $0.25 per square foot for a cost of $3,000. Theconstruction of the filter would be accomplished byland grading equipment. Based on an average sizeoperation of 75 milk cows, the capital cost is $6.00 percow annually.
A liquid treatment component was included for dairyrepresentative farms #1 and #2 with less than 135 AUper farm. CNMP needs were judged to be high for thiscomponent; 65 percent for farm #1 and 75 percent forfarm #2.
Collection and transfer
The collection and transfer component addresses theinstallation and operation of practices associated withhandling the manure and wastewater within the pro-duction area. The type of collection used depends onthe type of animal feeding operation, consistency ofthe manure handled, and the type of managementsystem used. Management systems for animals raisedin buildings address a single manure consistency,either a liquid/slurry or a solid. Operations that useopen lots generally need to address both solids andliquids because manure and contaminated runoff aregenerally handled separately.
CNMP costs were determined for three types of collec-tion systems: solids collection, liquid collection withflush systems, and contaminated runoff collection. Forthe last two types of collection systems, a liquid pump-ing system is needed to transfer the wastewater to astorage structure and/or from the storage structure toland application equipment. For solids, manure istransferred to a solids storage facility during collec-tion.
Almost all model farms include either a collection or atransfer component, or both. Representative farmsthat predominantly handle manure as a slurry, how-ever, have storage pits either under the building oradjacent to the housing facility, requiring only rinsingto collect the manure. For these representative farms,it was assumed that the collection structures would beadequate and that only a transfer component may beneeded. These farms include veal, swine representa-tive farms #2 and #3, dairy representative farms #1 and#2 with more than 135 AU, and dairy representativefarm #3. Dairy representative farms #1 and #2 with lessthan 135 AU have a liquid treatment component (filterstrip for milk-house washings) and so would not needa collection or transfer component.
Solids collection
Solids collection is a component for all operationsexcept for swine and dairy farms with complete liquidor slurry systems, layer farms with liquid systems, andveal farms. Generally, most operations have an ad-equate collection system already in place, so CNMPneeds are expected to be low. CNMP needs werejudged to be 10 percent for all but the cases listedbelow:
• 2 percent for broiler farms• 15 percent for turkey farms (representative
farms #1 and #2)
Solids collection for dairy, fattened cattle, confinedheifers, and for swine raised in a building with outsideaccess or in a pasture or lot was assumed to consist ofa tractor scraper used to collect and pile the manureon a concrete slab. Costs are based on the amount ofmanure to be handled, which is estimated in appendixB. The scrape operation costs are based on a 37-hptractor with scraper at a purchase price of $22,000.Assuming this equipment is dedicated 80 percent tothis function, the annual cost is $3,591. Conventionalguidelines for estimating annual operating costs—fuel,oil, and labor—for equipment used on an intermittent

77
Costs Associated with Development and Implementation of Comprehensive Nutrient Management Plans
Part I—Nutrient Management, Land Treatment, Manure and Wastewater Handling and Storage, and Recordkeeping
basis, as in this case, is 15 percent of the purchaseprice (Tilmon and German, 1997). Thus, the annualoperating costs were estimated to be $3,300 per year.The cost per ton was determined for a 150-head dairyoperation, which was then used for all dairy, fattenedcattle, confined heifer, and swine farms that had asolids collection component. A 150-head dairy opera-tion has about 200 animal units and produces about580 tons of manure at transport and handling weight(assuming about 2.2 tons of manure as excreted atoven-dry weight, converting to a handling weight bymultiplying by 2, and adjusting for recoverability witha 0.65 recovery factor). Thus, capital costs are $6.20per ton of solids and operating costs are $5.70 per ton.
The cost of solids collection for broilers, pullets,turkeys, and layers with a high-rise or shallow pitproduction system that raise poultry in confinementbuildings was based on the assumption that the build-ings are partly cleaned out after each flock and com-pletely cleaned out once per year. A custom rate wasused, and since most of the cost is labor, it was catego-rized as an operating cost, even though a portion of thecost covers the cost of the equipment. The custom rateused was determined based on several sources ofinformation obtained from University Extension Ser-vice and private industry sources. The rates variedfrom $0.02 to $0.07 per square foot depending on thesize of the house and regional location. However, thepredominant price range was from $0.04 to $0.065(including both annual cleanout and four to five cake-outs per year.) Averaging the costs from the sourcesconsidered provided a custom rate of $0.053 cents persquare foot of house. An average size broiler andturkey house is about 20,000 square feet, producing anannual cleanout cost estimate of $1,060 per house. Theaverage size of a layer or pullet house with a 50,000-bird capacity is about 24,000 square feet, producing anannual cleanout cost of $1,272 per house.
For layer operations that use a mechanical belt systeminstalled beneath the layer cages, manure falls directlyonto the belt, and periodically the belt empties itselfonto a stacking area. For layer operations that use ascraper type system, the litter produced is removedfrom the building by mechanical scrapers and depos-ited in a stacking area. Solids collection for these twotypes of operations was viewed as the activity to movethe litter deposited in the stacking areas at the ends ofbuildings to a central storage area or directly intotrucks for transport off-farm. Cost was based on
equipment rental rates for a 150-hp front-end loader (3yard bucket) at $15.08 per hour and an operator costof $10.00 per hour. Based on a weekly manure produc-tion of about 42 tons of litter per house (50,000 birds),the time needed to move the litter is approximately 1.5hours per week per house for 78 hours per year, or$1,956 per house annually.
Liquid collection with flush systems
The flush system is used commonly by dairy, swine,and layer operations that handle their wastes as aliquid. Waste is collected by the flushing of floor gut-ters within the barn to move waste and water to acollection tank, where it is transferred to a holdingpond or lagoon by gravity or a transfer pump. Existingflush operations are assumed to have most of thesystem in place. Therefore, systems would only needto be upgraded to be consistent with any modificationsin the storage and handling systems. Componentsassumed to be needed were a flush tank, collectiontank, transfer pipe, and a pit agitation pump. CNMPneeds were judged to be comparatively low for thefollowing representative farms with flush systems:
• 10 percent for swine representative farm #1(liquid system with lagoon or storage pond)
• 10 percent for layer representative farm #2 (flushto lagoon)
• 30 percent for dairy representative farm #4(liquid system with lagoon or storage pond) withless than 270 AU
• 40 percent for dairy representative farm #5(liquid system with lagoon or storage pond) withless than 270 AU
• 20 percent for dairy representative farm #4 or #5with more than 270 AU
Costs for three sizes of dairy farms were used as thebasis for flush cost systems. The base system for thesmallest operations included two collection tanks (10feet wide by 20 feet long and 8 feet deep); a transferpipe (50 feet of 100-lb/in2 PVC); and an agitation pump(PTO driven impeller). Costs for larger systems wouldaccount for the increased size needed to handle moreanimals. Operating costs cover fuel, oil, electricity, andpump maintenance. For these systems, the cost of thepipe used to transfer the waste to the field for applica-tion was treated as a hauling cost, and the cost ofpumping to the field for irrigation is covered under thepumping transfer system costs. The dairy liquid collec-tion costs are summarized in table 26.
78
Costs Associated with Development and Implementation of Comprehensive Nutrient Management Plans
Part I—Nutrient Management, Land Treatment, Manure and Wastewater Handling and Storage, and Recordkeeping
The costs shown in table 26 were applied to dairyrepresentative farms #4 and #5. Dairies with less than150 head were assigned a capital cost of $28.99 perhead. Dairies with 150 to 250 head were assigned acapital cost of $24.57 per head. Dairies with more than250 head were assigned a capital cost of $23.10 perhead. Operating costs for all size farms were $11.84per head.
The same components are also needed for swineoperations with liquid wastes (swine representativefarm #1) and layer farms with liquid wastes (layerrepresentative farm #2). The costs above were con-verted to an animal unit basis for these swine farmsand to a per-house basis for the layer farms. Theannual capital cost was $20.70 per AU for swine farmswith less than 200 animal units, $17.55 per AU forfarms with 200 to 400AU, $16.50 per AU for farms withmore than 400 AU, and annual operating costs were$8.46 per AU for all size groups. For layers, the annualcapital cost was $3,157 per house, and the annualoperating cost was $1,291 per house.
Contaminated runoff collection
Earthen berms are used to divert rainfall runoff thathas come in contact with manure in the productionarea to a storage pond. These contaminated waterdivisions would be located on the down-gradient endof the production area. The types of contaminatedwater diversions typically used are earthen berms witha surface outlet and earthen berms with pipe outlets.
Contaminated water diversions are necessary compo-nents for all fattened cattle and confined heifer repre-sentative farms as well as turkey ranches and swinefarms with a pasture or lot (swine farm #5). It wasassumed that lots on dairy farms and swine farms witha building and open access would be small enough thatcontaminated water diversions would not be neededor would be incorporated into the structure of therunoff storage pond.
Typically, turkey operations and swine raised in apasture or lot would use an earthen berm with a sur-face outlet that diverts the runoff to a small storagepond. The construction is similar to earthen bermswith surface outlets used for clean water diversion.Based on costs used for the clean water diversionberms presented previously, the annual capital costwould be $111 per house for turkey ranches and $1.28per animal unit for swine. CNMP needs were judged tobe comparatively high for these farms, as follows:
• 50 percent for swine representative farm #5• 90 percent for turkey ranches
Fattened cattle and confined heifer operations use asimilar system; however, they would generally outletthe captured contaminated runoff through a pipe into aholding pond. These types of operations generally takeadvantage of the relief of the land to provide drainagewithin the lot. On the downslope end of the lot, anearthen berm is constructed that channels all lotrainfall runoff to a pipe outlet that conveys the con-taminated runoff water to a holding pond or lagoon.
The cost of the earthen berm was calculated based onthe following assumptions: the shape was trapezoidalwith an 8-foot top width, the side slopes were 3 hori-zontal to 1 vertical, and the height was 2 feet. The unitcost of the berm is $2.00 per linear foot, taken fromthe NRCS Field Office Technical Guide, Section 1,Annual Cost List. The length of the berm was equal tothe downslope width of the lot. The following ap-proach was used to determine the length of berm: firstit was assumed that each animal unit was provided 460square feet of lot space, then the total lot size wascomputed by multiplying the number of animal unitsby 460, and then the square root of the area was takento represent the berm length. The outlet pipe wasassumed to be a 12-inch diameter corrugated metalpipe (CMP). The unit cost for pipe, $12 per foot, re-flects the cost of the pipe and installation activities,such as excavation, laying the pipe, and backfill. The
Table 26 Cost estimates for liquid collection with flushsystems for dairy farms
Cost component - - - - - - - - - - Operation - - - - - - - - - -100-head 200-head 300-head
($) ($) ($)
Flush tank 7,801 15,602 23,403
Collection tanks 5,721 11,442 17,163
Collection pipe 562 562 562
PTO impeller 5,367 5,367 5,367
Total capital cost 19,451 32,973 46,495
Annual capital cost 2,899 4,914 6,929
Annual operating cost 1,185 2,369 3,554
Annual capital cost/head 28.99 24.57 23.10
Annual operating cost/head 11.84 11.84 11.84

79
Costs Associated with Development and Implementation of Comprehensive Nutrient Management Plans
Part I—Nutrient Management, Land Treatment, Manure and Wastewater Handling and Storage, and Recordkeeping
length of pipe needed on any particular site variesdepending on the distance from the berm to the stor-age pond. To simulate this variation, it was assumedthe length of pipe was 20 percent of the length ofdiversion.
Three size categories were used for assigning costs tothe fattened cattle and heifer farms:
Size 1 Size 2 Size 3
Animal number (head) 116 308 616
Area of lot (ft2) 53,130 141,080 283,360
Length of berm (ft) 230 376 532
Cost of berm ($) 460 752 1,064
Cost of berm per head ($) 3.96 2.44 1.72
Linear feet of pipe 46 75 106
CMP cost per foot ($) 12 12 12
Cost of pipe installed 4.76 2.93 2.07per head ($)
Annual cost per head ($) 1.31 0.80 0.56
Using these three cost estimates, the following ruleswere established for assigning capital costs to farmson a per-head basis:
• If the number of head is less than 200 then thecost per head is $1.31.
• If the number of head is between 200 and 450then the cost per head is $0.80.
• If the number of head is more than 450 then thecost per head is $0.56.
It was judged that the majority of fattened cattle andconfined heifer operations would need contaminatedwater diversions. CNMP needs were assigned asfollows:
• 55 percent for confined heifer and fattened cattlefarms with a scrape and stack manure handlingsystem in the South and West
• 40 percent for confined heifer and fattened cattlefarms with a scrape and stack manure handlingsystem in the Midwest and the Northeast
• 60 percent of the smaller fattened cattle opera-tions with manure pack
• 50 percent of the larger fattened cattle opera-tions with manure pack
Pumping transfer system
All model farms that must handle waste or wastewaterin a liquid or slurry form will need to facilitate thetransfer of that liquid or slurry from the storage struc-ture (storage pit, holding pond, lagoon, or runoffstorage pond) to the appropriate conveyance for landapplication. Some operations will own a pump for thispurpose, but the smaller operations would likely rentthe equipment. Costs were therefore estimated on aper-ton basis using a standard rental rate. Severalrental rates were obtained from the literature. Rentalrates varied depending on the geographic location, butthe rates were all within about 15 percent of eachother. The average rate was $140 per 8-hour day, or$17.50 per hour. The pumping rate used in the landapplication section was 500 gallons per minute, whichconverts to about 1.5 tons per minute (267 gallons perton), or 90 tons per hour, after allowing for about 20percent down time for setup or for moving the pump.Thus, the capital cost of the pump would be about$0.20 per ton. Operating costs would be minimal,consisting primarily of fuel costs. An operating cost of$0.06 per ton was based on the cost of 3 gallons of fuel($1.65 per gallon) per hour.
These costs would be appropriate for operations thatuse irrigation systems to land apply the wastewater.However, for smaller operations that use a tank truckand sprayer to land apply wastes, additional downtime needs to be factored into the costs to account forthe multiple trips to the field needed to empty theliquid storage facility. During these trips, the operatorwould still pay a rental charge but the pump would beidle. In the section on nutrient management costs, weassumed that operations with less than 1,000 tons ofliquid wastes per year would use a tank truck andsprayer for land application. Assuming the pumpwould only be operated 40 percent of the time forthese smaller operations, the pumping rate would beabout 45 tons per hour and thus capital costs would be$0.40 per ton. Operating costs would remain the sameat $0.06 per ton.
CNMP needs for pumping transfer systems wereassumed to be the same as the needs for storage (i.e.,runoff storage pond, slurry storage, or liquid storageponds or lagoons).

80
Costs Associated with Development and Implementation of Comprehensive Nutrient Management Plans
Part I—Nutrient Management, Land Treatment, Manure and Wastewater Handling and Storage, and Recordkeeping
Storage of solid wastes
The part of the manure that can be handled as a solid,including bedding material, is collected from produc-tion areas and stored until it can be land applied. Toefficiently use manure nutrients to fertilize crops, thewindow of opportunity to land apply manure is limited.Therefore, an essential part of a CNMP is manurestorage facilities that have enough capacity to holdmanure until the proper time for land application.
Solids storage is included as a CNMP component fordairy representative farms #1 and #2, fattened cattleand confined heifer farms with a scrape and stacksystem for manure handling, swine representativefarm #4 (building with outside access), and for allpoultry except layer farms with a flush to lagoonsystem. Fattened cattle farms and dairy farms in theWest with a manure pack system do not need a sepa-rate solids storage component, since the manure packis the method of storage. Similarly, swine farm #5 doesnot need a storage component because the solids canbe collected from the lot or pasture at the time ofapplication.
Conservation practice standards used in CNMP devel-opment do not require a minimum period of storagebecause the storage requirements would vary depend-ing on the crop growing season, the crops beinggrown, climate, and type of management system inplace. These factors determine what the storage ca-pacity should be on a particular farm. For purposes ofthis assessment, however, general minimum storagecapacities were established so that cost estimatescould be made. Consistent with typical managementpractices used in the poultry industry, the storagecapacity is assumed to be 1 year of litter productionfor all poultry types. For other animal sectors thestorage period is generally less than 1 year because thesolids can be handled more frequently and the limitingperiod of storage would be dictated by availability ofcropland to receive the manure. For most of the coun-try, it was assumed that 180 days (50 percent of thestorage period for poultry) represented the typicallength of storage because it would allow storage ofmanure through the winter and wet months of theyear. Model farms in the Southeast, in most cases, canproduce some type of crop year around, so would notneed a 180-day storage capacity. In the Southeaststorage time was set at 90 days. (For this purpose, the
Southeast States are Texas, Louisiana, Mississippi,Alabama, Georgia, Florida, and South Carolina.)
Storage costs were determined as the cost per ton ofsolids using the hauling weight to approximate thetons to be stored. The cost per ton was determinedusing a typical storage facility for a broiler operation.This cost per ton was then applied to all livestocktypes after adjusting for storage time needed. Forexample, the cost per ton, which was based on a 365-day storage capacity, was multiplied by 0.5 to estimatethe cost per ton for operations that only needed a 180-day storage capacity.
The solid storage structure for a typical broiler housewas used as the basis for calculating the costs ofstorage needs for all model farms. The storage cost forbroilers was based on a 1,600-square-foot timber shedwith end bays, push walls, and a concrete floor. Theshed cost $12,403, or $1,863 per year per house. Usingthe information presented in appendix B, table B–7, ontons of manure at transport weight, it was determinedthat the average amount of manure per poultry housewas about 267 tons per year, including bedding. Thus,the cost per ton is about $7 for all poultry farms. Forother livestock types except the Southeast, the costper ton is $3.50 after adjusting for the needed storagecapacity. Similarly, the cost per ton in the Southeast is$1.75 per ton. The total storage cost for each operationwas determined by multiplying these cost per tonvalues times the total tons of recoverable solid manure(at hauling weight) produced in a year.
Generally, the majority of operations are expected tohave an adequate solids storage system already inplace. The major exception is dairy farms in the DairyBelt that reported no solids storage in the NAHMSfarmer survey. CNMP needs for solids storage werejudged to be as follows:
• 100 percent for dairy farm #1 in the Dairy Belt• 20 percent for dairy farm #2 with 35 to 135 AU
and all sizes in the West• 40 percent for dairy farm #2 in the Dairy Belt
with 135 to 270 AU• 10 percent for dairy farm #2 in the Southeast
with more than 135 AU• 25 percent for fattened cattle and confined heifer
farms with a scrape and stack system• 40 percent for confined heifers in confinement
barns• 60 percent for swine representative farm #4
81
Costs Associated with Development and Implementation of Comprehensive Nutrient Management Plans
Part I—Nutrient Management, Land Treatment, Manure and Wastewater Handling and Storage, and Recordkeeping
• 55 percent for layer farms in the Southeast, West,and South Central regions with less than 400 AU
• 30 percent for layer farms in the Southeast, West,and South Central regions with more than 400 AU
• 40 percent for layer farms in the North Centraland Northeast region with less than 400 AU
• 20 percent for layer farms in the North Centraland Northeast region with more than 400 AU
• 40 percent for broiler farms in the East and pulletfarms in the North with less than 440 AU
• 50 percent for broiler farms in the West andturkey farms with less than 440 AU
• 60 percent for pullet farms in the South and Westwith less than 440 AU
• 25 percent for all broiler farms, pullet farms, andturkey farms with more than 440 AU
Storage of slurry wastes, liquidwastes, and contaminated runoff
Slurry wastes, liquid wastes, and contaminated runoffare normally stored in earthen or fabricated struc-tures. Earthen structures are also used to treat manurein an anaerobic, aerobic, or aerated lagoon. Whilelagoons and earthen storages look similar, the designprocess for each is different.
In this study, the nonsolid storage facilities weredesignated as liquid storage, slurry storage, and runoffstorage ponds. Liquid and slurry systems are differenti-ated by the consistency of the material being stored asdetermined by the livestock type and the total solidscontent of the manure. The breakpoint between liquidand slurry manure varies by livestock type. Liquidstorages and runoff storage ponds are identical inappearance. Liquid storage ponds as described heregenerally store more wash water than runoff water,while the runoff storage ponds generally store morerunoff water than wash water. Thus, a runoff storagepond for a small dairy will capture wash water as well.
Liquid storage
The category of liquid storage includes both liquidstorage and treatment lagoons. Most treatment la-goons provide a storage function as well as a treat-ment function. The design concept for anaerobiclagoons is to size the structure based on the treatmentvolume needed to degrade the organic material. Addi-tional volume is added for long-term storage of sludge(decay residuals) and storage volumes.
Liquid storage in ponds or lagoons is a component ofmanure management systems for some swine, dairy,and layer model farms. These typically are flush sys-tems where wastewater is gravity fed or pumped tostorage ponds or lagoons. Most of these operations areassumed to have adequate liquid storage or treatmentsystems in place. However, some may be in disrepair,under-capacity, or may need to be replaced entirely.CNMP needs for liquid storage, with the exceptionnoted below, were judged to be the following:
• 20 percent for dairy farm #4 in the Dairy Beltwith 35 to 135 AU
• 30 percent for dairy farm #4 in the Dairy Beltwith135 to 270 AU
• 40 percent for dairy farm #4 in the Dairy Beltwith more than 270 AU
• 30 percent for dairy farm #5 in the Southeast• 30 percent for dairy farm #5 in the West with less
than 270 AU• 20 percent for dairy farm #5 in the West with
more than 270 AU• 40 percent for layer farm #3 (flush to lagoon)• 20 percent for swine farm #1 for all sizes and
regions
It was recognized that a portion of the operationswould choose to convert from one method of handlingmanure to another method as long as improvementsare being made to the operation. Changes that willtake place cannot be predicted, so the general assump-tion was that the method of handling manure wouldremain the same after CNMP implementation. In thecase of representative farm #2 for the largest dairies inthe Dairy Belt, however, labor costs associated withproperly handling the manure as a solid would be toohigh, and the operator would most likely convert to aliquid system. Thus, CNMP needs are 100 percent forthe liquid storage component on these farms.
The cost of constructing a pond or lagoon was esti-mated for each model farm using a representativenumber of animals per farm for each model farm. Fordairy farms, the representative number of animals wasestimated as 137 percent of the number of milk cows,which accounts for the dairy herd plus dry cows (17percent) and calves and heifers (20 percent). Storagecapacity was assumed to be 180 days for all systems.The calculated annual cost was then converted to aper head basis (dairy), a per animal-unit basis (fat-tened cattle), or a per house basis (layers).

82
Costs Associated with Development and Implementation of Comprehensive Nutrient Management Plans
Part I—Nutrient Management, Land Treatment, Manure and Wastewater Handling and Storage, and Recordkeeping
Pond or lagoon sizes were developed using the NRCSAnimal Waste Management (AWM) engineering designprogram. AWM integrates all aspects of the sizingprocess to meet current NRCS conservation practicestandard criteria for Waste Storage Facility and WasteTreatment Lagoon. Where appropriate, a treatmentcomponent was included in the design. Categorieswere further defined to reflect regional differences. Atypical set of climate data (monthly precipitation andevaporation) was selected for each region representa-tive of the model farm. AWM then calculated manurevolume for 180-day storage, 180-day normal rainfall onthe pond surface, the rainfall on the pond surface froma 25-year 24-hour storm event, and as appropriate, the180-day runoff volume, for the most critical 6-monthperiod of the year based on location. Where the liquidis recycled for flushing, AWM allows the designer toreduce inputs. The AWM program also adjusted vol-umes for evaporation. The results from AWM gavepond/lagoon dimensions and final volume in gallons.
The installation costs were based on actual cost datafor equivalent systems. The costs per gallon werecalculated from the total cost of an installed pond/lagoon by the design storage volume. Costs wereobtained from various locations across the countryfrom NRCS engineers that had first-hand knowledge ofan actual system. The costs used in this assessmentreflect averages of the information received fromacross the country. Various systems were included inthe development of costs that included partially exca-vated ponds, complete earthen fill ponds, and flexiblemembrane lined ponds. Installation costs per gallonwere: 2.2 cents per gallon for pond/lagoons with acapacity of less than 1 million gallons, 1.8 cents pergallon for capacities from 1 million to 3 million gallons,and 1.5 cents per gallon for greater than 3 milliongallons.
Costs associated with liquid storage are shown in table27 for each model farm.
Slurry storage
Slurry storage in earthen pits, concrete tanks, or smallstorage ponds is a component of manure managementsystems for some swine, dairy, and veal model farms.These often are storage facilities beneath a slattedfloor. Storage facilities were designed for 120 days ofstorage to reflect common practice in the industry.Most of the dairy operations for representative farmnumber 3 and veal farms originally were slurry sys-tems, so most are assumed to already have adequatestorage systems. For swine farms with slurry systems,it was assumed that the majority would need extensiveupgrades to meet the 120-day storage requirement.CNMP needs for slurry storage were judged to be asfollows:
• 20 percent for dairy farm #3 in the Dairy Beltwith 35 to 135 AU
• 30 percent for dairy farm #3 in the Dairy Beltwith 135 to 270 AU
• 40 percent for dairy farm #3 in the Dairy Beltwith more than 270 AU
• 30 percent for veal farms• 50 percent for swine farm #3• 60 percent for swine farm #2
Slurry storage facility costs were estimated in thesame manner as liquid storage ponds and lagoons,using the same approach and the same costs pergallon. Costs associated with slurry storage are shownin table 28 for each model farm.
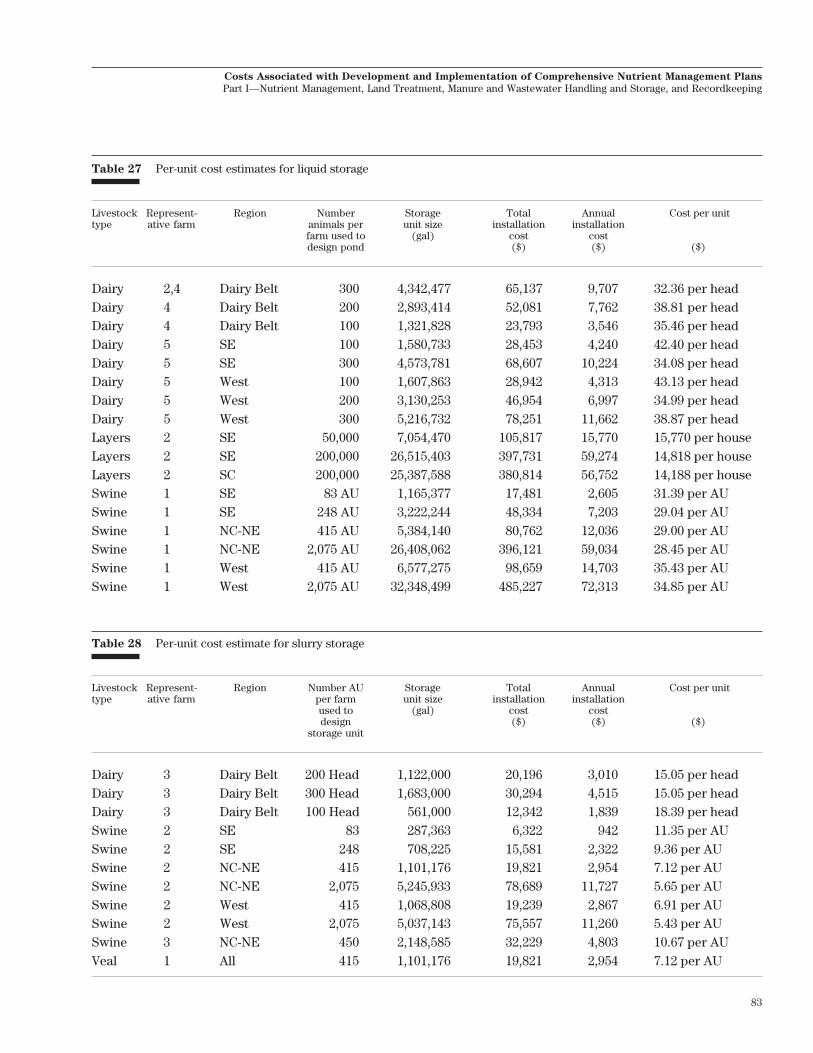
83
Costs Associated with Development and Implementation of Comprehensive Nutrient Management Plans
Part I—Nutrient Management, Land Treatment, Manure and Wastewater Handling and Storage, and Recordkeeping
Table 27 Per-unit cost estimates for liquid storage
Livestock Represent- Region Number Storage Total Annual Cost per unittype ative farm animals per unit size installation installation
farm used to (gal) cost costdesign pond ($) ($) ($)
Dairy 2,4 Dairy Belt 300 4,342,477 65,137 9,707 32.36 per headDairy 4 Dairy Belt 200 2,893,414 52,081 7,762 38.81 per headDairy 4 Dairy Belt 100 1,321,828 23,793 3,546 35.46 per headDairy 5 SE 100 1,580,733 28,453 4,240 42.40 per headDairy 5 SE 300 4,573,781 68,607 10,224 34.08 per headDairy 5 West 100 1,607,863 28,942 4,313 43.13 per headDairy 5 West 200 3,130,253 46,954 6,997 34.99 per headDairy 5 West 300 5,216,732 78,251 11,662 38.87 per headLayers 2 SE 50,000 7,054,470 105,817 15,770 15,770 per houseLayers 2 SE 200,000 26,515,403 397,731 59,274 14,818 per houseLayers 2 SC 200,000 25,387,588 380,814 56,752 14,188 per houseSwine 1 SE 83 AU 1,165,377 17,481 2,605 31.39 per AUSwine 1 SE 248 AU 3,222,244 48,334 7,203 29.04 per AUSwine 1 NC-NE 415 AU 5,384,140 80,762 12,036 29.00 per AUSwine 1 NC-NE 2,075 AU 26,408,062 396,121 59,034 28.45 per AUSwine 1 West 415 AU 6,577,275 98,659 14,703 35.43 per AUSwine 1 West 2,075 AU 32,348,499 485,227 72,313 34.85 per AU
Table 28 Per-unit cost estimate for slurry storage
Livestock Represent- Region Number AU Storage Total Annual Cost per unittype ative farm per farm unit size installation installation
used to (gal) cost costdesign ($) ($) ($)
storage unit
Dairy 3 Dairy Belt 200 Head 1,122,000 20,196 3,010 15.05 per headDairy 3 Dairy Belt 300 Head 1,683,000 30,294 4,515 15.05 per headDairy 3 Dairy Belt 100 Head 561,000 12,342 1,839 18.39 per headSwine 2 SE 83 287,363 6,322 942 11.35 per AUSwine 2 SE 248 708,225 15,581 2,322 9.36 per AUSwine 2 NC-NE 415 1,101,176 19,821 2,954 7.12 per AUSwine 2 NC-NE 2,075 5,245,933 78,689 11,727 5.65 per AUSwine 2 West 415 1,068,808 19,239 2,867 6.91 per AUSwine 2 West 2,075 5,037,143 75,557 11,260 5.43 per AUSwine 3 NC-NE 450 2,148,585 32,229 4,803 10.67 per AUVeal 1 All 415 1,101,176 19,821 2,954 7.12 per AU
84
Costs Associated with Development and Implementation of Comprehensive Nutrient Management Plans
Part I—Nutrient Management, Land Treatment, Manure and Wastewater Handling and Storage, and Recordkeeping
Runoff storage ponds
Open lots where animals are held produce contami-nated water during rainfall events in the form of run-off. Runoff storage ponds are constructed to captureand store this contaminated water. They are neededfor pasture-based swine operations (swine farm #5)and swine operations with a lot (swine farm #4),turkey ranches, dairy farms #1 and #2, fattened cattleand confined heifer farms with a scrape and stackmanure management system, and fattened cattlefeedlots with manure pack. These ponds will alsocollect the wash water used around dairies.
A majority of these farms do not have runoff storageponds, or the existing pond is inadequate. CNMP needsfor these farms were judged to be high, as follows:
• 80 percent for dairy farms #1 and #2• 90 percent for turkey ranches• 70 percent for fattened cattle farm #2• 40 percent for fattened cattle farm #1 and
confined heifer farm #2 (scrape and stack) in the Northeast and Midwest.
• 50 percent for fattened cattle farm #1 andconfined heifer farm #2 (scrape and stack)in the Southeast and West.
• 50 percent for swine farms #4 and #5
Costs for runoff storage ponds for dairy, fattenedcattle, swine farms, and confined heifer farms wereestimated in the same manner as liquid storage pondsand lagoons, using the same approach and the samecosts per gallon. Costs associated with runoff storageponds are shown in table 29 for each model farm.
Settling basins
Settling basins are expected to be a component for allfarms with runoff storage ponds. Runoff from openlots generally carries manure solids and sometimessoil particles with it. If these solids are allowed toreach the runoff storage ponds, the operator of thesystem is faced with the problem of handling a prima-rily liquid wastewater that contains some solids,
making land application of the liquid more difficultbecause of plugging of irrigation or spray nozzles. Theoperator also must address the removal of residualsolids from the liquid holding pond periodically toensure design capacity is maintained, which is anothercost to the operator. Because animal operations thatuse open lots must already handle both solids andliquids, most operations would prefer to separatesolids from the lot runoff before it can enter the runoffstorage pond. By separating the solids from the runoff,the solids can be managed more effectively and thestorage pond can be sized and operated more effi-ciently. While it is recognized that some operationswould continue to handle the runoff as a compositemixture, the added costs of dealing with the solids inthe runoff storage pond would easily offset the cost ofinstalling a settling basin. CNMP needs for settlingbasins were the same as those for runoff storageponds.
A settling basin consists of a small holding pond with aconcrete floor and an outlet structure to allow theliquid to pass through the basin. The outlet structure isa pipe that has a perforated riser at the inlet thatallows water level control to enhance settlement ofsolids. Before entering the storage pond, runoff passesthrough the settling basin where the solids are settledout and the liquid is outlet to the storage pond. Solidsare periodically removed and land applied or storedwith other manure solids on the farm.
The sizing of settling basins was based on a typicalopen lot area size for a given animal operation size andthe expected routed rainfall runoff volume associatedwith a 10 year-24 hour rainfall event on the open lot.Four size classes of operations—100 AU, 200 AU, 500AU, and 1,000 AU—were used to calculate costs on aper AU basis. The cost of the basin construction (landgrading, excavation, placing of earthen fill) would beabout $0.04 per gallon of temporary storage volume.The concrete bottom was assumed to be 6 inchesthick, with wire mesh reinforcement, at a cost of $200per cubic yard ($3.70 per square foot) installed. Theoutlet structure was cost at $780. The costs per AUfollow:

85
Costs Associated with Development and Implementation of Comprehensive Nutrient Management Plans
Part I—Nutrient Management, Land Treatment, Manure and Wastewater Handling and Storage, and Recordkeeping
Table 29 Per-unit cost estimates for runoff storage ponds
Livestock Represent- Region Number Pond size Total Annual Cost per unittype ative farm AU per installation installation
farm used to cost costdesign pond (gal) ($) ($) ($)
Dairy 1,2 Dairy Belt 200 head 1,355,750 24,404 3,637 18.18 per head
Dairy 2 Southeast 200 head 1,337,331 24,072 3,587 17.94 per head
Dairy 2 West 200 head 731,983 16,104 2,400 12.00 per head
Swine 5 Southeast 83 241,281 5,308 791 9.53 per AU
Swine 5 West 450 632,799 13,922 2,075 4.61 per AU
Swine 4 Midwest 450 1,398,349 25,170 3,751 8.34 per AU
Confined heifers 1 Northeast 50 395,232 8,695 1,296 25.92 per AU
Confined heifers 1 Southeast 50 400,076 8,802 1,312 26.23 per AU
Confined heifers 1 Midwest 50 308,505 6,787 1,011 20.23 per AU
Fattened cattle 1 Northeast 50 395,232 8,695 1,296 25.92 per AU
Fattened cattle 1 Southeast 50 400,076 8,802 1,312 26.23 per AU
Fattened cattle 1 Midwest 50 308,505 6,787 1,011 20.23 per AU
Fattened cattle 2 Southeast 100 535,736 11,786 1,756 17.56 per AU
Fattened cattle 2 Midwest 50 234,919 5,168 770 15.40 per AU
Fattened cattle 2 Midwest 100 399,713 8,794 1,311 13.11 per AU
Fattened cattle 2 Northern Plains 350 791,552 17,414 2,595 7.41 per AU
Fattened cattle 2 Northern Plains 750 1,608,964 28,961 4,316 5.75 per AU
Fattened cattle 2 Central Plains 750 1,673,838 30,129 4,490 5.99 per AU
Fattened cattle 2 Central Plains 1,500 3,321,639 49,825 7,425 4.95 per AU
Fattened cattle 2 West 250 317,391 6,983 1,041 4.16 per AU
Fattened cattle 2 West 750 1,136,631 20,459 3,049 4.07 per AU
Turkeys 2 East 500 1,350,897 24,316 3,624 540.87 per house
Turkeys 2 Midwest 500 1,167,101 21,008 3,131 467.28 per house
Turkeys 2 California 1100 2,285,140 41,133 6,130 415.87 per house
Turkeys 2 West other than 600 1,374,213 24,736 3,686 458.50 per houseCalifornia
AUs used Storage Size of Total cost Annualfor sizing volume concrete cost
bottom per AU(gal) (ft2) ($) ($)
100 17,000 600 3,682 5.49
200 50,000 800 5,743 4.28
500 108,600 1,000 8,828 2.63
1,000 206,700 1,200 13,492 2.01
These costs were assigned to CNMP farms based onthe size of operation, as follows:
• $5.49 per AU for farms with less than 135 AU• $4.28 per AU for farms with 135 to 300 AU• $2.63 per AU for farms with 300 to 1,000 AU• $2.01 per AU for farms with more than 1,000 AU

86
Costs Associated with Development and Implementation of Comprehensive Nutrient Management Plans
Part I—Nutrient Management, Land Treatment, Manure and Wastewater Handling and Storage, and Recordkeeping
Conservation practices forpastured livestock
Pastured livestock operations differ from conventionalfeeding operations in that the animals are raisedprimarily on pasture or range, rather than in a confinedenvironment. However, pastured and range animalssometimes are confined in the more conventionalsense to provide for ease of management. For ex-ample, in areas of the country where winter is severe,a common practice is to keep pastured or range ani-mals in a confined area with a dependable watersupply and access by the farmer to provide supple-mental feed. As a result, concentrations of manure areaccumulated in these confined areas, generally nearfeed bunks and watering sources. Sometimes theseconfinement areas are located adjacent to streams andwatercourses. The focus of a CNMP for these types ofoperations is to ensure a dependable source of wateraway from the streams to eliminate direct contact withwatercourses and provide for collection and handlingof recoverable manure generated in these concen-trated areas.
Costs associated with conservation practices forpastured livestock are grouped under the manure andwastewater storage and handling element, althoughthey include some costs associated with pasturemanagement that would be expected to be included ina CNMP for these farms. As shown in appendix A,24,697 farms with pastured livestock and few otherlivestock qualified as farms that may need a CNMPbecause of the amount of recoverable manure thatwould potentially be produced on these farms. Anadditional 36,575 farms had less than 35 AU of con-fined livestock types, but had beef cattle as the domi-nant livestock type on the farm. These two groups offarms comprise the set of farms for which CNMPcomponents for pastured livestock are applied.
CNMP needs and costs associated with conservationpractices for pastured livestock were derived using thesame approach as used for the manure and wastewa-ter storage and handling element. The methods used toestimate CNMP-related costs are presented in thefollowing sections for each component. All costs,except where noted otherwise, were based on theNatural Resources Conservation Service's Field OfficeTechnical Guide's average cost lists for individualcomponents or practices. All capital costs were amor-
tized over 10 years at 8 percent interest. Cost andneeds assumptions are summarized in appendix E,table E–1.
Fencing
To properly control the access of animals to water,feed, and loafing areas, a planned system of fencing isneeded that is consistent with each individual animalfeeding operation’s management strategy. Often theneed is primarily focused to exclude animals fromdirect access to a stream. However, with exclusionfrom the stream, alternative water sources need to beprovided, and generally, additional fencing is neededto control the movement of animals relative to the newwater sources. It was judged that about a third of thepastured livestock operations would need additionalfencing.
The amount of fencing needed is dependant on theparticular operation. For a typical 150-AU cattle opera-tion, it was assumed that about a mile of fence wouldbe needed to supplement existing fencing and replacefencing in disrepair, or 35.2 feet per AU. Based onNRCS Conservation Practice Standard Fence (Code382), the cost of fencing was $0.80 per foot of fence fora total cost of $28.16 per AU, or $4.20 annually per AU.
Water well
An alternative water source needs to be provided iflivestock are excluded from direct access to streamsand watercourses. Numerous methods are used toprovide this alternative water source, with no consis-tency of method demonstrated in any particular regionof the country. Methods include the installation ofwater wells dedicated to providing water for thepasture confinement area, utilizing instream pumps totransfer water from the immediate stream corridor,developing natural spring areas that are located awayfrom the stream corridor, and pumping and pipingwater from an existing water system. For this assess-ment, it was assumed that a new well would beinstalled. The use of a dedicated well is generally themethod of choice because of its reliability in providinga consistent quantity and quality of water (springs godry, stream flows and quality fluctuate). Costs werebased on criteria for well development in NRCS Con-servation Practice Standard Water Well (Code 642).The depth of the well was assumed to be 250 feet.(Actual depths vary from 100 feet to over 1,000 feetaround the country; however, most wells used for
87
Costs Associated with Development and Implementation of Comprehensive Nutrient Management Plans
Part I—Nutrient Management, Land Treatment, Manure and Wastewater Handling and Storage, and Recordkeeping
livestock watering are installed near riparian areaswhere the depth to a reliable, potable water table isrelatively shallow.) Using $22 per foot as the cost ofinstalling a well, the average cost of a well 250 feetdeep is $5,500, or $820 annually per farm. It wasjudged that representative farms #3 and #4 would notneed to construct a well, as an alternative watersource will most likely be readily available. For repre-sentative farms #1 and #2, it was judged that about 40percent of the operations would need to implementthis practice.
Watering facility
Along with the need to provide an additional source ofwater is the need to provide temporary water storageand a watering facility for the animals. The amount ofwater storage needed is dependant on the source andreliability of water and the size of the herd. Wateringfacility design is based on the criteria established inNRCS Conservation Practice Standard Watering
Facility (Code 614). In most situations the wateringfacility consists of a corrugated metal trough with aconcrete bottom and pad that stores the equivalent of1 day of water needs. Storage needs were based on 30gallons per animal unit. For this assessment, costs peranimal unit were based on storage requirements for a150-AU herd, which would be 4,500 gallons. The water-ing facility would consist of a circular corrugatedmetal tank 1.5 feet deep and 23 feet in diameter. Thecost is $0.75 per gallon for a total cost per AU of$22.50, or an annual cost of $3.35 per AU.
In the Northern Plains and Mountain States wherewinter confinement areas tend to be located a consid-erable distance from the operations’ headquarters andwhere winter temperatures can drop and remainbelow freezing, special "frost free" watering facilitiesare needed. This type of facility is an enclosed fiber-glass, insulated tank with a small drinking area forcow access. The need for more than 1 day of storagewould depend on how remote and accessible theconfinement site is. For the purposes of this assess-ment, 1 day of storage was used to calculate the cost.Based on a per-unit cost of $3 per gallon, the total costper AU is $90, or $13.41 per AU annually.
In some areas of the upper Midwest or New England,winter temperatures also drop to below freezing;however, because of the close proximity of the head-quarters area to the confinement areas, more cost-effective alternative methods are available to ensure
the water does not freeze (such as manual clearing ofice, electric heaters).
CNMP needs for watering facilities are the same asthose for water wells.
Heavy use area protection
The purpose of heavy use area protection is to stabi-lize areas of high traffic or use by equipment andanimals. Associated with a CNMP for pastured live-stock, this generally would address the area surround-ing the watering facility. The practice would not onlyprotect the integrity of the watering facility, but alsoprovide an area for easier recoverability of manure.For the purposes of this assessment, heavy use areaprotection will consist of a concrete pad surroundingthe watering facility. Costs per animal unit were basedon a 150-AU herd. The heavy use area would be asquare pad, 43 feet on a side or 1,815 square feet, 6inches thick. Subtracting out the area of the tank, therequired installation is 1,414 square feet, or 26.2 cubicyards of concrete. Based on an installation cost of$120 per cubic yard (which includes the minor gradingand shaping required, forming, cost of concrete, andlabor), the cost of the pad for the 150-AU herd wouldbe $3,141, or $3.12 per AU annually. Using the sameapproach, per-AU costs would be $6.35 for a 50-AUherd and $2.32 for a 250-AU herd. The following func-tion was derived for use in estimating the cost per AU:
x = herd sizea = annual cost per AU
If x < 50, then a=$6.35If x > 250, then a=$2.32
If 50 < x < 150, then a=6.35-x-50
150-506.35-3.12
( )( ) × ( )
If 150 < x < 250, then a=3.12-x-150
250-1503.12-2.32
( )( ) × ( )
Heavy use area protection is needed only for represen-tative farm #1. CNMP needs were judged to be 50percent for these operations.
Windbreak or shelterbelt establishment
One of the primary reasons that pastured livestockhave been wintered in riparian areas is to provideshelter from the wind and weather. In moving pastured

88
Costs Associated with Development and Implementation of Comprehensive Nutrient Management Plans
Part I—Nutrient Management, Land Treatment, Manure and Wastewater Handling and Storage, and Recordkeeping
livestock directly out of the immediate stream corri-dor, certain regions of the country will be moving theiranimals away from natural cover and protection fromthe elements. Replacement of the needed protection isessential in implementing a CNMP. The windbreaks orshelterbelts are installed along the edge of the confine-ment area on the side of the prevailing winds expectedin the winter. The windbreaks or shelterbelts generallyconsist of from three to seven parallel rows of trees ofvarying species. This is primarily a concern in theWest, Northern Plains, and Mountain States.
The criteria used to determine the size and type ofprotection needed were based on NRCS ConservationPractice Standard Windbreak/Shelterbelt Establish-
ment (Code 380). Cost estimates were estimated forthree herd size categories: 50, 150, and 250 AU. Forthese herd sizes, the length of the windbreak or shelterbreak would be 600, 1,200, and 1,800 feet, respectively.Installation cost is $4.20 per foot. Thus, the annualcost per AU is $7.51 per AU for a 50-AU herd, $5.01 perAU for a 150-AU herd, and $4.51 per AU for a 250-AUherd. The following function was derived for use inestimating the cost per AU:
x = herd sizea = annual cost per head
If x <= 50, then a=$7.51If x >=250, then a=$4.51
If 50 < x < 150, then a=7.51-x-50
150-507.51-5.01
( )( ) × ( )
If 150 < x < 250, then a=5.01-x-150
250-1505.01-4.51
( )( ) × ( )
Windbreak or shelter break establishment is onlyneeded for representative farm #2. CNMP needs werejudged to be 50 percent for these operations.
Solids storage
Most pasture operations would allow manure to accu-mulate through the period of temporary confinement,periodically removing the manure as it accumulates. Adesignated storage area is generally not needed tomanage the manure produced. However, in regionssuch as the Midwest, Lake States, and the Northeast,manure cannot be periodically spread because offrozen and snow covered ground. In these regionstemporary storage is needed for about 2 to 3 monthswhile the animals are temporarily confined. Becausethe period of storage is during the winter when theonly precipitation expected is in the form of snow, acover for the storage area is not considered essential.Therefore, a concrete slab 6 inches thick was used forestimation. For a 150-AU herd, the relative size of asolid storage pad would be 1,600 square feet. A 1,600square foot pad 6 inches thick would require 29.6cubic yards of concrete. Based on a per-unit cost of$120 per cubic yard (which includes the minor gradingand shaping required, forming, cost of concrete, andlabor), the total cost of the storage pad would be$3,556, which equates to about $1.85 per ton of recov-erable solids. CNMP needs were judged to be 50 per-cent for operations in the Midwest, Northeast, andLake States.
Filter strip
For pasture operations in the Midwest, Lake, andNortheast States, filter strips on the downslope edge ofthe temporary confinement area would be needed toprevent removal of solids and dissolved nutrients fromthe lot with the runoff from snowmelt and spring rains.Costs per AU were based on a 50-AU herd size. It wasassumed that the filter strip would need to be 30 feetwide by 400 feet long, resulting in a treatment area of12,000 square feet, or 0.28 acres. The average cost ofshaping and seeding is $1,500 per acre. Thus, the totalcost of the filter strip is $413, which is equivalent to anannual cost of $1.23 per AU. Because the typicallocation of these pasture operations is near streamcorridors, vegetated areas are often already in place,assuming the lot areas have been set back from thestream. CNMP needs were therefore judged to be only30 percent for representative farms #3 and #4.
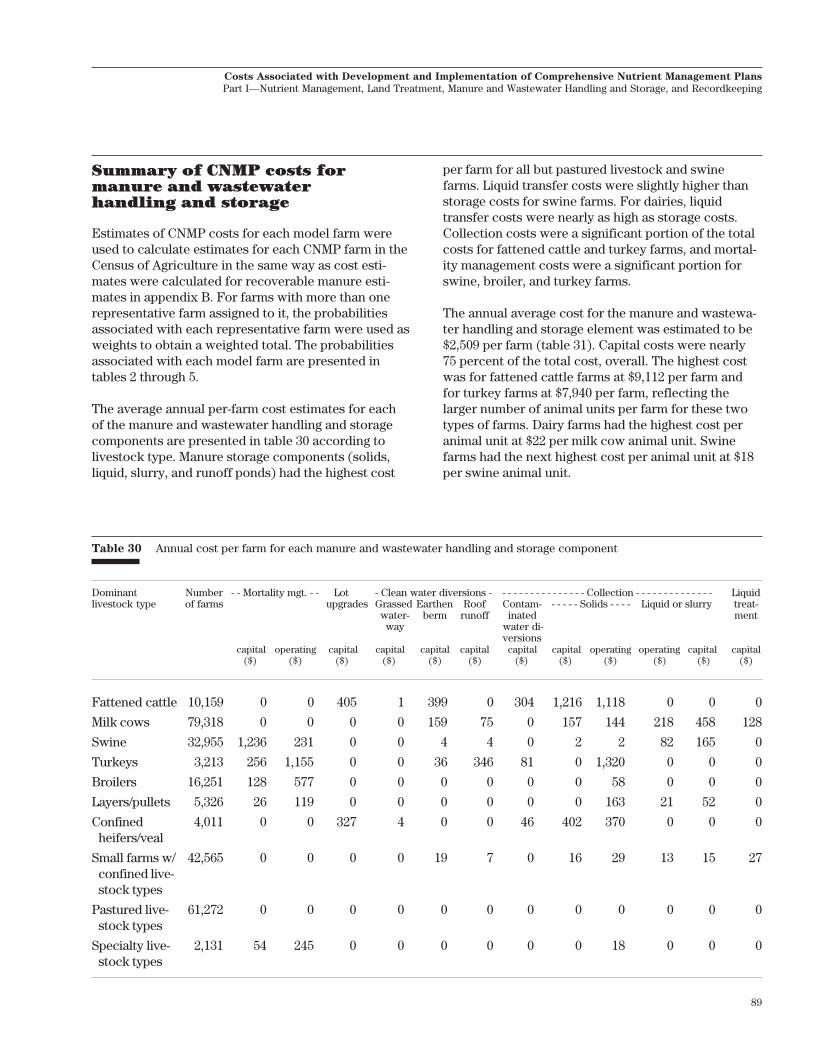
89
Costs Associated with Development and Implementation of Comprehensive Nutrient Management Plans
Part I—Nutrient Management, Land Treatment, Manure and Wastewater Handling and Storage, and Recordkeeping
Summary of CNMP costs formanure and wastewaterhandling and storage
Estimates of CNMP costs for each model farm wereused to calculate estimates for each CNMP farm in theCensus of Agriculture in the same way as cost esti-mates were calculated for recoverable manure esti-mates in appendix B. For farms with more than onerepresentative farm assigned to it, the probabilitiesassociated with each representative farm were used asweights to obtain a weighted total. The probabilitiesassociated with each model farm are presented intables 2 through 5.
The average annual per-farm cost estimates for eachof the manure and wastewater handling and storagecomponents are presented in table 30 according tolivestock type. Manure storage components (solids,liquid, slurry, and runoff ponds) had the highest cost
per farm for all but pastured livestock and swinefarms. Liquid transfer costs were slightly higher thanstorage costs for swine farms. For dairies, liquidtransfer costs were nearly as high as storage costs.Collection costs were a significant portion of the totalcosts for fattened cattle and turkey farms, and mortal-ity management costs were a significant portion forswine, broiler, and turkey farms.
The annual average cost for the manure and wastewa-ter handling and storage element was estimated to be$2,509 per farm (table 31). Capital costs were nearly75 percent of the total cost, overall. The highest costwas for fattened cattle farms at $9,112 per farm andfor turkey farms at $7,940 per farm, reflecting thelarger number of animal units per farm for these twotypes of farms. Dairy farms had the highest cost peranimal unit at $22 per milk cow animal unit. Swinefarms had the next highest cost per animal unit at $18per swine animal unit.
Table 30 Annual cost per farm for each manure and wastewater handling and storage component
Dominant Number - - Mortality mgt. - - Lot - Clean water diversions - - - - - - - - - - - - - - - - Collection - - - - - - - - - - - - - - Liquidlivestock type of farms upgrades Grassed Earthen Roof Contam- - - - - - Solids - - - - Liquid or slurry treat-
water- berm runoff inated mentway water di-
versionscapital operating capital capital capital capital capital capital operating operating capital capital
($) ($) ($) ($) ($) ($) ($) ($) ($) ($) ($) ($)
Fattened cattle 10,159 0 0 405 1 399 0 304 1,216 1,118 0 0 0
Milk cows 79,318 0 0 0 0 159 75 0 157 144 218 458 128
Swine 32,955 1,236 231 0 0 4 4 0 2 2 82 165 0
Turkeys 3,213 256 1,155 0 0 36 346 81 0 1,320 0 0 0
Broilers 16,251 128 577 0 0 0 0 0 0 58 0 0 0
Layers/pullets 5,326 26 119 0 0 0 0 0 0 163 21 52 0
Confined 4,011 0 0 327 4 0 0 46 402 370 0 0 0heifers/veal
Small farms w/ 42,565 0 0 0 0 19 7 0 16 29 13 15 27confined live-stock types
Pastured live- 61,272 0 0 0 0 0 0 0 0 0 0 0 0stock types
Specialty live- 2,131 54 245 0 0 0 0 0 0 18 0 0 0stock types

90
Costs Associated with Development and Implementation of Comprehensive Nutrient Management Plans
Part I—Nutrient Management, Land Treatment, Manure and Wastewater Handling and Storage, and Recordkeeping
Table 30 Annual cost per farm for each manure and wastewater handling and storage component—Continued
Dominant Solids Liquid Slurry Liquid transfer Runoff Settling Fence Heavy Well Watering Wind- Filterlivestock type storage storage storage storage basin use facility break strip
pond areacapital capital capital capital operating capital capital
($) ($) ($) ($) ($) ($) ($) ($) ($) ($) ($) ($) ($)
Fattened cattle 31 0 0 484 136 3,457 1,332 0 0 0 0 0 0
Milk cows 223 606 21 630 189 125 38 0 0 0 0 0 0
Swine 8 568 511 904 270 31 16 0 0 0 0 0 0
Turkeys 4,085 0 0 7 1 354 140 0 0 0 0 0 0
Broilers 1,539 0 0 0 0 0 0 0 0 0 0 0 0
Layers/pullets 2,490 663 0 288 86 0 0 0 0 0 0 0 0
Confined 632 10 0 120 31 934 236 0 0 0 0 0 0heifers/veal
Small farms w/ 41 13 2 7 4 0 0 0 0 0 0 0 0confined live-stock types
Pastured live- 11 0 0 0 0 0 0 147 80 203 263 109 10stock types
Specialty live- 509 0 0 0 0 0 0 0 0 0 0 0 0stock types
Costs differed most by farm size (table 31). Largefarms (producing more than 10 tons of phosphorusannually) had an average annual cost of $15,167 perfarm, compared to an average annual cost of $3,397per farm for medium-size farms and $1,070 per farmfor small farms. The cost per animal unit on largefarms, however, was lower than for medium-size andsmall farms because of the economies of scale embod-ied in the assignment of per unit costs and the lowerCNMP needs expected for the largest farms.
Per-farm costs were highest in the Pacific, Mountain,and Southern Plains regions (table 32) and lowest inthe Lake States and the Corn Belt regions. Total costswere highest in the Corn Belt, the Lake States, and theNorthern Plains, which together represented about 45percent of the total costs for manure and wastewaterhandling and storage.
Overall, annual manure and wastewater handling andstorage costs totaled $645 million.

91
Costs Associated with Development and Implementation of Comprehensive Nutrient Management Plans
Part I—Nutrient Management, Land Treatment, Manure and Wastewater Handling and Storage, and Recordkeeping
Table 31 Annual manure and wastewater handling and storage cost per farm, by livestock type and farm size
Dominant livestock type Number AU for AU for Capital Operating Maintenance Total cost Cost per AUor farm size class of farms dominant other live- cost** cost** cost** of dominant
livestock type stock types* livestock type($) ($) ($) ($) ($)
Fattened cattle 10,159 858 440 7,629 1,254 229 9,112 11Milk cows 79,318 149 46 2,620 551 79 3,249 22Swine 32,955 236 40 3,451 585 104 4,139 18Turkeys 3,213 638 49 5,305 2,476 159 7,940 12Broilers 16,251 150 33 1,666 635 50 2,351 16Layers/pullets 5,326 258 39 3,519 390 106 4,015 16Confined heifers/veal 4,011 237 64 2,710 401 81 3,192 13Small farms with 42,565 18 7 149 46 4 199 11
confined livestock typesPastured livestock types 61,272 107 10 NA NA NA 823 8Specialty livestock types 2,131 NA 17 563 263 17 843 NA
Large farms 19,746 1,129 290 11,627 2,721 349 15,167 13Medium-size farms 39,437 191 61 2,477 543 74 3,397 18Small farms 198,018 63 17 773 126 23 1,070 17
All types 257,201 165 45 1,867 389 56 2,509 15
NA Not available.* Includes pastured livestock types.** Costs for farms with pastured livestock types dominant were not broken down into capital and operating costs. Costs for these farms are
presented in the Total cost column.
Table 32 Annual manure and wastewater handling and storage cost per farm, by farm production region
Farm production region Number Capital cost Operating Maintenance Total costof farms cost cost
($) ($) ($) ($)
Appalachian 22,899 2,155 545 65 2,987Corn Belt 71,540 1,312 214 39 1,647Delta States 12,352 1,468 436 44 2,181Lake States 52,817 1,363 250 41 1,669Mountain 7,964 4,184 980 126 6,177Northeast 31,598 1,595 303 48 1,976Northern Plains 26,309 2,012 345 60 3,088Pacific 7,974 5,684 1,479 171 7,731Southeast 12,807 2,074 549 62 2,901Southern Plains 10,941 3,508 775 105 4,776
All types 257,201 1,867 389 56 2,509
92
Costs Associated with Development and Implementation of Comprehensive Nutrient Management Plans
Part I—Nutrient Management, Land Treatment, Manure and Wastewater Handling and Storage, and Recordkeeping
Recordkeeping Costs
The Comprehensive Nutrient Management Plan
Technical Guidance identifies a variety ofrecordkeeping activities that are expected to be in-cluded in a CNMP. These can be grouped into threecategories:1. Annual activities
• Results of manure tests for nutrient content• Field records of crops planted and harvested
and other annual activity records• Records associated with evaluations by NRCS,
third-party consultants, or regulatory agencies• Records of land application equipment calibra-
tion• Alterations to the CNMP• Update of site information and production
information, as needed.
2. Monthly activities
• Records of management of manure storagefacilities (dates of emptying, discharge oroverflow events, and record of monthly levels)
• Records of operation and maintenance
3. Per-event activities
• Application records for each land applicationevent, including the amount applied, acresapplied, application method, time and date ofapplication, weather conditions during applica-tion, and soil moisture condition
• Off-site transfer records, including manurenutrient content, amount of manure transferred,date, and recipient of manure
• Activities associated with emergency spillresponse plan
Recordkeeping costs for annual, monthly, and per-event activities depend on the type and size of theanimal feeding operation. Operations that handlemanure as a solid would not typically incur a cost formonthly activities, except possibly maintenance,because waste would be stockpiled and would notrequire as much monitoring as a liquid holding pond orlagoon. Broiler operations typically would remove thecrust from a house after each flock and perform acomplete house cleanout only once a year. Operationswith more frequent removal and land applicationwould incur higher recordkeeping costs. Generally,
liquid systems would have greater recordkeepingrequirements than solid handling systems. Largersystems would generally incur a higher monthly costthan smaller systems because of the greater complex-ity of the operation.
Recordkeeping costs were assigned as follows:• $80 per year for annual recordkeeping activities
(8 hours per year at $10 per hour). This costwould be incurred by all operations with morethan 35 animal units.
• $120 per year for monthly activities (1 hour permonth at $10 per hour) associated with liquid/slurry handling on small systems, and $240 peryear for monthly activities associated with liquid/slurry handling on larger systems (2 hours permonth at $10 per hour).
• $120 per year for monthly activities (1 hour permonth at $10 per hour) for the larger fattenedcattle operations with manure pack. For othersolid systems, monthly recordkeeping is minor,and costs are incorporated into the per-eventcost.
• $40 per year for per-event activities (16 days peryear for land application of manure, 15 minutesper day for recordkeeping, at $10 per hour) fornonpoultry operations that land apply manure,including layer farms with shallow pit or flush-to-lagoon systems. For the remaining poultry farms,per-event recordkeeping costs were assumed tobe $20 per year (8 days per year for land applica-tion of manure, 15 minutes per day forrecordkeeping, at $10 per hour).
• Recordkeeping costs for pastured livestockfarms and small farms with confined livestocktypes (less than 35 animal units) consisted of $40per year for annual costs and $20 per year formonthly and per-event costs.
Most, if not all, of the costs associated with setting uprecordkeeping would be covered in the technicalassistance provided to the producer, and so setupcosts are not included here. Setup might includeestablishing the necessary forms to document actionsand activities and providing software programs to aidin more comprehensive recordkeeping activities.
Although many operators keep some records, mostoperators are not expected to be keeping sufficientrecords to provide adequate information for maintain-ing a nutrient management plan. It was thus judged

93
Costs Associated with Development and Implementation of Comprehensive Nutrient Management Plans
Part I—Nutrient Management, Land Treatment, Manure and Wastewater Handling and Storage, and Recordkeeping
that CNMP needs would be 90 percent for record-keeping activities.
Overall, annual recordkeeping costs totaled $30 mil-lion. The annual average cost was $117 per farm (table33). Recordkeeping costs were highest for swinefarms, averaging $224 per farm. Costs were lowest forpoultry farms ($90 per farm), small farms with con-fined livestock types ($54 per farm), farms with pas-tured livestock types ($54 per farm), and specialtylivestock farms ($54 per farm).
CNMP development costs
A significant part of the cost of CNMPs is the cost ofdeveloping the CNMP for each livestock operation.CNMP development includes
• working with farmers to define objectives, de-velop and evaluate alternatives, and finalize aplan;
• designing the conservation practices identified inthe CNMP plan;
• assisting with and inspecting the installation ofthe conservation practices and identified man-agement activities; and
• following up with the producer to address ques-tions and to assure that the practices are beingcarried out as intended.
Because of the technical complexities that must beaddressed in developing and implementing a CNMP,most producers need assistance from technical spe-cialists to ensure that sustainable systems will beinstalled and operated, and that those systems meetthe objectives of a CNMP and are consistent with theproduction goals of the farmer. This assistance couldbe provided by technical specialists from either thepublic or private sectors.
Alternatives development and evaluation involvesmeeting with the livestock operator to determineresource concerns related to the operation, obtainpertinent operational data (such as the number ofanimals and plans for expansion), and identify presentpractices for handling manure. Resource concernsinclude potential environmental risks, such as runofffrom feedlots, proximity to streams and lakes, anderoding cropland. Based on this information the plan-ner would develop several alternatives the operationcould use to meet CNMP criteria. The preparation ofthe alternatives would involve developing preliminarydesigns for structural practices, estimating the acresand cropping practices needed to utilize manurenutrients efficiently, and determining the conservationsystem needed to control erosion on acres receivingmanure. The planner would then meet with the opera-tor again to review alternatives and assist with theselection. A CNMP would then be prepared.
Table 33 Annual average recordkeeping costs per farm,by livestock type and farm size
Dominant livestock type or farm Number Record-of farms keeping
costs
Fattened cattle 10,159 142
Milk cows 79,318 160
Swine 32,955 224
Turkeys 3,213 90
Broilers 16,251 90
Layers/pullets 5,326 136
Confined heifers/veal 4,011 117
Small farms with confined 42,565 54livestock types
Pastured livestock types 61,272 54
Specialty livestock types 2,131 54
Large 19,746 168
Medium 39,437 150
Small 198,018 106
All CNMP farms 257,201 117
94
Costs Associated with Development and Implementation of Comprehensive Nutrient Management Plans
Part I—Nutrient Management, Land Treatment, Manure and Wastewater Handling and Storage, and Recordkeeping
Once a CNMP has been planned and an alternativeselected by the operator, it is necessary to design thestructures that need to be installed or practices thatneed to be implemented. For structures this involvestaking soil borings in areas where ponds and lagoonswill be built, performing a detailed survey (with sur-veyor instruments) of all production areas includingareas proposed for structure locations, and surveys forland treatment practices. Design would also involveplotting of the surveys, making the necessary structuredesign calculations, and drafting the final design thatwill be used to guide construction, including the neces-sary construction specifications to support the draw-ings. For nutrient management it would involve devel-oping the nutrient balance calculations and specifica-tion of a nutrient management plan.
Implementation involves the assistance needed toensure that the installation of practices and structuresmeet the designs and specifications developed. Itgenerally involves providing layout stakes for a con-tractor to follow, performing necessary material testsonsite (soil compaction tests, for example), perform-ing periodic spot surveys to ensure constructed prac-tices are being installed according to designs, andperforming a final checkout survey after the practice isinstalled. It would also involve working with the opera-tor to calibrate manure-spreading equipment.
After a practice or a plan has been installed, it isnecessary to follow up by returning to the operationto ensure the practice is working properly and to makechanges or adjustments to the CNMP if needed.
CNMP development costs were estimated in terms oftechnical assistance hours needed to accomplish thefour primary functions defined above. Separate esti-mates were made for land treatment practices, nutri-ent management, and manure and wastewater han-dling and storage. Technical assistance associatedwith recordkeeping is embedded in the estimates forthese three elements, and could not be estimatedseparately.
The technical assistance generally associated with theland treatment practices element can involve arange of technical disciplines from engineering to soilconservation. Practices used to satisfy the criteriaestablished for this element are management practices(residue management, stripcropping) and structuralpractices (terraces, divisions, sediment basins).
Assistance would typically be provided by soil conser-vationists, agronomists, nutrient management special-ists, rangeland specialists, and engineers.
Technical assistance for the manure and wastewater
handling and storage element is primarily engineer-ing. The majority of the time accounted for under thiselement involves the design and installation assistanceassociated with waste handling, storage, and treat-ment structural practices. Many of the practices cov-ered under this element require a licensed engineer’sinvolvement by State Law. However, some of theresource assessment and preliminary design calcula-tions associated with the volume of waste generated,proportion of nutrients in manure, and locating cleanwater diversions can be performed by soil conserva-tionists, agronomists, or nutrient management special-ists.
Technical assistance for the nutrient management
element is generally associated with technical disci-plines trained in crop management activities. Typi-cally, this element of a CNMP would be addressed by anutrient management specialist or agronomist. How-ever, because of the close interaction between nutri-ent management and soil erosion, it is anticipated thatmany soil conservationists would also fill this role.
Estimates of technical assistance hours do not includeadministrative time associated with carrying outvarious additional functions that usually take place aspart of the overall implementation process, such asmaking Federal, State, Tribal, or local incentive pro-gram eligibility determinations, assisting operatorswith the completion of State, Tribal, and local permitapplications, and various agency performance report-ing and documentation activities.
Estimates of CNMP development costs also do not
include the time spent by the operator working withthe technical specialists to produce the plan. Depend-ing on the complexity of the operation and the avail-ability of records, the economic value of time spent bythe operator could be significant.

95
Costs Associated with Development and Implementation of Comprehensive Nutrient Management Plans
Part I—Nutrient Management, Land Treatment, Manure and Wastewater Handling and Storage, and Recordkeeping
Estimating the costs of developingCNMPs
Estimates of technical assistance hours were based onthe Fiscal Year 2001 National NRCS/PartnershipWorkload Analysis (2001 WLA). In fiscal year 2001,the NRCS conducted a workload analysis of the tech-nical assistance time associated with assisting produc-ers to plan and implement various conservation sys-tems and practices. The purpose of the 2001 WLA wasto analyze the conservation workload of NRCS and itsconservation partners using 44 Core Work Products(CWPs) to define field activities. These 44 CWPscapture a broad range of activities from systemsplanning to various administrative and program sup-port functions. Each CWP activity is further defined byspecific tasks associated with its completion. From 5to 10 tasks define a CWP. The 2001 WLA databasewas developed by 218 Regional Time Teams (RTTs)consisting of NRCS and technical staff from partner
organizations familiar with that region’s specificconservation operations.
At the time the 2001 WLA was conducted, the techni-cal requirements associated with a CNMP had not yetbeen defined. Therefore, the 2001 WLA did not containa specific CWP that addressed CNMPs. However, bycombining time estimates from 15 of the relevantCWPs and selecting specific tasks that would beincluded in development of a CNMP, an estimate wasmade of technical assistance hours associated withCNMP development. A list of the 15 CWPs and specifictasks that were used to estimate CNMP technicalassistance hours for each of the three CNMP elementsis presented in table 34. Technical assistance hourswere estimated for each of the four primary functions—alternatives development, design, implementation,and followup—by assigning the various tasks to eachfunction.
Table 34 Core work products (CWPs) and specific tasks associated with CNMP elements
CWP CWP Title CNMP Element Specific tasks*number
01a Conservation Systems on Land Treatment Practices Recognize problems, determine land user needs,Cropland (Planning) resource assessment, resource evaluation, evalu-
ate data, develop alternatives, formulate deci-sions, travel time, followup.
01b Conservation Systems on Land Treatment Practices Prepare designs, provide maintenance informa-Cropland (Application) tion, solicit necessary reviews, travel time, layout
practices, check out practices, certify practices.
02a Conservation Systems on Land Treatment Practices Recognize problems, determine land user needs,Rangeland (Planning) resource assessment, resource evaluation, evalu-
ate data, develop alternatives, formulate deci-sions, travel time, followup.
02b Conservation Systems on Land Treatment Practices Prepare designs, provide maintenance informa-Rangeland (Application) tion, solicit necessary reviews, travel time, layout
practices, check out practices, certify practices.
03a Conservation Systems on Land Treatment Practices Recognize problems, determine land user needs,Pastureland (Planning) resource assessment, resource evaluation, evalu-
ate data, develop alternatives, formulate deci-sions, travel time, followup.
03b Conservation Systems on Land Treatment Practices Prepare designs, provide maintenance informa-Pastureland (Application) tion, solicit necessary reviews, travel time, layout
practices, check out practices, certify practices.See footnote at end of table.
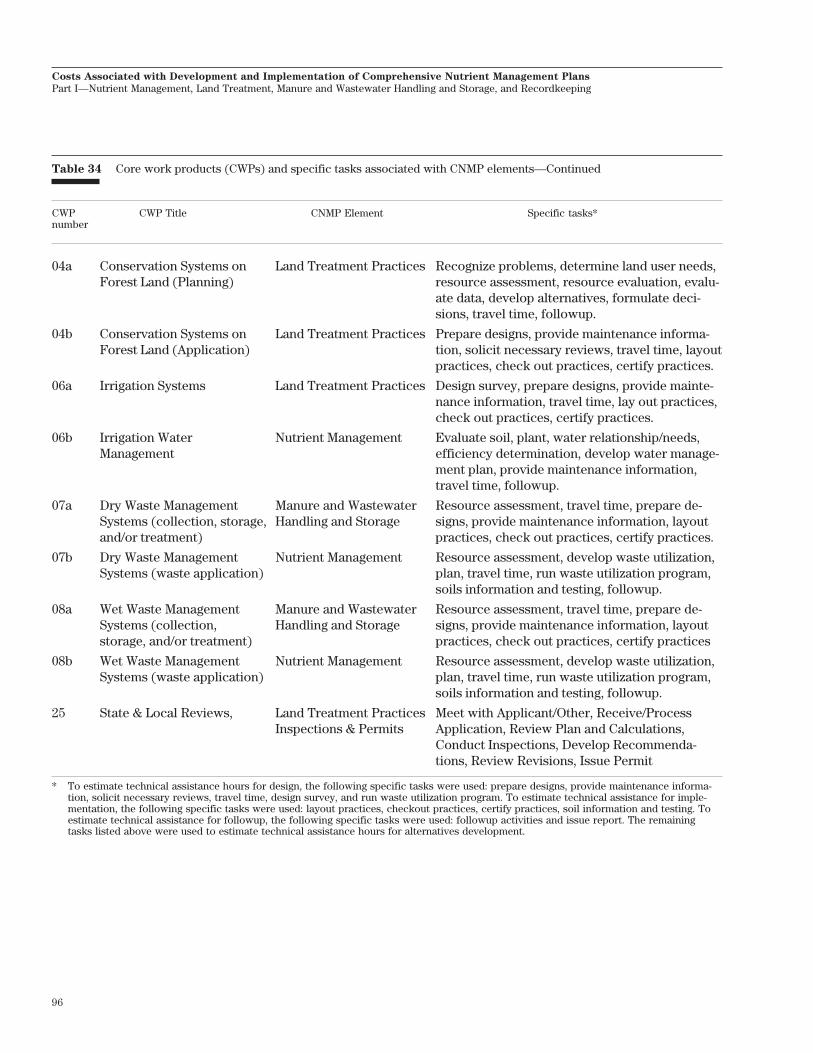
96
Costs Associated with Development and Implementation of Comprehensive Nutrient Management Plans
Part I—Nutrient Management, Land Treatment, Manure and Wastewater Handling and Storage, and Recordkeeping
Table 34 Core work products (CWPs) and specific tasks associated with CNMP elements—Continued
CWP CWP Title CNMP Element Specific tasks*number
04a Conservation Systems on Land Treatment Practices Recognize problems, determine land user needs,Forest Land (Planning) resource assessment, resource evaluation, evalu-
ate data, develop alternatives, formulate deci-sions, travel time, followup.
04b Conservation Systems on Land Treatment Practices Prepare designs, provide maintenance informa-Forest Land (Application) tion, solicit necessary reviews, travel time, layout
practices, check out practices, certify practices.
06a Irrigation Systems Land Treatment Practices Design survey, prepare designs, provide mainte-nance information, travel time, lay out practices,check out practices, certify practices.
06b Irrigation Water Nutrient Management Evaluate soil, plant, water relationship/needs,Management efficiency determination, develop water manage-
ment plan, provide maintenance information,travel time, followup.
07a Dry Waste Management Manure and Wastewater Resource assessment, travel time, prepare de-Systems (collection, storage, Handling and Storage signs, provide maintenance information, layoutand/or treatment) practices, check out practices, certify practices.
07b Dry Waste Management Nutrient Management Resource assessment, develop waste utilization,Systems (waste application) plan, travel time, run waste utilization program,
soils information and testing, followup.
08a Wet Waste Management Manure and Wastewater Resource assessment, travel time, prepare de-Systems (collection, Handling and Storage signs, provide maintenance information, layoutstorage, and/or treatment) practices, check out practices, certify practices
08b Wet Waste Management Nutrient Management Resource assessment, develop waste utilization,Systems (waste application) plan, travel time, run waste utilization program,
soils information and testing, followup.
25 State & Local Reviews, Land Treatment Practices Meet with Applicant/Other, Receive/ProcessInspections & Permits Application, Review Plan and Calculations,
Conduct Inspections, Develop Recommenda-tions, Review Revisions, Issue Permit
* To estimate technical assistance hours for design, the following specific tasks were used: prepare designs, provide maintenance informa-tion, solicit necessary reviews, travel time, design survey, and run waste utilization program. To estimate technical assistance for imple-mentation, the following specific tasks were used: layout practices, checkout practices, certify practices, soil information and testing. Toestimate technical assistance for followup, the following specific tasks were used: followup activities and issue report. The remainingtasks listed above were used to estimate technical assistance hours for alternatives development.

97
Costs Associated with Development and Implementation of Comprehensive Nutrient Management Plans
Part I—Nutrient Management, Land Treatment, Manure and Wastewater Handling and Storage, and Recordkeeping
Adjustments were made to account for specific CNMP-related tasks that had not been incorporated into theoriginal CWP estimates. Adjustments to the 2001 WLAdata were based on a subset of 20 RTTs in regionswith significant livestock production. Each of the 20representative RTTs evaluated the original data in the2001 WLA for the 15 CWPs associated with a CNMP bycomparing the original assumptions to the new techni-cal requirements for CNMP development and imple-mentation. The adjustments developed by each rangedfrom zero (no change) to an increase of 400 percent;the average adjustment was 17 percent.
For the land treatment practices element, technicalassistance hours were based on the incrementalchange calculated using the adjustment factors. Thetotal time estimate in the 2001 WLA database wouldoverstate the hours needed specifically to develop aCNMP. For example, consider CWP-01, ConservationSystems on Cropland (Planning). Under existing USDAprograms, most cropland already has some kind ofplan to address soil erosion criteria. By using theincremental change the estimation would capture onlythe time associated with adjusting the existing planwhere needed to address the higher standards estab-lished by the CNMP. The total time associated withland treatment for each of the technical assistancefunctions is the sum of the incremental changes for allthe CWPs used to define this element.
Two CWPs were used to define the manure and waste-water storage and handling element, CWP–07a andCWP–08a. The difference between the two is that oneis representative of animal feeding operations thatmanage their manure primarily as a solid (dry), andthe other is representative of operations that primarilymanage their manure as a liquid (wet). The total timeused for estimation of this element was the base timeestablished in the 2001 WLA plus the incrementalchange. The base time identified in the 2001 WLA forthese CWPs was included in the time accountingbecause, unlike the CWPs for land treatment, theseCWPs are dedicated to animal feeding operations. Theincremental change that is applied to these CWPsreflects the comparison of the new CNMP require-ments and new conservation practice standards to thewaste management system criteria that existed at thetime the 2001 WLA was conducted.
The technical assistance time used for the nutrientmanagement element was based on three CWPs:
CWP–06b Irrigation Water Management, CWP–07b DryWaste Management Systems (waste application), andCWP–08b Wet Waste Management Systems (wasteapplication). Only the incremental change associatedwith CWP–06b was included. It was assumed that forirrigation water management to apply, an irrigationsystem would already be in place. If an irrigationsystem was in place, some form of irrigation watermanagement was already in use. For CWP–07b andCWP–08b, the estimation used the sum of the 2001WLA base time plus the incremental change becausethese CWPs were dedicated to animal feeding opera-tions in the 2001 WLA.
Separate estimates were made for each of the modelfarms described previously (see tables 2 to 5). (Themodel farm structure was the same as that used toestimate recoverable manure in appendix B.) The 2001WLA database provided descriptions of the farms thatwere used as a basis for the time estimates. The de-scriptions included the size of the operation, type ofmanure management system (wet or dry), and domi-nant livestock type. Because these were not exactlythe same as the definitions for model farms, some RTTestimates were assigned to more than one model farm.The number of RTT estimates assigned to a modelfarm ranged from 1 to 34. The average of the RTTestimates was used to represent technical assistancehours for each model farm. Technical assistanceestimates for each model farm are presented in table35.
An additional adjustment factor was developed toaccount for mismatches between the size of opera-tions specified in the 2001 WLA database and themodel farm size. In some cases the size of the modelfarm was smaller than most of the RTT estimatesassigned to it, so the number of hours needed to beadjusted downward. In other cases the size of themodel farm was larger than most of the RTT estimatesassigned to it, so the number of hours needed to beadjusted upward. In yet other cases the match wasclose enough to need only a small, or no, adjustment.Adjustment factors ranged from 0.6 for some smallmodel farms to 1.7 for large model farms. The finalestimate of technical assistance hours for each modelfarm was obtained by multiplying the estimate ofhours in table 35 by the size adjustment factor, alsopresented in table 35.
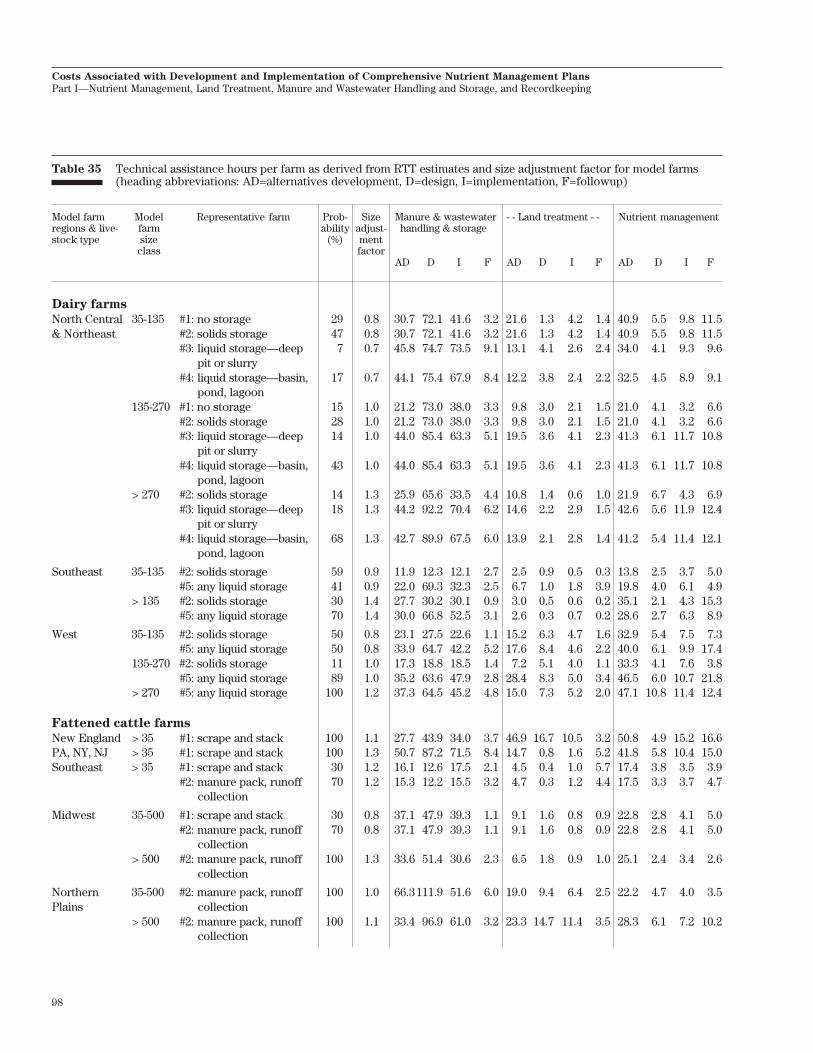
98
Costs Associated with Development and Implementation of Comprehensive Nutrient Management Plans
Part I—Nutrient Management, Land Treatment, Manure and Wastewater Handling and Storage, and Recordkeeping
Table 35 Technical assistance hours per farm as derived from RTT estimates and size adjustment factor for model farms(heading abbreviations: AD=alternatives development, D=design, I=implementation, F=followup)
Model farm Model Representative farm Prob- Size Manure & wastewater - - Land treatment - - Nutrient managementregions & live- farm ability adjust- handling & storagestock type size (%) ment
class factorAD D I F AD D I F AD D I F
Dairy farms
North Central 35-135 #1: no storage 29 0.8 30.7 72.1 41.6 3.2 21.6 1.3 4.2 1.4 40.9 5.5 9.8 11.5& Northeast #2: solids storage 47 0.8 30.7 72.1 41.6 3.2 21.6 1.3 4.2 1.4 40.9 5.5 9.8 11.5
#3: liquid storage—deep 7 0.7 45.8 74.7 73.5 9.1 13.1 4.1 2.6 2.4 34.0 4.1 9.3 9.6pit or slurry
#4: liquid storage—basin, 17 0.7 44.1 75.4 67.9 8.4 12.2 3.8 2.4 2.2 32.5 4.5 8.9 9.1pond, lagoon
135-270 #1: no storage 15 1.0 21.2 73.0 38.0 3.3 9.8 3.0 2.1 1.5 21.0 4.1 3.2 6.6#2: solids storage 28 1.0 21.2 73.0 38.0 3.3 9.8 3.0 2.1 1.5 21.0 4.1 3.2 6.6#3: liquid storage—deep 14 1.0 44.0 85.4 63.3 5.1 19.5 3.6 4.1 2.3 41.3 6.1 11.7 10.8
pit or slurry#4: liquid storage—basin, 43 1.0 44.0 85.4 63.3 5.1 19.5 3.6 4.1 2.3 41.3 6.1 11.7 10.8
pond, lagoon> 270 #2: solids storage 14 1.3 25.9 65.6 33.5 4.4 10.8 1.4 0.6 1.0 21.9 6.7 4.3 6.9
#3: liquid storage—deep 18 1.3 44.2 92.2 70.4 6.2 14.6 2.2 2.9 1.5 42.6 5.6 11.9 12.4pit or slurry
#4: liquid storage—basin, 68 1.3 42.7 89.9 67.5 6.0 13.9 2.1 2.8 1.4 41.2 5.4 11.4 12.1pond, lagoon
Southeast 35-135 #2: solids storage 59 0.9 11.9 12.3 12.1 2.7 2.5 0.9 0.5 0.3 13.8 2.5 3.7 5.0#5: any liquid storage 41 0.9 22.0 69.3 32.3 2.5 6.7 1.0 1.8 3.9 19.8 4.0 6.1 4.9
> 135 #2: solids storage 30 1.4 27.7 30.2 30.1 0.9 3.0 0.5 0.6 0.2 35.1 2.1 4.3 15.3#5: any liquid storage 70 1.4 30.0 66.8 52.5 3.1 2.6 0.3 0.7 0.2 28.6 2.7 6.3 8.9
West 35-135 #2: solids storage 50 0.8 23.1 27.5 22.6 1.1 15.2 6.3 4.7 1.6 32.9 5.4 7.5 7.3#5: any liquid storage 50 0.8 33.9 64.7 42.2 5.2 17.6 8.4 4.6 2.2 40.0 6.1 9.9 17.4
135-270 #2: solids storage 11 1.0 17.3 18.8 18.5 1.4 7.2 5.1 4.0 1.1 33.3 4.1 7.6 3.8#5: any liquid storage 89 1.0 35.2 63.6 47.9 2.8 28.4 8.3 5.0 3.4 46.5 6.0 10.7 21.8
> 270 #5: any liquid storage 100 1.2 37.3 64.5 45.2 4.8 15.0 7.3 5.2 2.0 47.1 10.8 11.4 12.4
Fattened cattle farms
New England > 35 #1: scrape and stack 100 1.1 27.7 43.9 34.0 3.7 46.9 16.7 10.5 3.2 50.8 4.9 15.2 16.6PA, NY, NJ > 35 #1: scrape and stack 100 1.3 50.7 87.2 71.5 8.4 14.7 0.8 1.6 5.2 41.8 5.8 10.4 15.0Southeast > 35 #1: scrape and stack 30 1.2 16.1 12.6 17.5 2.1 4.5 0.4 1.0 5.7 17.4 3.8 3.5 3.9
#2: manure pack, runoff 70 1.2 15.3 12.2 15.5 3.2 4.7 0.3 1.2 4.4 17.5 3.3 3.7 4.7collection
Midwest 35-500 #1: scrape and stack 30 0.8 37.1 47.9 39.3 1.1 9.1 1.6 0.8 0.9 22.8 2.8 4.1 5.0#2: manure pack, runoff 70 0.8 37.1 47.9 39.3 1.1 9.1 1.6 0.8 0.9 22.8 2.8 4.1 5.0
collection> 500 #2: manure pack, runoff 100 1.3 33.6 51.4 30.6 2.3 6.5 1.8 0.9 1.0 25.1 2.4 3.4 2.6
collection
Northern 35-500 #2: manure pack, runoff 100 1.0 66.3111.9 51.6 6.0 19.0 9.4 6.4 2.5 22.2 4.7 4.0 3.5Plains collection
> 500 #2: manure pack, runoff 100 1.1 33.4 96.9 61.0 3.2 23.3 14.7 11.4 3.5 28.3 6.1 7.2 10.2collection
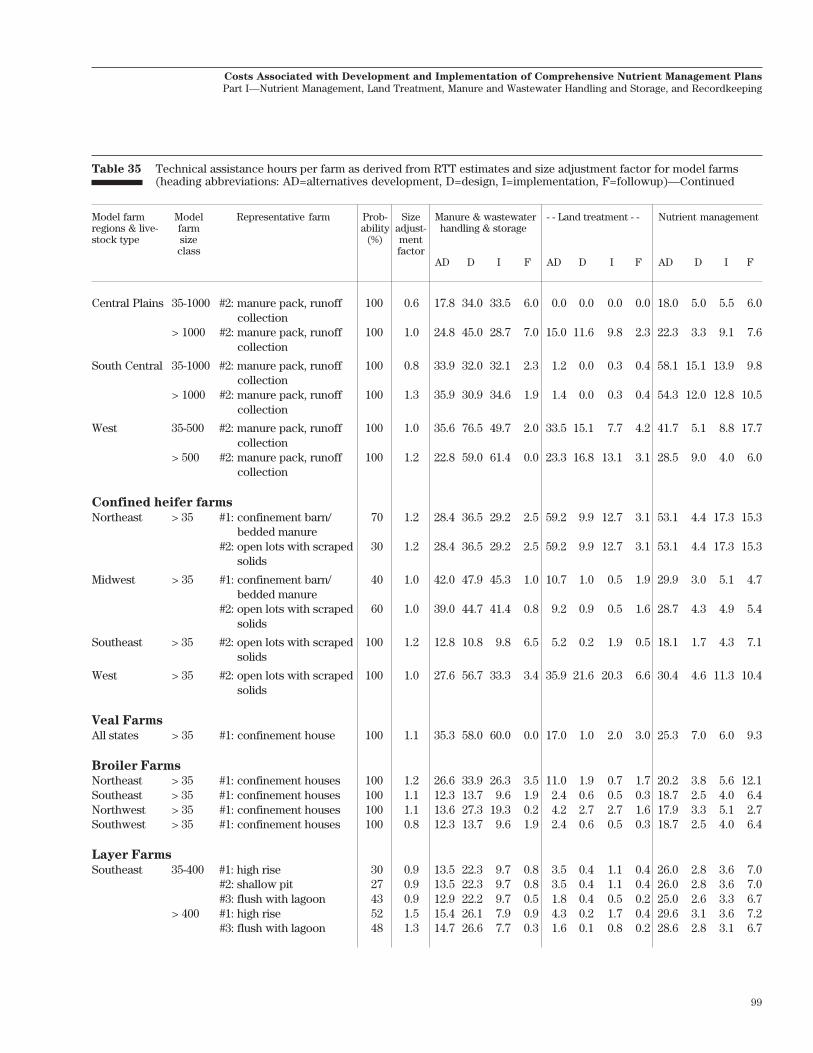
99
Costs Associated with Development and Implementation of Comprehensive Nutrient Management Plans
Part I—Nutrient Management, Land Treatment, Manure and Wastewater Handling and Storage, and Recordkeeping
Table 35 Technical assistance hours per farm as derived from RTT estimates and size adjustment factor for model farms(heading abbreviations: AD=alternatives development, D=design, I=implementation, F=followup)—Continued
Model farm Model Representative farm Prob- Size Manure & wastewater - - Land treatment - - Nutrient managementregions & live- farm ability adjust- handling & storagestock type size (%) ment
class factorAD D I F AD D I F AD D I F
Central Plains 35-1000 #2: manure pack, runoff 100 0.6 17.8 34.0 33.5 6.0 0.0 0.0 0.0 0.0 18.0 5.0 5.5 6.0collection
> 1000 #2: manure pack, runoff 100 1.0 24.8 45.0 28.7 7.0 15.0 11.6 9.8 2.3 22.3 3.3 9.1 7.6collection
South Central 35-1000 #2: manure pack, runoff 100 0.8 33.9 32.0 32.1 2.3 1.2 0.0 0.3 0.4 58.1 15.1 13.9 9.8collection
> 1000 #2: manure pack, runoff 100 1.3 35.9 30.9 34.6 1.9 1.4 0.0 0.3 0.4 54.3 12.0 12.8 10.5collection
West 35-500 #2: manure pack, runoff 100 1.0 35.6 76.5 49.7 2.0 33.5 15.1 7.7 4.2 41.7 5.1 8.8 17.7collection
> 500 #2: manure pack, runoff 100 1.2 22.8 59.0 61.4 0.0 23.3 16.8 13.1 3.1 28.5 9.0 4.0 6.0collection
Confined heifer farms
Northeast > 35 #1: confinement barn/ 70 1.2 28.4 36.5 29.2 2.5 59.2 9.9 12.7 3.1 53.1 4.4 17.3 15.3bedded manure
#2: open lots with scraped 30 1.2 28.4 36.5 29.2 2.5 59.2 9.9 12.7 3.1 53.1 4.4 17.3 15.3solids
Midwest > 35 #1: confinement barn/ 40 1.0 42.0 47.9 45.3 1.0 10.7 1.0 0.5 1.9 29.9 3.0 5.1 4.7bedded manure
#2: open lots with scraped 60 1.0 39.0 44.7 41.4 0.8 9.2 0.9 0.5 1.6 28.7 4.3 4.9 5.4solids
Southeast > 35 #2: open lots with scraped 100 1.2 12.8 10.8 9.8 6.5 5.2 0.2 1.9 0.5 18.1 1.7 4.3 7.1solids
West > 35 #2: open lots with scraped 100 1.0 27.6 56.7 33.3 3.4 35.9 21.6 20.3 6.6 30.4 4.6 11.3 10.4solids
Veal Farms
All states > 35 #1: confinement house 100 1.1 35.3 58.0 60.0 0.0 17.0 1.0 2.0 3.0 25.3 7.0 6.0 9.3
Broiler Farms
Northeast > 35 #1: confinement houses 100 1.2 26.6 33.9 26.3 3.5 11.0 1.9 0.7 1.7 20.2 3.8 5.6 12.1Southeast > 35 #1: confinement houses 100 1.1 12.3 13.7 9.6 1.9 2.4 0.6 0.5 0.3 18.7 2.5 4.0 6.4Northwest > 35 #1: confinement houses 100 1.1 13.6 27.3 19.3 0.2 4.2 2.7 2.7 1.6 17.9 3.3 5.1 2.7Southwest > 35 #1: confinement houses 100 0.8 12.3 13.7 9.6 1.9 2.4 0.6 0.5 0.3 18.7 2.5 4.0 6.4
Layer Farms
Southeast 35-400 #1: high rise 30 0.9 13.5 22.3 9.7 0.8 3.5 0.4 1.1 0.4 26.0 2.8 3.6 7.0#2: shallow pit 27 0.9 13.5 22.3 9.7 0.8 3.5 0.4 1.1 0.4 26.0 2.8 3.6 7.0#3: flush with lagoon 43 0.9 12.9 22.2 9.7 0.5 1.8 0.4 0.5 0.2 25.0 2.6 3.3 6.7
> 400 #1: high rise 52 1.5 15.4 26.1 7.9 0.9 4.3 0.2 1.7 0.4 29.6 3.1 3.6 7.2#3: flush with lagoon 48 1.3 14.7 26.6 7.7 0.3 1.6 0.1 0.8 0.2 28.6 2.8 3.1 6.7
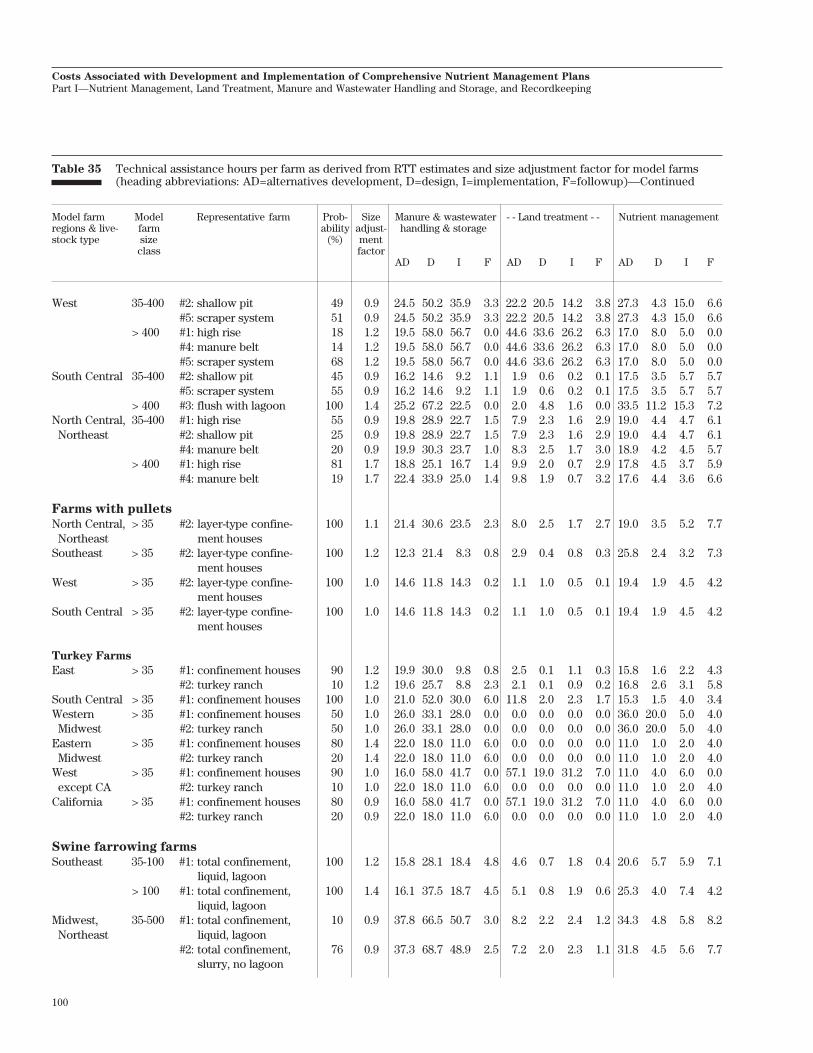
100
Costs Associated with Development and Implementation of Comprehensive Nutrient Management Plans
Part I—Nutrient Management, Land Treatment, Manure and Wastewater Handling and Storage, and Recordkeeping
Table 35 Technical assistance hours per farm as derived from RTT estimates and size adjustment factor for model farms(heading abbreviations: AD=alternatives development, D=design, I=implementation, F=followup)—Continued
Model farm Model Representative farm Prob- Size Manure & wastewater - - Land treatment - - Nutrient managementregions & live- farm ability adjust- handling & storagestock type size (%) ment
class factorAD D I F AD D I F AD D I F
West 35-400 #2: shallow pit 49 0.9 24.5 50.2 35.9 3.3 22.2 20.5 14.2 3.8 27.3 4.3 15.0 6.6#5: scraper system 51 0.9 24.5 50.2 35.9 3.3 22.2 20.5 14.2 3.8 27.3 4.3 15.0 6.6
> 400 #1: high rise 18 1.2 19.5 58.0 56.7 0.0 44.6 33.6 26.2 6.3 17.0 8.0 5.0 0.0#4: manure belt 14 1.2 19.5 58.0 56.7 0.0 44.6 33.6 26.2 6.3 17.0 8.0 5.0 0.0#5: scraper system 68 1.2 19.5 58.0 56.7 0.0 44.6 33.6 26.2 6.3 17.0 8.0 5.0 0.0
South Central 35-400 #2: shallow pit 45 0.9 16.2 14.6 9.2 1.1 1.9 0.6 0.2 0.1 17.5 3.5 5.7 5.7#5: scraper system 55 0.9 16.2 14.6 9.2 1.1 1.9 0.6 0.2 0.1 17.5 3.5 5.7 5.7
> 400 #3: flush with lagoon 100 1.4 25.2 67.2 22.5 0.0 2.0 4.8 1.6 0.0 33.5 11.2 15.3 7.2North Central, 35-400 #1: high rise 55 0.9 19.8 28.9 22.7 1.5 7.9 2.3 1.6 2.9 19.0 4.4 4.7 6.1
Northeast #2: shallow pit 25 0.9 19.8 28.9 22.7 1.5 7.9 2.3 1.6 2.9 19.0 4.4 4.7 6.1#4: manure belt 20 0.9 19.9 30.3 23.7 1.0 8.3 2.5 1.7 3.0 18.9 4.2 4.5 5.7
> 400 #1: high rise 81 1.7 18.8 25.1 16.7 1.4 9.9 2.0 0.7 2.9 17.8 4.5 3.7 5.9#4: manure belt 19 1.7 22.4 33.9 25.0 1.4 9.8 1.9 0.7 3.2 17.6 4.4 3.6 6.6
Farms with pullets
North Central, > 35 #2: layer-type confine- 100 1.1 21.4 30.6 23.5 2.3 8.0 2.5 1.7 2.7 19.0 3.5 5.2 7.7Northeast ment houses
Southeast > 35 #2: layer-type confine- 100 1.2 12.3 21.4 8.3 0.8 2.9 0.4 0.8 0.3 25.8 2.4 3.2 7.3ment houses
West > 35 #2: layer-type confine- 100 1.0 14.6 11.8 14.3 0.2 1.1 1.0 0.5 0.1 19.4 1.9 4.5 4.2ment houses
South Central > 35 #2: layer-type confine- 100 1.0 14.6 11.8 14.3 0.2 1.1 1.0 0.5 0.1 19.4 1.9 4.5 4.2ment houses
Turkey Farms
East > 35 #1: confinement houses 90 1.2 19.9 30.0 9.8 0.8 2.5 0.1 1.1 0.3 15.8 1.6 2.2 4.3#2: turkey ranch 10 1.2 19.6 25.7 8.8 2.3 2.1 0.1 0.9 0.2 16.8 2.6 3.1 5.8
South Central > 35 #1: confinement houses 100 1.0 21.0 52.0 30.0 6.0 11.8 2.0 2.3 1.7 15.3 1.5 4.0 3.4Western > 35 #1: confinement houses 50 1.0 26.0 33.1 28.0 0.0 0.0 0.0 0.0 0.0 36.0 20.0 5.0 4.0
Midwest #2: turkey ranch 50 1.0 26.0 33.1 28.0 0.0 0.0 0.0 0.0 0.0 36.0 20.0 5.0 4.0Eastern > 35 #1: confinement houses 80 1.4 22.0 18.0 11.0 6.0 0.0 0.0 0.0 0.0 11.0 1.0 2.0 4.0
Midwest #2: turkey ranch 20 1.4 22.0 18.0 11.0 6.0 0.0 0.0 0.0 0.0 11.0 1.0 2.0 4.0West > 35 #1: confinement houses 90 1.0 16.0 58.0 41.7 0.0 57.1 19.0 31.2 7.0 11.0 4.0 6.0 0.0
except CA #2: turkey ranch 10 1.0 22.0 18.0 11.0 6.0 0.0 0.0 0.0 0.0 11.0 1.0 2.0 4.0California > 35 #1: confinement houses 80 0.9 16.0 58.0 41.7 0.0 57.1 19.0 31.2 7.0 11.0 4.0 6.0 0.0
#2: turkey ranch 20 0.9 22.0 18.0 11.0 6.0 0.0 0.0 0.0 0.0 11.0 1.0 2.0 4.0
Swine farrowing farms
Southeast 35-100 #1: total confinement, 100 1.2 15.8 28.1 18.4 4.8 4.6 0.7 1.8 0.4 20.6 5.7 5.9 7.1liquid, lagoon
> 100 #1: total confinement, 100 1.4 16.1 37.5 18.7 4.5 5.1 0.8 1.9 0.6 25.3 4.0 7.4 4.2liquid, lagoon
Midwest, 35-500 #1: total confinement, 10 0.9 37.8 66.5 50.7 3.0 8.2 2.2 2.4 1.2 34.3 4.8 5.8 8.2Northeast liquid, lagoon
#2: total confinement, 76 0.9 37.3 68.7 48.9 2.5 7.2 2.0 2.3 1.1 31.8 4.5 5.6 7.7slurry, no lagoon
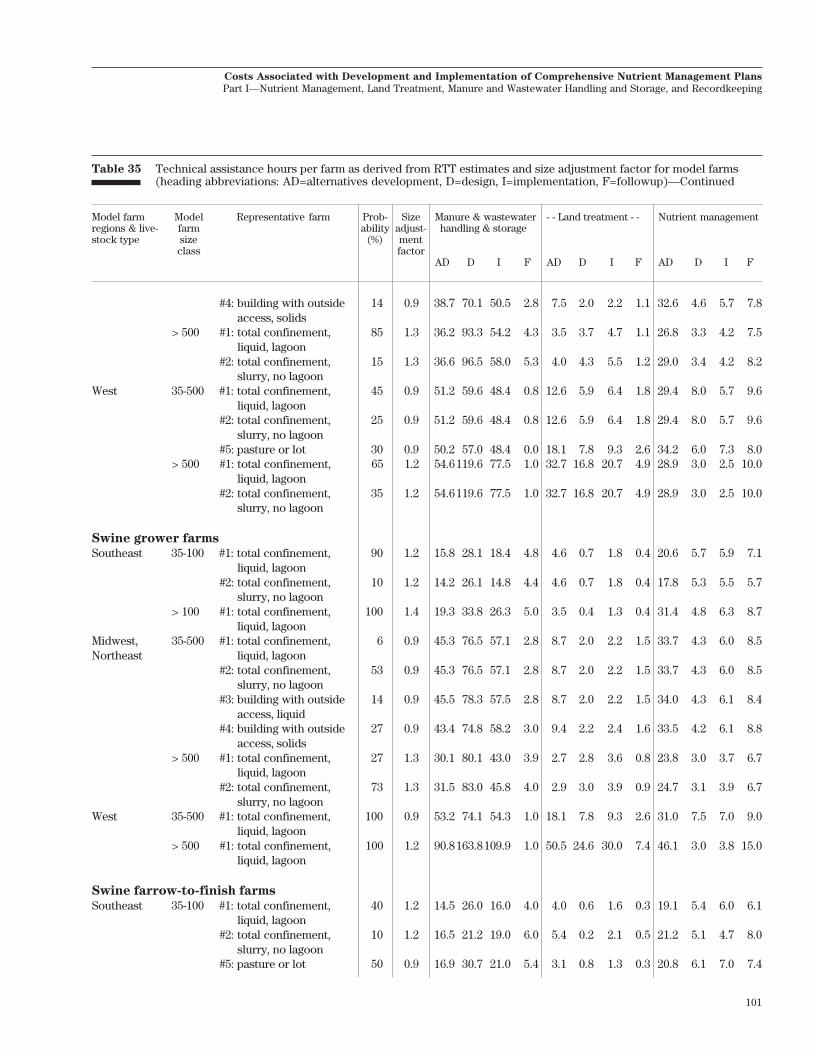
101
Costs Associated with Development and Implementation of Comprehensive Nutrient Management Plans
Part I—Nutrient Management, Land Treatment, Manure and Wastewater Handling and Storage, and Recordkeeping
Table 35 Technical assistance hours per farm as derived from RTT estimates and size adjustment factor for model farms(heading abbreviations: AD=alternatives development, D=design, I=implementation, F=followup)—Continued
Model farm Model Representative farm Prob- Size Manure & wastewater - - Land treatment - - Nutrient managementregions & live- farm ability adjust- handling & storagestock type size (%) ment
class factorAD D I F AD D I F AD D I F
#4: building with outside 14 0.9 38.7 70.1 50.5 2.8 7.5 2.0 2.2 1.1 32.6 4.6 5.7 7.8access, solids
> 500 #1: total confinement, 85 1.3 36.2 93.3 54.2 4.3 3.5 3.7 4.7 1.1 26.8 3.3 4.2 7.5liquid, lagoon
#2: total confinement, 15 1.3 36.6 96.5 58.0 5.3 4.0 4.3 5.5 1.2 29.0 3.4 4.2 8.2slurry, no lagoon
West 35-500 #1: total confinement, 45 0.9 51.2 59.6 48.4 0.8 12.6 5.9 6.4 1.8 29.4 8.0 5.7 9.6liquid, lagoon
#2: total confinement, 25 0.9 51.2 59.6 48.4 0.8 12.6 5.9 6.4 1.8 29.4 8.0 5.7 9.6slurry, no lagoon
#5: pasture or lot 30 0.9 50.2 57.0 48.4 0.0 18.1 7.8 9.3 2.6 34.2 6.0 7.3 8.0> 500 #1: total confinement, 65 1.2 54.6119.6 77.5 1.0 32.7 16.8 20.7 4.9 28.9 3.0 2.5 10.0
liquid, lagoon#2: total confinement, 35 1.2 54.6119.6 77.5 1.0 32.7 16.8 20.7 4.9 28.9 3.0 2.5 10.0
slurry, no lagoon
Swine grower farms
Southeast 35-100 #1: total confinement, 90 1.2 15.8 28.1 18.4 4.8 4.6 0.7 1.8 0.4 20.6 5.7 5.9 7.1liquid, lagoon
#2: total confinement, 10 1.2 14.2 26.1 14.8 4.4 4.6 0.7 1.8 0.4 17.8 5.3 5.5 5.7slurry, no lagoon
> 100 #1: total confinement, 100 1.4 19.3 33.8 26.3 5.0 3.5 0.4 1.3 0.4 31.4 4.8 6.3 8.7liquid, lagoon
Midwest, 35-500 #1: total confinement, 6 0.9 45.3 76.5 57.1 2.8 8.7 2.0 2.2 1.5 33.7 4.3 6.0 8.5Northeast liquid, lagoon
#2: total confinement, 53 0.9 45.3 76.5 57.1 2.8 8.7 2.0 2.2 1.5 33.7 4.3 6.0 8.5slurry, no lagoon
#3: building with outside 14 0.9 45.5 78.3 57.5 2.8 8.7 2.0 2.2 1.5 34.0 4.3 6.1 8.4access, liquid
#4: building with outside 27 0.9 43.4 74.8 58.2 3.0 9.4 2.2 2.4 1.6 33.5 4.2 6.1 8.8access, solids
> 500 #1: total confinement, 27 1.3 30.1 80.1 43.0 3.9 2.7 2.8 3.6 0.8 23.8 3.0 3.7 6.7liquid, lagoon
#2: total confinement, 73 1.3 31.5 83.0 45.8 4.0 2.9 3.0 3.9 0.9 24.7 3.1 3.9 6.7slurry, no lagoon
West 35-500 #1: total confinement, 100 0.9 53.2 74.1 54.3 1.0 18.1 7.8 9.3 2.6 31.0 7.5 7.0 9.0liquid, lagoon
> 500 #1: total confinement, 100 1.2 90.8163.8109.9 1.0 50.5 24.6 30.0 7.4 46.1 3.0 3.8 15.0liquid, lagoon
Swine farrow-to-finish farms
Southeast 35-100 #1: total confinement, 40 1.2 14.5 26.0 16.0 4.0 4.0 0.6 1.6 0.3 19.1 5.4 6.0 6.1liquid, lagoon
#2: total confinement, 10 1.2 16.5 21.2 19.0 6.0 5.4 0.2 2.1 0.5 21.2 5.1 4.7 8.0slurry, no lagoon
#5: pasture or lot 50 0.9 16.9 30.7 21.0 5.4 3.1 0.8 1.3 0.3 20.8 6.1 7.0 7.4
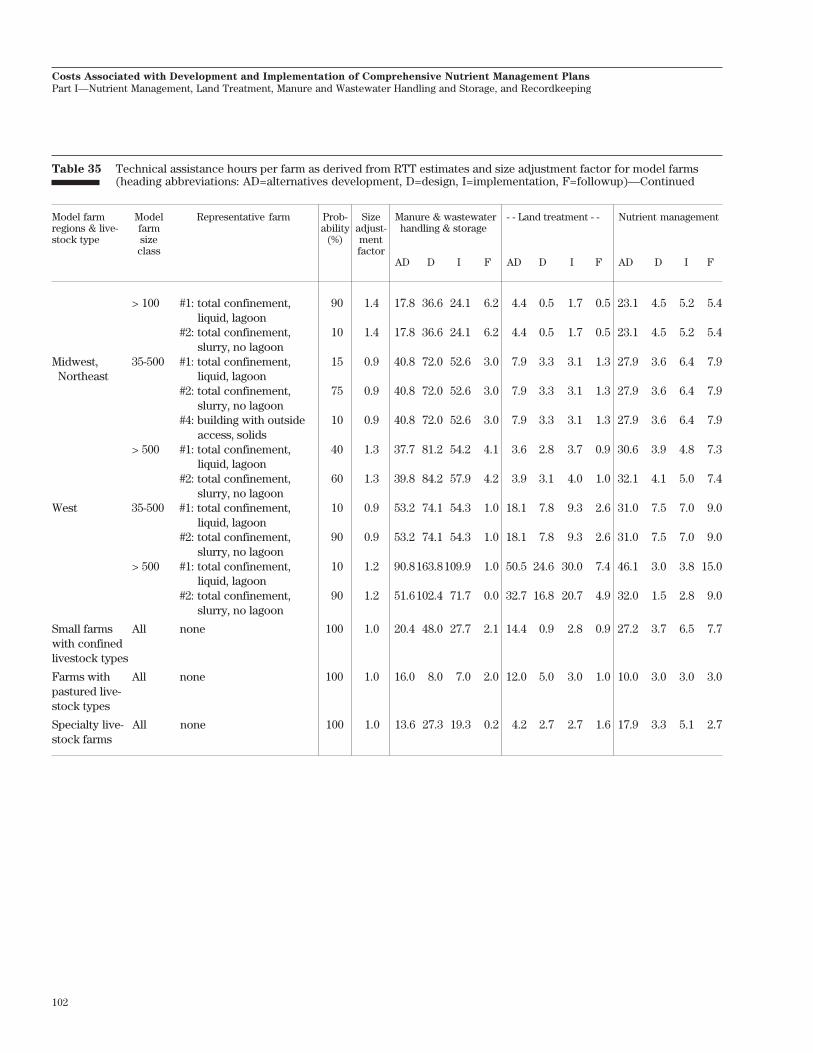
102
Costs Associated with Development and Implementation of Comprehensive Nutrient Management Plans
Part I—Nutrient Management, Land Treatment, Manure and Wastewater Handling and Storage, and Recordkeeping
Table 35 Technical assistance hours per farm as derived from RTT estimates and size adjustment factor for model farms(heading abbreviations: AD=alternatives development, D=design, I=implementation, F=followup)—Continued
Model farm Model Representative farm Prob- Size Manure & wastewater - - Land treatment - - Nutrient managementregions & live- farm ability adjust- handling & storagestock type size (%) ment
class factorAD D I F AD D I F AD D I F
> 100 #1: total confinement, 90 1.4 17.8 36.6 24.1 6.2 4.4 0.5 1.7 0.5 23.1 4.5 5.2 5.4liquid, lagoon
#2: total confinement, 10 1.4 17.8 36.6 24.1 6.2 4.4 0.5 1.7 0.5 23.1 4.5 5.2 5.4slurry, no lagoon
Midwest, 35-500 #1: total confinement, 15 0.9 40.8 72.0 52.6 3.0 7.9 3.3 3.1 1.3 27.9 3.6 6.4 7.9Northeast liquid, lagoon
#2: total confinement, 75 0.9 40.8 72.0 52.6 3.0 7.9 3.3 3.1 1.3 27.9 3.6 6.4 7.9slurry, no lagoon
#4: building with outside 10 0.9 40.8 72.0 52.6 3.0 7.9 3.3 3.1 1.3 27.9 3.6 6.4 7.9access, solids
> 500 #1: total confinement, 40 1.3 37.7 81.2 54.2 4.1 3.6 2.8 3.7 0.9 30.6 3.9 4.8 7.3liquid, lagoon
#2: total confinement, 60 1.3 39.8 84.2 57.9 4.2 3.9 3.1 4.0 1.0 32.1 4.1 5.0 7.4slurry, no lagoon
West 35-500 #1: total confinement, 10 0.9 53.2 74.1 54.3 1.0 18.1 7.8 9.3 2.6 31.0 7.5 7.0 9.0liquid, lagoon
#2: total confinement, 90 0.9 53.2 74.1 54.3 1.0 18.1 7.8 9.3 2.6 31.0 7.5 7.0 9.0slurry, no lagoon
> 500 #1: total confinement, 10 1.2 90.8163.8109.9 1.0 50.5 24.6 30.0 7.4 46.1 3.0 3.8 15.0liquid, lagoon
#2: total confinement, 90 1.2 51.6102.4 71.7 0.0 32.7 16.8 20.7 4.9 32.0 1.5 2.8 9.0slurry, no lagoon
Small farms All none 100 1.0 20.4 48.0 27.7 2.1 14.4 0.9 2.8 0.9 27.2 3.7 6.5 7.7with confinedlivestock types
Farms with All none 100 1.0 16.0 8.0 7.0 2.0 12.0 5.0 3.0 1.0 10.0 3.0 3.0 3.0pastured live-stock types
Specialty live- All none 100 1.0 13.6 27.3 19.3 0.2 4.2 2.7 2.7 1.6 17.9 3.3 5.1 2.7stock farms
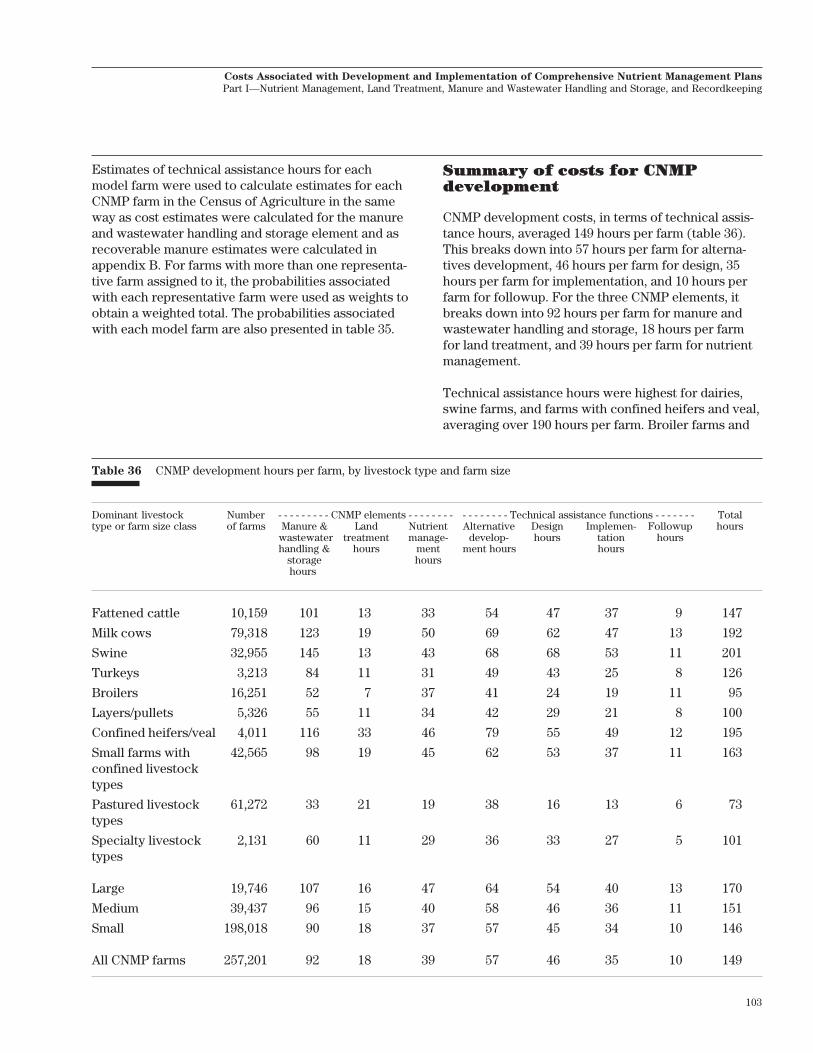
103
Costs Associated with Development and Implementation of Comprehensive Nutrient Management Plans
Part I—Nutrient Management, Land Treatment, Manure and Wastewater Handling and Storage, and Recordkeeping
Estimates of technical assistance hours for eachmodel farm were used to calculate estimates for eachCNMP farm in the Census of Agriculture in the sameway as cost estimates were calculated for the manureand wastewater handling and storage element and asrecoverable manure estimates were calculated inappendix B. For farms with more than one representa-tive farm assigned to it, the probabilities associatedwith each representative farm were used as weights toobtain a weighted total. The probabilities associatedwith each model farm are also presented in table 35.
Summary of costs for CNMPdevelopment
CNMP development costs, in terms of technical assis-tance hours, averaged 149 hours per farm (table 36).This breaks down into 57 hours per farm for alterna-tives development, 46 hours per farm for design, 35hours per farm for implementation, and 10 hours perfarm for followup. For the three CNMP elements, itbreaks down into 92 hours per farm for manure andwastewater handling and storage, 18 hours per farmfor land treatment, and 39 hours per farm for nutrientmanagement.
Technical assistance hours were highest for dairies,swine farms, and farms with confined heifers and veal,averaging over 190 hours per farm. Broiler farms and
Table 36 CNMP development hours per farm, by livestock type and farm size
Dominant livestock Number - - - - - - - - - CNMP elements - - - - - - - - - - - - - - - - Technical assistance functions - - - - - - - Totaltype or farm size class of farms Manure & Land Nutrient Alternative Design Implemen- Followup hours
wastewater treatment manage- develop- hours tation hourshandling & hours ment ment hours hours storage hours hours
Fattened cattle 10,159 101 13 33 54 47 37 9 147
Milk cows 79,318 123 19 50 69 62 47 13 192
Swine 32,955 145 13 43 68 68 53 11 201
Turkeys 3,213 84 11 31 49 43 25 8 126
Broilers 16,251 52 7 37 41 24 19 11 95
Layers/pullets 5,326 55 11 34 42 29 21 8 100
Confined heifers/veal 4,011 116 33 46 79 55 49 12 195
Small farms with 42,565 98 19 45 62 53 37 11 163confined livestocktypes
Pastured livestock 61,272 33 21 19 38 16 13 6 73types
Specialty livestock 2,131 60 11 29 36 33 27 5 101types
Large 19,746 107 16 47 64 54 40 13 170
Medium 39,437 96 15 40 58 46 36 11 151
Small 198,018 90 18 37 57 45 34 10 146
All CNMP farms 257,201 92 18 39 57 46 35 10 149
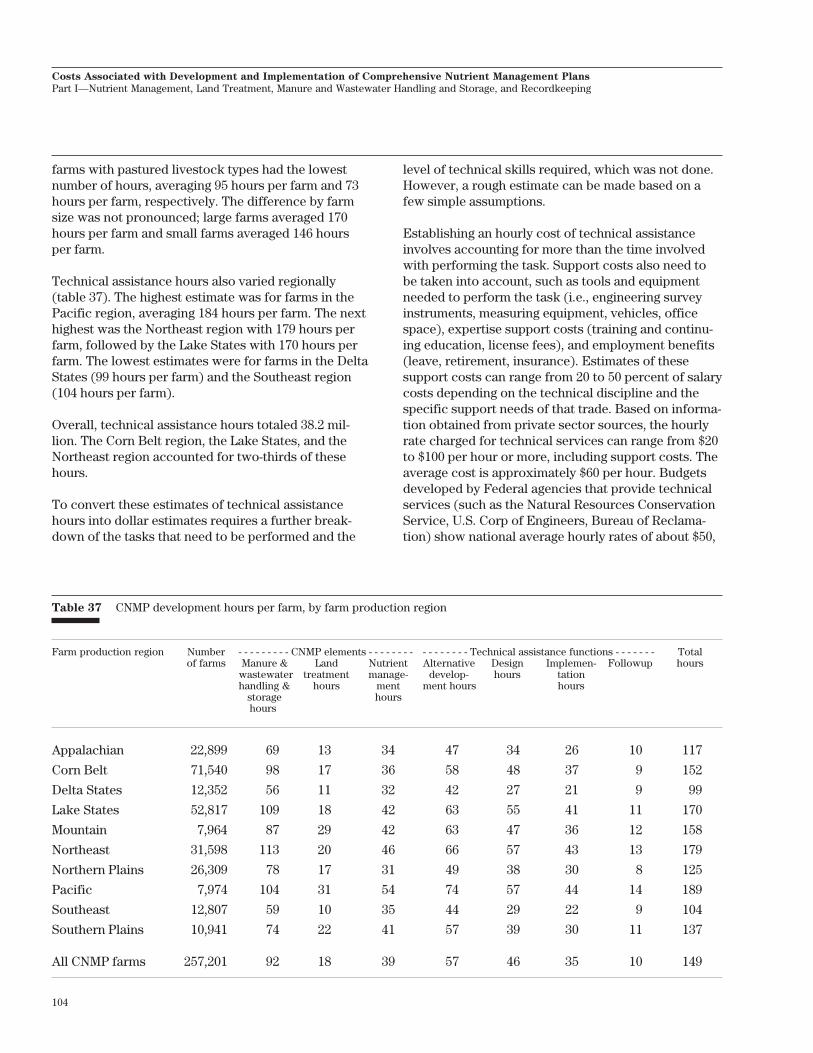
104
Costs Associated with Development and Implementation of Comprehensive Nutrient Management Plans
Part I—Nutrient Management, Land Treatment, Manure and Wastewater Handling and Storage, and Recordkeeping
farms with pastured livestock types had the lowestnumber of hours, averaging 95 hours per farm and 73hours per farm, respectively. The difference by farmsize was not pronounced; large farms averaged 170hours per farm and small farms averaged 146 hoursper farm.
Technical assistance hours also varied regionally(table 37). The highest estimate was for farms in thePacific region, averaging 184 hours per farm. The nexthighest was the Northeast region with 179 hours perfarm, followed by the Lake States with 170 hours perfarm. The lowest estimates were for farms in the DeltaStates (99 hours per farm) and the Southeast region(104 hours per farm).
Overall, technical assistance hours totaled 38.2 mil-lion. The Corn Belt region, the Lake States, and theNortheast region accounted for two-thirds of thesehours.
To convert these estimates of technical assistancehours into dollar estimates requires a further break-down of the tasks that need to be performed and the
level of technical skills required, which was not done.However, a rough estimate can be made based on afew simple assumptions.
Establishing an hourly cost of technical assistanceinvolves accounting for more than the time involvedwith performing the task. Support costs also need tobe taken into account, such as tools and equipmentneeded to perform the task (i.e., engineering surveyinstruments, measuring equipment, vehicles, officespace), expertise support costs (training and continu-ing education, license fees), and employment benefits(leave, retirement, insurance). Estimates of thesesupport costs can range from 20 to 50 percent of salarycosts depending on the technical discipline and thespecific support needs of that trade. Based on informa-tion obtained from private sector sources, the hourlyrate charged for technical services can range from $20to $100 per hour or more, including support costs. Theaverage cost is approximately $60 per hour. Budgetsdeveloped by Federal agencies that provide technicalservices (such as the Natural Resources ConservationService, U.S. Corp of Engineers, Bureau of Reclama-tion) show national average hourly rates of about $50,
Table 37 CNMP development hours per farm, by farm production region
Farm production region Number - - - - - - - - - CNMP elements - - - - - - - - - - - - - - - - Technical assistance functions - - - - - - - Totalof farms Manure & Land Nutrient Alternative Design Implemen- Followup hours
wastewater treatment manage- develop- hours tationhandling & hours ment ment hours hours storage hours hours
Appalachian 22,899 69 13 34 47 34 26 10 117
Corn Belt 71,540 98 17 36 58 48 37 9 152
Delta States 12,352 56 11 32 42 27 21 9 99
Lake States 52,817 109 18 42 63 55 41 11 170
Mountain 7,964 87 29 42 63 47 36 12 158
Northeast 31,598 113 20 46 66 57 43 13 179
Northern Plains 26,309 78 17 31 49 38 30 8 125
Pacific 7,974 104 31 54 74 57 44 14 189
Southeast 12,807 59 10 35 44 29 22 9 104
Southern Plains 10,941 74 22 41 57 39 30 11 137
All CNMP farms 257,201 92 18 39 57 46 35 10 149

105
Costs Associated with Development and Implementation of Comprehensive Nutrient Management Plans
Part I—Nutrient Management, Land Treatment, Manure and Wastewater Handling and Storage, and Recordkeeping
including support costs. These average cost estimatesare very general; hourly rates vary substantially amonglivestock operations depending on the complexity ofthe site-specific practices that are needed.
Averaging the two estimates, an hourly rate of $55 wasselected to approximate the dollar value of technicalassistance hours. Applying the $55 hourly rate to the38.2 million hours results in an estimate of about $2.1billion, or about $8,126 per farm for the 257,201 CNMPfarms.
Summary of CNMP develop-ment and implementationcosts
The annual CNMP implementation cost for all fourCNMP elements averaged $6,748 per farm for the257,201 farms that are expected to need a CNMP, andCNMP development costs, in terms of technical assis-tance hours, averaged 149 hours per farm (table 38). Inaddition, off-farm land application costs, which areassumed to be borne by the manure-receiving farms inthis assessment, averaged $98 per CNMP farm. The
Table 38 CNMP costs per farm, by livestock type and farm size
Dominant livestock Number Animal Record- Nutrient Off-farm Land Manure - - - - Total CNMP implementation - - - - CNMPtype or farm size of farms units per keeping manage- transport treat- & waste- costs per farm develop-
farm* costs ment costs ment water mentper farm costs per per farm costs handling Average Low** High** Per costs
farm per farm & storage animalcosts unit
per farm($/yr) ($/yr) ($/yr) ($/yr) ($/yr) ($/yr) ($/yr) ($/yr) ($/yr) (hr/farm)
Fattened cattle 10,159 1,298 142 1,655 4,646 2,613 9,112 18,167 1,026 308,005 14 147Milk cows 79,318 195 160 2,101 1,619 2,660 3,249 9,788 2,362 97,013 50 192Swine 32,955 276 224 1,601 2,450 3,615 4,139 12,029 2,060 75,159 44 201Turkeys 3,213 687 90 230 6,169 3,391 7,940 17,820 1,643 122,412 26 126Broilers 16,251 183 90 248 1,667 1,220 2,351 5,576 1,128 36,187 30 95Layers/pullets 5,326 297 136 144 7,414 1,685 4,015 13,394 342 95,887 45 100Confined heifers/ 4,011 301 117 1,153 1,410 2,026 3,192 7,898 594 76,660 26 195
vealSmall farms with 42,565 25 54 203 16 351 199 823 102 4,953 33 163
confined live-stock types
Pastured live- 61,272 117 54 211 3 357 823 1,448 280 7,757 12 73stock types
Specialty live- 2,131 17 54 180 0 634 843 1,691 1,711 3,256 NA 101stock types
Large farms 19,746 1,419 168 1,526 9,679 3,925 15,167 30,465 2,199 252,014 21 170Medium farms 39,437 252 150 1,085 2,281 2,897 3,397 9,809 1,210 64,426 39 151Small farms 198,018 80 106 987 345 1,267 1,070 3,773 161 25,298 47 146
All types 257,201 210 117 1,043 1,358 1,721 2,509 6,748 195 67,429 32 149
* Represents all animal units on the farm, but does not include animal units for specialty livestock types, which were not estimated.** The low estimate corresponds to the one-percentile value for the farms in each group, and the high estimate corresponds to the
99th-percentile value.
106
Costs Associated with Development and Implementation of Comprehensive Nutrient Management Plans
Part I—Nutrient Management, Land Treatment, Manure and Wastewater Handling and Storage, and Recordkeeping
manure and wastewater handling and storage elementrepresented the largest portion of implementationcosts at 37 percent, followed by 26 percent for landtreatment, 20 percent for off-farm transport, 15 per-cent for nutrient management, and 2 percent forrecordkeeping.
Determination of which farm group had the highestaverage cost depends on whether the cost is based ona per-farm average or a per-animal-unit average. Theaverage annual implementation cost per farm washighest for fattened cattle farms and turkey farms($18,167 and $17,820 per farm, respectively). However,these two groups of farms also had the most animalunits per farm, on average (table 38). On a per animalunit basis, dairies had the highest cost at $50 peranimal unit, followed by layer and pullet farms at $45per animal unit and swine farms at $44 per animal unit.Turkey farms had a moderate cost per animal unit of$26, and fattened cattle farms averaged only $14 peranimal unit, the lowest of all the farm groups exceptfarms with pastured livestock types. The lowest an-nual average cost per farm was for small farms withconfined livestock ($823 per farm), which also had thefewest animal units per farm. CNMP costs for smallfarms with confined livestock averaged $30 per animalunit. The average cost per animal unit for all farmswas $32.
CNMP implementation costs varied greatly amongfarms. This variation is shown in table 38 by the differ-ences between the low and high cost estimates foreach of the farm groups. The low estimate corre-sponds to the one-percentile value for the specifiedfarm group, and the high estimate corresponds to the99th percentile estimate. Costs were generally highestfor the largest farms, averaging $30,465 per farmannually for farms that produced more than 10 tons ofmanure phosphorus annually. The average annual costwas $9,809 per farm for medium-size farms, whichproduced 4 to10 tons of manure phosphorus annually,and $3,773 per farm for small farms, which producedless than 4 tons of manure phosphorus annually.However, among the large farms the annual per-farmcost ranged from a low of about $2,199 per farm to ahigh of about $252,014 per farm. This wide range incosts per farm among the largest farms reflects differ-ences in livestock types and manure management andhandling systems, but also reflects differences inCNMP needs. For example, farms with enough onfarmland to meet CNMP application criteria would not
incur any off-farm export costs, whereas farms withfew onfarm acres available for land application couldincur large off-farm transport costs. Farms in countiesthat do not have enough acres to apply all of the ma-nure according to CNMP application criteria have anadditional off-farm transport cost associated withtransporting the excess manure to a central processingfacility.
CNMP implementation costs per farm also variedregionally (table 39). The Pacific region had the high-est annual average cost at $19,464 per farm, reflectinga predominance of large farms in that region andrelatively high costs associated with off-farm trans-port. The lowest implementation cost per farm was forCNMP farms in the Lake States region and the DeltaStates region, averaging $4,469 per farm and $4,832per farm, respectively.
The cost of developing a CNMP also varied by live-stock type, farm size, region, and manure managementand handling systems, but not as dramatically asimplementation costs. There is a practical minimumcost for developing a CNMP because, regardless ofhow small the farm is, a basic set of tasks needs to beperformed. Larger farms generally have more complexsituations and more acres that need to have nutrientmanagement plans, but the technical assistance re-quired is not proportional to the size of the operation.The highest average CNMP development cost was forswine farms at 201 hours per farm, followed by con-fined heifer and veal farms at 195 hours per farm anddairies at 192 hours per farm. The lowest per-farmestimates of CNMP development costs were for broilerfarms (95 hours per farm), farms with pastured live-stock types (73 hours per farm), and specialty live-stock farms (101 hours per farm). CNMP developmentcosts were highest on a per-farm basis in the Pacific,Northeast, and Lake States regions, and lowest in theDelta States, Southeast, and Appalachia regions.
Over half of the total CNMP implementation costs andtwo-thirds of the CNMP development costs wereaccounted for in three regions—the Corn Belt, LakeStates, and Northeast. These three regions also had thelargest number of CNMP farms, representing 61 per-cent of the 257,201 CNMP farms. The Delta States,Mountain, Southeast, and Southern Plains regions hadthe lowest proportion of total costs, collectively repre-senting only 18 percent of CNMP implementation costsand 14 percent of CNMP development costs.

107
Costs Associated with Development and Implementation of Comprehensive Nutrient Management Plans
Part I—Nutrient Management, Land Treatment, Manure and Wastewater Handling and Storage, and Recordkeeping
CNMP implementation costs for the 257,201 CNMPfarms totaled $1.736 billion per year. Over the 10-yearimplementation period, the total cost would be $17.36billion. This extrapolation is appropriate for capitalcosts because a 10-year recovery period was used inthe calculations. For annual operating costs, however,the extrapolation is based on an additional assumptionthat annual operating costs would be defined as CNMPcosts for 10 years following CNMP implementation,after which the operating costs would become ab-sorbed into the production costs as one of the costs ofdoing business.
Table 39 Annual CNMP costs per farm, by farm production region
Farm production Number Record- Nutrient Off-farm Land Manure Total CNMP implementation CNMPregion of farms keeping manage- transport treatment & waste- costs per farm develop-
costs ment costs costs water ment costsper farm costs per farm per farm handling Average Low* High*
per farm & storagecosts
per farm($/yr) ($/yr) ($/yr) ($/yr) ($/yr) ($/yr) ($/yr) ($/yr) (hr/farm)
Appalachian 22,899 110 606 2,722 2,154 2,987 8,579 211 72,434 117
Corn Belt 71,540 120 973 380 2,312 1,647 5,432 163 43,143 152
Delta States 12,352 97 387 1,865 302 2,181 4,832 298 45,575 99
Lake States 52,817 123 1,430 257 990 1,669 4,469 254 29,559 170
Mountain 7,964 119 713 2,272 77 6,177 9,358 172 122,031 158
Northeast 31,598 124 1,712 1,030 4,465 1,976 9,307 296 65,715 179
Northern Plains 26,309 105 1,000 977 395 3,088 5,566 266 79,763 125
Pacific 7,974 157 812 10,697 67 7,731 19,464 134 161,378 189
Southeast 12,807 101 419 2,952 1,223 2,901 7,596 182 65,524 104
Southern Plains 10,941 106 597 2,163 334 4,776 7,976 125 143,563 137
All regions 257,201 117 1,043 1,358 1,721 2,509 6,748 195 67,429 149
* The low estimate corresponds to the one-percentile value for the farms in each group, and the high estimate corresponds to the99th-percentile value.
CNMP development costs totaled 38.2 million techni-cal assistance hours spread over the 10-year imple-mentation period. Assuming an average hourly cost of$55 for the technical assistance hours, the total costfor CNMP development for the 257,201 CNMP farmswould be about $2.1 billion over 10 years.
Overall, CNMP development and implementation costsare expected to be about $19.5 billion. About 10 per-cent is for CNMP development ($2.1 billion), and about90 percent is for CNMP implementation ($17.4 billion).The average cost per farm would be about $76,000spread out over 10 years, or $7,600 per farm per yearfor 10 years.

108
Costs Associated with Development and Implementation of Comprehensive Nutrient Management Plans
Part I—Nutrient Management, Land Treatment, Manure and Wastewater Handling and Storage, and Recordkeeping
References
Bennet, Myron, Donald Osburn, Charles D. Fulhage,and Donald L. Pfost. 1994. WQ302 Economicconsiderations for dairy waste managementsystems. Water Quality Initiative Pub., Dep.Agric. Econ., Univ. Missouri-Columbia and Dep.Agric. Eng., Univ. Missouri-Columbia.
Fleming, Ronald, Bruce Babcock, and Erda Wang.1998. Resource or waste? the economics ofswine manure storage and management. ReviewAgric. Econ., Vol. 20 (1), pp. 96–113.
Kellogg, Robert L., Charles H. Lander, David C. Moffitt,and Noel Gollehon. 2000. Manure nutrientsrelative to the capacity of cropland andpastureland to assimilate nutrients: spatial andtemporal trends for the United States. U.S. Dep.Agric., Nat. Resourc. Conserv. Serv. (Available athttp://www.nhq.nrcs.usda.gov/land/index/publication.html.)
Lander, Charles H., David Moffitt, and Klaus Alt. 1998.
Nutrients available from livestock manure rela-tive to crop growth requirements. ResourceAssess. and Strat. Plan. Working Pap. 98–1. Nat.Resourc. Conserv. Serv., U.S. Dep. Agric. (Avail-able at http://www.nhq.nrcs.usda.gov/land/index/publication.html.)
North Carolina Cooperative Extension. 1999. A costcomparison of composting and incineratingmethods for mortality disposal. Poultry Sci.Facts.
North Carolina Cooperative Extension. 1996. Work-sheet to determine size of poultry mortalitycomposter. Pub. EBAE 177-93.
Oregon State University Extension Service. 1982.Selecting a dairy waste management system forthe Willamette Valley. Pub. EC–1102.
Padgitt, Merritt, Doris Newton, Renata Penn, andCarmen Sandretto. 2000. Production practicesfor major crops in U.S. Agriculture, 1990-97. Stat.Bul. No. 969, 114 pp., electronic data. (Availableat http://www.ers.usda.gov/publications/sb969.)
Tilmon, H. Don, and Carl German. 1997. Consider-ations in using custom services and machineryrental: custom rates and guidelines for comput-ing machinery ownership costs. Univ. DelawareExt., Col. Agric. and Nat. Resourc.
United States Department of Agriculture, Animal andPlant Health Inspection Service. 1995. Part I,reference of 1995 swine management practices.Natl. Animal Health Monitor. Sys. (Available athttp://www.aphis.usda.gov.)
United States Department of Agriculture, Animal andPlant Health Inspection Service. 1996. Part I,reference of 1996 dairy management practices.Natl. Animal Health Monitor. Sys. (Available at:http://www.aphis.usda.gov.)
United States Department of Agriculture, Animal andPlant Health Inspection Service. 1999. Part I,reference of 1999 table egg layer management inthe U.S. Natl. Animal Health Monitor. Sys. (Avail-able at: http://www.aphis.usda.gov.)
United States Department of Agriculture, EconomicResearch Service. 2000. Data from the 1998agricultural resource management survey, hogsproduction practices and costs and returnsreport. Unpublished.
United States Department of Agriculture, NationalAgricultural Statistics Service. 1997. Code defini-tions—1997 census of agriculture. Census Div.
United States Department of Agriculture, NaturalResources Conservation Service. 1992. Agricul-tural waste management field handbook.(Available at http://www.ftw.nrcs.usda.gov/awmfh.html.)
United States Department of Agriculture, NaturalResources Conservation Service. 1999. Nutrientmanagement policy. NRCS General Manual, Title190, Part 402. (Available at http://www.nrcs.usda.gov/technical/ECS/nutrient/gm-190.html.)
United States Department of Agriculture, NaturalResources Conservation Service. 2000a. Compre-hensive nutrient management planning andtechnical guidance. (Available at http://www.nrcs.usda.gov/programs/afo/.)
109
Costs Associated with Development and Implementation of Comprehensive Nutrient Management Plans
Part I—Nutrient Management, Land Treatment, Manure and Wastewater Handling and Storage, and Recordkeeping
United States Department of Agriculture, NaturalResources Conservation Service. 2000b. 1997natural resources inventory summary report.(Available at http://www.nrcs.usda.gov/technical/NRI/1997/summary_report/index.html.)
United States Department of Agriculture, Soil Conser-vation Service. 1981. Land resource regions andmajor land resource areas of the United States.AH–296, Washington, DC.
United States Environmental Protection Agency. 1999.
Unified national strategy for animal feedingoperations.
United States Environmental Protection Agency. 2000.State compendium: programs and regulatoryactivities related to animal feeding operations.Off. Waste Mgt.
United States Environmental Protection Agency. 2001.
National pollutant discharge elimination systempermit regulation and effluent limitations guide-lines and standards for concentrated animalfeeding operations: proposed rule. Fed. Reg., Vol.66, No. 9. January 12, pp. 2959–3145.
Wimberly, J., and H. Goodwin. 2000. Alternative poul-try litter management in the Eucha/SpavinawWatershed. Part I Raw Litter for Export, Dep.Agric. Econ., Univ. Arkansas.

A–1
Introduction
The Census of Agriculture shows that 1,315,051 farmsin the United States in 1997 had some kind of livestockon the farm or had sales from livestock products,representing about two of every three farms in thecountry. These farms vary from primarily crop-produc-ing farms with a few livestock, to farms with largenumbers of confined livestock, to producers of spe-cialty livestock (ducks, geese, fur-bearing animals, andexotic livestock), to farms with large numbers ofpastured livestock, to small farms with few acres andfew livestock.
The purpose of this appendix is to identify the pre-dominant groups of livestock farms in the UnitedStates and to summarize the number and kind oflivestock and the amount of livestock sales associatedwith each farm group.
Classification of farms withlivestock
A farm is defined for purposes of the Census of Agri-culture as an enterprise with $1,000 or more of grossagricultural product sales, or has enough land and/orlivestock to generate sales at this level. Some of thefarms in the Census of Agriculture report no sales, buthave a combination of acres and livestock that stillqualify them as a farm. (For example, an enterprisewith 5 cattle of any kind, 5 horses, 7 hogs and pigs, 142poultry of any kind, or 25 sheep and goats qualifies asa farm even without any sales or farmland. For criteriaused to define farms without reported sales, see USDANASS, 1997.)
The Census of Agriculture reports end-of-year invento-ries and sometimes the number of animals sold duringthe year for the following livestock types:
• Beef cows• Milk cows• Heifers and heifer calves• Steers and bulls of all ages• Hogs and pigs used for breeding• Other hogs and pigs• Sheep and lambs• Chicken layers 20 weeks old and older• Chicken pullets for laying flock replacement• Chicken broilers• Turkeys for slaughter
Appendix A Profile of Farms with Livestock, 1997
• Turkeys for breeding• Other poultry, including ducks, geese, pigeons,
pheasants, quail, and other• Poultry hatched and placed or sold• Horses and ponies• Colonies of bees• Milk, Angora, and other goats• Mules, burros, and donkeys• Mink and rabbits• Fish and aquaculture products• Other livestock
The average number of cattle, swine, chickens, andturkeys on the farm during the year was estimatedfrom sales and end-of-year inventory according toprocedures described in Kellogg et al. (2000). Theestimates were in the form of USDA animal units (AU),where an animal unit is equivalent to 1,000 pounds oflive weight. For the other livestock types, end-of-yearinventories were used to represent livestock popula-tions on the farm.
Using this information on livestock types and numberon each farm, farms with livestock were uniquelycategorized into the following four groups:
• Farms with few livestock of all types• Farms with specialty livestock types• Farms with pastured livestock types and few
other livestock• Farms with confined livestock types
Farms with few livestock were defined to be farmswith
• less than 4 animal units of any combination offattened cattle, milk cows, swine, chickens, orturkeys;
• less than 8 animal units of cattle other thanfattened cattle or milk cows;
• less than 10 horses, ponies, mules, burros, ordonkeys;
• less than 25 sheep, lambs, or goats; and• less than $5,000 in sales of specialty livestock
products.
Farms with specialty livestock types were definedto be farms with
• few livestock (as defined above), but with salesof livestock products from fish, bees, rabbits,mink, poultry other than chickens and turkeys,and exotic livestock of more than $5,000, or
A–2
Costs Associated with Development and Implementation of Comprehensive Nutrient Management Plans
Part I—Nutrient Management, Land Treatment, Manure and Wastewater Handling and Storage, and Recordkeeping
• significant number of other livestock, but salesfrom specialty livestock that were more than 75percent of the total livestock sales for the farm.
Farms with confined livestock types were definedto be farms with
• 4 or more animal units of any combination offattened cattle, milk cows, swine, chickens, orturkeys, or
• calves or heifers that appeared to be raised inconfinement.
Farms with pastured livestock types and few
other livestock were defined to be farms with• less than 4 animal units of any combination of
fattened cattle, milk cows, swine, chickens, orturkeys;
• 8 or more animal units of cattle other than milkcows and fattened cattle;
• 10 or more horses, ponies, mules, burros, ordonkeys; or
• 25 or more sheep, lambs, or goats.
Farms that met criteria for veal farms or confinedheifer farms were excluded from this group andcounted as farms with confined livestock types.
Veal farms were identified in the Census of Agricultureas farms with annual sales of more than 210 calves andno beef cow or milk cow end-of-year inventory andlittle or no land available for grazing. Confined heiferfarms were identified as farms with annual sales ofmore than 50 heifers and no beef cow or milk cow end-of-year inventory and little or no land available forgrazing. Veal and confined heifers were identified onlyon farms with less than 5 acres of rangeland andpastureland and without grazing land permits. Thereare undoubtedly additional veal and confined heiferfarms, but they could not be distinguished from farmswith pastured animals based on the information avail-able in the Census of Agriculture. It is also likely thatsome of these farms did not raise confined heifers orveal. Nevertheless, the census data suggest that calvesor heifers on all of these farms were being held inconfinement.
The dominant livestock type on each farm was definedas the livestock type with the most animal units.
Farms with confined livestock types also mayhave significant populations of pastured livestocktypes, which were sometimes the dominant livestocktype on the farm. If more than 35 animal units of anyfattened cattle, milk cows, swine, chickens, or turkeyswere present on the farm, they were used to define thedominant livestock type, even if cattle (excluding milkcows and fattened cattle) were the most abundantlivestock type on the farm.
Included in farms with confined livestock types
were a small number of farms (2,291 farms) that didnot meet the criteria listed above. These three specialcases are
• Farms with no chicken layers, pullets, broilers,or turkeys, but more than 5,000 poultry hatchedand placed or sold, or more than 10,000 incuba-tor-egg capacity. Most of these farms producechicks for the broiler industry. Poultry sales forthese farms totaled $1.6 billion dollars.
• Farms that had more than $5,000 in dairy prod-ucts sold, but no end-of-year milk cow inventory.These are most likely dairies that went out ofbusiness in 1997. (Farms with other livestocktypes that had no end-of-year inventories, butreported livestock sales were automaticallyclassified as farms with confined livestock typesbecause data on the number of animals sold wasincorporated into the calculation of animal units.Milk cow animal units, however, are only basedon the end-of-year inventory.)
• Farms with sales of feeder pigs, but no otherhogs or pigs on the farm. Animal units are notestimated for feeder pigs because the calculationfor hogs for slaughter assumes the animals wereon the farm from birth to market. A separatecalculation for feeder pigs would therefore resultin an unknown amount of double counting. Only15 of these farms had significant numbers offeeder pigs, and were most likely swine nurseryoperations that raise weaned pigs to feeder pigsize.
Farms that met criteria for special cases, but had morethan four animal units of fattened cattle, milk cows,swine, chickens, or turkeys were classified accordingto the dominant confined livestock type, and were thusnot categorized as a "special case" farm.
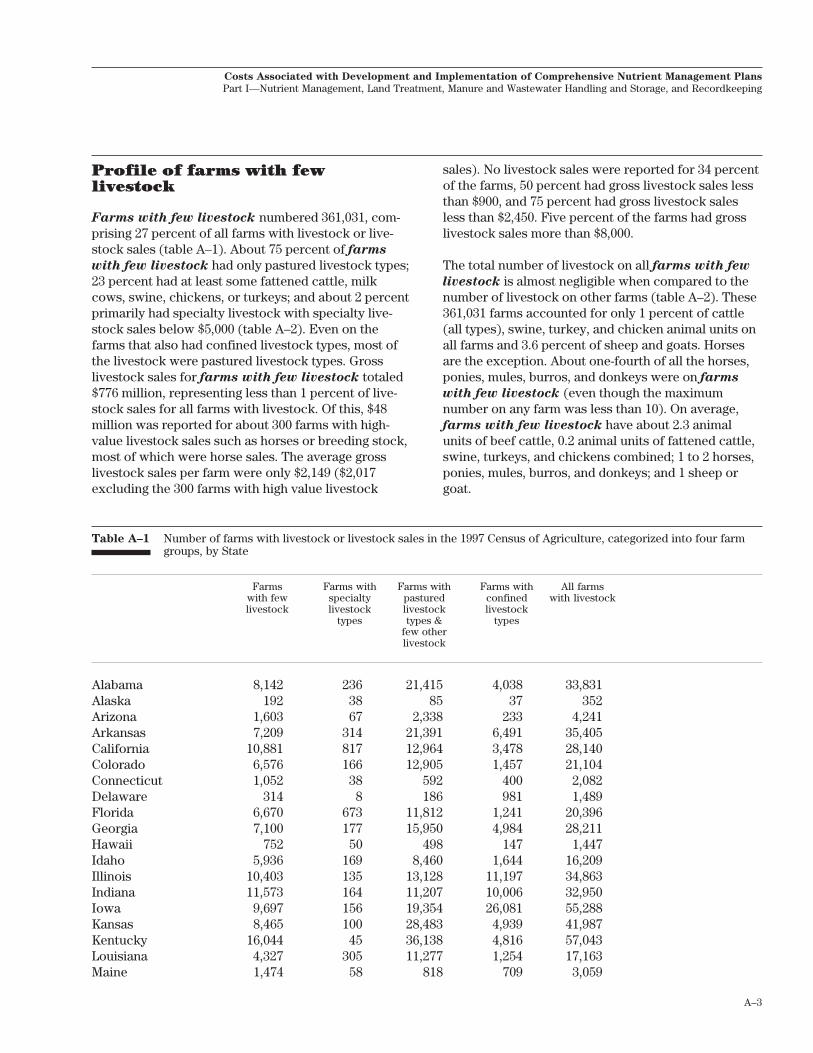
A–3
Costs Associated with Development and Implementation of Comprehensive Nutrient Management Plans
Part I—Nutrient Management, Land Treatment, Manure and Wastewater Handling and Storage, and Recordkeeping
Profile of farms with fewlivestock
Farms with few livestock numbered 361,031, com-prising 27 percent of all farms with livestock or live-stock sales (table A–1). About 75 percent of farms
with few livestock had only pastured livestock types;23 percent had at least some fattened cattle, milkcows, swine, chickens, or turkeys; and about 2 percentprimarily had specialty livestock with specialty live-stock sales below $5,000 (table A–2). Even on thefarms that also had confined livestock types, most ofthe livestock were pastured livestock types. Grosslivestock sales for farms with few livestock totaled$776 million, representing less than 1 percent of live-stock sales for all farms with livestock. Of this, $48million was reported for about 300 farms with high-value livestock sales such as horses or breeding stock,most of which were horse sales. The average grosslivestock sales per farm were only $2,149 ($2,017excluding the 300 farms with high value livestock
sales). No livestock sales were reported for 34 percentof the farms, 50 percent had gross livestock sales lessthan $900, and 75 percent had gross livestock salesless than $2,450. Five percent of the farms had grosslivestock sales more than $8,000.
The total number of livestock on all farms with few
livestock is almost negligible when compared to thenumber of livestock on other farms (table A–2). These361,031 farms accounted for only 1 percent of cattle(all types), swine, turkey, and chicken animal units onall farms and 3.6 percent of sheep and goats. Horsesare the exception. About one-fourth of all the horses,ponies, mules, burros, and donkeys were on farms
with few livestock (even though the maximumnumber on any farm was less than 10). On average,farms with few livestock have about 2.3 animalunits of beef cattle, 0.2 animal units of fattened cattle,swine, turkeys, and chickens combined; 1 to 2 horses,ponies, mules, burros, and donkeys; and 1 sheep orgoat.
Table A–1 Number of farms with livestock or livestock sales in the 1997 Census of Agriculture, categorized into four farmgroups, by State
Farms Farms with Farms with Farms with All farmswith few specialty pastured confined with livestocklivestock livestock livestock livestock
types types & typesfew otherlivestock
Alabama 8,142 236 21,415 4,038 33,831Alaska 192 38 85 37 352Arizona 1,603 67 2,338 233 4,241Arkansas 7,209 314 21,391 6,491 35,405California 10,881 817 12,964 3,478 28,140Colorado 6,576 166 12,905 1,457 21,104Connecticut 1,052 38 592 400 2,082Delaware 314 8 186 981 1,489Florida 6,670 673 11,812 1,241 20,396Georgia 7,100 177 15,950 4,984 28,211Hawaii 752 50 498 147 1,447Idaho 5,936 169 8,460 1,644 16,209Illinois 10,403 135 13,128 11,197 34,863Indiana 11,573 164 11,207 10,006 32,950Iowa 9,697 156 19,354 26,081 55,288Kansas 8,465 100 28,483 4,939 41,987Kentucky 16,044 45 36,138 4,816 57,043Louisiana 4,327 305 11,277 1,254 17,163Maine 1,474 58 818 709 3,059

A–4
Costs Associated with Development and Implementation of Comprehensive Nutrient Management Plans
Part I—Nutrient Management, Land Treatment, Manure and Wastewater Handling and Storage, and Recordkeeping
Table A–1 Number of farms with livestock or livestock sales in the 1997 Census of Agriculture, categorized into four farmgroups, by State—Continued
Farms Farms with Farms with Farms with All farmswith few specialty pastured confined with livestocklivestock livestock livestock livestock
types types & typesfew otherlivestock
Maryland 2,732 73 2,554 2,440 7,799Massachusetts 1,555 71 689 541 2,856Michigan 10,466 326 6,958 6,565 24,315Minnesota 10,554 330 12,930 19,171 42,985Mississippi 5,025 411 15,089 2,578 23,103Missouri 16,608 139 49,727 9,627 76,101Montana 4,120 141 13,078 772 18,111North Carolina 9,447 187 15,309 6,435 31,378New Hampshire 997 32 460 315 1,804Nebraska 5,011 101 19,929 9,893 34,934Nevada 764 13 1,418 141 2,336New Jersey 2,862 65 1,193 374 4,494New Mexico 3,674 41 6,661 454 10,830New York 6,709 211 5,626 9,076 21,622North Dakota 2,184 195 12,114 2,269 16,762Ohio 15,088 203 13,937 10,996 40,224Oklahoma 15,166 91 46,256 3,440 64,953Oregon 11,570 278 11,367 1,093 24,308Pennsylvania 10,122 247 9,306 14,215 33,890Rhode Island 218 10 107 65 400South Carolina 4,561 71 7,410 1,415 13,457South Dakota 2,782 147 15,293 5,789 24,011Tennessee 18,530 107 38,217 3,566 60,420Texas 42,210 495 114,373 6,516 163,594Utah 4,117 193 5,907 1,197 11,414Vermont 1,305 40 943 1,940 4,228Virginia 8,599 91 20,178 3,359 32,227Washington 8,262 249 7,577 1,497 17,585West Virginia 5,304 34 8,368 959 14,665Wisconsin 10,483 471 9,250 26,628 46,832Wyoming 1,596 55 6,140 362 8,153
All states 361,031 8,834 707,365 237,821 1,315,051

A–5
Costs Associated with Development and Implementation of Comprehensive Nutrient Management Plans
Part I—Nutrient Management, Land Treatment, Manure and Wastewater Handling and Storage, and Recordkeeping
Table A–2 Profile of farms with few livestock in the 1997 Census of Agriculture
Farms with Farms with Farms with only horses, Farms with beef cattle or Farms with All farms % of sales of only sheep ponies, mules, burros, a mix of cattle and other any fattened with few total for
specialty and goats** or donkeys** pastured livestock types** cattle, milk livestock all farmslivestock - - - - - - - - - - - - - - - - - - - - - - - - - - - - - - - - - - - - - - - - - - - cows, swine, withproducts Farms with Farms with Farms with Farms with chickens, live-
>75% of live- <$50,000 in $50,000 or <$50,000 in $50,000 or or turkeys* stockstock sales* livestock more in livestock more in
sales livestock sales livestocksales sales
Number of farms 9,194 8,752 78,645 188 181,763 107 82,382 361,031 27.5Percent 2.5 2.4 21.8 0.1 50.3 <0.1 22.8 100.0
Total agricultural 135,718,022 181,653,572 1,645,568,234 30,153,774 1,856,154,469 21,109,205 1,002,993,042 4,873,350,318 3.8sales ($) Sales per farm 14,762 20,756 20,924 160,392 10,212 197,282 12,175 13,498 13.7
Livestock sales ($) 14,968,005 7,744,496 84,862,759 30,004,565 437,748,522 18,245,588 182,304,685 775,878,620 0.8Sales per farm
Mean 1,628 885 1,079 159,599 2,408 170,520 2,213 2,149 2.925th percentile 300 10 0 60,000 0 57,100 278 050th percentile 1,260 516 0 76,250 1,200 75,000 1,318 90075th percentile 2,513 1,235 500 127,500 2,815 135,000 2,936 2,45090th percentile 3,995 2,000 3,000 235,986 6,122 250,000 5,298 5,18995th percentile 4,500 2,662 5,600 476,000 9,568 536,350 7,181 8,000
Dollar value for sale of:Cattle other than 34,973 0 0 0 403,024,176 1,635,840 61,610,241 466,305,230 2.3fattened cattle
Fattened cattle 1,200 0 0 0 0 0 56,183,340 56,184,540 0.3Dairy products 0 0 0 0 0 0 1,026,771 1,026,771 <0.1Hogs and pigs 7,549 0 0 0 0 0 29,237,942 29,245,491 0.2Chicken & turkey 56,259 0 0 0 0 0 16,730,861 16,787,120 0.1products
Specialty live- 14,813,081 109,107 152,301 0 603,955 4,800 1,741,800 17,425,044 1.0stock products
Horses, ponies, 9,520 103,757 84,082,849 29,552,605 25,775,947 13,629,797 10,009,346 163,163,821 15.8mules, burros,donkeys
Sheep & goat 45,423 7,531,632 627,609 451,960 8,344,444 2,975,151 5,764,384 25,740,603 3.4products
Animal unitsFattened cattle 1 0 0 0 0 0 28,502 28,503 0.3Beef cows 1,041 0 0 0 305,721 5 88,563 395,331 1.1Other beef cattle 584 0 0 0 355,645 216 85,880 442,325 2.2Milk cows 99 0 0 0 0 0 11,142 11,241 0.1Other dairy cattle 21 0 0 0 0 0 5,768 5,789 0.2Hogs and pigs 46 0 0 0 0 0 24,936 24,981 0.3Chickens 79 0 0 0 0 0 3,840 3,919 0.1Turkeys 12 0 0 0 0 0 592 605 <0.1All types 1,882 0 0 0 661,367 222 249,223 912,693 1.0
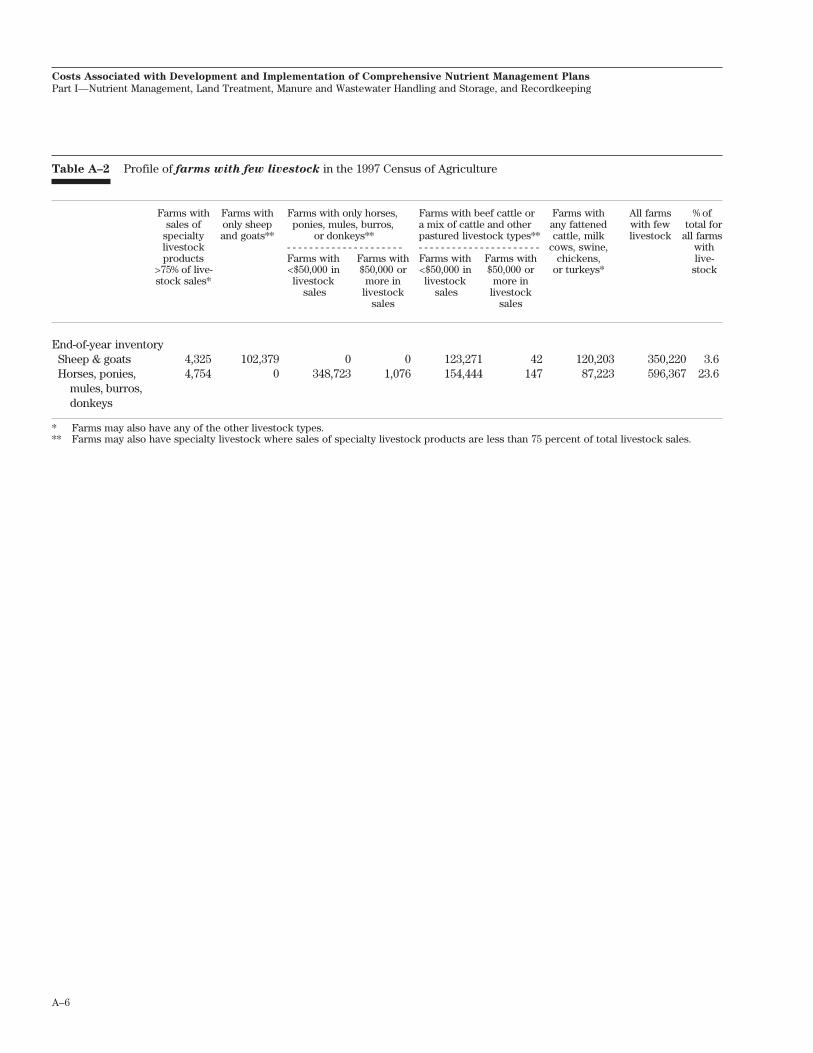
A–6
Costs Associated with Development and Implementation of Comprehensive Nutrient Management Plans
Part I—Nutrient Management, Land Treatment, Manure and Wastewater Handling and Storage, and Recordkeeping
Table A–2 Profile of farms with few livestock in the 1997 Census of Agriculture
Farms with Farms with Farms with only horses, Farms with beef cattle or Farms with All farms % of sales of only sheep ponies, mules, burros, a mix of cattle and other any fattened with few total for
specialty and goats** or donkeys** pastured livestock types** cattle, milk livestock all farmslivestock - - - - - - - - - - - - - - - - - - - - - - - - - - - - - - - - - - - - - - - - - - - cows, swine, withproducts Farms with Farms with Farms with Farms with chickens, live-
>75% of live- <$50,000 in $50,000 or <$50,000 in $50,000 or or turkeys* stockstock sales* livestock more in livestock more in
sales livestock sales livestocksales sales
End-of-year inventorySheep & goats 4,325 102,379 0 0 123,271 42 120,203 350,220 3.6Horses, ponies, 4,754 0 348,723 1,076 154,444 147 87,223 596,367 23.6
mules, burros,donkeys
* Farms may also have any of the other livestock types.** Farms may also have specialty livestock where sales of specialty livestock products are less than 75 percent of total livestock sales.

A–7
Costs Associated with Development and Implementation of Comprehensive Nutrient Management Plans
Part I—Nutrient Management, Land Treatment, Manure and Wastewater Handling and Storage, and Recordkeeping
Profile of farms with specialtylivestock types
In the 1997 Census of Agriculture, there were 8,834farms with specialty livestock types, comprising 0.7percent of all farms with livestock (table A–1). These8,834 farms accounted for $1.6 billion in gross live-stock sales (table A–3). Most of these farms (91 per-cent) had few other livestock, but 786 farms wouldalso qualify as farms with pastured livestock
types and few other livestock and 50 farms wouldalso qualify as farms with confined livestock
types. Overall, farms with specialty livestock
types had negligible amounts of other livestock types(table A–3). Although the other three farm groups allhad some specialty livestock, farms with specialty
livestock types accounted for 96 percent of all spe-cialty livestock sales. The dominant specialty livestocktypes on these farms—based on sales—were fish andother aquaculture species on 2,449 farms (28 percent),colonies of bees on 2,331 farms (26 percent), poultryother than chickens and turkeys (such as ducks andgeese) on 1,490 farms (17 percent), mink and rabbitson 641 farms (7 percent), and other exotic livestock on1,923 farms (22 percent).
Table A–3 Profile of farms with specialty livestock types in the 1997 Census of Agriculture
Farms that meet criteria for "farms Farms that meet Farms that meet All farms with Percent ofwith few livestock," but specialty criteria for farms criteria for farms specialty live- total for all
livestock sales were >$5,000 with pastured with confined stock types farms withlivestock types & livestock types, livestock
Farms with only Farms with a few other live- but specialtyspecialty live- mix of specialty stock, but livestock sales
stock types livestock types specialty live- were >75% of& other live- stock sales were total livestockstock types >75% of total sales
livestock sales
Number of farms 6,826 1,172 786 50 8,834 0.7Percent 77.3 13.3 8.9 0.6 100.0
Total agricultural sales ($) 1,533,175,707 106,925,267 214,946,962 65,420,064 1,920,468,000 1.5Sales per farm 224,608 91,233 273,469 1,308,401 217,395 221.4
Livestock sales ($) 1,263,909,162 90,662,252 202,967,572 57,702,731 1,615,241,717 1.6Sales per farmMean 185,161 77,357 258,228 1,154,055 182,844 243.325th percentile 12,000 10,000 3,400 65,979 11,01650th percentile 30,000 20,051 26,796 228,802 28,90075th percentile 99,385 50,000 112,991 469,551 94,20090th percentile 300,000 160,000 356,402 2,209,875 298,26295th percentile 700,000 315,000 902,522 6,642,000 650,000
Dollar value for sale ofCattle other than fattened 0 749,928 5,736,573 1,153,934 7,640,435 <0.1
cattleFattened cattle 0 65,217 47,517 544,658 657,392 <0.1Dairy products 0 2,952 55,267 383,339 441,558 <0.1Hogs and pigs 0 119,838 11,095 190,073 321,006 <0.1Chicken and turkey 867 457,055 20,231 446,235 924,389 <0.1
products
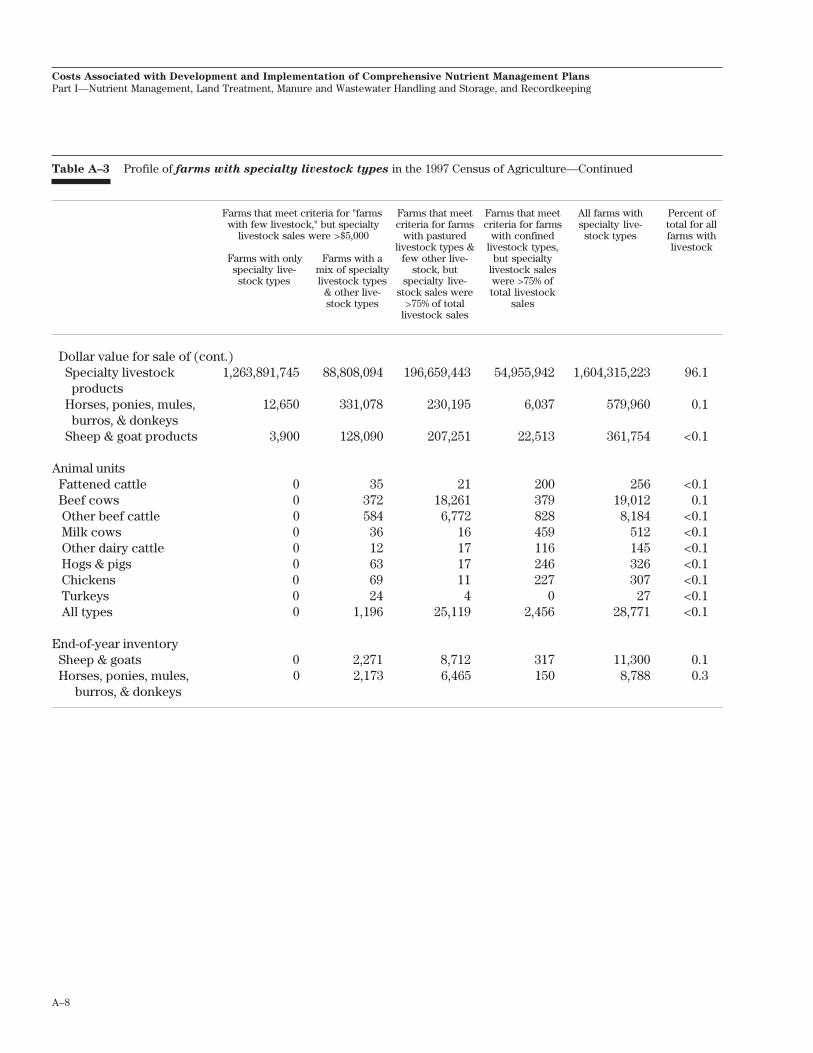
A–8
Costs Associated with Development and Implementation of Comprehensive Nutrient Management Plans
Part I—Nutrient Management, Land Treatment, Manure and Wastewater Handling and Storage, and Recordkeeping
Table A–3 Profile of farms with specialty livestock types in the 1997 Census of Agriculture—Continued
Farms that meet criteria for "farms Farms that meet Farms that meet All farms with Percent ofwith few livestock," but specialty criteria for farms criteria for farms specialty live- total for all
livestock sales were >$5,000 with pastured with confined stock types farms withlivestock types & livestock types, livestock
Farms with only Farms with a few other live- but specialtyspecialty live- mix of specialty stock, but livestock sales
stock types livestock types specialty live- were >75% of& other live- stock sales were total livestockstock types >75% of total sales
livestock sales
Dollar value for sale of (cont.)Specialty livestock 1,263,891,745 88,808,094 196,659,443 54,955,942 1,604,315,223 96.1
productsHorses, ponies, mules, 12,650 331,078 230,195 6,037 579,960 0.1
burros, & donkeysSheep & goat products 3,900 128,090 207,251 22,513 361,754 <0.1
Animal unitsFattened cattle 0 35 21 200 256 <0.1Beef cows 0 372 18,261 379 19,012 0.1
Other beef cattle 0 584 6,772 828 8,184 <0.1 Milk cows 0 36 16 459 512 <0.1 Other dairy cattle 0 12 17 116 145 <0.1 Hogs & pigs 0 63 17 246 326 <0.1 Chickens 0 69 11 227 307 <0.1 Turkeys 0 24 4 0 27 <0.1 All types 0 1,196 25,119 2,456 28,771 <0.1
End-of-year inventorySheep & goats 0 2,271 8,712 317 11,300 0.1Horses, ponies, mules, 0 2,173 6,465 150 8,788 0.3
burros, & donkeys
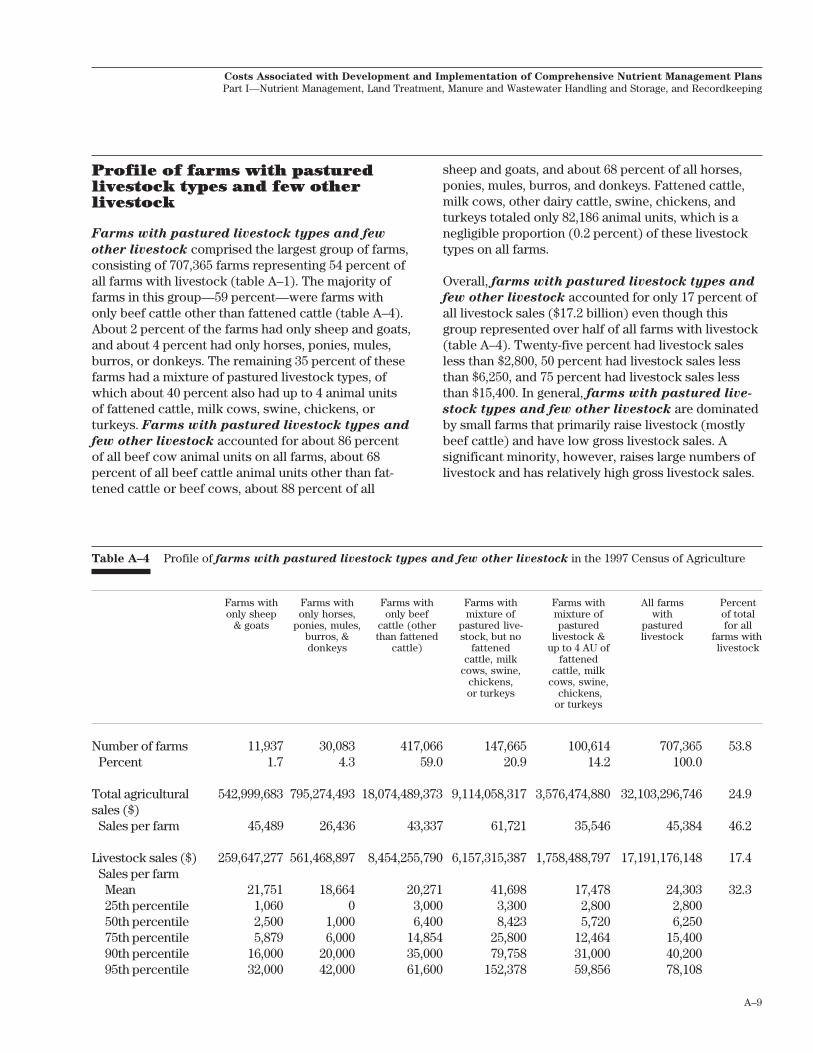
A–9
Costs Associated with Development and Implementation of Comprehensive Nutrient Management Plans
Part I—Nutrient Management, Land Treatment, Manure and Wastewater Handling and Storage, and Recordkeeping
Profile of farms with pasturedlivestock types and few otherlivestock
Farms with pastured livestock types and few
other livestock comprised the largest group of farms,consisting of 707,365 farms representing 54 percent ofall farms with livestock (table A–1). The majority offarms in this group—59 percent—were farms withonly beef cattle other than fattened cattle (table A–4).About 2 percent of the farms had only sheep and goats,and about 4 percent had only horses, ponies, mules,burros, or donkeys. The remaining 35 percent of thesefarms had a mixture of pastured livestock types, ofwhich about 40 percent also had up to 4 animal unitsof fattened cattle, milk cows, swine, chickens, orturkeys. Farms with pastured livestock types and
few other livestock accounted for about 86 percentof all beef cow animal units on all farms, about 68percent of all beef cattle animal units other than fat-tened cattle or beef cows, about 88 percent of all
sheep and goats, and about 68 percent of all horses,ponies, mules, burros, and donkeys. Fattened cattle,milk cows, other dairy cattle, swine, chickens, andturkeys totaled only 82,186 animal units, which is anegligible proportion (0.2 percent) of these livestocktypes on all farms.
Overall, farms with pastured livestock types and
few other livestock accounted for only 17 percent ofall livestock sales ($17.2 billion) even though thisgroup represented over half of all farms with livestock(table A–4). Twenty-five percent had livestock salesless than $2,800, 50 percent had livestock sales lessthan $6,250, and 75 percent had livestock sales lessthan $15,400. In general, farms with pastured live-
stock types and few other livestock are dominatedby small farms that primarily raise livestock (mostlybeef cattle) and have low gross livestock sales. Asignificant minority, however, raises large numbers oflivestock and has relatively high gross livestock sales.
Table A–4 Profile of farms with pastured livestock types and few other livestock in the 1997 Census of Agriculture
Farms with Farms with Farms with Farms with Farms with All farms Percentonly sheep only horses, only beef mixture of mixture of with of total
& goats ponies, mules, cattle (other pastured live- pastured pastured for allburros, & than fattened stock, but no livestock & livestock farms withdonkeys cattle) fattened up to 4 AU of livestock
cattle, milk fattenedcows, swine, cattle, milk
chickens, cows, swine,or turkeys chickens,
or turkeys
Number of farms 11,937 30,083 417,066 147,665 100,614 707,365 53.8Percent 1.7 4.3 59.0 20.9 14.2 100.0
Total agricultural 542,999,683 795,274,493 18,074,489,373 9,114,058,317 3,576,474,880 32,103,296,746 24.9sales ($)
Sales per farm 45,489 26,436 43,337 61,721 35,546 45,384 46.2
Livestock sales ($) 259,647,277 561,468,897 8,454,255,790 6,157,315,387 1,758,488,797 17,191,176,148 17.4Sales per farmMean 21,751 18,664 20,271 41,698 17,478 24,303 32.325th percentile 1,060 0 3,000 3,300 2,800 2,80050th percentile 2,500 1,000 6,400 8,423 5,720 6,25075th percentile 5,879 6,000 14,854 25,800 12,464 15,40090th percentile 16,000 20,000 35,000 79,758 31,000 40,20095th percentile 32,000 42,000 61,600 152,378 59,856 78,108
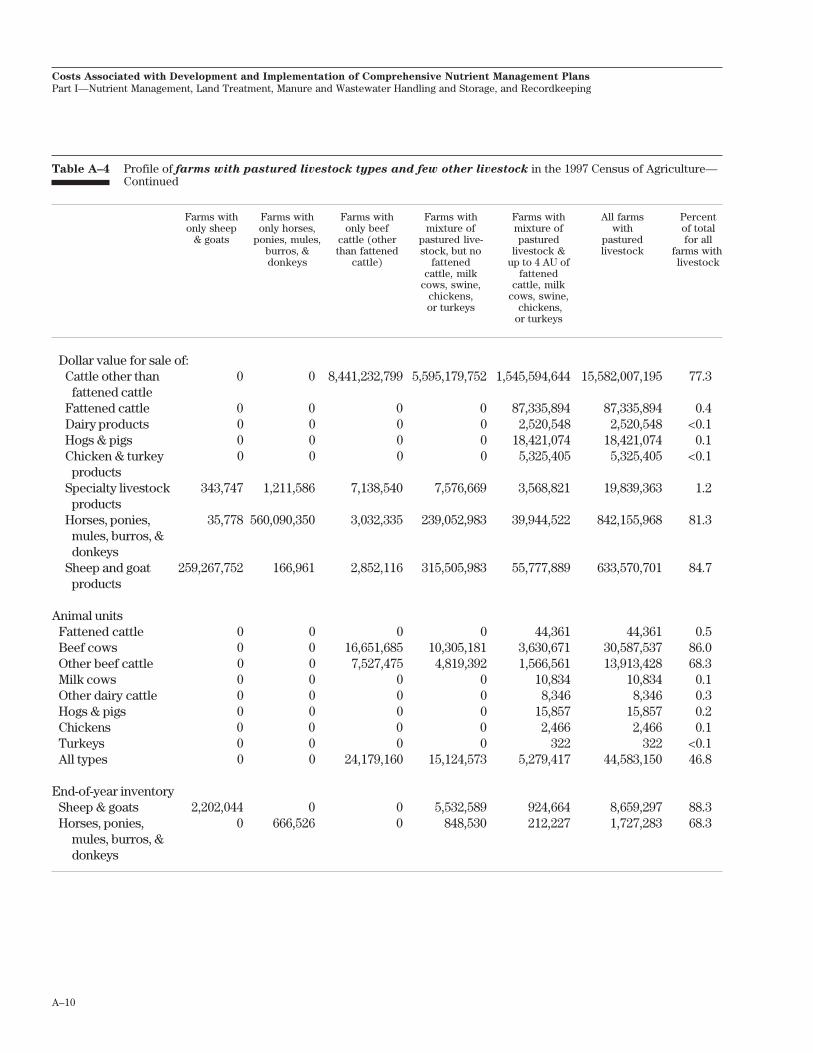
A–10
Costs Associated with Development and Implementation of Comprehensive Nutrient Management Plans
Part I—Nutrient Management, Land Treatment, Manure and Wastewater Handling and Storage, and Recordkeeping
Table A–4 Profile of farms with pastured livestock types and few other livestock in the 1997 Census of Agriculture—Continued
Farms with Farms with Farms with Farms with Farms with All farms Percentonly sheep only horses, only beef mixture of mixture of with of total
& goats ponies, mules, cattle (other pastured live- pastured pastured for allburros, & than fattened stock, but no livestock & livestock farms withdonkeys cattle) fattened up to 4 AU of livestock
cattle, milk fattenedcows, swine, cattle, milk
chickens, cows, swine,or turkeys chickens,
or turkeys
Dollar value for sale of:Cattle other than 0 0 8,441,232,799 5,595,179,752 1,545,594,644 15,582,007,195 77.3
fattened cattleFattened cattle 0 0 0 0 87,335,894 87,335,894 0.4Dairy products 0 0 0 0 2,520,548 2,520,548 <0.1Hogs & pigs 0 0 0 0 18,421,074 18,421,074 0.1Chicken & turkey 0 0 0 0 5,325,405 5,325,405 <0.1
productsSpecialty livestock 343,747 1,211,586 7,138,540 7,576,669 3,568,821 19,839,363 1.2
productsHorses, ponies, 35,778 560,090,350 3,032,335 239,052,983 39,944,522 842,155,968 81.3
mules, burros, &donkeys
Sheep and goat 259,267,752 166,961 2,852,116 315,505,983 55,777,889 633,570,701 84.7products
Animal unitsFattened cattle 0 0 0 0 44,361 44,361 0.5Beef cows 0 0 16,651,685 10,305,181 3,630,671 30,587,537 86.0Other beef cattle 0 0 7,527,475 4,819,392 1,566,561 13,913,428 68.3Milk cows 0 0 0 0 10,834 10,834 0.1Other dairy cattle 0 0 0 0 8,346 8,346 0.3Hogs & pigs 0 0 0 0 15,857 15,857 0.2Chickens 0 0 0 0 2,466 2,466 0.1Turkeys 0 0 0 0 322 322 <0.1All types 0 0 24,179,160 15,124,573 5,279,417 44,583,150 46.8
End-of-year inventorySheep & goats 2,202,044 0 0 5,532,589 924,664 8,659,297 88.3Horses, ponies, 0 666,526 0 848,530 212,227 1,727,283 68.3
mules, burros, &donkeys

A–11
Costs Associated with Development and Implementation of Comprehensive Nutrient Management Plans
Part I—Nutrient Management, Land Treatment, Manure and Wastewater Handling and Storage, and Recordkeeping
Profile of farms with confinedlivestock types
Of the 1,315,051 farms with livestock, 18 percent(237,821 farms) were farms with confined livestock
types (table A–1). These 237,821 farms accounted for$79 billion in gross livestock sales, which was 80percent of gross livestock sales for all farms (tableA–5). Of the farms with confined livestock types,
25 percent had gross livestock sales above $223,870,50 percent had sales above $93,620, and 75 percenthad sales above $33,204. The top 5 percent had grosslivestock sales above $1 million.
Farms with confined livestock types accountedfor 99 percent or more of all animal units on all farmswith livestock for each of fattened cattle, milk cows,other dairy cattle, swine, chickens, and turkeys (tableA–5). Dairies comprised 40 percent of the farms(94,787 farms), swine were the dominant livestocktype on 22 percent of the farms (51,772 farms), poultrywere dominant on 12 percent (27,530 farms), fattenedcattle were dominant on 8 percent (17,796 farms), andveal and confined heifers were dominant on about 2percent (4,011 farms). The remaining farms werespecial cases (1 percent) or small farms where beef
cattle (other than fattened cattle) were the dominantlivestock type (17 percent).
Farms with confined livestock types were brokendown into two groups: farms with less than 35 animalunits of either fattened cattle, milk cows, swine, chick-ens, or turkeys, and farms with more than 35 AU ofeither fattened cattle, milk cows, swine, chickens, orturkeys, or were defined as veal or confined heiferfarms. The 35-AU threshold was selected to corre-spond to the lower threshold used to derive represen-tative farms in the main body of this report.
Farms with less than 35 AU of confined livestock typestotaled 84,297, representing about 35 percent of farms
with confined livestock types. This group ac-counted for only 4 percent of livestock sales and only8 percent of the animal units among farms with
confined livestock types. The median per-farm live-stock sales were about $23,000 for these small farms.
There were 151,233 of the larger farms with con-
fined livestock types. These farms accounted for thebulk of fattened cattle, milk cow, swine, and poultryanimal units on all farms (table A–5). The median per-farm livestock sales were about $165,000. Of thesefarms, 10 percent had livestock sales above $835,000.
Table A–5 Profile of farms with confined livestock types in the 1997 Census of Agriculture
Farms with Farms with Special cases* All farms Percent of< 35 AU of > 35 AU of with confined total for alleach live- one or more livestock farms withstock type livestock types types livestock
Number of farms 84,297 151,233 2,291 237,821 18.1 Percent 35.4 63.6 1.0 100.0
Number of farms by dominant livestock type Fattened cattle 7,637 10,159 0 17,796 Milk cows 15,469 79,318 0 94,787 Swine 18,817 32,955 0 51,772 Turkeys 96 3,213 0 3,309 Broilers 1,525 16,251 0 17,776 Layers 862 4,052 0 4,914 Pullets 257 1,274 0 1,531 Cattle other than fattened cattle or 39,634 ** 0 39,634
milk cows Veal *** 168 0 168 Confined heifers *** 3,843 0 3,843
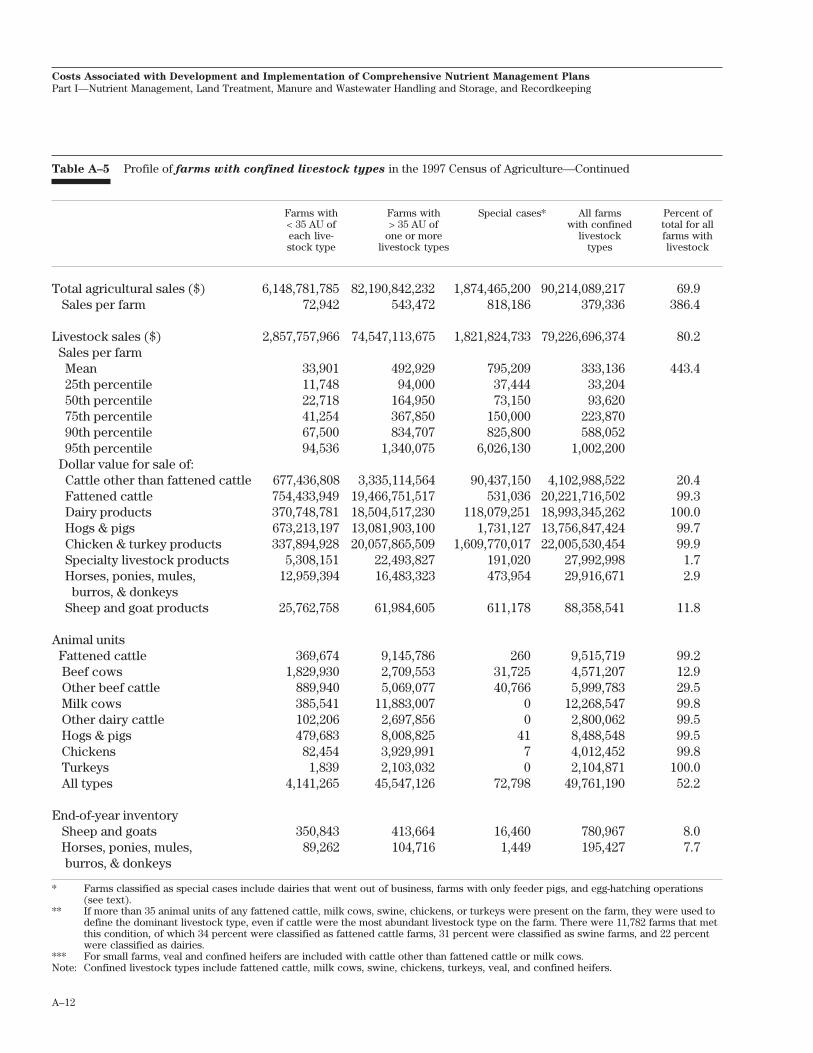
A–12
Costs Associated with Development and Implementation of Comprehensive Nutrient Management Plans
Part I—Nutrient Management, Land Treatment, Manure and Wastewater Handling and Storage, and Recordkeeping
Table A–5 Profile of farms with confined livestock types in the 1997 Census of Agriculture—Continued
Farms with Farms with Special cases* All farms Percent of< 35 AU of > 35 AU of with confined total for alleach live- one or more livestock farms withstock type livestock types types livestock
Total agricultural sales ($) 6,148,781,785 82,190,842,232 1,874,465,200 90,214,089,217 69.9 Sales per farm 72,942 543,472 818,186 379,336 386.4
Livestock sales ($) 2,857,757,966 74,547,113,675 1,821,824,733 79,226,696,374 80.2Sales per farmMean 33,901 492,929 795,209 333,136 443.425th percentile 11,748 94,000 37,444 33,20450th percentile 22,718 164,950 73,150 93,62075th percentile 41,254 367,850 150,000 223,87090th percentile 67,500 834,707 825,800 588,05295th percentile 94,536 1,340,075 6,026,130 1,002,200
Dollar value for sale of:Cattle other than fattened cattle 677,436,808 3,335,114,564 90,437,150 4,102,988,522 20.4Fattened cattle 754,433,949 19,466,751,517 531,036 20,221,716,502 99.3Dairy products 370,748,781 18,504,517,230 118,079,251 18,993,345,262 100.0Hogs & pigs 673,213,197 13,081,903,100 1,731,127 13,756,847,424 99.7Chicken & turkey products 337,894,928 20,057,865,509 1,609,770,017 22,005,530,454 99.9Specialty livestock products 5,308,151 22,493,827 191,020 27,992,998 1.7Horses, ponies, mules, 12,959,394 16,483,323 473,954 29,916,671 2.9
burros, & donkeysSheep and goat products 25,762,758 61,984,605 611,178 88,358,541 11.8
Animal unitsFattened cattle 369,674 9,145,786 260 9,515,719 99.2
Beef cows 1,829,930 2,709,553 31,725 4,571,207 12.9 Other beef cattle 889,940 5,069,077 40,766 5,999,783 29.5 Milk cows 385,541 11,883,007 0 12,268,547 99.8 Other dairy cattle 102,206 2,697,856 0 2,800,062 99.5 Hogs & pigs 479,683 8,008,825 41 8,488,548 99.5 Chickens 82,454 3,929,991 7 4,012,452 99.8 Turkeys 1,839 2,103,032 0 2,104,871 100.0 All types 4,141,265 45,547,126 72,798 49,761,190 52.2
End-of-year inventory Sheep and goats 350,843 413,664 16,460 780,967 8.0 Horses, ponies, mules, 89,262 104,716 1,449 195,427 7.7
burros, & donkeys
* Farms classified as special cases include dairies that went out of business, farms with only feeder pigs, and egg-hatching operations(see text).
** If more than 35 animal units of any fattened cattle, milk cows, swine, chickens, or turkeys were present on the farm, they were used todefine the dominant livestock type, even if cattle were the most abundant livestock type on the farm. There were 11,782 farms that metthis condition, of which 34 percent were classified as fattened cattle farms, 31 percent were classified as swine farms, and 22 percentwere classified as dairies.
*** For small farms, veal and confined heifers are included with cattle other than fattened cattle or milk cows.Note: Confined livestock types include fattened cattle, milk cows, swine, chickens, turkeys, veal, and confined heifers.
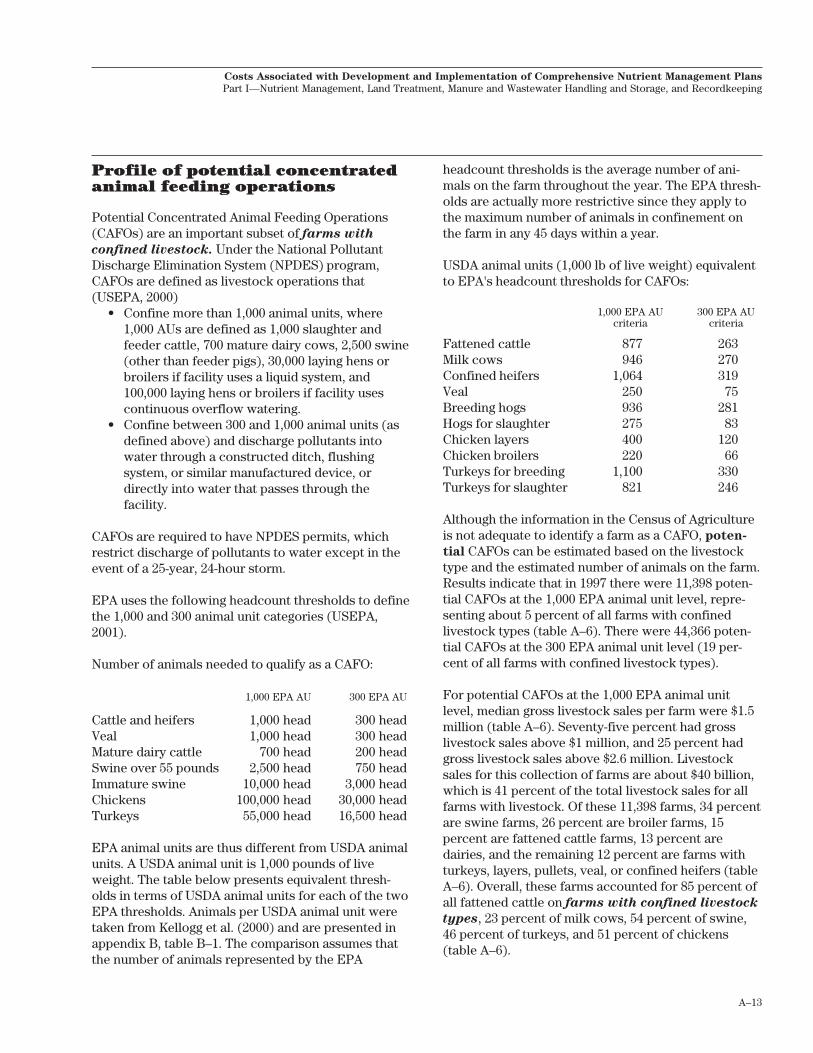
A–13
Costs Associated with Development and Implementation of Comprehensive Nutrient Management Plans
Part I—Nutrient Management, Land Treatment, Manure and Wastewater Handling and Storage, and Recordkeeping
Profile of potential concentratedanimal feeding operations
Potential Concentrated Animal Feeding Operations(CAFOs) are an important subset of farms with
confined livestock. Under the National PollutantDischarge Elimination System (NPDES) program,CAFOs are defined as livestock operations that(USEPA, 2000)
• Confine more than 1,000 animal units, where1,000 AUs are defined as 1,000 slaughter andfeeder cattle, 700 mature dairy cows, 2,500 swine(other than feeder pigs), 30,000 laying hens orbroilers if facility uses a liquid system, and100,000 laying hens or broilers if facility usescontinuous overflow watering.
• Confine between 300 and 1,000 animal units (asdefined above) and discharge pollutants intowater through a constructed ditch, flushingsystem, or similar manufactured device, ordirectly into water that passes through thefacility.
CAFOs are required to have NPDES permits, whichrestrict discharge of pollutants to water except in theevent of a 25-year, 24-hour storm.
EPA uses the following headcount thresholds to definethe 1,000 and 300 animal unit categories (USEPA,2001).
Number of animals needed to qualify as a CAFO:
1,000 EPA AU 300 EPA AU
Cattle and heifers 1,000 head 300 headVeal 1,000 head 300 headMature dairy cattle 700 head 200 headSwine over 55 pounds 2,500 head 750 headImmature swine 10,000 head 3,000 headChickens 100,000 head 30,000 headTurkeys 55,000 head 16,500 head
EPA animal units are thus different from USDA animalunits. A USDA animal unit is 1,000 pounds of liveweight. The table below presents equivalent thresh-olds in terms of USDA animal units for each of the twoEPA thresholds. Animals per USDA animal unit weretaken from Kellogg et al. (2000) and are presented inappendix B, table B–1. The comparison assumes thatthe number of animals represented by the EPA
headcount thresholds is the average number of ani-mals on the farm throughout the year. The EPA thresh-olds are actually more restrictive since they apply tothe maximum number of animals in confinement onthe farm in any 45 days within a year.
USDA animal units (1,000 lb of live weight) equivalentto EPA's headcount thresholds for CAFOs:
1,000 EPA AU 300 EPA AUcriteria criteria
Fattened cattle 877 263Milk cows 946 270Confined heifers 1,064 319Veal 250 75Breeding hogs 936 281Hogs for slaughter 275 83Chicken layers 400 120Chicken broilers 220 66Turkeys for breeding 1,100 330Turkeys for slaughter 821 246
Although the information in the Census of Agricultureis not adequate to identify a farm as a CAFO, poten-
tial CAFOs can be estimated based on the livestocktype and the estimated number of animals on the farm.Results indicate that in 1997 there were 11,398 poten-tial CAFOs at the 1,000 EPA animal unit level, repre-senting about 5 percent of all farms with confinedlivestock types (table A–6). There were 44,366 poten-tial CAFOs at the 300 EPA animal unit level (19 per-cent of all farms with confined livestock types).
For potential CAFOs at the 1,000 EPA animal unitlevel, median gross livestock sales per farm were $1.5million (table A–6). Seventy-five percent had grosslivestock sales above $1 million, and 25 percent hadgross livestock sales above $2.6 million. Livestocksales for this collection of farms are about $40 billion,which is 41 percent of the total livestock sales for allfarms with livestock. Of these 11,398 farms, 34 percentare swine farms, 26 percent are broiler farms, 15percent are fattened cattle farms, 13 percent aredairies, and the remaining 12 percent are farms withturkeys, layers, pullets, veal, or confined heifers (tableA–6). Overall, these farms accounted for 85 percent ofall fattened cattle on farms with confined livestock
types, 23 percent of milk cows, 54 percent of swine,46 percent of turkeys, and 51 percent of chickens(table A–6).

A–14
Costs Associated with Development and Implementation of Comprehensive Nutrient Management Plans
Part I—Nutrient Management, Land Treatment, Manure and Wastewater Handling and Storage, and Recordkeeping
At the 300 EPA animal unit level, the number of poten-tial CAFOs increases to nearly 4 times the number ofpotential CAFOs at the 1,000 EPA animal unit level,and account for an additional $18 billion in livestocksales (table A–6). Overall, these farms accounted for91 percent of all fattened cattle on farms with con-
fined livestock types, 44 percent of milk cows, 78percent of swine, 89 percent of turkeys, and 90 percentof chickens.
Table A–6 Profile of potential CAFOs, derived from the 1997 Census of Agriculture*
- - - - - - - 1,000 EPA animal units - - - - - - - - - - - - - - 300 EPA animal units - - - - - - -Amount Percent of Amount Percent of
total for farms total for farmswith confined with confined
livestock types livestock types
Number of farms 11,398 4.8 44,366 18.7
Number of farms by dominant livestock typeFattened cattle 1,766 9.9 4,448 25.0Milk cows 1,450 1.5 7,230 7.6Swine 3,924 7.6 13,825 26.7Turkeys 388 11.7 2,003 60.5Broilers 2,945 16.6 13,694 77.0Layers 546 11.1 1,420 28.9Pullets 125 8.2 711 46.4Veal 12 7.1 69 41.1Confined heifers 242 6.3 966 25.1
Total agricultural sales ($) 41,612,719,837 46.1 62,247,146,870 69.0Sales per farm 3,650,879 1,403,037
Livestock sales ($) 40,421,733,048 51.0 58,823,823,880 74.2Sales per farmMean 3,546,388 1,325,87625th percentile 1,059,606 373,28750th percentile (median) 1,510,469 607,61175th percentile 2,614,725 1,031,80190th percentile 5,500,000 1,946,80095th percentile 10,983,000 3,240,000
Correspondence between farmgroups and CNMP farms
In the main body of the publication, criteria werepresented for identifying farms that are expected toneed a CNMP. Of the 237,821 farms with confined
livestock types, 230,373 farms (97 percent) wereidentified as CNMP farms (table A–7). Of the 707,365farms with pastured livestock types and few
other livestock, 24,697 farms (3 percent) were identi-fied as CNMP farms. Including the 2,131 farms withspecialty livestock types, the total number of CNMPfarms is 257,201, which represents about 13 percent ofall farms in the 1997 Census of Agriculture. Table A–8provides a breakdown of CNMP farms by livestocktype and farm size for the 237,821 farms with con-
fined livestock types.
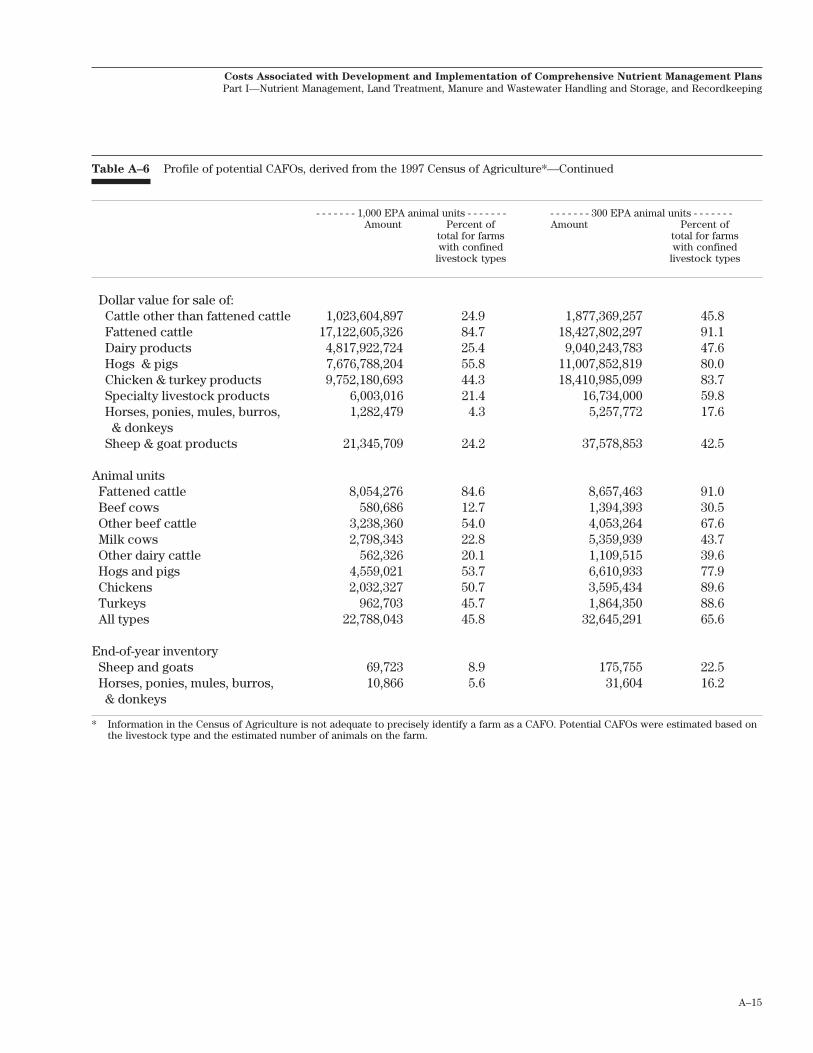
A–15
Costs Associated with Development and Implementation of Comprehensive Nutrient Management Plans
Part I—Nutrient Management, Land Treatment, Manure and Wastewater Handling and Storage, and Recordkeeping
Table A–6 Profile of potential CAFOs, derived from the 1997 Census of Agriculture*—Continued
- - - - - - - 1,000 EPA animal units - - - - - - - - - - - - - - 300 EPA animal units - - - - - - -Amount Percent of Amount Percent of
total for farms total for farmswith confined with confined
livestock types livestock types
Dollar value for sale of:Cattle other than fattened cattle 1,023,604,897 24.9 1,877,369,257 45.8Fattened cattle 17,122,605,326 84.7 18,427,802,297 91.1Dairy products 4,817,922,724 25.4 9,040,243,783 47.6Hogs & pigs 7,676,788,204 55.8 11,007,852,819 80.0Chicken & turkey products 9,752,180,693 44.3 18,410,985,099 83.7Specialty livestock products 6,003,016 21.4 16,734,000 59.8Horses, ponies, mules, burros, 1,282,479 4.3 5,257,772 17.6
& donkeysSheep & goat products 21,345,709 24.2 37,578,853 42.5
Animal unitsFattened cattle 8,054,276 84.6 8,657,463 91.0Beef cows 580,686 12.7 1,394,393 30.5Other beef cattle 3,238,360 54.0 4,053,264 67.6Milk cows 2,798,343 22.8 5,359,939 43.7Other dairy cattle 562,326 20.1 1,109,515 39.6Hogs and pigs 4,559,021 53.7 6,610,933 77.9Chickens 2,032,327 50.7 3,595,434 89.6Turkeys 962,703 45.7 1,864,350 88.6All types 22,788,043 45.8 32,645,291 65.6
End-of-year inventorySheep and goats 69,723 8.9 175,755 22.5Horses, ponies, mules, burros, 10,866 5.6 31,604 16.2& donkeys
* Information in the Census of Agriculture is not adequate to precisely identify a farm as a CAFO. Potential CAFOs were estimated based onthe livestock type and the estimated number of animals on the farm.
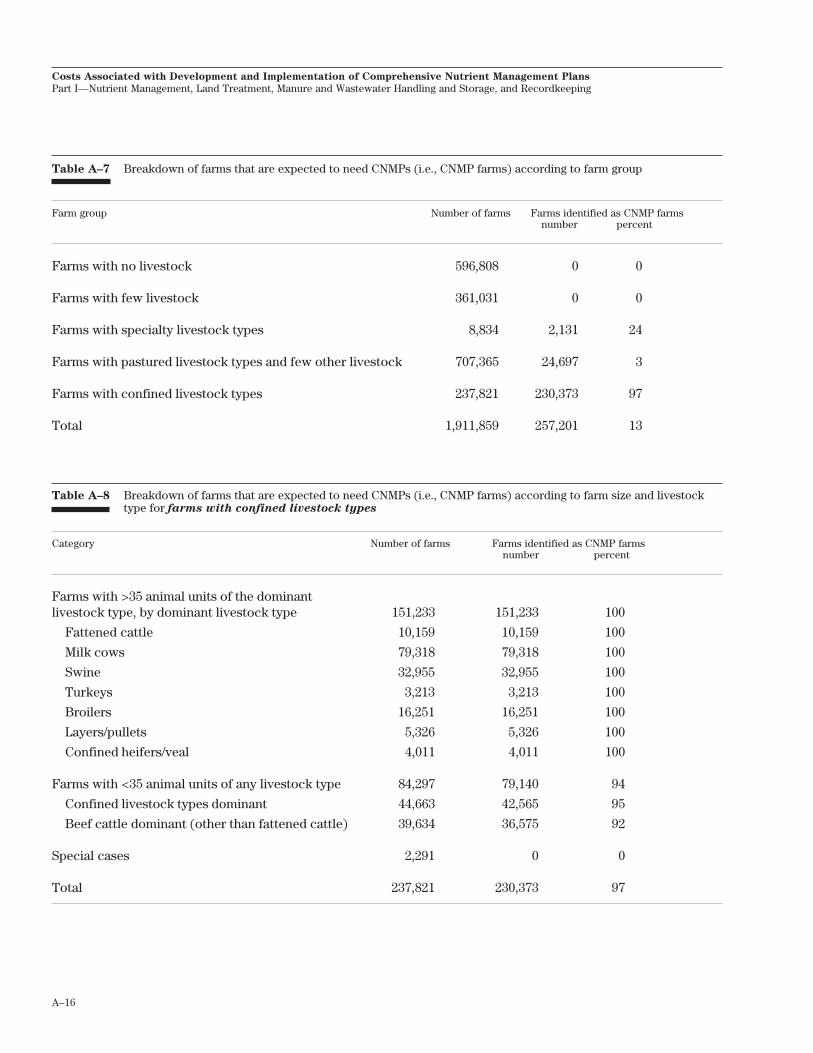
A–16
Costs Associated with Development and Implementation of Comprehensive Nutrient Management Plans
Part I—Nutrient Management, Land Treatment, Manure and Wastewater Handling and Storage, and Recordkeeping
Table A–7 Breakdown of farms that are expected to need CNMPs (i.e., CNMP farms) according to farm group
Farm group Number of farms Farms identified as CNMP farmsnumber percent
Farms with no livestock 596,808 0 0
Farms with few livestock 361,031 0 0
Farms with specialty livestock types 8,834 2,131 24
Farms with pastured livestock types and few other livestock 707,365 24,697 3
Farms with confined livestock types 237,821 230,373 97
Total 1,911,859 257,201 13
Table A–8 Breakdown of farms that are expected to need CNMPs (i.e., CNMP farms) according to farm size and livestocktype for farms with confined livestock types
Category Number of farms Farms identified as CNMP farmsnumber percent
Farms with >35 animal units of the dominantlivestock type, by dominant livestock type 151,233 151,233 100
Fattened cattle 10,159 10,159 100
Milk cows 79,318 79,318 100
Swine 32,955 32,955 100
Turkeys 3,213 3,213 100
Broilers 16,251 16,251 100
Layers/pullets 5,326 5,326 100
Confined heifers/veal 4,011 4,011 100
Farms with <35 animal units of any livestock type 84,297 79,140 94
Confined livestock types dominant 44,663 42,565 95
Beef cattle dominant (other than fattened cattle) 39,634 36,575 92
Special cases 2,291 0 0
Total 237,821 230,373 97
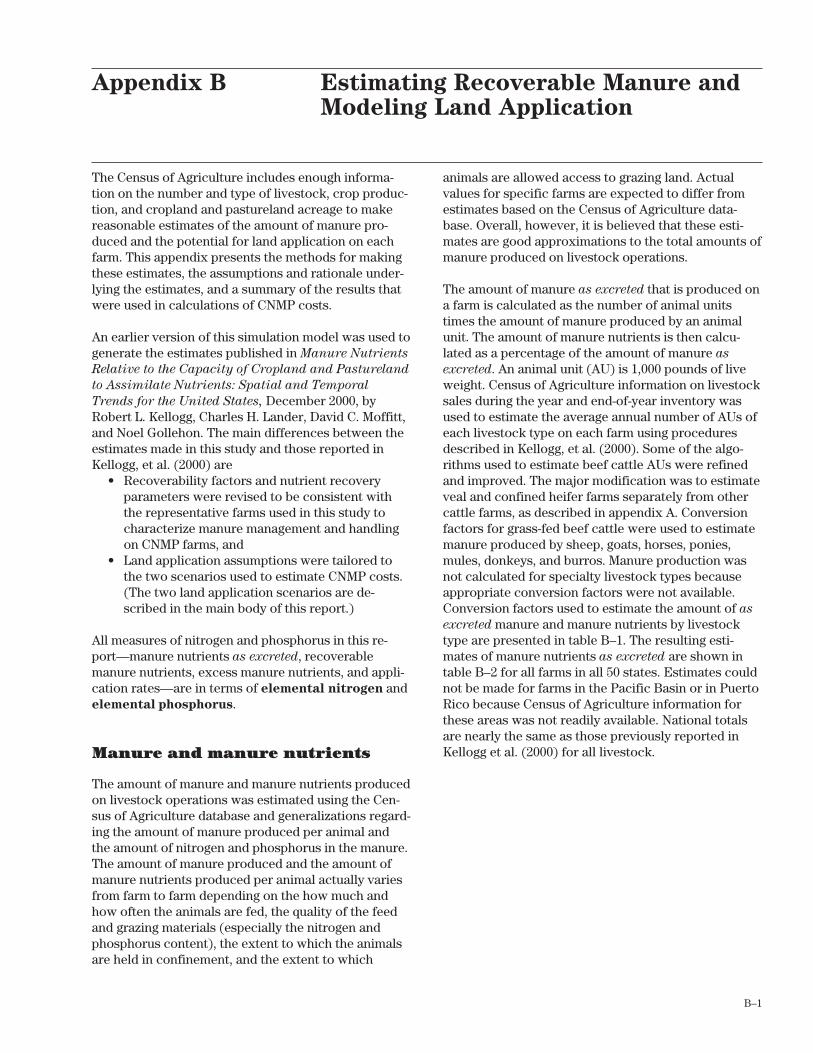
B–1
The Census of Agriculture includes enough informa-tion on the number and type of livestock, crop produc-tion, and cropland and pastureland acreage to makereasonable estimates of the amount of manure pro-duced and the potential for land application on eachfarm. This appendix presents the methods for makingthese estimates, the assumptions and rationale under-lying the estimates, and a summary of the results thatwere used in calculations of CNMP costs.
An earlier version of this simulation model was used togenerate the estimates published in Manure Nutrients
Relative to the Capacity of Cropland and Pastureland
to Assimilate Nutrients: Spatial and Temporal
Trends for the United States, December 2000, byRobert L. Kellogg, Charles H. Lander, David C. Moffitt,and Noel Gollehon. The main differences between theestimates made in this study and those reported inKellogg, et al. (2000) are
• Recoverability factors and nutrient recoveryparameters were revised to be consistent withthe representative farms used in this study tocharacterize manure management and handlingon CNMP farms, and
• Land application assumptions were tailored tothe two scenarios used to estimate CNMP costs.(The two land application scenarios are de-scribed in the main body of this report.)
All measures of nitrogen and phosphorus in this re-port—manure nutrients as excreted, recoverablemanure nutrients, excess manure nutrients, and appli-cation rates—are in terms of elemental nitrogen andelemental phosphorus.
Manure and manure nutrients
The amount of manure and manure nutrients producedon livestock operations was estimated using the Cen-sus of Agriculture database and generalizations regard-ing the amount of manure produced per animal andthe amount of nitrogen and phosphorus in the manure.The amount of manure produced and the amount ofmanure nutrients produced per animal actually variesfrom farm to farm depending on the how much andhow often the animals are fed, the quality of the feedand grazing materials (especially the nitrogen andphosphorus content), the extent to which the animalsare held in confinement, and the extent to which
Appendix B Estimating Recoverable Manure andModeling Land Application
animals are allowed access to grazing land. Actualvalues for specific farms are expected to differ fromestimates based on the Census of Agriculture data-base. Overall, however, it is believed that these esti-mates are good approximations to the total amounts ofmanure produced on livestock operations.
The amount of manure as excreted that is produced ona farm is calculated as the number of animal unitstimes the amount of manure produced by an animalunit. The amount of manure nutrients is then calcu-lated as a percentage of the amount of manure as
excreted. An animal unit (AU) is 1,000 pounds of liveweight. Census of Agriculture information on livestocksales during the year and end-of-year inventory wasused to estimate the average annual number of AUs ofeach livestock type on each farm using proceduresdescribed in Kellogg, et al. (2000). Some of the algo-rithms used to estimate beef cattle AUs were refinedand improved. The major modification was to estimateveal and confined heifer farms separately from othercattle farms, as described in appendix A. Conversionfactors for grass-fed beef cattle were used to estimatemanure produced by sheep, goats, horses, ponies,mules, donkeys, and burros. Manure production wasnot calculated for specialty livestock types becauseappropriate conversion factors were not available.Conversion factors used to estimate the amount of as
excreted manure and manure nutrients by livestocktype are presented in table B–1. The resulting esti-mates of manure nutrients as excreted are shown intable B–2 for all farms in all 50 states. Estimates couldnot be made for farms in the Pacific Basin or in PuertoRico because Census of Agriculture information forthese areas was not readily available. National totalsare nearly the same as those previously reported inKellogg et al. (2000) for all livestock.

B–2
Costs Associated with Development and Implementation of Comprehensive Nutrient Management Plans
Part I—Nutrient Management, Land Treatment, Manure and Wastewater Handling and Storage, and Recordkeeping
Table B–1 Parameters used to calculate the quantity of manure and manure nutrients as excreted
Livestock type Number Tons of manure per Pounds of nutrient perof animals - - - - AU per year - - - - wet weight ton of manure*
per AU wet weight oven-dry nitrogen phosphorusweight
Fattened cattle 1.14 10.59 1.27 10.98 3.37Beef calves 4 11.32 1.36 8.52 2.33Beef heifers 1.14 12.05 1.45 6.06 1.30Beef breeding cows and bulls 1 11.50 1.33 10.95 3.79Beef stockers and grass-fed beef 1.73 11.32 1.36 8.52 2.33
Horses, ponies, mules, donkeys, & burros 1.25 11.32 1.36 8.52 2.33Sheep and goats 8 11.32 1.36 8.52 2.33
Milk cows 0.74 15.24 2.20 10.69 1.92Dairy calves 4 12.05 1.45 6.06 1.30Dairy heifers 0.94 12.05 1.45 6.06 1.30Dairy stockers & grass-fed animals marketed as beef 1.73 12.05 1.45 6.06 1.30
Hogs for breeding 2.67 6.11 0.55 13.26 4.28Hogs for slaughter 9.09 14.69 1.33 11.30 3.29
Chicken layers 250 11.45 2.86 26.93 9.98Chicken pullets, less than 3 months old 455 8.32 2.08 27.20 10.53Chicken pullets, more than 3 months old 250 8.32 2.08 27.20 10.53Chicken broilers 455 14.97 3.74 26.83 7.80
Turkeys for breeding 50 9.12 2.28 22.41 13.21Turkeys for slaughter 67 8.18 2.04 30.36 11.83
* Includes nitrogen and phosphorus in urine.
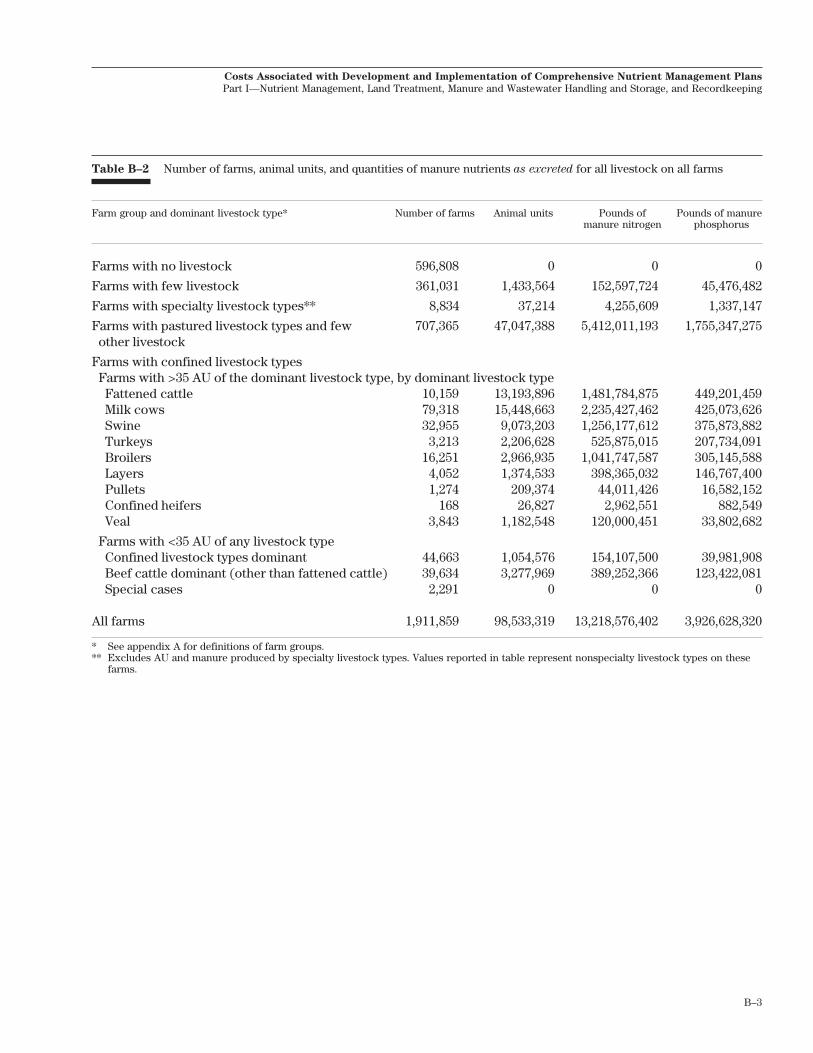
B–3
Costs Associated with Development and Implementation of Comprehensive Nutrient Management Plans
Part I—Nutrient Management, Land Treatment, Manure and Wastewater Handling and Storage, and Recordkeeping
Table B–2 Number of farms, animal units, and quantities of manure nutrients as excreted for all livestock on all farms
Farm group and dominant livestock type* Number of farms Animal units Pounds of Pounds of manuremanure nitrogen phosphorus
Farms with no livestock 596,808 0 0 0
Farms with few livestock 361,031 1,433,564 152,597,724 45,476,482
Farms with specialty livestock types** 8,834 37,214 4,255,609 1,337,147
Farms with pastured livestock types and few 707,365 47,047,388 5,412,011,193 1,755,347,275other livestock
Farms with confined livestock typesFarms with >35 AU of the dominant livestock type, by dominant livestock typeFattened cattle 10,159 13,193,896 1,481,784,875 449,201,459Milk cows 79,318 15,448,663 2,235,427,462 425,073,626Swine 32,955 9,073,203 1,256,177,612 375,873,882Turkeys 3,213 2,206,628 525,875,015 207,734,091Broilers 16,251 2,966,935 1,041,747,587 305,145,588Layers 4,052 1,374,533 398,365,032 146,767,400Pullets 1,274 209,374 44,011,426 16,582,152Confined heifers 168 26,827 2,962,551 882,549Veal 3,843 1,182,548 120,000,451 33,802,682
Farms with <35 AU of any livestock typeConfined livestock types dominant 44,663 1,054,576 154,107,500 39,981,908Beef cattle dominant (other than fattened cattle) 39,634 3,277,969 389,252,366 123,422,081Special cases 2,291 0 0 0
All farms 1,911,859 98,533,319 13,218,576,402 3,926,628,320
* See appendix A for definitions of farm groups.** Excludes AU and manure produced by specialty livestock types. Values reported in table represent nonspecialty livestock types on these
farms.
B–4
Costs Associated with Development and Implementation of Comprehensive Nutrient Management Plans
Part I—Nutrient Management, Land Treatment, Manure and Wastewater Handling and Storage, and Recordkeeping
Recoverable manure and recover-able manure nutrients
Recoverable manure is the portion of manure as
excreted that could be collected from buildings andlots where livestock are held, and thus would beavailable for land application. Recoverable manurenutrients are the amounts of manure nitrogen andphosphorus that would be expected to be available forland application. They are estimated by adjusting thequantity of recoverable manure for nutrient loss duringcollection, transfer, storage, and treatment. Recover-able manure nutrients are not adjusted for losses ofnutrients at the time of land application.
Estimates of manure produced as excreted wereconverted to estimates of recoverable manure usingrecoverability factors. The manure recoverability
factor is the proportion of manure as excreted thatcan be collected and made available for land applica-tion or other use. Nutrient recovery parameters arethe proportions of nitrogen and phosphorus in therecoverable manure relative to the amount of manurenutrients as excreted. Recoverability factors werederived for each model farm. Model farms are definedin the main body of this publication. The model farmanalytical structure was expanded somewhat to ac-count for recoverable manure on small farms andregional variability.
Manure recoverability factors and nutrient recoveryparameters for fattened cattle, milk cows, veal, con-fined heifers, swine, chickens, and turkeys are pre-sented in table B–3. Separate estimates of recoverablemanure and manure nutrients were made for each ofthe two land application scenarios defined in the mainbody of this publication. Estimates for the baseline
scenario were made using manure recoverabilityfactors and nutrient recovery parameters that areexpected to generally represent conditions in about1997, prior to implementation of CNMPs and mostState and local regulations. Estimates for the after-
CNMP scenario reflect adjustments for improvedmanure management and handling. Manure recover-ability factors were higher for most model farms in theafter-CNMP scenario. Most nutrient recovery param-eters were the same in both land application sce-narios. Nitrogen recovery parameters were lower inthe after-CNMP scenario for some liquid waste han-dling systems (dairies) under the assumption that
more of the solid manure on the farm would be incor-porated into the liquid system where volatilizationrates are higher. For some liquid systems, the systemchanges typically needed to meet CNMP criteria wouldsignificantly increase the storage time, and wastewa-ter would be more dilute. This would be especiallytrue upgrading a storage pond to a storage lagoon. Thelonger storage time provides more time for volatiliza-tion, so N losses in the after-CNMP scenario could begreater.
Estimates of recoverable manure for pastured live-stock types (e.g., beef cattle, horses, sheep, and goats)were limited to farms with more than one animal unitof these types per acre of pastureland and rangeland.Recoverability factors reflect the extent to whichthese livestock are expected to be held in confinementor the extent that the livestock are expected to congre-gate in lots and barnyards for shelter or feeding. Re-coverability factors for beef cows, calves, heifers, andstockers presented in Kellogg et al. (2000) were ad-justed upward to account for the exclusion of farmswith less than one animal unit per acre of pasturelandand rangeland. Manure recoverability factors for thisgroup were 0.05 (5 percent) for 17 states (mostly in theWest, Southeast, and South Central States), 0.10 for 29states, and 0.15 or 0.20 for four states (mostly in theNortheast). Nutrient recovery parameters for beefcattle are the same as those reported in Kellogg et al.(2000), table 8.
Estimates of recoverable manure for dairy cattle otherthan milk cows (exclusive of dairy calves and dairyheifers on veal and confined heifer farms) were basedon recoverability factors and nutrient recovery param-eters reported in Kellogg et al. (2000) for these live-stock types. Recoverable manure for sheep, goats,horses, ponies, mules, donkeys, and burros was esti-mated using manure recoverability factors and nutri-ent recovery parameters for grass-fed beef cattle.
Recoverable manure was not calculated for farms withfew livestock or for farms with specialty livestocktypes (ducks, geese, mink, and rabbits). Farms withfew livestock, as described in appendix A, have lessthan 4 AU of fattened cattle, milk cows, swine, orpoultry and small numbers of pastured livestock types.Since few livestock on these farms are raised in con-fined settings, the amount of recoverable manure isexpected to be negligible. Significant amounts of
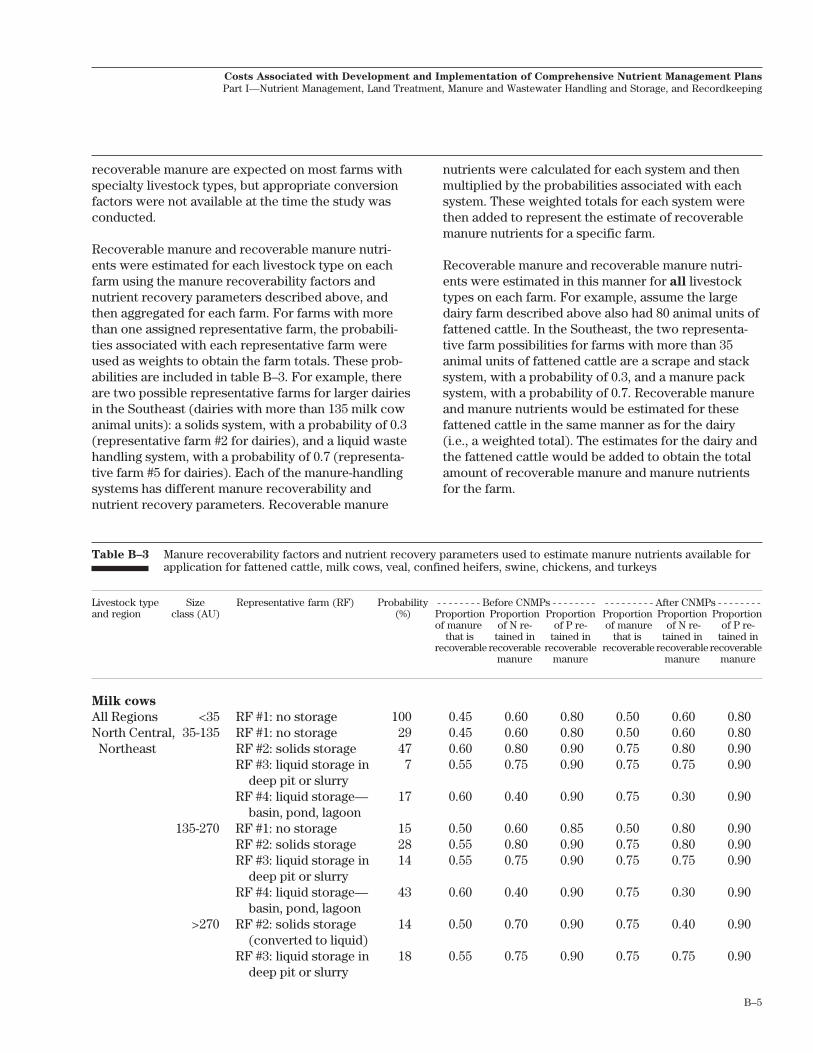
B–5
Costs Associated with Development and Implementation of Comprehensive Nutrient Management Plans
Part I—Nutrient Management, Land Treatment, Manure and Wastewater Handling and Storage, and Recordkeeping
recoverable manure are expected on most farms withspecialty livestock types, but appropriate conversionfactors were not available at the time the study wasconducted.
Recoverable manure and recoverable manure nutri-ents were estimated for each livestock type on eachfarm using the manure recoverability factors andnutrient recovery parameters described above, andthen aggregated for each farm. For farms with morethan one assigned representative farm, the probabili-ties associated with each representative farm wereused as weights to obtain the farm totals. These prob-abilities are included in table B–3. For example, thereare two possible representative farms for larger dairiesin the Southeast (dairies with more than 135 milk cowanimal units): a solids system, with a probability of 0.3(representative farm #2 for dairies), and a liquid wastehandling system, with a probability of 0.7 (representa-tive farm #5 for dairies). Each of the manure-handlingsystems has different manure recoverability andnutrient recovery parameters. Recoverable manure
nutrients were calculated for each system and thenmultiplied by the probabilities associated with eachsystem. These weighted totals for each system werethen added to represent the estimate of recoverablemanure nutrients for a specific farm.
Recoverable manure and recoverable manure nutri-ents were estimated in this manner for all livestocktypes on each farm. For example, assume the largedairy farm described above also had 80 animal units offattened cattle. In the Southeast, the two representa-tive farm possibilities for farms with more than 35animal units of fattened cattle are a scrape and stacksystem, with a probability of 0.3, and a manure packsystem, with a probability of 0.7. Recoverable manureand manure nutrients would be estimated for thesefattened cattle in the same manner as for the dairy(i.e., a weighted total). The estimates for the dairy andthe fattened cattle would be added to obtain the totalamount of recoverable manure and manure nutrientsfor the farm.
Table B–3 Manure recoverability factors and nutrient recovery parameters used to estimate manure nutrients available forapplication for fattened cattle, milk cows, veal, confined heifers, swine, chickens, and turkeys
Livestock type Size Representative farm (RF) Probability - - - - - - - - Before CNMPs - - - - - - - - - - - - - - - - - After CNMPs - - - - - - - -and region class (AU) (%) Proportion Proportion Proportion Proportion Proportion Proportion
of manure of N re- of P re- of manure of N re- of P re-that is tained in tained in that is tained in tained in
recoverable recoverable recoverable recoverable recoverable recoverablemanure manure manure manure
Milk cows
All Regions <35 RF #1: no storage 100 0.45 0.60 0.80 0.50 0.60 0.80North Central, 35-135 RF #1: no storage 29 0.45 0.60 0.80 0.50 0.60 0.80
Northeast RF #2: solids storage 47 0.60 0.80 0.90 0.75 0.80 0.90RF #3: liquid storage in 7 0.55 0.75 0.90 0.75 0.75 0.90
deep pit or slurryRF #4: liquid storage— 17 0.60 0.40 0.90 0.75 0.30 0.90
basin, pond, lagoon135-270 RF #1: no storage 15 0.50 0.60 0.85 0.50 0.80 0.90
RF #2: solids storage 28 0.55 0.80 0.90 0.75 0.80 0.90RF #3: liquid storage in 14 0.55 0.75 0.90 0.75 0.75 0.90
deep pit or slurryRF #4: liquid storage— 43 0.60 0.40 0.90 0.75 0.30 0.90
basin, pond, lagoon>270 RF #2: solids storage 14 0.50 0.70 0.90 0.75 0.40 0.90
(converted to liquid)RF #3: liquid storage in 18 0.55 0.75 0.90 0.75 0.75 0.90
deep pit or slurry

B–6
Costs Associated with Development and Implementation of Comprehensive Nutrient Management Plans
Part I—Nutrient Management, Land Treatment, Manure and Wastewater Handling and Storage, and Recordkeeping
Table B–3 Manure recoverability factors and nutrient recovery parameters used to estimate manure nutrients available forapplication for fattened cattle, milk cows, veal, confined heifers, swine, chickens, and turkeys—Continued
Livestock type Size Representative farm (RF) Probability - - - - - - - - Before CNMPs - - - - - - - - - - - - - - - - - After CNMPs - - - - - - - -and region class (AU) (%) Proportion Proportion Proportion Proportion Proportion Proportion
of manure of N re- of P re- of manure of N re- of P re-that is tained in tained in that is tained in tained in
recoverable recoverable recoverable recoverable recoverable recoverablemanure manure manure manure
RF #4: liquid storage— 68 0.55 0.40 0.90 0.75 0.30 0.90basin, pond, lagoon
Southeast 35-135 RF #2: solids storage 59 0.50 0.65 0.80 0.65 0.60 0.80RF #5: any liquid storage 41 0.55 0.65 0.90 0.70 0.65 0.90
>135 RF #2: solids storage 30 0.50 0.70 0.85 0.65 0.67 0.90RF #5: any liquid storage 70 0.55 0.35 0.90 0.70 0.25 0.90
West 35-135 RF #2: solids storage 50 0.55 0.55 0.90 0.65 0.55 0.90RF #5: any liquid storage, 50 0.50 0.65 0.90 0.75 0.65 0.90
with manure pack135-270 RF #2: solids storage 11 0.50 0.65 0.85 0.65 0.55 0.90
RF #5: any liquid storage, 89 0.55 0.40 0.85 0.75 0.30 0.90with manure pack
>270 RF #5: any liquid storage, 100 0.60 0.40 0.85 0.75 0.30 0.90with manure pack
Fattened cattle
All Regions <35 RF #1: feedlot scrape, 100 0.60 0.60 0.80 0.75 0.60 0.80stack
New England >35 RF #1: feedlot scrape, 100 0.55 0.70 0.85 0.75 0.70 0.85stack
PA, NY, NJ >35 RF #1: feedlot scrape, 100 0.60 0.70 0.85 0.75 0.70 0.85stack
Southeast >35 RF #1: feedlot scrape, 30 0.55 0.60 0.80 0.75 0.60 0.80stack
RF #2: feedlot with 70 0.60 0.55 0.75 0.80 0.55 0.75manure pack, runoff
Midwest 35-500 RF #1: feedlot scrape, 30 0.60 0.60 0.80 0.75 0.60 0.80stack
RF #2: feedlot with 70 0.60 0.50 0.80 0.80 0.50 0.80manure pack, runoff
> 500 RF #2: feedlot with 100 0.65 0.50 0.80 0.80 0.50 0.80manure pack, runoff
MT, WY, SD, MN35-500 RF #2: feedlot with 100 0.60 0.55 0.80 0.80 0.55 0.80manure pack, runoff
>500 RF #2: feedlot with 100 0.65 0.55 0.80 0.80 0.55 0.80manure pack, runoff
CO, KS, NE, SD35-1000 RF #2: feedlot with 100 0.60 0.50 0.80 0.80 0.50 0.80manure pack, runoff
>1000 RF #2: feedlot with 100 0.60 0.50 0.80 0.80 0.50 0.80manure pack, runoff
TX, OK, NM 35-1000 RF #2: feedlot with 100 0.60 0.45 0.80 0.80 0.45 0.80manure pack, runoff
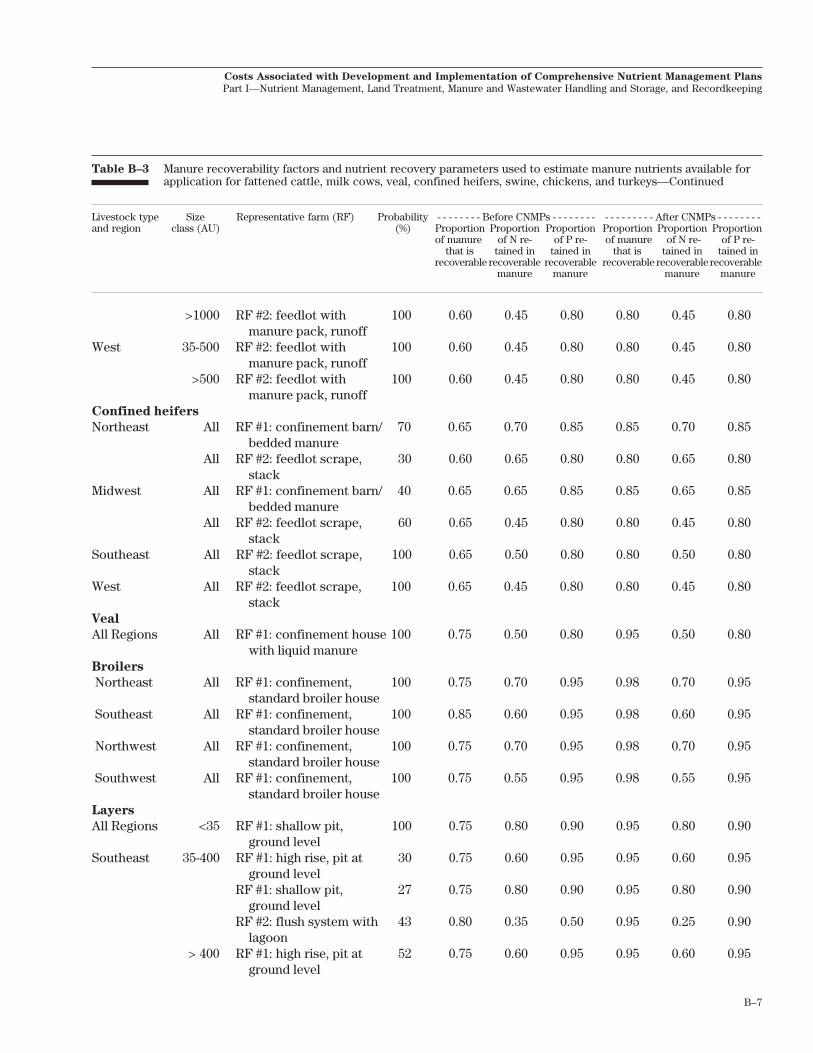
B–7
Costs Associated with Development and Implementation of Comprehensive Nutrient Management Plans
Part I—Nutrient Management, Land Treatment, Manure and Wastewater Handling and Storage, and Recordkeeping
Table B–3 Manure recoverability factors and nutrient recovery parameters used to estimate manure nutrients available forapplication for fattened cattle, milk cows, veal, confined heifers, swine, chickens, and turkeys—Continued
Livestock type Size Representative farm (RF) Probability - - - - - - - - Before CNMPs - - - - - - - - - - - - - - - - - After CNMPs - - - - - - - -and region class (AU) (%) Proportion Proportion Proportion Proportion Proportion Proportion
of manure of N re- of P re- of manure of N re- of P re-that is tained in tained in that is tained in tained in
recoverable recoverable recoverable recoverable recoverable recoverablemanure manure manure manure
>1000 RF #2: feedlot with 100 0.60 0.45 0.80 0.80 0.45 0.80manure pack, runoff
West 35-500 RF #2: feedlot with 100 0.60 0.45 0.80 0.80 0.45 0.80manure pack, runoff
>500 RF #2: feedlot with 100 0.60 0.45 0.80 0.80 0.45 0.80manure pack, runoff
Confined heifers
Northeast All RF #1: confinement barn/ 70 0.65 0.70 0.85 0.85 0.70 0.85bedded manure
All RF #2: feedlot scrape, 30 0.60 0.65 0.80 0.80 0.65 0.80stack
Midwest All RF #1: confinement barn/ 40 0.65 0.65 0.85 0.85 0.65 0.85bedded manure
All RF #2: feedlot scrape, 60 0.65 0.45 0.80 0.80 0.45 0.80stack
Southeast All RF #2: feedlot scrape, 100 0.65 0.50 0.80 0.80 0.50 0.80stack
West All RF #2: feedlot scrape, 100 0.65 0.45 0.80 0.80 0.45 0.80stack
Veal
All Regions All RF #1: confinement house 100 0.75 0.50 0.80 0.95 0.50 0.80with liquid manure
Broilers
Northeast All RF #1: confinement, 100 0.75 0.70 0.95 0.98 0.70 0.95standard broiler house
Southeast All RF #1: confinement, 100 0.85 0.60 0.95 0.98 0.60 0.95standard broiler house
Northwest All RF #1: confinement, 100 0.75 0.70 0.95 0.98 0.70 0.95standard broiler house
Southwest All RF #1: confinement, 100 0.75 0.55 0.95 0.98 0.55 0.95standard broiler house
Layers
All Regions <35 RF #1: shallow pit, 100 0.75 0.80 0.90 0.95 0.80 0.90ground level
Southeast 35-400 RF #1: high rise, pit at 30 0.75 0.60 0.95 0.95 0.60 0.95ground level
RF #1: shallow pit, 27 0.75 0.80 0.90 0.95 0.80 0.90ground level
RF #2: flush system with 43 0.80 0.35 0.50 0.95 0.25 0.90lagoon
> 400 RF #1: high rise, pit at 52 0.75 0.60 0.95 0.95 0.60 0.95ground level
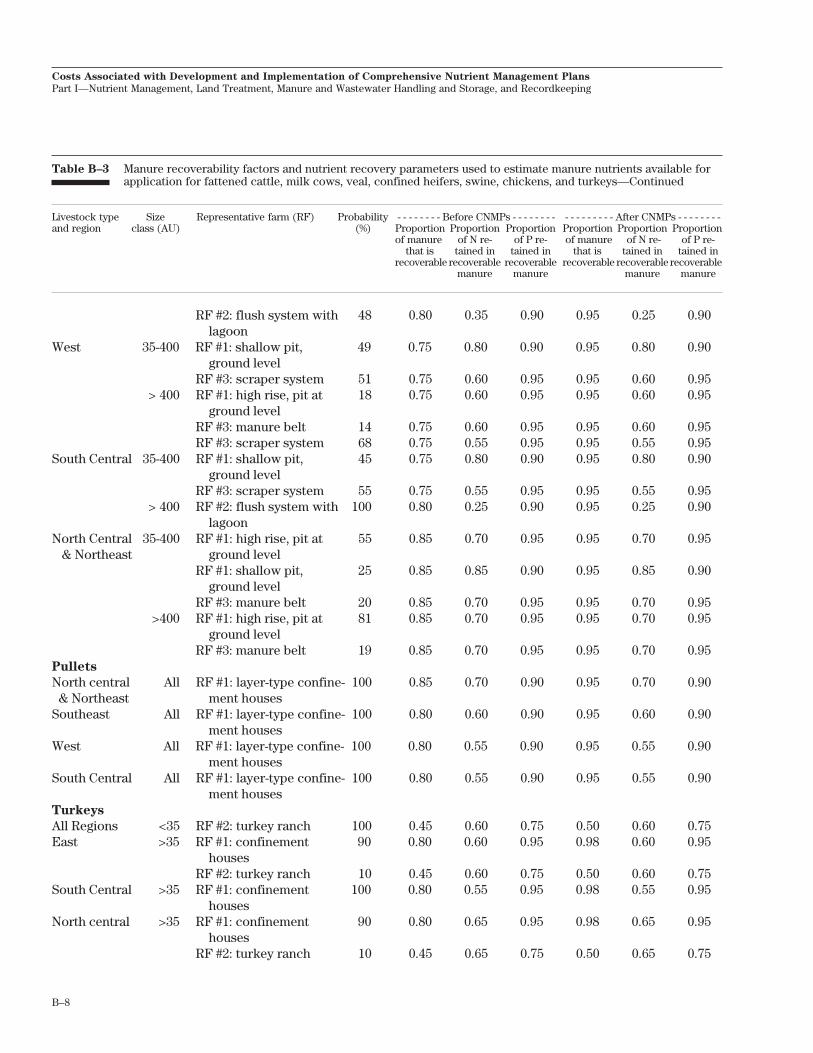
B–8
Costs Associated with Development and Implementation of Comprehensive Nutrient Management Plans
Part I—Nutrient Management, Land Treatment, Manure and Wastewater Handling and Storage, and Recordkeeping
Table B–3 Manure recoverability factors and nutrient recovery parameters used to estimate manure nutrients available forapplication for fattened cattle, milk cows, veal, confined heifers, swine, chickens, and turkeys—Continued
Livestock type Size Representative farm (RF) Probability - - - - - - - - Before CNMPs - - - - - - - - - - - - - - - - - After CNMPs - - - - - - - -and region class (AU) (%) Proportion Proportion Proportion Proportion Proportion Proportion
of manure of N re- of P re- of manure of N re- of P re-that is tained in tained in that is tained in tained in
recoverable recoverable recoverable recoverable recoverable recoverablemanure manure manure manure
RF #2: flush system with 48 0.80 0.35 0.90 0.95 0.25 0.90lagoon
West 35-400 RF #1: shallow pit, 49 0.75 0.80 0.90 0.95 0.80 0.90ground level
RF #3: scraper system 51 0.75 0.60 0.95 0.95 0.60 0.95> 400 RF #1: high rise, pit at 18 0.75 0.60 0.95 0.95 0.60 0.95
ground levelRF #3: manure belt 14 0.75 0.60 0.95 0.95 0.60 0.95RF #3: scraper system 68 0.75 0.55 0.95 0.95 0.55 0.95
South Central 35-400 RF #1: shallow pit, 45 0.75 0.80 0.90 0.95 0.80 0.90ground level
RF #3: scraper system 55 0.75 0.55 0.95 0.95 0.55 0.95> 400 RF #2: flush system with 100 0.80 0.25 0.90 0.95 0.25 0.90
lagoonNorth Central 35-400 RF #1: high rise, pit at 55 0.85 0.70 0.95 0.95 0.70 0.95 & Northeast ground level
RF #1: shallow pit, 25 0.85 0.85 0.90 0.95 0.85 0.90ground level
RF #3: manure belt 20 0.85 0.70 0.95 0.95 0.70 0.95 >400 RF #1: high rise, pit at 81 0.85 0.70 0.95 0.95 0.70 0.95
ground levelRF #3: manure belt 19 0.85 0.70 0.95 0.95 0.70 0.95
Pullets
North central All RF #1: layer-type confine- 100 0.85 0.70 0.90 0.95 0.70 0.90& Northeast ment houses
Southeast All RF #1: layer-type confine- 100 0.80 0.60 0.90 0.95 0.60 0.90ment houses
West All RF #1: layer-type confine- 100 0.80 0.55 0.90 0.95 0.55 0.90ment houses
South Central All RF #1: layer-type confine- 100 0.80 0.55 0.90 0.95 0.55 0.90ment houses
Turkeys
All Regions <35 RF #2: turkey ranch 100 0.45 0.60 0.75 0.50 0.60 0.75East >35 RF #1: confinement 90 0.80 0.60 0.95 0.98 0.60 0.95
housesRF #2: turkey ranch 10 0.45 0.60 0.75 0.50 0.60 0.75
South Central >35 RF #1: confinement 100 0.80 0.55 0.95 0.98 0.55 0.95houses
North central >35 RF #1: confinement 90 0.80 0.65 0.95 0.98 0.65 0.95houses
RF #2: turkey ranch 10 0.45 0.65 0.75 0.50 0.65 0.75
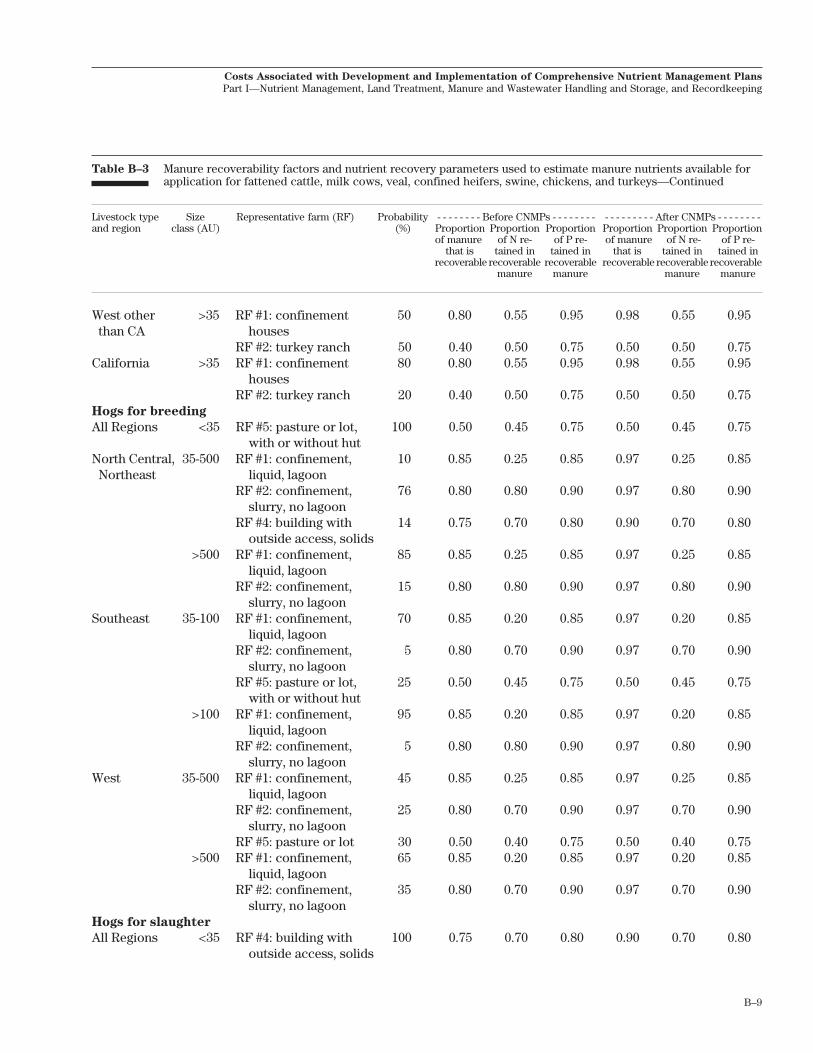
B–9
Costs Associated with Development and Implementation of Comprehensive Nutrient Management Plans
Part I—Nutrient Management, Land Treatment, Manure and Wastewater Handling and Storage, and Recordkeeping
Table B–3 Manure recoverability factors and nutrient recovery parameters used to estimate manure nutrients available forapplication for fattened cattle, milk cows, veal, confined heifers, swine, chickens, and turkeys—Continued
Livestock type Size Representative farm (RF) Probability - - - - - - - - Before CNMPs - - - - - - - - - - - - - - - - - After CNMPs - - - - - - - -and region class (AU) (%) Proportion Proportion Proportion Proportion Proportion Proportion
of manure of N re- of P re- of manure of N re- of P re-that is tained in tained in that is tained in tained in
recoverable recoverable recoverable recoverable recoverable recoverablemanure manure manure manure
West other >35 RF #1: confinement 50 0.80 0.55 0.95 0.98 0.55 0.95than CA houses
RF #2: turkey ranch 50 0.40 0.50 0.75 0.50 0.50 0.75California >35 RF #1: confinement 80 0.80 0.55 0.95 0.98 0.55 0.95
housesRF #2: turkey ranch 20 0.40 0.50 0.75 0.50 0.50 0.75
Hogs for breeding
All Regions <35 RF #5: pasture or lot, 100 0.50 0.45 0.75 0.50 0.45 0.75with or without hut
North Central, 35-500 RF #1: confinement, 10 0.85 0.25 0.85 0.97 0.25 0.85Northeast liquid, lagoon
RF #2: confinement, 76 0.80 0.80 0.90 0.97 0.80 0.90slurry, no lagoon
RF #4: building with 14 0.75 0.70 0.80 0.90 0.70 0.80outside access, solids
>500 RF #1: confinement, 85 0.85 0.25 0.85 0.97 0.25 0.85liquid, lagoon
RF #2: confinement, 15 0.80 0.80 0.90 0.97 0.80 0.90slurry, no lagoon
Southeast 35-100 RF #1: confinement, 70 0.85 0.20 0.85 0.97 0.20 0.85liquid, lagoon
RF #2: confinement, 5 0.80 0.70 0.90 0.97 0.70 0.90slurry, no lagoon
RF #5: pasture or lot, 25 0.50 0.45 0.75 0.50 0.45 0.75with or without hut
>100 RF #1: confinement, 95 0.85 0.20 0.85 0.97 0.20 0.85liquid, lagoon
RF #2: confinement, 5 0.80 0.80 0.90 0.97 0.80 0.90slurry, no lagoon
West 35-500 RF #1: confinement, 45 0.85 0.25 0.85 0.97 0.25 0.85liquid, lagoon
RF #2: confinement, 25 0.80 0.70 0.90 0.97 0.70 0.90slurry, no lagoon
RF #5: pasture or lot 30 0.50 0.40 0.75 0.50 0.40 0.75 >500 RF #1: confinement, 65 0.85 0.20 0.85 0.97 0.20 0.85
liquid, lagoonRF #2: confinement, 35 0.80 0.70 0.90 0.97 0.70 0.90
slurry, no lagoonHogs for slaughter
All Regions <35 RF #4: building with 100 0.75 0.70 0.80 0.90 0.70 0.80outside access, solids

B–10
Costs Associated with Development and Implementation of Comprehensive Nutrient Management Plans
Part I—Nutrient Management, Land Treatment, Manure and Wastewater Handling and Storage, and Recordkeeping
Table B–3 Manure recoverability factors and nutrient recovery parameters used to estimate manure nutrients available forapplication for fattened cattle, milk cows, veal, confined heifers, swine, chickens, and turkeys—Continued
Livestock type Size Representative farm (RF) Probability - - - - - - - - Before CNMPs - - - - - - - - - - - - - - - - - After CNMPs - - - - - - - -and region class (AU) (%) Proportion Proportion Proportion Proportion Proportion Proportion
of manure of N re- of P re- of manure of N re- of P re-that is tained in tained in that is tained in tained in
recoverable recoverable recoverable recoverable recoverable recoverablemanure manure manure manure
North Central, 35-500 RF #1: confinement, 6 0.85 0.25 0.85 0.97 0.25 0.85Northeast liquid, lagoon
RF #2: confinement, 53 0.80 0.80 0.90 0.97 0.80 0.90slurry, no lagoon
RF #3: building with 14 0.70 0.75 0.90 0.95 0.75 0.90outside access, liquid
RF #4: building with 27 0.75 0.70 0.80 0.90 0.70 0.80outside access, solids
>500 RF #1: confinement, 27 0.85 0.25 0.85 0.97 0.25 0.85liquid, lagoon
RF #2: confinement, 73 0.80 0.80 0.90 0.97 0.80 0.90slurry, no lagoon
Southeast 35-100 RF #1: confinement, 90 0.85 0.20 0.85 0.97 0.20 0.85liquid, lagoon
RF #2: confinement, 10 0.80 0.70 0.90 0.97 0.70 0.90slurry, no lagoon
>100 RF #1: confinement, 100 0.85 0.20 0.85 0.97 0.20 0.85liquid, lagoon
West 35-500 RF #1: confinement, 50 0.85 0.25 0.85 0.97 0.25 0.85liquid, lagoon
RF #2: confinement, 50 0.80 0.70 0.90 0.97 0.70 0.90slurry, no lagoon
>500 RF #1: confinement, 50 0.85 0.20 0.85 0.97 0.20 0.85liquid, lagoon
RF #2: confinement, 50 0.80 0.70 0.90 0.97 0.70 0.90slurry, no lagoon

B–11
Costs Associated with Development and Implementation of Comprehensive Nutrient Management Plans
Part I—Nutrient Management, Land Treatment, Manure and Wastewater Handling and Storage, and Recordkeeping
Farms with a minimum amount of total recoverablemanure produced annually were classified as manure-
producing farms. Manure-producing farms weredefined to be farms that produce more than 200pounds of recoverable manure nitrogen annually.Farms at this threshold generate about 45 tons ofrecoverable manure, as excreted, which is equivalentto about 11 tons of manure for land application (trans-port weight), or less than a pickup truck load permonth. This lower threshold was used as a practicalmatter to exclude numerous small farms that pro-duced no more recoverable manure than the largest ofthe farms with few livestock. It is also questionable
that the manure recovery factors and manure nutrientrecovery parameters would apply to these small farmssince they were derived for larger operations. Recover-able manure for farms below this threshold was setequal to zero for all subsequent calculations. Therewere 255,070 manure-producing farms in 1997, exclud-ing specialty livestock farms.
Estimates of recoverable manure nutrients for thebaseline scenario and for the after-CNMP scenario arecompared to estimates previously published in Kellogget al. (2000) in table B–4. The largest difference inrecoverable manure between the revised estimates
Table B–4 Estimates of recoverable manure and recoverable manure nutrients for manure-producing farms, 1997*
Published in Baseline scenario After-CNMP scenario Percent changeKellogg et al. (2000) in the after-CNMP
scenario ascompared to thebaseline scenario
Number of manure-producing farms 529,658** 255,070 255,070 0
Pounds of recoverable manure nitrogen Fattened cattle 389,900,000 327,007,586 432,098,907 32 Milk cows 635,700,000 601,051,133 673,290,892 12 Swine 274,100,000 521,975,775 629,395,784 21 Poultry 1,152,900,000 977,656,262 1,160,981,406 19 Other beef and dairy 130,600,000 105,383,686 113,076,052 7 Horses, sheep, goats No estimate 713,584 713,584 0 All types 2,583,200,000 2,533,788,026 3,009,556,624 19
Pounds of recoverable manure phosphorus Fattened cattle 254,000,000 163,443,118 216,222,176 32 Milk cows 243,900,000 175,074,365 225,637,803 29 Swine 276,800,000 245,696,950 291,700,481 19 Poultry 553,900,000 501,727,122 600,495,014 20 Other beef and dairy 108,200,000 64,651,344 68,014,510 5 Horses, sheep, goats No estimate 551,913 551,913 0 All types 1,436,800,000 1,151,144,811 1,402,621,897 22
Tons of recoverable manure, Not reported 355,033,803 430,173,338 21as excreted wet weight
Tons of recoverable manure, Not reported 50,178,583 60,823,028 21as excreted oven-dry weight
* Excludes 2,131 specialty livestock farms.** Previously published estimates of the number of farms are not directly comparable to the revised estimates because they apply to livestock
that were treated as confined livestock in Kellogg et al. (2000). About half of the farms in Kellogg et al. (2000) with confined livestockproduced negligible amounts of recoverable manure.
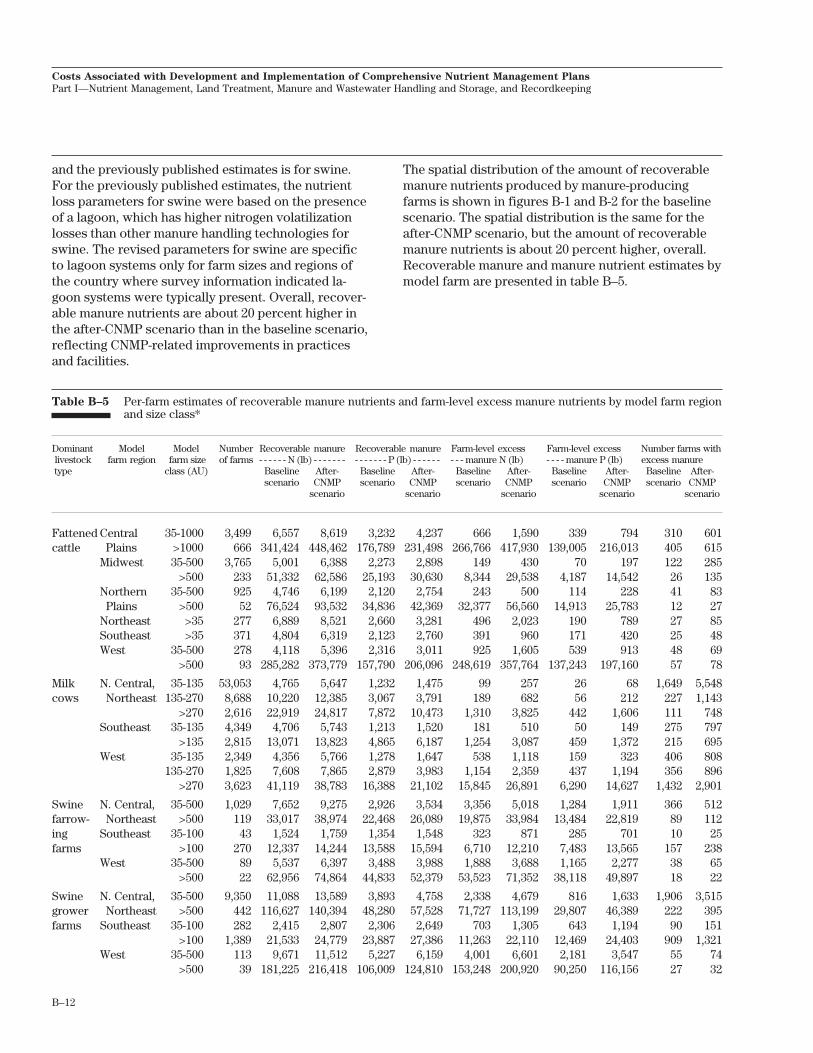
B–12
Costs Associated with Development and Implementation of Comprehensive Nutrient Management Plans
Part I—Nutrient Management, Land Treatment, Manure and Wastewater Handling and Storage, and Recordkeeping
and the previously published estimates is for swine.For the previously published estimates, the nutrientloss parameters for swine were based on the presenceof a lagoon, which has higher nitrogen volatilizationlosses than other manure handling technologies forswine. The revised parameters for swine are specificto lagoon systems only for farm sizes and regions ofthe country where survey information indicated la-goon systems were typically present. Overall, recover-able manure nutrients are about 20 percent higher inthe after-CNMP scenario than in the baseline scenario,reflecting CNMP-related improvements in practicesand facilities.
The spatial distribution of the amount of recoverablemanure nutrients produced by manure-producingfarms is shown in figures B-1 and B-2 for the baselinescenario. The spatial distribution is the same for theafter-CNMP scenario, but the amount of recoverablemanure nutrients is about 20 percent higher, overall.Recoverable manure and manure nutrient estimates bymodel farm are presented in table B–5.
Table B–5 Per-farm estimates of recoverable manure nutrients and farm-level excess manure nutrients by model farm regionand size class*
Dominant Model Model Number Recoverable manure Recoverable manure Farm-level excess Farm-level excess Number farms with livestock farm region farm size of farms - - - - - - N (lb) - - - - - - - - - - - - - - P (lb) - - - - - - - - - manure N (lb) - - - - manure P (lb) excess manure type class (AU) Baseline After- Baseline After- Baseline After- Baseline After- Baseline After-
scenario CNMP scenario CNMP scenario CNMP scenario CNMP scenario CNMPscenario scenario scenario scenario scenario
Fattened Central 35-1000 3,499 6,557 8,619 3,232 4,237 666 1,590 339 794 310 601cattle Plains >1000 666 341,424 448,462 176,789 231,498 266,766 417,930 139,005 216,013 405 615
Midwest 35-500 3,765 5,001 6,388 2,273 2,898 149 430 70 197 122 285>500 233 51,332 62,586 25,193 30,630 8,344 29,538 4,187 14,542 26 135
Northern 35-500 925 4,746 6,199 2,120 2,754 243 500 114 228 41 83Plains >500 52 76,524 93,532 34,836 42,369 32,377 56,560 14,913 25,783 12 27
Northeast >35 277 6,889 8,521 2,660 3,281 496 2,023 190 789 27 85Southeast >35 371 4,804 6,319 2,123 2,760 391 960 171 420 25 48West 35-500 278 4,118 5,396 2,316 3,011 925 1,605 539 913 48 69
>500 93 285,282 373,779 157,790 206,096 248,619 357,764 137,243 197,160 57 78
Milk N. Central, 35-135 53,053 4,765 5,647 1,232 1,475 99 257 26 68 1,649 5,548cows Northeast 135-270 8,688 10,220 12,385 3,067 3,791 189 682 56 212 227 1,143
>270 2,616 22,919 24,817 7,872 10,473 1,310 3,825 442 1,606 111 748Southeast 35-135 4,349 4,706 5,743 1,213 1,520 181 510 50 149 275 797
>135 2,815 13,071 13,823 4,865 6,187 1,254 3,087 459 1,372 215 695West 35-135 2,349 4,356 5,766 1,278 1,647 538 1,118 159 323 406 808
135-270 1,825 7,608 7,865 2,879 3,983 1,154 2,359 437 1,194 356 896>270 3,623 41,119 38,783 16,388 21,102 15,845 26,891 6,290 14,627 1,432 2,901
Swine N. Central, 35-500 1,029 7,652 9,275 2,926 3,534 3,356 5,018 1,284 1,911 366 512farrow- Northeast >500 119 33,017 38,974 22,468 26,089 19,875 33,984 13,484 22,819 89 112ing Southeast 35-100 43 1,524 1,759 1,354 1,548 323 871 285 701 10 25farms >100 270 12,337 14,244 13,588 15,594 6,710 12,210 7,483 13,565 157 238
West 35-500 89 5,537 6,397 3,488 3,988 1,888 3,688 1,165 2,277 38 65>500 22 62,956 74,864 44,833 52,379 53,523 71,352 38,118 49,897 18 22
Swine N. Central, 35-500 9,350 11,088 13,589 3,893 4,758 2,338 4,679 816 1,633 1,906 3,515grower Northeast >500 442 116,627 140,394 48,280 57,528 71,727 113,199 29,807 46,389 222 395farms Southeast 35-100 282 2,415 2,807 2,306 2,649 703 1,305 643 1,194 90 151
>100 1,389 21,533 24,779 23,887 27,386 11,263 22,110 12,469 24,403 909 1,321West 35-500 113 9,671 11,512 5,227 6,159 4,001 6,601 2,181 3,547 55 74
>500 39 181,225 216,418 106,009 124,810 153,248 200,920 90,250 116,156 27 32

B–13
Costs Associated with Development and Implementation of Comprehensive Nutrient Management Plans
Part I—Nutrient Management, Land Treatment, Manure and Wastewater Handling and Storage, and Recordkeeping
Table B–5 Per-farm estimates of recoverable manure nutrients and farm-level excess manure nutrients by model farm regionand size class*—Continued
Dominant Model Model Number Recoverable manure Recoverable manure Farm-level excess Farm-level excess Number farms with livestock farm region farm size of farms - - - - - - N (lb) - - - - - - - - - - - - - - P (lb) - - - - - - - - - manure N (lb) - - - - manure P (lb) excess manure type class (AU) Baseline After- Baseline After- Baseline After- Baseline After- Baseline After-
scenario CNMP scenario CNMP scenario CNMP scenario CNMP scenario CNMPscenario scenario scenario scenario scenario
Swine N. Central, 35-500 16,837 9,407 11,496 3,383 4,120 1,004 2,314 361 829 1,746 4,273farrow- Northeast >500 1,069 82,659 99,179 38,036 45,030 47,264 74,608 21,797 33,937 493 915to-finish Southeast 35-100 583 1,811 2,089 1,740 1,989 196 492 195 469 79 203farms >100 869 22,377 25,675 26,278 30,056 11,128 21,091 13,222 24,846 338 629
West 35-500 351 6,220 7,373 3,489 4,090 2,226 3,458 1,268 1,941 140 201>500 59 229,640 274,190 142,521 167,440 192,669 252,019 119,620 154,447 37 45
Turkeys California >35 135 123,339 151,351 84,587 103,814 120,085 150,714 82,422 103,389 132 135East >35 1,408 57,922 70,529 36,119 44,023 43,147 66,704 26,969 41,648 1,209 1,399N. Central >35 852 98,486 119,823 56,205 68,461 74,545 112,749 42,758 64,531 588 834S. Central >35 740 65,522 80,246 45,168 55,320 49,203 74,270 33,972 51,216 637 729West >35 78 58,629 72,278 38,210 47,076 45,049 67,195 29,373 43,781 55 73except CA
N. Central >35 836 49,997 65,271 21,558 28,144 40,460 60,134 17,782 26,117 660 814& West
East & South >35 15,415 29,750 35,002 13,417 15,748 21,241 30,285 9,593 13,623 13,040 14,906
Layers N. Central, <400 953 26,938 30,164 12,667 14,176 16,215 25,603 7,647 12,046 652 886Northeast >400 289 338,433 378,483 169,917 190,036 273,916 366,518 137,673 184,056 241 289
S. Central <400 879 13,452 17,005 7,056 8,911 6,812 12,555 3,579 6,586 610 805>400 39 113,140 134,235 144,179 170,953 86,926 128,583 110,111 163,665 35 38
Southeast <400 1,607 11,242 12,879 5,709 8,653 7,010 10,978 3,560 7,374 1,258 1,553>400 80 151,633 169,156 108,288 132,927 128,965 164,945 92,449 129,658 79 80
West <400 103 34,335 43,452 17,212 21,753 32,381 42,789 16,185 21,405 102 103>400 102 220,397 278,434 137,302 173,194 209,415 277,142 130,463 172,392 102 102
Pullets N. Central & >35 369 25,338 28,067 12,948 14,273 15,059 23,854 7,701 12,130 233 340Northeast
South & West >35 905 12,263 14,350 7,445 8,633 7,430 11,581 4,501 6,956 611 825
Veal All All 168 4,995 6,284 2,478 3,107 3,734 5,561 1,854 2,752 135 147
Confined Midwest All 2,436 10,414 13,192 4,498 5,674 2,614 5,310 1,165 2,329 525 898heifers Northeast All 167 5,504 7,077 1,998 2,531 2,290 4,099 851 1,494 62 90
South & West All 1,240 10,817 13,311 5,362 6,581 5,963 9,364 3,001 4,668 486 672
Small All states All 42,565 1,229 1,443 437 513 313 466 125 186 8,777 11,571farmswithconfinedlivestocktypes
Pastured All states All 61,272 689 781 379 414 51 78 36 51 4,869 6,420livestocktypes
All manure- 255,070 9,934 11,799 4,513 5,499 4,678 7,230 2,406 3,769 47,562 71,999producingfarms
* Excludes 2,131 specialty livestock farms.

B–14
Costs Associated with Development and Implementation of Comprehensive Nutrient Management Plans
Part I—Nutrient Management, Land Treatment, Manure and Wastewater Handling and Storage, and Recordkeeping
Figure B–1 Recoverable manure nitrogen, baseline scenario
Hawaii
AlaskaMap ID: 7059
Each dot represents 100,000 pounds

B–15
Costs Associated with Development and Implementation of Comprehensive Nutrient Management Plans
Part I—Nutrient Management, Land Treatment, Manure and Wastewater Handling and Storage, and Recordkeeping
Figure B–2 Recoverable manure phosphorus, baseline scenario
Hawaii
AlaskaMap ID: 7059
Each dot represents 100,000 pounds

B–16
Costs Associated with Development and Implementation of Comprehensive Nutrient Management Plans
Part I—Nutrient Management, Land Treatment, Manure and Wastewater Handling and Storage, and Recordkeeping
Tons of recoverable manure forhandling and transport
The CNMP cost assessment requires estimates of thetons of manure to be collected, stored, and trans-ported to the field for application. Neither the wet asexcreted weight nor the oven-dry weight estimate isappropriate for these calculations because the mois-ture content does not represent the moisture contentof the manure that is actually handled. For solids, theweight would be something between the dry and wetweights. For manure handled as a liquid or slurry,additional water is added to the manure during collec-tion. Wastewater collected in runoff storage ponds islargely runoff from rainfall.
Tons of recoverable manure for handling and transportwere calculated by adjusting either the wet weightestimate or the dry weight estimate for moisturecontent. The literature contains a wide range of esti-mates of moisture content for manure handled as asolid, slurry, or liquid. Table B–6 presents the typicalmoisture content of manure by livestock type andmanure consistency used here, in part, as a basis fordeveloping the algorithms used to convert wet or dryweight to handling and transport weight. Algorithms
were devised for each model farm to reflect character-istics of the manure management systems specific toeach representative farm as well as for expectedrunoff that would be collected in runoff storage ponds.For most solids, handling and transport weight isabout equal to two times the dry weight, and includesthe weight of bedding. For systems producing manureas a slurry, handling and transport weight was typi-cally calculated as one or two times the wet weight,depending on how much wash water would be used.Liquid manure was generally assumed to be 1 percentsolids for most systems, accounting for the additionalwater used to flush the system and, in some cases,runoff from the lot. However, a higher percentage ofsolids was assumed for some systems that would beexpected to have less dilute liquid wastes.
Separate algorithms for estimating tons of manure athandling and transport weight were constructed forthe baseline scenario and for the after-CNMP scenario.The specific algorithms and assumptions used for eachsystem are presented in table B–7. These algorithmswere used to make estimates of tons of solid, slurry,and liquid manure generated on each farm. The esti-mates were higher for the after-CNMP scenario thanfor the baseline scenario for most liquid systems,reflecting more recoverable manure and additionalflush or wash water. For wastewater collected inrunoff storage ponds, an estimate was needed only forthe additional volume expected as a result of CNMPimplementation. This was estimated by multiplying thevolume expected to be collected in runoff storageponds times the CNMP needs percentage for runoffstorage ponds. CNMP needs for runoff storage pondswere taken from appendix D, table D–1.
Table B–6 Assumptions about moisture content inmanure used a basis for calculating tons ofmanure at handling and transport weight
Livestock type Manure Percentconsistency moisture
Dairy Solid 50Slurry 90Liquid 99
Beef Solid 50Slurry 90Liquid 99
Swine Solid 50Slurry 90Liquid 99
Broilers Solid 76
Layers and pullets Solid 50Liquid 99
Turkeys Solid 66
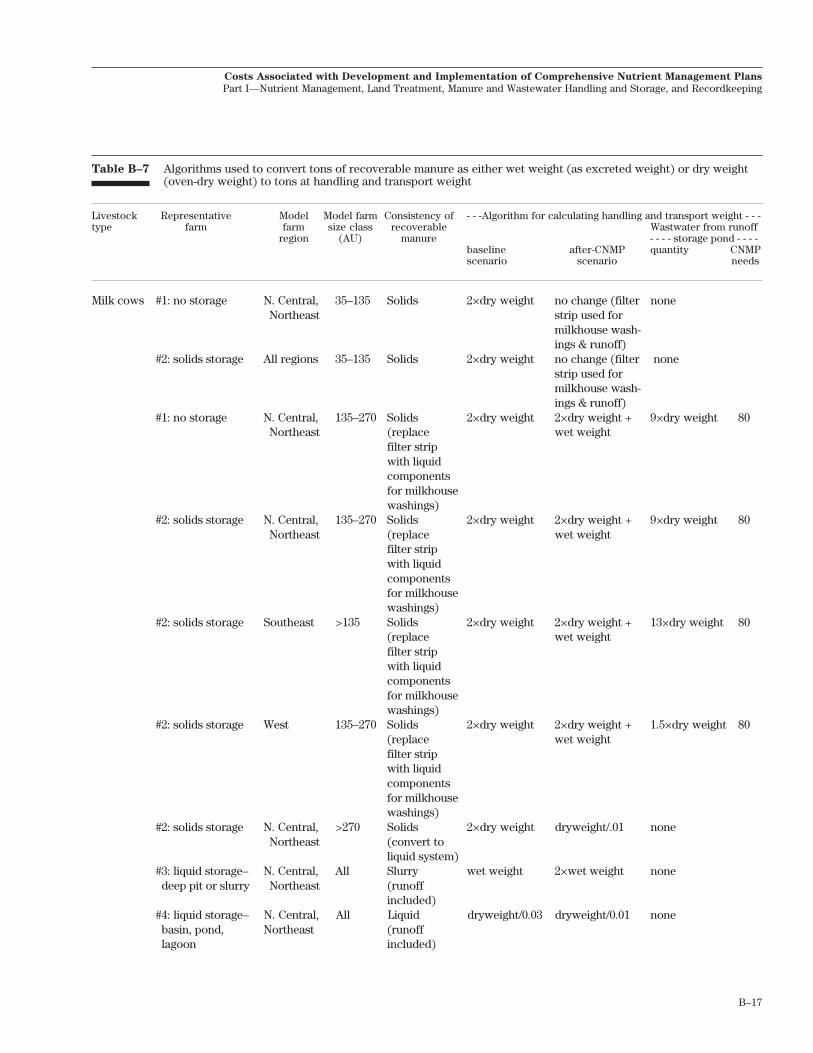
B–17
Costs Associated with Development and Implementation of Comprehensive Nutrient Management Plans
Part I—Nutrient Management, Land Treatment, Manure and Wastewater Handling and Storage, and Recordkeeping
Table B–7 Algorithms used to convert tons of recoverable manure as either wet weight (as excreted weight) or dry weight(oven-dry weight) to tons at handling and transport weight
Livestock Representative Model Model farm Consistency of - - -Algorithm for calculating handling and transport weight - - -type farm farm size class recoverable Wastwater from runoff
region (AU) manure - - - - storage pond - - - -baseline after-CNMP quantity CNMPscenario scenario needs
Milk cows #1: no storage N. Central, 35–135 Solids 2×dry weight no change (filter noneNortheast strip used for
milkhouse wash-ings & runoff)
#2: solids storage All regions 35–135 Solids 2×dry weight no change (filter nonestrip used formilkhouse wash-ings & runoff)
#1: no storage N. Central, 135–270 Solids 2×dry weight 2×dry weight + 9×dry weight 80Northeast (replace wet weight
filter stripwith liquidcomponentsfor milkhousewashings)
#2: solids storage N. Central, 135–270 Solids 2×dry weight 2×dry weight + 9×dry weight 80Northeast (replace wet weight
filter stripwith liquidcomponentsfor milkhousewashings)
#2: solids storage Southeast >135 Solids 2×dry weight 2×dry weight + 13×dry weight 80(replace wet weightfilter stripwith liquidcomponentsfor milkhousewashings)
#2: solids storage West 135–270 Solids 2×dry weight 2×dry weight + 1.5×dry weight 80(replace wet weightfilter stripwith liquidcomponentsfor milkhousewashings)
#2: solids storage N. Central, >270 Solids 2×dry weight dryweight/.01 noneNortheast (convert to
liquid system)#3: liquid storage– N. Central, All Slurry wet weight 2×wet weight nonedeep pit or slurry Northeast (runoff
included)#4: liquid storage– N. Central, All Liquid dryweight/0.03 dryweight/0.01 nonebasin, pond, Northeast (runofflagoon included)
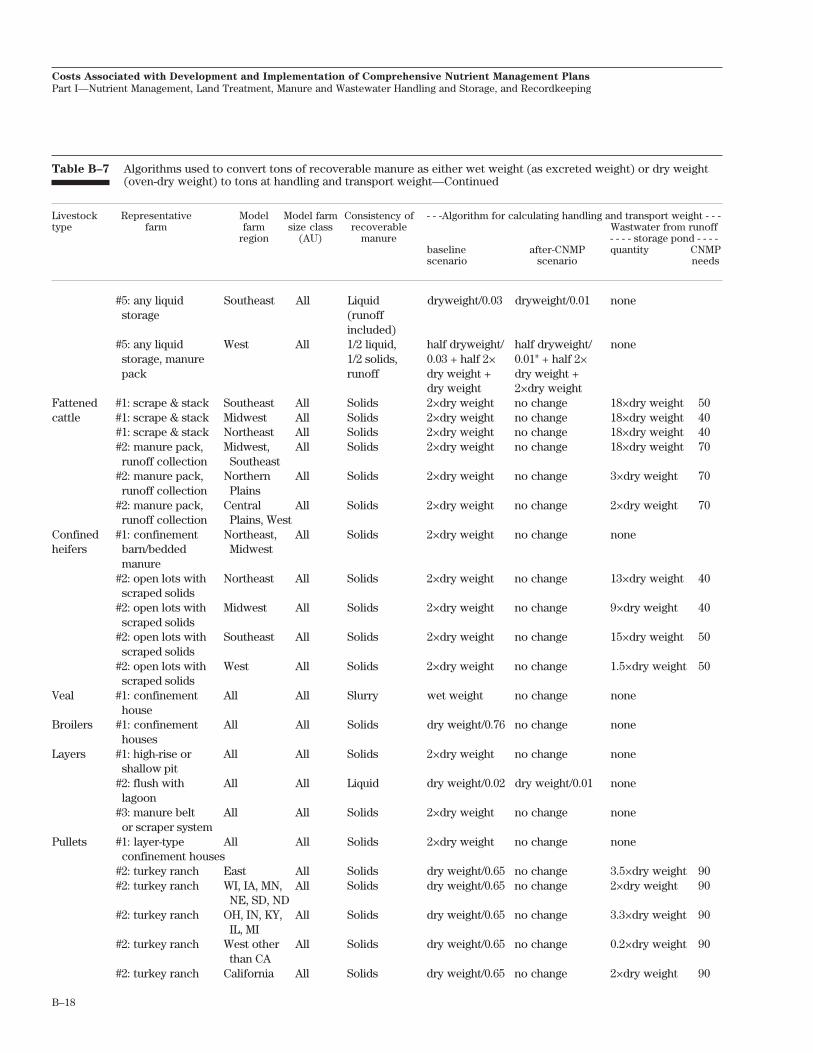
B–18
Costs Associated with Development and Implementation of Comprehensive Nutrient Management Plans
Part I—Nutrient Management, Land Treatment, Manure and Wastewater Handling and Storage, and Recordkeeping
Table B–7 Algorithms used to convert tons of recoverable manure as either wet weight (as excreted weight) or dry weight(oven-dry weight) to tons at handling and transport weight—Continued
Livestock Representative Model Model farm Consistency of - - -Algorithm for calculating handling and transport weight - - -type farm farm size class recoverable Wastwater from runoff
region (AU) manure - - - - storage pond - - - -baseline after-CNMP quantity CNMPscenario scenario needs
#5: any liquid Southeast All Liquid dryweight/0.03 dryweight/0.01 nonestorage (runoff
included)#5: any liquid West All 1/2 liquid, half dryweight/ half dryweight/ none
storage, manure 1/2 solids, 0.03 + half 2× 0.01" + half 2×pack runoff dry weight + dry weight +
dry weight 2×dry weightFattened #1: scrape & stack Southeast All Solids 2×dry weight no change 18×dry weight 50cattle #1: scrape & stack Midwest All Solids 2×dry weight no change 18×dry weight 40
#1: scrape & stack Northeast All Solids 2×dry weight no change 18×dry weight 40#2: manure pack, Midwest, All Solids 2×dry weight no change 18×dry weight 70
runoff collection Southeast#2: manure pack, Northern All Solids 2×dry weight no change 3×dry weight 70
runoff collection Plains#2: manure pack, Central All Solids 2×dry weight no change 2×dry weight 70
runoff collection Plains, WestConfined #1: confinement Northeast, All Solids 2×dry weight no change noneheifers barn/bedded Midwest
manure#2: open lots with Northeast All Solids 2×dry weight no change 13×dry weight 40
scraped solids#2: open lots with Midwest All Solids 2×dry weight no change 9×dry weight 40
scraped solids#2: open lots with Southeast All Solids 2×dry weight no change 15×dry weight 50
scraped solids#2: open lots with West All Solids 2×dry weight no change 1.5×dry weight 50
scraped solidsVeal #1: confinement All All Slurry wet weight no change none
houseBroilers #1: confinement All All Solids dry weight/0.76 no change none
housesLayers #1: high-rise or All All Solids 2×dry weight no change none
shallow pit#2: flush with All All Liquid dry weight/0.02 dry weight/0.01 none
lagoon#3: manure belt All All Solids 2×dry weight no change none
or scraper systemPullets #1: layer-type All All Solids 2×dry weight no change none
confinement houses#2: turkey ranch East All Solids dry weight/0.65 no change 3.5×dry weight 90#2: turkey ranch WI, IA, MN, All Solids dry weight/0.65 no change 2×dry weight 90
NE, SD, ND#2: turkey ranch OH, IN, KY, All Solids dry weight/0.65 no change 3.3×dry weight 90
IL, MI#2: turkey ranch West other All Solids dry weight/0.65 no change 0.2×dry weight 90
than CA#2: turkey ranch California All Solids dry weight/0.65 no change 2×dry weight 90
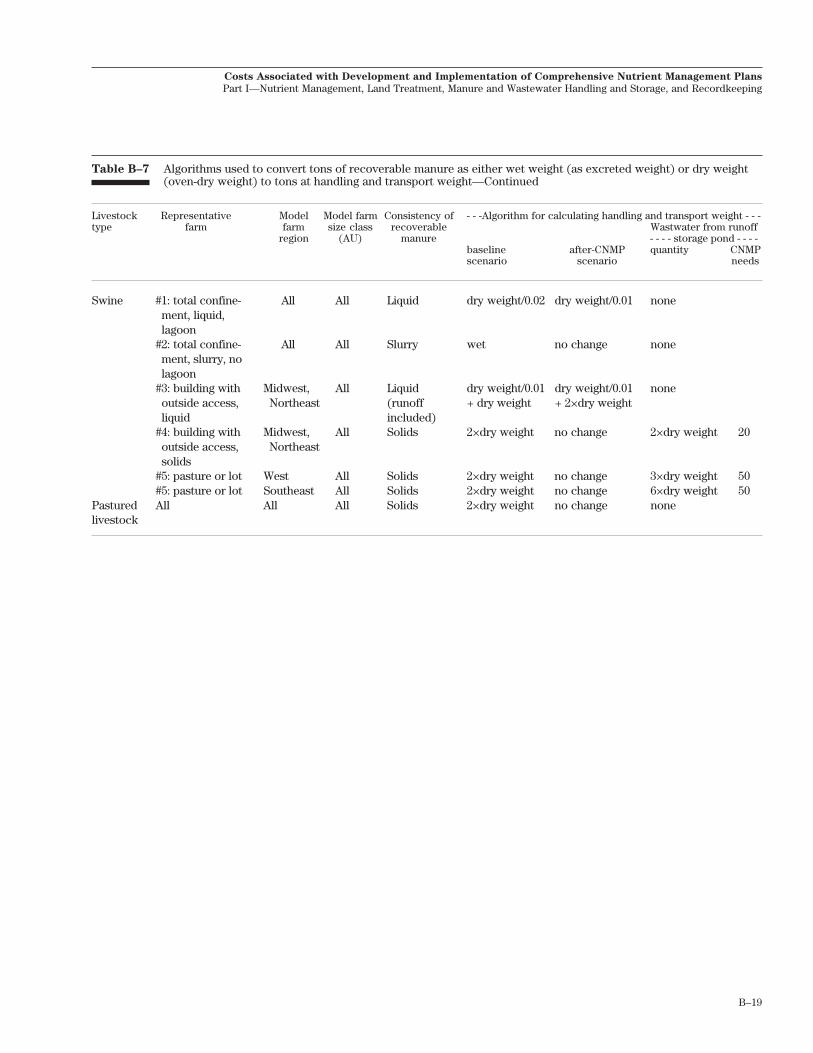
B–19
Costs Associated with Development and Implementation of Comprehensive Nutrient Management Plans
Part I—Nutrient Management, Land Treatment, Manure and Wastewater Handling and Storage, and Recordkeeping
Table B–7 Algorithms used to convert tons of recoverable manure as either wet weight (as excreted weight) or dry weight(oven-dry weight) to tons at handling and transport weight—Continued
Livestock Representative Model Model farm Consistency of - - -Algorithm for calculating handling and transport weight - - -type farm farm size class recoverable Wastwater from runoff
region (AU) manure - - - - storage pond - - - -baseline after-CNMP quantity CNMPscenario scenario needs
Swine #1: total confine- All All Liquid dry weight/0.02 dry weight/0.01 nonement, liquid,lagoon
#2: total confine- All All Slurry wet no change nonement, slurry, nolagoon
#3: building with Midwest, All Liquid dry weight/0.01 dry weight/0.01 noneoutside access, Northeast (runoff + dry weight + 2×dry weightliquid included)
#4: building with Midwest, All Solids 2×dry weight no change 2×dry weight 20outside access, Northeastsolids
#5: pasture or lot West All Solids 2×dry weight no change 3×dry weight 50#5: pasture or lot Southeast All Solids 2×dry weight no change 6×dry weight 50
Pastured All All All Solids 2×dry weight no change nonelivestock
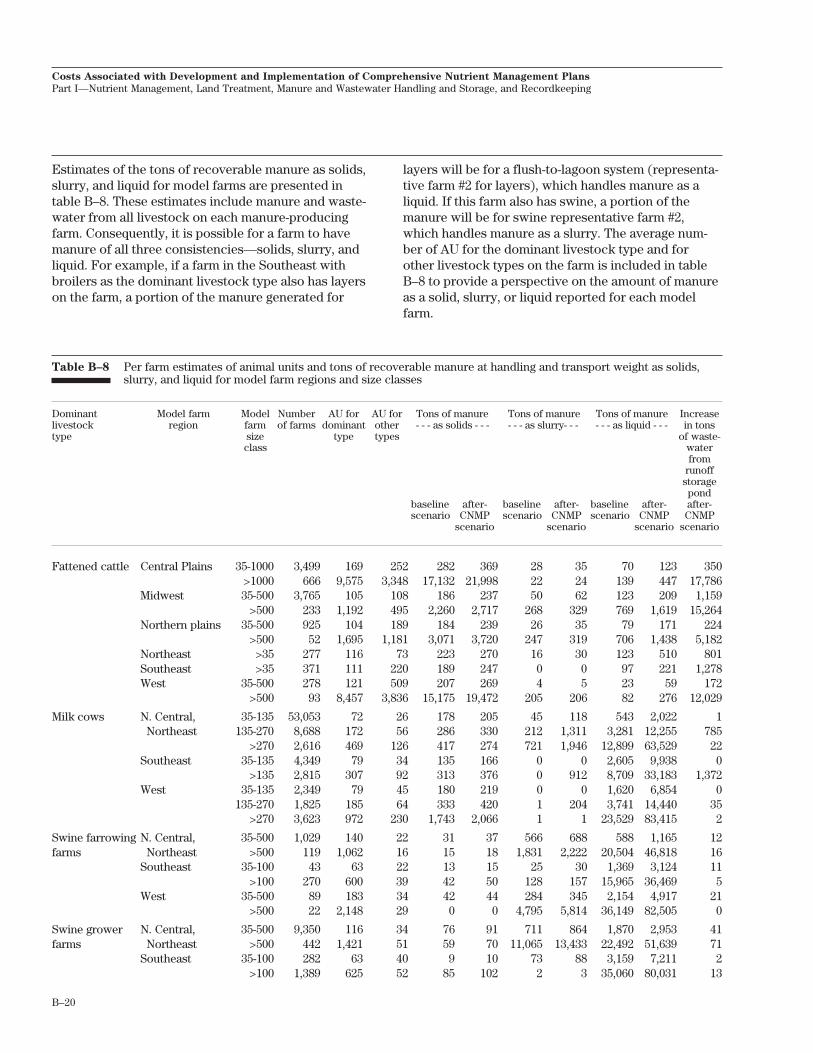
B–20
Costs Associated with Development and Implementation of Comprehensive Nutrient Management Plans
Part I—Nutrient Management, Land Treatment, Manure and Wastewater Handling and Storage, and Recordkeeping
Estimates of the tons of recoverable manure as solids,slurry, and liquid for model farms are presented intable B–8. These estimates include manure and waste-water from all livestock on each manure-producingfarm. Consequently, it is possible for a farm to havemanure of all three consistencies—solids, slurry, andliquid. For example, if a farm in the Southeast withbroilers as the dominant livestock type also has layerson the farm, a portion of the manure generated for
layers will be for a flush-to-lagoon system (representa-tive farm #2 for layers), which handles manure as aliquid. If this farm also has swine, a portion of themanure will be for swine representative farm #2,which handles manure as a slurry. The average num-ber of AU for the dominant livestock type and forother livestock types on the farm is included in tableB–8 to provide a perspective on the amount of manureas a solid, slurry, or liquid reported for each modelfarm.
Table B–8 Per farm estimates of animal units and tons of recoverable manure at handling and transport weight as solids,slurry, and liquid for model farm regions and size classes
Dominant Model farm Model Number AU for AU for Tons of manure Tons of manure Tons of manure Increaselivestock region farm of farms dominant other - - - as solids - - - - - - as slurry- - - - - - as liquid - - - in tonstype size type types of waste-
class waterfrom
runoffstoragepond
baseline after- baseline after- baseline after- after-scenario CNMP scenario CNMP scenario CNMP CNMP
scenario scenario scenario scenario
Fattened cattle Central Plains 35-1000 3,499 169 252 282 369 28 35 70 123 350>1000 666 9,575 3,348 17,132 21,998 22 24 139 447 17,786
Midwest 35-500 3,765 105 108 186 237 50 62 123 209 1,159>500 233 1,192 495 2,260 2,717 268 329 769 1,619 15,264
Northern plains 35-500 925 104 189 184 239 26 35 79 171 224>500 52 1,695 1,181 3,071 3,720 247 319 706 1,438 5,182
Northeast >35 277 116 73 223 270 16 30 123 510 801Southeast >35 371 111 220 189 247 0 0 97 221 1,278West 35-500 278 121 509 207 269 4 5 23 59 172
>500 93 8,457 3,836 15,175 19,472 205 206 82 276 12,029
Milk cows N. Central, 35-135 53,053 72 26 178 205 45 118 543 2,022 1Northeast 135-270 8,688 172 56 286 330 212 1,311 3,281 12,255 785
>270 2,616 469 126 417 274 721 1,946 12,899 63,529 22Southeast 35-135 4,349 79 34 135 166 0 0 2,605 9,938 0
>135 2,815 307 92 313 376 0 912 8,709 33,183 1,372West 35-135 2,349 79 45 180 219 0 0 1,620 6,854 0
135-270 1,825 185 64 333 420 1 204 3,741 14,440 35>270 3,623 972 230 1,743 2,066 1 1 23,529 83,415 2
Swine farrowing N. Central, 35-500 1,029 140 22 31 37 566 688 588 1,165 12farms Northeast >500 119 1,062 16 15 18 1,831 2,222 20,504 46,818 16
Southeast 35-100 43 63 22 13 15 25 30 1,369 3,124 11>100 270 600 39 42 50 128 157 15,965 36,469 5
West 35-500 89 183 34 42 44 284 345 2,154 4,917 21>500 22 2,148 29 0 0 4,795 5,814 36,149 82,505 0
Swine grower N. Central, 35-500 9,350 116 34 76 91 711 864 1,870 2,953 41farms Northeast >500 442 1,421 51 59 70 11,065 13,433 22,492 51,639 71
Southeast 35-100 282 63 40 9 10 73 88 3,159 7,211 2>100 1,389 625 52 85 102 2 3 35,060 80,031 13

B–21
Costs Associated with Development and Implementation of Comprehensive Nutrient Management Plans
Part I—Nutrient Management, Land Treatment, Manure and Wastewater Handling and Storage, and Recordkeeping
Table B–8 Per farm estimates of animal units and tons of recoverable manure at handling and transport weight as solids,slurry, and liquid for model farm regions and size classes—Continued
Dominant Model farm Model Number AU for AU for Tons of manure Tons of manure Tons of manure Increaselivestock region farm of farms dominant other - - - as solids - - - - - - as slurry- - - - - - as liquid - - - in tonstype size type types of waste-
class waterfrom
runoffstoragepond
baseline after- baseline after- baseline after- after-scenario CNMP scenario CNMP scenario CNMP CNMP
scenario scenario scenario scenario
West 35-500 113 145 82 23 27 816 992 4,036 9,342 2>500 39 3,216 194 115 142 16,938 20,569 85,540 196,429 8
Swine farrow- N. Central, 35-500 16,837 118 39 60 71 627 763 1,347 2,206 34to-finish farms Northeast >500 1,069 1,285 40 48 58 7,259 8,813 21,878 50,013 82
Southeast 35-100 583 59 50 9 10 48 58 2,227 5,091 6>100 869 912 65 39 46 98 123 37,866 86,517 18
West 35-500 351 120 100 23 26 485 591 2,628 6,129 7>500 59 4,971 262 151 182 20,241 24,559 115,223 264,084 3
Turkeys California >35 135 1,283 14 2,933 3,601 0 0 111 395 526East >35 1,408 505 45 1,233 1,502 2 12 834 2,091 201N. Central >35 852 778 43 1,934 2,351 124 159 346 762 243S. Central >35 740 601 69 1,535 1,880 5 9 47 152 6West except CA >35 78 740 45 1,400 1,726 0 0 0 0 76N. Central & West >35 836 257 29 962 1,255 5 9 30 93 1East & South >35 15,415 144 33 596 699 1 1 47 126 1
Layers N. Central, <400 953 135 24 677 757 16 23 54 122 10Northeast >400 289 1,776 131 8,932 9,982 131 195 605 1,986 61
S. Central <400 879 87 40 375 474 0 0 161 389 0>400 39 1,688 192 257 303 6 7 193,114 458,643 0
Southeast <400 1,607 86 23 215 272 0 0 4,227 10,041 0>400 80 1,284 153 3,024 3,818 1 96 71,825 171,853 143
West <400 103 209 11 926 1,171 0 0 0 0 0>400 102 1,609 104 7,227 9,128 8 10 70 218 0
Pullets N. Central, Northeast >35 369 179 33 583 653 18 33 96 283 13South & West >35 905 109 36 350 415 0 1 81 206 1
Veal All All 168 108 52 16 17 863 1,093 10 16 7
Confined Midwest All 2,436 217 73 503 638 101 112 129 210 883heifers Northeast All 167 107 17 211 277 96 96 8 12 220
South & West All 1,240 311 56 651 807 120 120 1 2 486
Small farms All states All 42,565 18 7 40 46 0 0 0 0 0with confined livestock types
Pastured All states All 61,272 107 10 33 35 0 0 0 0 0livestock types
All manure- 255,070 166 45 258 308 158 264 1,663 5,084 152producingfarms
B–22
Costs Associated with Development and Implementation of Comprehensive Nutrient Management Plans
Part I—Nutrient Management, Land Treatment, Manure and Wastewater Handling and Storage, and Recordkeeping
Land available for manureapplication
The land base defined to be potentially available formanure application consisted of cropland, croplandused as pasture, and half of permanent pasture, as inKellogg et al. (2000). For cropland, the acreage consid-ered is defined by the production of 24 crops includingcorn for silage, corn for grain, small grain hay, othertame hay, wild hay, grass silage, sorghum hay, sor-ghum for silage, sorghum for grain, alfalfa hay, winterwheat, barley, soybeans, durum wheat, other springwheat, oats, rye, Irish potatoes, sweet potatoes, cot-ton, sugar beets, rice, peanuts, and tobacco. (Thecensus does not identify the acreage of these cropsthat are double cropped. Where double croppingoccurs, it is assumed that each crop would be poten-tially available for manure application, which mayresult in more than one manure application per field inthe model simulation.) Cropland used as pasture is aspecific land use category in the Census of Agriculturedatabase. Permanent pasture is not reported in thecensus, but was derived from acres of rangeland andpastureland combined (a land use category in thecensus) and separate estimates of pastureland andrangeland acres by county as reported in the 1997National Resources Inventory (NRI). The NRI wasused to determine the percentage of pastureland andrangeland that is pastureland in each county. Thispercentage was then applied to the census acres forpastureland and rangeland combined for each farm toestimate the acres of permanent pastureland on eachfarm. In the East, most of the pastureland and range-land combined, as reported in the census, was classi-fied as permanent pastureland with this calculation,while few of the acres in the West were classified aspermanent pastureland. It was assumed that one-halfof the permanent pastureland would not be accessibleby manure spreading equipment because of location,terrain, or trees and other plant growth.
In the simulation model, the land available for manureapplication depends on whether the farm was a ma-nure-producing farm or a manure-receiving farm.Manure-receiving farms are defined to be farms thatare not manure-producing farms, have at least 10 acresof land potentially available for manure application,and are located in the same county as a manure-producing farm. All of the potentially available acreson manure-producing farms were assumed availablefor onfarm application. On manure-receiving farms,
however, only a portion of the potentially availableland was assumed available for off-farm manure appli-cation.
Acres with water erosion rates above the soil losstolerance level, or T, were assumed unavailable onmanure-receiving farms because of the potential foradditional costs for installation or adoption of erosioncontrol practices. The 1997 NRI was used to determinethe proportion of cropland and pastureland acres ineach county with sheet and rill erosion rates less thanT. Separate proportions were obtained for croplandand pastureland. This proportion was multiplied timesthe number of cropland acres (each of 24 crops) orpastureland acres (cropland used as pasture and halfof the permanent pasture) on manure-receiving farmsto determine the potential number of acres suitable formanure application. This calculation implicitly as-sumes that the acres with sheet and rill erosion lessthan T were equally distributed among the variouscrops and pastureland types.
Another assumption was that some manure-receivingfarms would be unwilling to accept manure because ofodor or other undesirable aspects, timing problemsrelated to climate or crop stage, soil phosphorus levelsat or near threshold limits, or other factors makingmanure more costly than application of commercialfertilizers. To account for this willingness-to-acceptfactor, it was assumed that 50 percent of the acrespotentially available with acceptable erosion rateswould actually be available for land application ofmanure on manure-receiving farms. The 50-percentconstraint was applied to the acreage for each of the24 crops as well as cropland used as pasture andpermanent pasture.
The analysis implicitly assumes that manure-producingfarms would not accept manure from other manure-producing farms. That is, manure-producing farms andmanure-receiving farms are mutually exclusive sets.This is a simplifying assumption that facilitates theconstruction of the simulation model. In actuality,some manure-producing farms would have additionalacres available for manure application by other ma-nure-producing farms, especially those livestockoperations that primarily produce crops. In the modelsimulation, about 80 percent of the total acres avail-able for land application on manure-producing farms isnot needed for manure application even after CNMPsare fully implemented. However, the bulk of these
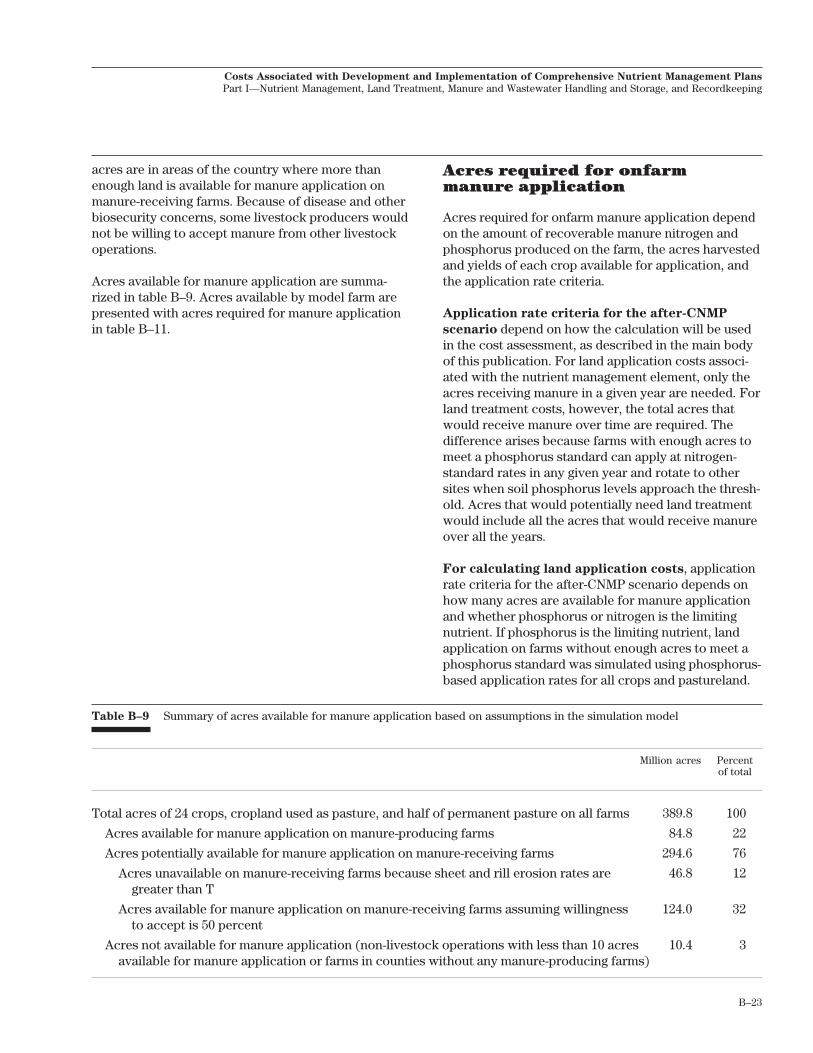
B–23
Costs Associated with Development and Implementation of Comprehensive Nutrient Management Plans
Part I—Nutrient Management, Land Treatment, Manure and Wastewater Handling and Storage, and Recordkeeping
acres are in areas of the country where more thanenough land is available for manure application onmanure-receiving farms. Because of disease and otherbiosecurity concerns, some livestock producers wouldnot be willing to accept manure from other livestockoperations.
Acres available for manure application are summa-rized in table B–9. Acres available by model farm arepresented with acres required for manure applicationin table B–11.
Acres required for onfarmmanure application
Acres required for onfarm manure application dependon the amount of recoverable manure nitrogen andphosphorus produced on the farm, the acres harvestedand yields of each crop available for application, andthe application rate criteria.
Application rate criteria for the after-CNMP
scenario depend on how the calculation will be usedin the cost assessment, as described in the main bodyof this publication. For land application costs associ-ated with the nutrient management element, only theacres receiving manure in a given year are needed. Forland treatment costs, however, the total acres thatwould receive manure over time are required. Thedifference arises because farms with enough acres tomeet a phosphorus standard can apply at nitrogen-standard rates in any given year and rotate to othersites when soil phosphorus levels approach the thresh-old. Acres that would potentially need land treatmentwould include all the acres that would receive manureover all the years.
For calculating land application costs, applicationrate criteria for the after-CNMP scenario depends onhow many acres are available for manure applicationand whether phosphorus or nitrogen is the limitingnutrient. If phosphorus is the limiting nutrient, landapplication on farms without enough acres to meet aphosphorus standard was simulated using phosphorus-based application rates for all crops and pastureland.
Table B–9 Summary of acres available for manure application based on assumptions in the simulation model
Million acres Percentof total
Total acres of 24 crops, cropland used as pasture, and half of permanent pasture on all farms 389.8 100
Acres available for manure application on manure-producing farms 84.8 22
Acres potentially available for manure application on manure-receiving farms 294.6 76
Acres unavailable on manure-receiving farms because sheet and rill erosion rates are 46.8 12greater than T
Acres available for manure application on manure-receiving farms assuming willingness 124.0 32to accept is 50 percent
Acres not available for manure application (non-livestock operations with less than 10 acres 10.4 3available for manure application or farms in counties without any manure-producing farms)
B–24
Costs Associated with Development and Implementation of Comprehensive Nutrient Management Plans
Part I—Nutrient Management, Land Treatment, Manure and Wastewater Handling and Storage, and Recordkeeping
For manure-producing farms that had enough acres tomeet a phosphorus standard, land application wassimulated using nitrogen-based application rates for allcrops and pastureland. For a few manure-producingfarms, nitrogen was the limiting nutrient, so landapplication was simulated using a nitrogen standard.For calculating land treatment costs, applicationrate criteria for the after-CNMP scenario were simu-lated using phosphorus-based application rates for allfarms where phosphorus was the limiting nutrient andnitrogen-based application rates for all farms wherenitrogen was the limiting nutrient.
Nitrogen-based application rates and phosphorus-based application rates that constitute application ratecriteria for nutrient management plans are defined byLand Grant Universities and called recommended
rates. Recommended rates are crop specific and varyfrom state to state and sometimes within a state.Recommended rates are set at a level that will providethe plant nutrients to achieve a desired yield, afteraccounting for nutrient losses from the crop systemfrom volatilization, denitrification, erosion, leaching,and runoff. Since these recommended rates are notreadily available in database form, recommended ratesfor use in the simulation model were approximated asa function of the amount of nutrients taken up by thecrop and removed at harvest.
The phosphorus standard used in the after-CNMPscenario was approximated as the amount of phospho-rus taken up and removed by the crop at harvest.Phosphorus uptake parameters are presented in tableB–10 for each of the 24 crops. The amount of phospho-rus taken up and removed at harvest per acre dependson the yield. The higher the yield, the more phospho-rus removed at harvest. Thus, manure applicationrates per acre based on a phosphorus standard, assimulated in the model, are higher for farms withhigher yields than for farms with lower yields. Limitingthe phosphorus application to the amount taken upand removed at harvest guarantees that phosphoruslevels will not continue to build up in the soil.
The nitrogen standard used in the after-CNMPscenario was approximated similar to that for thephosphorus standard, but included an additionalnitrogen recovery factor to adjust for losses duringand after application. Nitrogen uptake parameters forthe 24 crops are presented in table B–10. Recom-mended rates were approximated by multiplying the
amount of nitrogen taken up by the crop and removedat harvest by 1.43, which reflects a nitrogen recoveryfactor of 70 percent (1.43=1÷0.70). That is, recom-mended rates were simulated assuming that 70 per-cent of the manure nitrogen applied is available forcrop growth. The nitrogen recovery factor is largelydetermined by volatilization losses during and afterapplication, but also includes losses that are due todenitrification, erosion, leaching, and runoff. Nutrientmanagement plans include provisions for keepingthese losses at a minimum by addressing the methodand timing of application, winter cover crops, and croprotations, and by stipulating erosion control practiceson acres with sheet and rill erosion rates greater thanT.
Recommended rates of application for pasturelandcould not be established based on crop uptake andremoval since a crop is not harvested. For pastureland,nitrogen and phosphorus rates of application were setat levels expected to provide the nutrients necessaryfor good levels of grass production assuming thepastureland is being grazed and accounting for theadditional manure nutrients contributed by manureproduced by the grazing animals. For model simula-tion, the nitrogen standard was defined to be 75pounds of nitrogen per acre for cropland used aspasture and 30 pounds per acre for permanentpastureland. The lower rate for permanent pasturelandreflects the generally lower productivity associatedwith permanent pastureland as compared to croplandused as pastureland. (The nitrogen recovery factorwas not applied to pastureland.) The phosphorus ratewas set at approximately equivalent levels after adjust-ing for the ratio of phosphorus to nitrogen in beefcattle manure. The phosphorus standard was definedto be 28 pounds of phosphorus per acre for croplandused as pasture and 11 pounds per acre for permanentpastureland.
A portion of manure nitrogen and phosphorus is boundup in organic compounds, which may not be availablefor the crop during the same year that manure isapplied. In this simulation, no adjustment was made toaccount for the rate of mineralization of organic nutri-ents in the manure applied. The assumption is that theamount of manure nutrients not available to the cropduring the year of application would be offset bynutrients available from manure applications in previ-ous years.

B–25
Costs Associated with Development and Implementation of Comprehensive Nutrient Management Plans
Part I—Nutrient Management, Land Treatment, Manure and Wastewater Handling and Storage, and Recordkeeping
For a few manure-producing farms (1,379 farms), moreacres were required to meet a nitrogen standard thanwere required to meet a phosphorus standard, indicat-ing that nitrogen was the limiting nutrient. For thesefarms, 97 percent of the acres with manure appliedwere for four crops—other tame hay, wild hay, crop-land used as pasture, and permanent pasture. For thetwo pasture types, the difference in application ratesfor nitrogen and phosphorus generally reflected theproportion of nitrogen to phosphorus in manure. Forother tame hay and wild hay, the uptake of phosphorusapproached the uptake for nitrogen (table B–10) moreclosely than other crops. When the ratio of recover-able nitrogen to recoverable phosphorus in the manureis relatively high, as would be the case for systems
with higher nitrogen recovery parameters, more acresmay be required to meet a nitrogen standard than arerequired to meet a phosphorus standard on thesecrops and pastureland.
Application rate criteria for the baseline scenario
are applications at rates above the nitrogen standardfor some crops and pastureland and applications atrates similar to the nitrogen-standard rates for othercrops, emulating pre-CNMP land application practices.For the baseline scenario, the model simulated manureapplication rates on manure-producing farms at thenitrogen standard with a 50 percent nitrogen recoveryfactor for 15 of the 24 crops (alfalfa hay, winter wheat,barley, soybeans, durum wheat, other spring wheat,
Table B–10 Nutrient uptake and removal at harvest for 24 crops
Crop Yield unit Nutrient uptake per yield Acres receiving manure on manure-- - - - - - - unit (lb) - - - - - - - - - - - - - - - - producing farms - - - - - - - - -nitrogen phosphorus avg yield avg lb N avg lb P
uptake uptakeper acre per acre
Sorghum for silage Tons/acre 14.76 2.440 13.4 198 33Alfalfa hay Tons/acre 50.40 4.720 3.3 166 16Potatoes 100 pound bags/acre 0.36 0.060 322.1 116 19Soybeans Bushels/acre 3.55 0.360 32.4 115 12Corn for silage Tons/acre 7.09 1.050 14.3 101 15Corn for grain Bushels/acre 0.80 0.150 117.4 94 18Sugar beets for sugar Tons/acre 4.76 0.940 19.2 91 18Rice 100-lb bags/acre 1.25 0.290 70.4 88 20Peanuts for nuts (with pods) Pounds/acre 0.04 0.003 2,198.3 88 7Grass silage Tons/acre 13.60 1.600 5.9 80 9Tobacco Pounds/acre 0.03 0.002 2,149.0 64 4Sorghum for grain Bushels/acre 0.98 0.180 65.4 64 12Barley Bushels/acre 0.90 0.180 60.1 54 11Small grain hay Tons/acre 25.60 4.480 1.9 49 9Other spring wheat Bushels/acre 1.39 0.230 31.4 44 7Other tame hay Tons/acre 19.80 15.300 2.1 42 32Winter wheat Bushels/acre 1.02 0.200 39.5 40 8Durum wheat Bushels/acre 1.29 0.220 27.6 36 6Oats Bushels/acre 0.59 0.110 54.5 32 6Wild hay Tons/acre 19.80 15.300 1.5 30 23Sweet potatoes Bushels/acre 0.13 0.020 217.2 28 4Rye for grain Bushels/acre 1.07 0.180 24.4 26 4Cotton (lint and seed) 500-lb bales/acre 15.19 1.890 1.3 20 2Sorghum hay Tons/acre 2.39 1.010 2.7 6 3
Note: Taken from Kellogg et al. (2000), table 9.
B–26
Costs Associated with Development and Implementation of Comprehensive Nutrient Management Plans
Part I—Nutrient Management, Land Treatment, Manure and Wastewater Handling and Storage, and Recordkeeping
oats, rye, Irish potatoes, sweet potatoes, cotton, sugarbeets, rice, peanuts, and tobacco). Application ratesabove the nitrogen standard on these crops couldresult in impairment of crop quality. The nitrogenrecovery factor was set at 50 percent instead of the 70percent used in the after-CNMP scenario under theassumption that, prior to a CNMP, appropriate erosioncontrols would generally not be in place, nor wouldapplication timing, application method, crop rotations,or cover crops be tailored to minimize manure nutrientlosses on fields receiving manure. At 50 percent, thenitrogen recovery factor is thus equal to the amount ofnitrogen taken up and removed at harvest.
Higher application rates were simulated for permanentpasture, cropland used as pasture, and the remainingnine feed and forage crops (corn for silage, corn forgrain, small grain hay, other tame hay, wild hay, grasssilage, sorghum hay, sorghum for silage, sorghum forgrain). Application rates for this latter group of cropswere set at one and a half times the amount of nitro-gen taken up and removed at harvest for farms thathad enough land for onfarm application, plus the 50percent nitrogen recovery factor. For pastureland,nitrogen-standard application rates were increased 50percent. For farms that did not have sufficient land atthese application rates, application rates were furtherincreased to two times the amount of nitrogen takenup and removed at harvest for these nine crops, plusthe 50 percent nitrogen recovery factor. Nitrogenstandard application rates for pastureland weredoubled. The upper limit for application rates underthis application scheme—three times the amount ofnitrogen taken up and removed at harvest—was estab-lished to be below rates that would result in poor cropquality or the possibility of yield reductions because ofnitrogen intolerance.
Before estimating the assimilative capacity of eachcrop, the farm-level yields were adjusted to eliminatevery high and very low yields. Some of the very lowyields reported in the Census of Agriculture were theresult of local droughts or other detrimental weatherconditions and are not representative of the assimila-tive capacity of the land under normal conditions.Similarly, some of the very high yields might also notbe sustainable and would lead to an overestimation ofthe assimilative capacity of the land. The 10th percen-tile yield and the 95th percentile yield for each cropwas determined for each Land Resource Region. (Amap of Land Resource Regions is presented in figure
16 in the main body of this publication.) Each LandResource Region is characterized by a particularpattern of soils, climate, water resources, and landuse, so would generally be expected to have a sustain-able yield potential different from other Land Re-source Regions. Farm-level yields below the 10thpercentile yield for the region were adjusted upwardto equal the 10th percentile yield. Farm-level yieldsabove the 95th percentile yield for the region wereadjusted downward to equal the 95th percentile yield.All yields were adjusted in this way, including cropyields on manure-receiving farms.
The model allocates manure to each crop separately.To estimate the acres required to meet CNMP applica-tion criteria on each farm, it is necessary to first estab-lish the order in which crops are selected for applica-tion on the farm. For a manure-producing farm, themodel allocates manure to crops according to a set ofpriorities established by NRCS agronomists. Thesepriorities generally represent current practices onlivestock operations. The highest to lowest prioritiesestablished for manure application by crop type arecorn for silage, corn for grain, small grain hay, othertame hay, wild hay, grass silage, sorghum hay, crop-land used as pasture, permanent pasture, sorghum forsilage, sorghum for grain, alfalfa hay, winter wheat,barley, soybeans, durum wheat, other spring wheat,oats, rye, Irish potatoes, sweet potatoes, cotton, sugarbeets, rice, peanuts, and tobacco. The model allocatesmanure to the highest priority crop present on thefarm and applies manure to that crop according to theappropriate application rate criteria. If the acres of thefirst priority crop are insufficient to assimilate all ofthe manure produced on the farm, the model allocatesmanure to the next priority crop. This allocation pro-cess is repeated for each of the 24 crops and pasture-land on the farm or until all of the manure has beenallocated. Sensitivity analysis showed that reasonablechanges in the priority order of crops had a trivialeffect on estimates of total acres with manure applied.
Farms that do not have enough acres available to meetland application criteria have farm-level excess
manure. Farm-level excess manure must either beexported off the farm for land application on surround-ing properties or used in some manner other than landapplication. A portion of the farms in both land appli-cation scenarios will have excess manure and thusexcess manure nutrients. Excess manure phosphorusand excess manure nitrogen were calculated jointly as

B–27
Costs Associated with Development and Implementation of Comprehensive Nutrient Management Plans
Part I—Nutrient Management, Land Treatment, Manure and Wastewater Handling and Storage, and Recordkeeping
a function of excess manure. For example, when aphosphorus standard is being simulated, manure isapplied to each crop at a rate that does not exceed theuptake and removal of phosphorus by the crop, andmanure nitrogen is applied proportionately (i.e., at arate proportional to the ratio of phosphorus to nitro-gen in the recoverable manure). Similarly, when anitrogen standard is simulated, the manure phospho-rus rate is determined by the acres applied to meet thenitrogen standard. Thus, farm-level excess manurecontains both nitrogen and phosphorus in a proportiondetermined by the mix of livestock on the farm and themanure handling and storage systems assigned to thefarm. (Farm-level excess manure nutrients were notcalculated this way in Kellogg et al. (2000). In thatpublication farm-level excess manure nutrients werecalculated separately for nitrogen and phosphorus,simulating a nitrogen standard for nitrogen and aphosphorus standard for phosphorus. Whereas inKellogg et al. (2000) a farm may have excess phospho-rus, but no excess nitrogen, in this study every farmwith excess manure has both excess phosphorus andexcess nitrogen.)
To prevent the count of farms with excess manurefrom being artificially inflated by farms with small
amounts of excess manure, a farm was classified ashaving excess manure if the amount of excess manurenitrogen produced annually exceeded 100 pounds.(The model is a precise calculator; however, it isquestionable that farms with very small amounts ofexcess manure as calculated by the model wouldactually have any excess manure. It is even morequestionable that these farms would actually exportthat small amount to surrounding properties. Thecutoff used for identifying farms with excess manureis half the amount used to identify a CNMP farm, andso is small enough to be considered a trivial amount.)
The number of onfarm acres required to meet CNMPapplication criteria is the difference between baselineacres with manure applied and the after-CNMP sce-nario acres with manure applied. Estimates of addi-tional acres required for estimating onfarm land appli-cation costs and additional acres required for estimat-ing onfarm land treatment costs are both shown intable B–11. Farm-level excess manure nutrients andthe number of farms with excess manure are shown intable B–5 along with estimates of recoverable manurenutrients. (Additional summary tables are provided inthe main body of this publication.)
Table B–11 Per-farm estimates of total acres on farms, acres available for application of manure, acres with manureapplied, and acres required to meet CNMP application criteria on manure-producing farms*
Dominant livestock Model farm region Model Number Total Acres Acres Acres Additional Total Additionaltype farm size of farms acres on available with with acres acres that acres
class farm for land manure manure required would requiredapplication applied, applied for esti- receive for esti-
baseline in a given mating manure matingscenario year, after- land over time, land
CNMP application after- treatmentscenario costs CNMP costs
scenario
Fattened cattle Central Plains 35-1000 3,499 2,895 1,016 33 85 52 197 164>1000 666 4,719 1,076 311 650 339 781 469
Midwest 35-500 3,765 871 761 20 48 28 144 124>500 233 1,459 1,205 164 506 342 830 666
Northern Plains 35-500 925 2,550 917 24 58 34 153 129>500 52 4,737 1,570 184 585 400 944 760
Northeast >35 277 497 415 28 79 51 150 122Southeast >35 371 1,202 858 35 74 40 128 93West 35-500 278 4,151 770 26 52 26 104 78
>500 93 5,304 871 148 281 133 380 232

B–28
Costs Associated with Development and Implementation of Comprehensive Nutrient Management Plans
Part I—Nutrient Management, Land Treatment, Manure and Wastewater Handling and Storage, and Recordkeeping
Table B–11 Per-farm estimates of total acres on farms, acres available for application of manure, acres with manureapplied, and acres required to meet CNMP application criteria on manure-producing farms*—Continued
Dominant livestock Model farm region Model Number Total Acres Acres Acres Additional Total Additionaltype farm size of farms acres on available with with acres acres that acres
class farm for land manure manure required would requiredapplication applied, applied for esti- receive for esti-
baseline in a given mating manure matingscenario year, after- land over time, land
CNMP application after- treatmentscenario costs CNMP costs
scenario
Milk cows N.Central, Northeast 35-135 53,053 340 264 25 53 28 90 65135-270 8,688 644 536 46 107 61 222 176
>270 2,616 1,117 936 85 250 165 531 446Southeast 35-135 4,349 300 216 33 66 32 74 41
>135 2,815 679 498 73 145 71 247 174West 35-135 2,349 475 217 33 62 30 66 34
135-270 1,825 470 274 43 85 42 125 81>270 3,623 568 361 90 204 113 267 177
Swine farrowing N. Central, Northeast 35-500 1,029 363 289 21 47 25 88 67farms >500 119 270 213 63 128 65 163 100
Southeast 35-100 43 200 130 10 25 15 52 42>100 270 227 113 41 67 26 80 39
West 35-500 89 529 134 40 61 21 72 32>500 22 1,142 146 122 146 24 146 24
Swine grower N. Central, Northeast 35-500 9,350 575 501 37 90 53 169 132farms >500 442 810 678 203 472 269 578 374
Southeast 35-100 282 425 343 14 44 30 105 91>100 1,389 356 254 73 173 99 204 131
West 35-500 113 1,528 608 65 129 64 192 127>500 39 2,941 1,357 204 284 80 735 531
Swine farrow- N. Central, Northeast 35-500 16,837 631 528 36 89 52 179 143to-finish farms >500 1,069 863 746 145 462 317 603 458
Southeast 35-100 583 565 438 12 38 26 113 101>100 869 793 589 78 208 130 329 252
West 35-500 351 2,664 562 36 81 45 162 126>500 59 5,311 1,942 325 518 194 899 574
Turkeys California >35 135 172 17 17 17 0 17 0East >35 1,408 220 143 95 137 41 141 46N. Central >35 852 348 247 107 233 127 241 134S. Central >35 740 300 166 139 157 18 162 23West except CA >35 78 396 186 76 113 37 130 53N. Central, West >35 836 173 104 61 87 26 91 30East, South >35 15,415 170 103 65 88 23 92 27
Layers N. Central, Northeast <400 953 199 141 55 102 47 117 63>400 289 436 333 244 333 89 333 89
S. Central <400 879 174 97 61 81 20 83 22>400 39 898 360 234 264 30 340 106
Southeast <400 1,607 125 66 35 51 15 55 19>400 80 386 157 149 157 8 157 8
West <400 103 60 13 13 13 0 13 0>400 102 178 40 40 40 0 40 0
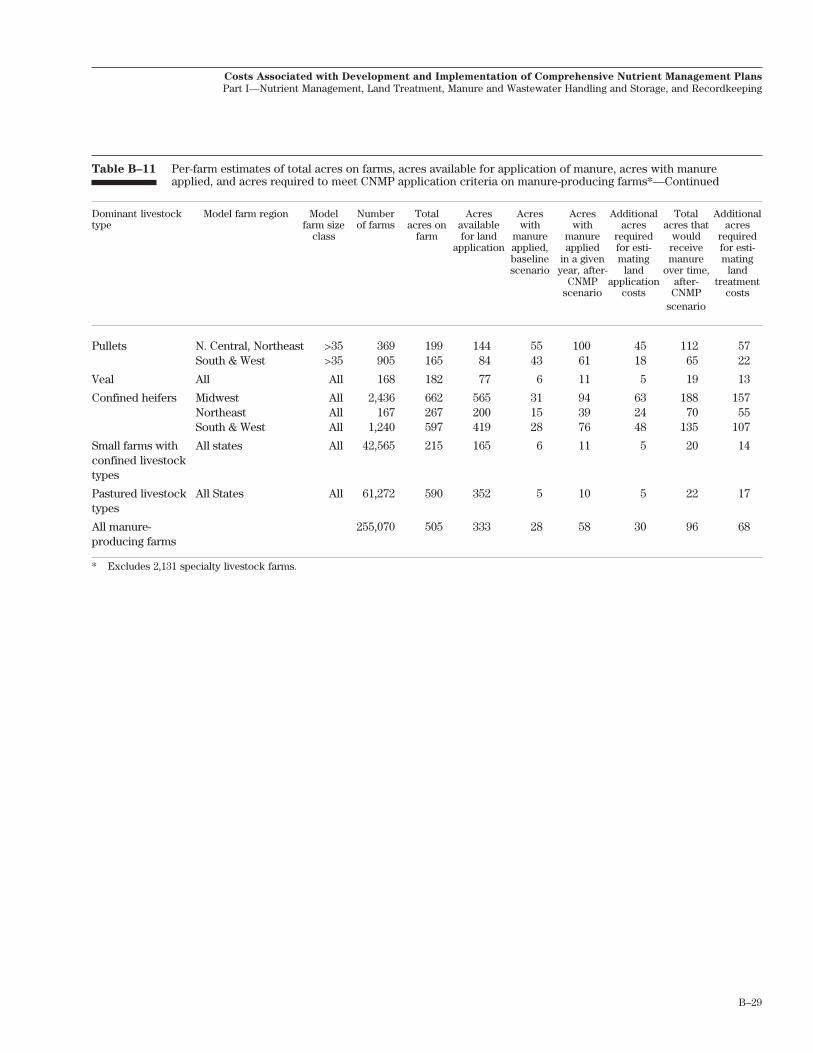
B–29
Costs Associated with Development and Implementation of Comprehensive Nutrient Management Plans
Part I—Nutrient Management, Land Treatment, Manure and Wastewater Handling and Storage, and Recordkeeping
Table B–11 Per-farm estimates of total acres on farms, acres available for application of manure, acres with manureapplied, and acres required to meet CNMP application criteria on manure-producing farms*—Continued
Dominant livestock Model farm region Model Number Total Acres Acres Acres Additional Total Additionaltype farm size of farms acres on available with with acres acres that acres
class farm for land manure manure required would requiredapplication applied, applied for esti- receive for esti-
baseline in a given mating manure matingscenario year, after- land over time, land
CNMP application after- treatmentscenario costs CNMP costs
scenario
Pullets N. Central, Northeast >35 369 199 144 55 100 45 112 57South & West >35 905 165 84 43 61 18 65 22
Veal All All 168 182 77 6 11 5 19 13
Confined heifers Midwest All 2,436 662 565 31 94 63 188 157Northeast All 167 267 200 15 39 24 70 55South & West All 1,240 597 419 28 76 48 135 107
Small farms with All states All 42,565 215 165 6 11 5 20 14confined livestocktypes
Pastured livestock All States All 61,272 590 352 5 10 5 22 17types
All manure- 255,070 505 333 28 58 30 96 68producing farms
* Excludes 2,131 specialty livestock farms.

B–30
Costs Associated with Development and Implementation of Comprehensive Nutrient Management Plans
Part I—Nutrient Management, Land Treatment, Manure and Wastewater Handling and Storage, and Recordkeeping
Acres required for off-farmmanure application
Farm-level excess manure is transported off the farmfor land application on manure-receiving farms locatedin the same county as the manure-producing farms ifsufficient land is available, or is transported off thefarm for alternative uses in counties where land is notavailable. Acres with manure applied on manure-receiving farms were calculated on a county basis.That is, all available acres on manure-receiving farmsin the county were combined for making the calcula-tion, thereby treating the county as if it was one largefarm. Consequently, the acres required for manureapplication on manure-receiving farms depends on theamount of farm-level excess manure produced in eachcounty, the acres of each crop available on manure-receiving farms in each county, and the applicationrate criteria.
Application rate criteria for manure-receiving farmswere modeled the same as for manure-producingfarms in the after-CNMP scenario with enough land tomeet nutrient management criteria—application atnitrogen standard rates. The nitrogen recovery factorwas set at 70 percent for both land application sce-narios. Manure-receiving farms were treated the samein the simulation model as manure-producing farmsafter CNMP implementation for several reasons. First,it was assumed that manure-receiving farms would beunwilling to accept manure if they had to apply atphosphorus-standard rates because commercial fertil-izers may offer a less costly option for providing theneeded nutrients for crop production. Second, aspresented earlier, it was assumed that manure-receiv-ing farms would not be willing to accept manure onland with water erosion rates such that implementa-tion of conservation practices might be required.Third, because manure-receiving farms are in thebusiness of producing crops for profit and are not alsoconcerned about manure disposal, it is assumed thatmanure-receiving farms would generally value thenutrient content of manure more than manure-produc-ing farms and would take measures necessary to getthe most benefit from the manure nutrients. Use ofconservation tillage and crop residue management,especially no-till, is expected to be more prevalent oncrop-producing farms. And last, if manure was appliedoff-farm using more relaxed practices than are usedfor onfarm application, CNMP implementation to some
extent would simply move the potential pollutionproblem off the farm to surrounding properties. Insimulating CNMP implementation, it is thereforeassumed that other programs and policies, includingState regulations, will be implemented to assure thatland application of manure adheres to the same crite-ria regardless of where the manure is applied.
The crop priority used to similate manure applicationis different for manure-receiving farms than for ma-nure-producing farms. Grain crops and other high-value crops have a higher priority than forage cropsand pastureland. The highest to lowest priorities formanure application on manure-receiving farms arecorn for grain, sorghum for grain, soybeans, winterwheat, barley, durum wheat, other spring wheat, oats,rye, Irish potatoes, sweet potatoes, cotton, corn forsilage, small grain hay, other tame hay, wild hay, grasssilage, sorghum hay, cropland used as pasture, perma-nent pasture, sorghum for silage, alfalfa hay, sugarbeets, rice, peanuts, and tobacco.
In most counties sufficient acreage exists for off-farmland application of manure in accordance with NRCSnutrient management criteria. However, in some areasof the country, the production of manure nutrientsexceeds the capacity of the land to assimilate nutri-ents (under the assumptions of the model simulation)resulting in excess manure. This excess manure iscategorized as county-level excess manure.
Acres with manure applied and estimates of county-level excess manure for off-farm application are pre-sented in table B–12. In the baseline scenario 2,707counties had farm-level excess manure. In thesecounties 1,167,309 farms were classified as manure-receiving farms with about 121 million acres availablefor manure application. In the after-CNMP scenario,1,198,371 manure-receiving farms had about 124million acres available for manure application. (Therewere more manure-receiving farms for the after-CNMPscenario because 113 additional counties had farmswith farm-level excess manure after CNMP implemen-tation.)
About 9.5 million acres on manure-receiving farms hadmanure applied in the baseline scenario, compared toabout 13.5 million acres in the after-CNMP scenario.Thus, about 4 million additional off-farm acres arerequired to meet CNMP application criteria.

B–31
Costs Associated with Development and Implementation of Comprehensive Nutrient Management Plans
Part I—Nutrient Management, Land Treatment, Manure and Wastewater Handling and Storage, and Recordkeeping
In the baseline scenario, 184 counties had excessmanure. County-level excess manure nitrogen totaled238 million pounds in the baseline scenario, andexcess manure phosphorus totaled 124 million pounds(table B–12), representing about 10 percent of the totalrecoverable manure nutrients. The presumption is thateither this manure is presently being transported toareas outside of the county for application, is beingused for purposes other than land application, is fed toanimals as a feed supplement, or is held in storagetemporarily. Lagoons, for example, accumulate ma-nure nutrients as the solids settle to the bottom andthe liquid is pumped off for land application. Thesesolids are retained in the lagoon sometimes for manyyears before being cleaned out and applied to the land.In addition, manure is sometimes allowed to stack upfor long periods in arid regions of the country, and isnot removed for land application every year. It is also
possible that some of this county-level excess manure,as measured by the simulation model, is actually landapplied, but at rates higher than simulated in thebaseline scenario.
In the after-CNMP scenario, the number of countieswith excess manure increased by 64 counties, shownin figure B–3. County-level excess manure increased toabout 16 percent of the total amount of recoverablemanure nutrients (table B–12). County-level excessmanure in the after-CNMP scenario was 454 millionpounds of nitrogen and 243 million pounds of phospho-rus. This excess manure cannot be land applied underthe assumptions of the model, and therefore must bedisposed of using alternative methods or addressedthrough feed management options that decrease thenutrient content in manure.
Table B–12 Acres with manure applied and estimates of excess manure for manure-receiving farms
Baseline scenario After-CNMP scenario
Number of counties with manure-receiving farms* 2,707 2,820 Number of manure-receiving farms in these counties 1,167,309 1,198,371
Farm-level excess manure nitrogen, pounds 1,193,141,133 1,844,146,884Farm-level excess manure phosphorus, pounds 613,628,308 961,462,003
Total acres of 24 crops and pastureland** 287,149,756 294,579,460Acres available for manure application*** 120,947,562 123,985,962
Acres with manure applied in a given year 9,474,818 13,486,869 Percent of total acres of 24 crops and pastureland 3.3 4.6 Percent of acres available for manure application 7.8 10.9
County-level excess manure nitrogen, pounds 237,595,809 454,286,181 Percent of farm-level excess manure nitrogen 19.9 24.6 Percent of recoverable manure nitrogen 9.4 15.1
County-level excess manure phosphorus, pounds 123,813,042 243,301,550 Percent of farm-level excess manure phosphorus 20.2 25.3 Percent of recoverable manure phosphorus 10.8 17.3
Number of counties with excess manure 184 248
* Counties with manure-receiving farms are counties that have one or more manure-producing farms with farm-level excess manure.** Excludes half of permanent pasture acreage.*** Excludes acres with sheet and rill erosion above T, 50 percent of the remaining acreage for each crop and cropland used as pasture, and
75 percent of permanent pastureland.
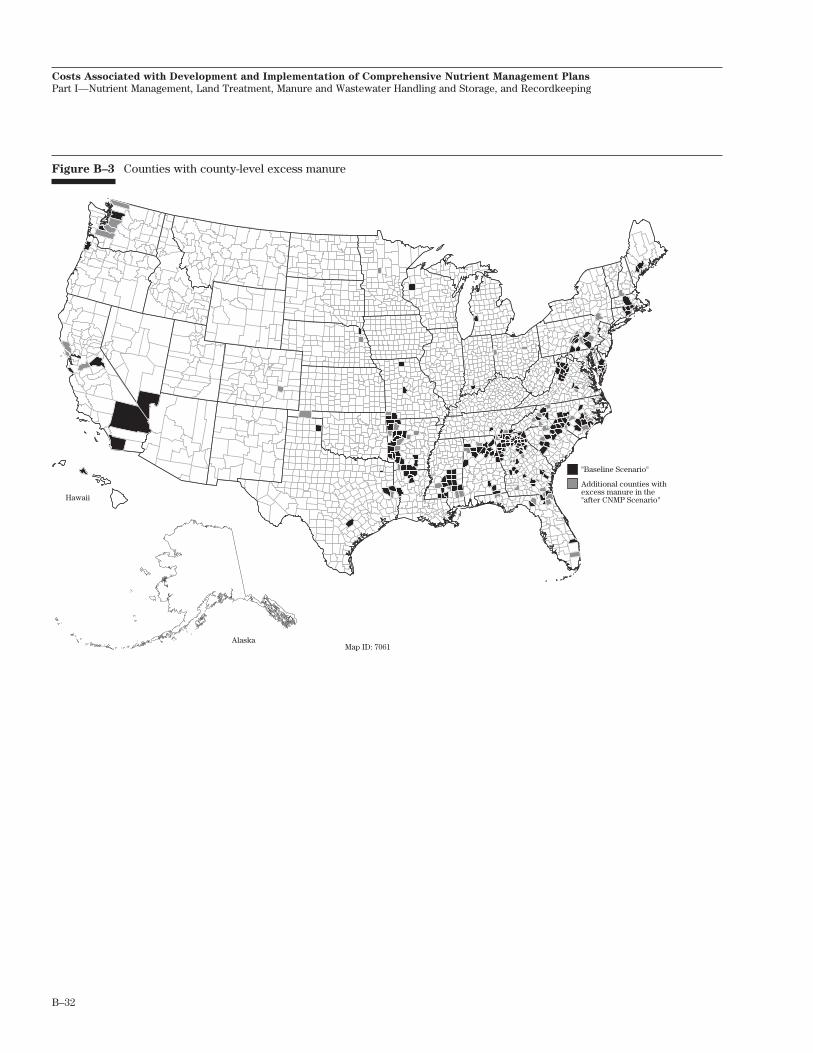
B–32
Costs Associated with Development and Implementation of Comprehensive Nutrient Management Plans
Part I—Nutrient Management, Land Treatment, Manure and Wastewater Handling and Storage, and Recordkeeping
Figure B–3 Counties with county-level excess manure
Hawaii
AlaskaMap ID: 7061
"Baseline Scenario"
Additional counties withexcess manure in the"after CNMP Scenario"
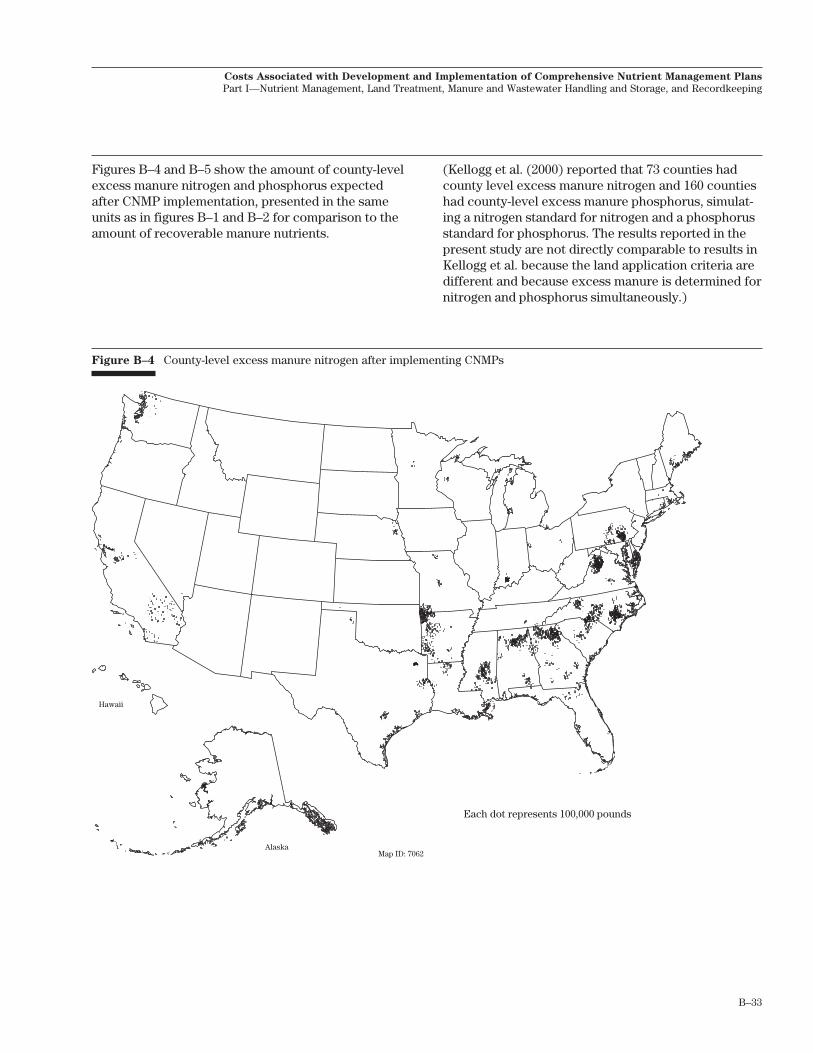
B–33
Costs Associated with Development and Implementation of Comprehensive Nutrient Management Plans
Part I—Nutrient Management, Land Treatment, Manure and Wastewater Handling and Storage, and Recordkeeping
Figures B–4 and B–5 show the amount of county-levelexcess manure nitrogen and phosphorus expectedafter CNMP implementation, presented in the sameunits as in figures B–1 and B–2 for comparison to theamount of recoverable manure nutrients.
(Kellogg et al. (2000) reported that 73 counties hadcounty level excess manure nitrogen and 160 countieshad county-level excess manure phosphorus, simulat-ing a nitrogen standard for nitrogen and a phosphorusstandard for phosphorus. The results reported in thepresent study are not directly comparable to results inKellogg et al. because the land application criteria aredifferent and because excess manure is determined fornitrogen and phosphorus simultaneously.)
Figure B–4 County-level excess manure nitrogen after implementing CNMPs
Hawaii
AlaskaMap ID: 7062
Each dot represents 100,000 pounds

B–34
Costs Associated with Development and Implementation of Comprehensive Nutrient Management Plans
Part I—Nutrient Management, Land Treatment, Manure and Wastewater Handling and Storage, and Recordkeeping
Figure B–5 County-level excess manure phosphorus after implementing CNMPs
Hawaii
AlaskaMap ID: 7063
Each dot represents 100,000 pounds

B–35
Costs Associated with Development and Implementation of Comprehensive Nutrient Management Plans
Part I—Nutrient Management, Land Treatment, Manure and Wastewater Handling and Storage, and Recordkeeping
Acres required for both onfarm and off-farm manureapplication are summarized in table B–13. Off-farmacres with manure applied were about the same asonfarm acres with manure applied, with off-farm acresbeing slightly higher in the baseline scenario andonfarm acres being slightly higher in the after-CNMPscenario. Overall, an additional 11.6 million acres arerequired to meet CNMP application criteria. Abouttwo-thirds of these are for onfarm application and therest for off-farm application.
Included in table B–13 is the amount of recoverablemanure nutrients that would be applied on the farm,
applied off the farm, and the amount that would re-main as county-level excess manure. Overall, thepercentage of recoverable manure nitrogen that wouldbe applied on the farm falls from 53 percent in thebaseline scenario to 39 percent in the after-CNMPscenario, whereas the percentage for off-farm applica-tion increases from 38 percent in the baseline scenarioto 46 percent in the after-CNMP scenario. Similarchanges are shown for manure phosphorus. County-level excess manure increases from about 10 percentin the baseline scenario to about 16 percent in theafter-CNMP scenario as a result of CNMP implementa-tion.
Table B–13 Summary of acres with manure applied and recoverable manure nutrients applied
Category Onfarm application Off-farm application Excess manure Total(manure-producing (manure-receiving (county-level)
farms) farms)
Recoverable manure nitrogen, pounds
Baseline scenario 1,340,621,108 955,543,104 237,595,809 2,533,788,026Percent of total 52.9 37.7 9.4 100.0
After-CNMP scenarioFarms applying at nitrogen-standard rates 871,617,297 1,389,860,703 NAFarms applying at phosphorus-standard rates 293,774,939 NA NASum 1,165,392,236 1,389,860,703 454,286,181 3,009,556,624
Percent of total 38.7 46.2 15.1 100.0
Recoverable manure phosphorus, pounds
Baseline scenario 537,504,867 489,814,215 123,813,042 1,151,144,811Percent of total 46.7 42.6 10.8 100.0
After-CNMP scenarioFarms applying at nitrogen-standard rates 306,991,912 718,160,454 NAFarms applying at phosphorus-standard rates 134,162,240 NA NASum 441,154,152 718,160,454 243,301,550 1,402,621,897
Percent of total 31.5 51.2 17.3 100.0
Acres with manure applied in a given year
Baseline scenario 7,187,142 9,474,818 NA 16,661,960Percent of total 43.1 56.9 NA 100.0
After-CNMP scenarioFarms applying at nitrogen-standard rates 7,580,869 13,486,869 NAFarms applying at phosphorus-standard rates 7,233,466 NA NASum 14,814,335 13,486,869 NA 28,301,204
Percent of total 52.3 47.7 NA 100.0
Additional acres required 7,627,193 4,012,051 NA 11,639,244Percent of total 65.5 34.5 NA 100.0
NA = not applicable.
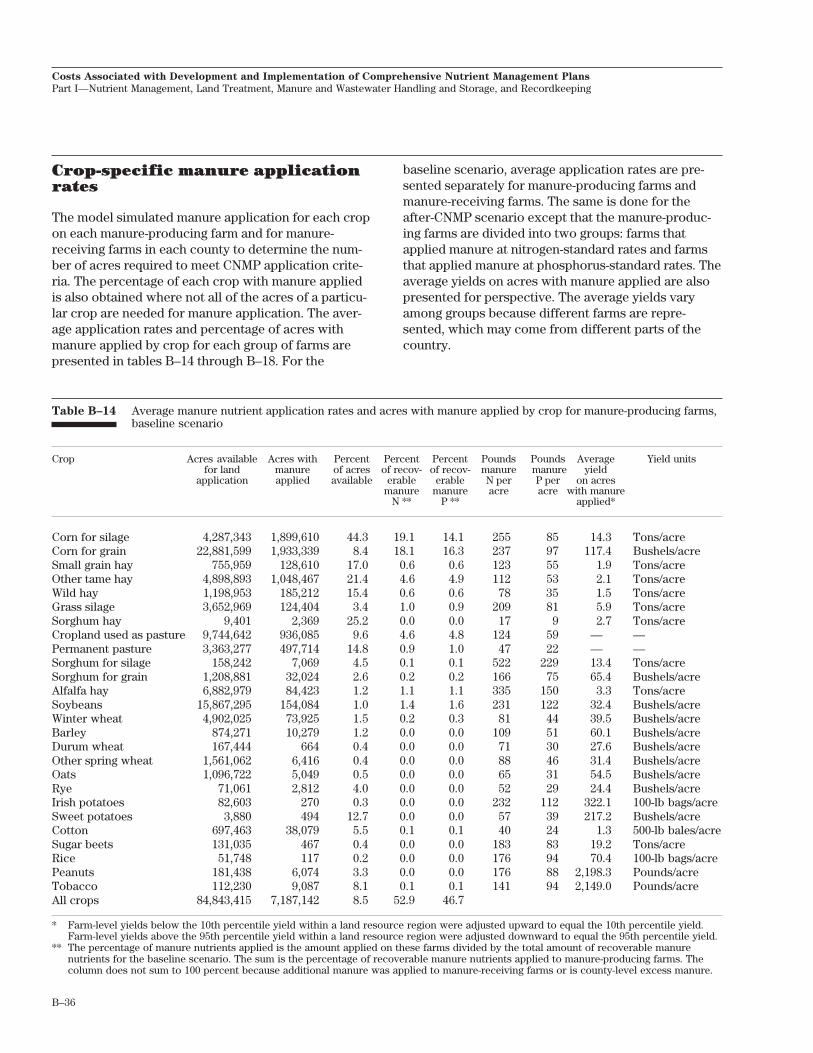
B–36
Costs Associated with Development and Implementation of Comprehensive Nutrient Management Plans
Part I—Nutrient Management, Land Treatment, Manure and Wastewater Handling and Storage, and Recordkeeping
Crop-specific manure applicationrates
The model simulated manure application for each cropon each manure-producing farm and for manure-receiving farms in each county to determine the num-ber of acres required to meet CNMP application crite-ria. The percentage of each crop with manure appliedis also obtained where not all of the acres of a particu-lar crop are needed for manure application. The aver-age application rates and percentage of acres withmanure applied by crop for each group of farms arepresented in tables B–14 through B–18. For the
baseline scenario, average application rates are pre-sented separately for manure-producing farms andmanure-receiving farms. The same is done for theafter-CNMP scenario except that the manure-produc-ing farms are divided into two groups: farms thatapplied manure at nitrogen-standard rates and farmsthat applied manure at phosphorus-standard rates. Theaverage yields on acres with manure applied are alsopresented for perspective. The average yields varyamong groups because different farms are repre-sented, which may come from different parts of thecountry.
Table B–14 Average manure nutrient application rates and acres with manure applied by crop for manure-producing farms,baseline scenario
Crop Acres available Acres with Percent Percent Percent Pounds Pounds Average Yield unitsfor land manure of acres of recov- of recov- manure manure yield
application applied available erable erable N per P per on acresmanure manure acre acre with manure
N ** P ** applied*
Corn for silage 4,287,343 1,899,610 44.3 19.1 14.1 255 85 14.3 Tons/acreCorn for grain 22,881,599 1,933,339 8.4 18.1 16.3 237 97 117.4 Bushels/acreSmall grain hay 755,959 128,610 17.0 0.6 0.6 123 55 1.9 Tons/acreOther tame hay 4,898,893 1,048,467 21.4 4.6 4.9 112 53 2.1 Tons/acreWild hay 1,198,953 185,212 15.4 0.6 0.6 78 35 1.5 Tons/acreGrass silage 3,652,969 124,404 3.4 1.0 0.9 209 81 5.9 Tons/acreSorghum hay 9,401 2,369 25.2 0.0 0.0 17 9 2.7 Tons/acreCropland used as pasture 9,744,642 936,085 9.6 4.6 4.8 124 59 — —Permanent pasture 3,363,277 497,714 14.8 0.9 1.0 47 22 — —Sorghum for silage 158,242 7,069 4.5 0.1 0.1 522 229 13.4 Tons/acreSorghum for grain 1,208,881 32,024 2.6 0.2 0.2 166 75 65.4 Bushels/acreAlfalfa hay 6,882,979 84,423 1.2 1.1 1.1 335 150 3.3 Tons/acreSoybeans 15,867,295 154,084 1.0 1.4 1.6 231 122 32.4 Bushels/acreWinter wheat 4,902,025 73,925 1.5 0.2 0.3 81 44 39.5 Bushels/acreBarley 874,271 10,279 1.2 0.0 0.0 109 51 60.1 Bushels/acreDurum wheat 167,444 664 0.4 0.0 0.0 71 30 27.6 Bushels/acreOther spring wheat 1,561,062 6,416 0.4 0.0 0.0 88 46 31.4 Bushels/acreOats 1,096,722 5,049 0.5 0.0 0.0 65 31 54.5 Bushels/acreRye 71,061 2,812 4.0 0.0 0.0 52 29 24.4 Bushels/acreIrish potatoes 82,603 270 0.3 0.0 0.0 232 112 322.1 100-lb bags/acreSweet potatoes 3,880 494 12.7 0.0 0.0 57 39 217.2 Bushels/acreCotton 697,463 38,079 5.5 0.1 0.1 40 24 1.3 500-lb bales/acreSugar beets 131,035 467 0.4 0.0 0.0 183 83 19.2 Tons/acreRice 51,748 117 0.2 0.0 0.0 176 94 70.4 100-lb bags/acrePeanuts 181,438 6,074 3.3 0.0 0.0 176 88 2,198.3 Pounds/acreTobacco 112,230 9,087 8.1 0.1 0.1 141 94 2,149.0 Pounds/acreAll crops 84,843,415 7,187,142 8.5 52.9 46.7
* Farm-level yields below the 10th percentile yield within a land resource region were adjusted upward to equal the 10th percentile yield.Farm-level yields above the 95th percentile yield within a land resource region were adjusted downward to equal the 95th percentile yield.
** The percentage of manure nutrients applied is the amount applied on these farms divided by the total amount of recoverable manurenutrients for the baseline scenario. The sum is the percentage of recoverable manure nutrients applied to manure-producing farms. Thecolumn does not sum to 100 percent because additional manure was applied to manure-receiving farms or is county-level excess manure.

B–37
Costs Associated with Development and Implementation of Comprehensive Nutrient Management Plans
Part I—Nutrient Management, Land Treatment, Manure and Wastewater Handling and Storage, and Recordkeeping
Table B–15 Average manure nutrient application rates and acres with manure applied by crop for manure-receiving farms,baseline scenario
Crop Acres available Acres with Percent Percent Percent Pounds Pounds Average Yield unitsfor land manure of acres of recov- of recov- manure manure yield
application applied available erable erable N per P per on acresmanure manure acre acre with manure
N ** P ** applied*
Corn for silage 1,403,339 95,912 6.8 0.7 0.8 198 100 19.5 Tons/acreCorn for grain 46,133,556 3,335,505 7.2 18.8 20.8 143 72 125.1 Bushels/acreSmall grain hay 2,041,118 90,963 4.5 0.3 0.3 70 38 1.9 Tons/acreOther tame hay 17,707,616 813,819 4.6 1.9 2.2 60 31 2.1 Tons/acreWild hay 6,462,708 152,383 2.4 0.3 0.3 44 23 1.5 Tons/acreGrass silage 960,757 39,965 4.2 0.2 0.3 143 74 7.3 Tons/acreSorghum hay 72,892 857 1.2 0.0 0.0 11 6 3.2 Tons/acreCropland used as pasture 51,427,685 1,892,175 3.7 5.6 6.3 75 38 — —Permanent pasture 19,603,370 465,740 2.4 0.5 0.6 28 14 — —Sorghum for silage 218,357 2,106 1.0 0.0 0.0 316 138 15.0 Tons/acreSorghum for grain 6,963,989 365,616 5.3 1.1 1.3 78 42 55.7 Bushels/acreAlfalfa hay 13,420,362 70,124 0.5 1.0 1.1 346 179 4.8 Tons/acreSoybeans 47,371,268 526,902 1.1 3.1 3.7 148 82 29.1 Bushels/acreWinter wheat 31,878,378 827,459 2.6 2.0 2.4 63 33 42.8 Bushels/acreBarley 4,651,474 82,074 1.8 0.3 0.3 98 48 76.5 Bushels/acreDurum wheat 2,488,967 60,250 2.4 0.4 0.4 166 84 90.2 Bushels/acreOther spring wheat 14,561,081 15,421 0.1 0.1 0.1 119 58 60.0 Bushels/acreOats 1,497,311 37,037 2.5 0.1 0.1 50 26 58.8 Bushels/acreRye 189,812 9,525 5.0 0.0 0.0 38 21 24.7 Bushels/acreIrish potatoes 1,221,360 21,598 1.8 0.1 0.2 171 89 332.7 100-lb bags/acreSweet potatoes 68,382 8,447 12.4 0.0 0.0 55 35 295.7 Bushels/acreCotton 11,253,997 518,885 4.6 0.9 1.1 43 24 2.0 500-lb bales/acreSugar beets 1,311,671 51 0.0 0.0 0.0 192 86 28.2 Tons/acreRice 2,462,287 169 0.0 0.0 0.0 89 48 49.7 100-lb bags/acrePeanuts 1,125,771 22,054 2.0 0.1 0.1 134 67 2,334.9 Pounds/acreTobacco 652,249 19,782 3.0 0.1 0.1 107 77 2,273.5 Pounds/acreAll crops 287,149,756 9,474,818 3.3 37.7 42.6
* Farm-level yields below the 10th percentile yield within a land resource region were adjusted upward to equal the 10th percentile yield.Farm-level yields above the 95th percentile yield within a land resource region were adjusted downward to equal the 95th percentile yield.
** The percentage of manure nutrients applied is the amount applied on these farms divided by the total amount of recoverable manurenutrients for the baseline scenario. The sum is the percentage of recoverable manure nutrients applied to manure-receiving farms. Thecolumn does not sum to 100 percent because additional manure was applied to manure-producing farms or is county-level excess manure.
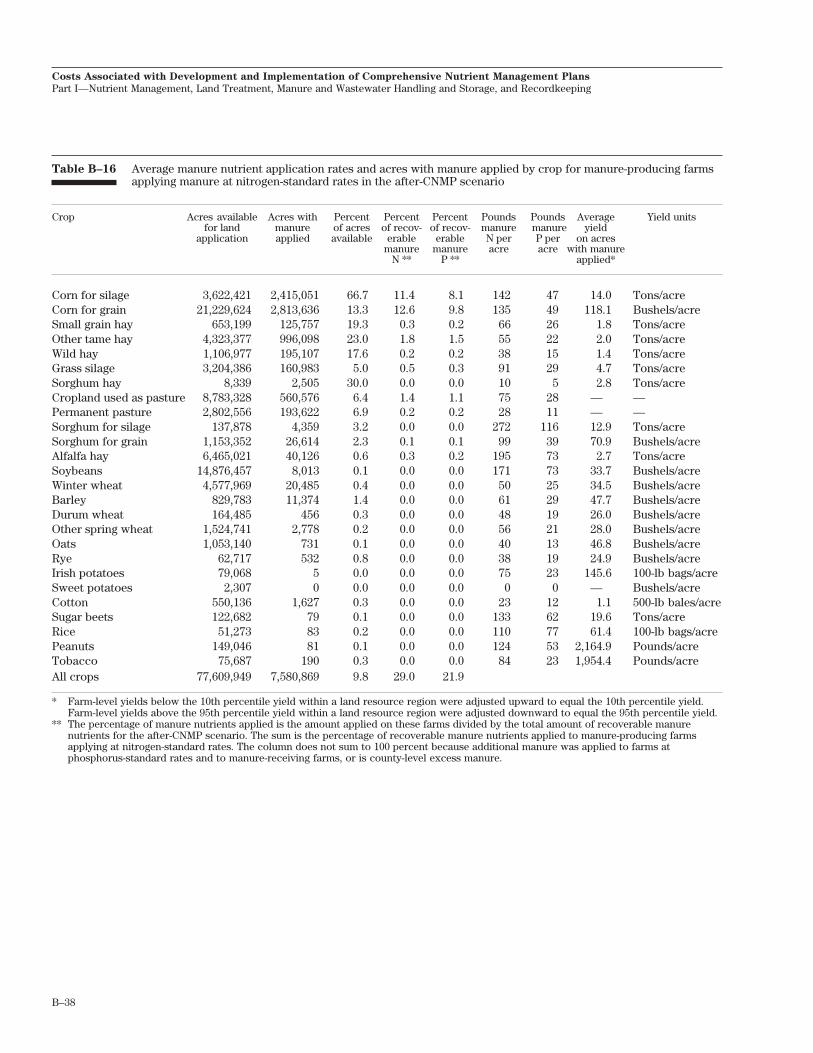
B–38
Costs Associated with Development and Implementation of Comprehensive Nutrient Management Plans
Part I—Nutrient Management, Land Treatment, Manure and Wastewater Handling and Storage, and Recordkeeping
Table B–16 Average manure nutrient application rates and acres with manure applied by crop for manure-producing farmsapplying manure at nitrogen-standard rates in the after-CNMP scenario
Crop Acres available Acres with Percent Percent Percent Pounds Pounds Average Yield unitsfor land manure of acres of recov- of recov- manure manure yield
application applied available erable erable N per P per on acresmanure manure acre acre with manure
N ** P ** applied*
Corn for silage 3,622,421 2,415,051 66.7 11.4 8.1 142 47 14.0 Tons/acreCorn for grain 21,229,624 2,813,636 13.3 12.6 9.8 135 49 118.1 Bushels/acreSmall grain hay 653,199 125,757 19.3 0.3 0.2 66 26 1.8 Tons/acreOther tame hay 4,323,377 996,098 23.0 1.8 1.5 55 22 2.0 Tons/acreWild hay 1,106,977 195,107 17.6 0.2 0.2 38 15 1.4 Tons/acreGrass silage 3,204,386 160,983 5.0 0.5 0.3 91 29 4.7 Tons/acreSorghum hay 8,339 2,505 30.0 0.0 0.0 10 5 2.8 Tons/acreCropland used as pasture 8,783,328 560,576 6.4 1.4 1.1 75 28 — —Permanent pasture 2,802,556 193,622 6.9 0.2 0.2 28 11 — —Sorghum for silage 137,878 4,359 3.2 0.0 0.0 272 116 12.9 Tons/acreSorghum for grain 1,153,352 26,614 2.3 0.1 0.1 99 39 70.9 Bushels/acreAlfalfa hay 6,465,021 40,126 0.6 0.3 0.2 195 73 2.7 Tons/acreSoybeans 14,876,457 8,013 0.1 0.0 0.0 171 73 33.7 Bushels/acreWinter wheat 4,577,969 20,485 0.4 0.0 0.0 50 25 34.5 Bushels/acreBarley 829,783 11,374 1.4 0.0 0.0 61 29 47.7 Bushels/acreDurum wheat 164,485 456 0.3 0.0 0.0 48 19 26.0 Bushels/acreOther spring wheat 1,524,741 2,778 0.2 0.0 0.0 56 21 28.0 Bushels/acreOats 1,053,140 731 0.1 0.0 0.0 40 13 46.8 Bushels/acreRye 62,717 532 0.8 0.0 0.0 38 19 24.9 Bushels/acreIrish potatoes 79,068 5 0.0 0.0 0.0 75 23 145.6 100-lb bags/acreSweet potatoes 2,307 0 0.0 0.0 0.0 0 0 — Bushels/acreCotton 550,136 1,627 0.3 0.0 0.0 23 12 1.1 500-lb bales/acreSugar beets 122,682 79 0.1 0.0 0.0 133 62 19.6 Tons/acreRice 51,273 83 0.2 0.0 0.0 110 77 61.4 100-lb bags/acrePeanuts 149,046 81 0.1 0.0 0.0 124 53 2,164.9 Pounds/acreTobacco 75,687 190 0.3 0.0 0.0 84 23 1,954.4 Pounds/acreAll crops 77,609,949 7,580,869 9.8 29.0 21.9
* Farm-level yields below the 10th percentile yield within a land resource region were adjusted upward to equal the 10th percentile yield.Farm-level yields above the 95th percentile yield within a land resource region were adjusted downward to equal the 95th percentile yield.
** The percentage of manure nutrients applied is the amount applied on these farms divided by the total amount of recoverable manurenutrients for the after-CNMP scenario. The sum is the percentage of recoverable manure nutrients applied to manure-producing farmsapplying at nitrogen-standard rates. The column does not sum to 100 percent because additional manure was applied to farms atphosphorus-standard rates and to manure-receiving farms, or is county-level excess manure.
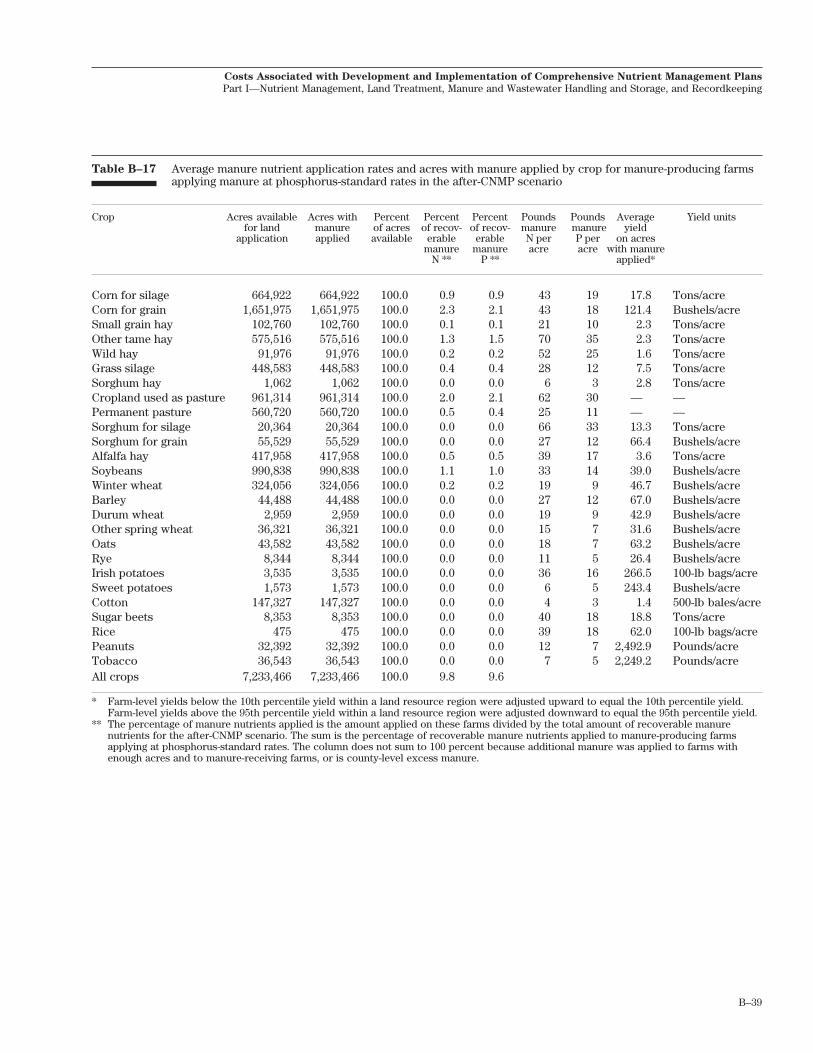
B–39
Costs Associated with Development and Implementation of Comprehensive Nutrient Management Plans
Part I—Nutrient Management, Land Treatment, Manure and Wastewater Handling and Storage, and Recordkeeping
Table B–17 Average manure nutrient application rates and acres with manure applied by crop for manure-producing farmsapplying manure at phosphorus-standard rates in the after-CNMP scenario
Crop Acres available Acres with Percent Percent Percent Pounds Pounds Average Yield unitsfor land manure of acres of recov- of recov- manure manure yield
application applied available erable erable N per P per on acresmanure manure acre acre with manure
N ** P ** applied*
Corn for silage 664,922 664,922 100.0 0.9 0.9 43 19 17.8 Tons/acreCorn for grain 1,651,975 1,651,975 100.0 2.3 2.1 43 18 121.4 Bushels/acreSmall grain hay 102,760 102,760 100.0 0.1 0.1 21 10 2.3 Tons/acreOther tame hay 575,516 575,516 100.0 1.3 1.5 70 35 2.3 Tons/acreWild hay 91,976 91,976 100.0 0.2 0.2 52 25 1.6 Tons/acreGrass silage 448,583 448,583 100.0 0.4 0.4 28 12 7.5 Tons/acreSorghum hay 1,062 1,062 100.0 0.0 0.0 6 3 2.8 Tons/acreCropland used as pasture 961,314 961,314 100.0 2.0 2.1 62 30 — —Permanent pasture 560,720 560,720 100.0 0.5 0.4 25 11 — —Sorghum for silage 20,364 20,364 100.0 0.0 0.0 66 33 13.3 Tons/acreSorghum for grain 55,529 55,529 100.0 0.0 0.0 27 12 66.4 Bushels/acreAlfalfa hay 417,958 417,958 100.0 0.5 0.5 39 17 3.6 Tons/acreSoybeans 990,838 990,838 100.0 1.1 1.0 33 14 39.0 Bushels/acreWinter wheat 324,056 324,056 100.0 0.2 0.2 19 9 46.7 Bushels/acreBarley 44,488 44,488 100.0 0.0 0.0 27 12 67.0 Bushels/acreDurum wheat 2,959 2,959 100.0 0.0 0.0 19 9 42.9 Bushels/acreOther spring wheat 36,321 36,321 100.0 0.0 0.0 15 7 31.6 Bushels/acreOats 43,582 43,582 100.0 0.0 0.0 18 7 63.2 Bushels/acreRye 8,344 8,344 100.0 0.0 0.0 11 5 26.4 Bushels/acreIrish potatoes 3,535 3,535 100.0 0.0 0.0 36 16 266.5 100-lb bags/acreSweet potatoes 1,573 1,573 100.0 0.0 0.0 6 5 243.4 Bushels/acreCotton 147,327 147,327 100.0 0.0 0.0 4 3 1.4 500-lb bales/acreSugar beets 8,353 8,353 100.0 0.0 0.0 40 18 18.8 Tons/acreRice 475 475 100.0 0.0 0.0 39 18 62.0 100-lb bags/acrePeanuts 32,392 32,392 100.0 0.0 0.0 12 7 2,492.9 Pounds/acreTobacco 36,543 36,543 100.0 0.0 0.0 7 5 2,249.2 Pounds/acreAll crops 7,233,466 7,233,466 100.0 9.8 9.6
* Farm-level yields below the 10th percentile yield within a land resource region were adjusted upward to equal the 10th percentile yield.Farm-level yields above the 95th percentile yield within a land resource region were adjusted downward to equal the 95th percentile yield.
** The percentage of manure nutrients applied is the amount applied on these farms divided by the total amount of recoverable manurenutrients for the after-CNMP scenario. The sum is the percentage of recoverable manure nutrients applied to manure-producing farmsapplying at phosphorus-standard rates. The column does not sum to 100 percent because additional manure was applied to farms withenough acres and to manure-receiving farms, or is county-level excess manure.

B–40
Costs Associated with Development and Implementation of Comprehensive Nutrient Management Plans
Part I—Nutrient Management, Land Treatment, Manure and Wastewater Handling and Storage, and Recordkeeping
Table B–18 Average manure nutrient application rates and acres with manure applied by crop for manure-receiving farms,after-CNMP scenario
Crop Acres available Acres with Percent Percent Percent Pounds Pounds Average Yield unitsfor land manure of acres of recov- of recov- manure manure yield
application applied available erable erable N per P per on acresmanure manure acre acre with manure
N ** P ** applied*
Corn for silage 1,423,856 126,400 8.9 0.8 0.9 193 103 19.1 Tons/acreCorn for grain 46,362,105 4,792,009 10.3 22.8 24.1 143 71 125.1 Bushels/acreSmall grain hay 2,114,320 126,059 6.0 0.3 0.4 70 39 1.9 Tons/acreOther tame hay 18,280,501 1,075,882 5.9 2.1 2.4 59 31 2.1 Tons/acreWild hay 6,645,415 202,261 3.0 0.3 0.3 43 23 1.5 Tons/acreGrass silage 979,247 72,936 7.4 0.3 0.4 143 79 7.4 Tons/acreSorghum hay 73,920 1,602 2.2 0.0 0.0 9 5 2.8 Tons/acreCropland used as pasture 52,900,255 2,485,118 4.7 6.2 7.0 75 39 — —Permanent pasture 20,231,074 663,704 3.3 0.6 0.7 28 15 — —Sorghum for silage 222,114 7,332 3.3 0.1 0.1 299 162 14.2 Tons/acreSorghum for grain 7,038,302 543,628 7.7 1.4 1.7 80 43 56.7 Bushels/acreAlfalfa hay 13,901,766 143,736 1.0 1.7 2.0 351 195 4.9 Tons/acreSoybeans 47,988,525 847,963 1.8 4.4 5.1 157 85 30.8 Bushels/acreWinter wheat 32,520,009 1,299,863 4.0 2.7 3.1 62 34 42.5 Bushels/acreBarley 4,869,278 109,059 2.2 0.3 0.4 96 52 74.8 Bushels/acreDurum wheat 2,917,644 78,962 2.7 0.4 0.5 168 93 90.9 Bushels/acreOther spring wheat 15,471,323 40,236 0.3 0.1 0.2 109 59 54.8 Bushels/acreOats 1,546,402 50,931 3.3 0.1 0.1 50 26 58.8 Bushels/acreRye 194,433 13,192 6.8 0.0 0.0 37 20 23.9 Bushels/acreIrish potatoes 1,247,337 35,826 2.9 0.2 0.2 171 91 332.2 100-lb bags/acreSweet potatoes 71,602 9,230 12.9 0.0 0.0 55 37 294.6 Bushels/acreCotton 11,808,195 695,752 5.9 1.0 1.2 41 24 1.9 500-lb bales/acreSugar beets 1,321,949 216 0.0 0.0 0.0 173 97 25.4 Tons/acreRice 2,617,406 3,149 0.1 0.0 0.0 112 59 62.7 100-lb bags/acrePeanuts 1,162,324 29,536 2.5 0.1 0.1 137 71 2,386.2 Pounds/acreTobacco 670,158 32,289 4.8 0.1 0.2 106 79 2,260.8 Pounds/acreAll crops 294,579,461 13,486,869 4.6 46.2 51.2
* Farm-level yields below the 10th percentile yield within a land resource region were adjusted upward to equal the 10th percentile yield.Farm-level yields above the 95th percentile yield within a land resource region were adjusted downward to equal the 95th percentile yield.
** The percentage of manure nutrients applied is the amount applied on these farms divided by the total amount of recoverable manurenutrients for the after-CNMP scenario. The sum is the percentage of recoverable manure nutrients applied to manure-receiving farms. Thecolumn does not sum to 100 percent because additional manure was applied to manure-producing farms or is county-level excess manure.
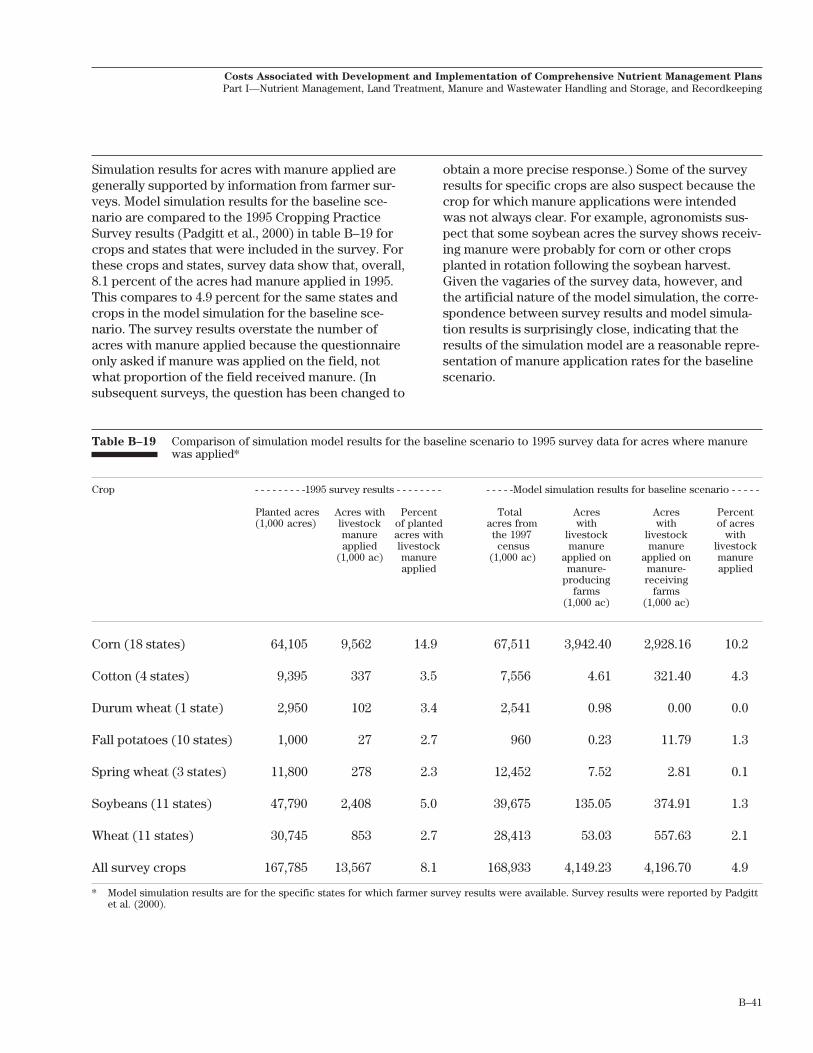
B–41
Costs Associated with Development and Implementation of Comprehensive Nutrient Management Plans
Part I—Nutrient Management, Land Treatment, Manure and Wastewater Handling and Storage, and Recordkeeping
Simulation results for acres with manure applied aregenerally supported by information from farmer sur-veys. Model simulation results for the baseline sce-nario are compared to the 1995 Cropping PracticeSurvey results (Padgitt et al., 2000) in table B–19 forcrops and states that were included in the survey. Forthese crops and states, survey data show that, overall,8.1 percent of the acres had manure applied in 1995.This compares to 4.9 percent for the same states andcrops in the model simulation for the baseline sce-nario. The survey results overstate the number ofacres with manure applied because the questionnaireonly asked if manure was applied on the field, notwhat proportion of the field received manure. (Insubsequent surveys, the question has been changed to
obtain a more precise response.) Some of the surveyresults for specific crops are also suspect because thecrop for which manure applications were intendedwas not always clear. For example, agronomists sus-pect that some soybean acres the survey shows receiv-ing manure were probably for corn or other cropsplanted in rotation following the soybean harvest.Given the vagaries of the survey data, however, andthe artificial nature of the model simulation, the corre-spondence between survey results and model simula-tion results is surprisingly close, indicating that theresults of the simulation model are a reasonable repre-sentation of manure application rates for the baselinescenario.
Table B–19 Comparison of simulation model results for the baseline scenario to 1995 survey data for acres where manurewas applied*
Crop - - - - - - - - -1995 survey results - - - - - - - - - - - - -Model simulation results for baseline scenario - - - - -
Planted acres Acres with Percent Total Acres Acres Percent(1,000 acres) livestock of planted acres from with with of acres
manure acres with the 1997 livestock livestock withapplied livestock census manure manure livestock
(1,000 ac) manure (1,000 ac) applied on applied on manureapplied manure- manure- applied
producing receivingfarms farms
(1,000 ac) (1,000 ac)
Corn (18 states) 64,105 9,562 14.9 67,511 3,942.40 2,928.16 10.2
Cotton (4 states) 9,395 337 3.5 7,556 4.61 321.40 4.3
Durum wheat (1 state) 2,950 102 3.4 2,541 0.98 0.00 0.0
Fall potatoes (10 states) 1,000 27 2.7 960 0.23 11.79 1.3
Spring wheat (3 states) 11,800 278 2.3 12,452 7.52 2.81 0.1
Soybeans (11 states) 47,790 2,408 5.0 39,675 135.05 374.91 1.3
Wheat (11 states) 30,745 853 2.7 28,413 53.03 557.63 2.1
All survey crops 167,785 13,567 8.1 168,933 4,149.23 4,196.70 4.9
* Model simulation results are for the specific states for which farmer survey results were available. Survey results were reported by Padgittet al. (2000).

C–1
Appendix C Comparison of Size Class CategoriesUsed in the Report to EPA Size ClassCategories
Three size classes of farms were derived to summarizeresults of the cost assessment. Size class categorieswere based on the total amount of manure phosphorusproduced on a farm, as excreted. This measure of farmsize is more appropriate than a measure based on thenumber of animals or animal units on the farm be-cause, as shown in appendix B, different animal typesproduce different amounts of manure and manurenutrients after adjusting for live weight. Manure nitro-gen could also have been used to define size classes,but phosphorus was chosen because of its importancein determining CNMP land application criteria. Totalmanure phosphorus as excreted was used rather thanrecoverable manure phosphorus because recoverablemanure does not include the amount produced whenanimals are not held in confinement, and would thusnot be a reliable measure of the overall size of thelivestock operation. In addition, the amount of recov-erable manure can change with CNMP implementationas better management practices improve manurerecoverability on the farm.
The three size classes were defined as follows:• Large farms are operations that produce more
than 10 tons (20,000 pounds) of manure phospho-rus annually.
• Medium-size farms are operations that producebetween 4 and 10 tons (8,000 to 20,000 pounds)of manure phosphorus annually.
• Small farms are operations that produce lessthan 4 tons (8,000 pounds) of manure phospho-rus annually.
The number of farms by size class and the spatialdistribution is presented in the main body of thispublication (tables 6 and 7, and figures 12 and 13).
The large farm size class was derived to correspondroughly to concentrated animal feeding operations(CAFOs) with more than 1,000 EPA animal units sincethese operations present the greatest potential threatto environmental quality and require a National Pollut-ant Discharge Elimination System (NPDES) permit tooperate. (See appendix A for a definition of CAFOsand the relationship between USDA animal units andEPA animal units.) Table C–1 presents estimates of the
total pounds of manure phosphorus that would beproduced on a farm annually at the 1,000 EPA animalunit threshold (column 7), assuming a farm had live-stock at that level throughout the entire year. Asshown in the table, the EPA CAFO criteria are notconsistent with respect to phosphorus productionacross the various livestock types. Choosing a cutoffthat would closely represent the number of fattenedcattle or dairy CAFOs would account for too fewswine CAFOs, for example. The EPA CAFO criteriaalso have the disadvantage of not accounting formultiple livestock types on an operation.
The 10-ton threshold (20,000 pounds) used to definelarge operations was selected to include the bulk ofswine operations that would be classified as a CAFOwith more than 1,000 EPA AU plus additional farms ofan equivalent size in terms of manure production.Table C–2 shows that of the 11,398 potential CAFOs,91 percent are included in the large farm size class.(See appendix A for definition of potential CAFOs asderived from the Census of Agriculture.) The 1,044potential CAFOs not included were predominantlyswine farms. An additional 9,392 livestock operationswere also included that produced an equivalentamount of manure. The total number of farms in thelarge size class was 19,746, of which 59 percent werepotential CAFOs with more than 1,000 EPA animalunits.
A similar approach was used to derive the cutoff formedium size farms, where the 4-ton threshold corre-sponds roughly to the 300 EPA animal unit threshold.Table C–3 shows that of the 32,968 operations thatwould potentially have 300 to 1,000 EPA animal units,64 percent are included in the medium farm size class,whereas 19 percent were included in the large farmsize class and 17 percent were included in the smallfarm size class. An additional 18,365 farms that pro-duced an equivalent amount of manure were alsoincluded in the medium farm size class including the1,044 farms with more than 1,000 EPA animal unitsthat were not included in the large farm size class. Thetotal number of farms in the medium farm size classwas 39,437, of which 53 percent have 300 to 1,000 EPAanimal units.
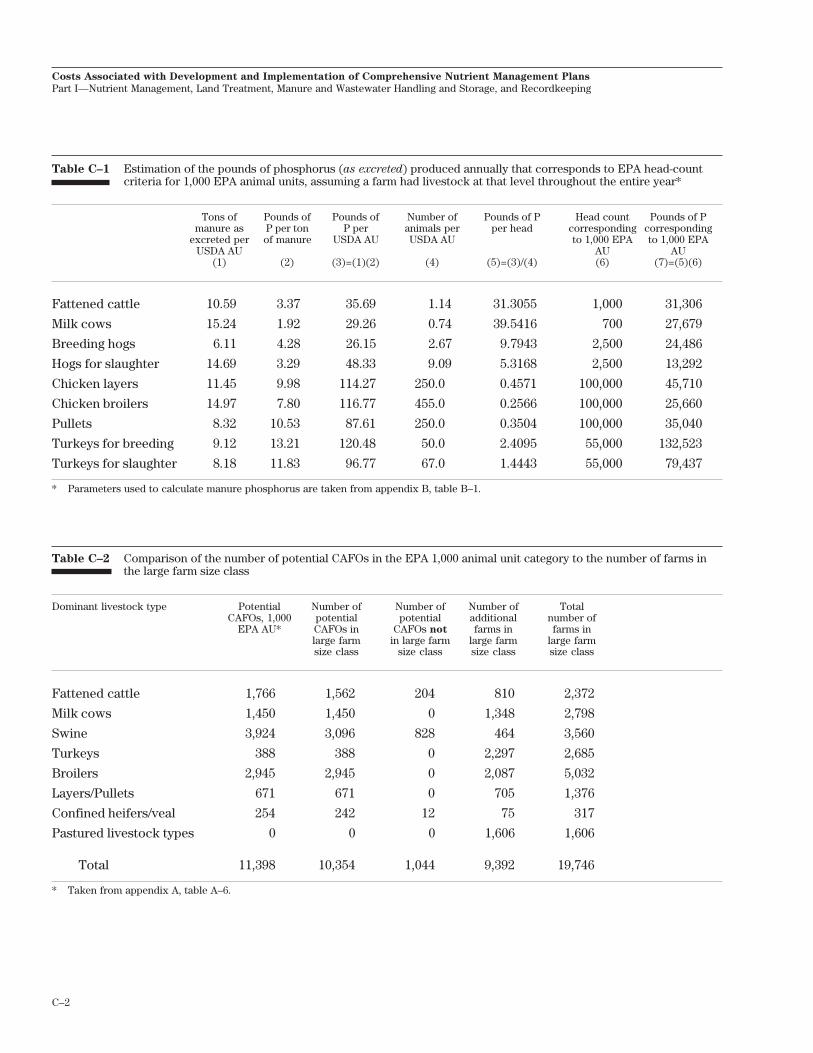
C–2
Costs Associated with Development and Implementation of Comprehensive Nutrient Management Plans
Part I—Nutrient Management, Land Treatment, Manure and Wastewater Handling and Storage, and Recordkeeping
Table C–1 Estimation of the pounds of phosphorus (as excreted) produced annually that corresponds to EPA head-countcriteria for 1,000 EPA animal units, assuming a farm had livestock at that level throughout the entire year*
Tons of Pounds of Pounds of Number of Pounds of P Head count Pounds of Pmanure as P per ton P per animals per per head corresponding corresponding
excreted per of manure USDA AU USDA AU to 1,000 EPA to 1,000 EPAUSDA AU AU AU
(1) (2) (3)=(1)(2) (4) (5)=(3)/(4) (6) (7)=(5)(6)
Fattened cattle 10.59 3.37 35.69 1.14 31.3055 1,000 31,306
Milk cows 15.24 1.92 29.26 0.74 39.5416 700 27,679
Breeding hogs 6.11 4.28 26.15 2.67 9.7943 2,500 24,486
Hogs for slaughter 14.69 3.29 48.33 9.09 5.3168 2,500 13,292
Chicken layers 11.45 9.98 114.27 250.0 0.4571 100,000 45,710
Chicken broilers 14.97 7.80 116.77 455.0 0.2566 100,000 25,660
Pullets 8.32 10.53 87.61 250.0 0.3504 100,000 35,040
Turkeys for breeding 9.12 13.21 120.48 50.0 2.4095 55,000 132,523
Turkeys for slaughter 8.18 11.83 96.77 67.0 1.4443 55,000 79,437
* Parameters used to calculate manure phosphorus are taken from appendix B, table B–1.
Table C–2 Comparison of the number of potential CAFOs in the EPA 1,000 animal unit category to the number of farms inthe large farm size class
Dominant livestock type Potential Number of Number of Number of TotalCAFOs, 1,000 potential potential additional number of
EPA AU* CAFOs in CAFOs not farms in farms inlarge farm in large farm large farm large farmsize class size class size class size class
Fattened cattle 1,766 1,562 204 810 2,372
Milk cows 1,450 1,450 0 1,348 2,798
Swine 3,924 3,096 828 464 3,560
Turkeys 388 388 0 2,297 2,685
Broilers 2,945 2,945 0 2,087 5,032
Layers/Pullets 671 671 0 705 1,376
Confined heifers/veal 254 242 12 75 317
Pastured livestock types 0 0 0 1,606 1,606
Total 11,398 10,354 1,044 9,392 19,746
* Taken from appendix A, table A–6.

C–3
Costs Associated with Development and Implementation of Comprehensive Nutrient Management Plans
Part I—Nutrient Management, Land Treatment, Manure and Wastewater Handling and Storage, and Recordkeeping
Table C–3 Comparison of the number of farms in the 300 to 1,000 EPA animal unit category to the number of farms in themedium farm size class
Dominant livestock type Farms Farms Farms Farms Additional farms in Totalwith 300 to with 300 to with 300 to with 300 to medium farm size number1,000 EPA 1,000 EPA 1,000 EPA 1,000 EPA - - - - - class - - - - - - of farms
AU* AU & in AU & in AU and in Potential Farms in mediummedium large farm small farm CAFOs, with less farm sizefarm size size class size class 1,000 than 300 class
class EPA AU EPA AU
Fattened cattle 2,682 1,423 465 794 204 1,621 3,248
Milk cows 5,780 4,552 1,227 1 0 3,098 7,650
Swine 9,901 5,568 317 4,016 828 2,258 8,654
Turkeys 1,615 0 1,615 0 0 460 460
Broilers 10,749 8,218 2,080 451 0 555 8,773
Layers/pullets 1,460 751 638 71 0 1,585 2,336
Confined heifers/veal 781 560 73 148 12 138 710
Small farms with confined livestock types 0 0 0 0 0 91 91
Pastured livestock types 0 0 0 0 0 7,515 7,515
Total 32,968 21,072 6,415 5,481 1,044 17,321 39,437
* Taken from appendix A, table A–6.
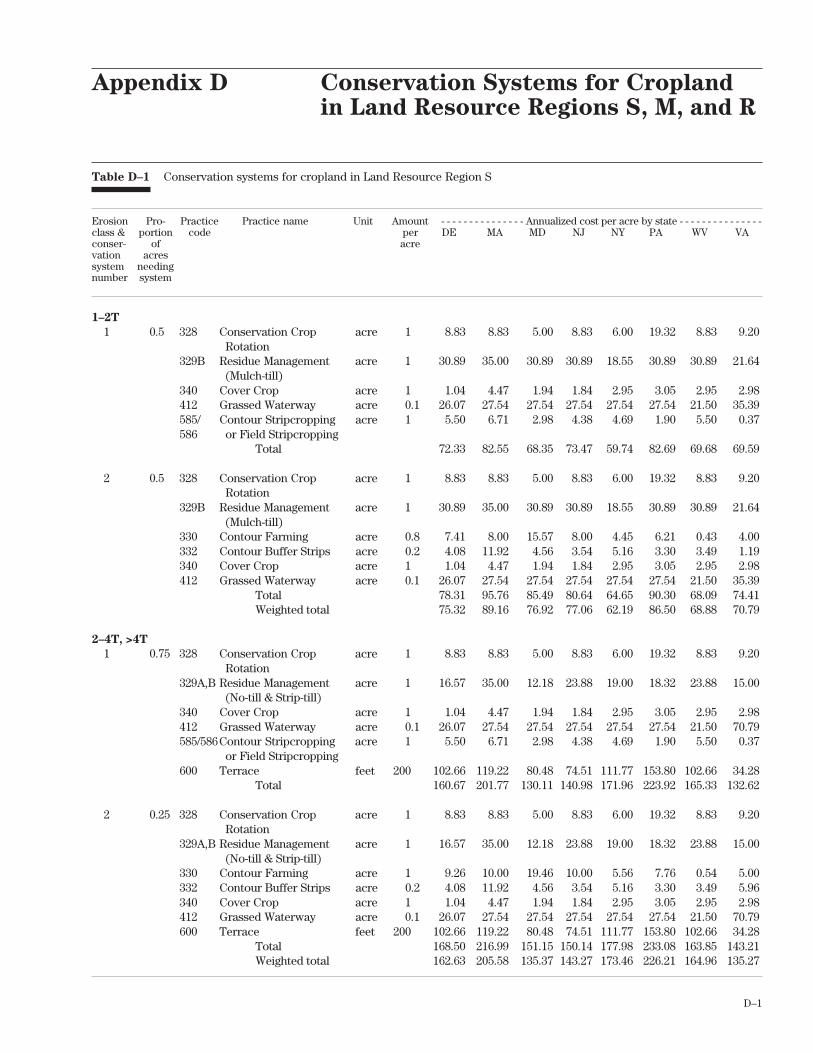
D–1
Appendix D Conservation Systems for Croplandin Land Resource Regions S, M, and R
Table D–1 Conservation systems for cropland in Land Resource Region S
Erosion Pro- Practice Practice name Unit Amount - - - - - - - - - - - - - - - Annualized cost per acre by state - - - - - - - - - - - - - - -class & portion code per DE MA MD NJ NY PA WV VAconser- of acrevation acressystem needingnumber system
1–2T
1 0.5 328 Conservation Crop acre 1 8.83 8.83 5.00 8.83 6.00 19.32 8.83 9.20Rotation
329B Residue Management acre 1 30.89 35.00 30.89 30.89 18.55 30.89 30.89 21.64(Mulch-till)
340 Cover Crop acre 1 1.04 4.47 1.94 1.84 2.95 3.05 2.95 2.98412 Grassed Waterway acre 0.1 26.07 27.54 27.54 27.54 27.54 27.54 21.50 35.39585/ Contour Stripcropping acre 1 5.50 6.71 2.98 4.38 4.69 1.90 5.50 0.37586 or Field Stripcropping
Total 72.33 82.55 68.35 73.47 59.74 82.69 69.68 69.59
2 0.5 328 Conservation Crop acre 1 8.83 8.83 5.00 8.83 6.00 19.32 8.83 9.20Rotation
329B Residue Management acre 1 30.89 35.00 30.89 30.89 18.55 30.89 30.89 21.64(Mulch-till)
330 Contour Farming acre 0.8 7.41 8.00 15.57 8.00 4.45 6.21 0.43 4.00332 Contour Buffer Strips acre 0.2 4.08 11.92 4.56 3.54 5.16 3.30 3.49 1.19340 Cover Crop acre 1 1.04 4.47 1.94 1.84 2.95 3.05 2.95 2.98412 Grassed Waterway acre 0.1 26.07 27.54 27.54 27.54 27.54 27.54 21.50 35.39
Total 78.31 95.76 85.49 80.64 64.65 90.30 68.09 74.41Weighted total 75.32 89.16 76.92 77.06 62.19 86.50 68.88 70.79
2–4T, >4T
1 0.75 328 Conservation Crop acre 1 8.83 8.83 5.00 8.83 6.00 19.32 8.83 9.20Rotation
329A,B Residue Management acre 1 16.57 35.00 12.18 23.88 19.00 18.32 23.88 15.00(No-till & Strip-till)
340 Cover Crop acre 1 1.04 4.47 1.94 1.84 2.95 3.05 2.95 2.98412 Grassed Waterway acre 0.1 26.07 27.54 27.54 27.54 27.54 27.54 21.50 70.79585/586Contour Stripcropping acre 1 5.50 6.71 2.98 4.38 4.69 1.90 5.50 0.37
or Field Stripcropping600 Terrace feet 200 102.66 119.22 80.48 74.51 111.77 153.80 102.66 34.28
Total 160.67 201.77 130.11 140.98 171.96 223.92 165.33 132.62
2 0.25 328 Conservation Crop acre 1 8.83 8.83 5.00 8.83 6.00 19.32 8.83 9.20Rotation
329A,B Residue Management acre 1 16.57 35.00 12.18 23.88 19.00 18.32 23.88 15.00(No-till & Strip-till)
330 Contour Farming acre 1 9.26 10.00 19.46 10.00 5.56 7.76 0.54 5.00332 Contour Buffer Strips acre 0.2 4.08 11.92 4.56 3.54 5.16 3.30 3.49 5.96340 Cover Crop acre 1 1.04 4.47 1.94 1.84 2.95 3.05 2.95 2.98412 Grassed Waterway acre 0.1 26.07 27.54 27.54 27.54 27.54 27.54 21.50 70.79600 Terrace feet 200 102.66 119.22 80.48 74.51 111.77 153.80 102.66 34.28
Total 168.50 216.99 151.15 150.14 177.98 233.08 163.85 143.21Weighted total 162.63 205.58 135.37 143.27 173.46 226.21 164.96 135.27
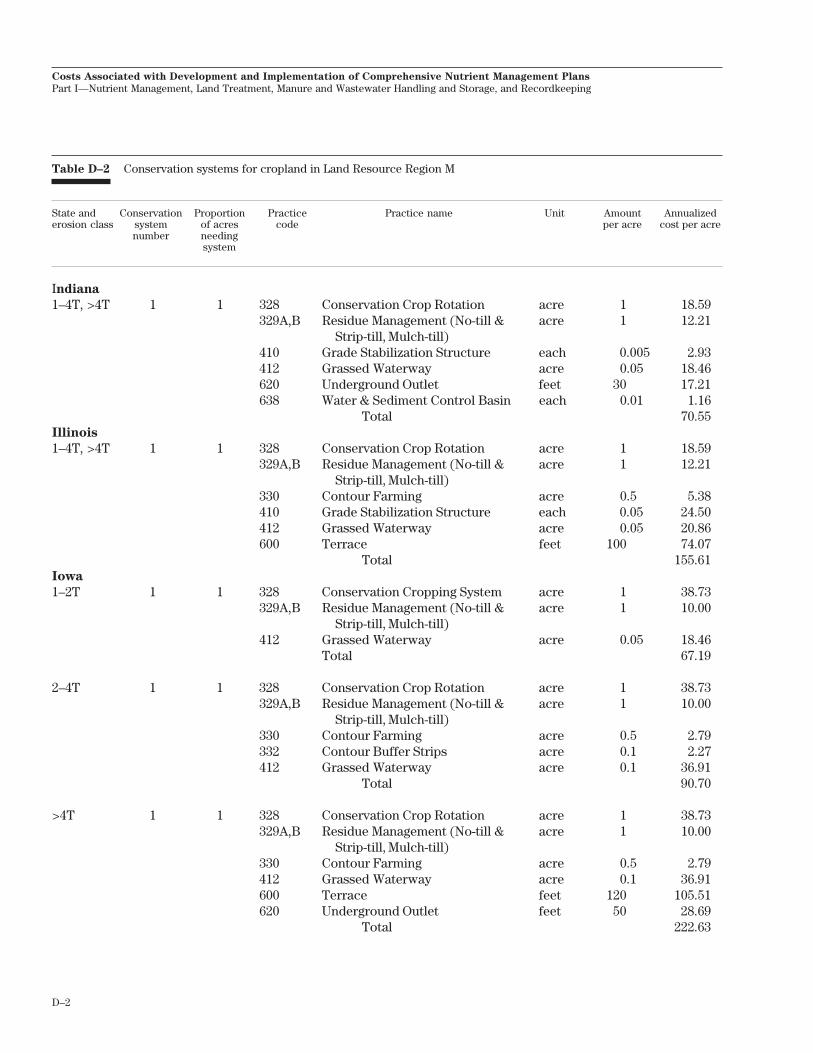
D–2
Costs Associated with Development and Implementation of Comprehensive Nutrient Management Plans
Part I—Nutrient Management, Land Treatment, Manure and Wastewater Handling and Storage, and Recordkeeping
Table D–2 Conservation systems for cropland in Land Resource Region M
State and Conservation Proportion Practice Practice name Unit Amount Annualizederosion class system of acres code per acre cost per acre
number needingsystem
Indiana
1–4T, >4T 1 1 328 Conservation Crop Rotation acre 1 18.59329A,B Residue Management (No-till & acre 1 12.21
Strip-till, Mulch-till)410 Grade Stabilization Structure each 0.005 2.93412 Grassed Waterway acre 0.05 18.46620 Underground Outlet feet 30 17.21638 Water & Sediment Control Basin each 0.01 1.16
Total 70.55Illinois
1–4T, >4T 1 1 328 Conservation Crop Rotation acre 1 18.59329A,B Residue Management (No-till & acre 1 12.21
Strip-till, Mulch-till)330 Contour Farming acre 0.5 5.38410 Grade Stabilization Structure each 0.05 24.50412 Grassed Waterway acre 0.05 20.86600 Terrace feet 100 74.07
Total 155.61Iowa
1–2T 1 1 328 Conservation Cropping System acre 1 38.73329A,B Residue Management (No-till & acre 1 10.00
Strip-till, Mulch-till)412 Grassed Waterway acre 0.05 18.46
Total 67.19
2–4T 1 1 328 Conservation Crop Rotation acre 1 38.73329A,B Residue Management (No-till & acre 1 10.00
Strip-till, Mulch-till)330 Contour Farming acre 0.5 2.79332 Contour Buffer Strips acre 0.1 2.27412 Grassed Waterway acre 0.1 36.91
Total 90.70
>4T 1 1 328 Conservation Crop Rotation acre 1 38.73329A,B Residue Management (No-till & acre 1 10.00
Strip-till, Mulch-till)330 Contour Farming acre 0.5 2.79412 Grassed Waterway acre 0.1 36.91600 Terrace feet 120 105.51620 Underground Outlet feet 50 28.69
Total 222.63

D–3
Costs Associated with Development and Implementation of Comprehensive Nutrient Management Plans
Part I—Nutrient Management, Land Treatment, Manure and Wastewater Handling and Storage, and Recordkeeping
Table D–2 Conservation systems for cropland in Land Resource Region M—Continued
State and Conservation Proportion Practice Practice name Unit Amount Annualizederosion class system of acres code per acre cost per acre
number needingsystem
Minnesota
1–2T 1 1 328 Conservation Crop Rotation acre 1 19.95329A,B Residue Management (No-till & acre 1 16.94
Strip-till, Mulch-till)410 Grade Stabilization Structure each 0.005 3.54412 Grassed Waterway acre 0.05 18.46590 Nutrient Management acre 1 7.50620 Underground Outlet feet 30 12.34638 Water & Sediment Control Basin each 0.1 35.25
Total 113.98
2–4T 1 1 328 Conservation Crop Rotation acre 1 19.95329A,B Residue Management (No-till & acre 1 16.94
Strip-till, Mulch-till)330 Contour Farming acre 1 11.79412 Grassed Waterway acre 0.05 18.46585 Contour Strip-cropping acre 1 1.27620 Underground Outlet feet 30 12.34638 Water & Sediment Control Basin each 0.1 35.25
Total 116.00
>4T 1 0.15 328 Conservation Crop Rotation acre 1 19.95329A,B Residue Management (No-till & acre 1 16.94
Strip-till, Mulch-till)410 Grade Stabilization Structure each 0.005 3.54412 Grassed Waterway acre 0.05 18.46620 Underground Outlet feet 30 12.34638 Water & Sediment Control Basin each 0.01 3.52
Total 74.75
2 0.25 328 Conservation Crop Rotation acre 1 19.95329A,B Residue Management (No-till & acre 1 16.94
Strip-till, Mulch-till)330 Contour Farming acre 0.5 5.90410 Grade Stabilization Structure each 0.05 35.44411 Grasses & Legumes in Rotation acre 1 0.00412 Grassed Waterway acre 0.1 36.91528A Prescribed Grazing acre 1 4.95
Total 120.09
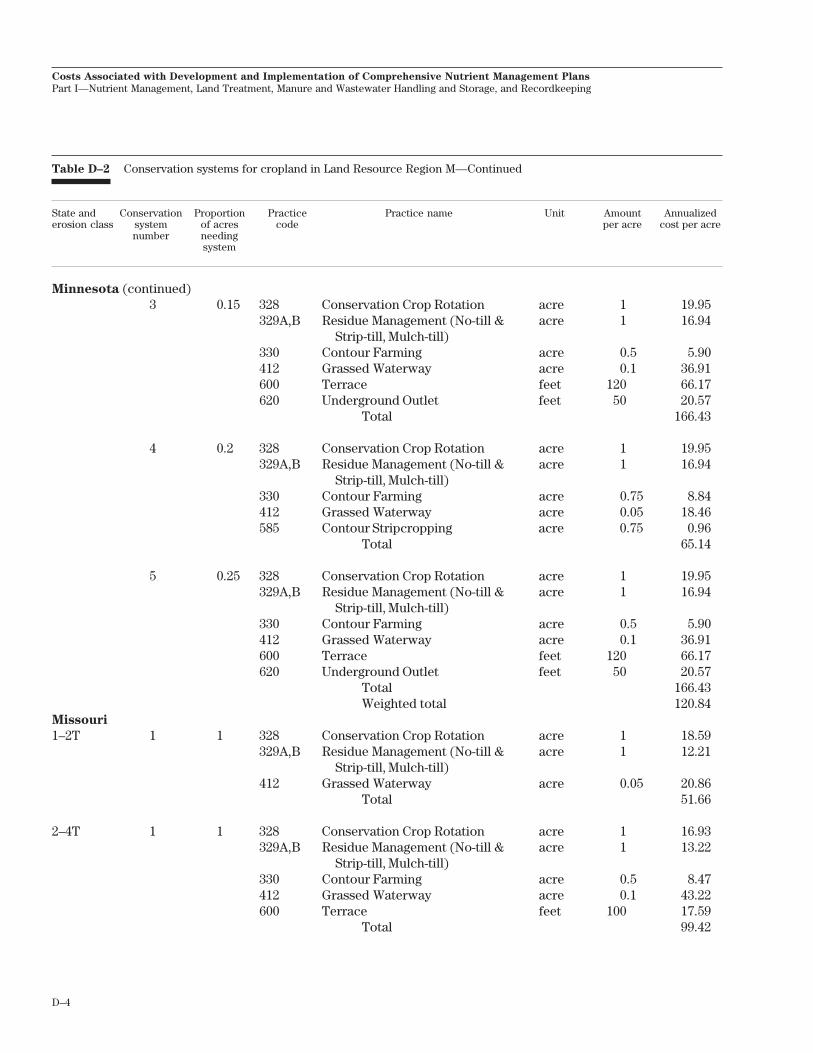
D–4
Costs Associated with Development and Implementation of Comprehensive Nutrient Management Plans
Part I—Nutrient Management, Land Treatment, Manure and Wastewater Handling and Storage, and Recordkeeping
Table D–2 Conservation systems for cropland in Land Resource Region M—Continued
State and Conservation Proportion Practice Practice name Unit Amount Annualizederosion class system of acres code per acre cost per acre
number needingsystem
Minnesota (continued)3 0.15 328 Conservation Crop Rotation acre 1 19.95
329A,B Residue Management (No-till & acre 1 16.94Strip-till, Mulch-till)
330 Contour Farming acre 0.5 5.90412 Grassed Waterway acre 0.1 36.91600 Terrace feet 120 66.17620 Underground Outlet feet 50 20.57
Total 166.43
4 0.2 328 Conservation Crop Rotation acre 1 19.95329A,B Residue Management (No-till & acre 1 16.94
Strip-till, Mulch-till)330 Contour Farming acre 0.75 8.84412 Grassed Waterway acre 0.05 18.46585 Contour Stripcropping acre 0.75 0.96
Total 65.14
5 0.25 328 Conservation Crop Rotation acre 1 19.95329A,B Residue Management (No-till & acre 1 16.94
Strip-till, Mulch-till)330 Contour Farming acre 0.5 5.90412 Grassed Waterway acre 0.1 36.91600 Terrace feet 120 66.17620 Underground Outlet feet 50 20.57
Total 166.43Weighted total 120.84
Missouri
1–2T 1 1 328 Conservation Crop Rotation acre 1 18.59329A,B Residue Management (No-till & acre 1 12.21
Strip-till, Mulch-till)412 Grassed Waterway acre 0.05 20.86
Total 51.66
2–4T 1 1 328 Conservation Crop Rotation acre 1 16.93329A,B Residue Management (No-till & acre 1 13.22
Strip-till, Mulch-till)330 Contour Farming acre 0.5 8.47412 Grassed Waterway acre 0.1 43.22600 Terrace feet 100 17.59
Total 99.42
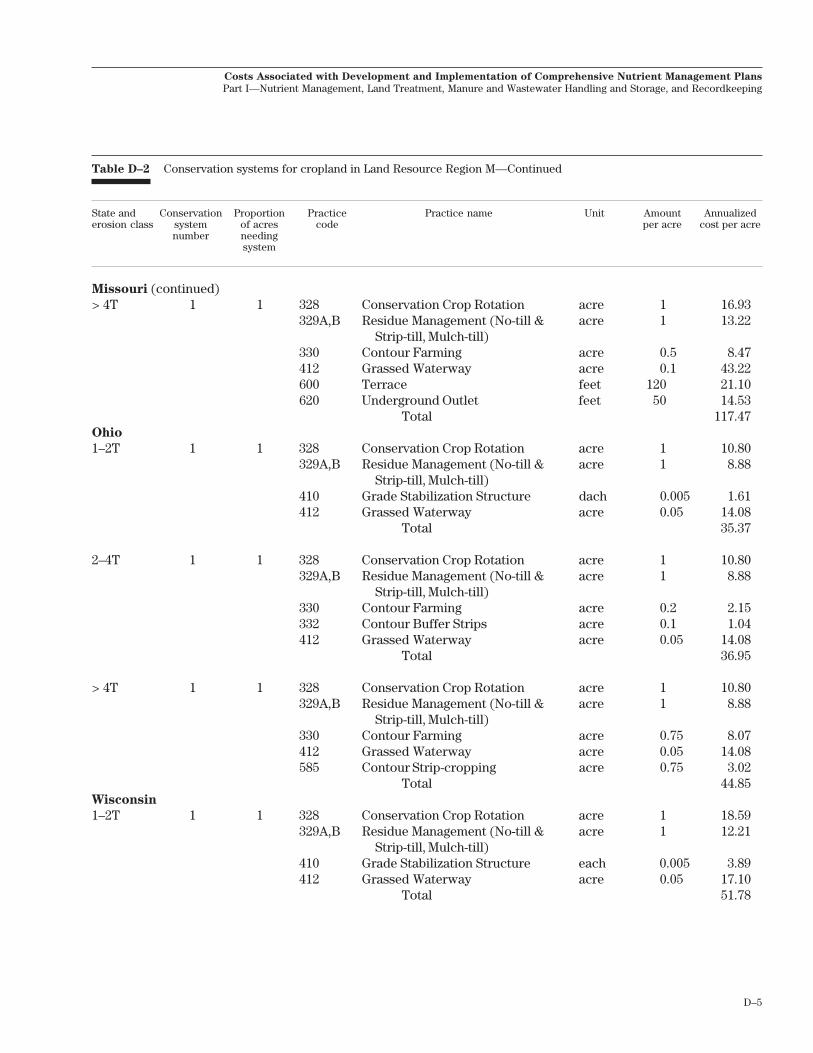
D–5
Costs Associated with Development and Implementation of Comprehensive Nutrient Management Plans
Part I—Nutrient Management, Land Treatment, Manure and Wastewater Handling and Storage, and Recordkeeping
Table D–2 Conservation systems for cropland in Land Resource Region M—Continued
State and Conservation Proportion Practice Practice name Unit Amount Annualizederosion class system of acres code per acre cost per acre
number needingsystem
Missouri (continued)> 4T 1 1 328 Conservation Crop Rotation acre 1 16.93
329A,B Residue Management (No-till & acre 1 13.22Strip-till, Mulch-till)
330 Contour Farming acre 0.5 8.47412 Grassed Waterway acre 0.1 43.22600 Terrace feet 120 21.10620 Underground Outlet feet 50 14.53
Total 117.47Ohio
1–2T 1 1 328 Conservation Crop Rotation acre 1 10.80329A,B Residue Management (No-till & acre 1 8.88
Strip-till, Mulch-till)410 Grade Stabilization Structure dach 0.005 1.61412 Grassed Waterway acre 0.05 14.08
Total 35.37
2–4T 1 1 328 Conservation Crop Rotation acre 1 10.80329A,B Residue Management (No-till & acre 1 8.88
Strip-till, Mulch-till)330 Contour Farming acre 0.2 2.15332 Contour Buffer Strips acre 0.1 1.04412 Grassed Waterway acre 0.05 14.08
Total 36.95
> 4T 1 1 328 Conservation Crop Rotation acre 1 10.80329A,B Residue Management (No-till & acre 1 8.88
Strip-till, Mulch-till)330 Contour Farming acre 0.75 8.07412 Grassed Waterway acre 0.05 14.08585 Contour Strip-cropping acre 0.75 3.02
Total 44.85Wisconsin
1–2T 1 1 328 Conservation Crop Rotation acre 1 18.59329A,B Residue Management (No-till & acre 1 12.21
Strip-till, Mulch-till)410 Grade Stabilization Structure each 0.005 3.89412 Grassed Waterway acre 0.05 17.10
Total 51.78
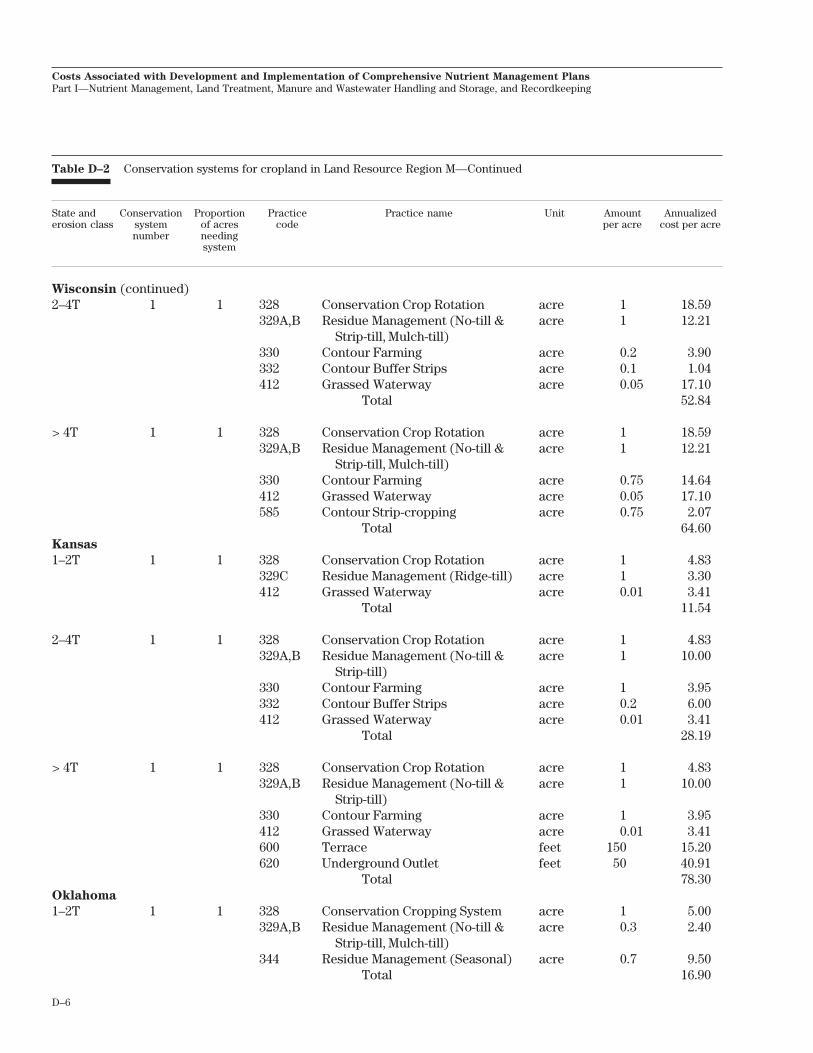
D–6
Costs Associated with Development and Implementation of Comprehensive Nutrient Management Plans
Part I—Nutrient Management, Land Treatment, Manure and Wastewater Handling and Storage, and Recordkeeping
Table D–2 Conservation systems for cropland in Land Resource Region M—Continued
State and Conservation Proportion Practice Practice name Unit Amount Annualizederosion class system of acres code per acre cost per acre
number needingsystem
Wisconsin (continued)2–4T 1 1 328 Conservation Crop Rotation acre 1 18.59
329A,B Residue Management (No-till & acre 1 12.21Strip-till, Mulch-till)
330 Contour Farming acre 0.2 3.90332 Contour Buffer Strips acre 0.1 1.04412 Grassed Waterway acre 0.05 17.10
Total 52.84
> 4T 1 1 328 Conservation Crop Rotation acre 1 18.59329A,B Residue Management (No-till & acre 1 12.21
Strip-till, Mulch-till)330 Contour Farming acre 0.75 14.64412 Grassed Waterway acre 0.05 17.10585 Contour Strip-cropping acre 0.75 2.07
Total 64.60Kansas
1–2T 1 1 328 Conservation Crop Rotation acre 1 4.83329C Residue Management (Ridge-till) acre 1 3.30412 Grassed Waterway acre 0.01 3.41
Total 11.54
2–4T 1 1 328 Conservation Crop Rotation acre 1 4.83329A,B Residue Management (No-till & acre 1 10.00
Strip-till)330 Contour Farming acre 1 3.95332 Contour Buffer Strips acre 0.2 6.00412 Grassed Waterway acre 0.01 3.41
Total 28.19
> 4T 1 1 328 Conservation Crop Rotation acre 1 4.83329A,B Residue Management (No-till & acre 1 10.00
Strip-till)330 Contour Farming acre 1 3.95412 Grassed Waterway acre 0.01 3.41600 Terrace feet 150 15.20620 Underground Outlet feet 50 40.91
Total 78.30Oklahoma
1–2T 1 1 328 Conservation Cropping System acre 1 5.00329A,B Residue Management (No-till & acre 0.3 2.40
Strip-till, Mulch-till)344 Residue Management (Seasonal) acre 0.7 9.50
Total 16.90

D–7
Costs Associated with Development and Implementation of Comprehensive Nutrient Management Plans
Part I—Nutrient Management, Land Treatment, Manure and Wastewater Handling and Storage, and Recordkeeping
Table D–2 Conservation systems for cropland in Land Resource Region M—Continued
State and Conservation Proportion Practice Practice name Unit Amount Annualizederosion class system of acres code per acre cost per acre
number needingsystem
Oklahoma (continued)2–4T 1 1 328 Conservation Crop Rotation acre 1 5.00
329A,B Residue Management (No-till & acre 1 8.00Strip-till)
412 Grassed Waterway acre 0.05 4.10600 Terrace feet 150 10.06
Total 27.16
> 4T 1 1 328 Conservation Crop Rotation acre 1 5.00329A,C Residue Management (No-till & acre 1 8.00
Strip-till, Ridge-till)362 Diversion feet 110 14.75412 Grassed Waterway acre 0.05 4.10600 Terrace feet 110 7.38
Total 39.23South Dakota
1–2T 1 1 328 Conservation Crop Rotation acre 1 3.85329C Residue Management (Ridge-till) acre 1 4.65412 Grassed Waterway acre 0.01 4.02
Total 12.52
2–4T 1 1 328 Conservation Crop Rotation acre 1 3.85329A,B Residue Management (No-till & acre 1 10.78
Strip-till)330 Contour Farming acre 1 12.93332 Contour Buffer Strips acre 0.2 6.00412 Grassed Waterway acre 0.01 4.02
Total 37.58
> 4T 1 1 328 Conservation Crop Rotation acre 1 3.85329A,B Residue Management (No-till & acre 1 10.78
Strip-till)330 Contour Farming acre 1 12.93412 Grassed Waterway acre 0.01 4.02600 Terrace feet 150 31.30620 Underground Outlet feet 50 25.36
Total 88.23Nebraska
1–2T 1 1 328 Conservation Crop Rotation acre 1 5.00329C Residue Management (Ridge-till) acre 1 4.65412 Grassed Waterway acre 0.01 3.41
Total 13.06

D–8
Costs Associated with Development and Implementation of Comprehensive Nutrient Management Plans
Part I—Nutrient Management, Land Treatment, Manure and Wastewater Handling and Storage, and Recordkeeping
Table D–2 Conservation systems for cropland in Land Resource Region M—Continued
State and Conservation Proportion Practice Practice name Unit Amount Annualizederosion class system of acres code per acre cost per acre
number needingsystem
Nebraska (continued)2–4T 1 1 328 Conservation Crop Rotation acre 1 5.00
329A,B Residue Management (No-till & acre 1 10.78Strip-till)
330 Contour Farming acre 1 12.93332 Contour Buffer Strips acre 0.2 6.00412 Grassed Waterway acre 0.01 3.41
Total 38.12
> 4T 1 1 328 Conservation Crop Rotation acre 1 5.00329A,B Residue Management (No-till & acre 1 10.78
Strip-till)330 Contour Farming acre 1 12.93412 Grassed Waterway acre 0.01 3.41600 Terrace feet 150 12.07620 Underground Outlet feet 50 24.29
Total 68.48Michigan
1–2T 1 0.15 328 Conservation Crop Rotation acre 1 6.52329A,B Residue Management (No-till & acre 1 12.00
Strip-till, Mulch-till)410 Grade Stabilization Structure each 0.005 2.24412 Grassed Waterway acre 0.05 18.63620 Underground Outlet feet 30 22.35638 Water & Sediment Control Basin each 0.1 17.88
Total 79.62
2 0.2 328 Conservation Cropping System acre 1 6.52329A,B Residue Management (No-till & acre 1 12.00
Strip-till, Mulch-till)410 Grade Stabilization Structure each 0.05 22.35412 Grassed Waterway acre 0.1 37.26600 Terrace feet 100 22.95
Total 101.08
3 0.1 328 Conservation Crop Rotation acre 1 6.52329A,B Residue Management (No-till & acre 1 12.00
Strip-till, Mulch-till)410 Grade Stabilization Structure each 0.005 2.24412 Grassed Waterway acre 0.05 18.63590 Nutrient Management acre 1 5.00620 Underground Outlet feet 30 22.35638 Water & Sediment Control Basin each 0.1 17.88
Total 84.62

D–9
Costs Associated with Development and Implementation of Comprehensive Nutrient Management Plans
Part I—Nutrient Management, Land Treatment, Manure and Wastewater Handling and Storage, and Recordkeeping
Table D–2 Conservation systems for cropland in Land Resource Region M—Continued
State and Conservation Proportion Practice Practice name Unit Amount Annualizederosion class system of acres code per acre cost per acre
number needingsystem
Michigan (continued)4 0.35 328 Conservation Crop Rotation acre 1 6.52
329A,B Residue Management (No-till & acre 1 12.00Strip-till, Mulch-till)
412 Grassed Waterway acre 0.05 18.63Total 37.15
5 0.2 328 Conservation Crop Rotation acre 1 6.52329A,B Residue Management (No-till & acre 1 12.00
Strip-till, Mulch-till)410 Grade Stabilization Structure each 0.005 2.24412 Grassed Waterway acre 0.05 18.63
Total 39.38Weighted total 61.50
2–4T 1 0.15 328 Conservation Crop Rotation acre 1 6.52329A,B Residue Management (No-till & acre 1 12.00
Strip-till, Mulch-till)410 Grade Stabilization Structure each 0.005 2.24412 Grassed Waterway acre 0.05 18.63620 Underground Outlet feet 30 22.35638 Water & Sediment Control Basin each 0.1 17.88
Total 79.62
2 0.2 328 Conservation Crop Rotation acre 1 6.52329A,B Residue Management (No-till & acre 1 12.00
Strip-till, Mulch-till)330 Contour Farming acre 0.5 5.38410 Grade Stabilization Structure each 0.05 22.35412 Grassed Waterway acre 0.05 18.63600 Terrace feet 100 22.95
Total 87.84
3 0.1 328 Conservation Crop Rotation acre 1 6.52329A,B Residue Management (No-till & acre 1 12.00
Strip-till, Mulch-till)330 Contour Farming acre 1 10.77412 Grassed Waterway acre 0.05 18.63585 Contour Strip-cropping acre 1 1.58620 Underground Outlet feet 30 22.35638 Water & Sediment Control Basin each 0.1 17.88
Total 89.73
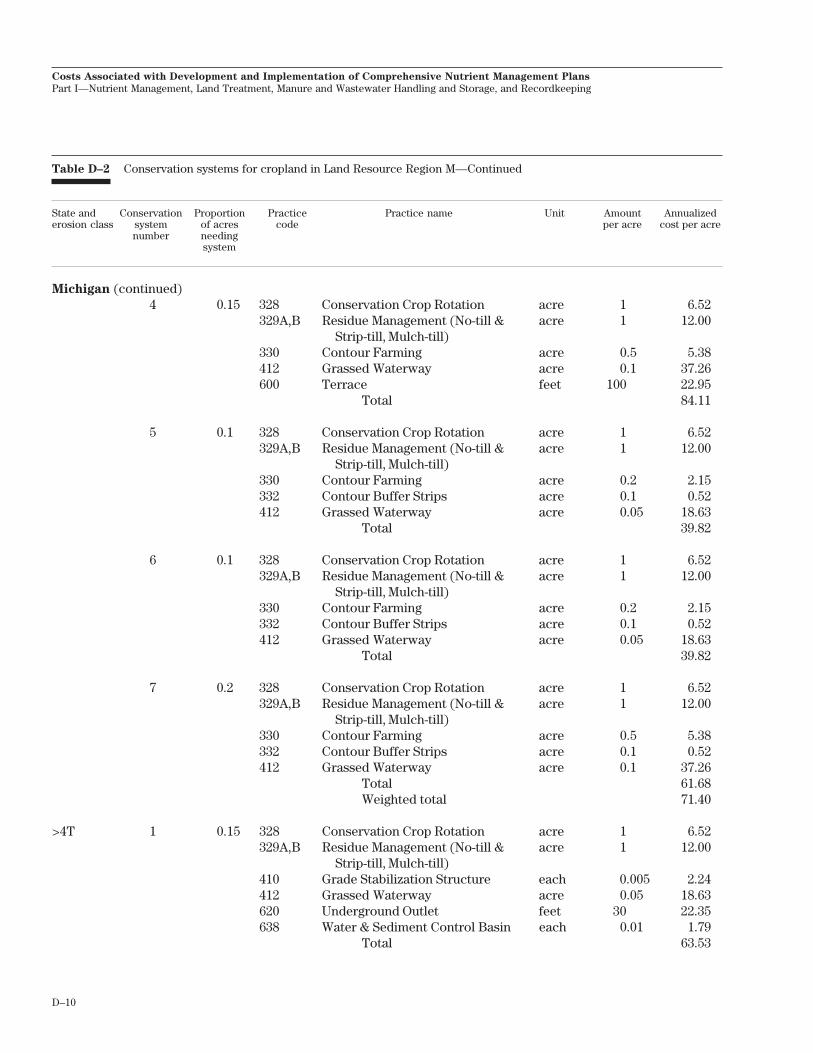
D–10
Costs Associated with Development and Implementation of Comprehensive Nutrient Management Plans
Part I—Nutrient Management, Land Treatment, Manure and Wastewater Handling and Storage, and Recordkeeping
Table D–2 Conservation systems for cropland in Land Resource Region M—Continued
State and Conservation Proportion Practice Practice name Unit Amount Annualizederosion class system of acres code per acre cost per acre
number needingsystem
Michigan (continued)4 0.15 328 Conservation Crop Rotation acre 1 6.52
329A,B Residue Management (No-till & acre 1 12.00Strip-till, Mulch-till)
330 Contour Farming acre 0.5 5.38412 Grassed Waterway acre 0.1 37.26600 Terrace feet 100 22.95
Total 84.11
5 0.1 328 Conservation Crop Rotation acre 1 6.52329A,B Residue Management (No-till & acre 1 12.00
Strip-till, Mulch-till)330 Contour Farming acre 0.2 2.15332 Contour Buffer Strips acre 0.1 0.52412 Grassed Waterway acre 0.05 18.63
Total 39.82
6 0.1 328 Conservation Crop Rotation acre 1 6.52329A,B Residue Management (No-till & acre 1 12.00
Strip-till, Mulch-till)330 Contour Farming acre 0.2 2.15332 Contour Buffer Strips acre 0.1 0.52412 Grassed Waterway acre 0.05 18.63
Total 39.82
7 0.2 328 Conservation Crop Rotation acre 1 6.52329A,B Residue Management (No-till & acre 1 12.00
Strip-till, Mulch-till)330 Contour Farming acre 0.5 5.38332 Contour Buffer Strips acre 0.1 0.52412 Grassed Waterway acre 0.1 37.26
Total 61.68Weighted total 71.40
>4T 1 0.15 328 Conservation Crop Rotation acre 1 6.52329A,B Residue Management (No-till & acre 1 12.00
Strip-till, Mulch-till)410 Grade Stabilization Structure each 0.005 2.24412 Grassed Waterway acre 0.05 18.63620 Underground Outlet feet 30 22.35638 Water & Sediment Control Basin each 0.01 1.79
Total 63.53

D–11
Costs Associated with Development and Implementation of Comprehensive Nutrient Management Plans
Part I—Nutrient Management, Land Treatment, Manure and Wastewater Handling and Storage, and Recordkeeping
Table D–2 Conservation systems for cropland in Land Resource Region M—Continued
SState and Conservation Proportion Practice Practice name Unit Amount Annualizederosion class system of acres code per acre cost per acre
number needingsystem
Michigan (continued)2 0.25 328 Conservation Crop Rotation acre 1 6.52
329A,B Residue Management (No-till & acre 1 12.00Strip-till, Mulch-till)
330 Contour Farming acre 0.5 5.38410 Grade Stabilization Structure each 0.05 22.35411 Grasses & Legumes in Rotation acre 1 0.00412 Grassed Waterway acre 0.1 37.26528A Prescribed Grazing acre 1 0.37
Total 83.88
3 0.15 328 Conservation Crop Rotation acre 1 6.52329A,B Residue Management (No-till & acre 1 12.00
Strip-till, Mulch-till)330 Contour Farming acre 0.5 5.38412 Grassed Waterway acre 0.1 37.26600 Terrace feet 120 27.54620 Underground Outlet feet 50 37.26
Total 125.96
4 0.2 328 Conservation Crop Rotation acre 1 6.52329A,B Residue Management (No-till & acre 1 12.00
Strip-till, Mulch-till)330 Contour Farming acre 0.75 8.07412 Grassed Waterway acre 0.05 18.63585 Contour Strip-cropping acre 0.75 1.18
Total 46.41
5 0.25 328 Conservation Crop Rotation acre 1 6.52329A,B Residue Management (No-till & acre 1 12.00
Strip-till, Mulch-till)330 Contour Farming acre 0.5 5.38412 Grassed Waterway acre 0.1 37.26600 Terrace feet 120 27.54620 Underground Outlet feet 50 37.26
Total 125.96Weighted total 90.16
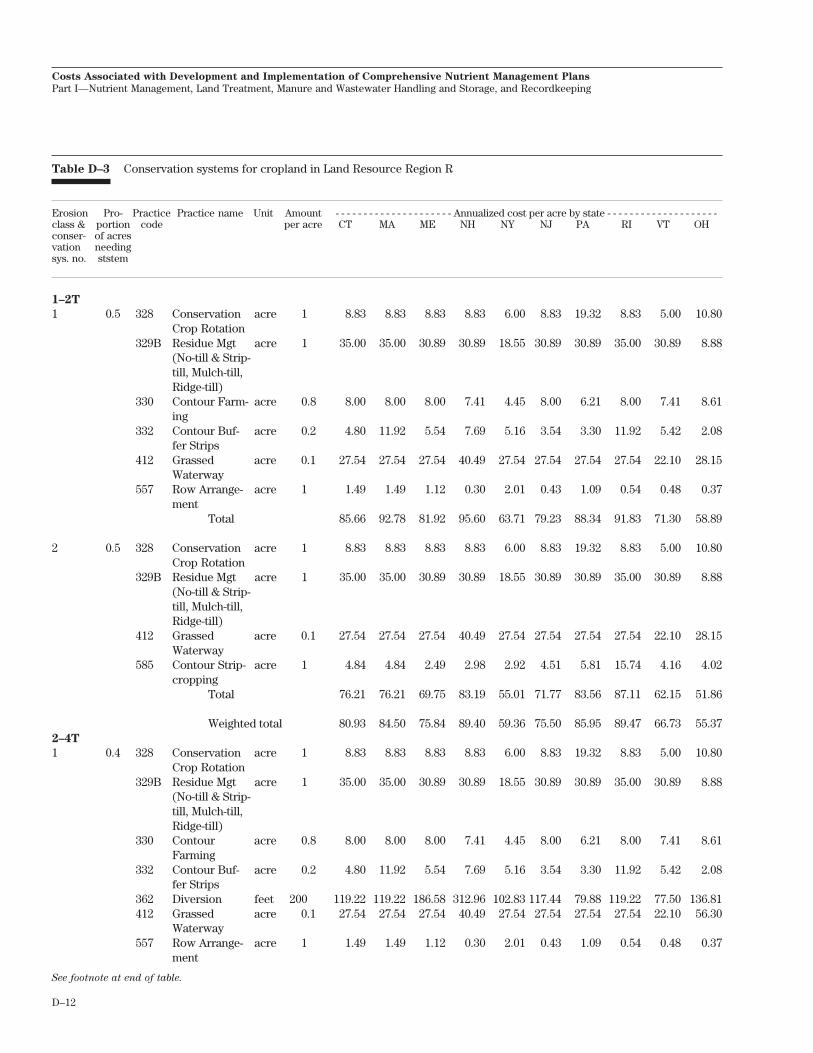
D–12
Costs Associated with Development and Implementation of Comprehensive Nutrient Management Plans
Part I—Nutrient Management, Land Treatment, Manure and Wastewater Handling and Storage, and Recordkeeping
Table D–3 Conservation systems for cropland in Land Resource Region R
Erosion Pro- Practice Practice name Unit Amount - - - - - - - - - - - - - - - - - - - - - Annualized cost per acre by state - - - - - - - - - - - - - - - - - - - -class & portion code per acre CT MA ME NH NY NJ PA RI VT OHconser- of acresvation needingsys. no. ststem
1–2T
1 0.5 328 Conservation acre 1 8.83 8.83 8.83 8.83 6.00 8.83 19.32 8.83 5.00 10.80Crop Rotation
329B Residue Mgt acre 1 35.00 35.00 30.89 30.89 18.55 30.89 30.89 35.00 30.89 8.88(No-till & Strip-till, Mulch-till,Ridge-till)
330 Contour Farm- acre 0.8 8.00 8.00 8.00 7.41 4.45 8.00 6.21 8.00 7.41 8.61ing
332 Contour Buf- acre 0.2 4.80 11.92 5.54 7.69 5.16 3.54 3.30 11.92 5.42 2.08fer Strips
412 Grassed acre 0.1 27.54 27.54 27.54 40.49 27.54 27.54 27.54 27.54 22.10 28.15Waterway
557 Row Arrange- acre 1 1.49 1.49 1.12 0.30 2.01 0.43 1.09 0.54 0.48 0.37ment
Total 85.66 92.78 81.92 95.60 63.71 79.23 88.34 91.83 71.30 58.89
2 0.5 328 Conservation acre 1 8.83 8.83 8.83 8.83 6.00 8.83 19.32 8.83 5.00 10.80Crop Rotation
329B Residue Mgt acre 1 35.00 35.00 30.89 30.89 18.55 30.89 30.89 35.00 30.89 8.88(No-till & Strip-till, Mulch-till,Ridge-till)
412 Grassed acre 0.1 27.54 27.54 27.54 40.49 27.54 27.54 27.54 27.54 22.10 28.15Waterway
585 Contour Strip- acre 1 4.84 4.84 2.49 2.98 2.92 4.51 5.81 15.74 4.16 4.02cropping
Total 76.21 76.21 69.75 83.19 55.01 71.77 83.56 87.11 62.15 51.86
Weighted total 80.93 84.50 75.84 89.40 59.36 75.50 85.95 89.47 66.73 55.372–4T
1 0.4 328 Conservation acre 1 8.83 8.83 8.83 8.83 6.00 8.83 19.32 8.83 5.00 10.80Crop Rotation
329B Residue Mgt acre 1 35.00 35.00 30.89 30.89 18.55 30.89 30.89 35.00 30.89 8.88(No-till & Strip-till, Mulch-till,Ridge-till)
330 Contour acre 0.8 8.00 8.00 8.00 7.41 4.45 8.00 6.21 8.00 7.41 8.61Farming
332 Contour Buf- acre 0.2 4.80 11.92 5.54 7.69 5.16 3.54 3.30 11.92 5.42 2.08fer Strips
362 Diversion feet 200 119.22 119.22 186.58 312.96 102.83 117.44 79.88 119.22 77.50 136.81412 Grassed acre 0.1 27.54 27.54 27.54 40.49 27.54 27.54 27.54 27.54 22.10 56.30
Waterway557 Row Arrange- acre 1 1.49 1.49 1.12 0.30 2.01 0.43 1.09 0.54 0.48 0.37
ment
See footnote at end of table.
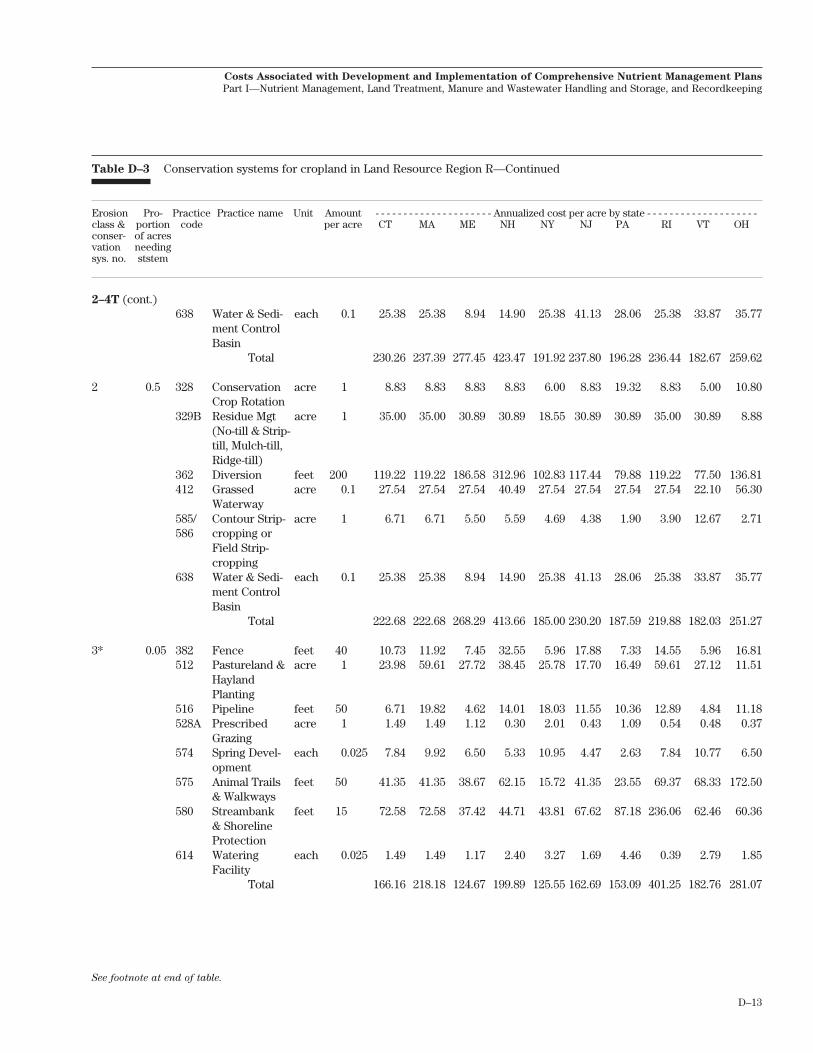
D–13
Costs Associated with Development and Implementation of Comprehensive Nutrient Management Plans
Part I—Nutrient Management, Land Treatment, Manure and Wastewater Handling and Storage, and Recordkeeping
Table D–3 Conservation systems for cropland in Land Resource Region R—Continued
Erosion Pro- Practice Practice name Unit Amount - - - - - - - - - - - - - - - - - - - - - Annualized cost per acre by state - - - - - - - - - - - - - - - - - - - -class & portion code per acre CT MA ME NH NY NJ PA RI VT OHconser- of acresvation needingsys. no. ststem
2–4T (cont.)638 Water & Sedi- each 0.1 25.38 25.38 8.94 14.90 25.38 41.13 28.06 25.38 33.87 35.77
ment ControlBasin
Total 230.26 237.39 277.45 423.47 191.92 237.80 196.28 236.44 182.67 259.62
2 0.5 328 Conservation acre 1 8.83 8.83 8.83 8.83 6.00 8.83 19.32 8.83 5.00 10.80Crop Rotation
329B Residue Mgt acre 1 35.00 35.00 30.89 30.89 18.55 30.89 30.89 35.00 30.89 8.88(No-till & Strip-till, Mulch-till,Ridge-till)
362 Diversion feet 200 119.22 119.22 186.58 312.96 102.83 117.44 79.88 119.22 77.50 136.81412 Grassed acre 0.1 27.54 27.54 27.54 40.49 27.54 27.54 27.54 27.54 22.10 56.30
Waterway585/ Contour Strip- acre 1 6.71 6.71 5.50 5.59 4.69 4.38 1.90 3.90 12.67 2.71586 cropping or
Field Strip-cropping
638 Water & Sedi- each 0.1 25.38 25.38 8.94 14.90 25.38 41.13 28.06 25.38 33.87 35.77ment ControlBasin
Total 222.68 222.68 268.29 413.66 185.00 230.20 187.59 219.88 182.03 251.27
3* 0.05 382 Fence feet 40 10.73 11.92 7.45 32.55 5.96 17.88 7.33 14.55 5.96 16.81512 Pastureland & acre 1 23.98 59.61 27.72 38.45 25.78 17.70 16.49 59.61 27.12 11.51
HaylandPlanting
516 Pipeline feet 50 6.71 19.82 4.62 14.01 18.03 11.55 10.36 12.89 4.84 11.18528A Prescribed acre 1 1.49 1.49 1.12 0.30 2.01 0.43 1.09 0.54 0.48 0.37
Grazing574 Spring Devel- each 0.025 7.84 9.92 6.50 5.33 10.95 4.47 2.63 7.84 10.77 6.50
opment575 Animal Trails feet 50 41.35 41.35 38.67 62.15 15.72 41.35 23.55 69.37 68.33 172.50
& Walkways580 Streambank feet 15 72.58 72.58 37.42 44.71 43.81 67.62 87.18 236.06 62.46 60.36
& ShorelineProtection
614 Watering each 0.025 1.49 1.49 1.17 2.40 3.27 1.69 4.46 0.39 2.79 1.85Facility
Total 166.16 218.18 124.67 199.89 125.55 162.69 153.09 401.25 182.76 281.07
See footnote at end of table.

D–14
Costs Associated with Development and Implementation of Comprehensive Nutrient Management Plans
Part I—Nutrient Management, Land Treatment, Manure and Wastewater Handling and Storage, and Recordkeeping
Table D–3 Conservation systems for cropland in Land Resource Region R—Continued
Erosion Pro- Practice Practice name Unit Amount - - - - - - - - - - - - - - - - - - - - - Annualized cost per acre by state - - - - - - - - - - - - - - - - - - - -class & portion code per acre CT MA ME NH NY NJ PA RI VT OHconser- of acresvation needingsys. no. ststem
2–4T (cont.)4* 0.05 378 Pond each 0.025 16.73 16.86 10.50 10.99 34.65 6.11 26.89 16.73 13.86 19.63
382 Fence feet 40 10.73 11.92 7.45 32.55 5.96 17.88 7.33 14.55 5.96 16.81512 Pastureland acre 1 23.98 59.61 27.72 38.45 25.78 17.70 16.49 59.61 27.12 11.51
& HaylandPlanting
516 Pipeline feet 50 6.71 19.82 4.62 14.01 18.03 11.55 10.36 12.89 4.84 11.18528A Prescribed acre 1 1.49 1.49 1.12 0.30 2.01 0.43 1.09 0.54 0.48 0.37
Grazing575 Animal Trails feet 50 41.35 41.35 38.67 62.15 15.72 41.35 23.55 69.37 68.33 172.50
& Walkways580 Streambank feet 15 72.58 72.58 37.42 44.71 43.81 67.62 87.18 236.06 62.46 60.36
& ShorelineProtection
614 Watering each 0.025 1.49 1.49 1.17 2.40 3.27 1.69 4.46 0.39 2.79 1.85Facility
Total 175.05 225.12 128.67 205.55 149.24 164.33 177.35 410.14 185.85 294.21
Weighted total 220.51 228.46 257.79 396.49 183.01 226.57 188.83 245.08 182.51 258.25
>4T
1 0.4 328 Conservation acre 1 8.83 8.83 8.83 8.83 6.00 8.83 19.32 8.83 5.00 10.80Crop Rotation
329B Residue Mgt acre 1 35.00 35.00 30.89 30.89 18.55 30.89 30.89 35.00 30.89 8.88(No-till & Strip-till, Mulch-till,Ridge-till)
330 Contour acre 0.8 8.00 8.00 8.00 7.41 4.45 8.00 6.21 8.00 7.41 8.61Farming
332 Contour Buf- acre 0.2 4.80 11.92 5.54 7.69 5.16 3.54 3.30 11.92 5.42 2.08fer Strips
340 Cover Crop acre 1 4.47 4.47 4.11 1.49 2.95 1.84 3.05 4.47 2.64 3.05362 Diversion feet 200 119.22 119.22 186.58 312.96 102.83 117.44 79.88 119.22 77.50 136.81412 Grassed acre 0.1 27.54 27.54 27.54 40.49 27.54 27.54 27.54 27.54 22.10 56.30
Waterway468 Lined Water- feet 25 86.33 85.69 120.94 25.48 47.80 60.43 39.38 47.54 55.74 428.37
way or Outlet638 Water & Sedi- each 0.1 25.38 25.38 8.94 14.90 25.38 41.13 28.06 25.38 33.87 35.77
ment ControlBasin
Total 319.57 326.06 401.37 450.14 240.66 299.64 237.62 287.91 240.56 690.68
See footnote at end of table.

D–15
Costs Associated with Development and Implementation of Comprehensive Nutrient Management Plans
Part I—Nutrient Management, Land Treatment, Manure and Wastewater Handling and Storage, and Recordkeeping
Table D–3 Conservation systems for cropland in Land Resource Region R—Continued
Erosion Pro- Practice Practice name Unit Amount - - - - - - - - - - - - - - - - - - - - - Annualized cost per acre by state - - - - - - - - - - - - - - - - - - - -class & portion code per acre CT MA ME NH NY NJ PA RI VT OHconser- of acresvation needingsys. no. ststem
>4T (cont.)2 0.4 328 Conservation acre 1 8.83 8.83 8.83 8.83 6.00 8.83 19.32 8.83 5.00 10.80
Crop Rotation329B Residue Mgt acre 1 35.00 35.00 30.89 30.89 18.55 30.89 30.89 35.00 30.89 8.88
(No-till & Strip-till, Mulch-till,Ridge-till)
330 Contour acre 0.8 8.00 8.00 8.00 7.41 4.45 8.00 6.21 8.00 7.41 8.61Farming
340 Cover Crop acre 1 4.47 4.47 4.11 1.49 2.95 1.84 3.05 4.47 2.64 3.05600 Terrace feet 210 125.18 125.18 107.79 107.79 117.36 78.24 161.49 62.59 107.79 108.24620 Underground feet 100 155.09 78.54 370.49 295.08 55.44 151.26 222.50 133.83 87.33 34.57
Outlet638 Water & Sedi- each 0.1 25.38 25.38 8.94 14.90 25.38 41.13 28.06 25.38 33.87 35.77
ment ControlBasin
Total 361.96 285.41 539.05 466.39 230.13 320.20 471.51 278.10 274.93 209.93
3* 0.1 382 Fence feet 40 10.73 11.92 7.45 32.55 5.96 17.88 7.33 14.55 5.96 16.81512 Pastureland acre 1 23.98 59.61 27.72 38.45 25.78 17.70 16.49 59.61 27.12 11.51
& HaylandPlanting
516 Pipeline feet 50 6.71 19.82 4.62 14.01 18.03 11.55 10.36 12.89 4.84 11.18528A Prescribed acre 1 1.49 1.49 1.12 0.30 2.01 0.43 1.09 0.54 0.48 0.37
Grazing574 Spring each 0.025 7.84 9.92 6.50 5.33 10.95 4.47 2.63 7.84 10.77 6.50
Development575 Animal Trails feet 50 41.35 41.35 38.67 62.15 15.72 41.35 23.55 69.37 68.33 172.50
& Walkways580 Streambank feet 15 72.58 72.58 37.42 44.71 43.81 67.62 87.18 236.06 62.46 60.36
& ShorelineProtection
614 Watering each 0.025 1.49 1.49 1.17 2.40 3.27 1.69 4.46 0.39 2.79 1.85Facility
Total 166.16 218.18 124.67 199.89 125.55 162.69 153.09 401.25 182.76 281.07
4* 0.1 378 Pond each 0.025 16.73 16.86 10.50 10.99 34.65 6.11 26.89 16.73 13.86 19.63382 Fence feet 40 10.73 11.92 7.45 32.55 5.96 17.88 7.33 14.55 5.96 16.81512 Pastureland acre 1 23.98 59.61 27.72 38.45 25.78 17.70 16.49 59.61 27.12 11.51
& HaylandPlanting
516 Pipeline feet 50 6.71 19.82 4.62 14.01 18.03 11.55 10.36 12.89 4.84 11.18528A Prescribed acre 1 1.49 1.49 1.12 0.30 2.01 0.43 1.09 0.54 0.48 0.37
Grazing
See footnote at end of table.
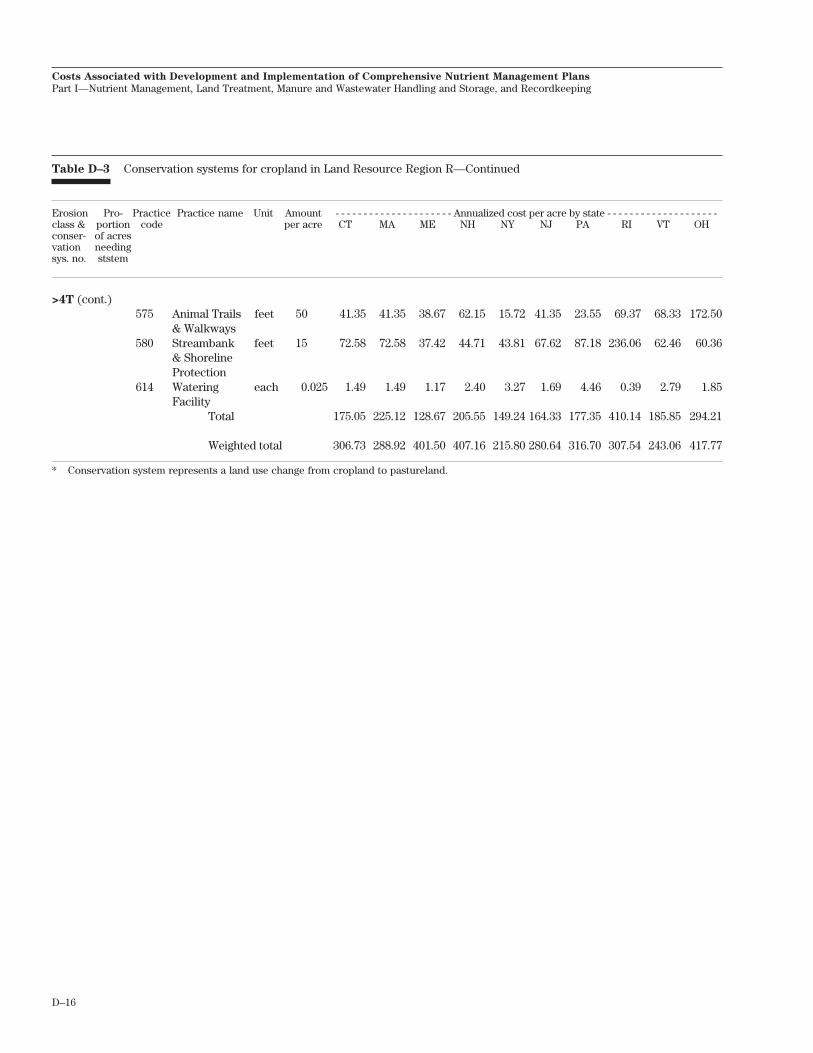
D–16
Costs Associated with Development and Implementation of Comprehensive Nutrient Management Plans
Part I—Nutrient Management, Land Treatment, Manure and Wastewater Handling and Storage, and Recordkeeping
Table D–3 Conservation systems for cropland in Land Resource Region R—Continued
Erosion Pro- Practice Practice name Unit Amount - - - - - - - - - - - - - - - - - - - - - Annualized cost per acre by state - - - - - - - - - - - - - - - - - - - -class & portion code per acre CT MA ME NH NY NJ PA RI VT OHconser- of acresvation needingsys. no. ststem
>4T (cont.)575 Animal Trails feet 50 41.35 41.35 38.67 62.15 15.72 41.35 23.55 69.37 68.33 172.50
& Walkways580 Streambank feet 15 72.58 72.58 37.42 44.71 43.81 67.62 87.18 236.06 62.46 60.36
& ShorelineProtection
614 Watering each 0.025 1.49 1.49 1.17 2.40 3.27 1.69 4.46 0.39 2.79 1.85Facility
Total 175.05 225.12 128.67 205.55 149.24 164.33 177.35 410.14 185.85 294.21
Weighted total 306.73 288.92 401.50 407.16 215.80 280.64 316.70 307.54 243.06 417.77
* Conservation system represents a land use change from cropland to pastureland.

E–1
Appendix E CNMP Needs and Costs for Manureand Wastewater Storage and Handling
Table E–1 CNMP needs and costs for manure and wastewater handling and storage, by representative farm and component
Representative farm and component Model farm Model farm CNMP Cost unit Capital Operatingregion size class needs cost per cost per
(AU) (%) unit ($) unit ($)
Fattened cattle #1: scrape and stack
Lot upgrade All All 15 Head 5.09 0.00Grassed waterway diversion All All 15 Head .08–.20 0.00Solids collection All All 10 Solids tons 6.20 5.70Solids storage Northeast >35 25 Solids tons 3.50 0.00
Southeast >35 25 Solids tons 1.75 0.00Midwest 35–500 25 Solids tons 3.50 0.00
Contaminated runoff collection Northeast >35 40 Head 0.56–1.31 0.00Southeast >35 55 Head 0.56–1.31 0.00Midwest 35–500 40 Head 0.56–1.31 0.00
Runoff storage pond Northeast >35 40 AU 25.92 0.00Southeast >35 50 AU 26.23 0.00Midwest 35–500 40 AU 20.23 0.00
Liquid transfer Northeast >35 40 Liquid tons 0.20–0.40 0.06Southeast >35 50 Liquid tons 0.20–0.40 0.06Midwest 35–500 40 Liquid tons 0.20–0.40 0.06
Settling basin Northeast >35 40 AU 2.01–5.49 0.00Southeast >35 50 AU 2.01–5.49 0.00Midwest 35–500 40 AU 2.01–5.49 0.00
Fattened cattle #2: manure pack
Lot upgrade Southeast >35 30 Head 5.09 0.00Midwest 35–500 30 Head 5.09 0.00Midwest >500 5 Head 5.09 0.00Northern Plains 35–500 30 Head 5.09 0.00Northern Plains >500 5 Head 5.09 0.00Central Plains 35–1,000 30 Head 5.09 0.00Central Plains >1,000 5 Head 5.09 0.00West 35–500 30 Head 5.09 0.00West >500 5 Head 5.09 0.00
Earth berm, undergound outlet Southeast >35 20 Head 3.58–5.07 0.00Midwest 35–500 20 Head 3.58–5.07 0.00Midwest >500 10 Head 3.58–5.07 0.00Northern Plains 35–500 20 Head 3.58–5.07 0.00Northern Plains >500 10 Head 3.58–5.07 0.00Central Plains 35–1,000 20 Head 3.58–5.07 0.00Central Plains >1,000 10 Head 3.58–5.07 0.00West 35–500 20 Head 3.58–5.07 0.00West >500 10 Head 3.58–5.07 0.00
Solids collection All All 10 Solids tons 6.20 5.70
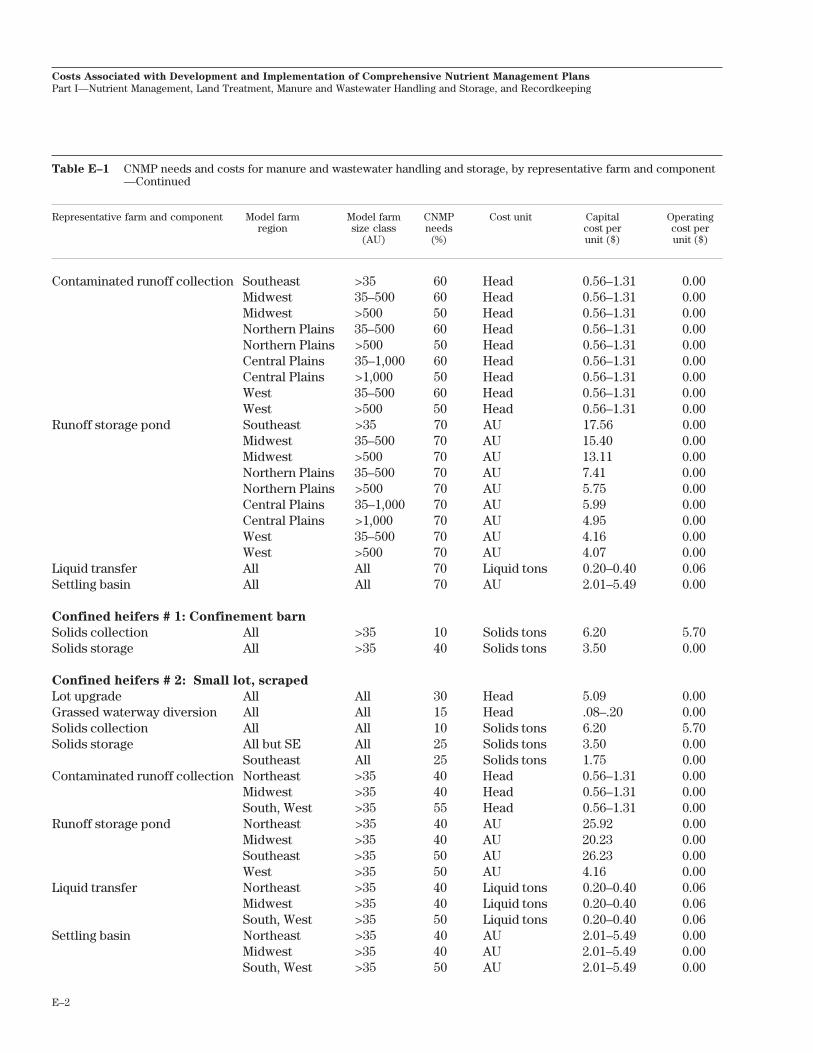
E–2
Costs Associated with Development and Implementation of Comprehensive Nutrient Management Plans
Part I—Nutrient Management, Land Treatment, Manure and Wastewater Handling and Storage, and Recordkeeping
Table E–1 CNMP needs and costs for manure and wastewater handling and storage, by representative farm and component—Continued
Representative farm and component Model farm Model farm CNMP Cost unit Capital Operatingregion size class needs cost per cost per
(AU) (%) unit ($) unit ($)
Contaminated runoff collection Southeast >35 60 Head 0.56–1.31 0.00Midwest 35–500 60 Head 0.56–1.31 0.00Midwest >500 50 Head 0.56–1.31 0.00Northern Plains 35–500 60 Head 0.56–1.31 0.00Northern Plains >500 50 Head 0.56–1.31 0.00Central Plains 35–1,000 60 Head 0.56–1.31 0.00Central Plains >1,000 50 Head 0.56–1.31 0.00West 35–500 60 Head 0.56–1.31 0.00West >500 50 Head 0.56–1.31 0.00
Runoff storage pond Southeast >35 70 AU 17.56 0.00Midwest 35–500 70 AU 15.40 0.00Midwest >500 70 AU 13.11 0.00Northern Plains 35–500 70 AU 7.41 0.00Northern Plains >500 70 AU 5.75 0.00Central Plains 35–1,000 70 AU 5.99 0.00Central Plains >1,000 70 AU 4.95 0.00West 35–500 70 AU 4.16 0.00West >500 70 AU 4.07 0.00
Liquid transfer All All 70 Liquid tons 0.20–0.40 0.06Settling basin All All 70 AU 2.01–5.49 0.00
Confined heifers # 1: Confinement barn
Solids collection All >35 10 Solids tons 6.20 5.70Solids storage All >35 40 Solids tons 3.50 0.00
Confined heifers # 2: Small lot, scraped
Lot upgrade All All 30 Head 5.09 0.00Grassed waterway diversion All All 15 Head .08–.20 0.00Solids collection All All 10 Solids tons 6.20 5.70Solids storage All but SE All 25 Solids tons 3.50 0.00
Southeast All 25 Solids tons 1.75 0.00Contaminated runoff collection Northeast >35 40 Head 0.56–1.31 0.00
Midwest >35 40 Head 0.56–1.31 0.00South, West >35 55 Head 0.56–1.31 0.00
Runoff storage pond Northeast >35 40 AU 25.92 0.00Midwest >35 40 AU 20.23 0.00Southeast >35 50 AU 26.23 0.00West >35 50 AU 4.16 0.00
Liquid transfer Northeast >35 40 Liquid tons 0.20–0.40 0.06Midwest >35 40 Liquid tons 0.20–0.40 0.06South, West >35 50 Liquid tons 0.20–0.40 0.06
Settling basin Northeast >35 40 AU 2.01–5.49 0.00Midwest >35 40 AU 2.01–5.49 0.00South, West >35 50 AU 2.01–5.49 0.00
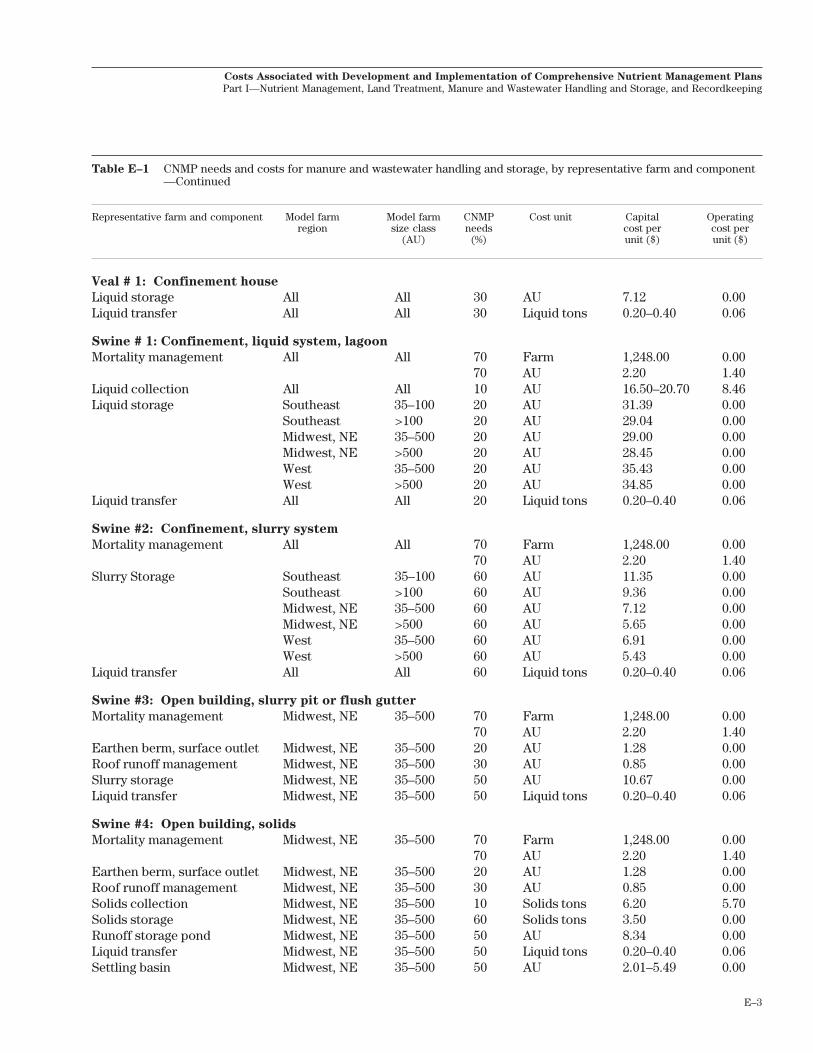
E–3
Costs Associated with Development and Implementation of Comprehensive Nutrient Management Plans
Part I—Nutrient Management, Land Treatment, Manure and Wastewater Handling and Storage, and Recordkeeping
Table E–1 CNMP needs and costs for manure and wastewater handling and storage, by representative farm and component—Continued
Representative farm and component Model farm Model farm CNMP Cost unit Capital Operatingregion size class needs cost per cost per
(AU) (%) unit ($) unit ($)
Veal # 1: Confinement house
Liquid storage All All 30 AU 7.12 0.00Liquid transfer All All 30 Liquid tons 0.20–0.40 0.06
Swine # 1: Confinement, liquid system, lagoon
Mortality management All All 70 Farm 1,248.00 0.0070 AU 2.20 1.40
Liquid collection All All 10 AU 16.50–20.70 8.46Liquid storage Southeast 35–100 20 AU 31.39 0.00
Southeast >100 20 AU 29.04 0.00Midwest, NE 35–500 20 AU 29.00 0.00Midwest, NE >500 20 AU 28.45 0.00West 35–500 20 AU 35.43 0.00West >500 20 AU 34.85 0.00
Liquid transfer All All 20 Liquid tons 0.20–0.40 0.06
Swine #2: Confinement, slurry system
Mortality management All All 70 Farm 1,248.00 0.0070 AU 2.20 1.40
Slurry Storage Southeast 35–100 60 AU 11.35 0.00Southeast >100 60 AU 9.36 0.00Midwest, NE 35–500 60 AU 7.12 0.00Midwest, NE >500 60 AU 5.65 0.00West 35–500 60 AU 6.91 0.00West >500 60 AU 5.43 0.00
Liquid transfer All All 60 Liquid tons 0.20–0.40 0.06
Swine #3: Open building, slurry pit or flush gutter
Mortality management Midwest, NE 35–500 70 Farm 1,248.00 0.0070 AU 2.20 1.40
Earthen berm, surface outlet Midwest, NE 35–500 20 AU 1.28 0.00Roof runoff management Midwest, NE 35–500 30 AU 0.85 0.00Slurry storage Midwest, NE 35–500 50 AU 10.67 0.00Liquid transfer Midwest, NE 35–500 50 Liquid tons 0.20–0.40 0.06
Swine #4: Open building, solids
Mortality management Midwest, NE 35–500 70 Farm 1,248.00 0.0070 AU 2.20 1.40
Earthen berm, surface outlet Midwest, NE 35–500 20 AU 1.28 0.00Roof runoff management Midwest, NE 35–500 30 AU 0.85 0.00Solids collection Midwest, NE 35–500 10 Solids tons 6.20 5.70Solids storage Midwest, NE 35–500 60 Solids tons 3.50 0.00Runoff storage pond Midwest, NE 35–500 50 AU 8.34 0.00Liquid transfer Midwest, NE 35–500 50 Liquid tons 0.20–0.40 0.06Settling basin Midwest, NE 35–500 50 AU 2.01–5.49 0.00

E–4
Costs Associated with Development and Implementation of Comprehensive Nutrient Management Plans
Part I—Nutrient Management, Land Treatment, Manure and Wastewater Handling and Storage, and Recordkeeping
Table E–1 CNMP needs and costs for manure and wastewater handling and storage, by representative farm and component—Continued
Representative farm and component Model farm Model farm CNMP Cost unit Capital Operatingregion size class needs cost per cost per
(AU) (%) unit ($) unit ($)
Swine #5: Pasture or lot
Mortality management All All 70 Farm 1,248.00 0.0070 AU 2.20 1.40
Earthen berm, surface outlet All All 50 AU 1.28 0.00Solids collection All All 10 Solids tons 6.20 5.70Contaminated runoff collection Southeast 35–100 50 AU 1.28 0.00
West 35–500 50 AU 1.28 0.00Runoff storage pond Southeast 35–100 50 AU 9.53 0.00
West 35–500 50 AU 4.61 0.00Liquid transfer All All 50 Liquid tons 0.20–0.40 0.06Settling basin All All 50 AU 2.01–5.49 0.00
Layer #1: High rise and shallow pit
Mortality management All 35–400 45 House 82.00 371.00All >400 15 House 82.00 371.00
Solids collection All All 10 House 0.00 1,272.00Solids storage All but NE 35–400 55 Solids tons 7.00 0.00
All but NE >400 30 Solids tons 7.00 0.00Northeast 35–400 40 Solids tons 7.00 0.00Northeast >400 20 Solids tons 7.00 0.00
Layer #2: Flush system to lagoon
Mortality management All 35–400 45 House 82.00 371.00All >400 15 House 82.00 371.00
Liquid collection All All 10 House 3,157.00 1,291.00Liquid storage Southeast 35–400 40 House 15,770.00 0.00
Southeast >400 20 House 14,818.00 0.00South Central >400 20 House 14,188.00 0.00
Liquid transfer All <400 40 Liquid tons 0.20–0.40 0.06All >400 20 Liquid tons 0.20–0.40 0.06
Layer #3: Manure belt or scraper system
Mortality management All 35–400 15 House 82.00 371.00All >400 15 House 82.00 371.00
Solids collection All All 10 House 0.00 1,956.00Solids storage All but NE 35–400 55 Solids tons 7.00 0.00
All but NE >400 55 Solids tons 7.00 0.00Northeast 35–400 40 Solids tons 7.00 0.00Northeast >400 20 Solids tons 7.00 0.00
Broilers #1: Broiler house
Mortality management All <220 45 House 140.00 633.00>220 15 House 140.00 633.00
Solids collection All All 2 House 0.00 1,060.00
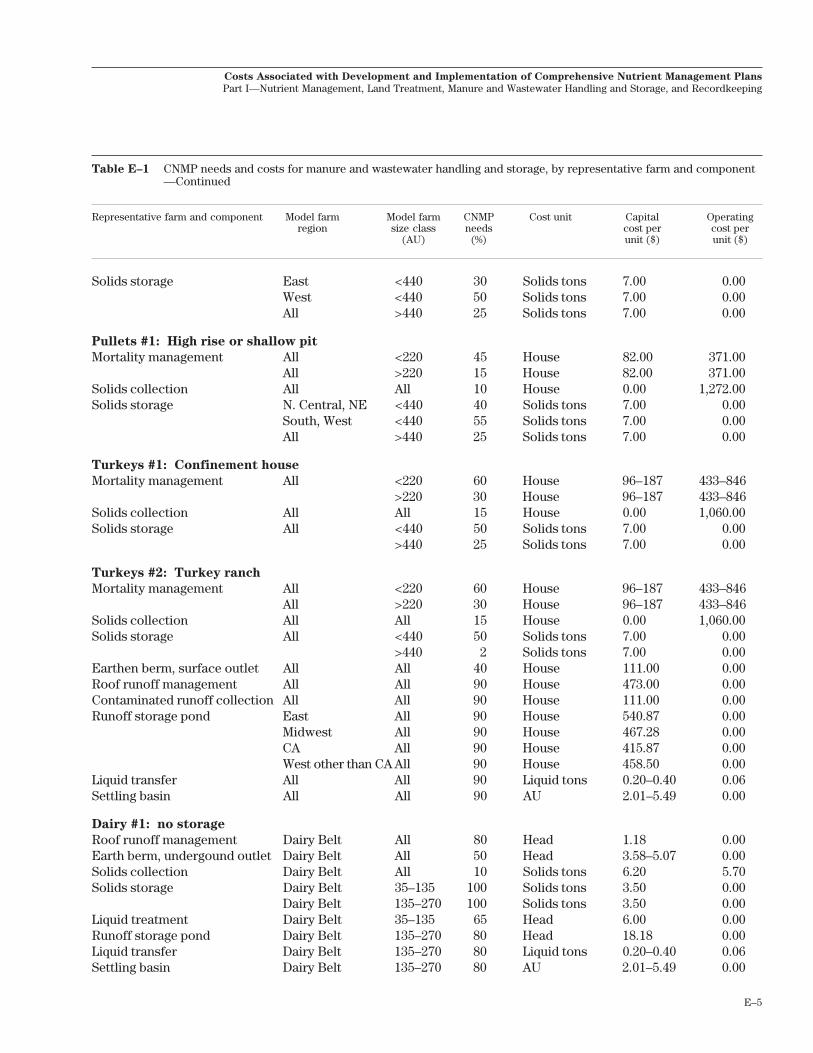
E–5
Costs Associated with Development and Implementation of Comprehensive Nutrient Management Plans
Part I—Nutrient Management, Land Treatment, Manure and Wastewater Handling and Storage, and Recordkeeping
Table E–1 CNMP needs and costs for manure and wastewater handling and storage, by representative farm and component—Continued
Representative farm and component Model farm Model farm CNMP Cost unit Capital Operatingregion size class needs cost per cost per
(AU) (%) unit ($) unit ($)
Solids storage East <440 30 Solids tons 7.00 0.00West <440 50 Solids tons 7.00 0.00All >440 25 Solids tons 7.00 0.00
Pullets #1: High rise or shallow pit
Mortality management All <220 45 House 82.00 371.00All >220 15 House 82.00 371.00
Solids collection All All 10 House 0.00 1,272.00Solids storage N. Central, NE <440 40 Solids tons 7.00 0.00
South, West <440 55 Solids tons 7.00 0.00All >440 25 Solids tons 7.00 0.00
Turkeys #1: Confinement house
Mortality management All <220 60 House 96–187 433–846>220 30 House 96–187 433–846
Solids collection All All 15 House 0.00 1,060.00Solids storage All <440 50 Solids tons 7.00 0.00
>440 25 Solids tons 7.00 0.00
Turkeys #2: Turkey ranch
Mortality management All <220 60 House 96–187 433–846All >220 30 House 96–187 433–846
Solids collection All All 15 House 0.00 1,060.00Solids storage All <440 50 Solids tons 7.00 0.00
>440 2 Solids tons 7.00 0.00Earthen berm, surface outlet All All 40 House 111.00 0.00Roof runoff management All All 90 House 473.00 0.00Contaminated runoff collection All All 90 House 111.00 0.00Runoff storage pond East All 90 House 540.87 0.00
Midwest All 90 House 467.28 0.00CA All 90 House 415.87 0.00West other than CA All 90 House 458.50 0.00
Liquid transfer All All 90 Liquid tons 0.20–0.40 0.06Settling basin All All 90 AU 2.01–5.49 0.00
Dairy #1: no storage
Roof runoff management Dairy Belt All 80 Head 1.18 0.00Earth berm, undergound outlet Dairy Belt All 50 Head 3.58–5.07 0.00Solids collection Dairy Belt All 10 Solids tons 6.20 5.70Solids storage Dairy Belt 35–135 100 Solids tons 3.50 0.00
Dairy Belt 135–270 100 Solids tons 3.50 0.00Liquid treatment Dairy Belt 35–135 65 Head 6.00 0.00Runoff storage pond Dairy Belt 135–270 80 Head 18.18 0.00Liquid transfer Dairy Belt 135–270 80 Liquid tons 0.20–0.40 0.06Settling basin Dairy Belt 135–270 80 AU 2.01–5.49 0.00
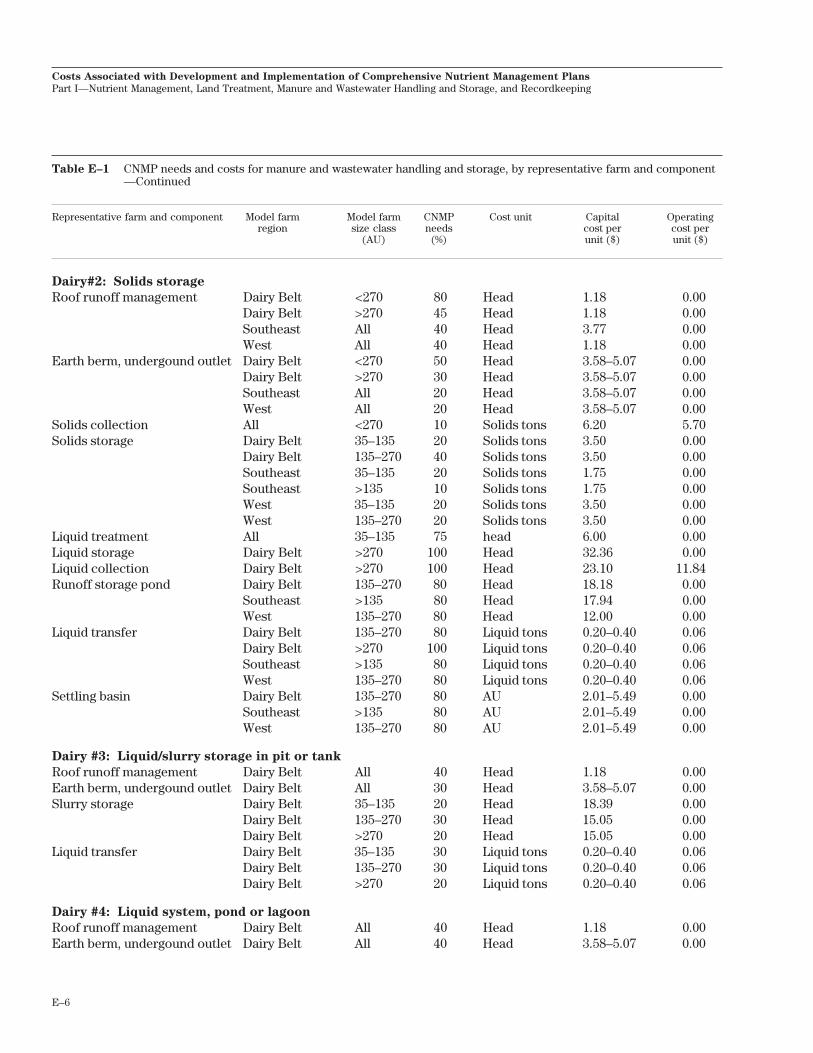
E–6
Costs Associated with Development and Implementation of Comprehensive Nutrient Management Plans
Part I—Nutrient Management, Land Treatment, Manure and Wastewater Handling and Storage, and Recordkeeping
Table E–1 CNMP needs and costs for manure and wastewater handling and storage, by representative farm and component—Continued
Representative farm and component Model farm Model farm CNMP Cost unit Capital Operatingregion size class needs cost per cost per
(AU) (%) unit ($) unit ($)
Dairy#2: Solids storage
Roof runoff management Dairy Belt <270 80 Head 1.18 0.00Dairy Belt >270 45 Head 1.18 0.00Southeast All 40 Head 3.77 0.00West All 40 Head 1.18 0.00
Earth berm, undergound outlet Dairy Belt <270 50 Head 3.58–5.07 0.00Dairy Belt >270 30 Head 3.58–5.07 0.00Southeast All 20 Head 3.58–5.07 0.00West All 20 Head 3.58–5.07 0.00
Solids collection All <270 10 Solids tons 6.20 5.70Solids storage Dairy Belt 35–135 20 Solids tons 3.50 0.00
Dairy Belt 135–270 40 Solids tons 3.50 0.00Southeast 35–135 20 Solids tons 1.75 0.00Southeast >135 10 Solids tons 1.75 0.00West 35–135 20 Solids tons 3.50 0.00West 135–270 20 Solids tons 3.50 0.00
Liquid treatment All 35–135 75 head 6.00 0.00Liquid storage Dairy Belt >270 100 Head 32.36 0.00Liquid collection Dairy Belt >270 100 Head 23.10 11.84Runoff storage pond Dairy Belt 135–270 80 Head 18.18 0.00
Southeast >135 80 Head 17.94 0.00West 135–270 80 Head 12.00 0.00
Liquid transfer Dairy Belt 135–270 80 Liquid tons 0.20–0.40 0.06Dairy Belt >270 100 Liquid tons 0.20–0.40 0.06Southeast >135 80 Liquid tons 0.20–0.40 0.06West 135–270 80 Liquid tons 0.20–0.40 0.06
Settling basin Dairy Belt 135–270 80 AU 2.01–5.49 0.00Southeast >135 80 AU 2.01–5.49 0.00West 135–270 80 AU 2.01–5.49 0.00
Dairy #3: Liquid/slurry storage in pit or tank
Roof runoff management Dairy Belt All 40 Head 1.18 0.00Earth berm, undergound outlet Dairy Belt All 30 Head 3.58–5.07 0.00Slurry storage Dairy Belt 35–135 20 Head 18.39 0.00
Dairy Belt 135–270 30 Head 15.05 0.00Dairy Belt >270 20 Head 15.05 0.00
Liquid transfer Dairy Belt 35–135 30 Liquid tons 0.20–0.40 0.06Dairy Belt 135–270 30 Liquid tons 0.20–0.40 0.06Dairy Belt >270 20 Liquid tons 0.20–0.40 0.06
Dairy #4: Liquid system, pond or lagoon
Roof runoff management Dairy Belt All 40 Head 1.18 0.00Earth berm, undergound outlet Dairy Belt All 40 Head 3.58–5.07 0.00
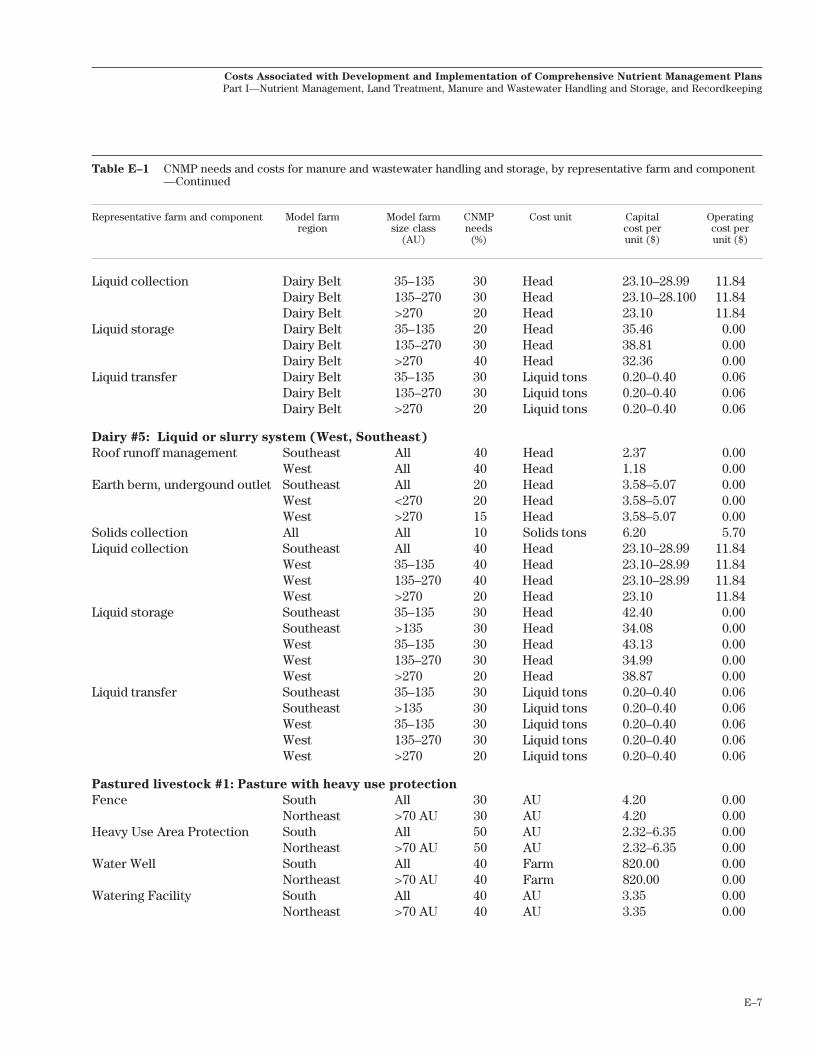
E–7
Costs Associated with Development and Implementation of Comprehensive Nutrient Management Plans
Part I—Nutrient Management, Land Treatment, Manure and Wastewater Handling and Storage, and Recordkeeping
Table E–1 CNMP needs and costs for manure and wastewater handling and storage, by representative farm and component—Continued
Representative farm and component Model farm Model farm CNMP Cost unit Capital Operatingregion size class needs cost per cost per
(AU) (%) unit ($) unit ($)
Liquid collection Dairy Belt 35–135 30 Head 23.10–28.99 11.84Dairy Belt 135–270 30 Head 23.10–28.100 11.84Dairy Belt >270 20 Head 23.10 11.84
Liquid storage Dairy Belt 35–135 20 Head 35.46 0.00Dairy Belt 135–270 30 Head 38.81 0.00Dairy Belt >270 40 Head 32.36 0.00
Liquid transfer Dairy Belt 35–135 30 Liquid tons 0.20–0.40 0.06Dairy Belt 135–270 30 Liquid tons 0.20–0.40 0.06Dairy Belt >270 20 Liquid tons 0.20–0.40 0.06
Dairy #5: Liquid or slurry system (West, Southeast)
Roof runoff management Southeast All 40 Head 2.37 0.00West All 40 Head 1.18 0.00
Earth berm, undergound outlet Southeast All 20 Head 3.58–5.07 0.00West <270 20 Head 3.58–5.07 0.00West >270 15 Head 3.58–5.07 0.00
Solids collection All All 10 Solids tons 6.20 5.70Liquid collection Southeast All 40 Head 23.10–28.99 11.84
West 35–135 40 Head 23.10–28.99 11.84West 135–270 40 Head 23.10–28.99 11.84West >270 20 Head 23.10 11.84
Liquid storage Southeast 35–135 30 Head 42.40 0.00Southeast >135 30 Head 34.08 0.00West 35–135 30 Head 43.13 0.00West 135–270 30 Head 34.99 0.00West >270 20 Head 38.87 0.00
Liquid transfer Southeast 35–135 30 Liquid tons 0.20–0.40 0.06Southeast >135 30 Liquid tons 0.20–0.40 0.06West 35–135 30 Liquid tons 0.20–0.40 0.06West 135–270 30 Liquid tons 0.20–0.40 0.06West >270 20 Liquid tons 0.20–0.40 0.06
Pastured livestock #1: Pasture with heavy use protection
Fence South All 30 AU 4.20 0.00Northeast >70 AU 30 AU 4.20 0.00
Heavy Use Area Protection South All 50 AU 2.32–6.35 0.00Northeast >70 AU 50 AU 2.32–6.35 0.00
Water Well South All 40 Farm 820.00 0.00Northeast >70 AU 40 Farm 820.00 0.00
Watering Facility South All 40 AU 3.35 0.00Northeast >70 AU 40 AU 3.35 0.00
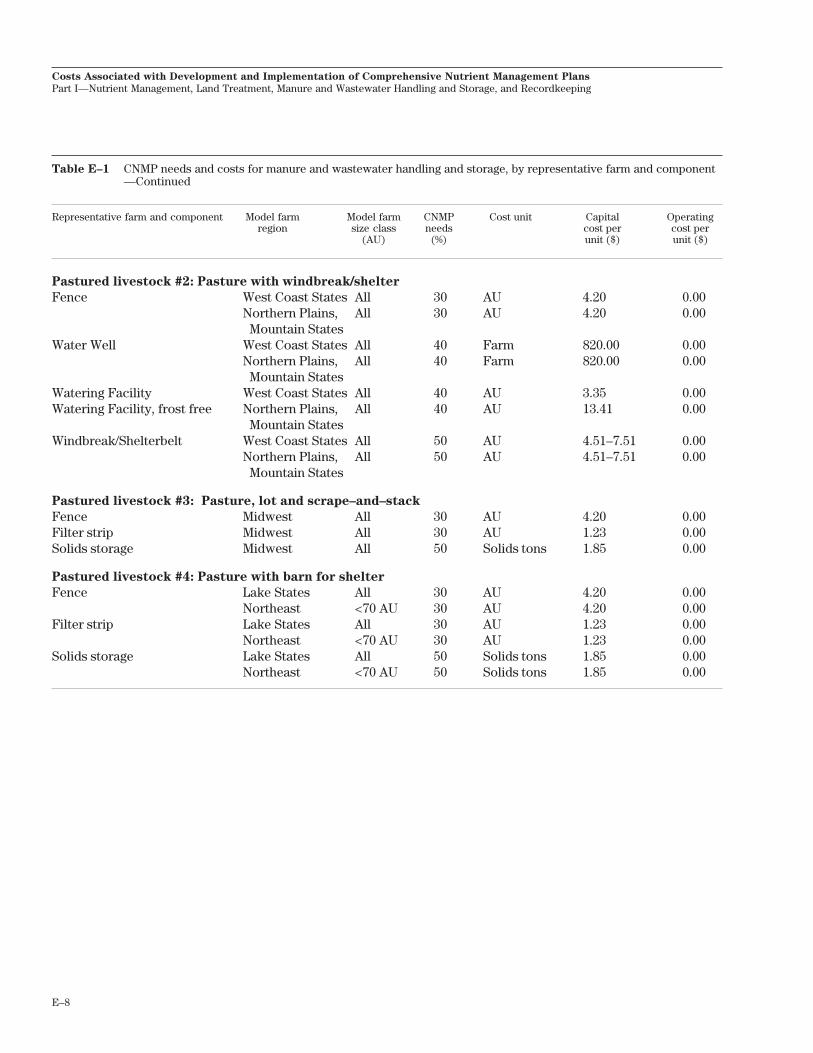
E–8
Costs Associated with Development and Implementation of Comprehensive Nutrient Management Plans
Part I—Nutrient Management, Land Treatment, Manure and Wastewater Handling and Storage, and Recordkeeping
Table E–1 CNMP needs and costs for manure and wastewater handling and storage, by representative farm and component—Continued
Representative farm and component Model farm Model farm CNMP Cost unit Capital Operatingregion size class needs cost per cost per
(AU) (%) unit ($) unit ($)
Pastured livestock #2: Pasture with windbreak/shelter
Fence West Coast States All 30 AU 4.20 0.00Northern Plains, All 30 AU 4.20 0.00
Mountain StatesWater Well West Coast States All 40 Farm 820.00 0.00
Northern Plains, All 40 Farm 820.00 0.00Mountain States
Watering Facility West Coast States All 40 AU 3.35 0.00Watering Facility, frost free Northern Plains, All 40 AU 13.41 0.00
Mountain StatesWindbreak/Shelterbelt West Coast States All 50 AU 4.51–7.51 0.00
Northern Plains, All 50 AU 4.51–7.51 0.00Mountain States
Pastured livestock #3: Pasture, lot and scrape–and–stack
Fence Midwest All 30 AU 4.20 0.00Filter strip Midwest All 30 AU 1.23 0.00Solids storage Midwest All 50 Solids tons 1.85 0.00
Pastured livestock #4: Pasture with barn for shelter
Fence Lake States All 30 AU 4.20 0.00Northeast <70 AU 30 AU 4.20 0.00
Filter strip Lake States All 30 AU 1.23 0.00Northeast <70 AU 30 AU 1.23 0.00
Solids storage Lake States All 50 Solids tons 1.85 0.00Northeast <70 AU 50 Solids tons 1.85 0.00