Embed Size (px)
Citation preview

Costs of Discrimination – Philip Gounev This is only a draft paper and can be quoted only with the author’s permission.
Created on 8/1/2004 4:37:00 PM 1
Costs of Discrimination and Government Spending on
Minorities
I. Introduction
During the forty years of communist regime in Bulgaria the government implemented a number of housing, education, and social policies, aiming to "integrate" the Roma minority. These ill-advised policies had little or a negative effects. Since 1989 successive governments in Bulgaria have done little to improve the livelihoods of the Roma. The adoption, in 1999 of a Framework Program for Equal Integration of the Roma in Bulgarian Society has not resulted on comprehensive policies. While the economic and social costs that the Roma minority has paid are quite obvious and have attracted lots of research and attention, none has really addressed the issue of the effects this inaction has had on the state budget and consequently on the national economy.
Unemployed and undereducated Roma pay less taxes, end up more often in prison, become dependent on a range of social benefits, repeat school grades, use much more often emergency and in-patient healthcare services. On the other hand they live much shorter and hardly ever reach retirement age to receive retirement benefits. They use the school system for only about five years, while the Bulgarians use it for ten years. The bottom line, though, is that in the long-term investing in social and economic development of the Roma would pay off as this would increase the state’s tax revenues and would reduce much of its social spending. The overall benefits to the society will be even greater.
II. Literature Review (this section would probably serve if there is some sort of academic publication, and won’t make it into the policy paper. For now it is simply a background research that helped me position my research a bit better and put my thoughts together). Economic Costs
When dealing with economic cost of discrimination, emphasis in the literature is frequently placed on male-female differentials. However, the issues and analyses in the literature are equally applicable, with appropriate adjustments, to ethnic discrimination.
The costs of discrimination are both individual and social. The U.S. Joint Economic Committee C1980) estimated the loss in GDP due to racial discrimination to be about 4 % of GPD. Another study, done by Estelle James, which is more analytical in nature, places the loss due to gender discrimination at about 3 % of GDP. According to Sharp, Register and Grimes (1996) race and gender discrimination reduced the nation's output by more than $450 billion in 1994. If other types of discrimination are calculated in, the number could easily exceed one-half of a trillion dollars per year.
Although most countries are committed to getting rid of discrimination, the degree of commitment and level of legal enforcement of anti-discrimination legislation

Costs of Discrimination – Philip Gounev This is only a draft paper and can be quoted only with the author’s permission.
Created on 8/1/2004 4:37:00 PM 2
varies significantly by nation. In the U.S., workplace lawsuits continue to soar with 40,000 filed each year.
Bates (2000) notes, that some early research in the study of costs associated with workplace inequity, although concerning the companies, not the government, include Bergmann's (1971) and Agarwal's (1982) examination of macro economic costs and Gary Becker's (1971), Ashenfelter and Pencavel's (1976) and Dunnette and Motowidlo's (1982) micro or firm level analysis. In describing the macro level costs Agarwal noted:
"...under-utilization of the minority labor force can cause a serious loss of potential national output. It can also prevent the labor market from efficiently correcting demand and supply imbalances...this in turn can cause higher rates of inflation...(and) can also produce a higher incidence of poverty among minority workers, necessitating higher social assistance costs."
Becker's model, in its basic form, provides us with a model of the effects rather than
the causes of discrimination. According to Becker, if the male and female wages were equal, the employer in Becker's model would maximize utility by hiring only male workers. If, however, female wages are lower than those of male workers the higher the proportion of men in the labor force the lower will be the employer's profits. This illustrates one of the central insights offered by Becker's model: namely, that an employer who exercises a taste for discrimination must "either pay or forfeit income for this privilege" (Becker, 1957, p. 14).
One further problem worth mentioning is that Becker's model predicts that, over the long run, discriminating employers will be driven out of business by the (money) cost minimizing non-discriminating employers, implying that discriminatory wage differentials will tend to disappear over time, a prediction which is at odds with the balance of the empirical evidence.
Bergmann estimated that national income in the United States could increase as much as 1.4% if discrimination (occupational desegregation) against black employees was eliminated. One point four percent many not appear to be a large figure, but that reflects the national average; the income gains for black employees could range from 35-60%. The important contribution of the Bergmann study is the observation that every employee can benefit from an equitable workplace.
Turning to the micro level, Ashenfelter and Pencavel's 1976 study of AT&T estimated that by eliminating discrimination based on gender alone, the company could realize cost savings of nearly 4%. In their study on the costs of occupational sex discrimination Dunnette and Motowidlo (1982) estimated that over a ten year period, the net loss to the organization due to excluding women was $7,200 for each person hired.
Twenty years later it appears very few firms have found a way to properly measure the fiscal impact of workplace equity. A recent study conducted by West Coast Research for the Multiculturalism and Immigration Ministry of British Columbia found that less than one-third of organizations with a diversity program measured the profitability of the program, and most of those that did apparently relied on simple global measures such as total sales.

Costs of Discrimination – Philip Gounev This is only a draft paper and can be quoted only with the author’s permission.
Created on 8/1/2004 4:37:00 PM 3
An interesting experiment to estimate the cost of discrimination was done by Ponder (1966). Using data from the United States Census of 1960, this study deals with the economic effects of a six-week "economic withdrawal" by the African Americans of Petersburg, Virginia, from the "downtown" area. The time period involved was May 10 through June 21, 1964. The alternative cost of a policy of discrimination was very large for downtown merchants of Petersburg, Virginia, for a six-week period. During a six-week period of economic withdrawal by the African Americans, downtown merchants sustained a great loss. If one assumes an 80% effective withdrawal, downtown merchants in the areas of food (groceries and restaurants), tobacco, house-furnishings and equipment, clothing, recreation, and automobile transportation sustained a loss of $1,296,745.
Brimmer (1993) concluded in a comprehensive study of the cost of employment discrimination , that disparate treatment of African Americans had cost the U.S. economy about $215 billion in 1991 (roughly 3.8 percent of the gross domestic product (GDP). While part of the loss can be attributed to the lag in educational achievement by blacks, Brimmer concedes, the bulk of the shortfall, he maintains, "appears to be related to continued discrimination which limits their access to higher-paying jobs." Moreover, said Brimmer, income deficits among blacks can be translated into losses in the gross domestic product, the annual value of goods and services produced by the country, excluding the returns on foreign investments. These losses -have represented 3 % to 4 % of GDP since the mid-1960s.
As assistant secretary of commerce in 1965, Brimmer asked the Census Bureau to estimate the cost of discrimination against nonwhites from 1949 to 1963. According to Brimmer, the bureau based its estimates on inefficiencies in the use of the labor, force, arising from failure to use fully the existing education, skills and experience of the population, and a failure to develop potential in education, skills and experience. Based on that analysis, Brimmer said, he estimated that discrimination against nonwhites cost about $20.1 billion in lost GDP in 1963.
Applying the Census Bureau's technique used in 1965, Brimmer explained, in 1993 he updated estimates of the economic cost of discrimination against blacks. The figures show that between 1965 and 1991, the American economy has lost between 1.5% and 2.2% of GDP because racism limits the full use of black educational attainment. In 1967, this loss amounted to $12.1 billion, or 1.5% of GDP. Another $11.1 billion, or 1.4% of GDP, was lost because of the failure to improve and fully use the educational level of African-Americans. In combination, lost GDP amounted to $23.2 billion, or 2.9% of the $814.3 billion total. By 1991, the GDP shortfall was $122.5 billion. Failure to improve the black education level cost $92.5 billion, or 1.6% of GDP. This totaled 3.8% of GDP, or $215 billion. The figures suggest that, while no dramatic shifts occurred since 1967, modern discrimination has risen slightly.
According to Brimmer, a number of interrelated factors lie behind the GDP loss. Historically, bias did not allow blacks to use their full qualifications. Today, despite equal opportunity laws, many blacks are still concentrated in positions that do not make full use of their talents. If racial bias were eliminated, blacks could migrate freely from low- to high-productivity occupations. A gain in the total output of goods and services would result. Plus, an unbiased use of labor most likely would also require increased capital stock investment—further boosting output and labor income. Another plus would be that

Costs of Discrimination – Philip Gounev This is only a draft paper and can be quoted only with the author’s permission.
Created on 8/1/2004 4:37:00 PM 4
self-employed entrepreneurs—particularly blacks—would have greater market access and be more efficient, which would lead to higher productivity income and GDP. That being the case, Brimmer advocates further investment to improve blacks' education and skills and "vigorous affirmative action programs to eradicate the lingering racial discrimination in American industry."
The opposite view was expressed in an article in Forbes Magazine by Brimelow and Spencer (1993), according to which the 1964 Civil Rights Act has been transformed by the civil rights lobby and its allies "into a pervasive quota system," whose impact upon the private and public sector has "already depressed GNP by a staggering four percentage points." The article was heavily criticized when Black Enterprise Board of Economists (BEBE) gathered fall 1993 in Washington, D.C. The BEBE found Brimelow's and Spencer's arguments flawed on several counts. Board members said the Forbes writers assume that qualified white male workers are being displaced by incompetent minorities and women. This assumption infers that white males are more productive workers than minorities and women. There is simply no conclusive empirical evidence to support either of these claims. Despite Brimelow's and Spencer's claims, there is no evidence that market competition—in the absence of affirmative-action regulations—will eliminate discrimination.
At the beginning of this century, some international organizations also began to take notice of the problem, particularly of its gender and educational aspect. According to UNFPA's (2000) State of the World Population Report, “Discrimination against women and girls not only harms individuals, it cripples economic growth." Women's second-class status carries a financial and social cost, and not just for women. Men, and society in general, also pay a price," said the report.
It highlighted the gender gap in education as a key influence on gross national product (GNP), stating that in countries where the ratio of women to men enrolled in primary or secondary school is less than three to four, GNP per capita is roughly 25 percent lower than elsewhere. "It has been estimated that a one percent increase in female secondary schooling results in a 0.3 per cent increase in economic growth." The relationship between female secondary education and economic growth is so strong because economic returns on women's education exceed those of men. "One reason is that women who use their skills to increase their income, invest more in child health and education," the report said.
This relationship has been verified in the economies of several East and Southeast Asian countries which grew at unprecedented rates from the 1960s through the 1980s. This was allied to investments in health and education, especially for women. As a result, birth rates dropped and these countries were able to invest more in stimulating economic growth. "Various analyses ascribe 30 percent of the growth in the 'Asian tigers' to changing age structures that resulted from lower death and birth rates," the report said. "This equals 1,525 dollars per capita in economic advance over a 30-year period." The opposite trend can be observed in South Asia and sub-Saharan Africa, where economic growth trails and the educational gender divide is greatest. In these regions, girls make up less than 40 percent of secondary students. The report argues governments must take the fundamental decision to move forward on gender equality through legislative changes and public policies: "Governments are also major employers and their rules and practices have a powerful influence on social change."

Costs of Discrimination – Philip Gounev This is only a draft paper and can be quoted only with the author’s permission.
Created on 8/1/2004 4:37:00 PM 5
When addressing employment, Truche (2000) stressed the importance of detailed
studies aimed at gauging discrimination in this area, which has emerged as the most frequent form of discrimination. A recent research project in Hungary has made it possible to assess the economic cost of discrimination and establish a link between under-employment of victims of discrimination and increases in social conflicts and economic imbalances. In studies carried out by the International Labour Office, using a systematic approach to gauge discrimination, a whole series of measures has been proposed which could be taken by social partners and governments. Emphasis is placed on the implementation of collective measures: charters and guidelines for employers and trade unions to be applied in all situations.
The World Bank (2001) report, 'Engendering Development Through Gender Equality in Rights, Resources and Voices' noted that if the Middle East, Africa, and South Asia had narrowed the gender gap in education as did East 'Asia, their economies would have grown by as much as one percent more each year than they did between 1960 and 1990. In Africa, improving rural women's access to productive resources like education, land and fertilizer could increase agricultural productivity by as much as one-fifth, said the report.
"Gender disparities are very closely associated with poverty. The gap between men and women in such things as health and education is greater in poor countries than in rich countries, and within countries it is greater among the poor," said Elizabeth King, who co-authored the report. "Societies that discriminate on the basis of gender pay a significant price in greater poverty, slower economic growth, weaker governance, and a lower quality of life," noted Andrew Mason, the other author of Engendering Development.
The study noted that areas such as domestic violence had an economic cost. Domestic violence resulted in lower productivity, greater absence from work, increased homelessness, greater demand for medical and community support services and larger expenditures on police and judicial services. While it was difficult to measure its exact costs, the report estimated that domestic violence reduced women's earnings by more than two percent of gross domestic product (GDP) in Chile and by 1.6 percent in Nicaragua in 1996. Citing research conducted in 1995, the report said in Canada, the cost of violence against women was about 1 billion dollars each year, or about 1 per-cent of Canada's GDP. The Bank called Engendering Development the most extensive study yet of the link between gender and economic progress. It noted that a recent study of 63 countries concluded that gains in women's education made the single largest contribution to declines in malnutrition between 1970 and 1995.
But one of the report's major shortfalls was that it failed to analyze the impact of the World Bank's own policies in the negation of women's progress in developing countries. No comprehensive study on the social impact of the World Bank's long criticized structural adjustment policies (SAPS) had so far been done, even though they have been in operation for two decades. A range of independent studies have noted that aspects of SAPS, such as trade liberalization have had negative consequences on many poor economies, resulting in retrenchments, the elimination of subsidies and permitting cheap imports that have destroyed local industries. Other policies, pushed through SAPs such as charging fees for public Services like primary education and health care have tended to

Costs of Discrimination – Philip Gounev This is only a draft paper and can be quoted only with the author’s permission.
Created on 8/1/2004 4:37:00 PM 6
hit women hardest. Results of the NGO's on-going research under the Gender and Economic Reform in Africa showed that economic stabilization policies and SAPs have generally worsened the situation of women and reinforced existing inequalities. The International Labor Organization research done by Abramo (2002) and covering Argentina, Brazil, Chile, Mexico and Uruguay again dealt with employment discrimination and challenged the conventional belief that hiring a woman is more costly than hiring a man. The study shows that the additional cost of employing a woman worker and having to cover maternity protection and childcare expenses is very small as this component of non-wage costs amounts to less than 2% of the monthly gross earnings of women employees. If we consider all non-wage costs, including those of training and compensating work injuries and others, which apply to different categories of workers, both men and women, then the additional cost of hiring a woman comes down to less than 1 per cent.
This is as a result of the fact that the payment of maternity-related benefits and wages during maternity leave are not borne by the employers, but come out of taxes (Chile) or social security funding (Argentina, Brazil, Mexico and Uruguay). When funded by the social security system - which occurs in the majority of Latin American countries, except for Chile - the employer's contribution is not linked to the number or the age of women employees, but rather to the total number of employees of both sexes.
On of the few studies that cost-justify discrimination in certain cases was done by Maltby (2000). The author claims, that the people who suffer illnesses on a genetic basis will probably be subjected to a lifetime of employment discrimination. The economic cost incurred by a person with Huntington's disease is approximately $50,000. What employer will hire a person who comes with that kind of liability? What employer will willingly hire a woman who carries the genetic marker for breast cancer? According to Maltby, an employer who refuses to hire someone with a genetic marker isn't acting on irrational bias. In some cases the discrimination really is cost-justified. "It may be bad ethics, but it's not bad economics", says Maltby. And although some state laws outlaw genetic discrimination, they do not address employer access to genetic information. Thus employers will still be able to learn which potential employees are at risk for future disease and the attendant medical bills. Where these risks are substantial employers will often find that it is more cost effective to discriminate. Maltby finds out, that the only effective formula is to prohibit both discrimination and employer access to genetic information.
Still, according to neoclassical economists, discrimination at work should be short-lived because it is costly and inefficient. Employers who discriminate against certain groups should disappear because they cannot compete with employers who do not discriminate. Statistical discrimination or "employers' taste" is what explains, in the view of mainstream economists, the persistence of discrimination in the labor market. The theory of statistical discrimination is based on the premise that firms cannot scrutinize the productivity of individual workers. As a consequence, they tend to rely on easily observable characteristics, such as race or sex, as an indicator of likely productivity - often assuming members of certain groups to have lower than average productivity. Evidence shows that constraints on the employment of women translate into higher labor costs through the contraction of labor supply. Conversely, greater equality in the distribution of productive resources and in education between men and women leads to
Costs of Discrimination – Philip Gounev This is only a draft paper and can be quoted only with the author’s permission.
Created on 8/1/2004 4:37:00 PM 7
higher productivity and growth. Systemic exclusion of members of certain groups from decent work generates
serious problems of poverty and social fragmentation that compromise economic growth. The case of apartheid in South Africa illustrates this. Discrimination against blacks allowed whites to benefit only for a limited period of time. Eventually, apartheid became a cost to the economy. Shortages in supply of skilled labor to the manufacturing sector acted as a brake to further expansion of the economy. As the education system made it impossible for the majority of the population to compete for higher level positions, it compounded the skills .blockage and contributed to further economic degradation.
The report Time for Equality at Work (2003) by ILO claims that there will always be workers who will find a job more easily than others, earn more than others or move up the occupational ladder faster than others. Differences in productivity between occupations or workers that reflect differences in skills, qualifications or abilities lead to different returns at work. The elimination of discrimination through the promotion of equality of treatment and opportunities is not about nullifying all differences in the labor market, the report states. The goal of these policies is to make sure that differences in labor market outcomes reflect a free choice in the selection of occupations, an absence of bias in the way merit is defined and valued and equal opportunities in the acquisition and maintenance of market-relevant skills. Effects of Government Spending on Minorities
One of the most discussed issues related to the topic is the role of the affirmative action programs in the USA. One research led by Simms (1995) offers three perspectives on the issue of affirmative action, which challenge many of the assumptions and criticisms raised about its impact.
In "The Economic Cost of Affirmative Action," Cecilia Conrad takes on the conservatives' economic-efficiency arguments directly. She estimates the policy's direct costs, both in public expenditure (enforcement) and private expenditure (compliance), and examines as well the impact affirmative-action hiring has on productivity in a number of industries. Conrad's analysis leads her to the conclusion that direct costs of enforcing affirmative action are quite small relative to the cost of doing business, on the order of $12 per employee per year, and also finds that the impact on productivity appears to be minimal.
In "The Effectiveness of Equal Employment Opportunity Policies," M. V. Lee Badgett and Heidi Hartmann review studies of the effectiveness of affirmative action. These studies use different approaches and methodologies. In some cases the researchers measure equal employment/affirmative action activity by comparing firms that are subject to high standards of federal review (such as contractors) with those that are not. In other cases, the wages, employment, and/or occupational status of minority groups and women are reviewed for comparison between the period before equal employment laws took effect and afterwards. In spite of these differences in approach and frequent limitations in the data available, there is a consistency in the findings regarding the impact on wages, employment, and occupational status. In sum, Badgett and Hartmann

Costs of Discrimination – Philip Gounev This is only a draft paper and can be quoted only with the author’s permission.
Created on 8/1/2004 4:37:00 PM 8
conclude, the preponderance of evidence suggests that activity associated with equal employment and affirmative action policies is associated with small but significant gains in wages and employment by people of color and women in a range of blue-collar and white-collar occupations. Moreover, they find no evidence that these gains were made at the expense of either firm competitiveness or fair employment practices. It appears that many of the jobs gained by minorities and women were the result of garnering a greater share of new jobs created and not the result of displacing white males. In sum, according to the authors, affirmative action can only be one strategy within a larger policy agenda to promote equity in American society.
One article from Lowery (1995) raises up some important questions on affirmative action and the anti-affirmative action climate in the United States. Should colleges and universities be allowed to set aside scholarships for minorities? Or adjust admission policies to compensate for past injustices? Should municipalities be allowed to give minority contractors a competitive edge when it comes to bidding? Or to set aside a certain amount of business for them? Is embracing the idea of a culturally diverse labor force more important to corporations than ensuring that they actually employ specific percentages of workers of diverse backgrounds?
These questions, seemingly answered during the 1970s and the 1980s, are once again surfacing in the 1990s. The concept of affirmative action—whether the setting is the boardroom or the campus--is as divisive today as it was three decades ago when President Lyndon Johnson formalized it by signing Executive Order 11246. And corporate executives found "diversity" a lot easier to swallow than "affirmative action," and much easier to sell to a predominately white male workforce. But the change in terminology has not translated into jobs for blacks or other minorities.
Browne (1972) turns our attention on another interesting aspect of the issue. He finds out, that there is no attention paid to the wealth holdings of blacks from virtually all of this mass of literature on the economic status of blacks. The focus is ever on income - on income differentials between blacks and whites, on the absolute and relative rates of growth of black and white income, on the gap between black and white income, on the rate at which the income gap is changing, on institutionalized techniques through which income discrimination is practiced.
This concentration on income as the significant barometer of economic well-being and as the key to the achievement of economic equality is not surprising, according to the author. Traditionally, macroeconomic analysis is organized around national income or one of its variants. Per capita national income or per capita gross national product is a generally accepted index for making international comparisons, even though there is widespread recognition that either one of these indices has inherent limitations for these purposes. But he asks himself how valid is income as an index of the economic well-being of American ethnic minorities? This unease manifests itself, for example, in the black community's response to an article by Wattenberg and Scammon (1973), which attempted to demonstrate that most blacks had "made it" into the middle class because 52 percent of black families allegedly had incomes above $6,000 in the South or $8,000 elsewhere. It comes out in the perplexity which blacks feel when some statistician points out that the annual aggregate income accruing to U.S. blacks is equal to or greater than the GNP of one or another nation of roughly equal population, such as Argentina or Spain (the favorite comparison used to be with Canada).

Costs of Discrimination – Philip Gounev This is only a draft paper and can be quoted only with the author’s permission.
Created on 8/1/2004 4:37:00 PM 9
Browne finds out, that in comparing the income of blacks with that of other groups, all income dollars are treated as identical, whether earned or unearned. Yet, for the U.S. as a whole, nearly a quarter of the national income originates from property or wealth; in contrast, virtually the entire income of the black community originates from wages, transfer payments, and self-employment in marginal enterprises - a fact which may be nearly as significant as the income figures themselves. "The groups responsible for running the affairs of this country have for several years recognized that the submerged economic position of the black population constituted a threat to the nation's internal tranquility and in consequence thereof a range of government, foundation and even corporate-sponsored programs designed to ameliorate to some degree the grossest economic deprivation of the black community were implemented. These programs have ranged from a straight dole of public assistance payments, through a variety of institutional development and subsidy programs, to occupational training programs of various sorts. The efficacy of most of these programs is vigorously debated, and given that their objectives were as much political as economic, it may never be really possible to evaluate them in any meaningful sense or on any cost-benefit basis. One can measure increases in aggregate income, but one cannot put a value on social disruptions which never occurred." In an absolute sense, the author concludes, the economic situation of blacks as a group had indeed improved. However, the economic situation of the American population as a whole, had improved even more.
The other major issue in the United States is the sponsorship of minority-owned companies. One analysis by Bartelme (2001) in Post and Courier newspaper shows that the issue is quite complex. In interviews with more than 60 government and business leaders and an examination of census data and state and local records, the newspaper found that:
African Americans own 9% of the state's businesses, but those businesses receive 3.7% of government's spending. Experts say the lack of government spending with black-owned businesses exacerbates a longstanding problem in South Carolina: 136 years after slavery, blacks have yet to establish a substantial business presence in the state. Some black business-owners say government procurement rules favor large companies over smaller ones. This shuts out many black companies, which tend to have fewer employees and financing resources.
Courts have ruled that state and local set-asides are unconstitutional, but some agencies have come up with creative ways to increase spending with companies owned by blacks, women and other minorities without resorting to quotas. One successful tactic: breaking large contracts into smaller ones. The state Department of Health and Environmental Control boosted its minority spending record and saved $140 million doing that.
Many agencies don't keep accurate records on how they spend money with businesses owned by minorities. Last year, the Department of Social Service's calculations were off by $426 million because of what officials said was a misunderstanding over the proper figures to use. Some agencies don't keep such records at all.
Few white-owned private companies take advantage of a state income tax break designed to encourage contractors to hire minority subcontractors. The governor's Office of Small and Minority Business Assistance, the state agency that compiles a list of black-

Costs of Discrimination – Philip Gounev This is only a draft paper and can be quoted only with the author’s permission.
Created on 8/1/2004 4:37:00 PM 10
owned businesses for government buyers, has a cumbersome application process that discourages some potential applicants. The agency has certified only two percent of the state's 23,216 black businesses.
Black-owned firms are struggling in other states. North Carolina spent about 3 percent of its procurement dollars with black companies. Studies in other cities and states have found that black companies make less than they would if race weren't a factor. In Europe when we talk about government spending on minorities, we talk about Roma people. Goldston (2002) claims, that since 1990, Brussels has contributed more than $10 billion to help candidate countries prepare for membership, and some of this cash has been specifically designated to aid minorities. Furthermore, a number of European governments that previously ignored racism have now begun to acknowledge its presence in their midst, creating some programs to combat discrimination and promising others. One country, Romania, even adopted provisional legislation in 2000 that, if confirmed by both houses of parliament, would prohibit racial and other forms of discrimination in most areas of public life and provide for legal remedies. Comprehensive antidiscrimination laws still do not exist in other post-communist states, although, partly in response to pressure from Brussels, /initial drafts are now circulating in several of them. The Enlargement Commissioner Verheugen (2002) states that enshrining fundamental human rights and democracy were the most important criteria to be met by the applicant countries. The Commissioner notes that about two million of the six million Roma in Central and Eastern Europe live in Romania, with a further 570,000 in Hungary and that they continue to suffer from low education, poor health and housing, centuries-old social exclusion and unemployment rates of up to 90%, But he also points out that each of the candidate countries has come up with an Action Plan and most of them have raised their budgets to tackle the problem. He singled out Slovakia and Romania for particular praise. However, the British Socialist MEP Robert Evans complained to the Commissioner about the wide gap between what candidate countries say they are doing for the Roma and the reality on the ground. And Alima Boumediene-Thiery (Greens, France) accused the EU Member States of not respecting the Roma's human rights given that they frequently expel them as illegal immigrants.
According to Kovats (2001), the opportunity for the EU is to establish equality of opportunity through facilitating significant improvement in the life chances and living conditions of Roma people and communities in accordance with their actual circumstances and in a way that is widely perceived as being of benefit to all within their home societies. The challenge, notes the author,, is to avoid the temptation to construct separate policy and administrative structures for Roma minorities and to prevent the further disintegration and ethnic fragmentation of east European societies by reversing the trend toward segregation and exclusive ethno-politics.
The situation with other minorities in Europe is far more settled. The Tyrolians are a German-speaking ethnic group located in the Italian province of South Tyrol. They constitute about 2/3 of the population of the region of South Tyrol which Italians call Alto Adige. Gurr (2003) notes, that since the implementation of the new autonomy pact, beginning in 1972, the German minority has gained effective control of public administration, educational and cultural affairs, and economic development, financed by a guaranteed percentage of government spending in relevant sectors. These policies, and a tourist boom, have made the South Tyrol one of the most prosperous Italian regions.

Costs of Discrimination – Philip Gounev This is only a draft paper and can be quoted only with the author’s permission.
Created on 8/1/2004 4:37:00 PM 11
III. The Empirical Evidence from Bulgaria
The approach that this paper takes is more direct and empirical but at the end it seeks to reach similar conclusions as some of the research cited above. The analysis will focus on a snapshot—the year 2001. Data for 2002 and 2003 is still difficult to come about, no comprehensive household surveys have been done since. The empirical evidence is derived mostly from a representative household survey. Wherever possible supporting data will be provided from other household surveys and institutional data.
Before presenting the evidence, it is important to discuss several important issues that should be kept in mind. The most important issue is the one of the size of the Roma population. This paper takes no position on the issue, but relies on the number of Roma that have been identified or have identified themselves as such in the household surveys that are analyzed. Another caveat that needs attention is the issue of data distortions as a result of the manner household surveys are often conducted in Bulgaria. (Other consideration could be added as I give the paper for critical remarks to people). Estimating the Roma population in Bulgaria.
The exact size of the Roma minority in Bulgaria is an issue that generates an intense debate among the people studying the demographic and cultural characteristics of this minority. There are two major reasons for this. First, the Roma minority is very diverse as a group (UNDP). Roma people rarely accept their ethnic group as unified. Some of them identify themselves as Bulgarian Roma, others-as Turkish Roma, Vlach Roma etc. These main groups are also divided into subgroups. This diversity makes it extremely difficult to find the exact size of Roma minority since their self-identification varies greatly.1
The second problem that one encounters when trying to determine the number of Roma that live in Bulgaria is the common practice among the interviewed Roma to conceal their ethnicity and identify themselves as Turks or Bulgarians. The main reason for this is avoiding prejudices and discrimination that are widespread against the Roma population. Because of these two reasons, it is not surprising that the existing data from different studies concerning the size of the Roma minority is quite controversial. According to the National Census in 2001 there are 365 797 people from Roma origin in Bulgaria. This constitutes 4.7% of the population in the country. However, according to some scholars, who base their knowledge on sociological surveys, the number of Roma minority is between 600 000 and 750 000.2 This shows that the difference in the size between the various studies of the Roma minority is quite substantial. Whether only people who identify themselves as Roma should be considered as such in the sociological analyses or even people who are accepted by the interviewers as Roma because of their social characteristics such as a way of living, education, physical appearance, is question that has no correct answer. There are advantages and disadvantages to both approaches. If one chooses to accept as Roma only the respondents that identify themselves as such, one 1 Томова, Илона. “Циганите в Преходния Период”. София: Международен Център по Проблемите на Малцинствата, 1995. стр. 21 2 Желязкова, Антонина et al. “Извън Капана на Зависимостта”. България: ПРООН 2002, стр. 29

Costs of Discrimination – Philip Gounev This is only a draft paper and can be quoted only with the author’s permission.
Created on 8/1/2004 4:37:00 PM 12
insures that only people from Roma origin are included in the analyses. Because of the unprivileged social status of this group, it is unlikely for people not belonging to this group to falsely identify themselves as Roma. The disadvantage of this approach is that it could result in false conclusions about the Roma people if the problem of concealing their ethnic belonging is too severe. Expanding the definition of Roma ethnicity to include also people who are identified by others as Roma could be beneficial if it gives more accurate results about this group. However, this approach might lead to misrepresentation if there are many people who are falsely identified as Roma.
It is obvious that there is no correct answer to who should be considered belonging to the Roma minority for the sake of obtaining more accurate conclusions about this minority group.
1. Data description and methodology of the data collection.
The data used in this analysis of the Roma minority is taken from the 2001 Bulgarian Integrated Household Survey. This survey is conducted by BBSS Gallup International under the supervision of the World Bank and with the assistance of the National Statistical Institute and the Ministry of Labor and Social Affairs. Using a two-stage cluster design, a nationally representative sample was drawn by the National Statistical Institute from the 2001 Population Census. There are about 2500 households interview.3 The number of Roma households varies depending on the criterion used to generate the sample of people in the data set. In addition to the random sample drawn, there are 133 oversampled Roma households (569 individuals) that could be used to achieve more significant statistical comparison of the ethic groups. As explained in the section above, the definition of ethnicity is quite a complicated issue that requires careful consideration. In order to deal with the instances where people from Roma origin conceal their ethnic background or self-identify themselves with a different ethnic group, in identifying the respondents’ ethnicity both the respondent and the interviewer are asked to answer questions concerning the ethnic origin of the interviewed. The criterion used by the interviewer in identifying the respondent’s ethnicity includes skin color, language/verbal behavior, style of living, family name, and other relevant characteristics. There are 34 households in the data set, in which the respondents do not identify their ethnicity as Roma, but the interviewer does. In this case, the interviewer is instructed to find three individuals from the same residential area, who know the respondent and to ask them questions concerning the ethnicity of the interviewed person. In 29 of the 34 cases, all three of the interviewed individuals assess the ethnicity of the respondent as Roma. From the remaining 5 cases, in two instances all of the inquired individuals assess the ethnicity of the responded as Bulgarian with high level of confidence. In these cases, for the purpose of this study the ethnicity of the respondent is recorded as Bulgarian. In the other three cases at least two of the three individuals identified the ethnicity of the respondent to be Roma and they are identified as such in the data analysis.
3 2001 Bulgarian Integrated Household Survey: Data and Methodology, March 2003 < http://www.worldbank.org/lsms/country/bg01/bg01docs.html> (15 June 2004).
Costs of Discrimination – Philip Gounev This is only a draft paper and can be quoted only with the author’s permission.
Created on 8/1/2004 4:37:00 PM 13
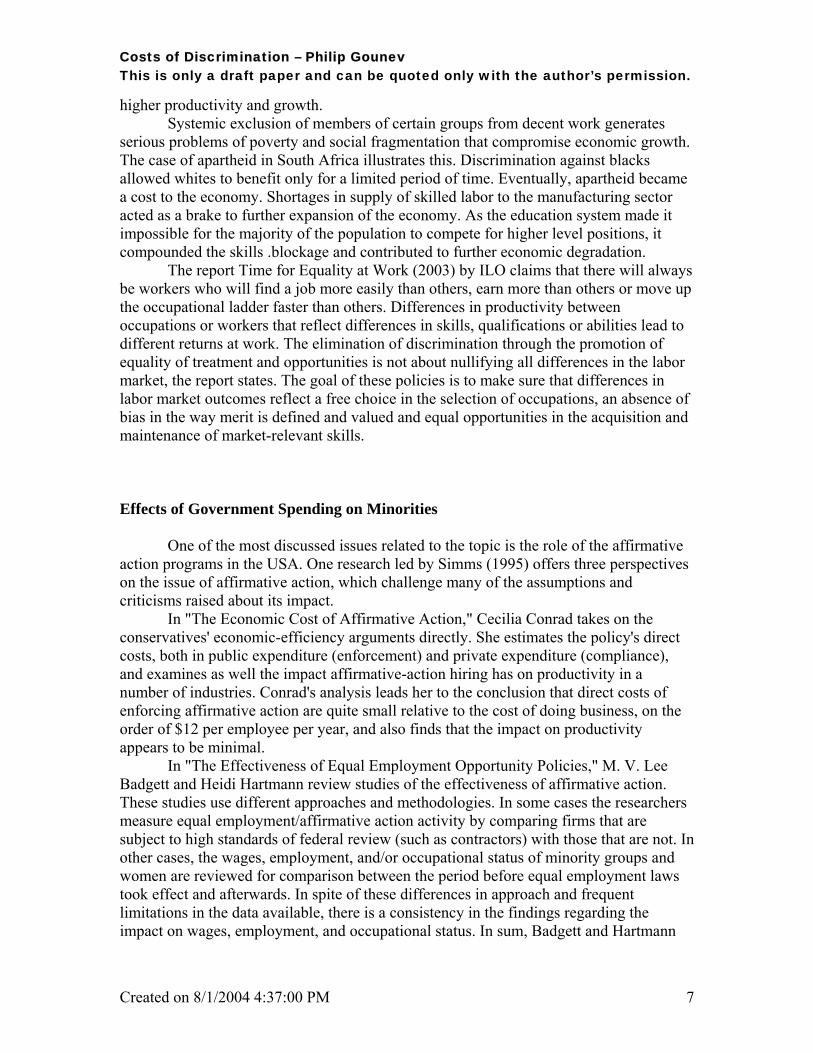
From this procedure of establishing the Roma origin of the respondent two different definitions of ethnicity could arise. According to the narrow definition, only people identifying themselves as Roma are considered to be of Roma origin. Using the narrow definition of ethnicity there are 234 households and 1055 individuals in the data set. The broad definition of ethnicity is created by including 32 more households, in which the interviewer and at least 2 of the 3 individuals that are inquired about the respondent’s ethnicity identified the respondent as Roma. According to the broad definition the total number of Roma households is 266 or 1229 individuals. It should be noted that 133 Roma households according to broad definition of ethnicity and 124 according to narrow definition are oversampled. Due to this oversampling 15.33% (broad) and 14% (narrow) of the respondents of this survey are from Roma origin. This information is summarized in the table below:
Narrow definition Broad definition
Total number Without oversampling
Total number
Without oversampling
Roma Households 234 110 266 133Roma Individuals 1055 523 1229 660Percentage of people surveyed 14.16677857 7.022962267 15.33374922 8.2345602Number of respondents 7447 8015
The number of the Bulgarian households is 2182 or 6236 individuals. The households from Turkish origin are 145 (550 individuals). There are 60 more households that have ethnicity different from the main three ethnic groups. Those observations are eliminated from the data set since they are not in the scope of this study.
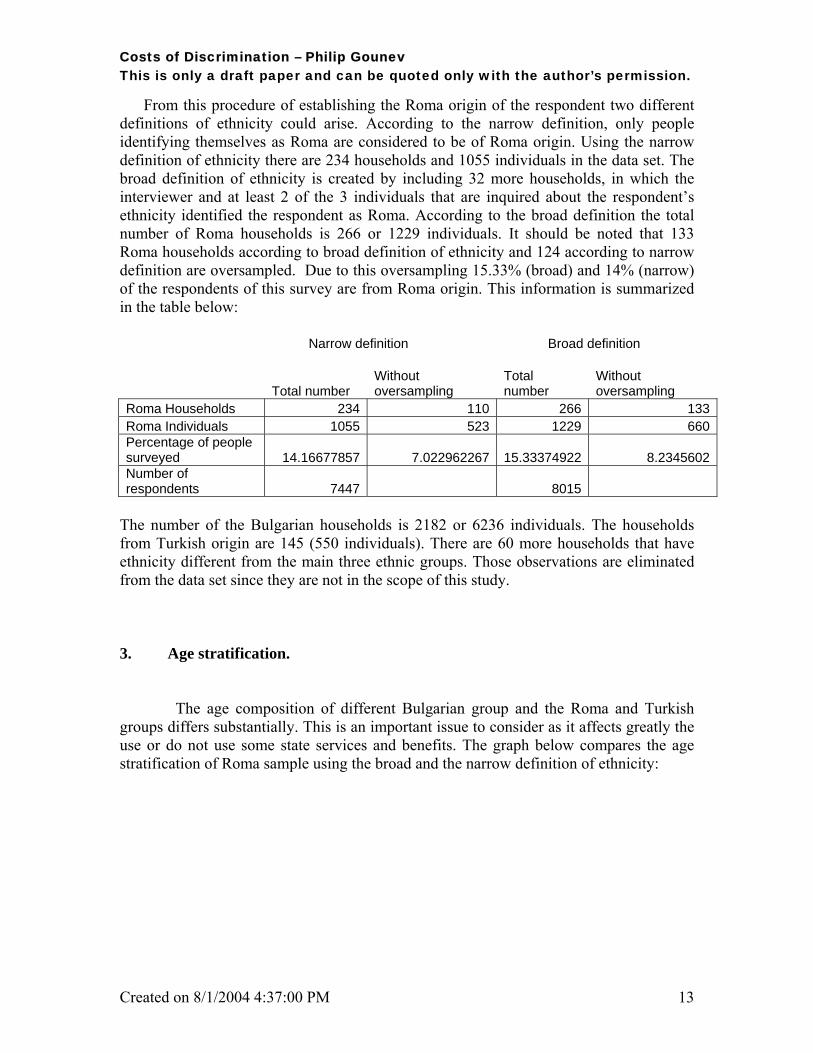
3. Age stratification. The age composition of different Bulgarian group and the Roma and Turkish groups differs substantially. This is an important issue to consider as it affects greatly the use or do not use some state services and benefits. The graph below compares the age stratification of Roma sample using the broad and the narrow definition of ethnicity:
Costs of Discrimination – Philip Gounev This is only a draft paper and can be quoted only with the author’s permission.
Created on 8/1/2004 4:37:00 PM 14
Roma age groups-broad definition
0
510
1520
25
3035
40
0-15 16-30 31-45 46-60 >60
age group
perc
enta
ge o
f sam
ple
Roma-narrowRoma-broad
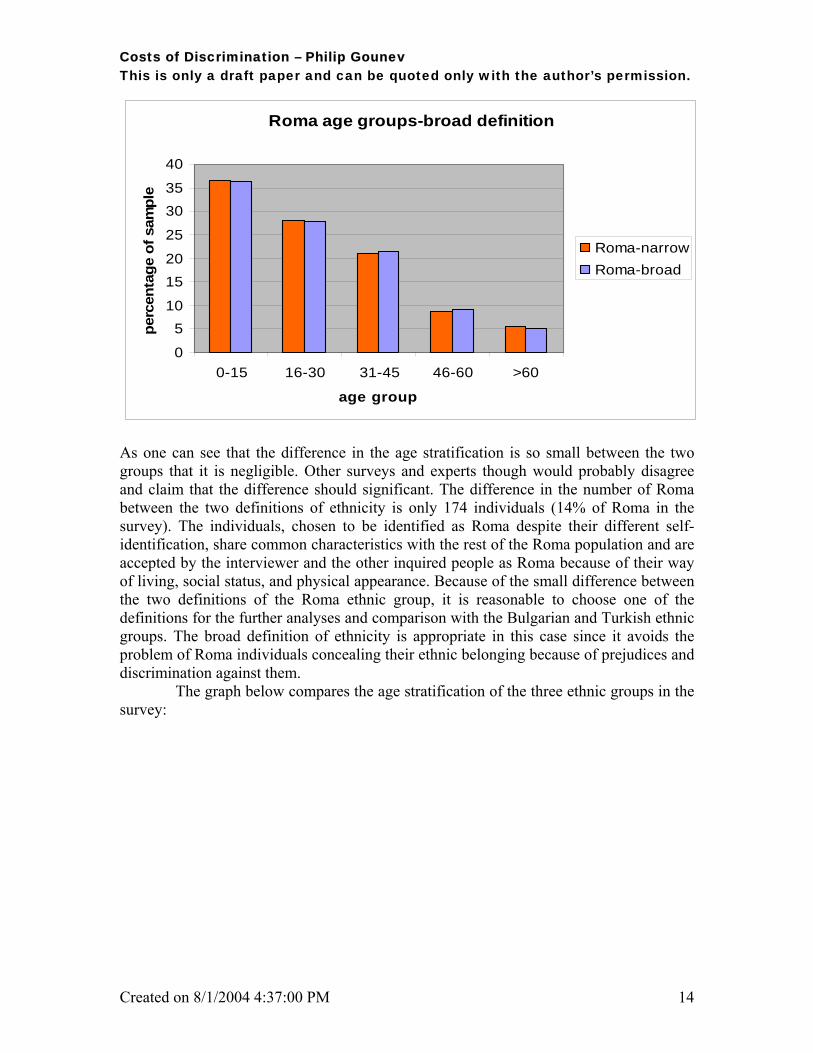
As one can see that the difference in the age stratification is so small between the two groups that it is negligible. Other surveys and experts though would probably disagree and claim that the difference should significant. The difference in the number of Roma between the two definitions of ethnicity is only 174 individuals (14% of Roma in the survey). The individuals, chosen to be identified as Roma despite their different self-identification, share common characteristics with the rest of the Roma population and are accepted by the interviewer and the other inquired people as Roma because of their way of living, social status, and physical appearance. Because of the small difference between the two definitions of the Roma ethnic group, it is reasonable to choose one of the definitions for the further analyses and comparison with the Bulgarian and Turkish ethnic groups. The broad definition of ethnicity is appropriate in this case since it avoids the problem of Roma individuals concealing their ethnic belonging because of prejudices and discrimination against them. The graph below compares the age stratification of the three ethnic groups in the survey:

Costs of Discrimination – Philip Gounev This is only a draft paper and can be quoted only with the author’s permission.
Created on 8/1/2004 4:37:00 PM 15
Age groups
0
5
10
15
20
25
30
35
40
0-15 16-30 31-45 46-60 >60
age group
perc
enta
ge o
f sam
ple
BulgarianTurkRoma-broad
The greatest percentage (36%) of the Roma minority belongs to the age group up to 15. Another striking fact is that only 5% of this ethnicity group is older than 60. This number is very small compared to 25% of the Bulgarian population aged above 60. Compared to 14% for the age group up to 15 for Bulgarians, the percentage of old people seems even more concerning. This demographic structure of the Roma minority is consistent with the 2001 Population Census and the nationally representative study made by the Agency of Social Analyses. The difference in the age structure of the Bulgarian and Roma groups could be explained by two underlying trends. First, the birth rate among the Roma minority is much higher than the birth rate among the Bulgarian population. It is know that Roma households have more children than the Bulgarian households. In the Household survey the average number of children in the household is 1.665414. According to UNDP report this number is 2.64.4 In Bulgarian household the average number of children is .3973419, which is approximately 4 times smaller number compared to Roma households. The average number of children in the households from Turkish minority group is .8551724. Second the life expectancy of among Roma minority is lower than among Bulgarians. According to I. Tomova the average life expectancy of the Roma minority is 10 years lower than for the rest of the population. This is due to greater poverty among Roma, which results in lower quality of life. The high birth rate and the low life expectancy among the Roma population aggravate the social impact of all problems that exist among the Roma group. First, the problem of the widespread illiteracy among Roma children will result in even greater percentage of Bulgarian population with no or very low quality education in the future. This represents a huge loss of human capital and an increase in the percentage of the population that is dependent on social benefits provided by the taxpayers. The health problems that the Roma face will also be aggravated by their demographic characteristics since they will result in even greater portion of the Bulgarian people who receive
4 Желязкова, p.30

Costs of Discrimination – Philip Gounev This is only a draft paper and can be quoted only with the author’s permission.
Created on 8/1/2004 4:37:00 PM 16
inadequate health service. The lack of timely visits to the doctor that is typical for the Roma minority makes the spending on Roma health unnecessary more expensive. This is the case because the cost of treatment of the more serious diseases that result from the postponement of the medical treatment is much higher. Last but not least, the number of people dependent on the social welfare system will increase exponentially as the number of Roma children increases relatively to Bulgarian children, which because of the more favorable conditions of life are less likely to become disabled, uneducated and unemployed. 4. Education In the Bulgarian Integrated Household Survey all members of the household aged older than six months are included. This makes 1190 Roma, 6025 Bulgarians and 521 Turks. One of the often referred problems when discussing the minority education is the lack of knowledge of the official language, which precludes the children from understanding the material taught in school. This problem, however, is not obvious from the data set. According to the respondents’ answers only 9 Roma aged older than 3 do not speak Bulgarian. This number for the Turkish minority is 15. One should be careful to conclude that the lack of knowledge of the official language is not such a severe problem since the response to this question is subject to a personal judgment on the side of the respondent. The survey of the Agency for Social Analyses shows that only 38.5% of the Roma parents speak Bulgarian with their children. The most commonly used language in the household is Roma or Turkish language (page 27). This puts the Roma children in an isolated social circle where the possibility of learning the official language on a level adequate for understanding the material taught in the Bulgarian schools is very restricted. According to the report written by Docho Michailov and Antonina Zheliaskova the level of illiteracy among the Roma minority is on average 18.1% for the country with severity of the problems varying in different municipalities. Illiteracy is almost equivalent to complete lack of knowledge of the language since no decent level of education is possible without a good knowledge of the spoken and written language. 20% of the Roma in the survey respond that they are still studying. This number for the Bulgarians is 16% and for Turkish minority-15.7%. This fact is not surprising since the sample of people from Roma ethnic group contains younger individuals than the Bulgarian group. 85% of the Bulgarians are older than 16, which is the usual age when people in Bulgaria finish their compulsory education. For Roma this number is 62% and for Turks- 74%. In fact, 57% of the Bulgarians point out the completion of their education as the reason for not studying. Only 14% of the Roma respond that they have completed their education (32% for Turks). All of the Roma in the data set that still study attend state run institution. A very small number of Bulgarians study in a private school or university (0.45%). This makes both groups extremely vulnerable to the weaknesses of the state run educational system. Because of the disadvantaged social status and the greater poverty of the Roma people the problems of the public educations affects them more severely. This is demonstrated by two facts. First, Roma minority spends much less years in studying - average of 5 years versus 10.33 years for Bulgarians and 6.65 for Turkish minority. Considering

Costs of Discrimination – Philip Gounev This is only a draft paper and can be quoted only with the author’s permission.
Created on 8/1/2004 4:37:00 PM 17
the fact that most of the Roma children study in schools with predominantly Roma presence where the quality of education and teacher’s requirements toward the students seem to be much lower (Zheliaskova), the length of education of Roma children in terms of acquired knowledge should be even lower. Although on the surface, one could probably argue that if the Roma study on the average five years less, the government is “saving” from having less students, this is probably not true. First, because the infrastructure, i.e. the schools are maintained anyway by the municipalities, since there are children in school age in the school district. Secondly, the teacher staff is unlikely to increase if all Roma children start going to school, because due to the decreasing number of children from other ethnic groups there are many teachers whose salaries are paid even if there are no jobs for them. (I plan to substantiate this argument with data and evidence. For now these are my observations from my visits to Plovdiv and Varna). The graph below shows that 18% of the Roma have no education. This number for the Bulgarians is 3.6%. About 42% of the Roma complete middle school, 8%-secondary school, and 0.17% have university degree.
Education- by ethnicity
05
101520253035404550
No studies Daycare Preschool Elementary MiddleSchool
SecondaryEducation
University Otheroccupation-
specificeducation
Educational level
% o
f the
sam
ple
RomaTurksBulgarian
These numbers are quite disturbing and they show major loss of human capital. Combined with the fact that the Roma minority has the highest birth rate and population growth, these numbers indicate that keeping the same trends, the illiteracy and lack of adequate education will lead of even greater percentage of uneducated people in the future.
The second reason for the Roma minority to be more severely affected by the problems that persist in the education in Bulgaria is the fact that they are more dependent on the state in obtaining adequate education than the majority group. This is due to the fact that they are more financially constrained to send their kids to additional training or tutoring. About 12% of the Bulgarians who are still studying respond that they have tutoring in addition to the school. This number for the Roma minority is only 2% (5 people). The payment made for these additional tutoring is almost 3 times greater for the

Costs of Discrimination – Philip Gounev This is only a draft paper and can be quoted only with the author’s permission.
Created on 8/1/2004 4:37:00 PM 18
Bulgarian children than for Roma children. The amount spent for textbooks is 4.68 times greater for the Bulgarian children than Roma children. Other expenses such as school meals and extra-curricular activities are also much greater for Bulgarians than for Roma. This shows that the Bulgarian families are more able and willing to allocate money from their budget to finance the education of their children than the Roma families are. This, accordingly, makes the Roma children more dependent on the state in obtaining their education.
Since the Roma minority is more dependent on the state in obtaining their education and is more likely to interrupt school at early age, it would make sense for the government to allocate additional finances and create greater incentives for the Roma children to stay at school. The Bulgarian families are more willing and able to invest in the education of their children not only because they are wealthier, but also because they value education more than the Roma families do. According to Zheljazkova’s report the most common motives for the parents from Stolipinovo, Plovdiv to send their boys to school is to acquire enough literacy in order to pass the driving license exam. For the girls the most widespread reason to attend school is to find a marriage partner. Bulgarians, on the other hand, assess the opportunities that the good education offers more positively than the Roma people. The Agency for Social Analyses (page 22) the pessimism for the development of the country and for the opportunities for work and improvement of the financial situation are greater among the less qualified and less educated people to which the Roma minority belongs. The more educated people are more optimistic about the future development of the country. It is well known that the value that a person puts on education comes with the opportunities that it offers. Since Bulgarians see more opportunities for their children in the future because they have better qualifications and education they will put more value to their children’s education. If the parents are poorly educated they do not have the ability to assess the importance of the education for the well-being of the individual and they are, therefore, less motivated to send their kids to school and encourage them to work hard (what is left for investing in their kids’ education). This explains why Bulgarians are more willing to invest in their children’s educations and why Bulgarian children study more years than the Roma children. The efficiency argument would then require investing more in the education of Roma minority in order to increase the value that they put in education, which would lead to a greater investment in education on their site in the future.
The way the education argument could be structured is to argue that the government is underspending in Roma education first because it invests less in schools, which have predominantly Roma children. You do not really need to have a specific number to support this claim. You could use the report written by Zheljaskova where it is written that the facilities and the level of education in the Roma schools are much worse than in other schools (page 8). If you can get actual numbers it will be even better. I guess that the response to this argument would be that the government’s policy is to desegregate the Roma schools, which would result in equal spending for all students independent of their ethnicity. However, the absolute level of spending is not the one that really matters in this case. What is important is to achieve a level of spending, which would create enough incentives on the site of the population to invest more in education. Because the value that one puts in education is positively correlated with the level of education that one has, it follows that it would require even greater spending on Roma

Costs of Discrimination – Philip Gounev This is only a draft paper and can be quoted only with the author’s permission.
Created on 8/1/2004 4:37:00 PM 19
students. This strategy would reduce the future spending on Roma education since the Roma population will be willing to invest more in their children’s education once they start valuing education more. In this way the current increase in spending on education for Roma minority would prove to be the cost efficient strategy in the long term. 5. Health
According to the survey completed by I. Tomova “Gypsies in the Transition Period,” the average life expectancy of the Roma minority is 10 years lower than for the rest of the population. The reasons for that are complex. Poor living conditions, the lack of education about preventive measures and hygiene, the lack of money to pay for health services and many others play a major role in the deteriorated health condition of the Roma population. The first fact that is striking when discussing Roma health is the positive assessment that the Roma persons give about their own health. Approximately 70% of the interviewed Roma from a sociological survey assess their health in the range of good, very good, and excellent (“Ensuring Minority Access To Health Profile”). In the Bulgarian Integrated Household Survey only 20.5% of Roma respondents reported disability or illness during the last year. This number for the Bulgarian respondents is 31.3%. To the question concerning the disabilities and the chronic diseases of the respondents there is no major trend in the health problems declared by the Roma minority:
Health problems for the last year
0
5
10
15
20
25
30
35
40
neuro
logica
l
eye_
problem
s
heari
ng_pro
blems
heart
respira
tory
high_b
lood
stomac
h
kidne
ys
diabete
s
female
_prob
lems
male_p
roblems
skin
mental
locom
otory
arthri
tis
traum
a
infec
tions
lasting
_cold
others disabilities
perc
enta
ge o
f all
disa
bilit
ies
BulgarianTurksRoma
Roma suffer somewhat more from infections than the other two groups. 8% of the Roma who respond that they had experienced health problems during the last year identify as having an infection. This number is quite high compared to 1.83% for Turks and 0.85% for Bulgarians. This is most probably due to the poor living conditions that dominate

Costs of Discrimination – Philip Gounev This is only a draft paper and can be quoted only with the author’s permission.
Created on 8/1/2004 4:37:00 PM 20
among Roma minority. Another problem that prevails among the Roma and Turkish groups is the lasting cold. 15% of Roma and 17.4% of Turks indicate suffering from lasting cold during the last year. This number is 8.7% for Bulgarians. People from Roma origin also suffer quite often from heart diseases, respiratory diseases, stomach and kidney diseases. Judging the health status of Roma minority by the self-assessment of the respondents leads to the conclusion that the warnings of severe problems in the Roma health status are highly exaggerated. However, the observation of the Roma health status using personal health records and evaluations of medical staff indicates that 80% of Roma households include a person with a disease (“Ensuring Minority Access To Health Profile”). According to the same survey one-third of the households have 3 or more persons with health problems and in 5% of the households-5 or more people suffer from some disease. This discrepancy of the respondent’s evaluation of their health and the medical staff evaluation creates a severe problem. From the respondent’s answers one can conclude that very often people from Roma origin ignore their health problems until they become a serious threat for them. From the Household Survey it becomes clear that 11 % from the Roma in the survey had a consultation within the last four weeks (for Bulgarians-16%, Turks-9.5%). 77.5% of the consultations are due to an illness and in only 19% of the cases the reason for the consultation was a check up. For comparison, 54% of the Bulgarians had a consultation due to an illness and 40% visited their GP for a check-up. These numbers are 50% and 46% for the Turkish minority group. The reason for Roma people to ignore their health and visit the doctor only when their health problem evolves into a serious illness is mainly their poverty. According to the Open Society report concerning Roma health issues, 90% are not able to afford the compulsory fee paid to their GP for the visit. Therefore, most of the people wait until the visit to the doctor becomes inevitable. The health problems that result from postponing the treatment are much more severe and more expensive to be treated. Thus, the end result is that the subsidized health system ends up spending more money for the Roma minority than it would have spent if people visited their doctor in a timely manner. 6. Housing Living conditions are one of the most important factors that influence health. It is well know that Roma people usually live in poor neighborhoods exposed to unfavorable living conditions. According to the Bulgarian Integrated Household Survey the number of people living in a single dwelling is almost twice as much for Roma population compared to the Bulgarian population (5.23 for Roma and 2.91 for Bulgarians). The average size of the dwelling for Roma households is 57.4 sqm. versus 76.3 for the Bulgarian households, which shows that the overcrowding is a very severe problems in Roma neighborhoods. About 8% of the respondents identified as Roma respond that their dwelling is not meant for living purposes. This response was given by only 2% of Turks and 0.4% of Bulgarians in the survey. All of the respondents in the survey that they have water supply. However, 53% of Roma indicate that the tab is located outside the building. For Bulgarians this percentage is 5.4% and for Turkish minority group- 24%. Another fact

Costs of Discrimination – Philip Gounev This is only a draft paper and can be quoted only with the author’s permission.
Created on 8/1/2004 4:37:00 PM 21
that is also indicative of the worse living conditions in the Roma households is that 87% do not have an indoor WC (29% for Bulgarians and 74%-Turks). Only 39% of Roma households have their garbage collected by a garbage truck (Bulgarians-80%, Turks-41.4%). A telephone in the dwelling is also luxury that only 12.4% of the Roma household can afford (Bulgarians-80.6% and Turks-55%). 7. Employment The illiteracy and the health problems that are widespread among the Roma children generate more problems once they become adults. Many studies, including Bulgarian Integrated Household Survey, show that on average the working people from Roma minority group have less prestigious jobs and receive lower wages than the rest of the Bulgarian population. Only people who are 16 or above are included in the employment file. The people in the survey from Roma origin who work for a salary or commission for an employer are usually performing physical labor related professions that are worse paid. These include construction, wood yielding and processing, tailoring, agriculture and others. There are no representatives of the Roma ethnic group in the data set who have leadership positions or jobs requiring higher education such as managers, technical experts, research and development experts, economists. There is only one Roma person who works as a legal staff. In comparison 34.5% of the Bulgarians in the survey that are working have professions that are considered more intellectual. These include professions that require higher education and specific skills. For the Turkish minority the percentage of people who have better paid intellectual professions is 4%. In the sociological survey by ASA (Agency for Social Analyses) 10% of the Bulgarians respond that they monitor the work of other people. This answer is given by only 3% of Turks and 1.9% of Roma minority (page15). The fact that Roma and Turkish population usually has less prestigious jobs plays a major role in creating large income gap between the two minority groups and the rest of the Bulgarian population. The average wage for the working Roma minority in the survey is 143 levs. For Bulgarians the average wage is 226, and for Turkish minority-166.2 levs. The length of employment also differs among the ethnic groups. The table below summarizes the type of employment that the working individuals in the survey have: % of working individuals Type of employment Roma Bulgarian Turk Permanent Dependent Job 42.30769 72.2335 40Temporary Job 47.11538 18.73096 42.6087Own Business 8.653846 8.426396 6.086957Other (farm or helping friends) 0.961538 0.507614 11.30435Refusal to answer 0.961538 0.101523 0Total 100 100 100
The percentage of Roma and Turks who have permanent jobs is very small compared to the Bulgarians. Most of the representatives of the two minority groups have temporary jobs, which often lack employment contracts. This tendency is shown also by the survey completed by the ASA where 40.3% of the Bulgarians aged 15 and older have a full time

Costs of Discrimination – Philip Gounev This is only a draft paper and can be quoted only with the author’s permission.
Created on 8/1/2004 4:37:00 PM 22
job (page 15). For Roma this number is 15.8% and for Turks-25%. The temporary employment dominates among 0.9% of Bulgarians and 2.5% of Roma (These numbers are quoted as a percentage of all people in the survey and should not be confused with the numbers given in the table above that represent percentage of working people with different type of employment). This, of course, makes securing the income necessary for the survival of the minority households more uncertain. Because of that the environment, in which the minority group lives, is much more stressful. Roma households concentrate mainly on the basic needs for the survival of their family. In these conditions investing in improvement of living conditions or the education of their children is unthinkable because no long term budgeting is possible. This constitutes one more reason for the Roma and Turkish households to be less willing to invest in their children’s education. Concentrated on the basic needs of the every day life, education seems a luxury that has no place in the constantly fluctuating household budget.
The national economy is losing a lot of money in terms of opportunity cost of the unemployed Roma. This cost includes the greater amount of taxes that the government could have collected if more Roma people were employed. The table below summarizes the information about the average taxes and the percentage of people who pay taxes from the three ethnic groups: Roma Bulgarians Turks Number of people who paid taxes from main employment 44 1143 34Average taxes paid 30,01 49,18 38,52Percentage of people with main job who pay taxes 45,36 60,28 32,07Number of people who pay taxes from self-employment 3 60 1Average taxes paid 445 521 140Percentage of self employed people who pay taxes 30 32,6087 12,5Percentage of population above 16 that pays taxes 6,2 23,2 8,9 The percentage of Roma above 16 that pay taxes is 3.75 times lower than the percentage of Bulgarians. This constitutes a large loss of revenue for the government. If the same percentage of Roma above 16 as Bulgarians paid taxes, the government would collect 1 155 421 levs more in taxes per month. This constitutes 13 865 047 levs loss of tax revenue each year. This estimate is very conservative since it uses the data obtained from the population census in 2001, which is the smallest estimate of the size of the Roma minority. If the percentage of Roma people was 7% as calculated using the Household Survey (look at table on page 2), this number would be 21 106 418. Second, it assumes that the increase of employment among Roma people will not be accompanied with an increase of average wage for the minority and thus the average taxes paid will remain the same, which are 39% lower than the average taxes paid by Bulgarians. Third, this estimate assumes that all of the Roma will be employed by somebody else and will not be self-employed. The average taxes paid by the self-employed Roma are almost 15 times greater than the average taxes paid by the Roma people working for an employer. Last but not least, this estimate does not take into account that a greater percentage of Roma are within the working age group than the Bulgarian population since a much greater percentage of Bulgarians above 16 are pensioners.

Costs of Discrimination – Philip Gounev This is only a draft paper and can be quoted only with the author’s permission.
Created on 8/1/2004 4:37:00 PM 23
Social Benefits Unemployment The lower level of education of the two main minority groups (Roma and Turks) results not only in concentration of the minority in less paid and lower qualified job, but also in greater unemployment and poverty among these ethnic groups. Only 13.7% of Roma aged above 16 in the survey respond that they have worked in the last 7 days. This number is 38% for Bulgarians in this age group and 29.6% for Turks. The table below shows the major reasons indicated by the respondents for not working in the last week. % of nonworking individuals Reason for not working Roma Bulgarian Turk Temporary interruption 0.45 3.03 1.76Sickness/disability 3.06 1.94 4.24Education 2.14 8.82 3.88Retirement 13.47 57.51 28.97No job 15.16 1.84 3.53Maternity/Housekeeping 5.81 2.78 9.54Currently looking for work 58.19 20.66 44.87Other reason 1.68 3.38 3.18Total 100 100 100
Form the Roma who have not been working in the last week, only 19% indicate as a major reason for not participating in the labor force either temporary sick leave, maternity leave or vacation (0.46%) , or more long-term reason such as sickness, disability, education or retirement (18.6%). For Bulgarians the percentage of people who are not working because they are involved in education activities is four times higher than for Roma minority (2.27 times greater than the Turkish minority). The major reason for the Bulgarians not to work is retirement, which is not surprising considering the demographic characteristics of the Bulgarian population. The percentage of Roma that is discouraged from the labor market conditions and responds that the reason for not working is that there is are no jobs available, is much higher than the Bulgarians and the Turks who give similar response. This means that in general Roma population’s evaluation of its own chances of finding a job is lower than Bulgarians’ and Turks’ assessment of their own working opportunities. Nevertheless, the majority of nonworking Roma responds that they are currently looking for a job (58.19%). The high percentage of nonworking Roma who are looking for a job compared to the percentage of nonworking Bulgarians who give the same response is partially due to the fact that Roma minority consists of more people who are at a working age. 64% of the Roma who are looking for a job are also registered with the Labor office. This percentage for Bulgarians is 51% and for Turks-50.4%. The greater percentage of Roma registered with the Labor office might be due to the fact that Roma are more dependent on unemployment benefits for their survival. 42.5% of the registered Roma receive some form of unemployment benefits (Bulgarians-37%; Turks-20.3%). The average length of job search also varies greatly among the ethnic groups. For Roma minority it is 48.23 months, For Bulgarians-22.72 and for Turks-42.7.
Not all people who are currently looking for a job and are registered with the labor office are eligible to receive unemployment benefits. From the figures above it is
Costs of Discrimination – Philip Gounev This is only a draft paper and can be quoted only with the author’s permission.
Created on 8/1/2004 4:37:00 PM 24
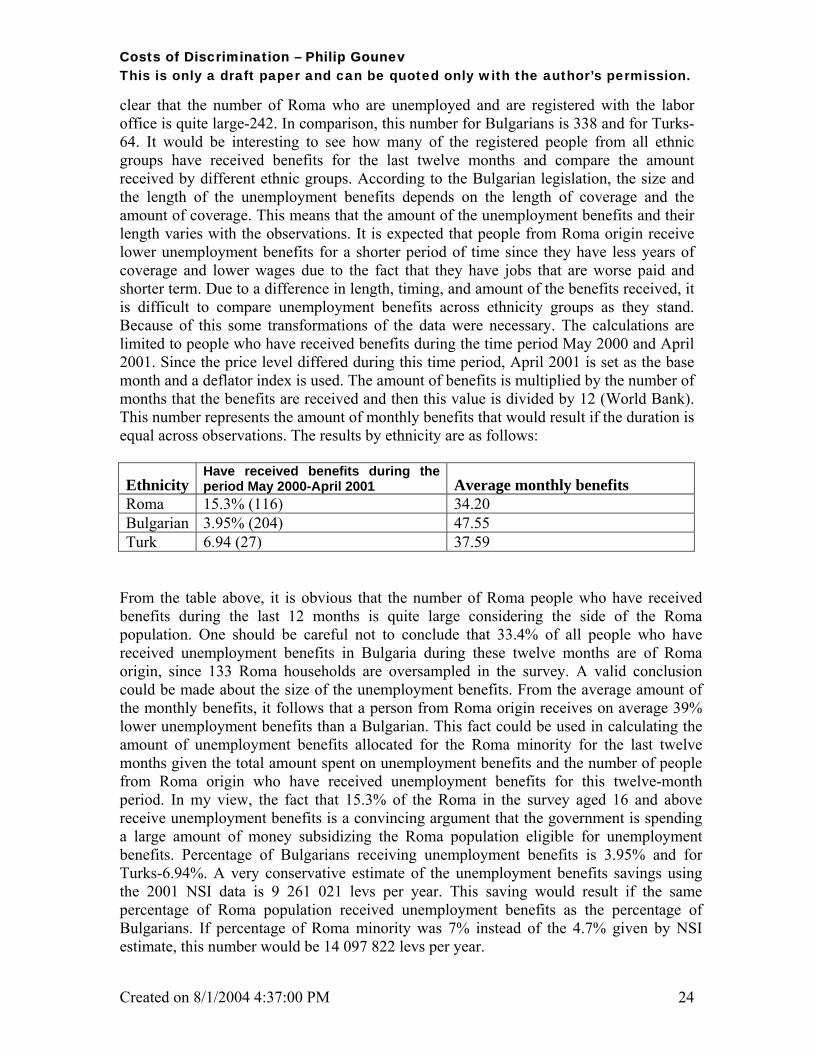
clear that the number of Roma who are unemployed and are registered with the labor office is quite large-242. In comparison, this number for Bulgarians is 338 and for Turks- 64. It would be interesting to see how many of the registered people from all ethnic groups have received benefits for the last twelve months and compare the amount received by different ethnic groups. According to the Bulgarian legislation, the size and the length of the unemployment benefits depends on the length of coverage and the amount of coverage. This means that the amount of the unemployment benefits and their length varies with the observations. It is expected that people from Roma origin receive lower unemployment benefits for a shorter period of time since they have less years of coverage and lower wages due to the fact that they have jobs that are worse paid and shorter term. Due to a difference in length, timing, and amount of the benefits received, it is difficult to compare unemployment benefits across ethnicity groups as they stand. Because of this some transformations of the data were necessary. The calculations are limited to people who have received benefits during the time period May 2000 and April 2001. Since the price level differed during this time period, April 2001 is set as the base month and a deflator index is used. The amount of benefits is multiplied by the number of months that the benefits are received and then this value is divided by 12 (World Bank). This number represents the amount of monthly benefits that would result if the duration is equal across observations. The results by ethnicity are as follows:
Ethnicity Have received benefits during the period May 2000-April 2001 Average monthly benefits
Roma 15.3% (116) 34.20 Bulgarian 3.95% (204) 47.55 Turk 6.94 (27) 37.59
From the table above, it is obvious that the number of Roma people who have received benefits during the last 12 months is quite large considering the side of the Roma population. One should be careful not to conclude that 33.4% of all people who have received unemployment benefits in Bulgaria during these twelve months are of Roma origin, since 133 Roma households are oversampled in the survey. A valid conclusion could be made about the size of the unemployment benefits. From the average amount of the monthly benefits, it follows that a person from Roma origin receives on average 39% lower unemployment benefits than a Bulgarian. This fact could be used in calculating the amount of unemployment benefits allocated for the Roma minority for the last twelve months given the total amount spent on unemployment benefits and the number of people from Roma origin who have received unemployment benefits for this twelve-month period. In my view, the fact that 15.3% of the Roma in the survey aged 16 and above receive unemployment benefits is a convincing argument that the government is spending a large amount of money subsidizing the Roma population eligible for unemployment benefits. Percentage of Bulgarians receiving unemployment benefits is 3.95% and for Turks-6.94%. A very conservative estimate of the unemployment benefits savings using the 2001 NSI data is 9 261 021 levs per year. This saving would result if the same percentage of Roma population received unemployment benefits as the percentage of Bulgarians. If percentage of Roma minority was 7% instead of the 4.7% given by NSI estimate, this number would be 14 097 822 levs per year.

Costs of Discrimination – Philip Gounev This is only a draft paper and can be quoted only with the author’s permission.
Created on 8/1/2004 4:37:00 PM 25
Retirement benefits For the money spent by the government on the old age pensions, it could be argued
that the amount spent on the minority’s pension is quite small for two reasons. First, the low life expectancy for Roma minority decreases substantially the number of people who are eligible to receive old age pension. Second, because the size of the pension depends on the salary received during the working period and the years of employment, even the people who reach the retirement age receive lower pensions than the rest of the Bulgarian population. The table below summarizes the pension statistics from the Household Survey.
Roma Bulgarians Turks Number of people receiving pension 66 1823 70Percentage receiving pension 5.37 29.23 12.72Retirement age 54 55 55Pension received last month 62 81 64
The percentage of Bulgarians who receive old age pension is 5.44 times greater than the percentage of Roma who receive pension. As expected, the average pension is 30.5% higher for the Bulgarians in the survey than for Roma minority. For the disabilities’ and survivors’ pensions the results obtained from the Household Survey are somewhat surprising. I expected that the percentage of Roma who receive disability pension to be higher than the same percentage for Bulgarians. The table below summarizes the results: Roma Bulgarians Turks Number of disabled receiving pension 33 180 22 Percentage receiving pension 2.68 2.88 4 Disability 1 4 71 4 Disability 2 17 75 11 Disability 3 12 34 6 Refusal to answer\ 0 0 1 Dis 1- average monthly payment 44.75 58.16 76.75 Dis 2- average monthly payment 45.68 48.53 51.90 Dis 3- average monthly payment 39.18 60.21 45.5
The percentage of Roma receiving disability pensions is roughly the same as the percentage of Bulgarians. It might be partially due to the fact that Roma people assess own their health more positively than the medical specialists do. Many of the Roma then might not be aware of the fact that they are eligible to receive disability pension. The average monthly payment is lower for the Roma minority of all three disability groups (maybe you should check whether the disability pension depends on the age of the disabled). A smaller percentage of Roma receive survivor’s pension compared to Bulgarians. The table below summarizes the results. Roma Bulgarian Turk Number receiving survivor's pension 28 396 18
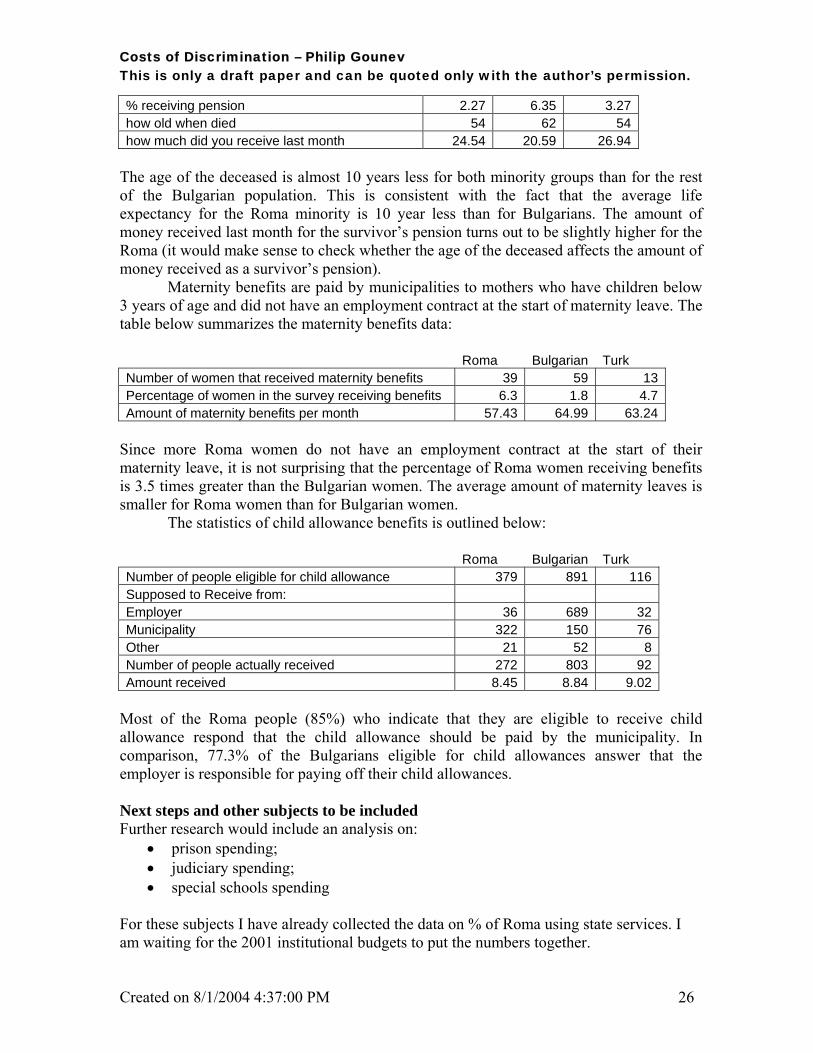
Costs of Discrimination – Philip Gounev This is only a draft paper and can be quoted only with the author’s permission.
Created on 8/1/2004 4:37:00 PM 26
% receiving pension 2.27 6.35 3.27 how old when died 54 62 54 how much did you receive last month 24.54 20.59 26.94
The age of the deceased is almost 10 years less for both minority groups than for the rest of the Bulgarian population. This is consistent with the fact that the average life expectancy for the Roma minority is 10 year less than for Bulgarians. The amount of money received last month for the survivor’s pension turns out to be slightly higher for the Roma (it would make sense to check whether the age of the deceased affects the amount of money received as a survivor’s pension). Maternity benefits are paid by municipalities to mothers who have children below 3 years of age and did not have an employment contract at the start of maternity leave. The table below summarizes the maternity benefits data: Roma Bulgarian Turk Number of women that received maternity benefits 39 59 13Percentage of women in the survey receiving benefits 6.3 1.8 4.7Amount of maternity benefits per month 57.43 64.99 63.24
Since more Roma women do not have an employment contract at the start of their maternity leave, it is not surprising that the percentage of Roma women receiving benefits is 3.5 times greater than the Bulgarian women. The average amount of maternity leaves is smaller for Roma women than for Bulgarian women. The statistics of child allowance benefits is outlined below: Roma Bulgarian Turk Number of people eligible for child allowance 379 891 116 Supposed to Receive from: Employer 36 689 32 Municipality 322 150 76 Other 21 52 8 Number of people actually received 272 803 92 Amount received 8.45 8.84 9.02
Most of the Roma people (85%) who indicate that they are eligible to receive child allowance respond that the child allowance should be paid by the municipality. In comparison, 77.3% of the Bulgarians eligible for child allowances answer that the employer is responsible for paying off their child allowances. Next steps and other subjects to be included Further research would include an analysis on:
• prison spending; • judiciary spending; • special schools spending
For these subjects I have already collected the data on % of Roma using state services. I am waiting for the 2001 institutional budgets to put the numbers together.

Costs of Discrimination – Philip Gounev This is only a draft paper and can be quoted only with the author’s permission.
Created on 8/1/2004 4:37:00 PM 27
References (these are some of the refences I have used so far, there are quite a bit more to be added, especially to the second part). Abramo, L. and Todaro, R. (2002), Examining a Myth: Labour Costs for Men and Women in Latin America, Lima, ILO. Agarwal, N. (1982), Economic Costs of Employment Discrimination, Commission on Equity, Government of Canada. Ashenfelter, 0. and Pencavel, J. (1976), Estimating the Effects on Costs and Price of the Elimination of Sex Discrimination: The Case of Telephone Rates, in Phyllis A Wallace, Equal Employment Opportunity and the AT&T Case, Cambridge MIT Press, pp.111-122. Bartelme, T. (2001), Wanted: Government Business (Black Companies Land Fewer Projects), The Post and Courier. Bates, M. and Este, D. (2000), Creating Workplace Environments that Reflect Human Rights Values, Cultural Diversity Institute, University of Calgary. Becker, G. (1957, 1971), The Economics of Discrimination, Chicago University Press, Chicago, IL. Bergmann, B.R. (1971), The Effect on White Incomes of Discrimination in Employment, Journal of Political Economy, Vol. 79, March-April, pp.294-313. Brimelow, P. and Spencer, L. (1993), When Quotas Replace Merit, Everybody Suffers, Forbes Magazine, February 15. Brimmer, A. (1993), Economic Cost of Discrimination against Black Americans, Paper presented before the North American Economics and Finance Association, Anaheim, California and in Simms, M. (1995), Economic Perspectives on Affirmative Action, Joint Center for Political and Economic Studies. Brimmer, A. (1993), The Economic Cost of Discrimination, Black Enterprise, November Edition. Browne, R. (1972), Wealth Distribution and Its Impact on Minorities, The Review of Black Political Economy, Vol.4, No. 4, pp. 27-37. Dunnette, M.D. and Motowidlo, S.J. (1982), Estimating Benefits and Costs of Anti-Sexist Training Programs in Organizations, in Bernardin, H.J., Women in the Work Force, New York, Praeger, pp. 156-182. Economist, The (2003), The price of equality, November 13th Edition. Goldston, J. (2002), Roma Rights, Roma Wrongs, Foreign Affairs, March-April, v81, i2, p!46. Gurr, T.R. (2003), Minorities at Risk Data, http://www.cidcm.umd.edu/inscr/mar. International Labour Organization (2003), Time for Equality at Work: Global Report under the Follow-up to the ILO Declaration on Fundamental Principles and Rights at Work, International Labour Conference, 91st Session. Johnes, G. and Sapsford, D. (1996), Some Recent Advances in the Economic Analysis of Discrimination, International Journal of Manpower, Vol. 17, No. 1. McCoy, F. (1994), Rethinking the Cost of Discrimination, Black Enterprise, January Edition. Kovats, M. (2001), Opportunities and Challenges - EU Enlargement and the Roma/Gypsy Diaspora, http.7/www.eumap.org.

Costs of Discrimination – Philip Gounev This is only a draft paper and can be quoted only with the author’s permission.
Created on 8/1/2004 4:37:00 PM 28
Lowery, M. (1995), The War on Equal Opportunity, Black Enterprise, February, v25, n7, p!48. Maltby, L. (2000), Brave New Workplace: Genetic Breakthroughs and the New Employment Discrimination, University of Colorado Medical School. Performance and Innovation Unit (2000), Winning the Generation Game. Sharp, A., Grimes, P., Register, C. (1996), Economics of Social Issues, McGraw-Hill / Irwin Shenggen Fan, Pham Lan Huong, Trinh Quang Long (2003), Government Spending and Poverty Reduction in Vietnam, Project report prepared for the World Bank funded project "Pro-poor spending in Vietnam", by International Food Policy Research Institute, Washington DC, and Central Institute for Economic Management, Hanoi. Simms, M. (1995), Economic Perspectives on Affirmative Action, Joint Center for Political and Economic Studies. Truche, P. (2000), Policies and practices to combat racism and related discrimination at sub-national and national levels, Report of Working Group II, European Contribution to the World Conference Against Racism, Racial Discrimination, Xenophobia and Related Intolerance, Strasbourg, 11-13 October. UNFPA (2000), State of World Population Report. Verheugen, G. (2002), Enlargement: Hungarian Minorities a Big Problem, Verheugen Admits, European Report, Feb 23, p501. Wattenberg, B. and Scammon, R. (1973), Black Progress and Liberal Rhetoric, Commentary. World Bank Policy Research Report (2001), Engendering Development — Through Gender Equality in Rights, Resources, and Voice.