Embed Size (px)
Citation preview
Costs of Doing Business in Ireland 2017 June 2017

Costs of Doing Business 2017
1
2
Introduction to the National Competitiveness Council
The National Competitiveness Council (NCC) reports to the Taoiseach and the Government, through the
Minister for Jobs, Enterprise and Innovation on key competitiveness issues facing the Irish economy and offers
recommendations on policy actions required to enhance Ireland’s competitive position. Each year the NCC
publishes two annual reports:
Ireland’s Competitiveness Scorecard provides a comprehensive statistical assessment of Ireland's
competitiveness performance; and
Ireland’s Competitiveness Challenge uses this information along with the latest research to outline the
main challenges to Ireland’s competitiveness and the policy responses required to meet them.
As part of its work, the NCC also:
Publishes the Costs of Doing Business where key business costs in Ireland are benchmarked against costs
in competitor countries; and
Provides an annual Submission to the Action Plan for Jobs and other papers on specific competitiveness
issues.
The work of the National Competitiveness Council is underpinned by research and analysis undertaken by the
Strategic Policy Division of the Department of Jobs, Enterprise and Innovation.
Costs of Doing Business 2017
3
National Competitiveness Council Members
Professor Peter Clinch Chair, National Competitiveness Council
Pat Beirne Chief Executive Officer, Mergon Group
Kevin Callinan Deputy General Secretary, IMPACT Trade Union
Micheál Collins Assistant Professor of Social Policy, University College Dublin
Isolde Goggin Chair, Competition and Consumer Protection Commission
Cathríona Hallahan CEO/Managing Director (Ireland), Microsoft
Declan Hughes Assistant Secretary, Department of Jobs, Enterprise and Innovation
Jane Magnier Joint Managing Director, Abbey Tours
Danny McCoy Chief Executive Officer, Ibec
Seán O'Driscoll President, Glen Dimplex Group
Margot Slattery Country President, Sodexo Ireland
Martin Shanahan Chief Executive, IDA Ireland
Julie Sinnamon Chief Executive, Enterprise Ireland
Ian Talbot Chief Executive, Chambers Ireland
Patrick Walsh Managing Director, Dogpatch Labs
Jim Woulfe Chief Executive, Dairygold Co-Operative Society Limited
Council Advisers
Patricia Cronin Department of Communications, Climate Action and Environment
Kathleen Gavin Department of Education and Skills
John McCarthy Department of Finance
Conan McKenna Department of Justice and Equality
David Moloney Department of Public Expenditure and Reform
Ray O’Leary Department of Transport, Tourism, and Sport
John Shaw Department of the Taoiseach
Kevin Smyth Department of Agriculture, Food and the Marine
David Walsh Department of Housing, Planning, Community and Local Government
Research, Analysis and Administration
Marie Bourke Department of Jobs, Enterprise and Innovation
Eoin Cuddihy 23 Kildare Street, Dublin 2, D02 TD30
John Maher Tel: 01 6312862
Email: [email protected]
Web: www.competitiveness.ie
4
Table of Contents
Executive Summary 5
Chapter 1 –Introduction and Methodology 12
Chapter 2 – How Do Costs Impact on Enterprise? 14
Chapter 3– How Does Ireland Perform? 21
Chapter 4 – Labour Costs 27
Chapter 5 – Property Costs 35
Chapter 6 – Transport Costs 40
Chapter 7 – Utility Costs 43
Chapter 8 – Credit and Financial Costs 48
Chapter 9 – Business Services and Other Input Costs 51
Chapter 10 – Broader Costs Environment 55
Costs of Doing Business 2017
5
Executive Summary
National Competitiveness
National competitiveness is a broad concept that encompasses a diverse range of factors, essential conditions
and policy inputs including education and training, innovation, clusters and firm sophistication, Ireland’s
economic and technological infrastructure, and the business environment (which includes entrepreneurship,
taxation and the regulatory framework). The National Competitiveness Council defines competitiveness as the
ability of firms based in Ireland to compete in international markets. Competitiveness is not an end in itself,
but is a means of achieving sustainable improvements in living standards and quality of life. Only by ensuring
that firms based in Ireland can compete successfully here and abroad can we create the employment, income
and wealth necessary to improve the lives of all of our citizens.
Cost Competitiveness
In terms of business costs, as a small open economy, dependent on exports and foreign investment as major
drivers of growth, our relative cost competitiveness is a significant determinant of our overall competitiveness,
and ultimately of our economic prosperity, employment and our standard of living. High business costs make
Ireland less attractive for mobile inward investment and reduce the competitiveness of Irish enterprises’ goods
and services trading in both domestic and international markets. More broadly, a more competitive cost base
can help to create a virtuous circle between inflation, wage expectations and cost competitiveness.
The Cost of Doing Business 2017 report focuses on those costs which affect business most and concentrates
on costs that are largely domestically determined. It specifically focuses on Irish enterprise costs that are out
of line with those in key competitor countries .The analysis and data reported are subject to availability. Based
on the summary cost profiles considered in Chapter 2, it is clear that the cost of labour is the most significant
driver of business costs for most firms – particularly for services firms. Since labour costs are generally the
most significant cost component for most firms, the relationship between labour costs and consumer prices is
a major determinant of Ireland’s overall cost competitiveness. Overall labour cost growth has remained
modest in recent years and well below the growth experienced in both the UK and the EU28. However, this
masks considerable divergence at sectoral level. As the labour market tightens further, upward pressures on
labour costs can expect to increase. These will vary between sectors and be dependent on the supply and
demand for labour.
From an enterprise perspective, it is important that the taxation system is balanced, broad and provides
certainty in a manner that supports and rewards employment. The Irish income tax system is the most
progressive in the EU. Ireland’s highest rate of income tax starts to apply at just below the average industrial
wage; by comparison the UK top marginal rate applies at 4.2 times the average industrial wage. Entry to the
higher rate of income tax in Ireland occurs at a relatively low level - the standard rate band threshold for a
single individual of €33,800 is below the national average wage of €36,899 (Q4, 2016). OECD analysis shows
the average single worker in Ireland faced a net average tax rate of 19.7 per cent in 2015, compared with the
OECD average of 25.5 per cent and 23.4 per cent in the UK. In Ireland, a single worker on the average industrial
wage, after tax and benefits, was 80.3 per cent of their gross wage, compared with the OECD average of 74.5
per cent and 76.6 per cent in the UK. Ireland’s marginal tax rate is high relative to the UK and 20 per cent
higher than the EU28 average. Figure 18 shows that marginal rates in Ireland are competitive at lower wage
levels but high for individuals earning the average wage or above. At 54.4 per cent, the top marginal tax rate in
Ireland is high relative to the UK (49%), the OECD average (47%) and the US (43.6%).
Our relative cost competitive position will be negatively affected if wage growth outpaces productivity and
wage growth in competitor countries. To ensure that wages are sustainable, wage growth should not outpace
6
productivity growth. Productivity performance will assume an even more prominent role in driving Irish
international competitiveness. Indeed, in the longer term, productivity growth is the preferred mechanism to
improve competitiveness as it can support cost competitiveness in tandem with high and increasing income
levels. Relative to most OECD countries, Ireland’s productivity performance is strong in terms of growth and
levels of GDP per hour worked. However, Ireland’s overall productivity performance measured relative to GDP
is positively skewed by certain sectors. A narrow base of sectors (ICT and Manufacturing account for the
majority of productivity growth) leaving Ireland vulnerable to shocks. Increasing productivity across all sectors
and occupations, particularly in the indigenous economy remains a significant issue1.
After labour costs, facility or property costs represent the next significant cost factor in the profile of business
costs. For services sub-sectors, office lease costs represent 4 to 15 per cent of total location-sensitive costs.
For manufacturing sub-sectors, industrial lease costs range from 2 to 5 per cent of location-sensitive costs.
The availability and cost of commercial property in Ireland remains a significant threat to sustained cost
competitiveness. On the commercial side, annual growth rates in office rents in the 5 years to Q2 2016 in
Dublin 4/Dublin 6 were 14.1 per cent, significantly higher than comparable rates in the UK and the Euro area.
Concerns persist about the availability of prime office space for rent in large urban centres in the short term as
the market tightens and vacancy rates decline. New commercial supply is being absorbed quickly while
demand levels are expected to rise. These factors combined could equate to rents increasing further over the
short to medium term. In 2016 prime retail rents increased by 31.5 per cent in Ireland on average since 2014
and Ireland was the 5th most expensive location in the Euro area. Such rental price pressures combined with
the shortage of supply of commercial space over the past number of years could adversely impact on Ireland’s
competitiveness in attracting mobile inward investment and the expansion of existing Irish enterprises and
start-ups.
From a competitiveness perspective, the supply and affordability of residential housing is a component of
Ireland’s ability to compete internationally. It impacts upon the attractiveness of Ireland as a location for
investment and directly impacts on enterprise costs through wage effects, and indirectly determines the price
of Irish goods and services. The cost of housing (purchase and rent) influences labour mobility and contributes
to an economy’s ability to adjust to adverse economic shocks. In short, a well-functioning housing and
construction sector is critical to the overall health of society and the economy. The shortage of housing in
Ireland remains an impediment both to attracting mobile inward investment and the expansion of operations
by enterprises and is a critical infrastructure support job creation in both Dublin and the regions. Despite an
increase in construction activity and planning permissions residential property supply remains constrained.
Continued strong demand means property price inflation is likely to continue in the short term without
additional supply becoming available. The link between residential prices and rents, and wage expectations
means that developments in the residential property sector also have a direct impact on Ireland’s international
competitiveness. Average rents nationally are close to peak 2007 rates and even surpass them in certain areas.
In a distinct echo of the recent past, our housing market risks undermining our entire competitiveness
offering. While the ‘Rebuilding Ireland’ Plan presents a wide-ranging set of welcome commitments, many of
these will take time to implement and to effect change.
A reliable and competitively priced supply of energy is vital for business and its ability to compete successfully
in international markets. Utility and energy costs are an essential input to the entire enterprise base across
the State, both the internationally trading and domestic sectors of the economy. Utility costs can represent 1
to 7 per cent of location-sensitive costs2. Despite increasing investment in renewable energy, Ireland continues
1 For more see NCC’s Benchmarking Ireland’s Productivity Performance, 2017
2 The CSO’s Census of Industrial Production shows that energy costs for Irish enterprise, including SME’s, represents 1.57% of total costs.
Costs of Doing Business 2017
7
to have a very high dependence on imported fossil fuels, particularly oil on which 48 per cent of our energy
consumption is based. As a small peripheral EU economy, with limited resources, factors outside of our control
such as international oil prices exert a significant influence on energy prices so it is essential that efforts
continue to focus on cost determinants within our control such as regulatory costs. The energy implications for
Ireland of Brexit could be significant given our dependence on energy imports from the UK, the source of 76
per cent of our oil imports. In terms of our electricity generation, 46 per cent is generated using natural gas,
and 96 per cent of our gas is imported from the UK. Ireland is characterised by high taxes on motor fuel and 58
per cent of total diesel costs are made up of various taxes, the 5th highest proportion in the Euro area. The
impact of these taxes is becoming more evident as the international price of oil increases.
Generally, water and waste water costs for enterprise in Ireland compare favourably to those in competitor
markets despite there being a significant variation between water and waste water tariffs across Local
Authorities. Ireland is relatively cost competitive for telecoms, although, concerns persist around quality and
the regional availability of high speed services.
Brexit also underscores the importance of Ireland’s logistics and transport sectors cost competitiveness. The
UK is the destination for 50 per cent of all maritime goods exports and 88.4 per cent of roll on/roll-off freight
traffic. Of the total amount of goods received at Irish ports in 2015, a third arrived from the UK. The proportion
of exports varies depending on the type of cargo involved. 85 per cent of roll-on/roll-off traffic arrived from the
UK while 41 per cent of liquid bulk originated in the UK. The implications of extra administrative costs and
tariffs, standards and regulations and customs on the transport of goods between Ireland and the UK could
negatively impact on indigenous exporters’ supply chains, and their capacity to competitively price products,
not only in the UK but domestically and in other international markets.
Access to competitively priced sources of finance is essential to facilitate enterprises establish, survive,
improve productivity and ultimately scale. Limited or costly credit damages the environment for
entrepreneurship, scaling and investment and amount to a competitive disadvantage for Irish enterprises. Irish
SMEs are still heavily reliant on bank loans with limited uptake of non-bank finance sources.
The determinants of the cost of credit in Ireland are complex and varied but the concentrated lending market
coupled with higher credit risk premiums in Ireland have been cited as the reasons for higher interest rates
here over the Euro area average. Irish interest rates on business loans have been consistently higher (and
more volatile) than equivalent Euro area rates and it is vital that the cost of credit is reduced to align Ireland
with rates in competitor countries. While many firms are understandably primarily concerned about accessing
credit rather than the cost of that credit, the interest rate differential between Ireland and the Euro area places
Irish based enterprises at a disadvantage. Central Bank analysis shows the Irish SME lending market is highly
concentrated with the three main lenders accounting for approximately 90 per cent of market share. The
CSO’s Access to Finance Survey, March 2016, indicates that there is a correlation between size and sector and
growth trajectory in successfully accessing finance. It also highlights how relatively few SMEs (particularly,
non-exporting SMEs) seek funding from non-bank sources: for example only 4.7 per cent of medium sized
enterprises looked for equity finance compared to 39.8 per cent of similar sized enterprises who looked for
bank finance. Further diversifying the lending market in Ireland and in turn increasing levels of private equity,
crowdfunding and venture capital funding remains a challenge.
Combined with the aforementioned domestically determined costs, infrastructural bottlenecks, skills
shortages and increasing levels of industrial unrest also present significant downside risks for Ireland and
these could potentially undermine national competitiveness, and ultimately growth.
8
Service and Broader Environment Price Competitiveness
The UK’s decision to leave the EU has imminent and far reaching consequences for Ireland’s economy and
brings into sharp focus the need for Ireland to maintain and improve our cost competitiveness. Ireland’s
current price profile could be described as ‘high cost, rising slowly’, the UK is “high cost, rising quickly”. Price
levels in Ireland were 22.2 per cent more than the EU average in 2015; the UK was 33.3 per cent above the EU
average. Ireland needs to maintain and improve its relative cost competiveness.
In recent years, the weak Euro exchange rate, low ECB interest rates, and low international fuel prices have
driven improvements in Irish Harmonised Competitiveness Index (HCI) competitiveness. The nominal HCI
appreciated by 3.8 per cent on a year-on-year basis to November 2016. The real HCI increased by 2.3 per cent
when deflated with consumer prices, indicating a degree of diminishing Irish competitiveness. The openness
of the Irish economy means the competitiveness of the enterprise sector is particularly vulnerable to negative
price and cost shocks which are outside the influence of domestic policymakers. These include unfavourable
exchange rate movements, higher international energy prices or imported inflation from our major trading
partners. All of these competitiveness reducing variables have been evident over the past year. The recent
appreciation of the euro vis-à-vis Sterling provides a timely warning about just how vulnerable Irish firms are
to external shocks and further volatility and depreciation of Sterling represents a major threat to Irish export
competitiveness. Volatility in exchange rates can affect the Irish economy through a number of channels. It
may generate expenditure switching effects between foreign and domestic goods and services both at home
and in trade partners, thus affecting net exports, to the degree that nominal exchange rate changes are
absorbed by importers/exporters rather than passed on through increased prices, exchange rate movements
may also affect firms’ profit margins, with possible second-round effects on investment. Further volatility and
depreciation of Sterling remains a clear threat to export competitiveness. Irish policymakers cannot influence
exchange rates, and the trade performance of our small open economy will always be conditional on the ebb
and flow of global markets. However, a competitive, sustainable, cost base can provide a buffer against such
exchange rate fluctuations and other external factors such as international energy prices.
The international price of oil has almost doubled over the past 12 months3 and the favourable tailwind of low
international energy prices, which to date have countered increases in other domestic costs, is now
dissipating. The curbing of supply by OPEC, dwindling reserve levels and the fall-off in US shale oil production
have been cited as contributory factors.
Consumer price inflation - as measured by the Harmonised Index of Consumer Prices (HICP) – decreased
slightly in 2016 according to Eurostat. Despite low levels of inflation, Ireland remains a relatively high cost
location and the return to strong economic growth has resulted in a series of upward cost pressures in some
areas of the economy. Ireland compares favourably in HICP terms compared to the UK, US and the EU 28.
Inflation in Ireland was negative through much of 2016. Recent changes in the euro Sterling exchange rate,
and the impact of higher energy prices begins has seen inflation increase in early 2017 to 0.7 per cent in both
CPI and 0.6 per cent in HICP terms in March 2017. The UK’s new relationship with the EU post-Brexit will have
a significant bearing on inflation there over the next few years through several channels. UK inflation recently
soared to its highest level in two and a half years and is forecast to rise to 2.5 per cent in 2017. Much of the rise
to date reflects the elimination of past drags from food, energy and import prices, together with renewed rises
in oil prices. The projected path for inflation over the next three years in large part reflects the impact of higher
3 Despite this international oil prices are currently half the levels recorded over the period 2009-13 and the baseline reference here of $27 per barrel lasted for
less than 12 months.
Costs of Doing Business 2017
9
import prices following Sterling’s depreciation. Conversely, Irish inflation rates are forecast at 0.7 per cent in
2017 and 1.2 per cent in 2018.
The services sector is likely to remain the main source of upward price pressure in Ireland, with the price pass
through impact of exchange rates and an expected increase in energy prices in 2017 also possible sources of
upward pressure. In addition, residential property rents are also projected to increase due to continued
limited supply of residential property. Persistently high rates of consumer price inflation lead to expectations
of further price increases, and can create a vicious circle of increasing prices, reducing real incomes, increasing
wage demands and reduced international cost competitiveness. As a small open economy, any deterioration
in our cost competitiveness will have a major negative impact upon economic growth, employment and our
standard of living. Addressing any erosion in cost competitiveness must remain a key economic priority for
both enterprise and the Government.
Challenges for Policy Makers
As outlined in Ireland’s Competitiveness Challenge 2016, maintaining fiscal sustainability and a broad tax base;
supporting structural reform, innovation, and productivity; and growing our enterprise and export base will
remain significant immediate challenges for Irish policymakers. The Council has set out a number of key
recommendations for structural reform to address the national cost base in Ireland’s Competitiveness
Challenge 2016 report. These are summarised on page 10 of this report. Furthermore, there have been a
number of key policy developments over the past year or so across the areas of interest to the Council – the
development of the Action Plan for Housing and Homelessness, the National Rental Strategy, the enactment
of the Legal Services Bill and the Cost of Insurance Working Group, all of which have been devised with a view
to maintaining and enhancing cost competitiveness.
Ultimately, cost competitiveness is a critical foundation to withstand economic shocks and relentlessly
pursuing cost competitiveness across all business inputs is essential for a small, open, trade-dependent
economy such as Ireland. It is also a crucial element in reducing the cost of living and improving living
standards. In light of these recurring and immediate cost issues, cumulatively there is a role for both the public
and private sectors alike to proactively manage the controllable portion of their respective cost bases, drive
efficiency and continue to take action to address unnecessarily high costs. It is important we maintain vigilant
control over domestically determined costs and there is no opportunity for complacency. Such actions will
ensure that improvements in relative cost competitiveness are more sustainable, leaving Ireland less
dependent on a benign external environment.
Finally, the findings contained in the report, along with those from the forthcoming NCC International
Competitiveness Scorecard 2017, will form the analytical basis for policy recommendations in Ireland’s
Competitiveness Challenge 2017 due later this year.
Policy Recommendations
Based on the benchmarking analysis contained in the Costs of Doing Business 2016 and Competitiveness
Scorecard 2016 reports, the Council identified a range of policy areas relating to costs requiring action in order
to enhance Ireland’s competitiveness performance. A number of key recommendations, drawn from the
Council’s most recent Competitiveness Challenge 2016 report are restated below.
10
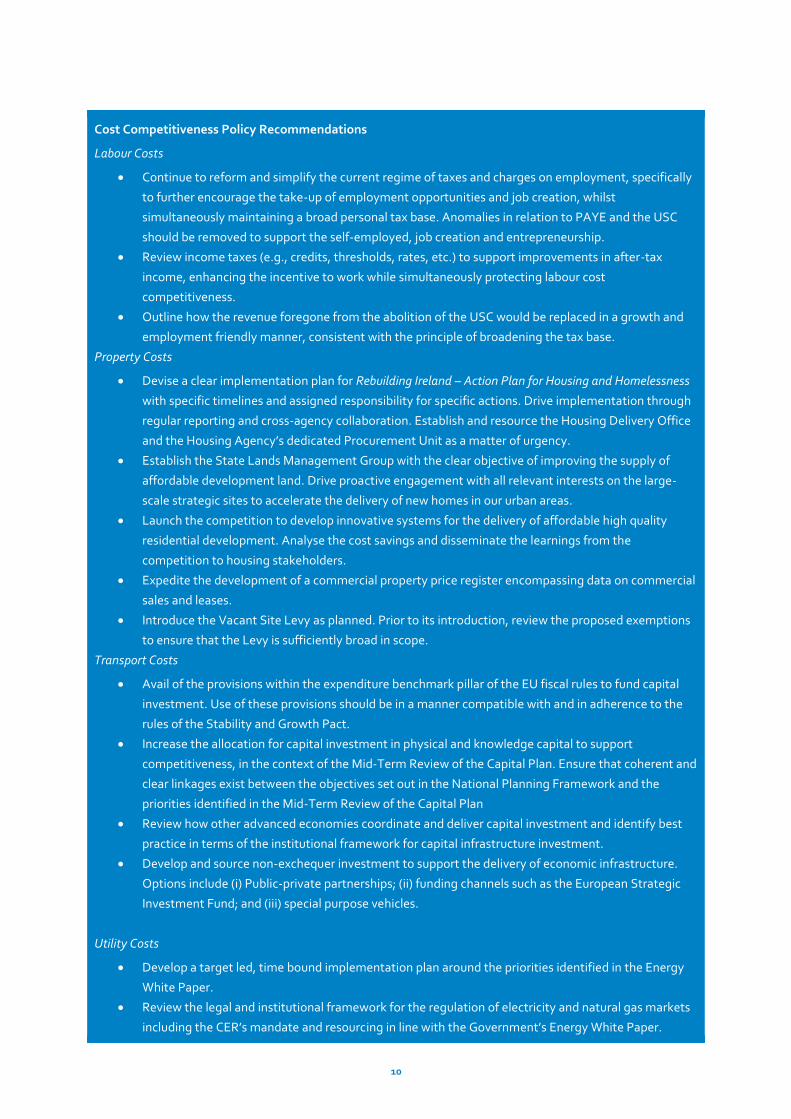
Cost Competitiveness Policy Recommendations
Labour Costs
Continue to reform and simplify the current regime of taxes and charges on employment, specifically
to further encourage the take-up of employment opportunities and job creation, whilst
simultaneously maintaining a broad personal tax base. Anomalies in relation to PAYE and the USC
should be removed to support the self-employed, job creation and entrepreneurship.
Review income taxes (e.g., credits, thresholds, rates, etc.) to support improvements in after-tax
income, enhancing the incentive to work while simultaneously protecting labour cost
competitiveness.
Outline how the revenue foregone from the abolition of the USC would be replaced in a growth and
employment friendly manner, consistent with the principle of broadening the tax base.
Property Costs
Devise a clear implementation plan for Rebuilding Ireland – Action Plan for Housing and Homelessness
with specific timelines and assigned responsibility for specific actions. Drive implementation through
regular reporting and cross-agency collaboration. Establish and resource the Housing Delivery Office
and the Housing Agency’s dedicated Procurement Unit as a matter of urgency.
Establish the State Lands Management Group with the clear objective of improving the supply of
affordable development land. Drive proactive engagement with all relevant interests on the large-
scale strategic sites to accelerate the delivery of new homes in our urban areas.
Launch the competition to develop innovative systems for the delivery of affordable high quality
residential development. Analyse the cost savings and disseminate the learnings from the
competition to housing stakeholders.
Expedite the development of a commercial property price register encompassing data on commercial
sales and leases.
Introduce the Vacant Site Levy as planned. Prior to its introduction, review the proposed exemptions
to ensure that the Levy is sufficiently broad in scope.
Transport Costs
Avail of the provisions within the expenditure benchmark pillar of the EU fiscal rules to fund capital
investment. Use of these provisions should be in a manner compatible with and in adherence to the
rules of the Stability and Growth Pact.
Increase the allocation for capital investment in physical and knowledge capital to support
competitiveness, in the context of the Mid-Term Review of the Capital Plan. Ensure that coherent and
clear linkages exist between the objectives set out in the National Planning Framework and the
priorities identified in the Mid-Term Review of the Capital Plan
Review how other advanced economies coordinate and deliver capital investment and identify best
practice in terms of the institutional framework for capital infrastructure investment.
Develop and source non-exchequer investment to support the delivery of economic infrastructure.
Options include (i) Public-private partnerships; (ii) funding channels such as the European Strategic
Investment Fund; and (iii) special purpose vehicles.
Utility Costs
Develop a target led, time bound implementation plan around the priorities identified in the Energy
White Paper.
Review the legal and institutional framework for the regulation of electricity and natural gas markets
including the CER’s mandate and resourcing in line with the Government’s Energy White Paper.
Costs of Doing Business 2017
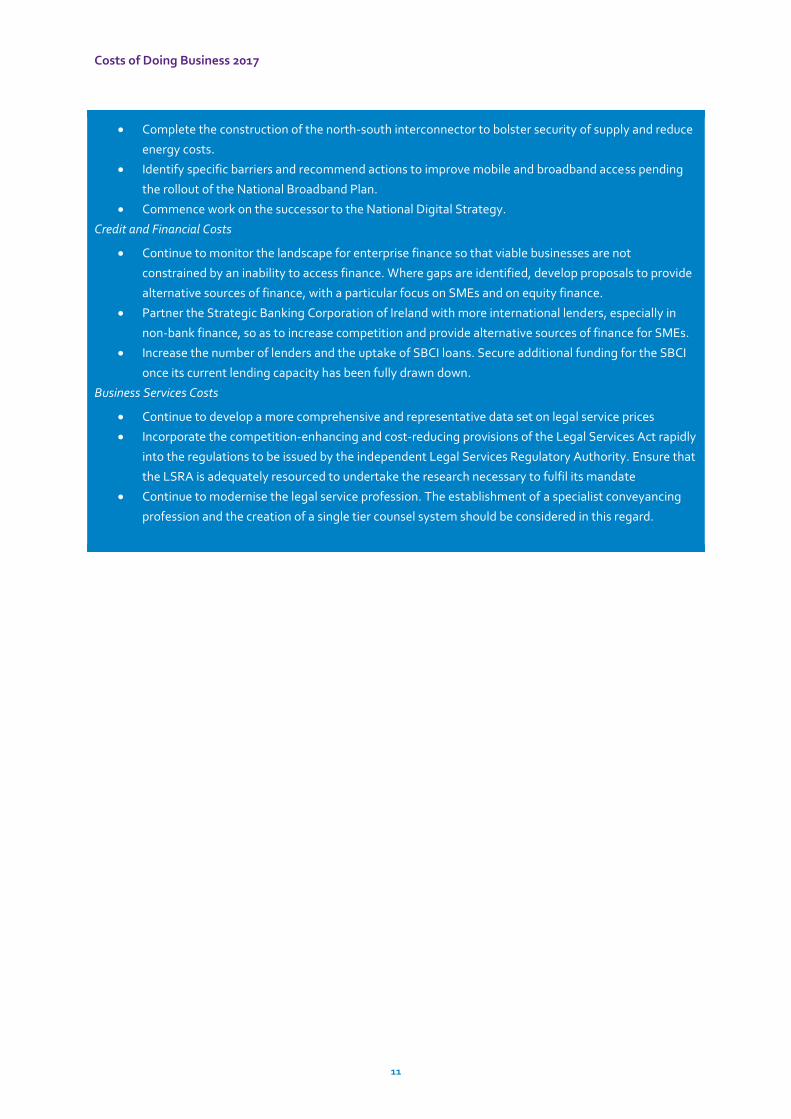
11
Complete the construction of the north-south interconnector to bolster security of supply and reduce
energy costs.
Identify specific barriers and recommend actions to improve mobile and broadband access pending
the rollout of the National Broadband Plan.
Commence work on the successor to the National Digital Strategy.
Credit and Financial Costs
Continue to monitor the landscape for enterprise finance so that viable businesses are not
constrained by an inability to access finance. Where gaps are identified, develop proposals to provide
alternative sources of finance, with a particular focus on SMEs and on equity finance.
Partner the Strategic Banking Corporation of Ireland with more international lenders, especially in
non-bank finance, so as to increase competition and provide alternative sources of finance for SMEs.
Increase the number of lenders and the uptake of SBCI loans. Secure additional funding for the SBCI
once its current lending capacity has been fully drawn down.
Business Services Costs
Continue to develop a more comprehensive and representative data set on legal service prices
Incorporate the competition-enhancing and cost-reducing provisions of the Legal Services Act rapidly
into the regulations to be issued by the independent Legal Services Regulatory Authority. Ensure that
the LSRA is adequately resourced to undertake the research necessary to fulfil its mandate
Continue to modernise the legal service profession. The establishment of a specialist conveyancing
profession and the creation of a single tier counsel system should be considered in this regard.
12
Chapter 1 –Introduction and Methodology
Introduction
Competitiveness is a multidimensional concept, encompassing many different drivers. Competitiveness is not
an end in itself, but a means of achieving sustainable improvements in living standards and quality of life. The
Cost of Doing Business is just one of the elements which determine a country’s ability to compete in
international markets. The success of the enterprise sector affects overall prosperity and steps towards this
prosperity also indicate progress in national competitiveness.
The NCC’s Competitiveness Framework
The Council defines national competitiveness as the ability of enterprises to compete successfully in
international markets. National competitiveness is a broad concept that encompasses the diverse range of
factors which result in firms in Ireland achieving success in international markets. For the Council, the goal of
national competitiveness is to provide Ireland’s people with the opportunity to improve their living standards
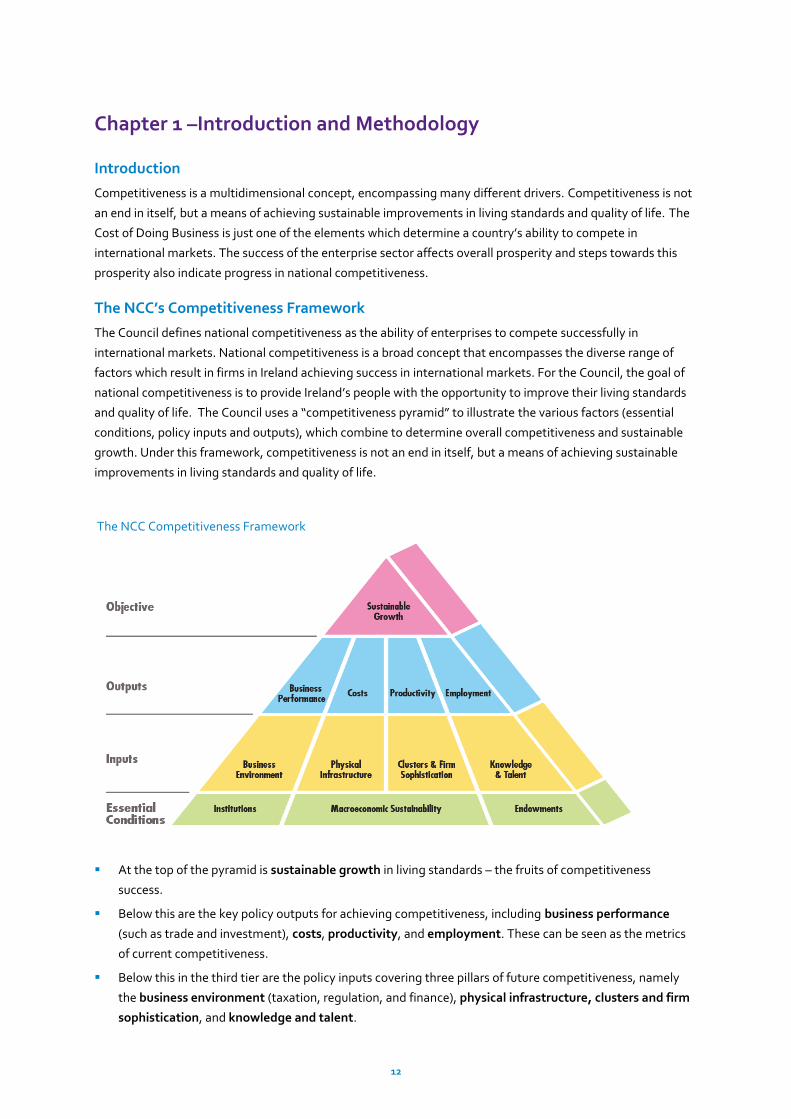
and quality of life. The Council uses a “competitiveness pyramid” to illustrate the various factors (essential
conditions, policy inputs and outputs), which combine to determine overall competitiveness and sustainable
growth. Under this framework, competitiveness is not an end in itself, but a means of achieving sustainable
improvements in living standards and quality of life.
At the top of the pyramid is sustainable growth in living standards – the fruits of competitiveness
success.
Below this are the key policy outputs for achieving competitiveness, including business performance
(such as trade and investment), costs, productivity, and employment. These can be seen as the metrics
of current competitiveness.
Below this in the third tier are the policy inputs covering three pillars of future competitiveness, namely
the business environment (taxation, regulation, and finance), physical infrastructure, clusters and firm
sophistication, and knowledge and talent.
The NCC Competitiveness Framework
Costs of Doing Business 2017
13
Finally, at the base of the pyramid are the essential conditions for competitiveness, these foundations are
based on institutions, macroeconomic sustainability, and endowments.
This Costs of Doing Business 2017 report concentrates on the costs that are largely domestically determined
such as labour, property, transport, utility, credit and financial, and business services. It considers both price
levels, and changes in those levels (i.e. price inflation). It is structured as follows:
Chapter 2 provided an overview of why costs matter for enterprise, sets out cost profiles for a range of
firm types which identify the most important cost categories, and explains the high level economic factors
that determine costs;
Chapter 3 summarises the key cost trends for enterprise in Ireland;
Chapters 4 to 8 examine the main cost categories in greater detail. The primary costs analysed in these
chapters relate to labour, property, transport, utilities, and credit and financial costs;
Chapter 9 examines data on business services and other input costs – a cost category not captured in the
profiles referred to above but still an important input for the vast majority of enterprises; and
Finally, acknowledging the interlinked nature of all sectors and participants of the economy, Chapter 10
considers the broader consumer cost environment.
Methodology
In each chapter, a range of internationally comparable, enterprise-focussed cost indicators are collected for
Ireland and a number of our key trading partners. We have endeavoured to collect data from high-quality,
internationally respected sources, and where necessary, caveats on data are set out. Measuring and
benchmarking cost competitiveness performance relative to third countries highlights Ireland’s strengths in a
number of areas but is also intended to identify potential threats on weaknesses. Nonetheless, there are
limitations to comparative analysis:
While every effort is made to ensure the timeliness of the data, there is a natural lag in collating
comparable official statistics across countries. As much of this data is collected on an annual basis, there
may be a time lag in capturing recent changes in cost levels.
The Council is also constrained in terms of the availability of metrics and their impact on enterprises of
different sizes and sectors and across a number of important areas such as water, transport and
international freight, waste, insurance and Local Authority rates.
Given the different historical contexts and economic, political and social goals of various countries, and
their differing physical geographies and resource endowments, it is not realistic or even desirable for any
country to seek to outperform other countries on all cost measures.
There are no generic strategies to achieve an optimum level of cost competitiveness; as countries face
trade-offs and may be at different points in the economic cycle.
Where possible, Irish cost levels are compared to a relevant peer group average (e.g. the OECD and Euro
area average). It is also worth noting that individual cost metrics have strengths and weaknesses (i.e. in
terms of definitions used, in how the data is collected etc.). When analysing the individual metrics, it is
important, therefore, to consider all of the data as a whole – does the analysis of the individual metrics
combine to tell a coherent story about Ireland’s current cost competitiveness performance.
14
Chapter 2 – How Do Costs Impact on Enterprise?
The NCC framework (see Chapter 1) for analysing competitiveness performance considers inputs and outputs
can be illustrated on a pyramid. Under the framework, competitiveness is not an end in itself, but a means of
achieving sustainable improvements in living standards and quality of life. The NCC currently uses a pyramid
to outline the framework within which it assesses Ireland’s competitiveness. At the top of the pyramid is
sustainable growth in living standards – the fruits of competitiveness success. Below this are the key policy
outputs for achieving competitiveness, including business performance (such as trade and investment), prices
and costs, productivity and employment. These can be seen as the metrics of current competitiveness. Below
this are the policy inputs covering three pillars of future competitiveness, namely education and training,
innovation, clusters and firm sophistication, Ireland’s economic and technological infrastructure and the
business environment (which includes entrepreneurship, taxation and the regulatory framework). Finally, at
the base of the pyramid are the essential conditions for competitiveness, these foundations are institutions,
macroeconomic sustainability and natural endowments.
Why Costs Matter
Generating sustainable broad based export-led growth is essential to sustaining economic growth in these
challenging times. To achieve such growth, Ireland’s international competitiveness must be maintained and
enhanced relative to our key competitors.
Competitiveness is a complex concept, encompassing many different drivers. Notwithstanding the evolution
of the Irish economy and the growing complexity of the goods and services produced in the country over the
past decade, cost competitiveness remains a critical determinant of success. Indeed, in the absence of a
currency devaluation policy lever to manage short term competitiveness pressures, a combination of cost
competitiveness in key business inputs and enhancements in productivity must provide the foundations for
sustaining growth. In the longer term, productivity growth is the preferred mechanism to improve
competitiveness as it can support cost competitiveness in tandem with high and increasing income levels.
A high cost environment weakens competitiveness in a number of ways.
High costs make Ireland less attractive in terms of mobile investment and business expansion and in the
context of Brexit, if unchecked could see companies relocating to other jurisdictions;
High costs make firms which rely on domestically sourced inputs less competitive when they are selling
into foreign markets – this is a particular concern for large indigenous exporting sectors such as the food
and drink sector, construction products and services, timber and engineering; and
A high cost environment can impact on firms which may not export, but which rely on the domestic
market – their customers (consumers and other firms) may source cheaper inputs from abroad due to
currency fluctuations, rather than from within Ireland, leading to a loss of market share for Irish based
enterprises.
More broadly, all sectors of the economy are interlinked and interdependent - high and increasing business
costs have implications for the costs of living. These in turn, have knock on implications for wage demands,
and so the cycle continues. It remains vital, therefore, that Ireland protects the gains made to date, and that
we continue to take action to address unnecessarily high costs (i.e. cost levels not justified by productivity)
wherever they arise. In this regard, there is a role for both the public and private sectors alike to proactively
Costs of Doing Business 2017
15
manage their cost base and drive efficiency, thus creating a virtuous circle between the costs of living, wage
expectations and cost competitiveness.
Which Costs Matter Most?
From a competitiveness perspective, it is essential that policymakers focus on maintaining cost
competitiveness, particularly in relation to those goods and services that comprise a significant percentage of
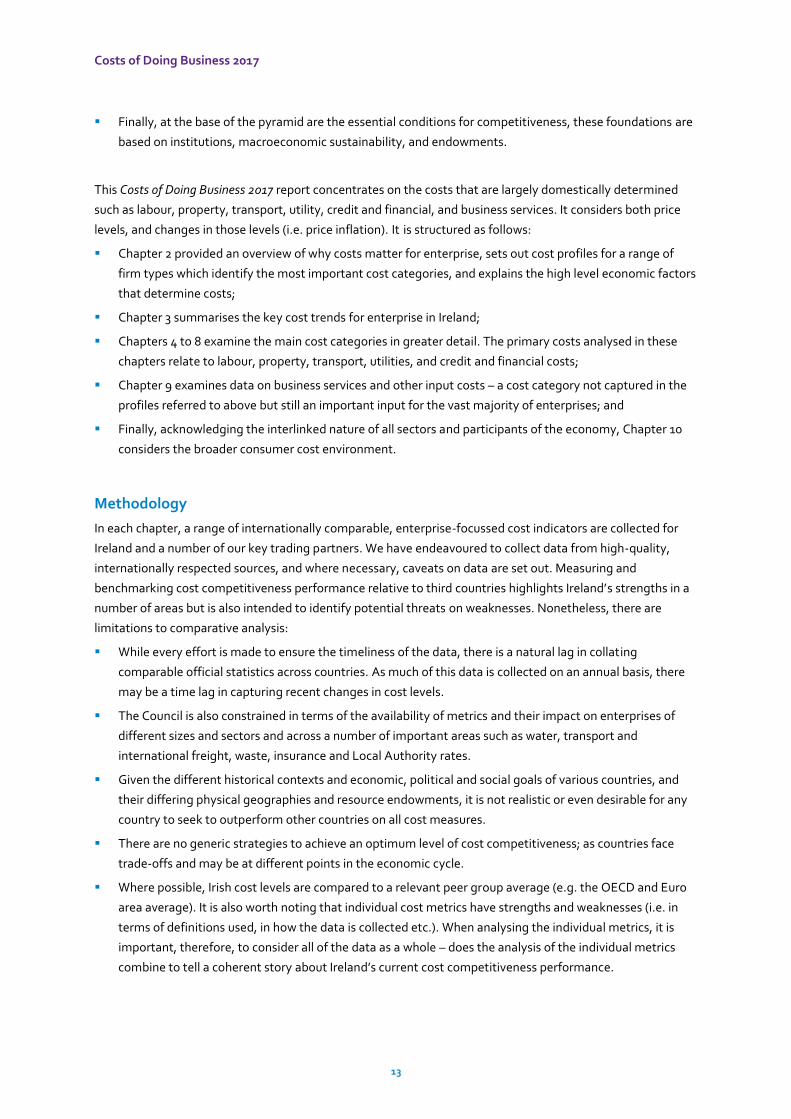
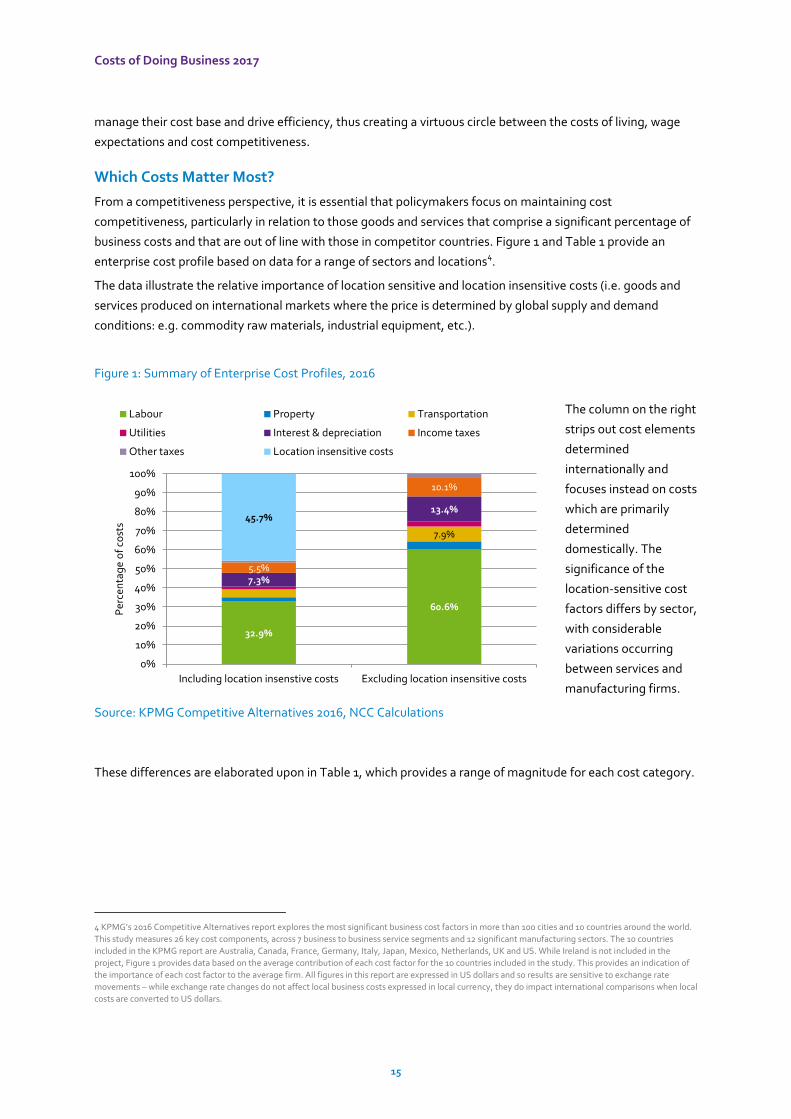
business costs and that are out of line with those in competitor countries. Figure 1 and Table 1 provide an
enterprise cost profile based on data for a range of sectors and locations4.
The data illustrate the relative importance of location sensitive and location insensitive costs (i.e. goods and
services produced on international markets where the price is determined by global supply and demand
conditions: e.g. commodity raw materials, industrial equipment, etc.).
Figure 1: Summary of Enterprise Cost Profiles, 2016
The column on the right
strips out cost elements
determined
internationally and
focuses instead on costs
which are primarily
determined
domestically. The
significance of the
location-sensitive cost
factors differs by sector,
with considerable
variations occurring
between services and
manufacturing firms.
Source: KPMG Competitive Alternatives 2016, NCC Calculations
These differences are elaborated upon in Table 1, which provides a range of magnitude for each cost category.
4 KPMG’s 2016 Competitive Alternatives report explores the most significant business cost factors in more than 100 cities and 10 countries around the world.
This study measures 26 key cost components, across 7 business to business service segments and 12 significant manufacturing sectors. The 10 countries
included in the KPMG report are Australia, Canada, France, Germany, Italy, Japan, Mexico, Netherlands, UK and US. While Ireland is not included in the
project, Figure 1 provides data based on the average contribution of each cost factor for the 10 countries included in the study. This provides an indication of
the importance of each cost factor to the average firm. All figures in this report are expressed in US dollars and so results are sensitive to exchange rate
movements – while exchange rate changes do not affect local business costs expressed in local currency, they do impact international comparisons when local
costs are converted to US dollars.
32.9%
60.6%
7.9%
7.3%
13.4%
5.5%
10.1%
45.7%
0%
10%
20%
30%
40%
50%
60%
70%
80%
90%
100%
Including location insenstive costs Excluding location insensitive costs
Per
cen
tag
e o
f co
sts
Labour Property Transportation
Utilities Interest & depreciation Income taxes
Other taxes Location insensitive costs
16
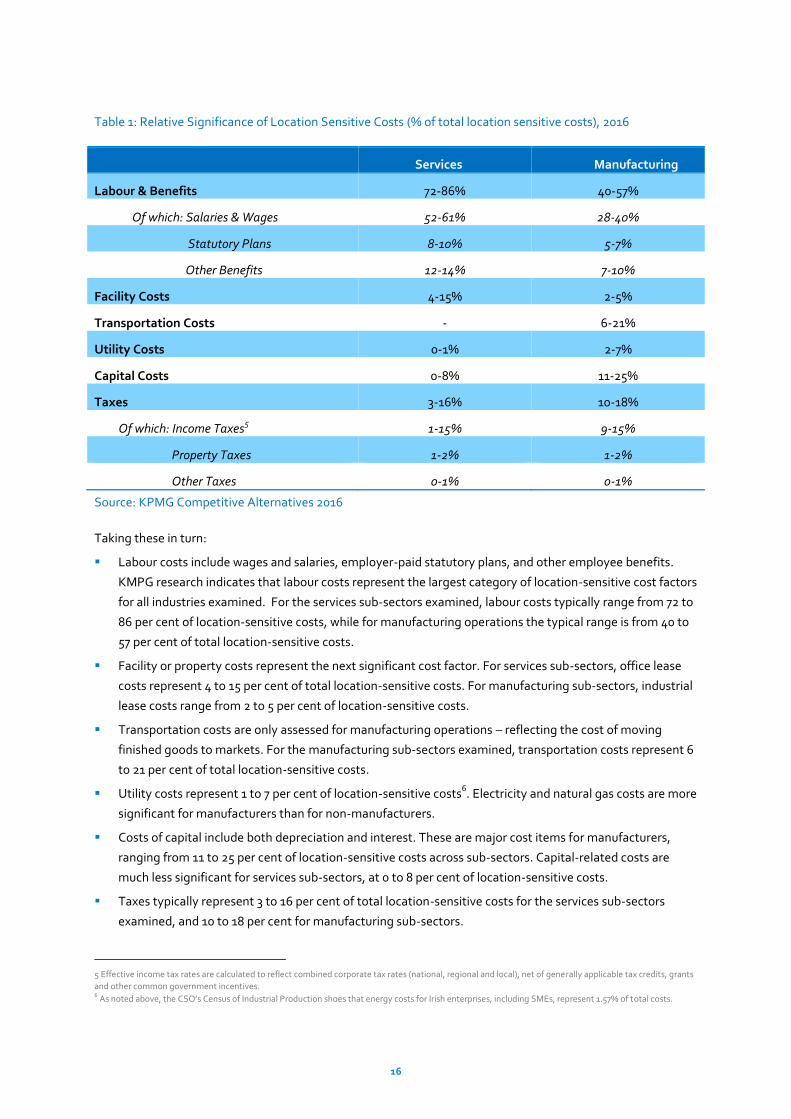
Table 1: Relative Significance of Location Sensitive Costs (% of total location sensitive costs), 2016
Services Manufacturing
Labour & Benefits 72-86% 40-57%
Of which: Salaries & Wages 52-61% 28-40%
Statutory Plans 8-10% 5-7%
Other Benefits 12-14% 7-10%
Facility Costs 4-15% 2-5%
Transportation Costs - 6-21%
Utility Costs 0-1% 2-7%
Capital Costs 0-8% 11-25%
Taxes 3-16% 10-18%
Of which: Income Taxes5 1-15% 9-15%
Property Taxes 1-2% 1-2%
Other Taxes 0-1% 0-1%
Source: KPMG Competitive Alternatives 2016
Taking these in turn:
Labour costs include wages and salaries, employer-paid statutory plans, and other employee benefits.
KMPG research indicates that labour costs represent the largest category of location-sensitive cost factors
for all industries examined. For the services sub-sectors examined, labour costs typically range from 72 to
86 per cent of location-sensitive costs, while for manufacturing operations the typical range is from 40 to
57 per cent of total location-sensitive costs.
Facility or property costs represent the next significant cost factor. For services sub-sectors, office lease
costs represent 4 to 15 per cent of total location-sensitive costs. For manufacturing sub-sectors, industrial
lease costs range from 2 to 5 per cent of location-sensitive costs.
Transportation costs are only assessed for manufacturing operations – reflecting the cost of moving
finished goods to markets. For the manufacturing sub-sectors examined, transportation costs represent 6
to 21 per cent of total location-sensitive costs.
Utility costs represent 1 to 7 per cent of location-sensitive costs6. Electricity and natural gas costs are more
significant for manufacturers than for non-manufacturers.
Costs of capital include both depreciation and interest. These are major cost items for manufacturers,
ranging from 11 to 25 per cent of location-sensitive costs across sub-sectors. Capital-related costs are
much less significant for services sub-sectors, at 0 to 8 per cent of location-sensitive costs.
Taxes typically represent 3 to 16 per cent of total location-sensitive costs for the services sub-sectors
examined, and 10 to 18 per cent for manufacturing sub-sectors.
5 Effective income tax rates are calculated to reflect combined corporate tax rates (national, regional and local), net of generally applicable tax credits, grants
and other common government incentives. 6 As noted above, the CSO’s Census of Industrial Production shoes that energy costs for Irish enterprises, including SMEs, represent 1.57% of total costs.
Costs of Doing Business 2017
17
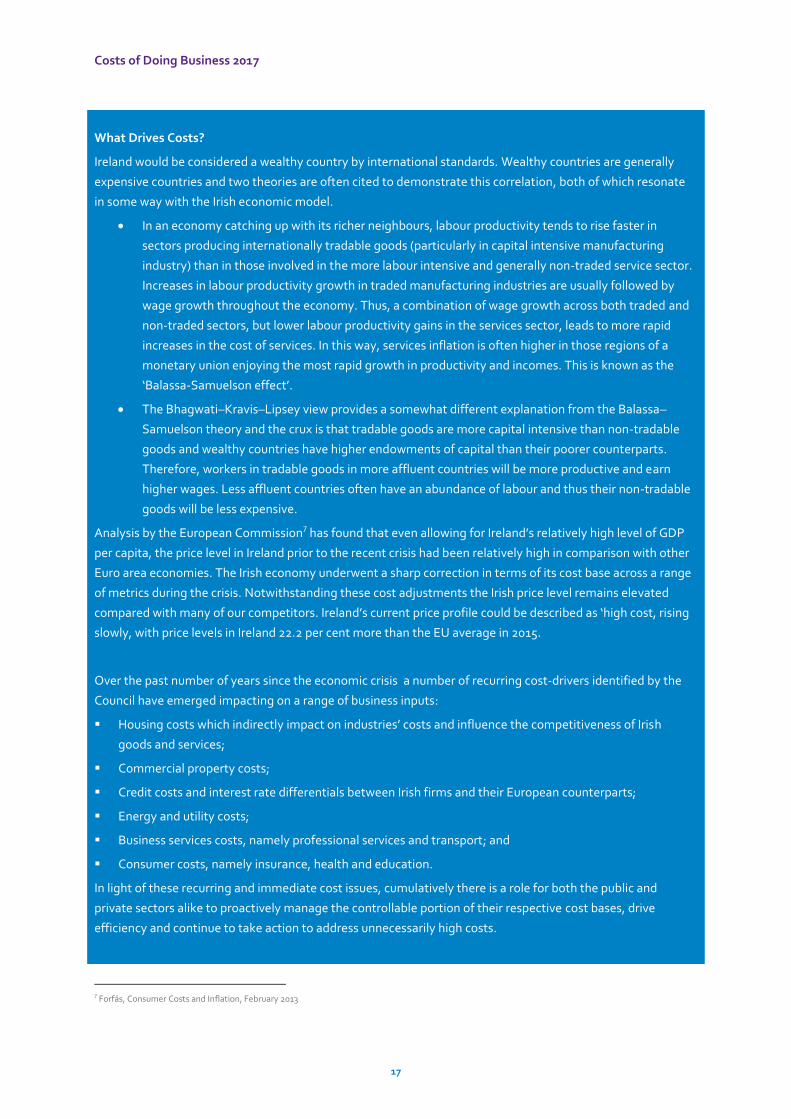
What Drives Costs?
Ireland would be considered a wealthy country by international standards. Wealthy countries are generally
expensive countries and two theories are often cited to demonstrate this correlation, both of which resonate
in some way with the Irish economic model.
In an economy catching up with its richer neighbours, labour productivity tends to rise faster in
sectors producing internationally tradable goods (particularly in capital intensive manufacturing
industry) than in those involved in the more labour intensive and generally non-traded service sector.
Increases in labour productivity growth in traded manufacturing industries are usually followed by
wage growth throughout the economy. Thus, a combination of wage growth across both traded and
non-traded sectors, but lower labour productivity gains in the services sector, leads to more rapid
increases in the cost of services. In this way, services inflation is often higher in those regions of a
monetary union enjoying the most rapid growth in productivity and incomes. This is known as the
‘Balassa-Samuelson effect’.
The Bhagwati–Kravis–Lipsey view provides a somewhat different explanation from the Balassa–
Samuelson theory and the crux is that tradable goods are more capital intensive than non-tradable
goods and wealthy countries have higher endowments of capital than their poorer counterparts.
Therefore, workers in tradable goods in more affluent countries will be more productive and earn
higher wages. Less affluent countries often have an abundance of labour and thus their non-tradable
goods will be less expensive.
Analysis by the European Commission7 has found that even allowing for Ireland’s relatively high level of GDP
per capita, the price level in Ireland prior to the recent crisis had been relatively high in comparison with other
Euro area economies. The Irish economy underwent a sharp correction in terms of its cost base across a range
of metrics during the crisis. Notwithstanding these cost adjustments the Irish price level remains elevated
compared with many of our competitors. Ireland’s current price profile could be described as ‘high cost, rising
slowly, with price levels in Ireland 22.2 per cent more than the EU average in 2015.
Over the past number of years since the economic crisis a number of recurring cost-drivers identified by the
Council have emerged impacting on a range of business inputs:
Housing costs which indirectly impact on industries’ costs and influence the competitiveness of Irish
goods and services;
Commercial property costs;
Credit costs and interest rate differentials between Irish firms and their European counterparts;
Energy and utility costs;
Business services costs, namely professional services and transport; and
Consumer costs, namely insurance, health and education.
In light of these recurring and immediate cost issues, cumulatively there is a role for both the public and
private sectors alike to proactively manage the controllable portion of their respective cost bases, drive
efficiency and continue to take action to address unnecessarily high costs.
7 Forfás, Consumer Costs and Inflation, February 2013
18
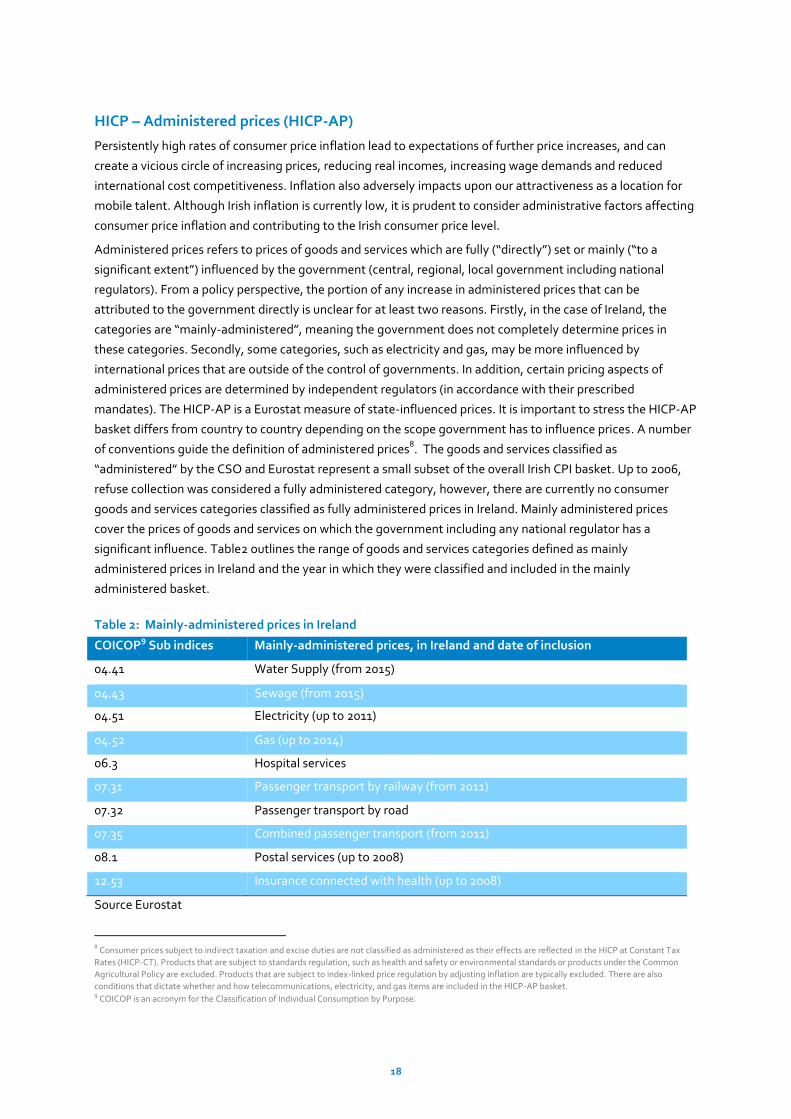
HICP – Administered prices (HICP-AP)
Persistently high rates of consumer price inflation lead to expectations of further price increases, and can
create a vicious circle of increasing prices, reducing real incomes, increasing wage demands and reduced
international cost competitiveness. Inflation also adversely impacts upon our attractiveness as a location for
mobile talent. Although Irish inflation is currently low, it is prudent to consider administrative factors affecting
consumer price inflation and contributing to the Irish consumer price level.
Administered prices refers to prices of goods and services which are fully (“directly”) set or mainly (“to a
significant extent”) influenced by the government (central, regional, local government including national
regulators). From a policy perspective, the portion of any increase in administered prices that can be
attributed to the government directly is unclear for at least two reasons. Firstly, in the case of Ireland, the
categories are “mainly-administered”, meaning the government does not completely determine prices in
these categories. Secondly, some categories, such as electricity and gas, may be more influenced by
international prices that are outside of the control of governments. In addition, certain pricing aspects of
administered prices are determined by independent regulators (in accordance with their prescribed
mandates). The HICP-AP is a Eurostat measure of state-influenced prices. It is important to stress the HICP-AP
basket differs from country to country depending on the scope government has to influence prices. A number
of conventions guide the definition of administered prices8. The goods and services classified as
“administered” by the CSO and Eurostat represent a small subset of the overall Irish CPI basket. Up to 2006,
refuse collection was considered a fully administered category, however, there are currently no consumer
goods and services categories classified as fully administered prices in Ireland. Mainly administered prices
cover the prices of goods and services on which the government including any national regulator has a
significant influence. Table2 outlines the range of goods and services categories defined as mainly
administered prices in Ireland and the year in which they were classified and included in the mainly
administered basket.
Table 2: Mainly-administered prices in Ireland
COICOP9 Sub indices Mainly-administered prices, in Ireland and date of inclusion
04.41 Water Supply (from 2015)
04.43 Sewage (from 2015)
04.51 Electricity (up to 2011)
04.52 Gas (up to 2014)
06.3 Hospital services
07.31 Passenger transport by railway (from 2011)
07.32 Passenger transport by road
07.35 Combined passenger transport (from 2011)
08.1 Postal services (up to 2008)
12.53 Insurance connected with health (up to 2008)
Source Eurostat
8 Consumer prices subject to indirect taxation and excise duties are not classified as administered as their effects are reflected in the HICP at Constant Tax
Rates (HICP-CT). Products that are subject to standards regulation, such as health and safety or environmental standards or products under the Common
Agricultural Policy are excluded. Products that are subject to index-linked price regulation by adjusting inflation are typically excluded. There are also
conditions that dictate whether and how telecommunications, electricity, and gas items are included in the HICP-AP basket. 9 COICOP is an acronym for the Classification of Individual Consumption by Purpose.
Costs of Doing Business 2017
19
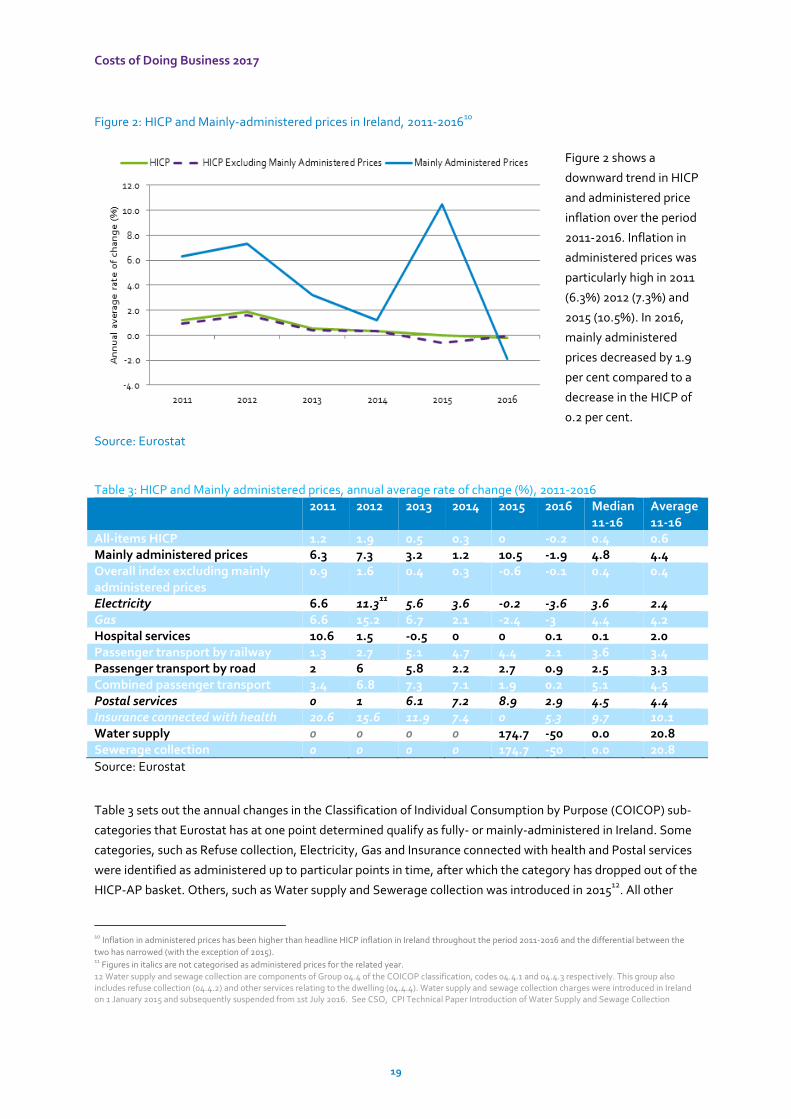
Figure 2: HICP and Mainly-administered prices in Ireland, 2011-201610
Figure 2 shows a
downward trend in HICP
and administered price
inflation over the period
2011-2016. Inflation in
administered prices was
particularly high in 2011
(6.3%) 2012 (7.3%) and
2015 (10.5%). In 2016,
mainly administered
prices decreased by 1.9
per cent compared to a
decrease in the HICP of
0.2 per cent.
Source: Eurostat
Table 3: HICP and Mainly administered prices, annual average rate of change (%), 2011-2016 2011 2012 2013 2014 2015 2016 Median
11-16 Average 11-16
All-items HICP 1.2 1.9 0.5 0.3 0 -0.2 0.4 0.6 Mainly administered prices 6.3 7.3 3.2 1.2 10.5 -1.9 4.8 4.4 Overall index excluding mainly administered prices
0.9 1.6 0.4 0.3 -0.6 -0.1 0.4 0.4
Electricity 6.6 11.311
5.6 3.6 -0.2 -3.6 3.6 2.4 Gas 6.6 15.2 6.7 2.1 -2.4 -3 4.4 4.2 Hospital services 10.6 1.5 -0.5 0 0 0.1 0.1 2.0 Passenger transport by railway 1.3 2.7 5.1 4.7 4.4 2.1 3.6 3.4 Passenger transport by road 2 6 5.8 2.2 2.7 0.9 2.5 3.3 Combined passenger transport 3.4 6.8 7.3 7.1 1.9 0.2 5.1 4.5 Postal services 0 1 6.1 7.2 8.9 2.9 4.5 4.4 Insurance connected with health 20.6 15.6 11.9 7.4 0 5.3 9.7 10.1 Water supply 0 0 0 0 174.7 -50 0.0 20.8 Sewerage collection 0 0 0 0 174.7 -50 0.0 20.8
Source: Eurostat
Table 3 sets out the annual changes in the Classification of Individual Consumption by Purpose (COICOP) sub-
categories that Eurostat has at one point determined qualify as fully- or mainly-administered in Ireland. Some
categories, such as Refuse collection, Electricity, Gas and Insurance connected with health and Postal services
were identified as administered up to particular points in time, after which the category has dropped out of the
HICP-AP basket. Others, such as Water supply and Sewerage collection was introduced in 201512
. All other
10
Inflation in administered prices has been higher than headline HICP inflation in Ireland throughout the period 2011-2016 and the differential between the
two has narrowed (with the exception of 2015). 11 Figures in italics are not categorised as administered prices for the related year.
12 Water supply and sewage collection are components of Group 04.4 of the COICOP classification, codes 04.4.1 and 04.4.3 respectively. This group also includes refuse collection (04.4.2) and other services relating to the dwelling (04.4.4). Water supply and sewage collection charges were introduced in Ireland on 1 January 2015 and subsequently suspended from 1st July 2016. See CSO, CPI Technical Paper Introduction of Water Supply and Sewage Collection
20
subheadings are included in the HICP-AP index for the entirety of the time series. The table shows that
transport related costs have increased at a rate consistently higher than HICP over the period 2011-2016. The
rate of increase in hospital services was high in 2010 but has slowed considerably since then. Categories no
longer categorised as administered prices such as Insurance connected with health, postal services, gas,
electricity and postal services increased at a more rapid rate than HICP prices.
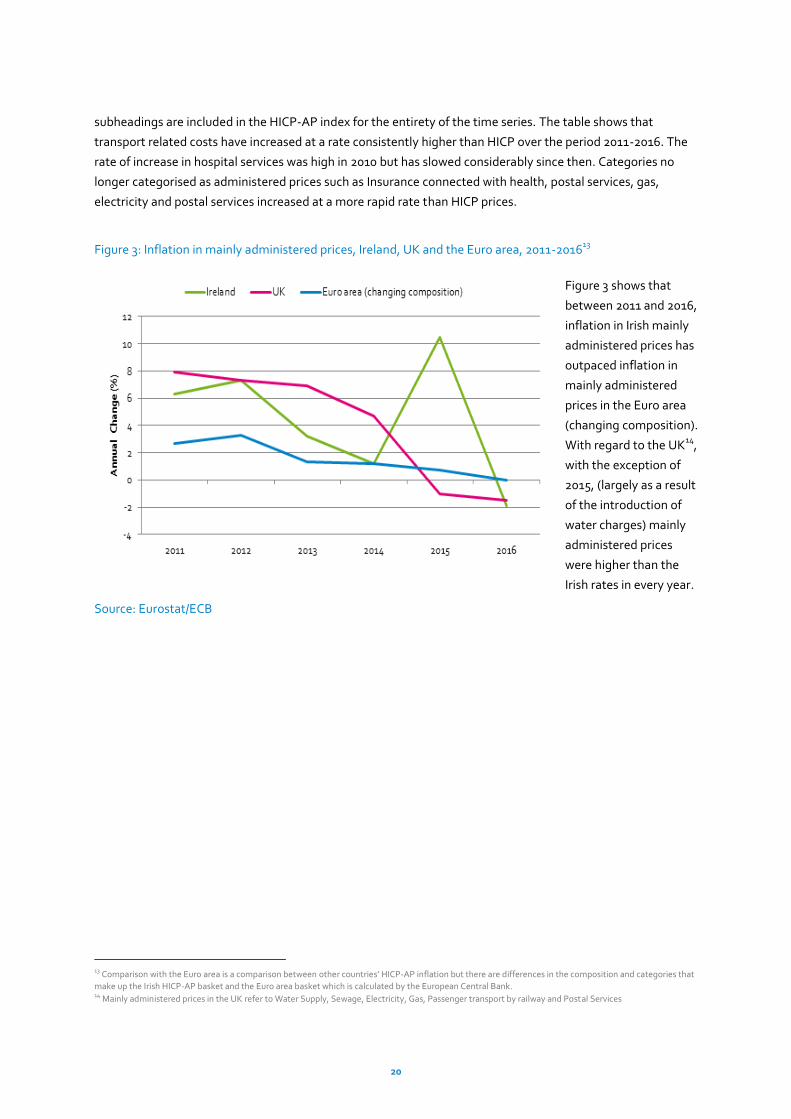
Figure 3: Inflation in mainly administered prices, Ireland, UK and the Euro area, 2011-201613
Figure 3 shows that
between 2011 and 2016,
inflation in Irish mainly
administered prices has
outpaced inflation in
mainly administered
prices in the Euro area
(changing composition).
With regard to the UK14
,
with the exception of
2015, (largely as a result
of the introduction of
water charges) mainly
administered prices
were higher than the
Irish rates in every year.
Source: Eurostat/ECB
13 Comparison with the Euro area is a comparison between other countries’ HICP-AP inflation but there are differences in the composition and categories that
make up the Irish HICP-AP basket and the Euro area basket which is calculated by the European Central Bank. 14 Mainly administered prices in the UK refer to Water Supply, Sewage, Electricity, Gas, Passenger transport by railway and Postal Services
Costs of Doing Business 2017
21
Chapter 3– How Does Ireland Perform?
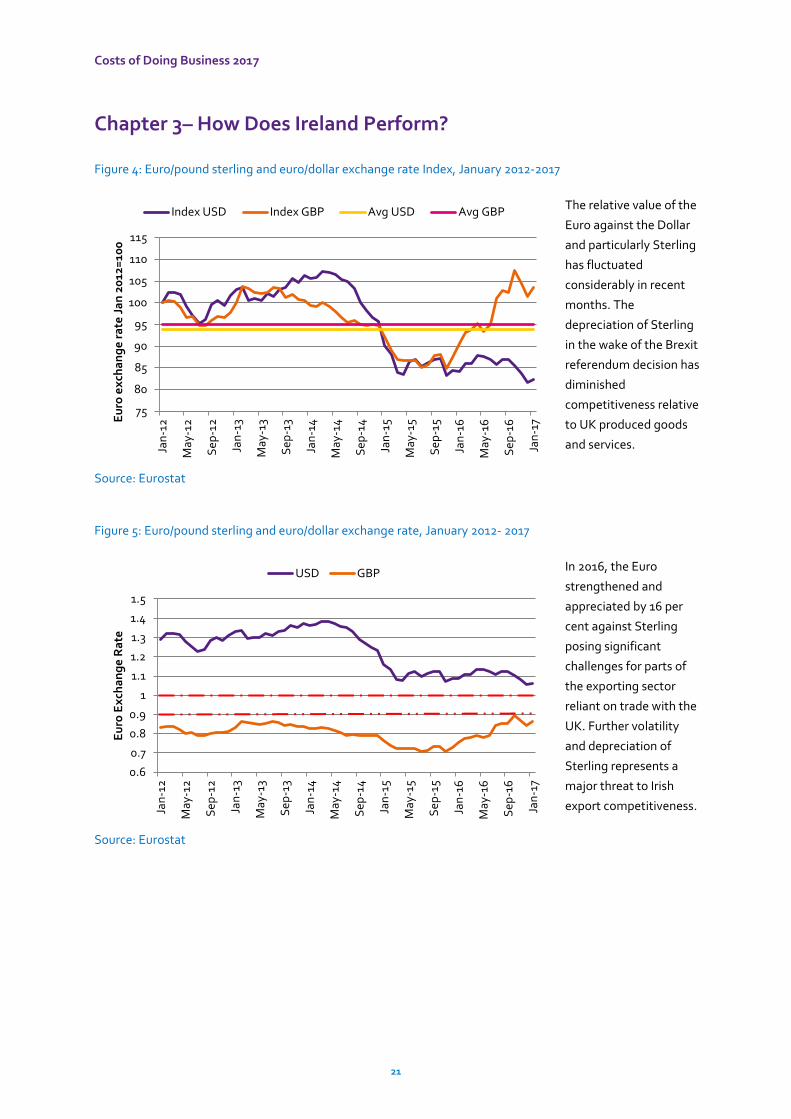
Figure 4: Euro/pound sterling and euro/dollar exchange rate Index, January 2012-2017
The relative value of the
Euro against the Dollar
and particularly Sterling
has fluctuated
considerably in recent
months. The
depreciation of Sterling
in the wake of the Brexit
referendum decision has
diminished
competitiveness relative
to UK produced goods
and services.
Source: Eurostat
Figure 5: Euro/pound sterling and euro/dollar exchange rate, January 2012- 2017
In 2016, the Euro
strengthened and
appreciated by 16 per
cent against Sterling
posing significant
challenges for parts of
the exporting sector
reliant on trade with the
UK. Further volatility
and depreciation of
Sterling represents a
major threat to Irish
export competitiveness.
Source: Eurostat
75
80
85
90
95
100
105
110
115
Jan
-12
May
-12
Sep
-12
Jan
-13
May
-13
Sep
-13
Jan
-14
May
-14
Sep
-14
Jan
-15
May
-15
Sep
-15
Jan
-16
May
-16
Sep
-16
Jan
-17E
uro
ex
cha
ng
e r
ate
Ja
n 2
012
=10
0
Index USD Index GBP Avg USD Avg GBP
0.6
0.7
0.8
0.9
1
1.1
1.2
1.3
1.4
1.5
Jan
-12
May
-12
Sep
-12
Jan
-13
May
-13
Sep
-13
Jan
-14
May
-14
Sep
-14
Jan
-15
May
-15
Sep
-15
Jan
-16
May
-16
Sep
-16
Jan
-17
Eu
ro E
xch
an
ge
Ra
te
USD GBP
22
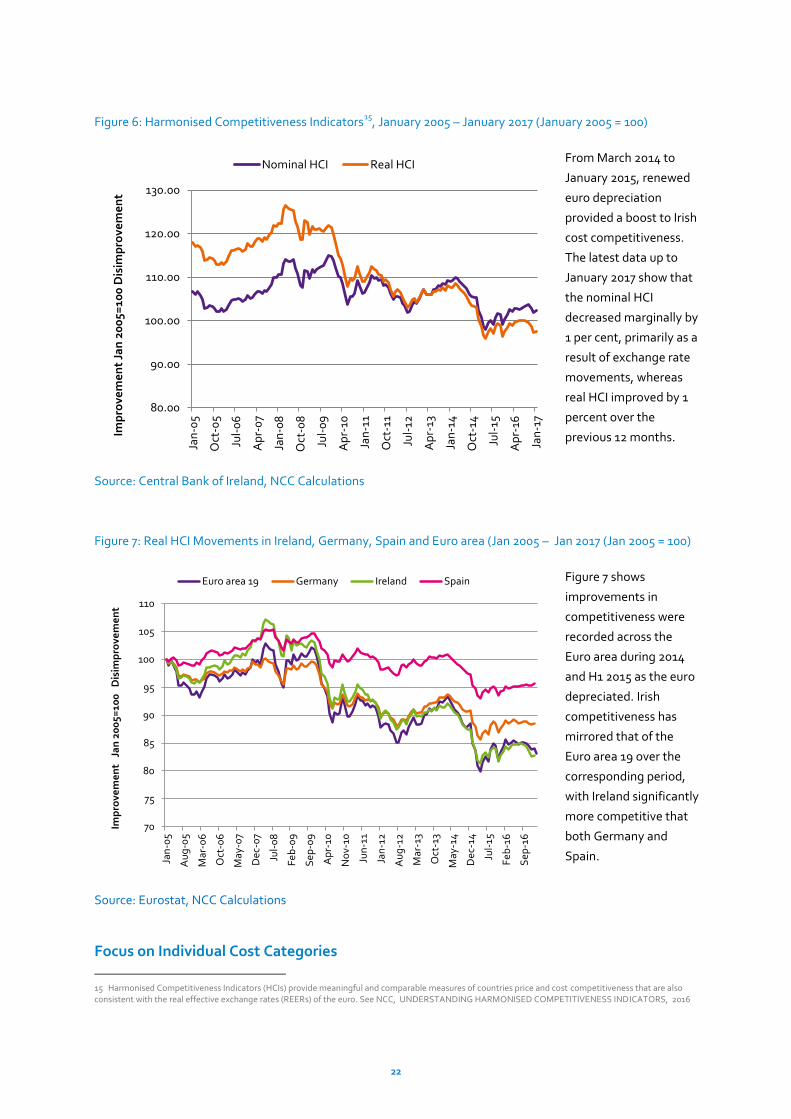
Figure 6: Harmonised Competitiveness Indicators15
, January 2005 – January 2017 (January 2005 = 100)
From March 2014 to
January 2015, renewed
euro depreciation
provided a boost to Irish
cost competitiveness.
The latest data up to
January 2017 show that
the nominal HCI
decreased marginally by
1 per cent, primarily as a
result of exchange rate
movements, whereas
real HCI improved by 1
percent over the
previous 12 months.
Source: Central Bank of Ireland, NCC Calculations
Figure 7: Real HCI Movements in Ireland, Germany, Spain and Euro area (Jan 2005 – Jan 2017 (Jan 2005 = 100)
Figure 7 shows
improvements in
competitiveness were
recorded across the
Euro area during 2014
and H1 2015 as the euro
depreciated. Irish
competitiveness has
mirrored that of the
Euro area 19 over the
corresponding period,
with Ireland significantly
more competitive that
both Germany and
Spain.
Source: Eurostat, NCC Calculations
Focus on Individual Cost Categories
15 Harmonised Competitiveness Indicators (HCIs) provide meaningful and comparable measures of countries price and cost competitiveness that are also consistent with the real effective exchange rates (REERs) of the euro. See NCC, UNDERSTANDING HARMONISED COMPETITIVENESS INDICATORS, 2016
80.00
90.00
100.00
110.00
120.00
130.00Ja
n-0
5
Oct
-05
Jul-
06
Ap
r-0
7
Jan
-08
Oct
-08
Jul-
09
Ap
r-10
Jan
-11
Oct
-11
Jul-
12
Ap
r-13
Jan
-14
Oct
-14
Jul-
15
Ap
r-16
Jan
-17
Imp
rove
me
nt
Jan
20
05=
100
Dis
imp
rove
me
nt
Nominal HCI Real HCI
70
75
80
85
90
95
100
105
110
Jan
-05
Au
g-0
5
Mar
-06
Oct
-06
May
-07
Dec
-07
Jul-
08
Fe
b-0
9
Sep
-09
Ap
r-10
No
v-10
Jun
-11
Jan
-12
Au
g-1
2
Mar
-13
Oct
-13
May
-14
Dec
-14
Jul-
15
Fe
b-1
6
Sep
-16
Imp
rove
me
nt
Ja
n 2
00
5=10
0
Dis
imp
rove
me
nt
Euro area 19 Germany Ireland Spain
Costs of Doing Business 2017
23
Harmonised competitiveness indicators can be difficult to translate into real world experience. From the
perspective of the firm or an individual, in order to fully appreciate changes in prices and costs, it is necessary
to examine more tangible indicators such as wage rates, rents, and the prices paid for various utilities and
services. In this regard, Costs of Doing Business 2017 examines over 70 different metrics across a range of
business cost categories to provide an overview of the cost environment for enterprise in Ireland. The key
messages are summarised below.
Measures of Overall Cost Competitiveness
Summary of Business Cost Trends in Ireland
Labour Costs There is considerable heterogeneity across Europe with regard to, average hourly labour
costs in the whole economy, with the lowest hourly labour costs recorded in Bulgaria (€4.4),
and the highest in Denmark (€42). In Ireland, the hourly labour cost was €30.4 in 2016,
compared to €26.7 in the UK and €29.8 for the Euro area 19. The relative change in hourly
labour costs 2015/2016 for the whole economy was 1.3 per cent compared to an increase of
1.4 per cent in the Euro area.
While demands for wage increases are understandable after a period of economic stagnation
and wage cuts, our relative competitive position will be negatively affected if wage growth
outpaces that in competitor countries and is not backed up by increases in productivity. While
labour cost growth has been positive, the growth has been below EU and Euro area averages
in the 5 year period to 2016, representing a competitiveness gain for Ireland. Sectoral wage
growth rates have been lower in Ireland than the Eur0 area over the corresponding period
with the notable exception of Wholesale & Retail and ICT. Domestically, at sectoral level,
hourly labour costs in Construction and Wholesale & Retail in Ireland grew by 4.6 per cent and
4.1 per cent respectively between 2012 and 2015. Across all sectors the average growth was 1
per cent.
In 2015 the minimum wage as a percentage of average wages ranged from 34.6 per cent in
the Czech Republic, 44per cent in Ireland to 52.4 per cent in Slovenia. As a percentage of
average wages in 2014 across the Euro area 15, Ireland has the 10th highest minimum wage
(not all comparable figures are 2014). In 2016 Ireland had the 2nd highest monthly minimum
wage (€1,546). In its 2016 report to Government, the Low Pay Commission (LPC)
recommended that the national minimum wage should increase by €0.10 to €9.25 per hour
from 1 January 2017 after having previously concluding that moderate increases in the
national minimum wage are unlikely to have a significantly adverse effect on employment.
According to the OECD, the levels of taxation in Ireland are below the Euro area on average
income levels and on marginal income levels for married couples. The corresponding
marginal levels are, however, high for single earners. Ireland is currently very reliant on taxes
on income as a source of revenue and significantly less revenue is generated through social
security contributions in Ireland as compared with other OCED members. Ireland has the 8th
lowest rate of social security contributions in the OECD. Employers’ contributions are the 7th
lowest, and employee contributions are the 11th lowest (although benefits are also
correspondingly low in Ireland).
24
Property
Costs The last number of years has witnessed a sustained recovery in the Irish commercial property
market. The cost of constructing a prime office unit and a High Tech Factory / Laboratory
facility in Ireland rose by 6 per cent and 2 per cent in 2016 over the previous year. Commercial
rents growth has been driven by an increase in demand, reflecting the improving economy.
This in turn, has boosted capital values, the price that would have been paid for property if it
had been purchased at the point of valuation, in all commercial sectors (e.g., office, industrial
and retail). Overall growth was 3.8 per cent in Q4 2016. This acceleration has almost halved in
the period since Q3 2015.
The availability of competitive property solutions is a key requirement for the expansion of
enterprises and winning mobile investment. In 2016 prime retails rents increased by 32 per
cent year-on-year on Dublin’s Grafton St. In the 5 years to Q2 2016 Compound Annual
Growth Rates associated with Office Rents were 14.1 per cent in Dublin (D2 and D4 districts)
and 7 per cent in Cork. The growth rates in Dublin were over three times the equivalent rates
in both London City and London’s West End. Commercial property prices in Ireland,
however, still compare favourably to comparable cities in the UK but concerns persist about
the availability of prime office space for rent in large urban centres in the short term as the
market tightens and vacancy rates decline. This could result in future rent increases and any
shortage of supply16
of new commercial space could adversely impact our competitiveness .
Transport
Costs Ireland continues to have a very high dependence on imported fossil fuels, particularly oil on
which 48 per cent of our energy consumption is based. As a small peripheral EU economy,
with limited resources, factors outside of our control such as international oil prices exert a
significant influence on energy prices. Ireland is characterised by high taxes on motor fuel and
58 per cent of total diesel costs are made up of various taxes, the 5th highest proportion in
the Euro area. The impact of these taxes is becoming more evident as the international price
of oil increases. As well as lowering greenhouse gases, investment in renewables is reducing
our reliance on imported fuel. Oil is a significant component of our fuel mix, but while the fuel
mix has an energy policy relevance in Ireland’s contemporary economy, oil’s main
significance is in transport policy and fiscal receipts.
In the year to January 2017 world oil prices have risen by almost 80 per cent to over $54 per
barrel. This sharp rise in oil prices has been a contributing factor to the increased prices for
petroleum products, and more generally inflation levels, across the EU. Irish petrol and diesel
prices increased by 14.8 and 22 per cent respectively in the 12 months to February 2017. In
addition, the cost of 1,000 litres of diesel in Ireland (€1,269) was 4.8 per cent above the Euro
area average (€1,211) in the corresponding month. Ireland was the 4th
most expensive country
with taxes on diesel, at 58 per cent, accounting for the majority of this differential in Ireland.
This is the 5th
highest proportion in the Euro area. With regard to service prices in the transport
sector, prices have been relatively stationary in recent quarters. Air transport is a notable
exception with rapid price growth of 22.6 per cent recorded between 2012 and 2016.
16 Recent research conducted by the ESRI noted that Dublin is the only European capital where there was no office space construction between 2011 and 2013.
The same research notes the high level of demand for commercial property amongst mobile investment firms - 70 per cent of the take-up of such office space
in Dublin in 2015 was by new and existing mobile investment firms, primarily tech-based companies, indicating the importance of ensuring a predictable and
sustainable supply of commercial property.
Costs of Doing Business 2017
25
Utility Costs The EU is among the most expensive locations for electricity and gas globally. The differential
average price for electricity between Ireland and the UK has gone from a point where we are
almost 12 per cent more expensive in 2012 to a situation where in the first half of 2016
electricity prices are 6 per cent cheaper in Ireland. Whilst industrial gas prices are now equal
to the average prices across the Euro area, comparable prices are over 15 per cent lower in
the UK. The data available, however, is based on cumulative average prices for Ireland and
simple arithmetic averages for comparators. These figures also exclude VAT charges which
may be making Irish prices appear to be more competitive given the fact that only 5
countries, Greece, Italy, Luxembourg, Malta and the UK have lower VAT rates on both natural
gas and electricity17
.
On average, water and waste water costs for enterprise in Ireland compare favourably to
those in competitor markets. Within Ireland, water costs vary significantly by local authority.
In terms of waste costs, the cost of landfill has increased from €93 per tonne in 2010 to €113 in
2014 because of increases in the landfill levy18
. Irish landfill costs are amongst the most
expensive of the benchmarked countries/regions.
Ireland is relatively cost competitive for telecoms, especially for business mobile broadband.
However, concerns persist around the issues of quality (speed) and the regional availability of
high speed services.
Credit and
Financial
Costs
The supply and demand for credit has improved significantly since the height of the crisis.
However, the cost of credit, while falling remains high in an international context. Ireland had
the 4th
highest SME interest rates on bank overdrafts and credit lines in the Euro area in 2016.
In January 2017, the interest rate in Ireland on loans of up to and including €1 million was
almost double the Euro area average rate for new business. Furthermore, Irish interest rates
for loans both under- and over the €1m threshold have been noticeably more volatile than
Euro area rates. Irish and Euro area interest rates diverged further in 2014 and 2015. It is vital
that cost competitiveness in this area does not weaken further.
The cost of registering a business in Ireland as a percentage of Gross National Income was 0.2
per cent in Ireland in 2016, half the rate recorded some five years previously. The
corresponding average across the OCED was 3.88 per cent.
Business
Services and
Other Input
Costs
Services prices in Ireland have risen continuously since the beginning of 2012 and the
magnitude of the increase has been higher than the Euro area 19 average during this period
also. Overall since 2010, service prices have risen by more than manufacturing prices perhaps
reflecting the greater exposure of the manufacturing sector to international competition.
Large increases in prices were recorded in Postal and Courier (10.6 %) and Advertising, Media
& Market Research (7.9%) since 2012.
While the price of legal services dipped for a brief period in 2013, in Q3 2016 legal service
prices were 8.3 per cent higher than the corresponding quarter in 2012. According to the
17 France applies a standard rate and a reduced rate of 20% and 5.5% on both natural gas and electricity. 18 The increase in the landfill levy is fully in line with the Government’s policy to move waste management away from landfill. The landfill levy is an important
economic instrument to support the development of alternative treatments to landfill in the higher tiers of the waste hierarchy and lessen our impact on the
environment. The landfill tax in the UK is 84.40 Sterling.
26
World Bank, in international terms Ireland remains an expensive location in which to enforce
a business contract and is the 6th
most expensive in the OECD. It also takes significant time
(650 days) to enforce a contract in Ireland (compared with an OECD average of 551 days. The
World Bank also estimate that the total cost of contract enforcement in Ireland amounts to
26.9 per cent of a claim, compared with 22.1 per cent across the OECD.
Broader Cost
Environment Ireland remains an expensive location in which to do business with a price profile which can
be described as “high cost, rising slowly”. Irish consumer prices remain over 22 per cent above
the European Union average. Education costs have increased at a faster rate than overall
consumer costs since 2012 and over the corresponding period prices have risen by 18.5 per
cent. These increases have been driven primarily by increases in the tertiary sector. Irish
insurance price inflation as measured by the HICP has been volatile and significantly above
the UK rate and Euro area average from early 2014. Health insurance, which accounts for
approximately 60 per cent of the insurance category, has increased in Ireland in recent
months. In March 2017 the rate of Irish health insurance inflation (8.3%) was well above the
Euro area (2.3%) and UK (3.8%).
Mainly administered prices cover the prices of goods and services on which the government
including any national regulator has a significant influence. There has been a downward trend
in HICP and administered price inflation over the period 2011-2016. Inflation in administered
prices was particularly high in 2011 (6.3%) 2012 (7.3%) and 2015 (10.5%).
The affordability of housing is a key component of competitiveness. It impacts upon the
attractiveness of Ireland as a location for investment and directly impacts on enterprise costs
through wage effects, and indirectly determines the price of Irish goods and services. Taking
account of the higher cost of mortgage finance in Ireland, only two cities, Amsterdam and
London had a higher ‘mortgage affordability index’ in 2015. In terms of rent as a percentage
of income, three international cities were found to be less affordable than Dublin. Residential
Tenancies Board data for 2016 indicates that private sector rents continued to trend upwards.
At a national level, annual growth was 7.8 per cent in Quarter 4, 2016; this compares to 6.6
per cent annual growth in Q3 2016. The standard national average rent in Q4 2016 stood at
€986 per month. This is nearly the same as peak rents in 2007. The CSO’s Residential
Property Price Index has risen by 52.1 per cent in the five years to February 2016 while year-
on-year national growth in the corresponding month was 10.7 per cent.
Childcare costs in Ireland are the second highest in the OECD for couples and the highest in
the OECD for lone parents.
Costs of Doing Business 2017
27
Chapter 4 – Labour Costs
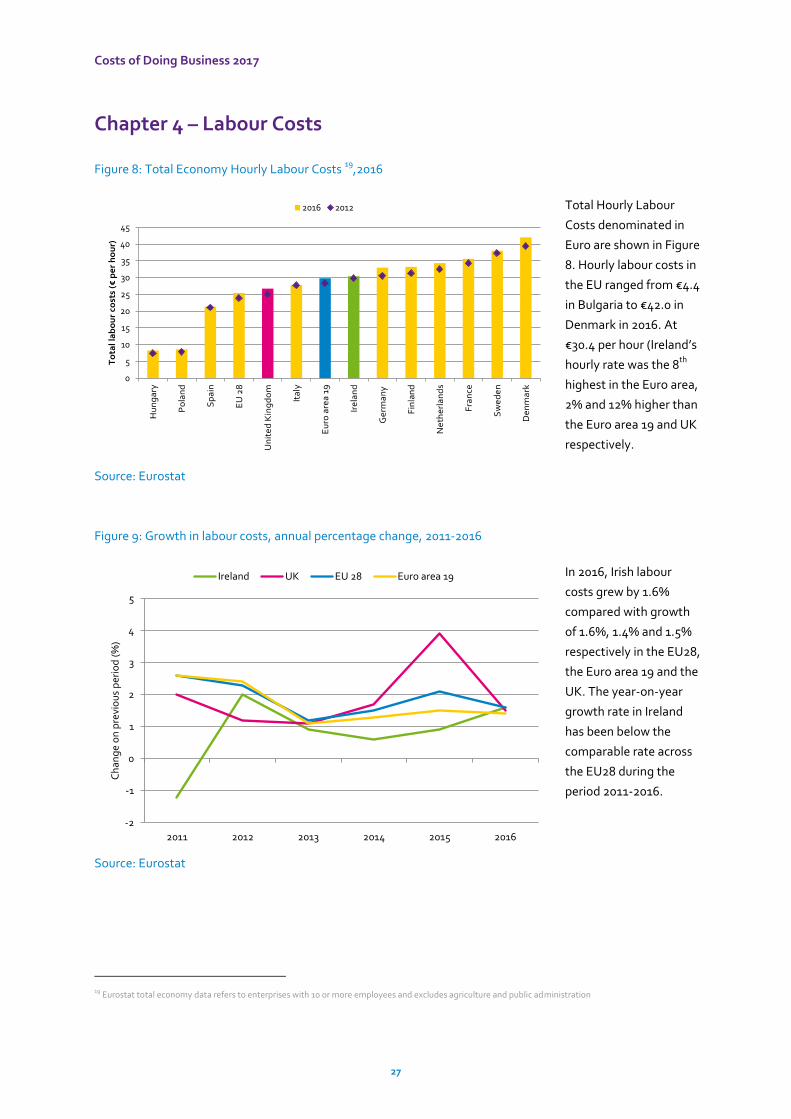
Figure 8: Total Economy Hourly Labour Costs 19
,2016
Total Hourly Labour
Costs denominated in
Euro are shown in Figure
8. Hourly labour costs in
the EU ranged from €4.4
in Bulgaria to €42.0 in
Denmark in 2016. At
€30.4 per hour (Ireland’s
hourly rate was the 8th
highest in the Euro area,
2% and 12% higher than
the Euro area 19 and UK
respectively.
Source: Eurostat
Figure 9: Growth in labour costs, annual percentage change, 2011-2016
In 2016, Irish labour
costs grew by 1.6%
compared with growth
of 1.6%, 1.4% and 1.5%
respectively in the EU28,
the Euro area 19 and the
UK. The year-on-year
growth rate in Ireland
has been below the
comparable rate across
the EU28 during the
period 2011-2016.
Source: Eurostat
19 Eurostat total economy data refers to enterprises with 10 or more employees and excludes agriculture and public administration
0
5
10
15
20
25
30
35
40
45
Hu
ng
ary
Po
lan
d
Sp
ain
EU
28
Un
ite
d K
ing
do
m
Ita
ly
Eu
ro a
rea
19
Ire
lan
d
Ge
rma
ny
Fin
lan
d
Ne
the
rla
nd
s
Fra
nce
Sw
ed
en
De
nm
ark
To
tal l
ab
ou
r co
sts
(€p
er
ho
ur)
2016 2012
-2
-1
0
1
2
3
4
5
2011 2012 2013 2014 2015 2016
Ch
ang
e o
n p
revi
ou
s p
erio
d (
%)
Ireland UK EU 28 Euro area 19
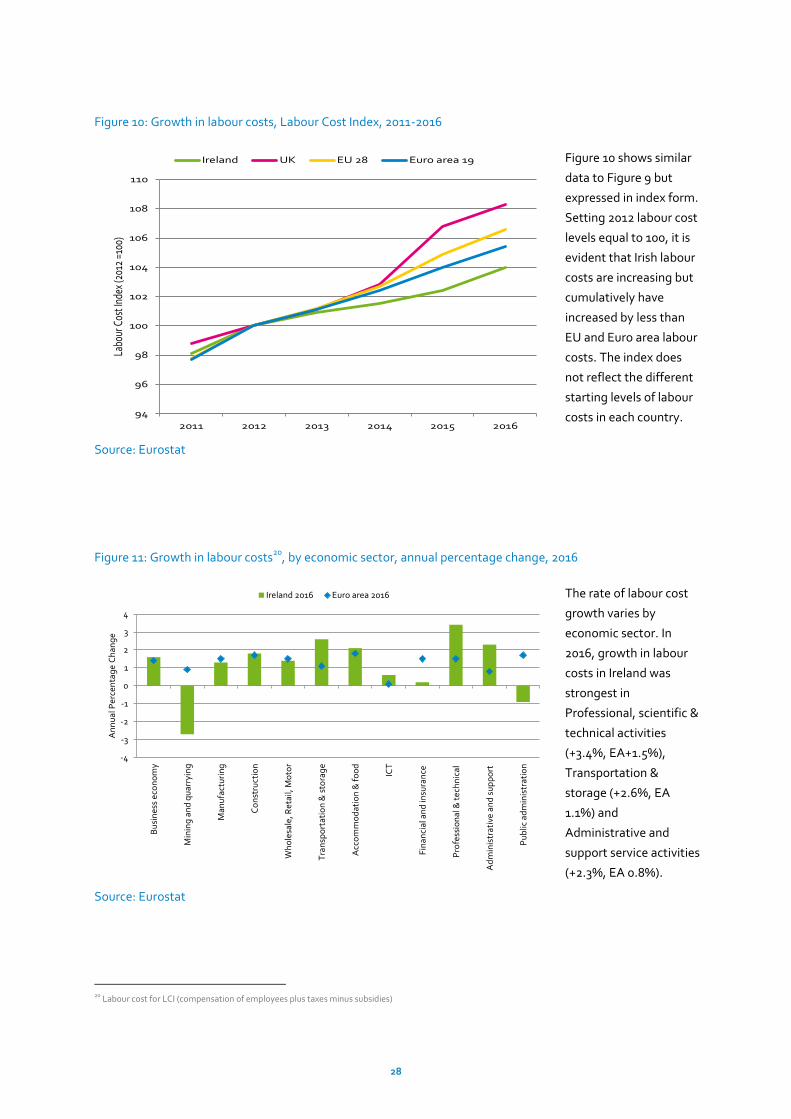
28
Figure 10: Growth in labour costs, Labour Cost Index, 2011-2016
Figure 10 shows similar
data to Figure 9 but
expressed in index form.
Setting 2012 labour cost
levels equal to 100, it is
evident that Irish labour
costs are increasing but
cumulatively have
increased by less than
EU and Euro area labour
costs. The index does
not reflect the different
starting levels of labour
costs in each country.
Source: Eurostat
Figure 11: Growth in labour costs20
, by economic sector, annual percentage change, 2016
The rate of labour cost
growth varies by
economic sector. In
2016, growth in labour
costs in Ireland was
strongest in
Professional, scientific &
technical activities
(+3.4%, EA+1.5%),
Transportation &
storage (+2.6%, EA
1.1%) and
Administrative and
support service activities
(+2.3%, EA 0.8%).
Source: Eurostat
20 Labour cost for LCI (compensation of employees plus taxes minus subsidies)
94
96
98
100
102
104
106
108
110
2011 2012 2013 2014 2015 2016
Labo
ur C
ost I
ndex
(201
2 =1
00)
Ireland UK EU 28 Euro area 19
-4
-3
-2
-1
0
1
2
3
4
Bu
sin
ess
eco
no
my
Min
ing
an
d q
uar
ryin
g
Man
ufa
ctu
rin
g
Co
nst
ruct
ion
Wh
ole
sale
, Re
tail,
Mo
tor
Tra
nsp
ort
atio
n &
sto
rag
e
Acc
om
mo
dat
ion
& f
oo
d
ICT
Fin
anci
al a
nd
insu
ran
ce
Pro
fess
ion
al &
te
chn
ical
Ad
min
istr
ativ
e a
nd
su
pp
ort
Pu
blic
ad
min
istr
atio
n
An
nu
al P
erce
nta
ge
Ch
ang
e
Ireland 2016 Euro area 2016
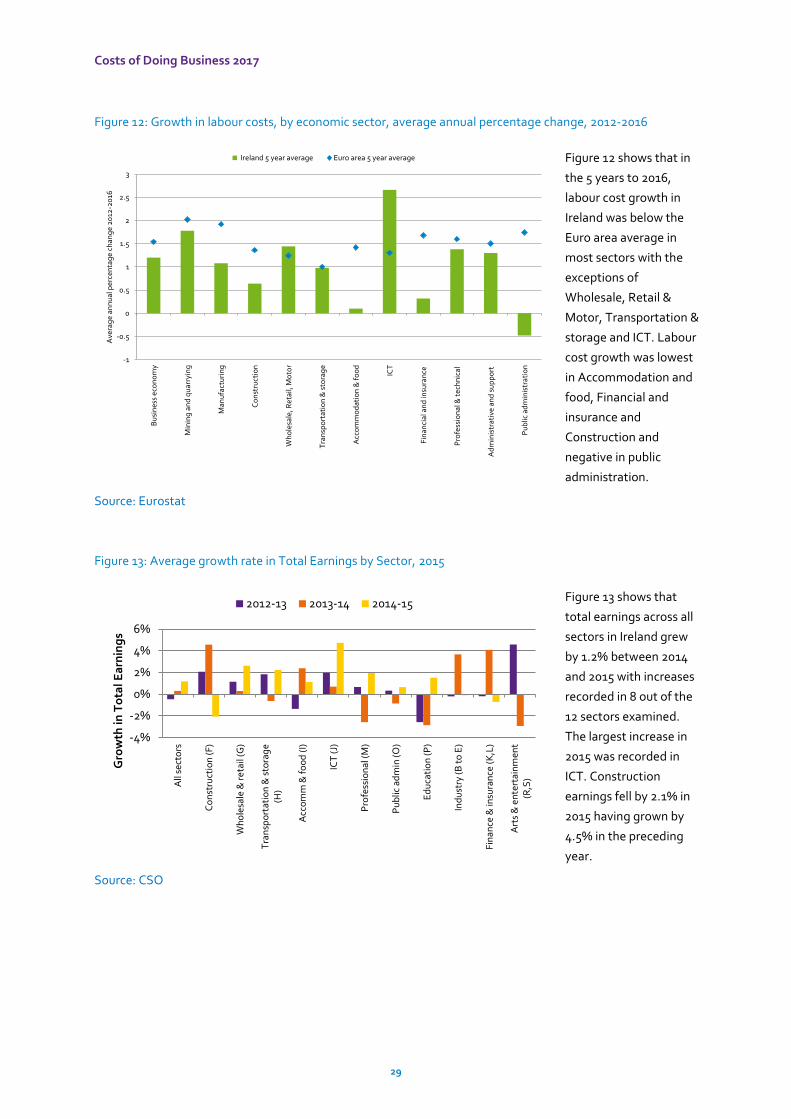
Costs of Doing Business 2017
29
Figure 12: Growth in labour costs, by economic sector, average annual percentage change, 2012-2016
Figure 12 shows that in
the 5 years to 2016,
labour cost growth in
Ireland was below the
Euro area average in
most sectors with the
exceptions of
Wholesale, Retail &
Motor, Transportation &
storage and ICT. Labour
cost growth was lowest
in Accommodation and
food, Financial and
insurance and
Construction and
negative in public
administration.
Source: Eurostat
Figure 13: Average growth rate in Total Earnings by Sector, 2015
Figure 13 shows that
total earnings across all
sectors in Ireland grew
by 1.2% between 2014
and 2015 with increases
recorded in 8 out of the
12 sectors examined.
The largest increase in
2015 was recorded in
ICT. Construction
earnings fell by 2.1% in
2015 having grown by
4.5% in the preceding
year.
Source: CSO
-1
-0.5
0
0.5
1
1.5
2
2.5
3
Bu
sin
ess
eco
no
my
Min
ing
an
d q
uar
ryin
g
Man
ufa
ctu
rin
g
Co
nst
ruct
ion
Wh
ole
sale
, Re
tail,
Mo
tor
Tra
nsp
ort
atio
n &
sto
rag
e
Acc
om
mo
dat
ion
& f
oo
d
ICT
Fin
anci
al a
nd
insu
ran
ce
Pro
fess
ion
al &
te
chn
ical
Ad
min
istr
ativ
e a
nd
su
pp
ort
Pu
blic
ad
min
istr
atio
n
Ave
rag
e an
nu
al p
erce
nta
ge
chan
ge
20
12-2
016
Ireland 5 year average Euro area 5 year average
-4%
-2%
0%
2%
4%
6%
All
sect
ors
Co
nst
ruct
ion
(F)
Wh
ole
sale
& r
eta
il (G
)
Tra
nsp
ort
atio
n &
sto
rag
e(H
)
Acc
om
m &
fo
od
(I)
ICT
(J)
Pro
fess
ion
al (M
)
Pu
blic
ad
min
(O)
Ed
uca
tio
n (
P)
Ind
ust
ry (B
to
E)
Fin
ance
& in
sura
nce
(K
,L)
Art
s &
en
tert
ain
men
t(R
,S)
Gro
wth
in T
ota
l Ea
rnin
gs
2012-13 2013-14 2014-15
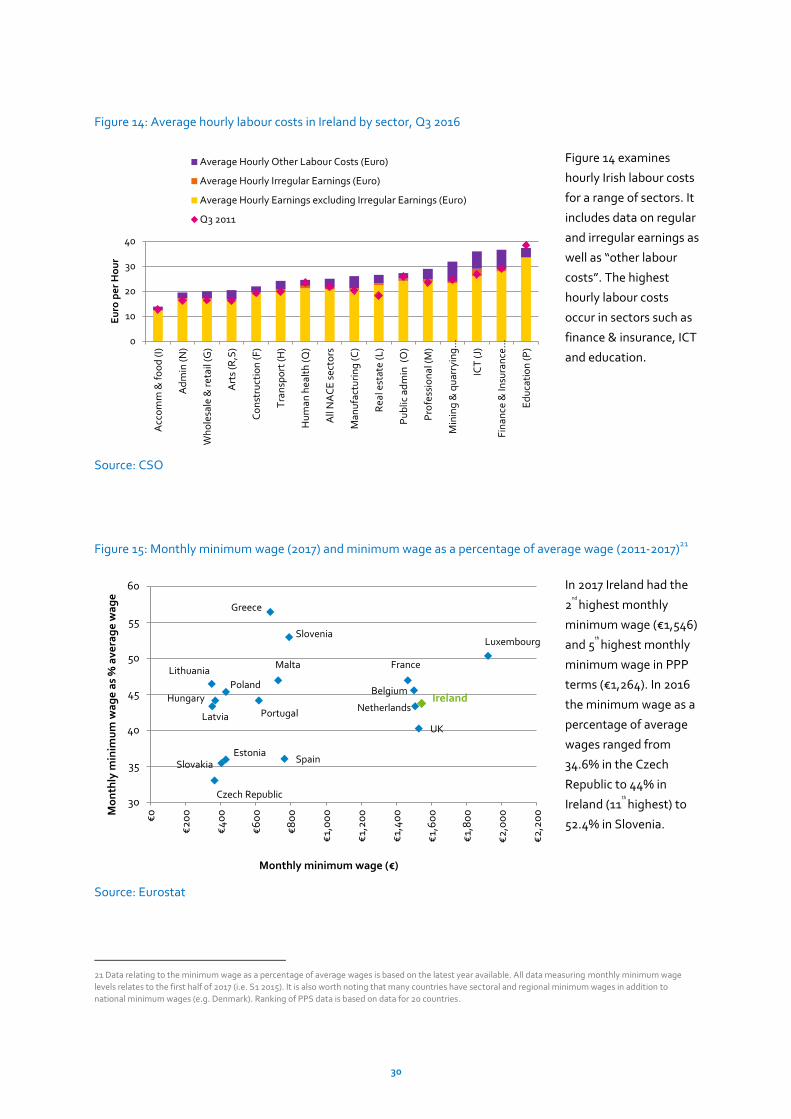
30
Figure 14: Average hourly labour costs in Ireland by sector, Q3 2016
Figure 14 examines
hourly Irish labour costs
for a range of sectors. It
includes data on regular
and irregular earnings as
well as “other labour
costs”. The highest
hourly labour costs
occur in sectors such as
finance & insurance, ICT
and education.
Source: CSO
Figure 15: Monthly minimum wage (2017) and minimum wage as a percentage of average wage (2011-2017)21
In 2017 Ireland had the
2nd
highest monthly
minimum wage (€1,546)
and 5th
highest monthly
minimum wage in PPP
terms (€1,264). In 2016
the minimum wage as a
percentage of average
wages ranged from
34.6% in the Czech
Republic to 44% in
Ireland (11th
highest) to
52.4% in Slovenia.
Source: Eurostat
21 Data relating to the minimum wage as a percentage of average wages is based on the latest year available. All data measuring monthly minimum wage
levels relates to the first half of 2017 (i.e. S1 2015). It is also worth noting that many countries have sectoral and regional minimum wages in addition to
national minimum wages (e.g. Denmark). Ranking of PPS data is based on data for 20 countries.
0
10
20
30
40
Acc
om
m &
fo
od
(I)
Ad
min
(N
)
Wh
ole
sale
& r
eta
il (G
)
Art
s (R
,S)
Co
nst
ruct
ion
(F
)
Tra
nsp
ort
(H
)
Hu
man
hea
lth
(Q
)
All
NA
CE
sec
tors
Man
ufa
ctu
rin
g (C
)
Re
al e
stat
e (
L)
Pu
blic
ad
min
(O
)
Pro
fess
ion
al (
M)
Min
ing
& q
uar
ryin
g…
ICT
(J)
Fin
ance
& In
sura
nce
…
Ed
uca
tio
n (P
)
Eu
ro p
er
Ho
ur
Average Hourly Other Labour Costs (Euro)
Average Hourly Irregular Earnings (Euro)
Average Hourly Earnings excluding Irregular Earnings (Euro)
Q3 2011
Czech Republic
Estonia
Ireland
Greece
Spain
France
Latvia
Lithuania
Luxembourg
Hungary
Malta
Netherlands
Poland
Portugal
Slovenia
Slovakia
UK
Belgium
30
35
40
45
50
55
60
€0
€2
00
€4
00
€6
00
€8
00
€1,
00
0
€1,
20
0
€1,
40
0
€1,
60
0
€1,
80
0
€2
,00
0
€2
,20
0Mo
nth
ly m
inim
um
wa
ge
as
% a
vera
ge
wa
ge
Monthly minimum wage (€)
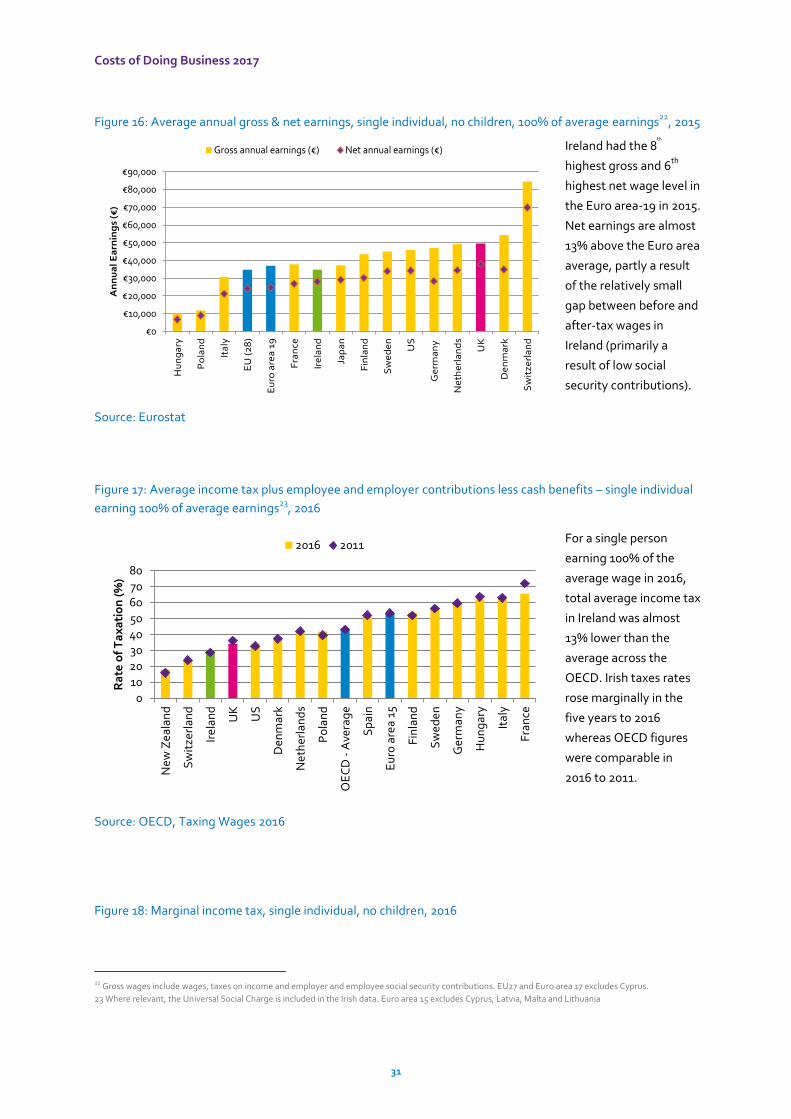
Costs of Doing Business 2017
31
Figure 16: Average annual gross & net earnings, single individual, no children, 100% of average earnings22
, 2015
Ireland had the 8th
highest gross and 6th
highest net wage level in
the Euro area-19 in 2015.
Net earnings are almost
13% above the Euro area
average, partly a result
of the relatively small
gap between before and
after-tax wages in
Ireland (primarily a
result of low social
security contributions).
Source: Eurostat
Figure 17: Average income tax plus employee and employer contributions less cash benefits – single individual
earning 100% of average earnings23
, 2016
For a single person
earning 100% of the
average wage in 2016,
total average income tax
in Ireland was almost
13% lower than the
average across the
OECD. Irish taxes rates
rose marginally in the
five years to 2016
whereas OECD figures
were comparable in
2016 to 2011.
Source: OECD, Taxing Wages 2016
Figure 18: Marginal income tax, single individual, no children, 2016
22 Gross wages include wages, taxes on income and employer and employee social security contributions. EU27 and Euro area 17 excludes Cyprus.
23 Where relevant, the Universal Social Charge is included in the Irish data. Euro area 15 excludes Cyprus, Latvia, Malta and Lithuania
€0
€10,000
€20,000
€30,000
€40,000
€50,000
€60,000
€70,000
€80,000
€90,000H
un
ga
ry
Po
lan
d
Ita
ly
EU
(2
8)
Eu
ro a
rea
19
Fra
nce
Ire
lan
d
Jap
an
Fin
lan
d
Sw
ed
en
US
Ge
rma
ny
Ne
the
rla
nd
s
UK
De
nm
ark
Sw
itze
rla
nd
An
nu
al E
arn
ing
s (€
)
Gross annual earnings (€) Net annual earnings (€)
0
10
20
30
40
50
60
70
80
Ne
w Z
eal
and
Sw
itze
rlan
d
Ire
lan
d
UK
US
Den
mar
k
Ne
ther
lan
ds
Po
lan
d
OE
CD
- A
vera
ge
Sp
ain
Eu
ro a
rea
15
Fin
lan
d
Sw
ed
en
Ger
man
y
Hu
ng
ary
Ital
y
Fra
nce
Ra
te o
f T
ax
ati
on
(%
)
2016 2011
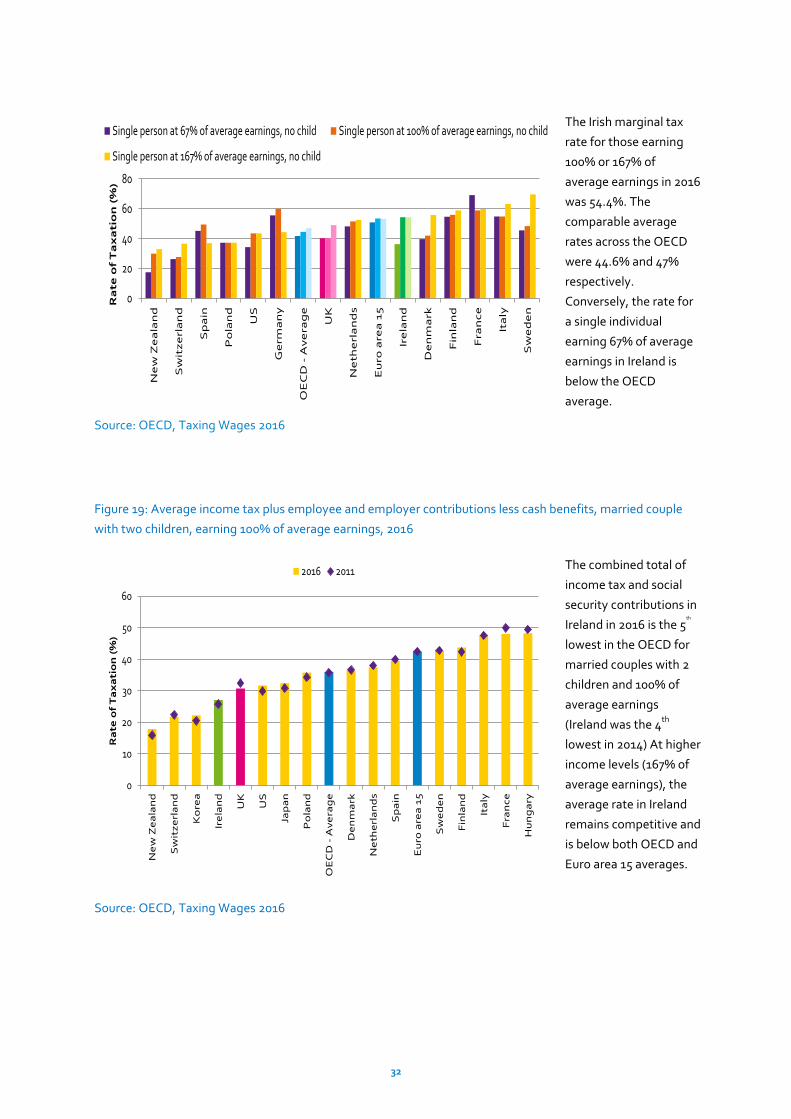
32
The Irish marginal tax
rate for those earning
100% or 167% of
average earnings in 2016
was 54.4%. The
comparable average
rates across the OECD
were 44.6% and 47%
respectively.
Conversely, the rate for
a single individual
earning 67% of average
earnings in Ireland is
below the OECD
average.
Source: OECD, Taxing Wages 2016
Figure 19: Average income tax plus employee and employer contributions less cash benefits, married couple
with two children, earning 100% of average earnings, 2016
The combined total of
income tax and social
security contributions in
Ireland in 2016 is the 5th
lowest in the OECD for
married couples with 2
children and 100% of
average earnings
(Ireland was the 4th
lowest in 2014) At higher
income levels (167% of
average earnings), the
average rate in Ireland
remains competitive and
is below both OECD and
Euro area 15 averages.
Source: OECD, Taxing Wages 2016
0
20
40
60
80
Ne
w Z
ea
lan
d
Sw
itz
erl
an
d
Sp
ain
Po
lan
d
US
Ge
rma
ny
OE
CD
- A
ve
rag
e
UK
Ne
the
rla
nd
s
Eu
ro a
rea
15
Ire
lan
d
De
nm
ark
Fin
lan
d
Fra
nc
e
Ita
ly
Sw
ed
en
Ra
te
of
Ta
xa
tio
n (
%)
Single person at 67% of average earnings, no child Single person at 100% of average earnings, no child
Single person at 167% of average earnings, no child
0
10
20
30
40
50
60
Ne
w Z
ea
lan
d
Sw
itz
erl
an
d
Ko
rea
Ire
lan
d
UK
US
Jap
an
Po
lan
d
OE
CD
- A
ve
rag
e
De
nm
ark
Ne
the
rla
nd
s
Sp
ain
Eu
ro a
rea
15
Sw
ed
en
Fin
lan
d
Ita
ly
Fra
nc
e
Hu
ng
ary
Ra
te o
f T
ax
ati
on
(%
)
2016 2011
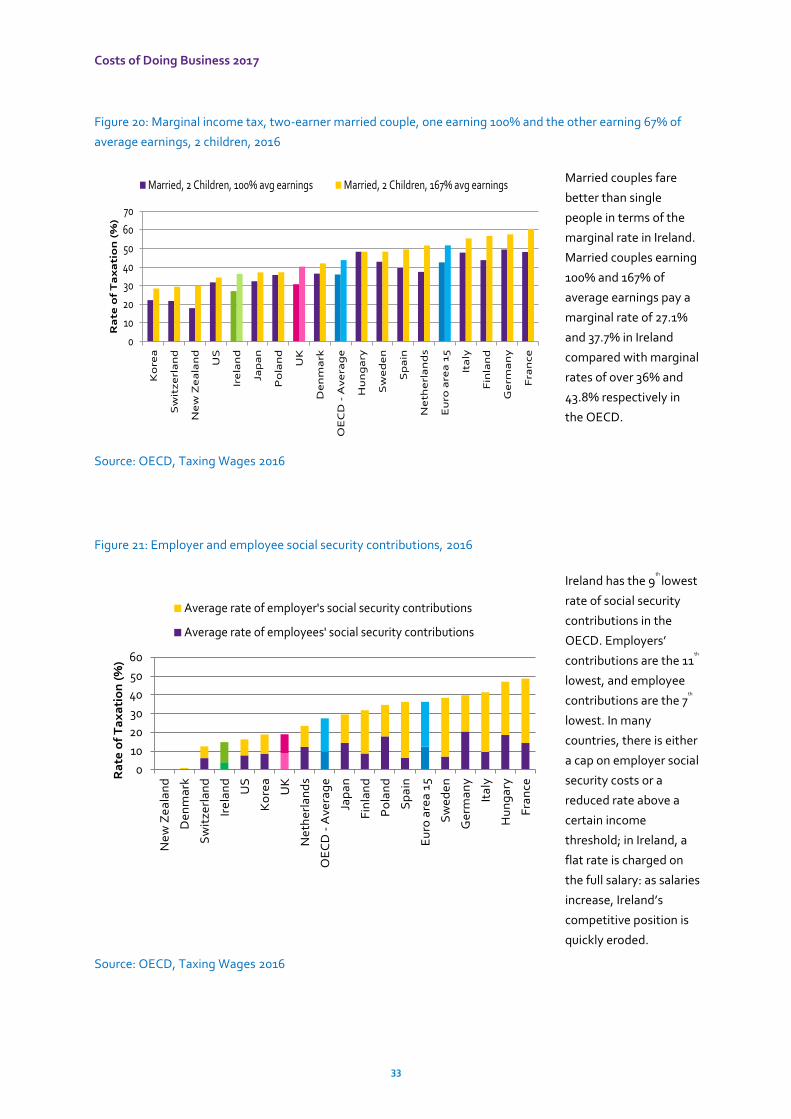
Costs of Doing Business 2017
33
Figure 20: Marginal income tax, two-earner married couple, one earning 100% and the other earning 67% of
average earnings, 2 children, 2016
Married couples fare
better than single
people in terms of the
marginal rate in Ireland.
Married couples earning
100% and 167% of
average earnings pay a
marginal rate of 27.1%
and 37.7% in Ireland
compared with marginal
rates of over 36% and
43.8% respectively in
the OECD.
Source: OECD, Taxing Wages 2016
Figure 21: Employer and employee social security contributions, 2016
Ireland has the 9th
lowest
rate of social security
contributions in the
OECD. Employers’
contributions are the 11th
lowest, and employee
contributions are the 7th
lowest. In many
countries, there is either
a cap on employer social
security costs or a
reduced rate above a
certain income
threshold; in Ireland, a
flat rate is charged on
the full salary: as salaries
increase, Ireland’s
competitive position is
quickly eroded.
Source: OECD, Taxing Wages 2016
0
10
20
30
40
50
60
70
Ko
rea
Sw
itz
erl
an
d
Ne
w Z
ea
lan
d
US
Ire
lan
d
Jap
an
Po
lan
d
UK
De
nm
ark
OE
CD
- A
ve
rag
e
Hu
ng
ary
Sw
ed
en
Sp
ain
Ne
the
rla
nd
s
Eu
ro a
rea
15
Ita
ly
Fin
lan
d
Ge
rma
ny
Fra
nc
e
Ra
te o
f T
ax
ati
on
(%
)
Married, 2 Children, 100% avg earnings Married, 2 Children, 167% avg earnings
0
10
20
30
40
50
60
Ne
w Z
ea
lan
d
De
nm
ark
Sw
itze
rla
nd
Ire
lan
d
US
Ko
rea
UK
Ne
the
rla
nd
s
OE
CD
- A
vera
ge
Jap
an
Fin
lan
d
Po
lan
d
Sp
ain
Eu
ro a
rea
15
Sw
ed
en
Ge
rma
ny
Ita
ly
Hu
ng
ary
Fra
nce
Ra
te o
f T
ax
ati
on
(%
)
Average rate of employer's social security contributions
Average rate of employees' social security contributions
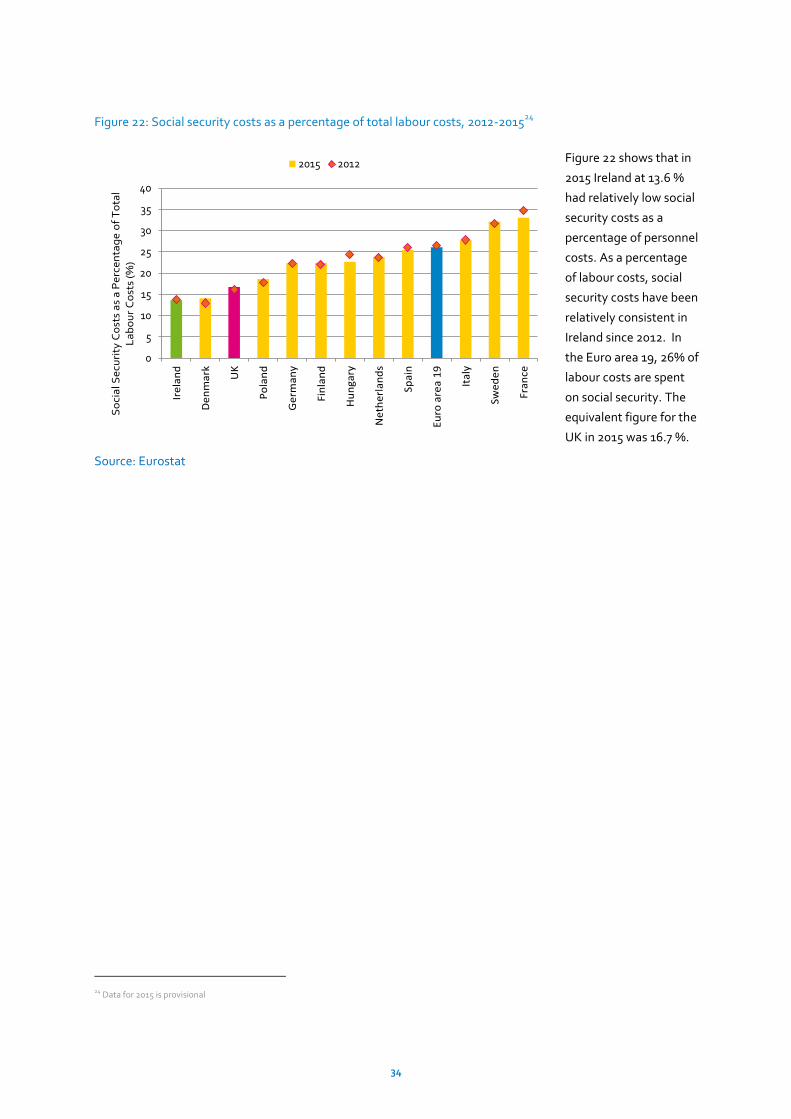
34
Figure 22: Social security costs as a percentage of total labour costs, 2012-201524
Figure 22 shows that in
2015 Ireland at 13.6 %
had relatively low social
security costs as a
percentage of personnel
costs. As a percentage
of labour costs, social
security costs have been
relatively consistent in
Ireland since 2012. In
the Euro area 19, 26% of
labour costs are spent
on social security. The
equivalent figure for the
UK in 2015 was 16.7 %.
Source: Eurostat
24 Data for 2015 is provisional
0
5
10
15
20
25
30
35
40Ir
ela
nd
De
nm
ark UK
Po
lan
d
Ge
rma
ny
Fin
lan
d
Hu
nga
ry
Ne
the
rla
nd
s
Spa
in
Eu
ro a
rea
19
Ita
ly
Swe
de
n
Fra
nce
So
cia
l Se
curi
ty C
ost
s a
s a
Pe
rce
nta
ge
of
To
tal
La
bo
ur
Co
sts
(%)
2015 2012
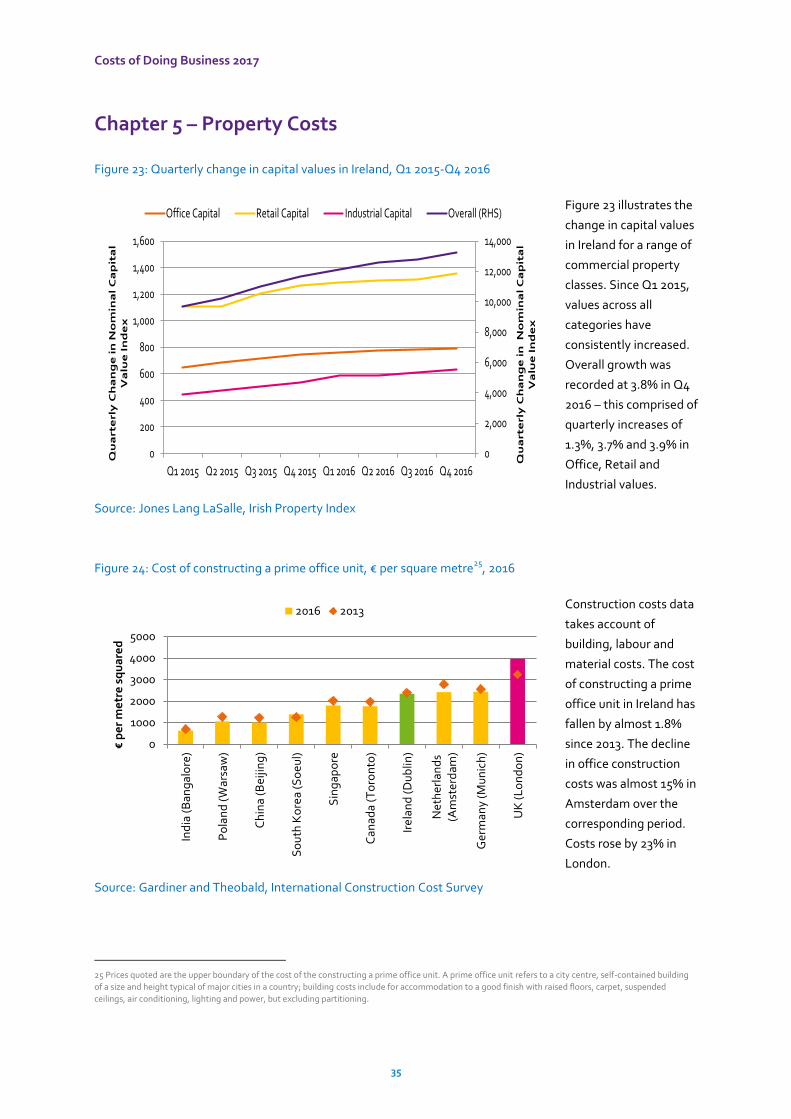
Costs of Doing Business 2017
35
Chapter 5 – Property Costs
Figure 23: Quarterly change in capital values in Ireland, Q1 2015-Q4 2016
Figure 23 illustrates the
change in capital values
in Ireland for a range of
commercial property
classes. Since Q1 2015,
values across all
categories have
consistently increased.
Overall growth was
recorded at 3.8% in Q4
2016 – this comprised of
quarterly increases of
1.3%, 3.7% and 3.9% in
Office, Retail and
Industrial values.
Source: Jones Lang LaSalle, Irish Property Index
Figure 24: Cost of constructing a prime office unit, € per square metre25
, 2016
Construction costs data
takes account of
building, labour and
material costs. The cost
of constructing a prime
office unit in Ireland has
fallen by almost 1.8%
since 2013. The decline
in office construction
costs was almost 15% in
Amsterdam over the
corresponding period.
Costs rose by 23% in
London.
Source: Gardiner and Theobald, International Construction Cost Survey
25 Prices quoted are the upper boundary of the cost of the constructing a prime office unit. A prime office unit refers to a city centre, self-contained building
of a size and height typical of major cities in a country; building costs include for accommodation to a good finish with raised floors, carpet, suspended
ceilings, air conditioning, lighting and power, but excluding partitioning.
0
2,000
4,000
6,000
8,000
10,000
12,000
14,000
0
200
400
600
800
1,000
1,200
1,400
1,600
Q1 2015 Q2 2015 Q3 2015 Q4 2015 Q1 2016 Q2 2016 Q3 2016 Q4 2016
Qu
art
erl
y C
ha
ng
e i
n
No
min
al
Ca
pit
al
Va
lue
In
de
x
Qu
art
erl
y C
ha
ng
e i
n N
om
ina
l C
ap
ita
l V
alu
e I
nd
ex
Office Capital Retail Capital Industrial Capital Overall (RHS)
0
1000
2000
3000
4000
5000
Ind
ia (
Ban
gal
ore
)
Po
lan
d (W
arsa
w)
Ch
ina
(Bei
jing
)
So
uth
Ko
rea
(So
eul)
Sin
gap
ore
Can
ada
(To
ron
to)
Ire
lan
d (D
ub
lin)
Ne
ther
lan
ds
(Am
ster
dam
)
Ger
man
y (M
un
ich
)
UK
(L
on
do
n)
€p
er
me
tre
sq
ua
red
2016 2013
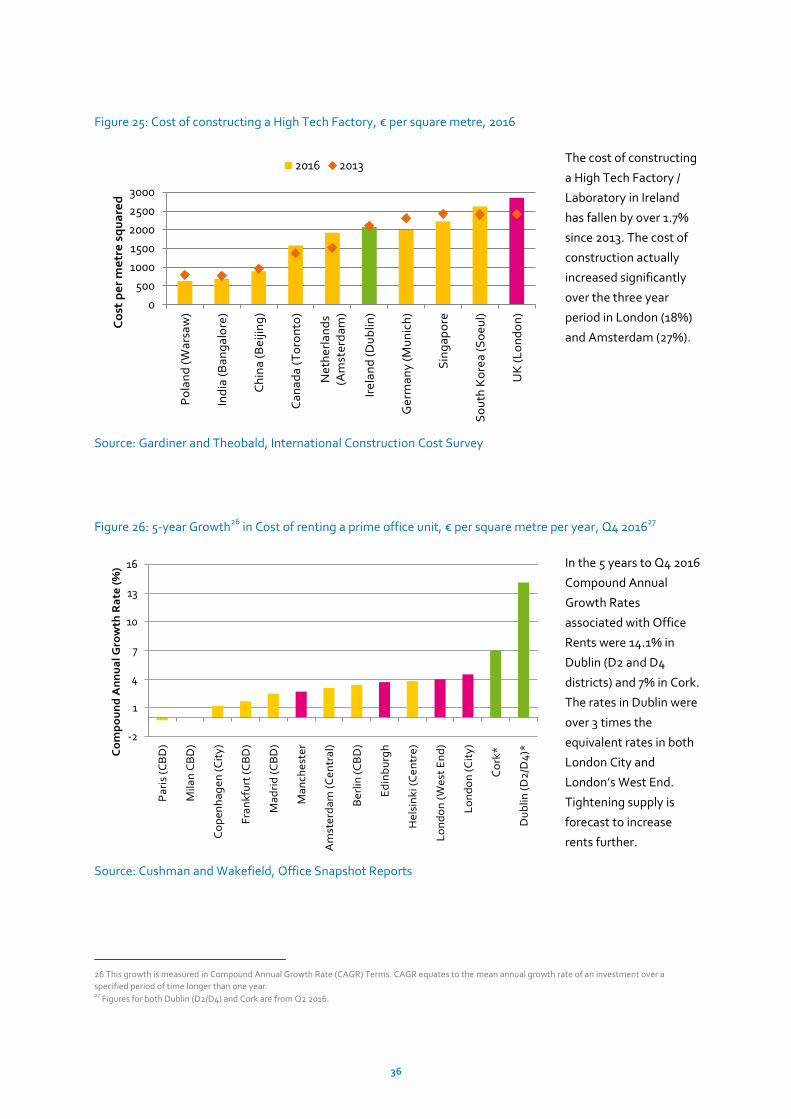
36
Figure 25: Cost of constructing a High Tech Factory, € per square metre, 2016
The cost of constructing
a High Tech Factory /
Laboratory in Ireland
has fallen by over 1.7%
since 2013. The cost of
construction actually
increased significantly
over the three year
period in London (18%)
and Amsterdam (27%).
Source: Gardiner and Theobald, International Construction Cost Survey
Figure 26: 5-year Growth26
in Cost of renting a prime office unit, € per square metre per year, Q4 201627
In the 5 years to Q4 2016
Compound Annual
Growth Rates
associated with Office
Rents were 14.1% in
Dublin (D2 and D4
districts) and 7% in Cork.
The rates in Dublin were
over 3 times the
equivalent rates in both
London City and
London’s West End.
Tightening supply is
forecast to increase
rents further.
Source: Cushman and Wakefield, Office Snapshot Reports
26 This growth is measured in Compound Annual Growth Rate (CAGR) Terms. CAGR equates to the mean annual growth rate of an investment over a
specified period of time longer than one year. 27 Figures for both Dublin (D2/D4) and Cork are from Q2 2016.
0
500
1000
1500
2000
2500
3000P
ola
nd
(W
ars
aw
)
Ind
ia (
Ba
ng
alo
re)
Ch
ina
(B
eiji
ng
)
Ca
na
da
(T
oro
nto
)
Ne
the
rla
nd
s(A
mst
erd
am
)
Ire
lan
d (
Du
blin
)
Ge
rma
ny
(M
un
ich
)
Sin
ga
po
re
So
uth
Ko
rea
(S
oe
ul)
UK
(L
on
do
n)
Co
st p
er
me
tre
sq
ua
red
2016 2013
-2
1
4
7
10
13
16
Pa
ris
(CB
D)
Mila
n C
BD
)
Co
pe
nh
ag
en
(C
ity
)
Fra
nk
furt
(C
BD
)
Ma
dri
d (
CB
D)
Ma
nch
est
er
Am
ste
rda
m (
Ce
ntr
al)
Be
rlin
(C
BD
)
Ed
inb
urg
h
He
lsin
ki (
Ce
ntr
e)
Lo
nd
on
(W
est
En
d)
Lo
nd
on
(C
ity
)
Co
rk*
Du
blin
(D
2/D
4)*C
om
po
un
d A
nn
ua
l Gro
wth
Ra
te (
%)
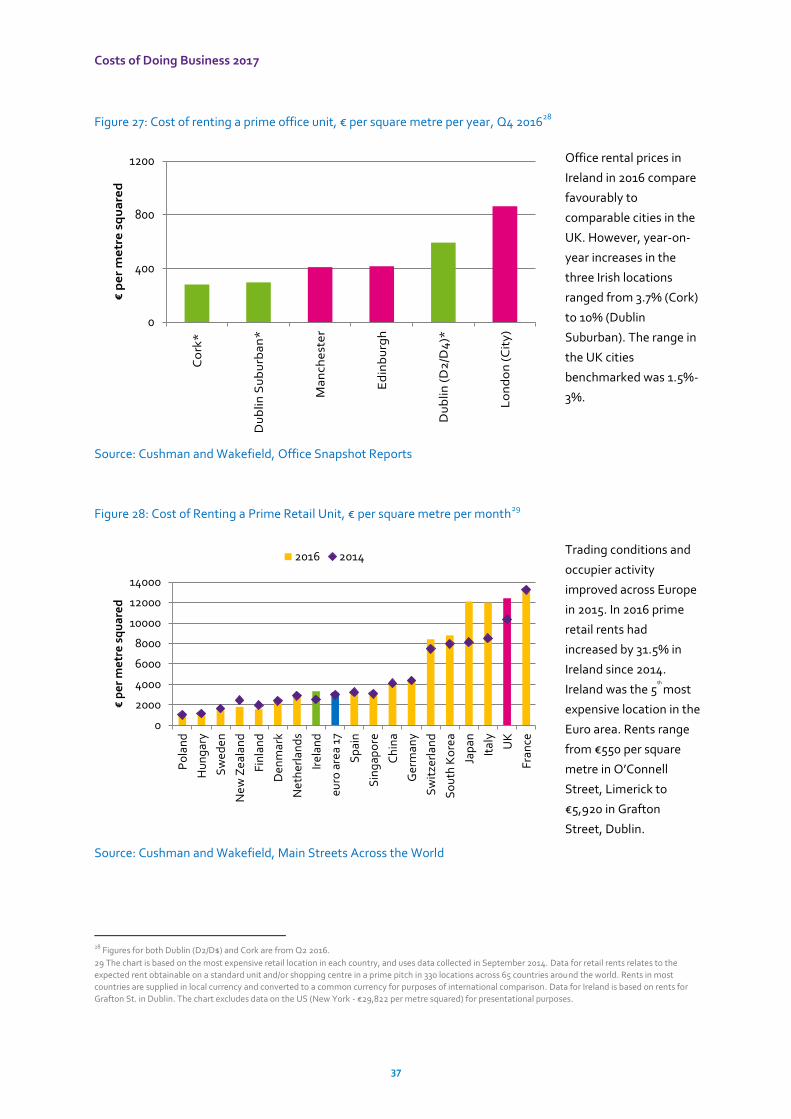
Costs of Doing Business 2017
37
Figure 27: Cost of renting a prime office unit, € per square metre per year, Q4 201628
Office rental prices in
Ireland in 2016 compare
favourably to
comparable cities in the
UK. However, year-on-
year increases in the
three Irish locations
ranged from 3.7% (Cork)
to 10% (Dublin
Suburban). The range in
the UK cities
benchmarked was 1.5%-
3%.
Source: Cushman and Wakefield, Office Snapshot Reports
Figure 28: Cost of Renting a Prime Retail Unit, € per square metre per month29
Trading conditions and
occupier activity
improved across Europe
in 2015. In 2016 prime
retail rents had
increased by 31.5% in
Ireland since 2014.
Ireland was the 5th
most
expensive location in the
Euro area. Rents range
from €550 per square
metre in O’Connell
Street, Limerick to
€5,920 in Grafton
Street, Dublin.
Source: Cushman and Wakefield, Main Streets Across the World
28 Figures for both Dublin (D2/D$) and Cork are from Q2 2016.
29 The chart is based on the most expensive retail location in each country, and uses data collected in September 2014. Data for retail rents relates to the
expected rent obtainable on a standard unit and/or shopping centre in a prime pitch in 330 locations across 65 countries around the world. Rents in most
countries are supplied in local currency and converted to a common currency for purposes of international comparison. Data for Ireland is based on rents for
Grafton St. in Dublin. The chart excludes data on the US (New York - €29,822 per metre squared) for presentational purposes.
0
400
800
1200
Co
rk*
Du
blin
Su
bu
rba
n*
Ma
nch
est
er
Ed
inb
urg
h
Du
blin
(D
2/D
4)*
Lo
nd
on
(C
ity
)
€p
er
me
tre
sq
ua
red
0
2000
4000
6000
8000
10000
12000
14000
Po
lan
d
Hu
ng
ary
Sw
ed
en
Ne
w Z
eal
and
Fin
lan
d
Den
mar
k
Ne
ther
lan
ds
Ire
lan
d
euro
are
a 17
Sp
ain
Sin
gap
ore
Ch
ina
Ger
man
y
Sw
itze
rlan
d
So
uth
Ko
rea
Jap
an
Ital
y
UK
Fra
nce
€p
er
me
tre
sq
ua
red
2016 2014
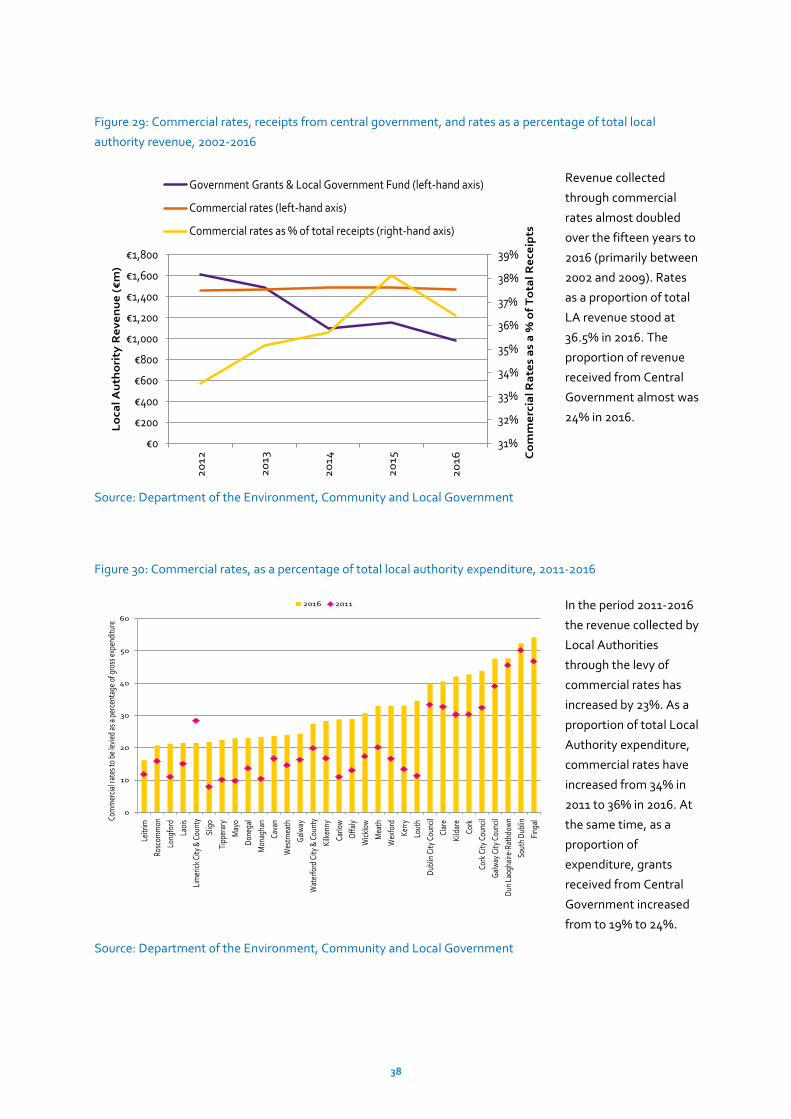
38
Figure 29: Commercial rates, receipts from central government, and rates as a percentage of total local
authority revenue, 2002-2016
Revenue collected
through commercial
rates almost doubled
over the fifteen years to
2016 (primarily between
2002 and 2009). Rates
as a proportion of total
LA revenue stood at
36.5% in 2016. The
proportion of revenue
received from Central
Government almost was
24% in 2016.
Source: Department of the Environment, Community and Local Government
Figure 30: Commercial rates, as a percentage of total local authority expenditure, 2011-2016
In the period 2011-2016
the revenue collected by
Local Authorities
through the levy of
commercial rates has
increased by 23%. As a
proportion of total Local
Authority expenditure,
commercial rates have
increased from 34% in
2011 to 36% in 2016. At
the same time, as a
proportion of
expenditure, grants
received from Central
Government increased
from to 19% to 24%.
Source: Department of the Environment, Community and Local Government
31%
32%
33%
34%
35%
36%
37%
38%
39%
€0
€200
€400
€600
€800
€1,000
€1,200
€1,400
€1,600
€1,800
20
12
20
13
20
14
20
15
20
16 C
om
me
rcia
l Ra
tes
as
a %
of
To
tal
Re
ceip
ts
Lo
cal
Au
tho
rity
Re
ve
nu
e (
€m
)
Government Grants & Local Government Fund (left-hand axis)
Commercial rates (left-hand axis)
Commercial rates as % of total receipts (right-hand axis)
0
10
20
30
40
50
60
Leitr
im
Rosc
omm
on
Long
ford
Laoi
s
Lim
eric
k Ci
ty &
Cou
nty
Slig
o
Tipp
erar
y
May
o
Don
egal
Mon
agha
n
Cava
n
Wes
tmea
th
Gal
way
Wat
erfo
rd C
ity &
Cou
nty
Kilk
enny
Carlo
w
Off
aly
Wic
klow
Mea
th
Wex
ford
Kerr
y
Lout
h
Dub
lin C
ity C
ounc
il
Clar
e
Kild
are
Cork
Cork
City
Cou
ncil
Gal
way
City
Cou
ncil
Dun
Lao
ghai
re-R
athd
own
Sout
h D
ublin
Fing
alCom
mer
cial
rate
s to
be le
vied
as a
per
cent
age
of g
ross
exp
endi
ture
2016 2011
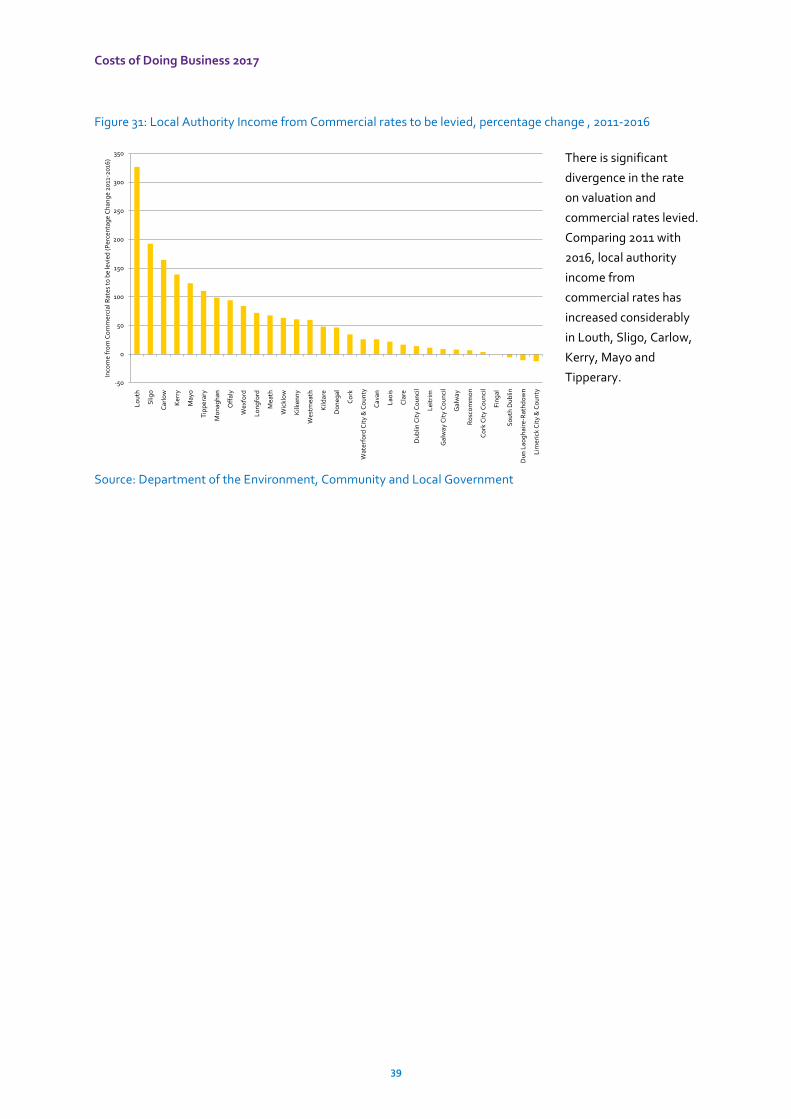
Costs of Doing Business 2017
39
Figure 31: Local Authority Income from Commercial rates to be levied, percentage change , 2011-2016
There is significant
divergence in the rate
on valuation and
commercial rates levied.
Comparing 2011 with
2016, local authority
income from
commercial rates has
increased considerably
in Louth, Sligo, Carlow,
Kerry, Mayo and
Tipperary.
Source: Department of the Environment, Community and Local Government
-50
0
50
100
150
200
250
300
350
Lo
uth
Slig
o
Car
low
Ke
rry
May
o
Tip
pe
rary
Mo
nag
han
Off
aly
Wex
ford
Lo
ng
ford
Mea
th
Wic
klo
w
Kilk
enn
y
Wes
tmea
th
Kild
are
Do
ne
gal
Co
rk
Wat
erf
ord
Cit
y &
Co
un
ty
Cav
an
Lao
is
Cla
re
Du
blin
Cit
y C
ou
nci
l
Le
itri
m
Gal
way
Cit
y C
ou
nci
l
Gal
way
Ro
sco
mm
on
Co
rk C
ity
Co
un
cil
Fin
gal
So
uth
Du
blin
Du
n L
aog
hai
re-R
ath
do
wn
Lim
eric
k C
ity
& C
ou
nty
Inco
me
fro
m C
om
mer
cial
Rat
es t
o b
e le
vied
(P
erce
nta
ge
Ch
ang
e 2
011
-20
16)
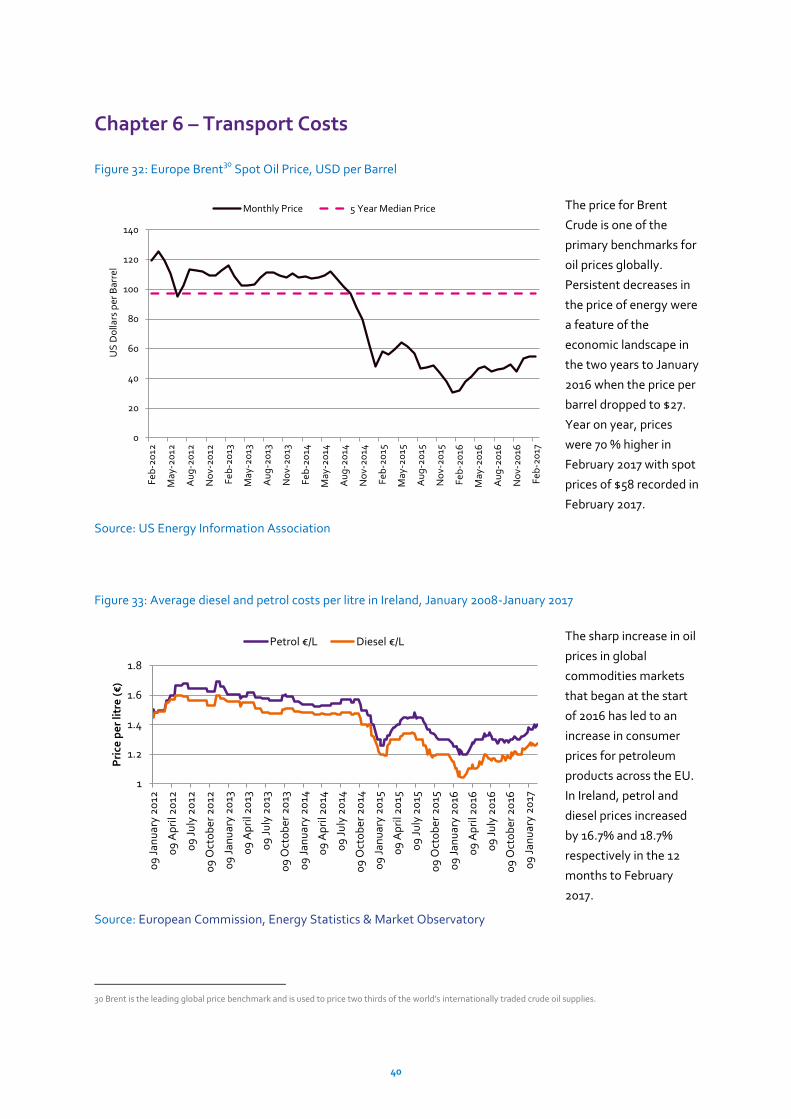
40
Chapter 6 – Transport Costs
Figure 32: Europe Brent30
Spot Oil Price, USD per Barrel
The price for Brent
Crude is one of the
primary benchmarks for
oil prices globally.
Persistent decreases in
the price of energy were
a feature of the
economic landscape in
the two years to January
2016 when the price per
barrel dropped to $27.
Year on year, prices
were 70 % higher in
February 2017 with spot
prices of $58 recorded in
February 2017.
Source: US Energy Information Association
Figure 33: Average diesel and petrol costs per litre in Ireland, January 2008-January 2017
The sharp increase in oil
prices in global
commodities markets
that began at the start
of 2016 has led to an
increase in consumer
prices for petroleum
products across the EU.
In Ireland, petrol and
diesel prices increased
by 16.7% and 18.7%
respectively in the 12
months to February
2017.
Source: European Commission, Energy Statistics & Market Observatory
30 Brent is the leading global price benchmark and is used to price two thirds of the world's internationally traded crude oil supplies.
0
20
40
60
80
100
120
140
Fe
b-2
012
May
-20
12
Au
g-2
012
No
v-2
012
Fe
b-2
013
May
-20
13
Au
g-2
013
No
v-2
013
Fe
b-2
014
May
-20
14
Au
g-2
014
No
v-2
014
Fe
b-2
015
May
-20
15
Au
g-2
015
No
v-2
015
Fe
b-2
016
May
-20
16
Au
g-2
016
No
v-2
016
Fe
b-2
017
US
Do
llars
per
Bar
rel
Monthly Price 5 Year Median Price
1
1.2
1.4
1.6
1.8
09
Jan
uar
y 2
012
09
Ap
ril 2
012
09
Ju
ly 2
012
09
Oct
ob
er 2
012
09
Jan
uar
y 2
013
09
Ap
ril 2
013
09
Ju
ly 2
013
09
Oct
ob
er 2
013
09
Jan
uar
y 2
014
09
Ap
ril 2
014
09
Ju
ly 2
014
09
Oct
ob
er 2
014
09
Jan
uar
y 2
015
09
Ap
ril 2
015
09
Ju
ly 2
015
09
Oct
ob
er 2
015
09
Jan
uar
y 2
016
09
Ap
ril 2
016
09
Ju
ly 2
016
09
Oct
ob
er 2
016
09
Jan
uar
y 2
017
Pri
ce p
er
litr
e (
€)
Petrol €/L Diesel €/L
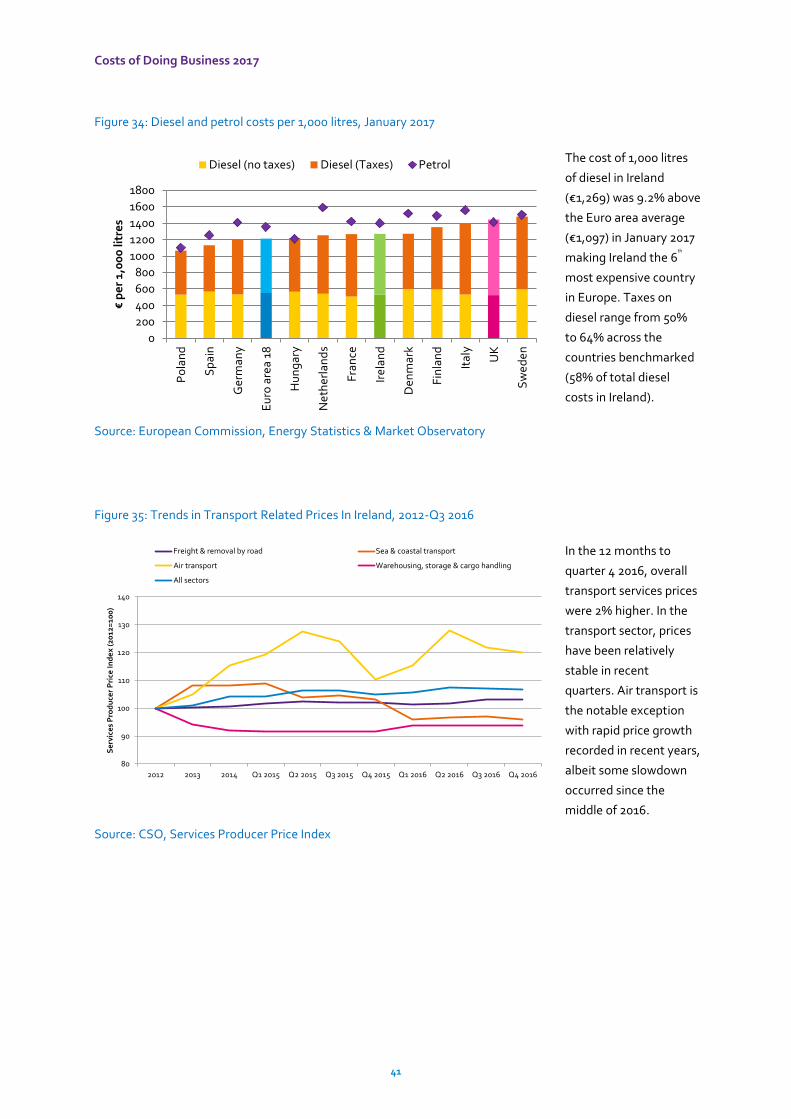
Costs of Doing Business 2017
41
Figure 34: Diesel and petrol costs per 1,000 litres, January 2017
The cost of 1,000 litres
of diesel in Ireland
(€1,269) was 9.2% above
the Euro area average
(€1,097) in January 2017
making Ireland the 6th
most expensive country
in Europe. Taxes on
diesel range from 50%
to 64% across the
countries benchmarked
(58% of total diesel
costs in Ireland).
Source: European Commission, Energy Statistics & Market Observatory
Figure 35: Trends in Transport Related Prices In Ireland, 2012-Q3 2016
In the 12 months to
quarter 4 2016, overall
transport services prices
were 2% higher. In the
transport sector, prices
have been relatively
stable in recent
quarters. Air transport is
the notable exception
with rapid price growth
recorded in recent years,
albeit some slowdown
occurred since the
middle of 2016.
Source: CSO, Services Producer Price Index
0
200
400
600
800
1000
1200
1400
1600
1800P
ola
nd
Sp
ain
Ger
man
y
Eu
ro a
rea
18
Hu
ng
ary
Ne
ther
lan
ds
Fra
nce
Ire
lan
d
Den
mar
k
Fin
lan
d
Ital
y
UK
Sw
ed
en
€p
er
1,0
00
litr
es
Diesel (no taxes) Diesel (Taxes) Petrol
80
90
100
110
120
130
140
2012 2013 2014 Q1 2015 Q2 2015 Q3 2015 Q4 2015 Q1 2016 Q2 2016 Q3 2016 Q4 2016
Se
rvic
es
Pro
du
cer
Pri
ce In
de
x (
2012
=10
0)
Freight & removal by road Sea & coastal transport
Air transport Warehousing, storage & cargo handling
All sectors
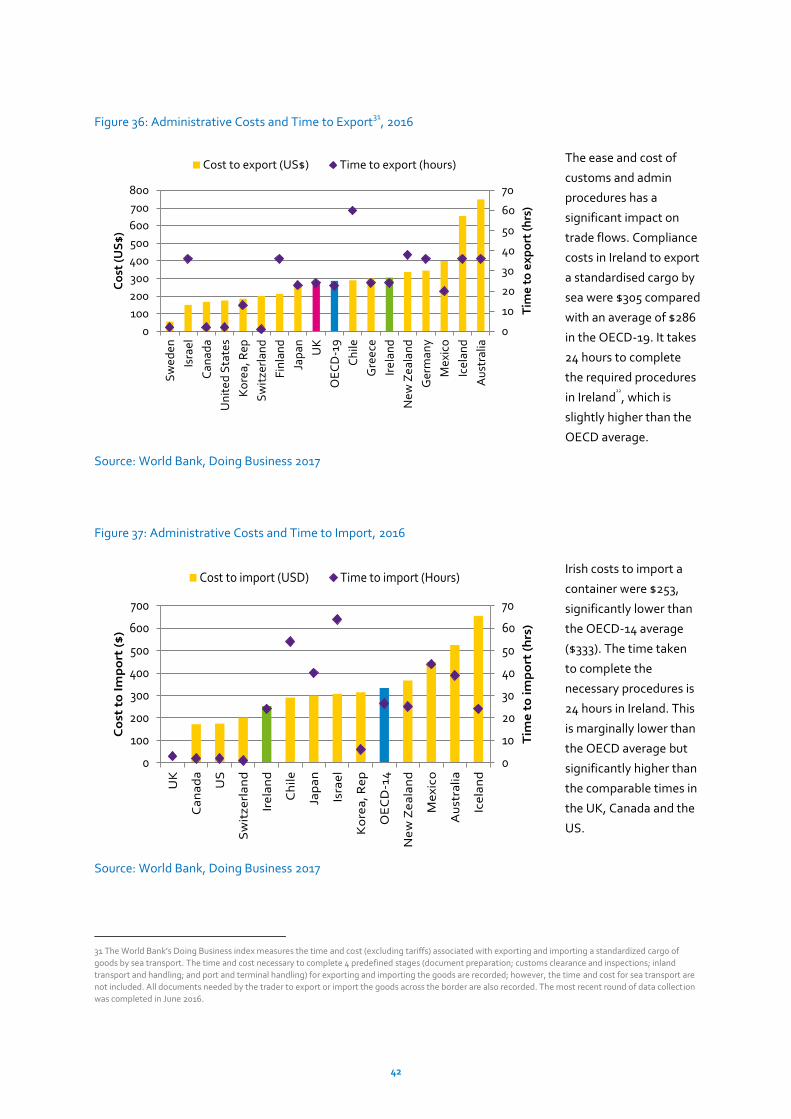
42
Figure 36: Administrative Costs and Time to Export31
, 2016
The ease and cost of
customs and admin
procedures has a
significant impact on
trade flows. Compliance
costs in Ireland to export
a standardised cargo by
sea were $305 compared
with an average of $286
in the OECD-19. It takes
24 hours to complete
the required procedures
in Ireland22
, which is
slightly higher than the
OECD average.
Source: World Bank, Doing Business 2017
Figure 37: Administrative Costs and Time to Import, 2016
Irish costs to import a
container were $253,
significantly lower than
the OECD-14 average
($333). The time taken
to complete the
necessary procedures is
24 hours in Ireland. This
is marginally lower than
the OECD average but
significantly higher than
the comparable times in
the UK, Canada and the
US.
Source: World Bank, Doing Business 2017
31 The World Bank’s Doing Business index measures the time and cost (excluding tariffs) associated with exporting and importing a standardized cargo of
goods by sea transport. The time and cost necessary to complete 4 predefined stages (document preparation; customs clearance and inspections; inland
transport and handling; and port and terminal handling) for exporting and importing the goods are recorded; however, the time and cost for sea transport are
not included. All documents needed by the trader to export or import the goods across the border are also recorded. The most recent round of data collection
was completed in June 2016.
0
10
20
30
40
50
60
70
0
100
200
300
400
500
600
700
800
Sw
ed
en
Isra
el
Can
ada
Un
ite
d S
tate
s
Ko
rea,
Rep
Sw
itze
rlan
d
Fin
lan
d
Jap
an UK
OE
CD
-19
Ch
ile
Gre
ece
Ire
lan
d
Ne
w Z
eal
and
Ger
man
y
Mex
ico
Icel
and
Au
stra
lia
Tim
e t
o e
xp
ort
(h
rs)
Co
st (
US
$)
Cost to export (US$) Time to export (hours)
0
10
20
30
40
50
60
70
0
100
200
300
400
500
600
700
UK
Ca
na
da
US
Sw
itze
rla
nd
Ire
lan
d
Ch
ile
Jap
an
Isra
el
Ko
rea
, R
ep
OE
CD
-14
Ne
w Z
ea
lan
d
Me
xico
Au
stra
lia
Ice
lan
d
Tim
e t
o i
mp
ort
(h
rs)
Co
st t
o I
mp
ort
($
)
Cost to import (USD) Time to import (Hours)
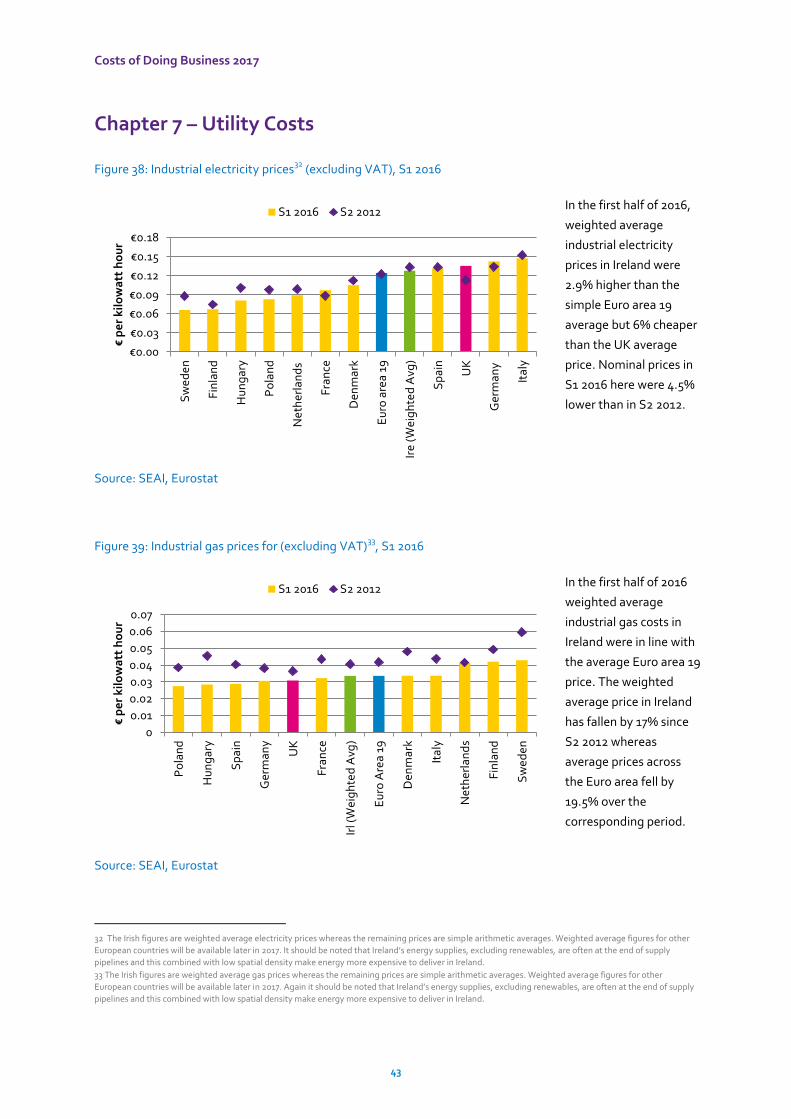
Costs of Doing Business 2017
43
Chapter 7 – Utility Costs
Figure 38: Industrial electricity prices32
(excluding VAT), S1 2016
In the first half of 2016,
weighted average
industrial electricity
prices in Ireland were
2.9% higher than the
simple Euro area 19
average but 6% cheaper
than the UK average
price. Nominal prices in
S1 2016 here were 4.5%
lower than in S2 2012.
Source: SEAI, Eurostat
Figure 39: Industrial gas prices for (excluding VAT)33
, S1 2016
In the first half of 2016
weighted average
industrial gas costs in
Ireland were in line with
the average Euro area 19
price. The weighted
average price in Ireland
has fallen by 17% since
S2 2012 whereas
average prices across
the Euro area fell by
19.5% over the
corresponding period.
Source: SEAI, Eurostat
32 The Irish figures are weighted average electricity prices whereas the remaining prices are simple arithmetic averages. Weighted average figures for other
European countries will be available later in 2017. It should be noted that Ireland’s energy supplies, excluding renewables, are often at the end of supply
pipelines and this combined with low spatial density make energy more expensive to deliver in Ireland.
33 The Irish figures are weighted average gas prices whereas the remaining prices are simple arithmetic averages. Weighted average figures for other
European countries will be available later in 2017. Again it should be noted that Ireland’s energy supplies, excluding renewables, are often at the end of supply
pipelines and this combined with low spatial density make energy more expensive to deliver in Ireland.
€0.00
€0.03
€0.06
€0.09
€0.12
€0.15
€0.18
Sw
ed
en
Fin
lan
d
Hu
ng
ary
Po
lan
d
Ne
ther
lan
ds
Fra
nce
Den
mar
k
Eu
ro a
rea
19
Ire
(W
eig
hte
d A
vg)
Sp
ain
UK
Ger
man
y
Ital
y
€p
er
kil
ow
att
ho
ur
S1 2016 S2 2012
0
0.01
0.02
0.03
0.04
0.05
0.06
0.07
Po
lan
d
Hu
ng
ary
Sp
ain
Ger
man
y
UK
Fra
nce
Irl (
Wei
gh
ted
Avg
)
Eu
ro A
rea
19
Den
mar
k
Ital
y
Ne
ther
lan
ds
Fin
lan
d
Sw
ed
en
€p
er
kil
ow
att
ho
ur
S1 2016 S2 2012
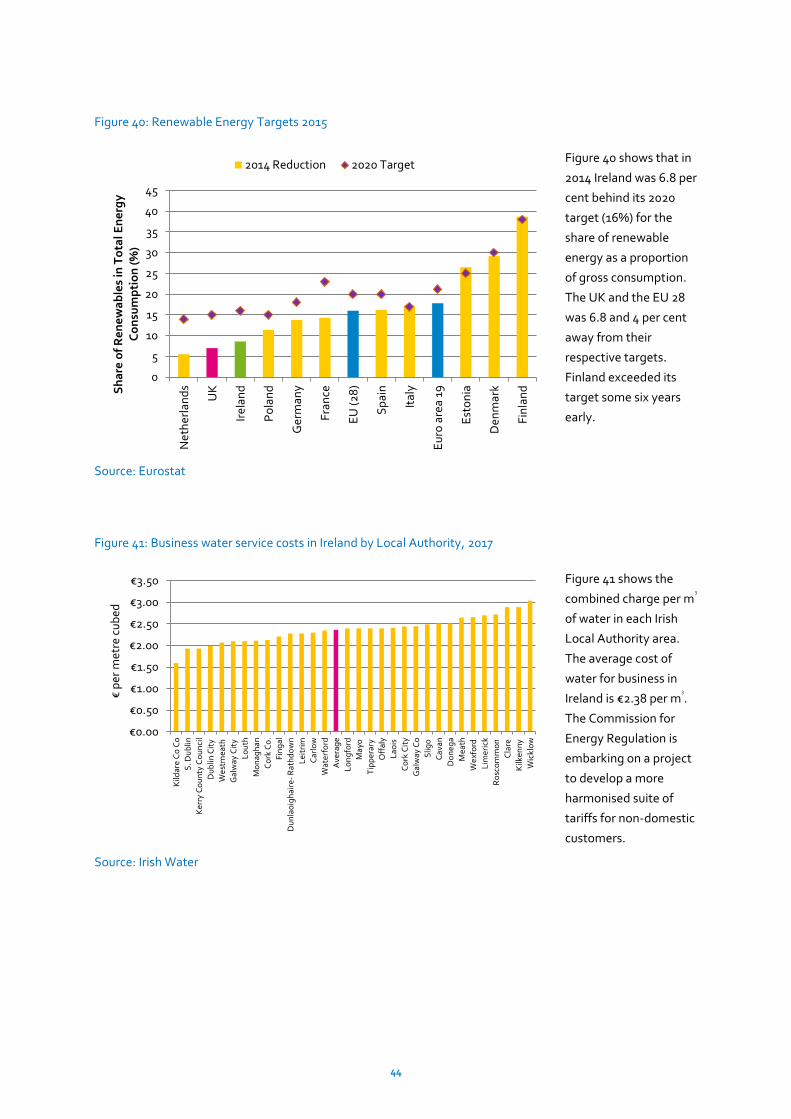
44
Figure 40: Renewable Energy Targets 2015
Figure 40 shows that in
2014 Ireland was 6.8 per
cent behind its 2020
target (16%) for the
share of renewable
energy as a proportion
of gross consumption.
The UK and the EU 28
was 6.8 and 4 per cent
away from their
respective targets.
Finland exceeded its
target some six years
early.
Source: Eurostat
Figure 41: Business water service costs in Ireland by Local Authority, 2017
Figure 41 shows the
combined charge per m3
of water in each Irish
Local Authority area.
The average cost of
water for business in
Ireland is €2.38 per m3
.
The Commission for
Energy Regulation is
embarking on a project
to develop a more
harmonised suite of
tariffs for non-domestic
customers.
Source: Irish Water
0
5
10
15
20
25
30
35
40
45N
eth
erla
nd
s
UK
Ire
lan
d
Po
lan
d
Ger
man
y
Fra
nce
EU
(2
8)
Sp
ain
Ital
y
Eu
ro a
rea
19
Est
on
ia
Den
mar
k
Fin
lan
dSh
are
of
Re
ne
wa
ble
s in
To
tal E
ne
rgy
C
on
sum
pti
on
(%
)
2014 Reduction 2020 Target
€0.00
€0.50
€1.00
€1.50
€2.00
€2.50
€3.00
€3.50
Kild
are
Co
Co
S. D
ub
lin
Ker
ry C
ou
nty
Co
un
cil
Du
blin
Cit
y
We
stm
eath
Gal
way
Cit
y
Lo
uth
Mo
nag
ha
n
Co
rk C
o.
Fin
gal
Du
nla
oig
hai
re-
Rat
hd
ow
n
Lei
trim
Car
low
Wat
erfo
rd
Ave
rag
e
Lo
ng
ford
May
o
Tip
per
ary
Off
aly
Lao
is
Co
rk C
ity
Gal
way
Co
Slig
o
Cav
an
Do
neg
a
Mea
th
We
xfo
rd
Lim
eric
k
Ro
sco
mm
on
Cla
re
Kilk
enn
y
Wic
klo
w
€p
er m
etre
cu
bed
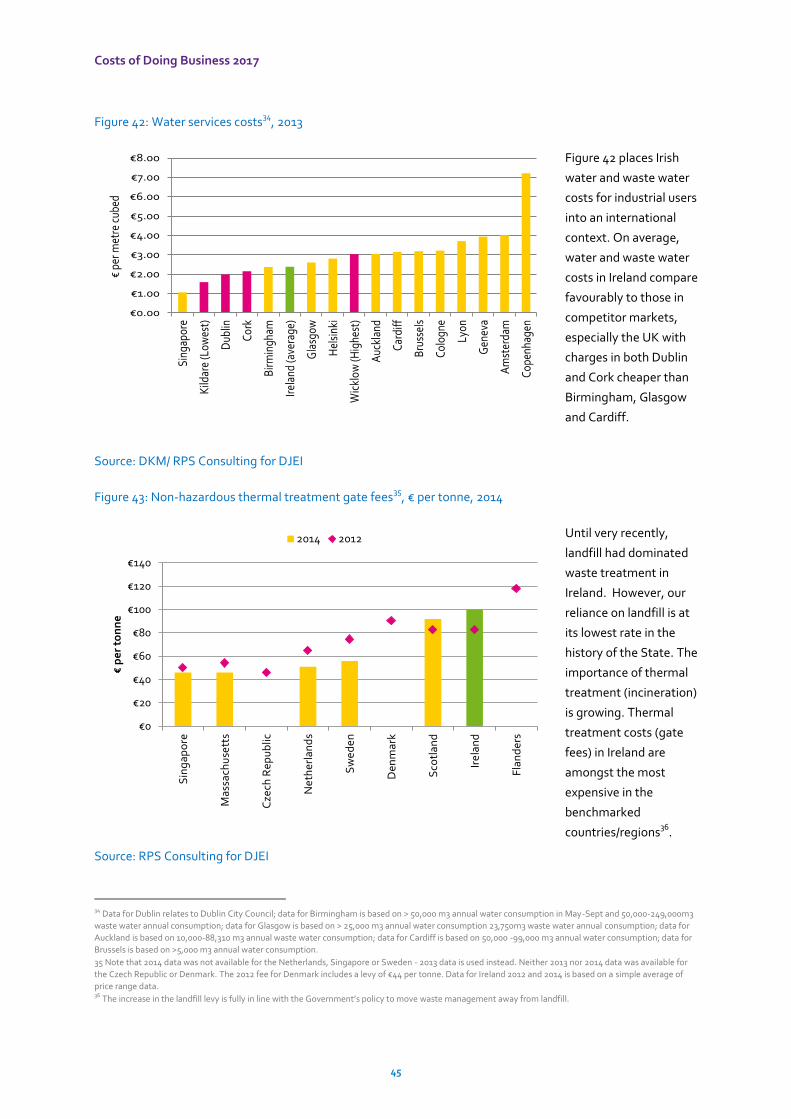
Costs of Doing Business 2017
45
Figure 42: Water services costs34
, 2013
Figure 42 places Irish
water and waste water
costs for industrial users
into an international
context. On average,
water and waste water
costs in Ireland compare
favourably to those in
competitor markets,
especially the UK with
charges in both Dublin
and Cork cheaper than
Birmingham, Glasgow
and Cardiff.
Source: DKM/ RPS Consulting for DJEI
Figure 43: Non-hazardous thermal treatment gate fees35
, € per tonne, 2014
Until very recently,
landfill had dominated
waste treatment in
Ireland. However, our
reliance on landfill is at
its lowest rate in the
history of the State. The
importance of thermal
treatment (incineration)
is growing. Thermal
treatment costs (gate
fees) in Ireland are
amongst the most
expensive in the
benchmarked
countries/regions36
.
Source: RPS Consulting for DJEI
34 Data for Dublin relates to Dublin City Council; data for Birmingham is based on > 50,000 m3 annual water consumption in May-Sept and 50,000-249,000m3
waste water annual consumption; data for Glasgow is based on > 25,000 m3 annual water consumption 23,750m3 waste water annual consumption; data for
Auckland is based on 10,000-88,310 m3 annual waste water consumption; data for Cardiff is based on 50,000 -99,000 m3 annual water consumption; data for
Brussels is based on >5,000 m3 annual water consumption.
35 Note that 2014 data was not available for the Netherlands, Singapore or Sweden - 2013 data is used instead. Neither 2013 nor 2014 data was available for
the Czech Republic or Denmark. The 2012 fee for Denmark includes a levy of €44 per tonne. Data for Ireland 2012 and 2014 is based on a simple average of
price range data. 36 The increase in the landfill levy is fully in line with the Government’s policy to move waste management away from landfill.
€0.00
€1.00
€2.00
€3.00
€4.00
€5.00
€6.00
€7.00
€8.00
Sing
apor
e
Kild
are
(Low
est)
Dub
lin
Cor
k
Birm
ingh
am
Irela
nd (a
vera
ge)
Gla
sgow
Hel
sink
i
Wic
klow
(Hig
hest
)
Auc
klan
d
Car
diff
Bru
ssel
s
Col
ogne
Lyon
Gen
eva
Am
ster
dam
Cop
enha
gen
€pe
r met
re c
ubed
€0
€20
€40
€60
€80
€100
€120
€140
Sin
gap
ore
Mas
sach
use
tts
Cze
ch R
epu
blic
Ne
ther
lan
ds
Sw
ed
en
Den
mar
k
Sco
tlan
d
Ire
lan
d
Fla
nd
ers
€p
er
ton
ne
2014 2012
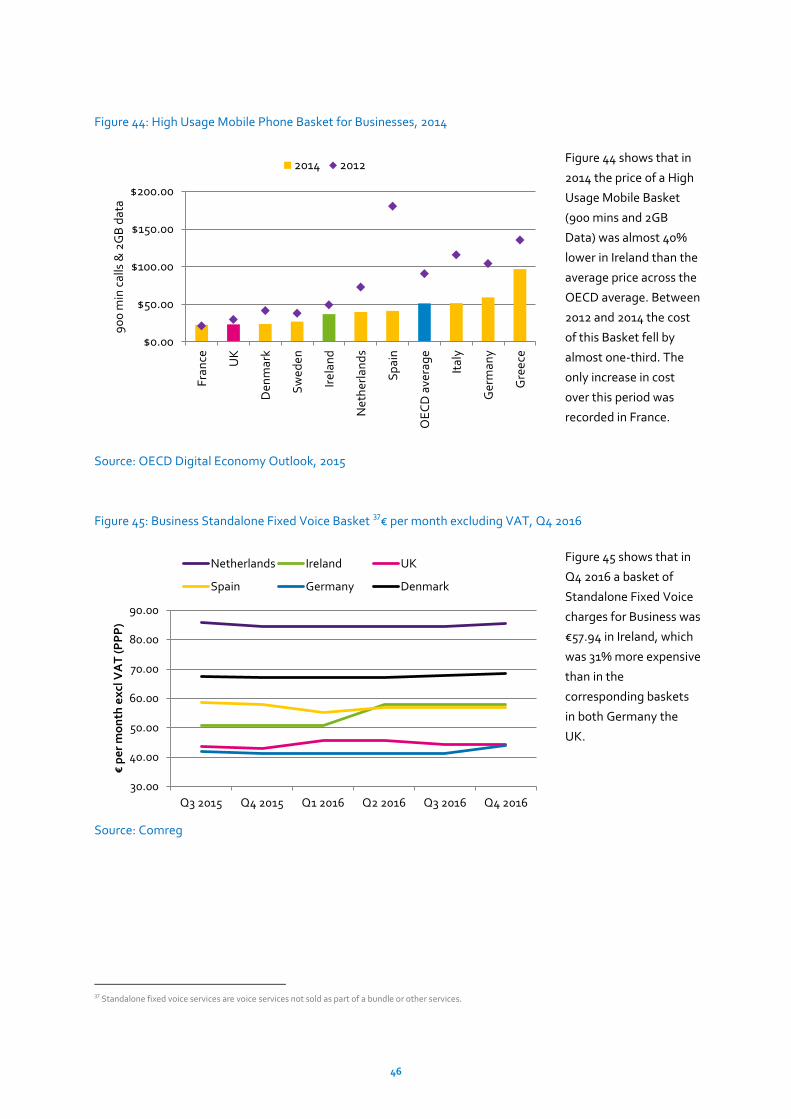
46
Figure 44: High Usage Mobile Phone Basket for Businesses, 2014
Figure 44 shows that in
2014 the price of a High
Usage Mobile Basket
(900 mins and 2GB
Data) was almost 40%
lower in Ireland than the
average price across the
OECD average. Between
2012 and 2014 the cost
of this Basket fell by
almost one-third. The
only increase in cost
over this period was
recorded in France.
Source: OECD Digital Economy Outlook, 2015
Figure 45: Business Standalone Fixed Voice Basket 37
€ per month excluding VAT, Q4 2016
Figure 45 shows that in
Q4 2016 a basket of
Standalone Fixed Voice
charges for Business was
€57.94 in Ireland, which
was 31% more expensive
than in the
corresponding baskets
in both Germany the
UK.
Source: Comreg
37 Standalone fixed voice services are voice services not sold as part of a bundle or other services.
$0.00
$50.00
$100.00
$150.00
$200.00F
ran
ce UK
Den
mar
k
Sw
ed
en
Ire
lan
d
Ne
ther
lan
ds
Sp
ain
OE
CD
ave
rag
e
Ital
y
Ger
man
y
Gre
ece
90
0 m
in c
alls
& 2
GB
dat
a
2014 2012
30.00
40.00
50.00
60.00
70.00
80.00
90.00
Q3 2015 Q4 2015 Q1 2016 Q2 2016 Q3 2016 Q4 2016
€p
er
mo
nth
ex
cl V
AT
(P
PP
)
Netherlands Ireland UK
Spain Germany Denmark
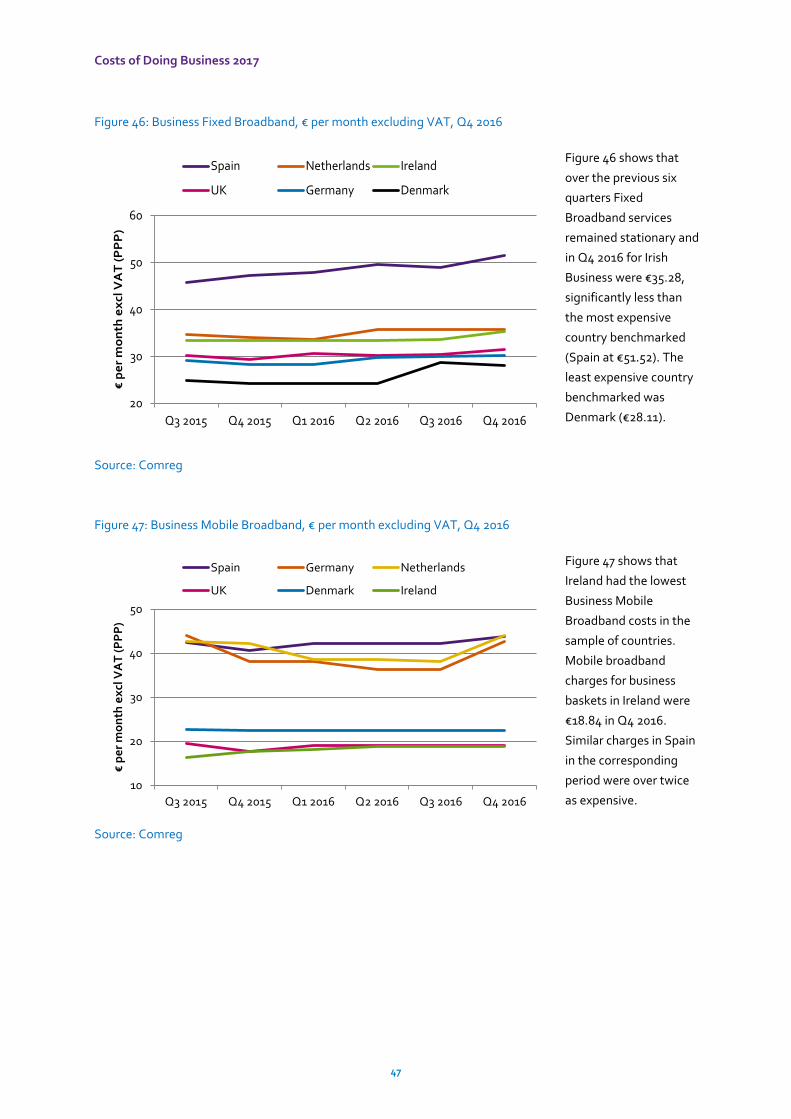
Costs of Doing Business 2017
47
Figure 46: Business Fixed Broadband, € per month excluding VAT, Q4 2016
Figure 46 shows that
over the previous six
quarters Fixed
Broadband services
remained stationary and
in Q4 2016 for Irish
Business were €35.28,
significantly less than
the most expensive
country benchmarked
(Spain at €51.52). The
least expensive country
benchmarked was
Denmark (€28.11).
Source: Comreg
Figure 47: Business Mobile Broadband, € per month excluding VAT, Q4 2016
Figure 47 shows that
Ireland had the lowest
Business Mobile
Broadband costs in the
sample of countries.
Mobile broadband
charges for business
baskets in Ireland were
€18.84 in Q4 2016.
Similar charges in Spain
in the corresponding
period were over twice
as expensive.
Source: Comreg
20
30
40
50
60
Q3 2015 Q4 2015 Q1 2016 Q2 2016 Q3 2016 Q4 2016
€p
er
mo
nth
ex
cl V
AT
(P
PP
)
Spain Netherlands Ireland
UK Germany Denmark
10
20
30
40
50
Q3 2015 Q4 2015 Q1 2016 Q2 2016 Q3 2016 Q4 2016
€p
er
mo
nth
ex
cl V
AT
(P
PP
)
Spain Germany Netherlands
UK Denmark Ireland
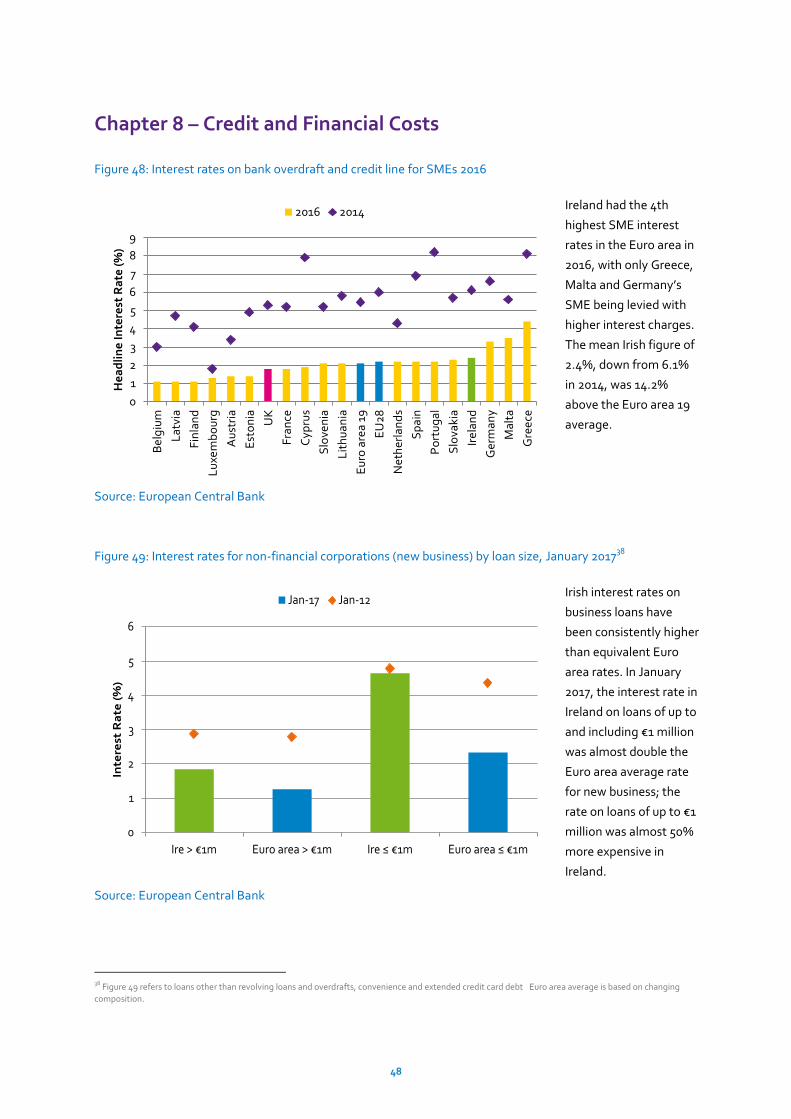
48
Chapter 8 – Credit and Financial Costs
Figure 48: Interest rates on bank overdraft and credit line for SMEs 2016
Ireland had the 4th
highest SME interest
rates in the Euro area in
2016, with only Greece,
Malta and Germany’s
SME being levied with
higher interest charges.
The mean Irish figure of
2.4%, down from 6.1%
in 2014, was 14.2%
above the Euro area 19
average.
Source: European Central Bank
Figure 49: Interest rates for non-financial corporations (new business) by loan size, January 201738
Irish interest rates on
business loans have
been consistently higher
than equivalent Euro
area rates. In January
2017, the interest rate in
Ireland on loans of up to
and including €1 million
was almost double the
Euro area average rate
for new business; the
rate on loans of up to €1
million was almost 50%
more expensive in
Ireland.
Source: European Central Bank
38 Figure 49 refers to loans other than revolving loans and overdrafts, convenience and extended credit card debt Euro area average is based on changing
composition.
0
1
2
3
4
5
6
7
8
9
Be
lgiu
m
Lat
via
Fin
lan
d
Lu
xem
bo
urg
Au
stri
a
Est
on
ia
UK
Fra
nce
Cyp
rus
Slo
ven
ia
Lit
hu
ania
Eu
ro a
rea
19
EU
28
Ne
ther
lan
ds
Sp
ain
Po
rtu
gal
Slo
vaki
a
Ire
lan
d
Ger
man
y
Mal
ta
Gre
ece
He
ad
lin
e In
tere
st R
ate
(%
)
2016 2014
0
1
2
3
4
5
6
Ire > €1m Euro area > €1m Ire ≤ €1m Euro area ≤ €1m
Inte
rest
Ra
te (
%)
Jan-17 Jan-12
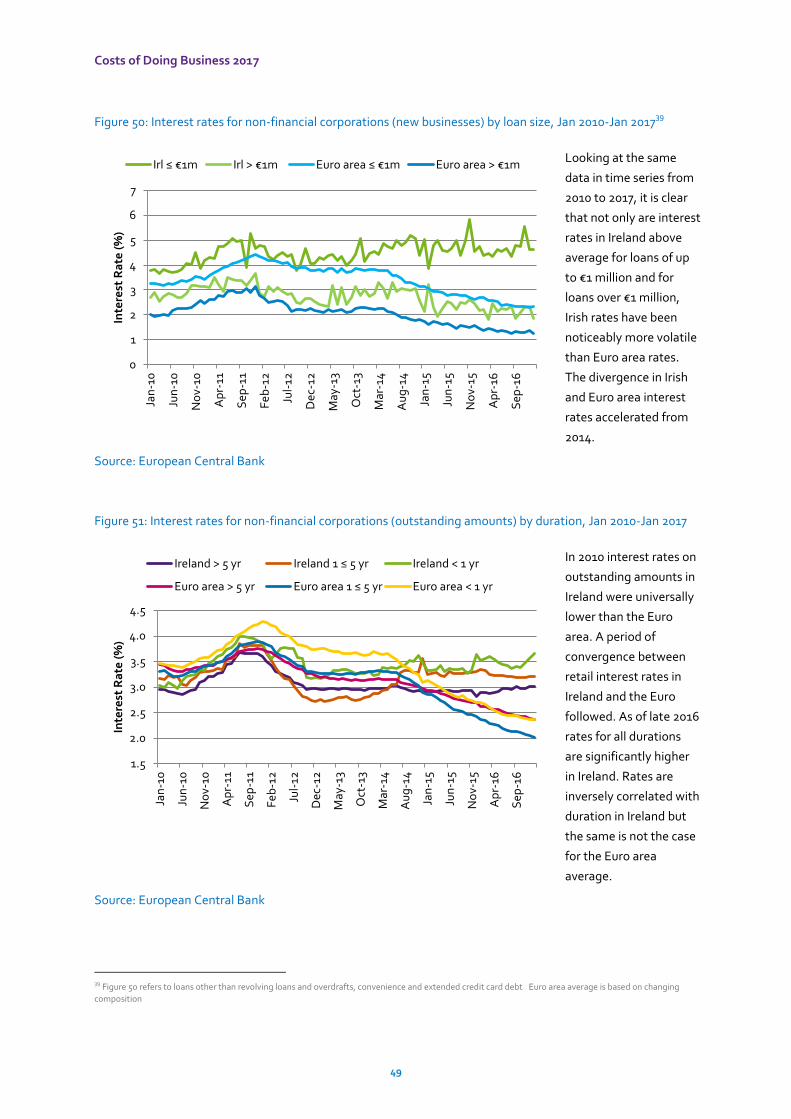
Costs of Doing Business 2017
49
Figure 50: Interest rates for non-financial corporations (new businesses) by loan size, Jan 2010-Jan 201739
Looking at the same
data in time series from
2010 to 2017, it is clear
that not only are interest
rates in Ireland above
average for loans of up
to €1 million and for
loans over €1 million,
Irish rates have been
noticeably more volatile
than Euro area rates.
The divergence in Irish
and Euro area interest
rates accelerated from
2014.
Source: European Central Bank
Figure 51: Interest rates for non-financial corporations (outstanding amounts) by duration, Jan 2010-Jan 2017
In 2010 interest rates on
outstanding amounts in
Ireland were universally
lower than the Euro
area. A period of
convergence between
retail interest rates in
Ireland and the Euro
followed. As of late 2016
rates for all durations
are significantly higher
in Ireland. Rates are
inversely correlated with
duration in Ireland but
the same is not the case
for the Euro area
average.
Source: European Central Bank
39 Figure 50 refers to loans other than revolving loans and overdrafts, convenience and extended credit card debt Euro area average is based on changing
composition
0
1
2
3
4
5
6
7
Jan
-10
Jun
-10
No
v-10
Ap
r-11
Sep
-11
Fe
b-1
2
Jul-
12
Dec
-12
May
-13
Oct
-13
Mar
-14
Au
g-1
4
Jan
-15
Jun
-15
No
v-15
Ap
r-16
Sep
-16
Inte
rest
Ra
te (
%)
Irl ≤ €1m Irl > €1m Euro area ≤ €1m Euro area > €1m
1.5
2.0
2.5
3.0
3.5
4.0
4.5
Jan
-10
Jun
-10
No
v-10
Ap
r-11
Sep
-11
Fe
b-1
2
Jul-
12
Dec
-12
May
-13
Oct
-13
Mar
-14
Au
g-1
4
Jan
-15
Jun
-15
No
v-15
Ap
r-16
Sep
-16
Inte
rest
Ra
te (
%)
Ireland > 5 yr Ireland 1 ≤ 5 yr Ireland < 1 yr
Euro area > 5 yr Euro area 1 ≤ 5 yr Euro area < 1 yr
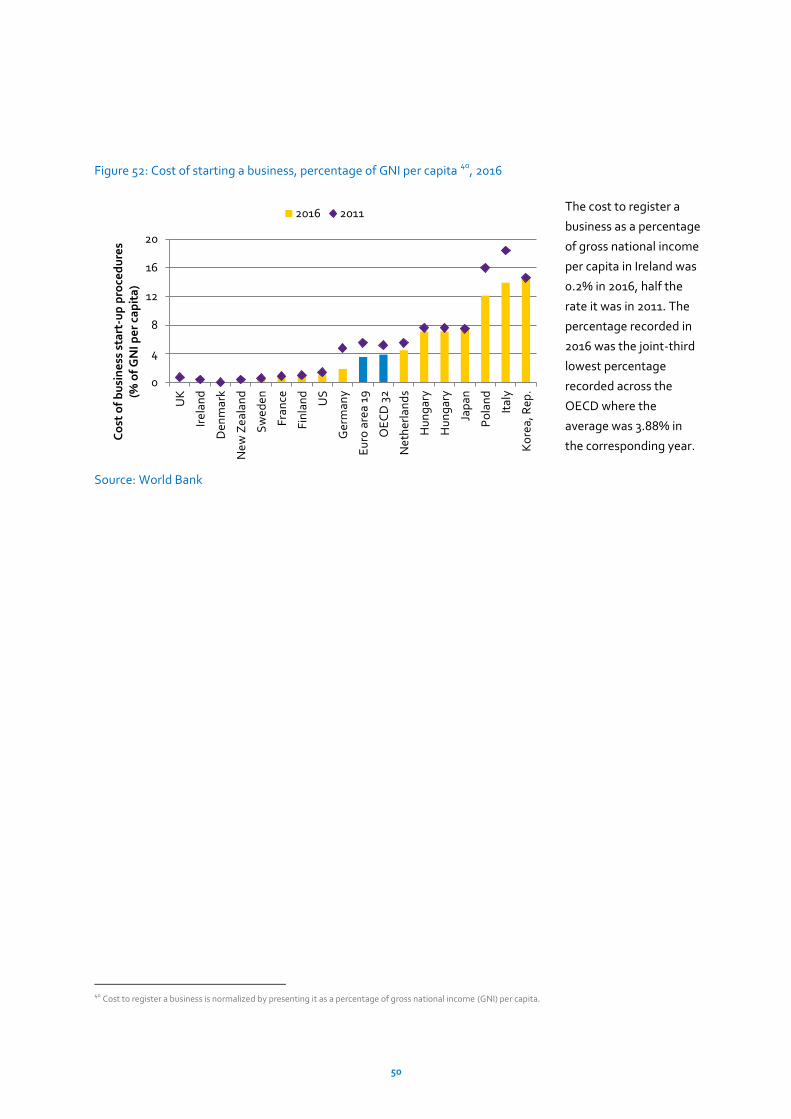
50
Figure 52: Cost of starting a business, percentage of GNI per capita 40
, 2016
The cost to register a
business as a percentage
of gross national income
per capita in Ireland was
0.2% in 2016, half the
rate it was in 2011. The
percentage recorded in
2016 was the joint-third
lowest percentage
recorded across the
OECD where the
average was 3.88% in
the corresponding year.
Source: World Bank
40 Cost to register a business is normalized by presenting it as a percentage of gross national income (GNI) per capita.
0
4
8
12
16
20
UK
Ire
lan
d
Den
mar
k
Ne
w Z
eal
and
Sw
ed
en
Fra
nce
Fin
lan
d
US
Ger
man
y
Eu
ro a
rea
19
OE
CD
32
Ne
ther
lan
ds
Hu
ng
ary
Hu
ng
ary
Jap
an
Po
lan
d
Ital
y
Ko
rea,
Rep
.
Co
st o
f b
usi
ne
ss s
tart
-up
pro
ced
ure
s (%
of
GN
I pe
r ca
pit
a)
2016 2011
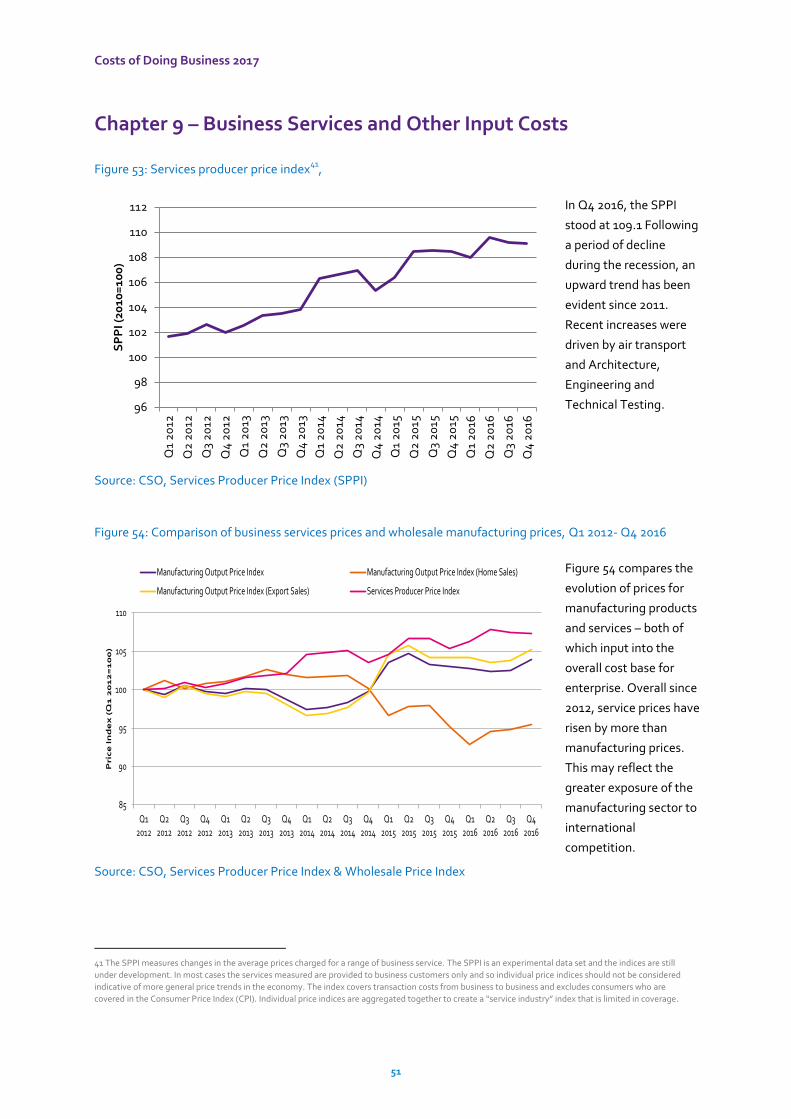
Costs of Doing Business 2017
51
Chapter 9 – Business Services and Other Input Costs
Figure 53: Services producer price index41
,
In Q4 2016, the SPPI
stood at 109.1 Following
a period of decline
during the recession, an
upward trend has been
evident since 2011.
Recent increases were
driven by air transport
and Architecture,
Engineering and
Technical Testing.
Source: CSO, Services Producer Price Index (SPPI)
Figure 54: Comparison of business services prices and wholesale manufacturing prices, Q1 2012- Q4 2016
Figure 54 compares the
evolution of prices for
manufacturing products
and services – both of
which input into the
overall cost base for
enterprise. Overall since
2012, service prices have
risen by more than
manufacturing prices.
This may reflect the
greater exposure of the
manufacturing sector to
international
competition.
Source: CSO, Services Producer Price Index & Wholesale Price Index
41 The SPPI measures changes in the average prices charged for a range of business service. The SPPI is an experimental data set and the indices are still
under development. In most cases the services measured are provided to business customers only and so individual price indices should not be considered
indicative of more general price trends in the economy. The index covers transaction costs from business to business and excludes consumers who are
covered in the Consumer Price Index (CPI). Individual price indices are aggregated together to create a “service industry” index that is limited in coverage.
96
98
100
102
104
106
108
110
112
Q1
20
12
Q2
20
12
Q3
20
12
Q4
20
12
Q1
20
13
Q2
20
13
Q3
20
13
Q4
20
13
Q1
20
14
Q2
20
14
Q3
20
14
Q4
20
14
Q1
20
15
Q2
20
15
Q3
20
15
Q4
20
15
Q1
20
16
Q2
20
16
Q3
20
16
Q4
20
16
SP
PI (
2010
=10
0)
85
90
95
100
105
110
Q12012
Q22012
Q32012
Q42012
Q12013
Q22013
Q32013
Q42013
Q12014
Q22014
Q32014
Q42014
Q12015
Q22015
Q32015
Q42015
Q12016
Q22016
Q32016
Q42016
Pri
ce
In
de
x (
Q1
20
12
=1
00
)
Manufacturing Output Price Index Manufacturing Output Price Index (Home Sales)
Manufacturing Output Price Index (Export Sales) Services Producer Price Index
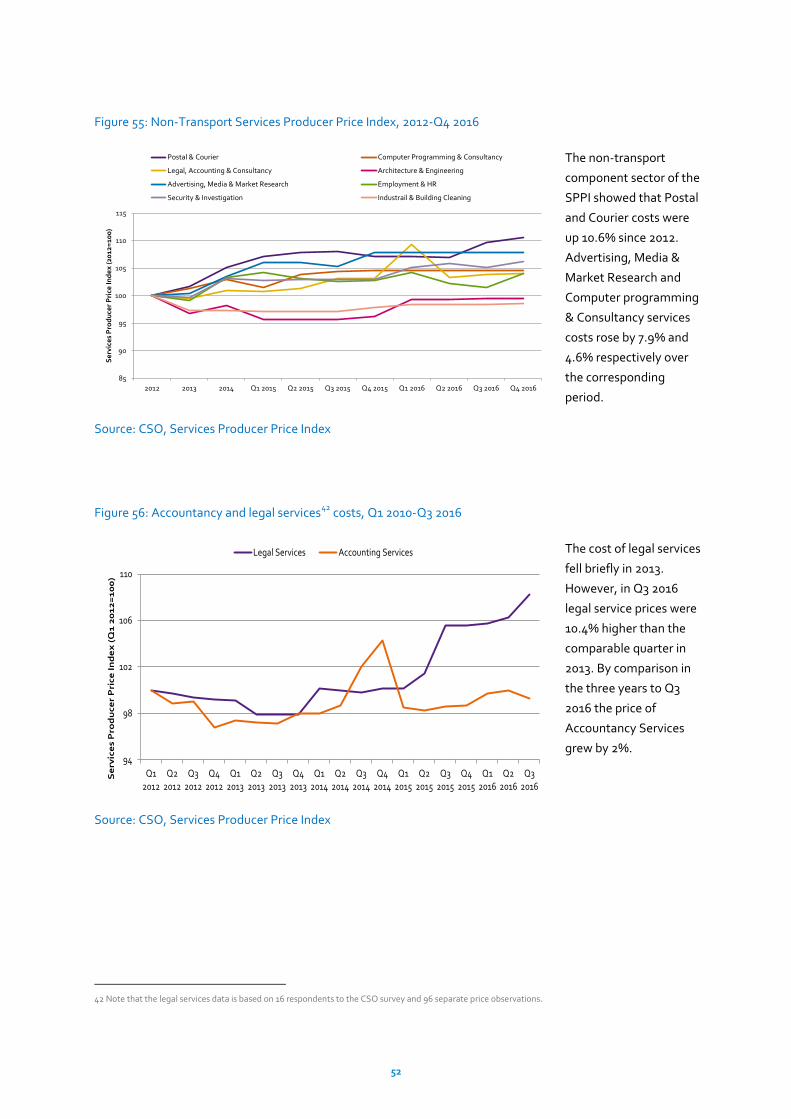
52
Figure 55: Non-Transport Services Producer Price Index, 2012-Q4 2016
The non-transport
component sector of the
SPPI showed that Postal
and Courier costs were
up 10.6% since 2012.
Advertising, Media &
Market Research and
Computer programming
& Consultancy services
costs rose by 7.9% and
4.6% respectively over
the corresponding
period.
Source: CSO, Services Producer Price Index
Figure 56: Accountancy and legal services42
costs, Q1 2010-Q3 2016
The cost of legal services
fell briefly in 2013.
However, in Q3 2016
legal service prices were
10.4% higher than the
comparable quarter in
2013. By comparison in
the three years to Q3
2016 the price of
Accountancy Services
grew by 2%.
Source: CSO, Services Producer Price Index
42 Note that the legal services data is based on 16 respondents to the CSO survey and 96 separate price observations.
85
90
95
100
105
110
115
2012 2013 2014 Q1 2015 Q2 2015 Q3 2015 Q4 2015 Q1 2016 Q2 2016 Q3 2016 Q4 2016
Se
rvic
es
Pro
du
cer
Pri
ce In
de
x (
2012
=10
0)
Postal & Courier Computer Programming & Consultancy
Legal, Accounting & Consultancy Architecture & Engineering
Advertising, Media & Market Research Employment & HR
Security & Investigation Industrail & Building Cleaning
94
98
102
106
110
Q12012
Q22012
Q32012
Q42012
Q12013
Q22013
Q32013
Q42013
Q12014
Q22014
Q32014
Q42014
Q12015
Q22015
Q32015
Q42015
Q12016
Q22016
Q32016
Se
rvic
es
Pro
du
ce
r P
ric
e I
nd
ex
(Q
1 2
01
2=
10
0)
Legal Services Accounting Services
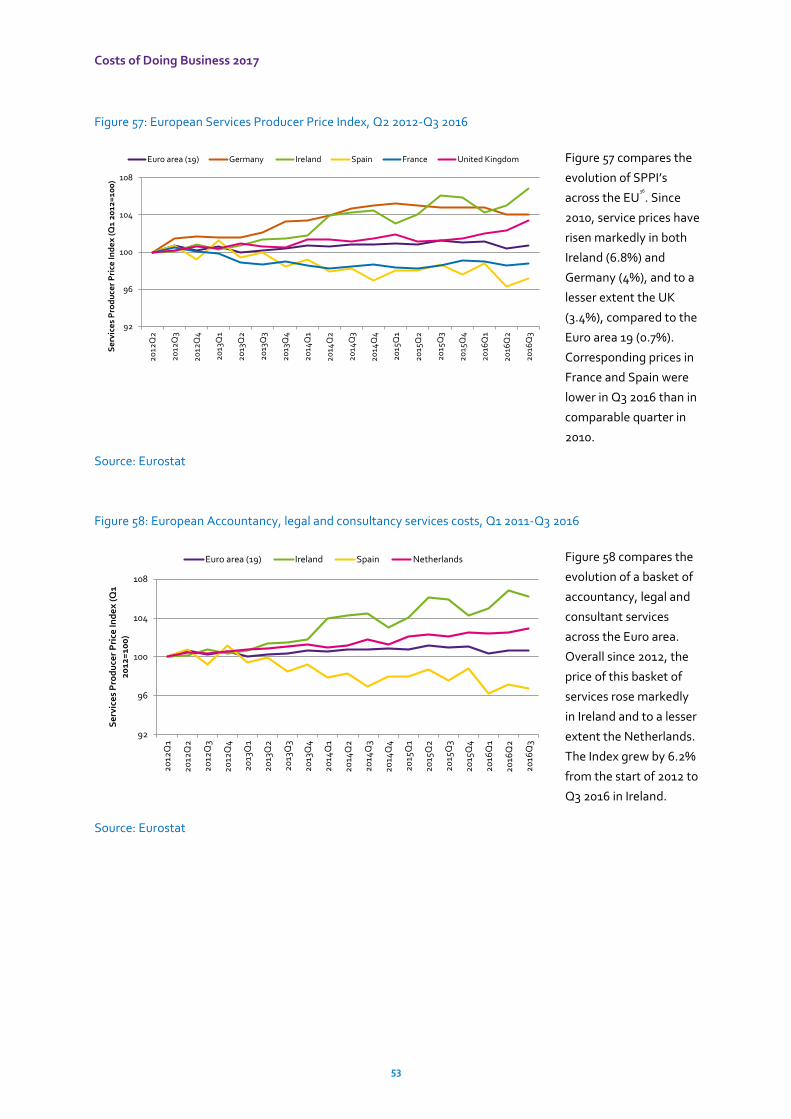
Costs of Doing Business 2017
53
Figure 57: European Services Producer Price Index, Q2 2012-Q3 2016
Figure 57 compares the
evolution of SPPI’s
across the EU36
. Since
2010, service prices have
risen markedly in both
Ireland (6.8%) and
Germany (4%), and to a
lesser extent the UK
(3.4%), compared to the
Euro area 19 (0.7%).
Corresponding prices in
France and Spain were
lower in Q3 2016 than in
comparable quarter in
2010.
Source: Eurostat
Figure 58: European Accountancy, legal and consultancy services costs, Q1 2011-Q3 2016
Figure 58 compares the
evolution of a basket of
accountancy, legal and
consultant services
across the Euro area.
Overall since 2012, the
price of this basket of
services rose markedly
in Ireland and to a lesser
extent the Netherlands.
The Index grew by 6.2%
from the start of 2012 to
Q3 2016 in Ireland.
Source: Eurostat
92
96
100
104
108
20
12Q
2
20
12Q
3
20
12Q
4
20
13Q
1
20
13Q
2
20
13Q
3
20
13Q
4
20
14Q
1
20
14Q
2
20
14Q
3
20
14Q
4
20
15Q
1
20
15Q
2
20
15Q
3
20
15Q
4
20
16Q
1
20
16Q
2
20
16Q
3
Se
rvic
es
Pro
du
cer
Pri
ce In
de
x (
Q1
2012
=10
0)
Euro area (19) Germany Ireland Spain France United Kingdom
92
96
100
104
108
20
12Q
1
20
12Q
2
20
12Q
3
20
12Q
4
20
13Q
1
20
13Q
2
20
13Q
3
20
13Q
4
20
14Q
1
20
14Q
2
20
14Q
3
20
14Q
4
20
15Q
1
20
15Q
2
20
15Q
3
20
15Q
4
20
16Q
1
20
16Q
2
20
16Q
3
Se
rvic
es
Pro
du
cer
Pri
ce In
de
x (
Q1
2012
=10
0)
Euro area (19) Ireland Spain Netherlands
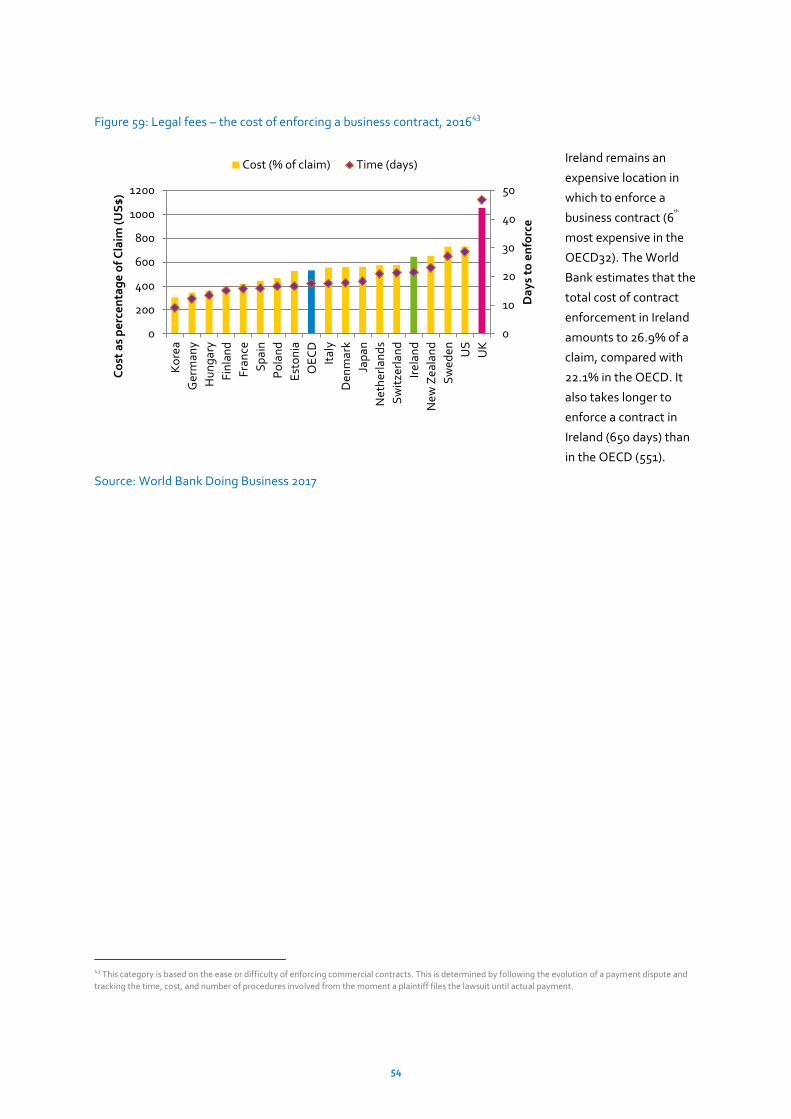
54
Figure 59: Legal fees – the cost of enforcing a business contract, 201643
Ireland remains an
expensive location in
which to enforce a
business contract (6th
most expensive in the
OECD32). The World
Bank estimates that the
total cost of contract
enforcement in Ireland
amounts to 26.9% of a
claim, compared with
22.1% in the OECD. It
also takes longer to
enforce a contract in
Ireland (650 days) than
in the OECD (551).
Source: World Bank Doing Business 2017
43 This category is based on the ease or difficulty of enforcing commercial contracts. This is determined by following the evolution of a payment dispute and
tracking the time, cost, and number of procedures involved from the moment a plaintiff files the lawsuit until actual payment.
0
10
20
30
40
50
0
200
400
600
800
1000
1200K
ore
a
Ger
man
y
Hu
ng
ary
Fin
lan
d
Fra
nce
Sp
ain
Po
lan
d
Est
on
ia
OE
CD
Ital
y
Den
mar
k
Jap
an
Ne
ther
lan
ds
Sw
itze
rlan
d
Ire
lan
d
Ne
w Z
eal
and
Sw
ed
en
US
UK
Da
ys
to e
nfo
rce
Co
st a
s p
erc
en
tag
e o
f C
laim
(U
S$
)
Cost (% of claim) Time (days)
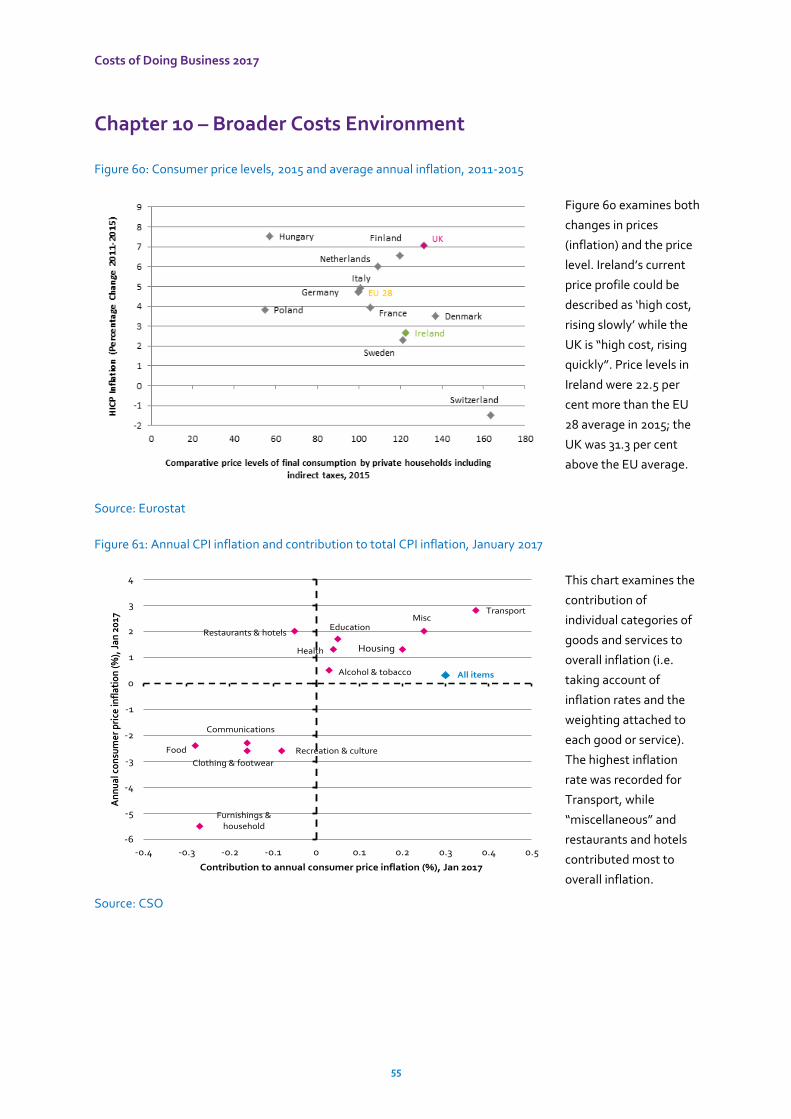
Costs of Doing Business 2017
55
Chapter 10 – Broader Costs Environment
Figure 60: Consumer price levels, 2015 and average annual inflation, 2011-2015
Figure 60 examines both
changes in prices
(inflation) and the price
level. Ireland’s current
price profile could be
described as ‘high cost,
rising slowly’ while the
UK is “high cost, rising
quickly”. Price levels in
Ireland were 22.5 per
cent more than the EU
28 average in 2015; the
UK was 31.3 per cent
above the EU average.
Source: Eurostat
Figure 61: Annual CPI inflation and contribution to total CPI inflation, January 2017
This chart examines the
contribution of
individual categories of
goods and services to
overall inflation (i.e.
taking account of
inflation rates and the
weighting attached to
each good or service).
The highest inflation
rate was recorded for
Transport, while
“miscellaneous” and
restaurants and hotels
contributed most to
overall inflation.
Source: CSO
All items
Food
Alcohol & tobacco
Clothing & footwear
Housing
Furnishings & household
Health
Transport
Communications
Recreation & culture
EducationRestaurants & hotels
Misc
-6
-5
-4
-3
-2
-1
0
1
2
3
4
-0.4 -0.3 -0.2 -0.1 0 0.1 0.2 0.3 0.4 0.5
An
nua
l co
nsu
mer
pri
ce in
flat
ion
(%),
Jan
201
7
Contribution to annual consumer price inflation (%), Jan 2017
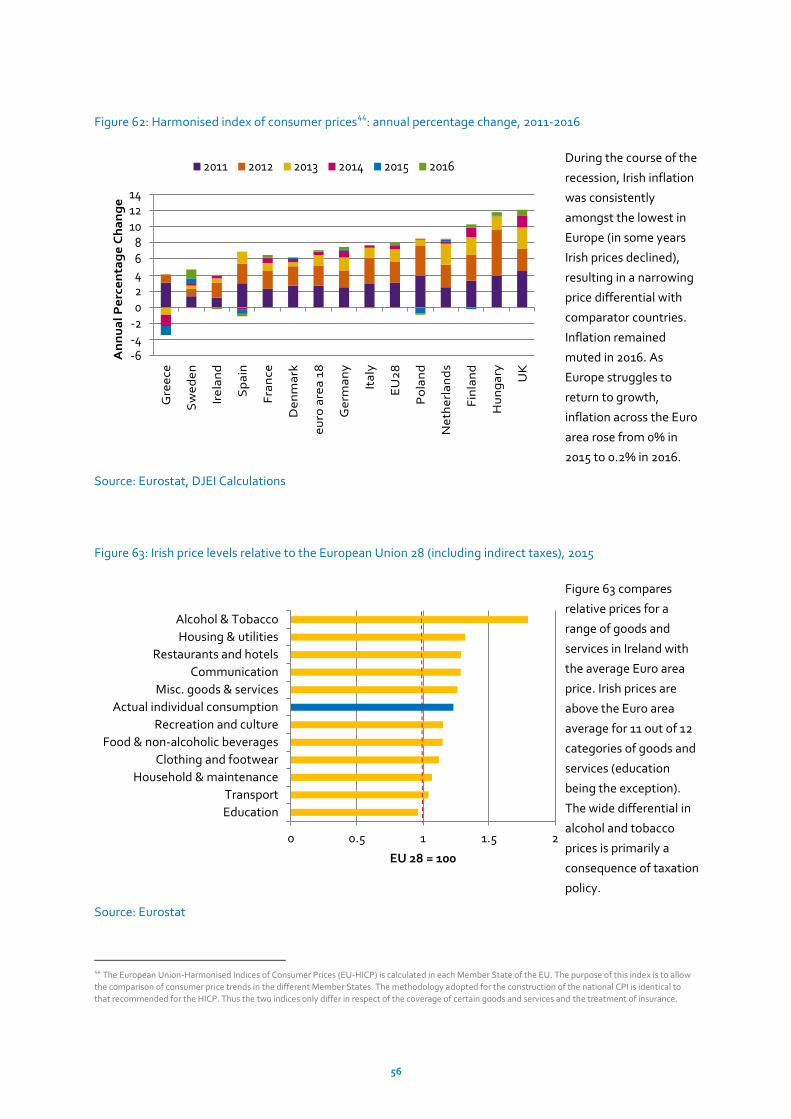
56
Figure 62: Harmonised index of consumer prices44
: annual percentage change, 2011-2016
During the course of the
recession, Irish inflation
was consistently
amongst the lowest in
Europe (in some years
Irish prices declined),
resulting in a narrowing
price differential with
comparator countries.
Inflation remained
muted in 2016. As
Europe struggles to
return to growth,
inflation across the Euro
area rose from 0% in
2015 to 0.2% in 2016.
Source: Eurostat, DJEI Calculations
Figure 63: Irish price levels relative to the European Union 28 (including indirect taxes), 2015
Figure 63 compares
relative prices for a
range of goods and
services in Ireland with
the average Euro area
price. Irish prices are
above the Euro area
average for 11 out of 12
categories of goods and
services (education
being the exception).
The wide differential in
alcohol and tobacco
prices is primarily a
consequence of taxation
policy.
Source: Eurostat
44 The European Union-Harmonised Indices of Consumer Prices (EU-HICP) is calculated in each Member State of the EU. The purpose of this index is to allow
the comparison of consumer price trends in the different Member States. The methodology adopted for the construction of the national CPI is identical to
that recommended for the HICP. Thus the two indices only differ in respect of the coverage of certain goods and services and the treatment of insurance.
-6-4-202468
101214
Gre
ece
Sw
ed
en
Ire
lan
d
Sp
ain
Fra
nce
De
nm
ark
eu
ro a
rea
18
Ge
rma
ny
Ita
ly
EU
28
Po
lan
d
Ne
the
rla
nd
s
Fin
lan
d
Hu
ng
ary
UK
An
nu
al
Pe
rce
nta
ge
Ch
an
ge
2011 2012 2013 2014 2015 2016
0 0.5 1 1.5 2
Education
Transport
Household & maintenance
Clothing and footwear
Food & non-alcoholic beverages
Recreation and culture
Actual individual consumption
Misc. goods & services
Communication
Restaurants and hotels
Housing & utilities
Alcohol & Tobacco
EU 28 = 100
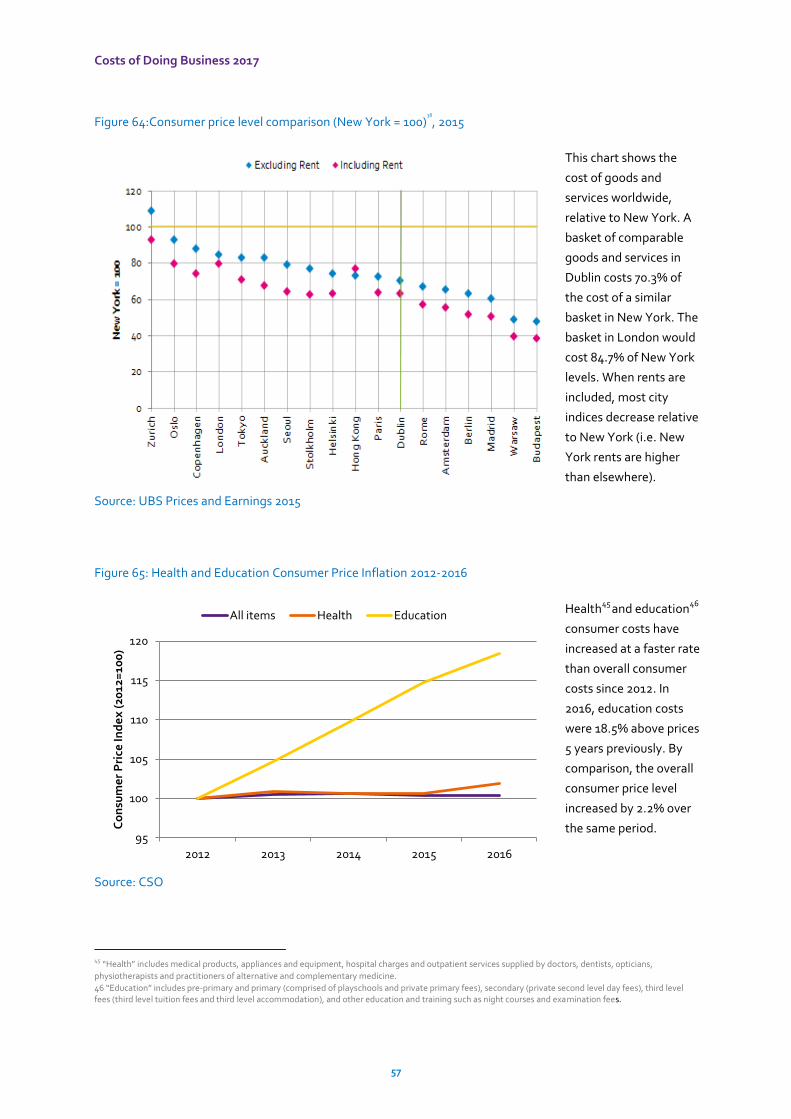
Costs of Doing Business 2017
57
Figure 64:Consumer price level comparison (New York = 100)38
, 2015
This chart shows the
cost of goods and
services worldwide,
relative to New York. A
basket of comparable
goods and services in
Dublin costs 70.3% of
the cost of a similar
basket in New York. The
basket in London would
cost 84.7% of New York
levels. When rents are
included, most city
indices decrease relative
to New York (i.e. New
York rents are higher
than elsewhere).
Source: UBS Prices and Earnings 2015
Figure 65: Health and Education Consumer Price Inflation 2012-2016
Health45
and education46
consumer costs have
increased at a faster rate
than overall consumer
costs since 2012. In
2016, education costs
were 18.5% above prices
5 years previously. By
comparison, the overall
consumer price level
increased by 2.2% over
the same period.
Source: CSO
45
“Health” includes medical products, appliances and equipment, hospital charges and outpatient services supplied by doctors, dentists, opticians,
physiotherapists and practitioners of alternative and complementary medicine.
46 “Education” includes pre-primary and primary (comprised of playschools and private primary fees), secondary (private second level day fees), third level fees (third level tuition fees and third level accommodation), and other education and training such as night courses and examination fees.
95
100
105
110
115
120
2012 2013 2014 2015 2016
Co
nsu
me
r P
rice
Ind
ex
(20
12=
100
)
All items Health Education
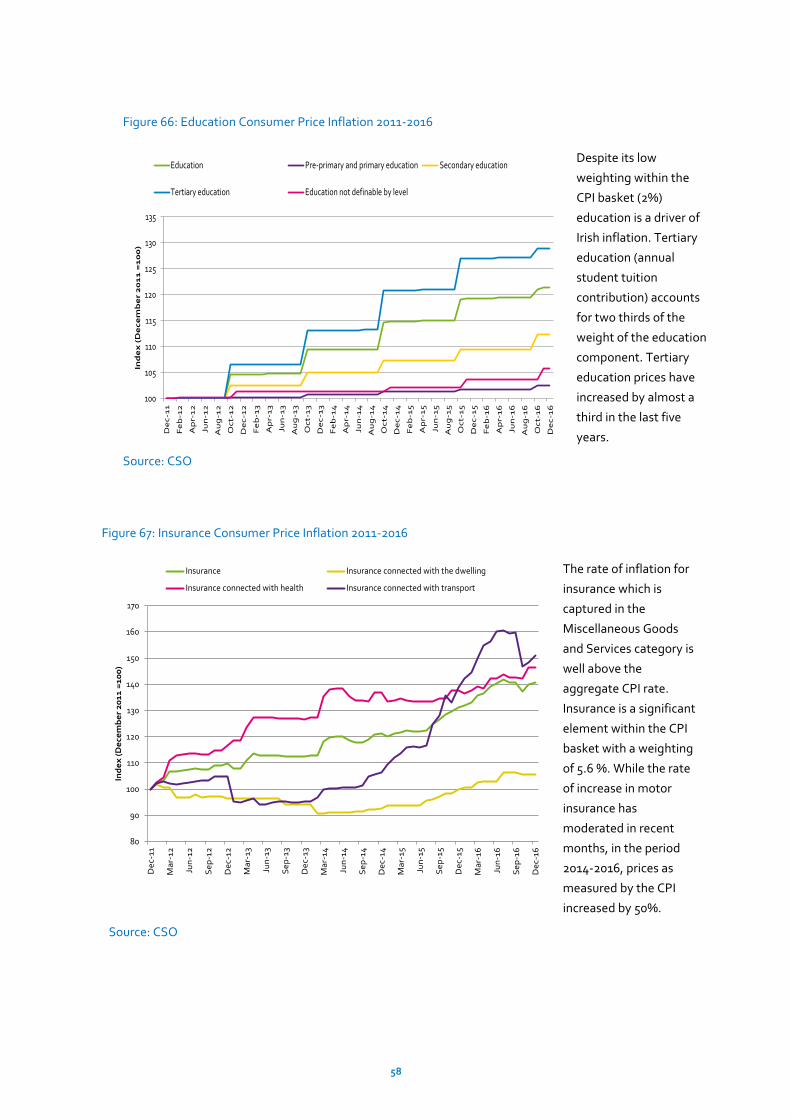
58
Figure 66: Education Consumer Price Inflation 2011-2016
Despite its low
weighting within the
CPI basket (2%)
education is a driver of
Irish inflation. Tertiary
education (annual
student tuition
contribution) accounts
for two thirds of the
weight of the education
component. Tertiary
education prices have
increased by almost a
third in the last five
years.
Source: CSO
Figure 67: Insurance Consumer Price Inflation 2011-2016
The rate of inflation for
insurance which is
captured in the
Miscellaneous Goods
and Services category is
well above the
aggregate CPI rate.
Insurance is a significant
element within the CPI
basket with a weighting
of 5.6 %. While the rate
of increase in motor
insurance has
moderated in recent
months, in the period
2014-2016, prices as
measured by the CPI
increased by 50%.
Source: CSO
100
105
110
115
120
125
130
135
De
c-1
1
Fe
b-1
2
Ap
r-1
2
Jun
-12
Au
g-1
2
Oc
t-1
2
De
c-1
2
Fe
b-1
3
Ap
r-1
3
Jun
-13
Au
g-1
3
Oc
t-1
3
De
c-1
3
Fe
b-1
4
Ap
r-1
4
Jun
-14
Au
g-1
4
Oc
t-1
4
De
c-1
4
Fe
b-1
5
Ap
r-1
5
Jun
-15
Au
g-1
5
Oc
t-1
5
De
c-1
5
Fe
b-1
6
Ap
r-1
6
Jun
-16
Au
g-1
6
Oc
t-1
6
De
c-1
6
Ind
ex
(D
ec
em
be
r 2
01
1 =
10
0)
Education Pre-primary and primary education Secondary education
Tertiary education Education not definable by level
80
90
100
110
120
130
140
150
160
170
De
c-11
Ma
r-12
Jun
-12
Se
p-1
2
De
c-12
Ma
r-13
Jun
-13
Se
p-1
3
De
c-13
Ma
r-14
Jun
-14
Se
p-1
4
De
c-14
Ma
r-15
Jun
-15
Se
p-1
5
De
c-15
Ma
r-16
Jun
-16
Se
p-1
6
De
c-16
Ind
ex
(D
ece
mb
er
20
11
=1
00
)
Insurance Insurance connected with the dwelling
Insurance connected with health Insurance connected with transport
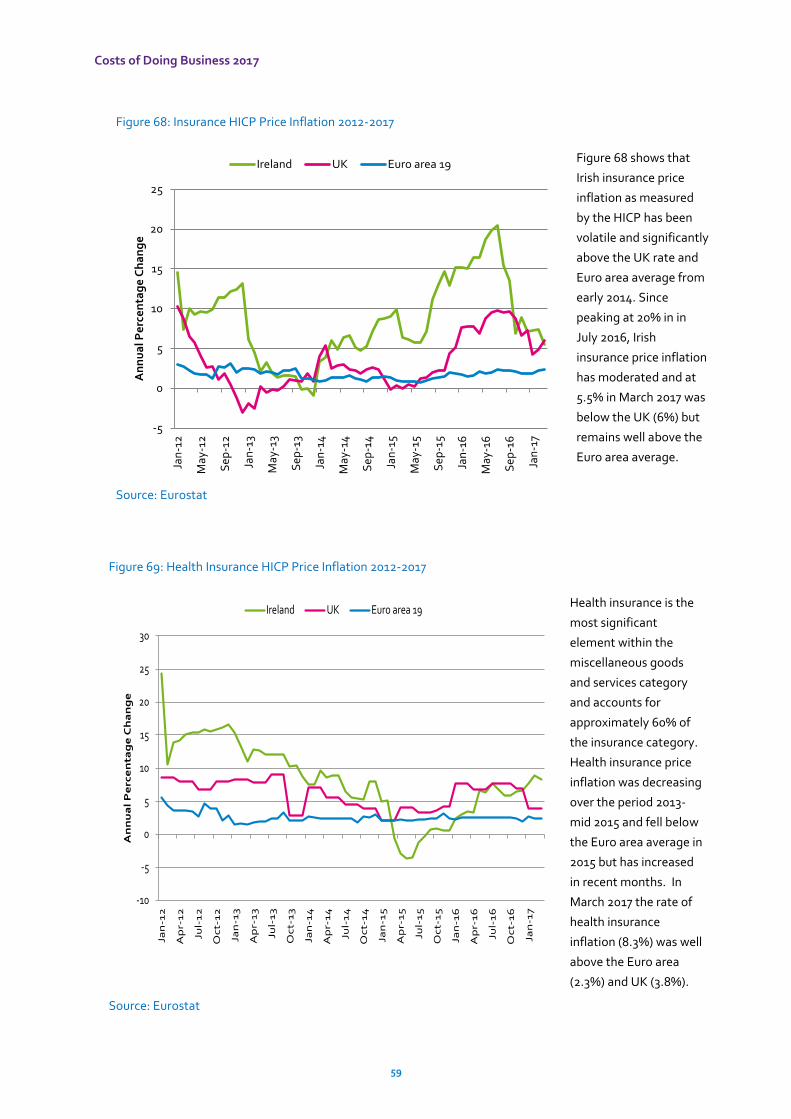
Costs of Doing Business 2017
59
Figure 68: Insurance HICP Price Inflation 2012-2017
Figure 68 shows that
Irish insurance price
inflation as measured
by the HICP has been
volatile and significantly
above the UK rate and
Euro area average from
early 2014. Since
peaking at 20% in in
July 2016, Irish
insurance price inflation
has moderated and at
5.5% in March 2017 was
below the UK (6%) but
remains well above the
Euro area average.
Source: Eurostat
Figure 69: Health Insurance HICP Price Inflation 2012-2017
Health insurance is the
most significant
element within the
miscellaneous goods
and services category
and accounts for
approximately 60% of
the insurance category.
Health insurance price
inflation was decreasing
over the period 2013-
mid 2015 and fell below
the Euro area average in
2015 but has increased
in recent months. In
March 2017 the rate of
health insurance
inflation (8.3%) was well
above the Euro area
(2.3%) and UK (3.8%).
Source: Eurostat
-5
0
5
10
15
20
25Ja
n-1
2
May
-12
Sep
-12
Jan
-13
May
-13
Sep
-13
Jan
-14
May
-14
Sep
-14
Jan
-15
May
-15
Sep
-15
Jan
-16
May
-16
Sep
-16
Jan
-17
An
nu
al P
erc
en
tag
e C
ha
ng
e
Ireland UK Euro area 19
-10
-5
0
5
10
15
20
25
30
Jan
-12
Ap
r-1
2
Jul-
12
Oc
t-1
2
Jan
-13
Ap
r-1
3
Jul-
13
Oc
t-1
3
Jan
-14
Ap
r-1
4
Jul-
14
Oc
t-1
4
Jan
-15
Ap
r-1
5
Jul-
15
Oc
t-1
5
Jan
-16
Ap
r-1
6
Jul-
16
Oc
t-1
6
Jan
-17
An
nu
al
Pe
rce
nta
ge
Ch
an
ge
Ireland UK Euro area 19
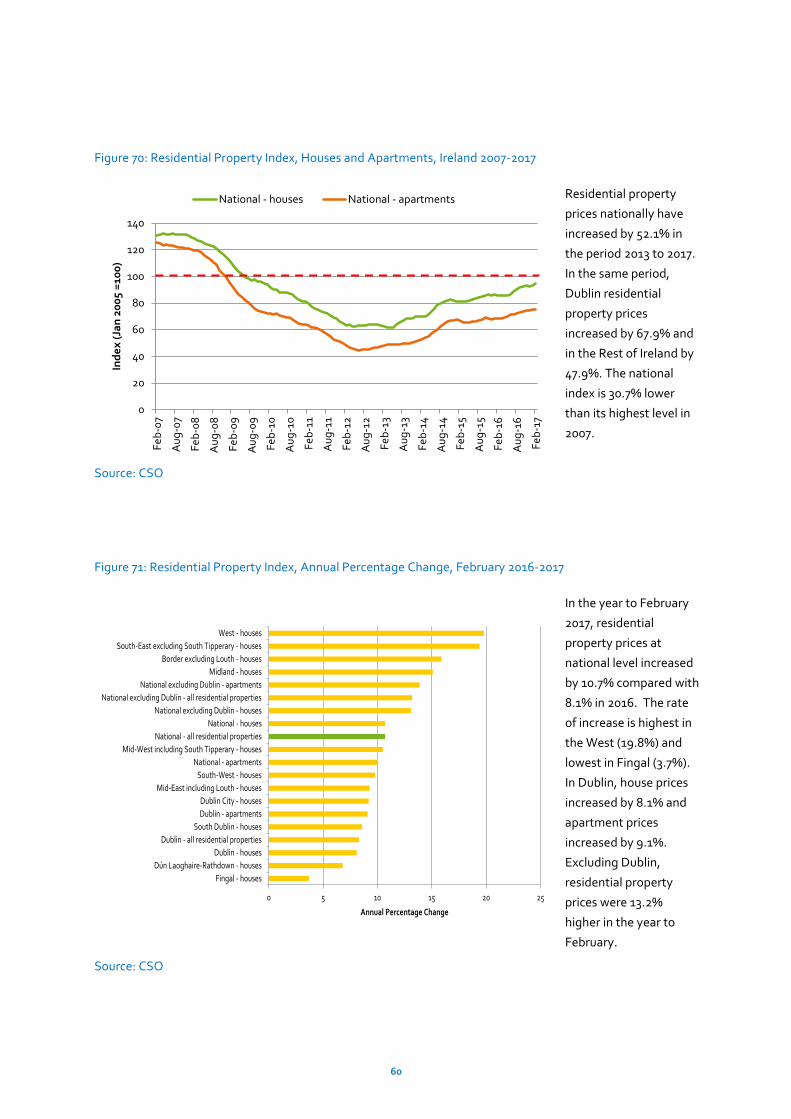
60
Figure 70: Residential Property Index, Houses and Apartments, Ireland 2007-2017
Residential property
prices nationally have
increased by 52.1% in
the period 2013 to 2017.
In the same period,
Dublin residential
property prices
increased by 67.9% and
in the Rest of Ireland by
47.9%. The national
index is 30.7% lower
than its highest level in
2007.
Source: CSO
Figure 71: Residential Property Index, Annual Percentage Change, February 2016-2017
In the year to February
2017, residential
property prices at
national level increased
by 10.7% compared with
8.1% in 2016. The rate
of increase is highest in
the West (19.8%) and
lowest in Fingal (3.7%).
In Dublin, house prices
increased by 8.1% and
apartment prices
increased by 9.1%.
Excluding Dublin,
residential property
prices were 13.2%
higher in the year to
February.
Source: CSO
0
20
40
60
80
100
120
140
Fe
b-0
7
Au
g-0
7
Fe
b-0
8
Au
g-0
8
Fe
b-0
9
Au
g-0
9
Fe
b-1
0
Au
g-1
0
Fe
b-1
1
Au
g-1
1
Fe
b-1
2
Au
g-1
2
Fe
b-1
3
Au
g-1
3
Fe
b-1
4
Au
g-1
4
Fe
b-1
5
Au
g-1
5
Fe
b-1
6
Au
g-1
6
Fe
b-1
7
Ind
ex
(Ja
n 2
00
5 =
100
)
National - houses National - apartments
0 5 10 15 20 25
Fingal - houses
Dún Laoghaire-Rathdown - houses
Dublin - houses
Dublin - all residential properties
South Dublin - houses
Dublin - apartments
Dublin City - houses
Mid-East including Louth - houses
South-West - houses
National - apartments
Mid-West including South Tipperary - houses
National - all residential properties
National - houses
National excluding Dublin - houses
National excluding Dublin - all residential properties
National excluding Dublin - apartments
Midland - houses
Border excluding Louth - houses
South-East excluding South Tipperary - houses
West - houses
Annual Percentage Change
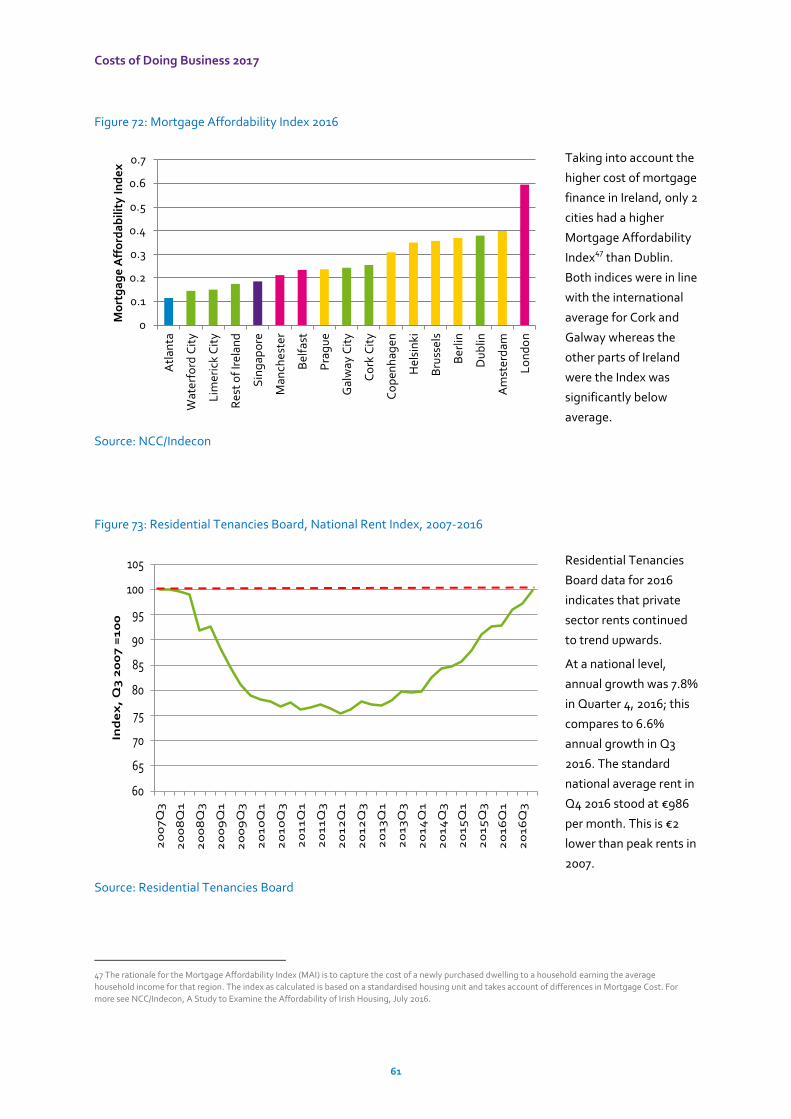
Costs of Doing Business 2017
61
Figure 72: Mortgage Affordability Index 2016
Taking into account the
higher cost of mortgage
finance in Ireland, only 2
cities had a higher
Mortgage Affordability
Index47
than Dublin.
Both indices were in line
with the international
average for Cork and
Galway whereas the
other parts of Ireland
were the Index was
significantly below
average.
Source: NCC/Indecon
Figure 73: Residential Tenancies Board, National Rent Index, 2007-2016
Residential Tenancies
Board data for 2016
indicates that private
sector rents continued
to trend upwards.
At a national level,
annual growth was 7.8%
in Quarter 4, 2016; this
compares to 6.6%
annual growth in Q3
2016. The standard
national average rent in
Q4 2016 stood at €986
per month. This is €2
lower than peak rents in
2007.
Source: Residential Tenancies Board
47 The rationale for the Mortgage Affordability Index (MAI) is to capture the cost of a newly purchased dwelling to a household earning the average
household income for that region. The index as calculated is based on a standardised housing unit and takes account of differences in Mortgage Cost. For
more see NCC/Indecon, A Study to Examine the Affordability of Irish Housing, July 2016.
0
0.1
0.2
0.3
0.4
0.5
0.6
0.7A
tlan
ta
Wat
erf
ord
Cit
y
Lim
eric
k C
ity
Re
st o
f Ir
ela
nd
Sin
gap
ore
Man
che
ste
r
Be
lfas
t
Pra
gu
e
Gal
way
Cit
y
Co
rk C
ity
Co
pen
hag
en
Hel
sin
ki
Bru
ssel
s
Be
rlin
Du
blin
Am
ster
dam
Lo
nd
on
Mo
rtg
ag
e A
ffo
rda
bil
ity
In
de
x
60
65
70
75
80
85
90
95
100
105
20
07
Q3
20
08
Q1
20
08
Q3
20
09
Q1
20
09
Q3
20
10
Q1
20
10
Q3
20
11
Q1
20
11
Q3
20
12
Q1
20
12
Q3
20
13
Q1
20
13
Q3
20
14
Q1
20
14
Q3
20
15
Q1
20
15
Q3
20
16
Q1
20
16
Q3
Ind
ex
, Q
3 2
00
7 =
10
0
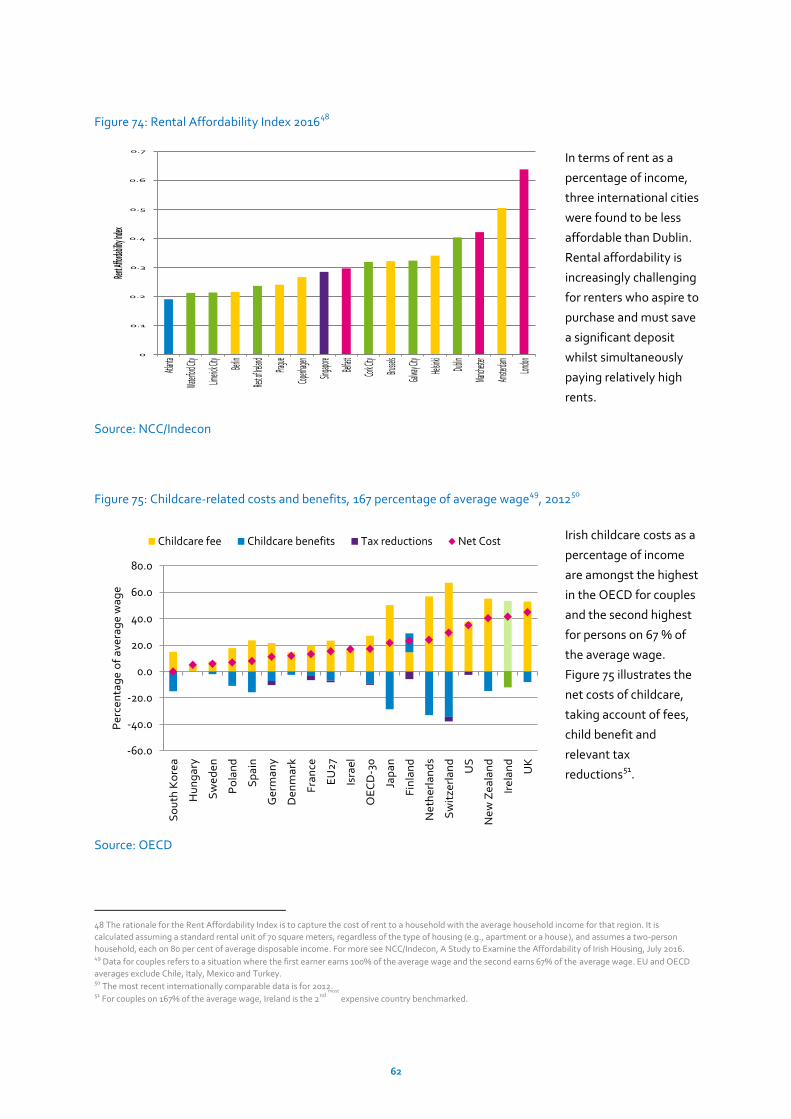
62
Figure 74: Rental Affordability Index 201648
In terms of rent as a
percentage of income,
three international cities
were found to be less
affordable than Dublin.
Rental affordability is
increasingly challenging
for renters who aspire to
purchase and must save
a significant deposit
whilst simultaneously
paying relatively high
rents.
Source: NCC/Indecon
Figure 75: Childcare-related costs and benefits, 167 percentage of average wage49
, 201250
Irish childcare costs as a
percentage of income
are amongst the highest
in the OECD for couples
and the second highest
for persons on 67 % of
the average wage.
Figure 75 illustrates the
net costs of childcare,
taking account of fees,
child benefit and
relevant tax
reductions51
.
Source: OECD
48 The rationale for the Rent Affordability Index is to capture the cost of rent to a household with the average household income for that region. It is
calculated assuming a standard rental unit of 70 square meters, regardless of the type of housing (e.g., apartment or a house), and assumes a two-person
household, each on 80 per cent of average disposable income. For more see NCC/Indecon, A Study to Examine the Affordability of Irish Housing, July 2016. 49
Data for couples refers to a situation where the first earner earns 100% of the average wage and the second earns 67% of the average wage. EU and OECD
averages exclude Chile, Italy, Mexico and Turkey. 50 The most recent internationally comparable data is for 2012. 51 For couples on 167% of the average wage, Ireland is the 2nd
most
expensive country benchmarked.
0
0.1
0.2
0.3
0.4
0.5
0.6
0.7
Atlanta
Waterf
ord Cit
y
Limeric
k City
Berlin
Rest of
Ireland Prague
Copenh
agen
Singap
ore
Belfast
Cork C
ity
Brusse
ls
Galway
City
Helsink
i
Dublin
Manch
ester
Amster
dam
London
Rent Af
fordabi
lity Ind
ex
-60.0
-40.0
-20.0
0.0
20.0
40.0
60.0
80.0
So
uth
Ko
rea
Hu
ng
ary
Sw
ed
en
Po
lan
d
Sp
ain
Ge
rma
ny
De
nm
ark
Fra
nce
EU
27
Isra
el
OE
CD
-30
Jap
an
Fin
lan
d
Ne
the
rla
nd
s
Sw
itze
rla
nd
US
Ne
w Z
ea
lan
d
Ire
lan
d
UK
Pe
rce
nta
ge
of
ave
rag
e w
ag
e
Childcare fee Childcare benefits Tax reductions Net Cost

National Competitiveness Council c/o Department of Jobs, Enterprise and Innovation 23 Kildare Street, Dublin 2, D02 TD30 Tel: 01 6312121 Email: [email protected] Web: www.competitiveness.ie