Embed Size (px)
Citation preview
COTTON FIBRE TESTING TRAINING COURSE
Theoretical Background
presented
by
Cotton Technology International
Manchester, UK
Sponsored by
The Food and Agriculture Organisation of the United Nations
CottonFibreT estingT rainingCourse Contents
© 1991 CottonT echnology International
CONTENTS
1. Technological Importance of Fibre Quality Parameters
2. The Meaning and Measurement of Cotton Fibre Properties
3. Reproducibility of Test Data from Airflow Testing Instruments
4. Appendices

CottonFibreT estingT rainingCourse Contents
© 1991 CottonT echnology International
Appendix 1
International Cotton Conference, Bremen 1988
- A Quick Maturity Test from the Modified IIC-Shirley Fineness/Maturity TesterS.A. Heap
- Possibilities to Remove Seed Coat Fragments in the Spinning ProcessDipl-Ing M. Frey
- The Effects of Ginning on Fibre QualityW. Mayfield
Appendix 2
International Cotton Conference, Bremen 1990
- Cotton Seed Fibre Separation Energy - Its Influence on Ginned Lint QualityS.A. Heap & P.F. Greenwood
- Practical Experience with New Cotton Measuring MethodsDipl-Ing M. Frey
- Improving the Between Laboratory Agreement for High Volume Instrument DataP.E. Sasser
Appendix 3
International Committee on Cotton Testing Methods 1988
- Progress Report
International Committee on Cotton Testing Methods 1990
- Progress Report
Appendix 4
USDA
- International Calibration Cotton Check Test Program July 1989Check Test Report Number 65
Faserinstitut Bremen
- Bremer Baumwoll Roudtest 1990/3Evaluation of the Test Results
CottonFibreT estingT rainingCourse P aper1
© 1991 CottonT echnology International P aper1 /1
TECHNOLOGICAL IMPORTANCE OF
FIBRE QUALITY PARAMETERS
1. INTRODUCTION
Cotton is an industrial raw material which has to be processed into other products, namely yarnsand fabrics. The quality of the final products, and hence their value, depends to a large extenton the basic properties of the fibres from which they are made. From the point of view ofproducing a high-quality product, the most important fibre properties are:
Fibre Length, Fibre Strength, Fibre Maturity, Fibre Fineness, Micronaire value (specific surface) Trash content
It is not just the average values of these parameters which are important. Of equal (sometimesgreater) importance is the uniformity, or variability in the values. So far as the textilemanufacturer is concerned, changes in these six properties are what determine:
Spinning potential - the finest yarn which can be spun, Spinning efficiency - the cost of spinning a particular type of yarn, Yarn strength, regularity, and appearance - the quality of a particular type of yarn, Yarn processing efficiency - the cost of making the yarn into a fabric, Fabric strength and appearance - the quality of a particular type of fabric, Dyeing efficiency and regularity - the cost and quality of particular dyed yarns or fabrics.
Several of the properties are correlated one with another. Thus, a cotton type which has a longstaple length also tends to be fine and to have a high strength. A fibre which is weak or is non-uniform in strength will tend to be non-uniform in fineness and maturity, and is likely to developnon-uniformity in length due to fibre breakage during processing.
2. LENGTH
Fibre length is probably the most characteristic property of cotton. Each cotton fibre is in fact asingle hair cell which has grown out from the surface of the seed. Cotton is the longest hair cellknown in nature. During the maturing period, the first thing that happens is that the hollow haircell grows in length, the final length and diameter depending on the species and variety. Thedevelopment of length takes between 15 and 20 days. Barbadense type cottons will take longerto lengthen than Hirsutum types and they will be finer. For the finest cottons, the ultimate lengthmay be 3000 times the diameter; for the shortest and coarsest types it may be only 1000 times.Only after the hair has grown almost to its full extent does the body of the cell wall begin to bedeposited, day by day in a spiralling pattern, working from the outside hair walls towards thecentre. This takes a further 40 to 50 days. Hair lengthening and cell wall deposition will occurfaster in a warm climate than in a cooler one.
Fibres which are long and strong will also tend to be more lustrous. Finer and longer fibres canbe spun into finer yarns of the highest quality.
CottonFibreT estingT rainingCourse P aper1
© 1991 CottonT echnology International P aper1 /2
The spinner uses one or other of the indicators of the average length of the longer fibres -effective length, upper half mean length, 2.5% span length - to set up his spinning machinery.The spacing between drafting rollers has to be carefully chosen so that the maximum control isobtained during drafting without excessive fibre breakage. Poor control in drafting leads toirregular yarns with relatively low strength. Thus, the length uniformity, and especially the shortfibre content, is very important in determining spinning efficiency and yarn quality.
During drafting, fibres which are gripped by the front rollers are drawn through the fibre fringeand their trailing ends will tend to straighten the leading ends of those fibres which are stillgripped by the back rollers. Short fibres cannot be controlled in the drafting zone; they are oftencalled floating fibres because they spend a relatively large amount of time floating between thetwo pairs of drafting rolls, not being gripped by either. Since they are not properly drawn forwardat the appropriate time, they can tend to bunch together and they can cause disturbances in thesmooth flow of drafting which can lead to irregularities in the yarn.
Irregularity in the yarn is undesirable in itself, because of the appearance of the yarn, but it alsohas the secondary effect of producing weak places in the yarn which will reduce its averagestrength and will increase the non-uniformity of strength. Irregularity in both mass and strengthwill impair the processing performance of the yarn during winding, beaming, sizing, and weaving.Thus, an irregular yarn is more expensive to produce, more expensive to convert into fabrics,and has a lower value in the final product.
Short fibres can originate in several ways. Usually the length uniformity of a cotton as it growson the seed is pretty good, although no doubt some cotton types are more disposed to non-uniformity in length than other types. Most short fibres are generated either during ginning or intextile processing by fibre breakage.
The cotton may be a type which inherently tends to produce short fibres. This could be becauseit is very strongly attached to the seed - finer cottons on the whole tend to be less stronglyattached than coarser ones - or it could be because the cotton is genetically disposed towardslow maturity or a high frequency of fibre defects and growth abnormalities.
Alternatively, the growing conditions may have been adverse so that a normally strong cottonhas been weakened by insect damage or has a low average maturity.
However, high levels of short fibre content can be produced in perfectly sound fibres by poorginning practice. For example, over drying in the gin so that the cotton is processed at lowmoisture content, or excessively high production rates, or excessive amounts of lint cleaningafter ginning can all result in large amounts of fibre breakage and the generation of short fibres.
3. STRENGTH
The average strength of the fibres determines the strength of the yarns which can be made. Thedependence of yarn strength upon fibre strength is not simple. It depends on the count of yarnwhich is to be made and is affected by the fibre length and fineness.
Length and fineness work together in affecting yarn strength so that a useful parameter toconsider is the aspect ratio. Aspect ratio, in general, is the ratio of length to diameter but in thiscase, we use the standard or intrinsic fineness, Hs, in place of diameter. Standard fineness isthe gravimetric fineness, H, divided by the maturity ratio, M.
CottonFibreT estingT rainingCourse P aper1
© 1991 CottonT echnology International P aper1 /3
Thus, we can define the aspect ratio as
Aspect Ratio = Length / Standard fineness= Length x Maturity / Fineness
In general, when coarse yarns are being spun, then fibre strength plays a dominant role indetermining yarn strength. The finer the yarn, the more important is the aspect ratio.
Strength, and especially strength uniformity, is also important in the generation of short fibres.Obviously, a strong cotton is better able to withstand a harsh ginning treatment than is a weakfibre, so there will be less fibre breakage.
4. MATURITY
Cotton of a variety which is well adapted to its growing area and which has been grown underfavourable conditions will have a high average maturity. However even such cottons will containsome immature fibres, for example those which came from bolls at the extreme periphery of theplant which did not have time, or nutrition to mature fully before harvesting. A higher proportionof immature fibres may be caused by bad weather, by inadequate nutrition, or by biologicalattack from pests or diseases.
Mature fibres are stronger, more lustrous, stiffer, and more lively than immature ones. They willdye to a deeper shade from a standard dyebath. Immature fibres are weak, dull, and limp bycomparison. They may also be discoloured and will not dye as deeply.
Immature fibres can cause serious trouble in the spinning operation which can lead to lowspinning efficiency (high cost) and low quality in yarns which in turn leads to low efficiency inyarn processing and fabric manufacture, and low quality in fabrics and garments.
One of the most serious consequences of immaturity is a tendency to form neps - small tangledbunches of fibres which degrade the appearance of yarns and fabrics and interfere with thesmooth operation of spinning. Neps of immature fibres will also show up as a quality defect inyarns and fabrics, particularly if these have been dyed. In this case the neps cause white specksto appear on the fabric surface which can ruin the fabric quality if they appear in significantnumbers.
Immature fibres are more likely to break during the ginning and spinning operations. This maycause an excessive quantity of short fibres in the raw cotton or the card sliver. Short fibres arevery damaging to spinning efficiency and yarn quality because they interfere with fibre controlduring the drafting operation.
If immaturity is caused by pests or disease, then the cotton may be stained or grey, and theremay be stickiness. If a whole boll has been affected, there may be bundles of dead fibres whichcling together and are difficult to deal with in spinning.
After dyeing, immature fibres appear to have a paler shade than mature ones for the sameamount of dyestuff in the fibre. This is a purely geometrical effect but it can be a cause of poorefficiency in dyeing and a source of barré‚ (yarns with different depths of colour) in woven andknitted fabrics.
The standard tests for maturity deliver an average value, so they are not particularly sensitive tosmall concentrations of immature or dead fibres. However, even small concentrations can bedamaging to spinning efficiency and yarn and fabric quality. Therefore, it is advisable to be verycritical of cotton lots whose average maturity is not fully up to standard.
CottonFibreT estingT rainingCourse P aper1
© 1991 CottonT echnology International P aper1 /4
5. FINENESS
It is important to differentiate between cottons with a low gravimetric fineness (weight per unitlength) and those with a low intrinsic fineness (cross section perimeter). Low gravimetricfineness can be an indicator of low maturity in an intrinsically coarse cotton.
In general terms, provided that a sample has a good average maturity, then a higher quality isindicated by a finer cotton i.e. an intrinsically fine cotton having a small perimeter. Usually,intrinsically finer cottons are longer, stronger, and more uniform than coarser ones. They willmake stronger, more uniform yarns and they can be spun at lower twist levels and at higherspeeds.
Gravimetric fineness determines the theoretical spinning limit of a given cotton. Depending onthe spinning technology being used (e.g. ring spinning or open-end rotor spinning), a certainnumber of fibres must be present in the cross section of the yarn for efficient spinning and forgood yarn quality. For ring spinning, the number of fibres can be less than 80 but for rotorspinning it must be more than 100.
Thus, the finest yarn count that theoretically can be made from a given cotton is directlyproportional to the fineness. For example, when spinning with 100 fibres in the yarn crosssection, a cotton with a fineness of 100 mtex can be spun into a 10 tex (60 Ne) yarn; a cottonwith a fineness of 200 mtex can only be spun to 20 tex (30 Ne).
The practical, or economic spinning limit, for a given spinning set up, will depend on the efficiencyof spinning which depends not only on gravimetric fineness but on a combination of fibreproperties including length, length uniformity, short fibre content, impurities, surface propertiesand intrinsic fineness.
Obviously, a very fine fibre is not as strong as a coarse one and it also will have a greatertendency to make neps during ginning and processing. Therefore, it has to be processed moregently. Nevertheless, a better quality of yarn will generally result from an intrinsically fine, maturefibre than from an intrinsically coarse fibre which has the same linear density (due to lowermaturity).
6. MICRONAIRE
Since micronaire is a function of the product of fineness and maturity, it follows that the sametechnological considerations apply as for fineness and maturity. For a given variety of cotton,there will be a level of micronaire which corresponds to a fully mature sample. Lower levels ofmicronaire value will indicate increasing amounts of immature fibres i.e. lower levels of bothfineness and maturity. Since individual spinners tend to buy a limited range of cotton types, theylearn what is the appropriate range of micronaire values for their cotton types which correspondto a good or adequate level of maturity.
Micronaire is the quickest and most reliable test which can be made on a cotton sample so it isin widespread use by spinners to control the quality of their cotton purchases and to composeeven running mixtures of different cotton deliveries.
Provided that the spinner has a fair amount of experience with the particular cotton types, thenmicronaire is one of his most useful and reliable objective tests. Problems can arise when newvarieties are introduced to the mill (which may have a different intrinsic fineness). In this case aseparate determination of fineness and/or maturity will be required to establish the true natureof the material but, even so, the spinner will not be sure of the practical performance of the newcotton until he has actually spun large quantities.
CottonFibreT estingT rainingCourse P aper1
© 1991 CottonT echnology International P aper1 /5
Thus, micronaire is one of the key blending criteria for a spinner because, for a cotton that he isfamiliar with, it will be a good indication of the nep forming potential, the processing efficiency,and the dyeing efficiency of the material.
7. TRASH CONTENT
Trash content has a large influence on the value of a raw cotton for three reasons.
7.1 Waste
The trash content determines the amount of waste which will be made during spinning.Therefore, the value of the cotton is reduced in direct proportion to the amount of trash. Thegrade of raw cotton, and therefore its selling price, is directly related to the trash content (seetables and charts).
7.2 Spinning efficiency
Trash content determines the spinning efficiency i.e. the cost of conversion of the raw cotton intoyarn. In this case it is not the absolute quantity of trash which is important but the type of theimpurities.
For example, the most damaging form of impurity is seed coat fragments with attached fibres.Such fragments are very difficult to remove in spinning. They can drastically affect the spinningefficiency both in ring spinning and in rotor spinning (see appendices).
The quantity of seed-coat fragments present, in a given lot of cotton, depends mainly on threefactors.
a) The genetic constitution of the seed. Some cottons have weak seed coats which are easilybroken and some cottons have fibres which are very strongly attached to the seed. Ineither case there is a tendency for fragments of the seed coat to be pulled away with thefibres during ginning.
b) The growing conditions. Seed coat fragments can arise from immature or aborted seedswhich may be small enough to pass through the grids during ginning and are then brokenup by the saw blades or by the lint cleaners.
c) Poor maintenance of the gin. Towards the end of the ginning season, gin parts may beworn and settings may not be correct. In such cases seeds can be damaged resulting inthe generation of seed coat fragments with attached fibres.
Heavy trash, in large particles, is much easier for the spinner to remove from the cotton thanvery fine particles. The finest particles are particularly dangerous in open end rotor spinningwhere they cause a build-up of deposits in the spinning rotors. Spinners usually have a setroutine for cleaning out their rotors so a cotton which has a higher level of fine dust and verysmall trash particles may produce a large quantity of sub-standard yarn before the spinnerrealises that anything is amiss.
Fragments of seeds can cause stickiness at card rollers and drafting rollers. Much more seriousstickiness problems are caused by insect residues, called honeydew which can make a cottonimpossible to spin and can shut down the factory.
CottonFibreT estingT rainingCourse P aper1
© 1991 CottonT echnology International P aper1 /6
Because of the effect of trash content on the grade and the price of raw cotton, ginners will striveto produce a clean and white material by using very aggressive lint cleaners. Unfortunately,although this removes most of the heavy trash and improves the grade, it also causes trashparticles and seed coat fragments to be broken down into small fragments, many of which remainin the ginned lint. In addition, many fibres are broken which causes an increase in the short fibrecontent (see appendices).
7.3 YARN QUALITY
Trash influences the yarn quality. Because the spinning efficiency is impaired, the yarn qualitysuffers. The yarn may appear dirty and it may have poor regularity. A cotton which is difficult toclean, because of the nature of the trash, will have to be processed aggressively by the spinnerwhich may cause the generation of excessive neps and short fibres. Both of these have anadverse effect on spinning efficiency and yarn quality.
CottonFibreT estingT rainingCourse P aper2
© 1991 CottonT echnology International P aper2 /1
THE MEANING AND MEASUREMENT OF
COTTON FIBRE PROPERTIES
1. INTRODUCTION
Length, Strength, Fineness and Maturity are four of the most important fibre properties of rawcotton. They have a strong influence on the spinning potential of the cotton, the efficiency of thespinning operation, the quality of the yarn which can be produced, and the efficiency of thesubsequent dyeing and finishing processes. In this paper we will look at the various definitionsof length, strength, fineness, maturity, and micronaire and some of their interrelationships interms of fibre structure and fibre geometry. We will also consider the methods of measurementof these parameters and the reliability as well as the interpretation of the test data.
2. LENGTH
2.1 Definitions
There is no single measurement which adequately describes the length of a sample of cotton.This is because, even for the same variety of cotton, differences in growing conditions or ginningtreatments will result in raw cottons with different proportions of short fibre and different averagelengths even though the nominal staple length may be the same or similar. In the days beforerapid instrumental measurements were available, the "staple length" was agreed to be thatlength which was most common. In practice, this meant that different customs arose in differentareas so that, for example the classers staple for an American cotton was not assessed on quitethe same basis as the Classers length for Egyptian types. Thus, the staple length is determinedsubjectively, according to established practice and can hardly be defined except by reference tocotton standards which are maintained by different cotton producers in order to preservecontinuity.
Since the advent of objective instrumental measurements, various length parameters have beendefined on the basis of the length distribution - especially the cumulative length distribution, orstaple diagram. Thus, length is defined in terms of one or more of a series of statisticalparameters such as:
Mean length Effective length Upper half mean length 2.5% Span length 50% Span length
As well as measures of length, we have measures of length uniformity:
Coefficient of variation Uniformity Ratio Uniformity Index
More specific measures of length uniformity are concerned with the proportion of short fibres:
Short fibre content Floating fibre index
CottonFibreT estingT rainingCourse P aper2
© 1991 CottonT echnology International P aper2 /2
Mean length and coefficient of variation have the normal statistical interpretations.
Effective length was originally developed in the UK as a practical length parameter for spinnerswhich is a measure of the average length of the majority of the longer fibres. It is derived froma special, repetitive construction on the staple diagram. Its statistical definition is the upperquartile of the fibre length distribution curtailed below a value equal to one half of the effectivelength.
Upper half mean length is similar to the effective length but is determined (and described) moresimply. It is the upper quartile of the length distribution curtailed below 1/4 inch.
2.5% Span length and 50% Span length are both derived from the fibre distribution which isproduced by the Fibrograph instrument. They represent the span of the fibres at the 2.5% andthe 50% point on this distribution, respectively.
The Uniformity Ratio is the ratio of mean to upper half mean length. The Uniformity Index is theratio of the 50% to the 2.5% Span length.
Short fibre content is the percentage of fibres in the distribution which are less than a certainlength - usually 12mm or half an inch.
Floating fibre index is a measure of short fibre content which takes the mean length into account.This allows that, for practical purposes, a short fibre in a long staple cotton is longer than a shortfibre in a short staple cotton. Various definitions have been developed, among which are thefollowing.
V = 100 . (staple length / mean length - 1)
V = 100 . (upper half mean / mean length - 1)
V = 100 . (2.5% Span length / mean length - 1)
2.2 Measurement
Classers Length
This is a subjective appraisal as described above. It is being replaced by instrumentalmeasurements and will not be further detailed.
Comb Sorter Devices
These were the first semi-instrumented measurements. Essentially, mechanical devices areused to assist the operator to prepare a staple diagram i.e. to lay all of the fibres in a sampleside by side on a velvet pad in descending length order. The staple diagram is obtained bytracing around the outline of the distribution. The method is slow and unreliable so it is beingreplaced by the more rapid, automated instruments. Its importance lies in the fact that it is theonly method for producing a true staple diagram, from which all basic parameters are derived.It therefore stands as the theoretical reference method for basic research studies. Furthermore,it is the only method (with the possible exception of the Almeter) which allows the short fibrecontent to be derived.
CottonFibreT estingT rainingCourse P aper2
© 1991 CottonT echnology International P aper2 /3
Almeter AL 101
The Almeter is a semi-automatic method for producing a staple distribution. It was originallydeveloped for wool fibres, for which it is well suited. With cotton, specimen preparation issubstantially more difficult so the results are probably not quite so reliable. Nevertheless, it isabout as reliable as hand methods and is very much quicker. A random fibre fringe is producedand straightened by repeatedly drawing the specimen through combs - somewhat like the handcomb sorter device. The fringe is then scanned by an optical device to produce the staplediagram. The data is collected by a computer which can then print out the diagram together withthe appropriate statistics.
Fibrograph
The Fibrograph is the most rapid and the most successful automated length measurementdevice, whether as a free-standing instrument or incorporated into a High Volume Instrument(HVI) system. It takes a length-biased sample by pinching a specimen from the sample. Thespecimen is combed and straightened by brushes and then is scanned by an optical device.Scanning begins at the clamp and proceeds down the length of the fibre beard. The amount oflight passing through the beard is expressed in relation to that at the clamp, which is taken as100%, and a length frequency distribution is generated by a computer with appropriate softwarewhich allows for the fact that the sample is length-biased. The computer also makes theappropriate manipulations of the distribution to deliver span lengths or upper half mean lengthetc. The whole frequency distribution (Fibrogram) can be printed. The Fibrogram is not thesame as the staple diagram but is a derivative of it. It essentially shows the distribution of fibrelengths that would project on one side of a pair of drafting rollers. Thus, if two pairs of draftingrollers are set at a distance corresponding to the 2.5% Span length apart, then it can be assumedthat about 2.5% of the fibres would be gripped by both sets of rollers at the same time.
3. Strength
3.1 Definitions
Breaking Load is the force required to break a fibre or fibre bundle.
Breaking extension, or elongation, is the extension of the fibre or fibre bundle at the moment thatit breaks.
Strength, or Specific strength, or Tenacity is the breaking load per unit of cross section or perunit of fineness. In the case of fibres or fibre bundles, strength is usually expressed in units ofgrams per tex.
3.2 Structural Origins of Fibre Strength
The cotton fibre is composed of highly crystalline micro fibrils which themselves are probablyextremely strong - values in the region of 130 g/tex can be deduced from theoretical studies.The strength of the single fibre depends on the way that these microfibrils are arranged in ahelical pattern and the way that the direction of the fibrillar helix reverses from time to time alongthe length of the fibre. The spiralling arrangement of the fibrils gives rise to convolutions, ortwisting of the fibre. The periodic reversals in the direction of the fibrillar helix cause theconvolutions also to reverse their direction.
What is important for our discussion is the crucial role which is played by the presence of thereversals and the convolutions, their frequency, and, especially, the uniformity of theirdistribution along the fibre length. In brief, and grossly simplified, the tensile strength of a normal
CottonFibreT estingT rainingCourse P aper2
© 1991 CottonT echnology International P aper2 /4
fibre (i.e. a fibre of normal maturity and without gross defects) is governed firstly by the uniformityof spacing of the reversals and secondly by the cross-sectional uniformity of the fibrillar packing.
This is because the initial effect of a tensile load is to untwist the convolutions which causesstress concentrations to occur adjacent to the reversal zones - on either side of a reversal zone,the convolutions are untwisting in opposite directions so the reversal zone is the centre ofrotation. If the length of the fibre segments between each reversal zone is roughly the same,then stress concentrations are shared more or less equally between all reversal zones.However, if some segments between reversal zones are relatively short, then all of the twist willbe removed from such segments before other, longer segments have been fully de-twisted.Stress will begin to concentrate close to the reversal zone, on the untwisted side, causing thefibre first to split along the fibrillar helix, and then to fracture.
How quickly the fibre will fail beside such reversal zones, and at what stress, will depend on theunderlying uniformity of the fibrillar packing at the places near the reversals and hence how wellthe rapidly concentrating stresses can be distributed over the cross section and back throughthe length of the fibre segment. The uniformity of fibrillar packing across the fibre cross sectionis influenced by the way that the fibre collapses when it first emerges from the boll and dries outin the field, so that some areas of the fibre structure are more uniform - i.e. stronger - than others.
This general tensile fracture mechanism (together with specific weak places in the fibres causedby growth irregularities) is probably the source of the well-known effect of the tensile test gaugelength upon fibre strength. The longer the test length, the more likely it contains either a weakplace or a region of unbalanced twist, where stress can concentrate.
An important consequence of this fracture mechanism is that the breaking extension is governedby the number of convolutions in the shorter fibre segments. Under low loads, extension of thefibre is almost entirely the result of deconvolution - the greater the number of convolutions, thegreater the extension. Deconvolution ceases either when the fibre breaks or when all of thesegments having one twist direction are fully untwisted.
If the convolutions are removed, for example by mercerising under tension, then the extensionat break is drastically reduced although the strength is generally significantly increased. Theincrease in strength is probably partly because there is no longer such a strong concentration ofstress adjacent to particular reversal zones, due to the untwisting of convolutions, but alsobecause of the improved distribution of fibrillar packing across the fibre cross section. Thepronounced drop in both fibre strength and extensibility which is caused by chemical cross-linking (for example in easy-care processes) is probably partly due to an increase in the torsionalstiffness of the fibre, which makes it more difficult to untwist the convolutions, and partly due toirregularities in the fibrillar packing being "frozen" into the structure so that stresses areconcentrated into a smaller length of the fibre.
When cotton fibres are evaluated for their strength in the marketing system, they are notmeasured as individual fibres but as bundles. Bundle testing exaggerates the effects describedabove - since there is a greater likelihood of finding "weak" places - but also adds its owncomplications. These are to do with differences in the orientation of the different fibres within abundle (some fibres may not be straight) and also different levels of crimp in the fibres. Inaddition, of course, there are differences in the actual strength and extensibility of different fibresin the bundle which means that the weaker or less extensible fibres break first, throwing the loadonto the remainder. The smaller the differences in orientation and crimp which are presentbetween different individual fibres in a bundle, then the higher will be the bundle strength.Likewise, the smaller the differences in strength and extensibility between different fibres (i.e.the greater the uniformity among fibres) the better will be the bundle strength.
CottonFibreT estingT rainingCourse P aper2
© 1991 CottonT echnology International P aper2 /5
3.3 Measurement
Single Fibre Tests
Strength may be measured on single fibres and there are instruments for this purpose. However,in order to have a good average value, the number of fibres which must be tested is of the orderof 1000. This makes single fibre measurement so slow and expensive that it is never doneexcept in the most basic research studies.
Bundle Testing
1. Pressley
In practice, virtually all fibre strength testing is done on bundles. Since each bundle may containup to 2000 fibres, the result of a single test is already a good average. However, because of thedifficulties of preparing uniform and reproducible bundles, it is necessary to test a number ofbundles to have a reproducible average for a given cotton. In fact, about ten bundles should betested but usually only two to four are measured.
The original bundle tester was the Pressley device which tested bundles with a test length ofzero - i.e. the clamps were close up to one another. Later, after the effect of test length wasdiscovered, it was found that tests made with a specimen length of 1/8 inch, or 3.2 mm gaveresults which were better correlated to yarn strength than the zero-gauge test. In fact, the zero-gauge test is eliminating the effect of the weak places and the convolutions, so it measuresdifferences in the fibrillar orientation and packing uniformity. Tests at 3.2 mm allow the effect ofreversals and convolutions to be felt, since the frequency of reversals in most cottons is about 2to 3 per mm.
The Pressley device is essentially a loaded beam with the test bundle in clamps at one end ofthe beam. On the other side of the beam fulcrum is a rolling weight on an incline. As the weightrolls down the incline, a greater and greater load is applied across the clamps until the bundlebreaks. The weight is arrested at this point and the load can be read off on a scale. The brokenfibres are collected from the clamps and weighed. Since their length is known - from the widthof the clamps - the tex value for the bundle can easily be calculated. The breaking load is dividedby the tex to obtain the strength of the bundle.
Later models of the Pressley tester allow a spacing of 3.2 mm between the clamps.
2 Stelometer
The Stelometer is also a loaded beam device but its mechanical design is more sophisticatedthan the Pressley to avoid the large inertial effect of the rolling weight. A test length of 3.2 mmis standard and provision is made to register the breaking extension as well as the breakingload. The bundle preparation and clamping arrangements are almost identical to those of thePressley tester so it is subject to the same difficulties and uncertainties. Bundle tex is alsomeasured in the same way.
3 H.V.I
The HVI bundle tester is radically different from the two other bundle testers. The criticaldifferences are the sample preparation and the estimation of the specimen mass. The bundlewhich is tested is the same one which is used for measuring length. This means it is not a flatparallel bundle but a tapered beard. The point at which the bundle is tested, is selectedautomatically by the instrument by reference to the length scan, in order to have a more or lessconsistent mass at the break point. The mass of the specimen is not determined directly but is
CottonFibreT estingT rainingCourse P aper2
© 1991 CottonT echnology International P aper2 /6
estimated from the length scan data, with a correction made for the micronaire. The reason forthis correction has to do with the fact that the method of estimating specimen mass via lightabsorption (Spinlab) or air flow (Motion Control) is biased according to the micronaire value ofthe cotton.
The HVI method is much quicker than the other two methods, and is slightly more reproducible.However, its precision is open to question with certain cottons because of the empirical natureof the mass estimation. The other serious consequence of this empirical mass determination isthat the device must be constantly calibrated to make sure that the mass determination is keptwithin proper bounds.
In fact, the need for constant calibration is not that different from the Pressley and Stelometerinstruments. Because of the large operator effects with these two instruments, it is alsonecessary to run many calibration samples on them also.
4. MATURITY
4.1 Definitions
Maturity is defined as the relative degree of fibre wall development, or the relative wall thickness.It is essentially the proportion of the total potentially available volume within the fibre which hasactually been filled by cellulose during the growing phase. The limit of fibre wall development isset by the genetic constitution of the particular cotton variety but the extent to which that limit isrealised in a given fibre or fibre population is determined by the growing conditions.
A cotton fibre is a single cell which grows out from the surface of the seed. This process beginsat about the time of flowering and the individual hair cells continue to lengthen for about 20 days.It is only after the cell has almost reached its full length that the cell wall begins to be deposited,in daily growth layers, working from the outside inwards. Deposition of the cell wall continuesfor about 35 to 50 days depending on the variety and the environmental conditions.
Flowers and fruits appear on the plant in succession so that seeds and fibres are at all stagesof development throughout the season. The rate of development is also different at differentpositions on the plant and in different areas of the field. Thus, at harvest time there will be arelatively wide distribution of maturities present in the crop and there will always be a proportionof fibres which have not properly matured.
There are two ways to express the relative development of the fibre wall. Both of them dependon a knowledge of the fibre perimeter i.e. the perimeter of the fibre cross section. The circlewhich has the same perimeter as the fibre perimeter is called the equivalent circle.
a) Maturity is the ratio of the cross-sectional area of the fibre wall to the area of the equivalentcircle, or
b) Maturity is the ratio of the fibre wall thickness to the radius of the equivalent circle.
Definition (a) is usually called the "degree of thickening" and is denoted by the Greek letter theta,θ. It also has been known as the "shape factor" or "form factor", or "circularity". However, these latter terms are often applied to the reciprocal of θ so they are best avoided in discussing maturity. If the area of fibre cross section is denoted by A, and the perimeter is P, then
θ = 4A / P2 [1]
CottonFibreT estingT rainingCourse P aper2
© 1991 CottonT echnology International P aper2 /7
Definition (b) is called the "relative wall thickness" and is usually denoted by RWT or 2e / D whichis twice the wall thickness, e, divided by the diameter of the equivalent circle, D.
The relationship between the degree of thickening and the relative wall thickness will beexamined later.
4.2. Measurement
The fundamental definition of maturity as degree of cell wall development means that the onlyway to measure it properly is by preparing a large number (at least 500) of representativetransverse fibre sections and photographing them or drawing around their projected images.From the photographs or drawings, direct measurements of the perimeter and the cross-sectional area of the fibres can be made to establish θ, or of perimeter and wall thickness to establish 2e / D. The method is extremely slow and is prone to errors so that for everydaypurposes, the method is impracticable - even when use is made of computerised image analysissoftware to speed up the analytical part of the measurement. Therefore, more rapid methods ofestimating maturity had to be developed.
Many practical procedures for estimating maturity have been developed over the years andsome of the more useful of these are described in "The Origin and Assessment of Cotton FibreMaturity" by E. Lord & S. A. Heap. Many of these methods yield estimates which are biased tosome degree i.e. the maturity estimate is influenced by the intrinsic fineness of the specimen.The only practical method which is probably free of such bias, and which has actually beencalibrated against careful measurements of either degree of thickening, θ, or relative wall thickness, 2e / D, is the classification of swollen fibres, according to the British method.
Classification of Swollen Fibres.
When cotton fibres are swollen in 18% by weight sodium hydroxide solution, the shape adoptedby a given fibre depends on its degree of thickening. Large numbers of such swollen fibres canbe observed relatively quickly and classified according to their visual appearance.
In the British system of classification (BS 3085), three levels of distinction are made as follows.
Normal fibres: appear as more or less solid rods, substantially without convolutions, andshow no continuous lumen.
Dead fibres: have a continuous lumen and an apparent wall thickness of one fifth orless of the maximum ribbon width. They will often show frequentconvolutions but may also appear as flat unconvoluted ribbons.
Thin-walled fibres: are those which are not classed as either Normal or Dead.
Detailed research in the 1930's and 1940's showed that the category of Normal fibrescorresponds to a degree of thickening, θ, greater than about one half whereas, Dead fibres had a θ of less than about one quarter. Furthermore, it was found that the relationship between the average degree of thickening and the percentages of Normal and Dead fibres was given by thefollowing equation.
θ = 0.577 [(N-D) / 200 + 0.70] [2]
CottonFibreT estingT rainingCourse P aper2
© 1991 CottonT echnology International P aper2 /8
For practical convenience, the term between the square brackets was designated the "maturityratio", M.
M = [(N-D) / 200 + 0.70] [3]
The maturity ratio is thus directly proportional to the degree of thickening provided that thedistribution of the parameter θ for the specimen under test is typical of normal cottons. Occasionally an abnormal distribution is encountered which may cause M to be an inadequaterepresentation of the average degree of thickening. Such cases are thought to be rare but thissupposition has not actually been proved.
In the American system of classification (ASTM D1442), the swollen fibres are separated intoonly two groups.
Mature fibres: have a ratio of apparent wall thickness to ribbon width that is greater thanone quarter.
Immature fibres: are the remainder.
The result is quoted as "percent mature fibres", Pm.
The American system of classification is more simple and rapid but it is less sensitive than theBritish method, and is not directly proportional to the degree of thickening. Nevertheless, it hasbeen found that there is a fairly good statistical relationship between the results of the two testsso that the one can be estimated from the other by use of the following empirically determinedequations.
M = 1.76 - √ (2.44 - 0.0212 Pm) [4]
and Pm = (M - 0.2) (1.565 - 0.471 M) [5]
More recently, it has been found that Pm is related to the relative wall thickness by an equationof the following form.
log Pm = 2.19 + 0.88 log (2e / D) [6]
5. FINENESS
5.1 Definitions
Fineness can also be defined in two different ways, by relation to either the fibre geometry or tothe linear density (weight per unit length).
Definitions which relate to the fibre geometry, such as the fibre perimeter or the diameter of theequivalent circle, are called biological fineness or intrinsic fineness.
Definitions which relate to the linear density are called gravimetric fineness. Linear density isnowadays expressed in units of millitex (milligrams per kilometre) although formerly units ofmicrograms per inch were used in some countries (especially the USA). The old British unit ofgrams x 10-8 per centimetre are numerically equal to millitex. Gravimetric fineness is usuallydenoted by the symbol H (hair weight).
The average perimeter of a given cotton variety is genetically determined and its value will showonly relatively small variations, for a given variety of cotton, no matter what the local growing
CottonFibreT estingT rainingCourse P aper2
© 1991 CottonT echnology International P aper2 /9
conditions. The very finest of Sea Island cottons may have average perimeters as low as 40micrometres whereas the coarsest Asiatic types may average around 75 micrometres.However, within a given sample there will be quite a range of perimeters so that the coarsestfibres in a Sea Island cotton sample may be larger than the finest fibres in an Asiatic type.
Obviously, for a range of cotton types, the average gravimetric fineness will be very closelydependent on the average perimeter and the average maturity but this relationship is not simplebecause of variations in the average shape of the cross section and of the overall specificvolume. The finest Sea Island cottons can have an average gravimetric fineness in the regionof 100 mtex; the coarsest Asiatic types may have values over 400 mtex. As with the intrinsicfineness, there is a large variation over individual fibres within a sample from single cottonvariety.
5.2 Measurement
Direct measurement of the intrinsic fineness or fibre perimeter has to be done on large numbersof photographs or drawings of clean cross-sections and, just as with the direct determination ofmaturity, it is very difficult, tedious, and subject to errors. Therefore, it is very seldom done inpractice. It is much more common to measure the gravimetric fineness or linear density or fibremass per unit length. The measurement is usually made on bundles of fibres obtained from acomb sorter or staple diagram test.
There are many different ways of obtaining linear density from fibre bundles but the two mainmethods are:
a) weighing a known number of fibre segments of known length which have been cut fromthe centres of fibre bundles taken from different length classes of the comb sorter.
b) weighing bundles containing a known number of whole fibres taken from a series of givenlength classes.
In each case the very short length classes are rejected before samples are taken, and thenumber of fibres in each bundle is counted before weighing. The total length of the fibres isknown from the number of fibres in each length group so the gravimetric fineness is simplyobtained from the mass of the fibres divided by the total length.
Method (b) will usually give results somewhat lower than method (a) because cotton fibres tapertowards the tip (the end remote from the seed) so that the linear density is higher at the centrethan at the tip end.
5.3 Standard Fineness
The standard fineness, Hs, is defined as the average linear density which would have beenmeasured if the sample had an average value of maturity ratio equal to unity.
Hs = H / M [7]
Variations in the Standard Fineness are independent of maturity and reflect correspondingvariations in average fibre perimeter. Thus, Hs is a measure of the intrinsic or biologicalfineness.
CottonFibreT estingT rainingCourse P aper2
© 1991 CottonT echnology International P aper2 /10
6. MICRONAIRE
6.1 Definition
Micronaire is derived from the rate of flow of air which will be measured when a specimen of agiven mass is confined within a chamber of given volume and subjected to a given pressuredrop across the specimen. The mass, volume, and pressure drop are those provided in any ofthe available micronaire test instruments.
The micronaire unit is an arbitrary one, having limited physical meaning of itself. Originally, theunit was thought to be one of fineness in micrograms per inch. However, the micronaire scalehad been set up by regression calibration of an airflow instrument against a series of cottons ofa single species, i.e. cottons having very similar intrinsic fineness. Later experience showedthat the micronaire value is in fact a measure of specific surface area which is a function of theproduct of fineness and maturity.
6.2 Measurement
Measurement of the micronaire value is straightforward and needs no special comment.However, it is useful to consider the basic theory of air permeability of fibre samples as this hasa direct bearing on the use of the IIC-Shirley Fineness and Maturity Tester (FMT).
This theoretical background has been described in detail by Lord but his textbook is now out ofprint. The following is a summary.
According to Lord, the basic law of flow by a fluid through a porous medium is summarised bythe following equation.
Q = K . AP / L
where Q is the rate of flowA is the cross-sectional area of the specimenL is the length of the specimenP is the pressure difference
Poiseuille’s law for laminar flow through a smooth circular tube is taken to be a particular casewhich takes the form
Q = 0.125 R2 A P / μL
where R is the tube radiusμ is the viscosity of the fluid
This has been extended to non-circular channels, giving
Q = 1 / Ko . M2 A P / μL [8]
where M is the ratio between the cross-sectional area normal to the flow and the totalperimeter presented to the flow.
The factor Ko is said to vary between 2 and 3 for a wide range of shapes of section.
For a bed of particles, the assumption has been made that this is equivalent to a group of paralleland similar channels whose total internal surface and total internal volume are respectively equalto the particle surfaces and pore volume.
CottonFibreT estingT rainingCourse P aper2
© 1991 CottonT echnology International P aper2 /11
Assuming that the particles are held in a container of length L and section area A, and that
So is the specific particle surface, i.e. surface area per unit volume of material
E is the porosity, i.e. the proportion of space not occupied by the material
then M = volume of fluid in the channelssurface area presented to fluid
i.e. M = E___So (1-E)
Furthermore, since the total cross-sectional area of the channels is A.E, it follows that equation[8] may be transformed into
Q = 1 / Ko . A P / So2μL . E3 / (1-E)2 [9]
A correction to equation [9] is required to take account of the tortuosity of the channels. If Le isthe equivalent average increased path length, then this leads to
Q = 1 / K . A P / So2μL . E3/ (1-E)2 [10]
where K = Ko (Le / L)2
For various systems, Ko has been found to vary between 2 and 3, and K between 4 and 5 butin practice the value of the correction factors K or Ko has to be determined experimentally for agiven system.
For plugs of fibres in a micronaire type apparatus, Lord found that K depends on the type of fibreand on the porosity (density of packing of the specimen).
After experimenting with a range of fibre types, Lord deduced the following modification toequation [10]
Q = 0.903 . A P / So2μL . E5/(1-E)α [11]
Where α is a factor which depends on the fibre type. For cotton it is about 1.4.
Equation [11] may thus be regarded as the practical expression of the laws governing air flow inan instrument of the micronaire type. Note that it is very sensitive to variations in E, the porosity,which depends on the dimensions of the chamber. Thus, it is necessary to calibrate a givenapparatus very carefully.
In the case of a specific micronaire instrument, used for a single type of fibre, the mass of thesample, the dimensional parameters, and the viscosity of the fluid are held constant so that therate of flow through the plug will be inversely proportional to the square of the specific surface,So. Therefore,
Q = I / So2 [12]
where I is the instrument calibration constant
CottonFibreT estingT rainingCourse P aper2
© 1991 CottonT echnology International P aper2 /12
For cotton, the relationship between specific surface, fineness and maturity is of the followingform.
So = S / V [13]
and S = 3.79 / √ (MH) [14]
where H is the linear densityM is the maturity ratioS is the surface area per gramV is the specific volume of fibre and enclosed lumen
The specific volume of cotton probably varies somewhat with variety and growing conditions buta good average value is about 0.75 which leads us to
So2 = 25.5 / MH [15]
Therefore, the rate of flow of air through a plug of cotton should be directly proportional to theproduct of fineness and maturity. In practice, the micronaire instrument is calibrated accordingto the arbitrary micronaire scale. The relationship which Lord found between micronaire valueand MH was the following.
MH = 3.86 X2 + 18.16 X + 13.0 [16]
where X is the micronaire value.
7. IIC-Shirley Fineness & Maturity Tester (FMT)
During the 1950's and 60's several workers had shown that if an airflow instrument was adaptedto provide two readings on a specimen, at different levels of compression (i.e. at two differentspecimen volumes) then the difference in the two airflow readings could be related to theaverage maturity of the specimen. Several commercial test instruments were developed toexploit this finding, the best known of which was the Arealometer.
During the 1960's this type of research was pursued further by the International Institute forCotton in collaboration with the Shirley Institute with the twin objectives of:
a) discovering which test conditions would give the best test accuracy consistent withease of operation, and
b) finding a test procedure which could yield unbiassed estimates of both fineness andmaturity.
The result of this research was the eventual development of the FMT instrument.
It was found that better accuracy could be obtained by measuring the pressure drop at constantflow, rather than flow at constant pressure drop (as in the micronaire instrument). In the FMT,the specimen mass is 4.0 g and the pressure drop is measured at two levels of specimencompression. The specimen density for the first pressure measurement is about 0.2 g/ml andthe airflow is 4.0 litres/min. These conditions are similar to those of a micronaire test so thereading for pressure drop, PL, at low specimen density is highly correlated with the micronairevalue.
CottonFibreT estingT rainingCourse P aper2
© 1991 CottonT echnology International P aper2 /13
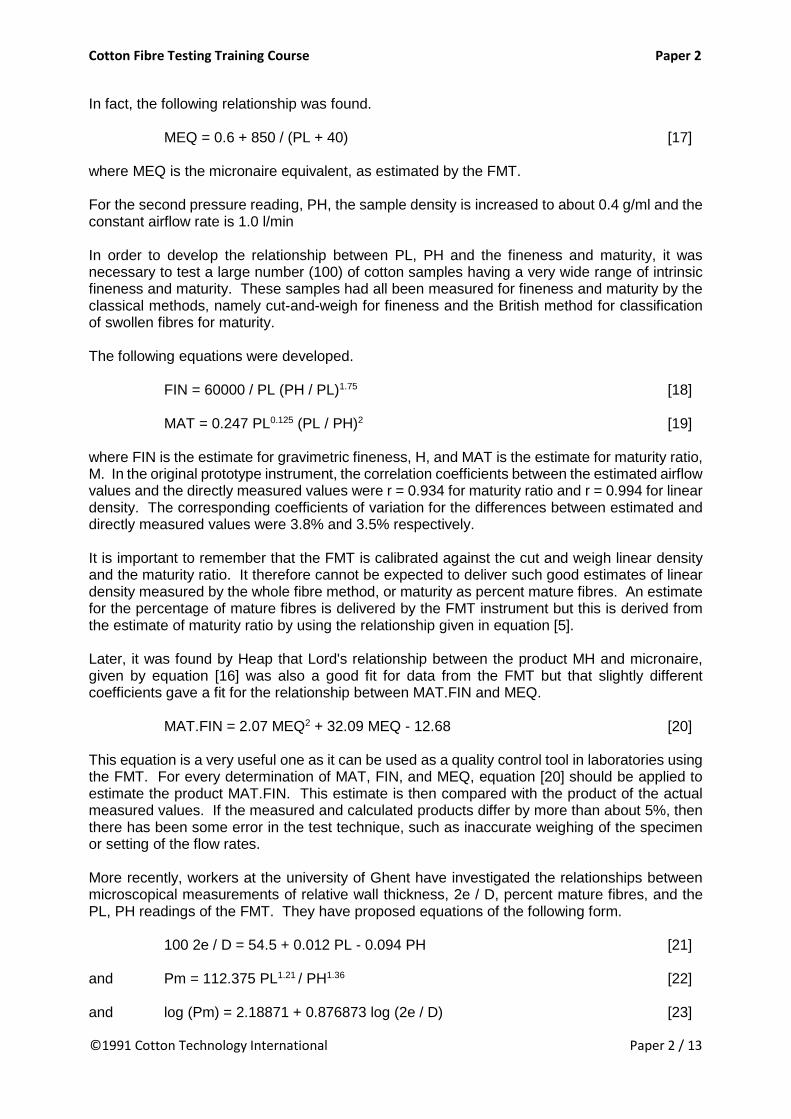
In fact, the following relationship was found.
MEQ = 0.6 + 850 / (PL + 40) [17]
where MEQ is the micronaire equivalent, as estimated by the FMT.
For the second pressure reading, PH, the sample density is increased to about 0.4 g/ml and theconstant airflow rate is 1.0 l/min
In order to develop the relationship between PL, PH and the fineness and maturity, it wasnecessary to test a large number (100) of cotton samples having a very wide range of intrinsicfineness and maturity. These samples had all been measured for fineness and maturity by theclassical methods, namely cut-and-weigh for fineness and the British method for classificationof swollen fibres for maturity.
The following equations were developed.
FIN = 60000 / PL (PH / PL)1.75 [18]
MAT = 0.247 PL0.125 (PL / PH)2 [19]
where FIN is the estimate for gravimetric fineness, H, and MAT is the estimate for maturity ratio,M. In the original prototype instrument, the correlation coefficients between the estimated airflowvalues and the directly measured values were r = 0.934 for maturity ratio and r = 0.994 for lineardensity. The corresponding coefficients of variation for the differences between estimated anddirectly measured values were 3.8% and 3.5% respectively.
It is important to remember that the FMT is calibrated against the cut and weigh linear densityand the maturity ratio. It therefore cannot be expected to deliver such good estimates of lineardensity measured by the whole fibre method, or maturity as percent mature fibres. An estimatefor the percentage of mature fibres is delivered by the FMT instrument but this is derived fromthe estimate of maturity ratio by using the relationship given in equation [5].
Later, it was found by Heap that Lord's relationship between the product MH and micronaire,given by equation [16] was also a good fit for data from the FMT but that slightly differentcoefficients gave a fit for the relationship between MAT.FIN and MEQ.
MAT.FIN = 2.07 MEQ2 + 32.09 MEQ - 12.68 [20]
This equation is a very useful one as it can be used as a quality control tool in laboratories usingthe FMT. For every determination of MAT, FIN, and MEQ, equation [20] should be applied toestimate the product MAT.FIN. This estimate is then compared with the product of the actualmeasured values. If the measured and calculated products differ by more than about 5%, thenthere has been some error in the test technique, such as inaccurate weighing of the specimenor setting of the flow rates.
More recently, workers at the university of Ghent have investigated the relationships betweenmicroscopical measurements of relative wall thickness, 2e / D, percent mature fibres, and thePL, PH readings of the FMT. They have proposed equations of the following form.
100 2e / D = 54.5 + 0.012 PL - 0.094 PH [21]
and Pm = 112.375 PL1.21 / PH1.36 [22]
and log (Pm) = 2.18871 + 0.876873 log (2e / D) [23]
CottonFibreT estingT rainingCourse P aper2
© 1991 CottonT echnology International P aper2 /14
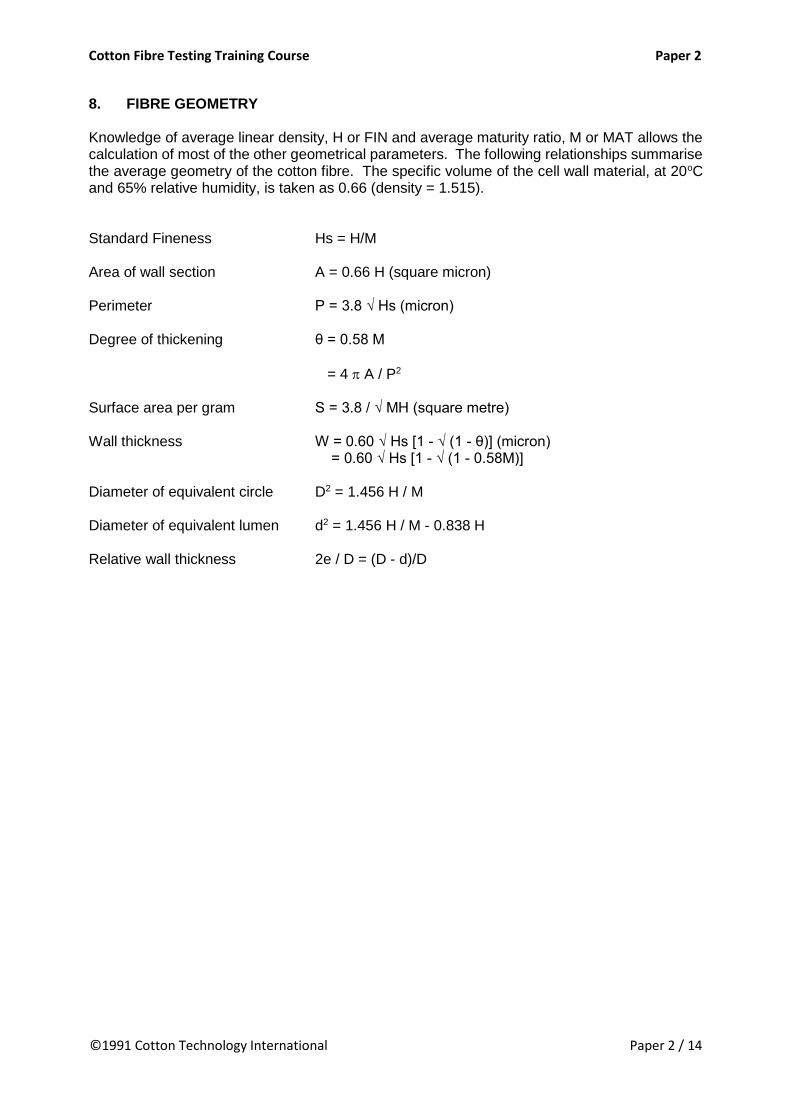
8. FIBRE GEOMETRY
Knowledge of average linear density, H or FIN and average maturity ratio, M or MAT allows thecalculation of most of the other geometrical parameters. The following relationships summarisethe average geometry of the cotton fibre. The specific volume of the cell wall material, at 20oCand 65% relative humidity, is taken as 0.66 (density = 1.515).
Standard Fineness Hs = H/M
Area of wall section A = 0.66 H (square micron)
Perimeter P = 3.8 √ Hs (micron)
Degree of thickening θ = 0.58 M
= 4 A / P2
Surface area per gram S = 3.8 / √ MH (square metre)
Wall thickness W = 0.60 √ Hs [1 - √ (1 - θ)] (micron) = 0.60 √ Hs [1 - √ (1 - 0.58M)]
Diameter of equivalent circle D2 = 1.456 H / M
Diameter of equivalent lumen d2 = 1.456 H / M - 0.838 H
Relative wall thickness 2e / D = (D - d)/D
CottonFibreT estingT rainingCourse P aper3
© 1991 CottonT echnology International P aper3 /1
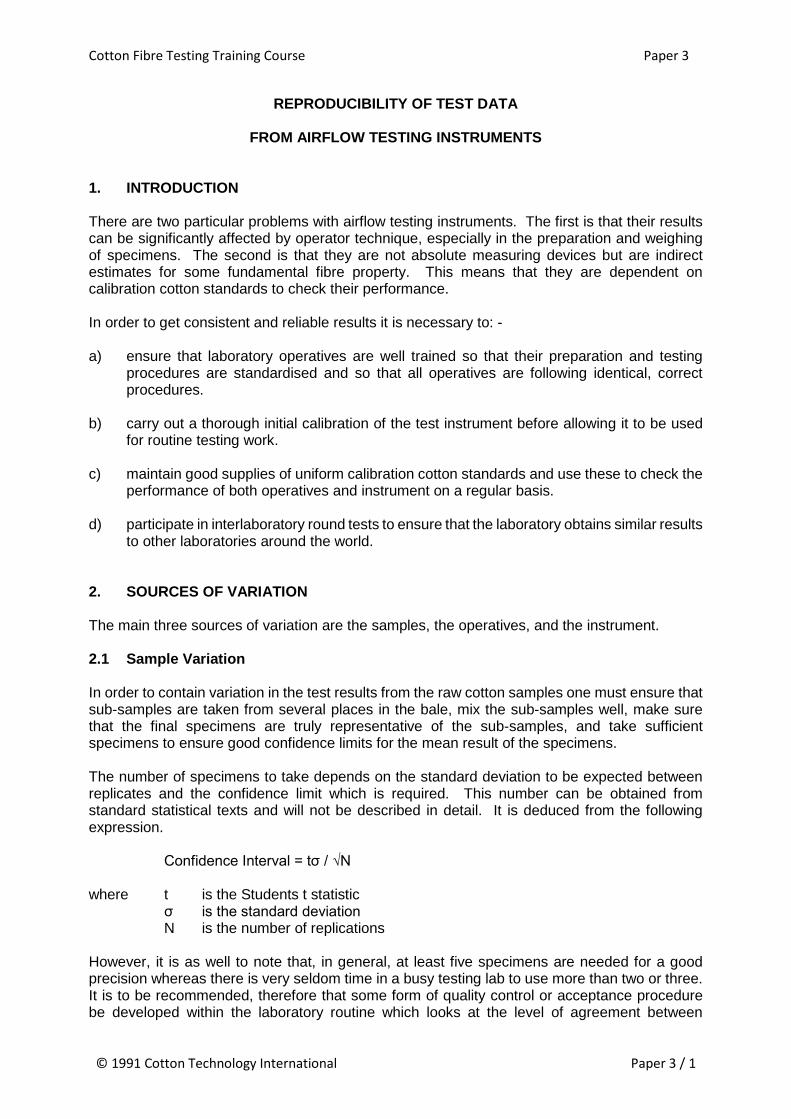
REPRODUCIBILITY OF TEST DATA
FROM AIRFLOW TESTING INSTRUMENTS
1. INTRODUCTION
There are two particular problems with airflow testing instruments. The first is that their resultscan be significantly affected by operator technique, especially in the preparation and weighingof specimens. The second is that they are not absolute measuring devices but are indirectestimates for some fundamental fibre property. This means that they are dependent oncalibration cotton standards to check their performance.
In order to get consistent and reliable results it is necessary to: -
a) ensure that laboratory operatives are well trained so that their preparation and testingprocedures are standardised and so that all operatives are following identical, correctprocedures.
b) carry out a thorough initial calibration of the test instrument before allowing it to be usedfor routine testing work.
c) maintain good supplies of uniform calibration cotton standards and use these to check theperformance of both operatives and instrument on a regular basis.
d) participate in interlaboratory round tests to ensure that the laboratory obtains similar resultsto other laboratories around the world.
2. SOURCES OF VARIATION
The main three sources of variation are the samples, the operatives, and the instrument.
2.1 Sample Variation
In order to contain variation in the test results from the raw cotton samples one must ensure thatsub-samples are taken from several places in the bale, mix the sub-samples well, make surethat the final specimens are truly representative of the sub-samples, and take sufficientspecimens to ensure good confidence limits for the mean result of the specimens.
The number of specimens to take depends on the standard deviation to be expected betweenreplicates and the confidence limit which is required. This number can be obtained fromstandard statistical texts and will not be described in detail. It is deduced from the followingexpression.
Confidence Interval = tσ / √N
where t is the Students t statistic σ is the standard deviation N is the number of replications
However, it is as well to note that, in general, at least five specimens are needed for a goodprecision whereas there is very seldom time in a busy testing lab to use more than two or three.It is to be recommended, therefore that some form of quality control or acceptance procedurebe developed within the laboratory routine which looks at the level of agreement between

CottonFibreT estingT rainingCourse P aper3
© 1991 CottonT echnology International P aper3 /2
replicate specimens and makes a decision to select further specimens for testing if theagreement is not good enough.
2.2 Operative Variation
Variation due to the operative is caused by use of incorrect or variable procedures, inadequateattention to detail, and inaccurate weighing. Operatives must be thoroughly trained in the correctprocedures and especially in the proper use of balances. Often the proper procedures are notwell defined in the manuals which are provided by instrument manufacturers. In this case (orindeed in any case) it is recommended that;
1. Firstly, the laboratory manager, or chief technician, should visit a competent laboratory whichis very experienced in using the instrument. He should receive training there and spend timeactually operating the instrument. If possible, he should obtain a copy of the standard methodof test used by that laboratory and study the way that they carry out calibrations.
2. Secondly, he should carry out preliminary training of his own laboratory staff according towhat he has learned.
3. Thirdly, he should write out a standard procedure for use with the instrument in his ownlaboratory, taking note of any lessons learned during the preliminary training phase.
4. Fourthly, the practical method and the written test procedure should be reviewed after someexperience has been gained by the operatives in testing a range of samples specially selectedfor this training phase. These samples should be available in sufficiently large quantity tocarry out the entire training programme. They should not be standard calibration cottons.Special attention should be paid to standardising procedures exactly and making sure thateach stage is written down fully, exactly and unambiguously so that it is capable of only oneinterpretation.
5. Fifthly, each operative should be issued with a copy of the standard procedure so that it canbe referred to at any time.
6. Finally, a further series of tests should be carried out in which each operator tests the samesamples several times in a blind test, to ensure that all operators are achieving the sameresults (according to a selected statistical test criterion).
If consistent results are not being obtained between operators, then an investigation should belaunched to try to discover the source of the discrepancies and to take corrective action whetherthis is by additional training or by further refinement of the standard procedure.
2.3 Instrument Variation
Variation between airflow instruments is due to the fact that the result of an airflow test isextremely sensitive to the exact dimensions of the test chamber. Within the normalmanufacturing tolerances (i.e. at reasonable cost) for these instruments, it is not possible to buildevery machine exactly the same. There is also a small effect due to the local gravitation constantand to atmospheric temperature and pressure. This means that, ideally, every instrument shouldbe thoroughly calibrated in the place where it is to be used.
In principle this is done by comparing the results actually recorded by the instrument for a rangeof calibration cottons compared to the average values which have been specified as the "true"values for those cottons. The calibration cottons used are the International Calibration CottonStandards (ICCS) which are supplied by the USDA. These calibration standards are supplied
CottonFibreT estingT rainingCourse P aper3
© 1991 CottonT echnology International P aper3 /3
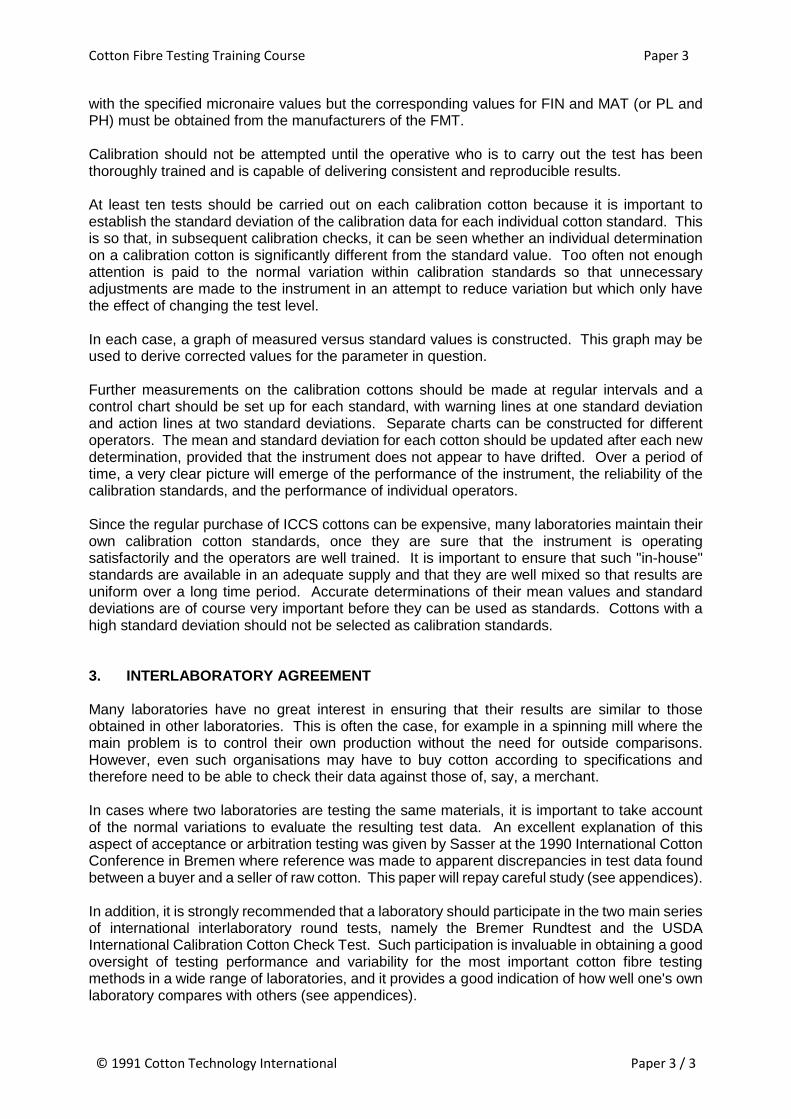
with the specified micronaire values but the corresponding values for FIN and MAT (or PL andPH) must be obtained from the manufacturers of the FMT.
Calibration should not be attempted until the operative who is to carry out the test has beenthoroughly trained and is capable of delivering consistent and reproducible results.
At least ten tests should be carried out on each calibration cotton because it is important toestablish the standard deviation of the calibration data for each individual cotton standard. Thisis so that, in subsequent calibration checks, it can be seen whether an individual determinationon a calibration cotton is significantly different from the standard value. Too often not enoughattention is paid to the normal variation within calibration standards so that unnecessaryadjustments are made to the instrument in an attempt to reduce variation but which only havethe effect of changing the test level.
In each case, a graph of measured versus standard values is constructed. This graph may beused to derive corrected values for the parameter in question.
Further measurements on the calibration cottons should be made at regular intervals and acontrol chart should be set up for each standard, with warning lines at one standard deviationand action lines at two standard deviations. Separate charts can be constructed for differentoperators. The mean and standard deviation for each cotton should be updated after each newdetermination, provided that the instrument does not appear to have drifted. Over a period oftime, a very clear picture will emerge of the performance of the instrument, the reliability of thecalibration standards, and the performance of individual operators.
Since the regular purchase of ICCS cottons can be expensive, many laboratories maintain theirown calibration cotton standards, once they are sure that the instrument is operatingsatisfactorily and the operators are well trained. It is important to ensure that such "in-house"standards are available in an adequate supply and that they are well mixed so that results areuniform over a long time period. Accurate determinations of their mean values and standarddeviations are of course very important before they can be used as standards. Cottons with ahigh standard deviation should not be selected as calibration standards.
3. INTERLABORATORY AGREEMENT
Many laboratories have no great interest in ensuring that their results are similar to thoseobtained in other laboratories. This is often the case, for example in a spinning mill where themain problem is to control their own production without the need for outside comparisons.However, even such organisations may have to buy cotton according to specifications andtherefore need to be able to check their data against those of, say, a merchant.
In cases where two laboratories are testing the same materials, it is important to take accountof the normal variations to evaluate the resulting test data. An excellent explanation of thisaspect of acceptance or arbitration testing was given by Sasser at the 1990 International CottonConference in Bremen where reference was made to apparent discrepancies in test data foundbetween a buyer and a seller of raw cotton. This paper will repay careful study (see appendices).
In addition, it is strongly recommended that a laboratory should participate in the two main seriesof international interlaboratory round tests, namely the Bremer Rundtest and the USDAInternational Calibration Cotton Check Test. Such participation is invaluable in obtaining a goodoversight of testing performance and variability for the most important cotton fibre testingmethods in a wide range of laboratories, and it provides a good indication of how well one's ownlaboratory compares with others (see appendices).
CottonFibreT estingT rainingCourse P aper3
© 1991 CottonT echnology International P aper3 /4
If the laboratory is able to participate in research and development, or standardisation work, andis also able to send a delegate to attend the International Cotton Test Conference every twoyears in Bremen, then a senior representative should apply for membership of the ITMFInternational Committee on Cotton Testing.
This committee meets every two years, at the same time as the International Cotton Conference.It discusses the standardisation of cotton testing methods and carries out research work toestablish the reliability of particular instruments and procedures. At present, the committee hasfive working groups, namely Maturity, Honeydew, Length, Dust & Trash, and HVI testing. Thecommittee comprises delegates from the most important cotton testing and research laboratoriesin the world.