Embed Size (px)
Citation preview

The views expressed are those of the author and should not be attributed to the Economic Research Service or USDA.
COTTON MARKET PROJECTIONS: AGLINK/COSIMO 2013-22 Stephen MacDonald, USDA/ERS
September 20, 2013
Cotton in Aglink-Cosimo: Model expanded to include cotton in 2013
• Cotton is primarily Gossypium hirsutum (“upland”)
• Data in terms of fiber
• Model simplifications: – Competition among fibers is not explicit
– Common template for several country models
– Shocks to other commodities affect cotton, but in Aglink cotton does not affect other commodities • World cotton output: 3 percent grains & oilseed value
World cotton market: Current situation and outlook for 2013/14
• Cotton recovering from price 2010 shock
• Stocks rising rapidly in China
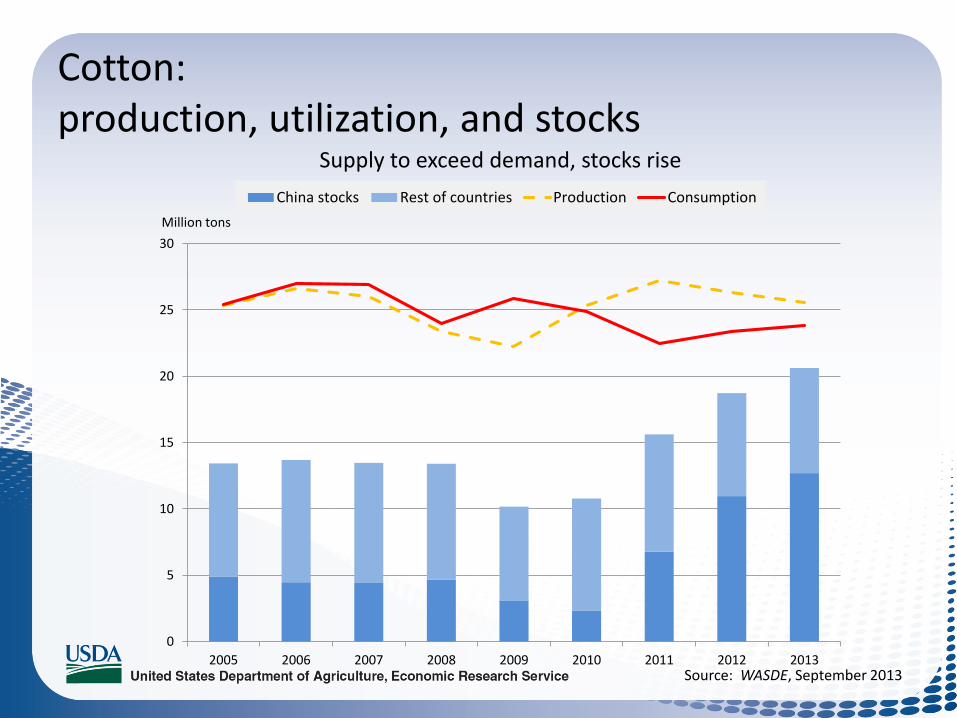
Cotton: production, utilization, and stocks
Supply to exceed demand, stocks rise
Source: WASDE, September 2013
0
5
10
15
20
25
30
2005 2006 2007 2008 2009 2010 2011 2012 2013
China stocks Rest of countries Production Consumption
Million tons
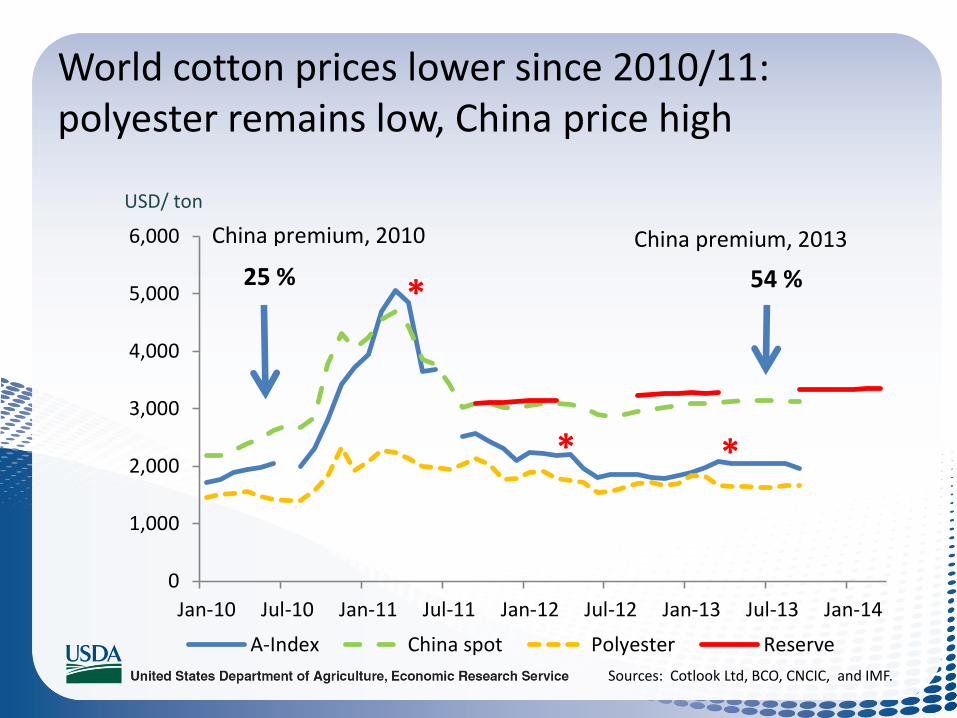
World cotton prices lower since 2010/11: polyester remains low, China price high
Sources: Cotlook Ltd, BCO, CNCIC, and IMF.
USD/ ton
0
1,000
2,000
3,000
4,000
5,000
6,000
Jan-10 Jul-10 Jan-11 Jul-11 Jan-12 Jul-12 Jan-13 Jul-13 Jan-14
A-Index China spot Polyester Reserve
*
* *
54 %25 %
China premium, 2010 China premium, 2013

World cotton market: outlook for 2022/23
• Consumption eventually surpasses pre-crisis
• India replacing China
• India and China reduced role in fiber trade
• Cotton prices low vis-a-vis grains, oilseeds

Cotton world price and consumption: China & India dominate consumption
0
500
1000
1500
2000
2500
3000
3500
0
5
10
15
20
25
30
2003 2005 2007 2009 2011 2013 2015 2017 2019 2021
USD/ton Million tons
Marketing year
China India Pakistan Rest of countries Nominal price Real price
Source: OECD, June 2013
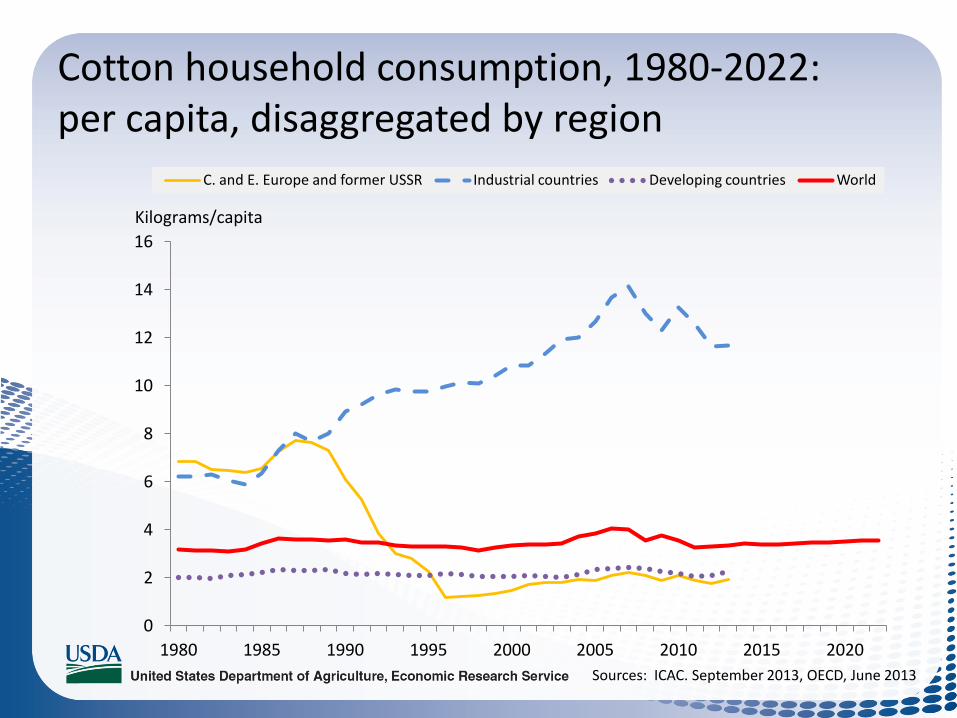
Cotton household consumption, 1980-2022: per capita, disaggregated by region
Sources: ICAC. September 2013, OECD, June 2013
0
2
4
6
8
10
12
14
16
1980 1985 1990 1995 2000 2005 2010 2015 2020
C. and E. Europe and former USSR Industrial countries Developing countries World
Kilograms/capita
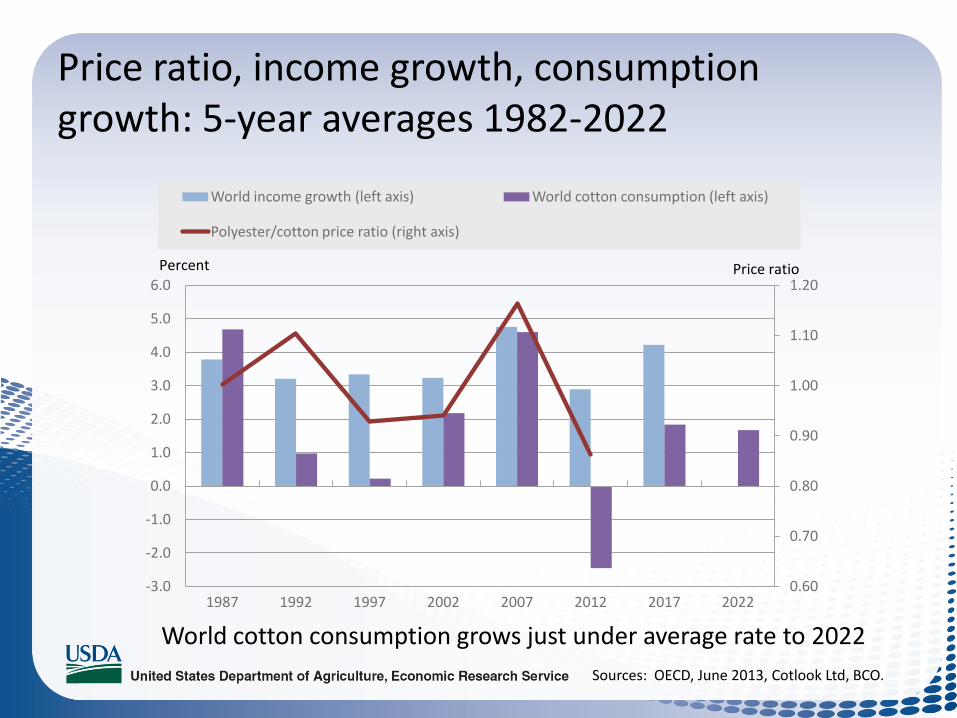
Price ratio, income growth, consumption growth: 5-year averages 1982-2022
0.60
0.70
0.80
0.90
1.00
1.10
1.20
-3.0
-2.0
-1.0
0.0
1.0
2.0
3.0
4.0
5.0
6.0
1987 1992 1997 2002 2007 2012 2017 2022
Thousand tonnes
World income growth (left axis) World cotton consumption (left axis)
Polyester/cotton price ratio (right axis)
Price ratio Percent
World cotton consumption grows just under average rate to 2022
Sources: OECD, June 2013, Cotlook Ltd, BCO.
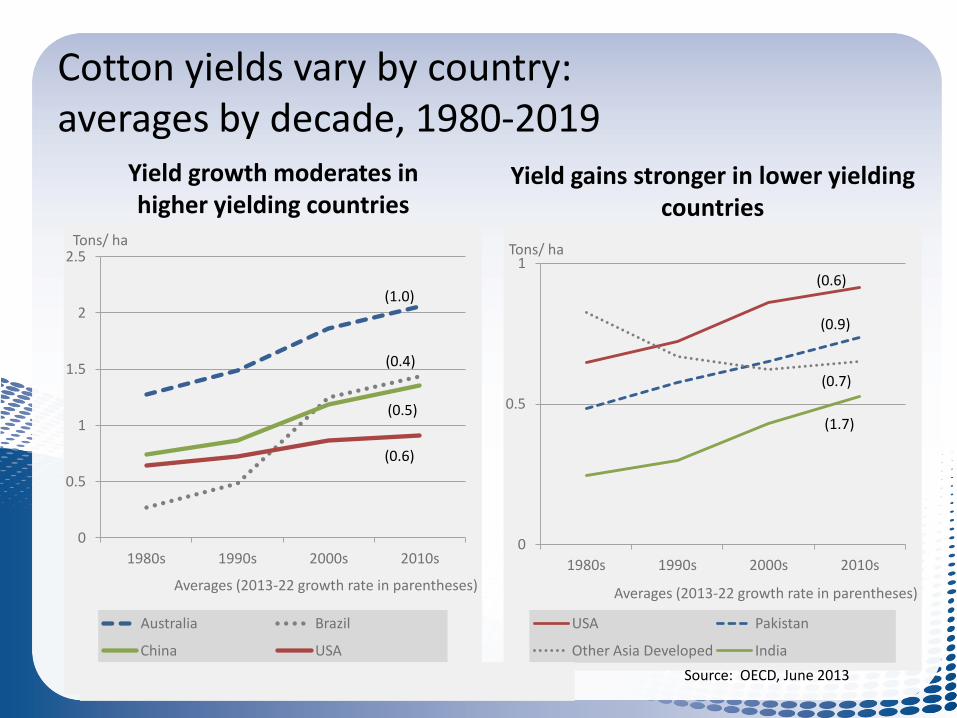
Cotton yields vary by country: averages by decade, 1980-2019
0
0.5
1
1.5
2
2.5
1980s 1990s 2000s 2010s
Tons/ ha
Averages (2013-22 growth rate in parentheses)
Australia Brazil
China USA
(0.4)
(0.5)
(0.6)
(1.0)
0
0.5
1
1980s 1990s 2000s 2010s
Tons/ ha
Averages (2013-22 growth rate in parentheses)
USA Pakistan
Other Asia Developed India
(0.6)
(0.9)
(0.7)
(1.7)
Yield growth moderates in higher yielding countries
Yield gains stronger in lower yielding countries
Source: OECD, June 2013
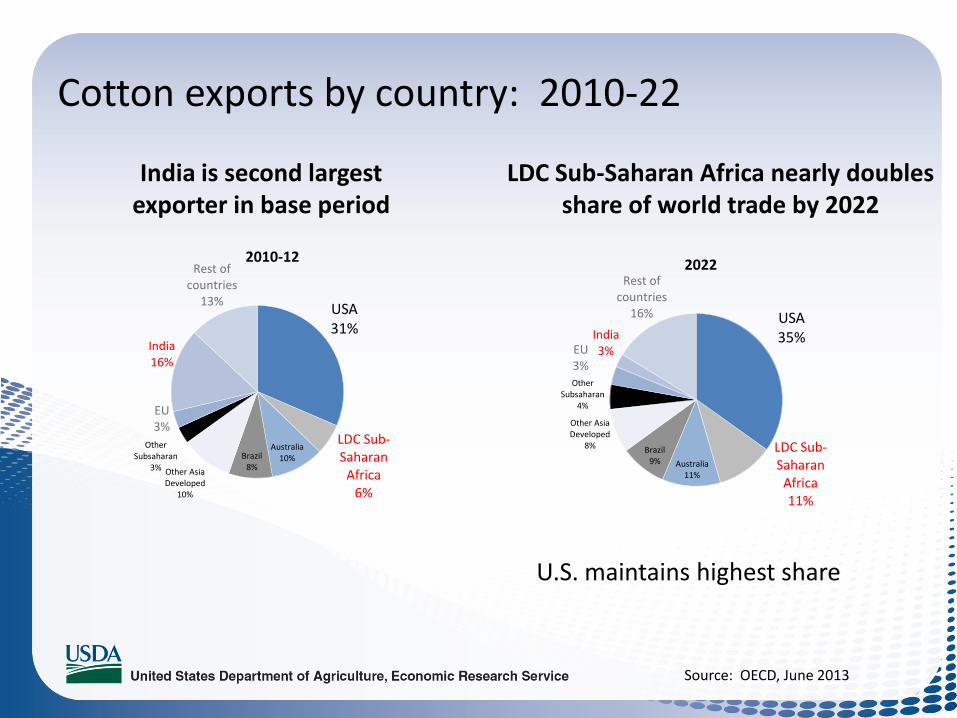
Cotton exports by country: 2010-22
USA 31%
LDC Sub-Saharan
Africa 6%
Australia 10% Brazil
8% Other Asia Developed
10%
Other Subsaharan
3%
EU 3%
India 16%
Rest of countries
13%
2010-12
USA 35%
LDC Sub-Saharan
Africa 11%
Australia 11%
Brazil 9%
Other Asia Developed
8%
Other Subsaharan
4%
EU 3%
India 3%
Rest of countries
16%
2022
India is second largest exporter in base period
LDC Sub-Saharan Africa nearly doubles share of world trade by 2022
U.S. maintains highest share
Source: OECD, June 2013

Cotton imports by country: 2010-22
China 41%
Bangladesh 9%
Turkey 8%
Vietnam 4%
Pakistan 4%
Indonesia 5%
Mexico 3%
Korea 3%
Rest of countries
23%
2010-12
China 21%
Bangladesh 15%
Turkey 14%
Vietnam 8% Pakistan
6%
Indonesia 6%
Mexico 4%
Korea 4%
Rest of countries
22%
2022
China dominates importers in base period
Bangladesh nearly doubles share of world trade by 2022
China remains largest importer
Source: OECD, June 2013

Cotton price relative to other crop prices: downward shift evident after 2000
Cotton prices remain low relative to competing crops
Source: OECD, June 2013
0
20
40
60
80
100
120
140
160
1970 1975 1980 1985 1990 1995 2000 2005 2010 2015 2020 Marketing year
Soybeans Maize Wheat
Index: Average ratio during 1990s = 100
Cotton ratio to:

Cotton area relative to other crops: India shows strongest growth
0.4
0.6
0.8
1
1.2
1.4
1.6
2000 2005 2010 2015 2020 Marketing year
India China USA Pakistan
Index: 1995-99 average cotton share of cropland = 1.0
Cotton’s area share grows in India
Source: OECD, June 2013
Cotton world projections to 2022: Highlights
• Global consumption grows slightly below its long term rate
• India replaces China as world’s largest producer, almost as consumer
• Cotton prices remain low relative to other crops
• U.S. remains world’s largest exporter
• China remains largest importer, role diminished

Cotton world projections to 2022: Uncertainties
• Evolution of cotton policy in China
• Ability of India to continue to expand yields
• Technical change in man-made fibers
• Consumer taste for fibers

Additional information
AGLINK-COSIMO results: www.oecd.org/site/oecd-faoagriculturaloutlook/
USDA International Baseline: www.ers.usda.gov/data-products/international-baseline-
data.aspx
ERS Cotton data and analysis: www.ers.usda.gov/topics/crops/cotton-wool.aspx