Embed Size (px)
Citation preview
© 2
012
Car
negi
e Le
arni
ng
Chapter 10 Assignments 135
10
Lesson 10.1 Assignment
Name Date
Could You Participate in Our Survey?Interpreting Frequency Distributions
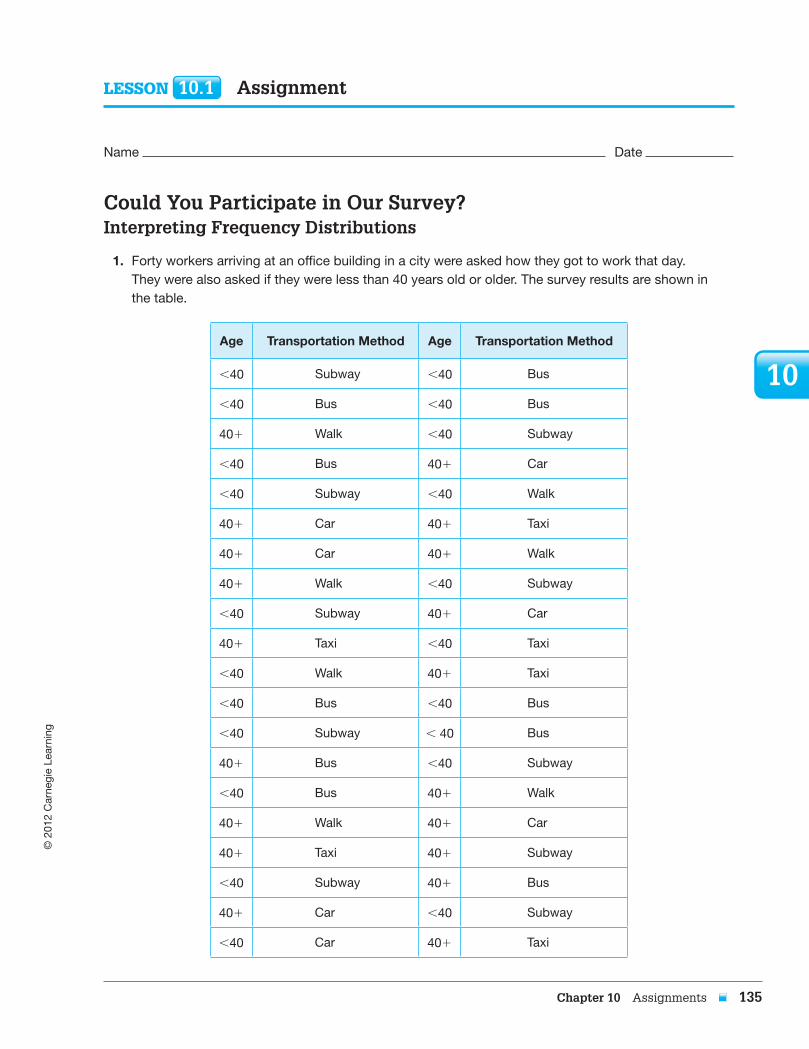
1. Forty workers arriving at an office building in a city were asked how they got to work that day. They were also asked if they were less than 40 years old or older. The survey results are shown in the table.
Age TransportationMethod Age TransportationMethod
,40 Subway ,40 Bus
,40 Bus ,40 Bus
401 Walk ,40 Subway
,40 Bus 401 Car
,40 Subway ,40 Walk
401 Car 401 Taxi
401 Car 401 Walk
401 Walk ,40 Subway
,40 Subway 401 Car
401 Taxi ,40 Taxi
,40 Walk 401 Taxi
,40 Bus ,40 Bus
,40 Subway , 40 Bus
401 Bus ,40 Subway
,40 Bus 401 Walk
401 Walk 401 Car
401 Taxi 401 Subway
,40 Subway 401 Bus
401 Car ,40 Subway
,40 Car 401 Taxi
8046_Assign_CH10_135-152.indd 135 4/14/12 1:34 PM
© 2
012
Car
negi
e Le
arni
ng
136 Chapter 10 Assignments
10
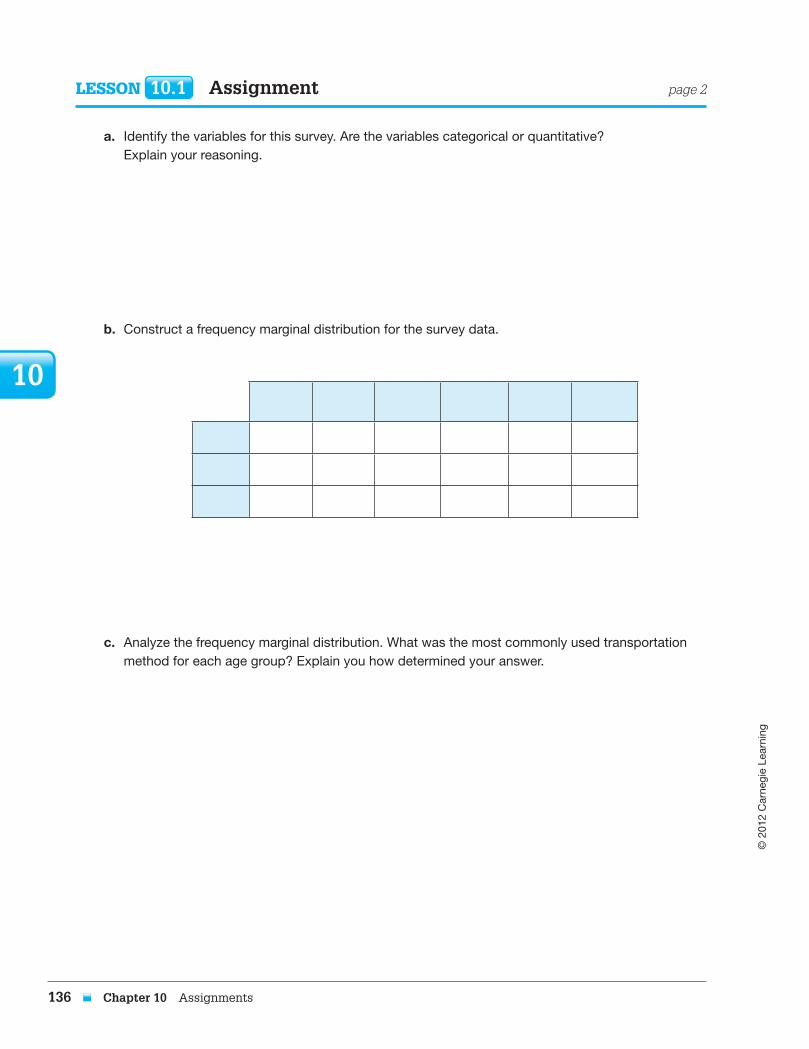
a. Identify the variables for this survey. Are the variables categorical or quantitative? Explain your reasoning.
b. Construct a frequency marginal distribution for the survey data.
c. Analyze the frequency marginal distribution. What was the most commonly used transportation method for each age group? Explain you how determined your answer.
Lesson 10.1 Assignment page 2
8046_Assign_CH10_135-152.indd 136 4/14/12 1:34 PM
© 2
012
Car
negi
e Le
arni
ng
Chapter 10 Assignments 137
10
Lesson 10.1 Assignment page 3
Name Date
d. Construct a double bar graph of the frequencies. Let the x-axis represent the transportation method, and let the y-axis represent the number of workers. What conclusion(s) can you draw by examining this graph?
x
y
8046_Assign_CH10_135-152.indd 137 4/14/12 1:34 PM
© 2
012
Car
negi
e Le
arni
ng
138 Chapter 10 Assignments
10
e. Construct a double bar graph of the frequencies. This time, let the x-axis represent the age levels. What conclusions can you draw by examining the graph?
x
y
f. The manager of a firm in the building where the survey was taken has noticed that a number of his employees have been coming in late. The late employees often say they are late because of subway problems, but he also notices it is mostly younger workers who are using this excuse. He thinks these employees may be irresponsible because most of his older employees are not coming in late. Which graph could be used to show the manager that his thinking may be wrong?
Lesson 10.1 Assignment page 4
8046_Assign_CH10_135-152.indd 138 4/14/12 1:34 PM
© 2
012
Car
negi
e Le
arni
ng
Chapter 10 Assignments 139
10
Lesson 10.2 Assignment
Name Date
It’s So Hot Outside!Relative Frequency Distribution
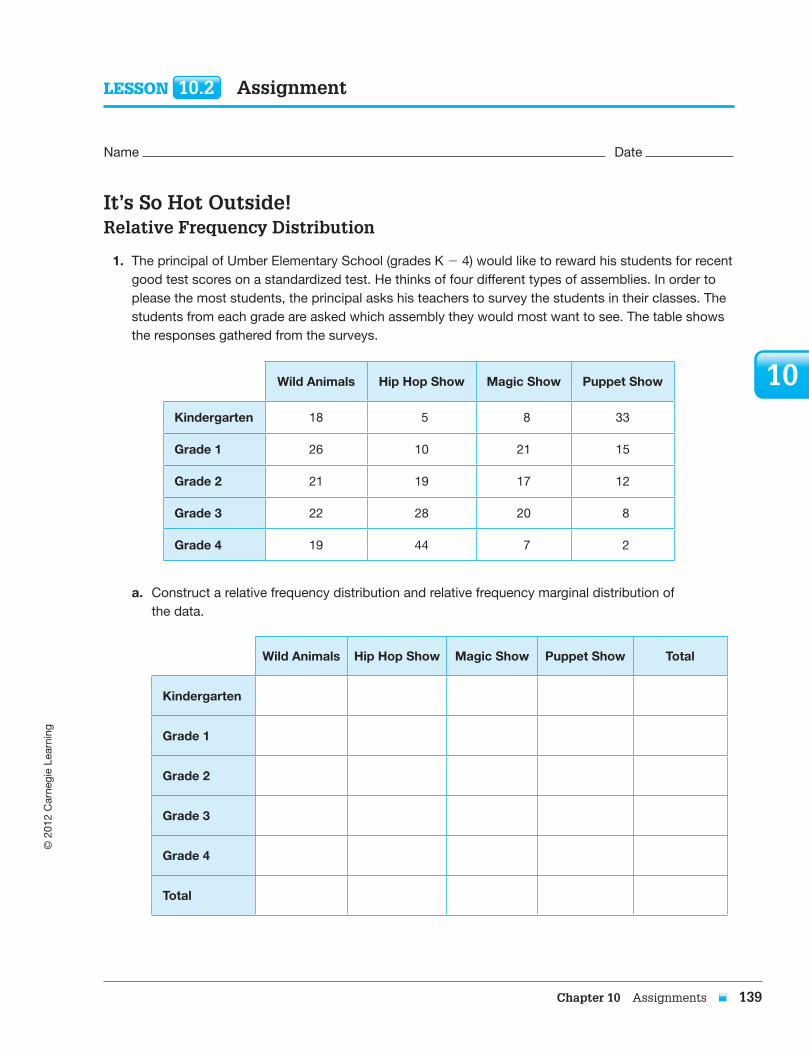
1. The principal of Umber Elementary School (grades K 2 4) would like to reward his students for recent good test scores on a standardized test. He thinks of four different types of assemblies. In order to please the most students, the principal asks his teachers to survey the students in their classes. The students from each grade are asked which assembly they would most want to see. The table shows the responses gathered from the surveys.
WildAnimals HipHopShow MagicShow PuppetShow
Kindergarten 18 5 8 33
Grade1 26 10 21 15
Grade2 21 19 17 12
Grade3 22 28 20 8
Grade4 19 44 7 2
a. Construct a relative frequency distribution and relative frequency marginal distribution of the data.
WildAnimals HipHopShow MagicShow PuppetShow Total
Kindergarten
Grade1
Grade2
Grade3
Grade4
Total
8046_Assign_CH10_135-152.indd 139 4/14/12 1:34 PM
© 2
012
Car
negi
e Le
arni
ng
140 Chapter 10 Assignments
10
Lesson 10.2 Assignment page 2
b. The principal wants to choose one assembly that he can show to all of the students. Construct a stacked bar graph of the relative frequency distribution. Then tell which assembly he should choose for the students. Explain how you determined your answer.
x
y
8046_Assign_CH10_135-152.indd 140 4/14/12 1:34 PM
© 2
012
Car
negi
e Le
arni
ng
Chapter 10 Assignments 141
10
Lesson 10.2 Assignment page 3
Name Date
c. The principal now thinks that each grade should get its own assembly. Construct a stacked back graph of the relative frequency distribution then tell which assembly should be shown to each grade. Explain how you determined your answer.
x
y
d. The principal has come up with an idea to hold a hip hop assembly for Grades 1 through 4 and a puppet show for Kindergarten. Do you think this is a good idea? Explain your reasoning.
8046_Assign_CH10_135-152.indd 141 4/14/12 1:34 PM
© 2
012
Car
negi
e Le
arni
ng
142 Chapter 10 Assignments
10
8046_Assign_CH10_135-152.indd 142 4/14/12 1:34 PM
© 2
012
Car
negi
e Le
arni
ng
Chapter 10 Assignments 143
10
She Blinded Me with Science!Relative Frequency Conditional Distribution
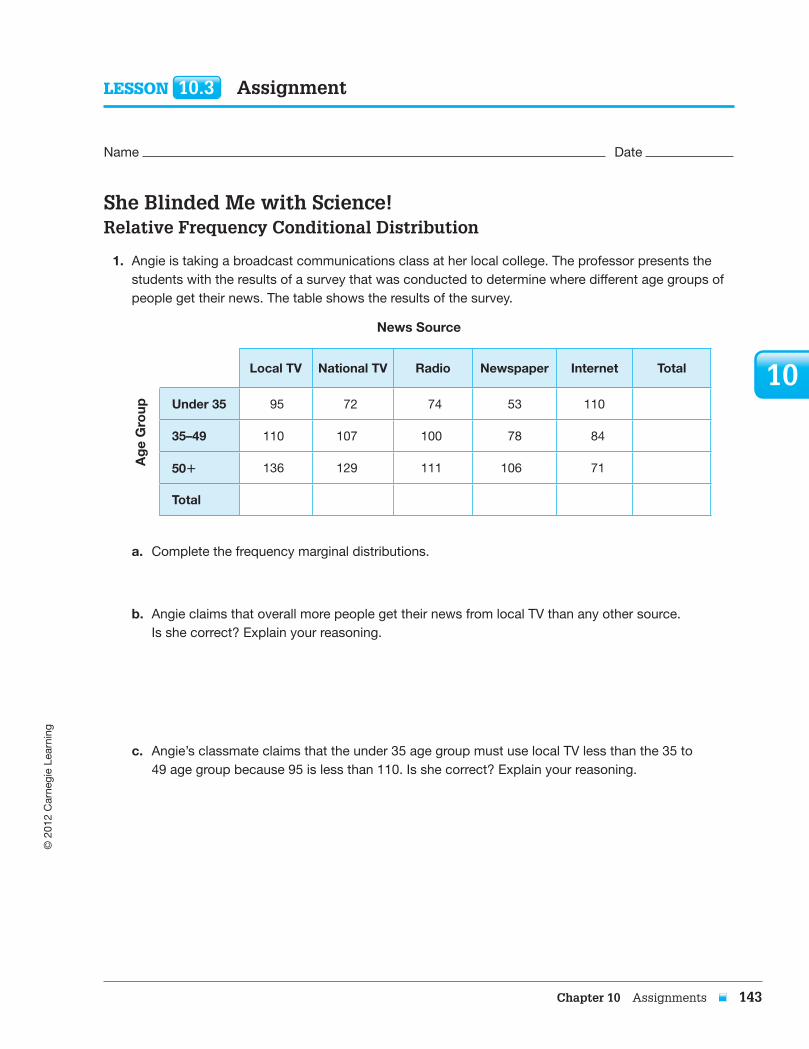
1. Angie is taking a broadcast communications class at her local college. The professor presents the students with the results of a survey that was conducted to determine where different age groups of people get their news. The table shows the results of the survey.
NewsSource
LocalTV NationalTV Radio Newspaper Internet Total
Under35 95 72 74 53 110
35–49 110 107 100 78 84
501 136 129 111 106 71
Total
a. Complete the frequency marginal distributions.
b. Angie claims that overall more people get their news from local TV than any other source. Is she correct? Explain your reasoning.
c. Angie’s classmate claims that the under 35 age group must use local TV less than the 35 to 49 age group because 95 is less than 110. Is she correct? Explain your reasoning.
Lesson 10.3 Assignment
Name Date A
ge
Gro
up
8046_Assign_CH10_135-152.indd 143 4/14/12 1:34 PM
© 2
012
Car
negi
e Le
arni
ng
144 Chapter 10 Assignments
10
Lesson 10.3 Assignment page 2
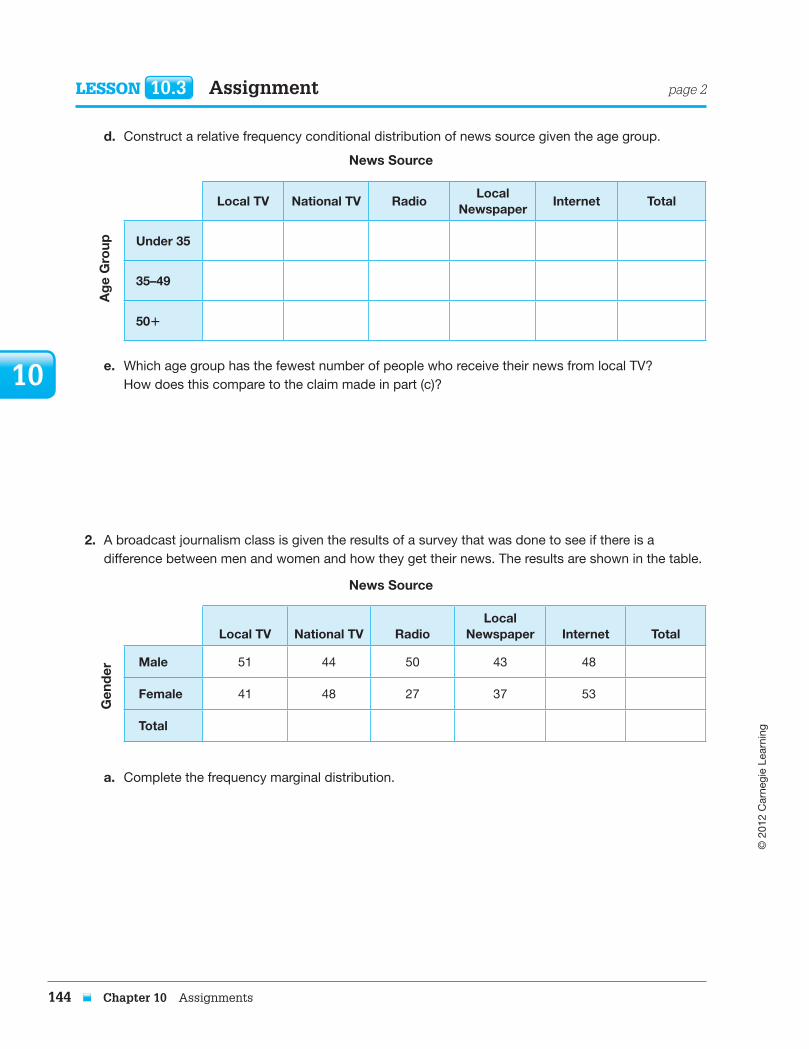
d. Construct a relative frequency conditional distribution of news source given the age group.
NewsSource
LocalTV NationalTV RadioLocal
NewspaperInternet Total
Under35
35–49
501
e. Which age group has the fewest number of people who receive their news from local TV? How does this compare to the claim made in part (c)?
2. A broadcast journalism class is given the results of a survey that was done to see if there is a difference between men and women and how they get their news. The results are shown in the table.
NewsSource
LocalTV
NationalTV
Radio
LocalNewspaper
Internet
Total
Male 51 44 50 43 48
Female 41 48 27 37 53
Total
a. Complete the frequency marginal distribution.
Ag
eG
roup
Gen
der
8046_Assign_CH10_135-152.indd 144 4/14/12 1:34 PM
© 2
012
Car
negi
e Le
arni
ng
Chapter 10 Assignments 145
10
Lesson 10.3 Assignment page 3
Name Date
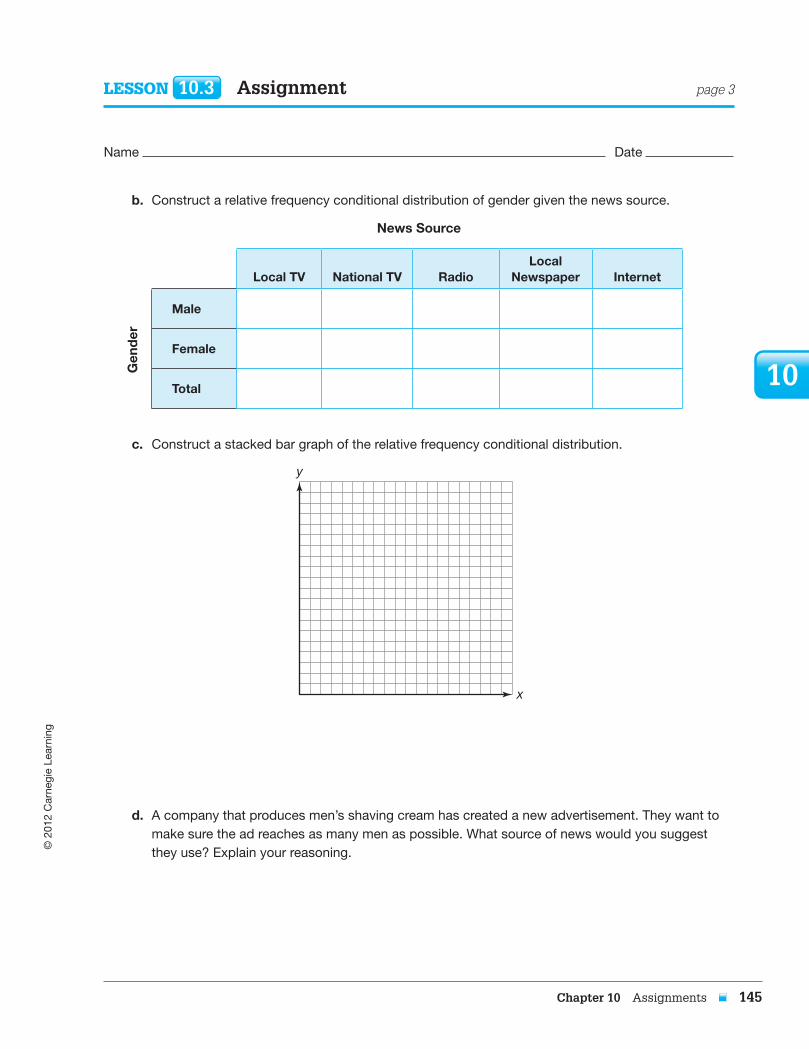
b. Construct a relative frequency conditional distribution of gender given the news source.
NewsSource
LocalTV
NationalTV
Radio
LocalNewspaper
Internet
Male
Female
Total
c. Construct a stacked bar graph of the relative frequency conditional distribution.
x
y
d. A company that produces men’s shaving cream has created a new advertisement. They want to make sure the ad reaches as many men as possible. What source of news would you suggest they use? Explain your reasoning.
Gen
der
8046_Assign_CH10_135-152.indd 145 4/14/12 1:35 PM

© 2
012
Car
negi
e Le
arni
ng
146 Chapter 10 Assignments
10
8046_Assign_CH10_135-152.indd 146 4/14/12 1:35 PM
© 2
012
Car
negi
e Le
arni
ng
Chapter 10 Assignments 147
10
Lesson 10.4 Assignment
Name Date
Oh! Switch the Station!Drawing Conclusions from Data
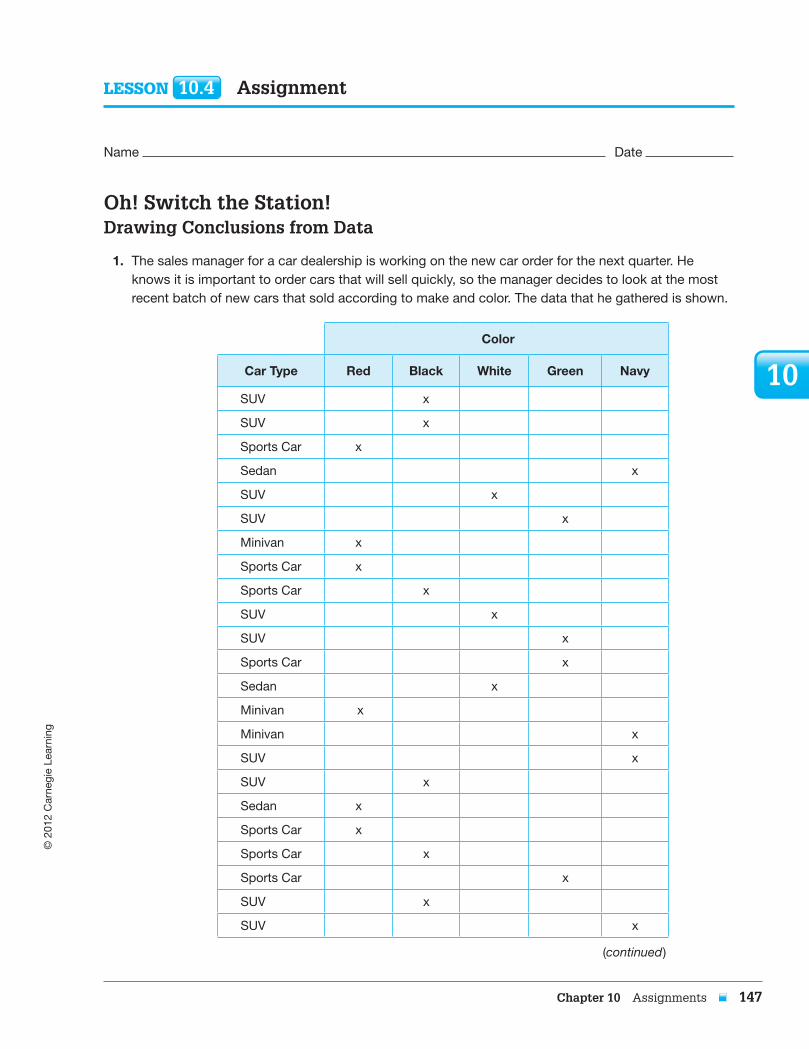
1. The sales manager for a car dealership is working on the new car order for the next quarter. He knows it is important to order cars that will sell quickly, so the manager decides to look at the most recent batch of new cars that sold according to make and color. The data that he gathered is shown.
Color
CarType Red Black White Green Navy
SUV x
SUV x
Sports Car x
Sedan x
SUV x
SUV x
Minivan x
Sports Car x
Sports Car x
SUV x
SUV x
Sports Car x
Sedan x
Minivan x
Minivan x
SUV x
SUV x
Sedan x
Sports Car x
Sports Car x
Sports Car x
SUV x
SUV x
(continued)
8046_Assign_CH10_135-152.indd 147 4/14/12 1:35 PM
© 2
012
Car
negi
e Le
arni
ng
148 Chapter 10 Assignments
10
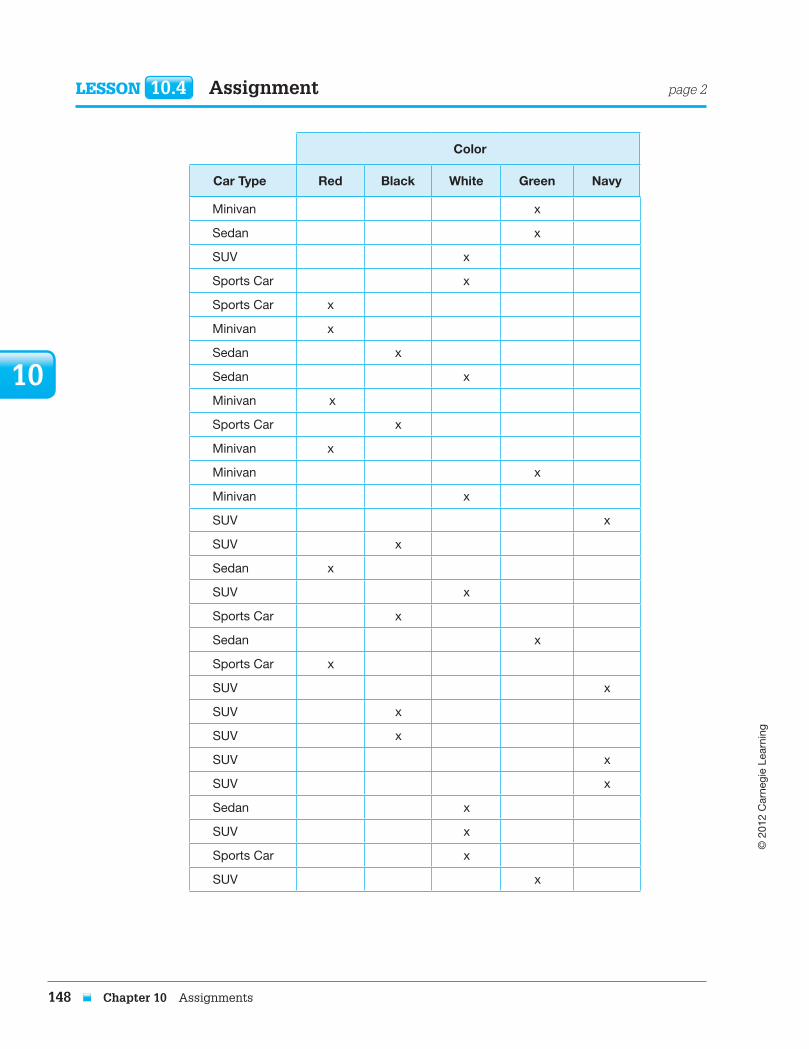
Lesson 10.4 Assignment page 2
Minivan x
Sedan x
SUV x
Sports Car x
Sports Car x
Minivan x
Sedan x
Sedan x
Minivan x
Sports Car x
Minivan x
Minivan x
Minivan x
SUV x
SUV x
Sedan x
SUV x
Sports Car x
Sedan x
Sports Car x
SUV x
SUV x
SUV x
SUV x
SUV x
Sedan x
SUV x
Sports Car x
SUV x
Color
CarType Red Black White Green Navy
8046_Assign_CH10_135-152.indd 148 4/14/12 1:35 PM
© 2
012
Car
negi
e Le
arni
ng
Chapter 10 Assignments 149
10
a. By looking at the table, can you determine which color car is most popular?
b. Organize the information to help the sales manager determine which color of car is most popular.
c. The manager decides that for his next order of new cars he will order a majority of them in black. Do you agree with his decision? Explain your reasoning.
Lesson 10.4 Assignment page 3
Name Date
8046_Assign_CH10_135-152.indd 149 4/14/12 1:35 PM
© 2
012
Car
negi
e Le
arni
ng
150 Chapter 10 Assignments
10
Lesson 10.4 Assignment page 4
d. The manufacturer wants the manager to justify his sales order. The sales manager knows that giving the manufacturer the marginal frequency table may be confusing. Recommend and then create a clear method the manager can use to present the information to the manufacturer that will help justify his order.
8046_Assign_CH10_135-152.indd 150 4/14/12 1:35 PM
© 2
012
Car
negi
e Le
arni
ng
Chapter 10 Assignments 151
10
Lesson 10.4 Assignment page 5
Name Date
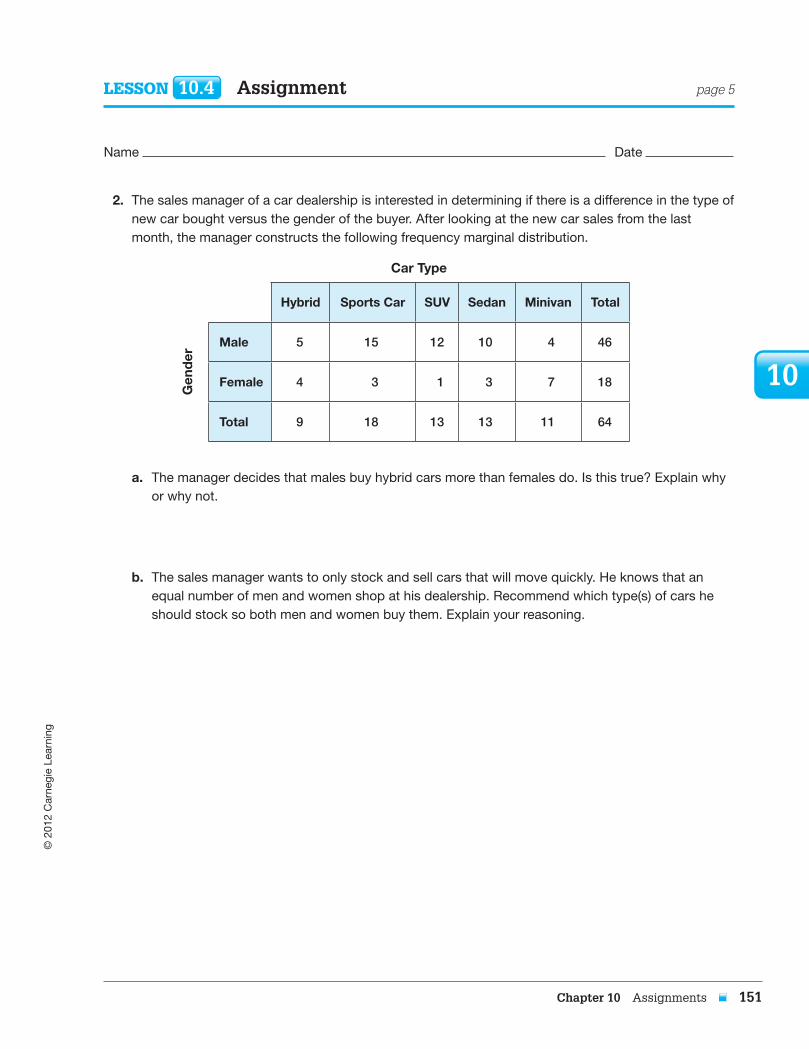
2. The sales manager of a car dealership is interested in determining if there is a difference in the type of new car bought versus the gender of the buyer. After looking at the new car sales from the last month, the manager constructs the following frequency marginal distribution.
CarType
Hybrid SportsCar SUV Sedan Minivan Total
Male 5 15 12 10 4 46
Female 4 3 1 3 7 18
Total 9 18 13 13 11 64
a. The manager decides that males buy hybrid cars more than females do. Is this true? Explain why or why not.
b. The sales manager wants to only stock and sell cars that will move quickly. He knows that an equal number of men and women shop at his dealership. Recommend which type(s) of cars he should stock so both men and women buy them. Explain your reasoning.
Gen
der
8046_Assign_CH10_135-152.indd 151 4/14/12 1:35 PM

© 2
012
Car
negi
e Le
arni
ng
152 Chapter 10 Assignments
10
8046_Assign_CH10_135-152.indd 152 4/14/12 1:35 PM