Embed Size (px)
Citation preview

City of Winchester
COUNCIL ACTION MEMO
☐ Resolution ☐ Ordinance ☒ Discussion To: Honorable Mayor and Members of City Council From: Shawn Hershberger, Director Subject: Presentation of Preliminary Housing Study Findings Meeting: City Council Work Session - Oct 12 2021
THE ISSUE:
This is a presentation of the preliminary findings of the housing study requested by Council. STRATEGIC PLAN:
Goal III: Advance the quality of life for all Winchester residents by increasing cultural, recreational, and tourism opportunities; enhance and maintain infrastructure and promote and improve public safety., Goal IV: Improve City services and advance the strategic plan goals by promoting a culture of transparency, efficiency, and innovation BACKGROUND INFORMATION:
In late 2020, the Common Council requested a housing study to be conducted in order to analyze Winchester's housing market and help identify opportunities for future housing initiatives. The City contracted with RKG Associates in April of 2021 to conduct the housing study. This is a presentation of RKG Associates' preliminary findings, pending finalization of the housing study report. BUDGET IMPACT:
This presentation does not have any direct budgetary impacts. OPTIONS:
This is a presentation only and no Council actions are required. RECOMMENDATION:
N/A ATTACHMENTS:
Housing Study Preliminary Findings Presentation winchester.housing.study.draft.10.8.21 Housing Study Presentation REVIEW: Shawn Hershberger, Director Approved - Sep 24 2021

Melisa Michelsen, City Attorney Approved - Sep 24 2021 Dan Hoffman, City Manager Approved - Sep 24 2021
MEETING HISTORY:
Presented at the September 30, 2021 - Planning and Economic Development Committee Meeting
Page 2 of 157

Winchester, VA Housing Market Analysis
Preliminary Findings Presentation
Page 3 of 157

DEFINING TERMS/GEOGRAPHIES
Page 4 of 157

SUBAREA BOUNDARIES
Housing analysis done at the citywide level as well as for six subareas
Subareas grouped because of their similar housing market characteristics
Residential Development Trends Analysis done at citywide level and for each subarea
The corresponding map reflects boundaries and subarea identification
Page 5 of 157

APPROACH INCOMES AND AFFORDABILITY
Rental Analysis Owner Analysis BaselineIncome Bands (2-Person) (3-Person) (4-Person)Extremely Low (30%) Income Limits $19,550 $22,000 $26,500Very Low (50%) Income Limits $32,600 $36,650 $40,700Low (80%) Income Limits $52,100 $58,600 $65,100100% AMI $65,200 $73,300 $81,400120% AMI $78,240 $87,960 $97,680
Renter Income Thresholds
Owner Income Thresholds
Rental Analysis Owner Analysis BaselineIncome Bands (2-Person) (3-Person) (4-Person)Extremely Low (30%) Income Limits $19,550 $22,000 $26,500Very Low (50%) Income Limits $32,600 $36,650 $40,700Low (80%) Income Limits $52,100 $58,600 $65,100100% AMI $65,200 $73,300 $81,400120% AMI $78,240 $87,960 $97,680
Page 6 of 157

APPROACH HOUSING VALUE ANALYSIS
Certain incomes can ”afford” a certain mortgage or rent payment HUD defines cost burdened at more than 30% of gross income Homeownership costs include principle, interest, taxes and insurance Rental housing calculation based on income Calculations based on HUD Income thresholds for Winchester region
The City’s housing units each carry a relative price if they were on the market Ownership units were measured against market value
Analysis compared assessed values against recent sales prices to determine value Corroborated findings against current listings
Rental units were measured against current asking rents Collected monthly rent data by subarea Used Zillow listings, ACS rent data, and information provided by local Realtors
Page 7 of 157

APPROACH INCOMES AND AFFORDABILITY
Corresponding Rent Thresholds
Corresponding Purchase Price Thresholds
Income Bands 2 3 4Extremely Low (30%) Income Limits $489 $550 $663Very Low (50%) Income Limits $815 $916 $1,018Low (80%) Income Limits $1,303 $1,465 $1,628100% AMI $1,630 $1,833 $2,035120% AMI $1,956 $2,199 $2,442
Persons in Household
Single Family Condo Single Family CondoMax. Home Value Max. Home Value Max. Home Value Max. Home Value
30% $102,660 $92,966 $119,342 $106,86650% $171,023 $161,329 $198,814 $186,33780% $273,449 $263,755 $317,885 $305,408
100% $342,045 $332,351 $397,627 $385,151120% $410,454 $400,760 $477,153 $464,676
FHA BUYER CONVENTIONAL BUYERAMI Threshold
Page 8 of 157

DEMAND ANALYSIS
Page 9 of 157

44%
56%
Households by Tenure (2019 ACS 5-Year Estimates)Winchester, VA
Owner HH Renter HH
Larger proportion of renter households
than owner households, typical
Page 10 of 157

15 to 24
17…
25 to 44862
18.6%
45 to 64
207744.7%
Over 651686 36.3%
Owner Households by Age of Head of HH
(2019 ACS 5-Year Estimates)City of Winchester 15 to
24380…
25 to 44252043.1%
45 to 64
198333.9%
Over 65965 16.5%
RenterHouseholds by Age of Head of HH
(2019 ACS 5-Year Estimates)City of Winchester
Younger households, ages 15-24, generally lack income and cash reserves for
home down payment
Nearly half of renter households are
headed by person 45+ years old
Page 11 of 157

30% and Below3597.7% 31% to 50%
3908.4%
51% to 80%635
13.7%
81% to 100%532
11.5%
101% to 120%454…
Over 120%2,27248.9%
Owner Households by HUD AMI(2019 ACS 5-Year Estimates)
City of Winchester
30% and Below1,001 17.1%
31% to 50%942
16.1%
51% to 80%1,637 28.0%
81% to 100%
632 10.8%
101% to 120%542 9.3%
Over 120%1,094 18.7%
Renter Households by HUD AMI(2019 ACS 5-Year Estimates)
City of Winchester
33% of renters earn less than $36,650 (50% of area AMI)
Income gap between renters
and owners substantial
Page 12 of 157

(316)
(115)
71
(171)
(531)
149
(34)
150
535
800
(600)
(400)
(200)
0
200
400
600
800
1,000
1-Person 2-Persons 3-Persons 4+ Persons Total
Change of Owner and Renter Households by Size (2010-2019)City of Winchester
Owner Renter
Page 13 of 157

1-Person114224.6%
2-Persons185840.0%
3-Persons810
17.4%
4+ Persons
83217.9%
Owner Households by Size(2019 ACS 5-Year Estimates)
City of Winchester
1-Person245141.9%
2-Persons133622.8%
3-Persons771
13.2%
4+ Persons129022.1%
Renter Households by Size(2019 ACS 5-Year Estimates)
City of Winchester
Page 14 of 157
Winchester predominately a renter community (56%) Number of renter households increased since 2010 while the number of homeowners
decreased Unmet demand for rental housing, particularly larger households, and Winchester’s relative
ownership housing affordability driving market conversions Trend likely to continue without new rental development, particularly for larger units
Renter Households are generally younger Consistent with national trends Younger households tend to have lower incomes, lack of down payment to purchase
KEY FINDINGSHOUSING DEMAND ANALYSIS
Page 15 of 157

There is an income disparity between renters and owners Consistent with national trends Lower income households struggle with pricing, down payment, cost of maintenance Nearly 50% of owner households earn more than 120% AMI ($87,960) Approximately 70% of renter households earn less than 100% AMI
KEY FINDINGSHOUSING DEMAND ANALYSIS
Page 16 of 157

SUPPLY ANALYSIS
Page 17 of 157

6,730
1,212
2,938
722
0 1,000 2,000 3,000 4,000 5,000 6,000 7,000 8,000
Single Family Dwelling
Multifamily (2-5 Units)
Multifamily (6+ Units)
Townhome Condominium
Housing Units
Hou
sing
Typ
esDevelopment Patterns by Type
City of Winchester, VA
Nearly 60% of residential development is confined in detached single family dwellings. Roughly 30%
of these homes are rentals, an
Page 18 of 157

2,467
1,212
2,938
0 500 1,000 1,500 2,000 2,500 3,000 3,500
Single Family/Townhome-Condo
Multifamily (2-5 Units)
Multifamily (6+)
Housing Units
Hou
sing
Typ
es
Rental Units by Structure Type City of Winchester, VA
Approximately 55% of Multifamily Units are contained
in structures with 1-5 units. Single family structures (detached dwellings and
attached townhome-condominiums) compose nearly 40% of multifamily rental units.
Page 19 of 157

154
2
466
37
0 50 100 150 200 250 300 350 400 450 500
Single Family Dwelling
Multifamily (2-5 Units)
Multifamily (6+ Units)
TownhomeCondominium
Housing Units
Hou
sing
Typ
esDevelopment Patterns by Type (Units Built 2010-2021)
City of Winchester, VA
Most development has been multifamily (6+ units), a relative
difference from development construction prior to 2010, which
Page 20 of 157

22
191
3
137
295
11
0 50 100 150 200 250 300 350
Sub-Area 1
Sub-Area 2
Sub-Area 3
Sub-Area 4
Sub-Area 5
Sub-Area 6
Housing Units
Hou
sing
Typ
esDevelopment Patterns by Sub-Area (Units Built 2010-2021)
City of Winchester, VA
Subarea 5 had the largest development in the previous decade,
largely due to the newly constructed Meadow Branch Apartments.
Page 21 of 157

154
264
0 50 100 150 200 250 300
Sub Area 2
Sub Area 5
Housing Units
Hou
sing
Typ
esMultifamily (6+) Development by Type (Units Built 2010-2021)
City of Winchester, VA
As illustrated, two large multifamily complexes
have been constructed in the previous ten years,
either in Sub Area 5 or Sub Area 2. The combined
complexes have higher FAR ratios than multifamily
Page 22 of 157

22
35
3
89
31
11
0 10 20 30 40 50 60 70 80 90 100
Sub Area 1
Sub Area 2
Sub Area 3
Sub Area 4
Sub Area 5
Sub Area 6
Housing Units
Hou
sing
Typ
esSingle Family and Townhome-Condomimum (Units Built 2010-2021)
City of Winchester, VA
Page 23 of 157

Housing conversions creating imbalance in typical rental housing by housing type Nearly 40% of rental units are contained in either detached single family homes or attached
townhome-condominiums. The total of rental units within structures that are 5 units or fewer exceed the total of rental
units within structures greater than 5 units
Housing differs within the City’s subareas Subarea 5 has the most detached single-family homes of any subarea while composing 70%
of housing types within its subarea. Subarea 6 has the largest proportion of detached single-family homes of any subarea while
composing 73% of housing types within its subarea. The largest proportion of multifamily rental units among all subareas is in subarea 3,
composing 60% of housing types. Subarea 1 has the largest housing diversity among all subareas
KEY FINDINGSHOUSING SUPPLY ANALYSIS
Page 24 of 157

Housing development predominantly has been multifamily since 2010 Due to large multifamily complexes- Meadow Branch Apartments and Jubal Square
Apartments Developers do not make enough money on low-density development due to high land costs Redevelopment requires greater density to be profitable Market is reacting to greatest demand, regional land use regulation constraints Subarea 4 constructed the most detached single-family dwellings in the previous decade
KEY FINDINGS HOUSING SUPPLY ANALYSIS
Page 25 of 157

HOMEOWNERSHIPAFFORDABILITY ANALYSIS
Page 26 of 157

KEY ASSUMPTIONS HOMEOWNERSHIP AFFORDABILITY ANALYSIS Homeownership more than just ability to pay mortgage
Qualifying credit score Down payment Renovation/rehabilitation costs
VERY important in Winchester’s most affordable ownership units Upkeep and maintenance costs HOA fees for condominiums
Lowest income households have several barriers to ownership Typically, many of the above issues
Page 27 of 157

APPROACHHOMEOWNERSHIP AFFORDABILITY ANALYSIS Analysis uses both FHA lending standards and conventional lending standards
FHA (3.5% down payment) simulates ‘worst case scenario’ Conventional (20.0% down payment) assumes ‘best case’
Nationally, lending for home purchases is about 90% FHA We cannot determine exact numbers in Winchester because the data is not available at local
level Analyzing both FHA and Conventional lending scenarios provides range of affordability for
purchasing
Analysis shows the balance between “supply” and “demand” for specific income groups Supply – Number of ownership units that are affordable to households in that AMI group Demand - Total households that exist in Winchester with incomes in that AMI group
Page 28 of 157
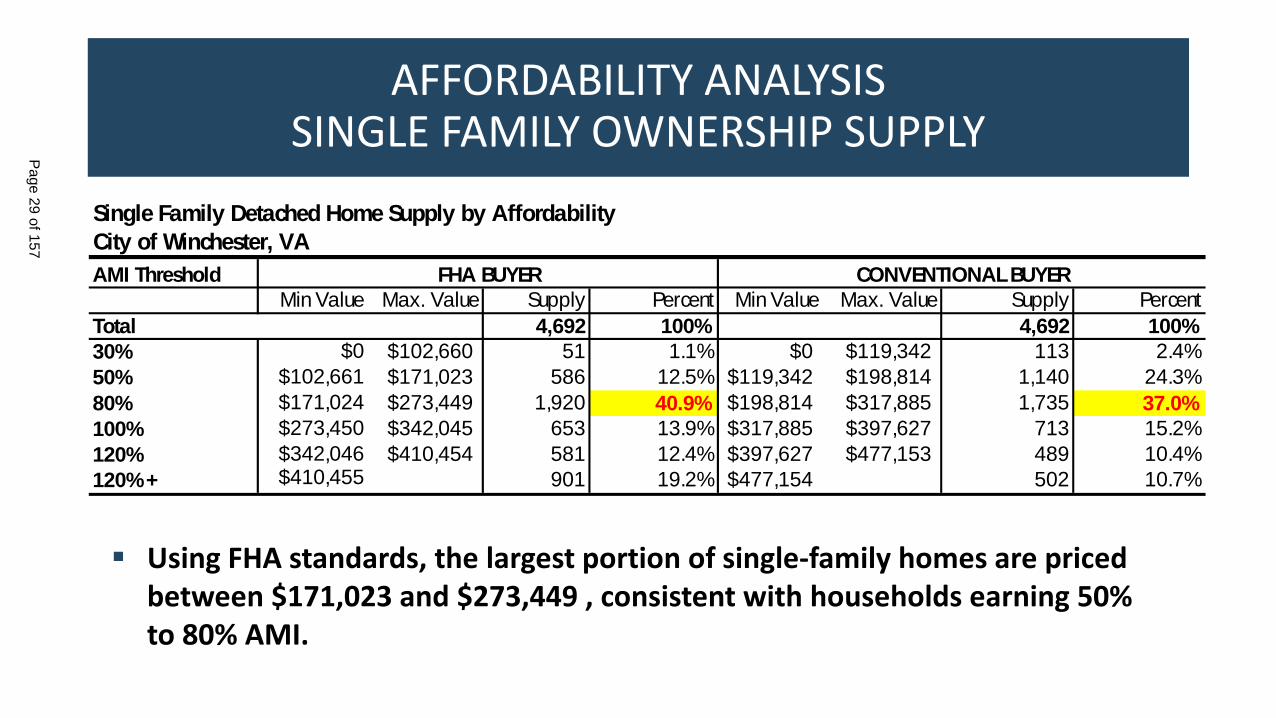
AFFORDABILITY ANALYSISSINGLE FAMILY OWNERSHIP SUPPLY
Using FHA standards, the largest portion of single-family homes are priced between $171,023 and $273,449 , consistent with households earning 50% to 80% AMI.
Single Family Detached Home Supply by AffordabilityCity of Winchester, VAAMI Threshold
Min Value Max. Value Supply Percent Min Value Max. Value Supply PercentTotal 4,692 100% 4,692 100%30% $0 $102,660 51 1.1% $0 $119,342 113 2.4%50% $102,661 $171,023 586 12.5% $119,342 $198,814 1,140 24.3%80% $171,024 $273,449 1,920 40.9% $198,814 $317,885 1,735 37.0%100% $273,450 $342,045 653 13.9% $317,885 $397,627 713 15.2%120% $342,046 $410,454 581 12.4% $397,627 $477,153 489 10.4%120%+ $410,455 901 19.2% $477,154 502 10.7%
FHA BUYER CONVENTIONAL BUYER
Page 29 of 157

AFFORDABILITY ANALYSISCONDOMINIUM HOMEOWNERSHIP SUPPLY
Most Townhome-Condominiums are priced within the 50%-80% AMI threshold, same as detached single-family homes.
Townhome-Condominium Attached Home Supply by AffordabilityCity of Winchester, VAAMI Threshold
Min Value Max. Value Supply Percent Min Value Max. Value Supply PercentTotal 293 100% 293 100%30% $0 $92,966 2 0.7% $0 $106,866 7 2.4%50% $92,967 $161,329 41 14.0% $106,867 $186,337 72 24.6%80% $161,330 $263,755 213 72.7% $186,338 $305,408 192 65.5%100% $263,756 $332,351 21 7.2% $305,409 $385,151 12 4.1%120% $332,352 $400,760 9 3.1% $385,152 $464,676 10 3.4%120%+ $400,761 7 2.4% $464,677 0 0.0%
FHA BUYER CONVENTIONAL BUYER
Page 30 of 157

0%
10%
20%
30%
40%
50%
60%
70%
80%
90%
100%
Single Family Townhome Condominium
Ownership Housing Affordability by Unit Type and HUD Income ThresholdCity of Winchester, VA
Under 30% 31%-50% 50%-80% 80%-100% 100%-120% 120%+
54.5%
= Percent of Units Affordable to households earning (80%
87.4%
Page 31 of 157

AFFORDABILITY ANALYSISHOMEOWNERSHIP GAP/SURPLUS
Ownership Housing Supply and Demand by HUD AMI Income ThresholdCity of Winchester, VA
FHA ConventionalAMI Threshold Count Percent Count Percent Count Percent Count CountTotal 4,985 100% 4,985 100% 4,642 100% 343 34330% of AMI (Extremely Low Income) and Below 53 1.1% 120 2.4% 359 7.7% (306) (239)31%-50% of AMI (Very Low Income) 627 12.6% 1,212 24.3% 390 8.4% 237 82251%-80% of AMI (Low Income) 2,133 42.8% 1,927 38.7% 635 13.7% 1,498 1,29281%-100% of AMI 674 13.5% 725 14.5% 532 11.5% 142 193101%-120% of AMI 590 11.8% 499 10.0% 454 9.8% 136 45121% of AMI and Above 908 18.2% 502 10.1% 2,272 48.9% (1,364) (1,770)
Gap
FHA Buyer Conventional Buyer
Supply (Single Family, Townhouse/Condominium)
Demand (No. of Owner Households)
Under FHA Standards, Winchester lacks ownership housing supply for households earning below 30% of AMI and above 121% of AMI
Lack of supply at the highest end is driving development decisions, creating downward pressure on market (increasing prices)
Page 32 of 157

(306)
237
1,498
142 136
(1,364)
(2,000)
(1,500)
(1,000)
(500)
0
500
1,000
1,500
2,000
Under 30% 30%-50% 50%-80% 80%-100% 100%-120% Above 120%
Hou
sing
Uni
ts
AMI Level
Ownership Housing Supply/Demand Equilibrium by HUD Income ThresholdCity of Winchester, VA
A 'Surplus' of units indicate there are more housing units priced to this income group than demand
from existing Winchester
A 'Gap' of units indicate there are more Winchester
households in that income group than housing units
affordable to their ability to pay.
Page 33 of 157

In general, Winchester has a large supply of affordable home-ownership opportunities for households making between 50% and 80% AMI Only 14% of ownership units are available for households earning under 50% AMI Under FHA standards, only 1% of homes are available for households earning below 30%
AMI, creating a major shortfall
Winchester does not have enough housing units to meet demand at the highest income levels (over 120% AMI/$87,960) Subarea 5 has the largest supply Estimates indicate a gap of nearly 1,400 owner occupied households Lack of supply of high-end ownership housing drives up prices and demand for less-expensive
units due to stringer demand Has impact on future affordability
KEY FINDINGS HOMEOWNERSHIP AFFORDABILITY ANALYSIS
Page 34 of 157

RENTALAFFORDABILITY ANALYSIS
Page 35 of 157

APPROACHRENTAL AFFORDABILITY ANALYSIS
Rental analysis examines prices and corresponding number of households able to afford those prices HUD defines income thresholds by household size and bedroom count’
Analysis shows the balance between “supply” and “demand” for specific income groups Supply – Number of ownership units that exist in Winchester that are affordable to
households in that AMI group Demand - Total households that exist in Winchester with incomes in that AMI group
Page 36 of 157

AFFORDABILITY ANALYSISRENTAL SUPPLY
Roughly 60% of rental units are priced below 80% AMI threshold ($52,100); fewer than 1% priced above 120% AMI ($78,240)
19% priced below 50% AMI (including 80 income-controlled units) Nearly 20% of renter households earn less than 30% AMI
Rent Levels Minimum Maximum Count PercentTotal 6,617 100.0%Under 30% of AMI $0 $489 188 2.8%30% to 50% $490 $815 1,063 16.1%50% to 80% $816 $1,303 2,778 42.0%80% to 100% $1,304 $1,630 1,647 24.9%100% to 120% $1,631 $1,956 910 13.7%Over 120% of AMI $1,957 33 0.5%
Rent Thresholds Total
Page 37 of 157
Housing in Winchester predominantly priced between 50% and 80% AMI, especially among townhome-condominium units.
Largest number of detached single-family homes priced above 120% AMI located in Subarea 5 (467 total homes priced above $410,454)
Using FHA Standards, only 5.5% of townhome-condominiums are priced above 100% AMI
KEY FINDINGSHOUSING VALUE ANALYSIS
Page 38 of 157

KEY FINDINGS RENTAL AFFORDABILITY ANALYSIS
AMI Threshold Under 30% 30%-50% 50%-80% 80%-100% 100%-120% Above 120%Annual HH Income $19,550 $32,600 $52,100 $65,200 $78,240 $78,720+Rent Level $489 $815 $1,303 $1,630 $1,956 $1,968+TOTALSupply 188 1,065 2,782 1,649 911 33Demand 1,001 942 1,637 632 542 1,094Gap (813) 124 1,145 1,017 369 (1,062)
Substantial unmet demand at the lowest (under 30% AMI) and highest (over 120% AMI) ends of the income spectrum
Page 39 of 157

(813)
121
1,141 1,015
367
(1,062)
(1,500)
(1,000)
(500)
0
500
1,000
1,500
Under 30% 30%-50% 50%-80% 80%-100% 100%-120% Above 120%
Hou
sing
Uni
ts
AMI Level
Rental Housing Supply/Demand Gap by HUD Income ThresholdCity of Winchester, VA
There are rental supply needs for the highest end (Above 120%
AMI)
Major supply deficiencies for households earning under 30%
AMI.
Page 40 of 157

Most vulnerable households substantially underserve More than 81% of households earning below 30% AMI are cost burdened Interviews with local housing professionals indicate most affordable units also worst
condition
New development priced for 100% AMI to 120% AMI income range Meeting unmet demand of higher income renters However, new development not robust enough to mitigate rent escalation being faster than
cost of living
Lack of larger (2+ bedroom) apartments causing conversion of traditional ownership units to rental Regulations limiting the development of units with more bedrooms will perpetuate this
trend, particularly for townhouse style rental units
KEY FINDINGSRENTAL AFFORDABILITY ANALYSIS
Page 41 of 157

FUTUREAFFORDABILITY PROJECTIONS
Page 42 of 157

2026 Household demand Collected ESRI detailed projection rates (2021-2026) by household income Applied ESRI projection rates to current household demand by tenure (Renter vs. Owner)
based on HUD defined income thresholds Projected the number of renter and owner households demanding housing units in 2026
2026 Housing unit supply Collected number of multifamily housing units expected to be constructed by 2026 through
the City of Winchester Planning Department Added these pipeline units to the current supply of rental housing units in the city’s
boundaries
METHODDOLOGYPROJECTED AFFORDABILITY ANALYSIS
Page 43 of 157

(100)
0
100
200
300
400
500
600
700
Under 30% 30%-50% 50%-80% 80%-100% 100%-120% Over 120% Total
Hou
seho
lds
Projected Change in Ownership Households by HUD AMI (2021-2026) City of Winchester, VA
Page 44 of 157

(100)
(50)
0
50
100
150
200
250
300
350
400
Under 30% 30%-50% 50%-80% 80%-100% 100%-120% Over 120% Total
Hou
seho
lds
Projected Change in Renter Households by HUD AMI City of Winchester, VA
Page 45 of 157

(745)
14
1,126
1,409
813
(1,350)(1,500)
(1,000)
(500)
0
500
1,000
1,500
2,000
Under 30% 30%-50% 50%-80% 80%-100% 100%-120% Above 120%
Hou
sing
Uni
tsProjected Supply/Demand Equilibrium for
Rental Units 2021-2026City of Winchester, VA
Major growth of supply-demand gap, reflective of projected
insufficient construction of 120% AMI units, based on historical
Due to future construction of multifamily complexes,
projected to be aimed at rental households earning between
80%-120% AMI
Page 46 of 157

Rapid development relative to previous decade (2010-2020) 840 rental units and 240 townhome-condominium units expected to be delivered in next five
years Large apartment complexes expected to be under construction soon, near the downtown
corridor (targeting young professionals) 170 of rental units expected to be age restricted (55+)
Known development projects focused on market-rate development (estimating 80%-120% AMI units based on historical trends) Number of income-controlled units is unknown
Impacts of economy; COVID-19 will affect the new unit construction Telecommuting/preferences of being outside major urban areas increasing demand in City Push from Northern Virginia skewed to higher income backets Price escalation likely will increase
KEY FINDINGS AFFORDABILITY PROJECTIONS
Page 47 of 157

Supply-demand balance projected to worsen for lower income households “Surplus” of housing between 30% and 50% AMI diminished while under 30% still substantial Will create even greater cost burdening/displacement of the most vulnerable residents
Growing pressure from more affluent households will drive price escalation Demand will outpace supply Without new development, prices will continue to rise faster than inflation This is for both rental and ownership Rehabilitation of units will decrease “affordable supply
Increasing demand from affluent homeowners may reverse conversion trends This will adversely impact larger, lower income households substantially Decrease available converted units AND drive pricing up for those that remain
KEY FINDINGS AFFORDABILITY PROJECTIONS
Page 48 of 157

Housing Study and Neighborhood Revitalization Strategy
City of Winchester, Virginia
Page 1
1 EXECUTIVE SUMMARY
A. OVERVIEW AND PURPOSE
Housing affordability is a challenge throughout the United States. Communities of all sizes
and development intensities are struggling to find approaches to address housing needs that
both provide market/financial feasibility for the development community while addressing
real and perceived concerns from existing residents. The housing challenges in the
Shenandoah Valley have been consistent with the national marketplace but are now
increasing faster due to the continued growth and expansion of the greater Washington DC
metropolitan market. Simply put, growing economic and housing pressures west along
Route 7 and Interstate 66—along with the natural growth of the Shenandoah Valley as a place
to live and work—are rapidly changing housing market equilibriums. The ultimate effect has
been that housing market trends prices within the Winchester/Frederick County market have
been escalating faster than incomes
RKG Associates, Inc. (RKG) was retained by the City of Winchester, Virginia, to undertake a
citywide housing market analysis to understand current and projected housing
supply/demand equilibrium for all housing types across all income levels. This housing study
is intended to quantify these needs and provide recommendations on how to better position
the city in meeting those needs.
B. SUMMARY OF FINDINGS
1. Previous Analyses
Prior to summarizing the findings of this current analysis, it is worth recapping key points
regarding housing for the City of Winchester and Frederick County as reported in 2018.1
• City of Winchester – The need for owner and renter housing continues to rise with
the more acute need identified for the latter. In addition to general renter demand,
need is driven by seniors (an aging in place population) and households earning less
than 120 percent of the area median income. At that time, it was reported that, the City
of Winchester’s future residential development was targeted to students, young
professionals, and empty nesters seeking higher density apartments and
condominiums, stating that “Winchester has enough housing to meet the needs of large
households and couples with children” and with a plan focusing on higher quality
apartments near Shenandoah University and replacement of obsolete and blighted
housing with higher density units.
1 Housing the Northern Shenandoah Valley – Trends, Projections, and Strategies, prepared for the Northern Shenandoah
Valley Regional Commission, dated June 2018.
Page 49 of 157

Housing Study and Neighborhood Revitalization Strategy
City of Winchester, Virginia
Page 2
• Frederick County – Increasing overall demand will need to result in increasing
housing production, which is inclusive of current and expected income levels for all
households. Like the City of Winchester, much of the increased demand is anticipated
to come from an aging population indicating that owner housing should include a
variety of sizes and price points and that renter housing may more appropriately
reflect lower and medium density developments, as downsizing seniors may also
compete with millennials (initial household formations) for such units.
The current analysis reveals these challenges remain and are becoming more acute. The
summary findings of this current analysis are offered next.
2. Housing Demand Analysis Summary Findings
• The City of Winchester predominately is a renter community. More than half (56%) of the
city’s households rent their housing. This finding is not surprising, given the several
(and increasing) large commercial multifamily developments in Winchester. Recent
development have increased the number of renter households since 2010. However,
new multifamily development is not the sole reason for increased renter households.
Census data indicate that the net number of homeowners decreased since 2010,
indicating that traditional ownership units are being converted for rental use.
• The Census data indicate these conversions largely are due to unmet demand for rental
housing, particularly larger households. Traditional ownership units in Winchester are
relatively older, smaller, and lower value than Frederick County, making market
conversions for these units more financially feasible. The market projection analysis
indicates that this trend likely to continue without new rental development,
particularly for larger units.
• Renter households in Winchester are generally younger. In addition to the influence of
Shenandoah University, the higher incidence of younger households being renters is
consistent with national trends. Younger households tend to have lower incomes, lack
of down payment to purchase, and typically prefer to be more mobile to follow
employment/ family opportunities.
• Census data indicate that renters, on average, have much lower incomes in Winchester than
homeowners. This finding is consistent with national trends, as lower income
households struggle with home prices, down payment, and the ability to address
maintenance costs. Data indicate that nearly 50% of owner households earn more than
120% AMI ($87,960) while approximately 70% of renter households earn less than
100% AMI.
• Senior households continue to increase, as a share of the overall housing market. Households
headed by persons aged 65 and older, increased by 26.5% between 2010 and 2020, and
Page 50 of 157

Housing Study and Neighborhood Revitalization Strategy
City of Winchester, Virginia
Page 3
are projected to account for almost 19% of all households in Winchester by 2030. These
households, typically in their retirement years, often are considering downsizing their
housing, replacing owner housing with renter housing, or seeking some assisted care
housing.
3. Housing Supply Analysis Summary Findings
• The growth of renter households has outpaced the development of new traditional rental
housing units (multifamily developments). Housing conversions—the use of a
traditionally owner-occupied unit (i.e., single-family home) as a rental housing unit—
have increased in Winchester, creating an imbalance in typical rental housing by
housing type. Nearly 40% of rental units in the city are contained in either detached
single-family homes or attached townhome/condominiums. The total of rental units
within structures that contain 5 units or fewer exceed the total of rental units within
structures greater than 5 units
• Housing differs within the City’s six subareas. Each defined subarea of the city (see page
50) has a different housing makeup, often determined by the period housing was built
in that area. Those subareas developed after the 1960s are more traditional single-
family subdivisions. For example, Subareas 5 and 6 have the most detached single-
family homes and largest proportion of units that are single-family homes within
Winchester of any subarea while composing 70% of housing types within its subarea.
In contrast, Subarea 1 has the largest housing diversity among all subareas and some
of the oldest housing in Winchester.
• Housing development in Winchester predominantly has been multifamily since 2010. Recent
large multifamily developments—Meadow Branch Apartments and Jubal Square
Apartments—have added hundreds of housing units in relatively small lard area. The
focus on multifamily development is being driven, in large part due, to the fact that
developers do not make enough money on low-density development due to high land
costs. Further, redevelopment, which is required in Winchester due to the relatively
small amount of greenfields, requires greater density to be profitable. Information
collected through interviews with local real estate professionals indicate that the
market is reacting to greatest demand and regional land use regulation constraints,
particularly within Frederick County.
4. Homeownership Affordability Analysis Summary Findings
• In general, Winchester has a large supply of affordable homeownership opportunities for
households making between 50% and 80% AMI. However, this finding is slightly
misleading. At a base level, there are very few options for households earning at the
lower end of this spectrum. Further, appreciation has been substantial in Winchester
meaning this affordability is waning as prices escalate higher than income levels.
Page 51 of 157

Housing Study and Neighborhood Revitalization Strategy
City of Winchester, Virginia
Page 4
• Escalation is due, in part, because Winchester does not have enough housing units to meet
demand at the highest income levels. The analysis indicates there is a supply gap of nearly
1,400 units for households earning above 120% of AMI. This imbalance is a lead
contributor to price escalations, as competition for the city’s limited homeownership
supply requires buyers to offer above asking price.
5. Rental Housing Affordability Analysis Summary Findings
• The most vulnerable households in Winchester are substantially underserved. At a base level,
more than 81% of households earning below 30% AMI are cost burdened (paying
above 30% of their gross income for housing). Serving households earning below 50%
of AMI is a national challenge but is growing in Winchester. Further, those units that
are available to these households oftentimes are also in the worst condition,
diminishing quality of life.
• New rental housing development is being priced for 100% AMI to 120% AMI income range.
While this finding is not surprising given the substantial unmet demand from these
higher earners, new development has not been robust enough to mitigate rent
escalation being faster than household income. Research done for this analysis
indicates that unmet demand, particularly for households earning below 80% of AMI,
will increase in the future. This issue is particularly challenging for larger renter
households as traditional apartment complexes have limited supply of 3+ bedroom
units and very few are being developed.
• The lack of larger (3+ bedroom) apartments causing conversion of traditional ownership units
to rental. Regulations limiting the development of units with more bedrooms will
perpetuate this trend, particularly for townhouse style rental units. The city’s older,
smaller, and comparatively lower cost ownership housing makes it more attractive for
investors seeking opportunities to serve this market.
6. Projected Affordability Analysis Summary Findings
The city’s development pipeline is more robust than past years. The city’s building permit database
indicates there is more development interest now than had been experienced in the past
decade. Approximately 840 rental units and 240 townhome-condominium units are expected
to be delivered in next five years. The apartment units are clustered in some larger
developments near the downtown corridor (targeting Shenandoah University and young
professionals). Further, roughly 200 of rental units expected to be age restricted (55+).
These known development projects are focused on market-rate development with little price diversity.
While it is not certain whether income-controlled units will become part of the program for
these projects, there is no indication that any will be added. The current market rate pricing
typically targets above 100% AMI (above 120% AMI for ownership housing). While the new
housing could ease the market pressure on lower-cost units, the lack of any income-controlled
Page 52 of 157

Housing Study and Neighborhood Revitalization Strategy
City of Winchester, Virginia
Page 5
units will continue to limit housing access and choice for the city’s existing modest-income
households.
Impacts of the current economy and COVID-19 will affect the new unit construction. In short, part
of the boom in housing demand in Winchester is the push from households to take advantage
of new options for telecommuting and from preferences of being outside higher density,
urban areas. Much of this increase in demand is from other Northern Virginia areas closer to
Washington DC. These buyers and renters tend to have higher incomes, skewing the market’s
historic ability to pay levels. As a result, price escalation likely will increase without new
income-controlled development.
Growing pressure from these more affluent households will increase price escalation. The projection
analysis indicates that demand will outpace supply despite the uptick in building permits.
Without new development, prices will continue to rise faster than inflation for both rental and
ownership housing. Further, many households are acquiring ‘fixer-upper’ units,
rehabilitating these units (particularly near Downtown). This effort will directly decrease the
city’s existing affordable supply. While increasing demand from affluent homeowners
willing to purchase and rehabilitate housing may reverse conversion trends, it will adversely
impact larger, lower income households substantially by decreasing the availability of
converted units and drive pricing up for those converted units that remain in the rental pool.
Ultimately, the supply-demand balance is projected to worsen for lower income households. Housing
costs (both rental and owner) have been escalating substantially faster than incomes in
Winchester. As a result, the little supply that is affordable to households earning under 50%
of AMI has been decreasing due to market forces. Concurrently, the number of households
earning less than 50% of AMI has been remaining steady. Without market intervention, cost
burdening and displacement of the most vulnerable Winchester residents will continue.
Page 53 of 157

Housing Study and Neighborhood Revitalization Strategy
City of Winchester, Virginia
Page 6
2 BASELINE METRICS
A. DEMOGRAPHICS
1. Population Trends
In 2010, the population of the City of Winchester was 26,203 persons. The City’s population
increased to an estimated 28,705 persons by 2020, a growth rate of 9.5%. The projected2
population for 2030, at 31,107 persons represents an 8.4% growth or approximately 2,402
persons (like the growth of 2,502 persons in the prior decade). In comparison, the Frederick
County population increased by 10.6% (2010 – 2020) or by approximately 8,269 persons to a
2020 population of 86,574. The projected 2030 population, at 101,471 persons, represents an
increase of 17.2% over 2020 for an increase of 14,898 persons (which is not quite double the
growth of the prior decade). The population of Virginia exhibited a 9.3% population growth
over the 2010 – 2020 period and is projected to increase by a similar 9.2% by 2030, resulting in
a 2030 population of nearly 9.55 million persons (Table 1). Despite projected population
growth (2030) for the City of Winchester, the rate of growth is less than the prior decade, while
the rate of projected growth for Frederick County exceeds the 2010 -2020 period and the rate
of growth for the state is comparable.
Table 1 – Comparative Population Trends
26,203 28,705 9.5% 31,107 8.4%
78,305 86,574 10.6% 101,471 17.2%
8,001,024 8,744,273 9.3% 9,546,958 9.2%
Source : Weldon Cooper Center for Public Service and RKG (2021)
Frederick County, VA
Virginia
Winchester City, VA
Total Population 2010 2020 % Δ 2010 2030 % Δ 2020
a. Group Quarters Population
The comparative population in group quarters3, for the City of Winchester and Frederick
County, are presented in Figure 1, noting the following:
• City of Winchester – Total group quarters population was 976 persons with 16.1%
(157 persons) in institutional facilities and the majority of these at 79.6% (125 persons)
were in nursing facilities. The remaining 83.9% of the group quarters population (819
persons) were in non-institutional facilities, led by 91.2% (747 persons) in colleges or
universities.
2 Population projections and age distributions developed by the Weldon Cooper Center for Public Service,
University of Virginia. 3 Delineated by type of Group Quarters from the U. S. Census for 2010.
Page 54 of 157

Housing Study and Neighborhood Revitalization Strategy
City of Winchester, Virginia
Page 7
• Frederick County – Total group quarters population was 967 persons (marginally less
than the City) with 75.2% (727 persons) in institutional facilities, led by 519 persons
(53.7%) in correctional facilities. The remaining 24.8% of the group quarters
population (240 persons) were in non-institutional facilities, generally specified as
including emergency and transitional shelters, domestic violence shelters, and adult
residential treatment centers, as examples.
Figure 1 – 2010 Group Quarters Population by Type of Group Quarters
Table 2 presents the overall change in the total group quarters population4 (2010 – 2020) for
the City and Frederick County with a sharp difference in the estimated percent change as the
percent change in Frederick County is slightly more than double that for the City of
Winchester.
Table 2 – Change in Group Quarters Population
2010 2020 % Δ 2010 2020 % Δ
Total Population 976 1,079 10.6% 967 1,172 21.2%
Source : ESRI and RKG (2021)
Population in Group
Quarters
City of Winchester Frederick County
2. Age Distribution Trends
In terms of age distribution (Figure 2) and with respect to housing demand, the City realized
population growth among those aged 20 to 34 years (6.9% over the last decade) with growth
projected to continue through 2030, a growth rate of 13.1% for an additional 865 persons in
this age cohort. This is more than double the population increase in this age cohort over the
2010 – 2020 period. The 20 to 34 age cohort is generally considered to be those in their family
formation years, typically establishing their own residences and often as rental properties.,
which could serve to increase residential demand throughout the City.
4 Data from ESRI did not provide a distinction for 2020 group quarters population with respect to institutional and
non-institutional settings.
- 32
12
5
-
74
7
-
72
51
9
11
5
92
-
78
24
0
16
2
0
100
200
300
400
500
600
700
800
Correctional Juvenile Nursing Other Inst. College Military Othet Non-Inst.City of Winchester Frederick County
Page 55 of 157

Housing Study and Neighborhood Revitalization Strategy
City of Winchester, Virginia
Page 8
Although not as pronounced, the City of Winchester also realized and is projected to continue
to realize population growth in the 35 to 44 age cohort. The projected growth to 2030
represents 180 persons or about 100 persons less than in the prior decade. Nonetheless, those
in this cohort are often represented by first-time homebuyers, potentially further impacting
residential demand throughout the City of Winchester.
The population in the 45 to 54 age cohort declined in the City of Winchester by nearly 440
persons in the last decade, but a rebound is projected for the 2020 – 2030 study period with a
growth of 7.2% or approximately 220 persons, suggesting some additional demand for
housing as they may seek to upgrade to newer and/or larger residences.
The City’s population aged 55 to 64 years, often pre-retirement years and indicative of those
seeking to downsize their housing, increased by 436 persons in the last decade but is projected
to decline by 466 persons by 2030. It is possible that as this population declines, some portion
of their existing housing may serve to meet the “move-up” demand from those in the 45 to 54
age cohort.
Lastly, those aged 65 and older, in their retirement years and often considering downsizing
their housing, replacing owner housing with renter housing, or seeking some assisted care
housing, increased by 26.5% from 2010 -2020. This represented an increase of 976 persons. The
projected growth to 2030, at a similar 23.1%, represents an additional 1,074 persons in this age
cohort. In 2010, those aged 65 and older accounted for approximately 14% of the City’s
population and this is projected to increase to an 18.4% representation by 2030.
Figure 2 – Population by Age Cohort – City of Winchester
6,8
75
6,2
01
3,1
00
3,5
07
2,8
44 3,6
76
7,6
98
6,6
26
3,3
81
3,0
68
3,2
80
4,6
52
8,2
25
7,4
91
3,5
62
3,2
89
2,8
14
5,7
26
1,000
2,000
3,000
4,000
5,000
6,000
7,000
8,000
9,000
10,000
less than 20 years 20 to 34 years 35 to 44 years 45 to 54 years 55 to 64 years 65 years and older
2010 2020 2030
The changes by population age cohort for Frederick County (Figure 3) present a similar
pattern to the City of Winchester with some notable variances, including:
• For those in the 20 to 34 age cohort, the growth in Frederick County was 1,807 persons
and is projected to be a comparable 1,855 person by 2030. This differs from the City
Page 56 of 157

Housing Study and Neighborhood Revitalization Strategy
City of Winchester, Virginia
Page 9
of Winchester where the projected growth is more robust, but nonetheless continues
to represent demand for potential rental housing.
• Unlike the City, Frederick County lost population (4.4%) in 35 to 44 age cohort in the
last decade, however projected growth for 2030, at 32.1% represents an increase of
slightly more than 3,500 persons among those often-representing first-time
homebuyers.
• The growth in the 65 and older cohort for Frederick County was 6,150 persons in the
2010 – 2020 period and projected at nearly 5,960 persons for 2030, representing growth
rates of 61.8% and 37%, respectively. In 2010, persons in this age cohort represented
12.7% of the countywide population and are projected to represent 21.7% by 2030.
Figure 3 – Population by Age Cohort – Frederick County
21
,64
2
13
,39
5
11
,43
1
12
,55
8
9,3
25
9,9
54
22
,19
8
15
,20
2
10
,92
3
10
,80
0
11
,34
6
16
,10
4
25
,70
5
17
,05
7
14
,43
2
11
,41
1
10
,80
5
22
,06
2
8,000
10,000
12,000
14,000
16,000
18,000
20,000
22,000
24,000
26,000
less than 20 years 20 to 34 years 35 to 44 years 45 to 54 years 55 to 64 years 65 years and older
2010 2020 2030
3. Population Diversity Trends
Trends in population diversity5 for the City of Winchester (Figure 4 ) indicate a population
which is predominantly White, although diminishing as a percent of the total City population
over time, from approximately 19,521 persons in 2010 to 19,659 persons in 2025. Although the
City’s Black population is projected to increase over the study period, reaching approximately
3,037 persons in 2025, as a percentage of the City’s population it is constant at an 11%
representation. The population identifying as Other (a broadly inclusive category) is projected
to increase from a 12% representation of the City’s population in 2010 to a 23% representation
in 2025. Persons of Hispanic/Latin heritage are projected to increase from approximately 4,035
persons in 2010 to 6,447 persons in 2025, increasing from a 15% representation of the
population (2010) to a 23% representation (2025).
5 Population diversity trends offered by Esri, a vendor of socioeconomic data and proprietary modeling. Note that
the “Other” category includes American Indian, Pacific Islander and persons reporting one or more other races.
Page 57 of 157

Housing Study and Neighborhood Revitalization Strategy
City of Winchester, Virginia
Page 10
Figure 4 – Population Diversity Trends – City of Winchester
75%
11%
2%
12%15%
71%
11%
3%
16%20%
68%
11%
3%
23% 23%
0%
10%
20%
30%
40%
50%
60%
70%
80%
White Black Asian Other Hispanic Ethnicity
2010 2020 2025
The population diversity trends for Frederick County (Figure 5) present a similar pattern to
those for the City of Winchester with a predominant, although diminishing, percent of
persons identifying as White. Like the City, persons identifying as Black have remained stable
in the percent representation of the countywide population. Also, persons in Frederick
County identifying as Other, and those of Hispanic/Latin heritage, are projected to realize
marked increases in their percentage representation of the total population.
Figure 5 – Population Diversity Trends – Frederick County
89%
4% 1%7% 7%
86%
5%1%
10% 10%
84%
5% 2%
12% 12%
0%
10%
20%
30%
40%
50%
60%
70%
80%
90%
100%
White Black Asian Other Hispanic Ethnicity
2010 2020 2025
4. Net Migration 2018
RKG reviewed information offered by EMSI6 to develop a comparison (2018 metrics) for
“inflow” and “outflow” metrics for the City of Winchester and Frederick County (Figure 6)
and indicating that there was a net “outflow” of population for the City of Winchester (a loss
of 605 persons) compared to a net “inflow” of population for Frederick County (1,144
6 EMSI is a national vendor of socioeconomic data and proprietary modeling. The migration data reflects the
amount of domestic taxpayer migration. The source and design of this taxpayer-based dataset does not represent
the entire population, but rather is a good indicator of migrating workers within the labor force.
Page 58 of 157

Housing Study and Neighborhood Revitalization Strategy
City of Winchester, Virginia
Page 11
persons). The “inflow” for Frederick County was 2.6 times greater than the City of
Winchester, while the “outflow” was 1.6 times greater – a reflection, in part of the overall
differences in total population, but also perhaps due to employment opportunities within
each location.
Figure 6 – Migration Metrics for 2018
a. City of Winchester
While the City of Winchester exhibited a net “outflow” of population there were two locations
where this was dominant (Table 3) including Frederick County (VA) and Berkeley County
(WV) which combined accounted for 87.5% of the 605-person decline. Of the top ten
destinations identified in Table 3 the net “inflow” to the City of Winchester was 238 persons.
Table 3 – Migration (2018) – City of Winchester
"inflow" "outflow" Net
Frederick County, VA 847 1,264 (417)
Loudoun County, VA 113 75 39
Berkeley County, WV 95 208 (113)
Carroll County, MD 84 4 79
Shenandoah County, VA 78 75 4
Clarke County, VA 66 57 9
Hampshire County, WV 65 40 25
Fairfax County, VA 64 42 22
Prince George's County, MD 64 3 61
Warren County, VA 58 68 (10)
All Other Locations 625 929 (304)
Total 2,158 2,763 (605)
Source : EMSI and RKG (2021)
2018 Migration - City of
Winchester
2,158 2,763
(605)
5,517
4,373
1,144
-1,000
0
1,000
2,000
3,000
4,000
5,000
6,000
"inflow" "outflow" NetCity of Winchester Frederick County
Page 59 of 157

Housing Study and Neighborhood Revitalization Strategy
City of Winchester, Virginia
Page 12
b. Frederick County
Frederick County experienced net “inflow” of population there were two locations (Table 4)
exhibiting a net “outflow” including Berkeley County (WV) and Shenandoah County (VA)
which combined accounted for a loss (or were the recipient) of 243 persons. Of the top ten
destinations identified in Table 4 the City of Winchester and Loudon County (VA) accounted
for nearly 71.5 % of the net “inflow” to Frederick County.
Table 4 – Migration (2018) – Frederick County
"inflow" "outflow" Net
Winchester City County, VA 1,264 847 417
Loudoun County, VA 587 187 400
Warren County, VA 385 219 167
Berkeley County, WV 292 513 (221)
Fairfax County, VA 261 83 178
Douglas County, NE 256 - 256
Shenandoah County, VA 224 246 (22)
Prince William County, VA 174 86 88
Clarke County, VA 152 140 12
Hampshire County, WV 95 85 11
All Other Locations 1,828 1,968 (141)
Total 5,517 4,373 1,144
Source : EMSI and RKG (2021)
2018 Migration - Frederick
County
5. Income Trends
Selected income metrics for the City of Winchester (Figure 7) indicate that median household
incomes are projected to increase by 4.9% (2020 – 2025) or by $2,625. The projected growth in
average household income, at 9.6% is greater and represents an increase of nearly $7,725. Per
capita income is projected to increase by a similar 9.4% or approximately $3,020.
Figure 7 – Income Metrics for the City of Winchester
$5
3,3
42
$8
0,6
60
$3
2,2
45
$5
5,9
67
$8
8,3
83
$3
5,2
64
$20,000
$30,000
$40,000
$50,000
$60,000
$70,000
$80,000
$90,000
Median Household Average Household Per Capita2020 2025
Page 60 of 157

Housing Study and Neighborhood Revitalization Strategy
City of Winchester, Virginia
Page 13
Frederick County income metrics (Figure 8) indicate that median household incomes are
projected to increase by 5.4% (2020 – 2025) or by nearly $4,460. The projected growth in
average household income, at 8.6% is greater (although less than for the City of Winchester)
and represents an increase of nearly $9,190. Per capita income is projected to increase by a
similar 8.5% (also somewhat less than the City of Winchester) or by approximately $3,345.
Figure 8 – Income Metrics for Frederick County
Despite slightly greater projected growth rates for the income measure for the City of
Winchester, in terms of absolute dollars, and as a percentage of the same measures for
Frederick County (Figure 9) they are lagging, declining nominally with respect to per capita
income.
Figure 9 – Income Comparisons for the City of Winchester to Frederick County
$8
2,7
65
$1
07
,15
9
$3
9,2
98
$8
7,2
22
$1
16
,34
6
$4
2,6
43
$20,000
$40,000
$60,000
$80,000
$100,000
$120,000
Median Household Average Household Per Capita
2020 2025
64.4% 64.2%
75.3% 76.0%
82.1% 82.7%
50.0%
60.0%
70.0%
80.0%
90.0%
2020 2025Median Household Average Household Per Capita
Page 61 of 157

Housing Study and Neighborhood Revitalization Strategy
City of Winchester, Virginia
Page 14
B. HOUSING
1. Housing and Household Trends
Trends in housing and households (occupied housing) for the City of Winchester and
Frederick County are presented in Table 5. The percent change in the number of housing units
over the last decade, and projected for 2025, for Frederick County are well above those for the
City of Winchester. This also holds for the number of vacant housing units, noting that the
City of Winchester experienced a decline in vacant units in the last decade.
Similarly, owner households declined in the City of Winchester in the last decade but are
projected to increase by 2025, albeit to a count less than in 2010. Steady growth has been
realized and is projected for owner households in Frederick County. In 2010, owner
households accounted for 45.8% of the City’s households and this is projected to decline to a
41.3% representation by 2025. In Frederick County the owner households were 78.6% in 2010
and are projected to increase to 82.7 % by 2025 or nearly twice that of the City of Winchester.
Renter households constitute the majority of households in the City of Winchester, accounting
for 54.2% in 2010 and projected to represent 58.7% in 2025. Overall growth rates for renter
households are well ahead of owner households in the 2010 -2020 period and marginally
greater for the 2025 projection. Conversely, renter households, as a percent of total
households, is declining in Frederick County from 21.4% in 2010 to 17.3% in 2025.
For the City of Winchester and for Frederick County, both metrics run counter to current
national averages indicating 64% owner units and 36% renter units. The disparity between
the City and Frederick County suggests that currently, and in the near-term future, persons
seeking homeownership have greater options and availability in Frederick County as very
few rental housing developments are being built outside Winchester.
The average household size for the City of Winchester and for Frederick County increased
over the last decade and is projected to continue to do so by 2025, with the average household
size being approximately ten percent greater in Frederick County when compared to the City
of Winchester during the study period.
Conversely, the median age of householders is approximately ten percent younger in the City
of Winchester when compared to Frederick County, although both continue to exhibit an
aging population.
Page 62 of 157

Housing Study and Neighborhood Revitalization Strategy
City of Winchester, Virginia
Page 15
Table 5 – Housing and Household Trends
2010 2020 % Δ 2025 % Δ 2010 2020 % Δ 2025 % Δ
11,872 12,328 3.8% 12,604 2.2% 31,346 37,044 18.2% 41,140 11.1%
10,607 11,161 5.2% 11,410 2.2% 28,864 34,381 19.1% 38,037 10.6%
4,861 4,621 -4.9% 4,717 2.1% 22,673 28,070 23.8% 31,446 12.0%
5,746 6,540 13.8% 6,693 2.3% 6,191 6,311 1.9% 6,591 4.4%
1,265 1,167 -7.7% 1,194 2.3% 2,482 2,663 7.3% 3,103 16.5%
10.7% 9.5% na 9.5% na 7.9% 7.2% na 7.5% na
2.38 2.40 0.8% 2.42 0.8% 2.68 2.69 0.4% 2.70 0.4%
35.1 36.3 3.4% 36.9 1.7% 38.9 40.5 4.1% 41.0 1.2%
Source : ESRI and RKG (2021)
Renter
Frederick CountySelected Housing and
Household Metrics
City of Winchester
Total Housing Units
Total Households
Owner
Average Household Size
Vacant Units
% Vacant
Median Householder Age
a. Vacant Housing by Type
RKG reviewed 2010 U.S. Census data and 2019 estimates, as offered by the American
Community Survey (ACS) to develop a comparison of the change in vacant housing by status
of vacancy for the City of Winchester and for Frederick County (Table 6), noting:
• While the total number of vacant housing units increased for the City of Winchester
and countywide, vacant housing units as a percent of all housing units declined in
Frederick County.
• “For rent” vacancies in the City of Winchester were dominant in 2010, but declined
substantially by 2019, at 729 units and 436 units, respectively. The City of Winchester
realized a significant decrease in the number of vacant units “for rent” although all
other types of vacancy increased sharply, particularly those classified as “rented, not
occupied” and those classified as “seasonal”. In 2010, “for rent” vacancies accounted
for 57.6% of the City’s vacant housing stock and this declined to 30.5% in 2019.
• Vacant units classified as “all other” were dominant in Frederick County for both
points in time, at 851 units and 1,263 units respectively. The number of “seasonal”
vacant units increased in Frederick County, also, while all other status categories
realized a decline. Vacant housing classified as “all other” accounted for 34.3% of the
countywide vacancies but increased to 47.5% by 2019.
Page 63 of 157

Housing Study and Neighborhood Revitalization Strategy
City of Winchester, Virginia
Page 16
Table 6 – Comparative Vacant Housing by Status of Vacancy
2010 2019 % Δ 2010 2019 % Δ
Total Housing Units 11,872 11,919 0.4% 31,346 35,452 13.1%
1,265 1,429 13.0% 2,482 2,658 7.1%
10.7% 12.0% na 7.9% 7.5% na
Vacant Units by Type
729 436 -40.2% 504 345 -31.5%
32 131 309.4% 36 7 -80.6%
144 193 34.0% 516 231 -55.2%
23 39 69.6% 84 59 -29.8%
46 201 337.0% 491 753 53.4%
291 429 47.4% 851 1,263 48.4%
Source : U.S. Census, American Community Survey and RKG (2021)
Vacant Housing Distributions by
Type of Vacancy
City of Winchester Frederick County
Vacant Housing Units
Seasonal
All Other
% Vacant
For Rent
Rented, not Occupied
For Sale
Sold, not Occupied
2. Owner Housing Values
Median owner housing values in the City of Winchester are projected to increase by nearly
$38,650 over the 2020 -2025 study period for an increase of 15.8% (Table 7). While the projected
increase in median housing values in Frederick County is less robust, at 7.8%, it still represents
an approximate $21,000 increase. Despite these variances, the median housing values in the
City of Winchester, on average, lag those in Frederick County likely suggesting a somewhat
higher concentration of lower value housing which in turns impacts the median.7
Average housing values in the City of Winchester are projected to increase by 10.4 percent or
$31,630. This compares to a $26,755 increase in Frederick County, or 9.2%. Dissimilar to the
median housing values, the average housing values for the City of Winchester are marginally
greater when compared to Frederick County suggesting some concentration of higher value
housing (outliers) which would impact the average housing value recognizing that total
owner housing in the City of Winchester is much less when compared Frederick County.
Also, over the 2010 -2019 study period the average number of building permits for single
family residential in the City of Winchester averaged less than five percent of the permits in
Frederick County.8
7 A measure where one-half of the housing values fall below the median value and one-half exceed the median
total value. Note also Table 21 where the total sample of single-family residential properties for sale in the City of
Winchester is, on average, $31,940 less when compared to Frederick County. Also, recent singe family transactions
in the City are about $40,560 less when compared to Frederick County (Table 22). 8 As further discussed in Chapter 3 – Residential Market Analysis.
Page 64 of 157
Housing Study and Neighborhood Revitalization Strategy
City of Winchester, Virginia
Page 17
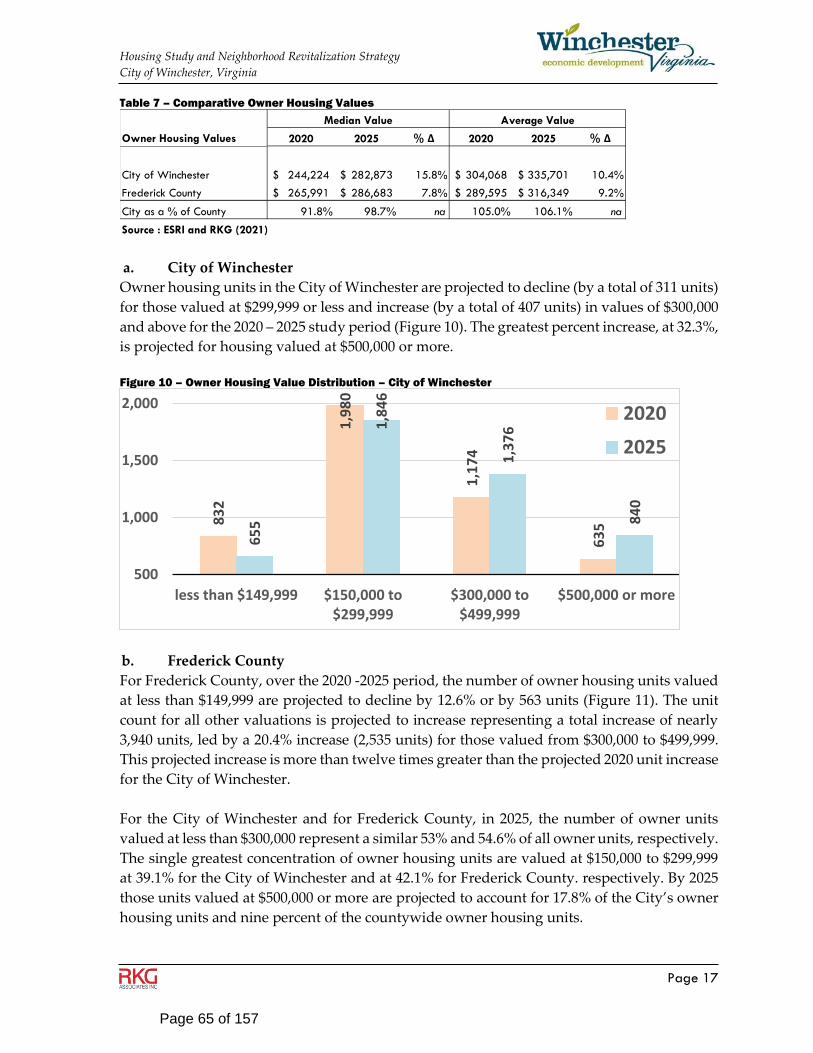
Table 7 – Comparative Owner Housing Values
2020 2025 % Δ 2020 2025 % Δ
City of Winchester 244,224$ 282,873$ 15.8% 304,068$ 335,701$ 10.4%
265,991$ 286,683$ 7.8% 289,595$ 316,349$ 9.2%
91.8% 98.7% na 105.0% 106.1% na
Source : ESRI and RKG (2021)
Average Value
Frederick County
City as a % of County
Owner Housing Values
Median Value
a. City of Winchester
Owner housing units in the City of Winchester are projected to decline (by a total of 311 units)
for those valued at $299,999 or less and increase (by a total of 407 units) in values of $300,000
and above for the 2020 – 2025 study period (Figure 10). The greatest percent increase, at 32.3%,
is projected for housing valued at $500,000 or more.
Figure 10 – Owner Housing Value Distribution – City of Winchester
b. Frederick County
For Frederick County, over the 2020 -2025 period, the number of owner housing units valued
at less than $149,999 are projected to decline by 12.6% or by 563 units (Figure 11). The unit
count for all other valuations is projected to increase representing a total increase of nearly
3,940 units, led by a 20.4% increase (2,535 units) for those valued from $300,000 to $499,999.
This projected increase is more than twelve times greater than the projected 2020 unit increase
for the City of Winchester.
For the City of Winchester and for Frederick County, in 2025, the number of owner units
valued at less than $300,000 represent a similar 53% and 54.6% of all owner units, respectively.
The single greatest concentration of owner housing units are valued at $150,000 to $299,999
at 39.1% for the City of Winchester and at 42.1% for Frederick County. respectively. By 2025
those units valued at $500,000 or more are projected to account for 17.8% of the City’s owner
housing units and nine percent of the countywide owner housing units.
83
2
1,9
80
1,1
74
63
5
65
5
1,8
46
1,3
76
84
0
500
1,000
1,500
2,000
less than $149,999 $150,000 to$299,999
$300,000 to$499,999
$500,000 or more
2020
2025
Page 65 of 157

Housing Study and Neighborhood Revitalization Strategy
City of Winchester, Virginia
Page 18
Figure 11 – Owner Housing Value Distribution – Frederick County
3. Renter Housing Rents
RKG reviewed information provided by the American Community Survey regarding the
number of renter households and contract rent9 for the City of Winchester and Frederick
County (Table 8) over the 2010 to 2019 period, noting:
• City of Winchester – Over the full study period, the number of total renter units
increased by 15.8%, with an 18.4% increase in those with cash rent and a decline of
27.8% in those with no cash rent. As a result, those with no cash rent declined from a
5.5% representation in 2010 to 3.5% in 2019. There was a decline in the number of
renter units (808 units) with rents of less than $749 and marked increase in those with
rents of $1,000 or more (1,426 units), which is further indicated by the approximate
$430 increase in median contract rent (a change of 94%).
• Frederick County – Over the same period, the number of total renter units increased
by 16.3% (marginally greater than the City) with the number of units with cash rent
increasing (17.8%) and those with no cash increasing by 3.7% – in sharp contrast to the
decline experienced in the City of Winchester. There was also an increase countywide
among the number of units (639 units) with rents of $749 or less, also in sharp contrast
to the City of Winchester. Further dissimilar to the City of Winchester, there was a
decline (388 units) for those with rents of $1,000 or more despite an increase in those
with rents of $1,500 or more. For Frederick County the median contract rent increased
by 79.6%, or $403, both less than and similar observations for the City of Winchester.
As measured by actual median contract rent, renter housing is more affordable in the City
compared to countywide, although the gap is closing as median contract rents in the City
were 89.7% of those countywide in 2010 and increased to nearly 97% by 2019. Despite this,
9 Contract rent is the monthly rent agreed to (for example, the “rent” amount one finds advertised), while gross
rent is the contract rent plus the estimated monthly costs of utilities (electricity, gas, water, sewer and fuels)
whether they are paid for by the owner or the renter.
4,4
72
12
,75
1
8,9
20
1,9
27
3,9
09
13
,24
9
11
,45
5
2,8
33
1,500
3,500
5,500
7,500
9,500
11,500
13,500
less than$149,999
$150,000 to$299,999
$300,000 to$499,999
$500,000 or more
2020
2025
Page 66 of 157

Housing Study and Neighborhood Revitalization Strategy
City of Winchester, Virginia
Page 19
options for renter housing at less than $1,000 per month declined in the City of Winchester by
549 units while increasing countywide by 1,355 units. This appears to run counter to he
previously identified (Figure 7) of greater median and average household incomes in
Frederick County compared to the City of Winchester.
Table 8 – Comparisons of Contract Rent
2010 2019 % Δ 2010 2019 % Δ
Total Renter Units 5,048 5,848 15.8% 6,063 7,053 16.3%
610 427 -30.0% 204 670 228.4%
1,954 1,329 -32.0% 768 941 22.5%
1,605 1,864 16.1% 1,626 2,342 44.0%
544 1,780 227.2% 2,014 1,559 -22.6%
55 245 345.5% 823 890 8.1%
Total Units with Cash Rent 4,768 5,645 18.4% 5,435 6,402 17.8%
454$ 881$ 94.1% 506$ 909$ 79.6%
Total Units no Cash Rent 280 203 -27.5% 628 651 3.7%
Source : American Community Survey and RKG (2021)
City of Winchester Frederick County
less than $500
$500 to $749
$750 to $999
$1,000 to $1,499
Median Contract Rent
$1,500 or more
Renter Occupied Units -
Monthly Contact Rent
4. Occupied Housing by Year Built
Approximately one percent of the occupied housing in the City of Winchester, in total and by
tenure, has been built since 2014, as compared to approximately eight percent, in total and by
tenure, for Frederick County (Table 9).
Approximately 13% of all occupied housing in the City of Winchester was built between 2000
and 2013, compared with nearly 22% for Frederick County. There is some parity for owner-
occupied housing in this study period with 19% for the City of Winchester and 23% for
Frederick County. While the metric for renter-occupied housing, in the same period, is eight
percent for the City of Winchester and 19% for Frederick County.
For the City of Winchester approximately 80% of the owner-occupied housing was built in
1980 or earlier, and approximately 61% of the renter-occupied housing. This compares against
69% and 73.6%, respectively, for Frederick County.10
In summary, the occupied housing stock in the City of Winchester is much older when
compared to Frederick County, particularly for renter-occupied housing.
10 A This is further reflected by the residential building permit activity, for each, over the 2010 - 2019 period as
presented elsewhere in this report.
Page 67 of 157

Housing Study and Neighborhood Revitalization Strategy
City of Winchester, Virginia
Page 20
Table 9 – Comparison of Households by Year Built
All Owner Renter All Owner Renter
Total Households 10,490 4,642 5,848 32,010 24,724 7,286
113 52 61 2,548 2,003 545
1,366 886 480 7,006 5,624 1,382
4,753 1,960 2,793 18,937 14,529 4,408
4,258 1,744 2,514 3,519 2,568 951
Source : U.S. Census, American Community Survey and RKG (2021)
Occupied Housing Units by Year
Structure Built
City of Winchester - 2019 Frederick County - 2019
2014 or later
2000 to 2013
1980 to 1999
1979 or earlier
5. Housing Units by Units in Structure
As reported by ACS (Table 10) approximately 67% of City’s housing was one-unit (attached
and detached) for the 2010 – 2014 rolling average and 71% for the 2015 – 2019 rolling average.
This compares to approximately 85.5% in Frederick County for both study periods. With
respect to structures with multiple units, these accounted for 33% and 29% in the City of
Winchester, respectively for each study period. For Frederick County, the similar measures
were approximately 14.5 % for each study period.
As noted previously (Table 5) approximately 58% of the occupied housing in the City of
Winchester was renter-occupied in 2020, suggesting, based on the number of units in
structure, that much of the single family housing (one unit, attached and detached) in the City
of Winchester is renter-occupied as compared to owner-occupied. This disparity does not
present itself for Frederick County where renter-occupied units, in 2020, accounted for 18.4%
of the occupied housing, only marginally greater than the estimated 14.5% (2015 – 2019) of
multiple unit housing. In other words, some portion of the renter-occupied housing in the
City of Winchester is being met by typically owner occupied housing as opposed to more
traditional multi-family housing such as apartment complexes.
Table 10 - Comparison of Housing Units by Units in Structure
2010 - 14 2015 - 19 % Δ 2010 - 14 2015 - 19 % Δ
Total Housing Units 11,913 11,919 0.1% 31,877 34,161 7.2%
6,528 6,746 3.3% 24,418 25,587 4.8%
1,465 1,692 15.5% 2,805 3,655 30.3%
548 262 -52.1% 191 239 25.0%
810 942 16.2% 223 273 22.5%
846 739 -12.6% 446 410 -8.1%
1,656 1,478 -10.7% 1,116 1,947 74.5%
60 60 0.0% 2,678 2,050 -23.5%
Source : American Community Survey and RKG (2021)
Housing Units by Units per
Structure
City of Winchester Frederick County
1-unit, detached
5 to 9-units
10-units or more
Mobile Home and Other
1-unit, attached
2-units
3 to 4-units
Page 68 of 157
Housing Study and Neighborhood Revitalization Strategy
City of Winchester, Virginia
Page 21
C. HOUSEHOLDS
This section presents several metrics with respect to household (occupied housing)
composition and trends for the City of Winchester and Frederick County.
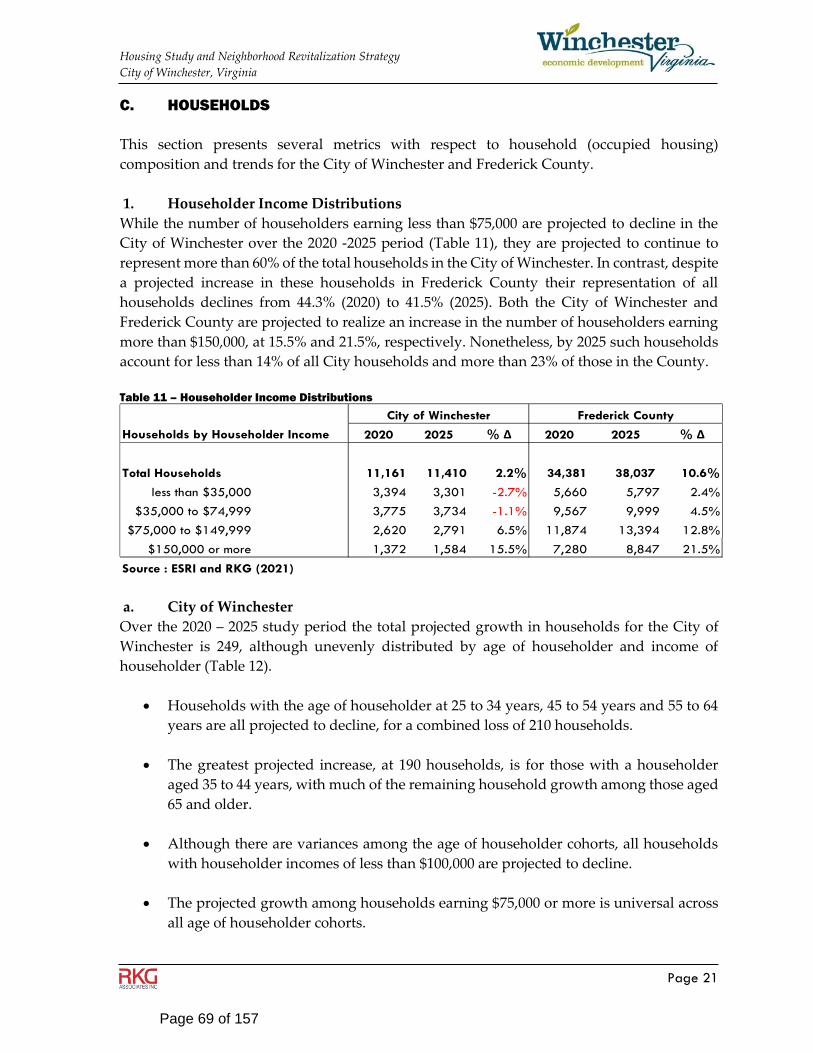
1. Householder Income Distributions
While the number of householders earning less than $75,000 are projected to decline in the
City of Winchester over the 2020 -2025 period (Table 11), they are projected to continue to
represent more than 60% of the total households in the City of Winchester. In contrast, despite
a projected increase in these households in Frederick County their representation of all
households declines from 44.3% (2020) to 41.5% (2025). Both the City of Winchester and
Frederick County are projected to realize an increase in the number of householders earning
more than $150,000, at 15.5% and 21.5%, respectively. Nonetheless, by 2025 such households
account for less than 14% of all City households and more than 23% of those in the County.
Table 11 – Householder Income Distributions
2020 2025 % Δ 2020 2025 % Δ
Total Households 11,161 11,410 2.2% 34,381 38,037 10.6%
3,394 3,301 -2.7% 5,660 5,797 2.4%
3,775 3,734 -1.1% 9,567 9,999 4.5%
2,620 2,791 6.5% 11,874 13,394 12.8%
1,372 1,584 15.5% 7,280 8,847 21.5%
Source : ESRI and RKG (2021)
Households by Householder Income
$150,000 or more
less than $35,000
City of Winchester Frederick County
$35,000 to $74,999
$75,000 to $149,999
a. City of Winchester
Over the 2020 – 2025 study period the total projected growth in households for the City of
Winchester is 249, although unevenly distributed by age of householder and income of
householder (Table 12).
• Households with the age of householder at 25 to 34 years, 45 to 54 years and 55 to 64
years are all projected to decline, for a combined loss of 210 households.
• The greatest projected increase, at 190 households, is for those with a householder
aged 35 to 44 years, with much of the remaining household growth among those aged
65 and older.
• Although there are variances among the age of householder cohorts, all households
with householder incomes of less than $100,000 are projected to decline.
• The projected growth among households earning $75,000 or more is universal across
all age of householder cohorts.
Page 69 of 157

Housing Study and Neighborhood Revitalization Strategy
City of Winchester, Virginia
Page 22
• The change in median household income for householders less than 25 years of age
falls below the projected City average for all households.
• The projected change in average household income falls below the City’s average for
those in the under 25 cohort, the 25 to 34 cohort and for those aged 75 or older.
Table 12 – Change in Households by Income and Age of Householder – City of Winchester
<25 25-34 35-44 45-54 55-64 65-74 75+ Total
29 (72) 190 (42) (96) 125 115 249
1 (28) 17 (14) (45) 9 18 (42)
(2) (47) 24 (29) (42) 3 12 (81)
14 (25) 13 (17) (27) 19 12 (11)
7 (2) 33 - (7) 16 13 60
9 30 103 18 25 78 60 323
1,702$ 3,235$ 3,810$ 4,284$ 3,475$ 2,607$ 1,773$ 2,625$
3,779$ 6,624$ 7,855$ 8,640$ 10,623$ 9,837$ 6,966$ 7,723$
Source : ESRI and RKG (2021)
Median Household Income
Average Household Income
Projected Change in
Households (2020 - 2025) by
Income and Age of
Householder
Total Households
Householder Income
$75,000 to $99,999
less than $25,000
$25,000 to $49,999
$50,000 to $74,999
$100,000 or more
Age of Householder
b. Frederick County
The projected growth for households throughout Frederick County is 3,656 with a decline
projected among householders aged 45 to 54 years, growth is projected for all other age of
householder cohorts (Table 13). Dissimilar to the City, household growth is projected across
all householder income levels, but is heavily weighted by those with householders 65 and
over, notable at household income levels of less than $75,000.
Page 70 of 157

Housing Study and Neighborhood Revitalization Strategy
City of Winchester, Virginia
Page 23
Table 13 – Change in Households by Income and Age of Householder –Frederick County
<25 25-34 35-44 45-54 55-64 65-74 75+ Total
34 402 728 (157) 295 1,005 1,349 3,656
3 (9) (8) (58) (55) 38 184 95
(2) (57) - (113) (70) 87 344 189
9 - 31 (98) (43) 158 228 285
8 87 137 (38) 42 140 173 549
16 381 568 150 421 582 420 2,538
1,377$ 6,151$ 2,972$ 6,332$ 6,275$ 6,961$ 4,270$ 4,457$
4,567$ 10,420$ 10,263$ 12,886$ 11,253$ 10,499$ 7,526$ 9,187$
Source : ESRI and RKG (2021)
Median Household Income
Average Household Income
Projected Change in Households
(2020 - 2025) by Income and
Age of Householder
Age of Householder
Total Households
Householder Income
less than $25,000
$25,000 to $49,999
$50,000 to $74,999
$75,000 to $99,999
$100,000 or more
2. Households by Household Size
In 2010, households in the City were typically one person households (34.3%) or two person
households (31.4%), followed by four or person per household (20.5%) and then three person
households at 13.8%. This household composition generally held constant in 2019, with two
persons households declining to a 30.4% representation and three person households
increasing to a 15.1% representation (Figure 12).
For Frederick County two person households accounted for 35.3% of all households in 2010,
followed by households of four or more persons (28%) and then single person households
(20.5%) and finally three person households (17.8%). In 2019, these representations held
constant noting that two person households increased to a 40.4% representation and
households of four or more persons declined to a 22% representation (Figure 13).
Comparatively, one- and two-person households in the City of Winchester accounted for
approximately 65% of all City households, in 2010 and in 2019. In Frederick County these
households increased from an approximate representation of 56% (2010) to 60% (2019).
Page 71 of 157

Housing Study and Neighborhood Revitalization Strategy
City of Winchester, Virginia
Page 24
Figure 12 - Household Distribution by Persons per Household (all Households)
Figure 13 - Household Distribution by Persons per Household (all Households)
a. City of Winchester
Table 14 presents measures of persons per household, in total, but also by tenure for the City
of Winchester. In 2010, owner households were predominantly two person (39.6%) and one
person households (26.7%) and generally held steady in 2019 although declining marginally
to a 24.6% representation for one person households. The general distribution of persons per
household, for renter households, in the City, was relatively unchanged (in terms of percent
of all renter households) over the 2010 – 2019 period, led in both periods by single person
households, two person households, four or more persons per household and finally three
person households.
In 2010 and in 2019, for the City of Winchester, one and two person households predominated
for both owners and renters at approximately 65% (±) of all households, respectively by
tenure.
3,6
38
3,3
30
1,4
68
2,1
71
3,5
93
3,1
94
1,5
81
2,1
22
0
800
1,600
2,400
3,200
4,000
One person Two persons Three persons Four + persons
2010 2019
5,9
27
10
,17
9
5,1
27
8,0
81
6,3
94
12
,93
7
5,6
31
7,0
48
3,000
5,000
7,000
9,000
11,000
13,000
One person Two persons Three persons Four + persons
2010 2019
Page 72 of 157

Housing Study and Neighborhood Revitalization Strategy
City of Winchester, Virginia
Page 25
Table 14 - Household Distribution by Persons per Household (by Tenure)
All Owner Renter All Owner Renter
Total Households 10,607 4,861 5,746 10,490 4,642 5,848
3,638 1,299 2,339 3,593 1,142 2,451
3,330 1,923 1,407 3,194 1,858 1,336
1,468 685 783 1,581 810 771
2,171 954 1,217 2,122 832 1,290
Source : U.S. Census, American Community Survey and RKG (2021)
Household Size by Number of
Persons per Household
City of Winchester - 2010 City of Winchester - 2019
Four + persons
One person
Two persons
Three persons
b. Frederick County
Table 15 presents measures of persons per household, in total, but also by tenure for Frederick
County. In 2010 and in 2019 owner households were predominantly two person households,
then households of four or more persons. Although the distribution of single person and three
person households changed somewhat, they represented a combined 35% (±) of all owner
households in both periods.
Renter households in Frederick County were led by households of four or more person in
2010 (34.5%) but declined to 20% by 2019. Single person households increased from 26.7%
(2010) to 29.2% (2019). Two person households increased from 27.8% (2010) to 33% (2019)
where they represented the dominant percentage of renter households.
Table 15 - Household Distribution by Persons per Household (by Tenure)
All Owner Renter All Owner Renter
Total Households 28,864 22,673 6,191 32,010 24,724 7,286
5,927 4,276 1,651 6,394 4,269 2,125
10,179 8,455 1,724 12,937 10,532 2,405
5,127 3,997 1,130 5,631 4,332 1,299
8,081 5,945 2,136 7,048 5,591 1,457
Source : U.S. Census, American Community Survey and RKG (2021)
Household Size by Number of
Persons per Household
Frederick County - 2010 Frederick County - 2019
One person
Two persons
Three persons
Four + persons
In summary, although there were some variations in persons per household between 2010
and 2019, for the City of Winchester and countywide, most households were single person
and two person households.
3. Households by Composition
Table 16 presents baseline household metrics for the City of Winchester and Frederick County
as reported by American Community Survey for 2019. While the average household size for
Page 73 of 157

Housing Study and Neighborhood Revitalization Strategy
City of Winchester, Virginia
Page 26
Frederick County, at 2.70 persons, is approximately 5.5% greater than for the City of
Winchester (2.56 persons). The average family size countywide (3.11 persons) is
approximately 6.5% less when compared with the City of Winchester (3.31 persons). In short,
smaller average household size in the City of Winchester but larger average family size
compared to Frederick County, possibly suggesting demand for smaller (unit SF) renter
housing in the City of Winchester but larger owner housing.
Table 16 – Baseline Household Metrics (ACS 2019)
Count as % Count as %
Total Households 10,490 na 31,503 na
2.56 na 2.70 na
3.31 na 3.11 na
Source : American Community Survey and RKG (2021)
Frederick CountyCity of Winchester
Average Family Size
Average Household Size
Household Composition
Metrics (ACS 2019)
Frederick County households are primarily married couple households, at nearly 60% of all
households as compared with a 37.6% representation in the City of Winchester (Figure 14).
As a result, all other household types in the City of Winchester account for a greater
percentage of all households when contrasted Frederick County.
Approximately 25.5 percent of City Households (2,661 households) are those with children
under 18 years of age, as compared with 28.6% (9,018 households) for all households in
Frederick County (Figure 15). The next greatest concentration of households with children
present, for the City of Winchester and countywide, is among female headed households,
followed by cohabitating households and then male headed households.
Figure 14 – Household Composition by Type of Household
37.6%
10.9%
19.3%
32.3%
59.4%
5.4%
13.9%
21.3%
0.0%
10.0%
20.0%
30.0%
40.0%
50.0%
60.0%
Married Couple CohabitatingCouple
Male Householder FemaleHouseholder
City of Winchester
Frederick County
Page 74 of 157

Housing Study and Neighborhood Revitalization Strategy
City of Winchester, Virginia
Page 27
Figure 15 – Presence of Own Children (<18 years) by Type of Household
4. Households Size by Household Type
The American Community Survey11 developed estimates of persons per household, for family
and non-family households for the City of Winchester and for Frederick County (Table 17).
The number of family households in the City of Winchester (6,126 households) represented
58% of all households as compared with 74.5% countywide (23,069 households). Conversely,
non-family households represented 42% and 25.5%, respectively for the City and Frederick
County.
Of the family households, a marginally higher percentage at nearly 57.5%, in the City of
Winchester (compared to 54% countywide) were of three or more persons, which may
explain, in part, the previously noted greater average family size in the City of Winchester
compared against Frederick County. The percent distribution of persons per household for
the City of Winchester and countywide are reasonably similar, although representing less of
all households countywide.
The greater concentration of non-family households in the City of Winchester, predominantly
one and two persons, likely speaks to the presence of, and continued demand for, renter
housing options throughout the City of Winchester.
11 Reflecting a rolling average for the 2014 – 2018 study period.
1,478
442 189 552
6,844
583 317
1,274
0
1,000
2,000
3,000
4,000
5,000
6,000
7,000
Married Couple CohabitatingCouple
Male Householder FemaleHouseholder
City of Winchester
Frederick County
Page 75 of 157

Housing Study and Neighborhood Revitalization Strategy
City of Winchester, Virginia
Page 28
Table 17 – Persons per Household, by Household Type
Count as % Count as %
Total Family Households 6,126 58.0% 23,069 74.5%
2,607 42.6% 10,584 45.9%
1,382 22.6% 5,637 24.4%
1,340 21.9% 3,809 16.5%
797 13.0% 3,039 13.2%
4,428 42.0% 7,904 25.5%
3,611 81.5% 6,478 82.0%
655 14.8% 1,224 15.5%
122 2.8% 144 1.8%
26 0.6% 41 0.5%
14 0.3% 17 0.2%
Source : American Community Survey and RKG (2021)
Households by Persons per
Household (ACS 2014-18)
City of Winchester Frederick County
3 Persons
4 Persons
5+ Persons
2 Persons
3 Persons
4 Persons
5+ Persons
1 Person
2 Persons
Non-Family Households
Page 76 of 157

Housing Study and Neighborhood Revitalization Strategy
City of Winchester, Virginia
Page 29
D. ECONOMICS
1. Labor Force and Unemployment
RKG reviewed monthly trends in the civilian labor force12 and unemployment statistics for
the City of Winchester and Frederick County over the January 2018 through November 2020
(latest available) study period.
• City of Winchester – The average monthly civilian labor force in the City of
Winchester was 14,651 persons over this period and the average monthly
unemployment rate was approximately 3.8% (Figure 16). While the civilian labor force
varied from month to month over the January 2018 to January 2020 period, the general
trendline indicated growth in the civilian labor force. Since that time and through
November of 2020 the general trendline has been downward. From January of 2018
through March of 2020 the unemployment rate was below four percent (typically
considered as full employment), but then spiked at 11.2% (April 2020) likely reflecting
impacts of the COVID-19 pandemic. Since then, the average monthly unemployment
has declined but remained above the four percent benchmark until November 2020
(3.9%). Since April of 2020, the unemployment rate has declined but so too has the
civilian labor force.
• Frederick County - The average monthly civilian labor force in Frederick County was
47,567 persons over this period and the average monthly unemployment rate was
approximately 3.2%, slightly less than that for the City of Winchester (Figure 17).
Similar to the City, despite month-to-month variations in the civilian labor force, the
trendline generally indicated growth (January 2018 through February of 2020). Since
that time, the trendline has dropped precipitously. Also like the City of Winchester,
unemployment varied but generally held below four percent, spiking at 9.8% in April
of 2020 and declining thereafter to 3.9% in November of 2020. Finally, like the City of
Winchester unemployment has declined since April 2020 but so too has the civilian
labor force.
For both the City of Winchester and Frederick County the monthly unemployment rate has
generally declined since the initial impacts of the COVID-19 pandemic on the economy in
April of 2020. While this reflects a decline in unemployment, statistically, it may also be, in
part, a function of a loss in the civilian labor force – essentially fewer persons may be
unemployed but fewer persons also comprise the civilian labor force.
12 Federal Reserve Economic Data.
Page 77 of 157

Housing Study and Neighborhood Revitalization Strategy
City of Winchester, Virginia
Page 30
Figure 16 – Civilian Labor Force and Unemployment Trends – City of Winchester
Figure 17 – Civilian Labor Force and Unemployment Trends – Frederick County
2. Employment by Industry Sector
Table 18 presents projected employment change (2021 – 2031) by industry sector for the City
of Winchester and Frederick County. Overall projected change for the City of Winchester is
393 positions (a two percent change) and for Frederick County 4,146 positions (a 12% change).
The projected change in total employment countywide is more than ten times that projected
for the City of Winchester.
Several industry sectors in the City of Winchester are projected to realize a decline in
employment, notably including construction, manufacturing, retail services and
administrative services. Nominal losses in employment are projected for Frederick County
across four industry sectors.
Industry sectors in the City of Winchester projected to realize substantial employment gains
include health care, management, education, government, and professional services. Notable
2.0%3.0%4.0%5.0%6.0%7.0%8.0%9.0%10.0%11.0%12.0%
13,00013,25013,50013,75014,00014,25014,50014,75015,00015,25015,50015,75016,000
Civilian Labor Force Unemployment Rate
1.0%2.0%3.0%4.0%5.0%6.0%7.0%8.0%9.0%10.0%
45,00045,50046,00046,50047,00047,50048,00048,50049,00049,50050,000
Civilian Labor Force Unemployment Rate
Page 78 of 157

Housing Study and Neighborhood Revitalization Strategy
City of Winchester, Virginia
Page 31
projected employment growth for Frederick County is in the transportation/warehousing,
manufacturing, government, retail trade and administrative sectors.
In all industry sectors where the City of Winchester is projected to realize a decline in
employment Frederick County is projected to realize an increase in employment.
Table 18 – Comparative Projected Employment Change by Industry Sector 2021 - 2031
2021 2031 # Δ 2021 2031 # Δ
Agriculture and other <10 <10 Insf. Data 272 282 10
Mining and other 0 0 - 61 40 (22)
Utilities 0 0 - 92 91 (1)
Construction 290 241 (49) 2,298 2,335 38
Manufacturing 1,228 730 (498) 6,203 6,852 649
Wholesale Trade 337 353 16 1,199 1,320 121
Retail Trade 3,893 3,511 (382) 3,488 3,835 347
Transportation / Whsing 246 200 (46) 4,057 5,074 1,018
Information 93 103 10 232 223 (9)
Finance and Insurance 645 630 (15) 2,333 2,819 486
Real Estate 272 195 (77) 257 309 53
Professional Services 984 1,126 142 836 847 11
Management 1,263 1,675 412 373 355 (17)
Administrative 863 644 (219) 1,675 2,007 332
Education 1,194 1,410 216 143 170 27
Health Care 7,252 7,876 624 1,483 1,538 54
Arts, Ent. And Recreation 273 367 94 239 245 6
Accommodation / Food 2,418 2,361 (57) 2,178 2,432 254
Other Services 612 652 40 779 903 124
Government 2,822 2,971 149 5,877 6,514 637
Unclassified Industry 56 93 37 64 94 30
All Sectors 24,745 25,138 393 34,139 38,286 4,146
Source : EMSI and RKG (2021)
Projected Employment
by Industry Sector
City of Winchester Frederick County
3. Establishments by Industry Sector
Table 19 reflects the number of establishments (2020) for the City of Winchester and for
Frederick County, with a total of 1,499 in the City and 1,986 countywide, noting that Frederick
County exceeds the City of Winchester by 437 establishments or about 1.3 times as many. This
variation is not universal across all industry sectors as the number of establishments in the
City of Winchester exceed those for Frederick County in retail trade, finance, education,
health care and government sectors – across these sectors there are 793 establishments in the
City of Winchester as compared to 676 establishments in Frederick County.
Page 79 of 157

Housing Study and Neighborhood Revitalization Strategy
City of Winchester, Virginia
Page 32
Table 19 – Comparative Establishments by Industry Sector (2020)
City County City as a %
Agriculture and other 1 22 4.7%
Mining and other 0 2 0.0%
Utilities 0 3 0.0%
Construction 48 229 20.8%
Manufacturing 29 103 28.3%
Wholesale Trade 38 94 40.4%
Retail Trade 247 194 127.5%
Transportation / Whsing 18 91 19.2%
Information 12 14 89.1%
Finance and Insurance 91 70 129.7%
Real Estate 57 63 89.7%
Professional Services 142 161 88.4%
Management 7 9 78.4%
Administrative 59 114 51.8%
Education 22 16 141.3%
Health Care 375 347 108.3%
Arts, Ent. And Recreation 17 19 85.7%
Accommodation / Food 125 133 94.4%
Other Services 128 172 74.7%
Government 58 50 115.5%
Unclassified Industry 26 33 79.4%
All Sectors 1,499 1,936 77.4%
Source : EMSI and RKG (2021)
Industry Sectors
Number of Establishments (2020)
4. Average Wages by Industry Sector
Across all industry sectors the estimated average annual wage (2020) for the City of
Winchester was $63,231 or approximately six percent greater than the average annual wage
of $59,920 in Frederick County (Figure 18). Industry sectors where the average annual wage
in the City of Winchester exceeded that countywide by 120% or more include the finance,
management, education, health care, government, and unclassified sectors. In most sectors
where the City’s average annual wage fell below that of Frederick County the typical
representation was ± 90%.
With respect to average annual wages and potential housing affordability issues, most
industry sectors in the City with wages of ± $50,000 are projected to realize a decline in
employment (2021 – 2031) except for other services, arts / entertainment, and unclassified
sectors. The picture is somewhat different for Frederick County as all industry sectors with
wages of ± $50,000 are projected to experience an increase in employment.
Page 80 of 157

Housing Study and Neighborhood Revitalization Strategy
City of Winchester, Virginia
Page 33
This could possibly have implications for Frederick County seeking owner housing in the
City of Winchester as the sample of single-family properties for sale, and those recently sold,
in the City is less than for Frederick County (Table 22). However, the reverse may be true for
renter housing as the sample of available apartments (Table 24) in both locales indicates a
lesser monthly rent, on average, countywide as contrasted to the City of Winchester.
Furthermore, despite some projected job losses across the City of Winchester by 2031,
approximately 31% of the City employment at that time is among industry sectors with wages
less than ± $50,000 including approximately 3,500 employed in retail trade (wage of $35,380)
and another approximate 2,360 employed in the accommodations and food services sector
(wage of $21,802).
Figure 18 – Comparative Average Annual Wages by Industry Sector (2020)
5. Employment by Occupation
Table 20 presents the projected change in employment, by occupation, for the City of
Winchester and for Frederick County, along with the 2020 average hourly wage. Several
occupations in the City of Winchester are projected to experience a decline in employment
while none are projected for Frederick County. Like annual wages by industry sector, many
of the occupation sectors, for the City of Winchester and countywide, have average hourly
wages that equate to less than an estimated ± $50,000 in total annual wages – as highlighted.
RKG estimates that a minimum hourly wage of $24.04 would result in an annual wage of
$50,000.13 The average hourly wage for all occupations in Frederick County falls below this
threshold while the average hourly wage for all occupations in the City of Winchester
marginally exceeds this threshold – both speaking to possible housing affordability issues.
13 This reflects the assumption of an eight-hour workday, five days a week for 52 weeks.
$0
$20,000
$40,000
$60,000
$80,000
$100,000
$120,000 City of Winchester Frederick County
Page 81 of 157

Housing Study and Neighborhood Revitalization Strategy
City of Winchester, Virginia
Page 34
Table 20 – Change in Employment (2021 -2031) by Occupation with Hourly Wage
Management Occupations 127 $56.09 208 $54.46
Business and Financial Operations Occupations 150 $36.53 352 $34.84
Computer and Mathematical Occupations 88 $43.36 111 $41.67
Architecture and Engineering Occupations (13) $40.24 52 $38.74
Life, Physical, and Social Science Occupations 8 $36.49 38 $30.93
Community and Social Service Occupations 48 $23.58 36 $25.72
Legal Occupations 34 $30.87 9 $33.39
Educational Instruction and Library Occupations 108 $34.84 175 $28.87
Arts, Design, Entertainment, Sports, and Media Occupations 77 $23.34 24 $22.95
Healthcare Practitioners and Technical Occupations 167 $42.91 112 $43.10
Healthcare Support Occupations 381 $13.82 12 $13.12
Protective Service Occupations 32 $21.19 58 $21.28
Food Preparation and Serving Related Occupations (32) $11.61 298 $11.18
Building and Grounds Cleaning and Maintenance Occupations (17) $13.44 77 $14.16
Personal Care and Service Occupations 57 $13.86 38 $14.48
Sales and Related Occupations (230) $16.02 371 $18.89
Office and Administrative Support Occupations (64) $18.28 359 $18.08
Farming, Fishing, and Forestry Occupations Insf. Data Insf. Data 9 $13.87
Construction and Extraction Occupations (13) $21.79 55 $22.08
Installation, Maintenance, and Repair Occupations (3) $22.72 283 $22.96
Production Occupations (373) $18.74 398 $18.94
Transportation and Material Moving Occupations (136) $15.42 1,072 $16.86
Military-only occupations 0 $0.00 0 $0.00
Unclassified Occupation 0 $0.00 0 $0.00
Total 393 $24.37 4,146 $22.18
Source : EMSI and RKG (2021)
Employment Change bt Selected
Occupations
City of Winchester
Δ in
Employment
Avg Hourly
$
Frederick County
Δ in
Employment
Avg Hourly
$
< $50,000
6. Industry Clusters
RKG also reviewed an analysis of industry clusters within the City of Winchester and
Frederick County, as developed by EMSI. This analysis develops a composite and weighted
ranking of the “relative strength” of an industry cluster based on such metrics as earnings,
overall growth, regional competitiveness, a degree of specialization whereby the
“performance” of the cluster exceeds national averages, and a measure of the cluster’s
contribution to the gross regional product (GRP). In short, the higher the cluster ranking the
stronger the cluster to the local economy.
The weak and strong clusters for the City of Winchester and Frederick County are presented
next, noting that all clusters may not be present in either location. For example, per the EMSI
analysis, there is no Production Technology and Heavy Machinery or Biopharmaceuticals
clusters in the City of Winchester. The former, along with the Communications Equipment
and Services cluster are examples of clusters that are not present in Frederick County.
Page 82 of 157

Housing Study and Neighborhood Revitalization Strategy
City of Winchester, Virginia
Page 35
There are some commonalities between the City of Winchester and Frederick County as both
exhibit weak clusters in Performing Arts, Hospitality/Tourism and Local Food/Beverage
Services. On the other hand, both exhibit strong clusters in Federal Government Services,
otherwise there is no duplication of strong clusters suggesting a diversification of strong
clusters between the two entities.
a. City of Winchester
With a composite ranking of 82 (out of 100) the Business Services cluster ranks highest in the
City of Winchester. The average cluster ranking in the City of Winchester is 41 and those
clusters ranking 53 or higher are considered as top performers, while those with a ranking of
28 or less are weak performers, as highlighted in Figure 19. Figure 19 – Weak and Strong Industry Clusters – City of Winchester, VA
b. Frederick County
With a composite ranking of 91 (out of 100) the Food Processing and Manufacturing cluster
ranks highest in the County. The average cluster ranking in the County is 36 and those clusters
ranking 48 or higher are considered as top performers, while those with a ranking of 24 or less
are weak performers, as highlighted in Figure 20.
827877
7266
2828
23222120
Business SvcsLocal Health Svcs
Federal Govt. SvcsEducation and Knowledge Creation
Local Govt. SvcsLocal Education and Training
Performing ArtsLocal Hospitality Businesses
Local Commercial SvcsHospitality/Tourism
Local Food/Beverage Svcs
Composite Ranking
Page 83 of 157

Housing Study and Neighborhood Revitalization Strategy
City of Winchester, Virginia
Page 36
Figure 20 – Weak and Strong Industry Clusters – Frederick County, VA
The ability to meet the required housing alternatives, as preferred by the employees within
these clusters, may be critical in retaining and/or attracting such employment and economic
growth and diversification which they represent. At a minimum, RKG recommends that the
City of Winchester initiates a dialogue with representative business leaders in these clusters
to better understand these preferences and requirements as understood by respective
employers in these clusters.
9183
7865
6051
2424232322212121
16
Food Processing/ManufacturingLocal Financial Svcs
Distribution/Electronics CommerceFederal Govt. Svcs
PlasticsConstruction
Local Hshld Goods and SvcsAgricultural Svcs
Local Personal SvcsEducation/Knowledge Creation
Local Food/Beverage SvcsHospitality/Tourism
Local Entertainment/Media SvcsPerforming Arts
Local Community/Civic Svcs
Composite Ranking
Page 84 of 157

Housing Study and Neighborhood Revitalization Strategy
City of Winchester, Virginia
Page 37
7. Commuting Patterns
Approximately 48% of the City of
Winchester employment has a commute
of less than ten miles and 25% have a 10-
to 24-mile commute. Figure 21 presents a
thematic density map of travel times to
place of work.
According to the U. S. Census, for 2018,
there were 28,880 employees working in
the City of Winchester. This included
24,799 workers commuting into the City
of Winchester, 86%, and 4,081 City
residents, 14% (Figure 22).
Approximately 8,439 City residents (or 67% of the total) commute outside of the City of
Winchester for their place of employment.
Approximately 38% of the City of
Winchester employment resides
elsewhere throughout Frederick County,
as presented in the accompany table of
place of residence of City of Winchester
employment.
Commuting 2018
Top Locales Count
4,081 14.1%
10,963 38.0%
2,125 7.4%
1,503 5.2%
1,318 4.6%
1,050 3.6%
898 3.1%
569 2.0%
488 1.7%
457 1.6%
5,428 18.8%
Total 28,880 100.0%
Source : U. S. Census and RKG (2021)
Loudoun County, VA
Clarke County, VA
Fairfax County, VA
All Other
Jefferson County, WV
% of Total
Winchester City
Frederick County, VA
Berkeley County, WV
Shenandoah County, VA
Warren County, VA
Hampshire County, WV
Figure 22 – Worker Flow Metrics (2018)
Accompanying Measures for Figure 22
Figure 21 – Worker Commute Distance (2018)
Page 85 of 157

Housing Study and Neighborhood Revitalization Strategy
City of Winchester, Virginia
Page 38
3 RESIDENTIAL MARKET ANALYSIS
A. EXISTING CONDITIONS
1. Building Permit Trends
RKG reviewed statistics provided by the Weldon Cooper Center for Public Service (and from
the U.S. Census) to report on single family and multi-family14 residential building permit
activity for the City of Winchester and Frederick County over the 2010 – 2019 study period.
a. City of Winchester
Over the 2010 to 2019 study period there were a total of 567 residential building permits in
the City of Winchester, with approximately 38% (213 permits) as single-family permits,
averaging 21 permits annually at an average value per permit of approximately $214,825.15
During this study period the number of single-family permits peaked at 37, in 2010 and again
in 2019 (Figure 23). During the intervening years, the number of permits troughed in 2012
(seven permits) and marginally recovered in 2013 (nine permits). In 2010 and in 2017 the
average value per permit exceeded $300,000, but otherwise exhibited a high degree of
volatility at average values per permit of approximately $265,000 or less.
Information current as of March 6, 2021 (refer to Table 25) as provided by the City of
Winchester, indicates that since 2011, 36 townhomes units have been delivered16 and are
occupied, all two-bedroom units.
Figure 23 – Single Family Building Permit Trends – City of Winchester
37
26
79
21
13
25
1820
37
0
5
10
15
20
25
30
35
40
$0
$40,000
$80,000
$120,000
$160,000
$200,000
$240,000
$280,000
$320,000
$360,000
Average Value Number of Units Weldon Cooper and RKG
14 These include duplexes (1, 2 units), smaller properties of 3 to 4 units and larger complexes of five or more units. 15 Note, for 2018 data was suppressed other than total unit count. 16 These include Brooks Manor, Phase I (10 units) and Meadow Branch, Phase I (26 units).
Page 86 of 157

Housing Study and Neighborhood Revitalization Strategy
City of Winchester, Virginia
Page 39
The remainder (62%) of the residential building permits were for multi-family units, total 354
units or approximately 35 units annually. This was dominated by permits for complexes of
five or more units totaling 341 units or 68 annually (Figure 24). However, dissimilar to single
family permit activity, the number of permits (units) issued per year varied widely from no
permits being issued to a comparatively high number of permits in 2017 and in 2018. The
average value of these permits, on a per unit basis, was nearly $65,800.17 In 2016 there permits
issued for five units, averaging $194,000 per units and in 2017 permits were issued for 152
units (averaging $109,300 per unit. These 2016 and 2017 permits heavily influenced the overall
average value per unit which otherwise did not exceed $70,000 per unit.
Information current as of March 6, 2021 (refer to Table 25) as provided by the City of
Winchester, indicates that since 2011, 307 apartment units have been delivered18 and are
occupied, with one bedroom (26%), two bedroom (59%) and three bedroom (14%) as the
apartment mix.
In summary, the average annual residential building permit activity for the City of
Winchester (2010 – 2019) was dominated by permits for multi-family units (accounting for
62% of the total annual permit activity) at relatively lesser average values per unit (averaging
31% of the value for single family units) and was more sporadic in nature.
Figure 24 – Multi-Family Building Permit Trends – City of Winchester
6
51
2 5
152138
1
31
61
91
121
151
$0
$30,000
$60,000
$90,000
$120,000
$150,000
$180,000
$210,000
Average Value Number of Units Weldon Cooper and RKG
b. Frederick County
Over the 2010 – 2019 period a total of 5,296 residential building permits were issued in
Frederick County with 86 percent for single family units, averaging 454 permits annually. In
all years but for the 2010 – 2012 period, the average annual number of single-family permits
surpassed 300 (Figure 25). This peaked with 791 permits in 2016 and has declined thereafter
but still exceeding 500 permits annually. The average value per permit for single family
17 Ibid. 18 These include the Bottling Works (23 units), Lofts at Jubal Early Square (140 units) and Meadow Branch, Phase
I (144 units).
Page 87 of 157

Housing Study and Neighborhood Revitalization Strategy
City of Winchester, Virginia
Page 40
development was approximately $213,045 which is marginally less than the average value
($214,825) in the City of Winchester. In most years, the average permit value in Frederick
County was nearly $200,000 or more. The peak was in 2018 with an average value of $236,400
and the trough was in 2010 at an average value of $183,475. Nonetheless, the average permit
values for Frederick County were generally similar and clustered in a much tighter range
when compared to those for the City of Winchester.
Overall, the average annual permit activity for singe family units (2010 – 2019) for the City of
Winchester represented less than five percent of the similar activity for Frederick County,
although the average value exceeded Frederick County by a nominal one percent.
Figure 25 - Single Family Building Permit Trends – Frederick County
247 229266
357
436
532
791
562525
594
200
300
400
500
600
700
800
$175,000
$190,000
$205,000
$220,000
$235,000
$250,000
Average Value Number of Units Weldon Cooper and RKG
The remaining 14% of the building permit activity in Frederick County was for multi-family
properties (757 units) which, like the City, was dominated by permits for developments of
five or more units (572 units). Also similar to the City of Winchester, the multi-family permit
activity was sporadic over the study period (Figure 26) averaging 76 permits (units) annually
but more so in the 2018 – 2019 study period with previous peaks in 2011 (153 units) and in
2015 (137 units). The average permit (per unit) value was $149, 139 with a peak value of
$313,725 per unit in 2001 (153 units). While the average permit value for multi-family in
Frederick County was less than for single family (at 70%) the variance was much less when
compared to that for the City of Winchester.
Page 88 of 157

Housing Study and Neighborhood Revitalization Strategy
City of Winchester, Virginia
Page 41
Figure 26 – Multi-Family Building Permit Trends – Frederick County
0
153
0 0 0
137
0
99
191177
0
20
40
60
80
100
120
140
160
180
200
$0
$40,000
$80,000
$120,000
$160,000
$200,000
$240,000
$280,000
$320,000
$360,000
Average Value Number of Units Weldon Cooper and RKG
The City of Winchester also reached out to Frederick County to obtain permit activity (permit
values) over the 2016 through 2020 study period, for commercial permits and residential
permits (Figure 27). This information is reflective of all permit activity, and is not limited to
new construction, only. Nonetheless, it does offer an overview of total permit activity
countywide, noting:
• Commercial Permit Values – The value of commercial permits ranged from $29.03
million in 2017 to $48,25 million in 2019, averaging $35.76 million over the study
period.
• Residential Permit Values – The average value of residential permits was $19.54
million over the five years, ranging from $13.18 million in 2020 to $28.82 million in
2017. Over the study period, residential permit values averaged 35.3% of total permit
values, from a low of 29.1% in 2020 to a high of 49.8% in 2017.
• Total Permits – On average, 2,960 permits were issued annually in Frederick County,
however, it should be noted that sharp increase in permit activity for 2019 and for 2020
reflects the inclusion of permits issued for the City of Winchester Utilities expansion
tank project. In the prior years, 2016 through 2018, the number of permits issued for
commercial and residential activity averaged 1,812 annually.
Page 89 of 157

Housing Study and Neighborhood Revitalization Strategy
City of Winchester, Virginia
Page 42
Figure 27 – Trends in Building Permit Activity – Frederick County
2. Single Family Residential for Sale
RKG reviewed residential listings19, from Zillow, for single family housing for the City of
Winchester and Frederick County to develop a sample of 50 properties, each, currently for
sale as either from the existing inventory, recently under contract and as new construction
(Table 21).
Table 21 – Sample Inventory of Single Family Residential for Sale
Exiting 17 2,283 360,847$ 158$ 3 2.8
Under Contract 20 2,028 299,530$ 148$ 3 2.4
New Construction 13 2,113 432,470$ 205$ 3 2.6
All for Sale 50 2,137 354,942$ 166$ 3 2.6
Exiting 9 2,091 334,922$ 160$ 3 2.3
Under Contract 20 2,055 355,110$ 173$ 3 2.6
New Construction 21 2,429 439,414$ 181$ 3 2.6
All For Sale 50 2,218 386,884$ 174$ 3 2.5
Source : Zillow and RKG (2021)
Count
City of Winchester for Sale
Single Family Residential
$ / SF BR Baths
Frederick County for Sale
Single Family Residential
Avg SF Asking $
Count Avg SF Asking $
$ / SF BR Baths
a. City of Winchester
Many listings (at 40%) were under contract with an average size of 2,028 SF with an average
price of $299,530 (or $148/SF). This is followed by for sale properties from the existing
19 Zillow listings current as of March 3, 2021.
$29,3
18,6
55
$29,0
28,2
83
$40,0
66,5
51
$48,2
53,5
07
$32,1
17,8
65
$35,7
56,9
72 $17,5
18,9
22
$28,8
24,1
10
$12,3
10,7
89
$25,8
73,6
04
$13,1
84,9
77
$19,5
42,4
80
-
1,000
2,000
3,000
4,000
5,000
6,000
$0
$5,000,000
$10,000,000
$15,000,000
$20,000,000
$25,000,000
$30,000,000
$35,000,000
$40,000,000
$45,000,000
$50,000,000
2016 2017 2018 2019 2020 Average
Commercial Permit Value Residential Permit Value Total Permits
Page 90 of 157

Housing Study and Neighborhood Revitalization Strategy
City of Winchester, Virginia
Page 43
inventory of housing and then by new construction. The average size (SF) of properties under
contract is less than that for either the existing inventory or for new construction. Of note is
that new construction (average SF) is somewhat less than the existing inventory possibly
indicative of different residential preferences or trending average household sizes. The
average price of properties under contract is well below the existing inventory and the
inventory of new construction, which is the highest at $432,470 likely reflecting increased
construction costs, amenities and possibly land values.
b. Frederick County
In Frederick County the number of residential listings under contract and those which are
new construction are similar in count. However, the average unit size for new construction
(2,429 SF) well exceeds that for both the existing inventory and for those listings under
contract. Similarly, the average price for new construction listings, at $439,414 exceeds that
for the existing inventory (by approximately $104,500) and for listings under contract (by
approximately $84,300).
In summary, the average pricing for new construction in Frederick County is marginally
higher than that for the City of Winchester, in absolute dollars but much higher on a per SF
basis. The average price for existing units in the City of Winchester are higher in absolute
dollars but comparable on a per SF basis. New construction listings in the City of Winchester,
although priced comparably to Frederick County, are typically smaller unit, by slighter mor
than 300 SF on average.
3. Single Family Residential Transactions
RKG next reviewed Zillow for recent single-family transactions20 for the City of Winchester
and Frederick County, comparing these to the for-sale sample inventory (Table 22). For the
City of Winchester, while the sample of sold properties are relatively similar in size (SF) to
the sample of for sale properties, the average pricing differs markedly with units sold
accounting for 87% of the asking price of units for sale, a differential of approximately $45,300.
The for-sale pricing includes many properties which are new construction, and which may be
driving this differential, however, the differential may also suggest, to some extent, that
selling prices, on average, are being realized at values less than original asking prices. This
could also be indicative of affordability issues among homebuyers.
With respect to Frederick County, recently sold properties are about 110 SF, on average, larger
than for sale properties – a nominal difference. However, there is better parity (91%) between
selling price and asking price, a difference of approximately $36,700. Similar notations, as for
the City of Winchester, may explain this differential. Nonetheless, for Frederick County, the
for-sale pricing and the sold pricing exceeds the City of Winchester by nine percent and 13%,
respectively.
20 Zillow listings current as of March 4, 2021.
Page 91 of 157

Housing Study and Neighborhood Revitalization Strategy
City of Winchester, Virginia
Page 44
Table 22 – Recent (February 2021) Single Family Transactions and For Sale Comparisons
For Sale sample 50 2,137 354,942$ 166$ 3 2.5
Recently Sold sample 50 2,032 309,638$ 152$ 3 2.5
Sold : For Sale 100% 95% 87% 92% 100% 100%
Frederick County Single
Family Residential Count Avg SF Asking $ $ / SF BR Baths
For Sale sample 50 2,218 386,884$ 174$ 3 2.5
Recently Sold sample 50 2,328 350,227$ 150$ 3 2.7
Sold : For Sale 100% 105% 91% 86% 100% 108%
Source : Zillow and RKG (2021)
BR Baths
City of Winchester Single
Family Residential Count Avg SF Asking $ $ / SF
I
4. Rental Properties
RKG researched apartfinder.com and spoke with selected are property managers to develop
a sample of available apartment properties in the City of Winchester and in neighboring
communities.
a. City of Winchester
A sample of eleven apartment properties was developed for the City of Winchester (Table 23)
representing a mix of one-, two- and three-bedroom units of varying average unit size (SF)
and asking monthly rent rates, noting the following:
• One Bedroom Units – the listed apartments varied in unit size from 320 SF to 1,287
SF, averaging 824 SF. Outside of the Lofts at Jubal Square all other units are less than
1,000 SF. Asking rents ranged from a monthly low of $860 to a high of $1,65021,
averaging $1,315 per month or approximately $1.60/SF/month. If the Brookfield
Corporate apartments are excluded the average unit size becomes 845 SF, the average
monthly rent declines to $1,267 or $1.50/SF/month.
• Two Bedroom Units – apartments range in size from 825 SF to 1,587 SF (an outlier
represented by the Lofts at Jubal Square)22 and average 1,078 SF (a 31 percent increase
over the sample of one-bedroom units). Monthly rents range from $979 to as much as
$1,800 (the Brookfield Corporate apartments) and average $1,402 (an increase of seven
percent over one-bedroom units), or approximately $1.30/SF/month. If the Brookfield
Corporate apartments are excluded the average unit size becomes 1,097 SF, the
average monthly rent declines to $1,369 or $1.25/SF/month.
21 These are represented by the Brookfield Corporate apartments which serve as short-term or extended stay units,
completely furnished, all paid utilities and with weekly cleaning services. 22 The Lofts at Jubal Square offer a more spacious and luxury apartment s with open floorplans, arched entries,
solariums, large windows, fireplaces, and in apartment laundry. En suite bathrooms are standard in most floor
plans and master bedroom suites feature large walk-in closets.
Page 92 of 157

Housing Study and Neighborhood Revitalization Strategy
City of Winchester, Virginia
Page 45
• Three Bedroom Units – all units in the three-bedroom sample are 1,000 SF or more
and average 1,251 SF (16 percent larger than the average two-bedroom unit). Monthly
rents range from a low of $1,00 to a high of $1,715 (the Lofts at Jubal Square) and
average $1,427 per month (a marginal two percent increase over two-bedroom units)
and average $1.14/SF/month.
Table 23 – Sample Listing of Apartments for Rent – City of Winchester
SF Rent Rent / SF SF Rent Rent / SF SF Rent Rent / SF
1,000 979$ 0.98$ 1,123 1,320$ 1.18$
825 1,475$ 1.79$
825 1,300$ 1.58$ 1,000 1,450$ 1.45$
1,050 1,500$ 1.43$
755 1,233$ 1.63$ 933 1,388$ 1.49$
320 860$ 2.69$ 960 995$ 1.04$ 1,000 1,100$ 1.10$
680 1,650$ 2.43$ 850 1,800$ 2.12$
1,360 1,400$ 1.03$
965 1,360$ 1.41$ 1,267 1,510$ 1.19$ 1,450 1,715$ 1.18$
1,287 1,460$ 1.13$ 1,584 1,585$ 1.00$
Autumn Wind /1 968 1,064$ 1.10$ 1,128 1,220$ 1.08$
Stuart Hill 845 1,298$ 1.54$ 1,099 1,485$ 1.35$
915 1,358$ 1.48$ 1,215 1,510$ 1.24$ 1,296 1,582$ 1.22$
Hiatt Run 1,258 1,490$ 1.18$ 1,400 1,650$ 1.18$
Averages 824 1,315$ 1.60$ 1,078 1,402$ 1.30$ 1,251 1,427$ 1.14$
Source : apartmentfinder.com, Property Managers and RKG (2021)
/1 These are tax credit properties with income restrictions.
Madison Village
Peppertree Lane
Fay Street Community
Brookfield Corporate
Contrail Park
The Lofts at Jubal Square
Noah at Pine Plaza
Sample of Apartment
Listings - City of
Winchester
1 BR Units 2 BR Units 3 BR Units
Preston Place /1
Two of the properties in the City of Winchester are tax credit properties and as such have
income restrictions (which may apply to some or all residents) indexed to the number of
residents per unit and with annual incomes not to exceed those as noted in Figure 28. For each
of the properties the income restrictions increase by 14%, 12%, 11%, 8% and 7% with each
additional resident per unit.
Page 93 of 157

Housing Study and Neighborhood Revitalization Strategy
City of Winchester, Virginia
Page 46
Figure 28 – Tax Credit Properties – Income Restrictions by Household Size
b. Surrounding Communities
RKG also developed a sample of apartment listings in surrounding communities23 (Table 24)
noting:
• One Bedroom Units – the listed apartments varied in unit size from 707 SF to 1,024 SF
(an outlier) and averaged 830 SF per unit. Except for the Lee Trace outlier24, all units
were less than 1,000 SF. The average rent is $1,082 per month or approximately
$1.30/SF/month. The average one-bedroom SF from the City of Winchester sample is
comparable to the surrounding communities’ sample; however, the average rent is
less (with and without the Brookfield Corporation outlier from the City of Winchester
sample).
• Two Bedroom Units – apartments range in size from 775 SF to 1,448 SF and average
1,069 SF per unit marginally smaller than the City of Winchester sample. Most unit
exceed 1,000 SF. The average monthly rents range from $790 to $1,410 with most
exceeding $1,000 and averaging $1,158 or approximately $1.08/SF/month. The average
rent for a two bedroom in these communities is less when compared to the City of
Winchester.
• Three Bedroom Units – the sampling identified two complexes offering three-
bedroom units, averaging 1,210 SF with an average monthly rent of $1,240 or
$1.02/SF/month. Although a limited sample, the average unit size is comparable to the
City of Winchester sample while the average monthly rent is less.
23 These included Stephens City and Martinsburg. 24 This is The Berkeley floor plan for a one-bedroom which includes two closets, a walk-in closet and a den,
differentiating it from other one-bedroom units.
$3
3,3
60
$3
8,1
00
$4
2,8
40
$4
7,5
80
$5
1,4
20
$5
5,2
00
$3
2,5
20
$3
7,1
40
$4
1,7
60
$4
6,3
80
$5
0,1
00
$5
3,8
20
$20,000
$25,000
$30,000
$35,000
$40,000
$45,000
$50,000
$55,000
$60,000
1 2 3 4 5 6Preston Place Autumn Wind
Page 94 of 157

Housing Study and Neighborhood Revitalization Strategy
City of Winchester, Virginia
Page 47
Table 24 - Sample Listing of Apartments for Rent – Surrounding Communities
SF Rent Rent / SF SF Rent Rent / SF SF Rent Rent / SF
1,181 1,350$ 1.14$
1,082 1,250$ 1.16$
960 1,100$ 1.15$
707 881$ 1.25$ 953 1,170$ 1.23$
821 924$ 1.13$ 953 1,016$ 1.07$
707 976$ 1.38$ 1,108 1,081$ 0.98$
1,108 1,106$ 1.00$
775 790$ 1.02$
860 850$ 0.99$ 1,096 1,000$ 0.91$
Lee Trace 890 1,334$ 1.50$ 1,089 1,399$ 1.28$ 1,324 1,480$ 1.12$
1,024 1,297$ 1.27$ 1,224 1,368$ 1.12$
Linden at Martinsburg 1,448 1,410$ 0.97$
1,150 1,163$ 1.01$
Averages 830 1,082$ 1.30$ 1,069 1,158$ 1.08$ 1,210 1,240$ 1.02$
Source : apartmentfinder.com, Property Managers and RKG (2021)
Polo Green
Fox Craft Village
Tasker Village
Berkshire Court
Sample of Apartment
Listings - Neighboring
Communities
1 BR Units 2 BR Units 3 BR Units
Overall, for the sample of one-, two- and three-bedroom units, the average size in the
surrounding communities is somewhat, although nominally less, than the average size for the
City of Winchester sample. However, asking rents in the surrounding communities, for each
bedroom type, is less when compared to the City of Winchester, ranging from approximately
$190 per month (three bedroom) to $245 month (two bedroom) indicating that in the
surrounding communities a renter gets a comparable apartment (in terms of average SF) at a
better monthly rent.
5. Pipeline Residential Development
Information current as of March 6, 2021, as provided by the City of Winchester (Figure 29),
indicates that over the 2011 – 2021 timeframe a total of 1,225 residential units in the City of
Winchester have been completed (28% of total) and another 882 units are planned (72% of
total) both predominantly apartments at 307 units and 645 units, respectively.
Figure 29 – PUD Residential Development 2011 - 2021
More specific information by project identification and development mix is provided in Table
25, and notes the following:
0
50
100
150
200
250
300
350
400
Apt (1 BR) Apt (2 BR) Apt (3 BR) Apt (4 BR) Townhomes CondosCompleted Incomplete
Page 95 of 157

Housing Study and Neighborhood Revitalization Strategy
City of Winchester, Virginia
Page 48
• Under construction – 70 apartment units are currently under construction and 16
townhome units are currently under production.
• Pending (not yet approved) – 134 apartment units pending but not yet approved.
• Proposed or planned (not yet approved) – 441 apartments units, 176 townhome units
and 44 condominium units.
Table 25 – PUD Residential Development 2011 – 2021 City of Winchester
Construction Age
Status Restricted
1 2 3 4 2 3 2 3
Brooks Manor, Phase 1 1/24/2019 Full Occupancy N 10 0.86 10 11.63
The Bottling Works 7/21/2016 Full Occupancy N 13 10 1.3 23 17.69
Lofts at Jubal Early Sq. 6/1/2015 Full Occupancy N 24 96 20 8.53 140 16.41
Meadow Branch Phase 1 12/20/2016 Full Occupancy N* 44 76 24 26 10.59 170 16.05
Harrison Plaza 3/12/2020 Under Cons. N 25 45 4.68 70 14.96
Brooks Manor, Phase 2 1/24/2019 Under Cons. N 14 2 1.47 16 10.88
Meadow Branch Phase 2 Not Yet Approved Pending N 36 74 24 7.5 134 17.87
Creekside Condos Not Yet Approved Not Started N 14 31 4.44 45 10.14
Hackwoods SVWC Not Yet Approved Not Started Y 7 32 9.65 39 4.04
The Local(Spring St) Not Yet Approved Not Started N** 8 140 42 8 6.23 198 31.78
Roberts Square Not Yet Approved Not Started N 36 1.96 36 18.37
Linden Drive Not Yet Approved Not Started Y/N*** 114 36 156 22.77 306 13.44
Treetops, Phase 2 Not Yet Approved Not Started N 12 6 1.87 18 9.63
375 W Tevis Not Yet Approved Not Started N 20 1.94 20 10.31
* 26 townhouse-styled apts- not separately platted for ownership Completed 81 182 44 - 36 - - - 343
** Oriented towards SU Students Incomplete 202 369 66 8 170 22 14 31 882
*** 160 Apts. age restricted, 154 T.H. not age-restricted TOTAL 283 551 110 8 206 22 14 31 83.79 1,225 14.62
Source : City of Winchester, VA and RKG (2021)
Density
(Number
of
units/Acre)Project Site Plan Approval Apartments (Bedrooms) Townhouses Condos Acreage Total Units
B. HOUSING AFFORDABILITY ANALYSIS
1. Methodology and Data Sources
RKG analyzed the affordability of the City of Winchester’s housing stock for both renter and
owner households. According to the Department of Housing and Urban Development
(HUD), affordability is defined as a household paying no more than 30% of its monthly gross
income on monthly housing costs. Therefore, for the purposes of this study, households
spending over 30% of its monthly gross income on housing costs is considered ‘cost-
burdened.’
Page 96 of 157

Housing Study and Neighborhood Revitalization Strategy
City of Winchester, Virginia
Page 49
Each year, HUD calculates the Area Median Income (AMI) of geographic areas nationwide.
Winchester’s 2021 AMI for a family of four is $81,400. RKG calculated income thresholds
based on percentages of Winchester’s 2021 AMI. These income thresholds correspond to-30%
AMI, 50% AMI, 80% AMI, 100% AMI and 120% AMI. For this study, RKG assumed rental
households contain 2 persons while owner households contain 3 persons. Therefore, among
City of Winchester households earning 50% of the AMI, renters earn up to $32,600 while
owners earn up to $36,650 (Table 26).
The defined income thresholds determine the maximum amount owner and renter
households can pay on monthly housing costs to be considered affordable. Housing costs
differ between owner and rental households. Renter costs are the monthly rental payment
plus any associated utilities. A rental household earning the 50% AMI threshold ($32,600) in
2021 should pay no more than $815 each month (Table 27). Any amount above $815 qualifies
a 2-person rental household 50% AMI renter household as ‘cost-burdened.’ The following
table indicates the maximum amount rental households in the City of Winchester will pay to
meet HUD’s affordability standards, based on their corresponding income threshold and
number of household members.
Table 27
Corresponding Monthly Gross Rent Thresholds
City of Winchester, VA (2021)
Income Threshold 2 3 4
30% AMI (Extremely Low) $489 $550 $663
50% AMI (Very Low) $815 $916 $1,018
80% AMI (Low) $1,303 $1,465 $1,628
100% AMI $1,630 $1,833 $2,035
120% AMI $1,956 $2,199 $2,442
Source: HUD and RKG Associates, Inc. 2021
Persons in Household
Table 26
HUD Household Income Thresholds
Winchester, VA-WV HUD MSA Area (2021)
Rental Analysis Owner Analysis Baseline
Income Threshold (2-Person) (3-Person) (4-Person)
30% AMI (Extremely Low) $19,550 $22,000 $26,500
50% AMI (Very Low) $32,600 $36,650 $40,700
80% AMI (Low) $52,100 $58,600 $65,100
100% AMI $65,200 $73,300 $81,400
120% AMI $78,240 $87,960 $97,680
Source: HUD and RKG Associates, Inc.,2021
Page 97 of 157

Housing Study and Neighborhood Revitalization Strategy
City of Winchester, Virginia
Page 50
In contrast, monthly ownership costs include the mortgage principal, interest, taxes, and
insurance payments. Owning a condominium will also include monthly ‘condo fees’, added
to the typical monthly owner costs. RKG converted ownership costs for single family homes
and condominiums to reflect the maximum affordable purchase price of single-family homes
and condominiums within the City of Winchester (Table 28).
Owner households either finance home purchases through FHA or Conventional loans. FHA
loans are backed by the federal government, aimed at home buyers who cannot qualify for a
conventional loan. FHA loans require a 3.5% down payment of the home’s value while
conventional loans are often 20%. RKG incorporated these loan percentages to estimate the
maximum affordable purchase price for each corresponding income threshold, either
qualifying for an FHA or conventional loan. As indicated in the table above, RKG assumed
conventional homebuyers of each income threshold can afford higher home values than FHA
buyers.
After identifying the housing affordability standards among local owner and rental
households, RKG analyzed the City of Winchester’s housing supply and demand to
understand local demographics and the availability of affordable living opportunities. The
demand analysis uses estimates from the American Community Survey (ACS) and ESRI,
comparing household tenure (renter vs. owner) occupancy characteristics and their relative
proportions. The housing supply analysis primarily uses the property tax assessment data
from the City of Winchester. Through the assessment records, RKG estimated market values
of ownership housings, corroborating the estimated values against current listings to support
the estimates. To determine the prices of rental units, data was collected by Apartments.com
and interviews with property managers.
After estimating the City of Winchester’s Housing Supply and Demand, RKG identified
housing gaps and surpluses among owner and rental households and their corresponding
defined income thresholds. Gaps indicate that there are more City of Winchester households
in the income threshold than housing units affordable to their ability to pay. A surplus of
units indicate there are more housing units priced to the income threshold than demand from
existing City of Winchester households.
Table 28
Maximum Affordable Single Family Home/Condominium Maximum Value
City of Winchester, VA
Single Family Condo Single Family Condo
Income Threshold Income Limit Max. Home Value Max. Home Value Max. Home Value Max. Home Value
30% AMI (Extremely Low) $22,000 $102,660 $92,966 $119,342 $106,866
50% AMI (Very Low) $36,650 $171,023 $161,329 $198,814 $186,337
80% AMI (Low) $58,600 $273,449 $263,755 $317,885 $305,408
100% AMI $73,300 $342,045 $332,351 $397,627 $385,151
120% AMI $87,960 $410,454 $400,760 $477,153 $464,676
Source: HUD and RKG Associates, Inc., 2021
FHA BUYER CONVENTIONAL BUYER
Page 98 of 157

Housing Study and Neighborhood Revitalization Strategy
City of Winchester, Virginia
Page 51
RKG then projected the future rental housing supply and demand through 2026, using ESRI
data and pipeline information provided by the City of Winchester’s Planning Department.
Ownership demand was projected through 2026 while ownership supply was not, due to data
limitations.
Figure 30- Map of Subareas
City of Winchester and RKG Associates Inc., 2021
Page 99 of 157

Housing Study and Neighborhood Revitalization Strategy
City of Winchester, Virginia
Page 52
RKG also analyzed the housing stock of six distinct subareas within the City of Winchester
(Figure 30), identifying existing residential development patterns and trends between 2010
and 2021. RKG delineated each subarea based on their similar housing market characteristics.
2. Residential Demand
Like most urban areas, the City of
Winchester is predominately renters,
comprising 56% of all households
(Figure 31). This is a recent
phenomenon for the city as owner
households dominated in 2010. In
part, the increased rental demand is
attributed to the relatively higher costs
of homeownership. The existing rental
supply shortage creates a challenge for
the city to meet the heightened
demand. It also strains the
affordability of rental households,
particularly those containing 4 or
more persons.
Large rental households of 4 or
more persons comprise most new
rental demand. Since 2010, nearly 70%
of new rental households are 4 or more
persons, that corresponds with a 32%
decrease of owner households with 4
or more persons (Figure 32). Most
rental units within traditional
multifamily complexes (6+ units)
contain fewer than 3 bedrooms. If
these large rental households are not
living in overcrowded conditions,
many are likely renting converted
single familyhomes, more suitable in
scale to accommodate their household
size.
Renting converted single family homes, originally constructed for home ownership, is
precarious. Current tenants are vulnerable to eviction. Their current landlords may reconvert
the homes back to homeownership. A strong possibility, since the City of Winchester’s
property values continue to rise, inciting sales of these properties . If that happens, these larger
Source: ACS 2019
Figure 31
Figure 32
Source: ACS Estimates, 2010 and 2019
Page 100 of 157

Housing Study and Neighborhood Revitalization Strategy
City of Winchester, Virginia
Page 53
rental households will be faced with limited living options, increasing their cost burdens
and reducing their quality of life.
Consistent with national trends, owner households in the City of Winchester typically earn
more than rental households. According to ACS estimates, the 2019 median household
income among owner households was $86,782 while the median income among rental
households came in at $44,049. Furthermore nearly 50% of owner households earn more than
120% AMI ($87,960), while only 18.7% of renter households earn this amount (Figure
33). Lower income households are more likely to rent as they lack sufficient income to secure
the down payment and afford ongoing maintenance costs. Younger households in the City of
Winchester, ages 15-24, face similar challenges, prompting a large proportion of this
demographic to seek rental, rather than ownership opportunities.
Figure 33- Proportion of Households by Tenure and Income Threshold, City of Winchester
30% and Below7.7%
31% to 50%8.4%
51% to 80%13.7%
81% to 100%11.5%
101% to 120%9.8%
Over 120%48.9%
Owner Households
30% and Below17.1%
31% to 50%16.1%
51% to 80%28.0%
81% to 100%10.8%
101% to 120%9.3%
Over 120%18.7%
Renter Households
Source: ACS 2019, HUD 2021 and RKG Associates Inc., 2021
Page 101 of 157

Housing Study and Neighborhood Revitalization Strategy
City of Winchester, Virginia
Page 54
3. Residential Supply
Single family homes, which include
detached dwellings and attached
townhome-condominiums, make up
roughly 65% of the City of
Winchester’s existing housing stock
(Figure 34). Nearly 35% of single-
family homes are rentals, an unusually
large proportion for an urban area.
Therefore, this comprises 56% of total
rental units in the city when combined
with the supply of rental units
confined in 2-5 unit residential
structures. The imbalance of
traditional rental units, confined in
large (6+) multifamily rental
complexes or greater, creates pressing issues for the City of Winchester. Notably, fewer
affordable rental units for lower income households and increased likelihood of evictions
among households that rent converted single family homes. Winchester needs density;
however, the preponderance of single-family homes creates land use inefficiencies, thwarting
the opportunity for higher density multifamily development.
This issue is most prominent in
Subarea 6, where 75% of rental units
reside in structures with 1-5 units
(Figure 35). The same goes for
Subarea’s 1 and 2, as approximately
65% of rental units in each area are in
structures with 1-5 units. Subarea 3,
however should be considered a
model for the other subareas; a
sterling example of how more
affordable living opportunities can be
attained within the City of
Winchester- efficiently using space to
boost the supply of rental units.
Figure 34
Source: City of Winchester 2021
Figure 35
Source: City of Winchester 2021
Page 102 of 157
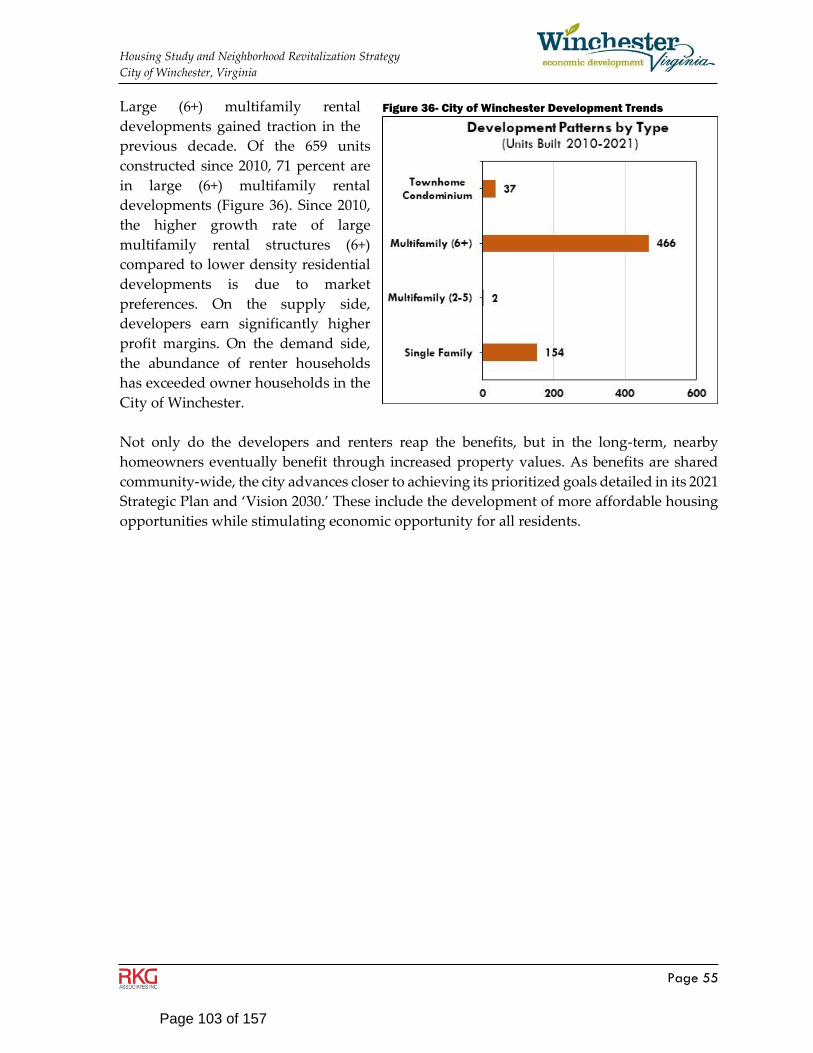
Housing Study and Neighborhood Revitalization Strategy
City of Winchester, Virginia
Page 55
Large (6+) multifamily rental
developments gained traction in the
previous decade. Of the 659 units
constructed since 2010, 71 percent are
in large (6+) multifamily rental
developments (Figure 36). Since 2010,
the higher growth rate of large
multifamily rental structures (6+)
compared to lower density residential
developments is due to market
preferences. On the supply side,
developers earn significantly higher
profit margins. On the demand side,
the abundance of renter households
has exceeded owner households in the
City of Winchester.
Not only do the developers and renters reap the benefits, but in the long-term, nearby
homeowners eventually benefit through increased property values. As benefits are shared
community-wide, the city advances closer to achieving its prioritized goals detailed in its 2021
Strategic Plan and ‘Vision 2030.’ These include the development of more affordable housing
opportunities while stimulating economic opportunity for all residents.
Figure 36- City of Winchester Development Trends
Page 103 of 157

Housing Study and Neighborhood Revitalization Strategy
City of Winchester, Virginia
Page 56
4. Homeownership Affordability Analysis
Purchasing and owning a home is expensive. After the down payment, ownership costs
include the monthly mortgage, insurance, taxes, and for condominium owners, additional
HOA fees. Moreover, owner households face renovation/rehabilitation and
upkeep/maintenance costs, both critical to owning a home in the City of Winchester, as most
single-family homes are older, built before 2000. All these costs create major barriers for lower
income households seeking to purchase a home. Ownership costs are variable too, as lower
income households likely face higher interest payments due to lower credit scores.
Accounting for the costs of homeownership, RKG estimated the supply of ownership units in
the City of Winchester affordable to households among each income threshold-30% AMI, 50%
AMI, 80% AMI, 100% AMI, 120% AMI, 120%+ AMI (Table 29 & Table 30). As described in
section 1, owner households either finance a home purchase through an FHA or conventional
loan. For this study, the calculated home prices reflect a scenario where an FHA requires a
3.5% down payment whereas a conventional loan requires a 20% down payment.
Analyzing both scenarios provided a different range of the number of units affordable to each
income threshold. As lower incomes typically secure FHA loans, most of the analysis will be
focused on the FHA scenario, identifying the corresponding number of households able to
afford homes in their defined income threshold.
Most detached single family homes within the City of Winchester are affordable to low
income households. Under FHA standards, approximately 41% are priced between $171,023
Table 29
Single Family Dwelling Home Supply by Affordability
City of Winchester, VA
Min Value Max. Value Supply Percent Min Value Max. Value Supply Percent
Income Threshold 4,694 100% 4,694 100%
30% AMI (Extremely Low) $0 $102,660 53 1.1% $0 $119,342 115 2.4%
50% AMI (Very Low) $102,661 $171,023 585 12.5% $119,342 $198,814 1,139 24.3%
80% AMI (Low) $171,024 $273,449 1,920 40.9% $198,814 $317,885 1,735 37.0%
100% AMI $273,450 $342,045 654 13.9% $317,885 $397,627 714 15.2%
120% AMI $342,046 $410,454 581 12.4% $397,627 $477,153 489 10.4%
120%+ AMI $410,455 901 19.2% $477,154 502 10.7%
Source: City of Winchester Property Assessment Data
FHA BUYER CONVENTIONAL BUYER
Table 30
Townhome-Condominium Attached Home Supply by Affordability
City of Winchester, VA
Min Value Max. Value Supply Percent Min Value Max. Value Supply Percent
Income Threshold 293 100% 293 100%
30% AMI (Extremely Low) $0 $92,966 2 0.7% $0 $106,866 7 2.4%
50% AMI (Very Low) $92,967 $161,329 41 14.0% $106,867 $186,337 72 24.6%
80% AMI (Low) $161,330 $263,755 213 72.7% $186,338 $305,408 192 65.5%
100% AMI $263,756 $332,351 21 7.2% $305,409 $385,151 12 4.1%
120% AMI $332,352 $400,760 9 3.1% $385,152 $464,676 10 3.4%
120%+ AMI $400,761 7 2.4% $464,677 0 0.0%
Source: City of Winchester Property Assessment Data
FHA BUYER CONVENTIONAL BUYER
Page 104 of 157

Housing Study and Neighborhood Revitalization Strategy
City of Winchester, Virginia
Page 57
and $273,449, consistent with households earning 50% to 80% AMI. Townhome-
condominiums too, are predominately priced within the 50% to 80% income threshold under
FHA.
While ownership units are affordable
to lower income households, too many
are unavailable That’s because they’re
likely occupied by high-income
households, whose choices are limited
due to the shortage of high value
ownership units (Figure 37). Nearly 50
percent of households earn above
120% AMI while only 19.7 percent of
ownership units are priced
correspondingly for this income
threshold. As higher income
households occupy less-valuable
homes, the downward pressure on the
ownership market inflates the values
of homes. As a result, lower income
households either purchase a home
beyond what their income allows or
switch to renting.
The City of Winchester’s recent housing market transformation--renter households now
exceed owner households--is largely attributed to the rising costs of homeownership. While
the lowest income households (30% AMI) are pushed to rental housing, it won’t be long before
current moderate income households are too. Largely a result of the downward pressure on
the ownership market from the highest income households.
5. Rental Affordability Analysis
RKG also estimated the supply of rental units in the City of Winchester, affordable to renter
households among each income threshold-30% AMI, 50% AMI, 80% AMI, 100% AMI, 120%
AMI, 120%+ AMI. Correspondingly, RKG compared the number of rental households able to
afford rental units among each income threshold. The results of the analysis are used to help
the City of Winchester develop policies and interventions that increase the availability of
rental units affordable to each income threshold.
Figure 37
Page 105 of 157

Housing Study and Neighborhood Revitalization Strategy
City of Winchester, Virginia
Page 58
Like the City of Winchester’s
ownership supply, most rental units
are affordable to households earning
between 50% to 80% AMI--42
percent (Table 31). Further, minimal
rental opportunities exist for the
highest and lowest incomes. Fewer
than one percent of units are
available to rental households
earning above 120% AMI while
roughly three percent are available to rental households earning below
30% AMI. The limited options available to these households, forces them to live in units priced
above what is affordable for their income threshold.
The high proportion of rental households and correspondingly low proportion of rental units
among the highest and lowest income thresholds, translates to major shortages (Figure 38).
Therefore, most rental households
earning above 120% AMI or under
30% AMI must occupy rental units
priced out of their corresponding rent
threshold.
The major shortage of rental units for
the highest income households
adversely impacts relatively lower
income rental households-increasing
cost burdens and the likelihood of
displacement. Eventually, as housing
instability persists among low-
income rental households, the rest of
the City of Winchester will be
impacted too, including major
disruptions to the economy and
provision of local community
services.
6. Future Affordability Projections
RKG projected the City of Winchester’s housing demand in 2026, applying ESRI’s projection
rates (2021-2026) to current household demand for both renter and owner households within
each HUD defined income threshold. RKG then projected the City of Winchester’s rental
housing supply in 2026, using multifamily pipeline data provided by the City of Winchester
Planning Department. The 2026 owner housing supply was not projected due to data
limitations.
Figure 38
Table 31
Rental Units by Monthly Gross Rent Thresholds
City of Winchester, VA
Count Percent
Income Thresholds Minimum Maximum 6,621 100.0%
30% AMI (Extremely Low) $0 $489 188 2.8%
50% AMI (Very Low) $490 $815 1,064 16.1%
80% AMI (Low) $816 $1,303 2,779 42.0%
100% AMI $1,304 $1,630 1,648 24.9%
120% AMI $1,631 $1,956 910 13.7%
120%+ AMI $1,957 33 0.5%
Sources: 2019 ACS, HUD 2021, and RKG Associates, Inc. 2021
Rent Thresholds
Figure 38
Page 106 of 157

Housing Study and Neighborhood Revitalization Strategy
City of Winchester, Virginia
Page 59
The projected growth of owner and
rental households is concentrated
among affluent households. Owner
households earning above 120% AMI
make up approximately 96 percent of
projected owner household growth,
while owner households earning
above 120% AMI comprise 85 percent
of projected renta; household growth.
The large projected growth of affluent
households may come from the influx
of high-income earning households
from Northern Virginia, attracted to
the relatively cheaper living costs and
the balance of small town feel and
urban amenities the City of
Winchester offers.
The growing pressure of these affluent
households will escalate the prices of
owner and rental units, especially
since high-end rental housing is
projected to face an even higher
shortage than the current year (Figure
40). Again, affluent households will
seek rental options below their income
threshold, placing cost burdens on
relatively lower income households.
To make matters worse, as demand for
ownership housing increases, the
converted rental units are at risk to
reconvert to ownership housing to
meet the eminent demand.
As discussed earlier, these converted rental units provide living for large rental households
of 4 persons or more. The reconversion would put even greater cost pressures on lower
income rental households and owner households alike.
Figure 39
Figure 40
Page 107 of 157

Winchester, VA Housing Market Analysis
Preliminary Findings Presentation
1
Page 108 of 157

▪ Winchester housing stock is predominantly rental▪ Failure to meet the market demand for larger rental units leading to conversion of traditional
single-family dwellings
▪ Clear income and age disparity between renters and owners within Winchester
▪ Supply is not meeting demand▪ Demand for rental properties, specifically larger unit rentals, is leading to status conversions
▪ Housing development has been predominantly multi-family since 2010
▪ Housing quality and variety differ within the subareas of the City
▪ Lack of supply is impacting affordability for prospective homeowners▪ Existing housing stock suggests a large supply of affordable opportunities for those making
between 50-80% AMI
▪ Supply gap of availability at the top end is leading to price escalation of all units
SUMMARY OF FINDINGS
2
Page 109 of 157

▪ Lack of supply is impacting affordability for renters▪ New rental product under development is majority market rate
▪ Most vulnerable populations are substantially underserved
▪ Lack of larger rental units (3+ bedroom) causing increase conversions
▪ Supply/Demand balance is projected to worsen▪ Robust pipeline of development projects, but lacking in price diversity
▪ Growing pressure from affluent households will increase price escalation
▪ Balance projected to worsen for lower income households
▪ Long-term impacts of COVID-19 are still unknown
▪ THE LOCAL HOUSING SITUATION IS NOT UNIQUE!
SUMMARY OF FINDINGS
3
Page 110 of 157

DEFINING TERMS/GEOGRAPHIES
4
Page 111 of 157

SUBAREA BOUNDARIES
▪ Housing analysis done at the citywide level as well as for six subareas
▪ Subareas grouped because of their similar housing market characteristics
▪ Residential Development Trends Analysis done at citywide level and for each subarea
▪ The corresponding map reflects boundaries and subarea identification
5
Page 112 of 157

6
Page 113 of 157

APPROACH INCOMES AND AFFORDABILITY
Rental Analysis Owner Analysis Baseline
Income Bands (2-Person) (3-Person) (4-Person)
Extremely Low (30%) Income Limits $19,550 $22,000 $26,500
Very Low (50%) Income Limits $32,600 $36,650 $40,700
Low (80%) Income Limits $52,100 $58,600 $65,100
100% AMI $65,200 $73,300 $81,400
120% AMI $78,240 $87,960 $97,680
Renter Income Thresholds
Owner Income Thresholds
Rental Analysis Owner Analysis Baseline
Income Bands (2-Person) (3-Person) (4-Person)
Extremely Low (30%) Income Limits $19,550 $22,000 $26,500
Very Low (50%) Income Limits $32,600 $36,650 $40,700
Low (80%) Income Limits $52,100 $58,600 $65,100
100% AMI $65,200 $73,300 $81,400
120% AMI $78,240 $87,960 $97,680
7
Page 114 of 157

APPROACH HOUSING VALUE ANALYSIS
▪ Certain incomes can ”afford” a certain mortgage or rent payment▪ HUD defines cost burdened at more than 30% of gross income▪ Homeownership costs include principle, interest, taxes and insurance▪ Rental housing calculation based on income▪ Calculations based on HUD Income thresholds for Winchester region
▪ The City’s housing units each carry a relative price if they were on the market▪ Ownership units were measured against market value
▪ Analysis compared assessed values against recent sales prices to determine value▪ Corroborated findings against current listings
▪ Rental units were measured against current asking rents▪ Collected monthly rent data by subarea▪ Used Zillow listings, ACS rent data, and information provided by local Realtors
8
Page 115 of 157

APPROACH INCOMES AND AFFORDABILITY
Corresponding Rent Thresholds
Corresponding Purchase Price Thresholds
Income Bands 2 3 4
Extremely Low (30%) Income Limits $489 $550 $663
Very Low (50%) Income Limits $815 $916 $1,018
Low (80%) Income Limits $1,303 $1,465 $1,628
100% AMI $1,630 $1,833 $2,035
120% AMI $1,956 $2,199 $2,442
Persons in Household
Single Family Condo Single Family Condo
Max. Home Value Max. Home Value Max. Home Value Max. Home Value
30% $102,660 $92,966 $119,342 $106,866
50% $171,023 $161,329 $198,814 $186,337
80% $273,449 $263,755 $317,885 $305,408
100% $342,045 $332,351 $397,627 $385,151
120% $410,454 $400,760 $477,153 $464,676
FHA BUYER CONVENTIONAL BUYER
AMI Threshold
9
Page 116 of 157

DEMAND ANALYSIS
10
Page 117 of 157

44%
56%
Households by Tenure (2019 ACS 5-Year Estimates)Winchester, VA
Owner HH Renter HH
Larger proportion of
renter households than
owner households, typical
for more urban areas.
11
Page 118 of 157

15 to 2417
0.4%
25 to 44862
18.6%
45 to 642077
44.7%
Over 651686
36.3%
Owner Households by Age of Head of HH(2019 ACS 5-Year Estimates)
City of Winchester
15 to 24380
6.5%
25 to 442520
43.1%
45 to 641983
33.9%
Over 65965
16.5%
Renter Households by Age of Head of HH(2019 ACS 5-Year Estimates)
City of Winchester
Younger households,
ages 15-24,
generally lack income
and cash reserves for
home down payment
Nearly half of renter
households are headed
by person 45+ years old
12
Page 119 of 157

30% and Below359
7.7%
31% to 50%390
8.4%
51% to 80%635
13.7%
81% to 100%532
11.5%
101% to 120%454
9.8%
Over 120%2,27248.9%
Owner Households by HUD AMI(2019 ACS 5-Year Estimates)
City of Winchester
30% and Below1,001 17.1%
31% to 50%942
16.1%
51% to 80%1,637 28.0%
81% to 100%632
10.8%
101% to 120%542
9.3%
Over 120%1,094 18.7%
Renter Households by HUD AMI(2019 ACS 5-Year Estimates)
City of Winchester
33% of renters earn
less than $36,650 (50%
of area AMI)
Income gap between
renters and owners
substantial
13
Page 120 of 157

(316)
(115)
71
(171)
(531)
149
(34)
150
535
800
(600)
(400)
(200)
0
200
400
600
800
1,000
1-Person 2-Persons 3-Persons 4+ Persons Total
Change of Owner and Renter Households by Size (2010-2019)City of Winchester
Owner Renter 14
Page 121 of 157
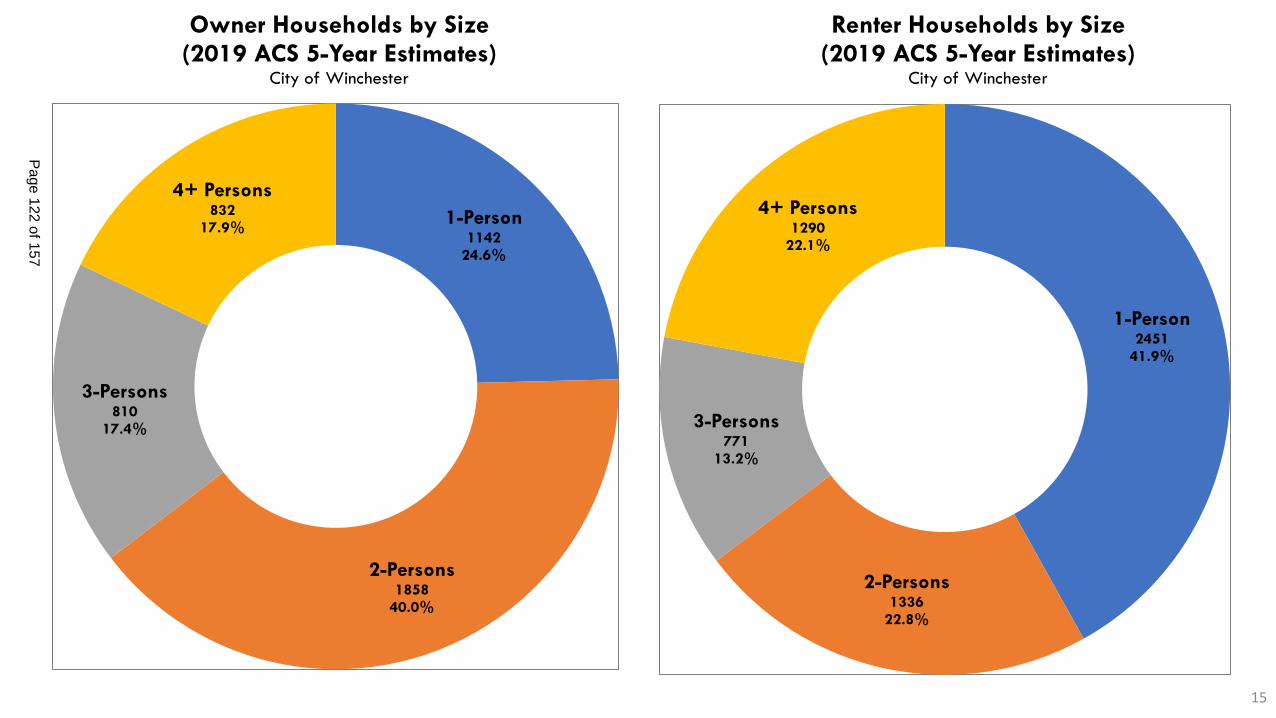
1-Person1142
24.6%
2-Persons1858
40.0%
3-Persons810
17.4%
4+ Persons832
17.9%
Owner Households by Size(2019 ACS 5-Year Estimates)
City of Winchester
1-Person2451
41.9%
2-Persons1336
22.8%
3-Persons771
13.2%
4+ Persons1290
22.1%
Renter Households by Size(2019 ACS 5-Year Estimates)
City of Winchester
15
Page 122 of 157

▪ Winchester predominately a renter community (56%)▪ Number of renter households increased since 2010 while the number of homeowners
decreased▪ Unmet demand for rental housing, particularly larger households, and Winchester’s relative
ownership housing affordability driving market conversions▪ Trend likely to continue without new rental development, particularly for larger units
▪ Renter Households are generally younger ▪ Consistent with national trends ▪ Younger households tend to have lower incomes, lack of down payment to purchase
KEY FINDINGSHOUSING DEMAND ANALYSIS
16
Page 123 of 157

▪ There is an income disparity between renters and owners▪ Consistent with national trends
▪ Lower income households struggle with pricing, down payment, cost of maintenance
▪ Nearly 50% of owner households earn more than 120% AMI ($87,960)
▪ Approximately 70% of renter households earn less than 100% AMI
KEY FINDINGSHOUSING DEMAND ANALYSIS
17
Page 124 of 157

SUPPLY ANALYSIS
18
Page 125 of 157
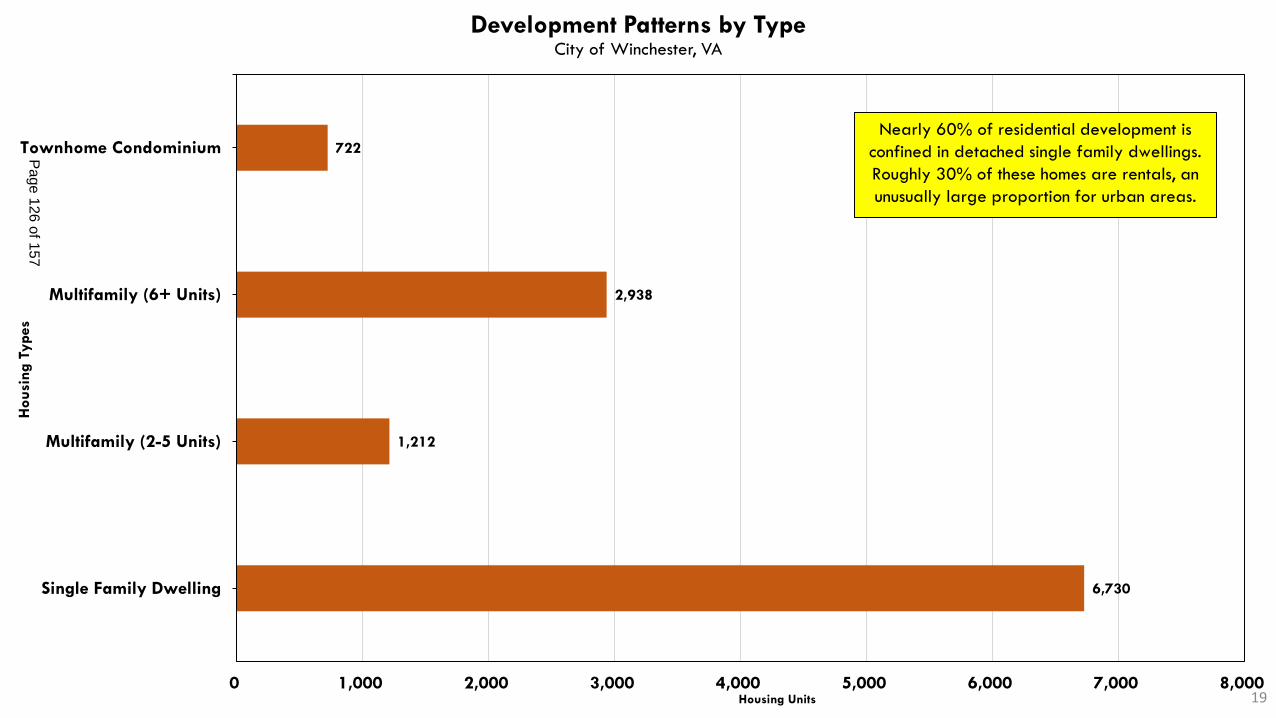
6,730
1,212
2,938
722
0 1,000 2,000 3,000 4,000 5,000 6,000 7,000 8,000
Single Family Dwelling
Multifamily (2-5 Units)
Multifamily (6+ Units)
Townhome Condominium
Housing Units
Housi
ng T
ypes
Development Patterns by TypeCity of Winchester, VA
Nearly 60% of residential development is
confined in detached single family dwellings.
Roughly 30% of these homes are rentals, an
unusually large proportion for urban areas.
19
Page 126 of 157

2,467
1,212
2,938
0 500 1,000 1,500 2,000 2,500 3,000 3,500
Single Family/Townhome-Condo
Multifamily (2-5 Units)
Multifamily (6+)
Housing Units
Housi
ng T
ypes
Rental Units by Structure Type City of Winchester, VA
Approximately 55% of Multifamily
Units are contained in structures with 1-
5 units. Single family structures
(detached dwellings and attached
townhome-condominiums) compose
nearly 40% of multifamily rental units.
20
Page 127 of 157

154
2
466
37
0 50 100 150 200 250 300 350 400 450 500
Single Family Dwelling
Multifamily (2-5 Units)
Multifamily (6+ Units)
Townhome Condominium
Housing Units
Housi
ng T
ypes
Development Patterns by Type (Units Built 2010-2021)City of Winchester, VA
Most development has been multifamily (6+
units), a relative difference from development
construction prior to 2010, which composed
mostly of single family homes.
21
Page 128 of 157

22
191
3
137
295
11
0 50 100 150 200 250 300 350
Sub-Area 1
Sub-Area 2
Sub-Area 3
Sub-Area 4
Sub-Area 5
Sub-Area 6
Housing Units
Housi
ng T
ypes
Development Patterns by Sub-Area (Units Built 2010-2021)City of Winchester, VA
Subarea 5 had the largest
development in the previous
decade, largely due to the
newly constructed Meadow
Branch Apartments.
22
Page 129 of 157

22
35
3
89
31
11
0 20 40 60 80 100
Sub Area 1
Sub Area 2
Sub Area 3
Sub Area 4
Sub Area 5
Sub Area 6
Housing Units
Housi
ng T
ypes
Single Family and Townhome-Condomimum (Units Built 2010-2021)City of Winchester, VA
23
Page 130 of 157

▪ Housing conversions creating imbalance in typical rental housing by housing type▪ Nearly 40% of rental units are contained in either detached single family homes or attached
townhome-condominiums.
▪ The total of rental units within structures that are 5 units or fewer exceed the total of rental units within structures greater than 5 units
▪ Housing differs within the City’s subareas▪ Subarea 5 has the most detached single-family homes of any subarea while composing 70%
of housing types within its subarea.
▪ Subarea 6 has the largest proportion of detached single-family homes of any subarea while composing 73% of housing types within its subarea.
▪ The largest proportion of multifamily rental units among all subareas is in subarea 3, composing 60% of housing types.
▪ Subarea 1 has the largest housing diversity among all subareas
KEY FINDINGSHOUSING SUPPLY ANALYSIS
24
Page 131 of 157

▪ Housing development predominantly has been multifamily since 2010▪ Due to large multifamily complexes- Meadow Branch Apartments and Jubal Square
Apartments▪ Developers do not make enough money on low-density development due to high land costs▪ Redevelopment requires greater density to be profitable▪ Market is reacting to greatest demand, regional land use regulation constraints▪ Subarea 4 constructed the most detached single-family dwellings in the previous decade
KEY FINDINGS HOUSING SUPPLY ANALYSIS
25
Page 132 of 157

HOMEOWNERSHIPAFFORDABILITY ANALYSIS
26
Page 133 of 157

KEY ASSUMPTIONS HOMEOWNERSHIP AFFORDABILITY ANALYSIS
▪ Homeownership more than just ability to pay mortgage▪ Qualifying credit score▪ Down payment▪ Renovation/rehabilitation costs
▪ VERY important in Winchester’s most affordable ownership units
▪ Upkeep and maintenance costs▪ HOA fees for condominiums
▪ Lowest income households have several barriers to ownership▪ Typically, many of the above issues
27
Page 134 of 157

APPROACHHOMEOWNERSHIP AFFORDABILITY ANALYSIS
▪ Analysis uses both FHA lending standards and conventional lending standards▪ FHA (3.5% down payment) simulates ‘worst case scenario’▪ Conventional (20.0% down payment) assumes ‘best case’
▪ Nationally, lending for home purchases is about 90% FHA▪ We cannot determine exact numbers in Winchester because the data is not available at local
level▪ Analyzing both FHA and Conventional lending scenarios provides range of affordability for
purchasing
▪ Analysis shows the balance between “supply” and “demand” for specific income groups▪ Supply – Number of ownership units that are affordable to households in that AMI group▪ Demand - Total households that exist in Winchester with incomes in that AMI group
28
Page 135 of 157

AFFORDABILITY ANALYSISSINGLE FAMILY OWNERSHIP SUPPLY
▪ Using FHA standards, the largest portion of single-family homes are priced between $171,023 and $273,449 , consistent with households earning 50% to 80% AMI.
Single Family Detached Home Supply by Affordability
City of Winchester, VA
AMI Threshold
Min Value Max. Value Supply Percent Min Value Max. Value Supply Percent
Total 4,692 100% 4,692 100%
30% $0 $102,660 51 1.1% $0 $119,342 113 2.4%
50% $102,661 $171,023 586 12.5% $119,342 $198,814 1,140 24.3%
80% $171,024 $273,449 1,920 40.9% $198,814 $317,885 1,735 37.0%
100% $273,450 $342,045 653 13.9% $317,885 $397,627 713 15.2%
120% $342,046 $410,454 581 12.4% $397,627 $477,153 489 10.4%
120%+ $410,455 901 19.2% $477,154 502 10.7%
FHA BUYER CONVENTIONAL BUYER
29
Page 136 of 157

AFFORDABILITY ANALYSISCONDOMINIUM HOMEOWNERSHIP SUPPLY
▪ Most Townhome-Condominiums are priced within the 50%-80% AMI threshold, same as detached single-family homes.
Townhome-Condominium Attached Home Supply by Affordability
City of Winchester, VA
AMI Threshold
Min Value Max. Value Supply Percent Min Value Max. Value Supply Percent
Total 293 100% 293 100%
30% $0 $92,966 2 0.7% $0 $106,866 7 2.4%
50% $92,967 $161,329 41 14.0% $106,867 $186,337 72 24.6%
80% $161,330 $263,755 213 72.7% $186,338 $305,408 192 65.5%
100% $263,756 $332,351 21 7.2% $305,409 $385,151 12 4.1%
120% $332,352 $400,760 9 3.1% $385,152 $464,676 10 3.4%
120%+ $400,761 7 2.4% $464,677 0 0.0%
FHA BUYER CONVENTIONAL BUYER
30
Page 137 of 157

AFFORDABILITY ANALYSISHOMEOWNERSHIP GAP/SURPLUS
Ownership Housing Supply and Demand by HUD AMI Income Threshold
City of Winchester, VA
FHA Conventional
AMI Threshold Count Percent Count Percent Count Percent Count Count
Total 4,985 100% 4,985 100% 4,642 100% 343 343
30% of AMI (Extremely Low Income) and Below 53 1.1% 120 2.4% 359 7.7% (306) (239)
31%-50% of AMI (Very Low Income) 627 12.6% 1,212 24.3% 390 8.4% 237 822
51%-80% of AMI (Low Income) 2,133 42.8% 1,927 38.7% 635 13.7% 1,498 1,292
81%-100% of AMI 674 13.5% 725 14.5% 532 11.5% 142 193
101%-120% of AMI 590 11.8% 499 10.0% 454 9.8% 136 45
121% of AMI and Above 908 18.2% 502 10.1% 2,272 48.9% (1,364) (1,770)
Gap
FHA Buyer Conventional Buyer
Supply
(Single Family, Townhouse/Condominium)
Demand (No. of Owner
Households)
▪ Under FHA Standards, Winchester lacks ownership housing supply for households earning below 30% of AMI and above 121% of AMI
▪ Lack of supply at the highest end is driving development decisions, creating downward pressure on market (increasing prices)
31
Page 138 of 157

(306)
237
1,498
142 136
(1,364)
(2,000)
(1,500)
(1,000)
(500)
0
500
1,000
1,500
2,000
Under 30% 30%-50% 50%-80% 80%-100% 100%-120% Above 120%
Hous
ing
Uni
ts
AMI Level
Ownership Housing Supply/Demand Equilibrium by HUD Income ThresholdCity of Winchester, VA
A 'Surplus' of units indicate there are
more housing units priced to this
income group than demand from
existing Winchester Households.
A 'Gap' of units indicate there are
more Winchester households in that
income group than housing units
affordable to their ability to pay.
32
Page 139 of 157

▪ In general, Winchester has a large supply of affordable home-ownership opportunities for households making between 50% and 80% AMI▪ Only 14% of ownership units are available for households earning under 50% AMI▪ Under FHA standards, only 1% of homes are available for households earning below 30%
AMI, creating a major shortfall
▪ Winchester does not have enough housing units to meet demand at the highest income levels (over 120% AMI/$87,960)▪ Subarea 5 has the largest supply▪ Estimates indicate a gap of nearly 1,400 owner occupied households ▪ Lack of supply of high-end ownership housing drives up prices and demand for less-expensive
units due to stringer demand▪ Has impact on future affordability
KEY FINDINGS HOMEOWNERSHIP AFFORDABILITY ANALYSIS
33
Page 140 of 157

RENTALAFFORDABILITY ANALYSIS
34
Page 141 of 157

APPROACHRENTAL AFFORDABILITY ANALYSIS
▪ Rental analysis examines prices and corresponding number of households able to afford those prices ▪ HUD defines income thresholds by household size and bedroom count’
▪ Analysis shows the balance between “supply” and “demand” for specific income groups▪ Supply – Number of ownership units that exist in Winchester that are affordable to
households in that AMI group▪ Demand - Total households that exist in Winchester with incomes in that AMI group
35
Page 142 of 157

AFFORDABILITY ANALYSISRENTAL SUPPLY
▪ Roughly 60% of rental units are priced below 80% AMI threshold ($52,100); fewer than 1% priced above 120% AMI ($78,240)
▪ 19% priced below 50% AMI (including 80 income-controlled units)▪ Nearly 20% of renter households earn less than 30% AMI
Rent Levels Minimum Maximum Count Percent
Total 6,617 100.0%
Under 30% of AMI $0 $489 188 2.8%
30% to 50% $490 $815 1,063 16.1%
50% to 80% $816 $1,303 2,778 42.0%
80% to 100% $1,304 $1,630 1,647 24.9%
100% to 120% $1,631 $1,956 910 13.7%
Over 120% of AMI $1,957 33 0.5%
Rent Thresholds Total
36
Page 143 of 157

▪ Housing in Winchester predominantly priced between 50% and 80% AMI, especially among townhome-condominium units.
▪ Largest number of detached single-family homes priced above 120% AMI located in Subarea 5 (467 total homes priced above $410,454)
▪ Using FHA Standards, only 5.5% of townhome-condominiums are priced above 100% AMI
KEY FINDINGSHOUSING VALUE ANALYSIS
37
Page 144 of 157

KEY FINDINGS RENTAL AFFORDABILITY ANALYSIS
AMI Threshold Under 30% 30%-50% 50%-80% 80%-100% 100%-120% Above 120%
Annual HH Income $19,550 $32,600 $52,100 $65,200 $78,240 $78,720+
Rent Level $489 $815 $1,303 $1,630 $1,956 $1,968+
TOTAL
Supply 188 1,065 2,782 1,649 911 33
Demand 1,001 942 1,637 632 542 1,094
Gap (813) 124 1,145 1,017 369 (1,062)
▪ Substantial unmet demand at the lowest (under 30% AMI) and highest (over 120% AMI) ends of the income spectrum
38
Page 145 of 157

(813)
121
1,141
1,015
367
(1,062)
(1,500)
(1,000)
(500)
0
500
1,000
1,500
Under 30% 30%-50% 50%-80% 80%-100% 100%-120% Above 120%
Housi
ng U
nits
AMI Level
Rental Housing Supply/Demand Gap by HUD Income ThresholdCity of Winchester, VA
There are rental supply needs for the
highest end (Above 120% AMI)
Major supply deficiencies for
households earning under 30%
AMI.
39
Page 146 of 157

▪ Most vulnerable households substantially underserve▪ More than 81% of households earning below 30% AMI are cost burdened▪ Interviews with local housing professionals indicate most affordable units also worst
condition
▪ New development priced for 100% AMI to 120% AMI income range▪ Meeting unmet demand of higher income renters▪ However, new development not robust enough to mitigate rent escalation being faster than
cost of living
▪ Lack of larger (2+ bedroom) apartments causing conversion of traditional ownership units to rental▪ Regulations limiting the development of units with more bedrooms will perpetuate this
trend, particularly for townhouse style rental units
KEY FINDINGSRENTAL AFFORDABILITY ANALYSIS
40
Page 147 of 157
FUTUREAFFORDABILITY PROJECTIONS
41
Page 148 of 157

▪ 2026 Household demand▪ Collected ESRI detailed projection rates (2021-2026) by household income ▪ Applied ESRI projection rates to current household demand by tenure (Renter vs. Owner)
based on HUD defined income thresholds▪ Projected the number of renter and owner households demanding housing units in 2026
▪ 2026 Housing unit supply▪ Collected number of multifamily housing units expected to be constructed by 2026 through
the City of Winchester Planning Department▪ Added these pipeline units to the current supply of rental housing units in the city’s
boundaries
METHODOLOGYPROJECTED AFFORDABILITY ANALYSIS
42
Page 149 of 157

(100)
0
100
200
300
400
500
600
700
Under 30% 30%-50% 50%-80% 80%-100% 100%-120% Over 120% Total
House
hold
sProjected Change in Ownership Households by HUD AMI (2021-2026)
City of Winchester, VA
43
Page 150 of 157

(100)
(50)
0
50
100
150
200
250
300
350
400
Under 30% 30%-50% 50%-80% 80%-100% 100%-120% Over 120% Total
House
hold
sProjected Change in Renter Households by HUD AMI
City of Winchester, VA
44
Page 151 of 157

(745)
14
1,126
1,409
813
(1,350)(1,500)
(1,000)
(500)
0
500
1,000
1,500
2,000
Under 30% 30%-50% 50%-80% 80%-100% 100%-120% Above 120%
Housi
ng U
nits
Projected Supply/Demand Equilibrium for Rental Units 2021-2026
City of Winchester, VA
Major growth of supply-demand gap,
reflective of projected insufficient
construction of 120% AMI units, based
on historical development trends
Due to future construction of
multifamily complexes, projected to
be aimed at rental households
earning between 80%-120% AMI
45
Page 152 of 157

▪ Rapid development relative to previous decade (2010-2020)▪ 840 rental units and 240 townhome-condominium units expected to be delivered in next five
years▪ Large apartment complexes expected to be under construction soon, near the downtown
corridor (targeting young professionals)▪ Roughly 200 of rental units expected to be age restricted (55+)
▪ Known development projects focused on market-rate development (estimating 80%-120% AMI units based on historical trends) ▪ Number of income-controlled units is unknown
▪ Impacts of economy; COVID-19 will affect the new unit construction▪ Telecommuting/preferences of being outside major urban areas increasing demand in City▪ Push from Northern Virginia skewed to higher income backets▪ Price escalation likely will increase
KEY FINDINGS AFFORDABILITY PROJECTIONS
46
Page 153 of 157

▪ Supply-demand balance projected to worsen for lower income households▪ “Surplus” of housing between 30% and 50% AMI diminished while under 30% still substantial
▪ Will create even greater cost burdening/displacement of the most vulnerable residents
▪ Growing pressure from more affluent households will drive price escalation▪ Demand will outpace supply
▪ Without new development, prices will continue to rise faster than inflation
▪ This is for both rental and ownership
▪ Rehabilitation of units will decrease “affordable supply
▪ Increasing demand from affluent homeowners may reverse conversion trends▪ This will adversely impact larger, lower income households substantially
▪ Decrease available converted units AND drive pricing up for those that remain
KEY FINDINGS AFFORDABILITY PROJECTIONS
47
Page 154 of 157

SUMMARY OF FINDINGS
48
Page 155 of 157

▪ Winchester housing stock is predominantly rental▪ Failure to meet the market demand for larger rental units leading to conversion of traditional
single-family dwellings
▪ Clear income and age disparity between renters and owners within Winchester
▪ Supply is not meeting demand▪ Demand for rental properties, specifically larger unit rentals, is leading to status conversions
▪ Housing development has been predominantly multi-family since 2010
▪ Housing quality and variety differ within the subareas of the City
▪ Lack of supply is impacting affordability for prospective homeowners▪ Existing housing stock suggests a large supply of affordable opportunities for those making
between 50-80% AMI
▪ Supply gap of availability at the top end is leading to price escalation of all units
SUMMARY OF FINDINGS
49
Page 156 of 157

▪ Lack of supply is impacting affordability for renters▪ New rental product under development is majority market rate
▪ Most vulnerable populations are substantially underserved
▪ Lack of larger rental units (3+ bedroom) causing increase conversions
▪ Supply/Demand balance is projected to worsen▪ Robust pipeline of development projects, but lacking in price diversity
▪ Growing pressure from affluent households will increase price escalation
▪ Balance projected to worsen for lower income households
▪ Long-term impacts of COVID-19 are still unknown
▪ THE LOCAL HOUSING SITUATION IS NOT UNIQUE!
SUMMARY OF FINDINGS
50
Page 157 of 157