Embed Size (px)
Citation preview
GE.07-22855
UNITED NATIONS
E
Economic and Social Council
Distr. GENERAL
ECE/EB.AIR/WG.1/2007/6 5 June 2007
Original: ENGLISH
ECONOMIC COMMISSION FOR EUROPE EXECUTIVE BODY FOR THE CONVENTION ON LONG-RANGE TRANSBOUNDARY AIR POLLUTION Working Group on Effects Twenty-sixth session Geneva, 29–30 August 2007 Item 4 of the provisional agenda RECENT RESULTS AND UPDATING OF SCIENTIFIC AND TECHNICAL KNOWLEDGE
2007 RESULTS OF MONITORING FOREST CONDITION IN EUROPE
Report by the Programme Coordinating Centre of the International Cooperative Programme on
Assessment and Monitoring of Air Pollution Effects on Forests (ICP Forests)
INTRODUCTION 1. In 2007, ICP Forests continued its large-scale (6,046 level I plots) and intensive (676 level II plots) monitoring of forest condition. The parameters monitored included crown condition, foliar chemistry, soil and soil solution chemistry, tree growth, ground vegetation, atmospheric deposition, ambient air quality, meteorology, phenology and litterfall (Lorenz et al. 2007, Fischer et al. 2007). The results are reported here in accordance with the Convention’s 2007 workplan (item 3.4).
ECE/EB.AIR/WG.1/2007/6 Page 2
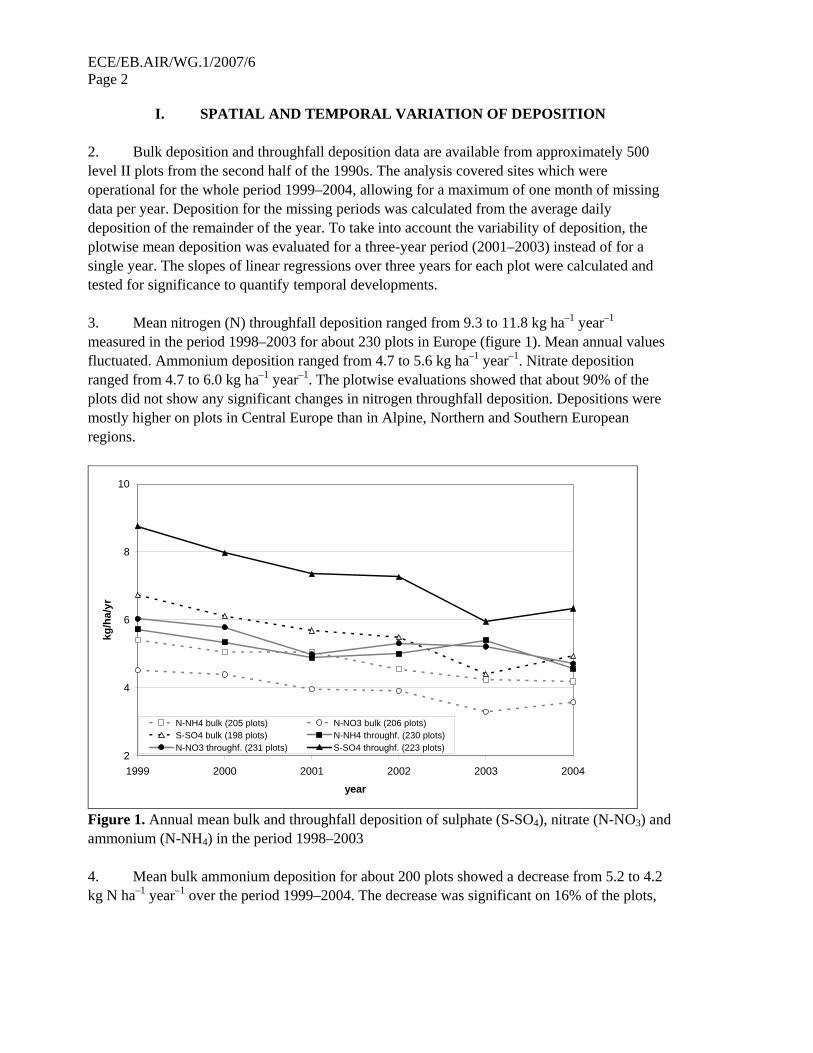
I. SPATIAL AND TEMPORAL VARIATION OF DEPOSITION 2. Bulk deposition and throughfall deposition data are available from approximately 500 level II plots from the second half of the 1990s. The analysis covered sites which were operational for the whole period 1999–2004, allowing for a maximum of one month of missing data per year. Deposition for the missing periods was calculated from the average daily deposition of the remainder of the year. To take into account the variability of deposition, the plotwise mean deposition was evaluated for a three-year period (2001–2003) instead of for a single year. The slopes of linear regressions over three years for each plot were calculated and tested for significance to quantify temporal developments. 3. Mean nitrogen (N) throughfall deposition ranged from 9.3 to 11.8 kg ha–1 year–1 measured in the period 1998–2003 for about 230 plots in Europe (figure 1). Mean annual values fluctuated. Ammonium deposition ranged from 4.7 to 5.6 kg ha–1 year–1. Nitrate deposition ranged from 4.7 to 6.0 kg ha–1 year–1. The plotwise evaluations showed that about 90% of the plots did not show any significant changes in nitrogen throughfall deposition. Depositions were mostly higher on plots in Central Europe than in Alpine, Northern and Southern European regions.
2
4
6
8
10
1999 2000 2001 2002 2003 2004
year
kg/h
a/yr
N-NH4 bulk (205 plots) N-NO3 bulk (206 plots)S-SO4 bulk (198 plots) N-NH4 throughf. (230 plots)N-NO3 throughf. (231 plots) S-SO4 throughf. (223 plots)
Figure 1. Annual mean bulk and throughfall deposition of sulphate (S-SO4), nitrate (N-NO3) and ammonium (N-NH4) in the period 1998–2003 4. Mean bulk ammonium deposition for about 200 plots showed a decrease from 5.2 to 4.2 kg N ha–1 year–1 over the period 1999–2004. The decrease was significant on 16% of the plots,
ECE/EB.AIR/WG.1/2007/6 Page 3
whereas a significant increase was observed on only one plot. Bulk nitrate inputs decreased from 4.5 in 1999 to 3.3 kg N ha–1 year–1 in 2003 and increased to 3.6 kg N ha–1 year–1 in 2004. A significant decrease was observed on 13% of the plots. A significant increase was observed on 1.5% of the plots. 5. Mean throughfall sulphate inputs decreased from 8.8 to 6.0 kg ha–1 year–1 in 1999–2003 and increased to 6.3 kg ha–1 year–1 in 2004 (figure 1). 30.5% of the plots showed significantly decreasing sulphur (S) inputs, whereas only two plots showed an increase. Comparatively low sulphate throughfall deposition was measured on plots in the Alpine region, Scandinavia and the Iberian peninsula. Mean bulk sulphate deposition decreased continuously from 6.7 in 1999 to 4.4 kg S ha–1 year–1 in 2003, and increased to 4.9 in 2004 kg S ha–1 year–1.
II. CALCULATION OF CRITICAL LOADS 6. Deposition trends or absolute inputs do not contain information on possible effects on forest ecosystems. Therefore, critical loads have been calculated. They define thresholds for the effects of air pollution. If pollution is below the critical values, it is assumed that no environmental damage will occur and a long-term stability of the ecosystem is achieved. 7. Soil data necessary for the calculation of critical loads were available from 186 level II plots located in 13 countries: Austria (19), Belgium (6), Czech Republic (2), Finland (11), Germany (82), Greece (4), Hungary (13), the Netherlands (4), Norway (10), Poland (6), Spain (10), Switzerland (10) and the United Kingdom (9). The plots were selected on data availability and are not representative for the whole of Europe. Input data included soil data and mean throughfall deposition for the years 2001–2003. 8. Critical loads for nutrient nitrogen were generally low, i.e. ecosystems that are sensitive to high nitrogen inputs, in northern Germany, the Mediterranean region, the Netherlands and Scandinavia. In Spain and Scandinavia, this was due to low forest growth and harvesting, resulting in a small export of nitrogen from the ecosystems. In the Mediterranean region, there was little nitrogen leaching due to low precipitation. More nitrogen was assumed to remain in the ecosystems resulting in higher risks for harmful effects. In the Alpine region, where precipitation was high, more nitrogen deposition was assumed to be leached, leading to higher critical loads. The calculation did not consider possible effects of nitrogen on groundwater. In Central Europe, high nitrogen uptake by forest trees was assumed, leading to low sensitivity. 9. Critical loads for nutrient nitrogen generally were exceeded on 66% of the plots in Central Europe and in Spain. There was hardly any exceedance in the Alpine regions, Greece, Scandinavia and the United Kingdom (figure 2). However, due to the high precipitation surplus critical loads were sometimes overestimated (e.g. in the Alpine regions) or total deposition was underestimated. Therefore, the presented results reflect the average trend of 186 plots, but site-specific ones.
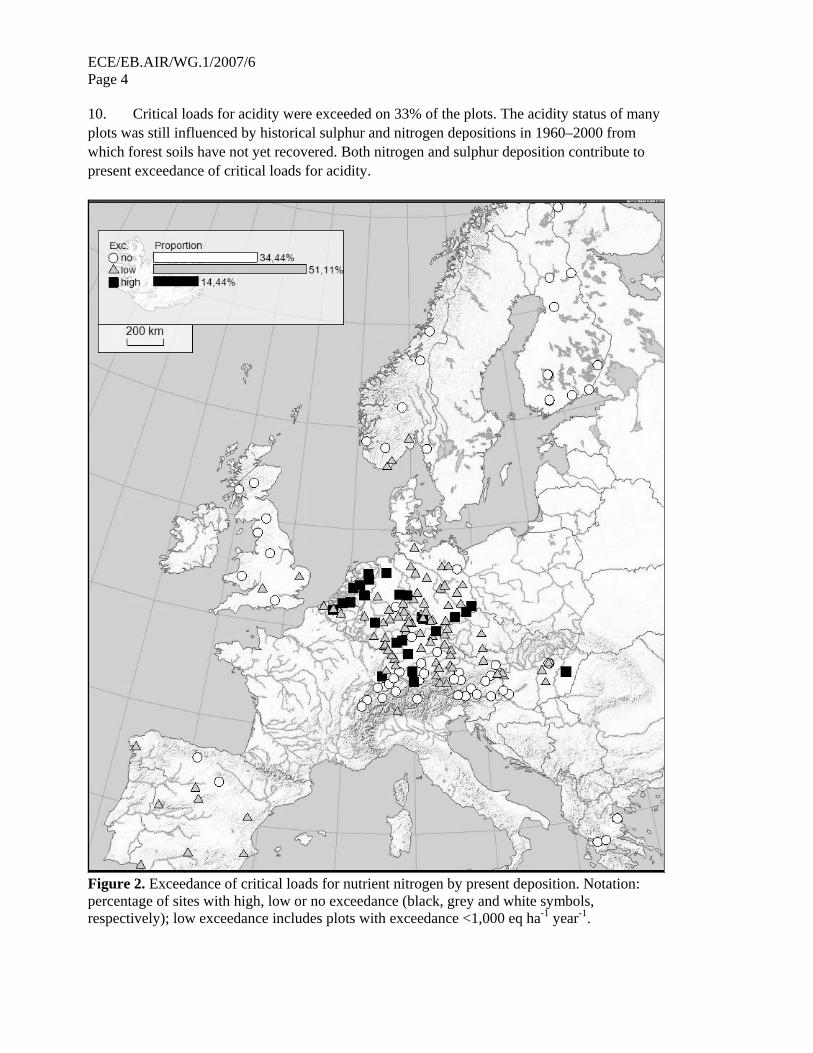
ECE/EB.AIR/WG.1/2007/6 Page 4 10. Critical loads for acidity were exceeded on 33% of the plots. The acidity status of many plots was still influenced by historical sulphur and nitrogen depositions in 1960–2000 from which forest soils have not yet recovered. Both nitrogen and sulphur deposition contribute to present exceedance of critical loads for acidity.
Figure 2. Exceedance of critical loads for nutrient nitrogen by present deposition. Notation: percentage of sites with high, low or no exceedance (black, grey and white symbols, respectively); low exceedance includes plots with exceedance <1,000 eq ha-1 year-1.
ECE/EB.AIR/WG.1/2007/6 Page 5
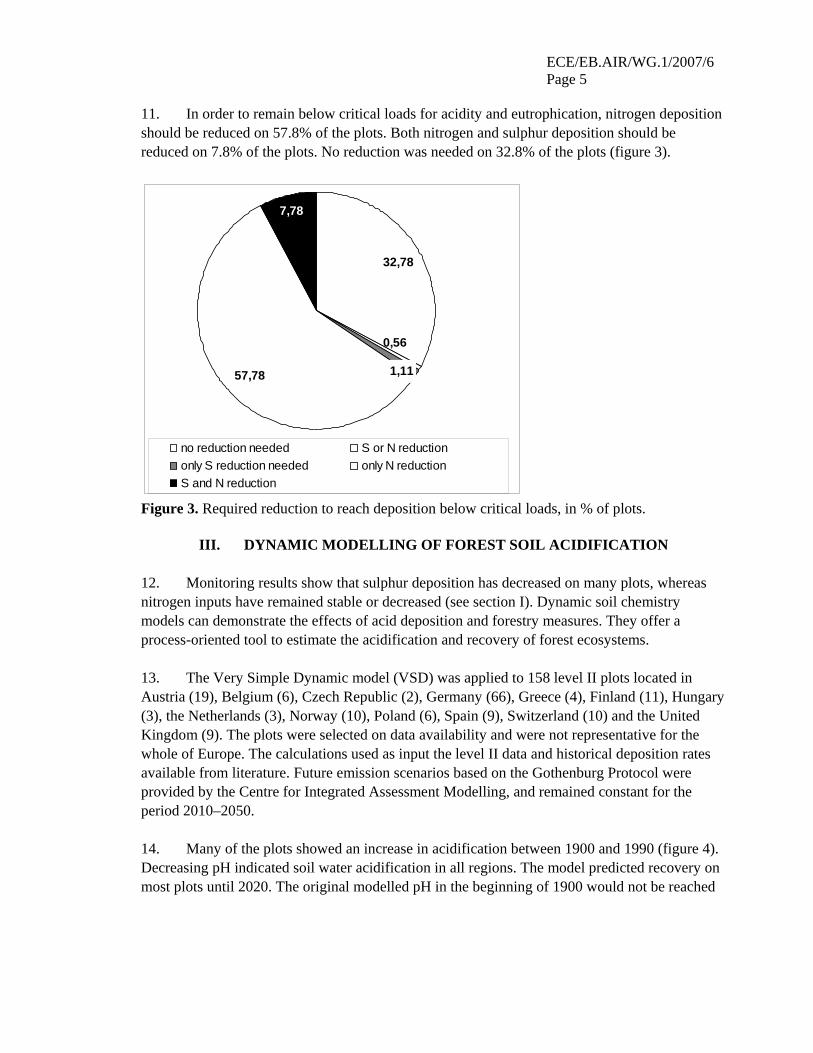
11. In order to remain below critical loads for acidity and eutrophication, nitrogen deposition should be reduced on 57.8% of the plots. Both nitrogen and sulphur deposition should be reduced on 7.8% of the plots. No reduction was needed on 32.8% of the plots (figure 3).
32,78
7,78
57,78 1,11
0,56
no reduction needed S or N reductiononly S reduction needed only N reductionS and N reduction
Figure 3. Required reduction to reach deposition below critical loads, in % of plots.
III. DYNAMIC MODELLING OF FOREST SOIL ACIDIFICATION 12. Monitoring results show that sulphur deposition has decreased on many plots, whereas nitrogen inputs have remained stable or decreased (see section I). Dynamic soil chemistry models can demonstrate the effects of acid deposition and forestry measures. They offer a process-oriented tool to estimate the acidification and recovery of forest ecosystems. 13. The Very Simple Dynamic model (VSD) was applied to 158 level II plots located in Austria (19), Belgium (6), Czech Republic (2), Germany (66), Greece (4), Finland (11), Hungary (3), the Netherlands (3), Norway (10), Poland (6), Spain (9), Switzerland (10) and the United Kingdom (9). The plots were selected on data availability and were not representative for the whole of Europe. The calculations used as input the level II data and historical deposition rates available from literature. Future emission scenarios based on the Gothenburg Protocol were provided by the Centre for Integrated Assessment Modelling, and remained constant for the period 2010–2050. 14. Many of the plots showed an increase in acidification between 1900 and 1990 (figure 4). Decreasing pH indicated soil water acidification in all regions. The model predicted recovery on most plots until 2020. The original modelled pH in the beginning of 1900 would not be reached
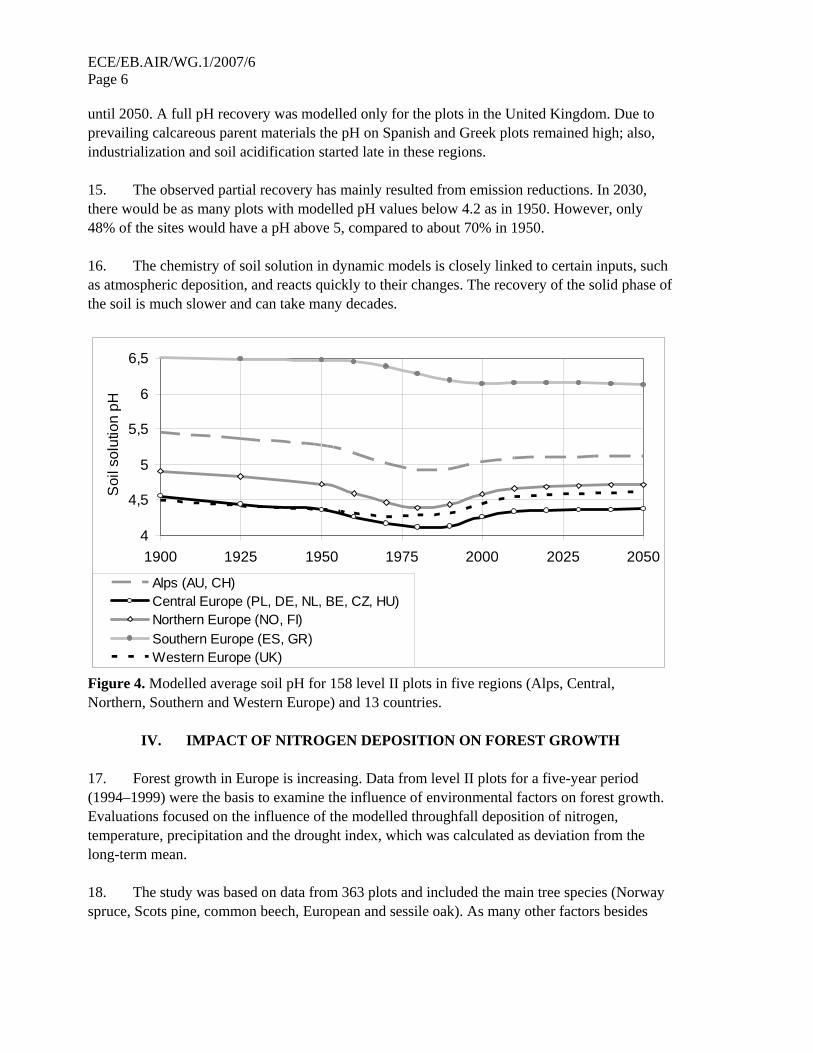
ECE/EB.AIR/WG.1/2007/6 Page 6 until 2050. A full pH recovery was modelled only for the plots in the United Kingdom. Due to prevailing calcareous parent materials the pH on Spanish and Greek plots remained high; also, industrialization and soil acidification started late in these regions. 15. The observed partial recovery has mainly resulted from emission reductions. In 2030, there would be as many plots with modelled pH values below 4.2 as in 1950. However, only 48% of the sites would have a pH above 5, compared to about 70% in 1950. 16. The chemistry of soil solution in dynamic models is closely linked to certain inputs, such as atmospheric deposition, and reacts quickly to their changes. The recovery of the solid phase of the soil is much slower and can take many decades.
4
4,5
5
5,5
6
6,5
1900 1925 1950 1975 2000 2025 2050
Soi
l sol
utio
n pH
Alps (AU, CH)Central Europe (PL, DE, NL, BE, CZ, HU)Northern Europe (NO, FI)Southern Europe (ES, GR)Western Europe (UK)
Figure 4. Modelled average soil pH for 158 level II plots in five regions (Alps, Central, Northern, Southern and Western Europe) and 13 countries.
IV. IMPACT OF NITROGEN DEPOSITION ON FOREST GROWTH 17. Forest growth in Europe is increasing. Data from level II plots for a five-year period (1994–1999) were the basis to examine the influence of environmental factors on forest growth. Evaluations focused on the influence of the modelled throughfall deposition of nitrogen, temperature, precipitation and the drought index, which was calculated as deviation from the long-term mean. 18. The study was based on data from 363 plots and included the main tree species (Norway spruce, Scots pine, common beech, European and sessile oak). As many other factors besides
ECE/EB.AIR/WG.1/2007/6 Page 7
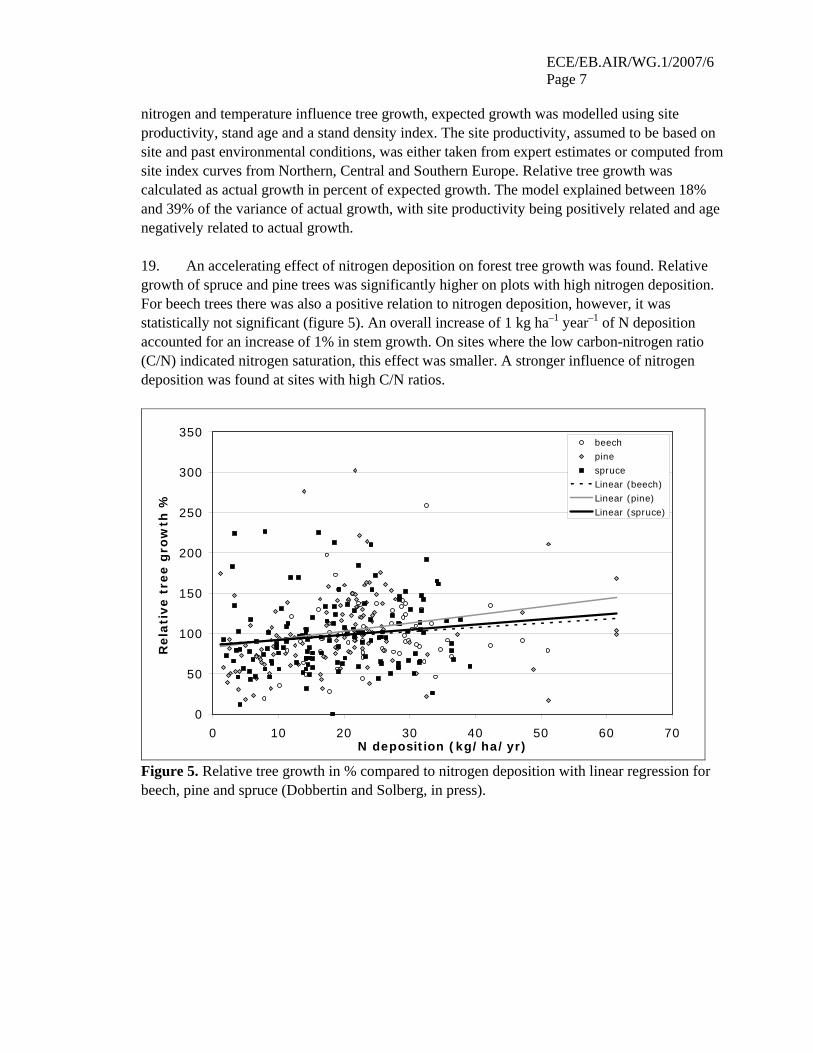
nitrogen and temperature influence tree growth, expected growth was modelled using site productivity, stand age and a stand density index. The site productivity, assumed to be based on site and past environmental conditions, was either taken from expert estimates or computed from site index curves from Northern, Central and Southern Europe. Relative tree growth was calculated as actual growth in percent of expected growth. The model explained between 18% and 39% of the variance of actual growth, with site productivity being positively related and age negatively related to actual growth. 19. An accelerating effect of nitrogen deposition on forest tree growth was found. Relative growth of spruce and pine trees was significantly higher on plots with high nitrogen deposition. For beech trees there was also a positive relation to nitrogen deposition, however, it was statistically not significant (figure 5). An overall increase of 1 kg ha–1 year–1 of N deposition accounted for an increase of 1% in stem growth. On sites where the low carbon-nitrogen ratio (C/N) indicated nitrogen saturation, this effect was smaller. A stronger influence of nitrogen deposition was found at sites with high C/N ratios.
0
50
100
150
200
250
300
350
0 10 20 30 40 50 60 70N deposition (kg/ha/yr)
Rela
tive t
ree g
row
th %
beechpinespruceLinear (beech)Linear (pine)Linear (spruce)
Figure 5. Relative tree growth in % compared to nitrogen deposition with linear regression for beech, pine and spruce (Dobbertin and Solberg, in press).
ECE/EB.AIR/WG.1/2007/6 Page 8
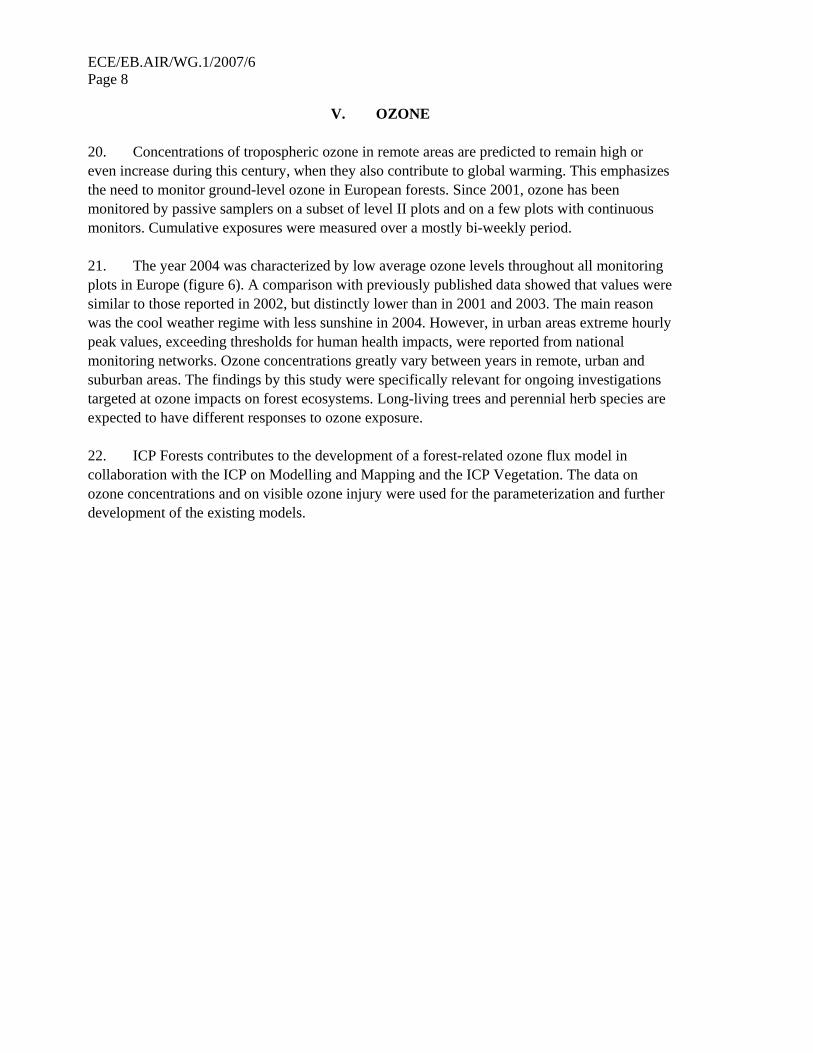
V. OZONE 20. Concentrations of tropospheric ozone in remote areas are predicted to remain high or even increase during this century, when they also contribute to global warming. This emphasizes the need to monitor ground-level ozone in European forests. Since 2001, ozone has been monitored by passive samplers on a subset of level II plots and on a few plots with continuous monitors. Cumulative exposures were measured over a mostly bi-weekly period. 21. The year 2004 was characterized by low average ozone levels throughout all monitoring plots in Europe (figure 6). A comparison with previously published data showed that values were similar to those reported in 2002, but distinctly lower than in 2001 and 2003. The main reason was the cool weather regime with less sunshine in 2004. However, in urban areas extreme hourly peak values, exceeding thresholds for human health impacts, were reported from national monitoring networks. Ozone concentrations greatly vary between years in remote, urban and suburban areas. The findings by this study were specifically relevant for ongoing investigations targeted at ozone impacts on forest ecosystems. Long-living trees and perennial herb species are expected to have different responses to ozone exposure. 22. ICP Forests contributes to the development of a forest-related ozone flux model in collaboration with the ICP on Modelling and Mapping and the ICP Vegetation. The data on ozone concentrations and on visible ozone injury were used for the parameterization and further development of the existing models.
ECE/EB.AIR/WG.1/2007/6 Page 9
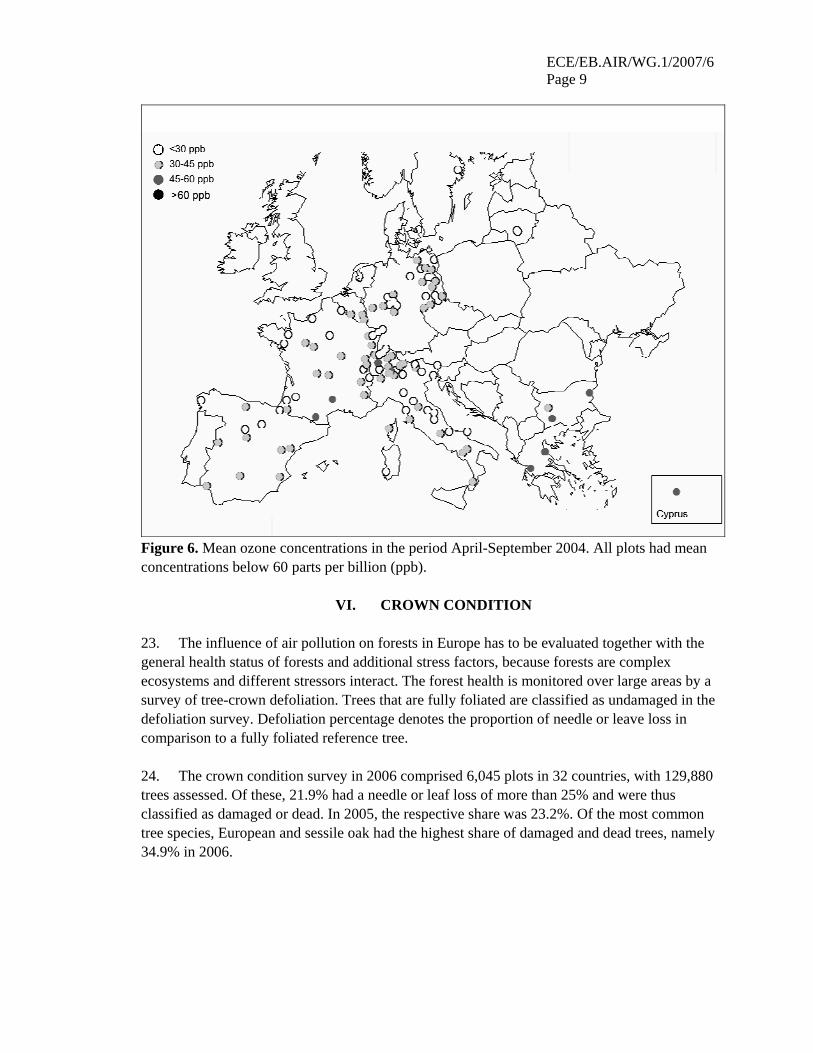
Figure 6. Mean ozone concentrations in the period April-September 2004. All plots had mean concentrations below 60 parts per billion (ppb).
VI. CROWN CONDITION 23. The influence of air pollution on forests in Europe has to be evaluated together with the general health status of forests and additional stress factors, because forests are complex ecosystems and different stressors interact. The forest health is monitored over large areas by a survey of tree-crown defoliation. Trees that are fully foliated are classified as undamaged in the defoliation survey. Defoliation percentage denotes the proportion of needle or leave loss in comparison to a fully foliated reference tree. 24. The crown condition survey in 2006 comprised 6,045 plots in 32 countries, with 129,880 trees assessed. Of these, 21.9% had a needle or leaf loss of more than 25% and were thus classified as damaged or dead. In 2005, the respective share was 23.2%. Of the most common tree species, European and sessile oak had the highest share of damaged and dead trees, namely 34.9% in 2006.
ECE/EB.AIR/WG.1/2007/6 Page 10
0
5
10
15
20
25
3019
9019
9119
9219
9319
9419
9519
9619
9719
9819
9920
0020
0120
0220
0320
0420
0520
06
mea
n de
folia
tion
(%)
Scots pine Eur+sess. oakmaritime pine beechNorway spruce holm oak
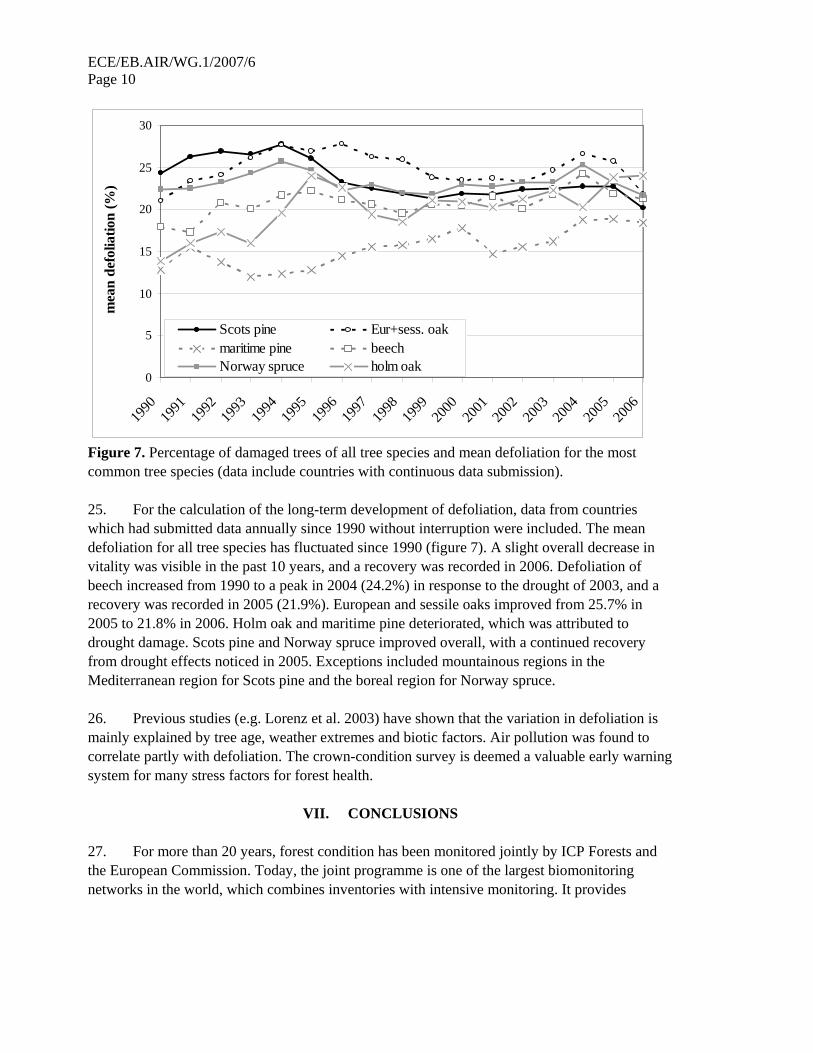
Figure 7. Percentage of damaged trees of all tree species and mean defoliation for the most common tree species (data include countries with continuous data submission). 25. For the calculation of the long-term development of defoliation, data from countries which had submitted data annually since 1990 without interruption were included. The mean defoliation for all tree species has fluctuated since 1990 (figure 7). A slight overall decrease in vitality was visible in the past 10 years, and a recovery was recorded in 2006. Defoliation of beech increased from 1990 to a peak in 2004 (24.2%) in response to the drought of 2003, and a recovery was recorded in 2005 (21.9%). European and sessile oaks improved from 25.7% in 2005 to 21.8% in 2006. Holm oak and maritime pine deteriorated, which was attributed to drought damage. Scots pine and Norway spruce improved overall, with a continued recovery from drought effects noticed in 2005. Exceptions included mountainous regions in the Mediterranean region for Scots pine and the boreal region for Norway spruce. 26. Previous studies (e.g. Lorenz et al. 2003) have shown that the variation in defoliation is mainly explained by tree age, weather extremes and biotic factors. Air pollution was found to correlate partly with defoliation. The crown-condition survey is deemed a valuable early warning system for many stress factors for forest health.
VII. CONCLUSIONS 27. For more than 20 years, forest condition has been monitored jointly by ICP Forests and the European Commission. Today, the joint programme is one of the largest biomonitoring networks in the world, which combines inventories with intensive monitoring. It provides
ECE/EB.AIR/WG.1/2007/6 Page 11
reliable and representative data on the forest ecosystem health and vitality and helps to detect forest ecosystem responses to a changing environment. 28. The inventory provides representative information on forest condition in Europe and the intensive monitoring provides data for more complex studies on ecosystem responses. Current evaluations showed decreasing sulphur inputs on one third of around 200 level II plots since 1999. Dynamic models showed that acidification at many of the modelled plots reached a maximum in the end of the 1980s and experienced a slight recovery thereafter. Critical loads for acidity were still exceeded on one third of the plots. 29. Nitrogen deposition remains a major disturbance for forest ecosystems. Nitrogen inputs remained unchanged on 85% of the plots. Critical loads for nutrient nitrogen were still exceeded on two thirds of the plots. In order to be below critical loads, deposition would need to be reduced on two thirds of the plots. Results indicated that forest growth was accelerated by nitrogen deposition. On sites that were overexploited in the past and had a good supply of nutrients other than nitrogen, current nitrogen inputs might compensate for former nitrogen losses. On other sites where nitrogen deposition first increased growth, it might cause nutrient imbalance and a destabilization of forest stands in the long run.
REFERENCES Fischer R, Badea O, Barbosa P, Bastrup-Birk A, Becher G, Bertini R, Calatayud V, Coenen S, De Vries W, Dobbertin M, Ferretti M, Granke O, Hiederer R, Houston-Durrant T, Köhl M, Kraft P, Lorenz M, Meyer P, Nagel H-P, Pavlenda P, Reinds GJ, Roskams P, Sanz M, Schulte E, Seidling W, Solberg S, Stofer S. (2007) The Condition of Forests in Europe. Executive Report 2007. CLRTAP and EC, Hamburg and Brussels, in press. Lorenz M, Fischer R, Becher G, Granke O, Roskams P, Nagel H-P, Kraft P (2007) Forest Condition in Europe. 2007 Technical Report of ICP Forests. Work Report of the Institute for World Forestry, BFH Hamburg, in press. Lorenz M, Mues V, Becher G, Fischer R, Luyssaert S, Raitio H, Fürst A, Langouche D (2003) Forest Condition in Europe. 2003 Technical Report. Geneva, Brussels. UNECE and EC, 114 pp. Note: The references have been reproduced as received by the secretariat.
-----