Embed Size (px)
Citation preview


COUNCIL ON HIGHER EDUCATION
VitalStats Public Higher Education 2014

The Council on Higher Education (CHE) is an independent
statutory body established by the Higher Education Act, no. 101
of 1997 (amended). The CHE is the Quality Council for Higher Education, advises the Minister of Higher Education and
Training on all higher education issues and is responsible for
quality assistance and promotion through the Higher Education Quality Committee.
Published by the Council on Higher Education in 2016
1 Quintin Brand Street
Persequor Technopark
Brummeria Pretoria
South Africa
+27 12 349 3840
www.che.ac.za
© Council on Higher Education, Pretoria, 2016
All rights reserved. Material from this publication may be
reproduced with the appropriate acknowledgement to the CHE.
ISBN: 978-0-9946785-8-4

COUNCIL ON HIGHER EDUCATION
VitalStats 2014 i
Foreword
The VitalStats: Public Higher Education series was launched in 2012 with VitalStats 2010, and is now
into its fifth edition. The Council on Higher Education (CHE) has found that the series has been well
received by the sector, with researchers and other interested stakeholders making extensive use of the
data. The series provides recent, audited data on the higher education sector in an easy to use format.
VitalStats 2014 contains data for the period 2009 to 2014, which is the latest audited data available for
the sector. The CHE hopes to extend the publication to the private sector when the necessary audited
data is available.
The majority of the data used are collected through the Higher Education Management Information
System (HEMIS), and the CHE appreciates the Department of Higher Education and Training’s (DHET)
assistance in collecting and extracting these data and for providing other necessary financial and
research information. Thanks are also due to the National Student Financial Aid Scheme (NSFAS) and
Statistics South Africa for providing relevant data.
The publication starts with four sections on student data, namely (i) overall enrolments and completions;
(ii) enrolments and completions by qualification type; (iii) by field of study; and finally (iv) by institutional
type. Student data is followed by a section on data on staffing at public universities. The sixth section of
the publication consists of cohort analysis of students who began their studies in 2009, tracking their
respective throughput rates both at undergraduate and postgraduate level. Owing to the different mode
of study (distance and often part-time) at the University of South Africa (UNISA), which impacts on the
time it takes a student to graduate, data for UNISA are considered separately in this section (as indicated
on the relevant graphs). The final section of VitalStats provides financial and research output data. The
publication includes a glossary based on HEMIS definitions.
The CHE is grateful to Charles Sheppard for compiling the necessary cohort studies and for some
financial information, and to Fiona Lewis for data on the full cost of study. The role of the Monitoring and
Evaluation Directorate staff, particularly Michael Gordon, in developing VitalStats is appreciated. The
CHE welcomes any suggestions or requests for additional copies of the publication. Please direct these
to Genevieve Simpson at [email protected]. The publication can also be downloaded from the
CHE’s website (www.che.ac.za).
Dr Denyse Webbstock
Director: Monitoring and Evaluation

COUNCIL ON HIGHER EDUCATION
ii VitalStats 2014
Definitions
Block grant:
State subsidy to universities is divided into block and earmarked grants. Block grants are consolidated
into a single transfer and the funds can be used for any legitimate university purpose. Currently block
grants have four components: teaching input (based on enrolments), teaching output (based on
graduations), research output (based on approved publications and research masters and doctoral
graduations) and institutional factors (based on institution size and proportion of historically
disadvantaged students).
Classification of Educational Subject Matter or CESM categories:
A set of classifications aiming to provide a single coherent system for categorising subject matter
irrespective of the level of instruction or type of institution. For a list of first-order CESM categories, see
Appendix 2.
Cohort:
The first-time entry students in a given year who have enrolled for a particular higher education
programme.
Comprehensive Universities (Comp):
This refers to institutions that offer the full spectrum of programmes, including vocational, professional
and general formative programmes at both undergraduate and postgraduate levels.
Contact mode of delivery:
This refers to courses involving personal interaction with institutional teachers or institutional
supervisors, through lectures, tutorials, seminars, practicals, supervision, or other forms of required
work, which occurs at the institution’s premises or at a site of delivery of the institution.
Course success rates:
The success rate refers to the total number of courses passed by students in a given academic year
relative to course enrolments. It is calculated by dividing the total number of FTE degree credits (courses
completed) by FTE enrolments. These calculations, for a programme or for an institution as a whole,
produce weighted average success rates.
Distance mode of delivery:
This refers to courses where the interaction with institutional teachers or institutional supervisors is
undertaken remotely through the use of correspondence, telematics, or the internet.
Earmarked funding:
State subsidy to universities is divided into block and earmarked grants. Earmarked funds must be spent
on the purposes for which they are designated. In recent years, some of the categories for earmarked
COUNCIL ON HIGHER EDUCATION
VitalStats 2014 iii
provision have been interest and redemption of government loans, infrastructure, teaching development,
research development, foundation courses, clinical training of health professionals and veterinary
science.
Field of study:
Enrolments are divided into four broad fields or areas of study, calculated by aggregating enrolments by
CESM category as below. For a description of each CESM category, see Appendix 2:
Science, Engineering and Technology (SET): CESM 01, 02, 06, 08, 09, 10, 13, 14, 15 & 16
Business & Commerce (B&C): CESM 04
Humanities (Hum): CESM 03, 05, 11, 12 ,17, 18, 19 & 20
Education (Ed): CESM 07
Full Cost of Study (FCS):
The FCS is defined as the cost of registration, tuition, accommodation, books and meals as averaged
per student per university.
Full-time equivalent (FTE):
FTE student enrolments are calculated (a) by assigning to each course a fraction representing the
weighting it has in the curriculum of a qualification, and (b) by multiplying the headcount enrolment of
that course by this fraction. FTE staff numbers are calculated in a similar way.
Gross Domestic Product (GDP):
This is the total market value of all goods and services produced in a country in a given year. The GDP
includes all consumer, investment and government economic activity during that year. The value of
exports is added to GDP and the value of imports is subtracted.
Headcount:
The total number of students enrolled at each institution whether as full-time, part-time or occasional
students.
National Student Financial Aid Scheme (NSFAS):
NSFAS is the South African government student loan and bursary scheme which provides loans and
bursaries to students at public universities and colleges.
Nominal and real funding:
Nominal funding refers to the actual amount of money given to a specific activity in Rand value for that
specific year. Real funding relates the funding of a particular year relative to a base year, taking inflation
into account. Real funding allows for a comparison of purchasing power over time as increases and
decreases are compared to the base year.
COUNCIL ON HIGHER EDUCATION
iv VitalStats 2014
Occasional student:
This is a person who satisfies the statutory requirements for entry into a formally approved qualification
offered by the institution and who is effectively registered for an approved course, but who is not
registered for an approved qualification. It includes persons enrolled for non-degree purposes.
Participation rate or Gross Enrolment Ratios (GER):
This is total headcount enrolment over the national population of 20-24 years old, calculated as a
percentage. The term used by the Department of Higher Education and Training is participation rate.
The National Plan for Higher Education (Department of Education: 2001) explains that: “The
participation rate is calculated using the UNESCO standard, as the percentage of 20–24 year olds of
the general population enrolled in higher education”.
Percentage accumulative (for Cohort Study):
This indicates (in the relevant graphs) the total number of students of a particular first-time entering
cohort who have graduated or dropped out up to that point. It includes all the students of that cohort who
have graduated or dropped out in previous years.
Percentage non-accumulative (for Cohort Study):
This indicates (in the relevant graphs) the total number of students of a particular first-time entering
cohort who have graduated or dropped out in that particular year. It does not include the students of that
cohort who have graduated or dropped out in previous years.
Permanent employee:
A person is classified as a permanent staff member if he/she contributes to an approved retirement fund
of the institution.
Personnel categories:
The personnel category indicates the type of duties to be undertaken in a position which a staff member
occupies in the institution, and the qualifications and experience normally required by the incumbent of
that position. The duties, qualifications and experience referred to relate to those of the position. The
personnel categories are:
Instruction/research professional (Academic): A position in which (a) at least 50% of time is spent
on instruction and/or research activities, and (b) the position requires a higher education qualification
equivalent to at least 4 years of higher education study.
Executive/administrative/managerial professional (Senior Management): A position in which (a)
the primary function is the management of the institution or one of its major divisions or sections, and
(b) the position requires an educational attainment equivalent to at least 4 years of higher education
study.
Non-professional administration (Administrative): A position in which (a) the primary function is
clerical, secretarial or administrative duties, and (b) an educational attainment equivalent to 4 years
of higher education study is not required.
Service staff: A group of staff for whom the primary function comprises unskilled activities.
COUNCIL ON HIGHER EDUCATION
VitalStats 2014 v
Postgraduate:
Postgraduate qualifications include Postgraduate Diplomas and Honours, Masters and Doctoral
degrees.
Qualification:
A qualification is the certificate, diploma or degree which an institution awards to a student on the
successful completion of an accredited programme of study of 120 credits or more.
Qualification types:
This refers to the different types of certificates, diplomas and degrees offered by higher education
institutions that conform to the specifications for nine such types on the Higher Education Qualifications
Sub-Framework (HEQSF). An explanation of the types of qualifications and requirements for the
awarding of the qualification can be found in the HEQSF.
Research development grant (RDG):
The RDG is part of the earmarked funding budget which the state provides to public universities for the
purpose of developing research capacity at the institution. Institutional research output targets are used
when calculating the funds available for RDGs, but the formula used means that if some institutions
produce above their target, the total amount for RDGs decreases, thus reducing the value of the RDG
unit. Plans for spending RDGs need to be approved by the DHET before the funds are paid to the
institution.
Research output unit (RO):
The research output unit is a proxy for the amount of research produced, calculated for subsidy
purposes. Public universities accrue research output units based on the number of publications and
graduate outputs produced in a specific year. The Policy and procedures for measurement of research
output of public higher education institutions (2003) determines the number of units awarded for different
recognised publication types.
Staff members:
A staff member is a person who is either compensated by the institution by pay or other means for
services rendered, or who, while not being paid or compensated by the institution, performs services
which relate to the institution’s normal activities and those activities which would otherwise have been
performed by staff receiving compensation from the institution.
Student: staff ratio:
This refers to the average number of students per academic staff member and gives an indication of the
average teaching load carried by each academic staff member. It is calculated by dividing the number
of FTE academic staff by the number of FTE students.
Temporary employee:
All staff members who do not contribute to an approved retirement fund of the institution are classified
as having temporary employment status.
COUNCIL ON HIGHER EDUCATION
vi VitalStats 2014
Third stream income:
This refers to all university income derived from sources other than state subsidy or student tuition fees.
It is also sometimes called private income. Sources of third steam income are diverse and can include
donations or endowments; money earned through contract research or entrepreneurial activity; and
income from investments.
Throughput rates:
The throughput rate calculates the number of first-time entry undergraduate students of a specific cohort
of a specific year who have graduated either within the minimum time, or up to 2 years beyond the
minimum time, to the number of students in the baseline enrolments of that cohort. Throughput rates
are reflected in the section on cohort studies.
Traditional Universities (Trad):
This refers to institutions that offer a broad range of general formative and professional programmes at
both undergraduate and postgraduate levels.
Undergraduate:
A student engaged in an undergraduate qualification at a university, namely a first or entry qualification, including certain certificate programmes, diplomas and Bachelor degrees.
Universities of Technology (UoT):
This refers to institutions (previously called Technikons) that offer a range of programmes that are
vocationally and/ or professionally-orientated, primarily at the undergraduate level.
Weighted research output:
Research funding for public universities is based research output units accrued by an institution in a
specific year. Units are awarded based on the number of publications an institution produces as well as
the number of research masters and doctoral graduates in that year. When calculating weighted
research output for the given year, the number of doctoral graduates is multiplied by three, while the
units for publications and research masters graduates are multiplied by one.

COUNCIL ON HIGHER EDUCATION
VitalStats 2014 i

2
STUDENT ENROLMENT AND COMPLETION DATA
VitalStats 2014 3
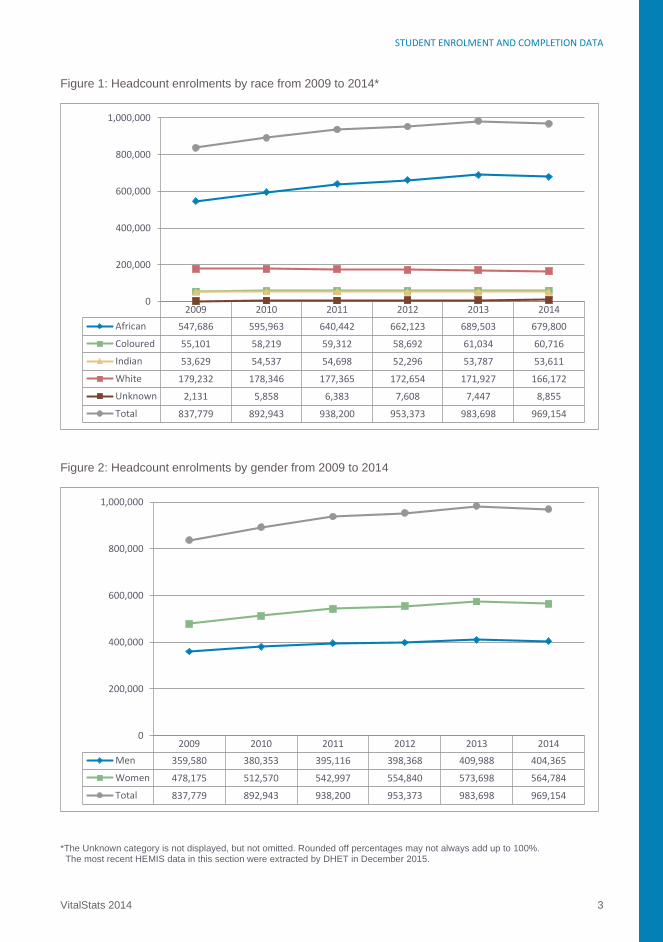
Figure 1: Headcount enrolments by race from 2009 to 2014*
Figure 2: Headcount enrolments by gender from 2009 to 2014
*The Unknown category is not displayed, but not omitted. Rounded off percentages may not always add up to 100%. The most recent HEMIS data in this section were extracted by DHET in December 2015.
2009 2010 2011 2012 2013 2014
African 547,686 595,963 640,442 662,123 689,503 679,800
Coloured 55,101 58,219 59,312 58,692 61,034 60,716
Indian 53,629 54,537 54,698 52,296 53,787 53,611
White 179,232 178,346 177,365 172,654 171,927 166,172
Unknown 2,131 5,858 6,383 7,608 7,447 8,855
Total 837,779 892,943 938,200 953,373 983,698 969,154
0
200,000
400,000
600,000
800,000
1,000,000
2009 2010 2011 2012 2013 2014
Men 359,580 380,353 395,116 398,368 409,988 404,365
Women 478,175 512,570 542,997 554,840 573,698 564,784
Total 837,779 892,943 938,200 953,373 983,698 969,154
0
200,000
400,000
600,000
800,000
1,000,000

STUDENT ENROLMENT AND COMPLETION DATA
4 VitalStats 2014
Figure 3: Headcount enrolments as a proportional comparison to population headcount by race from
2009 to 2014
Figure 4: Headcount enrolments as a proportional comparison to population headcount by gender
from 2009 to 2014
* Higher education ** Population numbers are in thousands
H.Ed Pop H.Ed Pop H.Ed Pop H.Ed Pop H.Ed Pop H.Ed* Pop**
2009 2010 2011 2012 2013 2014
African 547,686 39,726 595,963 40,346 640,442 40,979 662,123 41,625 689,503 42,284 679,800 43,376
Coloured 55,101 4,559 58,219 4,613 59,312 4,665 58,692 4,716 61,034 4,766 60,716 4,783
Indian 53,629 1,259 54,537 1,276 54,698 1,294 52,296 1,311 53,787 1,329 53,611 1,344
White 179,232 4,680 178,346 4,661 177,365 4,642 172,654 4,622 171,927 4,602 166,172 4,556
21%9%
20%9%
19%9%
18%9%
17%9%
17%8%
6%
3%
6%
3%
6%
2%
5%
3%
5%
3%
6%
2%
7%
9%
7%
9%
6%
9%
6%
9%
6%
9%
6%
9%
65%79%
67%79%
68%79%
69%80%
70%80%
70%80%
0%
10%
20%
30%
40%
50%
60%
70%
80%
90%
100%
H.Ed Pop H.Ed Pop H.Ed Pop H.Ed Pop H.Ed Pop H.Ed* Pop**
2009 2010 2011 2012 2013 2014
Men 359,580 24,381 380,353 24,732 395,116 25,089 398,368 25,453 409,988 25,823 404,365 26,878
Women 478,175 25,842 512,570 26,164 542,997 26,490 554,840 26,822 573,698 27,159 564,784 28,079
0%
10%
20%
30%
40%
50%
60%
70%
80%
90%
100%

STUDENT ENROLMENT AND COMPLETION DATA
VitalStats 2014 5
Figure 5: Participation rates by race from 2009 to 2014
Figure 6: Participation rates by gender from 2009 to 2014
2009 2010 2011 2012 2013 2014
African 13% 14% 14% 16% 16% 15%
Coloured 14% 15% 14% 14% 15% 14%
Indian 45% 46% 47% 47% 49% 50%
White 58% 57% 57% 55% 55% 54%
Overall 17% 18% 17% 19% 20% 18%
0%
10%
20%
30%
40%
50%
60%
2009 2010 2011 2012 2013 2014
Men 15% 15% 15% 16% 16% 15%
Women 19% 21% 20% 23% 23% 21%
Overall 17% 18% 17% 19% 20% 18%
0%
5%
10%
15%
20%
25%
STUDENT ENROLMENT AND COMPLETION DATA
6 VitalStats 2014
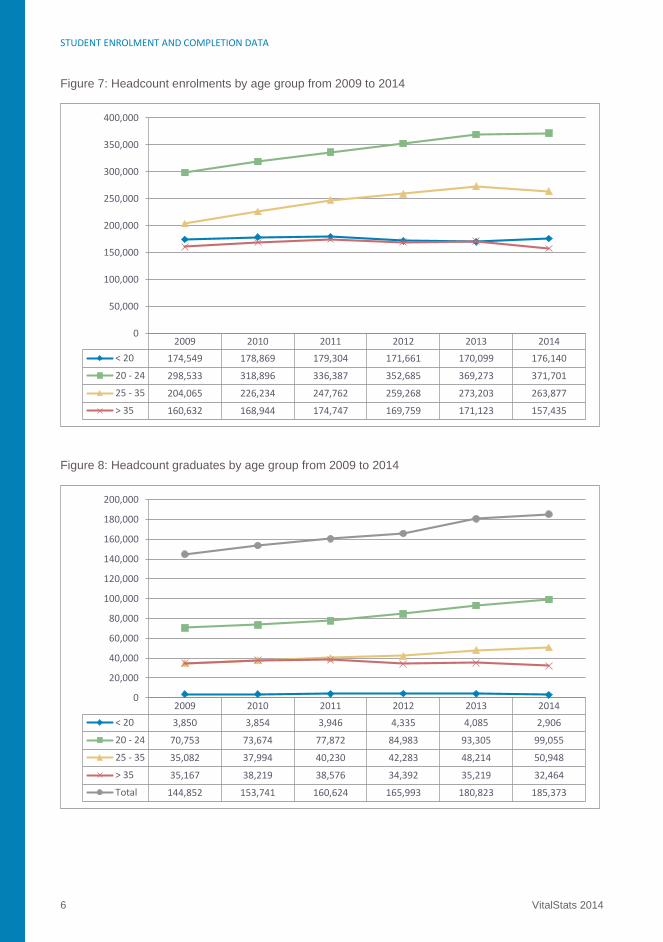
Figure 7: Headcount enrolments by age group from 2009 to 2014
Figure 8: Headcount graduates by age group from 2009 to 2014
2009 2010 2011 2012 2013 2014
< 20 174,549 178,869 179,304 171,661 170,099 176,140
20 - 24 298,533 318,896 336,387 352,685 369,273 371,701
25 - 35 204,065 226,234 247,762 259,268 273,203 263,877
> 35 160,632 168,944 174,747 169,759 171,123 157,435
0
50,000
100,000
150,000
200,000
250,000
300,000
350,000
400,000
2009 2010 2011 2012 2013 2014
< 20 3,850 3,854 3,946 4,335 4,085 2,906
20 - 24 70,753 73,674 77,872 84,983 93,305 99,055
25 - 35 35,082 37,994 40,230 42,283 48,214 50,948
> 35 35,167 38,219 38,576 34,392 35,219 32,464
Total 144,852 153,741 160,624 165,993 180,823 185,373
0
20,000
40,000
60,000
80,000
100,000
120,000
140,000
160,000
180,000
200,000
STUDENT ENROLMENT AND COMPLETION DATA
VitalStats 2014 7
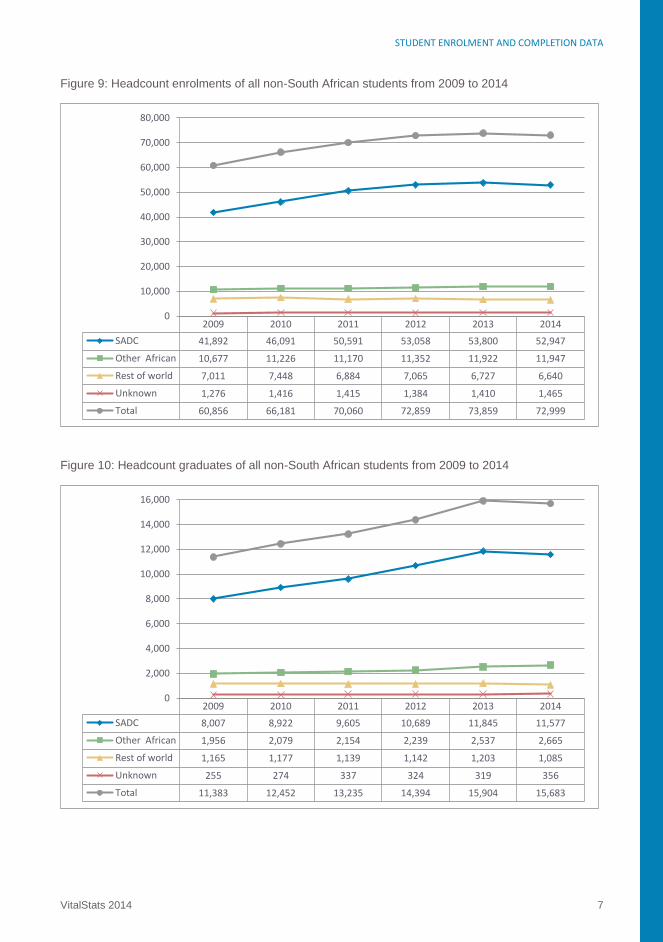
Figure 9: Headcount enrolments of all non-South African students from 2009 to 2014
Figure 10: Headcount graduates of all non-South African students from 2009 to 2014
2009 2010 2011 2012 2013 2014
SADC 41,892 46,091 50,591 53,058 53,800 52,947
Other African 10,677 11,226 11,170 11,352 11,922 11,947
Rest of world 7,011 7,448 6,884 7,065 6,727 6,640
Unknown 1,276 1,416 1,415 1,384 1,410 1,465
Total 60,856 66,181 70,060 72,859 73,859 72,999
0
10,000
20,000
30,000
40,000
50,000
60,000
70,000
80,000
2009 2010 2011 2012 2013 2014
SADC 8,007 8,922 9,605 10,689 11,845 11,577
Other African 1,956 2,079 2,154 2,239 2,537 2,665
Rest of world 1,165 1,177 1,139 1,142 1,203 1,085
Unknown 255 274 337 324 319 356
Total 11,383 12,452 13,235 14,394 15,904 15,683
0
2,000
4,000
6,000
8,000
10,000
12,000
14,000
16,000
STUDENT ENROLMENT AND COMPLETION DATA
8 VitalStats 2014
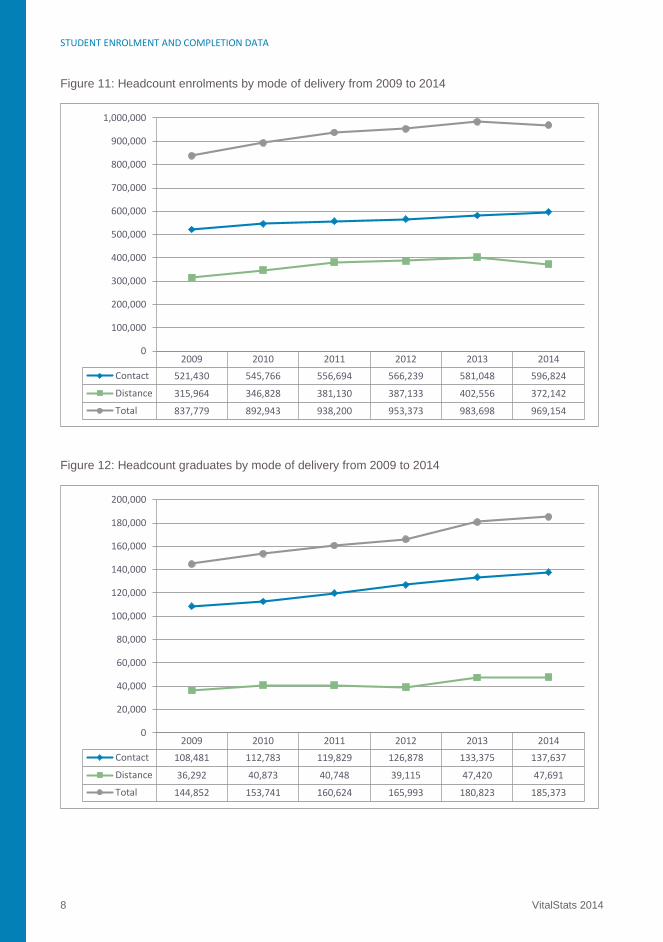
Figure 11: Headcount enrolments by mode of delivery from 2009 to 2014
Figure 12: Headcount graduates by mode of delivery from 2009 to 2014
2009 2010 2011 2012 2013 2014
Contact 521,430 545,766 556,694 566,239 581,048 596,824
Distance 315,964 346,828 381,130 387,133 402,556 372,142
Total 837,779 892,943 938,200 953,373 983,698 969,154
0
100,000
200,000
300,000
400,000
500,000
600,000
700,000
800,000
900,000
1,000,000
2009 2010 2011 2012 2013 2014
Contact 108,481 112,783 119,829 126,878 133,375 137,637
Distance 36,292 40,873 40,748 39,115 47,420 47,691
Total 144,852 153,741 160,624 165,993 180,823 185,373
0
20,000
40,000
60,000
80,000
100,000
120,000
140,000
160,000
180,000
200,000
STUDENT ENROLMENT AND COMPLETION DATA
VitalStats 2014 9
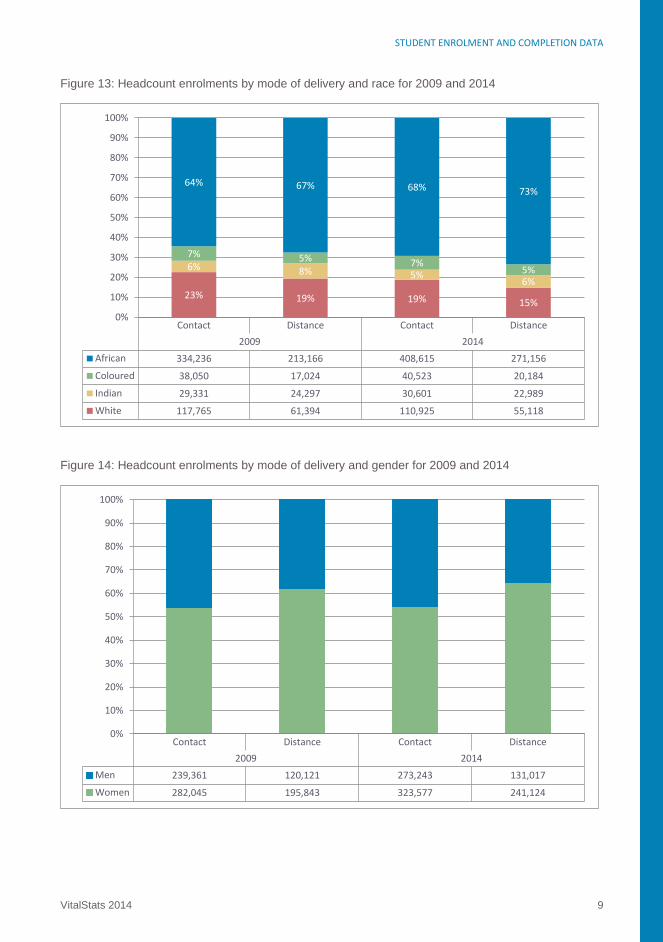
Figure 13: Headcount enrolments by mode of delivery and race for 2009 and 2014
Figure 14: Headcount enrolments by mode of delivery and gender for 2009 and 2014
Contact Distance Contact Distance
2009 2014
African 334,236 213,166 408,615 271,156
Coloured 38,050 17,024 40,523 20,184
Indian 29,331 24,297 30,601 22,989
White 117,765 61,394 110,925 55,118
23% 19% 19% 15%
6% 8% 5%6%
7% 5% 7%5%
64% 67% 68% 73%
0%
10%
20%
30%
40%
50%
60%
70%
80%
90%
100%
Contact Distance Contact Distance
2009 2014
Men 239,361 120,121 273,243 131,017
Women 282,045 195,843 323,577 241,124
0%
10%
20%
30%
40%
50%
60%
70%
80%
90%
100%

STUDENT ENROLMENT AND COMPLETION DATA
10 VitalStats 2014
Figure 15: Headcount graduates by mode of delivery and race for 2009 and 2014
Figure 16: Headcount graduates by mode of delivery and gender for 2009 and 2014
Contact Distance Contact Distance
2009 2014
African 61,007 25,783 88,269 33,869
Coloured 8,537 1,385 9,501 2,124
Indian 6,459 2,052 7,270 2,982
White 32,165 7,063 31,173 8,338
30%19% 23% 17%
6%
6%5%
6%
8%
4%7%
4%
56%
71%64%
71%
0%
10%
20%
30%
40%
50%
60%
70%
80%
90%
100%
Contact Distance Contact Distance
2009 2014
Men 46,064 10,694 57,788 14,930
Women 62,416 25,598 79,849 32,761
0%
10%
20%
30%
40%
50%
60%
70%
80%
90%
100%
STUDENT ENROLMENT AND COMPLETION DATA
VitalStats 2014 11
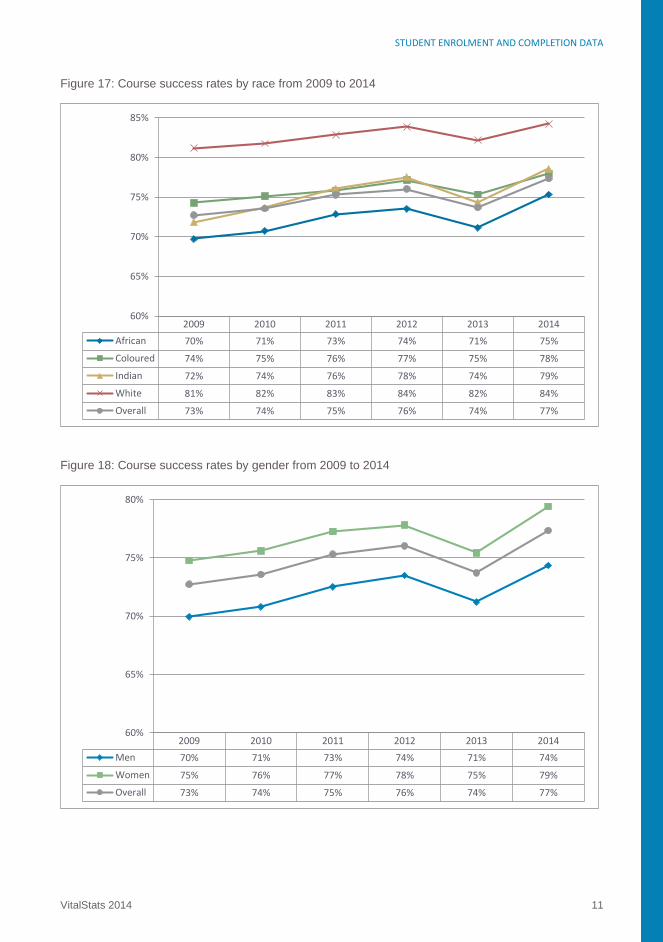
Figure 17: Course success rates by race from 2009 to 2014
Figure 18: Course success rates by gender from 2009 to 2014
2009 2010 2011 2012 2013 2014
African 70% 71% 73% 74% 71% 75%
Coloured 74% 75% 76% 77% 75% 78%
Indian 72% 74% 76% 78% 74% 79%
White 81% 82% 83% 84% 82% 84%
Overall 73% 74% 75% 76% 74% 77%
60%
65%
70%
75%
80%
85%
2009 2010 2011 2012 2013 2014
Men 70% 71% 73% 74% 71% 74%
Women 75% 76% 77% 78% 75% 79%
Overall 73% 74% 75% 76% 74% 77%
60%
65%
70%
75%
80%
STUDENT ENROLMENT AND COMPLETION DATA
12 VitalStats 2014
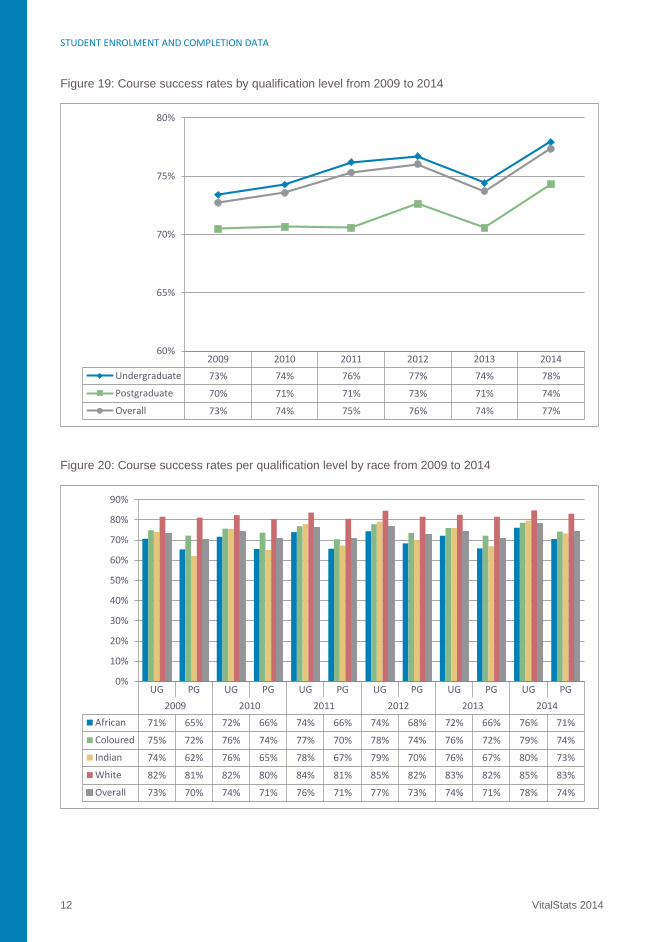
Figure 19: Course success rates by qualification level from 2009 to 2014
Figure 20: Course success rates per qualification level by race from 2009 to 2014
2009 2010 2011 2012 2013 2014
Undergraduate 73% 74% 76% 77% 74% 78%
Postgraduate 70% 71% 71% 73% 71% 74%
Overall 73% 74% 75% 76% 74% 77%
60%
65%
70%
75%
80%
UG PG UG PG UG PG UG PG UG PG UG PG
2009 2010 2011 2012 2013 2014
African 71% 65% 72% 66% 74% 66% 74% 68% 72% 66% 76% 71%
Coloured 75% 72% 76% 74% 77% 70% 78% 74% 76% 72% 79% 74%
Indian 74% 62% 76% 65% 78% 67% 79% 70% 76% 67% 80% 73%
White 82% 81% 82% 80% 84% 81% 85% 82% 83% 82% 85% 83%
Overall 73% 70% 74% 71% 76% 71% 77% 73% 74% 71% 78% 74%
0%
10%
20%
30%
40%
50%
60%
70%
80%
90%
STUDENT ENROLMENT AND COMPLETION DATA
VitalStats 2014 13
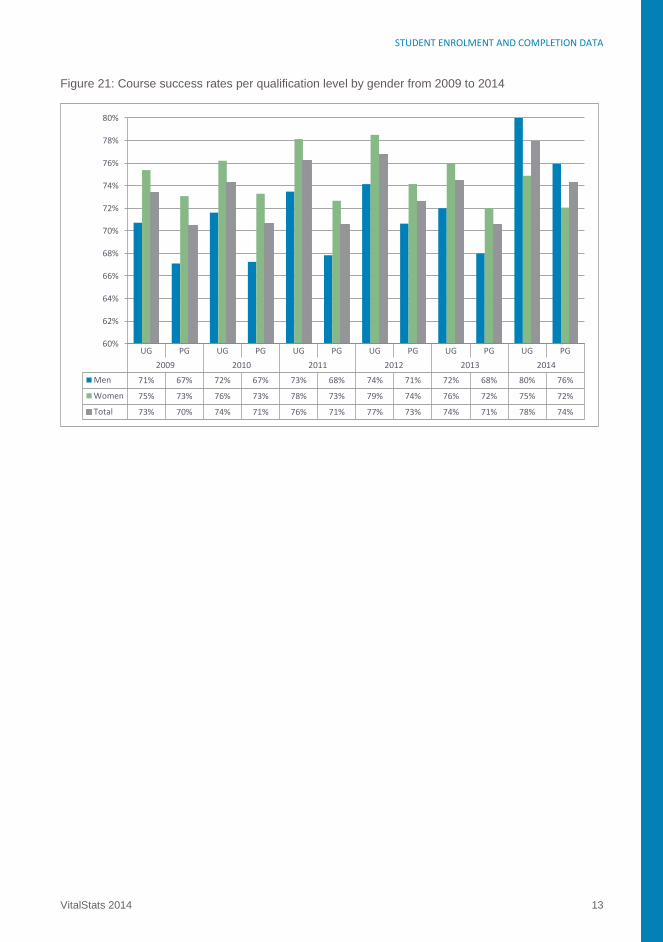
Figure 21: Course success rates per qualification level by gender from 2009 to 2014
UG PG UG PG UG PG UG PG UG PG UG PG
2009 2010 2011 2012 2013 2014
Men 71% 67% 72% 67% 73% 68% 74% 71% 72% 68% 80% 76%
Women 75% 73% 76% 73% 78% 73% 79% 74% 76% 72% 75% 72%
Total 73% 70% 74% 71% 76% 71% 77% 73% 74% 71% 78% 74%
60%
62%
64%
66%
68%
70%
72%
74%
76%
78%
80%


STUDENT ENROLMENT AND COMPLETION DATA
VitalStats 2014 15

STUDENT DATA BY QUALIFICATION TYPE
VitalStats 2014 17
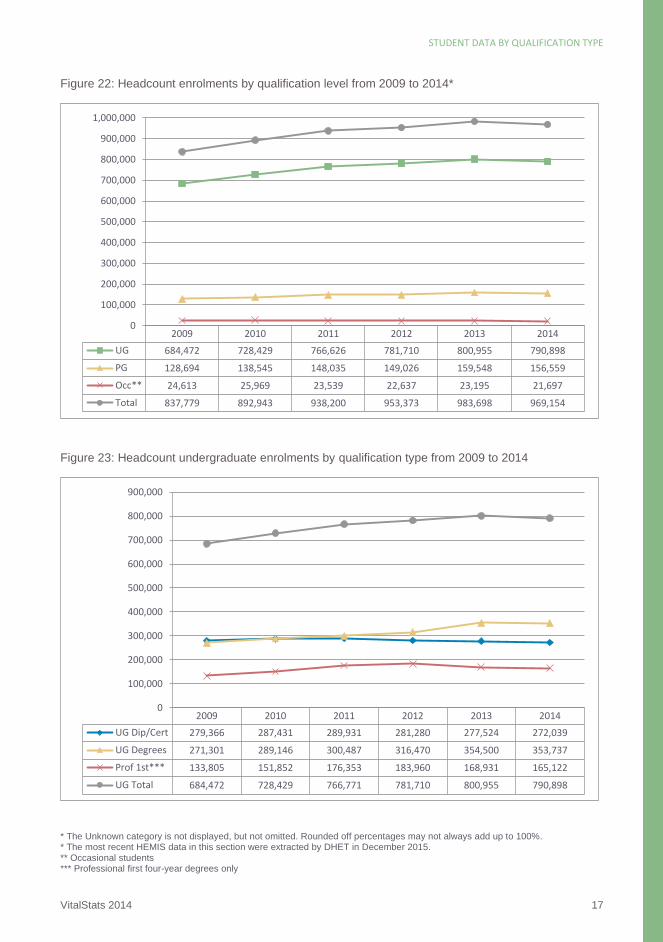
Figure 22: Headcount enrolments by qualification level from 2009 to 2014*
Figure 23: Headcount undergraduate enrolments by qualification type from 2009 to 2014
* The Unknown category is not displayed, but not omitted. Rounded off percentages may not always add up to 100%. * The most recent HEMIS data in this section were extracted by DHET in December 2015.
** Occasional students *** Professional first four-year degrees only
2009 2010 2011 2012 2013 2014
UG 684,472 728,429 766,626 781,710 800,955 790,898
PG 128,694 138,545 148,035 149,026 159,548 156,559
Occ** 24,613 25,969 23,539 22,637 23,195 21,697
Total 837,779 892,943 938,200 953,373 983,698 969,154
0
100,000
200,000
300,000
400,000
500,000
600,000
700,000
800,000
900,000
1,000,000
2009 2010 2011 2012 2013 2014
UG Dip/Cert 279,366 287,431 289,931 281,280 277,524 272,039
UG Degrees 271,301 289,146 300,487 316,470 354,500 353,737
Prof 1st*** 133,805 151,852 176,353 183,960 168,931 165,122
UG Total 684,472 728,429 766,771 781,710 800,955 790,898
0
100,000
200,000
300,000
400,000
500,000
600,000
700,000
800,000
900,000
STUDENT DATA BY QUALIFICATION TYPE
18 VitalStats 2014
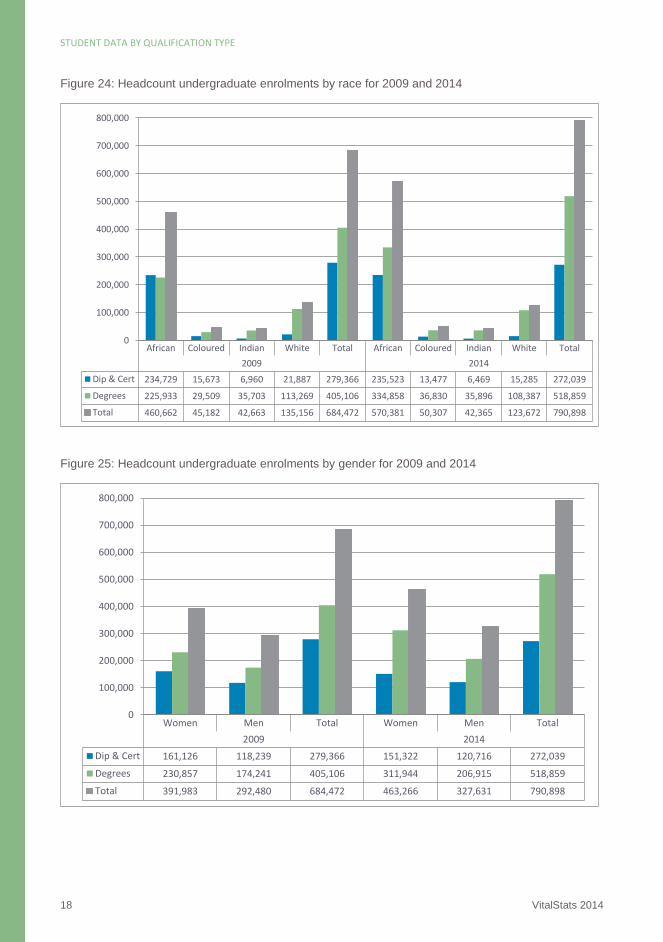
Figure 24: Headcount undergraduate enrolments by race for 2009 and 2014
Figure 25: Headcount undergraduate enrolments by gender for 2009 and 2014
African Coloured Indian White Total African Coloured Indian White Total
2009 2014
Dip & Cert 234,729 15,673 6,960 21,887 279,366 235,523 13,477 6,469 15,285 272,039
Degrees 225,933 29,509 35,703 113,269 405,106 334,858 36,830 35,896 108,387 518,859
Total 460,662 45,182 42,663 135,156 684,472 570,381 50,307 42,365 123,672 790,898
0
100,000
200,000
300,000
400,000
500,000
600,000
700,000
800,000
Women Men Total Women Men Total
2009 2014
Dip & Cert 161,126 118,239 279,366 151,322 120,716 272,039
Degrees 230,857 174,241 405,106 311,944 206,915 518,859
Total 391,983 292,480 684,472 463,266 327,631 790,898
0
100,000
200,000
300,000
400,000
500,000
600,000
700,000
800,000
STUDENT DATA BY QUALIFICATION TYPE
VitalStats 2014 19
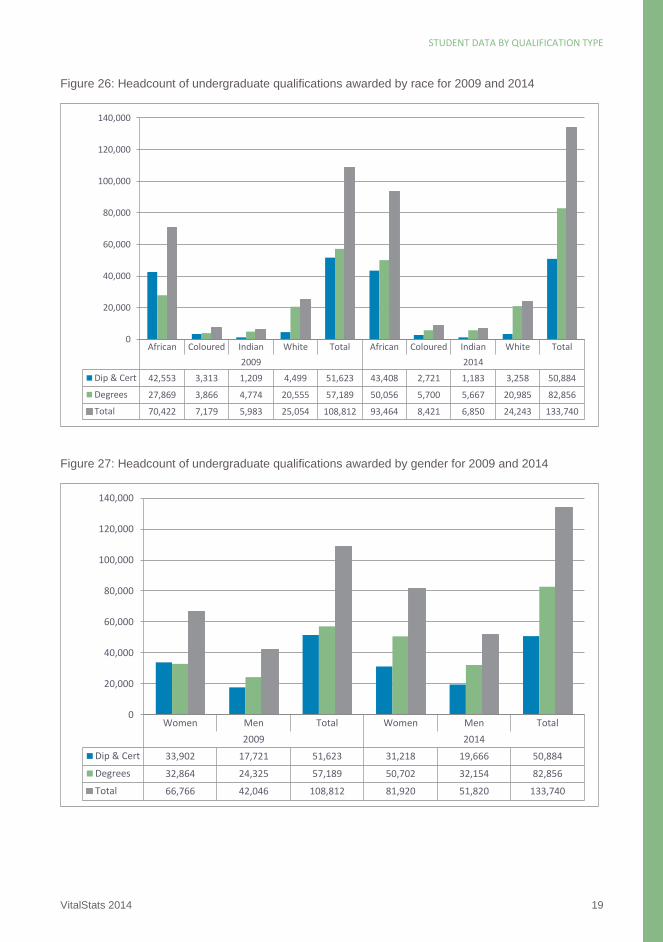
Figure 26: Headcount of undergraduate qualifications awarded by race for 2009 and 2014
Figure 27: Headcount of undergraduate qualifications awarded by gender for 2009 and 2014
African Coloured Indian White Total African Coloured Indian White Total
2009 2014
Dip & Cert 42,553 3,313 1,209 4,499 51,623 43,408 2,721 1,183 3,258 50,884
Degrees 27,869 3,866 4,774 20,555 57,189 50,056 5,700 5,667 20,985 82,856
Total 70,422 7,179 5,983 25,054 108,812 93,464 8,421 6,850 24,243 133,740
0
20,000
40,000
60,000
80,000
100,000
120,000
140,000
Women Men Total Women Men Total
2009 2014
Dip & Cert 33,902 17,721 51,623 31,218 19,666 50,884
Degrees 32,864 24,325 57,189 50,702 32,154 82,856
Total 66,766 42,046 108,812 81,920 51,820 133,740
0
20,000
40,000
60,000
80,000
100,000
120,000
140,000

STUDENT DATA BY QUALIFICATION TYPE
20 VitalStats 2014
Figure 28: Headcount of postgraduate enrolments by race for 2009 and 2014
Figure 29: Headcount of postgraduate enrolments by gender for 2009 and 2014
African Coloured Indian White Total African Coloured Indian White Total
2009 2014
PG up to Hons 46,031 5,019 4,827 18,384 74,442 56,850 5,042 4,882 16,820 84,941
Masters 21,260 2,868 3,977 15,384 43,723 29,094 3,395 4,110 15,568 53,675
Doctoral 4,370 646 810 4,637 10,529 9,291 924 1,356 5,730 17,943
Total 71,661 8,533 9,614 38,405 128,694 95,235 9,361 10,348 38,118 156,559
0
20,000
40,000
60,000
80,000
100,000
120,000
140,000
160,000
Women Men Total Women Men Total
2009 2014
PG up to Hons 46,971 27,470 74,442 53,790 31,151 84,941
Masters 20,537 23,182 43,723 26,733 26,941 53,675
Doctoral 4,486 6,041 10,529 7,885 10,055 17,943
Total 71,994 56,693 128,694 88,408 68,147 156,559
0
20,000
40,000
60,000
80,000
100,000
120,000
140,000
160,000

STUDENT DATA BY QUALIFICATION TYPE
VitalStats 2014 21
Figure 30: Headcount of postgraduate qualifications awarded by race for 2009 and 2014
Figure 31: Headcount of postgraduate qualifications awarded by gender for 2009 and 2014
African Coloured Indian White Total African Coloured Indian White Total
2009 2014
PG up to Hons 12,660 2,214 1,838 9,734 26,548 22,119 2,482 2,422 10,166 37,748
Masters 3,250 461 606 3,757 8,112 5,471 620 822 4,286 11,627
Doctoral 516 75 84 697 1,380 1,091 105 161 848 2,258
Total 16,426 2,750 2,528 14,188 36,040 28,681 3,207 3,405 15,300 51,633
0
10,000
20,000
30,000
40,000
50,000
60,000
Women Men Total Women Men Total
2009 2014
PG up to Hons 16,799 9,748 26,548 24,003 13,745 37,748
Masters 3,935 4,177 8,112 5,768 5,859 11,627
Doctoral 573 807 1,380 936 1,322 2,258
Total 21,307 14,732 36,040 30,707 20,926 51,633
0
10,000
20,000
30,000
40,000
50,000
60,000
STUDENT DATA BY QUALIFICATION TYPE
22 VitalStats 2014
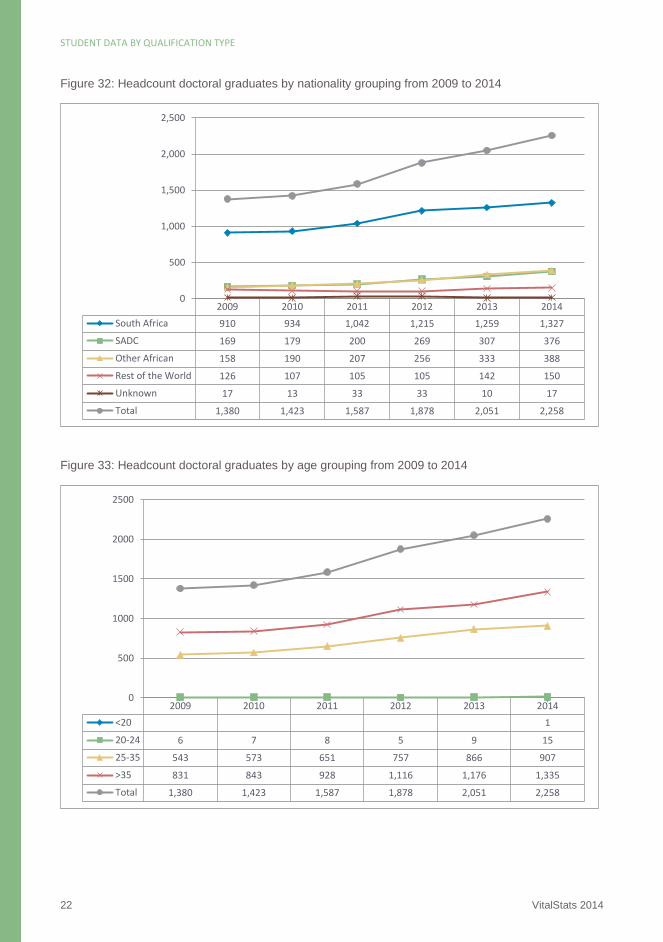
Figure 32: Headcount doctoral graduates by nationality grouping from 2009 to 2014
Figure 33: Headcount doctoral graduates by age grouping from 2009 to 2014
2009 2010 2011 2012 2013 2014
South Africa 910 934 1,042 1,215 1,259 1,327
SADC 169 179 200 269 307 376
Other African 158 190 207 256 333 388
Rest of the World 126 107 105 105 142 150
Unknown 17 13 33 33 10 17
Total 1,380 1,423 1,587 1,878 2,051 2,258
0
500
1,000
1,500
2,000
2,500
2009 2010 2011 2012 2013 2014
<20 1
20-24 6 7 8 5 9 15
25-35 543 573 651 757 866 907
>35 831 843 928 1,116 1,176 1,335
Total 1,380 1,423 1,587 1,878 2,051 2,258
0
500
1000
1500
2000
2500


STUDENT DATA BY FIELD OF STUDY
VitalStats 2014 25
Figure 34: Headcount enrolments by field of study from 2009 to 2014*
Figure 35: Headcount enrolments by field of study and mode of delivery for 2009 and 2014
* The Unknown category is not displayed, but not omitted. Rounded off percentages may not always add up to 100%.
The most recent HEMIS data in this section were extracted by DHET in December 2015. ** B&C: Business and Commerce; SET: Science, Engineering and Technology
2009 2010 2011 2012 2013 2014
B&C** 236,256 278,845 288,487 282,299 279,954 272,408
Edu 137,467 145,416 164,939 168,608 172,991 166,099
Hum 226,854 234,206 220,326 229,184 247,131 243,426
SET 237,166 234,472 264,447 273,282 283,622 287,221
0
50,000
100,000
150,000
200,000
250,000
300,000
Contact Distance Contact Distance
2009 2014
B&C 126,616 109,625 153,333 118,893
Edu 50,692 86,568 54,297 111,802
Hum 140,015 86,790 142,864 100,562
SET 204,071 32,981 246,330 40,885
Total 521,430 315,964 596,824 372,142
0
100,000
200,000
300,000
400,000
500,000
600,000
STUDENT DATA BY FIELD OF STUDY
26 VitalStats 2014
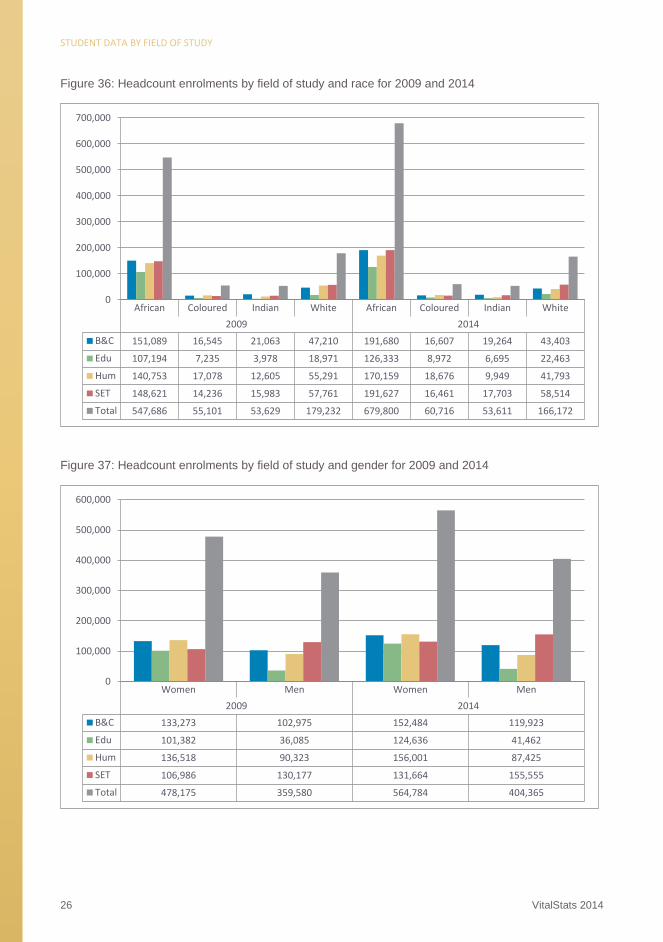
Figure 36: Headcount enrolments by field of study and race for 2009 and 2014
Figure 37: Headcount enrolments by field of study and gender for 2009 and 2014
African Coloured Indian White African Coloured Indian White
2009 2014
B&C 151,089 16,545 21,063 47,210 191,680 16,607 19,264 43,403
Edu 107,194 7,235 3,978 18,971 126,333 8,972 6,695 22,463
Hum 140,753 17,078 12,605 55,291 170,159 18,676 9,949 41,793
SET 148,621 14,236 15,983 57,761 191,627 16,461 17,703 58,514
Total 547,686 55,101 53,629 179,232 679,800 60,716 53,611 166,172
0
100,000
200,000
300,000
400,000
500,000
600,000
700,000
Women Men Women Men
2009 2014
B&C 133,273 102,975 152,484 119,923
Edu 101,382 36,085 124,636 41,462
Hum 136,518 90,323 156,001 87,425
SET 106,986 130,177 131,664 155,555
Total 478,175 359,580 564,784 404,365
0
100,000
200,000
300,000
400,000
500,000
600,000

STUDENT DATA BY FIELD OF STUDY
VitalStats 2014 27
Figure 38: Headcount graduates by field of study and race for 2009 and 2014
Figure 39: Headcount graduates by field of study and gender for 2009 and 2014
African Coloured Indian White African Coloured Indian White
2009 2014
B&C 19,492 2,496 2,684 9,043 32,696 3,160 3,750 10,448
Edu 27,636 2,114 949 4,800 27,798 2,179 1,328 5,456
Hum 17,875 2,448 1,999 12,100 27,169 3,022 1,746 9,871
SET 21,818 2,871 2,877 13,286 34,483 3,267 3,432 13,768
Total 86,848 9,929 8,511 39,242 122,145 11,628 10,255 39,543
0
20,000
40,000
60,000
80,000
100,000
120,000
Women Men Women Men
2009 2014
B&C 19,265 14,521 28,724 21,656
Edu 26,906 8,625 27,784 9,291
Hum 21,571 12,946 28,213 14,130
SET 20,310 20,661 27,906 27,669
Total 88,073 56,778 112,627 72,746
0
20,000
40,000
60,000
80,000
100,000
120,000

STUDENT DATA BY FIELD OF STUDY
28 VitalStats 2014
Figure 40: Course success rate by CESM* for 2014
Figure 41: FTE enrolled and completed figures per CESM category for 2014
* The CESM categories are listed in Appendix 2
82%84% 86%
71%
80%
74%
86%
74%
89%86%
79%
72%
82%
77%
68%
100%
81%80%78%
82%
77%
0%
10%
20%
30%
40%
50%
60%
70%
80%
90%
100%9,
573
6,8
40
9,44
4
162,
257
15,
539
38,5
52
94,6
76
35,7
02
35,3
35
2,8
18
33,5
89
50,6
54
23,0
70
25,7
48
28,5
06
1
7,50
9
25,5
79
24,7
39 36,8
16
7,8
43
5,7
78
8,1
38
114,
508
12,4
80
28,
557
81,4
39
26,3
96
31,
369
2,4
26
26,5
71 36,2
54
18,
885
19,7
44
19,4
34
2
6,0
55
20,
540
19,2
40 30,
225
0
20,000
40,000
60,000
80,000
100,000
120,000
140,000
160,000
180,000
1 2 3 4 5 6 7 8 9 10 11 12 13 14 15 16 17 18 19 20
Enrolled Completed

STUDENT DATA BY FIELD OF STUDY
VitalStats 2014 29
Figure 42: Course success rate by field of study from 2009 to 2014
Figure 43: FTE enrolments by field of study from 2009 to 2014
2009 2010 2011 2012 2013 2014
B&C 65% 67% 69% 69% 66% 71%
EDU 80% 82% 82% 82% 81% 86%
Hum 73% 76% 78% 78% 75% 78%
SET 74% 74% 75% 77% 76% 78%
Overall 73% 74% 75% 76% 74% 77%
50%
55%
60%
65%
70%
75%
80%
85%
90%
2009 2010 2011 2012 2013 2014
B&C 130,801 162,907 163,790 158,992 165,524 162,257
Edu 76,023 81,460 94,089 91,909 96,230 94,676
Hum 192,345 173,023 181,663 191,030 202,672 203,870
SET 170,538 182,700 188,866 192,885 201,431 206,144
Total 569,708 600,094 628,409 634,817 665,857 666,947
0
20,000
40,000
60,000
80,000
100,000
120,000
140,000
160,000
180,000
200,000
220,000

STUDENT DATA BY FIELD OF STUDY
30 VitalStats 2014
Figure 44: FTE completed by field of study from 2009 to 2014
2009 2010 2011 2012 2013 2014
B&C 85,643 108,380 112,926 110,417 109,319 114,508
Edu 61,038 66,643 77,247 75,470 77,822 81,439
Hum 141,364 131,679 140,902 148,628 151,390 159,502
SET 126,354 134,887 142,218 148,242 152,336 160,435
Total 414,399 441,590 473,293 482,758 490,868 515,884
0
20,000
40,000
60,000
80,000
100,000
120,000
140,000
160,000


STUDENT DATA BY INSTITUTIONAL TYPE
VitalStats 2014 33
Figure 45: Headcount enrolments by institutional type from 2009 to 2014*
Figure 46: Headcount enrolments by institutional type and race for 2009 and 2014
* The Unknown category is not displayed, but not omitted. Rounded off percentages may not always add up to 100%.
The most recent HEMIS data in this section were extracted by DHET in December 2015.
2009 2010 2011 2012 2013 2014
UoTs 148,964 153,168 152,212 154,822 159,006 161,491
Comp 124,584 126,579 129,747 126,736 127,278 130,669
Trad 300,672 319,759 327,377 335,529 342,174 348,503
UNISA 263,559 293,437 328,864 336,286 355,240 328,491
0
50,000
100,000
150,000
200,000
250,000
300,000
350,000
400,000
African Coloured Indian White Total African Coloured Indian White Total
2009 2014
UoTs 118,396 12,181 5,097 13,212 148,964 136,897 10,703 4,701 9,135 161,491
Comp 100,703 5,087 3,224 15,541 124,584 110,670 5,355 2,822 11,816 130,669
Trad 159,973 22,495 21,890 94,362 300,672 198,580 26,519 23,655 92,035 348,503
UNISA 168,614 15,338 23,418 56,117 263,559 233,653 18,139 22,433 53,186 328,491
Total 547,686 55,101 53,629 179,232 837,779 679,800 60,716 53,611 166,172 969,154
0
50,000
100,000
150,000
200,000
250,000
300,000
350,000
STUDENT DATA BY INSTITUTIONAL TYPE
34 VitalStats 2014
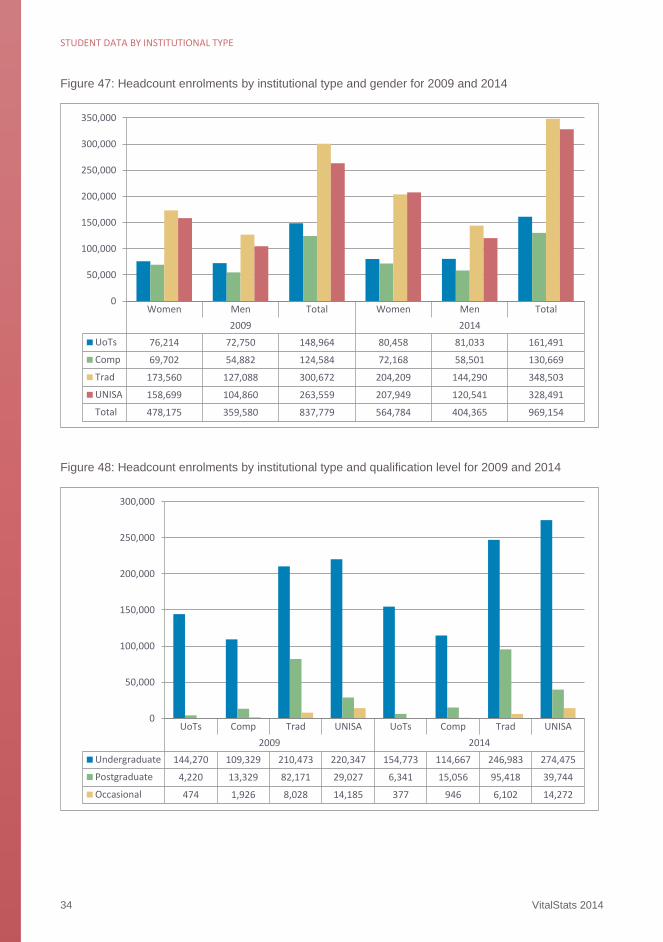
Figure 47: Headcount enrolments by institutional type and gender for 2009 and 2014
Figure 48: Headcount enrolments by institutional type and qualification level for 2009 and 2014
Women Men Total Women Men Total
2009 2014
UoTs 76,214 72,750 148,964 80,458 81,033 161,491
Comp 69,702 54,882 124,584 72,168 58,501 130,669
Trad 173,560 127,088 300,672 204,209 144,290 348,503
UNISA 158,699 104,860 263,559 207,949 120,541 328,491
Total 478,175 359,580 837,779 564,784 404,365 969,154
0
50,000
100,000
150,000
200,000
250,000
300,000
350,000
UoTs Comp Trad UNISA UoTs Comp Trad UNISA
2009 2014
Undergraduate 144,270 109,329 210,473 220,347 154,773 114,667 246,983 274,475
Postgraduate 4,220 13,329 82,171 29,027 6,341 15,056 95,418 39,744
Occasional 474 1,926 8,028 14,185 377 946 6,102 14,272
0
50,000
100,000
150,000
200,000
250,000
300,000
STUDENT DATA BY INSTITUTIONAL TYPE
VitalStats 2014 35
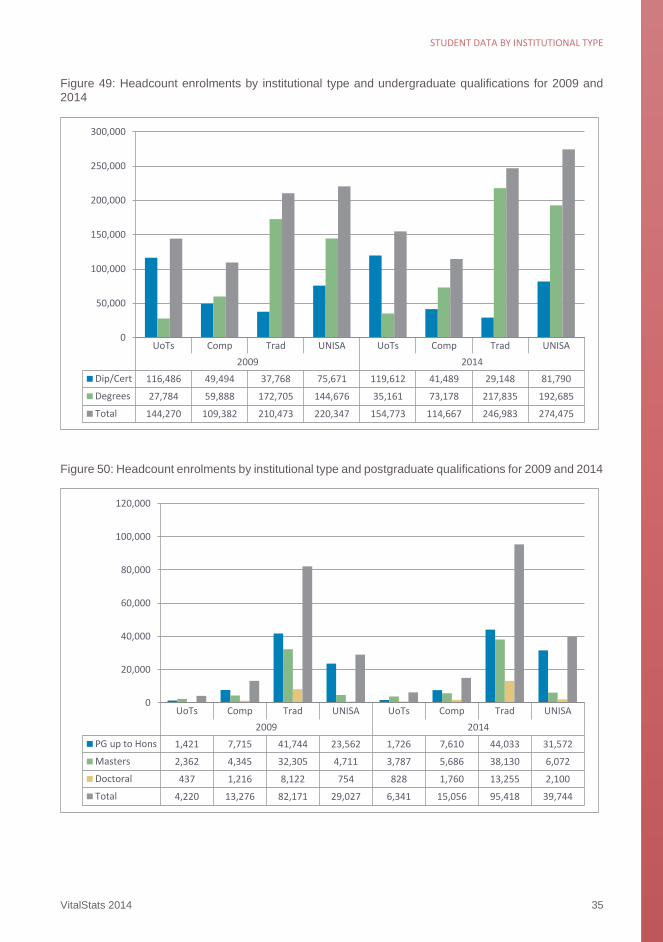
Figure 49: Headcount enrolments by institutional type and undergraduate qualifications for 2009 and
2014
Figure 50: Headcount enrolments by institutional type and postgraduate qualifications for 2009 and 2014
UoTs Comp Trad UNISA UoTs Comp Trad UNISA
2009 2014
Dip/Cert 116,486 49,494 37,768 75,671 119,612 41,489 29,148 81,790
Degrees 27,784 59,888 172,705 144,676 35,161 73,178 217,835 192,685
Total 144,270 109,382 210,473 220,347 154,773 114,667 246,983 274,475
0
50,000
100,000
150,000
200,000
250,000
300,000
UoTs Comp Trad UNISA UoTs Comp Trad UNISA
2009 2014
PG up to Hons 1,421 7,715 41,744 23,562 1,726 7,610 44,033 31,572
Masters 2,362 4,345 32,305 4,711 3,787 5,686 38,130 6,072
Doctoral 437 1,216 8,122 754 828 1,760 13,255 2,100
Total 4,220 13,276 82,171 29,027 6,341 15,056 95,418 39,744
0
20,000
40,000
60,000
80,000
100,000
120,000

STUDENT DATA BY INSTITUTIONAL TYPE
36 VitalStats 2014
Figure 51: Headcount graduates by institutional type from 2009 to 2014
Figure 52: Headcount enrolments at Universities of Technology from 2009 to 2014
2009 2010 2011 2012 2013 2014
UoTs 30,597 30,204 32,244 33,591 35,228 36,231
Comp 23,076 26,073 25,837 28,043 28,421 29,587
Trad 68,504 73,087 75,735 78,149 82,240 81,659
UNISA 22,675 24,377 26,808 26,210 34,934 37,896
0
10,000
20,000
30,000
40,000
50,000
60,000
70,000
80,000
90,000
2009 2010 2011 2012 2013 2014
CPUT 30,958 32,167 32,506 33,509 33,477 33,186
CUT 12,205 12,583 12,644 12,724 13,303 14,352
DUT 24,026 25,184 24,840 24,875 26,059 26,472
MUT 9,680 10,033 10,286 10,802 11,375 11,377
TUT 52,688 51,785 50,075 51,711 54,159 56,785
VUT 19,407 21,416 21,861 21,201 20,633 19,319
0
10,000
20,000
30,000
40,000
50,000
60,000
STUDENT DATA BY INSTITUTIONAL TYPE
VitalStats 2014 37
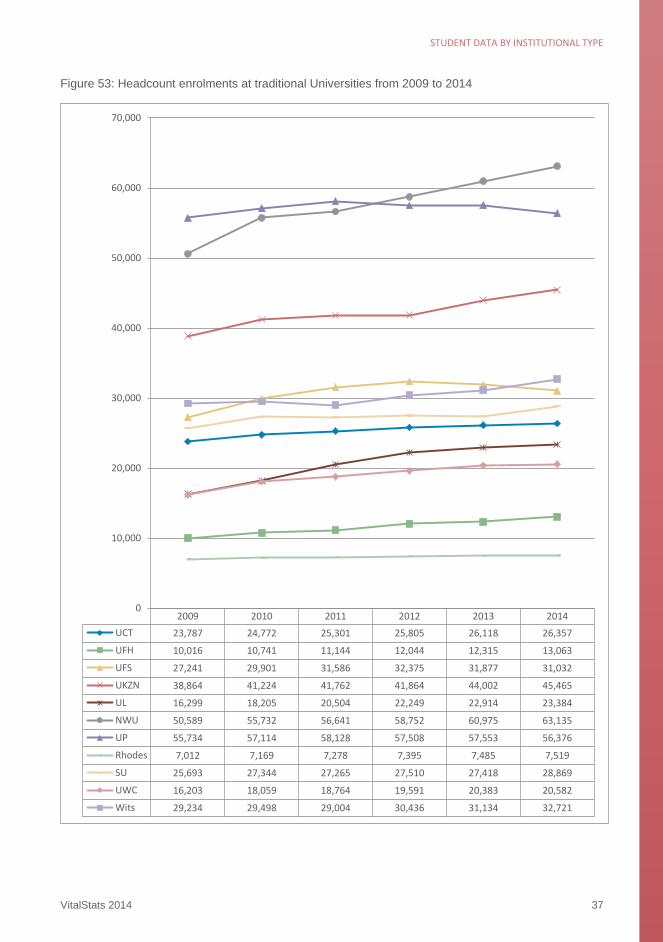
Figure 53: Headcount enrolments at traditional Universities from 2009 to 2014
2009 2010 2011 2012 2013 2014
UCT 23,787 24,772 25,301 25,805 26,118 26,357
UFH 10,016 10,741 11,144 12,044 12,315 13,063
UFS 27,241 29,901 31,586 32,375 31,877 31,032
UKZN 38,864 41,224 41,762 41,864 44,002 45,465
UL 16,299 18,205 20,504 22,249 22,914 23,384
NWU 50,589 55,732 56,641 58,752 60,975 63,135
UP 55,734 57,114 58,128 57,508 57,553 56,376
Rhodes 7,012 7,169 7,278 7,395 7,485 7,519
SU 25,693 27,344 27,265 27,510 27,418 28,869
UWC 16,203 18,059 18,764 19,591 20,383 20,582
Wits 29,234 29,498 29,004 30,436 31,134 32,721
0
10,000
20,000
30,000
40,000
50,000
60,000
70,000
STUDENT DATA BY INSTITUTIONAL TYPE
38 VitalStats 2014
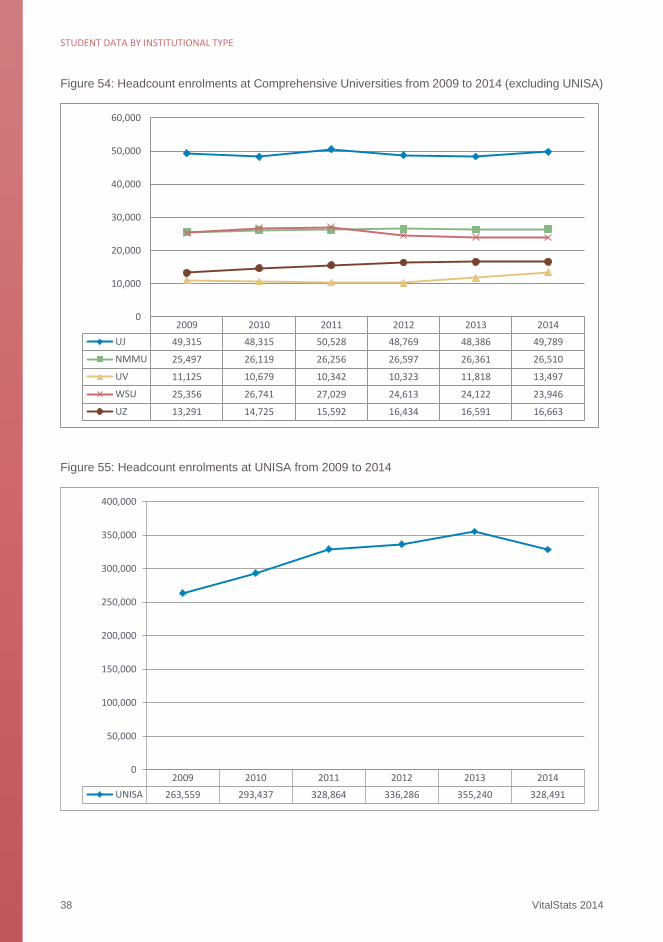
Figure 54: Headcount enrolments at Comprehensive Universities from 2009 to 2014 (excluding UNISA)
Figure 55: Headcount enrolments at UNISA from 2009 to 2014
2009 2010 2011 2012 2013 2014
UJ 49,315 48,315 50,528 48,769 48,386 49,789
NMMU 25,497 26,119 26,256 26,597 26,361 26,510
UV 11,125 10,679 10,342 10,323 11,818 13,497
WSU 25,356 26,741 27,029 24,613 24,122 23,946
UZ 13,291 14,725 15,592 16,434 16,591 16,663
0
10,000
20,000
30,000
40,000
50,000
60,000
2009 2010 2011 2012 2013 2014
UNISA 263,559 293,437 328,864 336,286 355,240 328,491
0
50,000
100,000
150,000
200,000
250,000
300,000
350,000
400,000


STAFF COMPLEMENT
VitalStats 2014 41
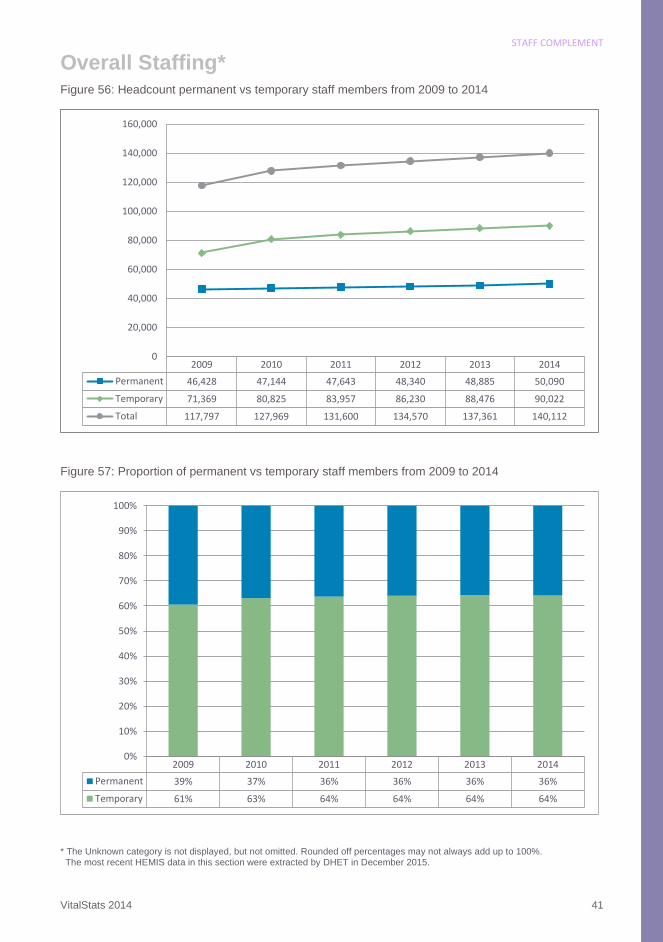
Overall Staffing*
Figure 56: Headcount permanent vs temporary staff members from 2009 to 2014
Figure 57: Proportion of permanent vs temporary staff members from 2009 to 2014
* The Unknown category is not displayed, but not omitted. Rounded off percentages may not always add up to 100%.
The most recent HEMIS data in this section were extracted by DHET in December 2015.
2009 2010 2011 2012 2013 2014
Permanent 46,428 47,144 47,643 48,340 48,885 50,090
Temporary 71,369 80,825 83,957 86,230 88,476 90,022
Total 117,797 127,969 131,600 134,570 137,361 140,112
0
20,000
40,000
60,000
80,000
100,000
120,000
140,000
160,000
2009 2010 2011 2012 2013 2014
Permanent 39% 37% 36% 36% 36% 36%
Temporary 61% 63% 64% 64% 64% 64%
0%
10%
20%
30%
40%
50%
60%
70%
80%
90%
100%

STAFF COMPLEMENT
42 VitalStats 2014
Figure 58: Headcount overall staff members by race from 2009 to 2014
Figure 59: Headcount overall staff by gender for 2009 and 2014
2009 2010 2011 2012 2013 2014
African 48,092 53,445 55,649 59,020 62,335 64,996
Coloured 11,605 12,356 13,007 13,407 13,702 13,998
Indian 7,456 7,858 8,269 8,256 8,325 8,464
White 49,960 53,008 53,107 52,744 51,579 50,513
Unknown 684 1,302 1,568 1,143 1,420 2,141
0
10,000
20,000
30,000
40,000
50,000
60,000
70,000
2009 2010 2011 2012 2013 2014
Men 56,028 60,967 62,474 63,731 64,823 65,906
Women 61,767 66,990 69,116 70,828 72,526 74,206
Total 117,797 127,969 131,600 134,570 137,361 140,112
0
10,000
20,000
30,000
40,000
50,000
60,000
70,000
80,000
STAFF COMPLEMENT
VitalStats 2014 43
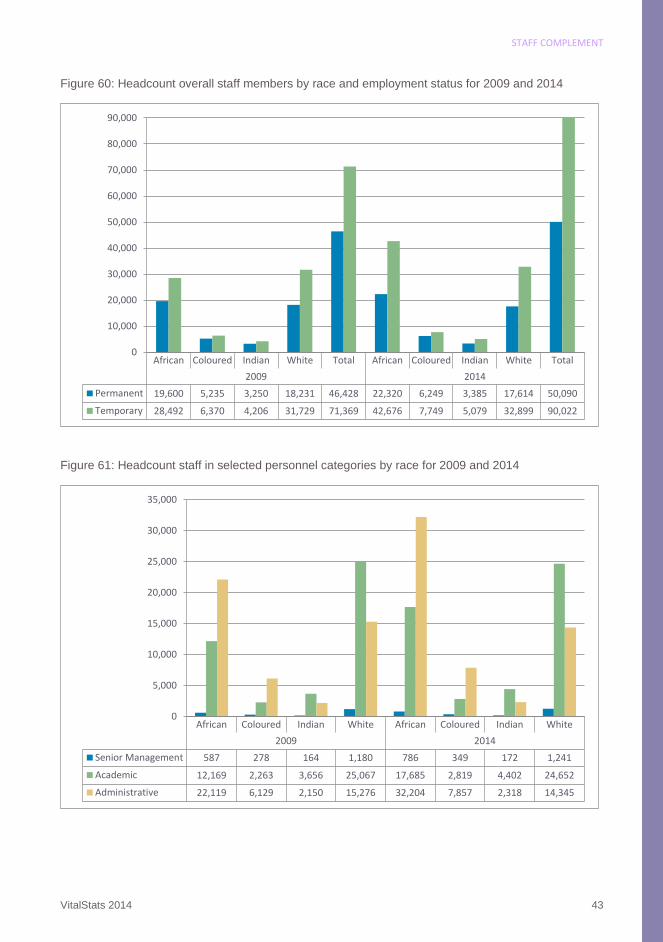
Figure 60: Headcount overall staff members by race and employment status for 2009 and 2014
Figure 61: Headcount staff in selected personnel categories by race for 2009 and 2014
African Coloured Indian White Total African Coloured Indian White Total
2009 2014
Permanent 19,600 5,235 3,250 18,231 46,428 22,320 6,249 3,385 17,614 50,090
Temporary 28,492 6,370 4,206 31,729 71,369 42,676 7,749 5,079 32,899 90,022
0
10,000
20,000
30,000
40,000
50,000
60,000
70,000
80,000
90,000
African Coloured Indian White African Coloured Indian White
2009 2014
Senior Management 587 278 164 1,180 786 349 172 1,241
Academic 12,169 2,263 3,656 25,067 17,685 2,819 4,402 24,652
Administrative 22,119 6,129 2,150 15,276 32,204 7,857 2,318 14,345
0
5,000
10,000
15,000
20,000
25,000
30,000
35,000
STAFF COMPLEMENT
44 VitalStats 2014
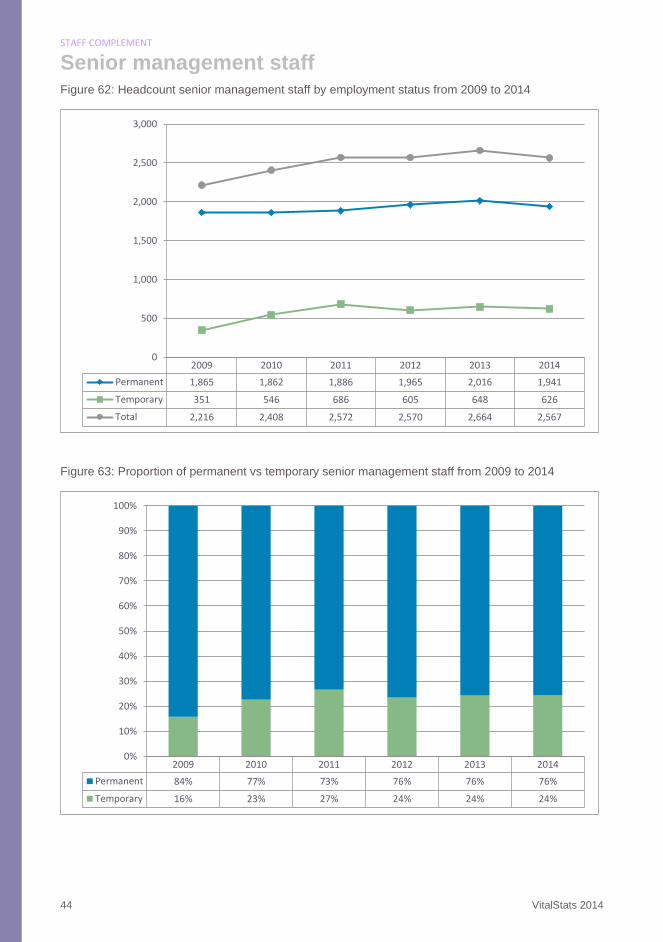
Senior management staff
Figure 62: Headcount senior management staff by employment status from 2009 to 2014
Figure 63: Proportion of permanent vs temporary senior management staff from 2009 to 2014
2009 2010 2011 2012 2013 2014
Permanent 1,865 1,862 1,886 1,965 2,016 1,941
Temporary 351 546 686 605 648 626
Total 2,216 2,408 2,572 2,570 2,664 2,567
0
500
1,000
1,500
2,000
2,500
3,000
2009 2010 2011 2012 2013 2014
Permanent 84% 77% 73% 76% 76% 76%
Temporary 16% 23% 27% 24% 24% 24%
0%
10%
20%
30%
40%
50%
60%
70%
80%
90%
100%

STAFF COMPLEMENT
VitalStats 2014 45
Figure 64: Headcount senior management staff members by race from 2009 to 2014
Figure 65: Headcount senior management staff members by gender from 2009 to 2014
2009 2010 2011 2012 2013 2014
African 587 653 684 689 731 786
Coloured 278 279 299 303 320 349
Indian 164 169 176 176 182 172
White 1,180 1,292 1,402 1,395 1,425 1,241
Total 2,216 2,408 2,572 2,570 2,664 2,567
0
200
400
600
800
1,000
1,200
1,400
1,600
2009 2010 2011 2012 2013 2014
Men 1,307 1,395 1,459 1,445 1,510 1,495
Women 909 1,013 1,113 1,125 1,154 1,072
Total 2,216 2,408 2,572 2,570 2,664 2,567
0
200
400
600
800
1,000
1,200
1,400
1,600
STAFF COMPLEMENT
46 VitalStats 2014
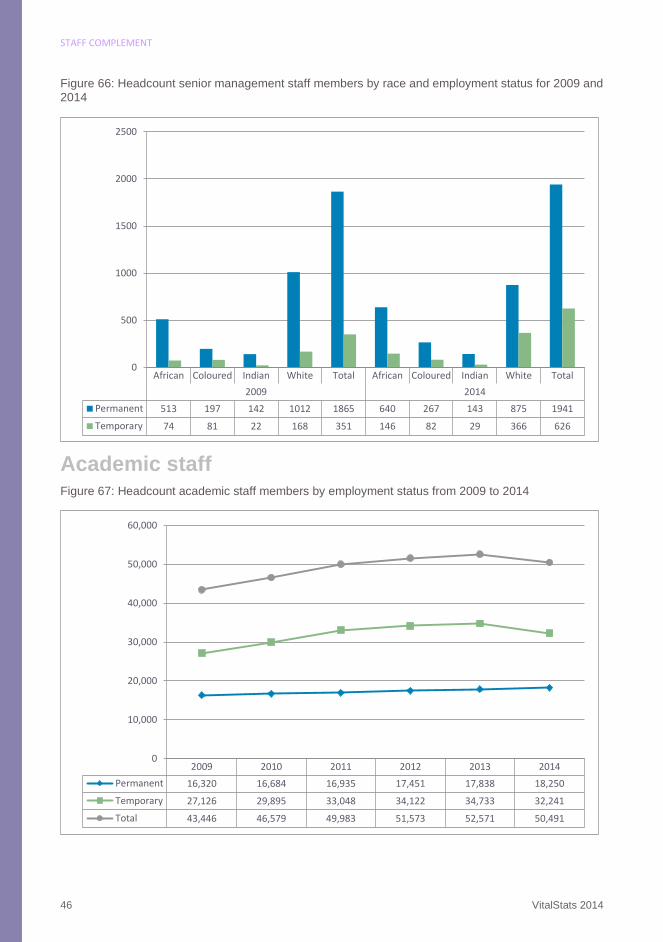
Figure 66: Headcount senior management staff members by race and employment status for 2009 and
2014
Academic staff
Figure 67: Headcount academic staff members by employment status from 2009 to 2014
African Coloured Indian White Total African Coloured Indian White Total
2009 2014
Permanent 513 197 142 1012 1865 640 267 143 875 1941
Temporary 74 81 22 168 351 146 82 29 366 626
0
500
1000
1500
2000
2500
2009 2010 2011 2012 2013 2014
Permanent 16,320 16,684 16,935 17,451 17,838 18,250
Temporary 27,126 29,895 33,048 34,122 34,733 32,241
Total 43,446 46,579 49,983 51,573 52,571 50,491
0
10,000
20,000
30,000
40,000
50,000
60,000
STAFF COMPLEMENT
VitalStats 2014 47
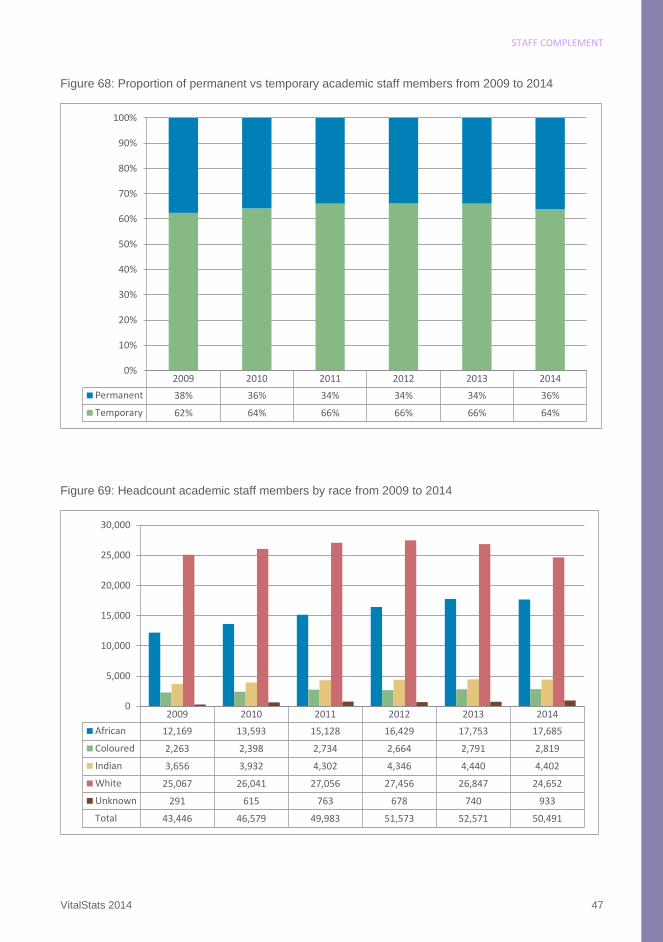
Figure 68: Proportion of permanent vs temporary academic staff members from 2009 to 2014
Figure 69: Headcount academic staff members by race from 2009 to 2014
2009 2010 2011 2012 2013 2014
Permanent 38% 36% 34% 34% 34% 36%
Temporary 62% 64% 66% 66% 66% 64%
0%
10%
20%
30%
40%
50%
60%
70%
80%
90%
100%
2009 2010 2011 2012 2013 2014
African 12,169 13,593 15,128 16,429 17,753 17,685
Coloured 2,263 2,398 2,734 2,664 2,791 2,819
Indian 3,656 3,932 4,302 4,346 4,440 4,402
White 25,067 26,041 27,056 27,456 26,847 24,652
Unknown 291 615 763 678 740 933
Total 43,446 46,579 49,983 51,573 52,571 50,491
0
5,000
10,000
15,000
20,000
25,000
30,000
STAFF COMPLEMENT
48 VitalStats 2014
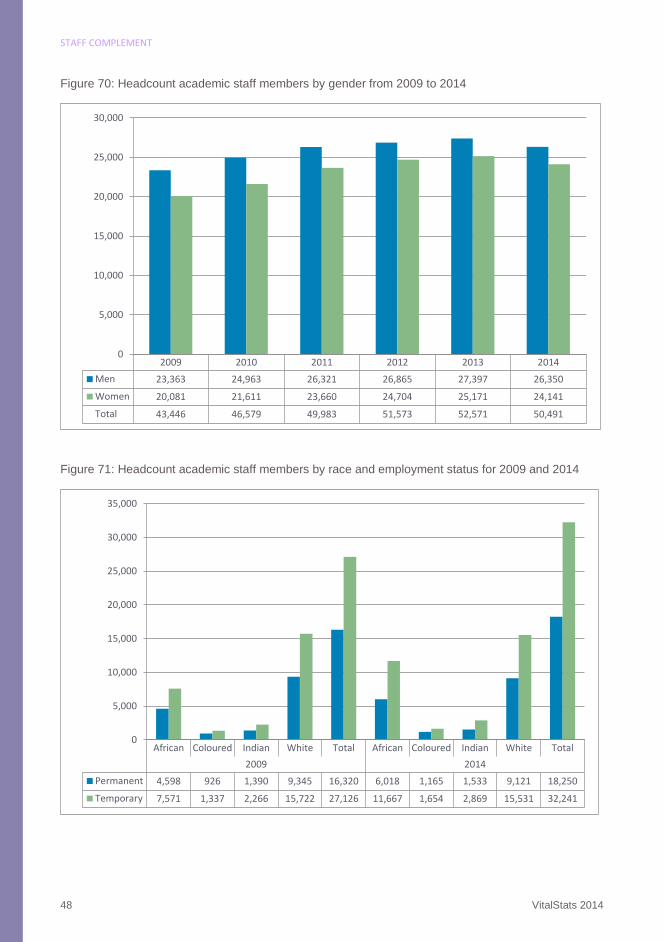
Figure 70: Headcount academic staff members by gender from 2009 to 2014
Figure 71: Headcount academic staff members by race and employment status for 2009 and 2014
2009 2010 2011 2012 2013 2014
Men 23,363 24,963 26,321 26,865 27,397 26,350
Women 20,081 21,611 23,660 24,704 25,171 24,141
Total 43,446 46,579 49,983 51,573 52,571 50,491
0
5,000
10,000
15,000
20,000
25,000
30,000
African Coloured Indian White Total African Coloured Indian White Total
2009 2014
Permanent 4,598 926 1,390 9,345 16,320 6,018 1,165 1,533 9,121 18,250
Temporary 7,571 1,337 2,266 15,722 27,126 11,667 1,654 2,869 15,531 32,241
0
5,000
10,000
15,000
20,000
25,000
30,000
35,000

STAFF COMPLEMENT
VitalStats 2014 49
Figure 72: Headcount academic staff by race and qualification level for 2009 and 2014
Figure 73: Headcount permanent academic staff by gender and qualification level for 2009 and 2014
* Other includes all unknowns and qualifications labelled as other.
UGDip/Cert
UGDegrees
PG up toHons
Masters Doctoral Other*UG
Dip/CertUG
DegreesPG up to
HonsMasters Doctoral Other*
2009 2014
African 528 1,834 1,450 2,583 1,441 4,333 492 2,175 2,024 3,661 2,595 6,738
Coloured 156 353 292 555 367 540 112 406 288 675 533 805
Indian 68 645 341 770 511 1,321 67 855 387 897 875 1,321
White 593 2,982 2,514 4,991 5,753 8,234 455 2,455 2,413 5,228 7,065 7,036
Unknown 2 30 24 43 60 132 20 61 53 168 435 196
0
1,000
2,000
3,000
4,000
5,000
6,000
7,000
8,000
UGDip/Cert
UGDegrees
PG up toHons
Masters Doctoral Other*UG
Dip/CertUG
DegreesPG up to
HonsMasters Doctoral Other*
2009 2014
Men 676 2,917 2,277 4,716 5,390 7,387 583 2,740 2,376 5,453 7,078 8,120
Women 670 2,927 2,343 4,226 2,742 7,173 563 3,212 2,789 5,176 4,425 7,976
0
1,000
2,000
3,000
4,000
5,000
6,000
7,000
8,000
9,000

STAFF COMPLEMENT
50 VitalStats 2014
Figure 74: Headcount permanent academic staff by race and qualification level for 2009 and 2014
Figure 75: Headcount permanent academic staff by gender and qualification level for 2009 and 2014
* Other includes all unknowns and qualifications labelled as other.
UGDip/Cert
UGDegrees
PG up toHons
Masters Doctoral Other*UG
Dip/CertUG
DegreesPG up to
HonsMasters Doctoral Other*
2009 2014
African 100 528 608 1,725 1,059 578 100 618 922 2,328 1,845 205
Coloured 31 115 130 371 242 37 22 121 101 471 430 20
Indian 28 197 152 509 376 128 10 176 174 555 593 25
White 148 751 1,096 2,970 3,985 395 62 474 904 2,906 4,649 126
Unknown 0 2 3 13 33 10 0 7 5 89 308 4
0
500
1,000
1,500
2,000
2,500
3,000
3,500
4,000
4,500
UGDip/Cert
UGDegrees
PG up toHons
Masters Doctoral Other*UG
Dip/CertUG
DegreesPG up to
HonsMasters Doctoral Other*
2009 2014
Men 158 791 998 2,902 3,760 584 98 666 1,033 3,206 4,719 214
Women 149 802 991 2,686 1,935 564 96 730 1,073 3,143 3,106 166
0
500
1,000
1,500
2,000
2,500
3,000
3,500
4,000
4,500
5,000
STAFF COMPLEMENT
VitalStats 2014 51
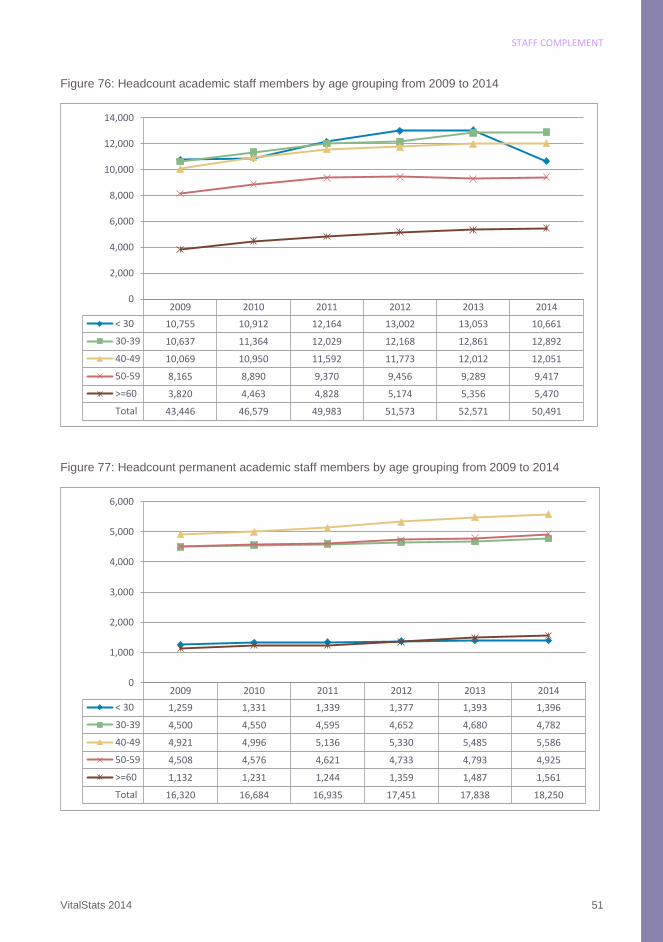
Figure 76: Headcount academic staff members by age grouping from 2009 to 2014
Figure 77: Headcount permanent academic staff members by age grouping from 2009 to 2014
2009 2010 2011 2012 2013 2014
< 30 10,755 10,912 12,164 13,002 13,053 10,661
30-39 10,637 11,364 12,029 12,168 12,861 12,892
40-49 10,069 10,950 11,592 11,773 12,012 12,051
50-59 8,165 8,890 9,370 9,456 9,289 9,417
>=60 3,820 4,463 4,828 5,174 5,356 5,470
Total 43,446 46,579 49,983 51,573 52,571 50,491
0
2,000
4,000
6,000
8,000
10,000
12,000
14,000
2009 2010 2011 2012 2013 2014
< 30 1,259 1,331 1,339 1,377 1,393 1,396
30-39 4,500 4,550 4,595 4,652 4,680 4,782
40-49 4,921 4,996 5,136 5,330 5,485 5,586
50-59 4,508 4,576 4,621 4,733 4,793 4,925
>=60 1,132 1,231 1,244 1,359 1,487 1,561
Total 16,320 16,684 16,935 17,451 17,838 18,250
0
1,000
2,000
3,000
4,000
5,000
6,000

STAFF COMPLEMENT
52 VitalStats 2014
Administrative staff
Figure 78: Headcount administrative staff members by employment status from 2009 to 2014
Figure 79: Proportion of permanent vs temporary administrative staff members from 2009 to 2014
2009 2010 2011 2012 2013 2014
Permanent 14,225 14,919 16,076 16,624 16,724 17,171
Temporary 31,637 37,246 37,604 37,401 37,854 40,006
Total 45,862 52,165 53,680 54,025 54,578 57,177
0
10,000
20,000
30,000
40,000
50,000
60,000
70,000
2009 2010 2011 2012 2013 2014
Permanent 31% 29% 30% 31% 31% 30%
Temporary 69% 71% 70% 69% 69% 70%
0%
10%
20%
30%
40%
50%
60%
70%
80%
90%
100%

STAFF COMPLEMENT
VitalStats 2014 53
Figure 80: Headcount administrative staff members by race from 2009 to 2014
Figure 81: Headcount administrative staff members by gender from 2009 to 2014
2009 2010 2011 2012 2013 2014
African 22,119 26,255 27,705 29,106 29,961 32,204
Coloured 6,129 6,940 7,294 7,571 7,725 7,857
Indian 2,150 2,267 2,362 2,209 2,149 2,318
White 15,276 16,361 15,971 14,902 14,335 14,345
Unknown 188 342 348 237 408 453
Total 45,862 52,165 53,680 54,025 54,578 57,177
0
5,000
10,000
15,000
20,000
25,000
30,000
2009 2010 2011 2012 2013 2014
Men 17,206 19,879 20,795 20,941 21,105 22,184
Women 28,656 32,279 32,879 33,077 33,464 34,993
Total 45,862 52,165 53,680 54,025 54,578 57,177
0
5,000
10,000
15,000
20,000
25,000
30,000
35,000
STAFF COMPLEMENT
54 VitalStats 2014
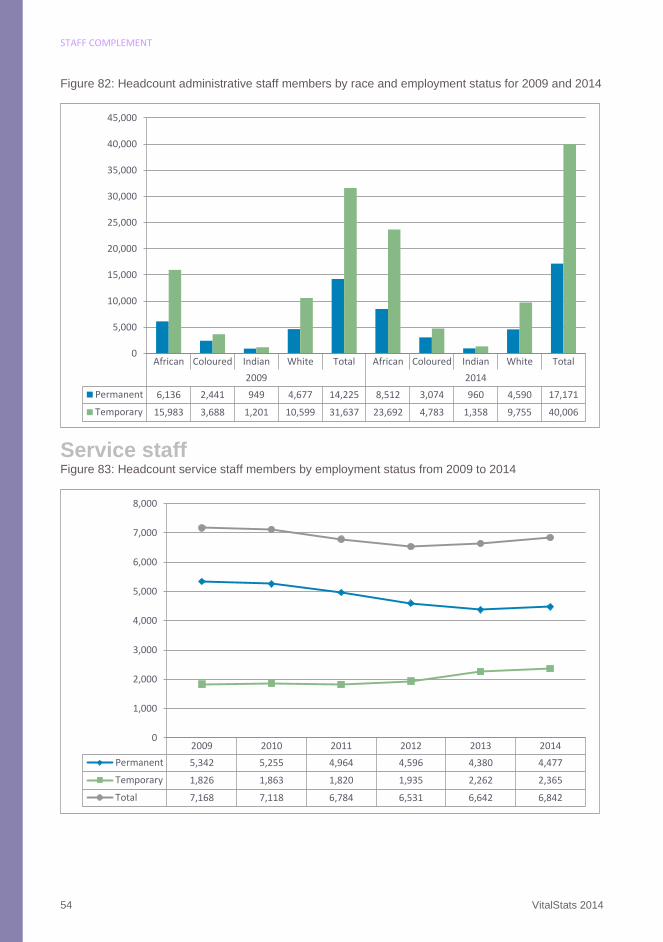
Figure 82: Headcount administrative staff members by race and employment status for 2009 and 2014
Service staff
Figure 83: Headcount service staff members by employment status from 2009 to 2014
African Coloured Indian White Total African Coloured Indian White Total
2009 2014
Permanent 6,136 2,441 949 4,677 14,225 8,512 3,074 960 4,590 17,171
Temporary 15,983 3,688 1,201 10,599 31,637 23,692 4,783 1,358 9,755 40,006
0
5,000
10,000
15,000
20,000
25,000
30,000
35,000
40,000
45,000
2009 2010 2011 2012 2013 2014
Permanent 5,342 5,255 4,964 4,596 4,380 4,477
Temporary 1,826 1,863 1,820 1,935 2,262 2,365
Total 7,168 7,118 6,784 6,531 6,642 6,842
0
1,000
2,000
3,000
4,000
5,000
6,000
7,000
8,000
STAFF COMPLEMENT
VitalStats 2014 55
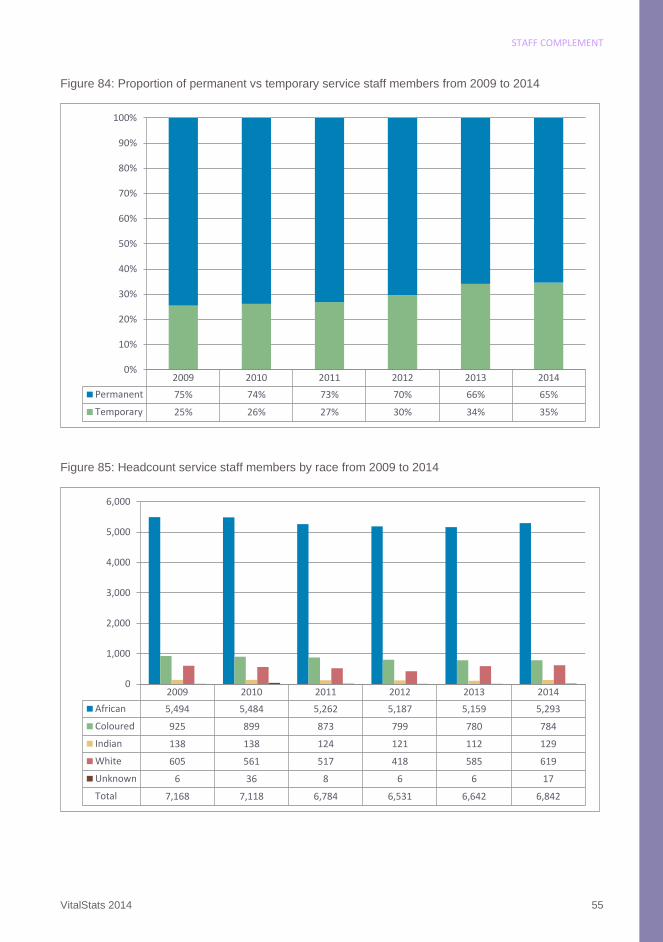
Figure 84: Proportion of permanent vs temporary service staff members from 2009 to 2014
Figure 85: Headcount service staff members by race from 2009 to 2014
2009 2010 2011 2012 2013 2014
Permanent 75% 74% 73% 70% 66% 65%
Temporary 25% 26% 27% 30% 34% 35%
0%
10%
20%
30%
40%
50%
60%
70%
80%
90%
100%
2009 2010 2011 2012 2013 2014
African 5,494 5,484 5,262 5,187 5,159 5,293
Coloured 925 899 873 799 780 784
Indian 138 138 124 121 112 129
White 605 561 517 418 585 619
Unknown 6 36 8 6 6 17
Total 7,168 7,118 6,784 6,531 6,642 6,842
0
1,000
2,000
3,000
4,000
5,000
6,000
STAFF COMPLEMENT
56 VitalStats 2014
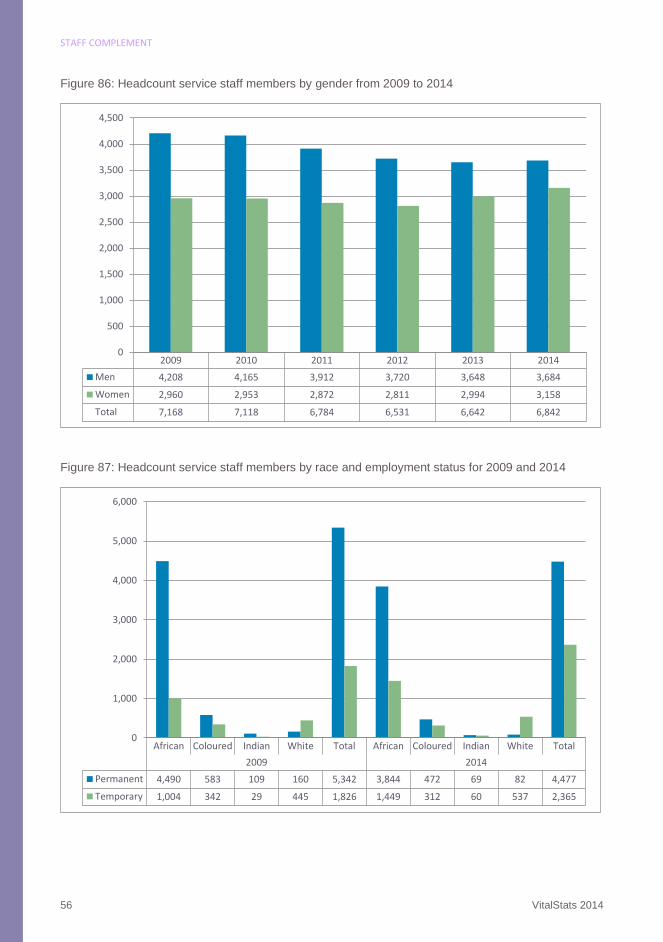
Figure 86: Headcount service staff members by gender from 2009 to 2014
Figure 87: Headcount service staff members by race and employment status for 2009 and 2014
2009 2010 2011 2012 2013 2014
Men 4,208 4,165 3,912 3,720 3,648 3,684
Women 2,960 2,953 2,872 2,811 2,994 3,158
Total 7,168 7,118 6,784 6,531 6,642 6,842
0
500
1,000
1,500
2,000
2,500
3,000
3,500
4,000
4,500
African Coloured Indian White Total African Coloured Indian White Total
2009 2014
Permanent 4,490 583 109 160 5,342 3,844 472 69 82 4,477
Temporary 1,004 342 29 445 1,826 1,449 312 60 537 2,365
0
1,000
2,000
3,000
4,000
5,000
6,000

STAFF COMPLEMENT
VitalStats 2014 57
Student: staff ratios
Figure 88: FTE Student: Staff ratio from 2009 to 2014
Figure 89: Headcount Student: Staff ratio for permanent and temporary academic staff together and
permanent academic staff only from 2009 to 2014
2009 2010 2011 2012 2013 2014
Ratio 27 27 27 26 27 27
0
5
10
15
20
25
30
2009 2010 2011 2012 2013 2014
HC ratio overall 19 19 19 18 19 19
HC ratio perm staff 51 54 55 55 55 53
0
10
20
30
40
50
60

STAFF COMPLEMENT
58 VitalStats 2014
Figure 90: FTE Student: Staff ratio by field of study from 2009 to 2014
2009 2010 2011 2012 2013 2014
B&C 65 61 57 54 55 48
Edu 60 60 63 61 67 63
Hum 34 38 36 38 41 39
SET 20 21 20 20 21 21
Overall 27 27 27 26 27 27
0
10
20
30
40
50
60
70


COHORT STUDY
VitalStats 2014 61
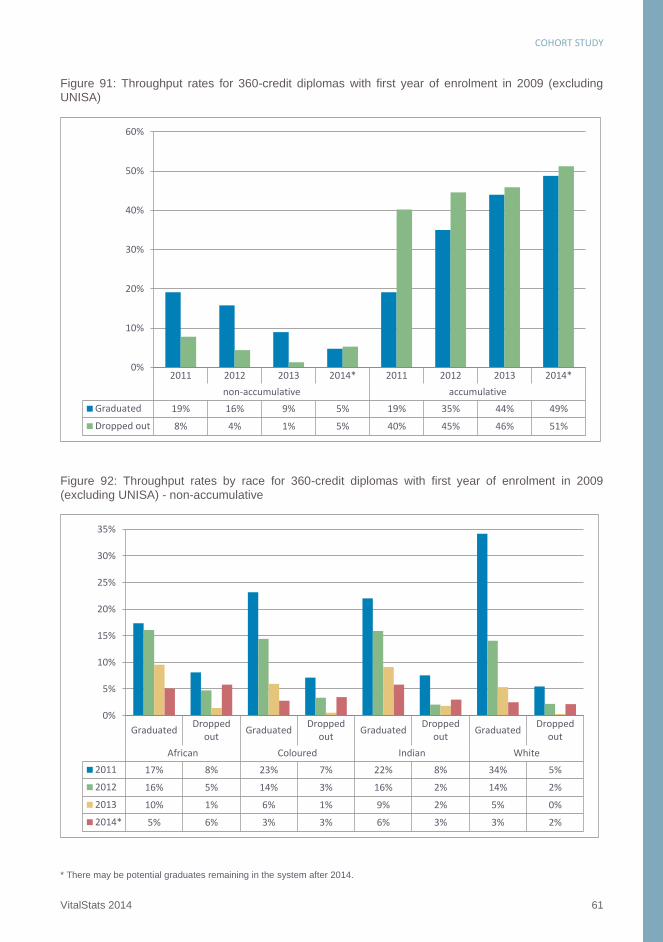
Figure 91: Throughput rates for 360-credit diplomas with first year of enrolment in 2009 (excluding
UNISA)
Figure 92: Throughput rates by race for 360-credit diplomas with first year of enrolment in 2009
(excluding UNISA) - non-accumulative
* There may be potential graduates remaining in the system after 2014.
2011 2012 2013 2014* 2011 2012 2013 2014*
non-accumulative accumulative
Graduated 19% 16% 9% 5% 19% 35% 44% 49%
Dropped out 8% 4% 1% 5% 40% 45% 46% 51%
0%
10%
20%
30%
40%
50%
60%
GraduatedDropped
outGraduated
Droppedout
GraduatedDropped
outGraduated
Droppedout
African Coloured Indian White
2011 17% 8% 23% 7% 22% 8% 34% 5%
2012 16% 5% 14% 3% 16% 2% 14% 2%
2013 10% 1% 6% 1% 9% 2% 5% 0%
2014* 5% 6% 3% 3% 6% 3% 3% 2%
0%
5%
10%
15%
20%
25%
30%
35%
COHORT STUDY
62 VitalStats 2014
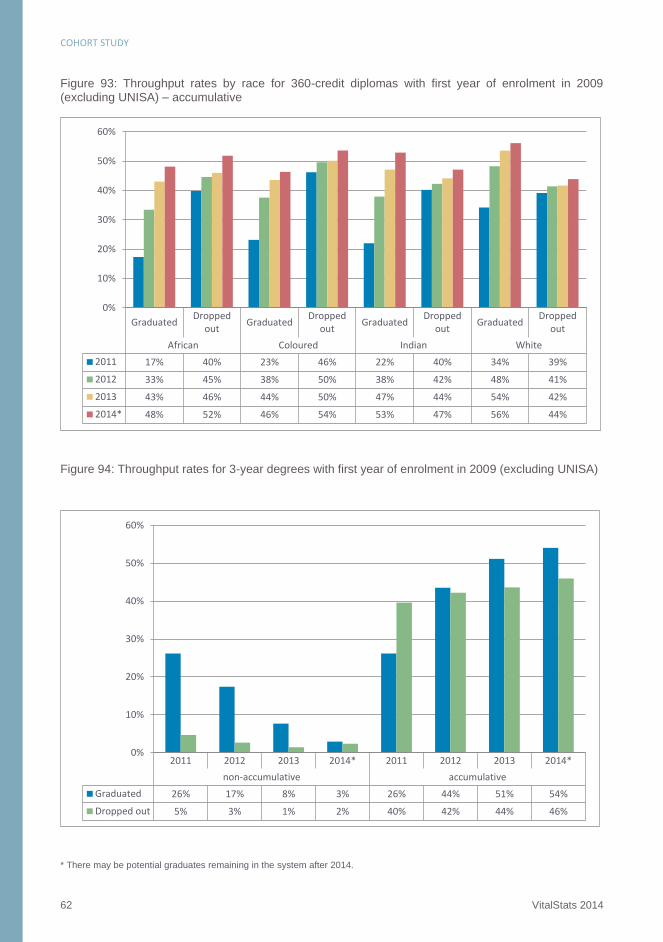
Figure 93: Throughput rates by race for 360-credit diplomas with first year of enrolment in 2009
(excluding UNISA) – accumulative
Figure 94: Throughput rates for 3-year degrees with first year of enrolment in 2009 (excluding UNISA)
* There may be potential graduates remaining in the system after 2014.
GraduatedDropped
outGraduated
Droppedout
GraduatedDropped
outGraduated
Droppedout
African Coloured Indian White
2011 17% 40% 23% 46% 22% 40% 34% 39%
2012 33% 45% 38% 50% 38% 42% 48% 41%
2013 43% 46% 44% 50% 47% 44% 54% 42%
2014* 48% 52% 46% 54% 53% 47% 56% 44%
0%
10%
20%
30%
40%
50%
60%
2011 2012 2013 2014* 2011 2012 2013 2014*
non-accumulative accumulative
Graduated 26% 17% 8% 3% 26% 44% 51% 54%
Dropped out 5% 3% 1% 2% 40% 42% 44% 46%
0%
10%
20%
30%
40%
50%
60%
COHORT STUDY
VitalStats 2014 63
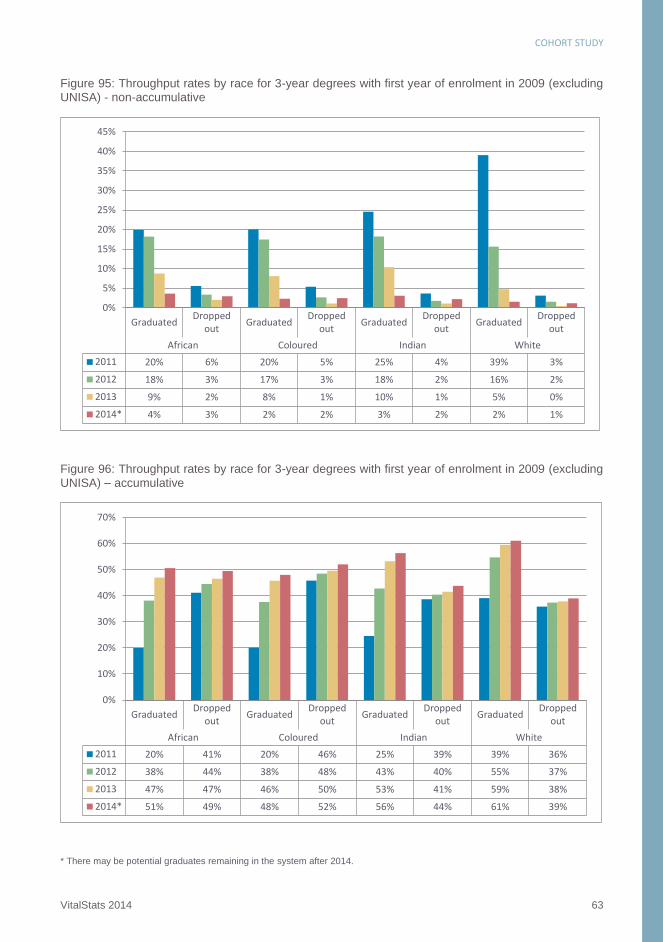
Figure 95: Throughput rates by race for 3-year degrees with first year of enrolment in 2009 (excluding
UNISA) - non-accumulative
Figure 96: Throughput rates by race for 3-year degrees with first year of enrolment in 2009 (excluding
UNISA) – accumulative
* There may be potential graduates remaining in the system after 2014.
GraduatedDropped
outGraduated
Droppedout
GraduatedDropped
outGraduated
Droppedout
African Coloured Indian White
2011 20% 6% 20% 5% 25% 4% 39% 3%
2012 18% 3% 17% 3% 18% 2% 16% 2%
2013 9% 2% 8% 1% 10% 1% 5% 0%
2014* 4% 3% 2% 2% 3% 2% 2% 1%
0%
5%
10%
15%
20%
25%
30%
35%
40%
45%
GraduatedDropped
outGraduated
Droppedout
GraduatedDropped
outGraduated
Droppedout
African Coloured Indian White
2011 20% 41% 20% 46% 25% 39% 39% 36%
2012 38% 44% 38% 48% 43% 40% 55% 37%
2013 47% 47% 46% 50% 53% 41% 59% 38%
2014* 51% 49% 48% 52% 56% 44% 61% 39%
0%
10%
20%
30%
40%
50%
60%
70%
COHORT STUDY
64 VitalStats 2014
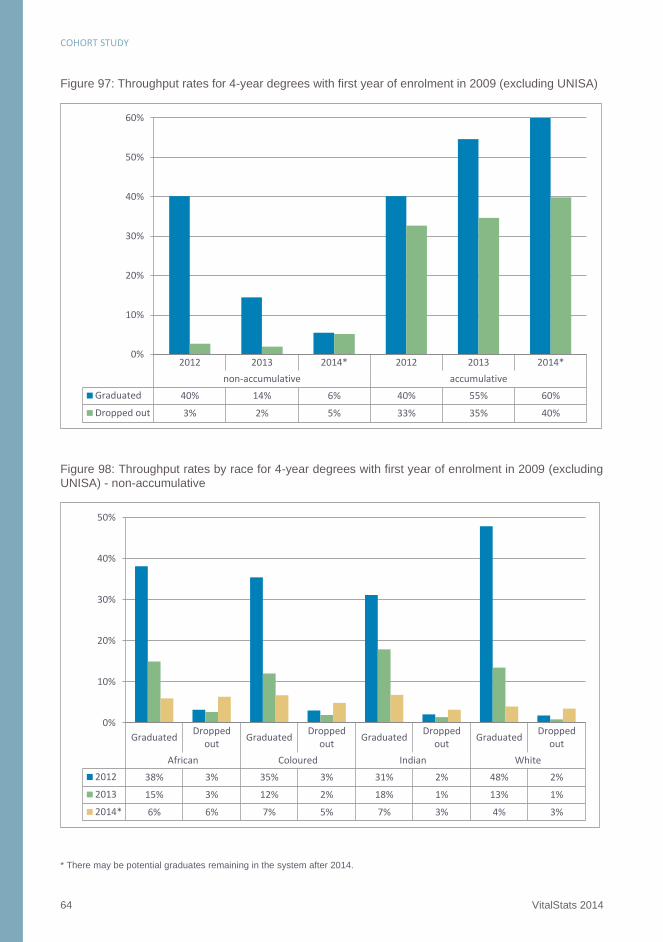
Figure 97: Throughput rates for 4-year degrees with first year of enrolment in 2009 (excluding UNISA)
Figure 98: Throughput rates by race for 4-year degrees with first year of enrolment in 2009 (excluding
UNISA) - non-accumulative
* There may be potential graduates remaining in the system after 2014.
2012 2013 2014* 2012 2013 2014*
non-accumulative accumulative
Graduated 40% 14% 6% 40% 55% 60%
Dropped out 3% 2% 5% 33% 35% 40%
0%
10%
20%
30%
40%
50%
60%
GraduatedDropped
outGraduated
Droppedout
GraduatedDropped
outGraduated
Droppedout
African Coloured Indian White
2012 38% 3% 35% 3% 31% 2% 48% 2%
2013 15% 3% 12% 2% 18% 1% 13% 1%
2014* 6% 6% 7% 5% 7% 3% 4% 3%
0%
10%
20%
30%
40%
50%
COHORT STUDY
VitalStats 2014 65
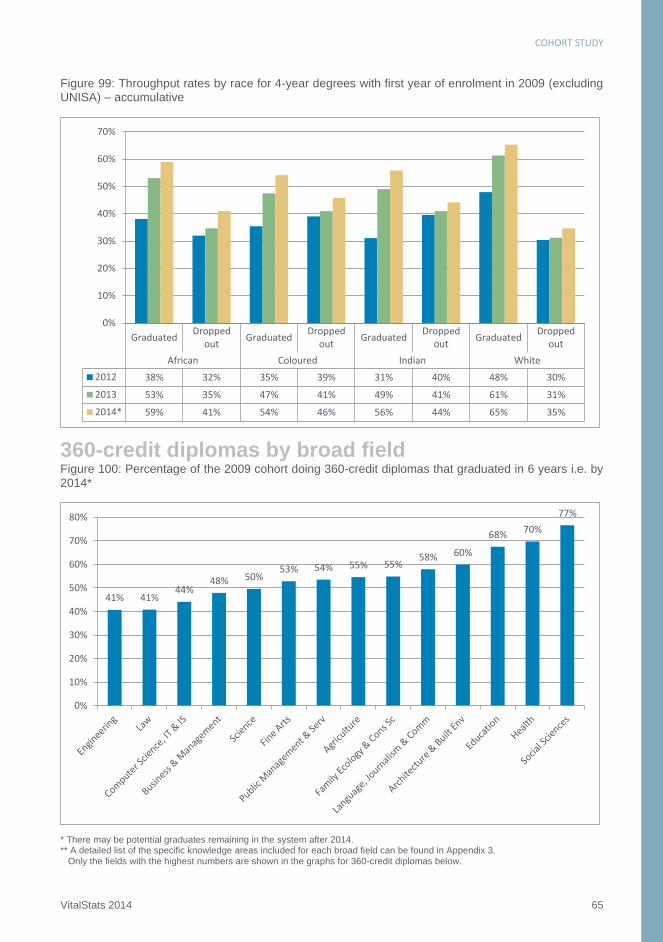
Figure 99: Throughput rates by race for 4-year degrees with first year of enrolment in 2009 (excluding
UNISA) – accumulative
360-credit diplomas by broad field
Figure 100: Percentage of the 2009 cohort doing 360-credit diplomas that graduated in 6 years i.e. by
2014*
* There may be potential graduates remaining in the system after 2014. ** A detailed list of the specific knowledge areas included for each broad field can be found in Appendix 3.
Only the fields with the highest numbers are shown in the graphs for 360-credit diplomas below.
GraduatedDropped
outGraduated
Droppedout
GraduatedDropped
outGraduated
Droppedout
African Coloured Indian White
2012 38% 32% 35% 39% 31% 40% 48% 30%
2013 53% 35% 47% 41% 49% 41% 61% 31%
2014* 59% 41% 54% 46% 56% 44% 65% 35%
0%
10%
20%
30%
40%
50%
60%
70%
41% 41%44%
48% 50%53% 54% 55% 55%
58% 60%
68% 70%
77%
0%
10%
20%
30%
40%
50%
60%
70%
80%
COHORT STUDY
66 VitalStats 2014
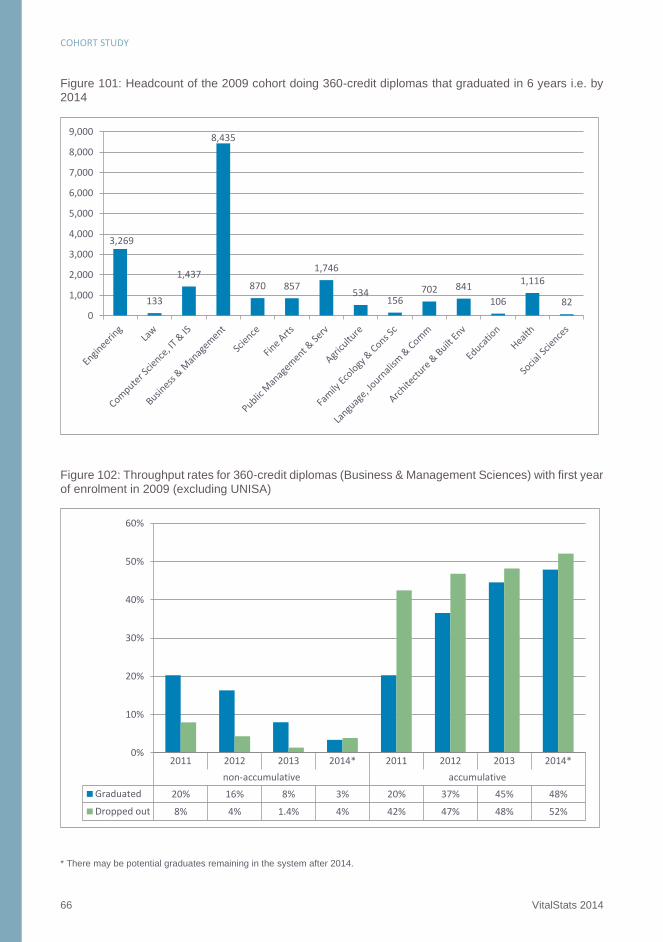
Figure 101: Headcount of the 2009 cohort doing 360-credit diplomas that graduated in 6 years i.e. by
2014
Figure 102: Throughput rates for 360-credit diplomas (Business & Management Sciences) with first year
of enrolment in 2009 (excluding UNISA)
* There may be potential graduates remaining in the system after 2014.
3,269
133
1,437
8,435
870 857
1,746
534156
702 841
106
1,116
82
0
1,000
2,000
3,000
4,000
5,000
6,000
7,000
8,000
9,000
2011 2012 2013 2014* 2011 2012 2013 2014*
non-accumulative accumulative
Graduated 20% 16% 8% 3% 20% 37% 45% 48%
Dropped out 8% 4% 1.4% 4% 42% 47% 48% 52%
0%
10%
20%
30%
40%
50%
60%

COHORT STUDY
VitalStats 2014 67
Figure 103: Throughput rates for 360-credit diplomas (Engineering) with first year of enrolment in 2009
(excluding UNISA)
Figure 104: Throughput rates for 360-credit diplomas (Public Management & Services) with first year of
enrolment in 2009 (excluding UNISA)
* There may be potential graduates remaining in the system after 2014.
2011 2012 2013 2014* 2011 2012 2013 2014*
non-accumulative accumulative
Graduated 5% 14% 12% 10% 5% 19% 31% 41%
Dropped out 10% 6% 1% 11% 41% 48% 48% 59%
0%
10%
20%
30%
40%
50%
60%
2011 2012 2013 2014* 2011 2012 2013 2014*
non-accumulative accumulative
Graduated 25% 16% 8% 3% 25% 42% 50% 54%
Dropped out 7% 3% 2% 5% 36% 40% 42% 46%
0%
10%
20%
30%
40%
50%
60%
COHORT STUDY
68 VitalStats 2014
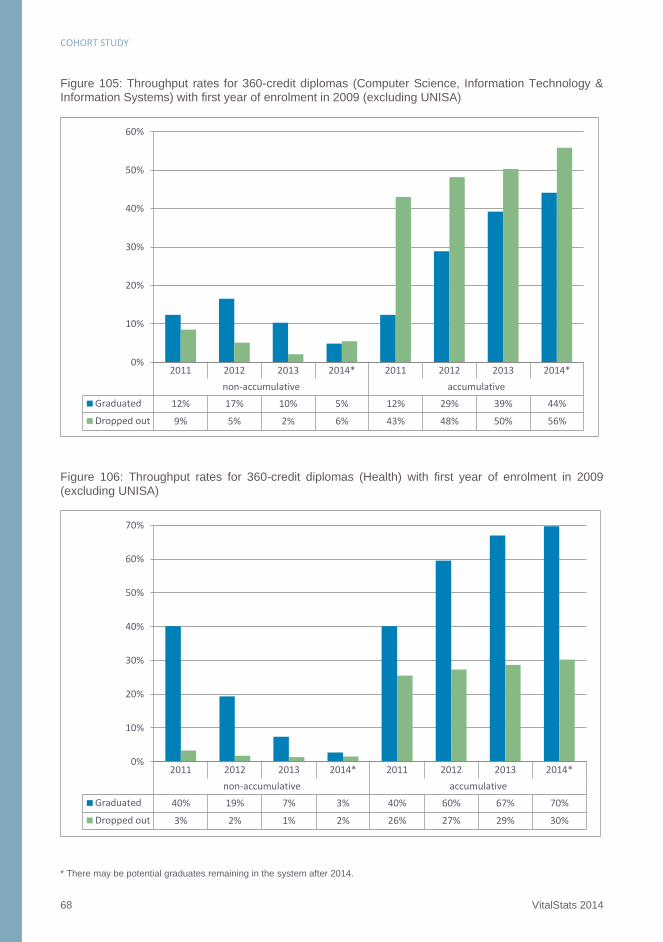
Figure 105: Throughput rates for 360-credit diplomas (Computer Science, Information Technology &
Information Systems) with first year of enrolment in 2009 (excluding UNISA)
Figure 106: Throughput rates for 360-credit diplomas (Health) with first year of enrolment in 2009
(excluding UNISA)
* There may be potential graduates remaining in the system after 2014.
2011 2012 2013 2014* 2011 2012 2013 2014*
non-accumulative accumulative
Graduated 12% 17% 10% 5% 12% 29% 39% 44%
Dropped out 9% 5% 2% 6% 43% 48% 50% 56%
0%
10%
20%
30%
40%
50%
60%
2011 2012 2013 2014* 2011 2012 2013 2014*
non-accumulative accumulative
Graduated 40% 19% 7% 3% 40% 60% 67% 70%
Dropped out 3% 2% 1% 2% 26% 27% 29% 30%
0%
10%
20%
30%
40%
50%
60%
70%
COHORT STUDY
VitalStats 2014 69
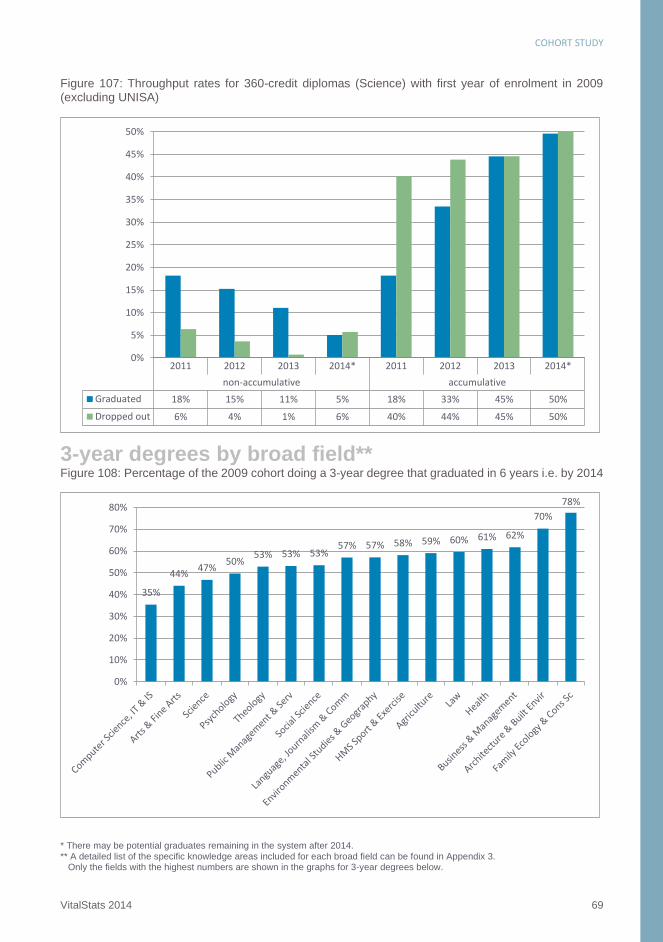
Figure 107: Throughput rates for 360-credit diplomas (Science) with first year of enrolment in 2009
(excluding UNISA)
3-year degrees by broad field**
Figure 108: Percentage of the 2009 cohort doing a 3-year degree that graduated in 6 years i.e. by 2014
* There may be potential graduates remaining in the system after 2014.
** A detailed list of the specific knowledge areas included for each broad field can be found in Appendix 3. Only the fields with the highest numbers are shown in the graphs for 3-year degrees below.
2011 2012 2013 2014* 2011 2012 2013 2014*
non-accumulative accumulative
Graduated 18% 15% 11% 5% 18% 33% 45% 50%
Dropped out 6% 4% 1% 6% 40% 44% 45% 50%
0%
5%
10%
15%
20%
25%
30%
35%
40%
45%
50%
35%
44%47%
50%53% 53% 53%
57% 57% 58% 59% 60% 61% 62%
70%
78%
0%
10%
20%
30%
40%
50%
60%
70%
80%
COHORT STUDY
70 VitalStats 2014
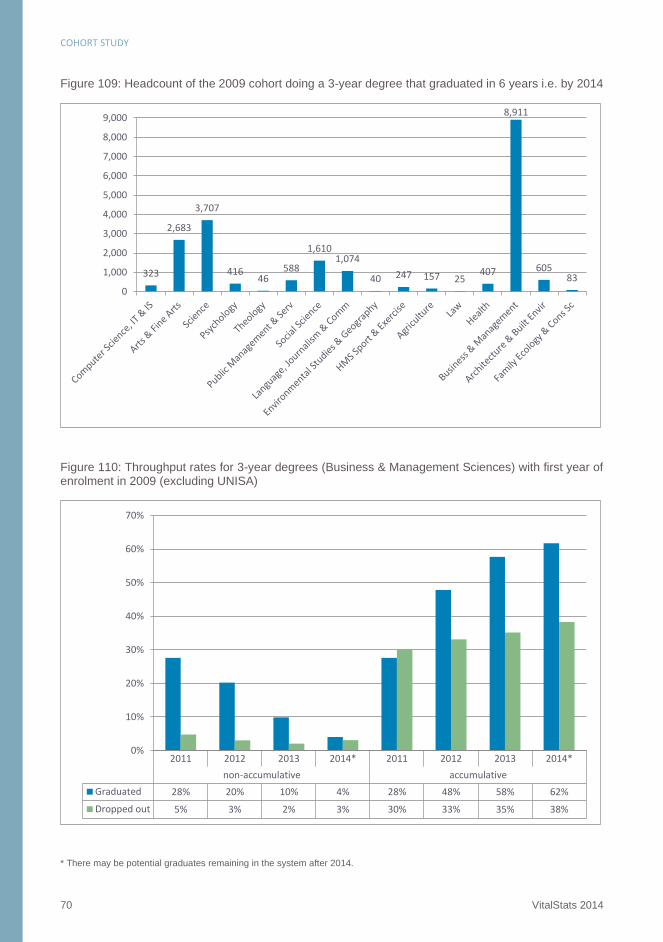
Figure 109: Headcount of the 2009 cohort doing a 3-year degree that graduated in 6 years i.e. by 2014
Figure 110: Throughput rates for 3-year degrees (Business & Management Sciences) with first year of
enrolment in 2009 (excluding UNISA)
* There may be potential graduates remaining in the system after 2014.
323
2,683
3,707
41646
588
1,6101,074
40 247 157 25407
8,911
60583
0
1,000
2,000
3,000
4,000
5,000
6,000
7,000
8,000
9,000
2011 2012 2013 2014* 2011 2012 2013 2014*
non-accumulative accumulative
Graduated 28% 20% 10% 4% 28% 48% 58% 62%
Dropped out 5% 3% 2% 3% 30% 33% 35% 38%
0%
10%
20%
30%
40%
50%
60%
70%

COHORT STUDY
VitalStats 2014 71
Figure 111: Throughput rates for 3-year degrees (Science) with first year of enrolment in 2009 (excluding
UNISA)
Figure 112: Throughput rates for 3-year degrees (Arts and Fine Arts) with first year of enrolment in 2009
(excluding UNISA)
* There may be potential graduates remaining in the system after 2014.
2011 2012 2013 2014* 2011 2012 2013 2014*
non-accumulative accumulative
Graduated 21% 16% 8% 3% 21% 37% 44% 47%
Dropped out 4% 3% 1% 2% 48% 50% 51% 53%
0%
10%
20%
30%
40%
50%
60%
2011 2012 2013 2014* 2011 2012 2013 2014*
non-accumulative accumulative
Graduated 24% 14% 5% 1% 24% 38% 43% 44%
Dropped out 5% 2% 1% 2% 51% 53% 54% 56%
0%
10%
20%
30%
40%
50%
60%
COHORT STUDY
72 VitalStats 2014
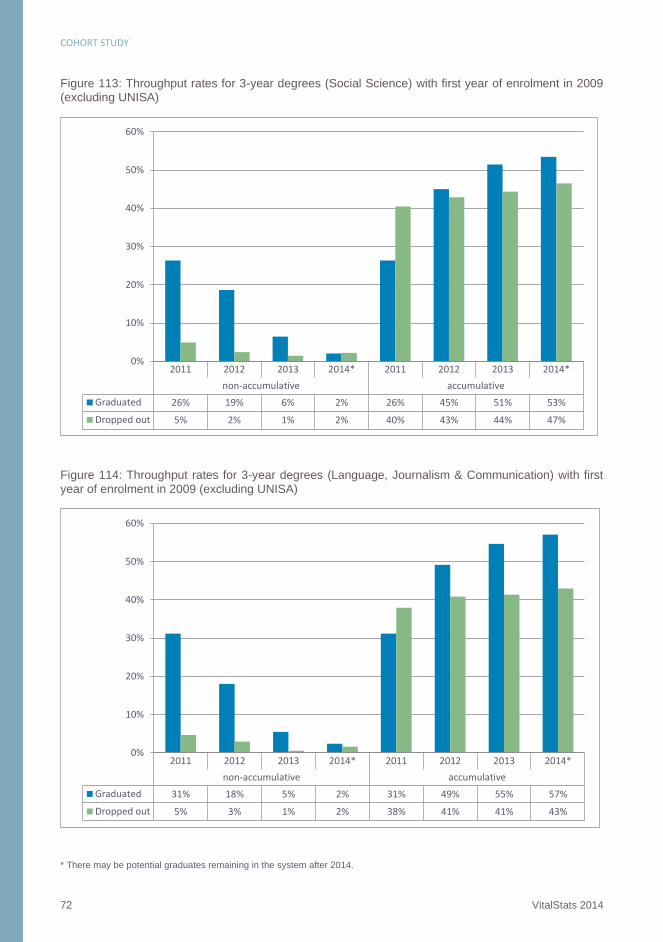
Figure 113: Throughput rates for 3-year degrees (Social Science) with first year of enrolment in 2009
(excluding UNISA)
Figure 114: Throughput rates for 3-year degrees (Language, Journalism & Communication) with first
year of enrolment in 2009 (excluding UNISA)
* There may be potential graduates remaining in the system after 2014.
2011 2012 2013 2014* 2011 2012 2013 2014*
non-accumulative accumulative
Graduated 26% 19% 6% 2% 26% 45% 51% 53%
Dropped out 5% 2% 1% 2% 40% 43% 44% 47%
0%
10%
20%
30%
40%
50%
60%
2011 2012 2013 2014* 2011 2012 2013 2014*
non-accumulative accumulative
Graduated 31% 18% 5% 2% 31% 49% 55% 57%
Dropped out 5% 3% 1% 2% 38% 41% 41% 43%
0%
10%
20%
30%
40%
50%
60%
COHORT STUDY
VitalStats 2014 73
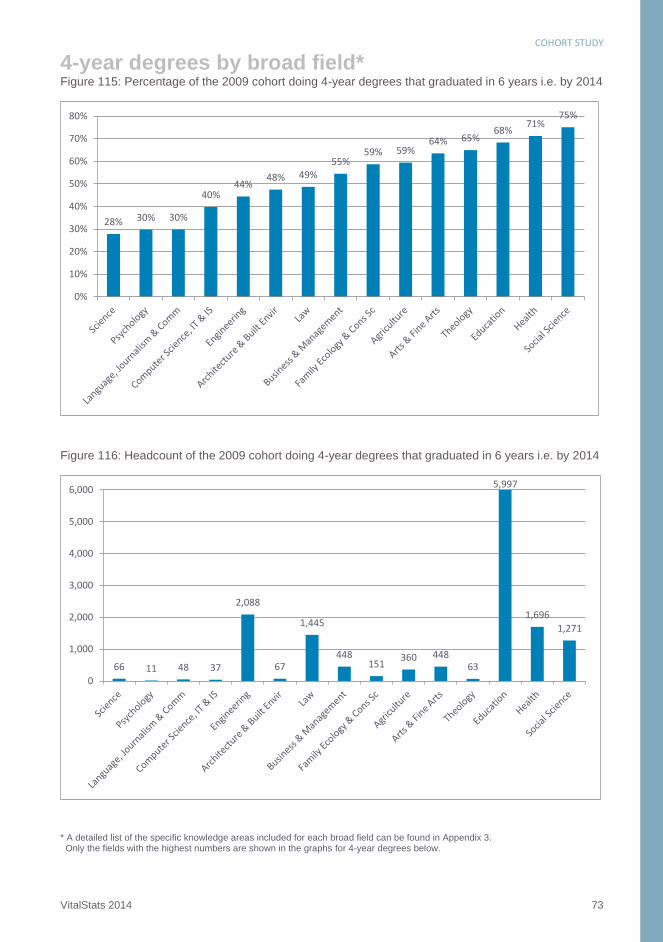
4-year degrees by broad field*
Figure 115: Percentage of the 2009 cohort doing 4-year degrees that graduated in 6 years i.e. by 2014
Figure 116: Headcount of the 2009 cohort doing 4-year degrees that graduated in 6 years i.e. by 2014
* A detailed list of the specific knowledge areas included for each broad field can be found in Appendix 3. Only the fields with the highest numbers are shown in the graphs for 4-year degrees below.
28% 30% 30%
40%44%
48% 49%55%
59% 59%64% 65%
68%71%
75%
0%
10%
20%
30%
40%
50%
60%
70%
80%
66 11 48 37
2,088
67
1,445
448151
360 44863
5,997
1,696
1,271
0
1,000
2,000
3,000
4,000
5,000
6,000
COHORT STUDY
74 VitalStats 2014
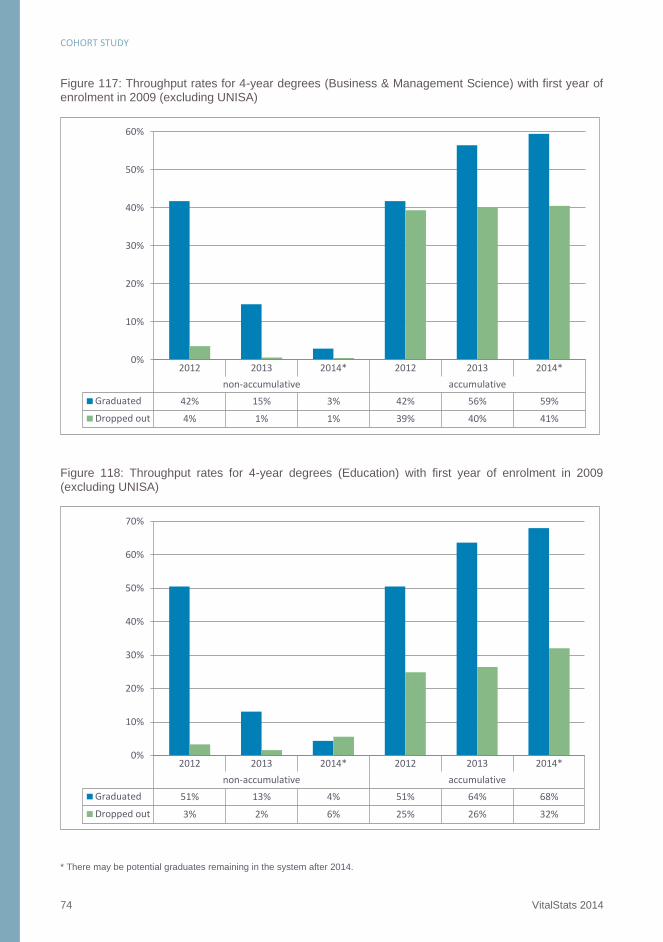
Figure 117: Throughput rates for 4-year degrees (Business & Management Science) with first year of
enrolment in 2009 (excluding UNISA)
Figure 118: Throughput rates for 4-year degrees (Education) with first year of enrolment in 2009
(excluding UNISA)
* There may be potential graduates remaining in the system after 2014.
2012 2013 2014* 2012 2013 2014*
non-accumulative accumulative
Graduated 42% 15% 3% 42% 56% 59%
Dropped out 4% 1% 1% 39% 40% 41%
0%
10%
20%
30%
40%
50%
60%
2012 2013 2014* 2012 2013 2014*
non-accumulative accumulative
Graduated 51% 13% 4% 51% 64% 68%
Dropped out 3% 2% 6% 25% 26% 32%
0%
10%
20%
30%
40%
50%
60%
70%

COHORT STUDY
VitalStats 2014 75
Figure 119: Throughput rates for 4-year degrees (Engineering) with first year of enrolment in 2009
(excluding UNISA)
Figure 120: Throughput rates for 4-year degrees (Health) with first year of enrolment in 2009 (excluding
UNISA)
* There may be potential graduates remaining in the system after 2014.
The negative percentages (e.g. -0.1) show those students that returned after stopping out.
2012 2013 2014* 2012 2013 2014*
non-accumulative accumulative
Graduated 23% 17% 11% 23% 41% 52%
Dropped out 2% 2% 10% 37% 39% 48%
0%
10%
20%
30%
40%
50%
60%
2012 2013 2014* 2012 2013 2014*
non-accumulative accumulative
Graduated 53% 16% 6% 53% 69% 75%
Dropped out 2% -0.1% 4% 21% 21% 25%
-10%
0%
10%
20%
30%
40%
50%
60%
70%
80%
COHORT STUDY
76 VitalStats 2014
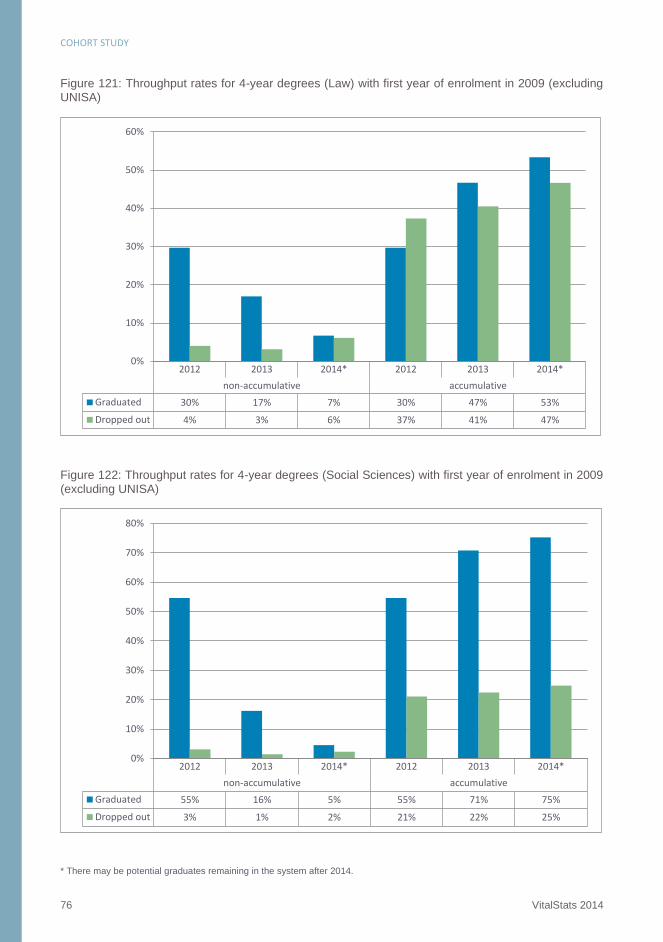
Figure 121: Throughput rates for 4-year degrees (Law) with first year of enrolment in 2009 (excluding
UNISA)
Figure 122: Throughput rates for 4-year degrees (Social Sciences) with first year of enrolment in 2009
(excluding UNISA)
* There may be potential graduates remaining in the system after 2014.
2012 2013 2014* 2012 2013 2014*
non-accumulative accumulative
Graduated 30% 17% 7% 30% 47% 53%
Dropped out 4% 3% 6% 37% 41% 47%
0%
10%
20%
30%
40%
50%
60%
2012 2013 2014* 2012 2013 2014*
non-accumulative accumulative
Graduated 55% 16% 5% 55% 71% 75%
Dropped out 3% 1% 2% 21% 22% 25%
0%
10%
20%
30%
40%
50%
60%
70%
80%

COHORT STUDY
VitalStats 2014 77
Figure 123: Throughput within regulation time up to n+2 years for 360-credit diplomas, 3-year degrees,
4-year degrees and weighted national rate with first enrolment in 2009 (excluding UNISA)
Figure 124: Non-accumulative throughput comparisons of 2007, 2008 and 2009 cohorts finishing within
regulation time up to n+2 years for 360-credit diplomas, 3-year degrees, 4-year degrees and weighted
national rate (excluding UNISA)
RegulationTime
n+1 n+2Regulation
Timen+1 n+2
non-accumulative accumulative
Diploma grads 19% 16% 9% 19% 35% 44%
3-yr deg grads 26% 17% 8% 26% 44% 51%
4-yr deg grads 40% 14% 6% 40% 55% 60%
Overall 27% 16% 8% 27% 43% 50%
0%
10%
20%
30%
40%
50%
60%
Regulation Time
n+1 n+2Regulatio
n Timen+1 n+2
Regulation Time
n+1 n+2
2007 Cohorts 2008 Cohorts 2009 Cohorts
Diploma grads 20% 15% 9% 19% 16% 9% 19% 16% 9%
3-yr deg grads 29% 19% 9% 30% 18% 8% 26% 17% 8%
4-yr deg grads 38% 15% 6% 42% 15% 6% 40% 14% 6%
Overall 27% 15% 8% 29% 16% 8% 27% 16% 8%
0%
5%
10%
15%
20%
25%
30%
35%
40%
45%
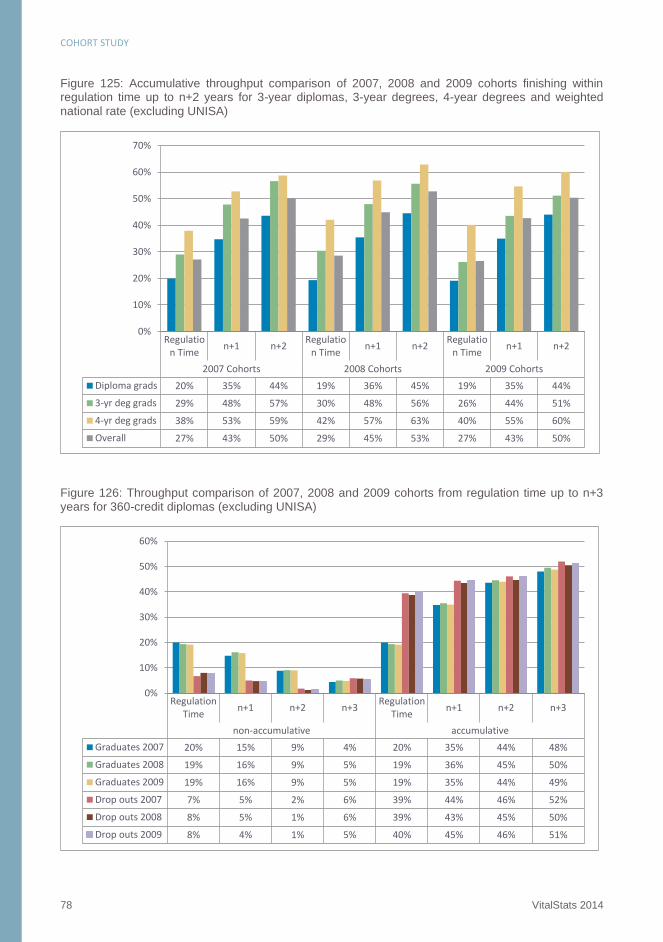
COHORT STUDY
78 VitalStats 2014
Figure 125: Accumulative throughput comparison of 2007, 2008 and 2009 cohorts finishing within regulation time up to n+2 years for 3-year diplomas, 3-year degrees, 4-year degrees and weighted
national rate (excluding UNISA)
Figure 126: Throughput comparison of 2007, 2008 and 2009 cohorts from regulation time up to n+3
years for 360-credit diplomas (excluding UNISA)
Regulation Time
n+1 n+2Regulatio
n Timen+1 n+2
Regulation Time
n+1 n+2
2007 Cohorts 2008 Cohorts 2009 Cohorts
Diploma grads 20% 35% 44% 19% 36% 45% 19% 35% 44%
3-yr deg grads 29% 48% 57% 30% 48% 56% 26% 44% 51%
4-yr deg grads 38% 53% 59% 42% 57% 63% 40% 55% 60%
Overall 27% 43% 50% 29% 45% 53% 27% 43% 50%
0%
10%
20%
30%
40%
50%
60%
70%
RegulationTime
n+1 n+2 n+3Regulation
Timen+1 n+2 n+3
non-accumulative accumulative
Graduates 2007 20% 15% 9% 4% 20% 35% 44% 48%
Graduates 2008 19% 16% 9% 5% 19% 36% 45% 50%
Graduates 2009 19% 16% 9% 5% 19% 35% 44% 49%
Drop outs 2007 7% 5% 2% 6% 39% 44% 46% 52%
Drop outs 2008 8% 5% 1% 6% 39% 43% 45% 50%
Drop outs 2009 8% 4% 1% 5% 40% 45% 46% 51%
0%
10%
20%
30%
40%
50%
60%
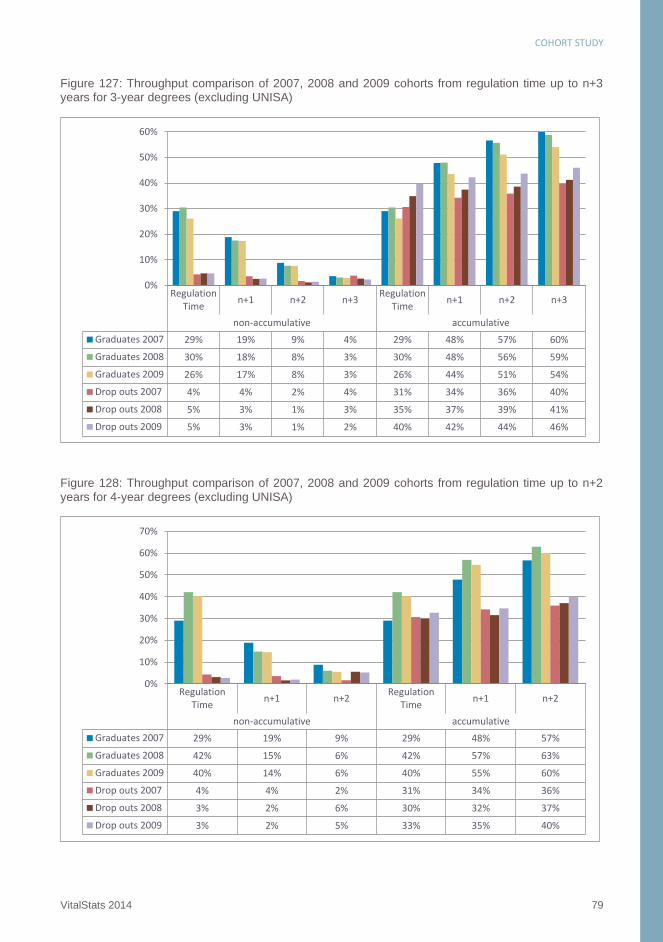
COHORT STUDY
VitalStats 2014 79
Figure 127: Throughput comparison of 2007, 2008 and 2009 cohorts from regulation time up to n+3
years for 3-year degrees (excluding UNISA)
Figure 128: Throughput comparison of 2007, 2008 and 2009 cohorts from regulation time up to n+2
years for 4-year degrees (excluding UNISA)
RegulationTime
n+1 n+2 n+3Regulation
Timen+1 n+2 n+3
non-accumulative accumulative
Graduates 2007 29% 19% 9% 4% 29% 48% 57% 60%
Graduates 2008 30% 18% 8% 3% 30% 48% 56% 59%
Graduates 2009 26% 17% 8% 3% 26% 44% 51% 54%
Drop outs 2007 4% 4% 2% 4% 31% 34% 36% 40%
Drop outs 2008 5% 3% 1% 3% 35% 37% 39% 41%
Drop outs 2009 5% 3% 1% 2% 40% 42% 44% 46%
0%
10%
20%
30%
40%
50%
60%
RegulationTime
n+1 n+2Regulation
Timen+1 n+2
non-accumulative accumulative
Graduates 2007 29% 19% 9% 29% 48% 57%
Graduates 2008 42% 15% 6% 42% 57% 63%
Graduates 2009 40% 14% 6% 40% 55% 60%
Drop outs 2007 4% 4% 2% 31% 34% 36%
Drop outs 2008 3% 2% 6% 30% 32% 37%
Drop outs 2009 3% 2% 5% 33% 35% 40%
0%
10%
20%
30%
40%
50%
60%
70%

COHORT STUDY
80 VitalStats 2014
UNISA**
Figure 129: Throughput rates at UNISA for 360-credit diplomas with first year of enrolment in 2007
Figure 130: Throughput rates at UNISA for 3-year degrees with first year of enrolment in 2007
* There may be potential graduates remaining in the system after 2014.
The negative percentages (e.g. -0.4) show those students that returned after stopping out. ** The different mode of study (distance and often part-time) at the University of South Africa (UNISA), impacts on the time it takes
a student to graduate. These completion rates cannot be compared to those for the sector as a whole.
2009 2010 2011 2012 2013 2014* 2012 2013 2014*
non-accumulative accumulative
Graduated 1% 1% 2% 2% 2% 2% 6% 8% 9%
Dropped out 5% 3% 4% 0% 1.6% 7% 83% 84% 91%
0%
10%
20%
30%
40%
50%
60%
70%
80%
90%
100%
2009 2010 2011 2012 2013 2014* 2012 2013 2014*
non-accumulative accumulative
Graduated 2% 3% 3% 2% 3% 2% 11% 14% 16%
Dropped out 5% 4% 4% -0.4% 2.5% 12% 70% 72% 84%
-10%
0%
10%
20%
30%
40%
50%
60%
70%
80%
90%
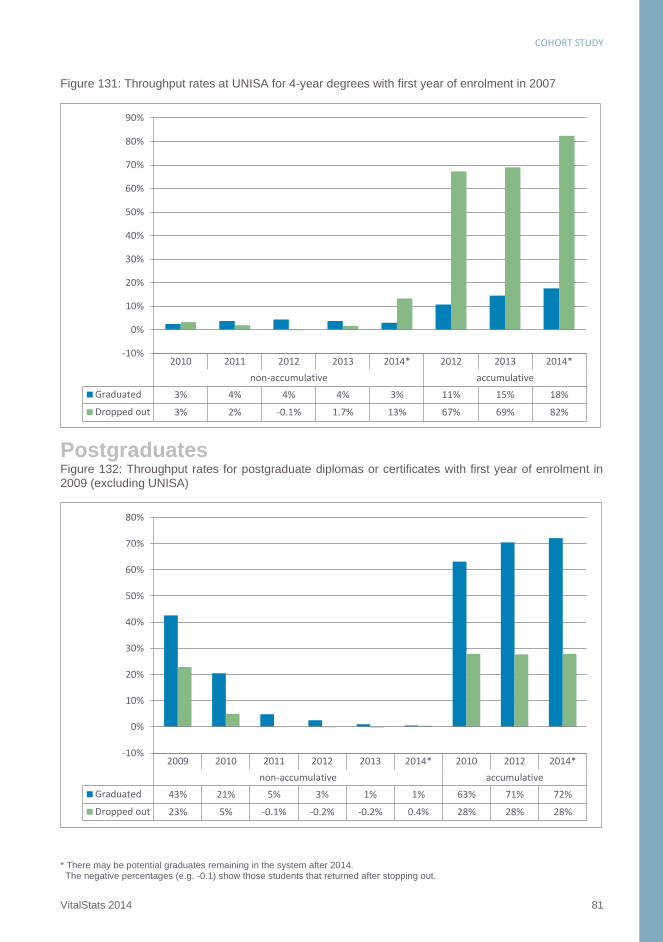
COHORT STUDY
VitalStats 2014 81
Figure 131: Throughput rates at UNISA for 4-year degrees with first year of enrolment in 2007
Postgraduates Figure 132: Throughput rates for postgraduate diplomas or certificates with first year of enrolment in
2009 (excluding UNISA)
* There may be potential graduates remaining in the system after 2014. The negative percentages (e.g. -0.1) show those students that returned after stopping out.
2010 2011 2012 2013 2014* 2012 2013 2014*
non-accumulative accumulative
Graduated 3% 4% 4% 4% 3% 11% 15% 18%
Dropped out 3% 2% -0.1% 1.7% 13% 67% 69% 82%
-10%
0%
10%
20%
30%
40%
50%
60%
70%
80%
90%
2009 2010 2011 2012 2013 2014* 2010 2012 2014*
non-accumulative accumulative
Graduated 43% 21% 5% 3% 1% 1% 63% 71% 72%
Dropped out 23% 5% -0.1% -0.2% -0.2% 0.4% 28% 28% 28%
-10%
0%
10%
20%
30%
40%
50%
60%
70%
80%

COHORT STUDY
82 VitalStats 2014
Figure 133: Percentage of the 2009 cohort doing postgraduate diplomas or certificates that graduated
in 3 years i.e. by 2011 (excluding UNISA)
Figure 134: Headcount of the 2009 cohort doing postgraduate diplomas or certificates that graduated in
3 years i.e. by 2011 (excluding UNISA)
0%
33%
41%
55% 56%63% 65% 67%
71%76% 77% 79%
83%89% 90%
98% 99%
0%
10%
20%
30%
40%
50%
60%
70%
80%
90%
100%
0 2 12
1,600
101 69 872
65
1,628
1,303
11 5107
37 43 87
0
200
400
600
800
1,000
1,200
1,400
1,600
1,800
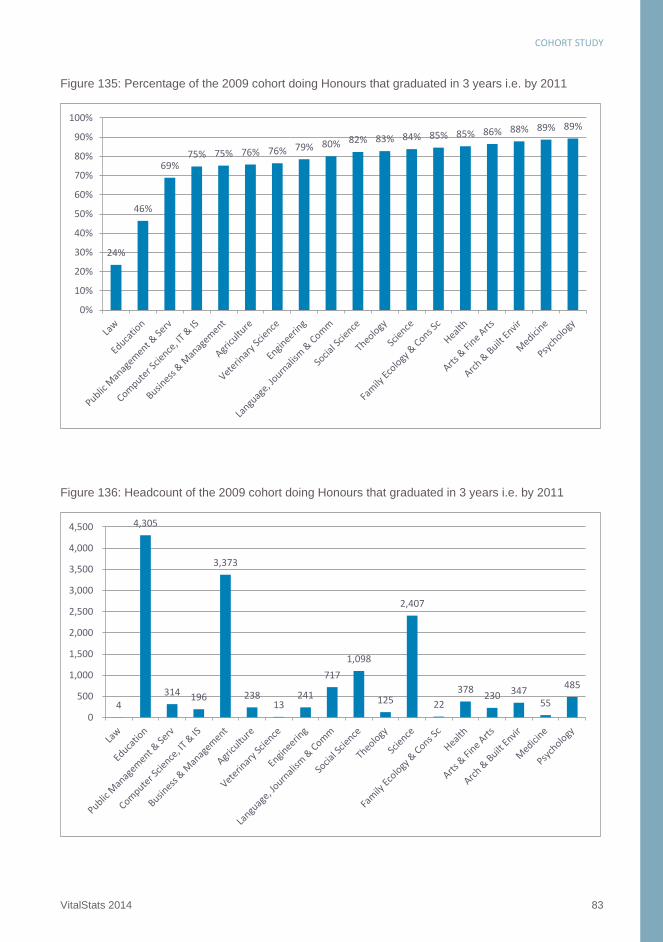
COHORT STUDY
VitalStats 2014 83
Figure 135: Percentage of the 2009 cohort doing Honours that graduated in 3 years i.e. by 2011
Figure 136: Headcount of the 2009 cohort doing Honours that graduated in 3 years i.e. by 2011
24%
46%
69%75% 75% 76% 76% 79% 80% 82% 83% 84% 85% 85% 86% 88% 89% 89%
0%
10%
20%
30%
40%
50%
60%
70%
80%
90%
100%
4
4,305
314 196
3,373
238 13
241
717
1,098
125
2,407
22
378 230 347
55
485
0
500
1,000
1,500
2,000
2,500
3,000
3,500
4,000
4,500
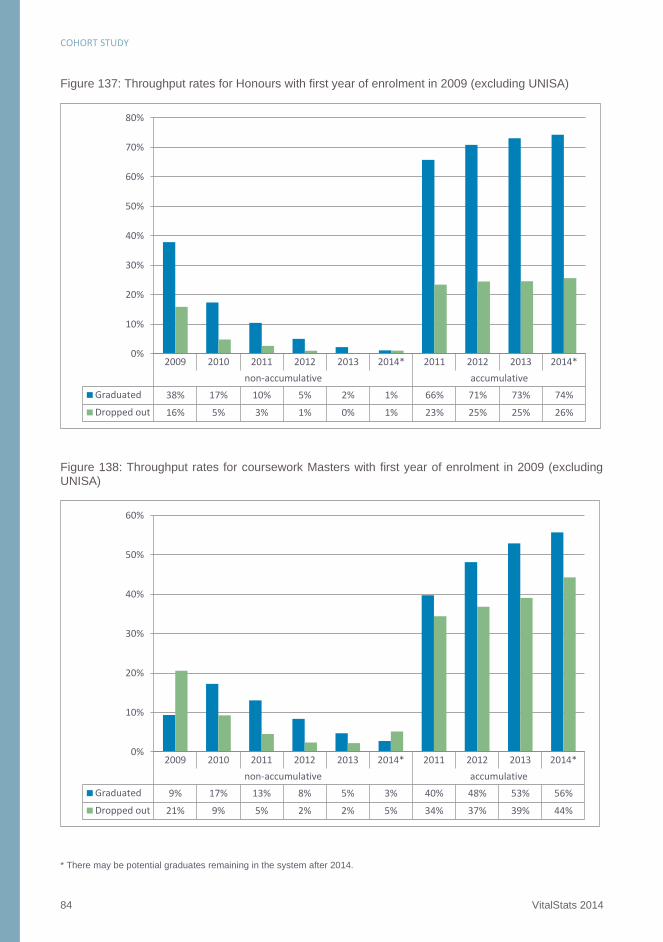
COHORT STUDY
84 VitalStats 2014
Figure 137: Throughput rates for Honours with first year of enrolment in 2009 (excluding UNISA)
Figure 138: Throughput rates for coursework Masters with first year of enrolment in 2009 (excluding
UNISA)
* There may be potential graduates remaining in the system after 2014.
2009 2010 2011 2012 2013 2014* 2011 2012 2013 2014*
non-accumulative accumulative
Graduated 38% 17% 10% 5% 2% 1% 66% 71% 73% 74%
Dropped out 16% 5% 3% 1% 0% 1% 23% 25% 25% 26%
0%
10%
20%
30%
40%
50%
60%
70%
80%
2009 2010 2011 2012 2013 2014* 2011 2012 2013 2014*
non-accumulative accumulative
Graduated 9% 17% 13% 8% 5% 3% 40% 48% 53% 56%
Dropped out 21% 9% 5% 2% 2% 5% 34% 37% 39% 44%
0%
10%
20%
30%
40%
50%
60%

COHORT STUDY
VitalStats 2014 85
Figure 139: Percentage of the 2009 cohort doing coursework Masters that graduated in 4 years i.e. by
2012
Figure 140: Headcount of the 2009 cohort doing coursework Masters that graduated in 4 years i.e. by
2012
15%
29%33% 33%
41% 41% 42%44% 46% 47%
49%53% 55% 55% 57%
59% 61% 62%
76%
0%
10%
20%
30%
40%
50%
60%
70%
80%
149
6
184 71
378
144
15 15
314 393
105
255
500
1,513
475 416
167 100
255
-
200
400
600
800
1,000
1,200
1,400
1,600

COHORT STUDY
86 VitalStats 2014
Figure 141: Percentage of the 2009 cohort doing research Masters that graduated in 4 years i.e. by
2012
Figure 142: Headcount of the 2009 cohort doing research Masters that graduated in 4 years i.e. by 2012
41% 43%49%
40%
30%
39%
47% 45%49%
43%40%
100%
67%
25%
57%
43%
55% 56%
0%
10%
20%
30%
40%
50%
60%
70%
80%
90%
100%
86
22 54
152
39
149
241
5
251
129
43
2
60 46
513
160
32 9
0
100
200
300
400
500
600
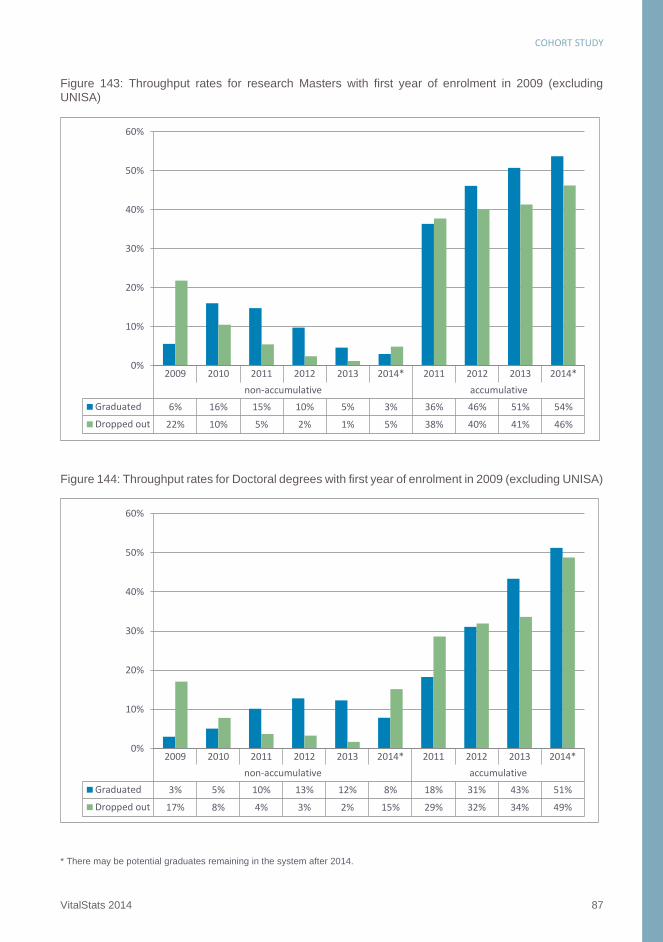
COHORT STUDY
VitalStats 2014 87
Figure 143: Throughput rates for research Masters with first year of enrolment in 2009 (excluding
UNISA)
Figure 144: Throughput rates for Doctoral degrees with first year of enrolment in 2009 (excluding UNISA)
* There may be potential graduates remaining in the system after 2014.
2009 2010 2011 2012 2013 2014* 2011 2012 2013 2014*
non-accumulative accumulative
Graduated 6% 16% 15% 10% 5% 3% 36% 46% 51% 54%
Dropped out 22% 10% 5% 2% 1% 5% 38% 40% 41% 46%
0%
10%
20%
30%
40%
50%
60%
2009 2010 2011 2012 2013 2014* 2011 2012 2013 2014*
non-accumulative accumulative
Graduated 3% 5% 10% 13% 12% 8% 18% 31% 43% 51%
Dropped out 17% 8% 4% 3% 2% 15% 29% 32% 34% 49%
0%
10%
20%
30%
40%
50%
60%

COHORT STUDY
88 VitalStats 2014
Figure 145: Percentage of the 2009 cohort doing Doctoral degrees that graduated in 6 years i.e. by 2014
Figure 146: Headcount of the 2009 cohort doing Doctoral degrees that graduated in 6 years i.e. by 2014
35%38% 38%
41% 43%47% 47% 47% 48% 48%
50% 51% 52% 53%57% 57%
63% 64% 65%
0%
10%
20%
30%
40%
50%
60%
70%
30
6
122
32
93
27
67
35 25
52
11
224
115
46
149
4
82
313
35
0
50
100
150
200
250
300
350


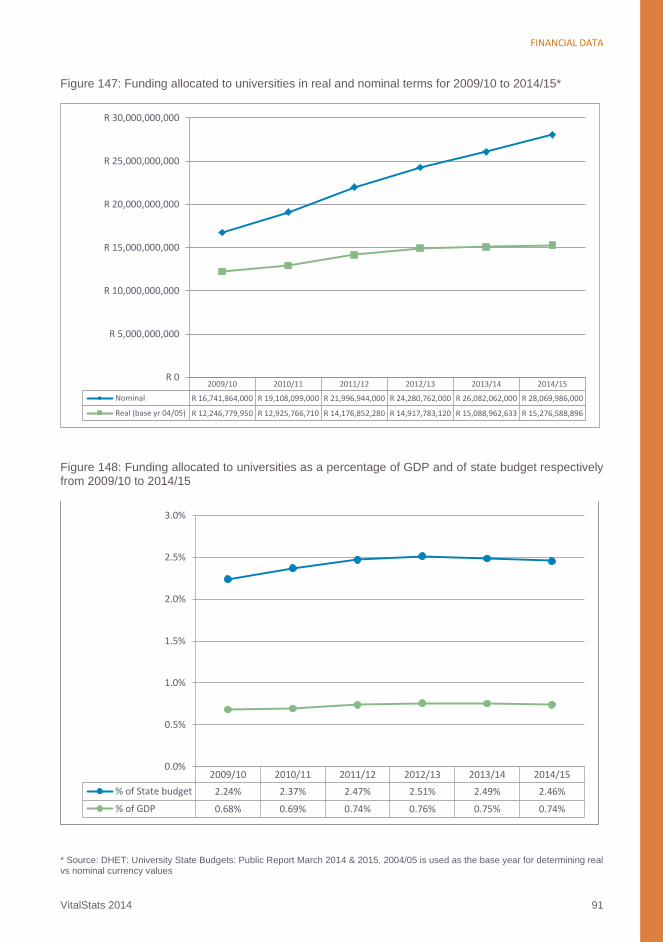
FINANCIAL DATA
VitalStats 2014 91
Figure 147: Funding allocated to universities in real and nominal terms for 2009/10 to 2014/15*
Figure 148: Funding allocated to universities as a percentage of GDP and of state budget respectively
from 2009/10 to 2014/15
* Source: DHET: University State Budgets: Public Report March 2014 & 2015. 2004/05 is used as the base year for determining real vs nominal currency values
2009/10 2010/11 2011/12 2012/13 2013/14 2014/15
Nominal R 16,741,864,000 R 19,108,099,000 R 21,996,944,000 R 24,280,762,000 R 26,082,062,000 R 28,069,986,000
Real (base yr 04/05) R 12,246,779,950 R 12,925,766,710 R 14,176,852,280 R 14,917,783,120 R 15,088,962,633 R 15,276,588,896
R 0
R 5,000,000,000
R 10,000,000,000
R 15,000,000,000
R 20,000,000,000
R 25,000,000,000
R 30,000,000,000
2009/10 2010/11 2011/12 2012/13 2013/14 2014/15
% of State budget 2.24% 2.37% 2.47% 2.51% 2.49% 2.46%
% of GDP 0.68% 0.69% 0.74% 0.76% 0.75% 0.74%
0.0%
0.5%
1.0%
1.5%
2.0%
2.5%
3.0%
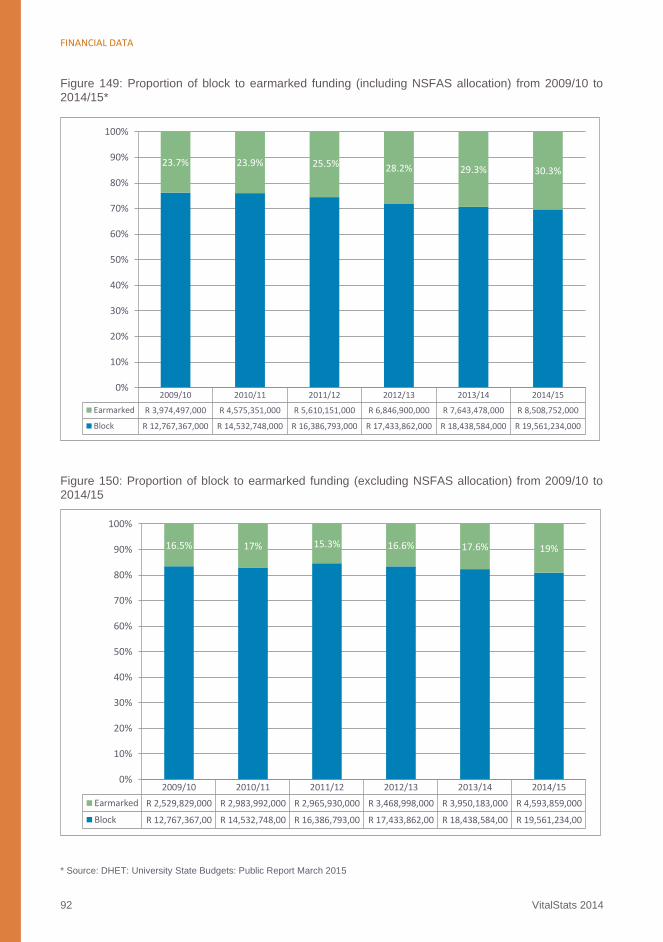
FINANCIAL DATA
92 VitalStats 2014
Figure 149: Proportion of block to earmarked funding (including NSFAS allocation) from 2009/10 to
2014/15*
Figure 150: Proportion of block to earmarked funding (excluding NSFAS allocation) from 2009/10 to
2014/15
* Source: DHET: University State Budgets: Public Report March 2015
2009/10 2010/11 2011/12 2012/13 2013/14 2014/15
Earmarked R 3,974,497,000 R 4,575,351,000 R 5,610,151,000 R 6,846,900,000 R 7,643,478,000 R 8,508,752,000
Block R 12,767,367,000 R 14,532,748,000 R 16,386,793,000 R 17,433,862,000 R 18,438,584,000 R 19,561,234,000
23.7% 23.9% 25.5% 28.2% 29.3% 30.3%
0%
10%
20%
30%
40%
50%
60%
70%
80%
90%
100%
2009/10 2010/11 2011/12 2012/13 2013/14 2014/15
Earmarked R 2,529,829,000 R 2,983,992,000 R 2,965,930,000 R 3,468,998,000 R 3,950,183,000 R 4,593,859,000
Block R 12,767,367,00 R 14,532,748,00 R 16,386,793,00 R 17,433,862,00 R 18,438,584,00 R 19,561,234,00
16.5% 17% 15.3% 16.6% 17.6% 19%
0%
10%
20%
30%
40%
50%
60%
70%
80%
90%
100%
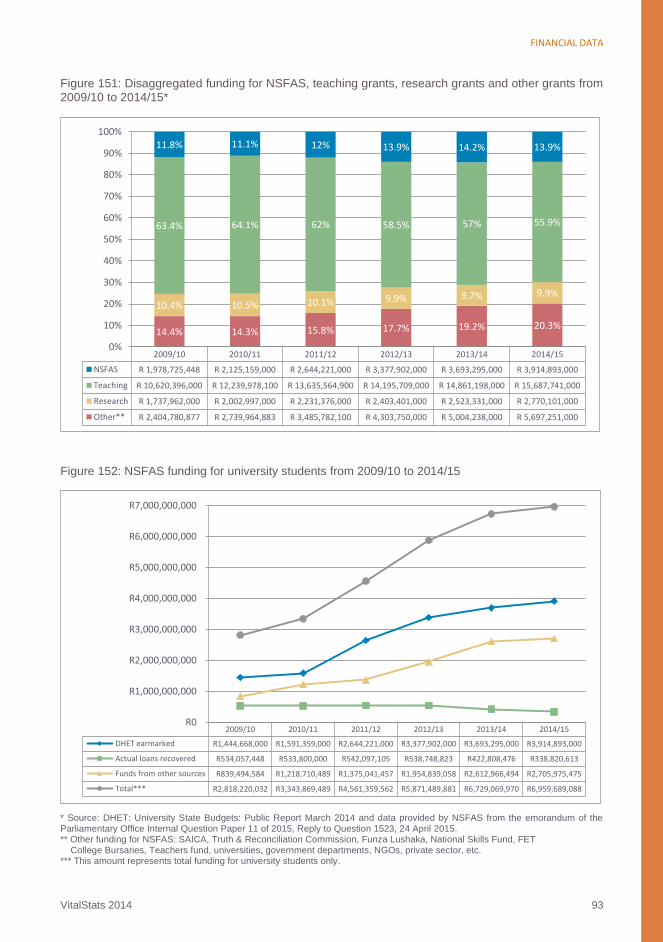
FINANCIAL DATA
VitalStats 2014 93
Figure 151: Disaggregated funding for NSFAS, teaching grants, research grants and other grants from
2009/10 to 2014/15*
Figure 152: NSFAS funding for university students from 2009/10 to 2014/15
* Source: DHET: University State Budgets: Public Report March 2014 and data provided by NSFAS from the emorandum of the
Parliamentary Office Internal Question Paper 11 of 2015, Reply to Question 1523, 24 April 2015. ** Other funding for NSFAS: SAICA, Truth & Reconciliation Commission, Funza Lushaka, National Skills Fund, FET
College Bursaries, Teachers fund, universities, government departments, NGOs, private sector, etc. *** This amount represents total funding for university students only.
2009/10 2010/11 2011/12 2012/13 2013/14 2014/15
NSFAS R 1,978,725,448 R 2,125,159,000 R 2,644,221,000 R 3,377,902,000 R 3,693,295,000 R 3,914,893,000
Teaching R 10,620,396,000 R 12,239,978,100 R 13,635,564,900 R 14,195,709,000 R 14,861,198,000 R 15,687,741,000
Research R 1,737,962,000 R 2,002,997,000 R 2,231,376,000 R 2,403,401,000 R 2,523,331,000 R 2,770,101,000
Other** R 2,404,780,877 R 2,739,964,883 R 3,485,782,100 R 4,303,750,000 R 5,004,238,000 R 5,697,251,000
14.4% 14.3% 15.8% 17.7% 19.2% 20.3%
10.4% 10.5% 10.1% 9.9% 9.7% 9.9%
63.4% 64.1% 62% 58.5% 57% 55.9%
11.8% 11.1% 12% 13.9% 14.2% 13.9%
0%
10%
20%
30%
40%
50%
60%
70%
80%
90%
100%
2009/10 2010/11 2011/12 2012/13 2013/14 2014/15
DHET earmarked R1,444,668,000 R1,591,359,000 R2,644,221,000 R3,377,902,000 R3,693,295,000 R3,914,893,000
Actual loans recovered R534,057,448 R533,800,000 R542,097,105 R538,748,823 R422,808,476 R338,820,613
Funds from other sources R839,494,584 R1,218,710,489 R1,375,041,457 R1,954,839,058 R2,612,966,494 R2,705,975,475
Total*** R2,818,220,032 R3,343,869,489 R4,561,359,562 R5,871,489,881 R6,729,069,970 R6,959,689,088
R0
R1,000,000,000
R2,000,000,000
R3,000,000,000
R4,000,000,000
R5,000,000,000
R6,000,000,000
R7,000,000,000

FINANCIAL DATA
94 VitalStats 2014
Figure 153: Average full cost of study showing the percentage cost of tuition from 2009 to 2014*
Figure 154: Proportional disaggregation of institutional funding per source from 2009/10 to 2014/15
* Source: NSFAS full cost of study report, DHET (2014) Audited financial statements of the universities for the period 2009/10 to 2014/15. Pretoria: DHET
2009 2010 2011 2012 2013 2014
Full cost R 43,358 R 47,101 R 50,619 R 55,843 R 60,710 R 65,320
Tuition only R 17,567 R 18,275 R 19,660 R 21,689 R 22,861 R 25,745
41% 39% 39%39% 38%
39%
R 0
R 10,000
R 20,000
R 30,000
R 40,000
R 50,000
R 60,000
R 70,000
2009/10 2010/11 2011/12 2012/13 2013/14 2014/15
State 39% 41% 42% 40% 40% 38%
Tuition fees 29% 30% 31% 31% 33% 33%
Third stream 31% 30% 27% 29% 27% 28%
20%
25%
30%
35%
40%
45%
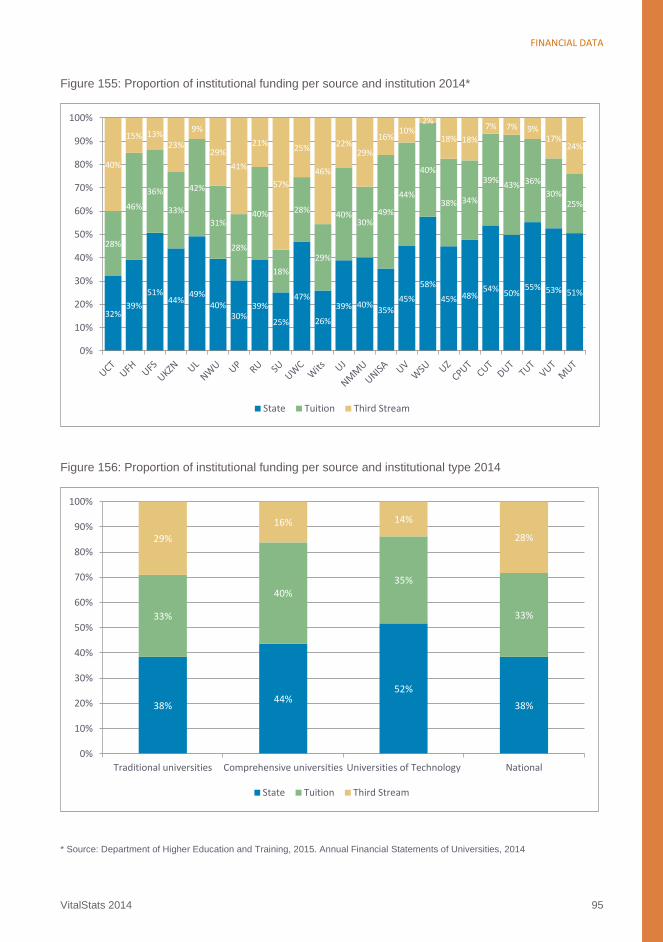
FINANCIAL DATA
VitalStats 2014 95
Figure 155: Proportion of institutional funding per source and institution 2014*
Figure 156: Proportion of institutional funding per source and institutional type 2014
* Source: Department of Higher Education and Training, 2015. Annual Financial Statements of Universities, 2014
32%39%
51%44%
49%40%
30%39%
25%
47%
26%
39% 40%35%
45%
58%
45% 48%54% 50%
55% 53% 51%
28%
46%
36%
33%
42%
31%
28%
40%
18%
28%
29%
40%30%
49%
44%
40%
38% 34%
39%43% 36%
30%25%
40%
15% 13%23%
9%
29%
41%
21%
57%
25%
46%
22%29%
16%10%
2%
18% 18%
7% 7% 9%17%
24%
0%
10%
20%
30%
40%
50%
60%
70%
80%
90%
100%
State Tuition Third Stream
38%44%
52%
38%
33%
40%35%
33%
29%
16% 14%
28%
0%
10%
20%
30%
40%
50%
60%
70%
80%
90%
100%
Traditional universities Comprehensive universities Universities of Technology National
State Tuition Third Stream
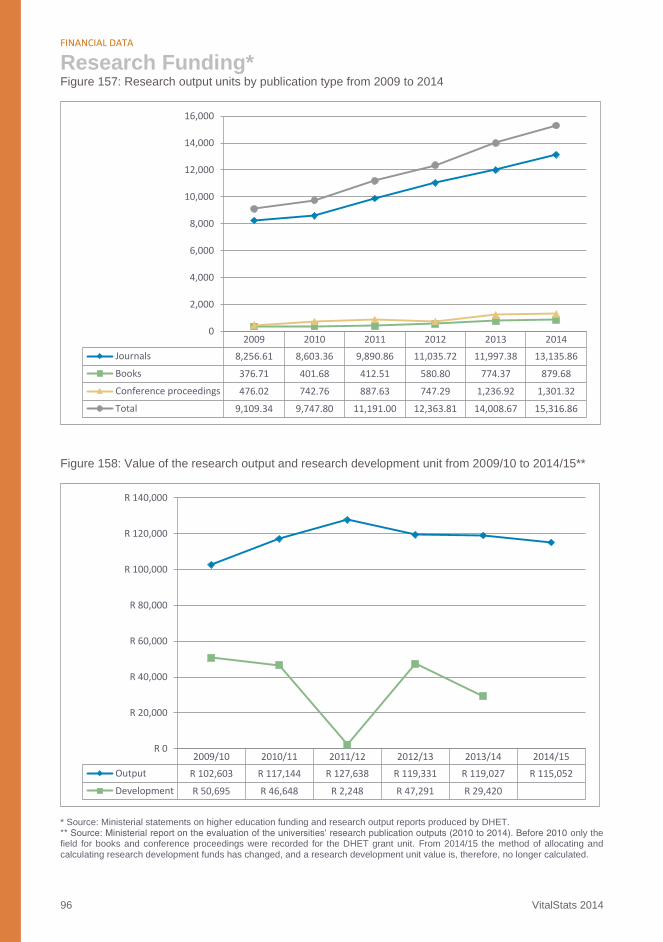
FINANCIAL DATA
96 VitalStats 2014
Research Funding* Figure 157: Research output units by publication type from 2009 to 2014
Figure 158: Value of the research output and research development unit from 2009/10 to 2014/15**
* Source: Ministerial statements on higher education funding and research output reports produced by DHET.
** Source: Ministerial report on the evaluation of the universities’ research publication outputs (2010 to 2014). Before 2010 only the field for books and conference proceedings were recorded for the DHET grant unit. From 2014/15 the method of allocating and
calculating research development funds has changed, and a research development unit value is, therefore, no longer calculated.
2009 2010 2011 2012 2013 2014
Journals 8,256.61 8,603.36 9,890.86 11,035.72 11,997.38 13,135.86
Books 376.71 401.68 412.51 580.80 774.37 879.68
Conference proceedings 476.02 742.76 887.63 747.29 1,236.92 1,301.32
Total 9,109.34 9,747.80 11,191.00 12,363.81 14,008.67 15,316.86
0
2,000
4,000
6,000
8,000
10,000
12,000
14,000
16,000
2009/10 2010/11 2011/12 2012/13 2013/14 2014/15
Output R 102,603 R 117,144 R 127,638 R 119,331 R 119,027 R 115,052
Development R 50,695 R 46,648 R 2,248 R 47,291 R 29,420
R 0
R 20,000
R 40,000
R 60,000
R 80,000
R 100,000
R 120,000
R 140,000
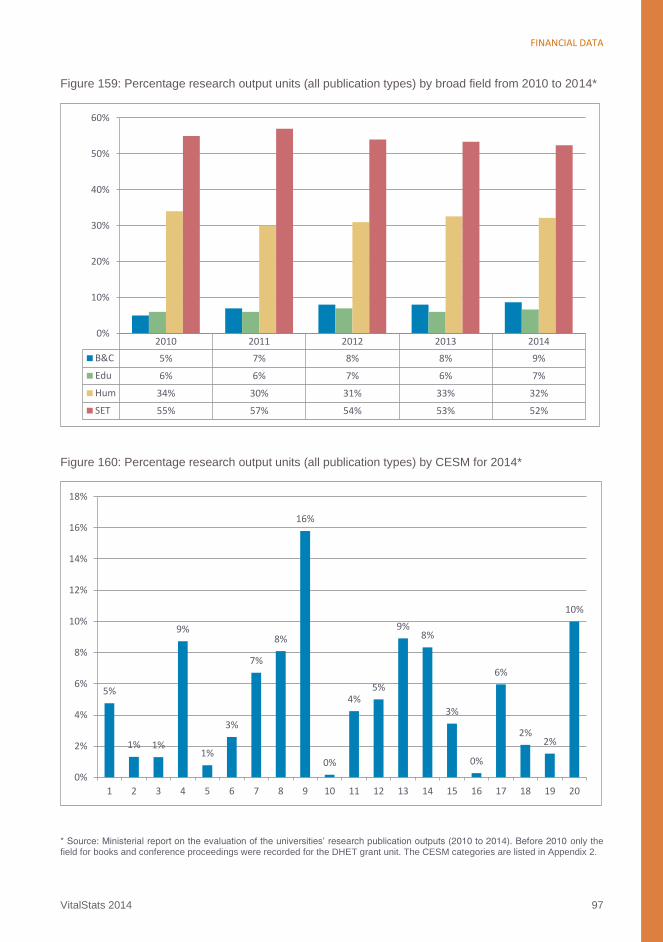
FINANCIAL DATA
VitalStats 2014 97
Figure 159: Percentage research output units (all publication types) by broad field from 2010 to 2014*
Figure 160: Percentage research output units (all publication types) by CESM for 2014*
* Source: Ministerial report on the evaluation of the universities’ research publication outputs (2010 to 2014). Before 2010 only the
field for books and conference proceedings were recorded for the DHET grant unit. The CESM categories are listed in Appendix 2.
2010 2011 2012 2013 2014
B&C 5% 7% 8% 8% 9%
Edu 6% 6% 7% 6% 7%
Hum 34% 30% 31% 33% 32%
SET 55% 57% 54% 53% 52%
0%
10%
20%
30%
40%
50%
60%
5%
1% 1%
9%
1%
3%
7%
8%
16%
0%
4%5%
9%8%
3%
0%
6%
2%2%
10%
0%
2%
4%
6%
8%
10%
12%
14%
16%
18%
1 2 3 4 5 6 7 8 9 10 11 12 13 14 15 16 17 18 19 20
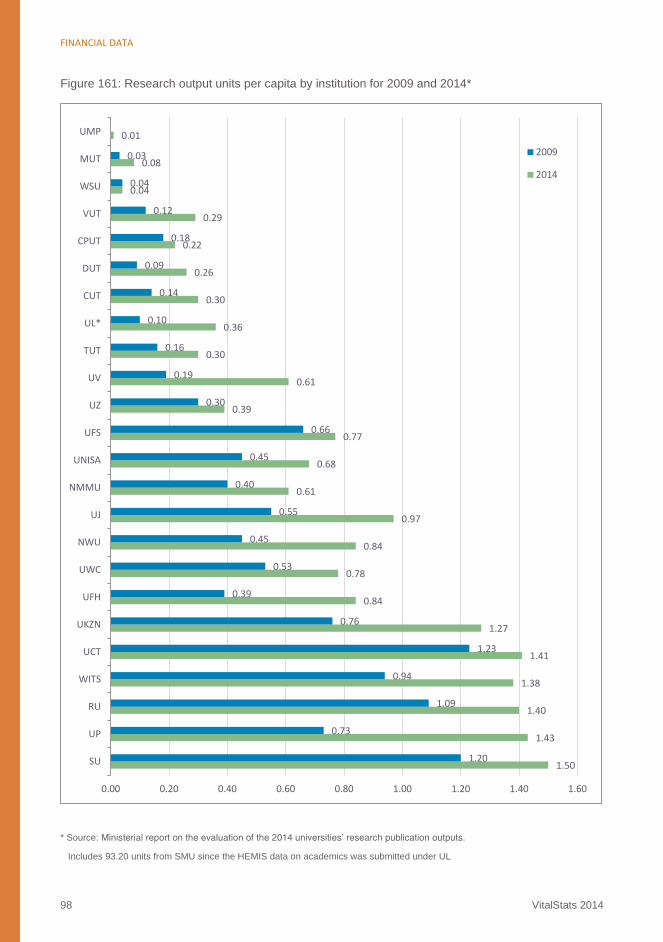
FINANCIAL DATA
98 VitalStats 2014
Figure 161: Research output units per capita by institution for 2009 and 2014*
* Source: Ministerial report on the evaluation of the 2014 universities’ research publication outputs.
Includes 93.20 units from SMU since the HEMIS data on academics was submitted under UL
1.50
1.43
1.40
1.38
1.41
1.27
0.84
0.78
0.84
0.97
0.61
0.68
0.77
0.39
0.61
0.30
0.36
0.30
0.26
0.22
0.29
0.04
0.08
0.01
1.20
0.73
1.09
0.94
1.23
0.76
0.39
0.53
0.45
0.55
0.40
0.45
0.66
0.30
0.19
0.16
0.10
0.14
0.09
0.18
0.12
0.04
0.03
0.00 0.20 0.40 0.60 0.80 1.00 1.20 1.40 1.60
SU
UP
RU
WITS
UCT
UKZN
UFH
UWC
NWU
UJ
NMMU
UNISA
UFS
UZ
UV
TUT
UL*
CUT
DUT
CPUT
VUT
WSU
MUT
UMP
2009
2014

VitalStats 2014 99
Appendix 1:
Institutions by institutional type
Traditional Universities
North-West University (NWU)
Rhodes University (RU)
University of Cape Town (UCT)
University of Fort Hare (UFH)
University of the Free State (UFS)
University of KwaZulu-Natal (UKZN)
University of Limpopo (UL)
University of Pretoria (UP)
University of Stellenbosch (SU)
University of the Western Cape (UWC)
University of the Witwatersrand (Wits)
Comprehensive Universities
Nelson Mandela Metropolitan University (NMMU)
University of Johannesburg (UJ)
University of South Africa (UNISA)
University of Venda (UV)
University of Zululand (UZ)
Walter Sisulu University (WSU)
Sol Plaatjie University (SPU)
University of Mpumalanga (UMP)
Universities of Technology
Cape Peninsula University of Technology (CPUT)
Central University of Technology (CUT)
Durban University of Technology (DUT)
Mangosuthu University of Technology (MUT)
Tshwane University of Technology (TUT)
Vaal University of Technology (VUT)
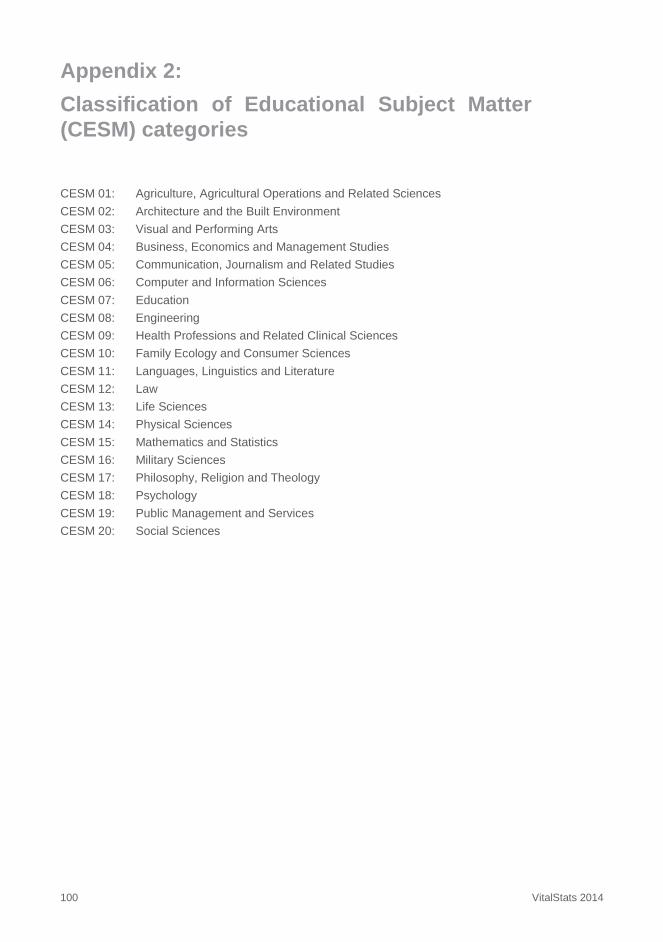
100 VitalStats 2014
Appendix 2:
Classification of Educational Subject Matter
(CESM) categories
CESM 01: Agriculture, Agricultural Operations and Related Sciences
CESM 02: Architecture and the Built Environment
CESM 03: Visual and Performing Arts
CESM 04: Business, Economics and Management Studies
CESM 05: Communication, Journalism and Related Studies
CESM 06: Computer and Information Sciences
CESM 07: Education
CESM 08: Engineering
CESM 09: Health Professions and Related Clinical Sciences
CESM 10: Family Ecology and Consumer Sciences
CESM 11: Languages, Linguistics and Literature
CESM 12: Law
CESM 13: Life Sciences
CESM 14: Physical Sciences
CESM 15: Mathematics and Statistics
CESM 16: Military Sciences
CESM 17: Philosophy, Religion and Theology
CESM 18: Psychology
CESM 19: Public Management and Services
CESM 20: Social Sciences
VitalStats 2014 101
Appendix 3:
Cohort methodology and list of specific knowledge
areas included in the broad fields used in the cohort
study
Methodological note for cohort analysis
Based on CESM categories and qualifiers, qualifications were recoded into uniform qualification names for the purpose of uniformity and to reduce the number of groups to be analysed. These groupings are shown in this Appendix.
Student cohorts were then defined and identified as follows:
At undergraduate level (for first qualifications), a cohort comprised the first-time entering students in a particular year who were selected as the new entrants.
For honours and postgraduate diplomas and certificates the cohort comprised new entrants made up of students from all three categories; namely, first-time entering, transfer and entering.
For masters and doctoral students all students who had not been enrolled in the previous year were deemed to be new entrants.
Any student in a cohort who graduated before the minimum expected duration of a qualification was deleted from the cohort on the assumption that the entrance category of the student was incorrect, or that the student had carried credits into the qualification being analysed.
Two types of analyses were performed:
1. Where cohort analyses were performed by uniform qualification name, any student who discontinued his/her studies in a particular uniform qualification during the period analysed was counted as a drop-out for that particular uniform qualification classification.
2. An analysis was also done ignoring the uniform qualification classification, and any student who qualified in the same qualification type i.e. degree or diploma of any sort, was counted as a successful graduate. This analysis showed slightly higher completion rates. Students who discontinued their studies in the qualification type being analysed and who moved to a different qualification type e.g. from a degree to a diploma, were seen as a dropout for the degree, but a completion for the diploma.
In both analyses, students who discontinued their studies during the period of analysis and then returned (stop-outs) were discounted against the number of drop-outs in the year that they returned. This accounts for the negative dropout numbers shown in some graphs. They were counted as successful if they graduated during the period analysed.
While analysis was undertaken with respect to UNISA, there are too few years of data available in the cohort studies to make an appropriate analysis of UNISA’s completion rates. UNISA’s cohort analyses are further complicated by the fact that large numbers of students interrupt their studies for a number of years.
*Please note that all extended programmes were excluded from these groupings.
Uniform Name Classifications
102 VitalStats 2014
360-credit Diplomas
Agriculture
Agricultural Management, Agriculture, Animal Health, Animal Production, Equine Science, Fisheries Resource Management,
Food Technology, Forestry, Game Ranch Management, Horticulture, Pulp and Paper Technology, Turf Grass Management, Wood Technology.
Architecture and Built Environment
Architecture, Architectural Technology, Building, Building Surveying, Landscape Technology, Surveying, Town and Regional
Planning.
Arts and Fine Arts
Ceramic Design, Dance, Drama, Fashion Design and Technology, Fashion, Film and Television Production, Film and Video Technology, Fine Art, Graphic Design, Human Sciences, Interior Design, International Communication, Jewellery Design
and Manufacture, Journalism, Language Practice, Motion Picture Production, Multimedia, Music, Musical Theatre, Opera, Performing Arts Technology, Photography, Public Relations Management, Public Relations, Surface Design, Three Dimensional Design, Translation and Interpreting Practice, Vocal Art.
Business and Management Sciences
Accounting, Administrative Management: General/ Financial, Company Administration, Adventure Tourism Management, Business Administration, Business Communication, Business Management, Commercial Administration, Commercial Practice, Cost and Management Accounting, Credit Management, Credit Management, Economic Management Accounting,
Economic Management Analysis, Economics, Ecotourism Management, Entrepreneurship, Event Management, Finance and Accounting, Financial Information Systems, Hospitality Management, Human Resources Management/ Development, Import and Export Management, Internal Auditing, Inventory and Stores Management, Labour Relations, Logistics, Management of Training, Management Sciences, Management Services, Management, Maritime Studies, Marketing, Office
Management and Technology, Office Management, Open Space and Recreation Management, Operations Management, Organisational & Work Study: Factories, Organisational Leadership, Packaging and Printing Management, Personnel Management, Printing Management, Production Management, Productions and Operations Management, Public Management, Purchase Management, Purchasing Management, Real Estate, Recreation Management, Retail Business
Management, Secretarial: Office Administration, Small Business Management, Sport Administration and Marketing, Sport Management, State accounts and Finance (inland), Taxation, Tourism Management, Transport Economics, Transportation Management, Travel and Tourism.
Computer Science, Information Technology and Information Sciences
Computer Studies, Computer Systems, Information Technology (Business Applications, Communication Network, Software Development, Technical Applications).
Education
Adult Basic Education and Training, Adv Cert in Education (Specialisation), Adv Cert in Education, College HE Diploma, Education (Commerce), Education (FET): Specialisation, Education (GET): Foundation Phase, Education (GET): Intermediate and Senior Phase, Education (Home Economics), Education (Natural Sciences), Education (Technical), Junior Primary Teachers, Secondary Teachers Diploma (Technical), Secondary Teachers Diploma, Senior Primary Teachers
Diploma.
Engineering
Chemical, Civil (Provision), Civil, Coal Mining, Electrical (Light Cur), Electrical (Provision), Electrical, Engineering Computer Systems, Explosives Management, Industrial (Provision), Industrial, Marine Engineering, Mechanical, Mechatronics,
Metalliferous Mining, Metallurgy, Mine Engineering, Mine Surveying, Mineral Surveying, Science Engineering and Technology, Surface Mining.
Family Ecology and Consumer Sciences
Catering Management, Child and Youth Development, Clothing Management, Clothing Production, Clothing, Consumer
Sciences: Food & Nutrition, Food and Beverage Management, Food and Consumer Sciences, Food and Nutrition, Food Service Management, Textile Design, Textile Technology, Wet Processing, Textile Technology: Dry Processing.
VitalStats 2014 103
Health
Biomedical Technology, Chiropractic, Clinical Technology, Dental Technology, Emergency Medical Care, Environmental
Health, Health Services Administration, Homoeopathy, Medical Orthotics and Prosthetics, Medical Technology, Optical Dispensing, Optometry, Podiatry, Radiography: Diagnostic, Radiography: Nuclear Medicine, Radiology: Somatology, Radiology: Therapy, Radiology: Ultrasound, Veterinary Technology.
Languages, Journalism and Communication
International Communication, Journalism, Language Practice, Multimedia, Public Relations, Public Relations Management, Translation and Interpreting Practice.
Law
Civil Law Administration, Deeds Registration Law, Legal Assistance, Registration of Deeds.
Public Management and Services
Contact Centre Management, Correctional Services Management, Government Finance, Local Government Finance, Local Government Management, Police Administration, Policing, Public Management and Administration, Public Management, Public Relations Management, Road Traffic and Municipal Police Management, Safety Management, Security Management,
Security Risk Management, Traffic Safety Management.
Science
Analytical Chemistry, Biotechnology, Cartography, Computer Studies, Computer Systems, Environmental Management, Environmental Sciences, Explosive Technology, Extraction Metallurgy, Fire Service Technology, Fire Technology, Fuel
Technology, Geology, Geotechnology, Information Technology, Information Technology: Business Applications, Information Technology: Communication Network, Information Technology: Software Development, Information Technology: Technical Applications, Mathematical Technology, Meteorology, Nature Conservation, Non Destructive Testing, Oceanography,
Officiating and Coaching Science, Plastic Technology, Polymer Technology, Rubber Technology, Sport and Exercise Technology, Water Care.
Social Science
Archival Studies, Community Extension, Library and Information Practice, Library and Information Studies.
3-year Degrees
Arts and Fine Arts
Combinations of: Applied Leisure Science, Arts, Audio Visual Production Management, Cognitive Science, Combined Arts, Community Development, Conservation, Culture & Arts, Culture & Heritage Tourism Management, Culture, Design,
Development Studies, Drama, Economics, Environmental Planning, Environmental Studies, Film and Television Studies, Fine Arts, Geographical Sciences, Geography, Human Movement Science, Human Resource Development, Humanities, Information Management, Information Science, International Relations, International Studies, Islamic Studies, Labour Relations, Law, Leadership, Life skills and Counselling, Marketing Research, Music, Pastoral Guidance, Performance
Studies, Philosophy, Physical Education, Policy Studies, Political Leadership and Citizenship, Politics, Psychology, Public Administration, Religion, Social and Marketing Research, Social Research, Social Sciences, Social Work Society, Sociology, Sport & Exercise, Sport Coaching, Sport Development, Sport Psychology, Sport Recreation & Exercise Science, Theatre
Studies, Tourism and Sustainable Development, Tourism Development, Tourism Management, Visual Art.
Languages, Journalism and Communication
Audiovisual Communication, Communication, Corporate Communication, Creative Writing, Journalism, Languages, Language Practice, Marketing, Media Studies, Setswana.
Agriculture
Agribusiness Management, Agricultural Administration, Agricultural Enterprise Management, Agricultural Extension and Rural Resources Management, Agricultural Management, Agricultural Science, Agriculture Economics, Agriculture, Animal Production, Animal Science, Cellar Management, Cellar Technology, Plant Production.
104 VitalStats 2014
Architecture and Built Environment
Architectural Studies, Architecture and the Built Environment, Construction Economics and Computer Science, Construction
Economics, Construction Management Studies, Construction Studies, Housing Development, Landscape Architecture, Property Development, Quantity Surveying Studies, Surveying, Urban and Regional Planning.
Business and Management Sciences
Accountancy, Accounting and Informatics, Accounting and Law, Accounting Science, Accounting, Actuarial Science,
Banking, Agricultural Commerce, Applied Leisure Science Events and Facility Management, Applied Leisure Science, Auditing, Banking, Business Administration, Business Informatics, Business Information Management, Business Information Systems, Business Management, Business Studies, Chartered Accountancy, Chartered Marketing, Commerce and Communication, Commerce and Computer Science and Information Systems, Commerce and Computer Science and
Statistics, Commerce and Informatics, Commerce and Information Management, Commerce and Information Systems, Commerce and Information Technology Management, Commerce and Law and Information Management, Commerce and Law, Commerce and Management Information Systems, Commerce and Statistics, Commerce, Communication Management, Cost Management, Culture and Heritage Tourism, Development Economics, Development Management,
Development Studies, Economics and Econometrics, Economics and Statistics, Economics, Ecotourism Management, Entrepreneurial Management, Entrepreneurship, Environmental Economics, Events Management, Finance, Financial Information Management, Financial Journalism, Financial Management, Financial Mathematics, Financial Modelling,
Financial Planning, Financial Sciences, Forensic Accountancy, General Accounting, General Management, Heritage and Cultural Tourism, Hospitality Management, Human Resource Development, Human Resource Management, Industrial and Organisational Psychology, Industrial Organisational & Labour Studies, Industrial Psychology, Insurance, Internal Auditing, International Economics, Investment Management, Labour Relations, Leadership, Logistics Management, Management
Accounting, Management, Marketing and Tourism Management, Marketing Management, Marketing, Monetary Economics, Outdoor Recreation Management, Personnel Leadership, Philosophy and Economics, Planning and Development, Politics and Economics, Property Studies, Public Administration and Economics, Public Sector Information Management, Quantitative Management, Real Estate, Risk Management, Sports Management, Sport & Recreation Management, Sport
and Leisure in Society, Taxation, Tourism and Indigenous Development, Tourism Management, Tourism Studies, Transport and Logistics, Transport Economics, Transport Management, Transport.
Computer Science, Information Technology and Information Sciences
Computer Linguistics, Computer Science, Computing, Informatics, Data Communication, Geographic Information Systems,
Information Systems, Information Technology for Industry and Mining, Information Technology Management.
Education
In Service Training for Foundation Phase/ Intermediate Phase and Further Education and Training, In Service Training Information and Communications Technology (ICT), In Service Training in Mathematics, Adult and Continuous Education,
Computer Education.
Family Ecology and Consumer Sciences
Consumer Sciences, Family Ecology, Hospitality, Human Nutrition, Settlement Studies, Tourism.
Health
Advance Practice Nursing, Advanced Nursing Science, Anatomy, Dietetics, Biomedical Engineering, Biomedical Sciences, Clinical Medical Practice, Clinical Practice, Community Health and Management, Dental Therapy, Dentistry, Forensic Science and Technology, Health Promotion, Health Sciences and Social Services, Health Sciences, HIV, Human Biology,
Medical Bioscience, Medical Microbiology, Medical Practice, Medical Science in Physiology, Medical Sciences, Medicine, Nursing Education and Management, Nursing, Oral Health, Oral Hygiene, Radiation Sciences, Radiography (Clinical), Radiography (Diagnostic).
Law
Criminal Justice, Law, Occupational Risk Law.
Psychology
Psychology, Sport Psychology.
Public Management and Services
Community Safety and Socio-Legal Studies, Criminal Justice, Criminology, Ethics Studies, Government Administration and Development, Industrial Psychology, Local Government Management, Local Government, Police Science, Police Studies,
VitalStats 2014 105
Policy Studies, Political Studies, Public Administration, Public Affairs, Public Finance, Public Management, Public Procurement Management, Public Sector Economic Policy, Public Sector Economics, Public Sector Human Resource
Management, Public Sector Information Management, Public Sector Management Accounting, Public Sector Personnel Management, Rural Development Management.
Science
Applied Geology, Applied Mathematics, Applied Statistical Science, Aquatic Health, Atmospheric Sciences, Biochemistry,
Biodiversity, Biological Sciences, Biomedical Sciences, Biotechnology, Botany, Chemical Biology, Chemical Science, Chemical Technology, Chemistry, Community Water Management, Conservation Biology, Data Mining, Earth Science, Ecological Sciences, Electronics, Environmental and Resource Studies, Environmental Management, Environmental Sciences, Environmental Studies, Exercise Science, Exploration Geophysics, Financial Mathematics, Food Science &
Technology, Genetics, Geography, Geology, Geological Science, Geosciences, Human Physiology, Hydro Sciences, Hydrobiology, Hydrology, Industrial Mathematics, Industrial Science, Informatics, Laser Physics, Life Sciences, Marine Biology, Material Science, Materials Development, Mathematical Sciences, Mathematical Statistics, Mathematics, Medical Microbiology, Medical Science, Microbiology, Mineral Sciences, Natural Sciences, Nuclear Sciences, Operations Research,
Pest Management, Physical Sciences, Physics, Physiological Sciences, Plant Biotechnology, Polymer Sciences, Social Biology, Soil Sciences, Sport Coaching Sciences, Sports Science, Statistics, Textile Sciences, Theoretical Physics, Water Resources Management, Water Studies, Zoology.
Social Science
African Studies, Anthropology, Community Development, Cultural Studies, Demography, Development and Leadership, Ethics and Politics and Economics, Gender Studies, Geographical Environmental Management, Governance and Political Transformation, Government Business Ethics, Heritage Studies, History, Housing, Human and Social Studies, Human and
Societal Dynamics, Humanities, Industrial Working Life, Information and Knowledge Management, Information Science, International Studies, Library Sciences, Philosophy and Policy and Law, Philosophy, Policy studies, Political Science and International Relations, Political Studies, Population and Development Studies, Population Studies, Social Dynamics, Social Research, Social Science, Social Work, Socio Informatics, Sociology, Urban & Rural Studies, Youth in Development, Youth
Work.
Theology
Bible Languages, Biblical Studies, Christian Ministries, Church Ministry, Diaconiology, Pastoral Counselling, Theological
Foundations, Theology, Youth Work.
4 year Degrees
Arts and Fine Arts
Dance, Dramatic Arts, Fine Arts, Graphic Design, Jazz and Pop Music, Jewellery, Music Composition, Music Education,
Music, Musicology, Performing Arts, Theatre, Visual Arts, Visual Communication Development.
Human Movement Science and Sport & Exercise
Human Movement Education, Physical and Health Education.
Languages, Journalism and Communication
Communication Studies, Development Communication, Journalism, Languages Education.
Agriculture
Agricultural Agro meteorology (Grassland Sciences, Plant Pathology, Soil Science), Agricultural Economics, Agricultural Education, Agricultural Management, Agriculture, Agronomy, Animal Breeding, Animal Genetics, Animal Health, Animal
Production Management, Animal Production, Animal Sciences, Aquaculture, Crop Production Management, Crop Protection, Crop Science, Entomology, Food Science and Biochemistry, Food Science and Microbiology, Food Science Technology, Food Science, Forestry, Horticulture, Human Settlement Development, Irrigation, Land-Use Planning, Meat Science,
Molecular Genetics, Nursery Management, Ornamental Horticulture, Pasture Management, Pasture Sciences, Plant Breeding, Plant Production, Plant Protection, Soil Science, Vineyard and Wine Sciences, Weed Science, Wood Production, Woodwork, Wood Sciences.
106 VitalStats 2014
Architecture and Built Environment
Architectural Studies, Architecture, Building Administration, Building, Construction Management, Land and Property
Development Management, Property Studies, Quantity Surveying, Town and Regional Planning.
Business and Management Sciences
Accountancy, Accounting Science, Accounting, Actuarial Science, Banking, Business Administration, Business Communication, Business Science, Commerce Education, Development Economics, Hospitality Management, Hospitality,
Management, Office Management and Technology, Planning, Recreation and Leisure Studies, SMME (Small, Medium and Micro Enterprises), Tourism.
Computer Science, Information Technology and Information Sciences
Computationist, Information Technology, Software Development.
Dentistry
Dental Science, Dental Surgery,
Education
Adult Education, Early Childhood Development, Education in Agricultural Sciences/Arts/ Biology/ Commerce/ Consumer
Sciences/ Economic and Management Sciences/ English/ Food Sciences/Geography/ Humanities/ Languages/ Life Orientation/ Life Sciences/ Mathematics/ Natural Sciences/ Physical Education/ Science/ Social Sciences/ Technical/ Technology/ Textiles, Further Education and Training, General Education and Training (Foundation Phase/ Intermediate or Senior Phase), Pedagogics, Pre-primary Education, Primary Education, Secondary Education.
Engineering
Aeronautical Engineering, Chemical Engineering, Civil Engineering, Computer Systems Engineering, Electrical Engineering, Electro-Mechanical Engineering, Electronic Engineering, Industrial Engineering, Land Surveying, Materials Engineering,
Mechanical Engineering, Mechatronics, Metallurgy and Materials, Metallurgy, Mine Surveying, Mineral Resource Management, Mining.
Family Ecology and Consumer Sciences
Clothing and Textiles, Clothing International Retail Management, Clothing Small Business Management, Clothing,
Community Agriculture, Community Nutrition, Consumer Science, Consumer Studies, Food Management, Home Economics, Hotel-Keeping and Catering, Housing, Human Ecology, Nutrition.
Health
Advance Practice Nursing, Audiology, Biokinetics, Chinese Medicine, Communication Pathology, Diagnostic Radiography,
Diagnostic Ultrasound, Dietetics, Emergency Medical Care, Laboratory Medicine, Medical Clinical Practice, Medical Laboratory, Medical Orthotics and Prosthetics, Medical Orthotics and Prosthetics, Medical Sciences, Naturopathy, Nuclear Medicine Technology, Nursing Science, Nutrition, Occupational Therapy, Optometry, Oral Biology, Oral Health, Pharmacy, Physiotherapy, Radiation Therapy, Speech and Hearing Therapy, Speech and Language Pathology and Audiology Therapy,
Sport Sciences.
Law
Law, Financial Planning Law
Medicine
Medicine, Surgery.
Psychology
Counselling, Educational Psychology, Psychology, Sport Psychology.
VitalStats 2014 107
Public Management and Services
Criminal Justice Administration, Criminology, General Public Management, Local Government Management, Political
Studies, Public Financing, Public Human Resource Management, Public Information Management, Public Management (Accounting, Economic Policy), Rural Development Management.
Science
Biochemistry, Earth Sciences, Education in Earth Sciences/ Biology/ Life Sciences/Mathematical Sciences/ Physical
Sciences/, Environmental Management, Geomatics, Industrial Science, Mining and Environmental Conservation.
Social Science
Criminology, Diaconiology (Social Work), Indigenous Knowledge Systems, Information Design, Information Science, Information Studies in Education, Land Reform and Rural Development, Library and Information Science, Peace Studies,
Social Development, Social Work, Youth in Development.
Theology
Youth Work, Theology
Veterinary Science
Veterinary Science.
PG Diplomas and Certificates
Agriculture
Agricultural Management, Agriculture, Aquaculture, Food Security, Land and Agrarian Studies.
Architecture and Built Environment
Architecture, Built Environment, Construction Project Management.
Arts and Fine Arts
Arts, Coral Conducting, Drama, Film, Fine Arts, Music Technology, Music, Performance, Rock Art Studies, Television.
Business and Management Sciences
Accountancy, Accounting, Actuarial Science, Applied Accounting Science, Auditing, Business Administration, Business Data,
Business Management and Marketing, Business Management, Commerce, Computer Auditing, Computer Development Planning, Developing Areas, Development and Management, Development Studies, Dispute Resolution, Economics, Entrepreneurship Management, Entrepreneurship, Executive Leadership, Financial Accounting, Financial Banking
Investment Management, Financial Management, Financial Planning, Forensic Accounting, General Human Resources Management, General Management, General Operations, Human Resource Development, Human Resource Management, Industrial Administration, Industrial Relations, Internal Auditing, Investment, Labour Relations Management, Leadership Studies, Management Development, Management Practice, Management, Managing Accounting, Maritime Studies,
Marketing Management, Marketing Personnel Management, Marketing Support Management, Mineral Resource Management, Organisational Development, Planning, Property Development, Property Economics, Property Management, Property Studies, Recreation and Tourism, Risk Management, Small, Medium and Micro Enterprises Development, Sport Vision, Sustainable Development, Tax Law, Tax Strategy and Management, Taxation, Tourism, Transport and Logistics,
Transport Studies, Women's Development and Micro-Finance.
Computer Science, Information Technology and Information Sciences
Applied Information Systems, Computer Science, Digital Innovation, Geographical Information Systems, Information and Communication Technology Policy and Regulation, Information and Communication Technology, Management of
Information Systems, Multimedia Computing.
Dentistry
Clinical dentistry, Community Dentistry, Dentistry (Pain and Sedation), Dentistry Radiography, Dentistry, Implant Dentistry.

108 VitalStats 2014
Education
Adult Education, Agricultural Education, Art and Culture Education, Biology Education, Cognitive Studies, Computer Assisted
Education, Computer Science Education, Curriculum Studies, Distance Education, Drama and Theatre Education, Economic Science Education, Education Administration, Education in Physiotherapy, Education Leadership, Education Management, Education School Guidance, Education, Educational Guidance, Educators of Adults, English Language Teaching Language Education, Fine Arts Education, Foundation Phase Education, Further Education and Training, Geography Education, Group
Activities, Higher Education and Training, Higher Education Studies, Higher Education, Inclusive Education, Intermediate Phase Education, Junior Primary School Education, Life Sciences Education, Mathematical Literacy Education, Mathematical Sciences Education, Mathematics Education, Music Education, Natural Sciences Education, Philosophy of Education, Physical Sciences Education, Physical Sciences Education, Physics and Chemistry Education, Policy Studies
and Governance in Education, Primary School English Education, Primary School Mathematics Education, Psychology of Education, Quality Assurance and Reliability, Remedial Education, Secondary Education, Secondary School English Education, Secondary School Mathematics Education, Senior Phase Education, Senior Phase Social Sciences Teaching, Special Education Needs Education, Special Education, Technical Education, Tertiary Education.
Engineering
Chemical Engineering, Civil Engineering, Electrical Engineering, Engineering Management, Engineering, Geohydrology, Industrial Engineering, Materials, Mechanical Engineering, Metallurgy, Mining.
Family Ecology and Consumer Sciences
Child and Family Studies, Child and Youth Development, Childcare and Protection, Clothing and Textiles, Housing Development and Management.
Health
Addictions Care, Advanced Midwifery, Advanced Nursing, Advanced Occupational Therapy, Advanced Physiotherapy, Advanced Psychiatric Nursing, Applied Radiation Science, Child Health Care, Clinical Evidence and Health Management, Clinical HIV/ Aids Management, Community and General Paediatrics, Community Eye Health, Community Health Extension, Community Health Nursing, Community Health Veterinary Sciences, Community Health, Community Nursing Science,
Critical Care Nursing, Dermatology Nursing, Dietetics, Disability Studies, Emergency Care, Family Medicine, Forensic Health Care, Forensic Nursing, General Interventional Radiography, Gerontological Nursing, Hand Rehabilitation, Hand Therapy, Health and Welfare Management, Health Care and Social Welfare, Health Care Management, Health Economics, Health Education, Health Management, Health Professions Education, Health Promotion, Health Science in Autism Spectrum
Disorders, Health Science, Health Service Management, Health Studies Radiography (Diagnostic, Nuclear Medicine), Health Systems Management, Health Technology Management, HIV Management, Hospital Dietetics, Hospital Management, Hospital Pharmacy Management, Infection Control, Management of Childhood Disabilities, Maternal and Child Health, Medical Administration, Medical Information, Medical Surgical Nursing, Midwifery And Neonatal Nursing, Midwifery,
Nephrology Nursing Science, Nephrology, Nursing Administration, Nursing Critical Care, Nursing Education, Nursing Management, Nursing, Occupational Health, Occupational Medicine and Health, Occupational Therapy, Operating Room Nursing, Operational Ward Nursing, Optometry, Orthopaedic Nursing, Paediatric Nursing, Paediatric Radiology, Pesticide
Risk Management, Pharmacology, Physiotherapy, Primary Clinical Health, Primary Health Care, Psychiatric Nursing, Public Health Medicine, Public Health, Pulmonology, Speech and Hearing Therapy, Sport Medicine, Sport, Surgical Nursing, TB & HIV Management, Transfusion Medicine, Trauma Nursing, Tropical Medicine and Health, Vocational Rehabilitation.
Family Ecology and Consumer Sciences
Applied Linguistics, Communication Studies, Economic Journalism, Interactive Media design, International Communication, Journalism, Language Interpretation, Language Practice, Language Translation, Media Management, Second Language Studies, Telecommunications and Information, Translation and Court Interpreting, Translation Studies & Linguistics.
Law
Company Law, Criminal Justice, Environmental Law and Management, Estate Law, Export Laws, Forensic Investigation and Criminal Justice, Fraud and Criminal Justice, Human Rights, International and African Regional Law, International Economic Law, Labour Law, Law, Legal Practice, Maritime Law, Public Health Law.
Medicine
Clinical Haematology, Clinical Pharmacology, Endocrinology, Family Medicine, Gastroenterology, Geriatric Medicine, Palliative Medicine, Paediatrics.
Psychology
Applied Psychology, Child Psychiatric Nursing, Counselling, Psychological Counselling, Psychotherapy, Public Mental
Health.

VitalStats 2014 109
Public Management and Services
Community Development, Community Service, Disaster Management, Governance, Political Studies, Public Administration,
Public and Development Studies, Public Policy and Development, Public Policy, Rural Rescue Management.
Science
Applied Physiology, Chemical Pathology, Earth Science Practice and Management, Energy Studies, Environmental Sciences, Environmental Studies, Future Studies, Geographical Sciences, Geology, Integrated Water Resources
Management, Mathematical Sciences, Medical Physics, Population Studies, Science, Scientific Studies.
Social Science
African Studies, Antique Cultures, Applied Ethics (Philosophy), Applied Ethics, Applied Social Sciences, Archives and Records Management, Decision Making, Demography and Population Studies, Documentation and Development, Eastern
Cape Studies, Environment and Society, Gender Studies, Health Ethics, Heritage Studies, Humanitarian and Development Management, Information Management, Information Science, Information Studies, Inter-Cultural Communication, International Affairs, International Research Ethics, International Studies, Knowledge Development, Librarianship, Library and Information Science, Museum and Heritage Studies, Philosophy, Policy Development Studies, Political Science, Social
Policy, Social Sciences Methods, Social Sciences, Social Services, Social Work.
Theology
Christian Pastoral Studies, Religion and Culture, Theology.
Veterinary Science
Veterinary Public Health.
Honours Degrees
Agriculture
Agrarian Extension, Agribusiness Management, Agricultural Administration, Agricultural Biotechnology, Agricultural Economics, Agricultural Extension, Agricultural Irrigation Management, Agricultural Management, Agriculture (Biochemistry,
Entomology, Microbiology, Rural Development and Planning, Rural Household Development), Agronomy, Animal Science (Animal Breeding, Large Stock Science, Production, Production Management, Nutrition Science, Pig Science, Poultry Science, Product Physiology, Small Stock Science, Wool Science), Aquaculture, Crop Protection, Crop Science, Food for Communities and Families, Food for Families, Food Processing, Food Production and Processing, Food Science and
Technology, Food Science, Forestry, Genetics, Grass Land Science, Income For Communities, Land Development, Land Management, Land-Use Planning, Ornamental Horticulture, Pasture Science, Plant Nutrition, Plant Pathology, Plant Production (Agronomy, Horticulture), Plant Protection, Plant Quarantine, Rural Agricultural Development/ Planning, Soil Science, Sustainable Ecology Management, Sustainable Insect Management, Sustainable Plant Genetic Resource
Management, Weed Science, Wildlife Management, Wood Work.
Architecture and Built Environment
Architectural Studies, Architecture, Construction Management, Construction, Land and Property Development Management, Landscape Architecture, Property Studies, Quantity Surveying, Urban and Regional Development/ Planning, Urban Studies.
Arts and Fine Arts
Design, Drama, Film Studies, Music Education, Music Technology, Music, Musicology, Performing Art, Television Studies, Theatre, Visual Media, Visual Studies.
Business and Management Sciences
Accountancy, Accounting Sciences, Accounting, Actuarial Science, Administration in Business Management, Agribusiness Management, Applied Econometrics, Auditing, Business Information Systems, Business Management, Commerce, Community Development Studies, Cost and Management Accounting, Development Studies, Econometrics, Economic
Policy Analysis, Economics, Ecotourism, Employment relations, Financial Economics and Investment, Financial Management, Financial Modelling, Human Resource Development, Human Resource Management, Industrial Psychology, Industrial Society and Labour Studies, Internal Auditing, Investment Management, Investment, Logistics, Management Accounting, Management, Marketing Management, Marketing Supply Chain Management, Marketing, Money and Banking,
Operations Research, Personnel Leadership, Property Valuation and Management, Quantitative Management, Real Estate,
110 VitalStats 2014
Recreation, Small Business Development Studies, Sport and Leisure Studies, Sport and Recreation Management, Statistics, Strategic Management, Supply Chain Management, Taxation, Tourism Management, Transport Economics.
Computer Science, Information Technology and Information Sciences
Computer Information Systems, Computer Science, Computing, Data Mining, Information Systems.
Dentistry
Dental Science.
Education
Adult and Community Education and Training, Adult Education, Assessment and Quality Assurance, Astronomy Education, Chemistry Education, Community Education, Computer Integrated Education, Computing Education, Curriculum and Instruction Design and Development, Curriculum Design and Development, Curriculum Studies, Early Childhood
Development, Education Law, Education Management, Educational Management, Education Policy Studies, Educational Administration and Technology, Educational Leadership and Management Development, Educational Psychology, English Teaching, Environmental Education, Further Education and Training (FET) Specialisation, General Education and Training (GET) Specialisation, GET: Foundation Phase, GET: Intermediate/Senior Phase, Governance in Education, Guidance and
Counselling, Learning Support, Life Science Education, Mathematics Education, Non Mother Tongue Teaching, Physical Education, Physics Education, Professional Curriculum Studies, Science Education, Science Education, Special Needs Education, Technology Education.
Engineering
Agricultural Engineering, Bio-Engineering, Chemical Engineering, Computer Engineering, Control Engineering, Corrosion Engineering, Electrical Engineering, Electronic Engineering, Environmental Engineering, Geotechnical Engineering, Industrial Engineering, Mechanical Engineering, Metallurgical Engineering, Micro-Electronics, Mining Engineering, Software
Engineering, Structural Engineering, Transportation Engineering, Urban Engineering, Water Resources Engineering, Water Utilisation Engineering, Quality Assurance & Reliability, Technology Management.
Family Ecology and Consumer Sciences
Clothing Management, Clothing Marketing, Consumer Sciences, Food Management, Home Economics, Merchandise
Management, Settlement Studies
Health
Biokinetics, Clinical Nursing, Critical Care, Dietetics, Haematology, Health Studies, HIV/AIDS, Human Genetics, Human Movement Sciences, Immunology, Medical Criminality, Medical Immunology, Medical Microbiology, Medical Nuclear
Science, Medical Physics, Medical Science, Medical Sciences Anatomy, Medical Sciences Bio-Engineering, Medical Virology, Medicine and Surgery, Midwifery and Neonatal Care, Neurology, Nursing Administration, Nursing Education, Nursing Management, Nursing Science, Orthopaedics, Paediatrics, Pharmacology, Physiology, Physiotherapy, Psychiatry, Quantitative Health Science, Radiation Therapy, Radiography (Angiography, Computer Tomography, Diagnostic General,
Nuclear Medicine), Radiological Therapy, Sport Coaching, Vocational Rehabilitation.
Languages, Journalism and Communication
African languages, African Non-Mother Tongue Teaching, Afrikaans, Ancient Languages and Cultures, Applied Language Studies, Applied Linguistics, Arabic, Augmentative and Alternative Communication, Classical Hebrew, Communication
Management, Communication Science, Communication Theory, Communication, Corporate Communication, Culture and Media Studies, English Language Teaching and Literary Studies, English Linguistics, English Literature, English Studies, English, European Languages, Film & Television Studies, French Language and Literature, French Teaching, General
Literary Theory, German Language and Literature, Integrated Marketing Communication, IsiNdebele, Italian Language and Literature, Journalism, Languages, Language Practice, Language Studies, Linguistics, Literacy Studies, Marketing Communication, Media Studies, Modern European Languages, Modern Hebrew, Nguni, Pan-African Literatures, Portuguese, Professional Writing, Romance Languages, Russian, Semitic Languages, Sesotho, Siswati, Sociolinguistics, Sotho, Spanish,
Strategic Communication, Theory of Literature, Translation Studies, Xhosa.
Law
Criminal Justice.
VitalStats 2014 111
Medicine
Aerospace Medicine, Chemical Pathology, Haematology, Medical Oncology, Medicine, Molecular Medicine, Radiation
Oncology.
Psychology
Industrial Psychology, Industrial and Organisational Psychology, Psychology, Sport Psychology.
Public Management and Services
Auditing (Public Sector), Community Development, Criminal Justice, Criminology, Development, Industrial Psychology for the Public Sector, International Politics, International Relations, Municipal Administration, Penology, Police Science, Political Science, Probation Services, Public Accounting, Public Administration, Public Economics, Public Logistics, Public Management & Governance, Public Management, Public Sector Transport Economics, Rural Development, Statistics for the
Public Sector.
Science
Actuarial Mathematics, Actuarial Science, Anatomy, Animal, Plant and Environmental Sciences, Applied Biotechnology, Applied Geology, Applied Mathematics, Applied Sciences, Astronomy, Astrophysics, Behaviour Genetics, Biochemistry,
Biodiversity, Bioinformatics, Biology, Biosystems, Biotechnology, Botany, Chemical Technology, Chemistry and Management, Chemistry, Comparative Anatomy, Control, Corrosion, Development Biology, Electronics, Electrotechnics, Entomology, Environment Management, Environmental Monitoring, Environmental Sciences, Environmental Studies, Environmental Technology, Exercise Sciences, Exploration Geophysics, Forensic Genetics, Forensic Sciences, Genetics,
Geographical Information Systems, Geography Ecotourism, Geography, Geohydrology, Geoinformatics, Geology, Geotechnics, Human Cell Biology, Human Genetics, Human Histology, Human Physiology, Hydrology, Industrial Systems, Irrigation, Limnology, Macro-Anatomy, Materials Science, Mathematical Statistics, Mathematics of Finance, Mathematics,
Mechanics, Medical Bioscience, Medical Cell Biology, Metallurgy, Meteorology, Microbiology, Mine Strata Control, Mining Environmental Control Neuro-Anatomy, Nutrition & Food Sciences, Operations Research, Palaeontology and Geology, Physical Anthropology, Physical Science, Physics Polymer Technology, Physics, Physiological Sciences, Physiology, Plant Health, Plant Molecular Biology, Plant Pathology, Quality Assurance and Reliability, Renewable Energy, Reproductive
Biology, Reproductive Biology (Andrology), Sport Sciences, Statistics, Structural Biology, Structural materials, Structures, Technology Management, Transportation Planning, Water Resources, Water Science, Water Utilisation, Wildlife, Wildlife Management, Zoology.
Social Science
Africa Studies, African Politics, African Studies, Ancient History, Ancient Near Eastern Studies, Anthropology, Applied Ethics, Archaeology, Archival Science, Biblical Archaeology, Classical Culture, Classical Studies, Cognitive Science, Conflict Resolution, Cultural History, Culture Studies, Development Sociology, Development Studies, Gender Studies, Heritage and Cultural Tourism, Heritage and Museum Studies, Historical Studies, History, Industrial Sociology, Informatics, Information
Management, Information Science, Information Sciences for Development Studies, International Politics, International Relations, Islamic Studies, Judaica Studies, Library and Information Sciences, Library and Information Studies, Life Skills and Counselling (HIV and AIDS), Moral and Cultural Studies, Philosophy, Political Dynamics, Political Science, Politics and
International Relationships, Politics, Population Studies, Social Behaviour Studies in HIV/ AIDS, Social Behaviour Studies, Social Policy, Social Science Research, Social Work (Probation Work), Social Work, Sociology
Theology
Biblical Archaeology, Biblical Studies, Christian Spirituality, Church History, Diaconiology In Missiology, Diaconiology In
Youth Work, Judaica, Missiology, New Testament, Old Testament, Practical Theology, Religious Studies, Science of Religion and Missiology, Systematic Theology, Theological Ethics, Theological Studies, Theology.
Veterinary Science
Veterinary Science
Masters Degrees
Agriculture
Agribusiness Management, Agricultural Administration, Agricultural Economics, Agricultural Extension and Rural Development, Agricultural Extension, Agricultural Management, Agriculture, Agronomy, Animal Breeding and Genetics, Animal Breeding, Animal Production Management, Animal Production Physiology, Animal Production, Aquaculture, Arts and Culture Management, Biochemistry, Crop Protection, Entomology, Environmental Management, Food Processing, Food
112 VitalStats 2014
Production, Food Science and Technology, Food Sciences, Food Technology, Forest Management and Environmental Studies, Forestry, Game Ranch Management, Genetics, Home Economics, Horticulture, Integrated Pest and Disease
Management, Land and Agricultural Studies, Land Development, Land-Use Planning, Large Animal Stock Sciences, Livestock Nutrition, Meat Science, Mechanized Agriculture, Microbiology, Nutrition Sciences, Ornamental Horticulture, Pasture Science, Pest and Disease Management, Pig Sciences, Plant Biotechnology, Plant Breeding, Plant Pathology, Plant Production, Plant Protection, Plant Quarantine, Postharvest Technology, Poultry Sciences, Rural Development and
Ecotourism, Rural Development Planning, Rural Engineering Technology, Rural Household Development, Small Stock Animal Sciences, Soil Science and Plant Nutrition, Soil Science, Sustainable Agriculture, Sustainable Ecological Management, Sustainable Insect Management, Sustainable-Genetic Resource Management, Weed Science, Wildlife Management, Wood Sciences.
Architecture and Built Environment
Architectural Technology, Architecture, Building Management, Building Project Management, Building, Built Environment, City Planning and Urban Design, Construction Economics and Management, Construction Economics, Construction Management, Design and Management, Development Planning, Environmental Planning (Urban Design), Environmental
Planning, Housing Development and Management, Housing, Interior Architecture, Land and Property Development Management, Landscape Architecture, Project Management, Quantity Surveying, Real Estate, Surveying, Town and Regional Planning, Urban and Regional Planning, Urban Design, Urban Infrastructure, Urban Renewal, Urban Studies.
Arts and Fine Arts
Applied Drama: Theatre in Education, Ceramic Design, Ceramics Technology, Clothing Design, Dance, Design, Digital Arts, Drama (Performance), Drama, Dramatic Art, Fashion, Film Studies, Fine Art, Graphic Design, History and Film Documentary, History of Art, Industrial Design, Interior Design, Media Studies, Motion Picture Production, Music Composition, Music
Education, Music Technology, Music Therapy, Music, Musical Theatre, Musicology, Performing Art, Performing Arts Technology, Photography, Piano Didactics, Rock Art Studies, Textile Design and Technology, Theatre Arts, Visual Arts, Visual Studies.
Business and Management Sciences
Accounting Science, Accounting, Actuarial Science, Adventure Tourism Management, Applied Econometrics, Auditing, Banking, Business Administration, Business Information System, Business Leadership, Business Management, Business Science, Clothing, Commerce, Commercial Administration, Comparative Local Development, Computer Auditing, Cost and Management Accounting, Development Economics, Development Finance, Development Management, Development
Planning, Development Studies, Econometrics, Economic Management Analysis, Economic Policy Analysis, Economic Policy, Economics, Economy of Trade and Investment, Ecotourism Management, Entrepreneurship, Environmental Management, Executive Leadership, Financial Economics and Investment, Financial Engineering, Financial Management Sciences, Financial Management, Financial Markets, Financial Risk Management, Food and Beverage Management, Food
Service Management, Heritage and Cultural Tourism, Hospitality Management, Hotel and Tourism Management, Human Resources Development, Industrial Administration, Innovation Studies, Insurance Science, Internal Auditing, International Accounting, Investment Management, Labour Policy and Globalisation, Labour Relations Management, Leadership Studies,
Logistics, Management Accounting, Management, Marketing Management, Marketing, Money and Banking, Office Management and Technology, Operations Management, Operations Research, Organisational Leadership, Parks and Recreation Management, Personal and Professional Leadership, Personnel Leadership, Personnel Management, Planning, Production and Operations Management, Production Management, Quantitative Management, Real Estate, Recreation and
Sport Management, Retail Business Management, SA & International Taxation, Sport Management, Taxation, Tourism and Hospitality Management, Tourism Development, Tourism Management, Tourism, Transport Economics, Transport Studies.
Computer Science, Information Technology and Information Sciences
Computer Data Processing, Computer Science, Computer Systems, Computing Education, Computing, Informatics,
Information and Communication Technology, Information Communication and Technology Policy and Regulation, Information Management, Information Networks, Information Systems, Information Technology, Knowledge Management, Professional Practice in Information Technology.
Dentistry
Community Dentistry, Dental Technology, Dentistry, Endodontics, Facial and Oral Radiation, Facial and Oral Surgery, Maxillofacial and Oral Radiology, Odontology, Oral Medicine, Oral Pathology, Oral Surgery, Orthodontics, Periodontics, Prosthodontics.
Education
Adult and Community Education and Training, Adult Education, Assessment and Quality Assurance in Education and Training, Child Education in the Foundation Phase, Cognitive Education, Comparative Education, Computer Assisted Education, Computer-Integrated Education, Counselling, Curriculum and Instruction Design and Development, Curriculum
Policy Development, Curriculum Studies, Early Childhood Development, Early Childhood Intervention, Education for

VitalStats 2014 113
Community Development, Education In Didactics, Education Management, Education, Educational Guidance and Counselling, Educational Leadership, Educational Linguistics, Educational Management, Educational Policy, Educational
Psychology, Educational Technology, Educator Professional Development, Environmental Education, Geography Education, Guidance, Higher Education and Higher Education Studies, History of Education, ICT in Education, Inclusive Education, Language and Literacy in the Foundation Phase, Law and Policy, Learning Support, Life and Career Orientation, Marketing Research, Mathematical and Science Education, Mathematics Education, Maximising Potential in Education and Training,
Methodology in the Foundation Phase, Natural Sciences Education, Numeracy in the Foundation Phase, Open and Distance Learning, Orthodidactics, Orthopedagogics, Philosophy of Education, Policy Studies, Post School Education (Bridging), Psychology of Learning, Relationship of Authority in Education, School Counselling, Science Education, Sociopedagogics, Special Needs Education, Subject Didactics, Teacher Education, Technology Education, Values and Human Rights in
Education.
Engineering
Agricultural Engineering, Bio-Engineering, Chemical Engineering, Civil Engineering (Water), Civil Engineering, Computer Engineering, Control Engineering, Corrosion Engineering, Electrical Engineering, Electronic Engineering, Engineering and
Environmental Geology, Engineering Geology, Engineering Management, Engineering Project Management, Engineering Sciences, Engineering Surveying, Environmental Engineering, Geotechnical Engineering, Industrial Engineering, Mechanical Engineering, Mechatronics, Metallurgical Engineering, Metallurgy and Materials, Micro-Electronic Engineering,
Mineral Engineering, Mining Engineering, Quality, Software Engineering, Structural Engineering, Technology Management, Transportation Engineering, Urban Engineering, Water Resources Engineering, Water Utilization Engineering.
Family Ecology and Consumer Sciences
Applied Human Nutrition, Child and Family Studies, Child Care and Protection, Clothing Management, Consumer Science,
Development, Food and Beverage Management, Food and Consumer Sciences, Food and Nutrition, Food Management, Home Economics, Hospitality Management, Housing, Human Ecology, Interior Merchandise Management, Merchandise Management, Nutrition Management, Nutrition, Public Nutrition, Settlement Management.
Health
Anatomical Pathology, Andrology, Audiology, Biokinetics, Biomedical Technology, Chiropractic, Clinical Microbiology & Infectious Diseases, Clinical Nursing, Clinical Pharmacology, Clinical Technology, Communication Pathology (Speech Language), Community Health, Community Nursing Science (Occupational Health, Primary Health Care), Critical Care and Trauma, Dietetics, Emergency Medical Care, Emergency Medicine, Environmental Health, Epidemiology, Facial and Oral
Surgery, Family Medicine, Gender and Health, Genetic Counselling, Gynaecology, Hand Rehabilitation, Hand Therapy, Health and Welfare Management, Health Care, Health Innovation, Health Professions Education Structure, Health Promotion, Health Sciences Education, Health Sciences, Health Studies, Homoeopathy, Human Molecular Biology, Human Movement Science, Infectious Diseases, Maternity and Child Nursing (Midwifery and Neonatal), Maternity Child Health,
Medical Administration, Medical and Surgical Nursing (Critical Care, Operating Room), Medical Anthropology, Medical Bioscience, Medical Criminalistics, Medical Immunology, Medical Information, Medical Science in Nutrition, Medical Sciences, Medical Virology, Medicine Specialisation in Critical Care, Medicine, Mental Health, Neuro Surgery, Neurology,
Nursing Education, Nursing Management, Nursing Science, Nursing, Nutrition, Obstetrics, Occupational and Environmental Health, Occupational Science, Occupational Therapy, Optometry, Orthopaedic Surgery, Orthopaedics, Otorhinolaryngology, Paediatrics and Child Health, Paediatrics, Pathology, Pharmaceutical Sciences, Pharmacology, Pharmacy Administration, Pharmacy, Physical Education, Physiotherapy, Podiatry, Professional Nursing Science (Ethos & Prof Practice, Nursing
Management, Nursing Education), Psychiatric Mental Health Nursing, Psychiatry, Public Health, Pulmonology, Quantitative Health Science, Radiation (Diagnostics, Therapy, Nuclear Medicine), Radiation Oncology, Radiography, Rehabilitation, Reproductive Biology, Somatology, Speech and Language Pathology, Speech Pathology, Sports Medicine, Surgery, Therapeutic Sciences.
Languages, Journalism and Communication
African Languages, African Linguistics, Afrikaans, Ancient Languages, Applied Language Studies, Applied Linguistics, Arabic, Audiovisual Communication, Augmentation and Alternative Communication, Business Communication, Communication, Communication Management, Communication Pathology, Communication Science, Communication
Studies, Contemporary English Studies, Corporate and Marketing Communication, Corporate Communication, Creative Writing, Development Communication, Document Design and Text Editing, English, European Literacy, French, Fundamental Communication, German, Greek, Integrated Marketing, Integrated Marketing Communication, Interactive
Media Design, International Communication, Interpreting, Isindebele, Isizulu, Italian, Journalism, Judaica, Language and Communication Afrikaans, Language Management, Language Practice, Language Studies, Language Technology, Latin, Lexicography, Linguistics, Literary Theory, Marketing Communication, Media Studies, Modern Hebrew, Multimedia, Nguni, Pan-African Literatures, Portuguese, Public Relations, Public Relations Management, Publishing Studies, Romance
Languages, Russian, Semitic Languages, Semitic Languages & Cultures, Sepedi, Sesotho, Sesotho Literature, Setswana, Sociolinguistics, South African Sign Language, Spanish, Strategic Communication, Teaching African Non Mother –Tongue, Theory of Literature, Translation, Translation Studies, Xhosa.

114 VitalStats 2014
Law
Administrative Law, Banking Law, Business Law, Child Care and Protection, Child Law, Civil Procedural Law, Commercial
and Business Law, Commercial Law, Company Law, Constitutional Law, Consumer Protection Law, Corporate Law, Criminal Justice, Criminal Law, Criminal Procedural Law, Criminology, Development and Management Law, Dispute Resolution, Drafting and Interpretation of Contracts, Environmental Law, Financial Planning Law, Foundations and Theory of Law, Human Rights and Constitutional Practice, Human Rights and Democratisation in Africa, Human Rights Law, Human Rights,
Indigenous Law, Information and Communication Law, Insolvency Law, Intellectual Property Law, International Commercial Law, International Economic Law, International Human Rights Law, International Law, International Trade and Investment Jurisprudence, International Trade Law, Interpretation of Statutes, Labour Law, Law in Africa, Law of Business Entities, Law of Contract, Law of Evidence, Maritime Law, Maritime Studies, Medical Law, Mercantile Law, Private International Law,
Private Law, Procedural Law, Property Law, Public Law, Reproductive and Sexual Rights, Roman Law, Shipping Law, Tax Law.
Medicine
Advanced Hepatology and Transplanting, Allergology, Anaesthesia, Anaesthesiology, Anaesthesiology, Anatomical
Pathology, Anaesthesia (Critical Care), Biomedical Forensic Science, Cardiothoracic Surgery, Chemical Pathology, Child and Adolescent Psychiatry, Clinical Pathology, Clinical Paediatric Surgery, Clinical Pharmacology, Community Dentistry, Community Health, Critical Care, Dental Surgery, Dermatology, Diagnostic Radiology, Emergency Medicine, Endocrinology
and Metabolism, Facial Surgery, Facial Surgery-Dentistry, Facial Surgery-Medicine, Family Medicine, Forensic Medicine, Forensic Pathology, Gastroenterology and Hepatology, General Surgery, Geriatrics, Haematological Pathology, Haematology, Immunology, Implantology, Internal Medicine, Medical Clinical Science in Transfusion, Medical Genetics, Medical Microbiology, Medical Oncology, Medical Virology, Medicine, Microbiology, Nephrology, Neurological Surgery,
Neurology, Neurosurgery, Nuclear Medicine, Obstetrics and Gynaecology, Occupational Medicine, Ophthalmology, Optometry, Oral Medicine, Oral Pathology, Orthodontics, Orthopaedic Surgery, Otorhinolaryngology, Paediatric Forensic Pathology, Paediatric Gastroenterology, Paediatric Surgery, Paediatrics Medical Genetics, Paediatrics Medical Oncology, Paediatrics, Periodontics, Plastic and Reconstructive Surgery, Plastic Surgery, Prosthodontics, Psychiatry, Public Health
Medicine, Public Health, Radiation Oncology, Radiological Diagnostics, Somatology, Sport Medicine, Surgery, Surgical Critical Care, Surgical Gastro Enterology, Thoracic Surgery, Trauma Surgery, Urology, Virological Pathology, Virology.
Psychology
Administration in Industrial Psychology, Applied Psychology, Autism Spectrum Disorders, Clinical Psychology, Community-
Based Counselling Psychology, Counselling Psychology, Educational Psychology, Group Therapy, Industrial and Organisational Psychology, Industrial Psychology, Medical Applied Psychology, Mental Health, Neuropsychology, Play Therapy, Psychology, Research Psychology.
Public Management and Services
Accounting for Public Sector, African Politics, Auditing for Public Sector, Business Administration, Community Police Management, Contact Centre Management, Correctional Services Management, Development Studies, Disaster Management, Entrepreneurship, Government Finances and Auditing, Industrial Psychology for the Public Sector,
International Politics, International Relations, Local Governance and Development, Municipal Administration, Penology, Police Science, Policing, Political Science for Public Sector, Public Administration Training Management, Public Administration, Public Economics, Public Labour Relations Management, Public Management and Governance, Public Management, Public Philosophy and Ethics, Public Policy, Public Sector Business Management, Public Sector Development
Management, Public Sector Economics, Public Sector Logistics, Public Sector Quantitative Management, Security Management, Security Risk Management, Security Studies, Traffic Safety Management, Transport Economics for Public Sector.
Science
Actuarial Sciences, Aerospace Medicine, Agriculture, Analytical Environmental Chemistry, Anatomy, Anatomical Sciences, Applied Geology, Applied Mathematics, Applied Mineralogy, Applied Radiation Science, Applied Science, Applied Sciences (Civil, Control, Industrial Systems, Mechanics, Mechanical, Metallurgy, Mining Environment, Urban), Applied Statistics, Aquatic Resource Management, Astronomy Education, Astronomy, Bio Diversity, Biochemistry, Bioinformatics, Biological
Systems, Biosystems, Biotechnology, Botany, Cartography, Cell Biology, Chemical Pathology, Chemical Science, Chemical Technology, Chemistry Education, Chemistry, Conservation Ecology and Planning, Corrosion, Earth Sciences, Electronics, Electrotechnics, Entomology, Environment and Society, Environmental Ecology, Environmental Economics, Environmental Education, Environmental Health, Environmental Management, Environmental Planning, Environmental Sciences,
Environmental Technology, Epidemiology, Exercise Science, Exploration, Explosives Technology, Extraction Metallurgy, Fire Technology, Forensic Investigations, Genetics, Geography, Geoinformatics, Geology, Geophysics, Geotechnics, Human Genetics, Human Physiology, Hydrogeology, Hydrology, Industrial Systems, Integrated Water Resource
Management, Irrigation, Life Science Education, Life Sciences, Mammalogy, Marine Coastal Management, Mathematical Science, Mathematical Statistics, Mathematical Technology, Mathematics Education, Mathematics of Finance, Mathematics, Mechanics, Medical Microbiology, Medical Nuclear Science, Medical Physics, Metallurgy, Meteorology, Microbiology and Plant Pathology, Microbiology, Mine Strata Control, Mineral Resource Management, Mining Environmental Control,
VitalStats 2014 115
Nanoscience, Nature Conservation, Oceanography, Operations Research, Petroleum Geology, Physical Science, Physics Education, Physics, Physiological Sciences, Physiology, Plant Biotechnology, Plant Pathology, Plant Physiology, Polymer
Technology, Project Management in Science, Quality Assurance and Reliability, Radiobiology, Renewable Energy, Reproductive Biology, Resource Allocation Biology, Science Education, Sport and Exercise Technology, Sports Science, Statistical Science, Statistics Education, Statistics, Structural Biology, Structural Materials, Structures, Systems and Conservation Evaluation, Technology Education, Technology Management, Transportation Planning, Water Care, Water
Resources, Water Utilisation, Zoology.
Social Science
Africa Studies, African Politics, African Studies, Ancient History, Ancient Languages and Cultures, Ancient Near Eastern Studies, Anthropology, Applied Ethics, Archaeology, Biblical Archaeology, Child and Youth Care, Classical Studies, Clinical
Practice Social Work, Community Development, Community Work, Cultural History, Cultural Management, Culture Studies, Demography (Course Work), Development Studies and Conflict Resolution, Diaconiology in Social Work, Diplomatic Studies, Diversity Studies, Employee Assistance Programmes, Environment and Society, Folklore Studies, Future Studies, Gender Studies, Governance and Political Transformation, Heritage and Cultural Management, Heritage and Museum Studies,
Heritage Studies, Historical Studies, History, HIV/AIDS Management, Human and Societal Dynamics, Industrial and Social Labour Studies, Industrial Sociology, Information Design (Course Work), Information Management, Information Science (Archival Science, Multimedia, Publishing), Information Science, Information Studies, Interdisciplinary Global Change
Studies, International Management, International Politics, International Relations, Islamic Studies, Judaica, Library and Information Studies, Library Science, Medical Science in Social Work, Medical Social Work, Migration and displacement, Moral and Cultural Studies, Philosophy, Policy and Development, Policy Studies, Political Policy Studies, Political Science, Politics, Population Studies, Rural Development, Social and Behaviour Studies, Social Behaviour Studies In HIV / AIDS,
Social Development and Planning, Social Development and Policy, Social Health Care, Social Impact Assessment, Social Policy, Social Research, Social Science (Mental Health, Criminology, Clinical), Social Work (Play Therapy), Social Work Management, Social Work Welfare Policy, Social Work, Sociology, Strategic Studies, Workplace Ethics.
Theology
Applied Theology, Biblical Studies, Christian Spirituality, Church History, Church Ministry, Diaconiology in Missionary, Diaconiology in Play Therapy, Diaconiology in Youth Work, Divinity, Dogmatics and Christian Ethics, Missiology, New Testament Studies, Old Testament Studies, Pastoral Family Therapy, Practical Theology, Religious Studies, Science of Religion and Missiology, Systematic Theology, Theological Ethics, Theology, Youth Ministry.
Veterinary Science
Anaesthesiology, Bovine Medicine, Cattle Herd Health, Clinical Laboratory Diagnostics, Companion Animal Clinical Studies, Diagnostic Imaging, Equine Medicine, Equine Surgery, Laboratory Animal Science, Ophthalmology, Paraclinical Studies, Pathology, Pharmacology, Pig Herd Health, Poultry Diseases, Production Animal Studies, Small Animal Medicine, Small
Animal Surgery, Small Stock Herd Health, Theriogenology, Toxicology, Veterinary Ethology, Veterinary Industrial Pharmacology, Veterinary Public Health, Veterinary Technology, Veterinary Tropical Diseases, Wildlife Diseases.
Doctoral degrees
Agriculture
Agrarian Extension, Agribusiness Management, Agricultural Economics, Agricultural Management, Agriculture, Agronomy, Animal Production Management, Animal Production, Crop Protection, Food Science, Food Technology, Forestry, Game Ranch Management, Horticultural Science, Land-Use Planning, Mechanized Agriculture, Ornamental Horticulture, Pasture
Science, Plant Biotechnology, Plant Nutrition, Plant Production, Plant Protection, Plant Quarantine, Soil Science, Weed Science, Wildlife Management.
Architecture and Built Environment
Architectural Technology, Architecture, Building, Construction Economics, Construction Management, Land and Property Development, Landscape Architecture, Quantity Surveying, Town and Regional Planning, Urban and Regional Planning.
Arts and Fine Arts
Ceramics Technology, Dance, Design, Digital Arts, Drama, Fashion, Film and Television, Film Studies, Fine Arts, Graphic
Design, History of Art, Interior Design, Literature and Philosophy in Art History, Literature and Philosophy in Musicology, Motion Picture Production, Music, Musicology, Performing Arts Technology, Photography.

116 VitalStats 2014
Business and Management Sciences
Accounting Sciences, Accounting, Adventure Tourism Management, Auditing, Business Administration, Business
Information Systems, Business Leadership, Business Management, Business, Commerce, Cost and Management Accounting, Development Studies, Econometrics, Economic Sciences, Economics, Entrepreneurship, Environmental Business Management, Financial Management Sciences, Food and Beverage Management, Food Service Management, Human Resources Management, Insurance Science, Internal Auditing, Labour Relations Management, Logistics, Marketing
Management, Marketing, Office Management and Technology, Operations Management, Operations Research, Organisational Behaviour, Organisational Leadership, Personnel Leadership, Production Management, Project Management, Public Affairs, Quantitative Management, Real Estate, Recreation and Sport Management, Rural Development and Ecotourism, Statistics, Taxation, Tourism and Hospitality Management, Tourism Management, Transport Economics.
Computer Science, Information Technology and Information Sciences
Computer Science, Computer Systems, Informatics, Information Systems, Information Technology, Knowledge Management.
Dentistry
Dental Technology, Dentistry, Odontology Sciences, Orthodontics.
Education
Adult and Community Education and Training, Adult Education, Assessment and Quality Assurance, Comparative Education, Computer Assisted Education, Computer-Integrated Education, Curriculum and Instructional Design and Development,
Curriculum Studies, Didactic Pedagogics, Didactics, Education Management, Education Policy Studies, Education, Educational Guidance and Counselling, Educational Law and Policy, History of Education, Inclusive Education, Learning Support Guidance and Counselling, Mathematics Education, Maximising Potential in Education and Training, Orthodidactics,
Orthopedagogics, Philosophy of Education, Preschool Pedagogics, Psychology of Education, Science Education, Socio-pedagogics, Tertiary Didactics.
Engineering
Agricultural Engineering, Chemical Engineering, Civil Engineering, Computer Engineering, Electrical Engineering, Electronic
Engineering, Engineering and Environment Geology, Engineering Management, Engineering Technology, Engineering, Environmental Engineering, Industrial Engineering, Mechanical Engineering, Metallurgical Engineering, Mining Engineering, Quality, Rural Engineering Technology, Technology Management, Transportation Engineering, Water Utilisation Engineering.
Family Ecology and Consumer Sciences
Clothing Management, Consumer Science Development, Food and Nutrition, Food Management, International Merchandise Management, Nutrition, Settlement Studies, Textile Design and Technology.
Health
Anaesthesia, Audiology, Biomedical Technology, Clinical Technology, Community Health, Diagnostic Radiology, Dietetics, Emergency Medical Care, Environmental Health, Epidemiology, Health Professions Education, Health Sciences, Health Systems, Homoeopathy, Human Movement Science, Literature and Philosophy in Health Studies, Medical Microbiology, Medical Physics, Medical Science, Medical Virology, Nursing Sciences, Occupational Therapy, Optometry, Pharmaceutical
Sciences, Pharmacology, Pharmacy, Philosophy in Nursing, Physiotherapy, Public Health, Radiography, Radiological Diagnostics, Radiological Therapy, Somatology, Therapeutic Sciences.
Languages, Journalism and Communication
African Languages, Afrikaans, Applied Languages, Arabic, Augmentative and Alternative Communication, Business Communication, Communication Management, Communication, English, French, German, Greek, International Communication, Interpreting and Translation, Italian, Journalism, Language Practice, Language Studies, Latin, Linguistics, Literary Theory, Literature and Philosophy, Literature, Media Studies, Modern Hebrew, Portuguese, Public Relations
Management, Publishing, Russian, Semitic Languages, Sesotho, Spanish, Strategic Communication.
Law
Bioethics and Health Law, Company Law, Criminal Law, Human Rights, Jurisprudence, Law, Legal History, Mercantile Law, Private Law, Procedural Law, Public Law.
VitalStats 2014 117
Medicine
Aerospace Medicine, Anaesthesia, Anaesthesiology, Anatomical Pathology, Chemical Microbiology and Infectious
Deceases, Chemical Pathology, Communication Pathology, Dermatology, Diagnostic Radiology, Epidemiology, Family Medicine, Family Practice, Forensic Medicine, Forensic Pathology, Geriatrics, Haematology and Molecular Medicine, Haematology, Human Genetics, Immunology, Internal Medicine, Medical Immunology, Medical Nuclear Science, Medical Oncology, Medical Science, Medicine, Neurology, Neurosurgery, Obstetrics and Gynaecology, Ophthalmology, Orthopaedic
Surgery, Otorhinolaryngology, Paediatrics, Pathology, Plastic and Reconstructive Surgery, Psychiatry, Radiation Oncology, Reproduction and HIV, Sports Medicine, Surgery, Thoracic Surgery, Urology, Virology.
Psychology
Clinical Psychology, Consulting Psychology, Educational Psychology, Industrial and Organisational Psychology, Psychology,
Psychotherapy.
Public Management and Services
Administration, African Politics, Business Economics, Business Management, Contact Centre Management, Criminology, Development Studies, Economics, Governance and Political Transformation, International Politics, International Relations,
Labour Relations Management, Land Development, Municipal Administration, Penology, Police Science, Policing, Political Science, Public Administration, Public Management, Public Policy and Development Management, Public Relations Management, Public Sector Accounting, Public Sector Auditing, Public Sector Statistics, Quantitative Management, Rural
Development Planning, Tourism Management, Transport Economics.
Science
Actuarial Science, Agriculture, Anatomical Sciences, Anatomy, Animal Plant and Environmental Sciences, Animal Sciences, Applied Mathematics, Applied Statistics, Astronomy, Bio Systems, Biochemistry, Bioinformatics, Bio-Statistics,
Biotechnology, Botany, Chemical Technology, Chemistry, Computational and Applied Mathematics, Electricity, Electronics, Engineering Geology, Entomology, Environmental Ecology, Environmental Economics, Environmental Education, Environmental Management, Environmental Sciences, Environmental Studies, Environmental Technology, Exploration Geophysics, Explosives Technology, Extraction Metallurgy, Genetics, Geo informatics, Geography Archaeology and
Environmental Studies, Geography, Geology, Geosciences, Human Physiology, Hydrogeology, Life Sciences, Mathematical Sciences, Mathematical Statistics, Mathematics, Mechanics, Metallurgy and Materials, Metallurgy, Meteorology, Microbiology and Plant Pathology, Microbiology, Mining, Molecular and Cell Biology, Nature Conservation, Physiology, Plant Breeding, Plant Pathology, Plant Physiology, Polymer Technology, Reproductive Biology (Andrology), Reproductive Biology,
Science, Physics, Sport and Exercise Technology, Sport Science, Statistics and Actuarial Science, Statistics, Sustainable Ecological Management, Sustainable Insect Management, Technology Management, Technology, Water Care, Water Resource Management, Water Utilisation, Zoology.
Social Science
African Politics, African Studies, Ancient History, Anthropology, Archaeology, Astronomy, Classical Studies, Cultural History, Culture Studies, Environment and Society, Folklore Studies, Gender Studies, Heritage and Museum Studies, History of Ancient Culture, History, Humanities, Information Design, Information Science, International Politics, International Relations,
Library and Information Studies, Library Science, Near Eastern Studies, Philosophy, Political Science, Politics, Social Development, Social Science, Social Work, Sociology.
Theology
Biblical and Religious Studies, Biblical Studies, Christian Ethics, Christian Spirituality, Church History, Diaconiology in
Missionary, Diaconiology in Play Therapy, Diaconiology in Social Work, Diaconiology in Youth Work, Divinity, Judaica, Missiology, Modern Hebrew, New Testament Studies, Old Testament Studies, Old Testament, Pastoral Family Care, Practical Theology, Religious Studies, Science of Religion and Missiology, Science of Religious and Missiology Studies, Systematic Theology and Ethics, Systematic Theology, Theological Ethics, Theology, Youth Ministry.
Veterinary Science
Animal Clinical Studies, Paraclinical Sciences, Production Animal Studies, Veterinary Technology, Veterinary Tropical Diseases.
118 VitalStats 2014
Appendix 4:
Table of Figures Figure 1: Headcount enrolments by race from 2009 to 2014* ........................................................................ 3 Figure 2: Headcount enrolments by gender from 2009 to 2014 ...................................................................... 3 Figure 3: Headcount enrolments as a proportional comparison to population headcount by race from 2009
to 2014 .............................................................................................................................................. 4 Figure 4: Headcount enrolments as a proportional comparison to population headcount by gender from
2009 to 2014 ..................................................................................................................................... 4 Figure 5: Participation rates by race from 2009 to 2014 .................................................................................. 5 Figure 6: Participation rates by gender from 2009 to 2014 ............................................................................. 5 Figure 7: Headcount enrolments by age group from 2009 to 2014 ................................................................. 6 Figure 8: Headcount graduates by age group from 2009 to 2014 ................................................................... 6 Figure 9: Headcount enrolments of all non-South African students from 2009 to 2014 ................................. 7 Figure 10: Headcount graduates of all non-South African students from 2009 to 2014.................................... 7 Figure 11: Headcount enrolments by mode of delivery from 2009 to 2014 ...................................................... 8 Figure 12: Headcount graduates by mode of delivery from 2009 to 2014 ........................................................ 8 Figure 13: Headcount enrolments by mode of delivery and race for 2009 and 2014 ........................................ 9 Figure 14: Headcount enrolments by mode of delivery and gender for 2009 and 2014 ................................... 9 Figure 15: Headcount graduates by mode of delivery and race for 2009 and 2014 ........................................ 10 Figure 16: Headcount graduates by mode of delivery and gender for 2009 and 2014 .................................... 10 Figure 17: Course success rates by race from 2009 to 2014 ............................................................................ 11 Figure 18: Course success rates by gender from 2009 to 2014 ........................................................................ 11 Figure 19: Course success rates by qualification level from 2009 to 2014 ....................................................... 12 Figure 20: Course success rates per qualification level by race from 2009 to 2014......................................... 12 Figure 21: Course success rates per qualification level by gender from 2009 to 2014 .................................... 13 Figure 22: Headcount enrolments by qualification level from 2009 to 2014* ................................................. 17 Figure 23: Headcount undergraduate enrolments by qualification type from 2009 to 2014 .......................... 17 Figure 24: Headcount undergraduate enrolments by race for 2009 and 2014 ................................................ 18 Figure 25: Headcount undergraduate enrolments by gender for 2009 and 2014 ........................................... 18 Figure 26: Headcount of undergraduate qualifications awarded by race for 2009 and 2014 .......................... 19 Figure 27: Headcount of undergraduate qualifications awarded by gender for 2009 and 2014 ..................... 19 Figure 28: Headcount of postgraduate enrolments by race for 2009 and 2014 .............................................. 20 Figure 29: Headcount of postgraduate enrolments by gender for 2009 and 2014 .......................................... 20 Figure 30: Headcount of postgraduate qualifications awarded by race for 2009 and 2014 ............................ 21 Figure 31: Headcount of postgraduate qualifications awarded by gender for 2009 and 2014 ........................ 21 Figure 32: Headcount doctoral graduates by nationality grouping from 2009 to 2014 ................................... 22 Figure 33: Headcount doctoral graduates by age grouping from 2009 to 2014 .............................................. 22 Figure 34: Headcount enrolments by field of study from 2009 to 2014* ........................................................ 25 Figure 35: Headcount enrolments by field of study and mode of delivery for 2009 and 2014 ........................ 25 Figure 36: Headcount enrolments by field of study and race for 2009 and 2014 ............................................ 26 Figure 37: Headcount enrolments by field of study and gender for 2009 and 2014 ....................................... 26 Figure 38: Headcount graduates by field of study and race for 2009 and 2014 .............................................. 27 Figure 39: Headcount graduates by field of study and gender for 2009 and 2014 .......................................... 27 Figure 40: Course success rate by CESM* for 2014 .......................................................................................... 28 Figure 41: FTE enrolled and completed figures per CESM category for 2014 .................................................. 28 Figure 42: Course success rate by field of study from 2009 to 2014 ................................................................ 29 Figure 43: FTE enrolments by field of study from 2009 to 2014 ...................................................................... 29 Figure 44: FTE completed by field of study from 2009 to 2014 ....................................................................... 30 Figure 45: Headcount enrolments by institutional type from 2009 to 2014* .................................................. 33 Figure 46: Headcount enrolments by institutional type and race for 2009 and 2014 ..................................... 33 Figure 47: Headcount enrolments by institutional type and gender for 2009 and 2014 ................................. 34 Figure 48: Headcount enrolments by institutional type and qualification level for 2009 and 2014 ................ 34
VitalStats 2014 119
Figure 49: Headcount enrolments by institutional type and undergraduate qualifications for 2009 and 2014 ........................................................................................................................................................ 35
Figure 50: Headcount enrolments by institutional type and postgraduate qualifications for 2009 and 2014. 35 Figure 51: Headcount graduates by institutional type from 2009 to 2014 ...................................................... 36 Figure 52: Headcount enrolments at Universities of Technology from 2009 to 2014 ..................................... 36 Figure 53: Headcount enrolments at traditional Universities from 2009 to 2014 ........................................... 37 Figure 54: Headcount enrolments at Comprehensive Universities from 2009 to 2014 (excluding UNISA) ..... 38 Figure 55: Headcount enrolments at UNISA from 2009 to 2014 ..................................................................... 38 Figure 56: Headcount permanent vs temporary staff members from 2009 to 2014 ....................................... 41 Figure 57: Proportion of permanent vs temporary staff members from 2009 to 2014 ................................... 41 Figure 58: Headcount overall staff members by race from 2009 to 2014 ....................................................... 42 Figure 59: Headcount overall staff by gender for 2009 and 2014 .................................................................... 42 Figure 60: Headcount overall staff members by race and employment status for 2009 and 2014 ................. 43 Figure 61: Headcount staff in selected personnel categories by race for 2009 and 2014 ............................... 43 Figure 62: Headcount senior management staff by employment status from 2009 to 2014 .......................... 44 Figure 63: Proportion of permanent vs temporary senior management staff from 2009 to 2014 .................. 44 Figure 64: Headcount senior management staff members by race from 2009 to 2014 .................................. 45 Figure 65: Headcount senior management staff members by gender from 2009 to 2014 .............................. 45 Figure 66: Headcount senior management staff members by race and employment status for 2009 and 2014
........................................................................................................................................................ 46 Figure 67: Headcount academic staff members by employment status from 2009 to 2014 ........................... 46 Figure 68: Proportion of permanent vs temporary academic staff members from 2009 to 2014 ................... 47 Figure 69: Headcount academic staff members by race from 2009 to 2014 ................................................... 47 Figure 70: Headcount academic staff members by gender from 2009 to 2014 ............................................... 48 Figure 71: Headcount academic staff members by race and employment status for 2009 and 2014 ............. 48 Figure 72: Headcount academic staff by race and qualification level for 2009 and 2014 ................................ 49 Figure 73: Headcount permanent academic staff by gender and qualification level for 2009 and 2014 ........ 49 Figure 74: Headcount permanent academic staff by race and qualification level for 2009 and 2014 ............. 50 Figure 75: Headcount permanent academic staff by gender and qualification level for 2009 and 2014 ........ 50 Figure 76: Headcount academic staff members by age grouping from 2009 to 2014 ..................................... 51 Figure 77: Headcount permanent academic staff members by age grouping from 2009 to 2014 .................. 51 Figure 78: Headcount administrative staff members by employment status from 2009 to 2014 ................... 52 Figure 79: Proportion of permanent vs temporary administrative staff members from 2009 to 2014 ........... 52 Figure 80: Headcount administrative staff members by race from 2009 to 2014 ........................................... 53 Figure 81: Headcount administrative staff members by gender from 2009 to 2014 ....................................... 53 Figure 82: Headcount administrative staff members by race and employment status for 2009 and 2014 ..... 54 Figure 83: Headcount service staff members by employment status from 2009 to 2014 ............................... 54 Figure 84: Proportion of permanent vs temporary service staff members from 2009 to 2014 ....................... 55 Figure 85: Headcount service staff members by race from 2009 to 2014 ....................................................... 55 Figure 86: Headcount service staff members by gender from 2009 to 2014 ................................................... 56 Figure 87: Headcount service staff members by race and employment status for 2009 and 2014 ................. 56 Figure 88: FTE Student: Staff ratio from 2009 to 2014..................................................................................... 57 Figure 89: Headcount Student: Staff ratio for permanent and temporary academic staff together and
permanent academic staff only from 2009 to 2014 ....................................................................... 57 Figure 90: FTE Student: Staff ratio by field of study from 2009 to 2014 .......................................................... 58 Figure 91: Throughput rates for 360-credit diplomas with first year of enrolment in 2009 (excluding UNISA)
........................................................................................................................................................ 61 Figure 92: Throughput rates by race for 360-credit diplomas with first year of enrolment in 2009 (excluding
UNISA) - non-accumulative ............................................................................................................. 61 Figure 93: Throughput rates by race for 360-credit diplomas with first year of enrolment in 2009 (excluding
UNISA) – accumulative ................................................................................................................... 62 Figure 94: Throughput rates for 3-year degrees with first year of enrolment in 2009 (excluding UNISA) ....... 62 Figure 95: Throughput rates by race for 3-year degrees with first year of enrolment in 2009 (excluding
UNISA) - non-accumulative ............................................................................................................. 63

120 VitalStats 2014
Figure 96: Throughput rates by race for 3-year degrees with first year of enrolment in 2009 (excluding UNISA) – accumulative ................................................................................................................... 63
Figure 97: Throughput rates for 4-year degrees with first year of enrolment in 2009 (excluding UNISA) ....... 64 Figure 98: Throughput rates by race for 4-year degrees with first year of enrolment in 2009 (excluding
UNISA) - non-accumulative ............................................................................................................. 64 Figure 99: Throughput rates by race for 4-year degrees with first year of enrolment in 2009 (excluding
UNISA) – accumulative ................................................................................................................... 65 Figure 100: Percentage of the 2009 cohort doing 360-credit diplomas that graduated in 6 years i.e. by 2014*
........................................................................................................................................................ 65 Figure 101: Headcount of the 2009 cohort doing 360-credit diplomas that graduated in 6 years i.e. by 2014 . 66 Figure 102: Throughput rates for 360-credit diplomas (Business & Management Sciences) with first year of
enrolment in 2009 (excluding UNISA) ............................................................................................. 66 Figure 103: Throughput rates for 360-credit diplomas (Engineering) with first year of enrolment in 2009
(excluding UNISA) ........................................................................................................................... 67 Figure 104: Throughput rates for 360-credit diplomas (Public Management & Services) with first year of
enrolment in 2009 (excluding UNISA) ............................................................................................. 67 Figure 105: Throughput rates for 360-credit diplomas (Computer Science, Information Technology &
Information Systems) with first year of enrolment in 2009 (excluding UNISA) .............................. 68 Figure 106: Throughput rates for 360-credit diplomas (Health) with first year of enrolment in 2009 (excluding
UNISA)............................................................................................................................................. 68 Figure 107: Throughput rates for 360-credit diplomas (Science) with first year of enrolment in 2009 (excluding
UNISA)............................................................................................................................................. 69 Figure 108: Percentage of the 2009 cohort doing a 3-year degree that graduated in 6 years i.e. by 2014 ....... 69 Figure 109: Headcount of the 2009 cohort doing a 3-year degree that graduated in 6 years i.e. by 2014 ........ 70 Figure 110: Throughput rates for 3-year degrees (Business & Management Sciences) with first year of
enrolment in 2009 (excluding UNISA) ............................................................................................. 70 Figure 111: Throughput rates for 3-year degrees (Science) with first year of enrolment in 2009 (excluding
UNISA)............................................................................................................................................. 71 Figure 112: Throughput rates for 3-year degrees (Arts and Fine Arts) with first year of enrolment in 2009
(excluding UNISA) ........................................................................................................................... 71 Figure 113: Throughput rates for 3-year degrees (Social Science) with first year of enrolment in 2009
(excluding UNISA) ........................................................................................................................... 72 Figure 114: Throughput rates for 3-year degrees (Language, Journalism & Communication) with first year of
enrolment in 2009 (excluding UNISA) ............................................................................................. 72 Figure 115: Percentage of the 2009 cohort doing 4-year degrees that graduated in 6 years i.e. by 2014 ........ 73 Figure 116: Headcount of the 2009 cohort doing 4-year degrees that graduated in 6 years i.e. by 2014 ......... 73 Figure 117: Throughput rates for 4-year degrees (Business & Management Science) with first year of
enrolment in 2009 (excluding UNISA) ............................................................................................. 74 Figure 118: Throughput rates for 4-year degrees (Education) with first year of enrolment in 2009 (excluding
UNISA)............................................................................................................................................. 74 Figure 119: Throughput rates for 4-year degrees (Engineering) with first year of enrolment in 2009 (excluding
UNISA)............................................................................................................................................. 75 Figure 120: Throughput rates for 4-year degrees (Health) with first year of enrolment in 2009 (excluding
UNISA)............................................................................................................................................. 75 Figure 121: Throughput rates for 4-year degrees (Law) with first year of enrolment in 2009 (excluding UNISA)
........................................................................................................................................................ 76 Figure 122: Throughput rates for 4-year degrees (Social Sciences) with first year of enrolment in 2009
(excluding UNISA) ........................................................................................................................... 76 Figure 123: Throughput within regulation time up to n+2 years for 360-credit diplomas, 3-year degrees, 4-year
degrees and weighted national rate with first enrolment in 2009 (excluding UNISA) ................... 77 Figure 124: Non-accumulative throughput comparisons of 2007, 2008 and 2009 cohorts finishing within
regulation time up to n+2 years for 360-credit diplomas, 3-year degrees, 4-year degrees and weighted national rate (excluding UNISA) ...................................................................................... 77
VitalStats 2014 121
Figure 125: Accumulative throughput comparison of 2007, 2008 and 2009 cohorts finishing within regulation time up to n+2 years for 3-year diplomas, 3-year degrees, 4-year degrees and weighted national rate (excluding UNISA) .................................................................................................................... 78
Figure 126: Throughput comparison of 2007, 2008 and 2009 cohorts from regulation time up to n+3 years for 360-credit diplomas (excluding UNISA) .......................................................................................... 78
Figure 127: Throughput comparison of 2007, 2008 and 2009 cohorts from regulation time up to n+3 years for 3-year degrees (excluding UNISA) .................................................................................................. 79
Figure 128: Throughput comparison of 2007, 2008 and 2009 cohorts from regulation time up to n+2 years for 4-year degrees (excluding UNISA) .................................................................................................. 79
Figure 129: Throughput rates at UNISA for 360-credit diplomas with first year of enrolment in 2007 ............. 80 Figure 130: Throughput rates at UNISA for 3-year degrees with first year of enrolment in 2007 ..................... 80 Figure 131: Throughput rates at UNISA for 4-year degrees with first year of enrolment in 2007 ..................... 81 Figure 132: Throughput rates for postgraduate diplomas or certificates with first year of enrolment in 2009
(excluding UNISA) ........................................................................................................................... 81 Figure 133: Percentage of the 2009 cohort doing postgraduate diplomas or certificates that graduated in 3
years i.e. by 2011 (excluding UNISA) .............................................................................................. 82 Figure 134: Headcount of the 2009 cohort doing postgraduate diplomas or certificates that graduated in 3
years i.e. by 2011 (excluding UNISA) .............................................................................................. 82 Figure 135: Percentage of the 2009 cohort doing Honours that graduated in 3 years i.e. by 2011 .................. 83 Figure 136: Headcount of the 2009 cohort doing Honours that graduated in 3 years i.e. by 2011 ................... 83 Figure 137: Throughput rates for Honours with first year of enrolment in 2009 (excluding UNISA) ................. 84 Figure 138: Throughput rates for coursework Masters with first year of enrolment in 2009 (excluding UNISA)
........................................................................................................................................................ 84 Figure 139: Percentage of the 2009 cohort doing coursework Masters that graduated in 4 years i.e. by 2012 85 Figure 140: Headcount of the 2009 cohort doing coursework Masters that graduated in 4 years i.e. by 2012 85 Figure 141: Percentage of the 2009 cohort doing research Masters that graduated in 4 years i.e. by 2012 .... 86 Figure 142: Headcount of the 2009 cohort doing research Masters that graduated in 4 years i.e. by 2012 ..... 86 Figure 143: Throughput rates for research Masters with first year of enrolment in 2009 (excluding UNISA) ... 87 Figure 144: Throughput rates for Doctoral degrees with first year of enrolment in 2009 (excluding UNISA) ... 87 Figure 145: Percentage of the 2009 cohort doing Doctoral degrees that graduated in 6 years i.e. by 2014 ..... 88 Figure 146: Headcount of the 2009 cohort doing Doctoral degrees that graduated in 6 years i.e. by 2014 ..... 88 Figure 147: Funding allocated to universities in real and nominal terms for 2009/10 to 2014/15* .................. 91 Figure 148: Funding allocated to universities as a percentage of GDP and of state budget respectively from
2009/10 to 2014/15 ........................................................................................................................ 91 Figure 149: Proportion of block to earmarked funding (including NSFAS allocation) from 2009/10 to 2014/15*
........................................................................................................................................................ 92 Figure 150: Proportion of block to earmarked funding (excluding NSFAS allocation) from 2009/10 to 2014/15
........................................................................................................................................................ 92 Figure 151: Disaggregated funding for NSFAS, teaching grants, research grants and other grants from 2009/10
to 2014/15* .................................................................................................................................... 93 Figure 152: NSFAS funding for university students from 2009/10 to 2014/15 .................................................. 93 Figure 153: Average full cost of study showing the percentage cost of tuition from 2009 to 2014* ................ 94 Figure 154: Proportional disaggregation of institutional funding per source from 2009/10 to 2014/15 .......... 94 Figure 155: Proportion of institutional funding per source and institution 2014* ............................................ 95 Figure 156: Proportion of institutional funding per source and institutional type 2014 ................................... 95 Figure 157: Research output units by publication type from 2009 to 2014 ....................................................... 96 Figure 158: Value of the research output and research development unit from 2009/10 to 2014/15** ......... 96 Figure 159: Percentage research output units (all publication types) by broad field from 2010 to 2014* ........ 97 Figure 160: Percentage research output units (all publication types) by CESM for 2014* ................................ 97 Figure 161: Research output units per capita by institution for 2009 and 2014* .............................................. 98