Embed Size (px)
Citation preview

Council Report #2016-99
Budget and 10 Year Financial Plan
Prepared by: Glenn Dees, Director of Finance/Treasurer Reviewed by: Jennifer Moore, Chief Administrative Officer Approved by: Jennifer Moore, Chief Administrative Officer Plan: The proposed budget is fully aligned with all four strategic pillars identified in the County’s strategic plan.
December 14, 2016
Recommendation “Now Therefore Be it Resolved That the 2017 Draft Budget and 10 Year Financial Plan Report be received for information.”
Purpose This report provides an overview of the 2017 budget. It also summarizes a 10 year long term financial forecast, key financial trends including reserve, and debt projections. Background and Discussion Budget Process and Schedule The County budget process commenced this year on June 16th subsequent to staff receiving Council approval for a target base levy increase of 2.0% for the 2017 budget year and within the long term financial planning model. In addition to the base levy, the dedicated infrastructure levy will increase by 0.3%. The approval for a target levy increase provided Finance staff the direction to commence drafting budgets with all departments based on a known expectation from Council. Kicking off the budgetary cycle in June facilitates enough time for a December presentation with sufficient opportunities for review and discussion among staff, management and Council. The timing will allow early tendering of projects and purchases and ideally provide more advantageous pricing. This also allows 2017 initiatives to move forward with funding in place and demonstrates ongoing improvements in the budget process and long term planning. The 2017 draft budget proposes an annual increase of 1.90% which is slightly less than the

2.0% target. Staff are recommending that the savings realized from the proposed 2017 budget increase vs the target be redirected into the dedicated infrastructure levy recognizing identified needs under the long-term capital plan. The 2018-2026 long term financial plan is built on annual levy increases of 2.0% after assessment growth. This is the 7th consecutive year with a stable levy increase after more than a decade of volatility in the County tax rates. This year’s draft budget process continued to focus on long term financial needs and challenges within the model as opposed to just the current budget year in isolation. The long term model also ensures stable modest increases over the long term. Beginning in 2012, staff developed a 10 year, long term financial plan for each County department under the Long Term Financial Planning Framework. The long term plan includes operating revenues and expenditures as well as capital. It projects levy impacts as well as the changes to debt levels and reserves over that 10 year period. This is becoming common practice among municipalities with many going as far as formally adopting multi-year budgets aligned with the term of Council. The 2017 budget includes an additional nine years of projections through 2026. Staff revise the forecast each year to include changes in Provincial funding, refining estimates based on new information, prioritizing projects, adding the details of recently approved master plans, and using reserves to achieve a stable annual levy increase. This year the long term plan continues to specifically earmark levy dollars dedicated to capital throughout the 10 years as was introduced and adopted within the model commencing with the 2016 budget. Council provided staff with direction to target a dedicated infrastructure levy based on 1.0% of the 2016 capital budget with a 0.5% escalation factor in each year of the 2018-2026 long term forecast based on the prior year capital budget. The draft 2017 budget and long term financial plan is aligned with the County’s Strategic Plan 2015 - 2019, approved September 16, 2015. The existing strategic plan identifies four strategic pillars:
1. Economic Innovation and Prosperity 2. Sustainable Infrastructure and Services 3. Thriving & Inclusive Communities 4. Organizational Excellence
The draft budget funds the continuation of all current programs and services although some specific programs will see minor modifications that are the result of changes to Provincial subsidies and/or program guidelines and legislation as well as a continual drive to ensure the best value for the programs delivered by the County. It also identifies financial resources to advance initiatives identified in the strategic plan such as plans to promote economic innovation and prosperity. Each department has prepared business plans and issue papers that clearly map their plans and projects to the corporate strategic plan. The detailed business plans will be available to the public on the County website, or in printed copy upon request, in December 2016 immediately following the budget presentation to Council. Preliminary budgets were developed by each division in July/August 2016 and then reviewed with Department Coordinators (2 Councillors) at the monthly meetings in September and October. The budget was consolidated by the Finance department who worked closely with each division and Department Coordinators to make adjustments, find efficiencies and meet the general targets set in the previously endorsed 10 year plan. Staff have worked to bring the draft budget to Council as early as possible to ensure 2017 projects can be started early in the new year.

Long Term Financial Planning Framework Recognizing needs primarily under the Sustainable Infrastructure and Services strategic pillar, County staff annually prepare a ten year financial planning model in accordance with methodologies derived under an adopted Long Term Financial Planning Framework (LTFPF). The County has adopted a financial strategy within this framework that is focused on long term needs and challenges as opposed to focusing solely on the current budget year levy impact. In order to ensure consistent and modest levy increases over time, this framework adopts a philosophy of establishing a targeted annual increase within the current year budget and the nine year forecast. In prior years the County experienced significant volatility in annual levy decreases/increases. Since adopting the LTFPF the County has realized stable annual levy increases and this approach carries forward within the long term financial model as displayed below:
This chart helps to display how each year is interlinked and how decisions focusing on the short term can impact on future years. In the ‘90’s the County experienced levy rate reductions and then in subsequent years implemented significant increases trying to rebuild operating and capital budgets particularly in light of Provincial downloads. In conjunction with this, reserves were depleted as a means for financing routine capital items and in some instances projects were completed and recorded as unfinanced capital within the Financial Statements. Working capital was minimal and the operating line of credit was frequently utilized to maintain cash flow requirements.

Prudent long term focused planning under the existing framework allows for improved financial positioning by building upon reserves. Minimization of debt servicing costs is achieved with the issuing of debt for only larger non-routine capital projects. Striving towards a more sustainable financial model, escalation of annual capital budgets is a key priority. The County continues to work towards addressing the infrastructure deficit. Much of the infrastructure the County owns was downloaded from the Province in the form of roads, bridges and social housing. In many instances this infrastructure is nearing the end of useful life and is inefficient and costly to operate and maintain. The current asset management plan indicates that the County should be spending $27.4M per annum on infrastructure; however, the long term model anticipates spending significantly below this threshold even though major capital projects such as the GPL rebuild and Trent River Crossing are included within the current financial plan. In 2016, the County introduced a dedicated infrastructure levy. Even with the implementation of this special purpose levy, infrastructure spending is only marginally gaining ground relative to the asset management plan. The index used for the base levy increase in the current model is based on 2.0% as approved by Council; whereas, prior models had been assumed at 2.5%. When establishing the index it is important that this be aligned with actual economic factors that impact on municipal spending and are representative of the types of expenditures incurred. Under the LTFPF the index utilized in the model is reviewed annually. The Consumer Price Index (CPI) is a measure that is often suggested for municipal budgeting and forecasting. However, this is not necessarily indicative of the composition of spending incurred by most municipalities depending upon geographic location and the types of services provided. A significant proportion of County expenditures are related to capital and external services which can be more accurately predicted based on Construction Price Indexes. These indexes reflect the changes in costs for construction materials and skilled and unskilled labour. Also of significant proportions within the composition of costs for the County are salaries/wages and benefits, utilities and insurance. The weighting of these expenditures as comprised within the overall County budget must be considered in deriving a realistic targeted increase under the LTFPF.
Levy increases that are set below a reasonable index level in the long term model ultimately result in deferral of capital items, increases to the infrastructure deficit and a further aged asset base leading to increased maintenance costs. Sustained periods of time with insufficient levy increases will likely impact on future years’ service level standards and ultimately limit future flexibility for financing larger projects resulting in increased debt servicing costs.
The LTFPF provides for ease of budgeting in that subsequent budget years are already populated in detail with capital items identified. The further out in the forecast the greater the level of uncertainty with assumptions that are established at a high level for items such as projected capital costs, interest rates, etc. However, in the short term, assumptions and capital items are more accurately identified and provide for an “off the shelf” budget for the subsequent budget year.
2017 Budget Overview and Economic Outlook

The 2017 draft budget proposes a 1.9% base levy increase which is less than the target approved by Council and less than the 2.5% increase for the year that was embedded within the previous long term planning model. This proposed increase is only slightly above the annual inflation rate of 1.5% as reported by Statistics Canada for the month of October 2016 and is slightly less than the inflation target of 2.0% as set by the Bank of Canada in monetary policy. As mentioned above, many of the goods and services purchased by the County move independently of the general rate of inflation as determined by a consumer basket of goods. The annual Non-residential Building Construction Index at the 3rd quarter 2016 was 3.2% for the greater Toronto area which is a more indicative measure of costs related to County infrastructure construction projects. There are continued demands on energy costs that exceed overall CPI measures and the budget anticipates additional costs as a result of a Provincial regulation beginning on January 1, 2017 for the implementation of a greenhouse gas emissions Cap and Trade Program. Further, the County will continue to face financial pressure in order to deliver programs and services and simultaneously invest in infrastructure and contribute to reserves for the considerable future needs. With the recent results of the U.S. election, there has been a greater degree of uncertainty in assessing the Canadian economic outlook. The legacy of the past recession is still entrenched within the Canadian economy and Gross Domestic Product (GDP) was anticipated to remain moderate through 2017, and beyond, likely in the range of 1.7% to 2.0% according to recent forecasts. However, the annualized 3rd quarter 2016 Canadian GDP was recently announced at 3.5% showing some economic recovery which may set the stage for upward revisions to Canada’s overall GDP growth rate. Generally, when growth and inflation are low, interest rates would be held low by the Bank of Canada as a stimulus measure. However, significant impacts now anticipated in the U.S. economy from tax reform policies, increased infrastructure spending, other stimulus initiatives and potential NAFTA renegotiations add unknown variables to possible influences in Canada. Inflationary pressures continue to build in the U.S. and it is anticipated now that the U.S. Federal Reserve will increase rates in December with recent increased inflation and employment results. Forecasts for Canada are that the Bank of Canada is likely to stay on hold for increases to the overnight rate throughout 2017 as a result of immediate uncertainty with trade policies and the instability in the economy. It is expected that inflation will remain low throughout 2017 but that there may be upward pressures as the U.S. economy grows. The sustained period of lower inflation in prior years as well as the general economic conditions have benefitted the County in several ways: - Purchases of services have seen significant competition and favourable pricing - Fuel prices have remained stable - Salary and benefit increases have levelled off and - Asphalt cement prices have been favourable As mentioned, many of the County’s expenditures move independently of inflation. Additionally, the County has not fully re-established sustainable budgets for all departments such as transportation and waste. Inflationary increases will make it increasingly difficult to continue to limit tax levy increases to 2.0% without impacting programs and services or seeing the infrastructure deficit worsen.

The chart below has been included in budget presentations over the past several years. It continues to be relevant as it provides a clear picture of the actual changes in the County levy compared to inflation and program changes. The green line shows the major decrease in the County levy through the 1990’s when budgets were slashed across all departments. However, program responsibilities such as County Roads stayed the same so by 2000 the County’s programs were all seriously underfunded. From 1998-2001, a range of former Provincial and Federal programs, such as Social Housing, several roads and EMS, were downloaded to the County with significant financial costs. From 2000-2005, the levy increases were steep as Council struggled to meet its responsibilities to fund and operate all of the former and new downloaded services. The red line represents the Consumer Price Index (CPI) and shows how, theoretically, the County levy should have been increased to sustain its original program responsibilities only. The blue line is a theoretical line showing how the levy should have been increased from 1993 to today to handle both the original and downloaded program responsibilities. The purple dashed line reflects the additional investment in capital that was recommended in the County’s 2014 Asset Management Plan. While this chart shows significant financial challenges in the past, the County is much more financially stable as we have made up much of the ground previously lost.
Levy vs Consumer Price

We have continued to project stable increases over the next several years. However, as we continue on the path of financial rebuilding, annual levy increases need to begin to address the perpetual shortfall in infrastructure funding. The Provincial government is unlikely to provide any substantial continuous financial assistance in the near term given their ongoing financial challenges and substantial deficit. The Federal Gas Tax continues to be the only consistent infrastructure funding available. The Province introduced formula based OCIF funding in 2015 which has been expanded but the amount of funding is still immaterial to the overall County budget. Other programs, such as the OCIF application based funding program, are sporadic and require competition with other municipalities. In an environment where almost all municipalities are in need of infrastructure investments, the competition is fierce to chase relatively small pots of funding. Therefore, the level of annual increases are being reconsidered for future budgets as we develop plans to reach sustainable funding levels for both operating and capital budgets. The federal government has committed to infrastructure funding over the next 11 years under the 2017-18 fiscal plan amounting to $81B; however, much of the funding is earmarked for public transit, green infrastructure such as water and wastewater management and social infrastructure in the form of affordable housing, child care, and recreational/cultural infrastructure. In addition, it is now anticipated that funds will be utilized by the Federal government to create a Canada Infrastructure Bank which will provide financing to private/public partnership projects in excess of $100M. In light of this, much of the anticipated funding may not provide any significant sustainable benefit to the County and details are still pending. The Provincial government has expressed an understanding of the financial pressures to fund infrastructure but at this time there is no stable ongoing funding available to mitigate these challenges In 2016, the County benefitted from:
- Stable asphalt cement prices - Competitive markets producing favourable pricing for most tenders and RFPs - Continued stable fuel pricing - Provincial subsidies for Paramedics, long term care and most Social
Services programs met budget expectations - One-time non-recurring tipping fee revenues - MRF new line capture rates and improved recyclable commodity pricing - Stable caseloads in Social Services and program savings, and - Low inflation
However, the County was financially challenged by:
- Low Canadian dollar causing equipment purchases to escalate, and - Pressures on utility costs

All of these trends have been reflected in the 2017 draft budget in addition to other factors including:
- Additional upload to the Province for the County’s portion of OW program costs in 2017
- Impacts of the Waste Master Plan that was approved in 2014 - Ongoing low interest rates on investments - Provincial energy cap and trade program - Reserve allocations for future projects, and - Use of conservative estimates where Provincial subsidies are subject to change or
unconfirmed for 2017 The 2017 draft budget (cash basis) is as follows:
2015 (M$) Budget
2016 (M$) Budget
2017 (M$) Draft
Revenue Levy 48.3 50.5 52.3 Grants & Subsidies 33.1 34.0 36.8 Other Revenue 15.9 16.0 16.7 Total Revenue 97.3 100.5 105.8 Borrowing Debenture 0 4.2 2.2 Internal Borrowing 3.1 0 0 Total Borrowing 3.1 4.2 2.2 Total Revenue & Borrowing 100.4 104.7 108.0 Expenditures Operating 82.0 85.1 90.2 Capital 16.5 18.5 17.1 Debt Principal Repayment 1.5 1.3 1.8 Total Expenditure 100.0 104.9 109.1 Reserves Transfer to Reserve 4.0 4.9 5.3 Prior Year Project Carryover* TBD (4.0) (2.0) Transfer from Reserve (3.6) (1.3) (4.4) Net Change in Reserves 0.4 (0.4) (1.1) Total Expenditures & Reserves 100.4 104.5 108.0
* The prior year project carryover will be approved per by-law in November and December 2016.

The 2017 draft budget (accrual basis) is as follows:
2015 (M$) Budget
2016 (M$) Budget
2017 (M$) Draft
Cash Budget 100.4 104.5 108.0 Less: Debt Principal Repayment 1.5 1.3 1.8 Capital 16.5 18.5 17.1 Internal Borrowing 3.1 0 0 Debenture Financing 0
4.2
2.2
(21.1) (24.0) (21.1)Add: Amortization 8.3 8.2 8.2 Future Employee Benefits
Liability 0.2 0.2 0.2
Landfill Post Closure Liability 0.6 (3.4) 0.6 9.1 5.0 9.0 Accrual Based Budget 88.4 85.5 95.9
Levy Each County department is funded through multiple sources. The proposed $52.3M levy is split across the County operating departments as outlined in the graph below. Approximately 32% of the levy is directed to the Transportation department as the Federal Gas Tax is the only other significant source of revenue for roads maintenance and construction projects. About 19% of the levy goes to the Community and Social Services department. This is split fairly evenly between Social Housing and Social Services programs. The proportionate share of levy for Social Services was reduced in 2017 with the continued upload of OW costs. Paramedics require 12% of the levy to fund the County’s portion of operating costs as well as capital. The Waste division receives about 12% of the levy. Waste has multiple other sources of revenue such as bag tags, tipping fees and the sale of recycled materials. The levy requirements for these departments remain consistent with previous years. The Golden Plough Lodge is allocated 11% of the levy and continues to contribute to reserves towards the future rebuild of the facility. The Golden Plough Lodge receives a Provincial subsidy and accommodation revenue from residents in addition to the levy. A further 6% of the levy funds the County’s required payments to the Health Unit and MPAC. The balance of the levy funds various smaller departments including Economic Development, Tourism, the Forest, Land Use Planning and Emergency Planning and Health and Safety. The relative departmental levy allocations for 2017 are generally consistent with the prior year.

2017 Levy by Department
The support departments (Human Resources, Finance, Information Technology, Facilities, Corporate Management, Records Management, and Communications) are funded through internally allocated charges to each operating department. Each department is charged as follows:
Corporate Department
Allocation Method
IT Number of computers by department HR Number of employees in each department Finance Percent of total County budget Corporate Management
Percent of total County budget
Facilities Percent of office space used by each department
Communications Percent of total County budget Clerk/Records Management
Percent of total County budget
Revenue The County funds its programs, services and infrastructure through a number of sources. The largest single source of revenue is property taxes or the tax levy at 49%. An additional 35% of County operations are funded by grants and subsidies from the Provincial and Federal governments. Several departments generate significant revenue for their programs through rents, sale of recycled materials, accommodation fees for long term care, fees such as bag tags and tipping fees, and Provincial Offences fines. The relative proportion of revenue sources is consistent with previous years.

2017 Revenue Sources
Expenditures In 2017, approximately 42% of operating expenditures will be spent on staffing costs due to the fact that many services provided by the County are labour intensive such as long term care and paramedics. Salaries and benefits relative portion of expenditures remains consistent year over year. About 22% of the County’s operating budget is spent on Social Services programs although a significant portion of these costs are flow-through dollars and are funded directly by the Province. The County spends 14% of their operating costs on external services which include all forms of contract services including waste collection, engineering, auditing, legal, repairs and maintenance and a number of other specialized services. External services also include annual fees to the Municipal Property Assessment Corporation (MPAC) and the Health Unit. Materials and supplies account for 6% of operating expenditures and consist of medical supplies, raw food for the long term care home, sand and salt for roads, maintenance materials, office supplies and many other goods required for County operations. The balance of operating expenditures includes repairs and maintenance, fuel, utilities, waste expenses (primarily leachate management) and debt servicing.

2017 Operating Expenditures
The majority of the capital expenditures will be directed to the Transportation (52%) and Waste (26%) departments. These departments manage the vast majority of the County’s infrastructure. Social Housing and Facilities also manage a significant portion of the County assets. However, once again, most 2017 expenditures are repairs and maintenance. The balance of the capital budget will be spent in Paramedics and at the Golden Plough Lodge. Key capital projects & purchases in 2017 include:
Roads and bridge work Cell development at Brighton landfill Equipment replacement in Transportation, Waste & Paramedics (snow plows, trucks, ambulances) Social Housing and corporate building upgrades and equipment replacement Implementation of HR recruitment and performance review software Website redesign Roseneath Emergency Services Base
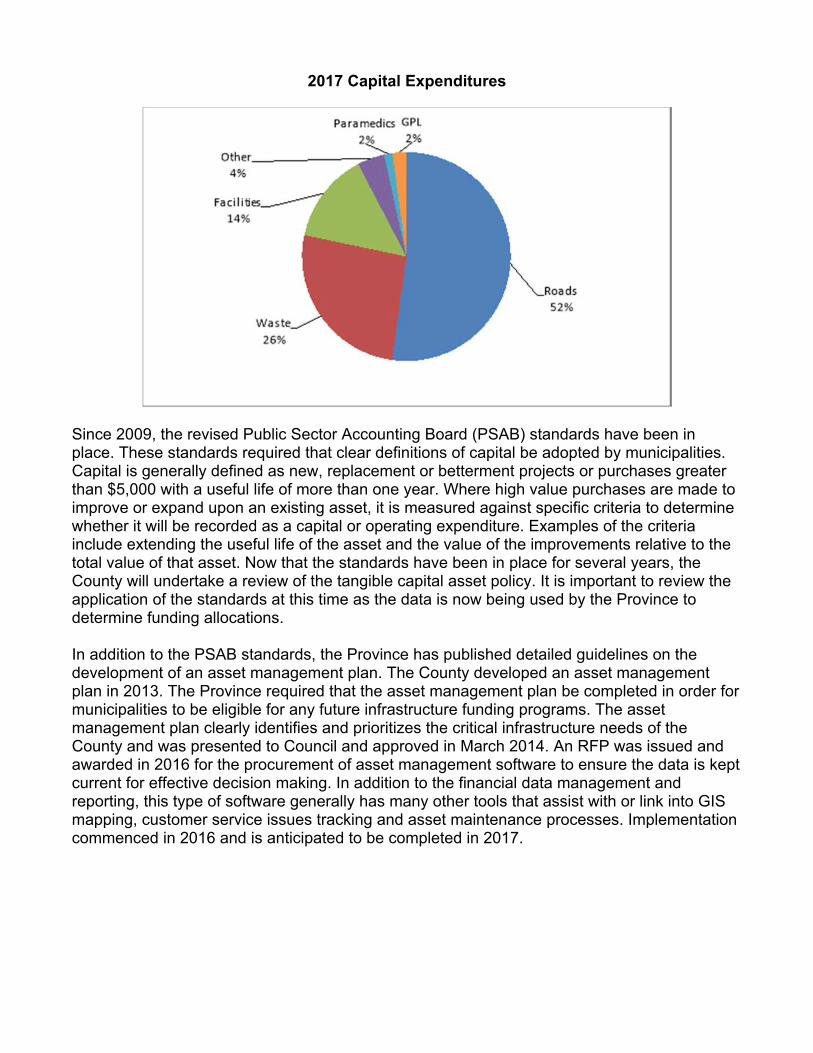
2017 Capital Expenditures
Since 2009, the revised Public Sector Accounting Board (PSAB) standards have been in place. These standards required that clear definitions of capital be adopted by municipalities. Capital is generally defined as new, replacement or betterment projects or purchases greater than $5,000 with a useful life of more than one year. Where high value purchases are made to improve or expand upon an existing asset, it is measured against specific criteria to determine whether it will be recorded as a capital or operating expenditure. Examples of the criteria include extending the useful life of the asset and the value of the improvements relative to the total value of that asset. Now that the standards have been in place for several years, the County will undertake a review of the tangible capital asset policy. It is important to review the application of the standards at this time as the data is now being used by the Province to determine funding allocations. In addition to the PSAB standards, the Province has published detailed guidelines on the development of an asset management plan. The County developed an asset management plan in 2013. The Province required that the asset management plan be completed in order for municipalities to be eligible for any future infrastructure funding programs. The asset management plan clearly identifies and prioritizes the critical infrastructure needs of the County and was presented to Council and approved in March 2014. An RFP was issued and awarded in 2016 for the procurement of asset management software to ensure the data is kept current for effective decision making. In addition to the financial data management and reporting, this type of software generally has many other tools that assist with or link into GIS mapping, customer service issues tracking and asset maintenance processes. Implementation commenced in 2016 and is anticipated to be completed in 2017.

Tax Impact Each year it is difficult to balance the need to increase property taxes to ensure the continuation of service and maintenance of assets with the challenging economic circumstances of the County. The EOWC identified in a white paper some of the challenges faced by rural Eastern Ontario when setting tax rates which include:
- Almost 90% of the local assessment is residential - Average personal earnings are less than the Provincial average - One in five people are a senior citizen - Lower share of income from employment earnings - Lower share of the workforce with college or university education - Lower shelter costs for owned homes but there are longer more expensive commutes - Larger share of homes needing major repairs
While these factors make it difficult to increase property taxes, they also support the need for sustainable programs and services delivered by municipal governments. Further, the balancing of immediate and future needs is critical to setting reasonable and appropriate rates to balance current and future budget considerations. The overall estimated tax impact from the County increase for 2017 is about $20 for the median single family home. Property taxes have three components: Municipal, County and Education. The portion of the property tax bill allocated to the County varies across the seven member municipalities. The County and Education tax rates are the same across all seven member municipalities. However, the local municipal tax rates vary by municipality depending on the types of programs and services offered. On average, the local municipalities account for just under half of a property tax bill at 49.7% with the County and Education making up the balance at 36.1% and 14.2% respectively. In recent years, the education tax rate in Northumberland has declined modestly. This has resulted in a slight shift in the proportionate split of local tax dollars. On average, municipalities have been the primary beneficiary.
How Are Property Taxes Allocated?

2016 Tax Rate Split
The allocation of the municipal tax dollar was fairly consistent between 2013 and 2016. The slightly lower education tax rate continued to create a small amount of tax room for the lower tier municipalities and the County. In 2016, the ongoing reduction in the education tax rate saw slightly more of each property tax dollar shift from education to the member municipalities and the County.
Relative Share of Property Tax Dollars

The draft budget would see the actual residential tax rate increase to an estimated 0.00480736 from 0.00477920. The final tax roll information is not yet available and the tax rate will change when the final data is published by MPAC. Final tax rates will be set in early 2017 following budget approval. The median assessed value for a single family dwelling is $235,000 for 2016. This is an increase of $2,750 over the median assessed property in 2015. Using these median values, a typical property owner would see their annual property tax for the County portion increase by approximately $19.76. It is important to note that these estimates are based on the median household and the actual impact will depend on the assessment of each individual property. Properties are assessed by MPAC and many factors are considered in determining a property’s assessed value. The County levy is allocated to each of the member municipalities based on weighted assessment. Growth does not occur consistently across the municipalities and changes in assessment values can vary among the municipalities as well. Therefore, each year the weighted assessment is recalculated to determine the distribution of the levy across the municipalities. Based on the preliminary tax roll data, the distribution will be approximately as follows:
Levy Distribution by Municipality
Departmental Summaries

Below is a brief overview of the draft budget for the major County departments. For more detail, please review the department business plans and issue papers in the budget books. Transportation The Transportation department draft budget is $22.8M. This includes road maintenance for winter and summer, surface treatment and construction activities. This includes some funds carried over from 2016 projects that were incomplete or deferred at the end of 2016 such as developers shared projects County Road 45/Van Luven turning lanes, County Road 2; Wilkins Gate to New Amherst storm sewers. The department is primarily funded by the levy but also receives Federal Gas Tax funding and to a lesser extent funding under the Ontario Community Infrastructure Funding (OCIF) formula based funding model. The department also receives full cost recovery for providing surface treatment services to the member municipalities.
Transportation Expenditures
The Transportation department has included four issue papers related to re-occurring annual requests. It has been a priority to ramp-up the Roads and Bridges construction budget. The budget includes issue papers to continue with the annual increase to the roads construction base budget. There are also issue papers to replace equipment which is at the end of life and capital maintenance of transportation facilities. Both of these issue papers capture items or projects that were previously identified in the 10 year plan.
In addition to the issue papers, the consolidated budget identified building the bridge reserve as a priority. $9.0M will be spent on major capital projects to improve the County’s 503km road system in 2017. Waste Services

The Waste Services draft budget is $17.4M. This includes the Material Recovery Facility (MRF) operations, curbside collection, landfill operation, closed landfill monitoring, the Household Hazardous Waste (HHW) program and the planning and education activities as well as capital projects. The draft budget includes $3.5M for the ongoing Brighton Landfill development project. The Waste department is unique in that it has many revenue sources to fund operations. The department continues to experience significant financial pressure and relies on the levy to fund a significant portion of its operations each year. This will continue well into the future as the County implements the commitments identified in the 2014 Waste Master Plan, sees limited funding from the Province and risk of instability in non-tax revenues.
Waste Expenditures
The Waste department issue papers include an annual request for the purchase of capital equipment which is included in the base budget. There is also an issue paper for the excavation and relocation of historic waste and subsequent cell lining as part of the ongoing Brighton Landfill expansion project. Other issue papers include equipment replacement, an environmental assessment aligned with review of options for residual waste disposal, waste operations changes to be implemented in 2018, and the design work for an organics transfer station. Economic Development, Land Use Planning & Tourism

The draft Economic Development budget for 2017 is $3.8M. This includes the economic development and tourism operations as well as the Ontario Agri-Food Venture Centre (OAFVC) and the Business Advisory Centre (BACN). Land Use Planning and Plumbing and Septic inspections were added under the responsibility of Land Use Planning during 2016. This department’s operations are funded primarily by the County levy with some small contributions from grants, permits and revenues from the OAFVC. The OAFVC commenced operations during 2016. The department has submitted one issue paper to change a contract position at BACN to a permanent one funded via provincial funding.
Economic Development, Land Use Planning & Tourism Expenditures
Northumberland Paramedics The proposed 2017 budget for the Paramedics department is $12.1M. This includes the operation of six bases and a fleet of ambulances and emergency response vehicles. Paramedic operations costs are funded 50% by the County levy and 50% from the Provincial subsidy. Capital costs and reserves contributions are funded solely by the County levy with the asset amortization being subsidized by the Province. Operational costs of the Colborne Emergency Services Base are captured within the draft 2017 budget as the first year of occupancy. The Paramedics department has included two issue papers in the draft 2017 budget inclusive of an education program for Advanced Care Paramedic training and hiring of a Paramedics Logistics Coordinator.
Northumberland Paramedic Expenditures

Golden Plough Lodge The Golden Plough Lodge (GPL) draft 2017 budget is $16.0M. The GPL provides nursing, dietary, housekeeping, maintenance, life enrichment programs and accommodations to the residents. In addition to the levy attributed to the GPL, funding is received through the Provincial per diem subsidy and resident accommodation revenue. However, the increase in Provincial funding is not projected to be adequate to fund the increasing needs. The GPL is required by the Province to rebuild the facility and annual levy contributions to a reserve account are being made to partially reduce the amount to be debentured at the time of the rebuild. The 2017 budget proposes the continuation of transfers to the GPL rebuild reserve totaling $1.1M within the year. The GPL proposes issue papers in their draft budget for Dietary Supervisor staffing hours, Life Enrichment staffing, a full-time Registered Practical Nurse, permanent staff accommodation and development of a strategic plan.
GPL Expenditures

Community & Social Services The Community & Social Services draft 2017 budget is $28.5M. This includes income services, employment and support services, children’s services, housing services, the Food 4 All warehouse and administrative services. The draft budget allocates $10.1M in levy to the Community & Social Services department which is slightly less than the previous year. The OW benefit costs have been uploaded such that they are covering inflation and other program costs. Other sources of revenue are primarily Provincial subsidies and social housing rent. A significant portion of the Community & Social Services revenues come via funding from Provincial Ministries, many of which are for mandatory programs and comprise of a cost sharing component by the County.
Community & Social Services Expenditures

The Community & Social Services department did not submit any issue papers for the 2017 budget and will continue to deliver the programs and services already approved in previous budgets. Support Services & Corporate Departments The corporate and support departments include a number of smaller support departments: Finance (Finance, IT, POA), Corporate Services (Forest, Emergency Planning and Health & Safety, Human Resources, Clerk, Records/Archives), Communications and Facilities. These departments are primarily funded through allocations to the various operating departments although the Forest does receive a small portion of the levy. Additionally, corporate includes County payments to the Health Unit and MPAC classified as External Services within the budget. These departments have included the following issue papers in their proposed 2017 budget:
- Implementation of recruitment software - Implementation of human resources performance review software - Records Management installation of storage equipment - Contract to permanent position Forestry Technician - Forestry truck replacement - Forestry new truck addition - Contract to permanent position Purchasing Coordinator - Complete repairs and maintenance projects for corporate buildings identified in the
10 year plan - Returning summer student position Energy Conservation planning and project
development

10 Year Financial Plan
The development of a long term financial plan is essential to ensuring the ongoing financial sustainability of the County and its assets. A long term plan requires staff to identify future needs and create a financial roadmap to ensure those needs will be met without creating volatile and unexpected tax increases. A thorough understanding of long term needs and related costs is essential to achieving sustainable infrastructure and services. The financial plan developed by staff projects an annual 2.0% increase for continuing operations within the years 2018-2026 as well as a dedicated infrastructure levy.
The strategy of consistent modest increases has worked well to get the County back on track for funding operations. While most departments still face financial challenges and constraints, the County has made great strides in moving closer to adequate and sustainable funding levels. With the detailed asset management reviews completed in recent years, it has become increasingly apparent that this strategy is not sufficient to meet the long term infrastructure needs.
The dedicated infrastructure levy was introduced in the 2016 budget and was applied within the long term financial plan. The proposed 2017 budget calculates the dedicated infrastructure levy based on 1.0% of the 2016 capital budget with a 0.5% escalation factor in each year of the 2018-2026 long term forecast based on the prior year capital budget. While the infrastructure needs remain unchanged, the timeframe to implement these increases has been re-evaluated and is recommended to escalate slowly over several years. This reflects the persistent economic challenges across Northumberland County and the demands on member municipalities to keep tax rates low. The need for additional infrastructure tax dollars is a critical issue but with the record low borrowing costs and promises of infrastructure funding from other levels of government there are some alternate means of financing likely to be available for the foreseeable future. The 10 year financial plan priorities are fully funded using a combination of levy increases, reserves and debt. The plan continues to respect the need for stable and predictable levy increases from year to year.
The revised long term plan identifies a portion of the projected increases for infrastructure. At the end of the 10 years, funding will not have reached a sustainable level and will require further increases beyond the term of the long term plan. This type of strategy to build infrastructure funding is being used frequently by municipalities across the Province.
As indicated previously, the Bank of Canada’s target range for inflation is 1 to 3 percent with the monetary policy aimed at the 2% target midpoint. Staff assumed this level of inflation for the purpose of the long term plan with slightly higher factors applied for more volatile items such as utilities and fuel. Where future prices are extremely difficult to project on a 10 year horizon such as asphalt, a lump sum amount has been used with project specifications to be increased or decreased as funding permits. These assumptions allowed staff to target an operating expenditure increase of 2% on average.
A long term plan is an ‘evergreen’ document or a constant work in progress. The first 10 year plan was developed as part of the 2012 budget process. Changes in legislation, unplanned events such as severe weather, and the economy can all have dramatic impacts on one or many years. Therefore, the original document has been revised as part of the current budget

process to reflect new information such as changes to Provincial subsidies or current economic conditions.
While this long term plan meets operating and basic capital needs, it does not allow the County to make any significant progress in reducing the infrastructure deficit. This is not unique to Northumberland as it is a challenge facing municipalities across the Province. The County’s roads and bridges are by far the largest single asset type. Once the Transportation Master Plan is adopted, and the asset management software is implemented, a more detailed estimate of infrastructure needs and timing will be incorporated into the long term financial plan. Projects that are on the horizon for 2020 and beyond are:
- Golden Plough Lodge rebuild as mandated by the Ministry of Health and Long Term Care
- Several major bridge projects including Campbellford - Implementation of the Waste Master Plan including organics and landfill space - Implementation of the Transportation Master Plan - Social Housing repairs & maintenance needs as well as demand for increased
affordable housing across the County Capital Assets & Infrastructure Deficit
The County has made major strides in recent years to rebuild capital and maintenance budgets despite many financial challenges. There is an ongoing commitment to ramp up the roads and bridges budgets and the housing repairs and maintenance budget is nearing a sustainable level. The County has also purchased or made major repairs to corporate buildings, Paramedic bases and roads depots. With millions of dollars being invested in the County’s infrastructure, the assets are remaining safe and operational to meet service objectives. Unfortunately, many of the County’s assets are still relatively old and in many cases are approaching either the end of their useful life or a point where major rehabilitation will be required. The County completed an Asset Management (AM) Plan in 2013 and it was approved by County Council in January 2014 as required by the Province. The AM Plan is a robust document that includes a vast amount of information and even more data is available in the supporting spreadsheets and fixed asset system. However, it is important to recognize that the AM Plan is an evergreen document and will require updates on a regular basis. For example, the Waste Master Plan and upcoming Transportation Master will both require significant changes to the current version of the plan. The first version of the AM Plan only includes major assets. The data does not include most equipment or vehicles and it does not value landfills and transfer stations in any way. The additional assets will be included in future revisions. The Province continues to place a heavy reliance on the AM Plan for funding applications. Most recently, the Ministry of Infrastructure of Ontario has completed consultations on potentially establishing an asset management planning regulation under the Infrastructure for Jobs and Prosperity Act, 2015, to set the form and content of municipal asset management plans. One-time funding such as OCIF is specifically looking for projects to be submitted based on the priority identified within municipal AM Plans. We have also seen a clear focus on

core infrastructure which only includes the road and bridge asset types at the County as we do not maintain other types identified as core infrastructure such as water and sewer. The County’s AM Plan identified roads and bridges as by far the largest need. The most astounding number in the AM Plan is the projected replacement value of the assets. The chart below summarizes the projected replacement value by major asset type:
Asset Type Replacement Cost
Roads $723,189,425Bridges $124,905,795MRF Equipment
$4,555,000
Facilities $82,042,756Housing $40,415,388GPL Building $51,126,022Total $1,026,234,386
Over the next 50-60 years, the infrastructure need will be approximately $1 billion. There are many strategies to extend the life of an asset but even applying the most advanced strategies, it will still require a significant financial investment to keep these assets functioning effectively. In order to manage these needs effectively, approximately $27.4M should be spent annually to replace and maintain assets. The current long term plan provides for an annual asset investment of about $21.9M on average over the next 10 years. That equates to an annual infrastructure shortfall of approximately $5.5M. Initiatives such as ramping up the roads and bridges have begun to narrow this gap slightly. It should also be noted that these projections only address assets currently operated by the County and does not consider growth or inflationary pressures on project costs. The Ministry of Municipal Affairs (MMA) provides a metric, Asset Consumption Ratio, to measure the percentage of the consumption of assets relative to original acquisition costs. This metric shows that Northumberland is performing just slightly better than the Provincial average. However, the total assets are almost half depreciated or ‘used up’ and the trend indicates that overall the County is losing ground on asset replacement. These are theoretical values for accounting purposes and only approximate the actual consumption of the assets’ useful life. However, the trend is alarming in that for all 5 years where data is available, the County has consumed more of the asset value than has been replaced and this trend is not turning around. This supports the need for an increased financial commitment to asset rehabilitation and replacement to reverse the trend.
Asset Consumption Ratio
County Average2011 40.5% 44.7% 2012 41.1% 45.8% 2013 42.6% 46.7% 2014 43.8% 47.5% 2015 44.4% 48.6%

The chart below shows the projected asset funding shortfall on an annual basis over the next 10 years. There is a placeholder in the 2021 forecast for the GPL replacement which shows a year where the asset investment surpasses the target level. The Trent River Crossing project is reflected in projections for 2025.
Annual Asset Investment Shortfall
Comparing the planned asset investment within the 10 year plan and the targets set in the AM Plan, the shortfall is alarming in the chart below.
Capital Investments vs Asset Management Plan Investment Target
The AM plan data can be used to develop more effective strategies to manage the County’s assets. Funding strategies are being developed to move toward the target levels. The priorities identified in the AM plan will drive future capital funding applications to ensure money is spent where it is most desperately needed. There is a significant amount of work to be done and strategies to develop now that more robust asset data is available. This type of infrastructure deficit is not unique to Northumberland County. A study conducted in 2012 by the province of Ontario, the Association of Municipalities of Ontario (AMO) and the City of Toronto predicted that over the next 10 years “Ontario Municipalities will need about $28 billion to address the investment gap between current funding and what would be needed to repair and maintain the entire municipal inventory of roads, bridges and culverts.”[1] In an effort to close the gap between actual spending on capital and what is required to keep pace with the deterioration of County assets, the draft 2017 budget includes a dedicated infrastructure levy. The amounts set aside from the dedicated infrastructure levy will be used to fund designated infrastructure projects. The amount included as dedicated infrastructure levy in the 2017 budget is $233,425 comprised of $184,744 as calculated based on the target set by Council (1% of the 2016 capital budget costs) and a further $48,681 allocated from savings realized with the proposed operating levy at 1.9% vs. the Council directed target of 2.0%. Council further authorized that staff target for the dedicated infrastructure levy index factor to increase by 0.5% in each year of the long term model calculated on the prior year capital budget. Therefore, the dedicated infrastructure amount grows slowly over time. The dedicated levy will reach $887k by the end of the 10 year plan. This strategy is in line with what a number of other Ontario municipalities are starting to do to address the infrastructure gap. Some of those municipalities that now have a similar budget tool to address this problem include the City of Barrie, Newmarket, Brampton, Mississauga, Centre Wellington, and Woolwich Township. Given the economic challenges within the broader County a slow and steady approach is being proposed. This will result in only 20% of the annual funding gap being closed at the end of this 10 year plan. Funding opportunities, new technologies and operating efficiencies will all contribute to accelerating the closure of this gap. As economic circumstances change, the pace of ramping up the dedicated levy will be re-evaluated. Reserves

Reserves are an important tool for long term planning. As part of the long term planning process, reserves are being set aside to pay for future capital projects and unexpected operating expenses such as extreme weather events. As infrastructure needs are becoming better defined through the AM Plan and various departmental master planning processes, it is becoming more apparent that the County will not have near enough funds set aside for future infrastructure needs. The dedicated infrastructure levy assists with building reserves in an effort to be better financially prepared for impending capital needs. The County’s reserve position has improved through 2015/16. Once again, the County has exceeded the Provincial average when looking at reserve contributions as a percentage of operating expenses. The portion of departmental budgets allocated to reserves has increased but planned reserve contributions need to be further enhanced in future budgets. The Ministry of Municipal Affairs has once again assigned a risk rating of low based on the County’s level of reserves in 2015. While this metric is important, it should be noted that MMA uses all reserves for its evaluation. In 2015, this included $4.4M in project carryovers which were only established as temporary reserves. Even after adjusting for the temporary reserves, the County has made significant progress in building reserves.
Total Reserves and Discretionary Reserve Funds as a % of Operating Expenses
County Average2007 6.1% 23.9% 2008 10.0% 28.1% 2009 12.9% 30.7% 2010 24.8% 30.7% 2011 27.3% 32.9%2012 31.2% 37.1% 2013 39.2% 33.2% 2014 41.5% 33.3% 2015 46.3% 34.5%
The County’s reserves as a percentage of operating expenses have increased substantially between 2007 and 2015. At the end of 2016, the County’s reserve balance is expected to be approximately $40.3M. There has been a conscious effort across all departments to identify needs and increase reserve contributions. However, the ongoing operational needs will continue to prevent reserve contributions from accelerating as quickly as required. The development of an AM Plan and long term financial plan identifies future capital needs and provides a plan for ongoing reserve contributions and withdrawals for major capital projects. Given the number of major projects coming up in the next 10-20 years, the County’s reserves will need to continue to grow. The AM Plan clearly illustrated that despite efforts to save for future projects, the County will still fall far short of the funds needed for infrastructure over the next several decades. The data presented above is helpful to illustrate our progress. However, benchmarking against other upper tier municipalities should be done with caution. Each municipality provides a different

range of programs and services and operate different infrastructure. The trends are useful but it is not an ‘apples to apples’ comparison. It is widely understood that no municipality is contributing to reserves at an adequate level. The shortfall in reserves will require future tax increases and the assumption of more debt in the near term as infrastructure needs become more critical.
Forecasted Yearend Reserve Balance
There will be approximately $2.0M placed in reserves at the end of 2016 to carryover funds for projects that were incomplete at yearend (primarily roads and several smaller projects). Estimated yearend reserve balances are detailed in the chart below.

Estimated Year End Reserve Balances
Other liquidity measures indicate significant improvements in the cash position of the County and these measures are directly related to the improved reserve position. The Total Cash & Cash Equivalents as a % of Operating Expenditures as well as Net Working Capital as a % of Total Municipal Operating Expenditures were rated by MMA as low risk. However, it should be noted that this metric can vary year over year depending on timing of shorter term investments such as GICs as it only captures balances in bank accounts and does not include other very short term and liquid investments. The County continues to invest in GICs, short term, and long term cashable bonds aligned with cash flow requirements ensuring access to funds if required for operations or capital purchases. The change in these liquidity measures reflects timing of cash flows, investment of maturities and investment of short term liquid funds. This County investment strategy has led to a significant increase on the return on the County’s investments yields. All investment are low risk, preserve principal and in compliance with the requirements of the Municipal Act.

Total Cash & Cash Equivalents as a % of Operating Expenditures
County Average2010 15.3% 26.5% 2011 11.2% 27.8% 2012 8.9% 30.8% 2013 25.5% 33.1% 2014 4.8% 30.5% 2015 19.3% 30.0%
Net Working Capital as a % of Total Municipal Operating Expenditures
County Average2007 -0.5% 23.3% 2008 5.4% 28.0% 2009 7.1% 27.8% 2010 13.4% 26.3% 2011 7.5% 24.8% 2012 4.2% 27.4% 2013 17.2% 28.7% 2014 -1.7% 27.4% 2015 12.2% 27.4%
Debt The County’s outstanding debt continues to be at a very manageable level. It is well below the annual repayment limit set by MMA. The County has not taken on any new debt over the past 6 years which has resulted in the principle outstanding decreasing steadily. However, the County will finance two 2016 projects that will be fully completed in early 2017 with debenture issuances in the new year. Municipalities are only permitted to assume debt for capital projects. The debt level projected for 2016 is $11.5M which is approximately $303 per household. The Provincial average was $1,200 per household (based on 2012 data). While the infrastructure in each municipality varies significantly, the County is clearly managing debt at a level well below most other municipalities. As the longer term financial needs are considered, the County will need to take on some additional debt in the medium and long term. Progress has been made to build reserves for future projects. However, adequate reserves will not be accumulated prior to beginning these critical projects. Projects that have been identified for debt financing will be the replacement of the Golden Plough Lodge, the construction/replacement of the Trent River crossing in Campbellford and some portions of the Brighton Landfill expansion. As more detailed project plans are developed and cost estimates are refined, the specific financing tools will be reevaluated. A portion of these projects will be funded by reserves but it is unlikely sufficient reserves can be set aside in time for these projects. A business case analysis will completed to determine if it is a more prudent business decision to forego the return on invested funds or pay interest on debt. In the current environment of exceptionally low interest rates the difference between options has been marginal.
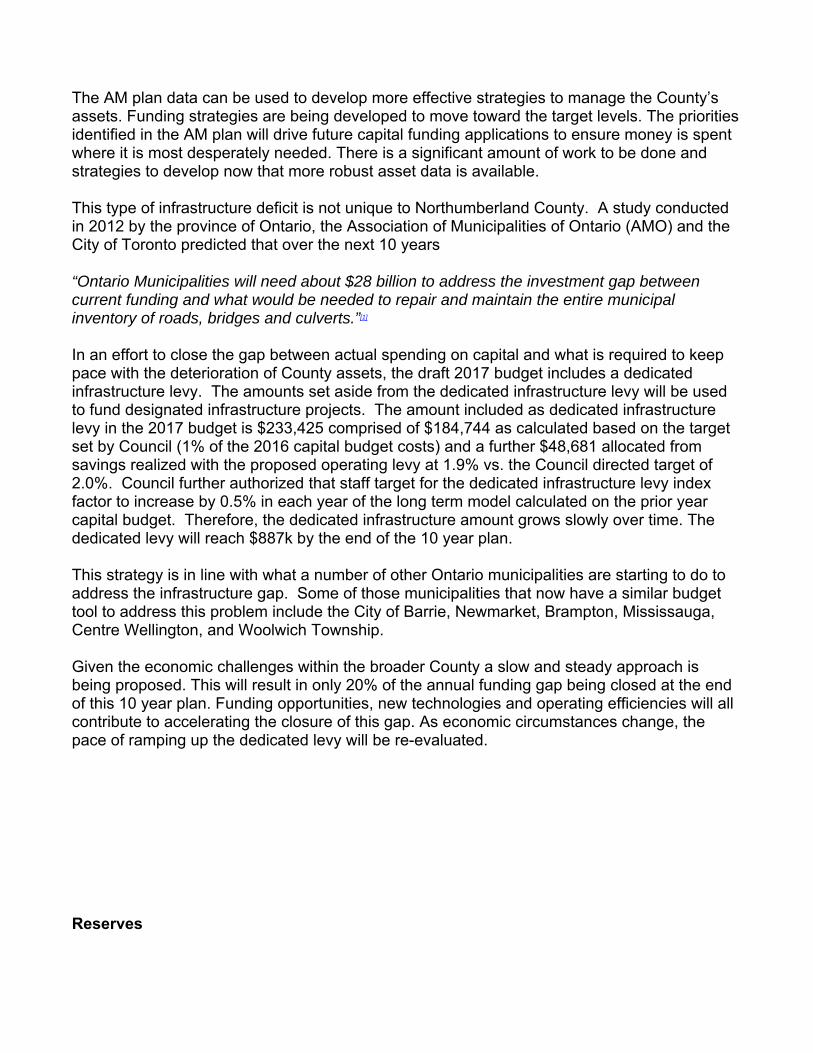
In addition to the projects noted above, it is recommended that the new Roseneath Emergency Services Base being constructed in 2017 be financed by debt. The exceptionally low cost of debt available to the low risk municipal sector presents an attractive business case. The County will be better off to leave reserve investments in place and assume additional debt at today’s low interest rates. The additional cost of interest will be funded 50% by the Provincial subsidy which will create a small positive margin for the County. The chart below shows the current debt being paid down and the addition of new debt based on the estimated costs of the Brighton Landfill Expansion project starting in 2017. There is also a placeholder for a Trent Hills Emergency Services Base in 2018, the GPL rebuild around 2021 and an additional placeholder for the Trent River crossing in Campbellford in approximately 2025 although these are approximate dates.
Forecasted Yearend Debt (Principal)
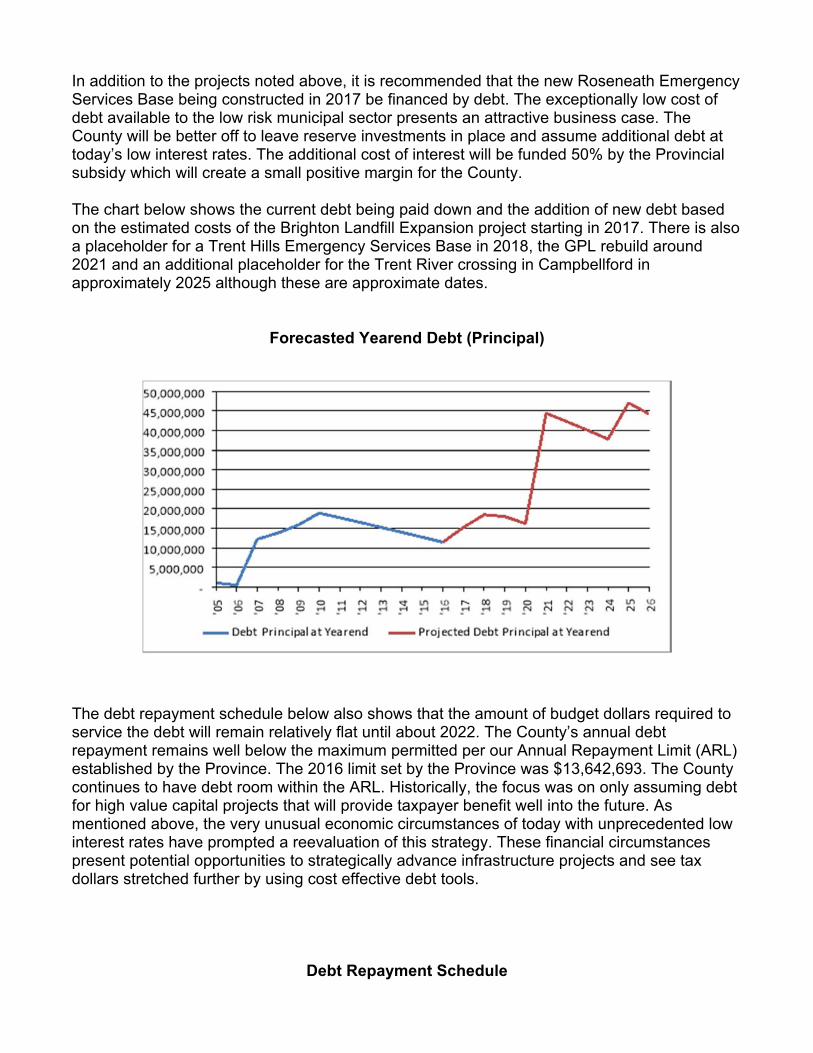
The debt repayment schedule below also shows that the amount of budget dollars required to service the debt will remain relatively flat until about 2022. The County’s annual debt repayment remains well below the maximum permitted per our Annual Repayment Limit (ARL) established by the Province. The 2016 limit set by the Province was $13,642,693. The County continues to have debt room within the ARL. Historically, the focus was on only assuming debt for high value capital projects that will provide taxpayer benefit well into the future. As mentioned above, the very unusual economic circumstances of today with unprecedented low interest rates have prompted a reevaluation of this strategy. These financial circumstances present potential opportunities to strategically advance infrastructure projects and see tax dollars stretched further by using cost effective debt tools.
Debt Repayment Schedule

MMA provides two sustainability metrics to identify concerns with a municipality’s ability to continue to pay for servicing long term debt commitments. The County’s position had weakened for both of these metrics due to the increase in long term debt since 2006. However, it has shown improvement with no new debt being issued since 2011. The Net Financial Assets or Net Debt as a % of Own Purpose Taxation metric is rated low as well as the risk rating for Net Financial Assets or Net Debt as a % of Total Operating Revenue. This metric will continue to be a positive indicator of the County’s positive debt position.
Net Financial Assets or Net Debt as a % of Own Purpose Taxation Plus User Fees
County Average2007 -40.9% -6.1% 2008 -31.9% 7.4% 2009 -43.7% -4.1% 2010 -58.5% 0.8% 2011 -36.3% 6.4% 2012 -27.3% 11.9% 2013 -12.6% 16.3% 2014 -5.5% 17.3% 2015 3.0% 20.5%
The recent debt has been at relatively low interest rates which are not reflected in the metrics. These low rates have helped keep the cost to service debt at a minimum. The metric measuring debt servicing cost continues to be risk rated as low by MMA and the County remains very close to the provincial averages.
Debt Servicing Cost as a % of Total Operating Revenue

County Average2007 0.7% 2.1% 2008 1.7% 2.3% 2009 1.8% 2.4% 2010 2.1% 1.9% 2011 2.3% 2.1% 2012 2.2% 2.1% 2013 2.2% 2.0% 2014 2.1% 1.9% 2015 2.0% 1.8%
Conclusions/Outcomes The 2017 draft budget and long term financial plan provided a challenge adjusting to the Council approved target increase within the model to 2.0% from the previous model which was established based on a 2.5% increase. Staff were able to find efficiencies in light of additional expenditures resulting in an increase below the target at 1.9%. This allowed for the allocation of the savings into the dedicated infrastructure levy recognizing future capital needs. The Long Term Financial Planning Framework provides the foundation for a well-established budgeting process that sees major projects and initiatives being identified within the long term plan that are simply forwarded into the current budget year. This forward thinking, long term approach has put a significant focus on building reserves, funding strategies and asset management. The budget and supporting documentation is fully aligned with the 2015-19 strategic plan and will advance the priorities established in that document. Each department has developed a budget document that is linked to the four strategic pillars, the mission and vision. The initiatives identified and funded within the draft budget focus on People, Partnerships and Possibilities, achieving best practices and collaboration. The proposed 2017 budget does not include any new programs or services but continues to meet the demands for all existing services. The operations are well funded and departments are able to effectively deliver services with this proposed budget. However, funding is still not adequate in areas such as long term care. Shortfalls in Provincially funded services continue to put pressure on the County levy. Costs are being contained with departments being able to accomplish more with the same or less funding. The infrastructure needs will be a challenge over the long term but the proposed budget provides for the immediate needs identified by each department and all projects previously identified for 2017 in the long term plan. The budget allows for some reserve contributions as we continue to look forward. This budget lays out a strategy for a dedicated capital levy that will build through each successive year in an effort to reduce the annual infrastructure gap. The County is financially stable and the 2017 budget focuses on preparing for the future. Each department maintains a strong foundation that is being built on sound fiscal decisions that position the County well to achieve success in delivering quality programs and services, maintaining infrastructure and being in a solid position to respond to the pressures of the economy and needs of the community.
[1] Sarah B. Hood, “The Asset Gap,” Municipal Monitor, Q1 2015, pgs 8‐9, (quoting Tom Dawe, Public Sector Digest)