Embed Size (px)
Citation preview

a (corresponding author) Massachusetts Institute of Technology, Sloan School of Management; 100 Main Street, Cambridge, MA 02139. E-mail: [email protected]; Phone: (781) 718-7804 b Claremont McKenna College; E-mail: [email protected] c Claremont McKenna College and National Bureau of Economic Research Associate; E-mail: [email protected] The authors would like to thank Jinlin Ye for excellent research assistance and seminar participants at the Massachusetts Institute of Technology, Harvard Business School, Harvard Economic History, 2014 London Business School Summer Finance Symposium, University of Colorado – Boulder, and HEC Montreal. We would also like to thank Michael Greenstone, John Campbell, Randall Kroszner, Nittai Bergman, Neil Shephard, Eric Hilt, William Roberds, Vania Stavrakeva, Jun Pan, Adrien Verdelhan, Rajkamal Iyer, Haoxiang Zhu, Jean-Noel Barrot, Erik Loualiche, Daan Struyven, Stephen Murphy, Nils Wernerfelt, Daniel Green, and Michael Abrahams for helpful comments. We greatly appreciate Janet Linde and New York Stock Exchange Archives for their assistance in accessing historical archives. We also wish to thank the Lowe Institute of Political Economy and the Financial Economics Institute at Claremont McKenna College for financial support. Any errors are our own.
Counterparty Risk and the Establishment of the New York Stock Exchange Clearinghouse
Asaf Bernsteina Eric Hughsonb Marc Weidenmierc
September 2016
Abstract
Heightened counterparty risk during the recent financial crisis has raised questions about the role
clearinghouses play in global financial stability. Empirical identification of the effect of centralized
clearing on counterparty risk is challenging because of the co-incidence of macro-economic turbulence
and the introduction of clearinghouses. We overcome these concerns by examining a novel historical
experiment, the establishment of a clearinghouse on the New York Stock Exchange (NYSE) in 1892.
During this period the largest NYSE stocks were also listed on the Consolidated Stock Exchange (CSE),
which already had a clearinghouse. Using identical securities on the CSE as a control, we find that the
introduction of clearing reduced annualized volatility of NYSE returns by 90-173bps and increased asset
values. Prior to clearing, shocks to overnight lending rates reduced the value of stocks on the NYSE,
relative to identical stocks on the CSE, but this was no longer true after the establishment of clearing. We
also show that at least ½ of the average reduction in counterparty risk on the NYSE is driven by a
reduction in contagion risk – the risk of a cascade of broker defaults. Our results indicate that clearing
can cause a significant improvement in market stability and value through a reduction in network
contagion and counterparty risk.

1
“For more than a century, financial stability has depended on the resilience under stress of clearinghouses and other parts of the financial infrastructure. As we rely even more heavily on these institutions in the United States and around the world, we must do all that we can to ensure their resilience, even as our financial system continues to evolve rapidly and in ways that we cannot fully predict.”
– Federal Reserve Chairman Ben Bernanke April 4, 2011
1 Introduction On September 14th, 2008 dealers from every major Wall Street firm involved in the $600 trillion over-the-
counter (OTC) derivatives market came into work on a Sunday for an unprecedented emergency trading
session. The goal? A frantic effort the day before Lehman Brothers declared bankruptcy to try and net
counterparty risk in their bilateral over-the-counter contracts with Lehman and limit the knock-on losses
of its collapse on other financial institutions. Lehman’s global OTC derivatives position at the time was
estimated at $35 trillion in notional, which included being a counterparty in 930,000 derivatives
transactions representing $24 billion in counterparty liabilities1. This ad-hoc attempt at clearing was
described by market participants as “a bust”, with very little successful netting prior to Lehman’s
bankruptcy filing2. The result was an unprecedented rise in counterparty risk, contagion, and financial
instability among global financial market participants exemplified by a dramatic increase in indicators of
counterparty risk including the credit default swap-bond basis and deviations from covered interest rate
parity3.
The collapse of Lehman Brothers and the subsequent spillovers raised concerns about the role
counterparty risk plays in the stability of the financial system and the importance of clearinghouses in
mitigating that risk. In particular, policymakers in the United States and European Union have tried to
address counterparty risk concerns not only by substantially increasing counterparty risk-based capital
requirements for banks with Basel III, but also by mandating centralized clearing of the majority of OTC
derivatives via the Dodd-Frank and European Markets Infrastructure Regulation Acts. Prior to Lehman’s
collapse, OTC derivatives were not required to engage in multilateral net settlement through a centralized
clearinghouse and often relied on bilateral netting and ad-hoc margin requirements between
1 Lehman Brothers Holdings Inc. First Creditors Section 341 Meeting, January 29, 2009, Summe (2012), and their most recent 10Q filing on July 10th, 2008. 2 Financial Times, “Dealers hold emergency trading session”, September 15, 2008. 3 Levich (2011) and Giglio (2013)

2
counterparties. Under bilateral netting, traders can be exposed to additional counterparty risk through
contagion, since if one trader defaults he can set off a cascade of additional defaults. All else being equal,
when OTC derivatives contracts instead engage in multilateral netting, Cecchetti et al. (2009) estimate
that gross notional exposures can be reduced by as much as 90 percent. Policy makers point to these
potential ex-post netting benefits and the rise in counterparty risk concerns after Lehman’s bankruptcy as
evidence that mandated OTC derivative clearing would reduce the probability of an initial default as well
as counterparty risk arising from contagion.
Despite the response of policymakers, academic evidence of the effects of clearing on financial
stability and asset values are still unclear. From a theoretical standpoint Duffie and Zhu (2011)
demonstrate that a single party clearing all assets should reduce counterparty risk, ceteris paribus, leading
to lower volatility and higher asset value, but this result does not generalize to multiple clearinghouses or
a single clearinghouse that does nott clear all transactions. Acharya and Bisin (2014) establish that in the
absence of a clearinghouse there can be a counterparty externality which encourages excess risk taking,
but Pirrong (2009) shows that a clearinghouse itself can reduce monitoring incentives which subsequently
increases moral hazard and counterparty risk. Biais et al. (2012) also note that a reduction in idiosyncratic
risk from clearing may endogenously increase systematic risk taking and Menkveld, et al. (2013) point
out that if the introduction of clearinghouse causes increases in collateral and margin requirements, then
the effect of funding and market liquidity on asset prices makes the response of prices theoretically
ambiguous (see also Garleanu and Pedersen 2011). Therefore, the effect of the introduction of a
clearinghouse on asset prices remains inevitably an empirical question.
Unfortunately, empirical evidence on the role of clearing is still limited and the effects on
counterparty risk are mixed. Examining the introduction of a clearinghouse for Nordic equities in 2009,
Menkveld et al. (2013) find that clearing reduces asset values, but Loon and Zhong (2013) show that the
clearing of credit derivative contracts in 2009 actually increased their values. Interpretation of these
opposing empirical results can be challenging because in both cases clearing was driven by the collapse of
Lehman Brothers in the fall of 2008 and the resulting financial crisis. It is hard to know if the
introduction of a clearinghouse in those markets was co-incident with the subsequent deterioration or
improvement in fundamental value and risk of those securities chosen to be cleared. It is precisely
because the introduction of the clearinghouse was a response to a crisis that makes it problematic to
attribute any changes in liquidity or counterparty risk to the clearinghouse and why it is important to
control for economic conditions.
Fortunately, history provides an experiment to study the effects of a clearinghouse on
counterparty risk where we can directly control for fundamental value. During the late 19th and early 20th

3
centuries, the Consolidated Stock Exchange (CSE) was a major exchange that competed head-to-head
with the Big Board, traded many NYSE-listed securities, and as noted by Brown et al. (2008) averaged
more than a 50 market percent share during the 1890s. Located across the street from the NYSE, the CSE
netted stock transactions through a clearinghouse starting in 1886, while the NYSE did not until May of
18924. Using identical securities on the two exchanges, we compare relative prices on the NYSE with
those on the CSE both before and after the introduction of the NYSE clearinghouse which allow us to
control for changes in fundamental security value and volatility. This allows for clean identification of the
causal effect on asset prices of the introduction of the clearinghouse by controlling for economic
conditions in a way that is difficult to replicate with modern data5. We also examine the relative prices for
more than 30 years following the introduction of clearing allowing us to observe the behavior during
periods of relative calm and crisis, as well as allowing time for endogenous general equilibrium effects by
market participants.
We find that the introduction of netting on the NYSE increased the value of stocks relative to the
CSE by 24bps. Consistent with the findings in McSherry et al. (2013), who document a decline in broker
defaults on the NYSE after the introduction of clearing, the empirical results suggest that clearing
increases rather than reduces equity values. Because brokers had to fund positions overnight, daily
borrowing rates were a major determinant of counterparty risk. Prior to the introduction of clearing, a one
standard deviation (3.7 percentage point) increase in the overnight collateralized borrowing rate for
brokers, also known as the call loan rate, is associated with an 8bp decline in the value of a stock on the
NYSE relative to the identical security on the CSE. After the introduction of clearing, shocks to the call
loan rate no longer affect prices on the NYSE relative to the CSE, suggesting a decline in the volatility of
NYSE prices. Consistent with this prediction, we find that relative to the CSE, annualized NYSE return
volatility is reduced by 90-173bps immediately following the introduction of clearing and remains low,
even during subsequent financial crises, in the subsequent 34 years.
Clearing on the NYSE was also introduced in stages, so we also examine the staggered
introduction and find that at least half of the average reduction in counterparty risk is driven by a
reduction in contagion risk through spillovers in the trader network. We run a series of robustness tests to
demonstrate that our results are driven by changes in counterparty risk coming from the introduction of
4 The CSE began competing head-to-head with the NYSE in 1885 when the rival exchange began trading securities on the Big Board using their ticker. This action set off a lengthy legal battle between the two exchanges with the NYSE ultimately establishing ownership of its price quotes (Mulherin et al. 1991). 5 The beginning of multilateral net settlement through a clearinghouse on the NYSE in 1892 was driven by a variety of factors, most notably financial panics in the early 1890s (McSherry and Wilson 2013). This again highlights the need to use the CSE as a control to cleanly identify the effect of counterparty risk.
4
clearing, rather than changes in asynchronous trading, market liquidity improvements on the NYSE, a
decrease in market liquidity on the CSE, or financial crises. Our results do not hold without the CSE
control, demonstrating again the importance of controlling for macro-economic changes in fundamental
value and volatility co-incident with the introduction of a clearinghouse. We also find that the
introduction of mutualization of risk and a formal centralized counter party (CCP) by the NYSE
clearinghouse in April of 1920 does not alter the benefits found from the introduction of centralized
clearing with multi-lateral netting in 1892, providing additional evidence consistent with a role for CCPs
in improving financial stability in asset markets.
Section 2 begins with a brief historical background on the introduction of clearing on the NYSE.
We describe the data used in Section 3. In Section 4, we present the empirical methodology and
predictions. We discuss the empirical results in Section 5. Section 6 concludes the paper.
2 Historical and Institutional Background 2.1 Trading on the NYSE Prior to Clearing Like OTC derivatives today, NYSE equities settled on a bilateral rather than a multilateral basis
prior to the introduction of a clearinghouse in 1892. In the absence of multilateral netting, brokers are
required to write and receive checks/securities for every transaction. To illustrate, consider the
hypothetical set of transactions in Example 1.
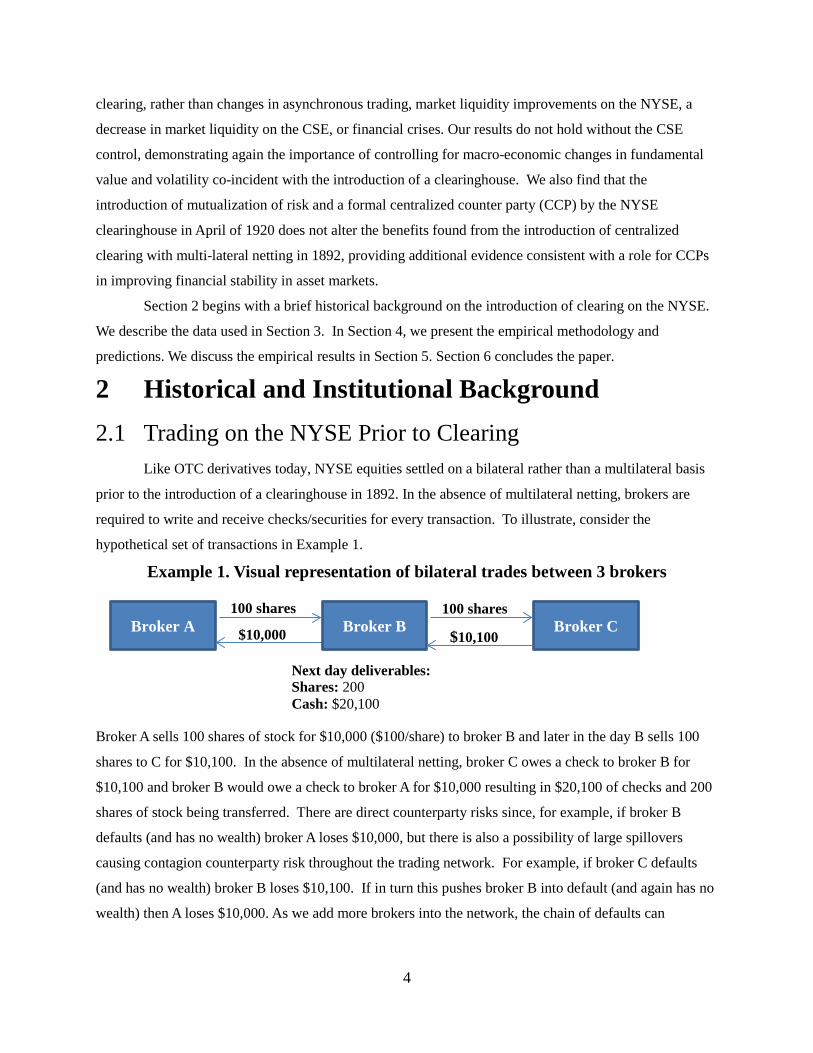
Example 1. Visual representation of bilateral trades between 3 brokers
Broker A sells 100 shares of stock for $10,000 ($100/share) to broker B and later in the day B sells 100
shares to C for $10,100. In the absence of multilateral netting, broker C owes a check to broker B for
$10,100 and broker B would owe a check to broker A for $10,000 resulting in $20,100 of checks and 200
shares of stock being transferred. There are direct counterparty risks since, for example, if broker B
defaults (and has no wealth) broker A loses $10,000, but there is also a possibility of large spillovers
causing contagion counterparty risk throughout the trading network. For example, if broker C defaults
(and has no wealth) broker B loses $10,100. If in turn this pushes broker B into default (and again has no
wealth) then A loses $10,000. As we add more brokers into the network, the chain of defaults can
$10,100 $10,000
100 shares 100 shares Broker A Broker B Broker C
Next day deliverables: Shares: 200 Cash: $20,100

5
multiply. Depending on how interconnected the trading network is, the spillover from contagion could be
a substantial component of total counterparty risk. Eliminating counterparty risk for security A should
also reduce the counterparty risk of security B even if it is unrelated because there is less chance of a
broker, or brokers he is trading with, defaulting on positions. For clarity we refer to the counterparty risk
caused by network spillovers as contagion risk and the remaining as direct counterparty risk.
At the time the NYSE clearinghouse was introduced, securities traded on the NYSE settled at
time T+1, which meant all brokers were required to deliver gross checks/securities from trades by the
next day at 2:15pm. Brokers engaged in transactions with numerous other brokers throughout the day, so
they rarely had enough assets on hand to pay every single transaction. Customers also bought securities
on margin so brokers would often have to borrow the additional funds necessary. Therefore, banks were
forced to extend significant uncollateralized credit and day loans to brokers to allow them to fulfill their
daily contracts. This practice was called overcertification since banks endorsed checks which certified an
amount greater than the balance in the broker’s account6, effectively providing short-term leverage to
brokers to finance their daily positions. This bears similarities to modern broker-dealers who use the repo
market and asset-backed commercial paper to provide short-term financing for trades in the OTC
markets7. McSherry and Wilson (2013) find that leverage, measured as the value of certified checks
divided by total capital, for 9 “broker banks” increased from 1.4 to 9.0 from 1875 to 1882. Anecdotal
evidence suggests even higher leverage ratios in the 1890s.
Just as short-term collateralized financing rates in the modern period are set by repo rates,
brokers would also finance positions via overnight collateralized borrowing organized on the floor of the
NYSE. The rate to buy and sell securities on margin via these overnight collateralized loans was known
as the call loan rate. The call loan rate could fluctuate wildly depending on the market environment.
Short-term interest rates were prone to seasonal increases during the harvest months and tended to
increase dramatically during late nineteenth and early twentieth century banking panics (Miron 1986,
Bernstein et al. 2010). For example, the call loan rate reached a daily annualized value of 125 percent
during the Panic of 1907 (Moen and Tallman 2003).
The volatility of funding costs to finance overnight positions led to a significant number of broker
defaults and increased counterparty risk. McSherry et al. (2013) find evidence of a statistically significant
relationship between spikes in call loan rates and broker insolvencies during this period.
Contemporaneous researchers, such as Sprague (1903), also blamed the immediacy of the liquidity
6 While technically illegal, overcertification was endemic during the period and used by most brokers and banks to finance their overnight positions. 7 It is worth noting though while that lending in modern repo markets also extends massive credit on an intraday basis, this lending is done on a fully collateralized basis. We thank an anonymous referee for raising this point.

6
requirements inherent in the NYSE system of daily settlement for broker failures; which tended to spike
during periods of financial stress. During periods of panic, buyers might walk away from buy orders,
leaving brokers with losses and potential defaults on overcertified checks. Anticipating this outcome, Wall
Street banks and trust companies that normally participated in overcertification might withdraw the
privilege extended to brokers. This is exactly what happened in the Panic of 1873 when banks suspended
overcertification to NYSE brokers. This action led to a suspension of trading for nine days and 57 broker
failures (Eames, 1894). By early 1892, R. L. Edwards, the President of the Bank of the State of New
York, threatened that certification for brokers would be cut unless decisive action was taken to lessen the
strain on bank lending and clerks8. NYSE President Francis L. Eames subsequently pushed for the
creation of the New York Stock Exchange Clearinghouse in May of 1892 which engaged in multi-lateral
netting across all NYSE members (Pratt 1909).
The NYSE clearinghouse function would then be extended in April of 1920 to include
mutualization of risk by acting as a centralized counterparty on trades between all members. The
staggered timing of the introduction of centralized clearing and then mutualization of risk provide a novel
setting to try and distinguish the effects of the two major functions of modern clearinghouses9. The
analysis in 1920 is made more challenging though since accusations of fraud on the Consolidated Stock
Exchange in February of 1922, which led to its eventual downfall, limit our identification strategy in the
post-mutualization period. We therefore focus our primary analysis on the introduction of clearing in
1892, but also briefly examine the introduction of mutualization in 1920.
2.2 Timing of Introduction of Clearing on the NYSE
On May 17th, 1892 the New York Stock Exchange introduced multilateral netting for four firms.
The decision to introduce clearing was driven by the financial panics of the early 1890s, concerns that
8 Meeker (1922) also documents that without the introduction of multilateral netting, it would have been physically impossible to maintain daily settlement. If, however, physical constraints rather than counterparty risk were the main reason for the introduction of multilateral netting, a perhaps more plausible response would have been to increase the settlement period. 9 Securities market clearinghouses serve two primary and distinct functions; multilateral netting and mutualization of risk. Since clearinghouses observe all trades on a given exchange they can net transactions across traders in an attempt to reduce the size outstanding liabilities and subsequent counterparty risk. The NYSE clearinghouse in 1892 engaged in exactly this sort of netting function and is the primary function of clearing analyzed in this paper. In today’s regulatory environment clearinghouses are also typically mandated to provide mutualization of risk by including themselves as counterparties in all transactions. In order to more clearly assess the modern implications of our analysis we also explore the introduction of mutualization of risk by the NYSE clearinghouse in 1920, but are limited by the length of time available for our empirical methodology in the post-mutualization period.

7
banks would restrict overcertification again, as well as evidence on the effectiveness of multilateral
netting used on the Consolidated Stock Exchange10. Because many NYSE stocks were already clearing on
the Consolidated Exchange, we can disentangle the effects of economic events from the effects of
clearing on counterparty risk. As indicated in the clearinghouse meeting minutes, the NYSE had pre-
scheduled meeting dates and decided “the list of stocks to be cleared will be enlarged as members become
familiar with the clearing system.” Since having some NYSE stocks clearing had spillover benefits
through a reduction in contagion risk for the remainder, the staged and independent timing of the
introduction multilateral netting for different securities allows separate identification of contagion and
direct counterparty risk. The NYSE continued to have meetings and clear additional stocks throughout the
1890s and by the end of 1893, most of the major securities were clearing11.
2.3 Trading on the NYSE after Clearing To understand the benefits of the introduction of clearing on the NYSE, we examine multilateral
netting between three brokers. A hypothetical set of transactions is shown in Example 2.
Example 2. Visual representation of trades between 3 brokers w/ clearing
Each transaction a broker made was recorded on the broker’s clearance sheet for a given day. In our
example, A’s clearance sheet had a single sale, C’s clearing sheet had a single purchase, and B’s clearance
sheet had a purchase and a sale. It is at this stage that netting occurred – and here, netting occurred only
for B. B bought 100 shares for $10,000 and then immediately sold them for $10,10012. The purchase and
10 In fact, by 1892 there were numerous examples of effective clearing systems in the United States, including the establishment of a clearinghouse for New York City bank deposits in 1853 (Gorton 1985) and for commodity trading on the Chicago Board of Trade in 1883 (Kroszner 1999). 11 For example, by the end of 1893 more than 80% of NYSE volume in Dow Jones stocks was clearing. 12 This simple example overlooks one complication. In reality for ease of netting, delivery prices were not simply what one paid or sold his or her shares for, but were instead determined by the Clearinghouse. At the end of each day, representatives set a price based on the quotation of the last day’s sales, which was then announced over the ticker. Small additional checks were then written between parties to account for the differences between the delivery prices and the actual executed prices (Pratt 1909).
$10,000
100 shares Broker A
Broker B
Broker C
Next day deliverables: Shares: 100 Cash: $10,100

8
sale were netted out and B received the difference of $100. Broker A had a balance to deliver 100 shares
valued at $10,000 and C had a balance to deliver of $10,100. Therefore, A wrote a draft on the
Clearinghouse of $10,000; B wrote a draft for $100, and C wrote a check to the Clearinghouse of
$10,100. By 10:00 a.m. the next day, the Clearinghouse returned a complete statement to each firm,
specifying to whom a delivery must be made by 2:15 p.m. that day (here A delivered to C). Creditors to
the Clearinghouse received checks for their remaining balances by noon, which were then deposited in the
bank (American Bankers Association 1910)13.
Under gross bilateral clearing, there were $20,100 worth of checks and 200 shares which could be
defaulted on, but after multilateral netting there were only $10,100 worth of checks and 100 shares to be
transferred. In this case there is a reduction in direct ex-post counterparty risks since with multilateral
netting, if broker B defaulted (and had no wealth) broker A lost nothing. There was also a reduction in
spillovers causing contagion counterparty risk throughout the trading network. For example, if broker C
defaulted (and had no wealth) broker A lost $10,000 and if broker A defaulted (and had no wealth) broker
B lost only $100. With multilateral netting, typically the chain of defaults does not grow as we quickly as
it would with bilateral netting when we add more brokers into the network.
Anecdotal evidence suggests that the NYSE clearinghouse may have been successful in reducing
counterparty risk on the NYSE in the years immediately following its establishment. In the post
clearinghouse period (i.e. between 1892 and 1920), Pratt (1909) estimated that the demand for day loans
from certifying banks decreased by nearly 65 percent, and 90 percent of all checks were eliminated. On
average, transactions in securities valued at $25 million necessitated only $5 million to change hands. In
one case, 204,000 shares, valued at $12.5 million were settled by a payment of only $10,000 (Meeker
1922).
That being said, anecdotal evidence of the effect of multi-lateral netting on counterparty risk
through contagion is mixed. The Chicago Board of Trade introduced a “ring” settlement system in 1883
similar to the one introduced on the NYSE and in 1902 the bankruptcy of member George Phillips led to
losses for more than 42 percent of members of the Board (Kroszner 1999, Moser 1998). Direct measures
of broker insolvencies also may not necessarily provide the full picture, since changes in counterparty risk
caused by a clearinghouse could lead to differences in margin requirements, borrowing rates, and
commissions between customers, brokers, and/or banks. The aggregate effect of all these channels should
show up in prices, either through expected losses from counterparties or changes in the discount rate
coming from volatility in counterparty risk and/or margin-driven asset pricing changes (Garleanu and
13 These exact times may have varied throughout the years, but they provide a rough picture of the daily operations of the Clearinghouse.

9
Pedersen 2011). Another challenge in interpreting effects is controlling for the counterfactual changes in
broker defaults and security value and volatility in the absence of a clearinghouse.
2.4 Consolidated Stock Exchange: An Ideal Control As illustrated in the timeline in figure 1, the Consolidated Stock Exchange, also known as the
“Little Board,” was established in New York City in 1885 with 2,403 members14 and provides an
excellent control for our difference-in-difference analysis of the effect of the introduction of clearing. The
Little Board competed head-to-head with the NYSE (Michie 1986). The rival exchange averaged a
respectable 23 percent market share (Brown et al. 2008) over its 40-year history although CSE stocks
generally had less trading volume and market liquidity than the same security on the Big Board. While the
NYSE waited until 1892 to introduce clearing, the CSE began multilateral net settlement in 1886. As
noted by McSherry and Wilson (2013), one reason that the NYSE introduced clearing was that the CSE
had “reduced financing needs and also lowered counterparty risk and broker defaults” by netting through
a clearinghouse.
We provide some suggestive evidence of the impact of the clearinghouse on the CSE by hand-
collecting information on broker defaults from the annual reports of the Consolidated Stock and
Petroleum Exchange of New York. Consistent with the contemporaneous accounts, the CSE clearinghouse
was successful in minimizing counterparty risk. We find that losses from broker defaults were less than
0.03% of total trading volume in 1893, a year that included one of the most severe financial panics in
American history.
Therefore, prices on the CSE for NYSE-CSE dual-listed stocks provide an almost ideal control
for the price response on the NYSE to the introduction of clearing15. This is why the introduction of
14 Based on annual reports of the Consolidated Stock and Petroleum Exchange of New York. 15 The CSE and NYSE also had similar governance structures and internal regulations. Both exchanges were cooperatively owned and governed by their members, with a board of governors, including a president, elected by members of the exchange, and committees with members appointed by the president overseeing various functions of the exchange. The constitution of both exchanges also allowed either party in the transaction for the sale or purchase of stocks, bonds, or any outstanding contracts, to call, at any time, a mutual deposit of cash for margin, with as little as thirty minutes notice. The NYSE and CSE allowed any party to demand maintenance margins of 5 percent, while the NYSE and CSE constitutions provided for initial margin requirements of 10 and 5 percent respectively. In practice though it is unclear if these minimal margin constraints were actually binding. As noted in a report by the CSE’s Governor’s Committee on Securities and Commodities in 1909, “the amount of margin which a broker requires from a speculative buyer of stocks depends, in each case, on the credit of the buyer”. Based on minutes from the NYSE’s Insolvency Committee from 1876-1925 brokers were occasionally removed from the exchange for “reckless dealing” because they required insufficient margins from customers. Even among this subset of potentially

10
clearing on the NYSE can be used to identify the causal effects of multilateral netting. In addition to
having cross-listed securities, we also benefit from the close proximity of the two exchanges. Since the
two exchanges were across the street from each other, arbitrageurs could effectively prevent price
discrepancies between the two exchanges not caused by “real differences” such as market illiquidity or
counterparty risk premia. Nelson (1907) dedicates an entire chapter to the “expertise” of arbitrageurs on
the Consolidated who were, he felt, only exceeded in their expertise by the arbitrageurs on the NYSE. In
fact, in table A4 of the online appendix we show that more than 92% of all variation of individual NYSE
stock returns can be explained by the returns of identical securities listed at the same time on the CSE16.
Another benefit of their close proximity is that both exchanges paid in the same currency. Cross-listed
securities in markets quoted in different currencies are confounded by the need to convert currencies
using OTC foreign exchange (FX) markets. Normally this is not problematic, but since these markets are
OTC, during times of financial distress, FX swaps may also include potentially significant counterparty
risk. For example, Levich (2011) shows that immediately following the Lehman bankruptcy covered
interest rate parity in the highly liquid FX swap GBP/USD deviated from no arbitrage conditions (in the
absence of counterparty risk) by hundreds of basis points17.
3 Data Description 3.1 Security Market Data
We focus our empirical analysis on common stocks in the Dow Jones Indices using monthly data
from September 1886 – December 1925 because these securities tended to be very liquid and traded on
both the NYSE and CSE (Brown et al. 2008). We use the original Dow Jones Index from September 1886
until October 1896, when the index is then split into the Dow Jones Railroad Index and the Industrial
reckless brokers the majority reported margins of 5%-8% and sometimes as high as 25%, depending on the reported trustworthiness of customers. All additional information on governance structure come from the Constitution of the New York Stock Exchange and Constitution of the Consolidated Stock Exchange from 1892. 16 By comparison, Lewellen (2014) regresses monthly stock returns on lagged individual firm stock returns, size, and book-to-market ratios and on average only explains 3.3% of cross-sectional variation in NYSE stock returns from 1964-2013. Even when including 15 lagged stock-specific individual factors expected to explain stock returns, he finds that less than 8% of cross-sectional variation in returns are explainable. 17 Another benefit of proximity, besides the ones previously emphasized, is that since both exchanges were in the same time zone, daily data on opening and closing prices are easily comparable. This is not only because it reduces timing mismatches in the quotes, but also because they are comparable periods of the trading day. Oftentimes opening and closing price behavior can behave differently and while high frequency quotes allow for quotations across time zones at the same time of day this can’t be done while also preserving the period of the trading day considered.

11
Index. We use hand-collected data from the New York Times and Commercial and Financial Chronicle
for each security in the index at a given point in time and rely on Farrell (1972) for changes in the
composition of the indices. Data are sampled from the last trading day of each month. We collected firm-
specific information on NYSE high, low, open, and closing transaction prices, bid and ask closing prices,
and trading volume. For NYSE stocks listed on the CSE, we use data on CSE closing prices as well as
CSE trading volume. We also use hand-collected monthly data on seat prices for the NYSE and CSE for
the period 1888-1925 from the Commercial and Financial Chronicle. In addition, we collect daily closing
bid and ask quotes on the NYSE starting in 189318. We also use end-of-month broker call loan rates from
the NBER macro-history database for the entire sample period.
For robustness checks, we hand-collected daily data on high, low, close, and open transaction
prices as well as trading volumes from January 1892- December 1901 for all stocks on the NYSE, CSE,
and the Boston Stock Exchange (BSE). Closing prices for the BSE are collected from the Boston Globe
from 1892-1901 at a weekly frequency. We construct an absolute difference estimator using daily high,
low, open, and closing transaction prices to estimate CSE bid-ask spreads and NYSE bid-ask spreads
prior to 1893. Our estimated NYSE bid-ask spreads have an 88 percent correlation with actual bid-ask
spreads on the Big Board from 1892-1925. Our estimator performs slightly better in-sample than one used
by Corwin and Schultz (2012), which has an 81 percent correlation with actual NYSE spreads over the
same period. In addition, our estimator has the desirable property, since unlike that used by Corwin and
Schultz, it is always positive, which was not the case for our Corwin-Schultz bid-ask estimates in our
sample period. For more details on the methodology and a comparison of the bid-ask spreads see online
appendix B.
3.2 Clearinghouse Data The NYSE started clearing securities in stages, beginning with four stocks in May 17th, 1892,
followed by four additional stocks each week. By 1894, more than 90 percent of volume was cleared on
the exchange and only a handful of stocks were subsequently added to the clearinghouse each year19. The
dates stocks were added and dropped from clearing on the NYSE were reported in the minutes of the
Committee on the Clearinghouse of the New York Stock Exchange at the New York Stock Exchange
18 Beginning on May 24, 1882, the New York Times reports NYSE bid-ask spreads on a daily basis. The data on daily bid-ask spreads continue through April 14, 1886. Between April 15, 1886, and May 12, 1893, the New York Times does not report bid-ask spreads for the NYSE. In this time interval, we gather monthly bid-ask spread data from the Commercial and Financial Chronicle. The bid-ask spread data are reported for Thursday trading and are matched with the appropriate trading volume data from the New York Times. 19 Authors’ calculations.
12
archives. The minutes of the clearinghouse were useful for understanding the function and
implementation of netting trades on the exchange. Data on broker defaults on the NYSE were collected
from the NYSE archives Committee on Admissions and List of Suspended Members. Information on CSE
broker defaults were collected from the Annual Reports of the Consolidated Stock and Petroleum
Exchange of New York.
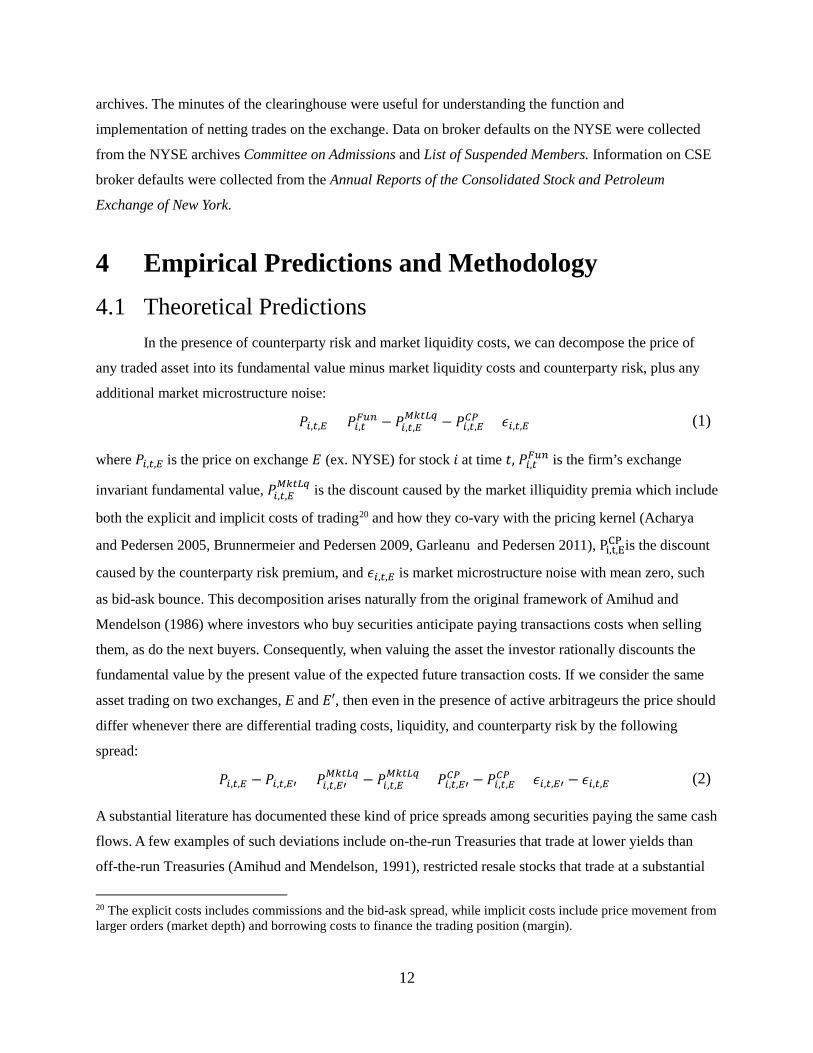
4 Empirical Predictions and Methodology 4.1 Theoretical Predictions
In the presence of counterparty risk and market liquidity costs, we can decompose the price of
any traded asset into its fundamental value minus market liquidity costs and counterparty risk, plus any
additional market microstructure noise:
𝑃𝑃𝑖𝑖,𝑡𝑡,𝐸𝐸 = 𝑃𝑃𝑖𝑖,𝑡𝑡𝐹𝐹𝐹𝐹𝐹𝐹 − 𝑃𝑃𝑖𝑖,𝑡𝑡,𝐸𝐸𝑀𝑀𝑀𝑀𝑡𝑡𝑀𝑀𝑀𝑀 − 𝑃𝑃𝑖𝑖,𝑡𝑡,𝐸𝐸
𝐶𝐶𝐶𝐶 + 𝜖𝜖𝑖𝑖,𝑡𝑡,𝐸𝐸 (1)
where 𝑃𝑃𝑖𝑖,𝑡𝑡,𝐸𝐸 is the price on exchange 𝐸𝐸 (ex. NYSE) for stock 𝑖𝑖 at time 𝑡𝑡, 𝑃𝑃𝑖𝑖,𝑡𝑡𝐹𝐹𝐹𝐹𝐹𝐹 is the firm’s exchange
invariant fundamental value, 𝑃𝑃𝑖𝑖,𝑡𝑡,𝐸𝐸𝑀𝑀𝑀𝑀𝑡𝑡𝑀𝑀𝑀𝑀 is the discount caused by the market illiquidity premia which include
both the explicit and implicit costs of trading20 and how they co-vary with the pricing kernel (Acharya
and Pedersen 2005, Brunnermeier and Pedersen 2009, Garleanu and Pedersen 2011), Pi,t,ECP is the discount
caused by the counterparty risk premium, and 𝜖𝜖𝑖𝑖,𝑡𝑡,𝐸𝐸 is market microstructure noise with mean zero, such
as bid-ask bounce. This decomposition arises naturally from the original framework of Amihud and
Mendelson (1986) where investors who buy securities anticipate paying transactions costs when selling
them, as do the next buyers. Consequently, when valuing the asset the investor rationally discounts the
fundamental value by the present value of the expected future transaction costs. If we consider the same
asset trading on two exchanges, E and 𝐸𝐸′, then even in the presence of active arbitrageurs the price should
differ whenever there are differential trading costs, liquidity, and counterparty risk by the following
spread:
𝑃𝑃𝑖𝑖,𝑡𝑡,𝐸𝐸 − 𝑃𝑃𝑖𝑖,𝑡𝑡,𝐸𝐸′ = 𝑃𝑃𝑖𝑖,𝑡𝑡,𝐸𝐸′𝑀𝑀𝑀𝑀𝑡𝑡𝑀𝑀𝑀𝑀 − 𝑃𝑃𝑖𝑖,𝑡𝑡,𝐸𝐸
𝑀𝑀𝑀𝑀𝑡𝑡𝑀𝑀𝑀𝑀 + 𝑃𝑃𝑖𝑖,𝑡𝑡,𝐸𝐸′𝐶𝐶𝐶𝐶 − 𝑃𝑃𝑖𝑖,𝑡𝑡,𝐸𝐸
𝐶𝐶𝐶𝐶 + 𝜖𝜖𝑖𝑖,𝑡𝑡,𝐸𝐸′ − 𝜖𝜖𝑖𝑖,𝑡𝑡,𝐸𝐸 (2)
A substantial literature has documented these kind of price spreads among securities paying the same cash
flows. A few examples of such deviations include on-the-run Treasuries that trade at lower yields than
off-the-run Treasuries (Amihud and Mendelson, 1991), restricted resale stocks that trade at a substantial
20 The explicit costs includes commissions and the bid-ask spread, while implicit costs include price movement from larger orders (market depth) and borrowing costs to finance the trading position (margin).
13
discount to publicly traded stock (Silber 1992), corporate bond vs. identical name CDS spreads (Duffie
2010), and corporate bond variations in spreads among identical CDS contracts (Arora, Gandhi, and
Longstaff 2012). The sign of these deviations depend on the relative trading costs in both markets and
whether costs are born more by buyers or sellers. A number of empirical papers including work by Jones
(2001), Amihud (2002), and Acharya and Pedersen (2005), have documented that in modern markets
stocks that are more illiquid trade at discounted prices and have higher expected returns. These results are
also consistent with research on fire sales in asset prices (Coval and Stafford 2006, Benmelech and
Bergman 2011) where sellers of assets are those in need of liquidity and thus willing to sell the security at
a discount, which means that market illiquidity cost asymmetrically affect market participants and
subsequently alter traded asset prices. So holding counterparty risk constant, if market liquidity were
better (ex. lower bid-ask spreads) on exchange E than on 𝐸𝐸′ we would expect the prices for identical
securities on 𝐸𝐸′ to trade at a discount. If on the other hand, market liquidity is lower on exchange E, but
counterparty risk is higher on E than 𝐸𝐸′ then the direction of the price spread is ambiguous. Since traders
that face a liquidity shock are more likely to be asset sellers and a high counterparty risk in transactions,
securities that trade on exchanges with higher counterparty risk are likely to trade at a relative discount.
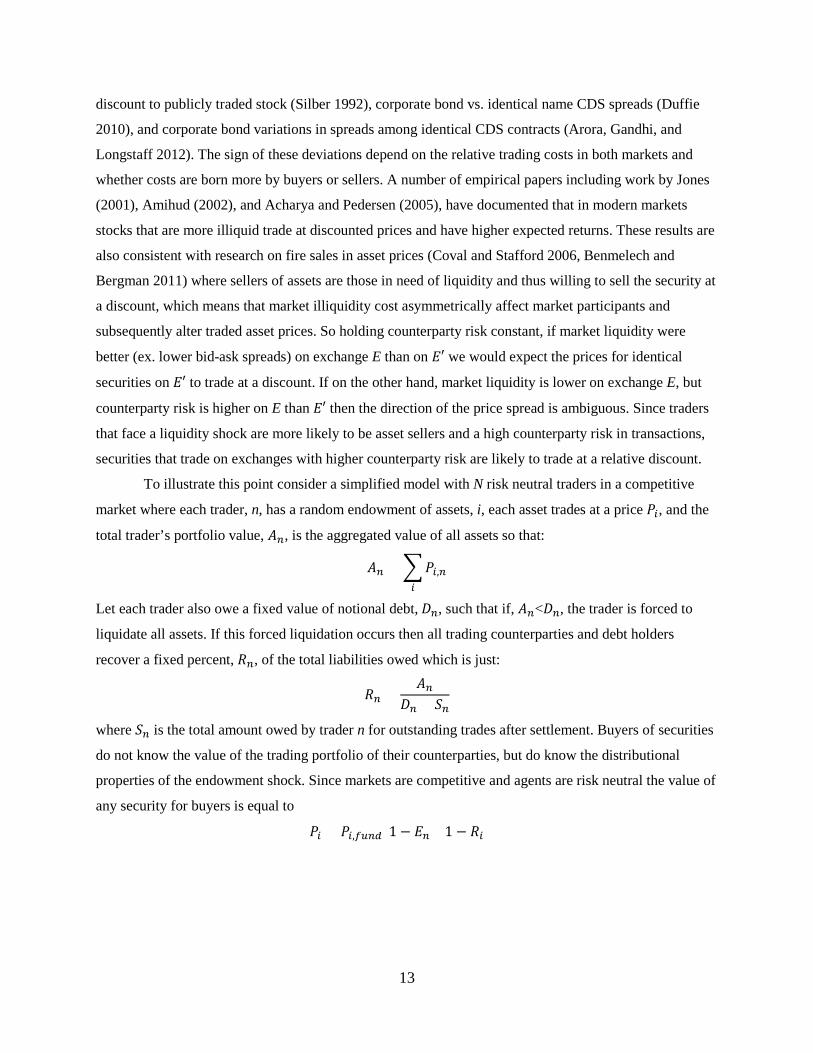
To illustrate this point consider a simplified model with N risk neutral traders in a competitive
market where each trader, n, has a random endowment of assets, i, each asset trades at a price 𝑃𝑃𝑖𝑖, and the
total trader’s portfolio value, 𝐴𝐴𝐹𝐹, is the aggregated value of all assets so that:
𝐴𝐴𝐹𝐹 = �𝑃𝑃𝑖𝑖,𝐹𝐹𝑖𝑖
Let each trader also owe a fixed value of notional debt, 𝐷𝐷𝐹𝐹, such that if, 𝐴𝐴𝐹𝐹<𝐷𝐷𝐹𝐹, the trader is forced to
liquidate all assets. If this forced liquidation occurs then all trading counterparties and debt holders
recover a fixed percent, 𝑅𝑅𝐹𝐹, of the total liabilities owed which is just:
𝑅𝑅𝐹𝐹 =𝐴𝐴𝐹𝐹
𝐷𝐷𝐹𝐹 + 𝑆𝑆𝐹𝐹
where 𝑆𝑆𝐹𝐹 is the total amount owed by trader n for outstanding trades after settlement. Buyers of securities
do not know the value of the trading portfolio of their counterparties, but do know the distributional
properties of the endowment shock. Since markets are competitive and agents are risk neutral the value of
any security for buyers is equal to
𝑃𝑃𝑖𝑖 = 𝑃𝑃𝑖𝑖,𝑓𝑓𝐹𝐹𝐹𝐹𝑑𝑑(1− 𝐸𝐸𝐹𝐹[ (1 − 𝑅𝑅𝑖𝑖) ])

14
where 𝑃𝑃𝑖𝑖,𝑓𝑓𝐹𝐹𝐹𝐹𝑑𝑑 is the fundamental value of the security, in the absence of counterparty risk21, and
𝐸𝐸𝐹𝐹[ (1 − 𝑅𝑅𝑖𝑖) ] is the expected losses due to counterparty risk across all traders in asset i. As long as some
positive number of traders are forced to sell assets then buyers will rationally discount the value of these
securities. Since markets are competitive and subject to market clearing conditions (i.e. assets are in short-
run fixed net supply) traders only sell if forced to liquidate and all buyers of these securities are
unconstrained (no counterparty risk) traders. Only those traders forced to liquidate have recoveries less
than 100%, so counterparty risk induces a discounted price in equilibrium. As the expected recovery falls,
this premium rises. So in times of distress, when endowment dispersion is large, this premium should be
large, while in less turbulent times it could be close to zero. Just as in the case of other trading costs (ex.
bid-ask spreads, trading fees) considered in models of market illiquidity by a number of previous authors
including Amihud and Mendelson (1991), Acharya and Pedersen (2005), and Garleanu and Pedersen
(2011), counterparty risk costs are asymmetrically born by buyers and sellers leading to predicable price
changes in equilibrium.
4.2 Baseline Empirical Methodology The expected change in the NYSE price after the introduction of clearing equals the change in the stock
price caused by changes in the fundamental value minus changes in the expected market illiquidity and
counterparty risk premia, or equivalently:
E[Δ𝑃𝑃𝑖𝑖,𝑁𝑁𝑁𝑁𝑁𝑁𝐸𝐸] = 𝐸𝐸[Δ𝑃𝑃𝑖𝑖𝐹𝐹𝐹𝐹𝐹𝐹] − 𝐸𝐸[Δ𝑃𝑃𝑖𝑖,𝑡𝑡,𝑁𝑁𝑁𝑁𝑁𝑁𝐸𝐸𝑀𝑀𝑀𝑀𝑡𝑡𝑀𝑀𝑀𝑀 ] − 𝐸𝐸[Δ𝑃𝑃𝑖𝑖,𝑡𝑡,𝑁𝑁𝑁𝑁𝑁𝑁𝐸𝐸
𝐶𝐶𝐶𝐶 ] (3)
If we assume that the expected market illiquidity premium is unaffected by the introduction of
multilateral netting, an assumption which we will examine later, we can rewrite (3) as:
E[Δ𝑃𝑃𝑖𝑖,𝑁𝑁𝑁𝑁𝑁𝑁𝐸𝐸] = E[Δ𝑃𝑃𝑖𝑖𝐹𝐹𝐹𝐹𝐹𝐹] − 𝐸𝐸[Δ𝑃𝑃𝑖𝑖,𝑡𝑡,𝑁𝑁𝑁𝑁𝑁𝑁𝐸𝐸𝐶𝐶𝐶𝐶 ] (4)
where expected changes in price are driven by changes in expected fundamental value and the
counterparty risk premium.
We are interested in estimating 𝐸𝐸[Δ𝑃𝑃𝑖𝑖,𝑡𝑡,𝑁𝑁𝑁𝑁𝑁𝑁𝐸𝐸𝐶𝐶𝐶𝐶 ], the change in the counterparty risk premium caused
by the introduction of multilateral netting. If the introduction of the clearinghouse were exogenous, we
could simply estimate a panel regression
𝑃𝑃𝑖𝑖,𝑡𝑡,𝑁𝑁𝑁𝑁𝑁𝑁𝐸𝐸 = 𝛼𝛼𝑖𝑖 + D1{𝑐𝑐𝑐𝑐𝑐𝑐𝑐𝑐𝑐𝑐,𝑖𝑖,𝑡𝑡} + 𝜖𝜖𝑖𝑖,𝑡𝑡, (5)
21 Or other market trading costs, which for simplicity are excluded from this model.

15
where 1{𝑐𝑐𝑐𝑐𝑐𝑐𝑐𝑐𝑐𝑐,𝑖𝑖,𝑡𝑡} is a dummy variable indicating when a stock starts clearing and 𝐷𝐷 is the average
treatment effect of clearing on the stock price. The problem, as shown in equation (4), is that if the
introduction of clearing coincides with changes in the fundamental value of the firm, omitted variables
rather than counterparty risk changes could be driving results. Here, for example, the introduction of
clearing on the NYSE was driven, in part, by financial panics in the early 1890s (McSherry and Wilson
2013). Without an alternative identification strategy, it would be impossible to identify the effect of the
introduction of the NYSE clearinghouse. Fortunately, our historical experiment provides a unique
opportunity to do exactly this.
Ideally, to determine the effect of clearing on counterparty risk, we would have prices for
identical securities which do not experience any change in counterparty risk to control for changes in
asset value not related to clearing. Fortunately, such securities exist. During the late 19th and early 20th
centuries, stocks were dual-listed on the NYSE and CSE. Further, there was no change in the trading
environment at the CSE when the NYSE introduced its clearinghouse. For the CSE price we have
𝑃𝑃𝑖𝑖,𝑡𝑡,𝐶𝐶𝑁𝑁𝐸𝐸 = 𝑃𝑃𝑖𝑖,𝑡𝑡𝐹𝐹𝐹𝐹𝐹𝐹 − 𝑃𝑃𝑖𝑖,𝑡𝑡,𝐶𝐶𝑁𝑁𝐸𝐸𝑀𝑀𝑀𝑀𝑡𝑡𝑀𝑀𝑀𝑀−𝑃𝑃𝑖𝑖,𝑡𝑡,𝐶𝐶𝑁𝑁𝐸𝐸
𝐶𝐶𝐶𝐶 + 𝜖𝜖𝑖𝑖,𝑡𝑡,𝐶𝐶𝑁𝑁𝐸𝐸 (6)
Using the CSE prices as a control, the difference in prices between the dual-listed securities is:
𝑃𝑃𝑖𝑖,𝑡𝑡,𝑁𝑁𝑁𝑁𝑁𝑁𝐸𝐸 − 𝑃𝑃𝑖𝑖,𝑡𝑡,𝐶𝐶𝑁𝑁𝐸𝐸 = 𝑃𝑃𝑖𝑖,𝐶𝐶𝑁𝑁𝐸𝐸𝑀𝑀𝑀𝑀𝑡𝑡𝑀𝑀𝑀𝑀 − 𝑃𝑃𝑖𝑖,𝑁𝑁𝑁𝑁𝑁𝑁𝐸𝐸
𝑀𝑀𝑀𝑀𝑡𝑡𝑀𝑀𝑀𝑀 + 𝑃𝑃𝑖𝑖,𝑡𝑡,𝐶𝐶𝑁𝑁𝐸𝐸𝐶𝐶𝐶𝐶 − 𝑃𝑃𝑖𝑖,𝑡𝑡,𝑁𝑁𝑁𝑁𝑁𝑁𝐸𝐸
𝐶𝐶𝐶𝐶 + 𝜖𝜖𝑖𝑖,𝑡𝑡,𝑁𝑁𝑁𝑁𝑁𝑁𝐸𝐸 − 𝜖𝜖𝑖𝑖,𝑡𝑡,𝐶𝐶𝑁𝑁𝐸𝐸 (7)
where the fundamental value drops out of the equation. Then looking at the difference after the
introduction of clearing we have
E[Δ𝑃𝑃𝑖𝑖,𝑁𝑁𝑁𝑁𝑁𝑁𝐸𝐸] − E[Δ𝑃𝑃𝑖𝑖,𝐶𝐶𝑁𝑁𝐸𝐸] = 𝐸𝐸[Δ𝑃𝑃𝑖𝑖,𝑡𝑡,𝐶𝐶𝑁𝑁𝐸𝐸𝑀𝑀𝑀𝑀𝑡𝑡𝑀𝑀𝑀𝑀] − 𝐸𝐸[Δ𝑃𝑃𝑖𝑖,𝑡𝑡,𝑁𝑁𝑁𝑁𝑁𝑁𝐸𝐸
𝑀𝑀𝑀𝑀𝑡𝑡𝑀𝑀𝑀𝑀 ]− 𝐸𝐸[Δ𝑃𝑃𝑖𝑖,𝑡𝑡,𝑁𝑁𝑁𝑁𝑁𝑁𝐸𝐸𝐶𝐶𝐶𝐶 ] (8)
so that the difference-in-differences between the expected prices on the two exchanges is caused by
changes in the relative market illiquidity premium and changes in the counterparty risk premium on the
NYSE. If there is no change in clearing on the CSE, then the expected change in the CSE counterparty
risk premium, 𝐸𝐸[Δ𝑃𝑃𝑖𝑖,𝑡𝑡,𝐶𝐶𝑁𝑁𝐸𝐸𝐶𝐶𝐶𝐶 ], is zero and drops out of equation (8).
If the difference in expected market liquidity between the two exchanges is the same before and
after the introduction of clearing on the NYSE22, then the difference-in-difference in prices can be written
as
ΔE[𝑃𝑃𝑖𝑖,𝑡𝑡,𝑁𝑁𝑁𝑁𝑁𝑁𝐸𝐸]− ΔE[𝑃𝑃𝑖𝑖,𝑡𝑡,𝐶𝐶𝑁𝑁𝐸𝐸] = −𝐸𝐸[Δ𝑃𝑃𝑖𝑖,𝑡𝑡,𝑁𝑁𝑁𝑁𝑁𝑁𝐸𝐸𝐶𝐶𝐶𝐶 ] (9)
22 Of course, trading might migrate to the NYSE since the clearinghouse improved the NYSE trading environment which might also result in a degradation of trading conditions on the CSE. We examine this however, and as we show trading volumes and spreads on both exchanges remained relatively stable after the NYSE clearinghouse was introduced.
16
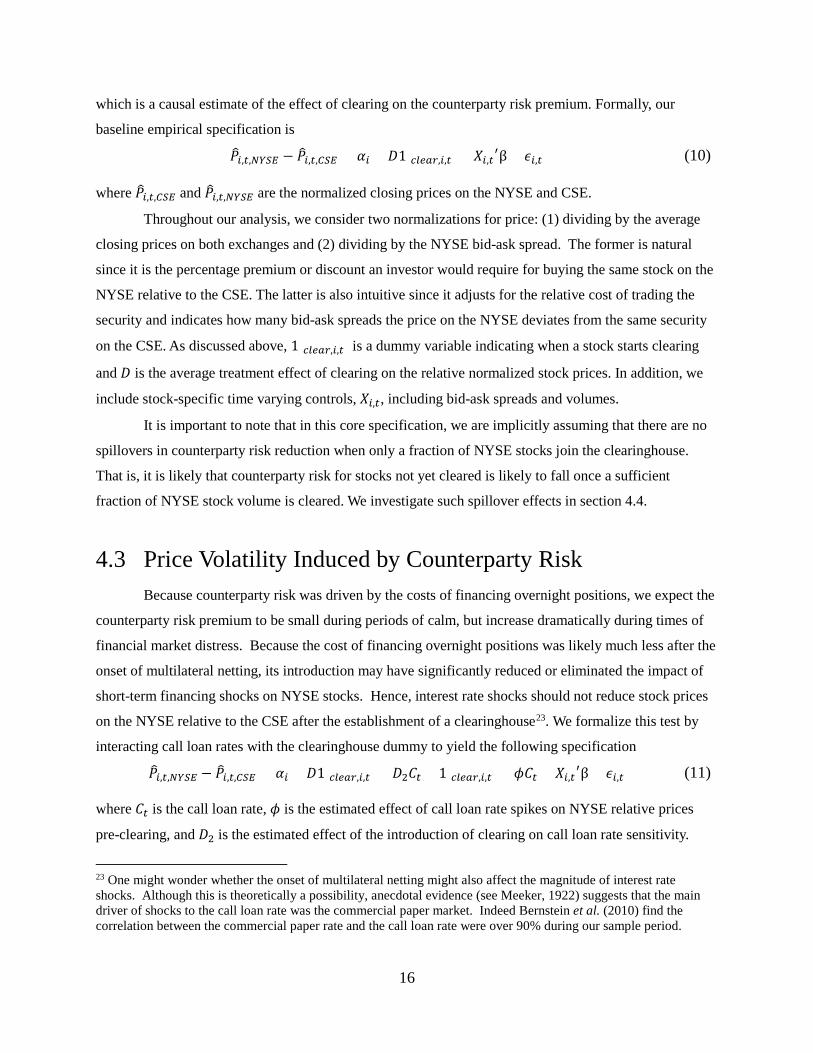
which is a causal estimate of the effect of clearing on the counterparty risk premium. Formally, our
baseline empirical specification is
𝑃𝑃�𝑖𝑖,𝑡𝑡,𝑁𝑁𝑁𝑁𝑁𝑁𝐸𝐸 − 𝑃𝑃�𝑖𝑖,𝑡𝑡,𝐶𝐶𝑁𝑁𝐸𝐸 = 𝛼𝛼𝑖𝑖 + 𝐷𝐷1{𝑐𝑐𝑐𝑐𝑐𝑐𝑐𝑐𝑐𝑐,𝑖𝑖,𝑡𝑡} + 𝑋𝑋𝑖𝑖,𝑡𝑡′β+ 𝜖𝜖𝑖𝑖,𝑡𝑡 (10)
where 𝑃𝑃�𝑖𝑖,𝑡𝑡,𝐶𝐶𝑁𝑁𝐸𝐸 and 𝑃𝑃�𝑖𝑖,𝑡𝑡,𝑁𝑁𝑁𝑁𝑁𝑁𝐸𝐸 are the normalized closing prices on the NYSE and CSE.
Throughout our analysis, we consider two normalizations for price: (1) dividing by the average
closing prices on both exchanges and (2) dividing by the NYSE bid-ask spread. The former is natural
since it is the percentage premium or discount an investor would require for buying the same stock on the
NYSE relative to the CSE. The latter is also intuitive since it adjusts for the relative cost of trading the
security and indicates how many bid-ask spreads the price on the NYSE deviates from the same security
on the CSE. As discussed above, 1{𝑐𝑐𝑐𝑐𝑐𝑐𝑐𝑐𝑐𝑐,𝑖𝑖,𝑡𝑡} is a dummy variable indicating when a stock starts clearing
and 𝐷𝐷 is the average treatment effect of clearing on the relative normalized stock prices. In addition, we
include stock-specific time varying controls, 𝑋𝑋𝑖𝑖,𝑡𝑡, including bid-ask spreads and volumes.
It is important to note that in this core specification, we are implicitly assuming that there are no
spillovers in counterparty risk reduction when only a fraction of NYSE stocks join the clearinghouse.
That is, it is likely that counterparty risk for stocks not yet cleared is likely to fall once a sufficient
fraction of NYSE stock volume is cleared. We investigate such spillover effects in section 4.4.
4.3 Price Volatility Induced by Counterparty Risk Because counterparty risk was driven by the costs of financing overnight positions, we expect the
counterparty risk premium to be small during periods of calm, but increase dramatically during times of
financial market distress. Because the cost of financing overnight positions was likely much less after the
onset of multilateral netting, its introduction may have significantly reduced or eliminated the impact of
short-term financing shocks on NYSE stocks. Hence, interest rate shocks should not reduce stock prices
on the NYSE relative to the CSE after the establishment of a clearinghouse23. We formalize this test by
interacting call loan rates with the clearinghouse dummy to yield the following specification
𝑃𝑃�𝑖𝑖,𝑡𝑡,𝑁𝑁𝑁𝑁𝑁𝑁𝐸𝐸 − 𝑃𝑃�𝑖𝑖,𝑡𝑡,𝐶𝐶𝑁𝑁𝐸𝐸 = 𝛼𝛼𝑖𝑖 + 𝐷𝐷1{𝑐𝑐𝑐𝑐𝑐𝑐𝑐𝑐𝑐𝑐,𝑖𝑖,𝑡𝑡} + 𝐷𝐷2𝐶𝐶𝑡𝑡 × 1{𝑐𝑐𝑐𝑐𝑐𝑐𝑐𝑐𝑐𝑐,𝑖𝑖,𝑡𝑡} + 𝜙𝜙𝐶𝐶𝑡𝑡 + 𝑋𝑋𝑖𝑖,𝑡𝑡′β+ 𝜖𝜖𝑖𝑖,𝑡𝑡 (11)
where 𝐶𝐶𝑡𝑡 is the call loan rate, 𝜙𝜙 is the estimated effect of call loan rate spikes on NYSE relative prices
pre-clearing, and 𝐷𝐷2 is the estimated effect of the introduction of clearing on call loan rate sensitivity.
23 One might wonder whether the onset of multilateral netting might also affect the magnitude of interest rate shocks. Although this is theoretically a possibility, anecdotal evidence (see Meeker, 1922) suggests that the main driver of shocks to the call loan rate was the commercial paper market. Indeed Bernstein et al. (2010) find the correlation between the commercial paper rate and the call loan rate were over 90% during our sample period.

17
Before the introduction of the NYSE clearinghouse, interest rate volatility and the volatility of
the NYSE-CSE price spread will move in response to fluctuations in counterparty risk. If we consider the
change in volatility of the price difference, instead of the expectation, and make slightly stronger
assumptions (relative to those needed to arrive at equation 9)24 then we can rewrite equation (9) as:
Δσ[𝑃𝑃𝑖𝑖,𝑡𝑡,𝑁𝑁𝑁𝑁𝑁𝑁𝐸𝐸 − 𝑃𝑃𝑖𝑖,𝑡𝑡,𝐶𝐶𝑁𝑁𝐸𝐸] = Δσ[𝑃𝑃𝑖𝑖,𝑡𝑡,𝑁𝑁𝑁𝑁𝑁𝑁𝐸𝐸𝐶𝐶𝐶𝐶 ] (12)
Equation (12) indicates that the change in the volatility of the price premium provides an estimate of the
change in counterparty risk volatility caused by clearing. We estimate the volatility of price spreads by
taking the absolute value of the price differences between the exchanges on each date normalized by the
average closing price on the exchanges and then scaling by a constant to generate an estimate for the
volatility25. In our robustness analysis, we also consider the volatility estimator using the ratio of the high
and low prices on each exchange presented in Parkinson (1980).
4.4 Counterparty Risk and Contagion Counterparty risk can be divided into two parts: contagion risk and direct counterparty risk.
Contagion risk is higher for an asset when a broker is more likely to default on other positions, starting a
cascade which results in default on a trade for that asset. When other stocks start to clear, contagion risk
is smaller, even if the asset is traded through a clearinghouse. We define the reduction in direct
counterparty risk as the direct effect of a stock clearing after accounting for any contagion risk reduction.
One of the benefits of analyzing the introduction of clearing on the NYSE is that clearing was introduced
in stages. Using prices on the CSE as a control again, we can decompose the volatility induced by
counterparty risk by estimating the following model
|𝑃𝑃�𝑖𝑖,𝑡𝑡,𝑁𝑁𝑁𝑁𝑁𝑁𝐸𝐸 − 𝑃𝑃�𝑖𝑖,𝑡𝑡,𝐶𝐶𝑁𝑁𝐸𝐸| = 𝛼𝛼𝑖𝑖 + 𝐷𝐷1{𝑐𝑐𝑐𝑐𝑐𝑐𝑐𝑐𝑐𝑐,𝑖𝑖,𝑡𝑡} + 𝛾𝛾𝑃𝑃𝛾𝛾𝛾𝛾𝛾𝛾𝐶𝐶𝛾𝛾𝛾𝛾𝛾𝛾𝛾𝛾𝑖𝑖,𝑡𝑡 + 𝑋𝑋𝑖𝑖,𝑡𝑡′β+ 𝜖𝜖𝑖𝑖,𝑡𝑡 (13)
24 Previously we assumed no changes in the relative market illiquidity premium. In this case we need to assume no changes in the volatility of the market illiquidity premium, but in addition we have to assume no change in the volatility of relative market microstructure noise or in the covariance between the counterparty risk premia, market illiquidity premia, and/or market microstructure premia. 25 If 𝑋𝑋~𝑁𝑁(𝜇𝜇,𝜎𝜎) then the absolute value of X is distributed folded-normally. Then if the expected normalized price difference is sufficiently small relative to the volatility then the volatility is proportional to the absolute value of X.
In particular, 𝜎𝜎 ≈ �𝜋𝜋2𝐸𝐸[|𝑋𝑋|]. In our analysis the expected normalized price difference is significantly smaller than
the volatility so our estimated volatility using this approximation are within ~1bp of the change in volatility accounting for any changes in the mean normalized price difference. For a complete discussion of the estimator and its properties see appendix B.

18
𝑃𝑃𝛾𝛾𝛾𝛾𝛾𝛾𝐶𝐶𝛾𝛾𝛾𝛾𝛾𝛾𝛾𝛾𝑖𝑖,𝑡𝑡 is the percentage of stocks already clearing.26 We also include a dummy for the stock that is
clearing which allows a natural interpretation for 𝐷𝐷 as the change in counterparty risk caused by direct
counterparty risk, while 𝛾𝛾 is the percent caused by a change in contagion risk. Since the breakdown of
these two types of risk depends on how connected traders of those securities are to the network of traders,
we would expect these to vary across securities. In particular we might expect securities with traders who
are more exposed to traders in the rest of the network, such as large firms with high volume securities, to
be more exposed to contagion risk27.
5 Results We first compare the sign and volatility of the counterparty risk premium before and after the
introduction of clearing on the NYSE. To do so, we reconsider equation (7):
𝑃𝑃𝑖𝑖,𝑡𝑡,𝑁𝑁𝑁𝑁𝑁𝑁𝐸𝐸 − 𝑃𝑃𝑖𝑖,𝑡𝑡,𝐶𝐶𝑁𝑁𝐸𝐸 = 𝑃𝑃𝑖𝑖,𝐶𝐶𝑁𝑁𝐸𝐸𝑀𝑀𝑀𝑀𝑡𝑡𝑀𝑀𝑀𝑀 − 𝑃𝑃𝑖𝑖,𝑁𝑁𝑁𝑁𝑁𝑁𝐸𝐸
𝑀𝑀𝑀𝑀𝑡𝑡𝑀𝑀𝑀𝑀 + 𝑃𝑃𝑖𝑖,𝑡𝑡,𝐶𝐶𝑁𝑁𝐸𝐸𝐶𝐶𝐶𝐶 − 𝑃𝑃𝑖𝑖,𝑡𝑡,𝑁𝑁𝑁𝑁𝑁𝑁𝐸𝐸
𝐶𝐶𝐶𝐶 + 𝜖𝜖𝑖𝑖,𝑡𝑡,𝑁𝑁𝑁𝑁𝑁𝑁𝐸𝐸 − 𝜖𝜖𝑖𝑖,𝑡𝑡,𝐶𝐶𝑁𝑁𝐸𝐸
Because the NYSE is more liquid than the CSE (Brown et al. 2008 and Table 1 summary statistics), the
price discount due to illiquidity should be smaller on the NYSE, 𝐸𝐸�𝑃𝑃𝑖𝑖,𝐶𝐶𝑁𝑁𝐸𝐸𝑀𝑀𝑀𝑀𝑡𝑡𝑀𝑀𝑀𝑀 − 𝑃𝑃𝑖𝑖,𝑁𝑁𝑁𝑁𝑁𝑁𝐸𝐸
𝑀𝑀𝑀𝑀𝑡𝑡𝑀𝑀𝑀𝑀� > 0. Therefore,
when counterparty risk is small, stocks should trade at a premium on the NYSE relative to the CSE. In
times of financial market crisis before stocks are cleared on the NYSE, stocks on the NYSE might well
trade at a discount instead because during crises, counterparty risk might be much larger on the NYSE
than on the CSE. Before the introduction of clearing on the NYSE then, stocks trade at a discount on the
NYSE when the counterparty risk premium is high and at a slight premium otherwise. If the introduction
of clearing on the NYSE eliminates (or substantially reduces) counterparty risk there, equation (7)
implies that that after the onset of clearing, prices on the Big Board should be consistently higher than
those on the CSE.
In figure 2 we plot the average for all Dow stocks of the 12-month moving average of the price
on the NYSE minus the price on the CSE normalized by the NYSE bid-ask spread. Prior to the
introduction of clearing this price difference is highly volatile, but after the introduction of clearing,
stocks on the NYSE consistently trade at a premium. In Table 2, we estimate equation (10) to show that
26 We consider weights by both $ sales and equally weighted, but focus on $ sales for our primary analysis since it is more representative of the actual volume of trading of the security. 27 While this seems intuitive since high trading volumes would seem to suggest more interconnected traders, without specifics on the exact nature of the network it is inevitably impossible to know with certainty which security types are most exposed to contagion. Inevitable it becomes an empirical question based on how D in specification 13 varies with security trading volume.

19
the introduction of clearing on the NYSE reduces the average counterparty risk premium by 24bps or 0.73
NYSE bid-ask spreads28. NYSE prices are 9bp lower on average than CSE prices prior to clearing, but
15bp higher afterward. This result is robust to including stock-specific time-varying market liquidity
controls on the NYSE and CSE, including the bid-ask spread on the NYSE, the dollar trading volume on
the NYSE, and the dollar trading volume on the CSE. The result is not robust, however, to not using the
CSE as control29. This highlights the importance of using identical securities traded on the CSE to control
for the changing macroeconomic environment.
The 24bps reduction is a substantial decline in the counterparty risk premium. This estimate for
the reduction in the counterparty risk premium is on the high end of those obtained in analyses of modern
counterparty risk in the credit derivative markets. Arora et al. (2012) note that estimates of the size of the
counterparty risk premium for credit default swaps in the modern period range from 7-20bps. If we scaled
the effects to size of the modern NYSE this would equate to approximately a $40 billion increase in value
caused by the reduction in counterparty risk from the introduction of a clearinghouse30.
We next investigate the drivers of the counterparty risk premium on the NYSE. Because brokers
had to fund substantial levered positions overnight, shocks to overnight borrowing rates were an
important determinant of counterparty risk prior to clearing on the NYSE. In figure 2, we also plot the 12-
month moving average of the broker’s call loan rate. As expected, prior to the introduction of clearing
NYSE stocks tend to trade at a discount relative to identical securities on the CSE during periods when
the call loan rate is high and at a premium when call loan rates are low. In table 2, we formally
investigate whether high call loan rates are associated with price discounts on the NYSE. We find that
call loan rates appear unrelated to changes in the NYSE-CSE relative prices after the introduction of
clearing. Column 4 shows that there is not a statistically significant relationship between the normalized
difference in NYSE and CSE prices and the call loan rate for the full sample period. This is because the
relationship is masked by the change in the relationship between call loan rates and counterparty risk after
the introduction of clearing. In Column 5, we estimate equation (10). We find that before the introduction
of clearing, a one standard deviation increase in the call loan rate in the pre-clearinghouse period is
associated with approximately an 8bp reduction in the price on the NYSE relative to the CSE31. The
effect is not statistically significant, however, after the introduction of clearing. As expected, we do not
28 The specification includes firm fixed effects, clustering standard errors at the stock level, and using identical securities on the CSE as a control. 29 These results are available from authors upon request. 30 Market cap of $16.6 trillion for NYSE taken from NYSE website as of August 2014. 31 We find that a one percentage point increase in the call loan rate is associated with more than a 2bps reduction in the relative price of NYSE stocks that also trade on the CSE and the standard deviation of the call loan rate was 3.7 percent before the introduction of the NYSE clearinghouse.

20
find evidence of a relationship between call loan rates and our normalized measure of relative NYSE-CSE
prices after a stock joins the clearinghouse (see column 6). The result is consistent with the introduction
of clearing mitigating the impact of funding shocks on counterparty risk for NYSE stocks. In table A5 of
the online appendix we rerun the analysis, but instead look at the effect of commercial paper rates on the
premium before and after the introduction of clearing. Again we find that a rise in funding costs reduces
the value of the NYSE stocks, but that this is no longer true after the introduction of the NYSE
clearinghouse. These results hold for both rates, though are stronger for call loan rates, when both
measures of funding costs are included32.
After the introduction of clearing on the NYSE, shocks to the call loan rate no longer affect prices
on the NYSE relative to those on the CSE. Call loan rates continue to be volatile, however (see figure 2).
Therefore, we would expect a decline in the volatility of NYSE returns given the reduction in the
volatility of the counterparty risk premium. In figures 3 and 4, we observe a dramatic decline in the
volatility of the counterparty risk premium after the introduction of clearing. In table 3, we show that the
monthly average absolute price difference of the NYSE relative price falls 20bps or 0.93 NYSE bid-ask
spreads after the introduction of clearing. These results are robust to including stock-specific time-
varying market liquidity controls such as bid-ask spreads on the NYSE and CSE and the broker call loan
rate interacted with a post-clearinghouse dummy. As we discussed previously, the results represent a
lower bound on the effects of clearing since other stocks clearing reduce the counterparty risk for non-
clearing stocks, reducing the estimated effect of clearing on counterparty risk. Since most stocks were
already clearing by the end of 1893, we include a post-1893 dummy variable instead of the post-
clearinghouse dummy. Post-1893, the average absolute price deviation fell by 40bps. Scaling the absolute
values by �𝜋𝜋2 to obtain estimates of the change in standard deviation and then annualizing these
monthly estimates suggests that the introduction of the clearinghouse reduced the annualized volatility of
the returns on the NYSE by 90-173bps33. Since, the average annualized volatility for stocks on the Dow
32 These results are consistent with a relationship between counterparty risk and costs of borrowing. Since even call loan rates were overnight borrowing rates, but the NYSE clearinghouse in 1892 only engaged in night clearing, the relationship between counterparty risk and call loan rates likely arises from the high correlation between intraday borrowing rates and overnight borrowing rates rather than call loan rates directly. This is also consistent with clearinghouses not causing or serving as a panacea for macroeconomic financial crises, but rather that the absence of a clearinghouse can exacerbate a crisis, by increasing market turbulence and contagion risk. 33 If instead of assuming normality we bootstrap from the original residual distribution we obtain similar estimates of 111-217bps decline in annualized return volatility. Since these results are similar to those obtained under normality and those under normality are slightly more conservative we focus primarily on that interpretation. We thank Neil Shephard for the suggestion.

21
Jones was 29.6% this represents a 3.0%-4.8% reduction in annualized volatility. Now if we assume
further that approximately one-tenth of this is systematic risk and the slope of the security market line is
approximately 0.3 then this would imply a decline in the counterparty risk premium of 9-14bps coming
from the increased volatility or approximately one-third to one-half of the total decline in the counterparty
risk premium we estimated34.
In table 4, we attempt to distinguish the effects of contagion risk through network spillovers from
the effects of direct counterparty risk. We first include monthly date fixed effects and find that the point
estimate for the effect of clearing on the counterparty risk premium volatility falls from -0.93 (column 2
of table 3) to -0.37 (column 1 of Table 4) when normalizing by bid-ask spread, but only moves from -0.20
(column 3 of table 3) to -0.16 (column 2 of table 4) when normalizing by stock price. This suggests that
the netting of other stocks increases the prices of stocks that have not yet cleared and that effect is picked
up by the date fixed effects. The clearing dummy remains marginally significant only when we normalize
by the bid-ask spread. If large firms have a high price, a low bid-ask spread, and large trading volume this
is what we would expect because traders in those securities would be more exposed to traders in the rest
of the broker network. To test this explicitly, in column 3 we remove the date fixed effects and replace
them with a dummy for clearing for the percentage of all stocks clearing. We find the post-clearinghouse
dummy is now a statistically significant -0.56 bid-ask spreads and the coefficient on the percentage of all
stocks clearing is a marginally significant 0.5135. Hence, spillover effects are likely to be important for
the reduction of counterparty risk.
Since contagion risk depends on how connected traders of a given stock are to the rest of the
trader network, we expect stocks trading higher volumes (relative to their average) on a particular day to
be more affected by others stocks clearing because they are more connected to the network. In columns 5
and 6 of table 4 we consider the effect of the percentage of stocks clearing on the relative prices of stocks
that have not yet cleared and. include a dummy for high trading volume36. Prior to clearing, on high
volume days counterparty risk premium volatility is higher on the NYSE, but that effect disappears as
more and more Dow stocks clear. In particular, the reduction in the counterparty risk (relative stocks on
low-volume days) is 0.77 bid-ask spreads times the percentage of Dow stocks clearing (column 4) or
34 Based on statistics in McSherry et al (2014) it appears that as a percent of total NYSE trading volume initial reported losses from broker insolvencies fall approximately 42bps in the period after the introduction of a clearinghouse. If we account for subsequent partial recovery of those losses, this appears consistent in magnitude with the estimates we obtain for the fall in counterparty risk premium coming from the decline in expected losses with our formal difference-in-difference analysis of prices. 35 The co-efficient on the percent of Dow Clearing has a natural interpretation since it is the expected reduction in counterparty risk if 100 percent of all other stocks clear. 36 The High Volume dummy is 1 for stocks with a trading volume higher than the median trading volume.
22
30bp times the percentage of Dow stocks clearing (column 5). If we combine the results of the high
trading volume dummy and the interaction term, we can see that prior to clearing stocks with a high
trading volume on a given day are associated with large volatility in the price difference, but after clearing
the difference is no longer statistically significant. On low volume days, the volatility of the counterparty
risk premium does not change in a significant way after the onset of clearing.
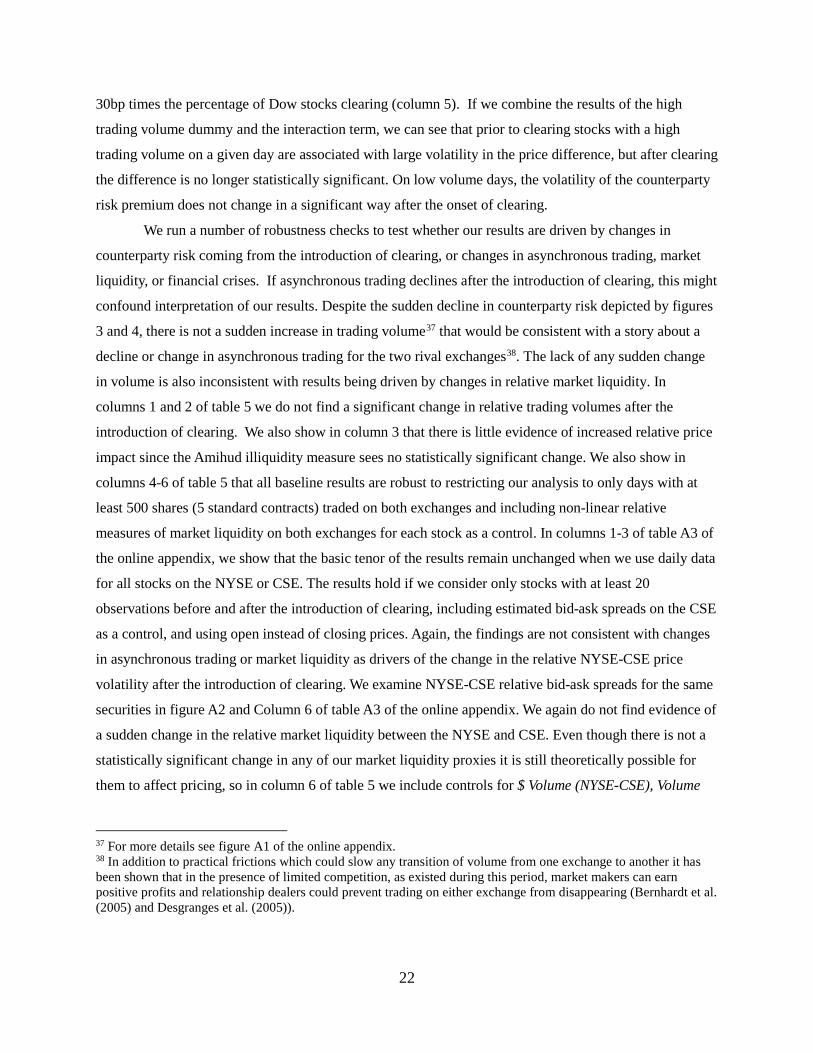
We run a number of robustness checks to test whether our results are driven by changes in
counterparty risk coming from the introduction of clearing, or changes in asynchronous trading, market
liquidity, or financial crises. If asynchronous trading declines after the introduction of clearing, this might
confound interpretation of our results. Despite the sudden decline in counterparty risk depicted by figures
3 and 4, there is not a sudden increase in trading volume37 that would be consistent with a story about a
decline or change in asynchronous trading for the two rival exchanges38. The lack of any sudden change
in volume is also inconsistent with results being driven by changes in relative market liquidity. In
columns 1 and 2 of table 5 we do not find a significant change in relative trading volumes after the
introduction of clearing. We also show in column 3 that there is little evidence of increased relative price
impact since the Amihud illiquidity measure sees no statistically significant change. We also show in
columns 4-6 of table 5 that all baseline results are robust to restricting our analysis to only days with at
least 500 shares (5 standard contracts) traded on both exchanges and including non-linear relative
measures of market liquidity on both exchanges for each stock as a control. In columns 1-3 of table A3 of
the online appendix, we show that the basic tenor of the results remain unchanged when we use daily data
for all stocks on the NYSE or CSE. The results hold if we consider only stocks with at least 20
observations before and after the introduction of clearing, including estimated bid-ask spreads on the CSE
as a control, and using open instead of closing prices. Again, the findings are not consistent with changes
in asynchronous trading or market liquidity as drivers of the change in the relative NYSE-CSE price
volatility after the introduction of clearing. We examine NYSE-CSE relative bid-ask spreads for the same
securities in figure A2 and Column 6 of table A3 of the online appendix. We again do not find evidence of
a sudden change in the relative market liquidity between the NYSE and CSE. Even though there is not a
statistically significant change in any of our market liquidity proxies it is still theoretically possible for
them to affect pricing, so in column 6 of table 5 we include controls for $ Volume (NYSE-CSE), Volume
37 For more details see figure A1 of the online appendix. 38 In addition to practical frictions which could slow any transition of volume from one exchange to another it has been shown that in the presence of limited competition, as existed during this period, market makers can earn positive profits and relationship dealers could prevent trading on either exchange from disappearing (Bernhardt et al. (2005) and Desgranges et al. (2005)).
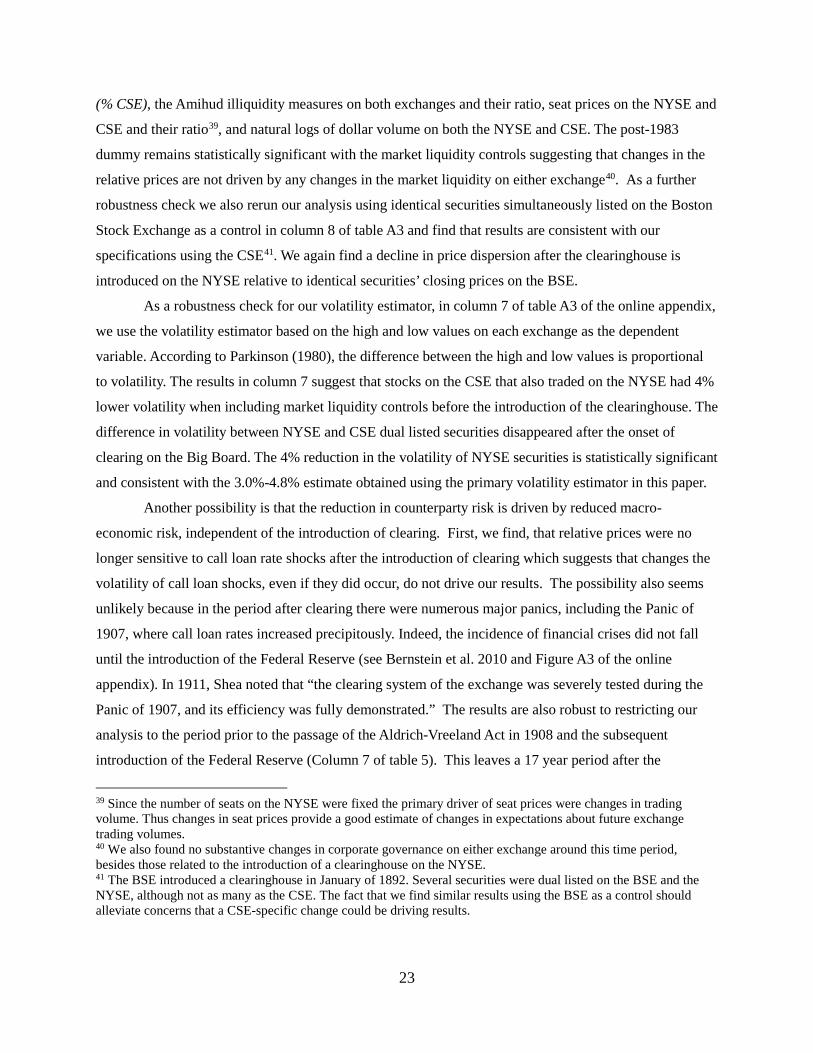
23
(% CSE), the Amihud illiquidity measures on both exchanges and their ratio, seat prices on the NYSE and
CSE and their ratio39, and natural logs of dollar volume on both the NYSE and CSE. The post-1983
dummy remains statistically significant with the market liquidity controls suggesting that changes in the
relative prices are not driven by any changes in the market liquidity on either exchange40. As a further
robustness check we also rerun our analysis using identical securities simultaneously listed on the Boston
Stock Exchange as a control in column 8 of table A3 and find that results are consistent with our
specifications using the CSE41. We again find a decline in price dispersion after the clearinghouse is
introduced on the NYSE relative to identical securities’ closing prices on the BSE.
As a robustness check for our volatility estimator, in column 7 of table A3 of the online appendix,
we use the volatility estimator based on the high and low values on each exchange as the dependent
variable. According to Parkinson (1980), the difference between the high and low values is proportional
to volatility. The results in column 7 suggest that stocks on the CSE that also traded on the NYSE had 4%
lower volatility when including market liquidity controls before the introduction of the clearinghouse. The
difference in volatility between NYSE and CSE dual listed securities disappeared after the onset of
clearing on the Big Board. The 4% reduction in the volatility of NYSE securities is statistically significant
and consistent with the 3.0%-4.8% estimate obtained using the primary volatility estimator in this paper.
Another possibility is that the reduction in counterparty risk is driven by reduced macro-
economic risk, independent of the introduction of clearing. First, we find, that relative prices were no
longer sensitive to call loan rate shocks after the introduction of clearing which suggests that changes the
volatility of call loan shocks, even if they did occur, do not drive our results. The possibility also seems
unlikely because in the period after clearing there were numerous major panics, including the Panic of
1907, where call loan rates increased precipitously. Indeed, the incidence of financial crises did not fall
until the introduction of the Federal Reserve (see Bernstein et al. 2010 and Figure A3 of the online
appendix). In 1911, Shea noted that “the clearing system of the exchange was severely tested during the
Panic of 1907, and its efficiency was fully demonstrated.” The results are also robust to restricting our
analysis to the period prior to the passage of the Aldrich-Vreeland Act in 1908 and the subsequent
introduction of the Federal Reserve (Column 7 of table 5). This leaves a 17 year period after the
39 Since the number of seats on the NYSE were fixed the primary driver of seat prices were changes in trading volume. Thus changes in seat prices provide a good estimate of changes in expectations about future exchange trading volumes. 40 We also found no substantive changes in corporate governance on either exchange around this time period, besides those related to the introduction of a clearinghouse on the NYSE. 41 The BSE introduced a clearinghouse in January of 1892. Several securities were dual listed on the BSE and the NYSE, although not as many as the CSE. The fact that we find similar results using the BSE as a control should alleviate concerns that a CSE-specific change could be driving results.

24
introduction of clearing on the NYSE where conditions were as ripe for financial crises as the period prior
to 1892.
Examining the period prior to 1907 also shows the results are not driven by the introduction of
the mutualization of risk on the NYSE clearinghouse in April of 1920, accusations of fraud on the
Consolidated Stock Exchange beginning in February of 1922, or the subsequent decline in volume on the
CSE. In table 6 we explicitly examine the introduction of mutualization of risk in April of 1920 prior to
the accusations of fraud on the CSE in February of 1922. We do not find statistically significant evidence
of changes in counterparty risk driven by mutualization of risk. These results should be interpreted with
caution given the limited post-mutualization period, but we do not find any evidence that the reduction in
counterparty risk caused by introduction of clearing in 1892 were negated, or significantly improved, by
the separate introduction of mutualization of risk.
6 Conclusion The dramatic rise in counterparty risk in the OTC derivatives markets during the recent financial
crisis has brought the role clearinghouses play in reducing market turbulence to the forefront of public
policy debate. In this paper, we show that a clearinghouse can improve financial stability in asset markets
by reducing counterparty risk. We use a novel historical experiment to cleanly identify the change in
counterparty risk of NYSE stocks after the introduction of a clearinghouse in 1892. We can identify the
effect of introducing clearing for NYSE stocks because the same securities were trading concurrently on
the Consolidated Stock Exchange, a rival exchange that already had centralized clearing. This is
important, because the introduction of clearing is usually driven by macro-economic turbulence, so that
before vs. after comparisons can be contaminated by changes in fundamental security value and risk. In
our setting, however, changes in counterparty and illiquidity risk can be more easily attributed to the
introduction of a clearinghouse. Our results suggest that prior to the introduction of net settlement on the
NYSE, identical stocks on the NYSE traded at a discount of 9bp relative to the Consolidated Stock
Exchange, the NYSE’s principal competitor. After the establishment of a clearinghouse, NSYE stocks
traded at a premium of 15bp. The difference of 24bp is statistically significant. Furthermore, the change
can be attributed almost entirely to the reduction in counterparty risk.
Before the establishment of the NYSE clearinghouse, the NYSE traded at a premium relative to
the same stocks on the CSE the majority of the time. However, when overnight collateralized borrowing
rates rose sharply, prices on the NYSE fell precipitously relative to those on the CSE. A one standard
deviation increase in interest rates (3.7 percentage points) reduced the value of stocks on the NYSE by
25
8bp, relative to identical stocks on the CSE. After the introduction of clearing, the difference between
prices on the NYSE and the CSE were no longer affected by changes in these overnight funding rates.
Call loan rates remained volatile, but annualized NYSE stock return volatility fell dramatically after
clearing by 90-173bps. We also use the staggered introduction of clearing on the NYSE to show that at
least half of this reduction in counterparty risk is driven by a reduction in contagion risk through
spillovers in the trader network.
Overall, our results indicate that clearinghouses can play a significant role in improving market
stability and increase asset values by reducing network contagion and counterparty risk. Two of the
primary functions of clearinghouses are netting without novation and mutualization of risk. We
demonstrate that even in the absence of a centralized counterparty, policies aimed at introducing
centralized clearing through a clearinghouse can substantially increase netting and subsequently improve
global financial stability.

26
References Acharya, V., Bisin, A., 2014. Counterparty risk externality: Centralized versus over-the-counter markets.
Journal of Economic Theory. 149: 153-82, 2014.
Acharya, V., Pedersen, L., 2005. Asset pricing with liquidity risk. Journal of Financial Economics. 77, 375-410.
American Bankers Association, 1910. Clearing-house Systems of the World. 55-62.
Amihud, Y., 2002. Illiquidity and stock returns: cross-section and time-series effects. Journal of financial markets. 5.1: 31-56.
Amihud, Y. and H. Mendelson, 1986. Asset pricing and the bid-ask spread. Journal of Financial Economics 17, 223–249.
Amihud, Y. and H. Mendelson, 1991. Liquidity, Maturity, and the Yields on U. S. Treasury Securities, The Journal of Finance 46, 1411-1425
Annual Reports of the Consolidated Stock and Petroleum Exchange of New York, 1890-1895.
Arora, N., Gandhi, P., and Longstaff, F., 2012. Counterparty credit risk and the credit default swap market. Journal of Financial Economics 103.2: 280-293.
Benmelech, Efraim, and Nittai K. Bergman. 2011. Bankruptcy and the collateral channel. The Journal of Finance 66.2: 337-378.
Bernanke, B., 1990. Clearing and Settlement during the Crash. Review of Financial Studies. 3.1: 133-151.
Bernanke, B., 2011. Clearinghouses, Financial Stability, and Financial Reform. Speech, 2011 Financial Markets Conference, Stone Mountain, Georgia
Bernhardt, D., Dvoracek, V., Hughson, E., and Werber, I., 2005. Why do Larger Orders Receive Better Prices on the London Stock Exchange. Review of Financial Studies. 18: 1343-1368.
Bernstein, A., Hughson, E. Weidenmier, M., 2010. Identifying the Effect of a lender of Last Resort: Lessons from the Founding of the Fed. Journal of Financial Economics, 98: 40-53.
Biais, B., Hedier, F., Hoerova, M., 2012. Clearing, Counterparty risk and aggregate risk. IMF Economic Review 60:193-222.
Biais, B., Hedier, F., Hoerova, M., Forthcoming. Risk-sharing or risk-taking? Counterparty-risk, incentives and margins. Journal of Finance.
Bliss, R. and Steigerwalk, R., 2006. Derivatives Clearing and Settlement: A Comparison of Central Counterparties and Alternative Structures. Economic Perspectives. Federal Reserve Bank of Chicago Working Paper. 30.4:22.
Brown, W., Mulherin, H., and Weidenmier, M., 2008. Competing with the New York Stock Exchange. The Quarterly Journal of Economics. 123(November):1679-1719.

27
Brunnermeier, M., Pedersen, L., 2009. Market Liquidity and Funding Liquidity. Review of Financial Studies. 22:2201-2238.
Calomiris, C. and Gorton, G., 1991. The Origins of Banking Panics: Models, Facts, and Bank Regulation. In R. G. Hubbard, ed.,Financial Markets and Financial Crises. University of Chicago Press, Chicago. 109–173.
Cecchetti, S., Guntelberg, J., Hollanders, M., 2009. Central Counterparties for Over-the-Counter Derivatives. Bank for International Settlements Quarterly Review. (September): 45-59.
Constitution of the New York Stock Exchange, March 1902.
Corwin, S., and Schultz, P., 2012. A Simple Way to Estimate Bid-Ask Spreads from Daily High and Low Prices. The Journal of Finance 67.2: 719-760.
Coval, Joshua, and Erik Stafford. 2007. Asset fire sales (and purchases) in equity markets. Journal of Financial Economics 86.2: 479-512.
Desgranges, G., and Foucault, T., 2005, Reputation-based pricing and price improvements in dealership markets. Journal of Economics and Business 57: 493-527.
Duffie, Darrell, 2010, Asset Price Dynamics with Slow-Moving Capital, Journal of Finance 65, 1238-1268.
Duffie, D., and Zhu, H., 2011. Does a central clearing counterparty reduce counterparty risk?. Review of Asset Pricing Studies 1.1: 74-95.
Duffie, D., Scheicher, M., Vuillemey, G., forthcoming. Central Clearing and Collateral Demand. Journal of Financial Economics.
Eames, F., 1894. The New York Stock Exchange. Greenwood Press. New York: Reprint edition, 1968.
Farboodi, M. 2014. Intermediation and Voluntary Exposure to Counterparty Risk. Working Paper.
Farrell, Maurice L., The Dow Jones Averages, 1885–1970 (New York, NY: Dow Jones Books, 1972).
Garleanu, N. and Pedersen, L., 2011. Margin-based Asset Pricing and Deviations from the Law of One Price. Review of Financial Studies. 24.6:1980-2022.
Giglio, S. 2013. Credit Default Swap Spreads and Systemic Financial Risk. Working Paper.
Gorton, G. 1985. Clearinghouses and the origin of central banking in the United States. The Journal of Economic History. 45.02: 277-283.
Jones, Charles M, 2011. A Century of Stock Market Liquidity and Trading Costs. Working Paper.
Kahn, C., McAndrews, J., and Roberds, W., 2003. Settlement risk under gross and net settlement. Journal of Money, Credit and Banking. 35.4:591-608.

28
Kahn, C., and Roberds, W., 2009. Payments settlement: Tiering in private and public systems. Journal of Money, Credit and Banking. 41.5: 855-884.
Kalemli-Ozcan, S., Sorensen, B., and Yesiltas, S., 2012. Leverage across firms, banks, and countries. Journal of International Economics. 88.2: 284-298.
Kroszner, R. 1999. Can Financial Markets Privately Regulate Risk in Payments and Clearing Systems? Journal of Money, Credit & Banking 31 (August): 596-618.
Levich, R. M. 2011. Evidence on financial globalization and crises: interest rate parity, In the Encyclopedia of Financial Globalization, ed. Gerard Caprio.
Lewellen, Jonathan. 2014. The cross section of expected stock returns. Critical Finance Review.
Longstaff, F., Mithal, S., and Neis, E., 2005. Corporate yield spreads: Default risk or liquidity? New evidence from the credit default swap market. The Journal of Finance. 60.5: 2213-2253.
Loon, Y., and Zhong, Z. 2013. The impact of central clearing on counterparty risk, liquidity, and trading: Evidence from the credit default swap market. Journal of Financial Economics.
McSherry, B., and Wilson, B. 2012. Overcertification and the NYCHA’s Clamor for an NYSE Clearinghouse. Quarterly Journal of Austrian Economics. 16.1: 13-26.
McSherry, B., Wilson, B., and McAndrews, J., 2013. Net Settlement and Counterparty Risk: Evidence From the Formation of the NYSE’s Clearinghouse in 1892. Working Paper.
Meeker, James Edward. 1922. The Work of the Stock Exchange. New York: The Ronald Press Company.
Menkveld, A., Pagnotta, E., and Zoican, M., 2013. Central Clearing and Asset Prices. No. 13-181/IV/DSF67. Tinbergen Institute Discussion Paper.
Michie, R. 1986. The London and New York Stock Exchanges, 1850-1914. The Journal of Economic History 46 (March): 171-187.
Minutes of the Committee on Clearinghouse. Located at the New York Stock Exchange Archives. 1892-1920.
Miron, J., 1986. Financial panics, the seasonality of the nominal interest rate, and the founding of the Fed. American Economic Review. 76: 125-140.
Moen, J., and Tallman, E., 2003. The Call Loan Market in the US Financial System Prior to the Federal Reserve System. Working Paper.
Moser, J., 1998. Contracting Innovations and the Evolution of Clearing and Settlement Methods at Futures Exchanges. Working Paper, The Federal Reserve Bank of Chicago.
Mulherin, J., Netter, J., and Overdahl, J. 1991. Prices are Property: The Organization of Financial Exchanges from a Transactions Cost Perspective. Journal of Law and Economics. 34: 591-644.

29
Nelson, S., 1907. The Consolidated Stock Exchange of New York: Its history, organization, machinery, and methods. Reprinted in Wall Street and the Security Markets, Vincent Carooso and Robert Sobel (eds.). New York: Arno Press, 1975.
Noyes, A., 1893. Stock Exchange Clearinghouses. Political Science Quarterly 8 (June): 252-267.
Parkinson, M., 1980, The extreme value method for estimating the variance of the rate of return, Journal of Business 53: 61-65.
Pirrong, C., 2009. The Economics of Clearing in Derivatives Markets: Netting, Asymmetric Information, and the Sharing of Default Risk Though a Central Counterparty, University of Houston, Working Paper.
Pratt, S., 1909. The Work of Wall Street. New York: D. Appleton and Company.
Richter, F., 1920. Notes and Memoranda: The Stock Clearing Corporation. Quarterly Journal of Economics 34: 538-544.
Roll, R., 1984, A simple implicit measure of the effective bid-ask spread in an efficient market, Journal of Finance. 39: 127-1139.
Shea, C., 1911. The financial encyclopaedia: a comprehensive exposition of all departments of finance, its leaders, institutions, histories, events and subjects. Vol. 1. The Financial encyclopaedia company.
Shleifer, A., and Vishny, R., 1997. The Limits of Arbitrage. Journal of Finance. 52.1:35–55.
Silber, W. L., 1992, Discounts on Restricted Stock: The Impact of Illiquidity on Stock Prices, Financial Analysts Journal, July/August, 60-64.
Singh, M., and Aitken, J., 2009. Counterparty Risk, Impact on Collateral Flows, and Role for Central Counterparties. Working Paper, International Monetary Fund.
Sobel, R., 2000. Curbstone Brokers: The Origins of the American Stock Exchange. Beard Books
Sprague, O., 1910. A History of Crises Under the National Banking System. National Monetary Commission. Washington, D.C.: U.S. Government Printing Office.
Stoll, H., 1989. Inferring the Components of the Bid-Ask Spread: Theory and Empirical Tests. Journal of Finance 44 (March): 115-134.
Summe, K., 2012. An Examination of Lehman Brothers’ Derivatives Portfolio Postbankruptcy: Would Dodd-Frank Have Made a Difference? In K.Scott and J. Taylor, eds., Bankruptcy Not Bailout: A Special Chapter 14. Hoover Institutional Press.
Timberlake, R., 1984. The Central Banking Role of Clearinghouse Associations. Journal of Money, Credit and Banking 16.1: 1–15.
Tracy, E., Gopalakrishnan, S., and Iyer, K., 2010. Central clearing for OTC derivatives impact on OTC revenues – what can you expect beyond compression? Deloitte Perspectives on Financial Reform. Issue 4.

30
White, E., 2013. Competition among the exchanges before the SEC: was the NYSE a natural hegemon? Financial History Review 20.01: 29-4.

31
Table 1. NYSE and CSE Summary Statistics
This table reports the sample statistics for the trading data for stocks on the New York Stock Exchange (NYSE) and Consolidated Stock Exchange (CSE). Security market data were hand collected at a monthly frequency from the New York Times and Commercial and Financial Chronicle from September 1886 – December 1925 for all stocks in the Dow Jones Indices. All data is winsorized at the 1st and 99th percentile. To be included in the first level of summary analysis a security must trade at least 1 share on both exchanges on a given date, while for the second, which is the one used in our primary econometric specifications, we require at least 200 shares (2 standard contracts).
NYSE Closing
Price
NYSE Trading Volume (#
Shares)
CSE Trading Volume
(#Shares)
NYSE Trading Volume ($000s)
CSE Trading Volume ($000s)
NYSE Bid-Ask Spread
(bps) With Minimum 1 Shares Traded (n = 9,373)
Mean 84.4 13,726 3,241 1,352 322 52 Median 81.4 4,400 410 324 29 32
Standard Dev. 42.4 29,340 8,710 3,304 965 66
Minimum 4 5 5 0.2 0.04 7 Maximum 323 489,444 291,870 52,300 24,100 1,818
With Minimum 200 Shares Traded (n = 6,065)
Mean 85.5 19,911 4,958 1,972 493 41
Median 81.0 8,425 1,150 644 88 26
Standard Dev. 41.1 34,912 10,432 3,966 1,164 52
Minimum 4.7 200 200 3.6 1.4 7
Maximum 319.5 489,444 291,870 52,300 24,100 1,481

32
Table 2. Price Deviations and Establishment of NYSE Clearinghouse
Following econometric specifications (9) and (10), in this table we show the estimated effect of the introduction of multilateral net settlement through a centralized clearing party on the closing price of a stock on the New York Stock Exchange relative to the closing price on the Consolidated Stock Exchange for the same security on the same day. Security market data were hand collected at a monthly frequency from the New York Times and Commercial and Financial Chronicle from September 1886 – December 1925 for all stocks in the Dow Jones Indices. To be included in the analysis a security must trade at least 200 shares on both exchanges on a given date. All data is winsorized at the 1st and 99th percentile. In column 1, NYSE-CSE/Close is the price on the NYSE minus the CSE normalized by the average closing price on both exchanges. Clearinghouse is a stock-specific dummy variable which equals 1 if a stock is cleared on the NYSE. In column 2, NYSE-Con/NYSE Bid-Ask is the LHS variable and is the price on the NYSE minus the CSE normalized by the bid-ask spread on the NYSE. Column 3 shows the results including stock-specific time-varying market liquidity controls on the NYSE and CSE. These include the bid-ask spread on the NYSE, the dollar trading volume on the NYSE, and the dollar trading volume on the CSE. Column 4 shows the results after including Call Loan Rate (%), the overnight collateralized borrowing rate. Column 5 includes an interaction term between the Clearinghouse dummy variable and the Call Loan Rate (%) as described in specification (10). Column 6 repeats the analysis in column 4, but restricting the sample to only stocks already clearing. All specifications are run with security-level fixed effects and errors are clustered at the security-level. P-Values: * 10%; ** 5%; ***1%.
(1) (2) (3) (4) (5) (6)
Dependent Variable: NYSE-CSE /Close (%)
NYSE-CSE / NYSE Bid-Ask
NYSE-CSE /Close (%)
NYSE-CSE /Close (%)
NYSE-CSE /Close (%)
NYSE-CSE /Close (%)
Clearinghouse 0.237*** 0.733*** 0.234*** 0.230*** 0.122*
(0.062) (0.126) (0.061) (0.061) (0.068)
Call Loan Rate -0.0029 -0.0217*** 0.0022 (0.0019) (0.0055) (0.0017)
Call Loan Rate x 0.0247*** Clearinghouse (0.0058)
Constant -0.094** -0.295*** -0.107** -0.093* -0.0083 -0.0062 (0.040) (0.082) (0.045) (0.048) (0.0055) (0.023)
Security Fixed Effects Y Y Y Y Y Y
Liquidity Controls N N Y Y Y Y
Only Clearinghouse N N N N N Y
# Clusters 90 90 90 90 90 51
# Observations 5,997 5,984 5,994 5,994 5,994 3,904
Adjusted R-squared 0.0086 0.0056 0.0104 0.0105 0.0138 0.0326

33
Table 3. Counterparty Risk Premium and Establishment of NYSE Clearinghouse
Following econometric specifications (9), (10) and (11), in this table we show the estimated effect of the introduction of multilateral net settlement through a centralized clearing party on the volatility of the closing price of a stock on the New York Stock Exchange relative to the closing price on the Consolidated Stock Exchange for the same security on the same day by looking at the absolute value of the relative price differences. Security market data were hand collected at a monthly frequency from the New York Times and Commercial and Financial Chronicle from Sept 1886 – Dec 1925 for all stocks in the Dow Jones Indices. To be included in the analysis a security must trade at least 200 shares on both exchanges on a given date. All data is winsorized at the 1st and 99th percentile. In column 1, |NYSE-CSE|/Close absolute value of the price on the NYSE relative to the CSE, normalized by the average closing price on both exchanges in percent. Clearinghouse is a stock-specific dummy variable which equals 1 if a stock is cleared on the NYSE. In column 2, |NYSE-CSE|/NYSE Bid-Ask is the volatility of the price on the NYSE minus the CSE normalized by the bid-ask spread on the NYSE. Column 3 shows the results with stock-specific time-varying market liquidity controls on the NYSE and CSE including the stock’s bid-ask spread on the NYSE and dollar trading volume on NYSE, and CSE. Column 4 shows results after including Call Loan Rate (%), the overnight collateralized borrowing rate, and an interaction term between the Clearinghouse dummy variable and the Call Loan Rate (%) as described in specification (10). Column 5 repeats the analysis in column 4, but restricting the sample to only stocks already clearing. Column 6 includes a dummy, Post 1893, which is equal to 1 for all securities clearing after 1893 and zero prior to May 1892. All specifications are run with security-level fixed effects and errors are clustered at the security-level. P-Values: *10%; **5%; ***1%.
(1) (2) (3) (4) (5) (6)
Dependent Variable: |NYSE-CSE| /Close (%)
|NYSE-CSE| / NYSE Bid-Ask
|NYSE-CSE| /Close (%)
|NYSE-CSE| /Close (%)
|NYSE-CSE| /Close (%)
|NYSE-CSE| /Close (%)
Clearinghouse -0.204** -0.929*** -0.207*** -0.174** (0.105) (0.323) (0.082) (0.089)
Post 1893 -0.399*** (0.077)
Call Loan Rate 0.0081* 0.0009 (0.0046) (0.0015)
Call Loan Rate x -0.0067 Clearinghouse
(0.0049)
Constant 0.544*** 1.840*** 0.397*** 0.360*** 0.174*** 0.557*** (0.069) (0.210) (0.055) (0.064) (0.016) (0.0068)
Security Fixed Effects Y Y Y Y Y Y
Liquidity Controls N N Y Y Y Y
Only Clearinghouse N N N N Y N
# Clusters 90 90 90 90 51 54
# Observations 5,997 5,984 5,994 5,994 3,904 4,314
Adjusted R-squared 0.223 0.165 0.293 0.293 0.157 0.171

34
Table 4. Contagion (Indirect Counterparty) Risk
Following econometric specifications (12), in this table we show the estimated effect of the introduction of multilateral net settlement through a centralized clearing party on the closing price of a stock on the New York Stock Exchange relative to the closing price on the Consolidated Stock Exchange for the same security on the same day broken out by contagion risk and direct counterparty risk. Security market data were hand collected at a monthly frequency from the New York Times and Commercial and Financial Chronicle from Sept 1886 – Dec 1925 for all stocks in the Dow Jones Indices. To be included in the analysis a security must trade at least 200 shares on both exchanges on a given date. All data is winsorized at the 1st and 99th percentile. In Column 1, |NYSE-CSE|/NYSE Bid-Ask is an estimate of monthly volatility of the price on the NYSE relative to the CSE, normalized by the bid-ask spread on the NYSE. Clearinghouse is a stock-specific dummy variable which equals 1 if a stock is cleared on the NYSE. This column includes date fixed effects. Column 2 is the same as Column 1, but |NYSE-Con|/NYSE Close is the volatility of the price on the NYSE minus the CSE normalized by the average closing price on both exchanges in percent. Column 3 includes the effects of spillovers by including, % of Dow Clearing, which is the percent of NYSE stocks in a Dow Jones Index currently clearing in addition to the Clearinghouse dummy. Column 4 restricts the sample to only stocks not clearing to show spillover effects and contagion risk. This regression includes variable, High Trading Volume, which is 1 if the $ trading volume is higher than the median for all stocks over the period. This variable is then interacted with % of Dow Clearing. Column 5 is the same as Column 4 but looks at |NYSE-CSE|/NYSE Close. All specifications are run with security-level fixed effects and errors are clustered at the security-level. P-Values: *10%; **5%; ***1%.
(1) (2) (3) (4) (5)
Dependent Variable: |NYSE-CSE| / NYSE Bid-Ask
|NYSE-CSE| /Close (%)
|NYSE-CSE| /NYSE Bid-Ask
|NYSE-CSE| /NYSE Bid-Ask
|NYSE-CSE| /Close (%)
% of Dow Clearing -0.508* 0.328 0.020
(0.295) (0.278) (0.16)
Clearinghouse -0.370 -0.156* -0.558***
(0.269) (0.088) (0.108)
High Volume Dummy x -0.772** -0.300** % of Dow Clearing (0.308) (0.137)
High Volume Dummy 0.538** 0.201**
(0.203) (0.096)
Constant 1.830** 0.582*** 2.091*** 1.199*** 0.329*** (0.119) (0.038) (0.210) (0.193) (0.098)
Security Fixed Effects Y Y Y Y Y Date Fixed Effects Y Y N N N
Stock Liquidity Controls Y Y Y Y Y Only Pre-Clearing Stocks N N N Y Y
# Clusters 90 90 90 50 50
# Observations 5,983 5,994 5,983 2,086 2,090
Adjusted R-squared 0.236 0.326 0.186 0.332 0.398

35
Table 5. Microstructure Noise and Market Liquidity Robustness Tests
In this table, we show that the introduction of clearing on the NYSE is not associated with a change in the relative trading on the NYSE vs. the CSE and that the introduction of multilateral net settlement through a centralized clearing party reduced the premium and volatility of the closing price of a stock on the New York Stock Exchange relative to the closing price on the Consolidated Stock Exchange for the same security on the same day. Security market data were hand collected at a monthly frequency from the New York Times and Commercial and Financial Chronicle from Sept 1886 – Dec 1925 for all stocks in the Dow Jones Indices. To be included in the analysis a security must trade at least 200 shares on both exchanges on a given date. All data is winsorized at the 1st and 99th percentile. In column 1, $ Volume (NYSE-CSE), is the difference in the dollar volume of trading for a stock on the NYSE minus the volume on the CSE on the same day. Clearinghouse is a stock-specific dummy variable which equals 1 if a stock is cleared on the NYSE. Column 2 shows the same as column 1, but now the looking at Volume (% CSE), which is the dollar trading volume on the CSE divided by the sum of the trading volume on the NYSE and CSE for a given security on a given day. Column 3 is the same specification as Column 2, but the left-hand side variable is the Amihud illiquidity measure, (|𝑁𝑁𝑁𝑁𝑆𝑆𝐸𝐸 𝑅𝑅𝛾𝛾𝑡𝑡𝑡𝑡|/𝑁𝑁𝑁𝑁𝑆𝑆𝐸𝐸 𝑆𝑆𝛾𝛾𝛾𝛾𝛾𝛾𝑠𝑠𝑡𝑡)/(|𝐶𝐶𝑆𝑆𝐸𝐸 𝑅𝑅𝛾𝛾𝑡𝑡𝑡𝑡|/𝐶𝐶𝑆𝑆𝐸𝐸 𝑆𝑆𝛾𝛾𝛾𝛾𝛾𝛾𝑠𝑠𝑡𝑡). In specifications in columns 4-5 securities are restricted to those with at least 500 contracts trading on the NYSE and CSE on a given day. In column 4, |NYSE-Con|/Close is an estimate of monthly volatility of the price on the NYSE relative to the CSE by looking at the absolute price deviation, normalized by the average closing price on both exchanges in percent. In Column 5, NYSE-CSE/Close is the price on the NYSE minus the CSE normalized by the average closing price on both exchanges. Column 6 is the same as column 5 but only restricts to at least 200 shares traded on both exchanges and includes relative stock-specific time-varying market liquidity controls. These include $ Volume (NYSE-CSE), Volume (% CSE), the Amihud illiquidity measures on both exchanges and their ratio, seat prices on the NYSE and CSE and their ratio, and natural logs of $ volume on both the NYSE and CSE. Column 7 repeats the baseline results in Table 2 column 1, but only for the period prior to passage of the Aldrich-Vreeland Act in 1909. All specifications are run with security-level fixed effects and errors are clustered at the security-level. P-Values: *10%; **5%; ***1%.
(1) (2) (3) (4) (5) (6) (7) Dependent Variable: $000s Volume
(NYSE-CSE) Volume (% CSE)
Amihud Illiquidity
(NYSE/Con)
|NYSE-Con| /Close (%)
NYSE-CSE /Close (%)
NYSE-CSE /Close (%)
NYSE-CSE /Close (%)
Clearinghouse 251 -3.45 -0.103 -0.226** 0.289*** 0.224*** 0.238***
(354) (2.49) (0.067) (0.101) (0.077) (0.079) (0.059) Constant 1,311*** 20.96*** 0.363*** 0.386*** -0.147*** -0.245 -0.152***
(231) (1.62) (0.044) (0.0697) (0.059) (0.203) (0.055)
Security Fixed Effects Y Y Y Y Y Y Y
Stock Liquidity Controls N N N Y Y Y Y Relative Liquidity Controls N N N N N Y N
Period 1886-1925 1886-1925 1886-1925 1886-1925 1886-1925 1888-1925 1886-1908 Min Traded Shares 200 200 200 500 500 200 200
Data Frequency Monthly Monthly Monthly Monthly Monthly Monthly Monthly Price Used Close Close Close Close Close Close Close # Clusters 90 90 89 85 85 88 62
# Observations 5,996 5,996 5,623 4,272 4,272 5,504 2,983 Adjusted R-squared 0.213 0.280 0.185 0.306 0.019 0.020 0.010

36
Table 6. Counterparty Risk and the Introduction of NYSE Novation
In this table we show that the introduction of novation (mutualization of risk though a centralized counterparty) on the NYSE in April 1920 does not appear to significantly affect the counterparty risk premium between the NYSE and CSE. Security market data were hand collected and are analyzed at a monthly frequency from the New York Times and Commercial and Financial Chronicle from Sept 1886 – January 1922 for all stocks in the Dow Jones Indices. The period February 1922-December 1925 is excluded from this analysis because of accusations of fraud on the CSE, which eventually led to its downfall, beginning with the failure of MacMasters& Co. in February of 1922. To be included in the analysis a security must trade at least 200 shares on both exchanges on a given date. All data is winsorized at the 1st and 99th percentile. In column 1, NYSE-CSE/Close is the price on the NYSE minus the CSE normalized by the average closing price on both exchanges and Novation is a dummy variable equal to 1 if the date is after April 1920. Column 2 is the same as column 1 but includes relative stock-specific time-varying market liquidity controls. These include $ Volume (NYSE-CSE), Volume (% CSE), the Amihud illiquidity measures on both exchanges and their ratio, seat prices on the NYSE and CSE and their ratio, and natural logs of $ volume on both the NYSE and CSE. In column 3, NYSE-Con/NYSE Bid-Ask is the LHS variable and is the price on the NYSE minus the CSE normalized by the bid-ask spread on the NYSE. In column 4, |NYSE-Con|/Close is an estimate of monthly volatility of the price on the NYSE relative to the CSE by looking at the absolute price deviation, normalized by the average closing price on both exchanges in percent. All specifications are run with security-level fixed effects and errors are clustered at the security-level. P-Values: *10%; **5%; ***1%.
(1) (2) (3) (4) Dependent Variable: NYSE-CSE
/ Close (%) NYSE-CSE / Close (%)
NYSE-CSE /NYSE Bid-Ask
|NYSE-CSE| /NYSE Bid-Ask
Novation -0.0462 -0.1198 -0.1391 0.0912 (0.0434) (0.0762) (0.1240) (0.1011)
Constant 0.0548*** -0.326 0.1828*** 1.064*** (0.0028) (0.212) (0.0079) (0.0065)
Security Fixed Effects Y Y Y Y Stock Liquidity Controls N Y N N
NYSE/CSE Stock Liquidity Controls N Y N N
Period Sep 1886 – Jan 1922
Sep 1886 – Jan 1922
Sep 1886 – Jan 1922
Sep 1886 – Jan 1922
Only Post-clearing Stocks Y Y Y Y # Clusters 51 50 51 51
# Observations 3,487 3,313 3,479 3,479 Adjusted R-squared 0.019 0.046 0.012 0.017
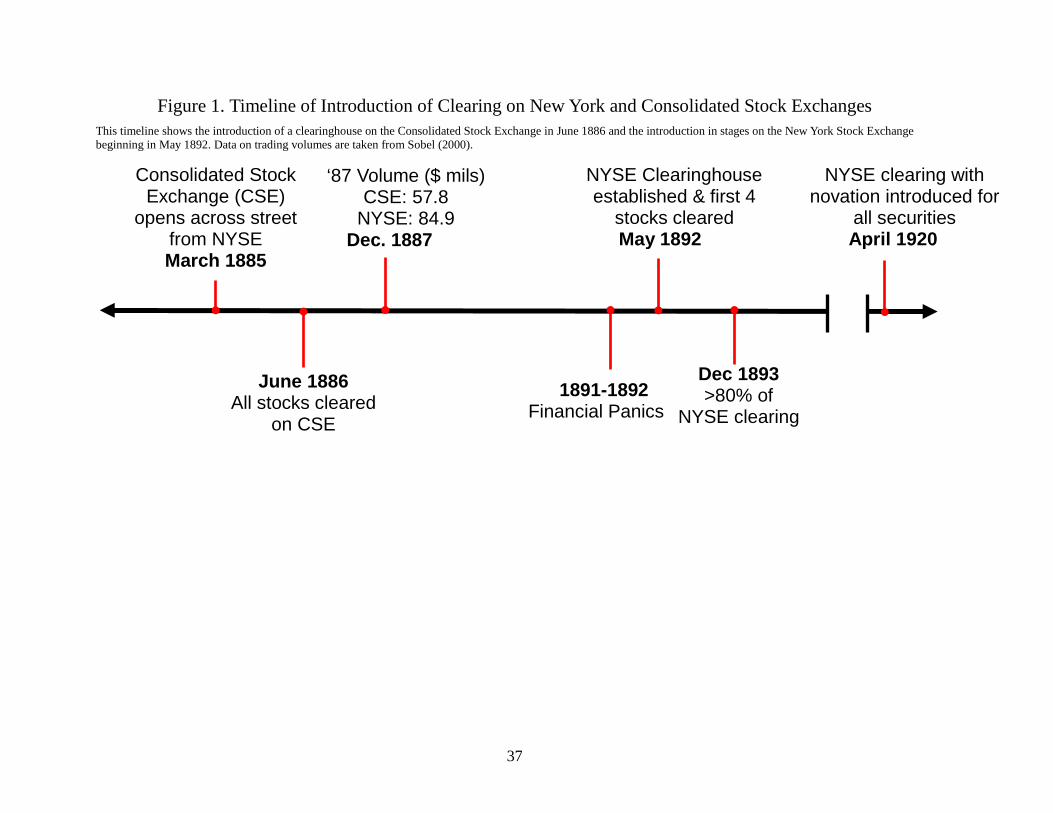
37
Figure 1. Timeline of Introduction of Clearing on New York and Consolidated Stock Exchanges
This timeline shows the introduction of a clearinghouse on the Consolidated Stock Exchange in June 1886 and the introduction in stages on the New York Stock Exchange beginning in May 1892. Data on trading volumes are taken from Sobel (2000).
Consolidated Stock Exchange (CSE)
opens across street from NYSE March 1885
‘87 Volume ($ mils) CSE: 57.8
NYSE: 84.9 Dec. 1887
June 1886 All stocks cleared
on CSE
1891-1892 Financial Panics
NYSE Clearinghouse established & first 4
stocks cleared May 1892
Dec 1893 >80% of
NYSE clearing
NYSE clearing with novation introduced for
all securities April 1920

38
-6%
-4%
-2%
0%
2%
4%
6%
8%
10%
12%
14%
-4.00
-3.00
-2.00
-1.00
0.00
1.00
2.00
3.00
4.00
5.00
6.00
Jan-
87
Nov
-87
Sep-
88
Jul-8
9
May
-90
Mar
-91
Jan-
92
Nov
-92
Sep-
93
Jul-9
4
May
-95
Mar
-96
Jan-
97
Nov
-97
Sep-
98
Jul-9
9
May
-00
Mar
-01
Jan-
02
Nov
-02
Sep-
03
Jul-0
4
May
-05
Mar
-06
Jan-
07
Nov
-07
Sep-
08
Jul-0
9
May
-10
Mar
-11
Jan-
12
Nov
-12
Sep-
13
Jul-1
4
May
-15
Mar
-16
Jan-
17
Nov
-17
Sep-
18
Jul-1
9
May
-20
Mar
-21
Jan-
22
Nov
-22
Sep-
23
Jul-2
4
May
-25
Ann
ualiz
ed C
all L
oan
Rat
e
NY
SE -
Con
Clo
sing
Pri
ce /
Bid
-Ask
Spr
ead
NYSE - Consolidated Price (normalized by bid-ask spread)
Call Loan Rate
12 per. Mov. Avg. (NYSE - Consolidated Price (normalized by bid-ask spread))
12 per. Mov. Avg. (Call Loan Rate)
Figure 2. Counterparty Risk Premium and Introduction of Clearing on NYSE (1887-1925)
In this figure we show the estimated effect of the introduction of multilateral net settlement through a centralized clearing party on the closing price of a stock on the New York Stock Exchange relative to the closing price on the Consolidated Stock Exchange for the same security on the same day. Security market data were hand collected at a monthly frequency from the New York Times and Commercial and Financial Chronicle from September 1886 – December 1925 for all stocks in the Dow Jones Indices. To be included in the analysis a security must trade at least 200 shares on both exchanges on a given date. All data is winsorized at the 1st and 99th percentile. NYSE-Con/NYSE Bid-Ask is the price on the NYSE minus the CSE normalized by the bid-ask spread on the NYSE and Call Loan Rate is the overnight collateralized broker borrowing rate. The period prior to the establishment of the NYSE clearinghouse May 17th, 1892 is highlighted in red.
May 1892: 1st 4 NYSE stocks start clearing
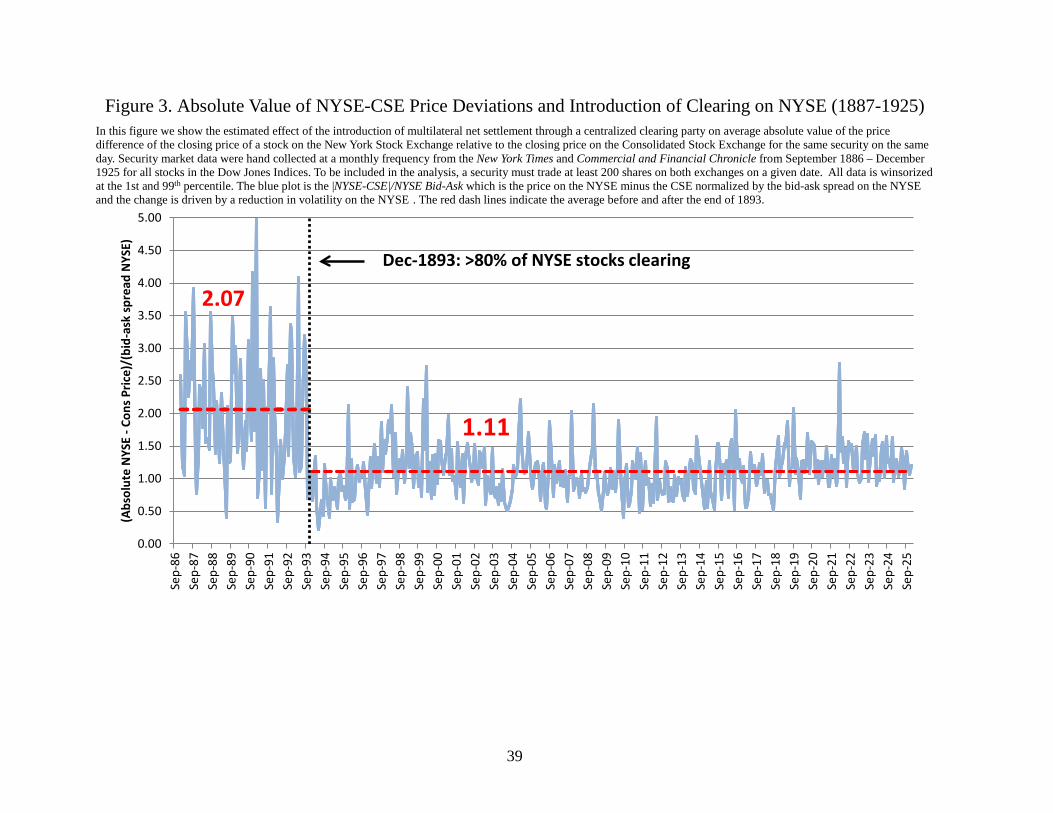
39
Figure 3. Absolute Value of NYSE-CSE Price Deviations and Introduction of Clearing on NYSE (1887-1925)
In this figure we show the estimated effect of the introduction of multilateral net settlement through a centralized clearing party on average absolute value of the price difference of the closing price of a stock on the New York Stock Exchange relative to the closing price on the Consolidated Stock Exchange for the same security on the same day. Security market data were hand collected at a monthly frequency from the New York Times and Commercial and Financial Chronicle from September 1886 – December 1925 for all stocks in the Dow Jones Indices. To be included in the analysis, a security must trade at least 200 shares on both exchanges on a given date. All data is winsorized at the 1st and 99th percentile. The blue plot is the |NYSE-CSE|/NYSE Bid-Ask which is the price on the NYSE minus the CSE normalized by the bid-ask spread on the NYSE and the change is driven by a reduction in volatility on the NYSE . The red dash lines indicate the average before and after the end of 1893.
2.07
0.00
0.50
1.00
1.50
2.00
2.50
3.00
3.50
4.00
4.50
5.00
Sep-
86Se
p-87
Sep-
88Se
p-89
Sep-
90Se
p-91
Sep-
92Se
p-93
Sep-
94Se
p-95
Sep-
96Se
p-97
Sep-
98Se
p-99
Sep-
00Se
p-01
Sep-
02Se
p-03
Sep-
04Se
p-05
Sep-
06Se
p-07
Sep-
08Se
p-09
Sep-
10Se
p-11
Sep-
12Se
p-13
Sep-
14Se
p-15
Sep-
16Se
p-17
Sep-
18Se
p-19
Sep-
20Se
p-21
Sep-
22Se
p-23
Sep-
24Se
p-25
(Abs
olut
e N
YSE
-Con
s Pric
e)/(
bid-
ask
spre
ad N
YSE)
Dec-1893: >80% of NYSE stocks clearing
1.11

40
Figure 4. Volatility of NYSE-CSE Premium and Introduction of Clearing on NYSE (1887-1925)
In this figure we show the estimated effect of the introduction of multilateral net settlement through a centralized clearing party on the rolling 12-month standard deviation of closing price of a stock on the New York Stock Exchange relative to the closing price on the Consolidated Stock Exchange for the same security on the same day. Security market data were hand collected at a monthly frequency from the New York Times and Commercial and Financial Chronicle from September 1886 – December 1925 for all stocks in the Dow Jones Indices. To be included in the analysis a security must trade at least 200 shares on both exchanges on a given date. All data is winsorized at the 1st and 99th percentile. NYSE-Con/NYSE Bid-Ask is the price on the NYSE minus the CSE normalized by the bid-ask spread on the NYSE. The period prior to the establishment of the NYSE clearinghouse May 17th, 1892 is highlighted in red.
0.00
0.50
1.00
1.50
2.00
2.50
-4.00
-3.00
-2.00
-1.00
0.00
1.00
2.00
3.00
4.00
5.00
6.00
Jan-
87
Nov
-87
Sep-
88
Jul-8
9
May
-90
Mar
-91
Jan-
92
Nov
-92
Sep-
93
Jul-9
4
May
-95
Mar
-96
Jan-
97
Nov
-97
Sep-
98
Jul-9
9
May
-00
Mar
-01
Jan-
02
Nov
-02
Sep-
03
Jul-0
4
May
-05
Mar
-06
Jan-
07
Nov
-07
Sep-
08
Jul-0
9
May
-10
Mar
-11
Jan-
12
Nov
-12
Sep-
13
Jul-1
4
May
-15
Mar
-16
Jan-
17
Nov
-17
Sep-
18
Jul-1
9
May
-20
Mar
-21
Jan-
22
Nov
-22
Sep-
23
Jul-2
4
May
-25
NY
SE -
Con
Clo
sing
Pri
ce /
Bid
-Ask
Spr
ead
NYSE - Consolidated Price (normalized by bid-ask spread)
12-Month Rolling Standard Deviation
May 1892: 1st 4 NYSE stocks start clearing

41
Appendix A: Supplementary Tables & Figures Table A1. Summary Statistics: All NYSE/CSE Stocks Daily Data
This table reports sample statistics for the trading data for stocks on the NYSE or CSE. Security market data were hand collected at a daily frequency from the New York Times from January 1892 – Dec 1901 for all stocks on the NYSE or CSE. All data is winsorized at the 1st and 99th percentile. To be included in the first level of summary analysis a security must trade at least 1 share on both exchanges on a given date, while for the second, which is the one used in our primary econometric specifications, we require at least 200 shares (2 standard contracts) and 20 observations before and after the introduction of clearing.
NYSE Closing
Price
NYSE Trading Volume
(#Shares)
CSE Trading Volume
(#Shares)
NYSE Trading Volume ($000s)
CSE Trading Volume ($000s)
NYSE Bid-Ask Spread
(bps)
CSE Bid-Ask Spread (bps)
With Minimum 1 Shares Traded (n = 62,959) Mean 56.3 10,122 3,055 743 252 68 120 Median 47.4 3,750 320 167 14 37 41
Standard Dev. 38.5 19,930 7,613 1,873 773 92 241
Minimum 0.8 1 2 0.004 0.009 9 9 Maximum 259 957,955 262,250 75,200 30,800 625 1,667
With Minimum 200 Shares Traded and 20 Observations before and after Clearing (n = 28,161)
Mean 64.6 15,820 5,789 1,255 496 44 49
Median 58.4 8,310 1,880 456 96 28 28
Standard Dev. 37.4 24,633 10,022 2,509 1,070 53 87
Minimum 0.8 200 200 0.6 0.4 9 9
Maximum 230 957,955 262,250 75,200 30,800 625 1,667

42
Table A2. Summary Statistics for Call Loan Rates and Exchange Seat Prices
This table reports the sample statistics for the average overnight collateralized borrowing rate, the Call Loan Rate, and seat prices for membership on the New York and Consolidated Stock Exchanges over four periods from September 1886- December 1925. Seat price data were hand collected at a monthly frequency from the Commercial and Financial Chronicle.
Full Sample Pre-Clearinghouse Clearinghouse Clearinghouse Subsample 1886-1925 1886-1893 1894-1925 1894-1908
Call Loan Rate (%)
Mean 4.0 4.7 3.8 3.6 Median 3.2 4.0 3.0 2.5
Standard Dev. 3.6 3.7 3.6 4.8
Minimum 0.9 1.1 0.9 0.9 Maximum 40.0 22.0 40.0 40.0
New York Stock Exchange Seat Price ($000s)
Mean 56.9 20.0 63.9 50.6
Median 63.0 20.0 68.5 54.5
Standard Dev. 29.1 1.8 26.5 26.3
Minimum 14.3 16.5 14.3 14.3
Maximum 150.0 24.0 150.0 95.0
Consolidated Stock Exchange Seat Price ($000s)
Mean 1.1 0.4 1.3 0.8
Median 0.7 0.3 0.8 0.7
Standard Dev. 1.3 0.3 1.5 0.7
Minimum 0.1 0.1 0.1 0.1
Maximum 6.0 1.0 6.0 2.5

43
Table A3. Robustness Tests for Changes in Microstructure Noise or Market Liquidity
In this table we show that the introduction of clearing on the NYSE is not associated with a change in the relative trading on the NYSE vs. the CSE and that the introduction of multilateral net settlement through a centralized clearing party reduced the premium and volatility of the closing price of a stock on the New York Stock Exchange relative to the closing price on the Consolidated Stock Exchange for the same security on the same day. Security market data were hand collected at a daily frequency from the New York Times from January 1892 – Dec 1901 for all stocks on the NYSE or CSE. To be included in the analysis a security must trade at least 200 shares on both exchanges on a given date. All data is winsorized at the 1st and 99th percentile. In Column 1, |NYSE-Con|/Close is an estimate of monthly volatility of the price on the NYSE relative to the CSE, normalized by the average closing price on both exchanges in percent. Post 1893, which is equal to 1 for all securities clearing after 1893 and zero prior. In Column 2, |NYSE-CSE|/NYSE Bid-Ask is the volatility of the price on the NYSE minus the CSE normalized by the bid-ask spread on the NYSE. Column 3 shows results if we only include stocks with at least 20 daily observations before and after the introduction of clearing. Column 4 shows results with stock-specific time-varying market liquidity controls. In addition to the estimated bid-ask spread on the NYSE, the dollar trading volume on the NYSE, and the dollar trading volume on the CSE. CSE Bid-Ask Control, indicates that it also includes the estimated bid-ask spread on the CSE. Column 5 shows results using opening instead of closing transaction prices. In Column 6, Bid-Ask (%) NYSE-CSE, is the NYSE minus CSE percent bid-ask spreads (normalized by price) on each exchange. In Column 7 (Hi-Lo)/Open CSE/NYSE is the high minus low value normalized by the opening price on the CSE divided by the same on the NYSE. In Column 8 we rerun the same specification as column 2, but use closing prices on the Boston Stock Exchange (BSE) as a control. Closing prices for the BSE are collected from the Boston Globe from 1892-1901 at a weekly frequency. All specifications are run with security-level fixed effects and errors are clustered at the security-level. P-Values: *10%; **5%; ***1%.
(1) (2) (3) (4) (5) (6) (7) (8) Dependent Variable: |NYSE-CSE|
/Close (%) |NYSE-CSE|
/NYSE Bid-Ask |NYSE-CSE| /Close (%)
|NYSE-CSE| /Close (%)
|NYSE-CSE| /Open (%)
Bid-Ask (%) NYSE-CSE
Hi-Lo/Open CSE/NYSE
|NYSE-BSE| /NYSE Bid-Ask
Post-1893 -0.141*** -0.393*** -0.194*** -0.193*** -0.225*** -0.056 0.038** -0.264* (0.051) (0.062) (0.055) (0.034) (0.055) (0.074) (0.016) (0.136)
Constant 0.745*** 1.742*** 0.692*** 0.386*** 0.600*** -0.314*** 0.957*** 1.695*** (0.038) (0.046) (0.040) (0.036) (0.063) (0.055) (0.012) (0.080)
Security Fixed Effects Y Y Y Y Y Y Y Y Liquidity Controls N N N Y Y N Y N
CSE Bid-Ask Control N N N Y Y N Y N Period 1892-1901 1892-1901 1892-1901 1892-1901 1892-1901 1892-1901 1892-1901 1892-1898
Min Pre & Post Obs N/A N/A 20 20 20 20 20 N/A Price Used Close Close Close Close Open Close Open Close # Clusters 188 188 48 48 48 48 48 11
# Observations 37,682 37,666 28,165 28,100 28,097 43,271 27,183 818 Adjusted R-squared 0.164 0.078 0.049 0.101 0.052 0.097 0.061 0.016

44
Table A4. CSE as Control for NYSE
In this table we show that most of the variation stock returns on the New York Stock Exchange can be explained by the monthly returns for identical securities listed across the street at the Consolidated Stock Exchange. Security market data were hand collected at a monthly frequency from the New York Times and Commercial and Financial Chronicle from September 1886 – December 1925 for all stocks in the Dow Jones Indices. All data is winsorized at the 1st and 99th percentile. In column 1 we regress the monthly percent change in closing prices of NYSE-listed securities on identical stock returns on the CSE. Column 2 is the same but looks at changes in NYSE prices, not normalized by closing prices. All standard errors are clustered at the security-level. P-Values: * 10%; ** 5%; ***1%.
(1) (2)
Dependent Variable: %ΔNYSE Closing Prices ΔNYSE Closing Prices
%ΔCSE Closing Prices 0.9528*** (0.008)
ΔCSE Closing Prices 0.9497*** (0.0088)
Constant 0.0005*** 0.0358*** (0.0002) (0.0125)
# Observations 8,205 8,205
Adjusted R-squared 0.9291 0.9264
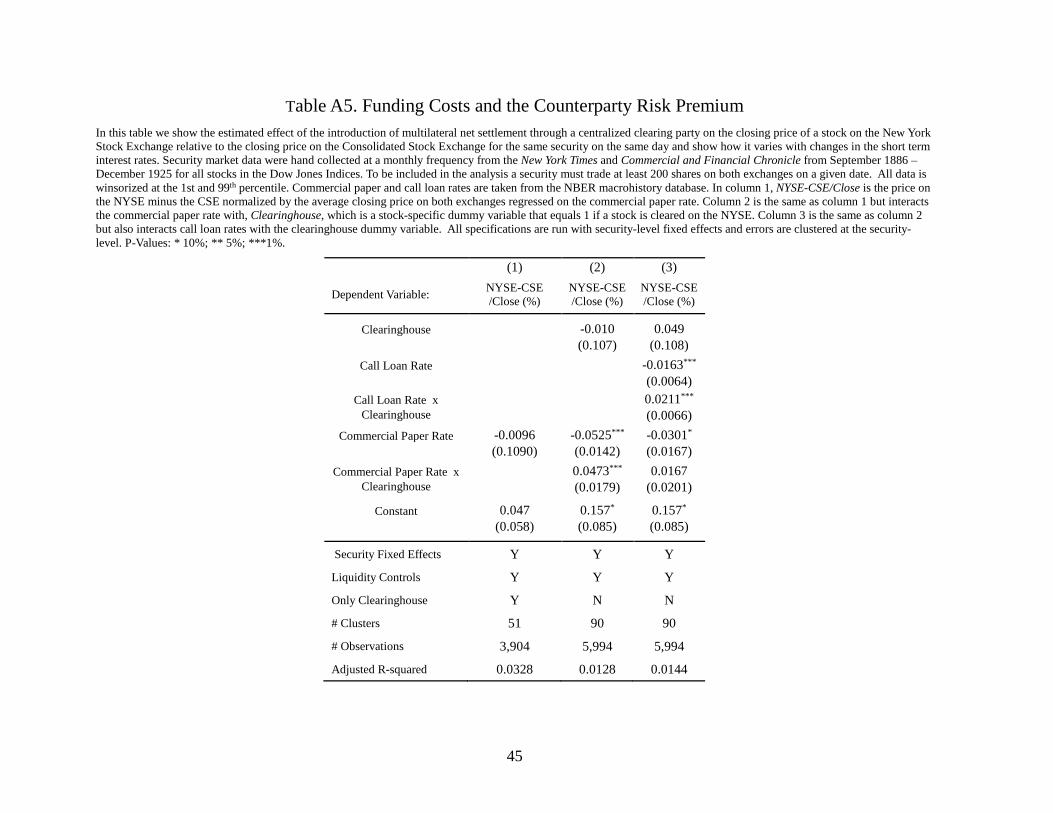
45
Table A5. Funding Costs and the Counterparty Risk Premium
In this table we show the estimated effect of the introduction of multilateral net settlement through a centralized clearing party on the closing price of a stock on the New York Stock Exchange relative to the closing price on the Consolidated Stock Exchange for the same security on the same day and show how it varies with changes in the short term interest rates. Security market data were hand collected at a monthly frequency from the New York Times and Commercial and Financial Chronicle from September 1886 – December 1925 for all stocks in the Dow Jones Indices. To be included in the analysis a security must trade at least 200 shares on both exchanges on a given date. All data is winsorized at the 1st and 99th percentile. Commercial paper and call loan rates are taken from the NBER macrohistory database. In column 1, NYSE-CSE/Close is the price on the NYSE minus the CSE normalized by the average closing price on both exchanges regressed on the commercial paper rate. Column 2 is the same as column 1 but interacts the commercial paper rate with, Clearinghouse, which is a stock-specific dummy variable that equals 1 if a stock is cleared on the NYSE. Column 3 is the same as column 2 but also interacts call loan rates with the clearinghouse dummy variable. All specifications are run with security-level fixed effects and errors are clustered at the security-level. P-Values: * 10%; ** 5%; ***1%.
(1) (2) (3)
Dependent Variable: NYSE-CSE /Close (%)
NYSE-CSE /Close (%)
NYSE-CSE /Close (%)
Clearinghouse -0.010 0.049 (0.107) (0.108)
Call Loan Rate -0.0163*** (0.0064)
Call Loan Rate x 0.0211*** Clearinghouse (0.0066)
Commercial Paper Rate -0.0096 -0.0525*** -0.0301* (0.1090) (0.0142) (0.0167)
Commercial Paper Rate x 0.0473*** 0.0167 Clearinghouse (0.0179) (0.0201)
Constant 0.047 0.157* 0.157* (0.058) (0.085) (0.085)
Security Fixed Effects Y Y Y
Liquidity Controls Y Y Y
Only Clearinghouse Y N N
# Clusters 51 90 90
# Observations 3,904 5,994 5,994
Adjusted R-squared 0.0328 0.0128 0.0144
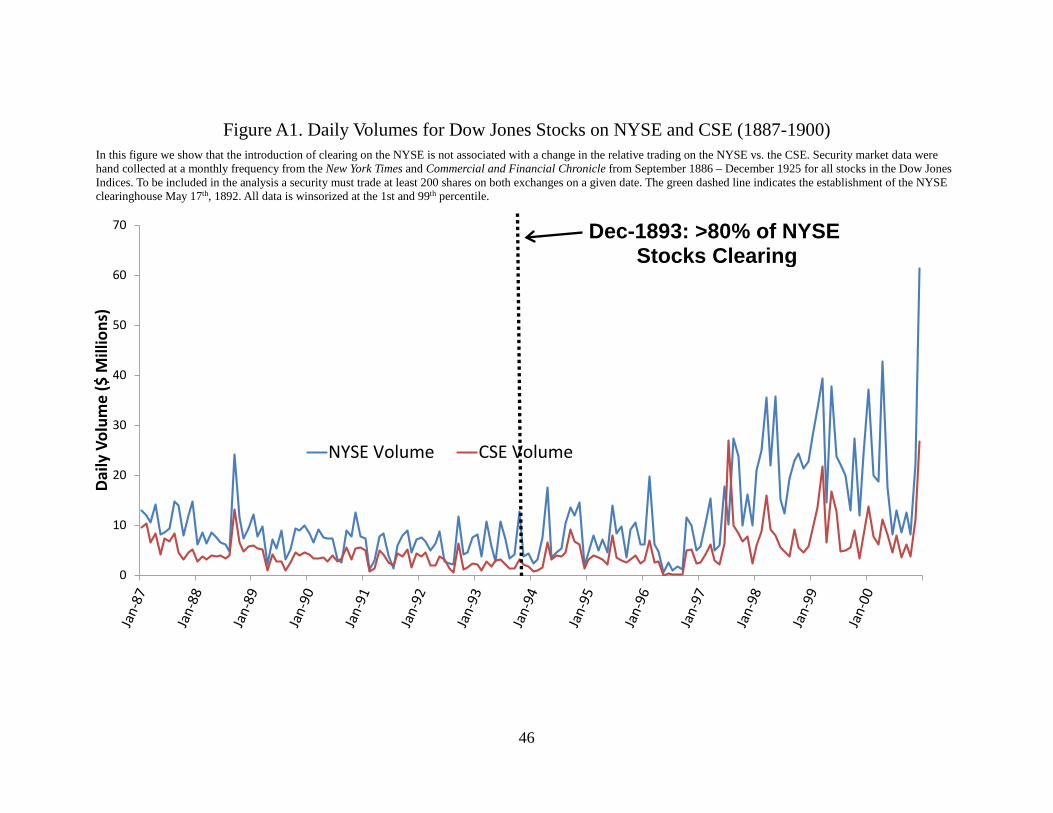
46
0
10
20
30
40
50
60
70
Daily
Vol
ume
($ M
illio
ns)
NYSE Volume CSE Volume
Figure A1. Daily Volumes for Dow Jones Stocks on NYSE and CSE (1887-1900)
In this figure we show that the introduction of clearing on the NYSE is not associated with a change in the relative trading on the NYSE vs. the CSE. Security market data were hand collected at a monthly frequency from the New York Times and Commercial and Financial Chronicle from September 1886 – December 1925 for all stocks in the Dow Jones Indices. To be included in the analysis a security must trade at least 200 shares on both exchanges on a given date. The green dashed line indicates the establishment of the NYSE clearinghouse May 17th, 1892. All data is winsorized at the 1st and 99th percentile.
Dec-1893: >80% of NYSE Stocks Clearing

47
0.00
0.50
1.00
1.50
2.00
2.50
3.00
3.50
CSE
Bid
Ask/
NYS
E Bi
d As
k
Dec-1893: >80% of NYSE Stocks Clearing
Figure A2. CSE/NYSE Bid-Ask Spreads 1892-1901
In this figure we show that the introduction of clearing on the NYSE is not associated with a change in the relative bid-ask spread on the NYSE vs. the CSE. Security market data were hand collected at a daily frequency from the New York Times from January 1892 – Dec 1901 for all stocks on the NYSE or CSE. To be included in the analysis a security must trade at least 200 shares on both exchanges on a given date. All data is winsorized at the 1st and 99th percentile. For a description of the estimation of the bid-ask spreads see appendix A.

48
0.0%
5.0%
10.0%
15.0%
20.0%
25.0%
30.0%
35.0%
40.0%
45.0%Ja
n-87
Jan-
88
Jan-
89
Jan-
90
Jan-
91
Jan-
92
Jan-
93
Jan-
94
Jan-
95
Jan-
96
Jan-
97
Jan-
98
Jan-
99
Jan-
00
Jan-
01
Jan-
02
Jan-
03
Jan-
04
Jan-
05
Jan-
06
Jan-
07
Jan-
08
Jan-
09
Jan-
10
Jan-
11
Jan-
12
Jan-
13
Jan-
14
Jan-
15
Jan-
16
Jan-
17
Jan-
18
Jan-
19
Jan-
20
Jan-
21
Jan-
22
Jan-
23
Jan-
24
Jan-
25
NY
SE -
Con
Clo
sing
Pri
ce /
Bid
-Ask
Spr
ead
Figure A3. Call Loan Interest Rates (Overnight Collateralized Borrowing Rate) 1887-1925
In this figure we show that the introduction of clearing on the NYSE is not associated with a change in macro-economic risk. Closing monthly broker call loan rates are taken from NBER macro-history database for the entire period.
Dec-1893: >80% of NYSE Stocks Clearing
May-1908: Aldrich-Vreeland Act
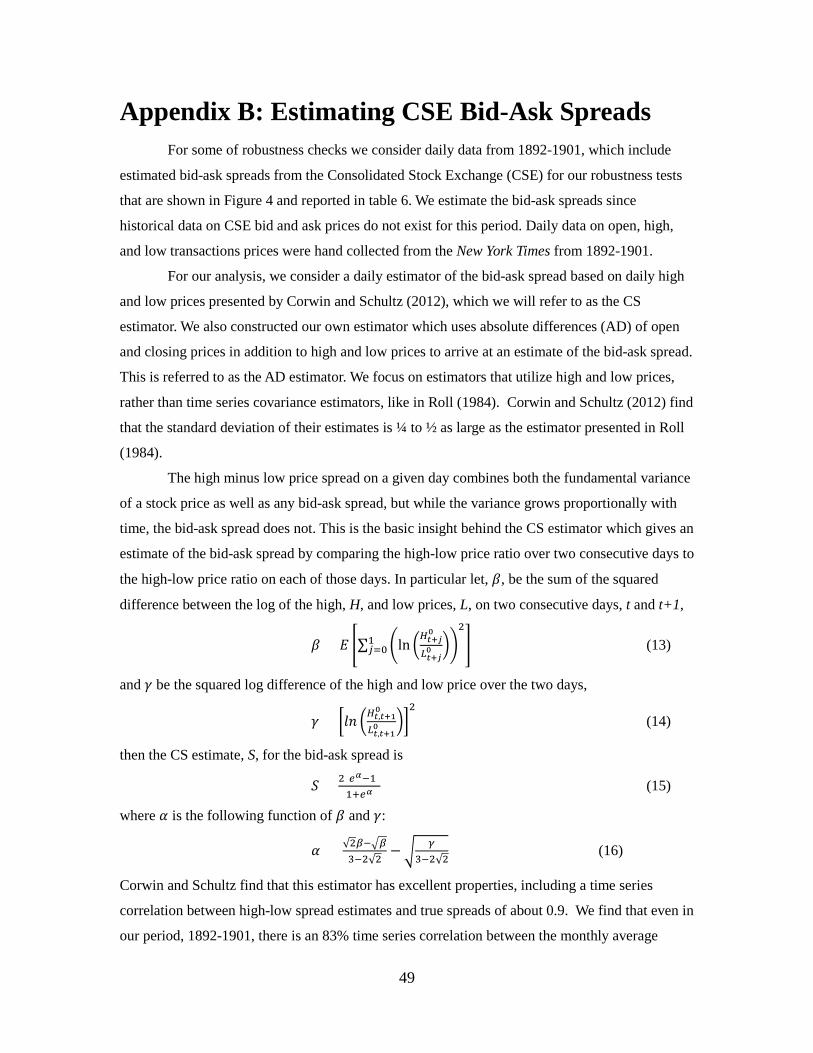
49
Appendix B: Estimating CSE Bid-Ask Spreads For some of robustness checks we consider daily data from 1892-1901, which include
estimated bid-ask spreads from the Consolidated Stock Exchange (CSE) for our robustness tests
that are shown in Figure 4 and reported in table 6. We estimate the bid-ask spreads since
historical data on CSE bid and ask prices do not exist for this period. Daily data on open, high,
and low transactions prices were hand collected from the New York Times from 1892-1901.
For our analysis, we consider a daily estimator of the bid-ask spread based on daily high
and low prices presented by Corwin and Schultz (2012), which we will refer to as the CS
estimator. We also constructed our own estimator which uses absolute differences (AD) of open
and closing prices in addition to high and low prices to arrive at an estimate of the bid-ask spread.
This is referred to as the AD estimator. We focus on estimators that utilize high and low prices,
rather than time series covariance estimators, like in Roll (1984). Corwin and Schultz (2012) find
that the standard deviation of their estimates is ¼ to ½ as large as the estimator presented in Roll
(1984).
The high minus low price spread on a given day combines both the fundamental variance
of a stock price as well as any bid-ask spread, but while the variance grows proportionally with
time, the bid-ask spread does not. This is the basic insight behind the CS estimator which gives an
estimate of the bid-ask spread by comparing the high-low price ratio over two consecutive days to
the high-low price ratio on each of those days. In particular let, 𝛽𝛽, be the sum of the squared
difference between the log of the high, H, and low prices, L, on two consecutive days, t and t+1,
𝛽𝛽 = 𝐸𝐸 �∑ �ln �𝐻𝐻𝑡𝑡+𝑗𝑗0
𝑀𝑀𝑡𝑡+𝑗𝑗0 ��
21𝑗𝑗=0 � (13)
and 𝛾𝛾 be the squared log difference of the high and low price over the two days,
𝛾𝛾 = �𝛾𝛾𝑙𝑙 �𝐻𝐻𝑡𝑡,𝑡𝑡+10
𝑀𝑀𝑡𝑡,𝑡𝑡+10 ��
2 (14)
then the CS estimate, S, for the bid-ask spread is
𝑆𝑆 = 2(𝑐𝑐𝛼𝛼−1)1+𝑐𝑐𝛼𝛼
(15)
where 𝛼𝛼 is the following function of 𝛽𝛽 and 𝛾𝛾:
𝛼𝛼 = √2𝛽𝛽−�𝛽𝛽3−2√2
− � 𝛾𝛾3−2√2
(16)
Corwin and Schultz find that this estimator has excellent properties, including a time series
correlation between high-low spread estimates and true spreads of about 0.9. We find that even in
our period, 1892-1901, there is an 83% time series correlation between the monthly average

50
actual bid-ask spread on the NYSE and the CS estimated bid-ask spreads. One of the unfortunate
properties of this estimator is that estimates of the bid-ask spread can be negative. In simulations,
Corwin and Schultz show that for stocks with a true bid-ask spread of 50bps, setting negative
values to zero results in an average estimate of the bid-ask spread of 143bps. As the true bid-ask
spreads become larger, the number of negative values diminishes and the bias becomes
negligible. Unfortunately, this does not appear to be the case in our analysis. When we use the CS
estimator from 1892-1901, we find that more than ½ of all bid-ask spread estimates are negative.
This is especially problematic in our analysis since in one of our normalization methods we
divide by the bid-ask spread, so we need the bid-ask spread to be strictly positive. To avoid this
issue we set negative values to the minimum bid-ask spread on the NYSE, 1/8th.
Since in our period more than half of all observations require this ad-hoc adjustment, we
considered another bid-ask estimator as a robustness check. In particular, we estimate the bid-ask
spread by taking the minimum non-zero pair-wise absolute differences (AD) between the open,
close, high, and low prices on two consecutive days. The insight for the estimator is that if we
observe two prices and there is no change in fundamental value, or the change is small relative to
the minimum tick size, then if the prices differ, the absolute difference between them is equal to
the bid-ask spread. In our period the tick sizes were 1/8th which means that as long as
fundamental value between two prices differ by less than 1/16th and observed prices differ we can
recover the exact bid-ask spread. Unlike the CS estimator the AD estimator is never negative, by
construction, since the estimate is bounded below by the minimum1/8th tick size. In addition,
Figure A1 shows that the AD estimator does a good job of predicting actual bid-ask spreads
during this period. For NYSE stocks from 1892-1901, we find an 88 percent time series
correlation between the monthly average actual bid-ask spread on the NYSE and the AD
estimated bid-ask spreads and a 75 percent correlation in changes in the averages. This compares
favorably with the CS estimator which has correlations of 83 percent and 57 percent in levels and
changes respectively, which is why we use the AD estimator in our primary analysis. The bid-ask
spread estimates using the AD and CS estimators have over an 80 percent correlation during this
period. As suggested by the high correlation between the estimates, also displayed in Figure A2,
the results are robust to using either estimator42.
42 Results using CS estimator are available upon request.

51
Figure B1. Validity of Estimated Bid-Ask Spreads for CSE and NYSE 1892-1901 This figure shows bid-ask spreads for security market data hand collected at a daily frequency from the New York Times from January 1892 – Dec 1901 for all stocks on the NYSE or CSE. To be included in the analysis a security must trade at least 200 shares on both exchanges on a given date. All data is winsorized at the 1st and 99th percentile. The blue line is the actual bid-ask spread on the NYSE. The red and green lines are the estimated bid-ask spread on the NYSE and CSE respectively using the absolute difference (AD) method. For a description of the estimation method see the appendix.
0.00%
0.50%
1.00%
1.50%
2.00%
2.50%
3.00%
3.50%
(Ask
-Bi
d)/(
Clos
ing
Pric
e)
AD Estimated CSE Bid-Ask Spreads
Actual NYSE Bid-Ask Spreads
AD Estimated NYSE Bid-Ask Spreads
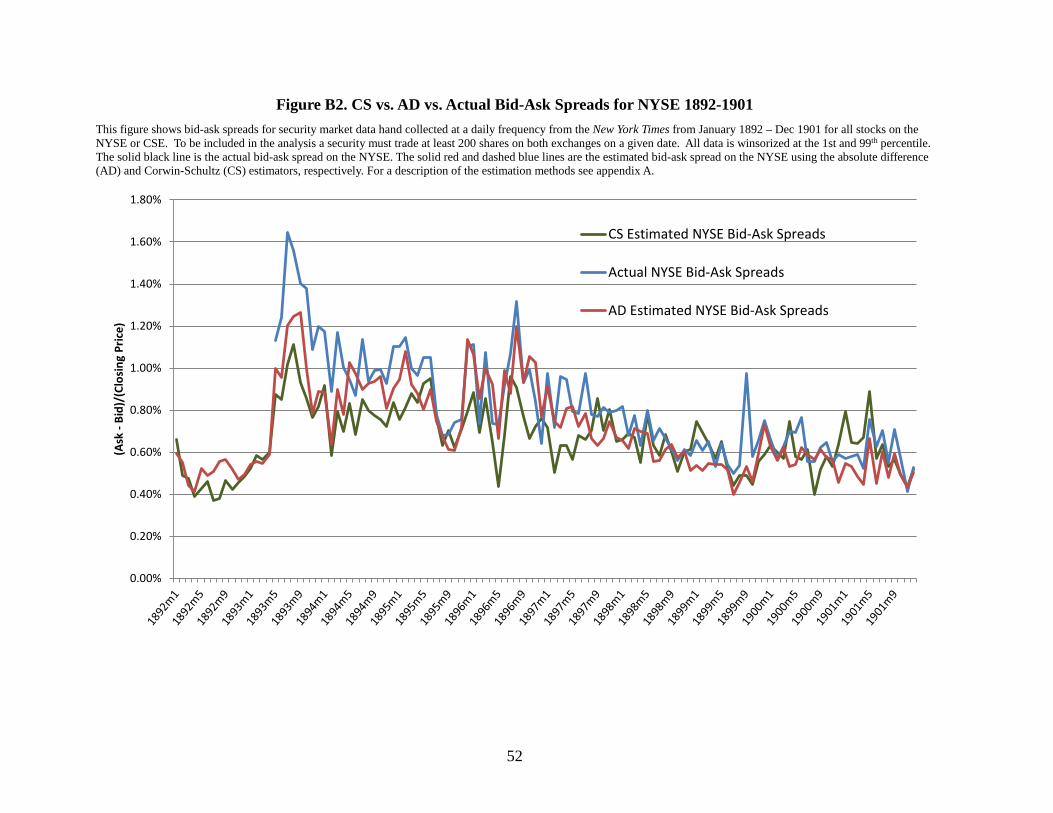
52
Figure B2. CS vs. AD vs. Actual Bid-Ask Spreads for NYSE 1892-1901 This figure shows bid-ask spreads for security market data hand collected at a daily frequency from the New York Times from January 1892 – Dec 1901 for all stocks on the NYSE or CSE. To be included in the analysis a security must trade at least 200 shares on both exchanges on a given date. All data is winsorized at the 1st and 99th percentile. The solid black line is the actual bid-ask spread on the NYSE. The solid red and dashed blue lines are the estimated bid-ask spread on the NYSE using the absolute difference (AD) and Corwin-Schultz (CS) estimators, respectively. For a description of the estimation methods see appendix A.
0.00%
0.20%
0.40%
0.60%
0.80%
1.00%
1.20%
1.40%
1.60%
1.80%
(Ask
-Bi
d)/(
Clos
ing
Pric
e)
CS Estimated NYSE Bid-Ask Spreads
Actual NYSE Bid-Ask Spreads
AD Estimated NYSE Bid-Ask Spreads

53
Appendix C: Estimating Change in Volatility Let X be defined as the price difference between the NYSE and CSE normalized by the average
price on the two exchanges so that, 𝑋𝑋 ≡ 𝑃𝑃�𝑖𝑖,𝑡𝑡,𝑁𝑁𝑁𝑁𝑁𝑁𝐸𝐸 − 𝑃𝑃�𝑖𝑖,𝑡𝑡,𝐶𝐶𝑁𝑁𝐸𝐸, is the return required to equalize the price on
both exchanges and let 𝑁𝑁 ≡ |𝑋𝑋|. Now if we assume that 𝑋𝑋~𝑁𝑁(𝜇𝜇,𝜎𝜎) then Y is distributed folded normal
and
𝐸𝐸[𝑁𝑁] = 𝜎𝜎�2𝜋𝜋𝛾𝛾− 12�
𝜇𝜇𝜎𝜎�
2
+ 𝜇𝜇 �1 − 2Φ�−𝜇𝜇𝜎𝜎�� (B1)
Therefore any change in the expectation of the absolute value is a function of any change in the mean
and/or volatility of X. Under the additional assumption that 𝜇𝜇 ≪ 𝜎𝜎 the expectation of a folded normal
distribution becomes
𝐸𝐸[𝑁𝑁] ≈ 𝜎𝜎�2𝜋𝜋 (B2)
so that the absolute value is just proportional to 𝜎𝜎, which is the primary estimator for the change in
volatility used in our paper.
From Table 2 we estimated that prior to the clearinghouse 𝜇𝜇= -9bps and afterwards it is 15bps and
from summary statistics computed separately we have that our estimate of 𝐸𝐸[𝑁𝑁] prior to the introduction
of the clearinghouse is approximately 73bps and 52bps afterwards. Using the change in 𝜇𝜇 and the change
in 𝐸𝐸[𝑁𝑁] we have that the implied 𝜎𝜎 from equation B1 is 94bps pre-clearing and 64bps afterwards, which
is a reduction of 30bps. If instead we use our estimator in B2 we get that the implied 𝜎𝜎 is 94bps pre-
clearing and 65bps afterwards, which is a reduction of 29bps. Thus our estimator in B2 is only
approximately 1bp off without having to estimating 𝜇𝜇 before and after as we would need to in B1.
To build an intuition for the when it is reasonable to use the approximation in B2 instead of B1
we start by taking the partial derivative with respect to 𝜇𝜇 and 𝜎𝜎 in B1. Defining �̂�𝜇 ≡ 𝜇𝜇𝜎𝜎 we get that:
𝜕𝜕𝐸𝐸[𝑁𝑁]𝜕𝜕𝜇𝜇
= −�̂�𝜇�2𝜋𝜋𝛾𝛾− 12𝜇𝜇�
2+ 1 + 2�̂�𝜇𝜙𝜙(−�̂�𝜇) − 2Φ(−�̂�𝜇) (B3)
and
𝜕𝜕𝐸𝐸[𝑁𝑁]𝜕𝜕𝜎𝜎
= �2𝜋𝜋𝛾𝛾− 12𝜇𝜇�
2(1 + �̂�𝜇 2)− 2�̂�𝜇2𝜙𝜙(−�̂�𝜇) (B4)
From equations B3 and B4 we can see that the ratio of the mean of X to the standard deviation is a
sufficient statistic for the partial derivative with respect to each of them. Since in our paper 𝜎𝜎 tends to be
larger than 𝜇𝜇 in figure B1 we consider the value of those derivatives for a range of values for the ratio of
𝜎𝜎 divided by 𝜇𝜇 from 0 to 10. As you can see in equations B3 and B4 above and in figure B1 as 𝜎𝜎 gets

54
large relative to 𝜇𝜇 the partial derivative with respect 𝜎𝜎 asymptotes to �2𝜋𝜋 while the partial derivative with
respect to 𝜇𝜇 shrinks continuously so that the ratio of the partials increases linearly and the mean has less
effect on the expectation of the absolute value. The intuition behind this result is that in the limit where
𝜇𝜇 ≪ 𝜎𝜎 the expectation of a folded normal distribution becomes 𝐸𝐸[𝑁𝑁] ≈ 𝜎𝜎�2𝜋𝜋 so that the absolute value is
just proportional to 𝜎𝜎.
In our sample we have a 𝜎𝜎 5 to 10 times larger than 𝜇𝜇 so the effect of changes in 𝜇𝜇 are minimal.
In particular, in the example provided previously, if 𝜎𝜎 remains unchanged at 73bps the change in 𝜇𝜇 from -
9bps to 15bps results in a change in the 𝐸𝐸[𝑁𝑁] of only 4/5ths of a basis point. The effect is so small because
the symmetry of the normal distribution means the change from -9bps to 15bps is the same as effect of a
change from 9bps to 15bps, or only 6bps. Also, since 𝜎𝜎 is about 7 times larger than 𝜇𝜇 the partial derivative
is around 0.12. Thus, taking these together 6𝑏𝑏𝑏𝑏𝑠𝑠 𝑥𝑥 0.12 ≈ 0.7𝑏𝑏𝑏𝑏𝑠𝑠 which is approximately the result we
arrived at previously.