Embed Size (px)
Citation preview
Country Profile on
Disability
KINGDOM OF NEPAL
March 2002 Japan International Cooperation Agency
Planning and Evaluation Department
Country Profile on Disabilities Kingdom of Nepal
Table of Contents
Figures ....................................................................................................................................... ii
Tables ......................................................................................................................................... ii
Abbreviations............................................................................................................................ iii
1. Basic Profile........................................................................................................................... 1
1-1. Basic Indicators .............................................................................................................. 1
1-2. Indicators on Disability .................................................................................................. 3
2. Issues on Disability ................................................................................................................ 9
2-1. Definition of Disability in Nepal .................................................................................... 9
2-2. Current Situation........................................................................................................... 12
2-3. Documentation and Survey on Disability ..................................................................... 15
3. Administration and Policy on Disability.............................................................................. 16
3-1. Administration on Disability......................................................................................... 16
3-2. Laws and Regulations on Disability ............................................................................. 19
3-3. Policies on Disability.................................................................................................... 20
3-4. Measures on Disability ................................................................................................. 21
3-5. Experts and Workers on the Field of Disability ............................................................ 26
4. Disability-related organizations and Activities .................................................................... 28
4-1. Activities by Disability-related Organizations.............................................................. 28
4-2. Cooperation Projects on Disability Organized by International Donors and Others .... 28
5. References............................................................................................................................ 30
i
Figures
Figure 1: Disability-specific Data ...................................................................................... 4
Figure 2: Number of Persons with Disabilities by Region and Gender ............................. 6
Figure 3: Cause-specific Data ............................................................................................ 7
Figure 4: Gender-specific Data .......................................................................................... 8
Figure 5: Organizational Chart of Central Government................................................... 16
Figure 6: Chart of Ministry of Education, Health, and Local Development at Local Level
................................................................................................................................. 18
Tables
Table 1: Disability-specific Data in 1980 and 1999........................................................... 3
Table 2: Age-specific Data ................................................................................................. 4
Table 3: Area-specific Data by Type of Disability ............................................................. 5
Table 4: Grade-specific Data for Intellectually Disabled................................................... 6
Table 5: Cause-specific Data for all Types of Disabilities ................................................. 7
Table 6: Cause-specific Data by Types of Disabilities....................................................... 7
Table 7: Number of Persons with Disabilities by Gender and Types Disabilities.............. 7
Table 8: Classifications of Disabilities.............................................................................. 11
ii
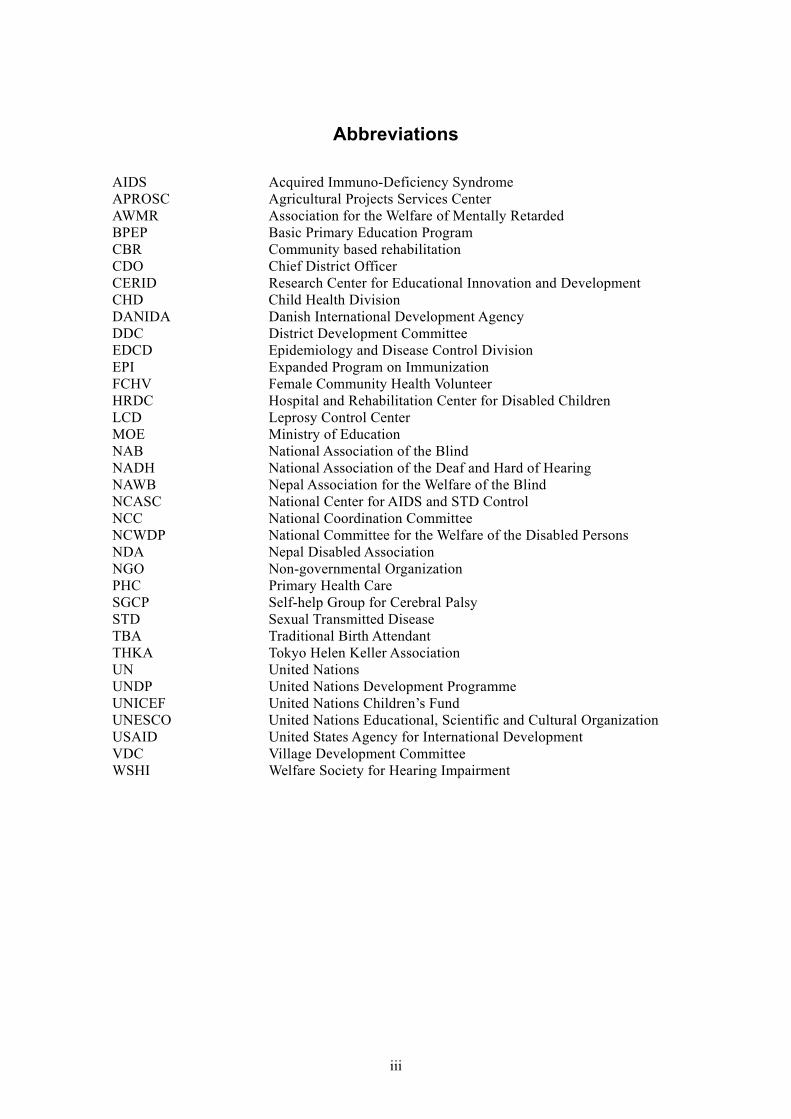
Abbreviations
AIDS Acquired Immuno-Deficiency Syndrome APROSC Agricultural Projects Services Center AWMR Association for the Welfare of Mentally Retarded BPEP Basic Primary Education Program CBR Community based rehabilitation CDO Chief District Officer CERID Research Center for Educational Innovation and Development CHD Child Health Division DANIDA Danish International Development Agency DDC District Development Committee EDCD Epidemiology and Disease Control Division EPI Expanded Program on Immunization FCHV Female Community Health Volunteer HRDC Hospital and Rehabilitation Center for Disabled Children LCD Leprosy Control Center MOE Ministry of Education NAB National Association of the Blind NADH National Association of the Deaf and Hard of Hearing NAWB Nepal Association for the Welfare of the Blind NCASC National Center for AIDS and STD Control NCC National Coordination Committee NCWDP National Committee for the Welfare of the Disabled Persons NDA Nepal Disabled Association NGO Non-governmental Organization PHC Primary Health Care SGCP Self-help Group for Cerebral Palsy STD Sexual Transmitted Disease TBA Traditional Birth Attendant THKA Tokyo Helen Keller Association UN United Nations UNDP United Nations Development Programme UNICEF United Nations Children’s Fund UNESCO United Nations Educational, Scientific and Cultural Organization USAID United States Agency for International Development VDC Village Development Committee WSHI Welfare Society for Hearing Impairment
iii
Country Profile onNepal
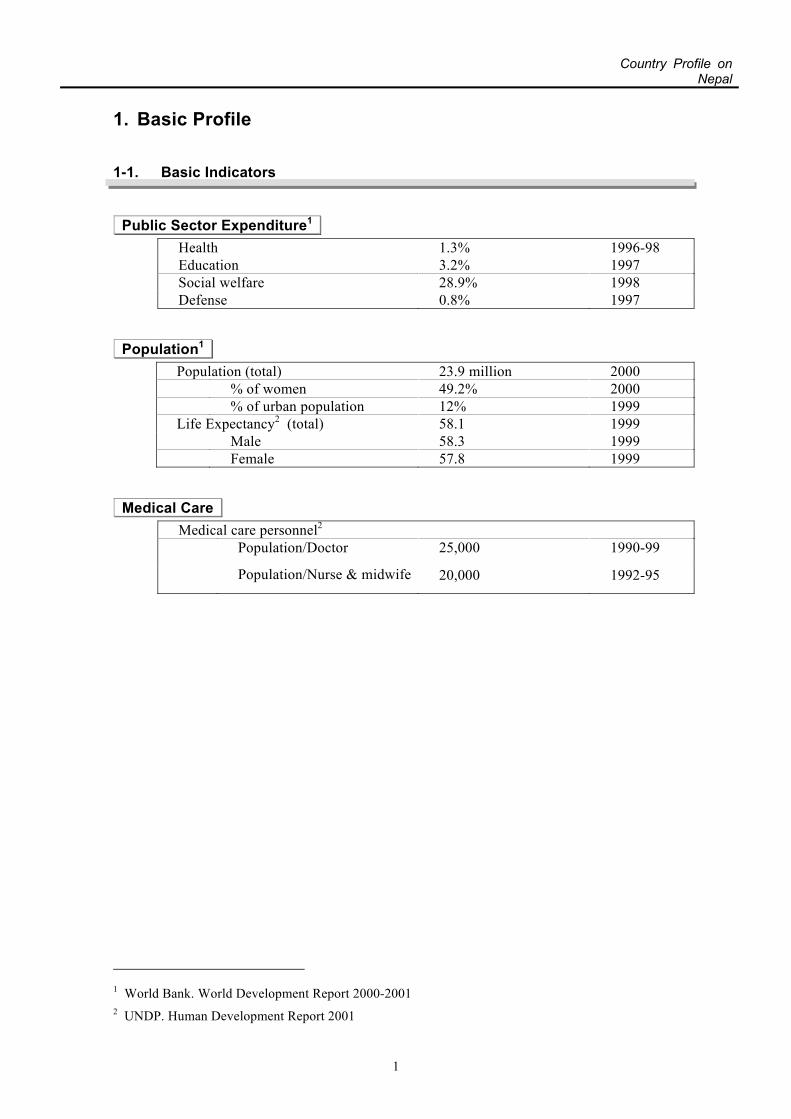
1. Basic Profile
1-1. Basic Indicators
Public Sector Expenditure1 Health 1.3% 1996-98 Education 3.2% 1997 Social welfare 28.9% 1998 Defense 0.8% 1997
Population1 Population (total) 23.9 million 2000 % of women 49.2% 2000 % of urban population 12% 1999 Life Expectancy2 (total) 58.1 1999 Male 58.3 1999 Female 57.8 1999
Medical Care Medical care personnel2 Population/Doctor 25,000 1990-99
Population/Nurse & midwife 20,000 1992-95
1 World Bank. World Development Report 2000-2001 2 UNDP. Human Development Report 2001
1
Country Profile onNepal
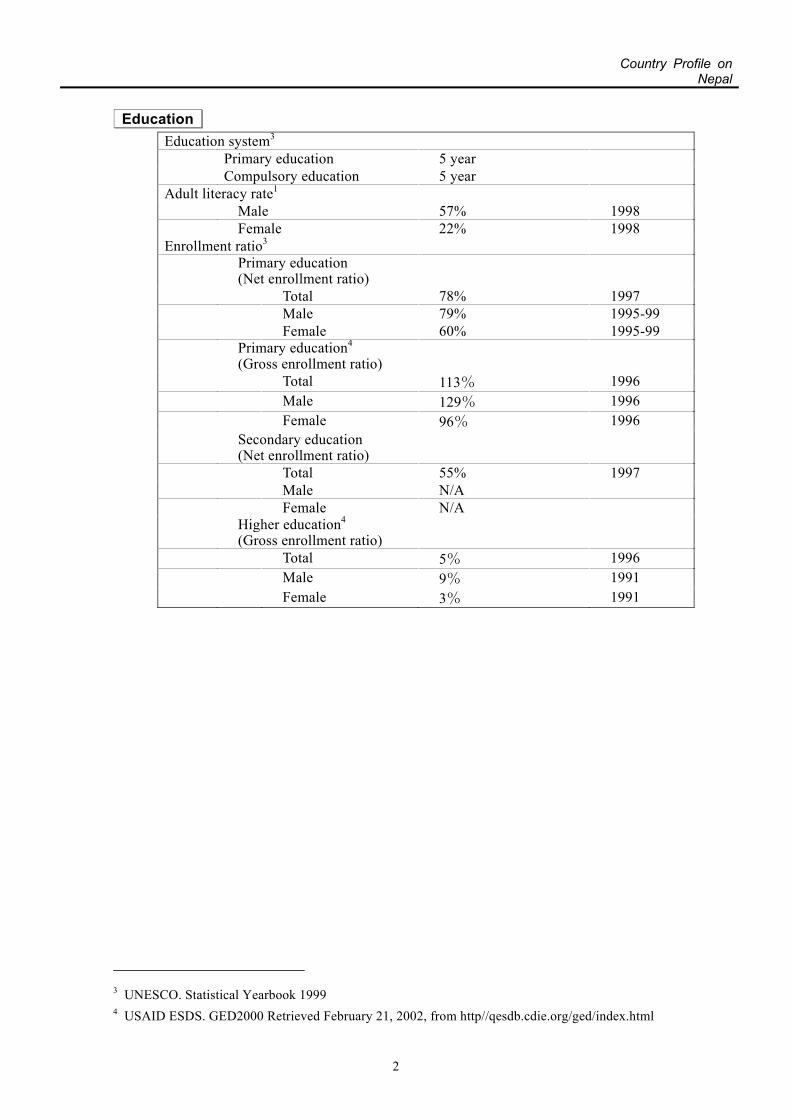
Education
Education system3 Primary education 5 year Compulsory education 5 year Adult literacy rate1 Male 57% 1998
Female 22% 1998 Enrollment ratio3
Primary education (Net enrollment ratio)
Total 78% 1997 Male 79% 1995-99 Female 60% 1995-99 Primary education4
(Gross enrollment ratio)
Total 113% 1996 Male 129% 1996 Female 96% 1996 Secondary education
(Net enrollment ratio)
Total 55% 1997 Male N/A Female N/A Higher education4
(Gross enrollment ratio)
Total 5% 1996 Male 9% 1991 Female 3% 1991
3 UNESCO. Statistical Yearbook 1999 4 USAID ESDS. GED2000 Retrieved February 21, 2002, from http//qesdb.cdie.org/ged/index.html
2

Country Profile onNepal
1-2. Indicators on Disability
Disability-specific Data
Table 1: Disability-specific Data in 1980 and 1999
Year Physical disability
Visual impairmen
t
Hearing impairmen
t
Intellectual disability
Psychiatric disability Overlapping
34.4% 25.7% 33.4% 6.5% - 1980
144.7 108.1 140.5 27.3 -
28.5% 7.3% 13.0% 2.7% 4.1% 44.3% 1999
105.8 27.1 48.3 10.0 15.2 164.5
Note: *Numbers are given in thousands and show the number of people with the disability. *Hearing disability includes both hearing and speaking disabilities. Source: Report on Sample Survey of Disabled Persons in Nepal 1980, Katmandu. A Situation Analysis on Disability in Nepal, 1999 (unpublished) Volume–I, National Planning
Commission Secretariat, UNICEF, New ERA Ltd., 1999.
3

Country Profile onNepal
Figure 1: Disability-specific Data
Overlapping44.3%
Physical28.5%
Hearing13.0%
Visual7.3%
Intellectual2.7%
Psychiatric
4.1%
Physical
Hearing
Visual
Psychiatric
Intellectual
Overlapping
Age-specific Data
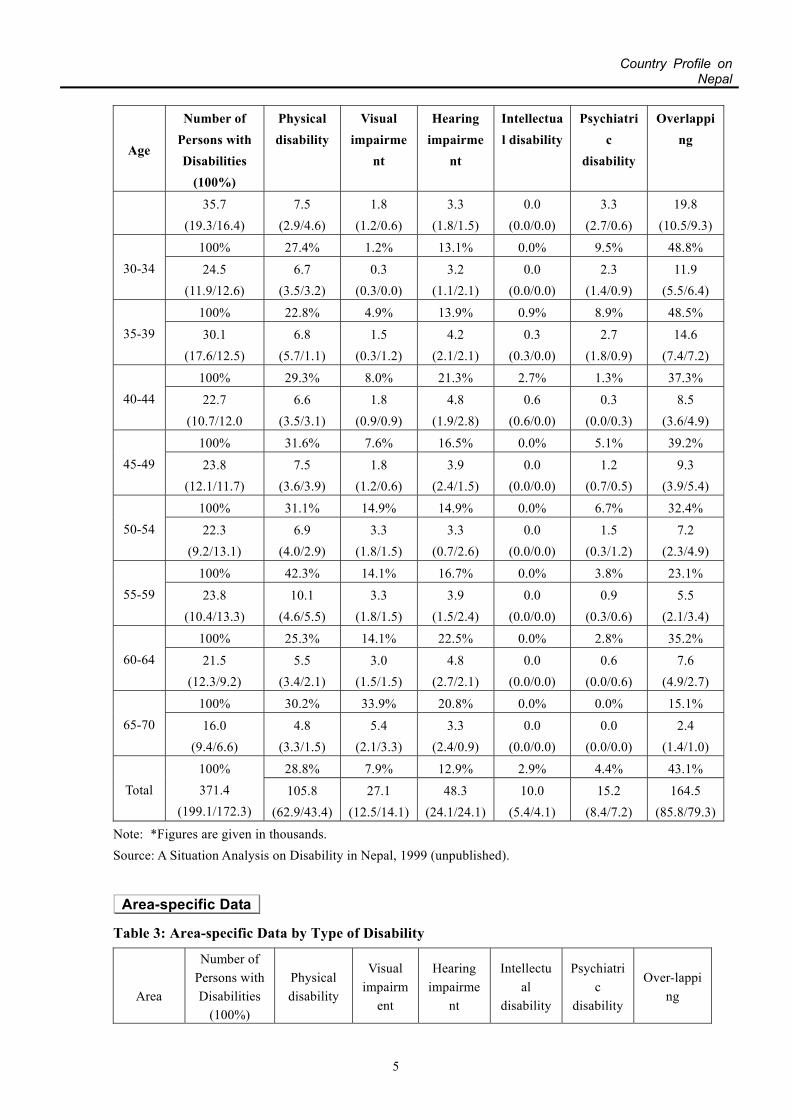
Table 2: Age-specific Data
Age
Number of Persons with Disabilities
(100%)
Physical disability
Visual impairme
nt
Hearing impairme
nt
Intellectual disability
Psychiatric
disability
Overlapping
Total (men/women)
100% 26.8% 0.0% 13.4% 1.0% 0.0% 58.8% 0-4 29.0
(19.7/9.3) 7.8
(5.7/2.1) 0.0
(0.0/0.0) 3.9
(2.7/1.2) 0.3
(0.0/0.3) 0.0
(0.0/0.0) 17.0
(11.3/5.7)
100% 24.5% 3.9% 9.8% 2.9% 0.0% 58.8% 5-9 30.8
(16.2/14.6) 7.5
(4.2/3.3) 1.2
(0.6/0.6) 3.0
(2.2/0.8) 0.9
(0.3/0.6) 0.0
(0.0/0.0) 18.1
(10.7/7.4)
100% 38.1% 0.8% 4.2% 9.3% 0.0% 47.5% 10-14 34.9
(20.1/14.8) 13.3
(7.7/5.6) 0.3
(0.0/0.8) 1.5
(0.7/0.7) 3.2
(1.7/1.5) 0.0
(0.0/0.0) 16.6
(8.3/8.3)
100% 26.4% 3.6% 8.2% 10.0% 1.8% 50.0% 15-19 33.1
(15.4/17.7) 8.7
(6.0/2.7) 1.2
(0.3/0.9) 2.7
(0.6/2.1) 3.3
(2.2/1.1) 0.6
(0.0/0.6) 16.5
(9.9/6.6)
100% 27.4% 6.8% 10.9% 5.5% 6.8% 42.5% 20-24 22.3
(12.1/10.2) 6.1
(4.3/1.8) 1.5
(0.3/1.2) 2.4
(0.9/1.5) 1.2
(0.6/0.6) 1.5
(0.9/0.6) 9.5
(3.4/6.1)
25-29 100% 21.0% 5.0% 9.2% 0.0% 9.2% 55.5%
4
Country Profile onNepal
Age
Number of Persons with Disabilities
(100%)
Physical disability
Visual impairme
nt
Hearing impairme
nt
Intellectual disability
Psychiatric
disability
Overlapping
35.7 (19.3/16.4)
7.5 (2.9/4.6)
1.8 (1.2/0.6)
3.3 (1.8/1.5)
0.0 (0.0/0.0)
3.3 (2.7/0.6)
19.8 (10.5/9.3)
100% 27.4% 1.2% 13.1% 0.0% 9.5% 48.8% 30-34 24.5
(11.9/12.6) 6.7
(3.5/3.2) 0.3
(0.3/0.0) 3.2
(1.1/2.1) 0.0
(0.0/0.0) 2.3
(1.4/0.9) 11.9
(5.5/6.4)
100% 22.8% 4.9% 13.9% 0.9% 8.9% 48.5% 35-39 30.1
(17.6/12.5) 6.8
(5.7/1.1) 1.5
(0.3/1.2) 4.2
(2.1/2.1) 0.3
(0.3/0.0) 2.7
(1.8/0.9) 14.6
(7.4/7.2)
100% 29.3% 8.0% 21.3% 2.7% 1.3% 37.3% 40-44 22.7
(10.7/12.0 6.6
(3.5/3.1) 1.8
(0.9/0.9) 4.8
(1.9/2.8) 0.6
(0.6/0.0) 0.3
(0.0/0.3) 8.5
(3.6/4.9)
100% 31.6% 7.6% 16.5% 0.0% 5.1% 39.2% 45-49 23.8
(12.1/11.7) 7.5
(3.6/3.9) 1.8
(1.2/0.6) 3.9
(2.4/1.5) 0.0
(0.0/0.0) 1.2
(0.7/0.5) 9.3
(3.9/5.4)
100% 31.1% 14.9% 14.9% 0.0% 6.7% 32.4% 50-54 22.3
(9.2/13.1) 6.9
(4.0/2.9) 3.3
(1.8/1.5) 3.3
(0.7/2.6) 0.0
(0.0/0.0) 1.5
(0.3/1.2) 7.2
(2.3/4.9)
100% 42.3% 14.1% 16.7% 0.0% 3.8% 23.1% 55-59 23.8
(10.4/13.3) 10.1
(4.6/5.5) 3.3
(1.8/1.5) 3.9
(1.5/2.4) 0.0
(0.0/0.0) 0.9
(0.3/0.6) 5.5
(2.1/3.4)
100% 25.3% 14.1% 22.5% 0.0% 2.8% 35.2% 60-64 21.5
(12.3/9.2) 5.5
(3.4/2.1) 3.0
(1.5/1.5) 4.8
(2.7/2.1) 0.0
(0.0/0.0) 0.6
(0.0/0.6) 7.6
(4.9/2.7)
100% 30.2% 33.9% 20.8% 0.0% 0.0% 15.1% 65-70 16.0
(9.4/6.6) 4.8
(3.3/1.5) 5.4
(2.1/3.3) 3.3
(2.4/0.9) 0.0
(0.0/0.0) 0.0
(0.0/0.0) 2.4
(1.4/1.0)
28.8% 7.9% 12.9% 2.9% 4.4% 43.1% Total
100% 371.4
(199.1/172.3) 105.8
(62.9/43.4)27.1
(12.5/14.1)48.3
(24.1/24.1)10.0
(5.4/4.1) 15.2
(8.4/7.2) 164.5
(85.8/79.3)
Note: *Figures are given in thousands. Source: A Situation Analysis on Disability in Nepal, 1999 (unpublished).
Area-specific Data
Table 3: Area-specific Data by Type of Disability
Area
Number of Persons with Disabilities
(100%)
Physical disability
Visual impairm
ent
Hearing impairme
nt
Intellectual
disability
Psychiatric
disability
Over-lapping
5

Country Profile onNepal
Area
Number of Persons with Disabilities
(100%)
Physical disability
Visual impairm
ent
Hearing impairme
nt
Intellectual
disability
Psychiatric
disability
Over-lapping
Total (men/women)
100% 28.4% 8.9% 12.8% 2.3% 2.9% 44.6% Terai 131.1
(74.5/56.6) 37.2
(23.0/14.2)11.7
(5.4/6.3)16.8
(6.9/9.9) 3.0
(2.1/0.9) 3.8
(2.3/1.5) 58.5
(39.0/19.5)
100% 31.5% 4.7% 9.9% 2.9% 5.4% 45.6% Hills 121.1
(67.9/53.2) 38.4
(24.1/14.3)5.7
(2.7/2.9)11.9
(5.8/6.1) 3.5
(2.0/1.5) 6.5
(2.9/3.5) 55.2
(29.9/25.3)
100% 26.4% 8.0% 16.1% 3.0% 4.0% 42.5% Mountain 119.2
(56.6/62.6) 31.3
(15.6/15.6)9.5
(4.6/4.9)19.2
(11.1/8.1)3.6
(2.1/1.5) 4.8
(2.4/2.4) 50.7
(20.7/30.0)
Note: *Figures are given in thousands. *The country is divided horizontally in three ecological belts based on geographical characteristics namely, plains or Terai, hills and mountainous regions.
Source: A Situation Analysis on Disability in Nepal, 1999 (unpublished).
Figure 2: Number of Persons with Disabilities by Region and Gender
74.5 67.956.6
56.653.2
62.6
0
20
40
60
80
100
120
140
Terai Hills Mountain
Female
Male
Grade-specific Data
Table 4: Grade-specific Data for Intellectually Disabled
Mild Moderate Severe Intellectually
disabled 26.0% 45.0% 29.0%
Note: the grade specific information is not available for other types of disabilities.
6

Country Profile onNepal
Source: Disabled Situation Analysis of Nepal 1998, Main Report, Agricultural Projects Services
(APROSC). Cause-specific Data
Table 5: Cause-specific Data for all Types of Disabilities Congenital Disease Accident Others Don’t know
44.6% 30.3% 15.4% 8.6% 1.0%
Figure 3: Cause-specific Data
Congenital44.8%
Disease30.5%
Accident15.1%
Others8.6%
Unknown1.0%
Congenital
Disease
Accident
Others
Unknown
Table 6: Cause-specific Data by Types of Disabilities Congenital Disease Accident Others Unknown
Physical 100%
27.3% 36.0% 25.5% 11.1% 0.0%
Visual 100%
10.4% 16.9% 10.4% 9.4% 7.3%
Hearing 100%
57.4% 26.4% 4.7% 10.9% 0.6%
Intellectual 100%
53.9% 35.3% 4.9% 3.9% 1.9%
Source: A Situation Analysis on Disability in Nepal, 1999
Gender-specific Data
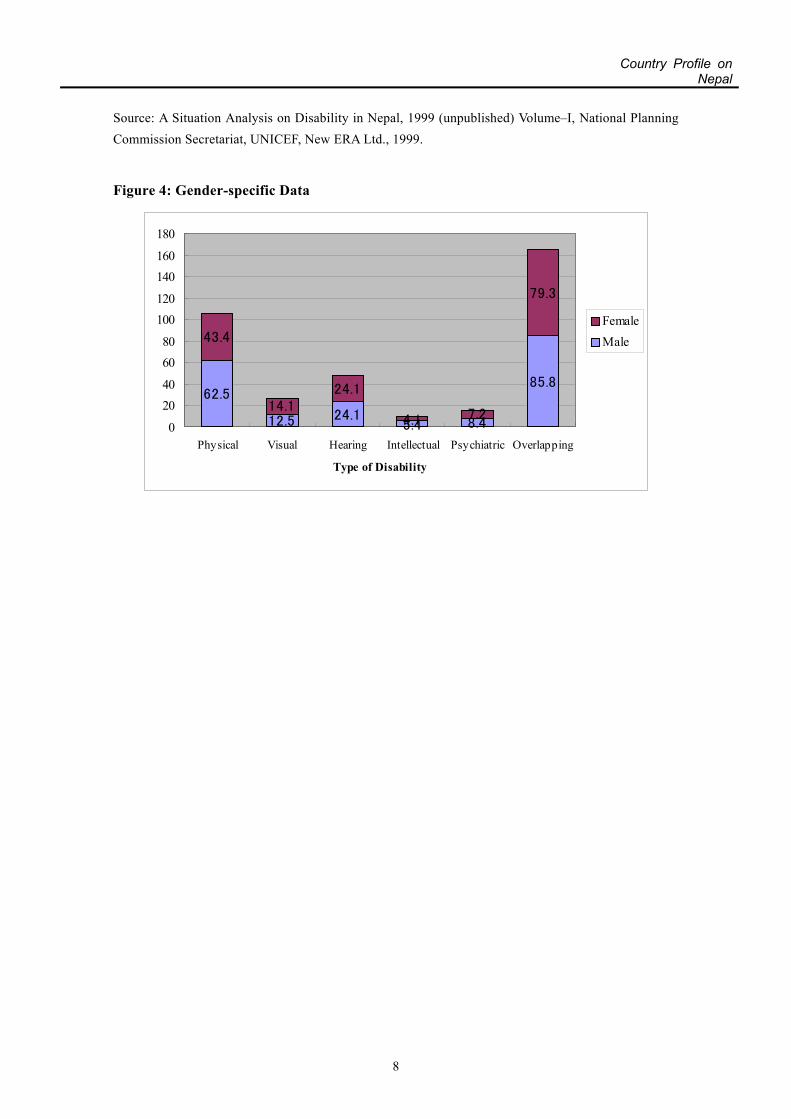
Table 7: Number of Persons with Disabilities by Gender and Types Disabilities
Total Physical Visual Hearing Intellectual Psychiatric OverlappingMale 199.1 62.5 12.5 24.1 5.4 85.8 85.8
Female 172.3 43.4 14.1 24.1 4.1 79.3 79.3 Notes: *Numbers are given in thousands
7
Country Profile onNepal
Source: A Situation Analysis on Disability in Nepal, 1999 (unpublished) Volume–I, National Planning Commission Secretariat, UNICEF, New ERA Ltd., 1999.
Figure 4: Gender-specific Data
62.5
12.5 24.15.4 8.4
85.8
43.4
14.124.1
4.1 7.2
79.3
0
2040
6080
100120
140160
180
Physical Visual Hearing Intellectual Psychiatric Overlapping
Type of Disability
FemaleMale
8
Country Profile onNepal
2. Issues on Disability
2-1. Definition of Disability in Nepal
Definition of Disability by the Government
The Nepalese constitution defines persons with disabilities as persons who are mentally or
physically unable or incompetent to lead a normal life. The term includes persons whose
mobility is impaired, who suffer from spinal curvature, have visually impaired in one or both
eyes, have hearing impairment, are unable to speak properly, or whose hands, legs, or fingers
are impaired or missing.
A person with any disability; including the amputation or paralysis of both legs; amputation of
both hands; blindness, or inability to work due to impaired vision; amputation or paralysis of
one leg; inability to walk, requiring the use of a wheelchair , hearing impairment, or
intellectual disability. However, persons who are in need of continuous support from others to
perform daily activities due to the aforementioned disability (or disabilities) are defined as
“acute handicapped”.
Different studies have defined disability classification in their own context. However, the
standard Person with Disabilities definition the Government has adopted and approved under
the committee formed under sub-section (2) of the Protection and Welfare of Disabled Persons
Act, 20395 is defined as follows:
1. Physical Disability: A person who is unable to perform the activities of daily life due to
physical deficiency, defect or deformity by birth, or by accident after birth, or due to
disease
2. Visually Impaired: A person who even after treatment (medical, surgical or use of
spectacles) cannot count or detect fingers with the better-sighted eye from a distance of
ten feet ‘or cannot read the characters of the Snellen chart (3/60)6 is defined as “blind”
5 Nepal follows its own calendar, Bikram Sambat. The New Year begins in mid-April. According to this system, Bikram Sambat 2039 is 1982-1983. 6 The Snellen chart is a chart for testing visual acuity, usually consisting of letters, numbers, or pictures printed in lines of decreasing size, which a patient is asked to read or identify at a fixed distance. (From The American Heritage Dictionary of the English Language: Fourth Edition. 2000)
9

Country Profile onNepal
and those defined “visually impaired” are those persons who, even after treatment
(medical, surgical or use of spectacles), cannot count or detect fingers with the
better-sighted eye from a distance of twenty feet, or cannot read the characters on the
Snellen chart (6/18).
3. Intellectual Disability: A person who cannot perform the activities expected of his/her
age and environment due to the lack of mental development prior to the age of 18 years.
4. Hearing Impaired: A person who cannot hear, speak clearly or cannot speak at all and
has to use sign language for communication with a hearing capacity of 80 decibels or less
is defined “deaf”, whereas those who cannot hear properly, speak clearly or can only
speak very little, or requires a hearing aid and have a hearing capacity between 65 to 80
decibels is defined as “hearing impaired”.
5. Mental Disease: A person who is unable to perform the activities of daily life due to
mental deficiency, defect or deformity by birth, by accident after birth, or by disease.
Definition by Other Studies
Previous studies have used different criteria for defining disability and have defined it in their
own context. Other definitions associated with various studies are given below.
1. 1971 Census, Central Bureau of Statistics, 1971
The 1971 census referred to the Person with Disabilities population in Nepal as the
"economically inactive" population due to “physical disability.” This definition included
four types of disability: blindness, deafness, deaf-mute, or other physical impairment. This
study indicated a national disability rate of 1.50%.
2. Report on Sample Survey of Disabled Persons in Nepal, 1980
This study defined persons with disabilities as those who by virtue of congenital disease,
acquired diseases, or injury, are incapable of living an independent personal or social life, or
engaging in gainful employment, or acquiring normal education consistent with his/her age or
sex. Each category was further classified into four sub-types as follows:
a. Visual Disability: blind, visually handicapped, one eye blind and one eye visually
handicapped.
b. Auditory Disability: deaf, hearing impaired, and deaf-mute
c. Physical Disabilities:
a) Upper Limb Disability: arm lost, arm crippled, finger lost
10
Country Profile onNepal
b) Lower Limb Disability: leg lost, leg crippled
c) Head, neck or spinal disability
d. Mental Disability: severe, moderate, and borderline
This national study indicated the prevalence of disability to be 3% in the total population.
3. Disabled People of Nepal, 1995 CERID/SED/BPEP/DANIDA7 Study
This study classified disabilities into 5 categories: hearing, visual, physical, mental and
intellectual. This classification was based on identification by household members. This study
indicated a prevalence of 4.55% in 8 districts.
4. Disabled Situation Analysis of Nepal 1998, APROSC8
This study classified the following types of disabilities:
a. Poor eyesight, blindness, night blindness and single-eye blindness
b. Hearing impairment, ear disease, poor hearing and deafness
c. Speech problems, unclear voice
d. Physical disability, paralysis, absence of organ, deformity
e. Epilepsy, development delay
f. Multiple disabilities
5. A Situation Analysis on Disability in Nepal, 1999, New ERA (unpublished)
This study considered any person who could not perform the daily activities of normal life
expected of a person of his/her specific age, or who required special care, support and
rehabilitation services. The following table gives a detailed classification of disabilities in this
analysis.
Table 8: Classifications of Disabilities
Communication
Disabilities
Visual Disability:
A person who, even after treatment, can
not count fingers (both) from a distance
of ten feet (3 meters), and who is
Hearing Impaired:
A person who can not
hear ordinary voices with
both ears from a distance
Speech impairment:
A person who can not
speak at all, or a person
who can not be understood
7 CERID: Research Center for Education Innovation and Development, BPEP: Basic and Primary Education Project, DANIDA: Danish International Development Agency 8 APROSC: Agricultural Projects Services Center
11
Country Profile onNepal
considered functionally visually impaired of one meter outside the family
Locomotion
Disabilities
Mobility Impairment:
A person who is unable to perform the
daily activities of life due to a physical
deficiency, defect or deformity in the
lower limbs
Manipulation (Working) Disability:
A person who is unable to perform the daily activities
of life due to a physical deficiency, defect or deformity
in the upper limbs
Mentally Related
Disabilities
Intellectual Disability:
A person who is unable to perform
activities or to learn new tasks typical of
their age and environment due to delayed
mental development prior to the age of
18 years. Under this classification, two
categories are included: a) persons who
can manage the daily activities of life
with the help of training and b) persons
who cannot manage daily activities (such
as eating, dressing, speaking and going to
the toilet, despite training.
Epilepsy:
A person who suffers
from frequent attacks of
unconsciousness and
shows symptoms of
tongue biting, frothing
from the mouth,
shivering, and
inconsistent speech
Chronic mental illness:
A person who, after 18
years of age, has some
mental instability
including symptoms such
as unprovoked anger or
elation, crying without
reason, or isolation from
others
Complex
Disabilities
overlapping:
A person who has more than one type of
disability
Cerebral Palsy:
A person who has some damage in the immature brain
leading to physical incapacity Some cases involve
intellectual disabilities.
2-2. Current Situation9
The recent study on the Situation Analysis on Disability 1999 (unpublished) indicated that the
service centers and the organizations for Persons with Disabilities are concentrated in the
accessible locations of the country. Thus, Persons with Disabilities in remote areas are
deprived of services.
1. Registration system
The Village Development Committee (VDC) is required to register all Persons with
Disabilities. This registration is done in order to distribute disability allowance.
However, there are complaints that some Persons with Disabilities are not registered
despite several requests. This is perhaps due to confusion on the definition of Persons
with Disabilities for the purpose of registration.
9 This chapter is based on the local consultant’s views in A Situation Analysis on Disability in Nepal, 1999 (unpublished)
12

Country Profile onNepal
A person with disabilities identification card provision program has been launched to
enable the provision of proper services for persons with disabilities. However, when
issuing identification cards, problems similar to those with the registration system have
arisen.
Although, a person with disabilities registration system to distribute disability
allowances exists, there are no fixed registration guidelines and disability allowances do
not reach all those who require it. Parallel to the newly launched persons with
disabilities identification card provision program, efforts should be made to accurately
register all persons with disabilities, and the registration system should be reformed so
that the necessary services are provided. Revision and publicity on persons with
disabilities definitions would be the basis of registration and training of registration
staff of Village Development Committees (VDC). At the same time, public relations to
promote Person with Disabilities registration and the provision of means by which
persons with disabilities can register are important for realizing this objective.
2. General Concept Towards Person with Disabilities
There is still a strong belief in Nepal that disability is due to sins of the past, fate and
God. More than 50 % of the parents of persons with disabilities surveyed answered that
the disability of their child was due to fate and God's will. These beliefs prevent them
from accessing appropriate health care treatment for their disabled children.
3. Poverty
As pregnant women in low-income groups are deprived of nutritious food and proper
health services, their children are at higher risk of being born with disabilities.
4. Lack of Opportunities in Rural Area
Although attempts have been made to provide job opportunities for persons with
disabilities in offices and factories, there are many rural persons with disabilities who
are deprived of information and services. Only a few persons with disabilities have
received vocational training and have been able to utilize their skills to generate income.
Rehabilitation services are also centrally focused, and persons with disabilities in rural
areas experience difficulties in accessing rehabilitation services.
13

Country Profile onNepal
5. Treatment
A recent study, A Situation Analysis on Disability, found that 28.5% of Persons with
Disabilities have never received any treatment. Among those who had sought treatment
approximately 30 % replied that they had been to faith healers. The general practice in
rural areas is to first visit faith healers and to visit health personnel if things do not
improve.
6. Education
According to the study A Situation Analysis on Disability in Nepal, 68.2 % of persons
with disabilities in Nepal have no education. Among the disabled male population,
59.6 % have no education, while 77.7 % of disabled females have no education. However,
the special education unit (MOE) has been promoting special education among
school-aged children.
Among the Persons with Disabilities from 6-20 years old, 43.7 % have never enrolled in
school and the drop out rate is around 30%. Nearly half of all children with disabilities
have not been able to benefit from education services. The high drop-out rate is said to
result from inability of children with disabilities to perform as well as other children.
7. Problems faced by Persons with Disabilities in the Community
The study: Situation Analysis on Disability in Nepal, 1999 indicated that 70% of Persons
with Disabilities could not lead a dignified life as they were mocked and isolated. It
found that even their participation in community gatherings was a big problem. Persons
with disabilities also felt discriminated against in the workplace.
8. Accessibility
9. Priority on the Ninth Five Year Plan (1997 – 2002)
Policies given in the Ninth Five Year Plan are priority issues for person with disabilities
welfare in Nepal. These are the provision of free medical, educational and vocational
training services; partnership between person with disabilities-related ministries and
organizations, improving person with disabilities facilities, data management, Person
14
Country Profile onNepal
with disabilities employment measures, promoting production of assistive devices and
the development of communication tools and media programs.
10. Improving rural area accessibility
Nepalese persons with disabilities in rural areas have limited access to services and
organizational activities. In particular, the lack of access to employment, treatment,
low-interest loans, facilities and organizations, as well as lack of opportunities to
participate in the community has been identified. In order to improve access to these
services and facilities, measures must be taken to remove physical barriers, increase
services and facilities in rural areas and strengthen publicity efforts towards persons with
disabilities.
2-3. Documentation and Survey on Disability
National Census
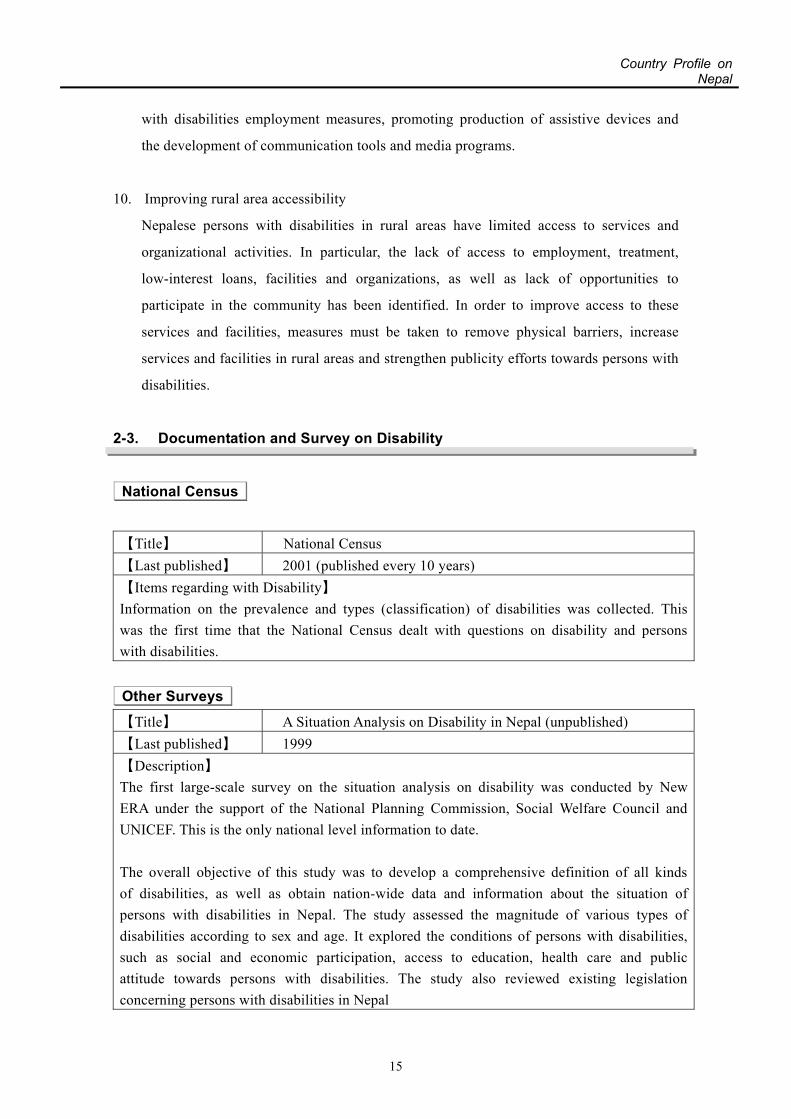
【Title】 National Census 【Last published】 2001 (published every 10 years) 【Items regarding with Disability】
Information on the prevalence and types (classification) of disabilities was collected. This was the first time that the National Census dealt with questions on disability and persons with disabilities.
Other Surveys
【Title】 A Situation Analysis on Disability in Nepal (unpublished) 【Last published】 1999 【Description】 The first large-scale survey on the situation analysis on disability was conducted by NewERA under the support of the National Planning Commission, Social Welfare Council and UNICEF. This is the only national level information to date. The overall objective of this study was to develop a comprehensive definition of all kinds of disabilities, as well as obtain nation-wide data and information about the situation of persons with disabilities in Nepal. The study assessed the magnitude of various types of disabilities according to sex and age. It explored the conditions of persons with disabilities, such as social and economic participation, access to education, health care and publicattitude towards persons with disabilities. The study also reviewed existing legislation concerning persons with disabilities in Nepal
15