Embed Size (px)
Citation preview

i
ROYAL GOVERNMENT OF BHUTAN MINISTRY OF AGRICULTURE AND FORESTS
Country Proposal for Improving Renewable Natural Resources Statistics in Bhutan
(An implementation of Global Strategy to Improve
Agricultural and Rural Statistics)
November 2014

ii
ROYAL GOVERNMENT OF BHUTAN
MINISTRY OF AGRICULTURE AND FORESTS
Country Proposal for Improving
Renewable Natural Resources Statistics in Bhutan
(An implementation of Global Strategy to Improve Agricultural and Rural
Statistics)
November 2014

i
Foreword By
Honorable Secretary, Ministry of Agriculture and Forests
The Ministry of Agriculture and Forests (MoAF) is pleased to bring out this Country Proposal
for Improving Renewable Natural Resources (RNR) Statistics in Bhutan, which is the first
of its kind that is prepared with collaborative efforts of the United Nations Food and Agricultural
Organization (FAO) and MoAF in the context of the Global Strategy to Improve Agricultural
and Rural Statistics.
The proposal is intended to be used as an authentic reference document by the RNR sector, other
relevant government agencies and international community interested in the development of
RNR statistics for making informed decision on poverty alleviation, livelihood and food security
in the country. Unlike in the past, the RNR sector is now comfortably placed in implementing the
prioritized statistical activities proposed in this proposal as they respond to specific problems or
opportunities identified in the In-depth Country Assessment (IdCA) of the National System
for RNR Statistics, which was undertaken by MoAF.
The MoAF would like to thank the FAO not only for its financial support but also for
successfully guiding our national stakeholders of RNR statistics in both the IdCA and this
proposal. We acknowledge the unwavering hard works and contributions put in by concerned
RNR colleagues and members outside of the RNR sector in bringing out this proposal. Our deep
and heartfelt appreciations also go to the member from National Statistics Bureau for facilitating
the various stakeholders’ meetings.

ii
Table of Contents
Foreword ........................................................................................................................................................ i
Abbreviations ............................................................................................................................................... iii
Glossary ........................................................................................................................................................ iii
1. Background ........................................................................................................................................... 1
2. In-depth Country Assessment ............................................................................................................... 1
3. Role of Stakeholders ............................................................................................................................. 2
4. The Country Proposal ........................................................................................................................... 4
4.1 Introduction ................................................................................................................................... 4
4.2 Background to the Concept Notes ................................................................................................ 4
4.3 Implementation arrangements ....................................................................................................... 5
4.4 Coordination, monitoring and evaluation ..................................................................................... 7
4.5 Estimated budget for the proposed projects .................................................................................. 8
4.6 Sustainability ................................................................................................................................. 9
Annex I: Concept Notes on the proposed projects ................................................................................. 10
Annex II: Budget ...................................................................................................................................... 40
Annex III: Work Plan (2015 –2017) ......................................................................................................... 42
Annex IV: List of participating individuals in the finalization of the Country Proposal .......................... 45

iii
Abbreviations
ADB Asian Development Bank BSS Bhutan Statistical System BLSS Bhutan Living Standard Survey DAMC Department of Agricultural Marketing and Cooperatives DoA Department of Agriculture DoFPS Department of Forests and Park Services DoL Department of Livestock DRC Department of Revenue and Customs FAO Food and Agriculture Organization of the United Nations FCB Food Corporation of Bhutan GHG Green House Gas GOE General Operating Expenses IdCA In-Depth Country Assessment MoAF Ministry of Agriculture and Forests MoF Ministry of Finance MoLHR Ministry of Labor and Human Resources NEC National Environment Commission NRDCL Natural Resources Development Corporation Limited NSB National Statistics Bureau NSDS National Statistics Development Strategy NSS National Statistical System ODE Organizational Development Exercise PPD Policy and Planning Division PSC Project Support Costs RGoB Royal Government of Bhutan RNR Renewable Natural Resources RNR-SF RNR-Statistical Framework RNR-SCS RNR-Statistical Coordination Section RNR-SSC RNR-Statistical Steering Committee RSD RNR Statistics Division RCSC Royal Civil Service Commission SPARS Strategic Plan for Agricultural and Rural Statistics SP-RNRS Strategic Plan for Renewable Natural Resources Statistics TSS Technical Support Services
Glossary
Tseri A land category used for shifting cultivation Dzongkhag District Frame List of units (e.g. list of households) from which a sample is drawn Gewog Block in a district

1
1. Background
Global Strategy to Improve Agricultural and Rural Statistics is the outcome of an effort
made by the UN Statistical Commission, the Food and Agriculture Organization of the United
Nations (FAO), the World Bank, and an extensive consultation process that involved national
statistics offices, agricultural ministries, and other government institutions that produce and use
agricultural and rural statistics. The purpose of the strategy is to provide a framework and
methodology that will improve the quality and availability of national and international food and
agricultural statistics to guide policy analysis and informed decision making. The strategy is
based on three pillars:
i. Establishment of a minimum set of core data that countries will provide to meet the
current and emerging demands;
ii. Integration of agriculture into the National Statistical Systems (NSS)1 in order to meet the
data needs of policy makers and other data users and to ensure data comparability across
countries and over time;
iii. Helping countries to enhance the sustainability of the National Agricultural Statistics
System through governance and statistical capacity building.
2. In-depth Country Assessment
As part of the implementation of Global Strategy to Improve Agricultural and Rural Statistics,
In-depth Country Assessment (IdCA) of the National System for Renewable Natural Resources
(RNR) Statistics was undertaken by Royal Government of Bhutan with support from United
Nations Food and Agriculture Organization (FAO). The main objective of the assessment was to
prepare groundwork for developing a Strategic Plan for Agricultural and Rural Statistics
(SPARS), which in case of Bhutan will be known as Strategic Plan for Renewable Natural
Resources Statistics (SP-RNRS).
The IdCA report identifies specific problems or opportunities for the development of the national
agricultural statistics program. The report is intended to be used as an official reference
document by the national and international community interested in the development of RNR
statistics in Bhutan. The IdCA gives increased focus on the data on the RNR sector, environment,
rural economy and the farm household. It was based on an assessment of the RNR data that users
need. Understandably most of users’ requirements relate to policy formulation, planning,
1 Bhutan Statistical System in the case of Bhutan

2
monitoring and evaluation of “economic development, poverty alleviation and food security”.
The IdCA identifies areas needing improvement in 5 years in order to develop the national
agricultural statistics program. It sets benchmark to move forward.
As ensuing steps to IdCA, following documents need to be prepared:
(i) Country Proposal for the development of the national agricultural statistics programme
(ii) Strategic Plan for Renewable Natural Resources Statistics (SP-RNRS)
This proposal takes the first step. A significant input to the development of SP-RNRS is already
available within the existing “RNR Statistical Framework” of MoAF.
3. Role of Stakeholders
Economic objectives of Ministry of Agriculture and Forests (MoAF) for the 11th Five Year Plan
(2013-2018) are to enhance food and nutrition security and accelerate RNR sector growth. Its
social objective is to enhance sustainable rural livelihood. Environmental objective is to promote
sustainable management and utilization of natural resources. Hence, besides generic
conventional data, emerging data requirements will be more in the years to come and role of
stakeholders in delivering relevant RNR data cannot be overemphasized.
The National Statistics Bureau (NSB) as the apex body and custodian of the country’s statistics
continues to strengthen its coordination and cooperation with all producer and user government
agencies for production of quality statistics for informed decision making. While awaiting
government approval of Statistics Bill, the NSB has been carrying out considerable revision of
National Statistics Development Strategy (NSDS) 2008 which is going to be finalized by end of
2014. Very recently the NSB with the support of World Bank conducted a two-day workshop on
NSDS, which was attended by all national stakeholders of Bhutan Statistical System (BSS)
including Policy and Planning Division (PPD) of MoAF.
The PPD of MoAF is responsible for providing policy and planning services to various RNR
programs and projects. In collaboration with line departments and agencies, it reviews and/or
develops policy and legislative documents. It provides secretarial support to the Minister and
Secretary. In addition, PPD is the most important user and producer of RNR statistics in Bhutan.
PPD provides support to NSB for the development of National Statistics Development Strategy
(NSDS) for the RNR sector. It plays a coordinating role in RNR statistical activities of other
agencies. PPD also plays a leading role in MoAF’s “RNR-Statistical Framework (RSF)”, “RNR-
statistical coordination” and “RNR-Statistical Steering Committee (RNR-SSC)”. In the RNR-
SSC, currently there is no provision of participation of the stakeholders outside MoAF. The RSF
3
is being revised to include all major stakeholders in the RNR-SSC. The revision will also contain
the ToR for the RNR-SSC. After further consultations, level of representation in SSC and/or in
Technical Working Committee (technical or decision oriented) will also be elaborated. However,
for taking actions that require additional funding, both SSC and/or Technical Working
Committee (TWC) will report to RNR-SCS. Briefly, PPD will have a pivotal role to play in
formulation of RSF and RNR part of NSDS, in expansion/establishment of the RNR-SSC, and in
implementation of this Country Proposal, which includes preparation of SP-RNRS as one of the
main activities.

4
4. The Country Proposal
4.1 Introduction
The preparation of this proposal was led by the PPD. It generally follows “Guidelines for
contents of the Country Proposal” provided by FAORAP. The proposal heavily draws from the
IdCA, which assesses the availability and quality of core RNR data identified in the context of
the Global Strategy.
The approach used in the proposal can best be described as moving from “reviews and
assessments” to “intervention and doing”, resources permitting. The proposal responds to
specific problems or opportunities identified in the IdCA by proposing 8 projects, in following
order of priorities:
Project 1: Bring improvement in crop statistics
Project 2: Bring improvement in livestock Statistics
Project 3: Increase institutional and HR capacity
Project 4: Gather and publish updated environmental data
Project 5: Land cover mapping
Project 6: Conduct of a RNR census
Project 7: Support to Bhutan Living Standard Survey
Project 8: Support to Labor Force Survey
Assessment of the relevance, feasibility and sustainability of the above 8 projects was done by
the stakeholders. It should be noted that Project 1-4 are short-term projects, whilst 5-8 are
medium and long-term projects that would exert lasting impact upon the RNR statistical system.
4.2 Background to the Concept Notes
The Government intends to use these “Concept Notes” as a vehicle for resource mobilization.
Concept Notes on the 8 identified projects are given in Annex I. These notes closely follow 2
documentations of FAO: “Guide to the Project Cycle – Quality and Results” and “Concept Note
Format”.
The duration proposed in the notes is 2 years but the proposal is expected to exert lasting impact
on the agricultural statistics system for 3-10 years. Each Concept Note (Annex I) elaborates on
the following:
• Problem and priority identified in the In-depth Country Assessment
• Summary of the Proposed Strategy
• Results Chains

5
o Expected Impact
o Expected outcome
o Expected outputs
• Participants and other stakeholders
• Potential risks
• Sustainability of the proposal
• Synergies with other projects and programs
• Work plan
• Implementation arrangements, budget and monitoring
For “identification of the problem” the notes are profoundly influenced by the “Wye Group
Handbook on Rural Households’ Livelihood and Well-Being Statistics”. Outputs and outcomes
mentioned in the notes mirror users’ true perspective. However, the methodological aspects
described in the notes are predominantly producer-oriented. Overall, sharper focus in each note
is on “how the problem can be solved”. For this “Strategy” and “How to” are used
synonymously.
As part of the first phase of the project cycle, the intent at present is to accomplish task of
“Identification of a problem” and “Preparation of Concept Notes”. “Appraisal and formalization”
with the resource partners” and “Endorsement” by a donor are extremely important aspects in the
identification phase. It is equally important to note that ensuing phases of the project cycle
(Formulation and Appraisal) are absolutely essential in the case of Project 5-8 mainly because
funding requirements for these projects are substantial.
The Government is aware that Global Strategy has rather limited resources to support the entire
proposal. It requests support from FAO in mobilization of resources from potential donors. At
the country level PPD will liaise with the donor agencies for mobilizing potential funds.
4.3 Implementation arrangements
To address coordination problems and to improve quality of statistics, one of the important
solutions – specifically under Pillar 3 of the Global Strategy - would be to centralize the
responsibility of all RNR data collection activity. This solution was adopted by all stakeholders
and was reflected as one of the recommendations in the IdCA. Later, further appraisal at MoAF
found that it will not be possible to do so because centralization would mean creation of a
separate division, which cannot happen at least during the 11th Plan (2013-2018) period.
Therefore, the idea of "centralization" has been dropped and sharp focus is now on strengthening
the existing system. That is why this country proposal has separate work plan for individual
sectors and sub-sectors.

6
In this connection, the Royal Government of Bhutan (RGoB) is currently carrying out
Organizational Development Exercise (ODE) in which the issue of centralization and creation of
a separate RNR Statistics Division (RSD) will be subjected to critical review from the Royal
Civil Service Commission (RCSC), which is the lead government agency for the ODE. In any
case, proposed activities in this Country Proposal will be implementable as they focus on
specific areas within the RNR statistical system. In either case, the RNR-SSC will have to be
expanded and maintained somehow. For this, MoAF and NSB will expand the RNR-SSC to
include all stakeholders2 involved in RNR statistics, and the expanded committee would be
engaged in discussion of project strategies, emerging data requirements and other technical
matters related to the RNR statistics programs and projects.
The list of implementing agency of individual projects is shown in Table 1 (in the case of
existing system) and Table 2 (in the case of centralized system).
Table 1: Implementation Arrangement for the Country Project Proposals (in the existing system)
Project Project Title Implementing Agency
Other main stakeholders
1 Bring improvement in crop statistics
DoA PPD and NSB
2 Bring improvement in livestock Statistics
DoL PPD and NSB
3 Increase institutional and HR capacity
PPD NSB, MoF, DAMC, DRC, DoA, DoL, FCB, DoFPS, NRCDL, NEC
4 Gather updated environmental data
NEC MoAF
5 Land cover mapping PPD DoA, DoFPS and NEC
6 Conduct of a RNR census PPD, NSB DoA, DoL, DoFPS,
7 Bhutan Living Standard Survey NSB MoAF
8 Labor Force Survey MoLHR NSB
2 PPD, DoA, DoL, DoFPS, DAMC, Council for RNR Research in Bhutan (CoRRB), BAFRA, Bhutan Bio-Security Information Section (BIMS) and Human Resources Information Section (HRIS)

7
Table 2: Implementation Arrangement for the Country Project Proposals (in centralized system)
Project Project Title Implementing Agency
Other main stakeholders
1 Bring improvement in crop statistics
RSD NSB
2 Bring improvement in livestock Statistics
RSD PPD and NSB
3 Increase institutional and HR capacity
RSD NSB, MoF, MoAF, FCB, NRCDL, NEC
4 Gather updated environmental data
NEC MoAF
5 Land cover mapping RSD MoAF and NEC
6 Conduct of a RNR census RSD, NSB MoAF
7 Bhutan Living Standard Survey NSB MoAF
8 Labor Force Survey MoLHR NSB
Sharp focus of the proposed projects is on the betterment. For example, these projects do not
include costs of (i) vehicles (for increased movement/supervision) and (ii) long-term training (for
sustainable human resource development and management). The cost of hiring vehicles is
included in the relevant project costs.
The SP-RNRS would include all activities including longer-duration professional training. The
SP-RNRS will be mapped out after finalization of the Country Proposal.
4.4 Coordination, monitoring and evaluation
Responsibility of overall coordination of the projects to be implemented in MoAF will rest upon
PPD (in case of existing system) or RSD (in centralized system) of MoAF. Quarterly meetings of
the RNR-SSC will be held to monitor the progress of all RNR statistical programs and projects,
including the projects proposed in the Country Proposal. Similar arrangements will be put into
place in the case of the projects implemented by other implementing agencies as well.
Individual project in this proposal may be evaluated by the Government, implementing partner
and donor at the end of the project. The terms of reference and exact timing for the evaluation
mission will be decided in consultation with all partners concerned. PPD will be held responsible
for organizing the evaluation mission in the case of MoAF projects. For projects outside MoAF,
individual agencies will be responsible. The draft evaluation report, which will be prepared by
the evaluation mission, will report on the achievements of the project. It will also look at any
follow up required.

8
4.5 Estimated budget for the proposed projects
Summarized cost estimates for the projects included in the proposal are shown in Table 3. In this
table, Government’s contribution in kind, which is going to be substantial, is not included. Costs
of international staff travel, Technical Support Services (TSS), General Operating Expenses
(GOE), and “Project Services Cost (PSC) apply to donors’ contribution. The cost of consultants’
service (34 person/months in total) is estimated at $20,000 per month. The PSC is 13% of the
donors’ contribution; it is not 13% of the total estimated budget.
Table 3: Summarized Cost estimates for the proposed projects (US$)
Table 4 provides estimated costs in the case of “Other expenses”. In this table “Travel” covers
the costs of international experts’ travel only. “Expendables” include the cost of 2 sets of data
processing software ($10,000), and the cost of very high resolution (5 m) land cover maps
($400,000), which will be considerably lesser if FAO is involved. Non-expendable cost covers
the cost of 2 overhead projectors for training purposes. TSS covers the cost of Technical Support
Services from FAO.
Table 4: Split of the “Other Expenses” (US$)
Sub-total
Project/Action Plan Technical Temporary Training GOE Other PSC Sub-total Government Government Government Total
Assistance Assistance Expenses Donor Contribution Contribution Contribution Project
(Consultant) (Equipment) (Operational) Cost
P1. Bring improvement in crop statistics 60,000 30,000 8,000 16,000 15,000 129,000 50,000 50,000 179,000
P2. Bring improvement in livestock Statistics 60,000 25,000 5,000 3,500 12,000 105,500 50,000 50,000 155,500
P3. Increase institutional and HR capacity 60,000 110,000 14,000 5,500 24,000 213,500 300,000 300,000 513,500
P4. Gather updated environmental data 40,000 40,000 50,000 8,000 21,000 21,000 180,000 20,000 20,000 200,000
P5. Land cover mapping 200,000 100,000 30,000 89,000 429,000 110,000 958,000 50,000 50,000 100,000 1,058,000
P6. Conduct of a RNR census 260,000 700,000 60,000 47,000 39,500 144,000 1,250,500 83,300 250,000 333,300 1,583,800
P7. Bhutan Living Standard Survey 10,000 145,000 155,000 155,000
P8. Labor Force Survey 50,000 90,000 140,000 140,000
Overall 680,000 840,000 305,000 171,000 514,500 326,000 2,836,500 613,300 535,000 1,148,300 3,984,800
Project/Action Plan Travel Expendable Non-expendable TSS Other
Expenses
P1. Bring improvement in crop statistics 5,000 10,000 1,000 16,000
P2. Bring improvement in livestock Statistics 2,500 1,000 3,500
P3. Increase institutional and HR capacity 2,500 2,000 1,000 5,500
P4. Gather updated environmental data 20,000 1,000 21,000
P5. Land cover mapping 25,000 400,000 4,000 429,000
P6. Conduct of a RNR census 32,500 7,000 39,500
P7. Bhutan Living Standard Survey
P8. Labor Force Survey
Overall 87,500 2,000 15,000 514,500

9
There are wide areas of expertise to be covered in the case of Project 3 “Increase institutional
and HR capacity”. The split of the costs by individual areas are given in Table 5.
Table 5: Split of the cost for the project “Increase institutional and HR capacity” (US$)
4.6 Sustainability
A common cause of concern for the government is on sustainability, an issue which is adequately
addressed in the Concept Notes by:
• Ensuring Government ownership. A National Project Director will be assigned in each
project. At least one counterpart will work closely with every international consultant.
The purpose is to stimulate effective and faster knowledge transfer. No National
Consultant will be hired so as to avoid further delay in knowledge transfer.
• Promoting and proposing interventions which can build on local activities, capacities and
resources. The focus will be to strengthen initiatives that have been undertaken to date.
• Mobilizing coordinated funding.
• Appreciating NSDS and RNR Statistical Framework.
• Advocating and requesting partial assistance from donors for extremely urgent activities that require substantial amount. For example, limited assistance from donors is needed specifically for: a) purchase of software and hardware,
b) purchase of Land Cover Maps (once in 5-7 years),
c) conduct of RNR Census (once in 10 years) and
d) collection, processing and dissemination of updated environmental data (Bhutan Environment Outlook and Dzonkhag Environment Outlook).
Sub-total
Activity/Component Technical Temporary Training GOE Other PSC Sub-total Government Government Government Total
Assistance Assistance Expenses Donor Contribution Contribution Contribution Project
(Consultant) (Equipment) (Operational) Cost
1. Formulation of SPARS and overall aspects 40,000 2,000 5,000 47,000 47,000
2. Support to ICT development 20,000 30,000 2,500 3,500 8,000 66,500 50,000 50,000 116,500
3. Consumer price data 10,000 1,000 12,000 40,000 40,000 52,000
4. Customs data 25,000 5,000 33,000 70,000 70,000 103,000
5. Auction data 10,000 1,000 12,000 70,000 70,000 82,000
6. RNR data use 15,000 2,000 19,000 20,000 20,000 39,000
7. Forestry data sets 10,000 1,000 12,000 30,000 30,000 42,000
8. Forest resources use 10,000 1,000 12,000 20,000 20,000 32,000
Sub-total 60,000 110,000 2,500 5,500 24,000 213,500 300,000 300,000 513,500

10
To summarize, the objective would be to make arrangements for the government to fund all
operational activity, slowly but surely, whilst donors will be required to provide funds mainly for
very well-targeted focussed training and technical assistance.
4.7 Annexures
Annex I: Concept Notes on the proposed projects
Project 1: Bring Improvement in Crop Statistics
Problem and priority identified in the In-depth Country Assessment
The DoA’s annual crop statistics are based on household data collected from individual Gewogs.
The proportion of households drawn in a Gewog ranges from 10 to 50 percent, depending on the
number of households in the Gewog. At the national level, the DoA survey covers 12 percent of
the total rural households in the country. The IdCA made following observations on the DoA
annual survey:
• The “frame” used for the survey is not sound.
• DoA’s emphasis has been on generating Gewog statistics for all data items covered by the DoA survey. This is in line with the users’ (DoA and PPD) demand and for calculating Self Sufficiency Rate at the sub-national levels. However, the DoA survey precludes MoAF from producing reasonably precise crop statistics at Gewog level. This is because sampling error of crop estimates rises rapidly as the targeted geographical area gets smaller.
• A sample of about 10 to 50 percent of households in a Gewog is an acceptable, practical rule as there is no other option available at present.
• Reasonably precise estimates will not be possible to generate from the DoA survey for sporadic variables (minor crops).
• Complete non-response rate (over 15%) in DoA sample survey is increasingly becoming a serious problem because the frame used for the survey is old. Complete non-response rate was 8% in the case of RNR Census of 2009. Remoteness partly contributes to high non-response rate in annual surveys. Item non-response rate is unknown.
• Capacity of DoA staff in survey data processing needs to be enormously strengthened.
11
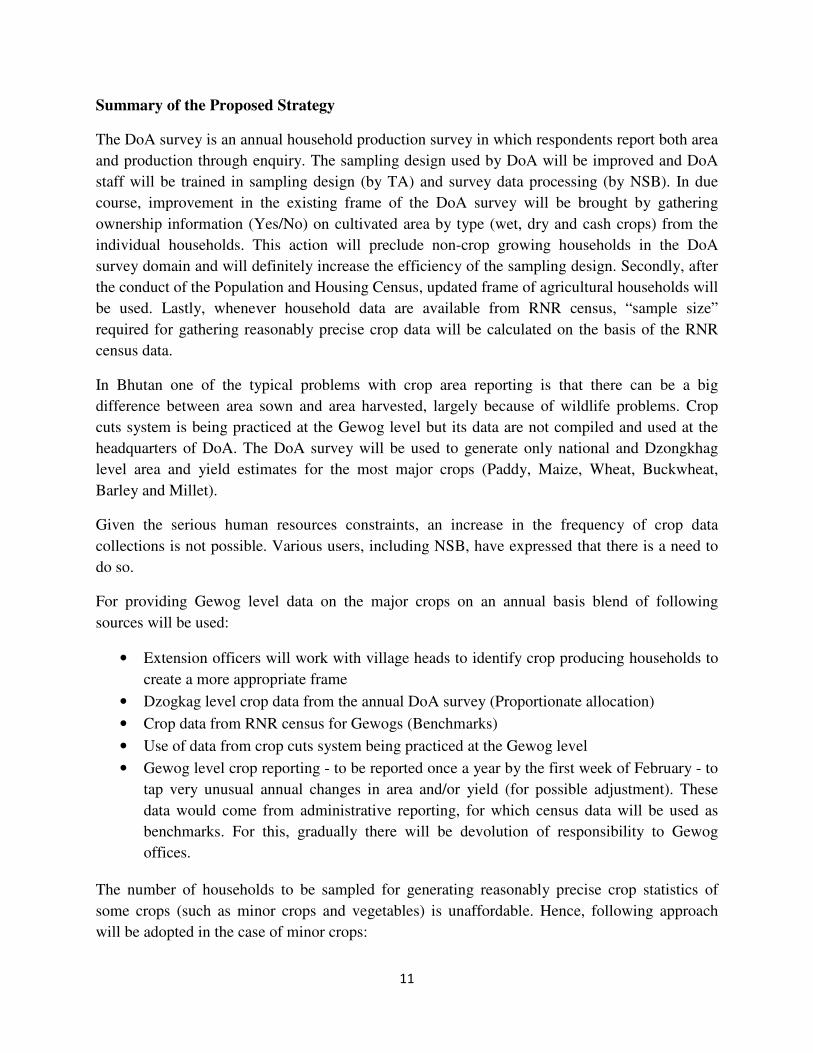
Summary of the Proposed Strategy
The DoA survey is an annual household production survey in which respondents report both area
and production through enquiry. The sampling design used by DoA will be improved and DoA
staff will be trained in sampling design (by TA) and survey data processing (by NSB). In due
course, improvement in the existing frame of the DoA survey will be brought by gathering
ownership information (Yes/No) on cultivated area by type (wet, dry and cash crops) from the
individual households. This action will preclude non-crop growing households in the DoA
survey domain and will definitely increase the efficiency of the sampling design. Secondly, after
the conduct of the Population and Housing Census, updated frame of agricultural households will
be used. Lastly, whenever household data are available from RNR census, “sample size”
required for gathering reasonably precise crop data will be calculated on the basis of the RNR
census data.
In Bhutan one of the typical problems with crop area reporting is that there can be a big
difference between area sown and area harvested, largely because of wildlife problems. Crop
cuts system is being practiced at the Gewog level but its data are not compiled and used at the
headquarters of DoA. The DoA survey will be used to generate only national and Dzongkhag
level area and yield estimates for the most major crops (Paddy, Maize, Wheat, Buckwheat,
Barley and Millet).
Given the serious human resources constraints, an increase in the frequency of crop data
collections is not possible. Various users, including NSB, have expressed that there is a need to
do so.
For providing Gewog level data on the major crops on an annual basis blend of following
sources will be used:
• Extension officers will work with village heads to identify crop producing households to
create a more appropriate frame
• Dzogkag level crop data from the annual DoA survey (Proportionate allocation)
• Crop data from RNR census for Gewogs (Benchmarks)
• Use of data from crop cuts system being practiced at the Gewog level
• Gewog level crop reporting - to be reported once a year by the first week of February - to
tap very unusual annual changes in area and/or yield (for possible adjustment). These
data would come from administrative reporting, for which census data will be used as
benchmarks. For this, gradually there will be devolution of responsibility to Gewog
offices.
The number of households to be sampled for generating reasonably precise crop statistics of
some crops (such as minor crops and vegetables) is unaffordable. Hence, following approach
will be adopted in the case of minor crops:

12
Dzongkhag level crop reporting - to be reported by the first week of February - will be
introduced to tap unusual changes in area or yield at Dzonghag level. Each Dzongkhag will be
requested to contribute towards this.
Area data of such crops at the sub-regional levels will be updated on the basis of data available
from the latest RNR census and current year’s field reporting.
Data on yield of most important 2-3 minor crops per Dzongkhag will be collected through small
scale purposive survey.
RDC (Research Development Centers) carry out various agronomic research and experiments,
but mainly due to a lack of qualified statisticians in RDC reliable results of such experiments are
difficult to produce and use. In consultation with Indian Agricultural Statistics Research Institute
(IASRI) this project will provide funding support to organize on-the-job training in IASRI and a
research farm in India on carrying out such “Experiments”. A total of 2-3 DoA staff are expected
to benefit from this “Training of Trainer” training. Project 3 will provide about $2,500
(additional) for this training.
In a nutshell, the aim will be to collect core quality data that are reasonably reliable. Attempt will
be made to allocate separate budget for the conduct of annual crop surveys in Dzongkhags.
Emphasis will be laid on quality, not on quantity, with appreciation that Gewog level data based
on survey alone are not at all reliable. Towards this, the questionnaire of DoA survey will be
revised to reflect above concerns. One thing that has clearly emerged is the fact that the
questionnaire will be much shorter than the one used currently.
Results Chains
Expected Impact
• Enabling environment for annual assessment of food security and productivity growth at the national and Dzongkhag levels
Expected outcome
• A workable and reliable system for providing annual crop statistics on a timely manner
Expected outputs
• Improved frame for gathering crop statistics.
• A report on methodology that includes details on sampling, questionnaires, enumeration, supervision, tabulation plan and data processing.
• More reliable annual crop data (due a more efficient and targeted sample design, and much reduced burden in data gathering).
13
• Trained Staff (4 at the centre and 1 in each Dzonghag) to ensure sustainability of the activities initiated by the project.
Participants and other stakeholders
Main stakeholders include NSB (for national accounts, frame and data processing) and PPD in
the MoAF. The action proposes no change in existing organizational or conceptual framework.
No individual/group/organization will be negatively affected by the project.
Potential risks
The DoA Survey has been and will be a regular activity of DoA. There are no potential risks
which could hinder the achievement of the expected results of this Project.
Sustainability of the proposal
Although the cost for DoA’s surveys is embedded into DoA’s budget, conduct of these surveys is
still subject to the fund availability. Therefore extra efforts will be made to ensure
financial/economic and operational sustainability in order to implement the survey activities in a
regularized frequency and time. Technological sustainability will be ensured by human resources
management, at all levels, and by human resources development, including higher level training.
TA and NSB will greatly contribute towards this. See Section 4.6 also.
Synergies with other projects and programs
The proposed action would complement initiatives to be taken under Project 5: Land cover
mapping and Project 6: Conduct of a RNR census. For example, Project 5 would provide data on
wetland, which can be used to check consistency of data obtained from DoA survey on area
cultivated with paddy. Similarly, Project 6 will provide frame and benchmark data for DoA
Survey, DOL Census and other RNR surveys.

14
Work plan
Activity Time schedule Responsibility Remark
1a. Revise questionnaire and survey design
February/March 2015
DoA, PPD Consultant 1 p/m
1b. Development of online database for survey data entry
February/March 2015
DoA Consultant 1 p/m
1c. On-the-job training of DoA staff
February/March 2015
3 Consultants, DoA
On-the-job training of 2-3 counterpart staff members by the consultant.
1d. Training of DoA staff on census frame and survey data processing
October 2015 DoA, PPD NSB
1e. A Report on the methodology April 2016 Consultant, DoA
1f. Publish results based on the improved survey
April/May 2017
DoA Consultant 1 p/m
Implementation arrangements, budget and monitoring
Overall implementation arrangements are described in Section 4.3 of the proposal. DoA will
implement the project. TA of 3 p/m will be needed to address the strategy mentioned above
properly. Amount allotted for the training is $30,000, which will be used for formal short-term
training of 1-2 staff from DoA in sampling in institutions such as SIAP and IASRI. Tailor-made,
formal training in data processing will be provided by NSB. No provision has been made for
long-term training.
Table A1: Estimated total budget of Project 1 (US$)
In the table other expenses include international staff travel ($5,000), expendable (software;
$10,000) and TSS.
Sub-total
Project/Action Plan Technical Temporary Training GOE Other PSC Sub-total Government Government Government Total
Assistance Assistance Expenses Donor Contribution Contribution Contribution Project
(Consultant) (Equipment) (Operational) Cost
P1. Bring improvement in crop statistics 60,000 30,000 8,000 16,000 15,000 129,000 50,000 50,000 179,000

15
Project 2: Bring improvement in livestock Statistics
Problem and priority identified in the In-depth Country Assessment
Annual data on livestock number, livestock products (amount produced, sold and consumed)
published by DoL are the results of complete enumeration of households carried out by Gewog
Livestock Extension Officers in 205 Gewogs. Enumeration for the DoL survey begins in October.
Under this operation the officer collects the data by using a set of structured questionnaires
developed by DoL. The enumeration is monitored by Dzongkhag Livestock Officer and
Assistant Dzongkhag Livestock Officer. Data on numbers include animals in government farms
also. Preliminary data processing of livestock census data starts at individual Gewog level. By
the last week of December all compiled data from Gewogs and Dzongkhags reaches Department
of Livestock (DoL).
After final processing, data are firstly presented to departmental level Livestock Statistics
Committee (LSC), which is headed by Director of DoL. Then these are submitted to RNR-SSC
of MoAF for its consideration and approval. Reported data are checked by MoAF for their
consistency with the historical data sets. No Post Enumeration Survey is conducted to assess the
quality of reported data. However, large differences are always rechecked and explained. After
approval, the compiled data by Dzongkhag and Gewog (in Excel templates) are submitted to the
RNR Statistical Coordination Section (RNR-SCS) in PPD of MoAF for publication and
dissemination. Dissemination of the data is done via MoAF’s website (www.moaf.gov.bt) and
CountrySTAT (http://countrystat.org/home.aspx?c=BTN), and in hard and soft copies. Users
have confidence in the reported data.
Following observations were made by IdCA as regards DoL complete enumeration survey:
• Technical capability of staff is good. The “frame” used for the survey is not sound.
• Gewog level annual data on livestock and livestock numbers and products are not national requirements.
• Given the vastness of the coverage (each Gewog) it is very difficult to ensure quality of collected data on livestock numbers and products. Hence, complete enumeration of households on an annual basis is uneconomical.
• Reference period of reporting livestock production, sale and consumption is 1 year, which is too long. DoL has devised some norms and cross-checks for livestock production reported at the household level. Under the circumstances, together with the cross-checks, this is probably the best method of collection.

16
Summary of the Proposed Strategy
Extension officers will work with village heads to identify households with livestock ownership
to create a more appropriate frame. Improvements will be made to the frame by collecting
(Yes/No) answer on livestock holdings by types of livestock from the individual households.
This would identify and include new enumeration units also. The questionnaire will also be
revised.
Focus will be laid on estimating livestock numbers, sale and production only. For data on
consumption, results of BLSS will be used.
In place of complete enumeration, pilot sample survey will be conducted in a Dzongkhag, on a
pilot basis, to assess if sample surveys can serve the same purpose.
Staff at the centre and at Dzongkhags and Gewogs will be trained further, especially in the
survey Dzongkhags.
Data processing capacity will be strengthened with assistance from NSB in organizing training
on survey data processing. NSB has shown willingness to help implement this type of tailor-
made training, at nominal costs.
Results Chains
Expected Impact
• Enabling environment for annual food supply and food security assessment at the national and sub-national level
Expected outcome
• A workable system for providing reliable data on annual livestock number and production in a timely manner
Expected outputs
• Improved frame for annual livestock data collections
• Sample Survey methodology developed and pilot tested for annual livestock statistics
• More reliable annual livestock statistics (due to improved design and much reduced burden in gathering data)
• Trained Staff (2 at the centre and 1 in each Dzonghag) to ensure sustainability of the Project
• Report on Pilot Livestock Sample Survey conducted in Trashigang or in one of the larger Dzongkhags.

17
Participants and other stakeholders
Main stakeholders include NSB (for national accounts, frame and data processing) and PPD in
the MoAF. The action neither proposes organizational change nor the conceptual framework. No
individual/group/organization will be negatively affected by the action.
Potential risks
On operation, there is no potential risk which could hinder the achievement of the expected
results. On technical front, in the case of large difference in the complete enumeration and
survey estimates, acceptability of the survey results would be difficult. The pilot survey will be
an important means in mitigating this risk.
Sustainability of the proposal
As operational cost for DoL’s annual survey is embedded into DoL’s budget, financial/economic
sustainability is automatically ensured. Technological sustainability will be ensured by human
resources management, specifically at the sub-national level, and human resources development,
including higher level training. TA will contribute towards this; no National Consultant will be
hired. See Section 4.6 also.
Synergies with other projects and programs
The proposed action would complement initiatives to be taken under Project 5: Land cover
mapping and Project 6: Conduct of a RNR census. For example, Project 4 would provide data on
grazing land. Similarly, Project 6 will provide frame and benchmark data for DoL Survey and
other RNR surveys. Project 6 will also provide guidance on the data items to be covered in the
future DoL Census. It will also provide data needed to improve livestock sample survey designs.
Work Plan
Activity Time schedule Responsibility Remark
2a.Revise questionnaires March 2015 Consultant 0.5 p/m
DoL
2b. Report on frame and
sampling design
March 2015 Consultant 0.5 p/m
DoL
2c. Standardization of livestock
products estimation formulae
March 2015 Consultant 1 p/m
DoL
PPD
2d. Training of central staff March 2015 Consultants
NSB (data processing)

18
2e. Training of field staff August 2015 and
August 2016
DoL
2f. Conduct Pilot Sample
Survey in Trashigang or in one
of the larger dzongkhags.
October-November
2015
DoL
2g. Report on the Pilot Sample
Survey
April 2016 DoL
Consultant 1 p/m
2h. Release annual data on
livestock
March-April 2016 and
March-April 2017
DoL
Implementation arrangements, budget and monitoring
Overall implementation arrangements are described in Section 4.3 of the proposal. DoL will
implement the project. TA of 3 p/m will be needed to implement the project.
Table A2: Estimated total budget of Project 2 (US$)
Sub-total
Project/Action Plan Technical Temporary Training GOE Other PSC Sub-total Government Government Government Total
Assistance Assistance Expenses Donor Contribution Contribution Contribution Project
(Consultant) (Equipment) (Operational) Cost
P2. Bring improvement in livestock Statistics 60,000 25,000 5,000 3,500 12,000 105,500 50,000 50,000 155,500
19
Project 3: Increase institutional and HR capacity of the line agencies
Problem and priority identified in the In-depth Country Assessment
The Country Proposal aims to achieve long-lasting technological sustainability. In this process,
there are some problems and issues to be addressed in order for the process to be smooth and the
outcomes effective and efficient. The project would seek to resolve the following to exert lasting
impact:
• Formulation of Strategic Plan for Renewable Natural Resources Statistics (SP-RNRS)
• Interactive web-based resource that generates time series RNR data at national/sub-national levels
• Strengthen capacity of the stakeholder agencies
The eight key areas identified in the IdCA are:
i) Development of Strategic Plans for Renewable Natural Resources Statistics (SP-RNRS)
The Global Strategy recognizes that improving agricultural statistics starts with developing SP-
RNRS and incorporating such plans into the National Statistical System (NSS)3. This activity of
Project 3 will be geared towards the formulation of SP-RNRS.
ii) Foster ICT development
All agencies producing RNR statistics have reasonable number of computers and ICT services in
the office. At MoAF the Information and Communication Services (ICS) in the past year
published and distributed over 16,500 copies of various RNR newsletters, farmers’ newspapers,
diaries and magazines. Apart from this, the ICS also disseminated RNR information to the public
through various media and aired 32 different RNR programs. The ICS has also been mandated to
implement Government to Clients (G2C) Services (e.g. granting timber quota via internet) and
21 services have been identified under this. In a move towards enhancing RNR ICT services, the
internet bandwidth has also been upgraded. However, there is a lack of interactive web-based
source that generates time series data on RNR at national and sub-national levels. Towards this,
this activity will build upon the existing capability of staff and capacity of the office.
3 Bhutan Statistical System in the case of Bhutan

20
iii) Consumer price data
Potential sources of consumer price data are Food Corporation of Bhutan (FCB)/Department of
Agricultural Marketing and Cooperatives (DAMC) and NSB. The project will assist these
agencies to collect, process, analyze and disseminate consumer price data on monthly basis.
iv) Customs data
With proper capacity building and planning, it is possible for Department of Revenue and
Customs (DRC) under Ministry of Finance (MoF) to provide detailed information on agriculture
trade by commodity and its value on a regular basis. Support will be provided by the project
towards this end.
v) Auction data
With proper capacity building, it is possible for FCB and DAMC to provide detailed information
on auction data (quantity traded and price) from auction yards across the country on a regular
basis. Support will be provided by the project towards this end.
vi) RNR data use
The purpose of this activity will be to train MoAF staff on the use of existing RNR data for
policy, planning and statistical development.
vii) Forestry data sets
The responsibility of collection, compilation and processing of current data on forestry rests on
DOFPS. Main sources of data on forestry are land cover maps, RNR Census, and administrative
data maintained by Department of Forests and Park Services (DoFPS) and Natural Resources
Development Corporation Limited (NRDCL). “Forestry Facts and Figures Trends 2012”
published by DoFPS provides current data on protected areas, social forestry, and sustainable
utilization of forest resources. The project will bring improvement in the timely availability of
forestry data sets collected through administrative reporting by providing much needed training
and equipment support.
viii) Forest resources use
Data collected and produced by NRDCL on the utilization of forest resources fall under
administrative reporting. To strengthen its capacity for timely data delivery work, NRDCL
require assistance in office and computer equipment, software, training and ICT. This project
intends to provide support to NRDCL for these.
21
Summary of the Proposed Strategy
The SP-RNRS will be an updated version of RSF, which is being finalized. The revised draft of
the RSF would include agencies outside MoAF such as NSB, Gross National Happiness
Commission (GNHC), DRC, Ministry of Labour and Human Resources (MoLHR) etc. Their
inclusion is absolutely necessary for the integration of the RNR Statistics System into the Bhutan
Statistical System (BSS) and NSDS. The SP-RNRS will have 2 parts. Updated RSF will be
its main part. Its Annex would include information required for SP-RNRS that are not available
in the main part.
Three consultants will be hired: (i) a consultant (1 p/m) will assist MoAF and NSB in
formulation of SP-RNRS, (ii) a consultant (1 p/m) will assist MoAF in proposing an interactive
database and (iii) another consultant (1 p/m) will strengthen capacity of existing staff in
analyzing existing data sets for planning and policy purposes.
An interactive database will be established on the basis of existing data sets. Existing, limited
capacity of staff will be addressed through appropriate capacity enhancement efforts including
training and the transfer of knowledge of relevant FAO technical staff to fill the observed gaps.
There is a need to assess the potential use of ‘R’ software for data processing and analysis in
MoAF. In-country capacity in this area of expertise is very limited. FAO will be contacted for
assessing R’s appropriateness and its training possibilities.
Results Chains
Describe the results, identified during preliminary analysis, which the proposed action will
achieve.
Expected Impact
• A coordinated, sustainable system of RNR statistics for use in interventions in the agricultural sector and beyond, ultimately contributing to eradicate poverty and hunger
Expected outcome
• Institutionalization of RNR statistical activities within the government structure
• Developed ICT
• Elements of SP-RNRS sequenced to be implemented
Expected outputs
• Revised RSF along with SP-RNRS
• Trained staff in various areas (15 in total)

22
• Monthly consumer prices and auction prices (from Regional office of FCB/DAMC)
• Timely commodity-specific trade data (from DRC)
• Timely forestry and forest resources use data (from DoFPS and NRDCL)
• Policy and planning-oriented outputs from existing data sets
Participants and other stakeholders
All stakeholders will benefit from the proposed action. Some of the stakeholders absolutely trust
that this project is most important of all.
Potential risks
There are no potential risks which could hinder the achievement of the expected results.
Sustainability of the proposal
See Section 4.6.
Synergies with other projects and programs
A TCP is being drawn up for consideration of FAO for capacity development of MoAF staff in
policy impact studies. Main intended outcomes of the TCP are: (i) 4 policy impact studies
conducted (on farm road, farm mechanization, human wildlife conflict interventions and
community-based ecotourism) and ii) Increased capacity of PPD in carrying out policy impact
studies. Clearly there will be no degree of overlap with the proposed TCP in activities/outputs.
The overall objective of the European Union (EU) project “Technical Cooperation Project in
Support of the RNR Sector” is to enable MoAF to achieve the objectives of the RNR 11th Five
Year Plan. This project (Project 3) will complement the activities to be undertaken by the EU
project, especially in the field of knowledge management and training documentation.

23
Work Plan
Activity Time schedule Responsibility Remark
3a. Training cum study tour
(with field trip) to India
(IASRI) to know the
agricultural data collection
system there
February 2015
(Preparation)
July/August 2015
(Implementation)
Consultant
PPD
NSB
FAO Bhutan
10 Participants from
various agencies; at
least 3 female
participants
There is a need to have
lead time of 6 months
to implement this
training
3b. On-the-job training of
staff from various agencies
March 2015 The topic would
include price statistics,
supply utilization
accounts, food balance
sheet
3c. Prepare ICT
development proposal for
MoAF
March 2015 ICT Consultant
MoAF
3d. Workshop to finalize
data to be collected and
consolidated
May 2015 PPD and NSB Participants: All
stakeholders
3e. Streamline agriculture in
NSDS
January-June 2015 PPD (RNR-SC) and
NSB
NSB and PPD
3f. Prepare revised SP-
RNRS
On-going Consultant
PPD (RNR-SC) and
NSB
The SP-RNRS will be
an updated version of
RSF which is being
finalized
Implementation arrangements, budget and monitoring
The project will be jointly implemented by PPD and NSB. Overall implementation arrangements
are described in Section 4.3 of the proposal. FAO Bhutan will assist the project in organizing
study tour to India.
Estimated budget of Project 3 is given in Table A3. In this table, TA consists of SPARS (1 p/m),
other areas (1 p/m) and ICT (1 p/m).
Table A3: Estimated total budget of Project 3 (US$)
ather and Publish updated environmental data
Sub-total
Project/Action Plan Technical Temporary Training GOE Other PSC Sub-total Government Government Government Total
Assistance Assistance Expenses Donor Contribution Contribution Contribution Project
(Consultant) (Equipment) (Operational) Cost
P3. Increase institutional and HR capacity 60,000 110,000 14,000 5,500 24,000 213,500 300,000 300,000 513,500

24
Problem and priority identified in the In-depth Country Assessment
Sectoral plans in Bhutan are guided by four pillars of Gross National Happiness (GNH): (i)
promotion of equitable and socioeconomic development, (ii) preservation and promotion of
cultural values, (iii) conservation of the natural environment and (iv) good governance.
Usefulness of data on environment is obvious, particularly for the third pillar.
The IdCA reported that out migration from rural areas and rapid urbanization are causing
profound impact on land use and land development, causing adverse effect on environment. As
regards this, central focus of NEC has been on data on land and agriculture, forests, air and
climate, energy and minerals, biodiversity, water resources, natural disasters, and waste.
Following IdCA, emerging data requirements on environment include updated map and data on
land cover (wet land, dry land and Tseri etc.), water and forest. Updated assessment of GHG
emissions is also required. Other main requirements are data that are needed for production of
Bhutan Environment Outlook (State of Environment Report).
Summary of the Proposed Strategy
As sources of environment statistics are dispersed over a variety of data producers, available data
on environment will be consolidated and assessed by NEC and such data will be disseminated to
the all types of users via web-based systems.
For this workshops and meetings will be held with the participation of institutions and
Dzongkhags
Data on land cover, water and forest are included in Project 5: Land cover mapping. Such data
will be outside the scope of the current project.
Assessment of GHG emissions will be undertaken via other means; it will be outside the scope of
the current project.
Further enhancement of the capacity of the users and technical capacity of staff will be continued.
A consultant for development of data dissemination system will be hired; on-the-job training will
be organized for 4 staff by the consultant.

25
Results Chains
Expected Impact
• Enabling environment for guiding environmental and forest policy, programs and plans
Expected outcome
• Given the institutional arrangements (see Section 4.3, and A4.9 below), main outcome will be institutional capacity development in the Government in the production and use of environmental data.
Expected outputs
• Assessment of National inventories of agriculture, land use, forestry and water
• Data required for Statement of Environment
• Web-based information system on environment
• Increased capability of 4 staff
Participants and other stakeholders
The proposed action would complement and benefit the initiatives to be taken by others on land
cover mapping, GHS emission assessment, and collection of forest data sets. No stakeholder will
be negatively affected by the proposed action.
Potential risks
There are no potential risks which could hinder the achievement of the expected results.
Sustainability of the proposal
Salient features of the sustainability in the action include capacity development and
environmental sustainability. Technological sustainability will be ensured by Technical
Assistance and staff training. In addition, given the implementation arrangement (Section A4.9)
institutional sustainability of the results after completion of this project will be ensured by the
institutional partners that will contribute towards this action. See Section 4.6 also.
Synergies with other projects and programs
The proposed action would complement and benefit the initiatives to be taken by land cover
mapping and forest and GHG emission data sets collection.

26
Work Plan
Activity Time schedule Responsibility Remark
4a. Prepare format for
information collection
July-August 2015 Consultant
MoAF
NEC
Data format will have
to be agreed on the
information collection
4b.Train Local staff and
institutional staff
October-November,
2015
MoAF
NEC
4c. Data Processing and data
assessment
March-June 2016 MoAF
NEC
4d. Consultant for
development of dissemination
system
July 2015
May 2016
MoAF
NEC
4e.Train staff in use of
dissemination system
October 2015
May-June 2016
MoAF
NEC
4f. Assess and process
collected data
March-April 2016
March-April 2017
MoAF
NEC
4g. Reporting and
dissemination
April 2016
April 2017
MoAF
NEC
Implementation arrangements, budget and monitoring
A proper framework to guide development, coordination and organization of environment
statistics is already in place in the country. Main stakeholders in the case of environment
statistics are National Environment Commission Secretariat, National Soil Services Centre
(NSSC) of DoA, Biodiversity Centre, PPD and DoFPS in MoAF, GNHC, National Land
Commission (NLC) and Ministry of Economic Affairs’ (MoEA) Department of Geology and
Mines (DGM), Hydro-Met Services Department and Department of Renewable Energy). The
NEC will be the main implementer of this project.
The estimated total budget of Project 4 is given below. Further details on the budget can be
found in Annex II. Briefly, TA, training and funding for studies will be needed to enhance the
institutional arrangement for environment information and data.
Table A4: Estimated total budget of Project 4 (US$)
Sub-total
Project/Action Plan Technical Temporary Training GOE Other PSC Sub-total Government Government Government Total
Assistance Assistance Expenses Donor Contribution Contribution Contribution Project
(Consultant) (Equipment) (Operational) Cost
P4. Gather updated environmental data 40,000 40,000 50,000 8,000 21,000 21,000 180,000 20,000 20,000 200,000

27
Project 5: Land cover mapping
Problem and priority identified in the In-depth Country Assessment
The IdCA emphasized that the updated map and data on land cover can be used as reliable
decision making tools for a sustainable use of RNR. Such data are also needed for updated
description, study and assessment of environment.
Land Cover Maps for Bhutan, which uses updated digital image, are available for 2010. Rapid
migration from rural to urban areas, farm labor shortage in rural areas, absenteeism from the
holding, and rapid urbanization have caused more and more land fallow (or put into use for non-
agricultural purposes). Existing land cover would not be mirrored correctly in the five year old
land cover map and data.
Summary of the Proposed Strategy
The strategy is to use FAO’s Land Cover Classification System (LCCS), which is recognized
worldwide as a very reliable method to describe the reality with a very high level of accuracy
and sharpness. Its output is a comprehensive land cover characterization, regardless of mapping
scale, land cover type, data collection method or geographic location. Besides, LCCS has proven
potential for use in classifying agriculture land cover by type (wet land, dry land and Tseri),
agro-ecological stratification and area sampling, all of which can improve reliability of RNR
statistics. Technical Assistance as regards LCCS will be sought from Global Land Cover
Network of FAO. High quality image resolution (5 m spatial resolution) will be needed to
capture small holdings with scattered and varied crops.
Overall strategy will be to develop capacity of national staff in land cover mapping.
Results Chains
The results which the proposed action will achieve are summarized below:
Expected Impact
• There will be powerful and lasting impact on formulation of evidence-based policy and in sustainable management and utilization of land, water and forest resources.
Expected outcome
• Sustainable capacity development in remote sensing and land cover mapping.

28
Expected outputs
• Latest land-cover map and data
• Updated, reliable agricultural land-cover statistics (wetland, dry land and Tseri etc.)
• 7 trained staff in remote sensing and land cover mapping in DoA, DoFPS and PPD who
will assist in preparing the land cover maps and data
Participants and other stakeholders
None of the stakeholders will be negatively affected by proposed action
Potential risks
Given earlier experience of MoAF in land cover mapping, there are no potential risks which
could hinder the achievement of the expected results.
Sustainability of the proposal
As regards financial/economic sustainability, similar action may be needed only after 5 years.
Technological sustainability of results after completion will be ensured by developing a cadre of
trained staff in land cover mapping in DoA, DoFPS and PPD. These offices will contribute
towards further use and sustainability of the results. See Section 4.6 also.
Synergies with other projects and programs
The proposed action is a perfect complement to Project 4: Gather updated environmental data.
Work Plan
Activity Time schedule Responsibility Remark
5a. Digital map
acquisition
July 2015 – March
2016
MoAF
Lead role PPD
5b. Training of staff in
GIS and mapping
March-September
2016
Consultant
MoAF
Lead role PPD
5c. Analysis of the
maps and data
July 2016 – March
2017
MoAF
Lead role PPD
5d. Production of
maps and land cover
(RNR) data
June 2017 Consultant
MoAF
Lead role PPD

29
Implementation arrangements, budget and monitoring
Overall implementation arrangements are described in Section 4.3 of the proposal. In 2008 Land
Cover Mapping Project (LCMP) was set up with the financial support of Nu. 7 million from the
GEF/WB funded Sustainable Land Management Project. On operational front, similar
arrangement will be put into place for this project at PPD and the project will be implemented by
PPD.
Table A5: Estimated total budget of Project 5 (US$)
Sub-total
Project/Action Plan Technical Temporary Training GOE Other PSC Sub-total Government Government Government Total
Assistance Assistance Expenses Donor Contribution Contribution Contribution Project
(Consultant) (Equipment) (Operational) Cost
P5. Land cover mapping 200,000 100,000 30,000 89,000 429,000 110,000 958,000 50,000 50,000 100,000 1,058,000

30
Project 6: Conduct of a RNR census
Problem and priority identified in the In-depth Country Assessment
Both MoAF and NSB lack monetary resources, skills, sustainable supervisory network, mobility
and other facilities at the centre and in the field. It is therefore clear that maintaining quality,
frequency, consistency, timeliness and reliability of agricultural data is difficult. Another
constraint has been non-availability of reliable frames for the conduct of a RNR Census.
The first RNR census was carried out in 2000. The last RNR census was conducted in 2009 by
PPD. There is a lack of comprehensive structural data on RNR and proper frame for the conduct
of RNR sample surveys. Conduct of a RNR census will provide such data and frame for the
conduct of RNR sample surveys.
Summary of the Proposed Strategy
Some questions will be added in the 2015 Population and Housing Census questionnaires to
prepare frames for RNR Census and annual sample surveys. Among other benefits, this will
ensure proper linkage of RNR surveys conducted by MoAF with NSB survey. This action will
also increase reliability of the results of the RNR surveys.
The data items to be covered in the 2016 RNR Census will be similar to the 2009 RNR Census.
However, in line with FAO’s recommendations, main emphasis this time will be laid on
“structural” RNR data that do not change in a short period. Recommended, standard definitions
and classifications will be followed as far as possible. Collection of data on fast changing
indicators will be kept to a minimum. Data processing will be done in collaboration with NSB,
for which MoAF staff will be trained. Database will be well maintained for the future access and
use.
Results Chains
Describe the results, identified during preliminary analysis, which the proposed action will
achieve.
Expected Impact
• Further development of domestic capacity for evidence-based policymaking in land cover,
land tenure, crop intensification and diversification. It will exert impact also on planning
enabling environment, both at national and smallest sub-national level.
• Increased reliability of the results provided by RNR and other socioeconomic surveys

31
Expected outcome
• Institutional development by setting a good example of streamlining agriculture data collection into the national system.
• Better linkage of Population census and RNR census
Expected outputs
• Improved frame for conducting RNR census and probability surveys
• Benchmark data for RNR policy and planning that can be typically used for 10 years
• Solid basis (household data) for the conduct of annual surveys (both for increasing efficiency of sampling design and for estimating optimal sample size required)
• 5 trained staff in MoAF for census and survey data processing
Participants and other stakeholders
All stakeholders in RNR Statistical Framework will benefit from the proposed action. There will
be no stakeholder that would be negatively affected by the proposed action.
Potential risks
The RNR Census should be conducted together with or soon after the Population and Housing
Census. For frame-related issues a consultant (1 p/m) will be needed when the questionnaire for
the Population and Housing Census will be finalized. As regards this time needed to mobilize
international resources is already tight. Similarly, time needed to mobilize national and
international resources for enumeration work is a potential risk.
Sustainability of the proposal
Technological sustainability of the results after completion can be ensured. For financial
sustainability there will be considerable “Government Contribution” for this project. See Section
4.6 also.
Synergies with other projects and programs
This project would complement RNR related projects/programs. It would benefit and build on
existing related initiatives such as annual crop survey and livestock census led by DoA and DoL.
32
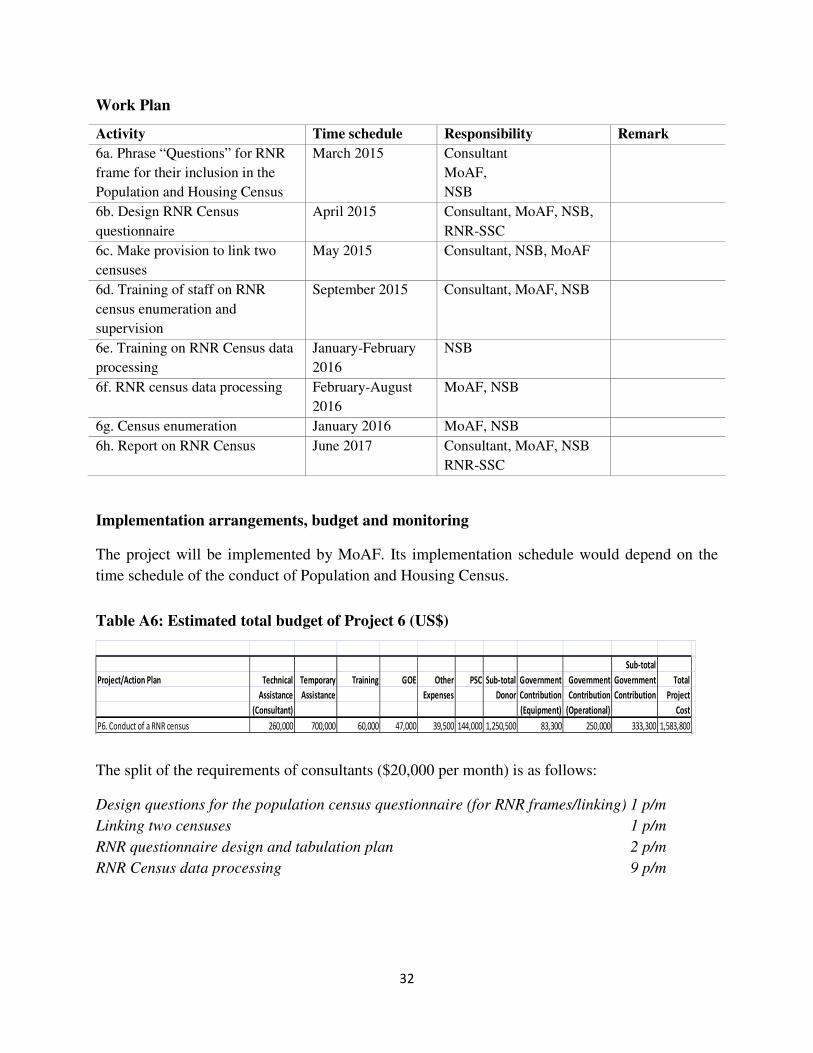
Work Plan
Activity Time schedule Responsibility Remark
6a. Phrase “Questions” for RNR
frame for their inclusion in the
Population and Housing Census
March 2015 Consultant
MoAF,
NSB
6b. Design RNR Census
questionnaire
April 2015 Consultant, MoAF, NSB,
RNR-SSC
6c. Make provision to link two
censuses
May 2015 Consultant, NSB, MoAF
6d. Training of staff on RNR
census enumeration and
supervision
September 2015 Consultant, MoAF, NSB
6e. Training on RNR Census data
processing
January-February
2016
NSB
6f. RNR census data processing February-August
2016
MoAF, NSB
6g. Census enumeration January 2016 MoAF, NSB
6h. Report on RNR Census June 2017 Consultant, MoAF, NSB
RNR-SSC
Implementation arrangements, budget and monitoring
The project will be implemented by MoAF. Its implementation schedule would depend on the
time schedule of the conduct of Population and Housing Census.
Table A6: Estimated total budget of Project 6 (US$)
The split of the requirements of consultants ($20,000 per month) is as follows:
Design questions for the population census questionnaire (for RNR frames/linking) 1 p/m
Linking two censuses 1 p/m
RNR questionnaire design and tabulation plan 2 p/m
RNR Census data processing 9 p/m
Sub-total
Project/Action Plan Technical Temporary Training GOE Other PSC Sub-total Government Government Government Total
Assistance Assistance Expenses Donor Contribution Contribution Contribution Project
(Consultant) (Equipment) (Operational) Cost
P6. Conduct of a RNR census 260,000 700,000 60,000 47,000 39,500 144,000 1,250,500 83,300 250,000 333,300 1,583,800

33
Project 7: Support to Bhutan Living Standard Survey
Problem and priority identified in the In-depth Country Assessment
Bhutan Living Standard Survey (BLSS) 2012 was commissioned by NSB. The sample size in
BLSS 2012 is 8,968 households, which represents a total of 127,942 households with 581,257
persons.
BLSS is an important source of information for many users including MoAF. It is the main
source of reliable data and indicators needed for monitoring and evaluation of the international
and regional commitments such as Millennium Development Goals (MDG) and South Asian
Association for Regional Cooperation (SAARC) Development Goals (SDG). Crucial RNR-
related data provided by this survey include most updated household level information on
composition, demographics, employment (in farming), asset ownership (of land and livestock),
sources of income, and food consumption in minute details. Bhutan Poverty Analysis 2012 and
Bhutan Poverty Assessment 2014 are predominantly based on BLSS data. Data on composition
and demography are available from the Population and Housing Census and updated data on
employment are available from Labour Force Surveys (LFS) also. However, BLSS is the most
comprehensive and comparable source of data on household food security and poverty.
The IdCA mission noted that NSB has a very good technical capacity to undertake probability
sample surveys and to process and analyze their data. Its human resources constraint can be
addressed because it is more of manpower not technical.
All BLSS (2003, 2007 and 2012) were entirely funded by Asian Development Bank (ADB). For
sustainability government-funded BLSS is a necessity now.
Summary of the Proposed Strategy
In 2017 will be conducted as a regular program of NSB. Entirely Government-funded BLSS will
be recurring every five year.
Results Chains
The proposed action will achieve the following results:
Expected Impact
• Enabling environment to inform and advocate for improved policies and programs on food security, poverty, livelihood, employment, and social capital.
• Enabling environment for household food security and livelihood assessment, monitoring and evaluation
34
Expected outcome
• Capacity of NSB further strengthened to carry out reliable, timely and regular production of poverty, nutrition and livelihood data and their analysis
• Institutional strengthening at the Dzongkhag level to carry out poverty, livelihood and food security monitoring
Expected outputs (main)
• BLSS Survey Report
• Poverty Analysis and Poverty Assessment Reports (based on data from BLSS)
• Sampled households’ data on:
• Commodity-specific food consumption
• Income earned from cereal, fruits, vegetables, meat, dairy products, eggs, forest wood products, forest non-wood products
• Poverty for MDG evaluation and other uses
• Social capital
• Data items sex (for the data items collected in BLSS “by sex”).
Participants and other stakeholders
BLSS is the sole source of reliable and comparable information and data on food security,
poverty, health, education, livelihood, asset ownership, remittances, credits, employment, and
social capital. Hence, stakeholders benefiting from the proposed action are many. Other sources
of some of these data include the Population and Housing Census (on composition and
demography) and LFS (employment). However, no agency or individual is going to be adversely
affected by the proposed project. The stakeholders will make sure that there will be no
duplication of efforts.
Potential risks
Given the experience NSB has gained over the years, potential risks which could hinder the
achievement of the expected results are none.
Sustainability of the proposal
Funds for carrying out BLSS 2017 would be possible to acquire from the Government resources.
The NSB and its partners are confident that the action will be able to ensure capacity
development and technological sustainability. Similarly, current situation suggests that

35
financial/economic sustainability for carrying out BLSS on a quinquennial basis would also be
possible to achieve. See Section 4.6 also.
Synergies with other projects and programs
The proposed action would complement the following:
• Existing initiatives taken by MoAF in gathering crop and livestock production data
• Existing initiatives taken by MoLHR in gathering employment and labour data
Work Plan
This project will support the conduct of BLSS in 2017. For this there is already a well-
established system at NSB.
Activity Time schedule Responsibility Remark
7a. Revision of 2012 BLSS
questionnaire
January-March 2017 NSB and
stakeholders
7b. Hiring and training of
enumerators and supervisors
March-April 2017 NSB
7c. Enumeration and supervision March-April 2017 NSB
7d. Conduct of BLSS April-May 2017 NSB
7e. Data processing and reporting June-December 2017 NSB
Implementation arrangements, budget and monitoring
The institutional arrangement made at NSB for the conduct of the 2012 BLSS was proper, so it
will be given continuity.
Table A7: Estimated total budget of Project 7 (US$)
The responsibility of monitoring and progress reporting will rest upon NSB. Of the three rounds
(2003, 2007 and 2012) of the BLSS conducted so far, the BLSS 2007 and 2012 rounds are most
important sources of indicators for assessing the government’s 2008–2013 five-year plan. ADB
always provided funding for the conduct of this survey. The Government will provide funds for
Sub-total
Project/Action Plan Technical Temporary Training GOE Other PSC Sub-total Government Government Government Total
Assistance Assistance Expenses Donor Contribution Contribution Contribution Project
(Consultant) (Equipment) (Operational) Cost
P7. Bhutan Living Standard Survey 10,000 145,000 155,000 155,000

36
the conduct of the next round of BLSS in 2017, after which this activity will be implemented in a
program mode.

37
Project 8: Support to the conduct of Labor Force Survey
Problem and priority identified in the In-depth Country Assessment
The tenth Labor Force Survey was conducted by MoLHR in March and April, 2012. The survey
provides useful information on the size, composition and economic characteristics of the urban
and rural population. In addition, data on labor and human resources are also available by sex,
age, occupation, location, industry, employment, nature of employment, and labor force
participation. Such data are essential for macroeconomic policy and planning.
The Labor Force Survey was initiated first time in 1998. From 2003, it has become a regular
activity of MoLHR. The Department of Employment aims to conduct the Labor Force Survey
annually to enable the Ministry to assess the current and emerging labor situation in the country.
MoLHR’s capacity needs to be increased in sampling frame preparation and in survey data
processing. NSB is in the best position to organize tailor made local training on these subjects.
Given this the training cost, part of which will be allotted from Project 3, is adjudged nominal.
Summary of the Proposed Strategy
The strategy is to promote existing approach by upgrading capacity of MoLHR by training 6 of
its staff members in survey data processing (4) and ICT development (2). in order to (i) gain
knowledge of NSB sampling frame, (ii) speed-up the survey data processing and (iii) satiate
emerging data on employment and labor use (in RNR-Sector). Training of 2 staff on ICT
development will be required also.
Currently LFS is conducted annually. Given the data demand intended strategy will be to
conduct it on quarterly or half-yearly basis, if resources permit.
Results Chains
The results identified during IdCA, which the proposed action will achieve, are summarized
below:
Expected Impact
• Through the provision of timely data there will be more enabling environment for policy formulation on labor and employment use in RNR Sector.

38
Expected outcome
• Capacity development at MoLHR for Labor Force Survey sampling design, data processing and reporting
Expected outputs
• 4 well trained staff on the use of sampling frame (of NSB), on sampling design and on survey data processing
• 2 staff trained in ICT development
• Timely, gender-specific data on employment and labour use by sex, age, occupation, location, employment, nature of employment, and labour force participation in RNR sector
• Survey Report that includes results and technical aspects
Participants and other stakeholders
Stakeholders benefiting from proposed action include line ministries, NSB and ILO because the
action will enable MoLHR to provide required data to their users on a timely manner. No
stakeholder will be negatively affected by the proposed action.
Potential risks
Possible turn-over of the trained staff could hinder the achievement of the expected results.
However, this risk is adjudged to be medium. Towards this practical mitigating measure to be
adopted includes organization of training for 4 professionals.
Sustainability of the proposal
Amount of the assistance to be provided by a donor is none. Given this, sustainability of results
after completion of the project will be easier. See Section 4.6 also.
Synergies with other projects and programs
The frame used by MoLHR comes from NSB and replicated household data sets of NSB and
MoLHR can be linked. Given this, firstly, proposed action would complement socioeconomic
data (e.g. BLSS) and other survey data gathered by NSB. Secondly, MoLHR will have to update
its sampling frame after the frame from next Population and Housing Census would be available
from the NSB.

39
Work Plan
Activity Time schedule Responsibility Remark
8a. Training of enumerators January 2015 MoLHR
NSB
8b. Conduct of Labor Force Survey March-April 2015 MoLHR
8c. Prepare proposal for data processing
training for consideration of NSB
March 2015 MoLHR
8d. Organization of training on data
processing
April 2015 MoLHR
8e. Process and Publish LFS Report April-December
2015
MoLHR
Implementation arrangements, budget and monitoring
The institutional arrangement made at MoLHR for the conduct of the 2012 was proper. It will be
given continuity. Accordingly, Labour Market Information & Research Division (LMIRD) of the
Department of Employment, MoLHR will take a lead in technical matters. The NSB will provide
technical assistance in frame, training (in data processing), data processing, and analysis. Other
line agencies and administrations at the central and sub-national levels will assume supporting
roles.
Table A8: Estimated total budget of Project 8 (US$)
Precise details on the budget can be found in Annex II. The project will be monitored by
MoLHR. The responsibility of monitoring and progress reporting will rest upon Labor Market
Information & Research Division (LMIRD) of the Department of Employment, Ministry of
Labour and Human Resources (MoLHR).
Sub-total
Project/Action Plan Technical Temporary Training GOE Other PSC Sub-total Government Government Government Total
Assistance Assistance Expenses Donor Contribution Contribution Contribution Project
(Consultant) (Equipment) (Operational) Cost
P8. Labor Force Survey 50,000 90,000 140,000 140,000

40
Annex II: Budget
Annex IIa: Budget Summary (US$)
Annex IIb: Budget Summary (Nu.)
Sub-total
Project/Action Plan Technical Temporary Training Travel Expendable Non- TSS GOE PSC Sub-total Government Government Government Total
(in order of priority) Assistance Assistance Expendable Donor Contribution Contribution Contribution Project
(Consultant) (Equipment) (Operational) Cost
P1. Bring improvement in crop statistics 60,000 30,000 5,000 10,000 1,000 8,000 15,000 129,000 50,000 50,000 179,000
P2. Bring improvement in livestock Statistics 60,000 25,000 2,500 1,000 5,000 12,000 105,500 50,000 50,000 155,500
P3. Increase institutional and HR capacity 60,000 110,000 2,500 2,000 1,000 14,000 24,000 213,500 300,000 300,000 513,500
P4. Gather updated environmental data 40,000 40,000 50,000 20,000 1,000 8,000 21,000 180,000 20,000 20,000 200,000
P5. Land cover mapping 200,000 100,000 30,000 25,000 400,000 4,000 89,000 110,000 958,000 50,000 50,000 100,000 1,058,000
P6. Conduct of a RNR census 260,000 700,000 60,000 32,500 7,000 47,000 144,000 1,250,500 83,300 250,000 333,300 1,583,800
P7. Bhutan Living Standard Survey 10,000 145,000 155,000 155,000
P8. Labor Force Survey 50,000 90,000 140,000 140,000
Overall 680,000 840,000 305,000 87,500 410,000 2,000 15,000 171,000 326,000 2,836,500 613,300 535,000 1,148,300 3,984,800
$ to Nu. Ex-Rate 60
Sub-total
Project/Action Plan Technical Temporary Training Travel Expendable Non- TSS GOE PSC Sub-total Government Government Government Total
(in order of priority) Assistance Assistance Expendable Donor Contribution Contribution Contribution Project
(Equipment) (Operational) Cost
P1. Bring improvement in crop statistics 3,600,000 1,800,000 300,000 600,000 60,000 480,000 900,000 7,740,000 3,000,000 3,000,000 10,740,000
P2. Bring improvement in livestock Statistics 3,600,000 1,500,000 150,000 60,000 300,000 720,000 6,330,000 3,000,000 3,000,000 9,330,000
P3. Increase institutional and HR capacity 3,600,000 6,600,000 150,000 120,000 60,000 840,000 1,440,000 12,810,000 18,000,000 18,000,000 30,810,000
P4. Gather updated environmental data 2,400,000 2,400,000 3,000,000 1,200,000 60,000 480,000 1,260,000 10,800,000 1,200,000 1,200,000 12,000,000
P5. Land cover mapping 12,000,000 6,000,000 1,800,000 1,500,000 24,000,000 240,000 5,340,000 6,600,000 57,480,000 3,000,000 3,000,000 6,000,000 63,480,000
P6. Conduct of a RNR census 15,600,000 42,000,000 3,600,000 1,950,000 420,000 2,820,000 8,640,000 75,030,000 4,998,000 15,000,000 19,998,000 95,028,000
P7. Bhutan Living Standard Survey 600,000 8,700,000 9,300,000 9,300,000
P8. Labor Force Survey 3,000,000 5,400,000 8,400,000 8,400,000
Overall 40,800,000 50,400,000 18,300,000 5,250,000 24,600,000 120,000 900,000 10,260,000 19,560,000 170,190,000 36,798,000 32,100,000 68,898,000 239,088,000
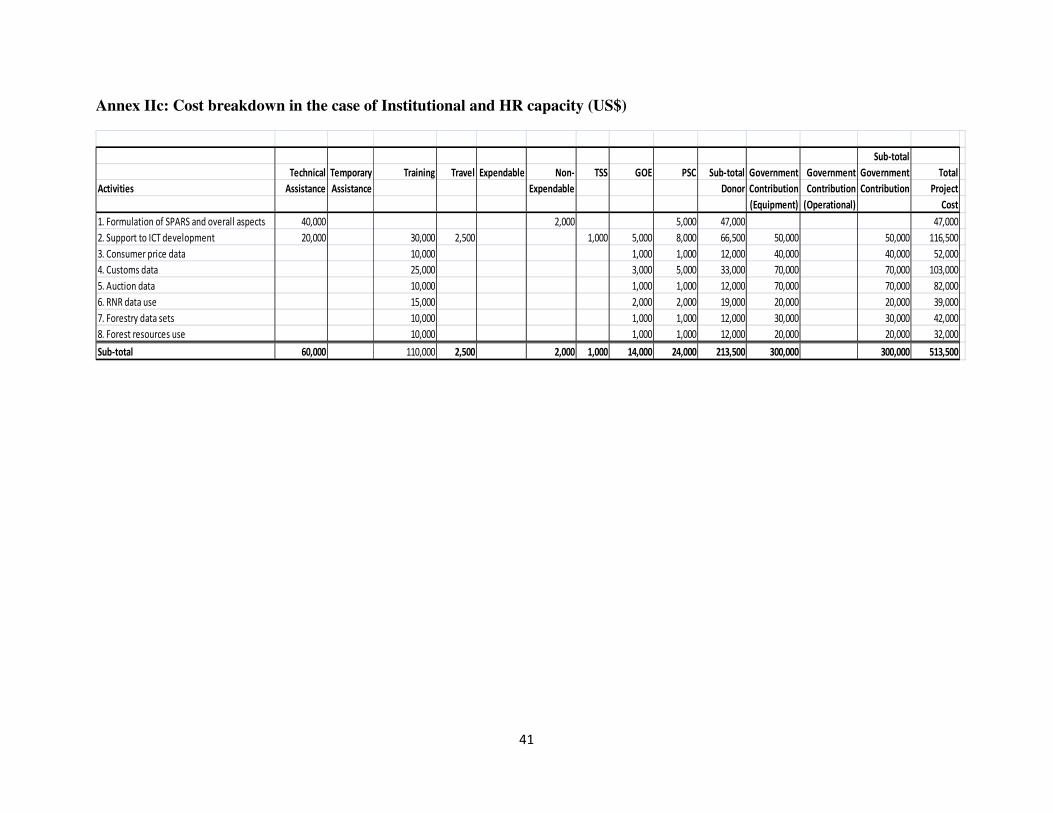
41
Annex IIc: Cost breakdown in the case of Institutional and HR capacity (US$)
Sub-total
Technical Temporary Training Travel Expendable Non- TSS GOE PSC Sub-total Government Government Government Total
Activities Assistance Assistance Expendable Donor Contribution Contribution Contribution Project
(Equipment) (Operational) Cost
1. Formulation of SPARS and overall aspects 40,000 2,000 5,000 47,000 47,000
2. Support to ICT development 20,000 30,000 2,500 1,000 5,000 8,000 66,500 50,000 50,000 116,500
3. Consumer price data 10,000 1,000 1,000 12,000 40,000 40,000 52,000
4. Customs data 25,000 3,000 5,000 33,000 70,000 70,000 103,000
5. Auction data 10,000 1,000 1,000 12,000 70,000 70,000 82,000
6. RNR data use 15,000 2,000 2,000 19,000 20,000 20,000 39,000
7. Forestry data sets 10,000 1,000 1,000 12,000 30,000 30,000 42,000
8. Forest resources use 10,000 1,000 1,000 12,000 20,000 20,000 32,000
Sub-total 60,000 110,000 2,500 2,000 1,000 14,000 24,000 213,500 300,000 300,000 513,500

42
Annex III: Work Plan (2015 –2017)
Project / Activity Q1 Q2 Q3 Q4 Q1 Q2 Q3 Q4 Q1 Q2
2015 2015 2015 2015 2016 2016 2016 2016 2017 2017
1 Bring improvement in crop statistics 1a. Revise questionnaire and survey design X
1b. Development of online database for survey data entry
X
1c. On-the-job training of DoA staff X
1d. Training of DoA staff on frame and data processing
X X
1e. A Report on the methodology X
1f. Publish results based on the improved survey X X
2 Bring improvement in livestock Statistics 2a. Revise questionnaires X
2b. Report on frame and sampling design X
2c. Development of estimation methods of livestock products
X
2d. Training of central staff X
2e. Training of field staff X X
2f. Conduct Pilot Sample Survey in a large Dzongkhags
X
2g. Report on the Pilot Sample Survey X
2h. Release annual data on livestock X X
3 Increase institutional and HR capacity 3a. Training cum study tour (with field trip) to India (IASRI)
X X X
3b. On-the-job training of staff from various agencies X
3c. Prepare ICT development proposal for MoAF X
3d. Workshop to finalize data to be collected and consolidated
X
3e. Streamline agriculture in NSDS X X
3f. Prepare revised SPARS (SP-RNRS) X X X X X X X
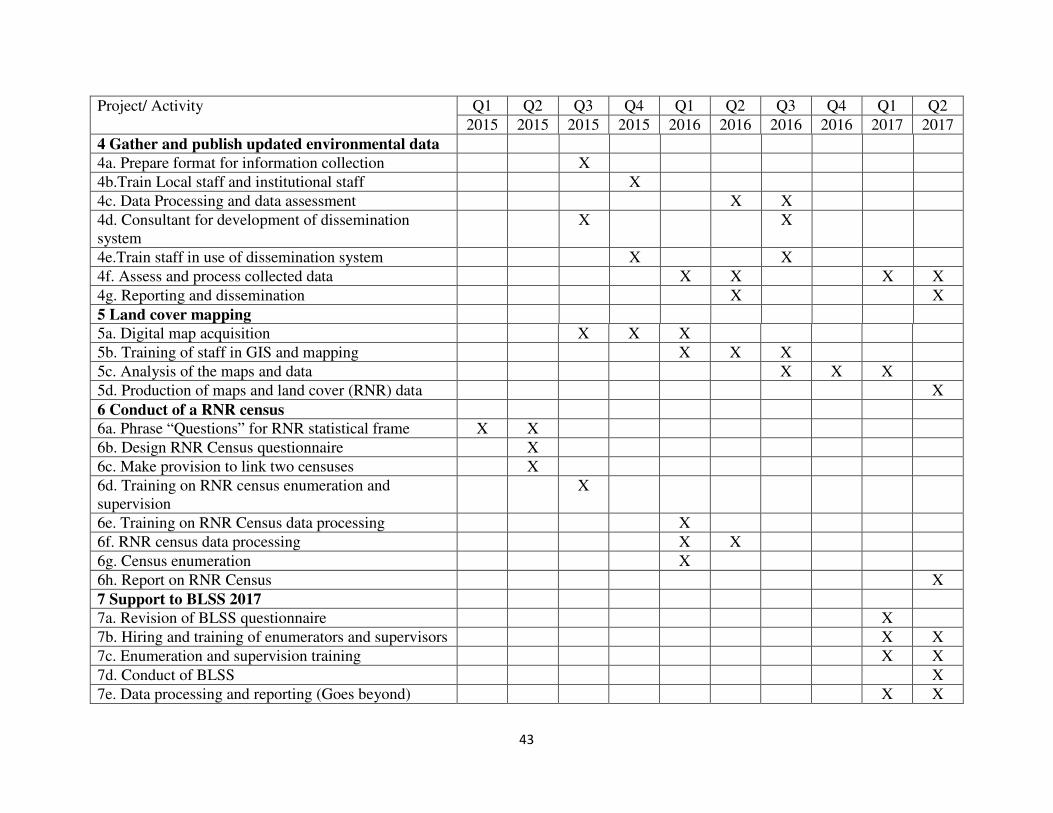
43
Project/ Activity Q1 Q2 Q3 Q4 Q1 Q2 Q3 Q4 Q1 Q2
2015 2015 2015 2015 2016 2016 2016 2016 2017 2017
4 Gather and publish updated environmental data 4a. Prepare format for information collection X
4b.Train Local staff and institutional staff X
4c. Data Processing and data assessment X X
4d. Consultant for development of dissemination system
X X
4e.Train staff in use of dissemination system X X
4f. Assess and process collected data X X X X
4g. Reporting and dissemination X X
5 Land cover mapping 5a. Digital map acquisition X X X
5b. Training of staff in GIS and mapping X X X
5c. Analysis of the maps and data X X X
5d. Production of maps and land cover (RNR) data X
6 Conduct of a RNR census 6a. Phrase “Questions” for RNR statistical frame X X
6b. Design RNR Census questionnaire X
6c. Make provision to link two censuses X
6d. Training on RNR census enumeration and supervision
X
6e. Training on RNR Census data processing X
6f. RNR census data processing X X
6g. Census enumeration X
6h. Report on RNR Census X
7 Support to BLSS 2017 7a. Revision of BLSS questionnaire X
7b. Hiring and training of enumerators and supervisors X X
7c. Enumeration and supervision training X X
7d. Conduct of BLSS X
7e. Data processing and reporting (Goes beyond) X X

44
Project / Activity Q1 Q2 Q3 Q4 Q1 Q2 Q3 Q4 Q1 Q2
2015 2015 2015 2015 2016 2016 2016 2016 2017 2017
8 Conduct of Labor Force Survey X X 8a. Training of enumerators X X
8b. Prepare a proposal for data processing training X
8c. Organization of training on data processing X
8d. Process and Publish LFS Report X X X X X X X X X

45
Annex IV: List of participating individuals in the finalization of the Country
Proposal
SN Name Agency
1 Mr. Dawa Zangpo Policy and Planning Division, Ministry of Agriculture & Forests
2 Mr. Tsheten Department of Livestock, Ministry of Agriculture & Forests
3 Mr. Karma Tenzin Information & Communication Services, Ministry of Agriculture & Forests
4 Mr. Tashi Namgay Department of Revenue & Customs, Ministry of Finance
5 Mr. Rinzin Namgay National Environment Commission
6 Mr. Sonam Penjor Policy and Planning Division, Ministry of Agriculture & Forests
7 Mr. Sangay Chophel Policy and Planning Division, Ministry of Agriculture & Forests
8 Dr. Kuenga Namgay Policy and Planning Division, Ministry of Agriculture & Forests
9 Mr. Phub Sangay (Chair) National Statistics Bureau
10 Mr. TN. Acharya Council for RNR Research of Bhutan, Ministry of Agriculture & Forests
11 Mr. Karpo Dukpa Policy and Planning Division, Ministry of Agriculture & Forests
12 Mr. Jamyang Kunzang Department of Agriculture, Ministry of Agriculture & Forests
13 Ms. Namgay Bidha Department of Forests & Park Services, Ministry of Agriculture & Forests
14 Ms. Sangay Choden DAMC, Ministry of Agriculture & Forests
15 Ms. Kuenga Wangmo Policy and Planning Division, Ministry of Agriculture & Forests
16 Mr. Nima P Sherpa Policy and Planning Division, Ministry of Agriculture & Forests
17 Mr. Dawa National Statistics Bureau
18 Mr. Chadho Tenzin FAO Country Office Bhutan
19 Mr. Yagyash Gautam FAO’s International Consultant
20 Mr. Allan Nicholls FAO, Asia-Pacific Region, Bangkok, Thailand

46
Preparation and printing of this Country Proposal is supported by United Nations Food and
Agriculture Organization, Regional Office for Asia- and the Pacific (FAO-RAP), Bangkok,
Thailand.
Contact:
Policy and Planning Division, Ministry of Agriculture and Forests Thimphu, Bhutan Tel: 975 02 323745, Fax: 975 02 323748
Related publication:
In-depth Country Assessment of the National Renewable Natural Resources Statistics in Bhutan (An implementation of Global Strategy to Improve Agricultural and Rural Statistics)
www.countrystat.org/home.aspx?c=BTN.