Embed Size (px)
Citation preview

Trinidad and Tobago
GLOBAL FOREST RESOURCES ASSESSMENT 2015
COUNTRY REPORT
Rome, 2014

FAO, at the request of its member countries, regularly monitors the world´s forests and theirmanagement and uses through the Global Forest Resources Assessment (FRA). This country reportis prepared as a contribution to the FAO publication, the Global Forest Resources Assessment 2015(FRA 2015).The content and the structure are in accordance with the recommendations and guidelines given byFAO in the document Guide for country reporting for FRA 2015 (http://www.fao.org/3/a-au190e.pdf).These reports were submitted to FAO as official government documents.
The content and the views expressed in this report are the responsibility of the entity submitting thereport to FAO. FAO may not be held responsible for the use which may be made of the informationcontained in this report.

FRA 2015 – Country Report, Trinidad and Tobago
3
TABLE OF CONTENTSReport preparation and contact persons...............................................................................................................................41. What is the area of forest and other wooded land and how has it changed over time? ................................................. 52. What is the area of natural and planted forest and how has it changed over time? ..................................................... 183. What are the stocks and growth rates of the forests and how have they changed? .....................................................224. What is the status of forest production and how has it changed over time? .................................................................425. How much forest area is managed for protection of soil and water and ecosystem services? ..................................... 486. How much forest area is protected and designated for the conservation of biodiversity and how has it changed overtime? ................................................................................................................................................................................... 537. What is the area of forest affected by woody invasive species? .................................................................................. 568. How much forest area is damaged each year? ............................................................................................................ 599. What is the forest area with reduced canopy cover? ....................................................................................................6310. What forest policy and regulatory framework exists to support implementation of sustainable forest managementSFM? .................................................................................................................................................................................. 6411. Is there a national platform that promotes stakeholder participation in forest policy development? ............................ 6612. What is the forest area intended to be in permanent forest land use and how has it changed over time? .................. 6713. How does your country measure and report progress towards SFM at the national level? ........................................ 7014. What is the area of forest under a forest management plan and how is this monitored? ........................................... 7215. How are stakeholders involved in the management decision making for publicly owned forests? .............................. 7416. What is the area of forest under an independently verified forest certification scheme? .............................................7517. How much money do governments collect from and spend on forests? .....................................................................7718. Who owns and manages the forests and how has this changed? ..............................................................................7919. How many people are directly employed in forestry? ................................................................................................. 8520. What is the contribution of forestry to Gross Domestic Product (GDP)? .................................................................... 8721. What is forest area likely to be in the future ...............................................................................................................88

FRA 2015 – Country Report, Trinidad and Tobago
4
Report preparation and contact personsContact personsThe present report was prepared by the following person(s)
Name (FAMILYNAME, first name)
Institution/address Email Tables
ROBERTS Carlton Forestry Division LongCircular Road Port of Spain
N/A N/A
N/A N/A N/A N/A
N/A N/A N/A N/A
N/A N/A N/A N/A
Introductory TextPlace an introductory text on the content of this report
Desk Study?
Check "yes" if this survey is a Desk Study, "no" otherwise
Desk Study? no

FRA 2015 – Country Report, Trinidad and Tobago
5
1. What is the area of forest and other wooded land and how has it changed over time?Documents for this question:
• Guide for country reporting FRA 2015• FRA 2015 Terms and Definitions
1.1 Categories and definitions
Category Definition
Forest Land spanning more than 0.5 hectares with trees higher than 5 meters and a canopy cover of more than10 percent or trees able to reach these thresholds in situ. It does not include land that is predominantlyunder agricultural or urban land use.
Other wooded land Land not classified as "Forest" spanning more than 0.5 hectares with trees higher than 5 meters anda canopy cover of 5-10 percent or trees able to reach these thresholds ; or with a combined coverof shrubs bushes and trees above 10 percent. It does not include land that is predominantly underagricultural or urban land use.
Other land All land that is not classified as "Forest" or "Other wooded land".
...of which with tree cover(sub-category)
Land considered as "Other land", that is predominantly agricultural or urban lands use and has patchesof tree cover that span more than 0.5 hectares with a canopy cover of more than 10 percent of trees ableto reach a height of 5 meters at maturity. It includes bothe forest and non-forest tree species.
Inland water bodies Inland water bodies generally include major rivers, lakes and water reservoirs.
Forest expansion Expansion of forest on land that, until then, was not defined as forest.
...of which afforestation(sub-category)
Establishment of forest through planting and/or deliberate seeding on land that, until then, was notdefined as forest.
...of which naturalexpansion of forest (sub-category)
Expansion of forests through natural succession on land that, until then, was under another land use(e.g. forest succession on land previously used for agriculture).
Deforestation The conversion of forest to other land use or the longterm reduction of the tree canopy cover below theminimum 10 percent threshold.
...of which humaninduced (sub-category)
Human induced conversion of forest to other land use or the permanent reduction of the tree canopycover below the minimum 10 percent threshold.
Reforestation Natural regeneration or re-establishment of forest through planting and/or deliberate seeding on landalready in forest land use.
...of which artificialreforestation (sub-category)
Re-establishment of forest through planting and/or deliberate seeding on land already in forest land use.
1.2 National data
1.2.1 Data sources
References to sourcesof information
Variables Years Additional comments

FRA 2015 – Country Report, Trinidad and Tobago
6
1 Forest Resource Inventoryand Management SectionInventory of the indigenousForests of Trinidad andTobago 1980. Government ofTrinidad and Tobago
Forest cover, forest typeclassification, land use/coverchange
1970 Inventory of all public forestsusing Aerial photographyfrom 1969 and ground truthin 1979
2 Internal Records DrawingOffice Forestry Division
Forest cover, 1994 Aerial photography of forestreserves.
3 Internal records ForestryDivision
Areas reforested 1988 to 2007 N/A
4 Internal Records; NationalReforestation and WatershedRehabilitation Programme
Areas reforested 2005,2006,2007 N/A
5 Helmer, E. H., T. S. Ruzycki,J. Benner, S. M. Voggesser,B. P. Scobie, C. Park, D. W.Fanning and S. Ramnarine.2012. Detailed maps oftropical forest types arewithin reach: forest treecommunities for Trinidadand Tobago mapped withmultiseason Landsat andmultiseason fine-resolutionimagery. Forest Ecology andManagement 279, 147-166.
Forest Cover 2012 N/A
1.2.2 Classification and definitions
National class Definition
Evergreen Seasonal forest This is also termed moist forest and is found at slightly higher(100-300 m) or more sheltered locations. It comprises mainlybroad-leaved evergreen trees with some foliage reduction inthe dry season. Imagine the semi-evergreen seasonal forest justdescribed but with scattered, emergent trees like sandbox (Huracrepitans), silk cotton (Ceiba pentandra) and cabbage palm(Roystonea oleracea). Some species in this community are alsofound in rainforest.

FRA 2015 – Country Report, Trinidad and Tobago
7
Semi evergreen seasonal forests < 1/3) may shed their leaves in the dry season, e.g. locust(Hymenaea coubaril). The lower layer is evergreen (e.g. balata -Manilkara bidentata) with the macaw palm (Aiphanes minima)in this layer. A shrub layer with members of the coffee andguava families is present but there are few herbs and epiphytes.The canopy has many woody vines or lianas. " /> This is alsotermed moist forest and is found at slightly higher (100-300 m)or more sheltered locations. This is a two storied forest withan upper closed canopy at 20 m high and a lower tree layer atabout half that height. The upper trees are mainly evergreens likeSpanish oak (Inga laurina) and beefwood (Pisonia fragrans) buta minority (< 1/3) may shed their leaves in the dry season, e.g.locust (Hymenaea coubaril). The lower layer is evergreen (e.g.balata - Manilkara bidentata) with the macaw palm (Aiphanesminima) in this layer. A shrub layer with members of thecoffee and guava families is present but there are few herbs andepiphytes. The canopy has many woody vines or lianas.
Deciduous seasonal forests* This is also termed dry forest and is found in low-lying areas.It has an upper open canopy at 20 m high and a lower closedshrub/tree layer. The upper trees are mainly deciduous, sheddingtheir leaves in the dry season, e.g. Whitewood (Tabebuia spp.)and birchgum (Bursera simaruba). The lower shrubby layer canbe quite dense and includes thorny species like bread 'n cheese(Pithecellobium unguis-cati) and ink berry (Randia aculeata).There are lianas but few if any epiphytes. What remains of thisforest is often heavily impacted.
Dry evergreen forests Is the littoral woodlands. It is situated near the sea exposed tothe sea-blast. Structure varies greatly with exposure an amountof gale damage from low recumbent scrub to high forest or purepalm forest. Trees are evergreen and have thickly cutinizedmesophyllous leaves and windswept crowns which present onlya narrow edge to the wind. Flora is limited.
Seasonal montane forests Sub-tropical temperatures. Evaporation ability of the airhigh on clear days due to exposure. Frequent mist. Abundantprecipitation but available moisture seasonally low due toexcessive soil drainage. A close tree canopy at 60 to 80 ft.somewhat open below. Deciduous trees present. Tremendouslyluxuriant lianas and epiphytes with abundant moss. Denseherbaceous ground layer, rare palms and tree ferns. Trees areoften strongly buttressed.
Montane forests** Includes lower montane rainforest, montante rain forest, Elfinwoodlands.
Secondary Forests Secondary forest is rainforest that has been disturbed in someway, naturally or unnaturally. Secondary forest can be createdin a number of ways, from degraded forest recovering fromselective logging, to areas cleared by slash and burn agriculturethat have been reclaimed by forest. Generally, secondary forestis characterized (depending on its level of degradation) by a lessdeveloped canopy structure, smaller trees, and less diversity.Due to the lack of a full canopy, more light will reach the floor,supporting vigorous ground vegetation.

FRA 2015 – Country Report, Trinidad and Tobago
8
Swamp forests Due to low relief the area is shallowly and more or lessperpetually inundated with fresh water varying from few inchesto 3 ft. deep. A close and even tree canopy about 60 ft withno lower stratification. Trees developed enormous sinous andspreading plank buttresses. 100 per cent evergreen leavescompound, mesophyllous and leathery. Very limited flora.
Bamboo Clumps and stands of pure bamboo stand
Water Dams for water production and open water bodies in the swamps
Abandoned forest plantation Planted forest and abandoned
Mixed conversion forest Degraded lands planted with a mixture of forest species
Teak and pine plantations Pure stands of teak plantations and pure stands of pineplantations
Other plantations Plantation of other local species
1.2.3 Original data
Note to 1.2.2
* Tropical dry forests in Trinidad and Tobago include both deciduous and semi-evergreen forests. A recentwork by Howard Nelson suggests that areas which were formerly classified as evergreen forest also fit thecriteria for dry forests.
In contrast to the moist forest ecoregion on Trinidad and Tobago,dry forest ecoregion is characterized by muchmore open forest, owing to the lack of a proper canopy. There is a greater proportion of deciduous trees andfewer large trees. Mosses and epiphytes are not common owing to the greatly reduced rainfall. Prominent treesin this area include Lonchocarpus punctatus , Bursera simaruba , Machaerium robinifolium and Pithecellobiumunguiscati . Along the coast several species of cactus and the century plant ( Agave evadens ) are common.In the foothills of the Northern Range, especially the area north and east of Port of Spain, Cordia alliodorabecomes common in the semi-deciduous forest. A small portion of this ecoregion also is found on the northerntip of Tobago. Here the canopy is at about 15 m and dominant trees include Bursera simaruba, Lonchocarpusdomingensis, Coccothrinax australis . Though many of the dominant species are deciduous, the understory ismostly evergreen with Eugenia spp. and Mayepea caribaea prominent.
** Lower montane forest: subtropical temperatures. No season drought. Available moisture more or less evenlydistributed throughout the year and over 70 inches. Freedom from water logging and inundations. Exposurecauses variations form true rainforest type. Canopy is lowered to between 70 and 100 ft. but is close at thislevel. No readily definable lower stratification. Dominants have long thin and clear boles. Lianas epiphytespoorly developed. Palms very rare. Ferns abundant but only small tree ferns. 100 percent evergreen. Leavessimple, mesophyllous, shiny and slightly leathery. Ground vegetation extremely sparse.
Montane rain forest: Canopy at 60 ft. much wind damage. Lowered stratum 20 40 ft and under storey of freeferns and small palms Lianas very abundant. Epiphytes tremendously luxuriant. Only small stemmed palms butabundant and several species of large tree-fern. 100 percent evergreen leaves simple, mesophyllous, leatherywith epiphyllous. Dense herbaceous ground vegetation. Tree flora extremely poor.

FRA 2015 – Country Report, Trinidad and Tobago
9
Elfin woodland: Stunted gnarled thicket 15-25 ft. in height of stilt rooted, fleshy leaved trees with longstraggling branches, festooned with moss and lichen. Canopy formed at 6-10 ft. under story of trees-ferns andsmall palms. Flora extremely limited.
_______________________________________________________________________________
Forest area
National classes 1970
ha a
1994
ha b
Forests land use
Evergreen Seasonal Forest 98180 88718
Semi-evergreen seasonal forest 13928 12586
Deciduous Seasonal Forests 3617 3268
Dry evergreen forests 495 447
Seasonal montane forests 926 837
Montane forests 21619 19535
Swamp forests 16789 15171
Secondary forests 22650 20467
Teak and pine plantations 16308 15000
Other plantations 5306 5306
Bamboo 528 528
Water 1613 1613
Other areas within forests 53729 72212
Total forest land owned bystate
255688 255688
Total Private forests 56000 56000
Private lands 201312 201312
Total land area 513000 513000

FRA 2015 – Country Report, Trinidad and Tobago
10
Forest expansion, reforestation
Table - Annual establishment of plantations on lands belonging to the state and on private lands from 1990to 2007.
state lands (ha) private lands(ha)
year teak pine other NRWRP 1 otherplantations
plantations plantations plantations
1990 54.5 200 50
1991 52 220 95
1992 54.5 65 68.8
1993 5 21 65
1994 16 32 58
1995 9 30.4 44.5
1996 20 77.4 70.2
1997 12 55 71.4
1998 28 115 110 692.5
1999 7 108 101.5 713
2000 4 125 138 138
2001 7 67.5 50.2 109
2002 7 39 124.5 209
2003 20 42.5 79.5 317
2004 6 48 111 301
2005 18 35 137 658 476

FRA 2015 – Country Report, Trinidad and Tobago
11
2006 18 60 124 617 626
2007 18 39.3 115 447 326
1 NRWRP is the National Reforestation and Watershed Rehabilitation Programme
1.3 Analysis and processing of national data
1.3.1 Adjustment
Water area was calibrated to UN statistics and added to the of other land class.
1.3.2 Estimation and forecasting
Forest area
The assumption of a rate of loss of forest cover for all forest types was made on the rate of loss of forest fromforest reserves. This rate was applied to all forested lands in Reserves and other lands owned by the state exceptfor lands under teak, pine, other plantations, water, and bamboo which are assumed as constant. Attempts arebeing made to collect data on loss of forest cover from all other land agencies but due to the steep deadlinethis approach is being used. This is shown under estimation and forecasting. All lands lost from forests areplaced under other areas within forests.
Nationalclasses
1970
ha a
1994
ha b
1990¹
ha c
2000¹
ha d
2005¹
ha e
2010
EvergreenSeasonalForest
98180 88718 90295 86352 84381 82410
FRA 2015 – Country Report, Trinidad and Tobago
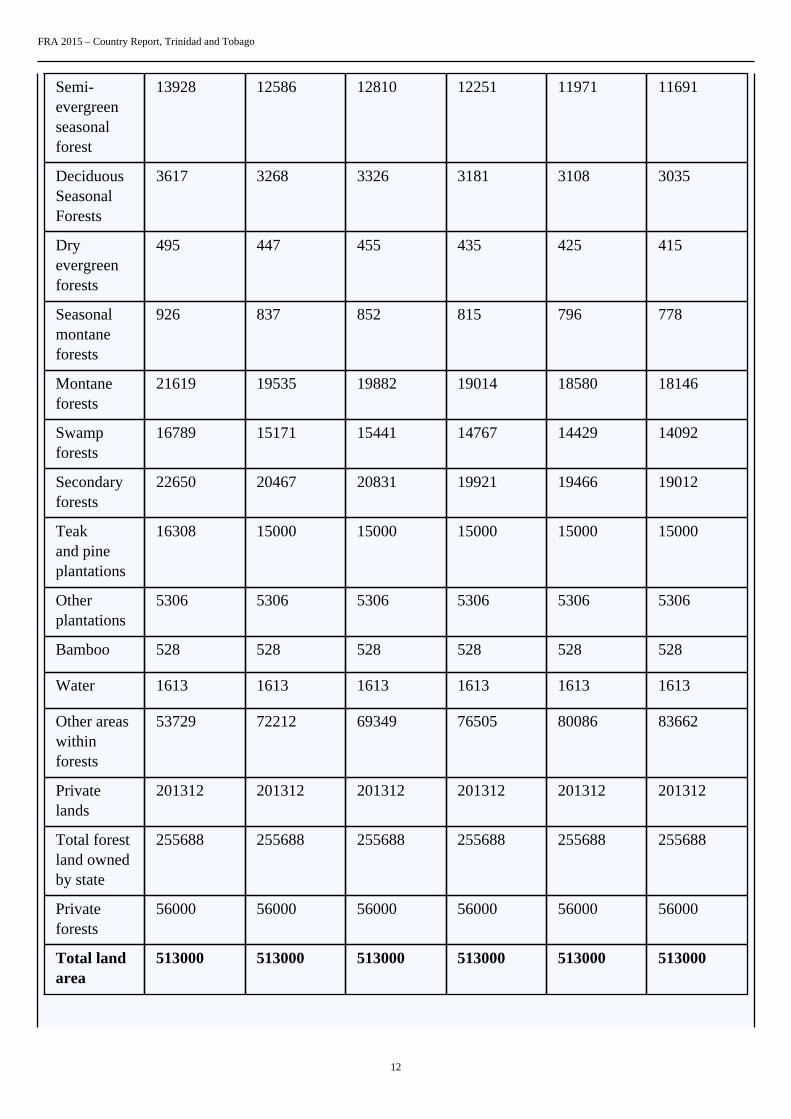
12
Semi-evergreenseasonalforest
13928 12586 12810 12251 11971 11691
DeciduousSeasonalForests
3617 3268 3326 3181 3108 3035
Dryevergreenforests
495 447 455 435 425 415
Seasonalmontaneforests
926 837 852 815 796 778
Montaneforests
21619 19535 19882 19014 18580 18146
Swampforests
16789 15171 15441 14767 14429 14092
Secondaryforests
22650 20467 20831 19921 19466 19012
Teakand pineplantations
16308 15000 15000 15000 15000 15000
Otherplantations
5306 5306 5306 5306 5306 5306
Bamboo 528 528 528 528 528 528
Water 1613 1613 1613 1613 1613 1613
Other areaswithinforests
53729 72212 69349 76505 80086 83662
Privatelands
201312 201312 201312 201312 201312 201312
Total forestland ownedby state
255688 255688 255688 255688 255688 255688
Privateforests
56000 56000 56000 56000 56000 56000
Total landarea
513000 513000 513000 513000 513000 513000

FRA 2015 – Country Report, Trinidad and Tobago
13
ha a = original data for year 1970
ha b = estimated data for year 1994
ha c = ha b + (ha a -ha b )/24*4
ha d = (ha b - (ha a -ha b )/24 *6)
ha e = (ha b - (ha a -ha b )/24 * 11)
ha f = (ha b - (ha a -ha b )/24 * 16)
Forest expansion, reforestation
Table - Annual establishment of plantations on lands belonging to the state and on private lands from 1990 to2007 along with 5 year averages.
state lands private lands
year teak pine Other NRWRP otherplantations
plantations plantations plantations
1990 54.5 200 50
1991 52 220 95
1992 54.5 65 68.8
Average(1990 to 1992
54 162 71 NIL
1993 5 21 65
1994 16 32 58
1995 9 30.4 44.5
1996 20 77.4 70.2
1997 12 55 71.4
Average(1993 to1997)
NIL

FRA 2015 – Country Report, Trinidad and Tobago
14
1998 28 115 110 692.5
1999 7 108 101.5 713
2000 4 125 138 138
2001 7 67.5 50.2 109
2002 7 39 124.5 209
Average(1998 to2002)
11 91 105 372
2003 20 42.5 79.5 317
2004 6 48 111 301
2005 18 35 137 658 476
2006 18 60 124 617 626
2007 18 39.3 115 447 326
Average(2003 to2007)
16 45 113.3 344 409
1.3.3 Reclassification
Forest area
Forest other woodedland
other land other landwith trees
inland water
EvergreenSeasonalForest
100%
Semi-evergreenseasonal forest
100%
DeciduousSeasonalForests
100%

FRA 2015 – Country Report, Trinidad and Tobago
15
Dry evergreenforests
100%
Seasonalmontaneforests
100%
Montaneforests
100%
Swamp forests 100%
Secondaryforests
100%
Teak and pineplantations
100%
Otherplantations
100 %
Bamboo 100%
Water 100%
Other areaswithin forests
100%
Private lands 81.7 18.3
Private forests 100%
Forest expansion, reforestation
Reforestation for 1990=sum of (teak, pine and other plantations)
That Equals (54+72+162)= 287
Similarly for 2000 reforestation =(11+91+105+372) equals 579
Similarly for 2005 reforestation= (16+45+113+344+409) that is 909.
The average for lands established by NRWRP is 574 for 3 years so for 5 years the average would be 344.
Plantations of teak and pine are introduced species but the plantations of other species are considered indigenous. The teak plantations are established in existing degraded forests while the pine plantations and plantations ofother species are established on areas which were recently harvested.
1.4 DataTable 1a

FRA 2015 – Country Report, Trinidad and Tobago
16
Area (000 hectares)Categories
1990 2000 2005 2010 2015
Forest 240.7 233.6 230 226.4 234.476
Other wooded land 69.3 76.5 80.1 83.7 128.714
Other land 203 202.9 202.9 202.9 149.81
... of which with tree cover 37 37 37 37 50
Inland water bodies 0 0 0 0 0
TOTAL 513.00 513.00 513.00 513.00 513.00
Table 1bAnnual forest establishment /loss (000 hectares per year)
...of which of introducedspecies (000 hectares per year)
Categories
1990 2000 2005 2010 1990 2000 2005 2010
Forest expansion N/A N/A N/A N/A N/A N/A N/A N/A
... of which afforestation 0 0 0 N/A 0 0 0 0
... of which natural
expansion of forest
0 0 0 N/A 0 0 0 N/A
Deforestation N/A N/A N/A N/A N/A N/A N/A N/A
... of which human induced N/A N/A N/A N/A N/A N/A N/A N/A
Reforestation 0.287 0.579 0.909 N/A 0.216 0.102 0.06 1
... of which artificial 0.287 0.579 0.909 N/A 0.216 0.102 0.06 1
Tiers
Category Tier for status Tier for reported trend
Forest Tier 3 Tier 2
Other wooded land Tier 3 Tier 2
Forest expansion Tier 3 Tier 2
Deforestation N/A N/A
Reforestation Tier 3 Tier 2
Tier criteria

FRA 2015 – Country Report, Trinidad and Tobago
17
Category Tier for status Tier for reported trend
• Forest• Other wooded land• Afforestation• Reforestation• Natural expansion of forest• Deforestation
Tier 3 : Data sources: Either recent(less than 10 years ago) National ForestInventory or remote sensing, with groundtruthing, or programme for repeatedcompatible NFIs Tier 2 : Data sources:Full cover mapping / remote sensing orold NFI (more than 10 years ago) Tier 1 :Other
Tier 3 : Estimate based on repeatedcompatible tiers 3 (tier for status) Tier 2 :Estimate based on repeated compatible tier2 or combination tier 3 and 2 or 1 (tier forstatus) Tier 1 : Other
1.5 Comments
CategoryComments related todata definitions etc
Comments on the reported trends
Forest The figures are different to FRA 2010because other plantations area was addedto forests, and new information madeavailable.
N/A
Other wooded land N/A N/A
Other land N/A N/A
Other land with tree cover Refers to abandoned cocoa , coffee andcoconut plantations
N/A
Inland water bodies The pass reports did not include thecountry water reservoirs.
N/A
Forest expansion N/A N/A
Deforestation N/A N/A
Reforestation N/A N/A
Other general comments to the table
N/A

FRA 2015 – Country Report, Trinidad and Tobago
18
2. What is the area of natural and planted forest and how has it changed over time?Documents for this question:
• Guide for country reporting FRA 2015• FRA 2015 Terms and Definitions
2.1 Categories and definitions
Term Definition
Naturally regeneratedforest
Forest predominantly composed of trees established through natural regeneration.
Naturalized introducedspecies
Other naturally regenerated forest where the tree species are predominantly non-native and do not needhuman help to reproduce/maintain populations over time.
Introduced species A species, subspecies or lower taxon occurring outside its natural range (past or present) and dispersalpotential (i.e. outside the range it occupies naturally or could occupy without direct or indirectintroduction or care by humans).
Category Definition
Primary forest Naturally regenerated forest of native species where there are no clearly visible indications of humanactivities and the ecological processes are not significantly disturbed.
Other naturallyregenerated forest
Naturally regenerated forest where there are clearly visible indications of human activities.
...of which of introducedspecies (sub-category)
Other naturally regenerated forest where the trees are predominantly of introduced species.
...of which naturalized(sub-sub category)
Other naturally regenerated forest where the trees are predominantly of naturalized introduced species.
Planted forest Forest predominantly composed of trees established through planting and/or deliberate seeding.
...of which of introducedspecies (sub-category)
Planted forest where the planted/seeded trees are predominantly of introduced species.
Mangroves Area of forest and other wooded land with mangrove vegetation.
...of which planted (sub-category)
Mangroves predominantly composed of trees established through planting.
2.2 National data
2.2.1 Data sources
References to sourcesof information
Variables Years Additional comments
1 Internal Documents DrawingOffice Forestry Division
Productive Forest andprotective forests
1990 Area determined byplanimeter based on a scaleof 1:150000 map.
2 N/A N/A N/A N/A
3 N/A N/A N/A N/A

FRA 2015 – Country Report, Trinidad and Tobago
19
4 N/A N/A N/A N/A
2.2.2 Classification and definitions
National class Definition
N/A N/A
N/A N/A
N/A N/A
N/A N/A
2.2.3 Original data
See table 1.3.2 and the following table:
National data 1990
Area(ha)
FRA classification
Watersheds 8334 Protection of soil and water
Nature reserves 458 Conservation of biologicaldiversity
Wildlife Sanctuaries 19004 Conservation of biologicaldiversity
National Parks 5002 Social Services
Production forests 75,875 Production
Protective forests 42,986 Protection of soil and water
Total reserve and unproclaimedreserve
143,324.7
2.3 Analysis and processing of national data
2.3.1 Adjustment

FRA 2015 – Country Report, Trinidad and Tobago
20
2.3.2 Estimation and forecasting
2.3.3 Reclassification
Primary forests are considered to be all forests (42,986 ha) above the 152m contour along with the wildlifeSanctuaries (19004 ha) and nature reserves (458 ha) which equals 62,448 ha.
2.4 DataTable 2a
Forest area (000 hectares)Categories
1990 2000 2005 2010 2015
Primary forest 62.4 62.4 62.4 62.4 62.4
Other naturally regeneratedforest
163.3 155.2 150.6 146 160.831
... of which of introducedspecies
0 0 0 0 0
... of which naturalized N/A N/A N/A N/A N/A
Planted forest 15 16 17 18 11.244
... of which of introducedspecies
15 16 17 18 11.244
TOTAL 240.70 233.60 230.00 226.40 234.48
Table 2b
Primary forest converted to (000 ha)
1990-2000 2000-2010 2010-2015
Othernatural
regenerationPlanted Other land
Othernatural
regenerationPlanted Other land
Othernatural
regenerationPlanted Other land
N/A N/A N/A N/A N/A N/A N/A N/A N/A
Table 2c
Area (000 hectares)Categories
1990 2000 2005 2010 2015
Mangroves (forest and OWL) 5.372 5.372 5.372 5.372 7.492

FRA 2015 – Country Report, Trinidad and Tobago
21
... of which planted N/A N/A N/A N/A N/A
Tiers
Category Tier for status Tier for reported trend
Primary forest Tier 3 Tier 2
Other naturally regenerated forest Tier 3 Tier 2
Planted forest Tier 3 Tier 2
Mangroves Tier 3 Tier 2
Tier Criteria
Category Tier for status Tier for reported trend
Primary forest/Other naturally regeneratedforest/Planted forest
Tier 3 : Data sources: Recent (less than10 years) National Forest Inventory orremote sensing with ground truthing ordata provided by official agencies orprogramme for repeated compatible NFIsTier 2 : Data sources: Full cover mapping/remote sensing or old NFI (more than 10years) Tier 1 : Other
Tier 3 : Estimate based on repeatedcompatible tiers 3 (tier for status) Tier 2 :Estimate based on repeated compatible tier2 or combination tier 3 and 2 or 1 (tier forstatus) Tier 1 : Other
2.5 Comments
CategoryComments related todata definitions etc
Comments on reported trend
Primary forest Consists of the Wildlife Sanctuaries(19004 ha) and all protective forestswithin the forest reserves (42,982ha) andthe nature reserves.
No reduction in area has been assumedover the periods since these are totallyprotected
Other naturally regenerating forest N/A N/A
Planted forest N/A The amount of planted forest is increasing
Mangroves N/A N/A
Other general comments to the table
N/A

FRA 2015 – Country Report, Trinidad and Tobago
22
3. What are the stocks and growth rates of the forests and how have they changed?Documents for this question:
• Guide for country reporting FRA 2015• FRA 2015 Terms and Definitions
3.1 Categories and definitions
Category Definition
Growing stock Volume over bark of all living trees with a minimum diameter of 10 cm at breast height (or abovebuttress if these are higher). Includes the stem from ground level up to a top diameter of 0 cm,excluding branches.
Net Annual Increment(NAI)
Average annual volume of gross increment over the given reference period less that of natural losses onall trees, measured to minimum diameters as defined for "Growing stock".
Above-ground biomass All living biomass above the soil including stem stump branches bark seeds and foliage.
Below-ground biomass All biomass of live roots. Fine roots of less than 2 mm diameter are excluded because these often cannotbe distinguished empirically from soil organic matter or litter.
Dead wood All non-living woody biomass not contained in the litter either standing lying on the ground or in thesoil. Dead wood includes wood lying on the surface dead roots and stumps larger than or equal to 10 cmin diameter or any other diameter used by the country.
Carbon in above-groundbiomass
Carbon in all living biomass above the soil including stem stump branches bark seeds and foliage.
Carbon in below-groundbiomass
Carbon in all biomass of live roots. Fine roots of less than 2 mm diameter are excluded because theseoften cannot be distinguished empirically from soil organic matter or litter.
Carbon in dead wood Carbon in all non-living woody biomass not contained in the litter, either standing, lying on the ground,or in the soil. Dead wood includes wood lying on the surface, dead roots and stumps larger than or equalto 10 cm in diameter or any other diameter used by the country.
Carbon in litter Carbon in all non-living biomass with a diameter less than the minimum diameter for dead wood (e.g.10 cm ) lying dead in various states of decomposition above the mineral or organic soil.
Soil carbon Organic carbon in mineral and organic soils (including peat) to a soil depth of 30 cm.
3.2 National data
3.2.1 Data sources
References to sourcesof information
Variables Years Additional comments
1 Forest Resource Inventoryand Management SectionInventory of the indigenousForests of Trinidad andTobago 1980. Government ofTrinidad and Tobago
Biomass Volume 1980 N/A
2 N/A N/A N/A N/A
3 N/A N/A N/A N/A

FRA 2015 – Country Report, Trinidad and Tobago
23
4 N/A N/A N/A N/A
3.2.2 Classification and definitions
National class Definition
N/A N/A
N/A N/A
N/A N/A
N/A N/A
3.2.3 Original data
National classes Vol/ha
Evergreen Seasonal Forest 131.68
Semi-evergreen seasonal forest 98.73
Deciduous Seasonal Forests 73.44
Dry evergreen forests 98.73
Seasonal montane forests 142.41
Montane forests 142.41
Swamp forests 58.32
Secondary forests 82.45
Teak plantations See below
Pine Plantations See below
Other plantations 60
Bamboo 20
Water NIL
Other areas within forests 18.82

FRA 2015 – Country Report, Trinidad and Tobago
24
Private forests 50
Table. Average volume per ha for teak plantations from local data
Age Volume
Per ha
5 28.21
10 72.28
15 122.44
20 163.8
25 192.75
30 235.3
35 262.38
40 285.93
45 303.23
50 320.5
>50 328.84
Table. Average volume per ha for pine plantations from local data.
Age Volume per ha
5 54.3
10 108.64
15 197.14
FRA 2015 – Country Report, Trinidad and Tobago
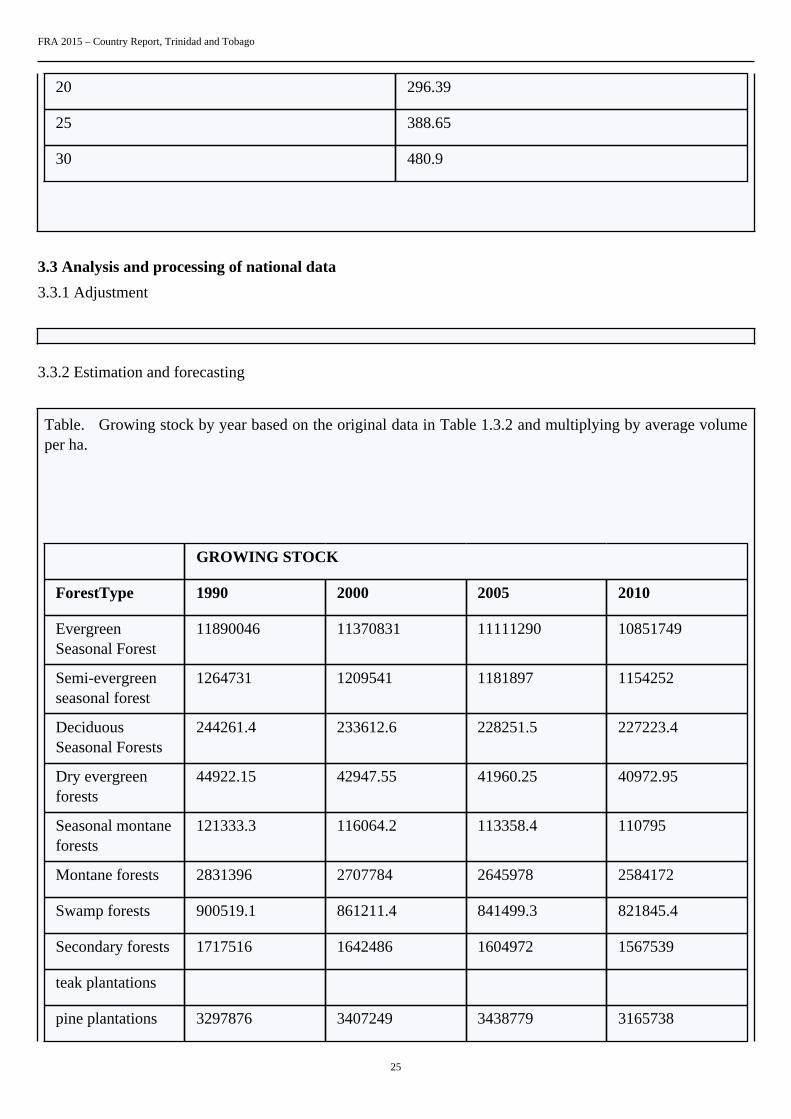
25
20 296.39
25 388.65
30 480.9
3.3 Analysis and processing of national data
3.3.1 Adjustment
3.3.2 Estimation and forecasting
Table. Growing stock by year based on the original data in Table 1.3.2 and multiplying by average volumeper ha.
GROWING STOCK
ForestType 1990 2000 2005 2010
EvergreenSeasonal Forest
11890046 11370831 11111290 10851749
Semi-evergreenseasonal forest
1264731 1209541 1181897 1154252
DeciduousSeasonal Forests
244261.4 233612.6 228251.5 227223.4
Dry evergreenforests
44922.15 42947.55 41960.25 40972.95
Seasonal montaneforests
121333.3 116064.2 113358.4 110795
Montane forests 2831396 2707784 2645978 2584172
Swamp forests 900519.1 861211.4 841499.3 821845.4
Secondary forests 1717516 1642486 1604972 1567539
teak plantations
pine plantations 3297876 3407249 3438779 3165738

FRA 2015 – Country Report, Trinidad and Tobago
26
Other plantations 318360 318360 318360 318360
Bamboo 10560 10560 10560 10560
Water NIL NIL NIL NIL
Other areas withinforests (OWL)
1305148 1439862 1488380 1574519
Private lands
Total forest landowned by state
Private forests 2800000 2800000 2800000 2800000
total growingstock
26746669 26160509 25825285 25227726
Biomass:
Table . Above Ground Biomass
Natonal Class BCEF 1 ABOVE GROUND BIOMASS
1990 2000 2005 2010
EvergreenSeasonalForest
1.3 15457059 14782081 14444677 14107273
Semi-evergreenseasonal forest
1.5 1897097 1814312 1772845 1731379
DeciduousSeasonalForests
1.7 415244.4 397141.5 388027.6 386279.7
Dry evergreenforests
1.5 67383.23 64421.33 62940.38 61459.43
Seasonalmontaneforests
1.3 157733.3 150883.4 147365.9 144033.5
Montaneforests
1.3 3680814 3520119 3439771 3359423

FRA 2015 – Country Report, Trinidad and Tobago
27
Swamp forests 2.05 1846064 1765483 1725074 1684783
Secondaryforests
1.5 2576274 2463730 2407458 2351309
Teak and pineplantations
3132982 3236887 3266840 3007451
Otherplantations
2.05 652638 652638 652638 652638
Bamboo 4 42240 42240 42240 42240
Water
Other areaswithin forests(OWL)
4 5220593 5759447 5953519 6298075
Private lands
Total forestland owned bystate
Private forests 2.05 5740000 5740000 5740000 5740000
total abovegroundbiomass
40886123 40389382 40043395 39566345
1 BCEF:FAO Guidelines for Country Reporting to FRA 2010, Appendix5, Table 5.4
Table . Below Ground Biomass in tonnes
All forests within Trinidad was assumed to be Tropical moist with the R either being 0.20 or 0.24 based onbiomass values.
Ratio (R) BELOW GROUND BIOMASS
1990 2000 2005 2010
EvergreenSeasonalForest
0.24 3709694 3547699 3466723 3385746

FRA 2015 – Country Report, Trinidad and Tobago
28
Semi-evergreenseasonal forest
0.2 379419.4 362862.4 354569 380903.3
DeciduousSeasonalForests
0.2 83048.89 79428.3 77605.52 77255.94
Dry evergreenforests
0.2 13476.65 12884.27 12588.08 12291.89
Seasonalmontaneforests
0.24 37856 36212.01 35367.81 34568.03
Montaneforests
0.24 883395.4 844828.5 825545.1 806261.6
Swamp forests 0.2 369212.8 353096.7 345014.7 336956.6
Secondaryforests
0.2 515254.8 492745.9 481491.5 470261.8
teakplantations
pineplantations
0.24 751915.7 776852.8 784041.6 721788.3
Otherplantations
0.2 130527.6 130527.6 130527.6 130527.6
Bamboo 0.2 8448 8448 8448 8448
Water
Other areaswithin forests OWL)
0.2 1044119 1151889 1190704 1259615
Private lands
Total forestland owned bystate
Private forests 0.2 1148000 1148000 1148000 1148000
total belowgroundbiomass
9074368 8945475 8860625 8772624

FRA 2015 – Country Report, Trinidad and Tobago
29
1 Ratio of above ground to below ground biomass (R ): FAO Guidelines for Country Reporting to FRA 2010,Appendix 5, Table 5.3.
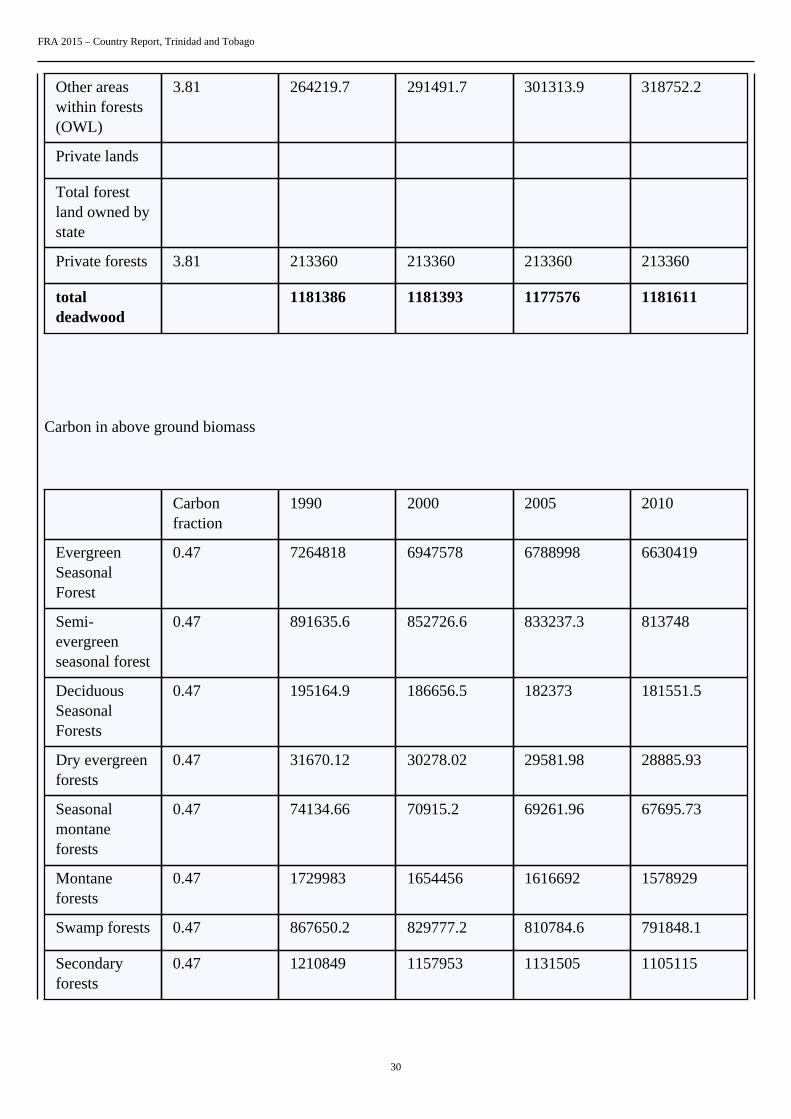
Biomass of deadwood
tonne/ha DEAD WOOD
1990 2000 2005 2010
EvergreenSeasonalForest
3.81 344024 329001.1 321491.6 313982.1
Semi-evergreenseasonal forest
3.81 48806.1 46676.31 45609.51 44542.71
DeciduousSeasonalForests
3.81 12672.06 12119.61 11841.48 11788.14
Dry evergreenforests
3.81 1733.55 1657.35 1619.25 1581.15
Seasonalmontaneforests
3.81 3246.12 3105.15 3032.76 2964.18
Montaneforests
3.81 75750.42 72443.34 70789.8 69136.26
Swamp forests 3.81 58830.21 56262.27 54974.49 53690.52
Secondaryforests
3.81 79366.11 75899.01 74165.46 72435.72
teakplantations
36195 36195 36195 36195
pineplantations
20955 20955 20955 20955
Otherplantations
3.81 20215.86 20215.86 20215.86 20215.86
Bamboo 3.81 2011.68 2011.68 2011.68 2011.68
Water
FRA 2015 – Country Report, Trinidad and Tobago
30
Other areaswithin forests(OWL)
3.81 264219.7 291491.7 301313.9 318752.2
Private lands
Total forestland owned bystate
Private forests 3.81 213360 213360 213360 213360
totaldeadwood
1181386 1181393 1177576 1181611
Carbon in above ground biomass
Carbonfraction
1990 2000 2005 2010
EvergreenSeasonalForest
0.47 7264818 6947578 6788998 6630419
Semi-evergreenseasonal forest
0.47 891635.6 852726.6 833237.3 813748
DeciduousSeasonalForests
0.47 195164.9 186656.5 182373 181551.5
Dry evergreenforests
0.47 31670.12 30278.02 29581.98 28885.93
Seasonalmontaneforests
0.47 74134.66 70915.2 69261.96 67695.73
Montaneforests
0.47 1729983 1654456 1616692 1578929
Swamp forests 0.47 867650.2 829777.2 810784.6 791848.1
Secondaryforests
0.47 1210849 1157953 1131505 1105115

FRA 2015 – Country Report, Trinidad and Tobago
31
teakplantations
0.47
pineplantations
0.47 1472502 1521337 1535415 1413502
Otherplantations
0.47 306739.9 306739.9 306739.9 306739.9
Bamboo 0.47 19852.8 19852.8 19852.8 19852.8
Water
Other areaswithin forests(OWL)
0.47 2453679 2706940 2798154 2960095
Private lands
Total forestland owned bystate
Private forests 0.47 2697800 2697800 2697800 2697800
total carbonin above-groundbiomass
19216478 18983010 18820396 18596182
Below ground biomass
carbonfraction
1990 2000 2005 1010
EvergreenSeasonalForest
0.47 1743556 1667419 1629360 1591300
Semi-evergreenseasonal forest
0.47 178327.1 170545.3 166647.5 179024.6
DeciduousSeasonalForests
0.47 39032.98 37331.3 36474.59 36310.29

FRA 2015 – Country Report, Trinidad and Tobago
32
Dry evergreenforests
0.47 6334.023 6055.605 5916.395 5777.186
Seasonalmontaneforests
0.47 17792.32 17019.65 16622.87 16246.98
Montaneforests
0.47 415195.9 397069.4 388006.2 378943
Swamp forests 0.47 173530 165955.4 162156.9 158369.6
Secondaryforests
0.47 242169.7 231590.6 226301 221023.1
teakplantations
pineplantations
0.47 353400.4 365120.8 368499.6 339240.5
Otherplantations
0.47 61347.97 61347.97 61347.97 61347.97
Bamboo 0.47 3970.56 3970.56 3970.56 3970.56
Water 0.47
Other areaswithin forests(OWL)
0.47 490735.7 541388 559630.8 592019.1
Private lands 0.47
Total forestland owned bystate
0.47
Private forests 0.47 539560 539560 539560 539560
total carbonin below-groundbiomass
0.47 4264953 4204373 4164494 4123133
Carbon in deadwood
Carbonfraction
1990 2000 2005 2010

FRA 2015 – Country Report, Trinidad and Tobago
33
EvergreenSeasonalForest
0.47 161691.3 154630.5 151101.1 147571.6
Semi-evergreenseasonal forest
0.47 22938.87 21937.87 21436.47 20935.07
DeciduousSeasonalForests
0.47 5955.868 5696.217 5565.496 5540.426
Dry evergreenforests
0.47 814.7685 778.9545 761.0475 743.1405
Seasonalmontaneforests
0.47 1525.676 1459.421 1425.397 1393.165
Montaneforests
0.47 35602.7 34048.37 33271.21 32494.04
Swamp forests 0.47 27650.2 26443.27 25838.01 25234.54
Secondaryforests
0.47 37302.07 35672.53 34857.77 34044.79
teakplantations
0.47 17011.65 17011.65 17011.65 17011.65
pineplantations
0.47 9848.85 9848.85 9848.85 9848.85
Otherplantations
0.47 9501.454 9501.454 9501.454 9501.454
Bamboo 0.47 945.4896 945.4896 945.4896 945.4896
Water
Other areaswithin forests(OWL)
0.47 124183.3 137001.1 141617.5 149813.5
Private lands
Total forestland owned bystate
Private forests 0.47 100279.2 100279.2 100279.2 100279.2
total carbonin deadwood
0.47 555251.3 555254.9 553460.6 555357

FRA 2015 – Country Report, Trinidad and Tobago
34
Carbon in litter
Default values 1990 2000 2005 2010
EvergreenSeasonalForest
2.1 189619.5 181339.2 177200.1 173061
Semi-evergreenseasonal forest
2.1 26901 25727.1 25139.1 24551.1
DeciduousSeasonalForests
2.1 6984.6 6680.1 6526.8 6497.4
Dry evergreenforests
2.1 955.5 913.5 892.5 871.5
Seasonalmontaneforests
2.1 1789.2 1711.5 1671.6 1633.8
Montaneforests
2.1 41752.2 39929.4 39018 38106.6
Swamp forests 2.1 32426.1 31010.7 30300.9 29593.2
Secondaryforests
2.1 43745.1 41834.1 40878.6 39925.2
teakplantations
2.1 19950 19950 19950 19950
pineplantations
5.2 28600 28600 28600 28600
Otherplantations
2.1 11142.6 11142.6 11142.6 11142.6
Bamboo 2.1 1108.8 1108.8 1108.8 1108.8
Water
Other areaswithin forests(OWL)
2.1 145632.9 160664.7 166078.5 175690.2
Private lands

FRA 2015 – Country Report, Trinidad and Tobago
35
Total forestland owned bystate
Private forests 2.1 117600 117600 117600 117600
total carbonin litter
668207.5 668211.7 666107.5 668331.4
Soil Carbon
Default value 1990 2000 2005 2010
EvergreenSeasonalForest
47 4243865 4058544 3965907 3873270
Semi-evergreenseasonal forest
47 602070 575797 562637 549477
DeciduousSeasonalForests
47 156322 149507 146076 145418
Dry evergreenforests
47 21385 20445 19975 19505
Seasonalmontaneforests
63 53676 51345 50148 49014
Montaneforests
63 1252566 1197882 1170540 1143198
Swamp forests 86 1327926 1269962 1240894 1211912
Secondaryforests
47 979057 936287 914902 893564
teakplantations
47 446500 446500 446500 446500
pineplantations
47 258500 258500 258500 258500
Otherplantations
47 249382 249382 249382 249382
Bamboo 47 24816 24816 24816 24816

FRA 2015 – Country Report, Trinidad and Tobago
36
Water 0 0 0 0
Other areaswithin forests(OWL)
47 3259403 3595829 3716995 3932114
Private lands 0 0 0 0
Total forestland owned bystate
0 0 0 0
Private forests 47 2632000 2632000 2632000 2632000
total soilcarbon
15507468 15466796 15399272 15428670
Source: FAO Guidelines for Country Reporting to FRA 2010, Appendix 5, Table 5.10.
3.3.3 Reclassification
3.4 DataTable 3a
Growing stock volume (million m 3 over bark)
Forest Other wooded landCategory
1990 2000 2005 2010 2015 1990 2000 2005 2010 2015
Totalgrowingstock
25.44 24.72 24.34 23.66 N/A 1.31 1.44 1.49 1.57 N/A
... ofwhichconiferous
1.27 1.24 1.28 1.09 N/A 0 0 0 0 N/A
... ofwhichbroadleaved
24.17 23.48 23.06 22.57 N/A 1.31 1.44 1.49 1.57 N/A
Table 3b
Category/Species name Growing stock in forest (million cubic meters)
Rank Scientific name Common name 1990 2000 2005 2010
1 st Mora excelsor Mora 3.469 3.317 3.241 N/A

FRA 2015 – Country Report, Trinidad and Tobago
37
2 nd Tectona grandis Teak 2.028 2.167 2.16 N/A
3 rd Pinus caribaea Caribbean Pine 1.27 1.24 1.279 N/A
4 th Spondiasmombin
Hogplum 1.118 1.069 1.045 N/A
5 th Pentaclethramacroloba
Fineleaf 0.958 0.916 0.895 N/A
6 th Sterculiacaribaea
Mahoe 0.923 0.993 0.863 N/A
7 th Carapaguianensis
Crappo 0.853 0.916 0.798 N/A
8 th Eschweilerasubglandulosa
Guatecare 0.836 0.799 0.781 N/A
9 th Pachira insignisWild
Chataigne 0.789 0.755 0.737 N/A
10 th Bucida buceras Bois gris 0.508 0.486 0.475 N/A
Remaining 12.69 12.06 12.07 0.486
TOTAL 25.44 24.72 24.34 .49
THE PRE-FILLED VALUES FOR GROWING STOCK REFER TO THE FOLLOWINGTHRESHOLD VALUES (SEE TABLE BELOW)
Item Value Complementary information
Minimum diameter (cm) at breast heightof trees included in growing stock (X)
20 N/A
Minimum diameter (cm) at the top end ofstem for calculation of growing stock (Y)
Crown point or 10 cm . for teak and pine7.3 cm
N/A
Minimum diameter (cm) of branchesincluded in growing stock (W)
Natural forests no branches Teak and pine plantation branchesincluded
Volume refers to above ground (AG) orabove stump (AS)
AG N/A
PLEASE NOTE THAT THE DEFINITION OF GROWING STOCK HAS CHANGED AND SHOULDBE REPORTED AS GROWING STOCK DBH 10 CM INCLUDING THE STEM FROM GROUNDLEVEL UP TO A DIAMETER OF 0 CM, EXCLUDING BRANCHES.
Table 3c
Net annual increment (m 3 per hectare and year)
ForestCategory
1990 2000 2005 2010 2015
Net annualincrement
N/A N/A N/A N/A N/A

FRA 2015 – Country Report, Trinidad and Tobago
38
... of whichconiferous
N/A N/A N/A N/A N/A
... of whichbroadleaved
N/A N/A N/A N/A N/A
Table 3d
Biomass (million metric tonnes oven-dry weight)
Forest Other wooded landCategory
1990 2000 2005 2010 2015 1990 2000 2005 2010 2015
Abovegroundbiomass
35.67 34.63 34.26 33.27 N/A 5.22 5.76 5.95 6.3 N/A
Belowgroundbiomass
8.03 7.79 7.67 7.51 N/A 1.04 1.15 1.19 1.26 N/A
Deadwood
0.92 0.89 0.88 0.86 N/A 0.26 0.29 0.3 0.32 N/A
TOTAL 44.62 43.31 42.81 41.64 .00 6.52 7.20 7.44 7.88 .00
Table 3e
Carbon (Million metric tonnes)
Forest Other wooded landCategory
1990 2000 2005 2010 2015 1990 2000 2005 2010 2015
Carbonin abovegroundbiomass
16.77 16.09 16.02 15.64 N/A 2.45 2.71 2.8 2.96 N/A
Carbonin belowgroundbiomass
3.77 3.66 3.6 3.53 N/A 0.49 0.54 0.56 0.59 N/A
SubtotalLivingbiomass
20.54 19.75 19.62 19.17 N/A 2.94 3.25 3.36 3.55 N/A
Carbonin deadwood
0.43 0.41 0.41 0.41 N/A 0.12 0.14 0.14 0.15 N/A
Carbonin litter
0.53 0.51 0.5 0.49 N/A 0.14 0.16 0.17 0.18 N/A
SubtotalDeadwoodand litter
0.96 0.92 0.9 0.9 N/A 0.26 0.3 0.31 0.33 N/A

FRA 2015 – Country Report, Trinidad and Tobago
39
Soilcarbon
12.25 11.87 11.68 11.5 N/A 3.26 3.6 3.72 3.93 N/A
TOTAL 33.75 32.54 32.21 31.57 .00 6.46 7.15 7.39 7.81 .00
Tiers
Variable/category Tier for status Tier for trend
Total growing stock Tier 2 Tier 2
Net annual increment N/A N/A
Above ground biomass Tier 1 Tier 1
Below ground biomass N/A N/A
Dead wood N/A N/A
Carbon in above-ground biomass N/A N/A
Carbon in below ground biomass N/A N/A
Carbon in dead wood and litter N/A N/A
Soil carbon N/A N/A
Tier criteria
Category Tier for status Tier for reported trend
Total growing stock Tier 3: Data sources Recent 10 yearsNational Forest Inventory or remotesensing with ground truthing orprogramme for repeated compatible NFI10 years Domestic volume functions Tier2: Data sources/registers and statisticsmodelling or old NFI 10 years or partialfield inventory Tier 1: Other data sources
Tier 3: Estimate based on repeatedcompatible tiers 3 (tier for status)Domestic growth functions Tier 2:Estimate based on repeated compatible tier2 or combination tier 3 and 2 or 1 tier forstatus Tier 1: Other
Net annual increment Tier 3: Scientifically tested nationalvolume and growth functions Tier 2:Selection of volume and growth functionsas relevant as possible Tier 1: Other
Tier 3: Confirmation/adjustment offunctions used through scientific workTier 2: Review work done to seekalternative functions Tier: 1 Other
Biomass Tier 3: Country-specific national or sub-national biomass conversion expansionfactors applied or other domestic orotherwise nationally relevant biomassstudies Tier 2: Application of countryspecific national or sub-national biomassconversion factors from other countrywith similar climatic conditions and foresttypes Tier 1: International/regional defaultbiomass expansion factors applied
Tier 3 : Estimate based on repeatedcompatible tiers 3 (tier for status) Tier 2 :Estimate based on repeated compatible tier2 or combination tier 3 and 2 or 1 (tier forstatus) Tier 1 : Other

FRA 2015 – Country Report, Trinidad and Tobago
40
• Carbon in above ground biomass• Carbon in below ground biomass• Carbon in dead wood and litter• Soil carbon
Tier 3: Country-specific national or sub-national biomass conversion expansionfactors applied Tier 2: Applicationof country specific national or sub-national biomass conversion factorsform from other country with similarclimatic conditions and forest types Tier1: International/regional default biomassexpansion factors applied
Tier 3 : Estimate based on repeatedcompatible tiers 3 (tier for status) Tier 2 :Estimate based on repeated compatible tier2 or combination tier 3 and 2 or 1 (tier forstatus) Tier 1 : Other
3.5 Comments on growing stock biomass and carbon
CategoryComments related todata definitions etc
Comments on the reported trend
Total growing stock Data on 2005 was based on individualspecies. For 2010 gross forest areas bymean volumes per ha were used. This maycause the increase in growing stock.
N/A
Growing stock of broadleaved coniferous N/A N/A
Growing stock composition The category "remainder species" wascalibrated in order to have the same resultsfor total growing stock
N/A
Net annual increment N/A N/A
Above-ground biomass Growing stock data was converted bythe various BCEF from Table 5.4 in theGuidelines..
N/A
Below-ground biomass N/A N/A
Dead wood Mortality data from natural forests basedon an analysis of over 100 sample plotsshowed an average of 5.22 cubic metresper ha. This value was divided by 1.37( FAO Guidelines for Country Reportingto FRA 2010Appendix 4, Table of weightand volume) to convert into biomassmortality of 3.81 metric tonne per ha. Thisvalue was applied to all forest types.
N/A
Carbon in above-ground biomass N/A N/A
Carbon in below-ground biomass N/A N/A
Carbon in dead wood N/A N/A
Carbon in litter N/A N/A

FRA 2015 – Country Report, Trinidad and Tobago
41
Soil carbon For soil carbon values most of the forestswere assumed to be on LAC soils with47 tonnes of carbon per ha. For themontane and seasonal montane forests63 tonnes of carbon per ha was used; andfor the swamp forests the global figurefor wetland soils of 86 tonnes per ha wasused.
N/A
Other general comments to the table
N/A
FRA 2015 – Country Report, Trinidad and Tobago
42
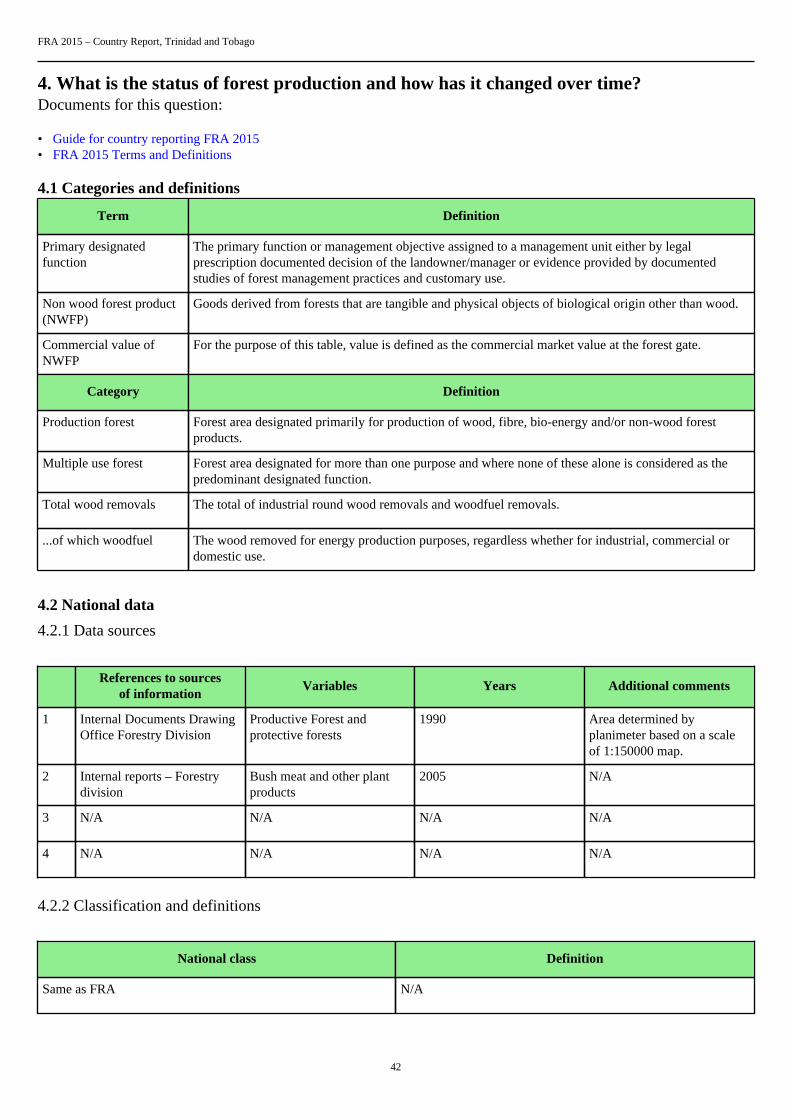
4. What is the status of forest production and how has it changed over time?Documents for this question:
• Guide for country reporting FRA 2015• FRA 2015 Terms and Definitions
4.1 Categories and definitions
Term Definition
Primary designatedfunction
The primary function or management objective assigned to a management unit either by legalprescription documented decision of the landowner/manager or evidence provided by documentedstudies of forest management practices and customary use.
Non wood forest product(NWFP)
Goods derived from forests that are tangible and physical objects of biological origin other than wood.
Commercial value ofNWFP
For the purpose of this table, value is defined as the commercial market value at the forest gate.
Category Definition
Production forest Forest area designated primarily for production of wood, fibre, bio-energy and/or non-wood forestproducts.
Multiple use forest Forest area designated for more than one purpose and where none of these alone is considered as thepredominant designated function.
Total wood removals The total of industrial round wood removals and woodfuel removals.
...of which woodfuel The wood removed for energy production purposes, regardless whether for industrial, commercial ordomestic use.
4.2 National data
4.2.1 Data sources
References to sourcesof information
Variables Years Additional comments
1 Internal Documents DrawingOffice Forestry Division
Productive Forest andprotective forests
1990 Area determined byplanimeter based on a scaleof 1:150000 map.
2 Internal reports – Forestrydivision
Bush meat and other plantproducts
2005 N/A
3 N/A N/A N/A N/A
4 N/A N/A N/A N/A
4.2.2 Classification and definitions
National class Definition
Same as FRA N/A

FRA 2015 – Country Report, Trinidad and Tobago
43
N/A N/A
N/A N/A
N/A N/A
4.2.3 Original data
National data 1990
Area(ha)
FRA classification
Watersheds 8334 Protection of soil and water
Nature reserves 458 Conservation of biologicaldiversity
Wildlife Sanctuaries 19004 Conservation of biologicaldiversity
National Parks 5002 Social Services
Production forests 75,875 Production
Protective forests 42,986 Protection of soil and water
Total reserve and unproclaimedreserve
143,324.7
4.3 Analysis and processing of national data
4.3.1 Adjustment
4.3.2 Estimation and forecasting
Using the above table, percentages were calculated and applied to the different forest areas for the reportingyear 1990, 2000 and the categories of production, protection and social service of the year 2005. In 2005 afurther 3000 hectares was managed as national parks. The area managed for production, protection of soil andwater, conservation of biological diversity are considered fixed for the period 1990 to 2010. The rest of thearea is considered to be multiple purpose.

FRA 2015 – Country Report, Trinidad and Tobago
44
4.3.3 Reclassification
Nationalclases
FRA Classes
Production Multiple
purpose
Protection Conservationofbiodiversity
Socialservice
Protectionof Soil andWater
Watershed 100%
Naturereserve
100%
Wildlife 100%
Nationalparks
100%
Productionof forests
100%
Protectiveforests
100%
All otherforestedareas
100%
4.4 DataTable 4a
Forest area (000 hectares)Categories
1990 2000 2005 2010 2015
Production forest 75.9 75.9 75.9 75.9 N/A
Multiple useforest
89 81.9 75.3 71.9 N/A
Table 4b
Rank Name of product Key species
Commercial valueof NWFP removals
2010 (value 1000local currency)
NWFP category
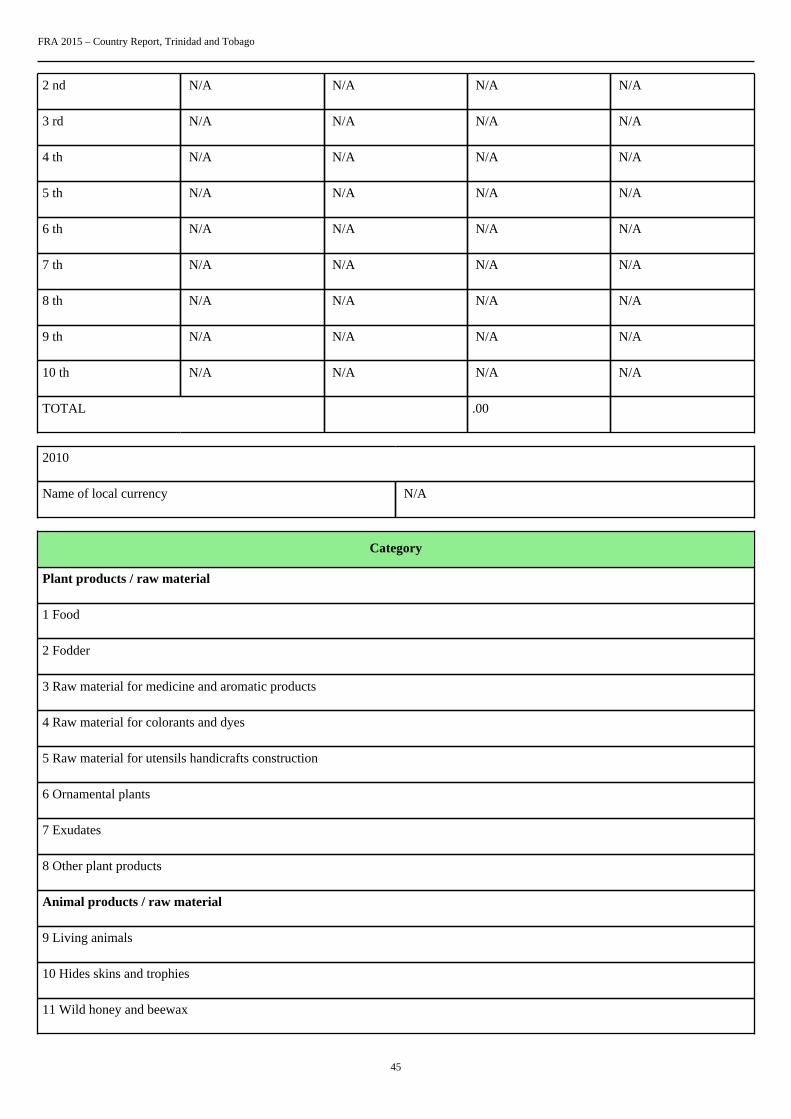
1 st N/A N/A N/A N/A
FRA 2015 – Country Report, Trinidad and Tobago
45
2 nd N/A N/A N/A N/A
3 rd N/A N/A N/A N/A
4 th N/A N/A N/A N/A
5 th N/A N/A N/A N/A
6 th N/A N/A N/A N/A
7 th N/A N/A N/A N/A
8 th N/A N/A N/A N/A
9 th N/A N/A N/A N/A
10 th N/A N/A N/A N/A
TOTAL .00
2010
Name of local currency N/A
Category
Plant products / raw material
1 Food
2 Fodder
3 Raw material for medicine and aromatic products
4 Raw material for colorants and dyes
5 Raw material for utensils handicrafts construction
6 Ornamental plants
7 Exudates
8 Other plant products
Animal products / raw material
9 Living animals
10 Hides skins and trophies
11 Wild honey and beewax

FRA 2015 – Country Report, Trinidad and Tobago
46
12 Wild meat
13 Raw material for medicine
14 Raw material for colorants
15 Other edible animal products
16 Other non-edible animal products
Table 4c Pre-filled data from FAOSTAT
FRA 2015 category (1000 m 3 u.b.)Year
Total wood removals ...of which woodfuel
1990 89.95 39.75
1991 85.48 39.48
1992 95.64 39.44
1993 91.27 39.67
1994 121.87 39.27
1995 156.31 38.91
1996 97.67 37.27
1997 111.32 37.92
1998 72.22 37.22
1999 70.81 36.81
2000 108.52 36.52
2001 102.08 36.08
2002 92.66 35.66
2003 95.25 35.25
2004 85.86 34.86
2005 99.47 34.47
2006 99.12 34.12
2007 98.8 33.8
2008 80.4 33.4

FRA 2015 – Country Report, Trinidad and Tobago
47
2009 80.14 33.14
2010 79.82 32.82
2011 79.52 32.52
Tiers
Category Tier for status Tier for reported trend
Production forest Tier 2 Tier 2
Multiple use forest Tier 2 Tier 2
Tier Criteria
Category Tier for status Tier for reported trend
Production forest Multiple use forest Tier 3: Updated including fieldverifications national forest mapsincluding functions Tier 2: Forest mapsolder than 6 years including forestfunctions Tier 1: Other
Tier 3 : Estimate based on repeatedcompatible tiers 3 (tier for status) Tier 2 :Estimate based on repeated compatible tier2 or combination tier 3 and 2 or 1 (tier forstatus) Tier 1 : Other
4.5 Comments
CategoryComments related todata definitions etc
Comments on the reported trend
Production forest N/A N/A
Multiple use forest N/A N/A
Total wood removals N/A N/A
Commercial value of NWFP N/A N/A
Other general comments to the table
Although 100,000 hectares are proposed in the system of national parks and protected areas only 8000 hectares of forested lands aremanaged as national parks

FRA 2015 – Country Report, Trinidad and Tobago
48
5. How much forest area is managed for protection of soil and water and ecosystemservices?Documents for this question:
• Guide for country reporting FRA 2015• FRA 2015 Terms and Definitions
5.1 Categories and definitions
Category Definition
Protection of soil andwater
Forest area designated or managed for protection of soil and water
...of which productionof clean water (sub-category)
Forest area primarily designated or managed for water production, where most human uses are excludedor heavily modified to protect water quality.
...of which coastalstabilization (sub-category)
Forest area primarily designated or managed for coastal stabilization.
...of which desertificationcontrol (sub-category)
Forest area primarily designated or managed for desertification control.
...of which avalanchecontrol (sub-category)
Forest area primarily designated or managed to prevent the development or impact of avalanches onhuman life assets or infrastructure.
...of which erosion, floodprotection or reducingflood risk (sub-category)
Forest area primarily designated or managed for protecting communities or assets from the impacts oferosion riparian floods and landslides or for providing flood plain services.
...of which other (sub-category)
Forest area primarily designated or managed for other protective functions.
Ecosystem services,cultural or spiritual values
Forest area primarily designated or managed for selected ecosystem services or cultural or spiritualvalues.
...of which publicrecreation (sub-category)
Forest area designated or managed for public recreation.
...of which carbon storageor sequestration (sub-category)
Forest area designated or managed for carbon storage or sequestration.
...of which spiritual orcultural services (sub-category)
Forest area designated or managed for spiritual or cultural services.
...of which other (sub-category)
Forest area designated or managed for other ecosystem services.
5.2 National data
5.2.1 Data sources
References to sourcesof information
Variables Years Additional comments
1 N/A N/A N/A N/A
2 N/A N/A N/A N/A

FRA 2015 – Country Report, Trinidad and Tobago
49
3 N/A N/A N/A N/A
4 N/A N/A N/A N/A
5.2.2 Classification and definitions
National class Definition
N/A N/A
N/A N/A
N/A N/A
N/A N/A
5.2.3 Original data
5.3 Analysis and processing of national data
5.3.1 Adjustment
5.3.2 Estimation and forecasting
5.3.3 Reclassification
5.4 DataTable 5a
Forest area (1000 hectares)Categories
1990 2000 2005 2010 2015
Protection of soiland water
N/A N/A N/A N/A N/A
... of whichproduction ofclean water
N/A N/A N/A N/A N/A
... of whichcoastalstabilization
N/A N/A N/A N/A N/A

FRA 2015 – Country Report, Trinidad and Tobago
50
... of whichdesertificationcontrol
N/A N/A N/A N/A N/A
... of whichavalanchecontrol
N/A N/A N/A N/A N/A
... of whicherosion, floodprotection orreducing floodrisk
N/A N/A N/A N/A N/A
... of which other(please specifyin commentsbelow the table)
N/A N/A N/A N/A N/A
Other
N/A
Table 5b
Forest area (1000 hectares)Categories
1990 2000 2005 2010 2015
Ecosystem services,cultural or spiritualvalues
N/A N/A N/A N/A N/A
...of which publicrecreation
N/A N/A N/A N/A N/A
...of whichcarbon storage orsequestration
N/A N/A N/A N/A N/A
...of which spiritualor cultural services
N/A N/A N/A N/A N/A
...of which other(please specify incomments belowthe table)
N/A N/A N/A N/A N/A
Tiers
Category Tier for reported trend Tier for status
Protection of soil and water N/A N/A
Ecosystem services, cultural or spiritualvalues
N/A N/A
Tier criteria
Category Tier for status Tier for reported trend

FRA 2015 – Country Report, Trinidad and Tobago
51
Protection of soil and water Tier 3: High reliability data derived eitherfrom high intensity sample survey or dataobtained from national or state agenciesresponsible for regulations or legislationrelating to soil and water protection. Tier2: Approaches based on low intensityor incomplete sample-based surveys orstudies that provide data for specific areasthat is extrapolated through statisticalanalysis to national level estimates. Tier 1:Other
Tier 3 : Estimate based on repeatedcompatible tiers 3 (tier for status) Tier 2 :Estimate based on repeated compatible tier2 or combination tier 3 and 2 or 1 (tier forstatus) Tier 1 : Other
• Cultural or spiritual values• Public recreation• Spiritual or cultural services• Other
Tier 3: High reliability data derivedeither from high intensity sample surveyor data obtained from national or stateagencies responsible for regulations. Tier2: Approaches based on low intensityor incomplete sample-based surveys orstudies that provide data for specific areasthat is extrapolated through statisticalanalysis to national level estimates. Tier 1:Other
Tier 3 : Estimate based on repeatedcompatible tiers 3 (tier for status) Tier 2 :Estimate based on repeated compatible tier2 or combination tier 3 and 2 or 1 (tier forstatus) Tier 1 : Other
5.5 Comments
CategoryComments related todata definitions etc
Comments on the reported trend
Protection of soil and water N/A N/A
Production of clean water N/A N/A
Coastal stabilization N/A N/A
Desertification control N/A N/A
Avalanche control N/A N/A
Erosion, flood protection or reducing floodrisk
N/A N/A
Other protective functions N/A N/A
Ecosystem services, cultural or spiritualvalues
N/A N/A
Public recreation N/A N/A
Carbon storage or sequestration N/A N/A
Spiritual or cultural services N/A N/A
Other ecosystem services N/A N/A
Other general comments to the table

FRA 2015 – Country Report, Trinidad and Tobago
52
N/A

FRA 2015 – Country Report, Trinidad and Tobago
53
6. How much forest area is protected and designated for the conservation of biodiversityand how has it changed over time?Documents for this question:
• Guide for country reporting FRA 2015• FRA 2015 Terms and Definitions
6.1 Categories and definitions
Category Definition
Conservation ofbiodiversity
Forest area designated primarily for conservation of biological diversity. Includes but is not limited toareas designated for biodiversity conservation within the protected areas.
Forest area withinprotected areas
Forest area within formally established protected areas independently of the purpose for which theprotected areas were established.
6.2 National data
6.2.1 Data sources
References to sourcesof information
Variables Years Additional comments
1 Internal Documents DrawingOffice Forestry Division
Productive Forest andprotective forests
1990 Area determined byplanimeter based on a scaleof 1:150000 map.
2 N/A N/A N/A N/A
3 N/A N/A N/A N/A
4 N/A N/A N/A N/A
6.2.2 Classification and definitions
National class Definition
N/A N/A
N/A N/A
N/A N/A
N/A N/A
6.2.3 Original data
See 4.2.3
6.3 Analysis and processing of national data

FRA 2015 – Country Report, Trinidad and Tobago
54
6.3.1 Adjustment
6.3.2 Estimation and forecasting
See 4.3.2.
6.3.3 Reclassification
See 4.3.3.
6.4 DataTable 6
Forest area (000 hectares)Categories
1990 2000 2005 2010 2015
Conservation ofbiodiversity
19.5 19.5 19.5 19.5 N/A
Forest areawithin protectedareas
N/A N/A N/A N/A N/A
Tiers
Category Tier for status Tier for reported trend
Conservation of biodiversity Tier 2 Tier 2
Forest area within protected areas N/A N/A
Tier criteria
Category Tier for status Tier for reported trend
• Conservation of biodiversity• Forests within protected areas
Tier 3: Data obtained from national orstate agencies responsible for conservationand protected area or legislation relatingto area protection. Tier 2: Studies thatprovide data for specific areas that isextrapolated through statistical analysis tonational level estimates Tier 1 Other
Tier 3 : Estimate based on repeatedcompatible tiers 3 (tier for status) Tier 2 :Estimate based on repeated compatible tier2 or combination tier 3 and 2 or 1 (tier forstatus) Tier 1 : Other
6.5 Comments
CategoryComments related todata definitions etc
Comments on the reported trend

FRA 2015 – Country Report, Trinidad and Tobago
55
Conservation of biodiversity N/A N/A
Forest area within protected areas N/A N/A
Other general comments to the table
Although 100,000 hectares are proposed in the system of national parks and protected areas only 8000 hectares of forested lands aremanaged as national parks
FRA 2015 – Country Report, Trinidad and Tobago
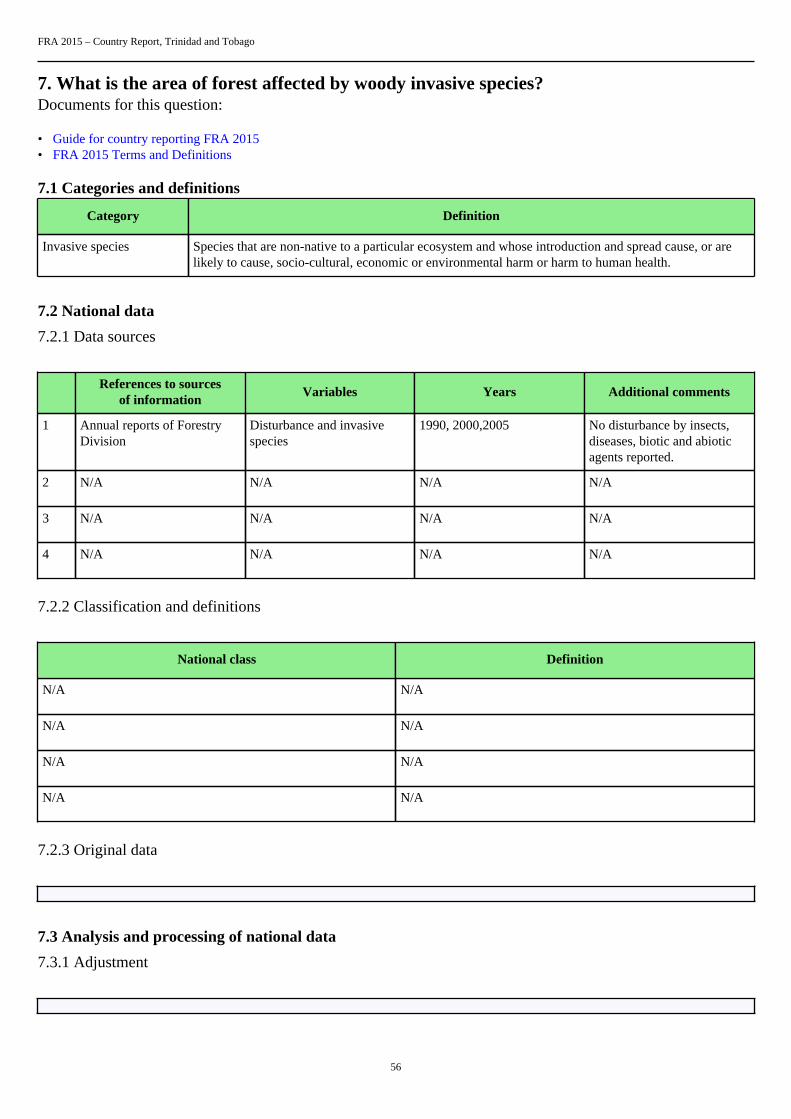
56
7. What is the area of forest affected by woody invasive species?Documents for this question:
• Guide for country reporting FRA 2015• FRA 2015 Terms and Definitions
7.1 Categories and definitions
Category Definition
Invasive species Species that are non-native to a particular ecosystem and whose introduction and spread cause, or arelikely to cause, socio-cultural, economic or environmental harm or harm to human health.
7.2 National data
7.2.1 Data sources
References to sourcesof information
Variables Years Additional comments
1 Annual reports of ForestryDivision
Disturbance and invasivespecies
1990, 2000,2005 No disturbance by insects,diseases, biotic and abioticagents reported.
2 N/A N/A N/A N/A
3 N/A N/A N/A N/A
4 N/A N/A N/A N/A
7.2.2 Classification and definitions
National class Definition
N/A N/A
N/A N/A
N/A N/A
N/A N/A
7.2.3 Original data
7.3 Analysis and processing of national data
7.3.1 Adjustment

FRA 2015 – Country Report, Trinidad and Tobago
57
7.3.2 Estimation and forecasting
7.3.3 Reclassification
7.4 DataTable 7
Forest area affected (000 ha)Scientific name of
woody invasive species2005 2010
N/A N/A N/A
N/A N/A N/A
N/A N/A N/A
N/A N/A N/A
N/A N/A N/A
N/A N/A N/A
N/A N/A N/A
N/A N/A N/A
N/A N/A N/A
N/A N/A N/A
Total N/A N/A
Tiers
Category Tier for status Tier for reported trend
Invasive species N/A N/A
Tier Criteria
Category Tier for status Tier for reported trend

FRA 2015 – Country Report, Trinidad and Tobago
58
Invasive species Tier 3: Systematic assessment in forestinventory or other survey (e.g. byconservation department) within the last5 years) Tier 2: Systematic assessment inforest inventory or other survey (e.g. byconservation department conducted morethan 5 years ago) Tier 1: Other
Tier 3 : Estimate based on repeatedcompatible tiers 3 (tier for status) Tier 2 :Estimate based on repeated compatible tier2 or combination tier 3 and 2 or 1 (tier forstatus) Tier 1 : Other
7.5 Comments
CategoryComments related todata definitions etc
Comments on the reported trend
Invasive species Acacia mangium ( tree species ) wasintroduced in Trinidad in 1984. Possessesinvasive tendencies especially in areaswhere fires are frequent in the dry season.It has been found in the natural forests butthere is no widespread occurrence. May beaffecting only a few hectares possibly lessthat 5 ha.
N/A
Other general comments to the table
N/A
FRA 2015 – Country Report, Trinidad and Tobago
59
8. How much forest area is damaged each year?Documents for this question:
• Guide for country reporting FRA 2015• FRA 2015 Terms and Definitions
8.1 Categories and definitions
Category Definition
Number of fires Number of fires per year
Burned area Area burned per year
Outbreaks of insects A detectable reduction in forest health caused by a sudden increase in numbers of harmful insects.
Outbreaks of diseases A detectable reduction in forest health caused by a sudden increase in numbers of harmful pathogens,such as bacteria, fungi, phytoplasma or virus.
Severe weather events Damage caused severe weather events, such as snow, storm, drought, etc.
8.2 National data
8.2.1 Data sources
References to sourcesof information
Variables Years Additional comments
1 N/A N/A N/A N/A
2 N/A N/A N/A N/A
3 N/A N/A N/A N/A
4 N/A N/A N/A N/A
8.2.2 Classification and definitions
National class Definition
N/A N/A
N/A N/A
N/A N/A
N/A N/A
8.2.3 Original data

FRA 2015 – Country Report, Trinidad and Tobago
60
8.3 Analysis and processing of national data
8.3.1 Adjustment
8.3.2 Estimation and forecasting
8.3.3 Reclassification
8.4 DataTable 8a
000 ha, number of fires
2003 2004 2005 2006 2007Category
000 ha # 000 ha # 000 ha # 000 ha # 000 ha #
Totalland areaburned
0.58 N/A 0.06 N/A N/A N/A 0.48 N/A 0.56 N/A
... ofwhichforestareaburned
0.42 N/A 0.06 N/A N/A N/A 0.44 N/A 0.4 N/A
2008 2009 2010 2011 2012Category
000 ha # 000 ha # 000 ha # 000 ha # 000 ha #
Totalland areaburned
N/A N/A 0.02 N/A 1.21 N/A N/A N/A N/A N/A
... ofwhichforestareaburned
N/A N/A N/A N/A 1.15 N/A N/A N/A N/A N/A
Table 8b
Outbreak category Description/name Year(s) of latest outbreak Area damaged (000 hectares)
N/A N/A N/A N/A
N/A N/A N/A N/A

FRA 2015 – Country Report, Trinidad and Tobago
61
N/A N/A N/A N/A
N/A N/A N/A N/A
N/A N/A N/A N/A
N/A N/A N/A N/A
N/A N/A N/A N/A
N/A N/A N/A N/A
N/A N/A N/A N/A
N/A N/A N/A N/A
Outbreak category
1 Insects
2 Diseases
3 Severe weather events
Tiers
Category Tier for status Tier for trend
Area affected by fire Tier 2 Tier 2
• Insects• Diseases• Severe weather events
N/A N/A
Tier criteria
Category Tier for status Tier for reported trend
Burned area Tier 3 : National fire monitoring routinesTier 2 : Remote sensing surveys Tier 1 :Other
Tier 3 : Estimate based on repeatedcompatible tiers 3 (tier for status) Tier 2 :Estimate based on repeated compatible tier2 or combination tier 3 and 2 or 1 (tier forstatus) Tier 1 : Other
• Insects• Diseases• Severe weather events
Tier 3 : Systematic survey (e.g. viainventory or aerial damage assessment)Tier 2 : Management records Tier 1 :Other
Tier 3 : Estimate based on repeatedcompatible tiers 3 (tier for status) Tier 2 :Estimate based on repeated compatible tier2 or combination tier 3 and 2 or 1 (tier forstatus) Tier 1 : Other
8.5 Comments
CategoryComments related todata definitions etc
Comments on the reported trend

FRA 2015 – Country Report, Trinidad and Tobago
62
Burned area N/A N/A
Insects N/A N/A
Diseases N/A N/A
Severe weather events N/A N/A
Other general comments to the table
N/A

FRA 2015 – Country Report, Trinidad and Tobago
63
9. What is the forest area with reduced canopy cover?Documents for this question:
• Guide for country reporting FRA 2015• FRA 2015 Terms and Definitions
Category Definition
Reduction in canopycover
Forest that has undergone a reduction of canopy cover of more than 20% between the years 2000 and2010 within the forest canopy cover range of 30-80% as detected by the MODIS VCF sensor.
Table 9
Category Area of forest with reduced canopy cover (000 ha)
Reduction in canopycover
78.4
Tiers
Category Tier for reported trend
Reduction in canopycover
Tier 2
Tier criteria
Category Tier for reported trend
Reduction in canopycover
Tier 3 : Remote sensing with ground truthing and/or Landsat imagery Tier 2 : Remote sensing usingModis (using pre-filled data provided by FAO) Tier 1 : Expert opinion
Comments
Category Comments related to data definitions etc
Reduction in canopycover
N/A
Other general comments

FRA 2015 – Country Report, Trinidad and Tobago
64
10. What forest policy and regulatory framework exists to support implementation ofsustainable forest management SFM?Documents for this question:
• Guide for country reporting FRA 2015• FRA 2015 Terms and Definitions
10.1 Categories and definitions
Category Definition
Policies supportingsustainable forestmanagement
Policies or strategies that explicitly encourage sustainable forest management.
Legislation andregulations supportingsustainable forestmanagement
Legislation and regulations that govern and guide sustainable forest management, operations and use.
10.2 National data
10.2.1 Data sources
References to sourcesof information
Variables Years Additional comments
1 N/A N/A N/A N/A
2 N/A N/A N/A N/A
3 N/A N/A N/A N/A
4 N/A N/A N/A N/A
10.2.2 Classification and definitions
National class Definition
N/A N/A
N/A N/A
N/A N/A
N/A N/A
10.2.3 Original data
10.3 Data

FRA 2015 – Country Report, Trinidad and Tobago
65
Table 10
Sub-nationalCategoryNational
Regional Provincial/State Local
Policies supportingsustainable forestmanagement
yes
... of which, in publiclyowned forests
yes
... of which, in privatelyowned forests
Legislation andregulations supportingsustainable forestmanagement
yes
... of which, in publiclyowned forests
... of which, in privatelyowned forests
10.4 Comments
Variable / category Comments related to data definitions etc
Policies supporting sustainable forest management N/A
Legislation and regulations supporting sustainable forestmanagement
New legislation being drafted at present
Other general comments

FRA 2015 – Country Report, Trinidad and Tobago
66
11. Is there a national platform that promotes stakeholder participation in forest policydevelopment?Documents for this question:
• Guide for country reporting FRA 2015• FRA 2015 Terms and Definitions
11.1 Categories and definitions
Category Definition
National stakeholderplatform
A recognized procedure that a broad range of stakeholders can use to provide opinions, suggestions,analysis, recommendations and other input into the development of national forest policy.
11.2 National data
11.2.1 Data sources
References to sources of information Years Additional comments
1 National Forest Policy 2011 N/A
2 N/A N/A N/A
3 N/A N/A N/A
4 N/A N/A N/A
Table 11Is there a national platform that promotes or allows forstakeholder participation in forest policy development?
yes
11.3 Comments
Category Comments related to data definitions etc
National stakeholder platform National consultations
Other general comments

FRA 2015 – Country Report, Trinidad and Tobago
67
12. What is the forest area intended to be in permanent forest land use and how has itchanged over time?Documents for this question:
• Guide for country reporting FRA 2015• FRA 2015 Terms and Definitions
12.1 Categories and definitions
Category Definition
Forest area intended to bein permanent forest landuse
Forest area that is designated or expected to be retained as forest and is highly unlikely to be convertedto other land use.
...of which permanentforest estate (sub-category)
Forest area that is designated by law or regulation to be retained as forest and may not be converted toother land use.
12.2 National data
12.2.1 Data sources
References to sourcesof information
Variables Years Additional comments
1 Internal Documents DrawingOffice Forestry Division
Productive Forest andprotective forests
1990 Area determined byplanimeter based on a scaleof 1:150000 map.
2 N/A N/A N/A N/A
3 N/A N/A N/A N/A
4 N/A N/A N/A N/A
12.2.2 Classification and definitions
National class Definition
N/A N/A
N/A N/A
N/A N/A
N/A N/A

FRA 2015 – Country Report, Trinidad and Tobago
68
12.2.3 Original data
The area of the permanent forest estate is fixed at 143,000 ha. Due to agricultural encroachment and squattingfor housing and illegal quarrying the forest area has been reduced but the area is still legally under the controlof the state.
12.3 Analysis and processing of national data
12.3.1 Adjustment
12.3.2 Estimation and forecasting
12.3.3 Reclassification
12.4 DataTable 12
Categories Forest area 2010 (000 ha)
Forest area intended to be in permanentforest land use
... of which permanent forest estate 143
Tiers
Category Tier for status
Forest area intended to be in permanent forest land use Tier 2
Permanent forest estate Tier 2
Tier Criteria
Category Tier for status
Forest area intended to be in permanent forest land use Tier 3 : National or sub-national land use plans strategydocuments or other reports within the past 10 years Tier 2 :National or sub-national land use plans strategy documents orother reports within the past 20 years Tier 1 : Other
Permanent forest estate Tier 3 : National or sub-national land use plans strategydocuments or other reports within the past 10 years Tier 2 :National or sub-national land use plans strategy documents orother reports within the past 20 years Tier 1 : Other

FRA 2015 – Country Report, Trinidad and Tobago
69
12.5 Comments
Category Comments related to data definitions etc
Forest area intended to be in permanent forest land use N/A
Permanent forest estate The area of the permanent forest estate is fixed at 143,000 ha.Due to agricultural encroachment and squatting for housing andillegal quarrying the forest area has been reduced but the area isstill legally under the control of the state.
Other general comments

FRA 2015 – Country Report, Trinidad and Tobago
70
13. How does your country measure and report progress towards SFM at the nationallevel?Documents for this question:
• Guide for country reporting FRA 2015• FRA 2015 Terms and Definitions
13.1 Categories and definitions
Category Definition
Forest area monitoredunder a national forestmonitoring framework
Forest area monitored by a national monitoring framework or systems that provide measurement basedperiodic monitoring of forest extent and quality.
Forest reporting atnational scale
National reporting of forest extent and characteristics that includes some measure of progress towardsustainable forest management.
13.2 National data
13.2.1 Data sources
References to sourcesof information
Variables Years Additional comments
1 N/A N/A N/A N/A
2 N/A N/A N/A N/A
3 N/A N/A N/A N/A
4 N/A N/A N/A N/A
13.2.2 Classification and definitions
National class Definition
N/A N/A
N/A N/A
N/A N/A
N/A N/A
13.3 DataTable 13a

FRA 2015 – Country Report, Trinidad and Tobago
71
Check all boxes that apply
Category% of totalforest area
Mostrecent year
Continuous PeriodicPermanent
groundplots
Temporaryground
plots
Aerial/remotesensingsamplebased
Aerial/remote
sensing fullcoverage
Forestinventory
N/A N/A
Other fieldassessments
N/A N/A yes
Updatesto othersources
N/A N/A
Expertestimate
73 2011
Table 13b
Type of forest reporting used at national scale Check boxes that apply
1 Criteria and Indicators reporting
2 Periodic national state of the forest report
3 Other (please document) yes
4 None
Other type of forest reporting
Point 3; other, refers to the Annual Report of the Forestry Division
13.4 Comments
Category Comments
N/A N/A
N/A N/A
N/A N/A
Other general comments
Forest cover mapping exercise conducted by USDA

FRA 2015 – Country Report, Trinidad and Tobago
72
14. What is the area of forest under a forest management plan and how is this monitored?Documents for this question:
• Guide for country reporting FRA 2015• FRA 2015 Terms and Definitions
14.1 Categories and definitions
Category Definition
Forest area withmanagement plan
Forest area that has a long-term documented management plan, aiming at defined management goalswhich is periodically revised
...of which for production(sub-category)
Forest management plan mainly focused on production
...of which forconservation (sub-category)
Forest management plan mainly focused on conservation
Monitoring of forestmanagement plans
Government monitoring of forest management plan implementation conducted through field visits oraudits of forest management plan performance
14.2 National data
14.2.1 Data sources
References to sourcesof information
Variables Years Additional comments
1 Internal Documents DrawingOffice Forestry Division
Productive Forest andprotective forests
1990 Area determined byplanimeter based on a scaleof 1:150000 map.
2 N/A N/A N/A N/A
3 N/A N/A N/A N/A
4 N/A N/A N/A N/A
14.3 DataTable 14a
Forest plan type Forest area 2010 (000 ha)
Forest area with management plan 143
... of which for production N/A
... of which for conservation N/A
Table 14b
Indicate which (if any) of the following are required in forest management plans in your country
1 Soil and water management

FRA 2015 – Country Report, Trinidad and Tobago
73
2 High conservation value forest delineation
3 Social considerations community involvement
Table 14c
Percent of area under forest management plan that is monitored annually N/A
Tiers
Category Tier for status
Forest area with management plan Tier 2
Percent of area under forest management plan that is monitoredannually
N/A
Tier criteria
Category Tier for status
Forest area with management plan Tier 3 : Reports that describe national records 5 years old or lessthat contain long-term forest monitoring plans Tier 2 : Industryor other records indicating the presence of a long-term forestmanagement plan Tier 1 : Other
Percent of area under forest management plan that is monitoredannually
Tier 3 : Government documentation of monitoring extent Tier 2: Reports from forest managers or other documental sources Tier1 : Other
14.4 Comments
Category Comments
Forest area with management plan N/A
N/A N/A
N/A N/A
Other general comments

FRA 2015 – Country Report, Trinidad and Tobago
74
15. How are stakeholders involved in the management decision making for publiclyowned forests?Documents for this question:
• Guide for country reporting FRA 2015• FRA 2015 Terms and Definitions
15.1 Categories and definitions
Category Definition
Stakeholder involvement Stakeholder involvement is defined as significant inputs into at least one aspect of forest management atthe operational scale
Table 15
Please indicate the type of stakeholder involvement in forest management decision making required in your country
1. Planning phase yes
2. Operations phase
3. Review of operations
Tiers
Category Tier for status
Type of stakeholder inputs Tier 3
Tier criteria
Category Tier for status
Type of stakeholder inputs Tier 3 : Government (national or sub-national) documentation ofstakeholder inputs Tier 2 : Government (national or subnational)requirement but stakeholder inputs not documented Tier 1 :Other
15.2 Comments
Category Comments
N/A N/A
N/A N/A
N/A N/A
Other general comments

FRA 2015 – Country Report, Trinidad and Tobago
75
16. What is the area of forest under an independently verified forest certification scheme?Documents for this question:
• Guide for country reporting FRA 2015• FRA 2015 Terms and Definitions
16.1 Categories and definitions
Category Definition
FSC certification Forest area certified under the Forest Stewardship Council certification scheme
PEFC certification Forest area certified under the Programme for the Endorsement of Forest Certification scheme
Other international forestmanagement certification
Forest area certified under an international forest management certification scheme with publishedstandards and is independently verified by a third-party, excluding FSC and PEFC certification.
Certified forest areausing a domestic forestmanagement certificationscheme
Area certified under a forest management certification scheme with published standards that arenationally recognized and independently verified by a thirdparty
16.2 DataTable 16a
Forest area (000 ha)International forest
management certification2000 2001 2002 2003 2004 2005 2006
FSC 0 0 0 0 0 0 0
PEFC 0 0 0 0 0 0 0
Other 0 0 0 0 0 0 0
2007 2008 2009 2010 2011 2012
FSC 0 0 0 0 0 0
PEFC 0 0 0 0 0 0
Other 0 0 0 0 0 0
Table 16b
Forest area (000 ha)Domestic forest
management certification2000 2001 2002 2003 2004 2005 2006
N/A 0 0 0 0 0 0 0
N/A 0 0 0 0 0 0 0
N/A 0 0 0 0 0 0 0

FRA 2015 – Country Report, Trinidad and Tobago
76
2007 2008 2009 2010 2011 2012
0 0 0 0 0 0
0 0 0 0 0 0
0 0 0 0 0 0
Tier criteria
Category Tier for status
International forest management certification Tier 3: International forest management scheme recordsmaintained by the certifying organization for the reporting yearTier 2: International forest management scheme records reportedby the certifying organization for a period 2 years prior to thereporting year Tier: 1 Other
Domestic forest management certification Tier 3: National registry reports for domestic forest managementcertification maintained by the certifying organization for thereporting year Tier 2: Domestic forest management schemerecords reported by the certifying organization for a period 2years prior to the reporting year Tier: 1 Other
Tiers
Category Tier for status
International forest management certification N/A
Domestic forest management certification N/A
16.3 Comments
Category Comments related to data definitions etc
Certified forest area using an international forest managementcertification scheme
N/A
Domestic forest management certification N/A
Other general comments

FRA 2015 – Country Report, Trinidad and Tobago
77
17. How much money do governments collect from and spend on forests?Documents for this question:
• Guide for country reporting FRA 2015• FRA 2015 Terms and Definitions
17.1 Categories and definitions
Category Definition
Forest revenue All government revenue collected from the domestic production and trade of forest products andservices. For this purpose revenue include:• Goods : roundwood; sawnwood; biomass; woodbased panels; pulp and paper and non-wood forest
products.• Services : including concession fees and royalties, stumpage payments, public timber sales revenue
taxes and charges based on forest area or yield, taxes on domestic trade and export of forest products,special levies on forestry activities and payments into forest related funds, other miscellaneousinspection, licence and administrative fees levied by forest administrations, permit and licence feesfor recreation and other forest related activities.
Public expenditure onforestry
All government expenditure on forest related activities.
17.2 National data
17.2.1 Data sources
References to sourcesof information
Variables Years Additional comments
1 Internal Records ForestryDivison
Revenue, Expenditure,subsidy
1998 to 2007 Data from NationalReforestation and WatershedRehabilitation Programme arefor 3 years only since projectcommenced in 2005.
2 N/A N/A N/A N/A
3 N/A N/A N/A N/A
4 N/A N/A N/A N/A
17.3 DataTable 17
Revenues / expenditures (000 local currency)Category
2000 2005 2010
Forest revenue 7411 7419 N/A
Public expenditure on forestry 37685 88090 N/A
2000 2005 2010

FRA 2015 – Country Report, Trinidad and Tobago
78
Name of Local Currency Dollar (TT$) N/A N/A
17.4 Comments
Category Comments related to data definitions etc
Forest revenue Revenue collected from sale of forest produce,
Public expenditure on forestry Total sum expended in the recurrent and developmentprogrammes of the Forestry Division and the NationalReforestation and watershed Rehabilitation Programme(NRWRP) Subsidies payable to private persons to establishforests on their private property; Funds payable to various groupsto protect turtles during the nesting season
Other general comments N/A
Other general comments

FRA 2015 – Country Report, Trinidad and Tobago
79
18. Who owns and manages the forests and how has this changed?Documents for this question:
• Guide for country reporting FRA 2015• FRA 2015 Terms and Definitions
18.1 Categories and definitions
Category Definition
Public ownership Forest owned by the State or administrative units of the public administration or by institutions orcorporations owned by the public administration.
...of which owned by thestate at national scale(sub-category)
Forest owned by the State at the national scale or administrative units of the public administration or byinstitutions or corporations owned by the public administration.
...of which owned by thestate at the sub-nationalgovernment scale (sub-category)
Forest owned by the State at the sub-national government scale or administrative units of the publicadministration or by institutions or corporations owned by the public administration.
Private ownership Forest owned by individuals, families, communities, private cooperatives corporations and otherbusiness entities, private, religious and educational institutions, pension or investment funds, NGOs,nature conservation associations and other private institutions.
...of which individuals(sub-category)
Forest owned by individuals and families.
...of which privatebusiness entities andinstitutions (sub-category)
Forest owned by private corporations cooperatives companies and other business entities as well asprivate nonprofit organizations such as NGOs nature conservation associations, and private religiousand educational institutions etc.
...of which local tribal andindigenous communities(sub-category)
Forest owned by a group of individuals belonging to the same community residing within or in thevicinity of a forest area or forest owned by communities of indigenous or tribal people The communitymembers are coowners that share exclusive rights and duties and benefits contribute to the communitydevelopment.
Unknown ownership Forest area where ownership is unknown includes areas where ownership is unclear or disputed.
Categories related tomanagement rights
of public forestsDefinition
Public Administration The Public Administration (or institutions or corporations owned by the Public Administration) retainsmanagement rights and responsibilities within the limits specified by the legislation.
Individuals households Forest management rights and responsibilities are transferred from the Public Administration toindividuals or households through long-term leases or management agreements.
Private companies Forest management rights and responsibilities are transferred from the Public Administration tocorporations, other business entities private cooperatives, private nonprofit institutions and associations,etc., through long-term leases or management agreements.
Communities Forest management rights and responsibilities are transferred from the Public Administration to localcommunities (including indigenous and tribal communities) through long-term leases or managementagreements.
Other form ofmanagement rights
Forests for which the transfer of management rights does not belong to any of the categories mentionedabove.
18.2 National data

FRA 2015 – Country Report, Trinidad and Tobago
80
18.2.1 Data sources
References to sourcesof information
Variables Years Additional comments
1 Forest Resource Inventoryand Management SectionInventory of the indigenousForests of Trinidad andTobago 1980. Government ofTrinidad and Tobago
Forest cover, forest typeclassification, land use/coverchange
1970 Inventory of all public forestsusing Aerial photographyfrom 1969 and ground truthin 1979
2 Internal Records DrawingOffice Forestry Division
Forest cover, 1994 Aerial photography of forestreserves.
3 Caribbean islandterrestrial habitatsscitec.uwichill.edu.bb/bcs/courses/ Ecology
Definitions 2005 N/A
4 National geographicsociety, and WWF.Terrestrial ecoregionsin the world. http://www.worldwildlife.org/wildworld
Definitions 2005 Refers to dry forestdescription
18.2.2 Classification and definitions
National class Definition
N/A N/A
N/A N/A
N/A N/A
N/A N/A
18.2.3 Original data
NOTE TO 18.2.2
As presented in 1.2.2.
________________________
See 1.2.3.
18.3 Analysis and processing of national data

FRA 2015 – Country Report, Trinidad and Tobago
81
18.3.1 Adjustment
18.3.2 Estimation and forecasting
The same rate of forest loss over the period 1970 to 1994 was used in forecasting for the relevant years. Pleasenote that the total area under administration of the Forestry Division is still 255,688 ha of lands.
18.3.3 Reclassification
Nationalclasses
1970
ha a
1994
ha b
1990¹
ha c
2000¹
ha d
2005¹
ha e
2010
EvergreenSeasonalForest
98180 88718 90295 86352 84381 82410
Semi-evergreenseasonalforest
13928 12586 12810 12251 11971 11691
DeciduousSeasonalForests
3617 3268 3326 3181 3108 3035
Dryevergreenforests
495 447 455 435 425 415
Seasonalmontaneforests
926 837 852 815 796 778
Montaneforests
21619 19535 19882 19014 18580 18146
Swampforests
16789 15171 15441 14767 14429 14092
Secondaryforests
22650 20467 20831 19921 19466 19012
Teakand pineplantations
16308 15000 15000 15000 15000 15000
Otherplantations
5306 5306 5306 5306 5306 5306

FRA 2015 – Country Report, Trinidad and Tobago
82
Bamboo 528 528 528 528 528 528
PublicForests(totalabove)
200346 181863 184726 177570 173989 170413
Privateforests
56000 56000 56000 56000 56000 56000
Totalforests
256346 237863 240726 233570 229989 226413
18.4 DataTable 18a
Forest area (1000 hectares)Categories
1990 2000 2005 2010
Public ownership 184.7 177.6 174 N/A
... of which ownedby the state atnational scale
N/A N/A N/A N/A
... of which ownedby the state atthe sub-nationalgovernment scale
N/A N/A N/A N/A
Private ownership 56 56 56 N/A
... of which ownedby individuals
N/A N/A N/A N/A
... of which ownedby private businessentities andinstitutions
N/A N/A N/A N/A
... of which ownedby local, tribaland indigenouscommunities
N/A N/A N/A N/A
Unknownownership
0 0 0 N/A
TOTAL 240.70 233.60 230.00 .00
Tiers
Category Tier for status Tier for reported trend

FRA 2015 – Country Report, Trinidad and Tobago
83
Public ownership Tier 2 Tier 2
Private ownership Tier 2 Tier 2
Unknown ownership N/A N/A
Tier criteria
Category Tier for status Tier for reported trend
Ownership Tier 3: National forestry statistics registersof land titles or maps on land ownershipor all forest area under one ownershipcategory that is five years old or less. Tier2:National forestry statistics registers ofland titles or maps on land ownership orquestionnaires that are more than fiveyears old. Tier 1: Other
Tier 3 : Estimate based on repeatedcompatible tiers 3 (tier for status) Tier 2 :Estimate based on repeated compatible tier2 or combination tier 3 and 2 or 1 (tier forstatus) Tier 1 : Other
Table 18b - Holder of management rights of public forests
Forest area (000 hectares)Categories
1990 2000 2005 2010
Public Administration 184.7 177.6 174 N/A
Individuals 0 0 0 N/A
Private companies 0 0 0 N/A
Communities 0 0 0 N/A
Other 0 0 0 N/A
TOTAL 184.70 177.60 174.00 .00
Category Tier for reported trend Tier for status
Public Administration N/A N/A
Individuals N/A N/A
Private companies N/A N/A
Communities N/A N/A
Other N/A N/A
18.5 Comments
CategoryComments related todata definitions etc
Comments on the reported trend

FRA 2015 – Country Report, Trinidad and Tobago
84
Public ownership All forests that are owned by the statewhich includes statelands and forestreserves
The total land area controlled by the Stateis fixed at 255,688 ha but due to squattingand illegal quarrying etc the area beingreported is reduced.
Private ownership Forest lands owned by private individualsand companies. Could not separate thatowned by individuals and that owned bycompanies
N/A
Unknown ownership N/A N/A
Management rights N/A N/A
Other general comments to the table
N/A

FRA 2015 – Country Report, Trinidad and Tobago
85
19. How many people are directly employed in forestry?Documents for this question:
• Guide for country reporting FRA 2015• FRA 2015 Terms and Definitions
19.1 Categories and definitions
Category Definition
Full-time equivalents(FTE)
A measurement equal to one person working full-time during a specified reference period.
Employment in forestry Employment in activities related to production of goods derived from forests. This category correspondsto the ISIC/NACE Rev. 4 activity A02 (Forestry and logging).
19.2 National data
19.2.1 Data sources
References to sourcesof information
Variables Years Additional comments
1 N/A N/A N/A N/A
2 N/A N/A N/A N/A
3 N/A N/A N/A N/A
4 N/A N/A N/A N/A
19.2.2 Classification and definitions
National class Definition
N/A N/A
N/A N/A
N/A N/A
N/A N/A
19.2.3 Original data
19.3 DataTable 19
Category Employment (000 years FTE)

FRA 2015 – Country Report, Trinidad and Tobago
86
1990 2000 2005 2010
Employment inforestry
1.3 1.4 1.4 N/A
... of which female N/A N/A N/A N/A
19.4 Comments
CategoryComments related todata definitions etc
Comments on the reported trend
Employment in forestry N/A N/A
Other general comments to the table
N/A

FRA 2015 – Country Report, Trinidad and Tobago
87
20. What is the contribution of forestry to Gross Domestic Product (GDP)?Documents for this question:
• Guide for country reporting FRA 2015• FRA 2015 Terms and Definitions
20.1 Categories and definitions
Category Definition
Gross value added fromforestry (at basic prices)
This category corresponds to the ISIC/NACE Rev. 4 activity A02 (Forestry and logging).
20.2 DataTable 20 (Pre-filled data from UNdata/EUROSTAT)
Category Million CurrencyYear for latest
available information
Gross value added fromforestry (at basic prices)
86 Trinidad and Tobago dollar 2009
20.3 Comments
Category Comments
Gross value added from forestry (at basic prices) N/A
Other general comments

FRA 2015 – Country Report, Trinidad and Tobago
88
21. What is forest area likely to be in the futureDocuments for this question:
• Guide for country reporting FRA 2015• FRA 2015 Terms and Definitions
21.1 Categories and definitions
Category Definition
Government target/aspiration for forest area
Government target/aspiration for forest area for a specific year.
Forests earmarked forconversion
Forest area that is allocated/classified or scheduled to be converted into non-forest uses.
21.2 National data
21.2.1 Data sources
References to sourcesof information
Variables Years Additional comments
1 N/A N/A N/A N/A
2 N/A N/A N/A N/A
3 N/A N/A N/A N/A
4 N/A N/A N/A N/A
21.3 DataTable 21a
Forest area (000 ha)Category
2020 2030
Government target/aspiration for forestarea
N/A N/A
Table 21b
Forest area (000 ha)Category
2013
Forests earmarked for conversion N/A
21.4 Comments
Category Comments
Government target/aspiration for forest area N/A

FRA 2015 – Country Report, Trinidad and Tobago
89
Forests earmarked for conversion N/A
Other general comments