Embed Size (px)
Citation preview

Italy
GLOBAL FOREST RESOURCES ASSESSMENT 2015
COUNTRY REPORT
Rome, 2014

FAO, at the request of its member countries, regularly monitors the world´s forests and theirmanagement and uses through the Global Forest Resources Assessment (FRA). This country reportis prepared as a contribution to the FAO publication, the Global Forest Resources Assessment 2015(FRA 2015).The content and the structure are in accordance with the recommendations and guidelines given byFAO in the document Guide for country reporting for FRA 2015 (http://www.fao.org/3/a-au190e.pdf).These reports were submitted to FAO as official government documents.
The content and the views expressed in this report are the responsibility of the entity submitting thereport to FAO. FAO may not be held responsible for the use which may be made of the informationcontained in this report.

FRA 2015 – Country Report, Italy
3
TABLE OF CONTENTSReport preparation and contact persons...............................................................................................................................41. What is the area of forest and other wooded land and how has it changed over time? ................................................. 52. What is the area of natural and planted forest and how has it changed over time? ..................................................... 153. What are the stocks and growth rates of the forests and how have they changed? .....................................................234. What is the status of forest production and how has it changed over time? .................................................................505. How much forest area is managed for protection of soil and water and ecosystem services? ..................................... 576. How much forest area is protected and designated for the conservation of biodiversity and how has it changed overtime? ................................................................................................................................................................................... 627. What is the area of forest affected by woody invasive species? .................................................................................. 668. How much forest area is damaged each year? ............................................................................................................ 699. What is the forest area with reduced canopy cover? ....................................................................................................7310. What forest policy and regulatory framework exists to support implementation of sustainable forest managementSFM? .................................................................................................................................................................................. 7411. Is there a national platform that promotes stakeholder participation in forest policy development? ............................ 7712. What is the forest area intended to be in permanent forest land use and how has it changed over time? .................. 7913. How does your country measure and report progress towards SFM at the national level? ........................................ 8314. What is the area of forest under a forest management plan and how is this monitored? ........................................... 8615. How are stakeholders involved in the management decision making for publicly owned forests? .............................. 8916. What is the area of forest under an independently verified forest certification scheme? .............................................9117. How much money do governments collect from and spend on forests? .....................................................................9318. Who owns and manages the forests and how has this changed? ..............................................................................9519. How many people are directly employed in forestry? ............................................................................................... 10120. What is the contribution of forestry to Gross Domestic Product (GDP)? ...................................................................10321. What is forest area likely to be in the future ............................................................................................................. 104

FRA 2015 – Country Report, Italy
4
Report preparation and contact personsContact personsThe present report was prepared by the following person(s)
Name (FAMILYNAME, first name)
Institution/address Email Tables
MARIANO Angelo Corpo forestale dello Stato [email protected] All
GASPARINI Patrizia CRA - Unità di ricercaper il Monitoraggio e laPianificazione forestale
[email protected] 1,2,3,4,5,6,7,12, 13, 14, 18
DE NATALE Flora CRA - Unità di Ricerca per laClimatologia e la Meteorologiaapplicate all'Agricoltura
[email protected] 1,2,3,4,5,6,7,12, 13, 14, 18
ROMANO Raoul Istituto Nazionale di EconomiaAgraria (INEA)
[email protected] 10,11,15,17
AMMASSARI Paolo Ministero delle politicheagricole, alimentari e forestali(MIPAAF)
[email protected] 10,11,13,15
LIBERATI Davide Ministero delle politicheagricole, alimentari e forestali(MIPAAF)
[email protected] 10,11,13,15
BALLIN Marco Istituto Statistico Nazionale(ISTAT)
[email protected] 19,20
VITULLO Marina ISPRA - Institute forEnvironmental Protection andResearch
Introductory TextPlace an introductory text on the content of this report
Desk Study?
Check "yes" if this survey is a Desk Study, "no" otherwise
Desk Study? no

FRA 2015 – Country Report, Italy
5
1. What is the area of forest and other wooded land and how has it changed over time?Documents for this question:
• Guide for country reporting FRA 2015• FRA 2015 Terms and Definitions
1.1 Categories and definitions
Category Definition
Forest Land spanning more than 0.5 hectares with trees higher than 5 meters and a canopy cover of more than10 percent or trees able to reach these thresholds in situ. It does not include land that is predominantlyunder agricultural or urban land use.
Other wooded land Land not classified as "Forest" spanning more than 0.5 hectares with trees higher than 5 meters anda canopy cover of 5-10 percent or trees able to reach these thresholds ; or with a combined coverof shrubs bushes and trees above 10 percent. It does not include land that is predominantly underagricultural or urban land use.
Other land All land that is not classified as "Forest" or "Other wooded land".
...of which with tree cover(sub-category)
Land considered as "Other land", that is predominantly agricultural or urban lands use and has patchesof tree cover that span more than 0.5 hectares with a canopy cover of more than 10 percent of trees ableto reach a height of 5 meters at maturity. It includes bothe forest and non-forest tree species.
Inland water bodies Inland water bodies generally include major rivers, lakes and water reservoirs.
Forest expansion Expansion of forest on land that, until then, was not defined as forest.
...of which afforestation(sub-category)
Establishment of forest through planting and/or deliberate seeding on land that, until then, was notdefined as forest.
...of which naturalexpansion of forest (sub-category)
Expansion of forests through natural succession on land that, until then, was under another land use(e.g. forest succession on land previously used for agriculture).
Deforestation The conversion of forest to other land use or the longterm reduction of the tree canopy cover below theminimum 10 percent threshold.
...of which humaninduced (sub-category)
Human induced conversion of forest to other land use or the permanent reduction of the tree canopycover below the minimum 10 percent threshold.
Reforestation Natural regeneration or re-establishment of forest through planting and/or deliberate seeding on landalready in forest land use.
...of which artificialreforestation (sub-category)
Re-establishment of forest through planting and/or deliberate seeding on land already in forest land use.
1.2 National data
1.2.1 Data sources
References to sourcesof information
Variables Years Additional comments
1 Ministero dell’Agricolturae delle Foreste - ISAFA.1988. Inventario ForestaleNazionale. Sintesimetodologica e risultati.
Forest; Other WoodedLand; Forest extent; NaturalRegeneration
1985 Hereinafter NFI1985

FRA 2015 – Country Report, Italy
6
2 Gasparini P. Tabacchi G.,2011(eds). L’InventarioNazionale delle Foreste edei Serbatoi Forestali diCarbonio (INFC-2005).MiPAAF-CFS, CRA-MPF. Edagricole, Milano.http://www.sian.it/inventarioforestale/jsp/home.jsp
Forest; Other WoodedLand Forest extent; NaturalRegeneration
2005 Hereinafter NFI1985
3 CFS-CRA, INFC2015,provisional results ofphotointerpretation (firstphase of the NFI survey)
Forest area 2015 Hereinafter NFI1985
4 FAOSTAT Total area; Inland water 1990 2000 2005 N/A
5 De Natale F. et al., 2003 -Stima del grado di coperturaforestale da ortofoto eapplicazione della definizionedi bosco negli InventariForestali. L'Italia Forestale eMontana n°4: 289-300.
Forest definitionscomparability
2003 N/A
6 Administrative data fromRegional Rural DevelopmentProgrammes .Source Ministryof Agriculture/NationalInstitute of AgriculturalEconomy
Afforestation 1994/2000 2001/20062007/2012
N/A
1.2.2 Classification and definitions
National class Definition
High forest Forest normally composed of trees originated by seeds.
Coppice Forest mainly composed of sprouts or root suckers.
Plantations and specialised stands - For wood production (e.g.: poplars and others rapid-growthspecies). - For non-wood production (e.g.: chestnut and corkoak).
Particular woody ecosystems: riparian and rupicolous forests Forest located along rivers or on rocky sites characterised by acrown cover of at least 20% and mainly composed by trees.
Particular woody ecosystems: shrubs Other wooded land mainly composed by shrubs.
Temporary unstocked areas Areas temporarily unstocked due to forest harvest, fire or otherdisturbances
Included areas Bare patches of land included in forest (smaller than 0.2 ha).
Afforestation Plantations established on other land
FRA 2015 – Country Report, Italy
7
N/A < 1%) which have not been taken into account in the presentreport. " /> While the definitions of forest resources adopted by2005 NFI are fully consistent with FRA ones, 1985 NFI adopteda lower threshold for area (2000 m2) and a higher threshold forcrown cover (20%). Nevertheless, an experimental study (seesource De Natale et al.,2003) led to the conclusion that the useof such different definitions implies only negligible differencesin terms of area estimates (< 1%) which have not been taken intoaccount in the present report.
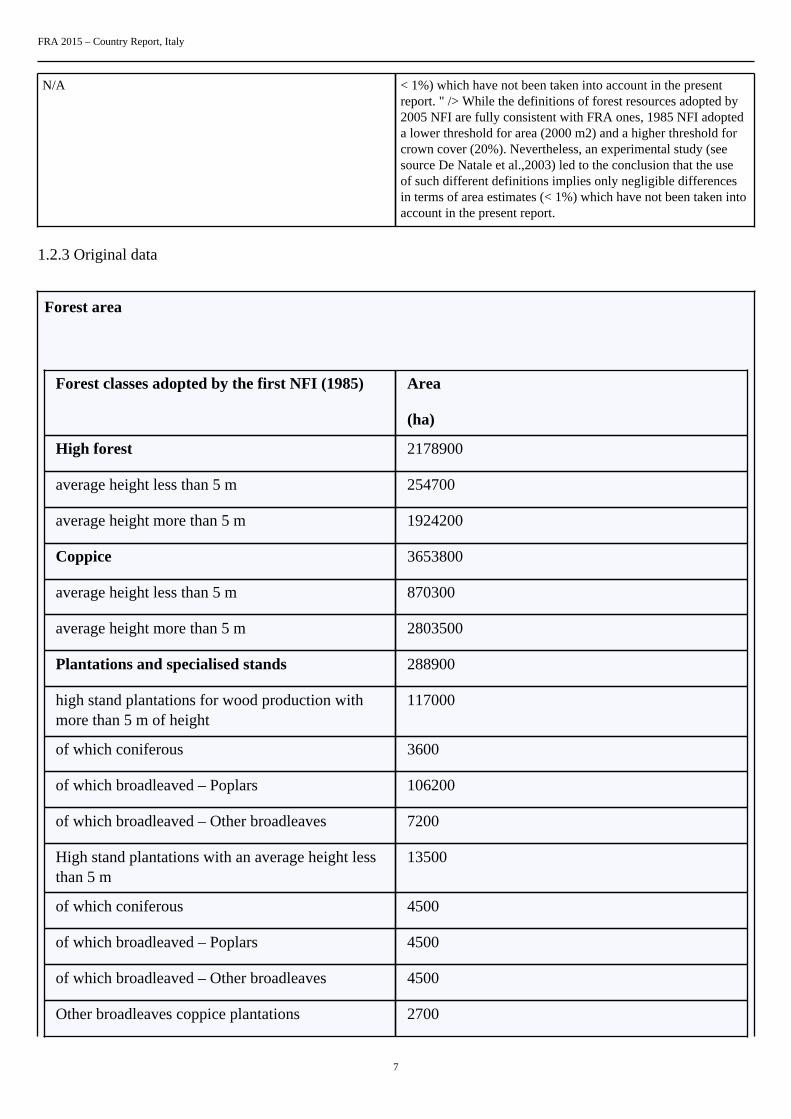
1.2.3 Original data
Forest area
Forest classes adopted by the first NFI (1985) Area
(ha)
High forest 2178900
average height less than 5 m 254700
average height more than 5 m 1924200
Coppice 3653800
average height less than 5 m 870300
average height more than 5 m 2803500
Plantations and specialised stands 288900
high stand plantations for wood production withmore than 5 m of height
117000
of which coniferous 3600
of which broadleaved – Poplars 106200
of which broadleaved – Other broadleaves 7200
High stand plantations with an average height lessthan 5 m
13500
of which coniferous 4500
of which broadleaved – Poplars 4500
of which broadleaved – Other broadleaves 4500
Other broadleaves coppice plantations 2700

FRA 2015 – Country Report, Italy
8
Eucalyptus coppice plantations 900
Chestnut stands for fruit production 90000
Cork oak stands 64800
Particular woody ecosystems: riparian andrupicolous forests
Riparian forests 110700
Rupicolous forests 575100
Particular woody ecosystems: shrubs 1475100
Temporary unstocked areas 99000
Included areas 273600
Forest classes adopted by the second NFI (2005) Area
(ha)
Forest 8759200
Other Wooded Land 1708333
Forest classes adopted by the second NFI (2015)
(provisional estimates)
Area
(ha)
Forest
9297078
Other Wooded Land
1813237
Forest expansion, reforestation

FRA 2015 – Country Report, Italy
9
AfforestationReference
period Total Of which
Introduced Species
Natural regeneration
ha ha ha
1994/2000 104142 22730
2001/2006 54134 10999
2007/2012 10374 4473
1985 2700
2005 3000
Data on total afforestation refer to plantations made in the context of Rural Development Projects co-financedby the European Union; data on natural regeneration refer to high forests and come from NFI statistics.
Deforestation
On the basis of the NFI 2005 results and of the preliminary estimates of the ongoing NFI (2015) it has beenpossible to estimate the deforestation rate for the period (2005-2015). This in average is equal to 3695 hectaresper year and has been reported in the table 1b as the 2010 value. This deforestation is deemed to human activitiesand therefore the same value has been repeated in the human induced cell.
1.3 Analysis and processing of national data
1.3.1 Adjustment
None needed.
1.3.2 Estimation and forecasting
Forest area
The estimation for 1990 and 2000 was made through a linear interpolation between the 1985 and 2005 data.The estimation for 2010 and 2015 was derived by a linear interpolation of 2005 and provisional data fromthe on-going photo-interpretation phase of NFI2015. Calculations carried out on data reclassified as shown innext paragraph.
Forest expansion, reforestation

FRA 2015 – Country Report, Italy
10
The extent of high forest natural regeneration is reported by NFI’s 1985 and 2005. Being this phenomenonstable in time, 1985’s data has been used for 1990. As concerns the remaining reporting years, 2005’s datahas been used.
Reforestation due to replanting of former poplar plantations (characterised by hybrids of introduced species)has been estimated by an expert respectively equal to 4 400, 3 300, 3 000 and 2 700 for the reporting periods.
Average annual rate of afforestation for the reporting years has been calculated from the data in the table 1.2.3.“ Forest expansion, reforestation” (section original data) on the basis of weighed averages derived as follows:
• YEAR 2000• Total afforestation ((104 142/7)*3+(54 134/6)*2)/5 = 12 535 ha• Afforestation of introduced species ((22 730/7)*3+(10 999/6)*2)/5 = 2 682 ha
• YEAR 2005• Total afforestation ((54 134/6)*4+(10 374/6))/5 = 7 564 ha• Afforestation of introduced species ((10 999/6)*3+(4 473/6)*2)/5 = 1 616 ha
• YEAR 2010• Total afforestation: 10 374/6= 1 729 ha• Afforestation of introduced species: 4473/6= 746 ha
The net annual rate of overall forest increase, based on NFI data is: 77 960 ha in the period 1990-2005, 53 788ha in the period 2006-2015. To better describe the actual phenomenon of forest expansion and to avoid abruptvariations due to the length of the period between two different forest inventories, particularly between the firstand the second NFI, the 2005 rate was estimated as the average of the two above mentioned periods. As a resultit is not consistent with the expansion rate resulting from the difference between the absolute extent of forestarea in the years 1985 and 2005.
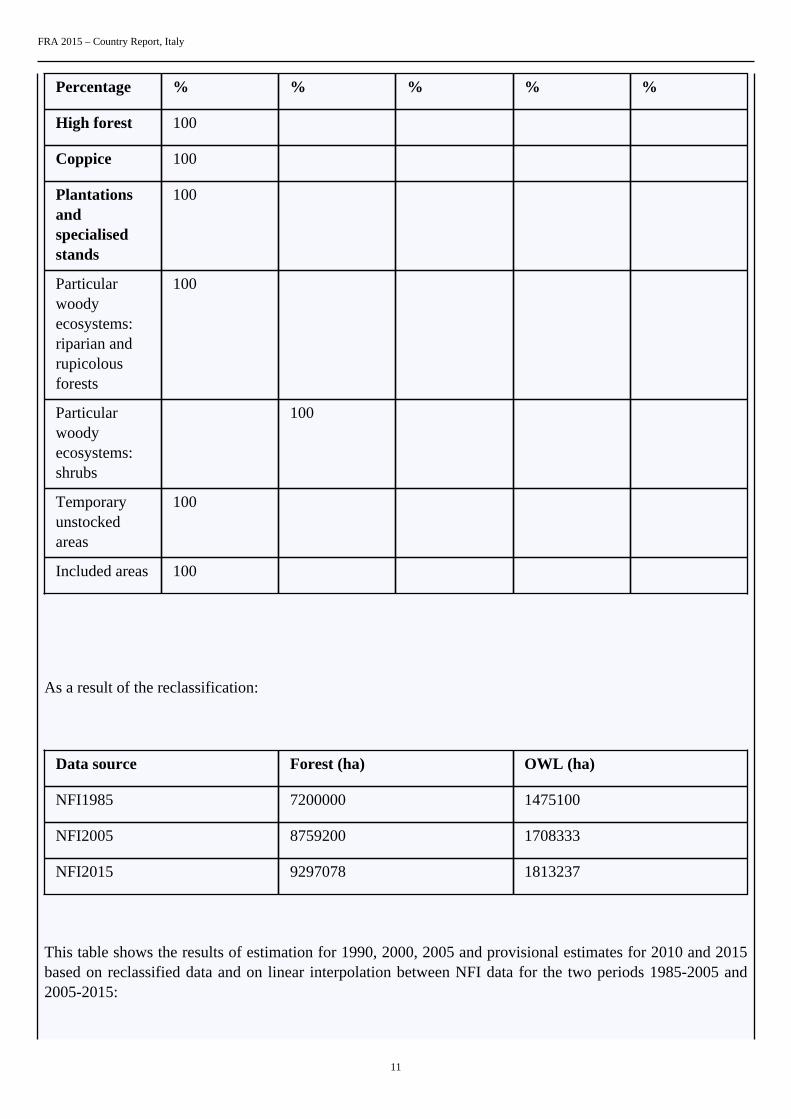
1.3.3 Reclassification
Forest area
The findings of the first NFI (1985) have been reclassified according to FRA categories. While 2005 data weredirectly used being fully consistent with FRA definitions.
Reclassification (Percentage allocation) into FRA classes
NationalLand use
Percentage of a National class belonging to a FRA Class
Other LandClasses 1985 Forest OtherWoodedLand Total Other Land
with TreeCover
Inland Water
FRA 2015 – Country Report, Italy
11
Percentage % % % % %
High forest 100
Coppice 100
Plantationsandspecialisedstands
100
Particularwoodyecosystems:riparian andrupicolousforests
100
Particularwoodyecosystems:shrubs
100
Temporaryunstockedareas
100
Included areas 100
As a result of the reclassification:
Data source Forest (ha) OWL (ha)
NFI1985 7200000 1475100
NFI2005 8759200 1708333
NFI2015 9297078 1813237
This table shows the results of estimation for 1990, 2000, 2005 and provisional estimates for 2010 and 2015based on reclassified data and on linear interpolation between NFI data for the two periods 1985-2005 and2005-2015:

FRA 2015 – Country Report, Italy
12
Years Forest (ha) OWL (ha)
1990 7589800 1533408
2000 8369400 1650025
2005 8759200 1708333
2010 9028139 1760785
2015 9297078 1813237
Forest expansion, reforestation
None.
Preliminary estimates based on partial photo interpretation
1.4 DataTable 1a
Area (000 hectares)Categories
1990 2000 2005 2010 2015
Forest 7590 8369 8759 9028 9297
Other wooded land 1533 1650 1708 1761 1813
Other land 20291 19395 18947 18625 18304
... of which with tree cover N/A N/A N/A N/A N/A
Inland water bodies 720 720 720 720 720
TOTAL 30134.00 30134.00 30134.00 30134.00 30134.00
Table 1bAnnual forest establishment /loss (000 hectares per year)
...of which of introducedspecies (000 hectares per year)
Categories
1990 2000 2005 2010 1990 2000 2005 2010
Forest expansion N/A 78 63.5 53.8 N/A N/A N/A N/A
... of which afforestation N/A 12.5 7.6 1.7 N/A 2.7 1.6 0.7

FRA 2015 – Country Report, Italy
13
... of which natural
expansion of forest
N/A 65.4 55.9 52.1 N/A N/A N/A N/A
Deforestation N/A N/A N/A 3.69 N/A N/A N/A N/A
... of which human induced N/A N/A N/A 3.69 N/A N/A N/A N/A
Reforestation 7.1 6.3 6 5.7 4.4 3.3 3 2.7
... of which artificial 4.4 3.3 3 2.7 4.4 3.3 3 2.7
Tiers
Category Tier for status Tier for reported trend
Forest Tier 3 Tier 3
Other wooded land Tier 3 Tier 3
Forest expansion Tier 3 Tier 3
Deforestation Tier 3 Tier 1
Reforestation Tier 1 Tier 1
Tier criteria
Category Tier for status Tier for reported trend
• Forest• Other wooded land• Afforestation• Reforestation• Natural expansion of forest• Deforestation
Tier 3 : Data sources: Either recent(less than 10 years ago) National ForestInventory or remote sensing, with groundtruthing, or programme for repeatedcompatible NFIs Tier 2 : Data sources:Full cover mapping / remote sensing orold NFI (more than 10 years ago) Tier 1 :Other
Tier 3 : Estimate based on repeatedcompatible tiers 3 (tier for status) Tier 2 :Estimate based on repeated compatible tier2 or combination tier 3 and 2 or 1 (tier forstatus) Tier 1 : Other
1.5 Comments
CategoryComments related todata definitions etc
Comments on the reported trends
Forest The Forest Inventory carried out in1985, applied the following thresholdsto define “Forest land”: • Minimum area- 2 000 square meters • Minimum width- 20 m • Minimum crown density - 20%While INFC 2005 adopted definitions andthresholds fully compatible with FRA2005 ones.
The availability of new, even if partial,NFI data on forest resources allows arevision of FRA2010 estimation. As aresult, their extent referring to 2010 hasslightly decreased. The combination of lasttwo sets of NFI data shows also a decreaseof the annual increment versus whatreported in FRA2010. As already statedin FRA2005 and 2010, forest expansionis mainly due to abandonment of formeragricultural lands and pastures.

FRA 2015 – Country Report, Italy
14
Other wooded land As the definition of OWL was not yetexisting at the time, the 1985 NFI didnot report any data on this class. As aconsequence, the class “Particular woodyecosystems - shrubs” has been assigned toOWL, after expert estimation.
The trend of OWL is in line with the onecharacterizing the forest area
Other land Calculated by subtracting the extent offorest, other wooded land and inland waterbodies from total country surface reportedin FAOSTAT.
N/A
Other land with tree cover N/A N/A
Inland water bodies Data from FAOSTAT database. N/A
Forest expansion Derived variable Afforestation The onlyreliable data on afforestation refers tothe interventions funded under the RuralDevelopment Schemes adopted by ItalianRegions and approved by the EuropeanCommission. The major part of theseplantations are based on autochthonousspecies. As a result, this estimation canbe considered partial and does not takeinto account other undetected activities ofafforestation.
Linear trend due to the estimationmethod adopted Afforestation The trend isinfluenced by rural development policy.
Deforestation Just a small amount of the deforestationhas been detected in last decades. No dataavailable for previous reporting years.
N/A
Reforestation Natural Forest under coppice managementnot included in the estimation.
N/A
Other general comments to the table
Thanks to NFI2005 and the just started third NFI (NFI2015) the figures reported in the present report are much more reliablethan the previous Italian FRA releases. 2015 figures are based on provisional estimates (derived from the first phase – photo-interpretation - of the third NFI, no ground truth available at present). 1990, 2000 and 2010 figures are all based on interpolation ofNFI data.

FRA 2015 – Country Report, Italy
15
2. What is the area of natural and planted forest and how has it changed over time?Documents for this question:
• Guide for country reporting FRA 2015• FRA 2015 Terms and Definitions
2.1 Categories and definitions
Term Definition
Naturally regeneratedforest
Forest predominantly composed of trees established through natural regeneration.
Naturalized introducedspecies
Other naturally regenerated forest where the tree species are predominantly non-native and do not needhuman help to reproduce/maintain populations over time.
Introduced species A species, subspecies or lower taxon occurring outside its natural range (past or present) and dispersalpotential (i.e. outside the range it occupies naturally or could occupy without direct or indirectintroduction or care by humans).
Category Definition
Primary forest Naturally regenerated forest of native species where there are no clearly visible indications of humanactivities and the ecological processes are not significantly disturbed.
Other naturallyregenerated forest
Naturally regenerated forest where there are clearly visible indications of human activities.
...of which of introducedspecies (sub-category)
Other naturally regenerated forest where the trees are predominantly of introduced species.
...of which naturalized(sub-sub category)
Other naturally regenerated forest where the trees are predominantly of naturalized introduced species.
Planted forest Forest predominantly composed of trees established through planting and/or deliberate seeding.
...of which of introducedspecies (sub-category)
Planted forest where the planted/seeded trees are predominantly of introduced species.
Mangroves Area of forest and other wooded land with mangrove vegetation.
...of which planted (sub-category)
Mangroves predominantly composed of trees established through planting.
2.2 National data
2.2.1 Data sources
References to sourcesof information
Variables Years Additional comments
1 Ministero dell’Agricolturae delle Foreste - ISAFA.1988. Inventario ForestaleNazionale. Sintesimetodologica e risultati.
Forest plantations; Forestarea
1985 Hereinafter NFI1985

FRA 2015 – Country Report, Italy
16
2 Gasparini P. Tabacchi G.,2011(eds). L’InventarioNazionale delle Foreste edei Serbatoi Forestali diCarbonio (INFC-2005).MiPAAF-CFS, CRA-MPF. Edagricole, Milano.http://www.sian.it/inventarioforestale/jsp/home.jsp
Forest origin Introducedspecies area
2005 Hereinafter NFI1985
3 CFS-CRA, INFC2015,provisional results ofphotointerpretation (firstphase of the NFI survey)
Forest area 2015 Hereinafter NFI1985
4 N/A N/A N/A N/A
2.2.2 Classification and definitions
National class Definition
Naturally originated forest Consistent with FRA 2005 definition of “modified natural forest”
Seminaturally originated forest Consistent with FRA 2005 definition of “semi natural forest”
Artificially originated forest Aggregated class including protective and productive plantationsof several species
Old-growth highly protected forest Forest located in the core areas of natural national parks
2.2.3 Original data
1985 data
National classes Area
(ha)
Forest Plantations (introduced species) 134100
Total Forest Area 7200000
2005 data

FRA 2015 – Country Report, Italy
17
National classes
Area
(ha)
Naturally originated forest
1485354
of which:
Old-growth highly protected forest 93127
Seminaturally originated forest
6671399
Artificially originated forest (planted forest) 602448
Forest dominated by invasive species (Black locustand Ailanthus altissima )
233553
Productive Plantations 122252
of which:
Poplar plantations 66269
Eucaliptus plantations 19626
Other broadleaves plantations 21359
Douglas plantations 2598
Pinus radiata plantations 2978
Other introduced coniferous plantations 1835
Indigenous conifers plantations 7587
Total Forest Area 8759200
2015 data

FRA 2015 – Country Report, Italy
18
National classes Area
(ha)
Total Forest Area (provisional estimate) 9297078
2.3 Analysis and processing of national data
2.3.1 Adjustment
No calibration was made.
2.3.2 Estimation and forecasting
The only usable information on primary forest is derivable from the 2005 NFI extent of old-growth forestecosystems located within core areas in national parks. Due to the fact that primary forest area can not increasein relatively short periods, the reported value of 93 127 ha must be considered the minimum documented extentfor the whole observation time. At the same time, as these ecosystems have been historically protected, it ispossible to assume that the cited value has not even decreased in recent years. Even if the reported figure isunderestimated because it only takes into account forest in protected areas, it has been preferred to the expertestimation (160 000 ha) mentioned in the FRA2005 report.
The area of self regenerated introduced species for the years 1990, 2000, 2010 and 2015 has been estimatedapplying the same percentage (black locust + ailanthus / Total of Other naturally regenerated Forest) retrieved
from the 2 nd NFI for the year 2005.
As regards planted forest, 1985 NFI provided information limited to productive plantations. The 1985 extent ofOther Planted Forest has been estimated applying the same ratio of Other Planted Forest against Total ForestArea found by 2005 NFI. This ratio is equal to 5.48%, being the 2005 extent of Other Planted Forest equalto 480 196 ha (Planted Forest minus Productive Plantations). Missing values for intermediate reporting yearshave been calculated by means of a linear interpolation while 2010 and 2015 figures for planted forest wereobtained by applying the same proportion of planted forest reported for 2005 to the updated total forest areafor those years.
The area of planted introduced species for the years 1990 and 2000 has been estimated by linear interpolationof 1985 and 2005 data; the latter has also been repeated for 2010 and 2015.
2.3.3 Reclassification

FRA 2015 – Country Report, Italy
19
Primary
Othernaturally
regenerated
Othernaturallyregenerated –
Introducedspecies
PlantedForest
PlantedForest
Introducedspecies
Naturallyoriginatedforest
Old-growthhighlyprotectedforest
100 %
Seminaturallyoriginatedforest
100%
Artificiallyoriginatedforest (plantedforest)
100%

FRA 2015 – Country Report, Italy
20
Forestdominatedby invasivespecies
(Black locustand Ailanthusaltissima )
100%
ProductivePlantations 100% Poplarplantations 100% 100%
Eucaliptusplantations 100% 100%
Otherbroadleavesplantations
100%
Douglasplantations 100% 100%
Pinus radiataplantations 100% 100%
Otherintroducedconiferousplantations
100% 100%
Indigenousconifersplantations
100%
2.4 DataTable 2a
Forest area (000 hectares)Categories
1990 2000 2005 2010 2015
Primary forest 93 93 93 93 93
Other naturally regeneratedforest
6950 7692 8064 8314 8565
... of which of introducedspecies
201 223 234 241 248

FRA 2015 – Country Report, Italy
21
... of which naturalized 201 223 234 241 248
Planted forest 547 584 602 621 639
... of which of introducedspecies
124 104 93 93 93
TOTAL 7590.00 8369.00 8759.00 9028.00 9297.00
Table 2b
Primary forest converted to (000 ha)
1990-2000 2000-2010 2010-2015
Othernatural
regenerationPlanted Other land
Othernatural
regenerationPlanted Other land
Othernatural
regenerationPlanted Other land
0 0 0 0 0 0 0 0 0
Table 2c
Area (000 hectares)Categories
1990 2000 2005 2010 2015
Mangroves (forest and OWL) 0 0 0 0 0
... of which planted 0 0 0 0 0
Tiers
Category Tier for status Tier for reported trend
Primary forest Tier 3 Tier 2
Other naturally regenerated forest Tier 3 Tier 2
Planted forest Tier 3 Tier 2
Mangroves Tier 3 Tier 3
Tier Criteria
Category Tier for status Tier for reported trend
Primary forest/Other naturally regeneratedforest/Planted forest
Tier 3 : Data sources: Recent (less than10 years) National Forest Inventory orremote sensing with ground truthing ordata provided by official agencies orprogramme for repeated compatible NFIsTier 2 : Data sources: Full cover mapping/remote sensing or old NFI (more than 10years) Tier 1 : Other
Tier 3 : Estimate based on repeatedcompatible tiers 3 (tier for status) Tier 2 :Estimate based on repeated compatible tier2 or combination tier 3 and 2 or 1 (tier forstatus) Tier 1 : Other

FRA 2015 – Country Report, Italy
22
2.5 Comments
CategoryComments related todata definitions etc
Comments on reported trend
Primary forest Italian primary forest is mainly locatedwithin the main protected areas managedby the State
The extent of Italian primary forestaccording with FRA definition is notwell known. Anyway such extent wasconsidered equal to forest cover incore areas of national parks. This datawas considered unvaried for the wholereporting period
Other naturally regenerating forest More than 90% of the Forest area belongsto this category. Seeding and planting arevery rarely applied.
The increase of this category is linked tothe general trend of forest area.
Planted forest Italian planted forest is mainlyrepresented by protective plantationsdevoted to prevention of soil erosion.Productive plantations, especially poplarstands, are important as well and representon average the 20% of the planted forest.The present estimation of planted foresthas been based on NFI-2005 final results,made available in 2007.
Due to the augmented attention towardsenvironmental protection, exotic speciesplantations are decreasing in extent.
Mangroves N/A N/A
Other general comments to the table
N/A
FRA 2015 – Country Report, Italy
23
3. What are the stocks and growth rates of the forests and how have they changed?Documents for this question:
• Guide for country reporting FRA 2015• FRA 2015 Terms and Definitions
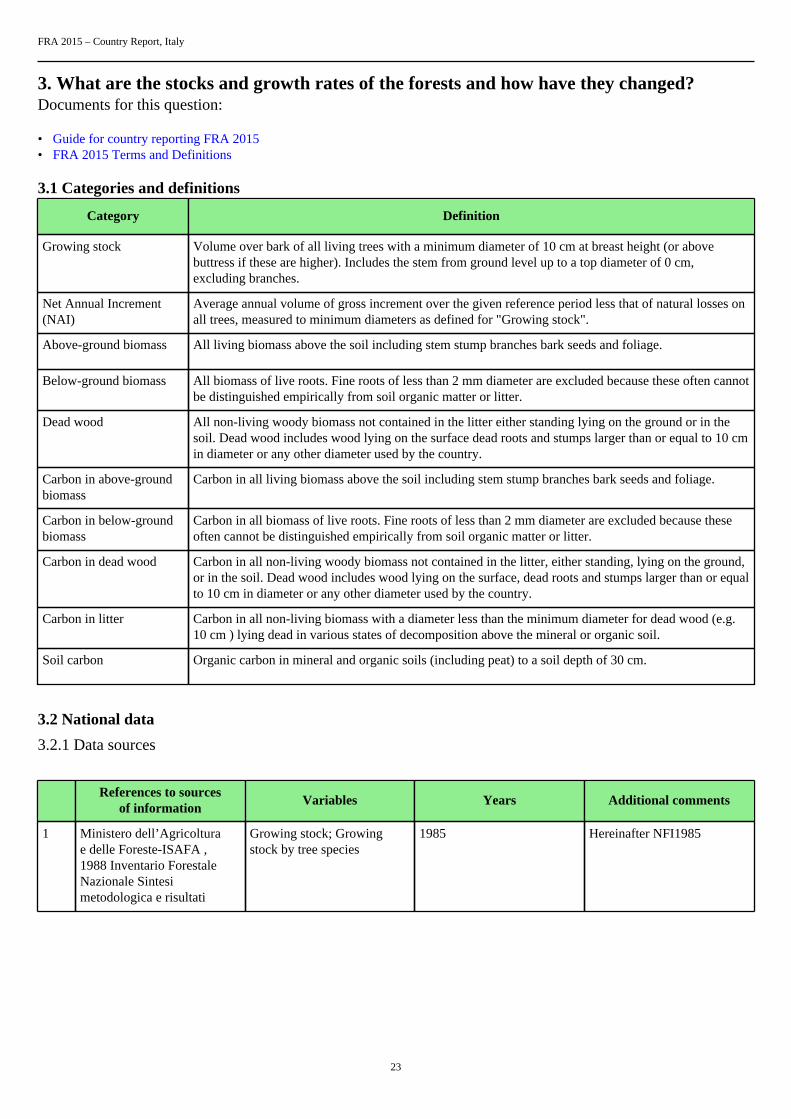
3.1 Categories and definitions
Category Definition
Growing stock Volume over bark of all living trees with a minimum diameter of 10 cm at breast height (or abovebuttress if these are higher). Includes the stem from ground level up to a top diameter of 0 cm,excluding branches.
Net Annual Increment(NAI)
Average annual volume of gross increment over the given reference period less that of natural losses onall trees, measured to minimum diameters as defined for "Growing stock".
Above-ground biomass All living biomass above the soil including stem stump branches bark seeds and foliage.
Below-ground biomass All biomass of live roots. Fine roots of less than 2 mm diameter are excluded because these often cannotbe distinguished empirically from soil organic matter or litter.
Dead wood All non-living woody biomass not contained in the litter either standing lying on the ground or in thesoil. Dead wood includes wood lying on the surface dead roots and stumps larger than or equal to 10 cmin diameter or any other diameter used by the country.
Carbon in above-groundbiomass
Carbon in all living biomass above the soil including stem stump branches bark seeds and foliage.
Carbon in below-groundbiomass
Carbon in all biomass of live roots. Fine roots of less than 2 mm diameter are excluded because theseoften cannot be distinguished empirically from soil organic matter or litter.
Carbon in dead wood Carbon in all non-living woody biomass not contained in the litter, either standing, lying on the ground,or in the soil. Dead wood includes wood lying on the surface, dead roots and stumps larger than or equalto 10 cm in diameter or any other diameter used by the country.
Carbon in litter Carbon in all non-living biomass with a diameter less than the minimum diameter for dead wood (e.g.10 cm ) lying dead in various states of decomposition above the mineral or organic soil.
Soil carbon Organic carbon in mineral and organic soils (including peat) to a soil depth of 30 cm.
3.2 National data
3.2.1 Data sources
References to sourcesof information
Variables Years Additional comments
1 Ministero dell’Agricolturae delle Foreste-ISAFA ,1988 Inventario ForestaleNazionale Sintesimetodologica e risultati
Growing stock; Growingstock by tree species
1985 Hereinafter NFI1985

FRA 2015 – Country Report, Italy
24
2 Gasparini P. Tabacchi G.,2011(eds). L’InventarioNazionale delle Foreste edei Serbatoi Forestali diCarbonio (INFC-2005).MiPAAF-CFS, CRA-MPF. Edagricole, Milano.http://www.sian.it/inventarioforestale/jsp/home.jsp
Growing stock; Growingstock by tree species
2005 Hereinafter NFI2005
3 CFS-CRA, INFC2015,provisional results ofphotointerpretation (firstphase of the NFI survey)
Forest area 2015 Hereinafter NFI2015
4 Fattorini L. et al., 2004– Above-ground treephytomass prediction andpreliminary shrub phytomassassessment in the foreststands of Trentino – SudiTrent, Sci.Nat., Acta Biol., 81(2004)
Phytomass of Forest trees andshrubs
2004 N/A
5 Tabacchi G., Di CosmoL., Gasparini P., 2011 -Aboveground tree volumeand phytomass predictionequations for forest speciesin Italy. European Journalof Forest Research, 130, 6:911-934.
Phytomass of Forest trees 2005 N/A
6 Tabacchi G., Di Cosmo L.,Gasparini P., Morelli S., 2011- Stima del volume e dellafitomassa delle principalispecie forestali italiane.Equazioni di previsione,tavole del volume e tavoledella fitomassa arboreaepigea. CRA-MPF Trento,ISBN 978-88-97081-11- 1,412 pp.
Phytomass of Forest trees 2005 N/A

FRA 2015 – Country Report, Italy
25
7 Gasparini P., Di Cosmo L.,Pompei E. (eds) 2013 - Ilcontenuto di carbonio delleforeste italiane. InventarioNazionale delle Foreste e deiserbatoi forestali di CarbonioINFC 2005. Metodi e risultatidell’indagine integrativa.Ministero delle PoliticheAgricole, Alimentari eForestali, Corpo Forestaledello Stato; Consiglio per laRicerca e la Sperimentazionein Agricoltura, Unità diricerca per il Monitoraggio ela Pianificazione Forestale.Trento, 260 pp. (Phase 3+ ofNFI2005)
Dead wood Litter CarbonSoil Carbon
2008 Hereinafter NFI2005additional survey
8 Tabacchi G., De Natale F.,Gasparini P. 2010 - Coerenzaed entità delle statisticheforestali. Sherwood, n. 165:11-19
Net Annual Increment Trendof Growing stock
1990-2010 N/A
9 Forest Europe, SOEF2011(National Report)
Forest type area 1990-2010 N/A
3.2.2 Classification and definitions
National class Definition
Growing stock Volume over bark of all living trees with a minimum diameter of4,5 cm at breast height. Excludes the stem from ground level upto a top diameter of 0 cm, including branches.
Net annual increment (NAI) Consistent with FRA one
Above-ground biomass Consistent with FRA one
Below-ground biomass Consistent with FRA one
Dead wood 4,5 cm." /> All non-living woody biomass not contained in thelitter, either standing, lying on the ground, or in the soil. Deadwood includes wood lying on the surface, dead roots, stumpslarger than or equal to 10 cm in diameter and standing trees withDBH > 4,5 cm.
Carbon in above-ground biomass Consistent with FRA one
Carbon in below-ground biomass Consistent with FRA one
Carbon in dead wood 4,5 cm." /> Carbon in all non-living woody biomass notcontained in the litter, either standing, lying on the ground, orin the soil. Dead wood includes wood lying on the surface, deadroots, stumps larger than or equal to 10 cm in diameter andstanding trees with DBH > 4,5 cm.

FRA 2015 – Country Report, Italy
26
Carbon in litter Consistent with FRA one
Soil carbon Consistent with FRA one
3.2.3 Original data
•
Growing stock
NFI 1985
Forest classes 1 Area
(ha)
Volume/ha
( m 3/ha)
Total volume
( m 3)
High forest
average height less than5 m
254700 n.a.* n.a.*
average height morethan 5 m
1924200 211
405720472
Of which conifers:
- Norway spruce n.s.* n.s.* 117543379
- Silver fir n.s.* n.s.* 23245024
- Larches n.s.* n.s.* 49017886
- Mountain pines n.s.* n.s.* 49974017
- Mediterranean pines n.s.* n.s.* 13365769
- Other conifers n.s.* n.s.* 3021422
Of which broadleaves:
- Beech n.s.* n.s.* 70243581

FRA 2015 – Country Report, Italy
27
- Turkey oak n.s.* n.s.* 16443298
- Other oaks n.s.* n.s.* 20587540
- Other broadleaves n.s.* n.s.* 42278552
Coppice
average height less than5 m
870300 n.a.* n.a.*
average height morethan 5 m
2803500 115 323391713
Of which conifers n.s.* n.s.* 11409590
Of which broadleaves:
- Beech n.s.* n.s.* 60939254
- Chestnut n.s.* n.s.* 74612238
- Hornbeams sp. n.s.* n.s.* 28940076
- Other oaks n.s.* n.s.* 33857781
- Turkey oak n.s.* n.s.* 36594099
- Evergreen oaks n.s.* n.s.* 16446998
- Other broadleaves n.s.* n.s.* 60591673
Plantations andspecialised stands
high stand plantationsfor wood production
117000 95 11148402
of which coniferous 3600 n.a.* 436960
of which broadleaved:
- Poplars 106200 n.a.* 10100841
- Other broadleaves 7200 n.a.* 610600
High stand plantationswith an average heightless than 5 m
13500 n.a.* n.a.*
Of which coniferous 4500 n.a.* n.a.*
Of which broadleaved

FRA 2015 – Country Report, Italy
28
- Poplars 4500 n.a.* n.a.*
- Other broadleaves 4500 n.a.* n.a.*
Other broadleavescoppice plantations
2700 58.3 157410
Eucalyptus coppiceplantations
900 n.a.* n.a.*
Chestnut stands forfruit production
90000 n.a.* n.a.*
Cork oak stands 64800 n.a.* n.a.*
Particular woodyecosystems: riparianand rupicolous forests
Riparian forests 110700 n.a.* n.a.*
Rupicolous forests 575100 n.a.* n.a.*
Particular woodyecosystems: shrubs
1475100 n.a.** n.a.**
Temporary unstockedareas
99000 n.s.** n.s.**
Included areas 273600 n.s.** n.s.**
Source: First Italian NFI (1985 data)
1. For Forest classes definitions refer to table 1 (Forest area)
n.s.* original data of growing stock refers to individual trees. Thus, area or density are not significant;
n.s.** bare land;
n.a.* data not originally available: this information will be derived combining area from the 1 stNFI and average
volume/ha from the 2 ndNFI ;
n.a. ** data not originally available: it will be estimated combining the results of 1 stNFI , 2 ndNFI and someresearch projects.
Moreover, other pieces of information contained in 1985 NFI and useful for growing stock calculation are:
• percentage of Rupicolous forest dominated by conifers: 26.9%• percentage of Rupicolous forest dominated by broadleaves: 73.1%

FRA 2015 – Country Report, Italy
29
NFI 2005
Forestclasses Area
(ha)
Volume/ha
(m 3 /ha)
dbh>10 cm
Total volume
( m 3)
dbh>10 cm
Total 10467533 n.a.*** n.a.***
Forest 8759200 134.0
1174061038
Other wooded Land 1708333 n.a.*** n.a.***
Forest ConiferousVolume*
n.s.* n.s.* 453779359
Forest BroadleavedVolume*
n.s.* n.s.* 720281679
Commercial species* n.s.* n.s.* 1174061038
Growing stockdistribution byspecies:
- Beech n.s.* n.s.* 207065160
- Norway spruce n.s.* n.s.* 200634780
- Chestnut n.s.* n.s.* 122051160
- Turkey oak n.s.* n.s.* 83143000
- Larches n.s.* n.s.* 79984300
- Downy oak n.s.* n.s.* 63564880
- Hop-hornbeam n.s.* n.s.* 32057200
- Holm oak n.s.* n.s.* 26149500

FRA 2015 – Country Report, Italy
30
- Silver fir n.s.* n.s.* 33936420
- Black pine n.s.* n.s.* 29746650
- Other species n.s.* n.s.* 295727987
Source: 2 nd Italian NFI
n.a.*** data not originally available: to be estimated combining the results of 2 ndNFI and some researchprojects
Following 2 nd NFI data is the basis for growing stock calculation of forest types whose volumes were notcalculated in 1985:
• high forest with average height less than 5 m: 20.3 m 3 /ha;• coppice with average height less than 5 m: 24.5 m 3 /ha;• Eucalyptus coppice with average height less than 5 m: 17.7 m 3 /ha;• plantations of average height less than 5 m: 12.1 m 3 /ha;• chestnut stands for fruit production: 169.3 m 3 /ha;• cork oak stands: 50.1 m 3 /ha;• riparian forests: 106.5 m 3 /ha;• rupicolous: 58 m 3 /ha.• The volume of small trees calculated on the basis of the 2 nd NFI is 4 m 3 /ha.• the volume of trees with diameter ranging from 4.5 to 10 cm is equal to 1.72% and 10.72% of total growing stock, respectively
for conifers and broadleaves.
As regards other wooded land, original data available is:
• average shrub dry phytomass: 39.86 metric tons/ha;
(Sources: 1 - database of Ri.Selv.Italia Research Project; 2 - Fattorini et al., 2004)
• average ratio between volume (cubic meters) and dry phytomass for plants (metric tons) under 5 m of height: 0.91;
(Source: 2 nd NFI)
• percentage of coniferous, broadleaved and mixed Other Wooded Land area: 7.2%, 83.9% and 8.9 %, respectively.
(Source: 2 nd NFI)
Data collected by a study concerning forest expansion in North-Eastern Alps has been used to estimate growing
stock density per hectare of new stands: 9.8 m 3 /ha (Tabacchi et al., 2010).

FRA 2015 – Country Report, Italy
31
GS trend
The GS for the years 2010 and 2015 has been estimated using the results of a linear interpolation between 1985and 2005 GS figures.
As a consequence of the reduction of Forest expansion rate observed after 2005 (from 77.9 thousands ha inthe period 1985-2005 to 53.8 thousands ha in the period 2005-2015), it has not deemed appropriate to simplyextrapolate 2010 and 2015 figures. To avoid this potential embedded overestimation, for each year after 2005a volume retrieved as follows has been subtracted:
9.38 m 3 /ha (GS density of new forests) * (77.9-53.8) thousands hectares.
Net annual Increment (NAI)
Gross Annual Increment: 30 421 548 m 3 (1985) and 35 872 293 m 3 (2005 estimates for dbh
# 10 cm), derived from NFI-1985 and NFI-2005
Gross Annual Increment by forest types: : according to NFI2005, broadleaves represent the 69.3% andconifers the remaining 30.7% of the whole GAI (according to estimates for dbh# 10 cm).
Natural losses: Natural losses according to the cited study (Tabacchi et al. 2010) cited among data sourcescorrespond to the 12.6% of the Gross Annual Increment. This percentage has been applied to all reporting years.
Biomass stock
Forest total phytomass (NFI 2005, dbh# 10 cm) is equal to 786 850 134 metric tons of which:
Conifers = 236 420 851 metric tons
Broadleaves = 550 429 283 metric tons
As regards dead wood biomass, the following data is provided by INFC Phase 3+ (referred to 2005):
Coarse deadwood biomass 34 315 177 m 3 (total forest)
Fine deadwood biomass 15 395 840 m 3 (total forest)

FRA 2015 – Country Report, Italy
32
Carbon stock
Original average Carbon data relating to Forest litter and soil is from the NFI2005 additional survey (seementioned data sources) and is respectively equal to 3.2 ton/ha and 81.7 ton/ha.
3.3 Analysis and processing of national data
3.3.1 Adjustment
Growing stock
No calibration needed.
Biomass stock
None needed.
Carbon stock
None needed.
3.3.2 Estimation and forecasting
Growing stock
The estimation of some missing original 1985 growing stock values (not particularly important in quantitativeterms, but necessary for the full consistency of the methodological process adopted) has been carried out. In
the following table mean volumes per hectare, retrieved from 2 ndNFI , have been applied to 1 stNFI areas toestimate missing growing stock components (e.g. stands with height less than 5 m and shrubs).
Forestclasses Area
(ha)
Volume/ha
( m 3/ha)
Total volume
( m 3)
NOTES
High forest
average heightless than 5 m
254700 20.3 5170410 Growing stockper hectare (2ndNFI data) by
area (1 stNFIdata).

FRA 2015 – Country Report, Italy
33
Coppice
average heightless than 5 m
870300 24.5 21322350 Growing stockper hectare (2ndNFI data) by
area (1 stNFIdata).
Plantations and specialised stands
YoungEucalyptuscoppice stands(always under 5m of height)
900 17.7 15930 Growing stockper hectare (2ndNFI data) by
area (1 stNFIdata).
Plantations under5 m of averageheight
13500 12.1 163350 Growing stockper hectare (2ndNFI data) by
area (1 stNFIdata).
Of whichconiferous
4500 12.1 54450 Growing stockper hectare (2ndNFI data) by
area (1 stNFIdata).
Of whichbroadleaved-Poplars
4500 12.1 54450 Growing stockper hectare (2ndNFI data) by
area (1 stNFIdata).
Of whichbroadleaved -
Otherbroadleaves
4500 12.1 54450 Growing stockper hectare (2ndNFI data) by
area (1 stNFIdata).
Chestnutstands for fruitproduction
90000 169.3 15237000 Growing stockper hectare (2ndNFI data) by
area (1 stNFIdata).

FRA 2015 – Country Report, Italy
34
Cork oak stands 64800 50.1 3246480 Growing stockper hectare (2ndNFI data) by
area (1 stNFIdata).
Particular woody ecosystems
Riparian forest
(this categoryincludes mainlyhygrophilousBroadleaves)
110700 106.5 11789550 Growing stockper hectare (2ndNFI data) by
area (1 stNFIdata).
Rupicolousforests
575100 58.0 33355800 Rupicolous holmoak growing stockper hectare (2ndNFI data) bytotal forest class
area (1 stNFIdata).
Shrubs
1475100 36.4 53693640 Growing stockper hectare (2ndNFI data) by
area (1 stNFIdata).
The growingstock per hectarehas been obtainedmultiplying 39.86 (average shrubdry phytomass)by 0.91 (averageratio volume/dry phytomass).See original dataparagraph.
The estimates resulting from the previous calculations have been broken down into forest types and groupsof species:

FRA 2015 – Country Report, Italy
35
Forestclasses Class Totalvolume
( m 3)
% Subclass Totalvolume
( m 3)
NOTES
High Forest < 5m of height
5170410
of whichconifers:
63.1 3262529
- Norway spruce 29.0 1499419
- Silver fir 5.7 294713
- Larches 12.1 625620
- Mountain pines 12.3 635960
- Mediterraneanpines
3.3 170624
- Other conifers 0.7 36193
of whichbroadleaves:
36.9 1907881
- Beech 17.3 894481
- Turkey oak 4.1 211987
- Other oaks 5.1 263691
- Otherbroadleaves
10.4 537723
Coppice < 5 m ofheight
21322350
of whichscatteredconifers
3.5 746282
of whichbroadleaves:
96.5 20576068
- Beech 18.8 4008602
- Chestnut 23.1 4925463
- Hornbeams 9 1919012
- Other oaks 10.5 2238847
The total growingstock of standsless than 5 m ofheight has beenassigned to eachgroup of species,applying the samepercentages ofhigher stands (1stNFI ).

FRA 2015 – Country Report, Italy
36
- Turkey oak 11.3 2409426
- Evergreen oaks 5.1 1087440
- Otherbroadleaves
18.7 3987279
Rupicolous 33 355 800
of whichconiferous
26.9 8972710
of whichbroadleaved
73.1 24383090
Estimate based onthe percentage of
(1 stNFI ) standswith a prevailingbroadleavedor coniferouscomponent,applied to thevolume of totalrupicolous forest.
Shrubs 53693640
of whichconiferous
11.6 6228462
of whichbroadleaved
88.4 47465178
Estimate madeon the basis of
the 2 ndNFI dataon conifers/broadleaves ratioof OWL area.Mixed OWLequally assignedto both classes.
In the following table, original data and estimates reported above have been summed up to computecomprehensive growing stock data.
Forestclasses GS of stands withheight > 5 m
GS of stands withheight < 5 m
Total GS
High forest - conifers
- Norway spruce 117543 379 1499419 119042798
- Silver fir 23245024 294713 23539737
- Larches 49017886 625620 49643506

FRA 2015 – Country Report, Italy
37
- Mountain pines 49974017 635960 50609977
- Mediterranean pines 13365769 170624 13536393
- Other conifers 3021422 36193 3057615
Total conifers GS inhigh forest (C1)
256167497 3262529 259430026
High forest -broadleaves
- Beech 70243581 894481 71138062
- Turkey oak 16443298 211987 16655285
- Other oaks 20587540 263691 20851231
- Other broadleaves 42278552 537723 42816275
Total broadleaves GSin high forest (B1)
149552971 1907882 151460853
Grand Total GS inHigh forest
410890879
Coppice – conifers
- scattered conifers(C2)
11409590 746282 12155872
Coppice-broadleaves
- Beech 60939254 4008602 64947856
- Chestnut 74612238 4925463 79537701
- Hornbeams sp. 28940076 1919012 30859088
- Other oaks 33857781 2 238 847 36096628
- Turkey oak 36594099 2409426 39003525
- Evergreen oaks 16446998 1087440 17534438
- Other broadleaves 60591673 3987279 64578952
Total broadleaves GSin coppice (B2)
311982119 20576069 332558188
Grand Total GS in Coppice 344714060
Plantations andspecialised stands

FRA 2015 – Country Report, Italy
38
Conifers (C3) 436960 54450 491410
- Poplars (high forest) 10100841 54450 10155291
- Other broadleaves(high forest)
610600 54450 665050
Other broadleaves(coppice)
157410 0 157410
Eucalyptus (coppice) ns 15930 15930
Chestnut stands forfruit production
15237000 n.s. 15237000
Cork oak stands 3246480 n.s. 3246480
Total broadleaves GSin Plantations (B3)
29352331 124830 29477161
Total GS in Plantations 29968571
Particular woodyecosystems: riparianand rupicolous forests
Riparian forests (B4) 11789550 n.s. 11789550
Rupicolous forests -coniferous (C4)
8972710 n.s. 8972710
Rupicolous forests -broadleaved (B5)
24383090 n.s. 24383090
Total GS in particular woody ecosystems:
riparian and rupicolous forest 45145350
The sum of all components reported above provides the total growing stock of Forest (830718860 m 3 ) ofwhich:
• coniferous (C1+C2+C3+C4) equal to 281050018 m 3 ( 33.8 % of the total value);• broadleaved (B1+B2+B3+B4+B5) equal to 549668842 m 3 ( 66.2 % of the total value).
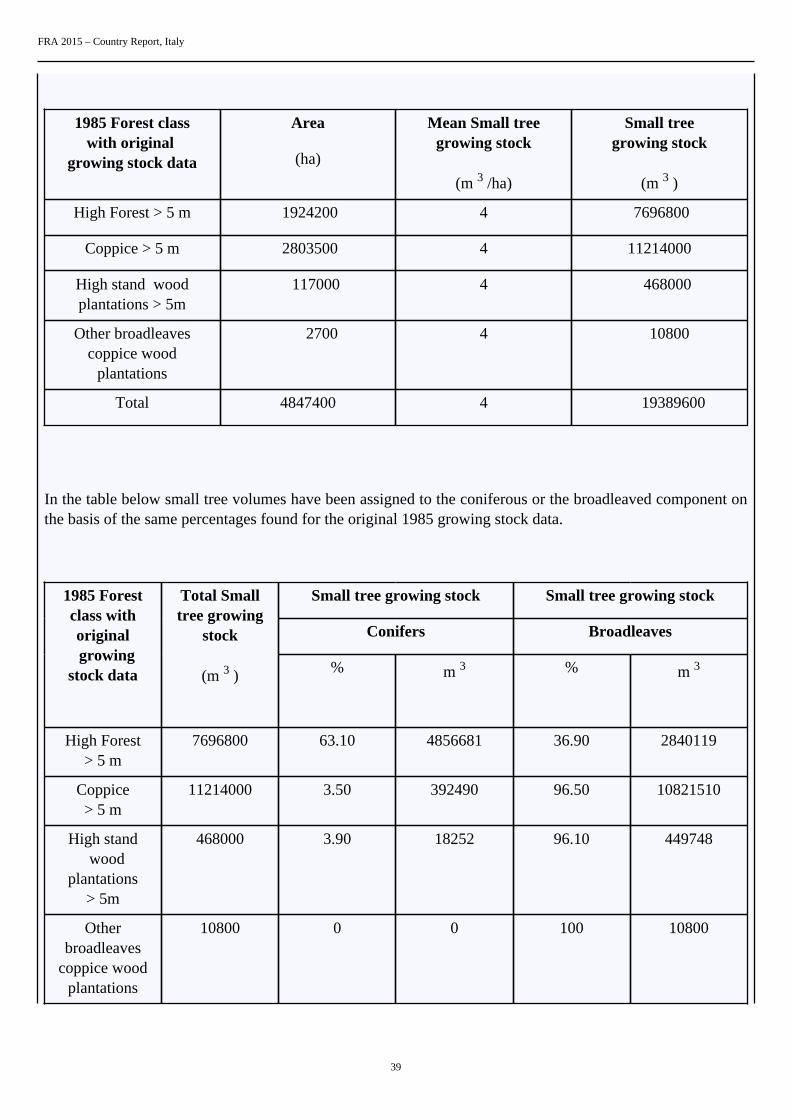
To compare 1 st and 2 nd NFI Forest growing stock data, volumes referring to trees with diameter between 2.5
and 4.5 cm (hereinafter “small trees”) have been estimated from the 1 st NFI figures (see following table).
FRA 2015 – Country Report, Italy
39
1985 Forest classwith original
growing stock data
Area
(ha)
Mean Small treegrowing stock
(m 3 /ha)
Small treegrowing stock
(m 3 )
High Forest > 5 m 1924200 4 7696800
Coppice > 5 m 2803500 4 11214000
High stand woodplantations > 5m
117000 4 468000
Other broadleavescoppice wood
plantations
2700 4 10800
Total 4847400 4 19389600
In the table below small tree volumes have been assigned to the coniferous or the broadleaved component onthe basis of the same percentages found for the original 1985 growing stock data.
Small tree growing stock Small tree growing stock
Conifers Broadleaves
1985 Forestclass withoriginal
growingstock data
Total Smalltree growing
stock
(m 3 ) % m 3 % m 3
High Forest> 5 m
7696800 63.10 4856681 36.90 2840119
Coppice> 5 m
11214000 3.50 392490 96.50 10821510
High stand wood
plantations> 5m
468000 3.90 18252 96.10 449748
Otherbroadleaves
coppice woodplantations
10800 0 0 100 10800

FRA 2015 – Country Report, Italy
40
Plantations- Total
478800 - 18252 - 460548
Total 19389600 - 5267423 - 14122177
To make growing stock 1985 values consistent with 2005 ones, small tree volumes have been subtracted fromthe total growing stock (T-S), both for conifers and broadleaves.
Moreover to be consistent with FRA2015 definition, volumes of trees with diameter between 4.5 and 10 have
been subtracted . According to 2 nd NFI data, the volume of trees with diameter ranging from 4.5 to 10 cm is equal to 1.03% and 11.18% of total growing stock, respectively for conifers and broadleaves. The growingstock with dbh>10cm has been considered equal to 98.97% (=100-1.03) and 88.82% (=100-11.18) of the T-Svolume respectively for conifers and broadleaves, as shown in the following tables:
1985 Forest classwith original growing stockdata
Conifer Growing stock (m 3 )
Total Small trees
( T ) ( S )
T - S GS with dbh >10cm
High Forest 259430026 4856681 254573345 251952718
Coppice 12155872 392490 11763382 11642287
Plantations 491410 18252 473158 468287
Particular woodyecosystems
8972710 n.s. 8972710 8880343
Total Forest GS 281050018 5267423 275782595 272943636

FRA 2015 – Country Report, Italy
41
1985 Forest classwith original growing stockdata
Broadleaves Growing stock (m 3 )
Total Small trees
( T ) ( S )
T - S GS with dbh >10cm
High Forest 151460853 2840119 148620734 132009512
Coppice 332558188 10821510 321736678 285776424
Plantations 29477161 460548 29016613 25773449
Particular woodyecosystems
36172640 n.s. 36172640 32129653
Total Forest GS 549668842 14122177 535546665 475689038
In the calculation of the growing stock it was made the assumption that, in terms of volume, the top part of thestems equals the branches. Therefore, no correction to original data has been applied.
As regards OWL GS, the estimation is not possible due to the lack of information concerning diameters under10 cm. Furthermore, the majority of plants in such category usually falls under the cited threshold.
Net Annual Increment
Data reported in the following table is the result of a linear inter/extrapolation of the Gross annual increment(GAI) values related to 1985 and 2005. Natural losses have been calculated applying the mentioned percentageof 12.6% .
2010 and 2015 GAI amounts have been reduced considering the already described decrease of forest expansion
annual rate. For this reason it has been assumed that the volume of 0.94 m 3 /ha/year represents the mean GAIan that the average medium age of new stands is 10 years.
As 9.38 m 3 /ha is the GS of such new stands, the rounded NAI is equal to 0.94 m 3 /ha/year.

FRA 2015 – Country Report, Italy
42
NAI = GAI-Natural losses
The portion of NAI due to trees with dbh<10 cm, calculated following the same estimation procedure appliedfor GS, has been then subtracted from the values in the above table.
Values in 1000 m 3
Year Gross annualincrement
(dbh>5)
Natural losses
(dbh>5)
Net annualincrement
(dbh>5)
NAI_dbh>10cm
1990 31784 4005 27779 24630
2000 34510 4348 30162 26743
2005 35872 4520 31352 27798
2010 37122 4689 32524 28767
2015 38371 4860 33715 29735
Following NAI specifications derived applying the Coniferous and Broadleaved GAI quotas from NFI2005
Net annual incrementCategory
1990 2000 2005 2010 2015
NAI inConiferous Forest
n.a. 8198 8521 8818 9115
NAI inBroadleaved Forest
n.a. 18545 19277 19949 20620

FRA 2015 – Country Report, Italy
43
For the reporting years 2000/2005, such figures in thousands cubic meters have been related to the total forestarea as reported in table 1.
Biomass stock
Conversion factors to retrieve total above-ground biomass amount of conifers and broadleaves from GS(respectively equal to 0.52 and 0.78) are based on original NFI2005 data.
As concerns below-ground biomass, above-ground values have been multiplied by IPCC ratios (Appendix 5,table 5.3) suggested for temperate forest, specifically: 0.29 for Conifers and 0.23 for Broadleaves.
Total dead wood biomass (coarse + fine, in terms of dry weight) for the year 2005 is provided by NFI2005additional survey. For other reporting years, the ratio between total dead wood biomass and growing stockderived from NFI2005 data, equal to 0.057, has been applied to growing stock figures of table 3a.
Carbon stock
Carbon content of dead wood and above and below-ground biomass have been calculated multiplying Forestbiomass values by carbon content fraction suggested by IPCC. Despite to what reported for FRA2010 (whena default conversion factor of 0.47 was applied), this time, according to IPCC2003 Guidance for LULUCF, aconversion factor equal to 0.5 has been applied. As a result the estimation here made are fully consistent withthe ones in the National submission to UNFCCC and Kyoto Protocol (first reporting period 2008-2013).
3.3.3 Reclassification
Growing stock
1985 NFI Reclassification matrix
FRA categoriesNationalClassification
Forest
(%)
OWL
(%)
Total
(%)
High Forest 100 0 100

FRA 2015 – Country Report, Italy
44
Coppice 100 0 100
Plantations andspecialised stands
100 0 100
Particular woodyecosystems: riparianand rupicolous forests
100 0 100
Particular woodyecosystems: shrubs
0 100 100
Biomass and Carbon stock
No reclassification used.
3.4 DataTable 3a
Growing stock volume (million m 3 over bark)
Forest Other wooded landCategory
1990 2000 2005 2010 2015 1990 2000 2005 2010 2015
Totalgrowingstock
855 1068 1174 1279 1385 N/A N/A N/A N/A N/A
... ofwhichconiferous
318 409 454 498 544 N/A N/A N/A N/A N/A
... ofwhichbroadleaved
537 659 720 781 841 N/A N/A N/A N/A N/A
Table 3b
Category/Species name Growing stock in forest (million cubic meters)
Rank Scientific name Common name 1990 2000 2005 2010
1 st Fagus sylvatica Beech 148.5 187.6 207.1 225.8
2 nd Picea abies Norway spruce 138.5 179.9 200.6 218.8
3 rd Castanea sativa Chestnut 96.8 113.7 122.1 133.1

FRA 2015 – Country Report, Italy
45
4 th Quercus cerris Turkey oak 57.7 74.7 83.1 90.7
5 th Larix decidua Larch 56.5 72.2 80 87.2
6 th Quercuspubescens
Downy Oak N/A N/A 63.6 69.3
7 th Ostryacarpinifolia
Hop-hornbeam N/A N/A 32.1 35
8 th Quercus ilex Holm oak N/A N/A 26.1 28.5
9 th Abies alba Silver fir 25.9 31.3 33.9 37
10 th Pinus nigra Black pine N/A N/A 29.7 32.4
Remaining 331.5 408.7 295.7 322
TOTAL 855.40 1068.10 1174.00 1279.80
THE PRE-FILLED VALUES FOR GROWING STOCK REFER TO THE FOLLOWINGTHRESHOLD VALUES (SEE TABLE BELOW)
Item Value Complementary information
Minimum diameter (cm) at breast heightof trees included in growing stock (X)
4.5 cm This is the original NFI threshold. Alldata has been adjusted to meet the newFRA2015 threshold equal to 10 cm.
Minimum diameter (cm) at the top end ofstem for calculation of growing stock (Y)
5.0 cm N/A
Minimum diameter (cm) of branchesincluded in growing stock (W)
5.0 cm N/A
Volume refers to above ground (AG) orabove stump (AS)
AS N/A
PLEASE NOTE THAT THE DEFINITION OF GROWING STOCK HAS CHANGED AND SHOULDBE REPORTED AS GROWING STOCK DBH 10 CM INCLUDING THE STEM FROM GROUNDLEVEL UP TO A DIAMETER OF 0 CM, EXCLUDING BRANCHES.
Table 3c
Net annual increment (m 3 per hectare and year)
ForestCategory
1990 2000 2005 2010 2015
Net annualincrement
3.25 3.2 3.17 3.19 3.2
... of whichconiferous
N/A 0.98 0.97 0.98 0.98

FRA 2015 – Country Report, Italy
46
... of whichbroadleaved
N/A 2.22 2.2 2.21 2.22
Table 3d
Biomass (million metric tonnes oven-dry weight)
Forest Other wooded landCategory
1990 2000 2005 2010 2015 1990 2000 2005 2010 2015
Abovegroundbiomass
641 797 874 951 1028 N/A N/A N/A N/A N/A
Belowgroundbiomass
158 196 215 235 254 N/A N/A N/A N/A N/A
Deadwood
36 45 50 54 58 N/A N/A N/A N/A N/A
TOTAL 835.00 1038.00 1139.00 1240.00 1340.00 .00 .00 .00 .00 .00
Table 3e
Carbon (Million metric tonnes)
Forest Other wooded landCategory
1990 2000 2005 2010 2015 1990 2000 2005 2010 2015
Carbonin abovegroundbiomass
321 398 437 476 514 N/A N/A N/A N/A N/A
Carbonin belowgroundbiomass
79 98 108 117 127 N/A N/A N/A N/A N/A
SubtotalLivingbiomass
400 496 545 593 641 N/A N/A N/A N/A N/A
Carbonin deadwood
18 23 25 27 29 N/A N/A N/A N/A N/A
Carbonin litter
24 27 28 29 30 N/A N/A N/A N/A N/A
SubtotalDeadwoodand litter
42 50 53 56 59 N/A N/A N/A N/A N/A
Soilcarbon
620 684 716 738 760 N/A N/A N/A N/A N/A

FRA 2015 – Country Report, Italy
47
TOTAL 1062.00 1230.00 1314.00 1387.00 1460.00 .00 .00 .00 .00 .00
Tiers
Variable/category Tier for status Tier for trend
Total growing stock Tier 3 Tier 2
Net annual increment Tier 3 Tier 2
Above ground biomass Tier 3 Tier 2
Below ground biomass Tier 3 Tier 2
Dead wood Tier 3 Tier 2
Carbon in above-ground biomass Tier 3 Tier 2
Carbon in below ground biomass Tier 3 Tier 2
Carbon in dead wood and litter Tier 3 Tier 2
Soil carbon Tier 3 Tier 2
Tier criteria
Category Tier for status Tier for reported trend
Total growing stock Tier 3: Data sources Recent 10 yearsNational Forest Inventory or remotesensing with ground truthing orprogramme for repeated compatible NFI10 years Domestic volume functions Tier2: Data sources/registers and statisticsmodelling or old NFI 10 years or partialfield inventory Tier 1: Other data sources
Tier 3: Estimate based on repeatedcompatible tiers 3 (tier for status)Domestic growth functions Tier 2:Estimate based on repeated compatible tier2 or combination tier 3 and 2 or 1 tier forstatus Tier 1: Other
Net annual increment Tier 3: Scientifically tested nationalvolume and growth functions Tier 2:Selection of volume and growth functionsas relevant as possible Tier 1: Other
Tier 3: Confirmation/adjustment offunctions used through scientific workTier 2: Review work done to seekalternative functions Tier: 1 Other
Biomass Tier 3: Country-specific national or sub-national biomass conversion expansionfactors applied or other domestic orotherwise nationally relevant biomassstudies Tier 2: Application of countryspecific national or sub-national biomassconversion factors from other countrywith similar climatic conditions and foresttypes Tier 1: International/regional defaultbiomass expansion factors applied
Tier 3 : Estimate based on repeatedcompatible tiers 3 (tier for status) Tier 2 :Estimate based on repeated compatible tier2 or combination tier 3 and 2 or 1 (tier forstatus) Tier 1 : Other

FRA 2015 – Country Report, Italy
48
• Carbon in above ground biomass• Carbon in below ground biomass• Carbon in dead wood and litter• Soil carbon
Tier 3: Country-specific national or sub-national biomass conversion expansionfactors applied Tier 2: Applicationof country specific national or sub-national biomass conversion factorsform from other country with similarclimatic conditions and forest types Tier1: International/regional default biomassexpansion factors applied
Tier 3 : Estimate based on repeatedcompatible tiers 3 (tier for status) Tier 2 :Estimate based on repeated compatible tier2 or combination tier 3 and 2 or 1 (tier forstatus) Tier 1 : Other
3.5 Comments on growing stock biomass and carbon
CategoryComments related todata definitions etc
Comments on the reported trend
Total growing stock The reclassification procedure for 1985NFI GS data made this consistent with2005 NFI data set. The estimation inthe last NFI was based on a new set of25 national models, constructed on thebasis of about 1300 sample trees collectedbetween 2002 and 2005, to derive volumeand above-ground phytomass fromdiameter at breast height and total treeheight.
During the observation period, annualremovals have averagely been around the25% of the NAI. Thus total growing stockhas been regularly augmenting.
Growing stock of broadleaved coniferous As above Available data (just two NFI completedin the reporting period) do not allow tocomment on a real trend
Growing stock composition In terms of species component, highlyreliable data are available for almost allspecies (NFI- 2005).
As above
Net annual increment As for total growing stock As above
Above-ground biomass 2005 data is highly reliable because basedon measured variables. This data has alsobeen used to build up two conversionfactors to estimate 1985 biomass startingfrom Growing Stock original data
As above
Below-ground biomass Data is based on IPCC conversion factorsapplied to above-ground biomass data.
As above
Dead wood 2005 data is highly reliable because basedon measured dead volume and dry weight.Other reporting years have been assessedon the assumption that dead wood/A.G.biomass is constant in time.
As above
Carbon in above-ground biomass Data on carbon content are obtained byapplying the carbon fraction suggested byIPCC2003 to highly reliable estimates ofbiomass (in terms of dry weight) derivedfrom ground measurements.
As above
Carbon in below-ground biomass As above As above
Carbon in dead wood As above As above
FRA 2015 – Country Report, Italy
49
Carbon in litter Carbon data relating to Forest litter andsoil is provided by NFI2005 additionalsurvey
As above
Soil carbon As above As above
Other general comments to the table
Note of Table 3b - Rank refers to the order of importance in terms of growing stock, i.e. 1st is the species with the highest growingstock. Year 2000 is the reference year for defining the species list and the order of the species.

FRA 2015 – Country Report, Italy
50
4. What is the status of forest production and how has it changed over time?Documents for this question:
• Guide for country reporting FRA 2015• FRA 2015 Terms and Definitions
4.1 Categories and definitions
Term Definition
Primary designatedfunction
The primary function or management objective assigned to a management unit either by legalprescription documented decision of the landowner/manager or evidence provided by documentedstudies of forest management practices and customary use.
Non wood forest product(NWFP)
Goods derived from forests that are tangible and physical objects of biological origin other than wood.
Commercial value ofNWFP
For the purpose of this table, value is defined as the commercial market value at the forest gate.
Category Definition
Production forest Forest area designated primarily for production of wood, fibre, bio-energy and/or non-wood forestproducts.
Multiple use forest Forest area designated for more than one purpose and where none of these alone is considered as thepredominant designated function.
Total wood removals The total of industrial round wood removals and woodfuel removals.
...of which woodfuel The wood removed for energy production purposes, regardless whether for industrial, commercial ordomestic use.
4.2 National data
4.2.1 Data sources
References to sourcesof information
Variables Years Additional comments
1 Ministero dell’Agricolturae delle Foreste - ISAFA.1988. Inventario ForestaleNazionale. Sintesimetodologica e risultati.
Forest functions 1985 Hereinafter NFI1985
2 Gasparini P. Tabacchi G.,2011(eds). L’InventarioNazionale delle Foreste edei Serbatoi Forestali diCarbonio (INFC-2005).MiPAAF-CFS, CRA-MPF. Edagricole, Milano.http://www.sian.it/inventarioforestale/jsp/home.jsp
Forest functions 2005 Hereinafter NFI2005
3 FRA 2005 Designated functions 1990 2000 N/A

FRA 2015 – Country Report, Italy
51
4 ISTAT 2008 Commercial value of NWFP 2008 N/A
4.2.2 Classification and definitions
National class Definition
Forest stands managed for non wood productions Mainly Chestnut and Cork Oak stands
N/A N/A
N/A N/A
N/A N/A
4.2.3 Original data
Area of forest designated for productive functions in 1985.
Year 1985Categories
ha
Plantations 134100
Coppice 3653800
Non wood production stands 135747
Source: NFI1985
Area of forest designated for productive and touristic functions in 2005.
Year 2005Categories
ha
Plantations 122252
Coppice 3663143
Non wood production stands 189240
FRA 2015 – Country Report, Italy
52
Source: NFI2005
4.3 Analysis and processing of national data
4.3.1 Adjustment
None needed.
4.3.2 Estimation and forecasting
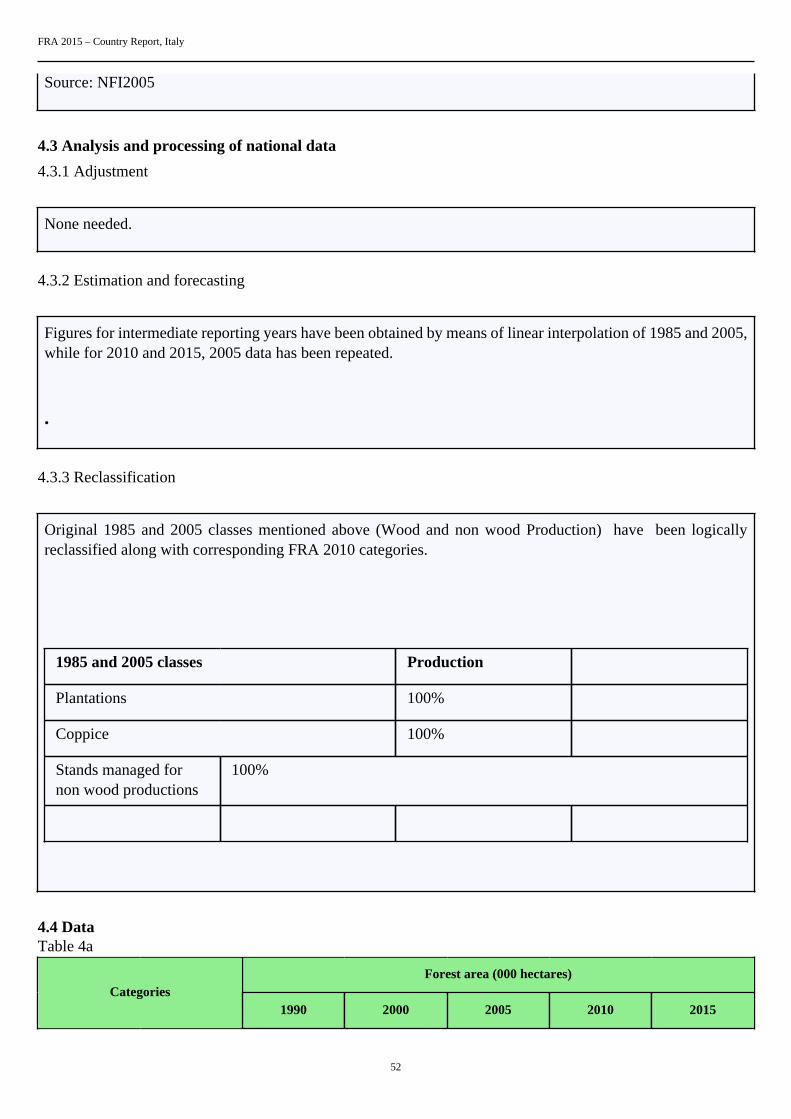
Figures for intermediate reporting years have been obtained by means of linear interpolation of 1985 and 2005,while for 2010 and 2015, 2005 data has been repeated.
•
4.3.3 Reclassification
Original 1985 and 2005 classes mentioned above (Wood and non wood Production) have been logicallyreclassified along with corresponding FRA 2010 categories.
1985 and 2005 classes Production
Plantations 100%
Coppice 100%
Stands managed fornon wood productions
100%
4.4 DataTable 4a
Forest area (000 hectares)Categories
1990 2000 2005 2010 2015
FRA 2015 – Country Report, Italy
53
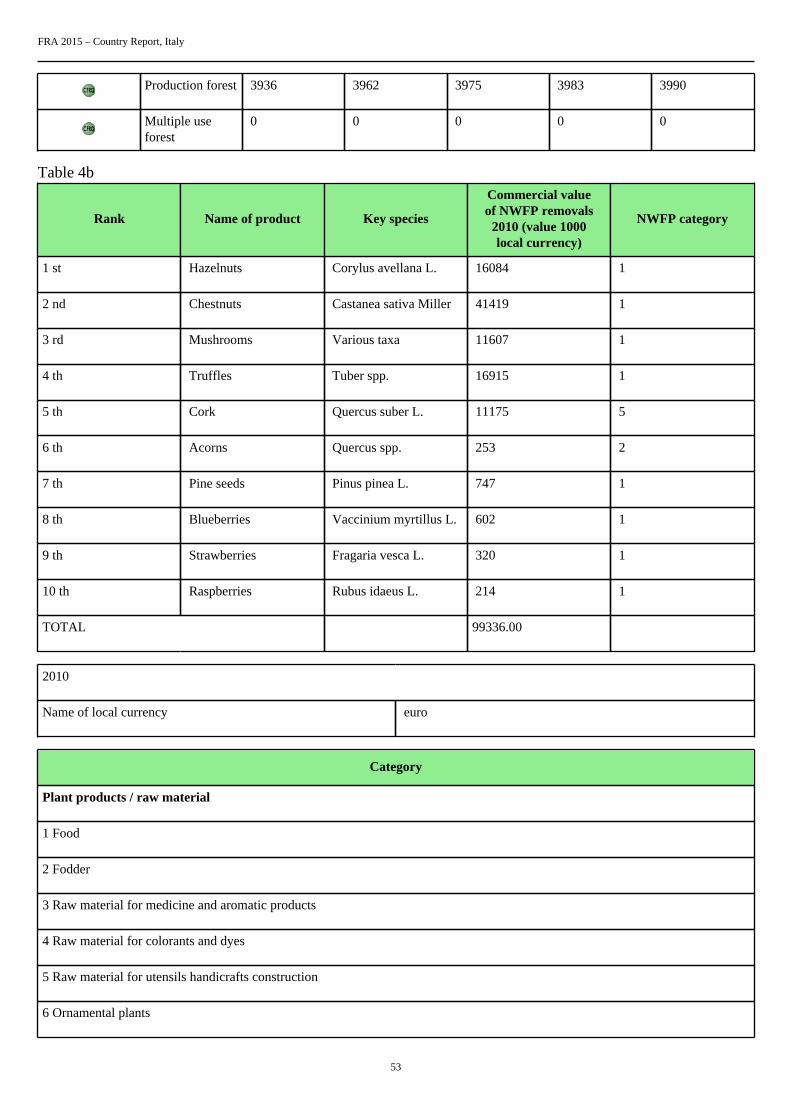
Production forest 3936 3962 3975 3983 3990
Multiple useforest
0 0 0 0 0
Table 4b
Rank Name of product Key species
Commercial valueof NWFP removals
2010 (value 1000local currency)
NWFP category
1 st Hazelnuts Corylus avellana L. 16084 1
2 nd Chestnuts Castanea sativa Miller 41419 1
3 rd Mushrooms Various taxa 11607 1
4 th Truffles Tuber spp. 16915 1
5 th Cork Quercus suber L. 11175 5
6 th Acorns Quercus spp. 253 2
7 th Pine seeds Pinus pinea L. 747 1
8 th Blueberries Vaccinium myrtillus L. 602 1
9 th Strawberries Fragaria vesca L. 320 1
10 th Raspberries Rubus idaeus L. 214 1
TOTAL 99336.00
2010
Name of local currency euro
Category
Plant products / raw material
1 Food
2 Fodder
3 Raw material for medicine and aromatic products
4 Raw material for colorants and dyes
5 Raw material for utensils handicrafts construction
6 Ornamental plants

FRA 2015 – Country Report, Italy
54
7 Exudates
8 Other plant products
Animal products / raw material
9 Living animals
10 Hides skins and trophies
11 Wild honey and beewax
12 Wild meat
13 Raw material for medicine
14 Raw material for colorants
15 Other edible animal products
16 Other non-edible animal products
Table 4c Pre-filled data from FAOSTAT
FRA 2015 category (1000 m 3 u.b.)Year
Total wood removals ...of which woodfuel
1990 7972 3637
1991 8327 4239
1992 8357 4832
1993 8818 4698
1994 9465 5481
1995 9736 5263
1996 9121 4958
1997 9146 5222
1998 9550 5183
1999 11138 6925
2000 9329 5680
2001 8099 5150
2002 7511 4883

FRA 2015 – Country Report, Italy
55
2003 8219 5580
2004 8697.4 5814.08
2005 8690.9 5673.46
2006 8618.3 5605.52
2007 8125 5133.86
2008 8667 5673.34
2009 8080.3 5352.26
2010 7843.8 5196.56
2011 7744.5 5388.49
Tiers
Category Tier for status Tier for reported trend
Production forest Tier 3 Tier 3
Multiple use forest Tier 1 Tier 1
Tier Criteria
Category Tier for status Tier for reported trend
Production forest Multiple use forest Tier 3: Updated including fieldverifications national forest mapsincluding functions Tier 2: Forest mapsolder than 6 years including forestfunctions Tier 1: Other
Tier 3 : Estimate based on repeatedcompatible tiers 3 (tier for status) Tier 2 :Estimate based on repeated compatible tier2 or combination tier 3 and 2 or 1 (tier forstatus) Tier 1 : Other
4.5 Comments
CategoryComments related todata definitions etc
Comments on the reported trend
Production forest Although the extent of productive forestis significant in Italy, the annual rate ofremoval is very low.
The situation is stable in time.
Multiple use forest This category is not provided by the NFI. N/A
Total wood removals All data prefilled, but 2011(JFQ nationalreport)
N/A
Commercial value of NWFP Last annual data available, here reported,refers to 2008
N/A
Other general comments to the table

FRA 2015 – Country Report, Italy
56
The content of this Question represents a fundamental update of previously released information on designated forest functions, dueto the use of 2005 NFI results.

FRA 2015 – Country Report, Italy
57
5. How much forest area is managed for protection of soil and water and ecosystemservices?Documents for this question:
• Guide for country reporting FRA 2015• FRA 2015 Terms and Definitions
5.1 Categories and definitions
Category Definition
Protection of soil andwater
Forest area designated or managed for protection of soil and water
...of which productionof clean water (sub-category)
Forest area primarily designated or managed for water production, where most human uses are excludedor heavily modified to protect water quality.
...of which coastalstabilization (sub-category)
Forest area primarily designated or managed for coastal stabilization.
...of which desertificationcontrol (sub-category)
Forest area primarily designated or managed for desertification control.
...of which avalanchecontrol (sub-category)
Forest area primarily designated or managed to prevent the development or impact of avalanches onhuman life assets or infrastructure.
...of which erosion, floodprotection or reducingflood risk (sub-category)
Forest area primarily designated or managed for protecting communities or assets from the impacts oferosion riparian floods and landslides or for providing flood plain services.
...of which other (sub-category)
Forest area primarily designated or managed for other protective functions.
Ecosystem services,cultural or spiritual values
Forest area primarily designated or managed for selected ecosystem services or cultural or spiritualvalues.
...of which publicrecreation (sub-category)
Forest area designated or managed for public recreation.
...of which carbon storageor sequestration (sub-category)
Forest area designated or managed for carbon storage or sequestration.
...of which spiritual orcultural services (sub-category)
Forest area designated or managed for spiritual or cultural services.
...of which other (sub-category)
Forest area designated or managed for other ecosystem services.
5.2 National data
5.2.1 Data sources
References to sourcesof information
Variables Years Additional comments

FRA 2015 – Country Report, Italy
58
1 Ministero dell’Agricolturae delle Foreste - ISAFA.1988. Inventario ForestaleNazionale. Sintesimetodologica e risultati.
Forest area Forest area legallybound for hydro-geologicalpurposes
1985 Hereinafter NFI1985
2 Gasparini P. Tabacchi G.,2011(eds). L’InventarioNazionale delle Foreste edei Serbatoi Forestali diCarbonio (INFC-2005).MiPAAF-CFS, CRA-MPF. Edagricole, Milano.http://www.sian.it/inventarioforestale/jsp/home.jsp
Forest functions Forest arealegally bound for hydro-geological purposes
2005 Hereinafter NFI2005
3 CFS-CRA, INFC2015,provisional results ofphotointerpretation (firstphase of the NFI survey)
Forest area 2015 Hereinafter NFI2015
4 N/A N/A N/A N/A
5.2.2 Classification and definitions
National class Definition
Forest area legally bound for hydro-geological purposes Defined by national law n. 3267/1923
N/A N/A
N/A N/A
N/A N/A
5.2.3 Original data
1985
Forest + OWL area legally bound for hydro-geological purposes = 7 693 000 ha
OWL total area = 1 475 100
2005
Forest area legally bound for hydro-geological purposes = 7 654 121
OWL % area legally bound for hydro-geological purposes = 64.2%

FRA 2015 – Country Report, Italy
59
5.3 Analysis and processing of national data
5.3.1 Adjustment
None needed
5.3.2 Estimation and forecasting
Data on area legally bound for hydro-geological purposes for the year 1985 refers to Forest and Other woodedland; to obtain figures for the two distinct land cover types, 2005 proportion of legally bound OWL has beenapplied to estimate 1985 legally bound OWL. Then this value has been subtracted from the total legally boundarea (F and OWL) to obtain the legally bound Forest area for the year 1985. Figures for the years 1990 and2000 were obtained by linear interpolation between 1985 and 2005; values for the years 2010 and 2015 wereobtained by applying the proportion of legally bound forest area reported for 2005 to the estimates of forestarea for the same reporting years.
5.3.3 Reclassification
5.4 DataTable 5a
Forest area (1000 hectares)Categories
1990 2000 2005 2010 2015
Protection of soiland water
6973 7427 7654 7889 8124
... of whichproduction ofclean water
N/A N/A N/A N/A N/A
... of whichcoastalstabilization
N/A N/A N/A N/A N/A
... of whichdesertificationcontrol
N/A N/A N/A N/A N/A
... of whichavalanchecontrol
N/A N/A N/A N/A N/A
... of whicherosion, floodprotection orreducing floodrisk
N/A N/A N/A N/A N/A

FRA 2015 – Country Report, Italy
60
... of which other(please specifyin commentsbelow the table)
N/A N/A N/A N/A N/A
Other
N/A
Table 5b
Forest area (1000 hectares)Categories
1990 2000 2005 2010 2015
Ecosystem services,cultural or spiritualvalues
N/A N/A N/A N/A N/A
...of which publicrecreation
N/A N/A N/A N/A N/A
...of whichcarbon storage orsequestration
N/A N/A N/A N/A N/A
...of which spiritualor cultural services
N/A N/A N/A N/A N/A
...of which other(please specify incomments belowthe table)
N/A N/A N/A N/A N/A
Tiers
Category Tier for reported trend Tier for status
Protection of soil and water Tier 3 Tier 3
Ecosystem services, cultural or spiritualvalues
Tier 3 Tier 3
Tier criteria
Category Tier for status Tier for reported trend
Protection of soil and water Tier 3: High reliability data derived eitherfrom high intensity sample survey or dataobtained from national or state agenciesresponsible for regulations or legislationrelating to soil and water protection. Tier2: Approaches based on low intensityor incomplete sample-based surveys orstudies that provide data for specific areasthat is extrapolated through statisticalanalysis to national level estimates. Tier 1:Other
Tier 3 : Estimate based on repeatedcompatible tiers 3 (tier for status) Tier 2 :Estimate based on repeated compatible tier2 or combination tier 3 and 2 or 1 (tier forstatus) Tier 1 : Other

FRA 2015 – Country Report, Italy
61
• Cultural or spiritual values• Public recreation• Spiritual or cultural services• Other
Tier 3: High reliability data derivedeither from high intensity sample surveyor data obtained from national or stateagencies responsible for regulations. Tier2: Approaches based on low intensityor incomplete sample-based surveys orstudies that provide data for specific areasthat is extrapolated through statisticalanalysis to national level estimates. Tier 1:Other
Tier 3 : Estimate based on repeatedcompatible tiers 3 (tier for status) Tier 2 :Estimate based on repeated compatible tier2 or combination tier 3 and 2 or 1 (tier forstatus) Tier 1 : Other
5.5 Comments
CategoryComments related todata definitions etc
Comments on the reported trend
Protection of soil and water Data refers to forest legally bound forgeneral hydro-geological purposes
The trend reflects the increase of Forestarea
Production of clean water N/A N/A
Coastal stabilization N/A N/A
Desertification control N/A N/A
Avalanche control N/A N/A
Erosion, flood protection or reducing floodrisk
N/A N/A
Other protective functions N/A N/A
Ecosystem services, cultural or spiritualvalues
N/A N/A
Public recreation N/A N/A
Carbon storage or sequestration N/A N/A
Spiritual or cultural services N/A N/A
Other ecosystem services N/A N/A
Other general comments to the table
N/A

FRA 2015 – Country Report, Italy
62
6. How much forest area is protected and designated for the conservation of biodiversityand how has it changed over time?Documents for this question:
• Guide for country reporting FRA 2015• FRA 2015 Terms and Definitions
6.1 Categories and definitions
Category Definition
Conservation ofbiodiversity
Forest area designated primarily for conservation of biological diversity. Includes but is not limited toareas designated for biodiversity conservation within the protected areas.
Forest area withinprotected areas
Forest area within formally established protected areas independently of the purpose for which theprotected areas were established.
6.2 National data
6.2.1 Data sources
References to sourcesof information
Variables Years Additional comments
1 Ministero dell’Ambiente edella Tutela del Territorio -Data base.
Protected areas:-OfficialNational list;-RAMSARsites;-Natura 2000 network’sSpecial; Protection areas(SPAs) and Sites ofCommunity Importance (SCI)
1993 2000 2003 2005 2008 Ministry of Environment’s adhoc elaboration
2 European EnvironmentAgency – Corine Land Cover
Corine Land Cover Level 3 1990 2000 N/A
3 N/A N/A N/A N/A
4 N/A N/A N/A N/A
6.2.2 Classification and definitions
National class Definition
Broadleaved forests Vegetation formation composed principally of trees, includingshrubs and bush, where broadleaved species predominate
Coniferous forests Vegetation formation composed principally of trees, includingshrub and bush, where coniferous species predominate
Mixed forests Vegetation formation composed principally of trees, includingshrub and bush, where broadleaved and coniferous species co-dominate
Sclerophyllous vegetation Bushy sclerophyllous vegetation
Transitional woodland/shrub Bushy or herbaceous vegetation with scattered trees.

FRA 2015 – Country Report, Italy
63
6.2.3 Original data
Forest resources under protection
1993* 2000** 2003**
CORINE Land Cover Classes
ha ha ha
Broadleaved forests 633 100 1 650 500 1 683 600
Coniferous forests 134 000 385 700 409 900
Mixed forests 104 500 255 000 273 500
Moors and heathland***
54 500 110 400 111 300
Sclerophyllousvegetation
49 200 264 100 267 700
Transitional woodland/shrub
154 200 319 100 325 100
Burned areas 100 000 3 600
Total 1 129 600 2 984 800 3 074 700
Source: Ministero dell’Ambiente e della Tutela del Territorio – Direzione Protezione Natura
* Data obtained overlapping in GIS Corine LC 1990 (level 3) and all Italian protected areas (1993’s NationalOfficial List +Ramsar sites).
** Data obtained overlapping in GIS Corine LC 2000 (level 3) and all Italian protected areas (2000’s and 2003’s National Official List + Ramsar sites + Natura 2000 network’s Special Protection areas and Sites ofCommunity Importance).
*** Considered as OWL in the reclassification.
6.3 Analysis and processing of national data
6.3.1 Adjustment
None needed.

FRA 2015 – Country Report, Italy
64
6.3.2 Estimation and forecasting
To update information on “Conservation of Biodiversity”, Corine LC 2000 (level 3) layer has been intersectedwith all Italian protected areas boundaries referring to 2008 (resulting from the National Official List + Ramsarsites + Natura 2000 network’s Special Protection areas and Sites of Community Importance). The results ofsuch an ad hoc elaboration are summarised in this table. As no new protected area has been established from2009 onwards, this value has been repeated for 2010 and 2015.
Years
2005 2008
CORINE Land Cover Classes
ha
ha
Broadleaved forests 1 737 764 1 812 659
Coniferous forests 423 990 470 937
Mixed forests 284 998 305 321
Sclerophyllous vegetation 271 875 305 635
Transitional woodland/shrub 340 311 366 560
Burned areas 3 717 3 759
Total 3 062 655 3 264 871
6.3.3 Reclassification
None needed.
6.4 DataTable 6
Forest area (000 hectares)Categories
1990 2000 2005 2010 2015

FRA 2015 – Country Report, Italy
65
Conservation ofbiodiversity
645 2874 3062 3265 3265
Forest areawithin protectedareas
645 2874 3062 3265 3265
Tiers
Category Tier for status Tier for reported trend
Conservation of biodiversity Tier 3 Tier 3
Forest area within protected areas Tier 3 Tier 3
Tier criteria
Category Tier for status Tier for reported trend
• Conservation of biodiversity• Forests within protected areas
Tier 3: Data obtained from national orstate agencies responsible for conservationand protected area or legislation relatingto area protection. Tier 2: Studies thatprovide data for specific areas that isextrapolated through statistical analysis tonational level estimates Tier 1 Other
Tier 3 : Estimate based on repeatedcompatible tiers 3 (tier for status) Tier 2 :Estimate based on repeated compatible tier2 or combination tier 3 and 2 or 1 (tier forstatus) Tier 1 : Other
6.5 Comments
CategoryComments related todata definitions etc
Comments on the reported trend
Conservation of biodiversity As no significant new protected areahas been established in the last reportingperiod, data for this category (coincidentwith Forest area within protected areas)has not changed from 2009.
As a consequence of the foundation ofthe Ministry of Environment (1985), atthe beginning of the 90’s a noticeable andquick augmentation of protected areas hasstarted. A positive trend has characterizedthe first decade of the present century;while no change has happened in the lastyears.
Forest area within protected areas As above As above
Other general comments to the table
N/A

FRA 2015 – Country Report, Italy
66
7. What is the area of forest affected by woody invasive species?Documents for this question:
• Guide for country reporting FRA 2015• FRA 2015 Terms and Definitions
7.1 Categories and definitions
Category Definition
Invasive species Species that are non-native to a particular ecosystem and whose introduction and spread cause, or arelikely to cause, socio-cultural, economic or environmental harm or harm to human health.
7.2 National data
7.2.1 Data sources
References to sourcesof information
Variables Years Additional comments
1 Gasparini P. Tabacchi G.,2011(eds). L’InventarioNazionale delle Foreste edei Serbatoi Forestali diCarbonio (INFC-2005).MiPAAF-CFS, CRA-MPF. Edagricole, Milano.http://www.sian.it/inventarioforestale/jsp/home.jsp
Disturbances; Invasivespecies
2005 N/A
2 N/A N/A N/A N/A
3 N/A N/A N/A N/A
4 N/A N/A N/A N/A
7.2.2 Classification and definitions
National class Definition
Invasive species Forest where the presence of Robinia pseudoacacia L. orAilanthus altissima Miller is detected in terms of a minimumbasal area of 2 square meters
N/A N/A
N/A N/A
N/A N/A

FRA 2015 – Country Report, Italy
67
7.2.3 Original data
NFI 2005 – affected Forest (ha)
Invasive species: Robinia pseudoacacia L
377186
Invasive species: Ailanthus altissima Miller
7142
7.3 Analysis and processing of national data
7.3.1 Adjustment
7.3.2 Estimation and forecasting
The only data available is from NFI 2005. Thus the same figures have been reported for 2005 and 2010.
7.3.3 Reclassification
7.4 DataTable 7
Forest area affected (000 ha)Scientific name of
woody invasive species2005 2010
Ailanthus altissima Miller 7 7
Robinia pseudoacacia L. 377 377
N/A N/A N/A
N/A N/A N/A
N/A N/A N/A

FRA 2015 – Country Report, Italy
68
N/A N/A N/A
N/A N/A N/A
N/A N/A N/A
N/A N/A N/A
N/A N/A N/A
Total 384 384
Tiers
Category Tier for status Tier for reported trend
Invasive species Tier 3 Tier 1
Tier Criteria
Category Tier for status Tier for reported trend
Invasive species Tier 3: Systematic assessment in forestinventory or other survey (e.g. byconservation department) within the last5 years) Tier 2: Systematic assessment inforest inventory or other survey (e.g. byconservation department conducted morethan 5 years ago) Tier 1: Other
Tier 3 : Estimate based on repeatedcompatible tiers 3 (tier for status) Tier 2 :Estimate based on repeated compatible tier2 or combination tier 3 and 2 or 1 (tier forstatus) Tier 1 : Other
7.5 Comments
CategoryComments related todata definitions etc
Comments on the reported trend
Invasive species Although most affecting species are thetwo reported, Prunus serotina Ehrh. forwhich data is not available at the present,is considered by some experts anotherspecies with some invasive potential.Even if the only data refers to 2005, thepresence of invasive species is consideredalmost stable by NFI experts.
No trend available
Other general comments to the table
Tier for reported trend: not significant as data has been repeated

FRA 2015 – Country Report, Italy
69
8. How much forest area is damaged each year?Documents for this question:
• Guide for country reporting FRA 2015• FRA 2015 Terms and Definitions
8.1 Categories and definitions
Category Definition
Number of fires Number of fires per year
Burned area Area burned per year
Outbreaks of insects A detectable reduction in forest health caused by a sudden increase in numbers of harmful insects.
Outbreaks of diseases A detectable reduction in forest health caused by a sudden increase in numbers of harmful pathogens,such as bacteria, fungi, phytoplasma or virus.
Severe weather events Damage caused severe weather events, such as snow, storm, drought, etc.
8.2 National data
8.2.1 Data sources
References to sourcesof information
Variables Years Additional comments
1 Forest Fires 2011, CorpoForestale dello Stato
Number of fires and affectedarea
2003-2011 N/A
2 Forest Fires 2012, CorpoForestale dello Stato (inpress)
Number of fires and affectedarea
2012 N/A
3 N/A N/A N/A N/A
4 N/A N/A N/A N/A
8.2.2 Classification and definitions
National class Definition
Forest fires A fire starting in forest or shrubby land that might spreadthrough neighbouring other land.
N/A N/A
N/A N/A
N/A N/A

FRA 2015 – Country Report, Italy
70
8.2.3 Original data
Affected area (ha)Year Number of fires
Forest orshrubby land
Other land Total
2003 9 697 44 064 47 741 91 805
2004 6 428 20 866 39 310 60 176
2005 7 951 21 470 26 105 47 575
2006 5 643 16 422 23 524 39 946
2007 10 639 116 602 111 127 227 729
2008 6 486 30 273 36 055 66 328
2009 5 422 31 060 42 295 73 355
2010 4 884 19 357 27 180 46 537
2011 8 181 38 430 33 577 72 007
2012 8 274 74 532 56 267 130 799
8.3 Analysis and processing of national data
8.3.1 Adjustment
none needed
8.3.2 Estimation and forecasting
none needed
8.3.3 Reclassification
none needed
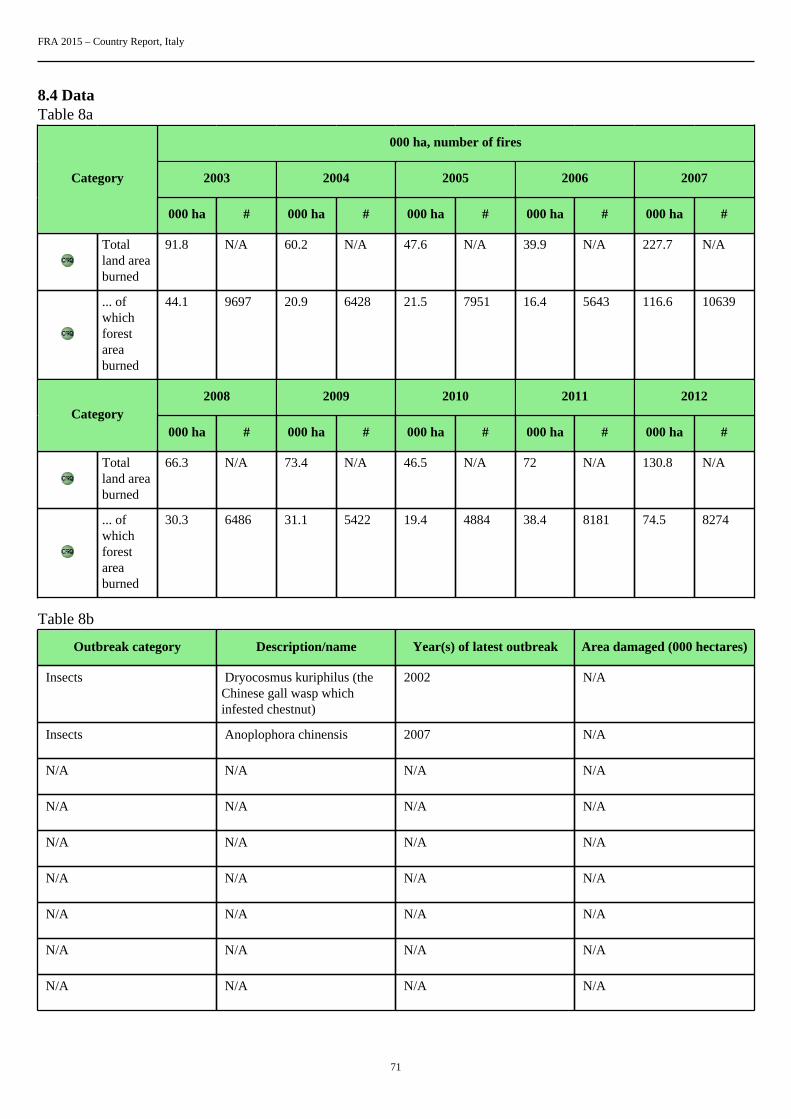
FRA 2015 – Country Report, Italy
71
8.4 DataTable 8a
000 ha, number of fires
2003 2004 2005 2006 2007Category
000 ha # 000 ha # 000 ha # 000 ha # 000 ha #
Totalland areaburned
91.8 N/A 60.2 N/A 47.6 N/A 39.9 N/A 227.7 N/A
... ofwhichforestareaburned
44.1 9697 20.9 6428 21.5 7951 16.4 5643 116.6 10639
2008 2009 2010 2011 2012Category
000 ha # 000 ha # 000 ha # 000 ha # 000 ha #
Totalland areaburned
66.3 N/A 73.4 N/A 46.5 N/A 72 N/A 130.8 N/A
... ofwhichforestareaburned
30.3 6486 31.1 5422 19.4 4884 38.4 8181 74.5 8274
Table 8b
Outbreak category Description/name Year(s) of latest outbreak Area damaged (000 hectares)
Insects Dryocosmus kuriphilus (theChinese gall wasp whichinfested chestnut)
2002 N/A
Insects Anoplophora chinensis 2007 N/A
N/A N/A N/A N/A
N/A N/A N/A N/A
N/A N/A N/A N/A
N/A N/A N/A N/A
N/A N/A N/A N/A
N/A N/A N/A N/A
N/A N/A N/A N/A

FRA 2015 – Country Report, Italy
72
N/A N/A N/A N/A
Outbreak category
1 Insects
2 Diseases
3 Severe weather events
Tiers
Category Tier for status Tier for trend
Area affected by fire Tier 3 Tier 3
• Insects• Diseases• Severe weather events
N/A N/A
Tier criteria
Category Tier for status Tier for reported trend
Burned area Tier 3 : National fire monitoring routinesTier 2 : Remote sensing surveys Tier 1 :Other
Tier 3 : Estimate based on repeatedcompatible tiers 3 (tier for status) Tier 2 :Estimate based on repeated compatible tier2 or combination tier 3 and 2 or 1 (tier forstatus) Tier 1 : Other
• Insects• Diseases• Severe weather events
Tier 3 : Systematic survey (e.g. viainventory or aerial damage assessment)Tier 2 : Management records Tier 1 :Other
Tier 3 : Estimate based on repeatedcompatible tiers 3 (tier for status) Tier 2 :Estimate based on repeated compatible tier2 or combination tier 3 and 2 or 1 (tier forstatus) Tier 1 : Other
8.5 Comments
CategoryComments related todata definitions etc
Comments on the reported trend
Burned area Forest fires are the most severe injuresfor Italian forest resources and manyefforts are made every year to take thephenomenon under control
In the period of observation, the burnedarea has been averagely decreasing,exception made for some problematicyears
Insects Data on affected area is not available n.a.
Diseases N/A N/A
Severe weather events N/A N/A
Other general comments to the table
N/A

FRA 2015 – Country Report, Italy
73
9. What is the forest area with reduced canopy cover?Documents for this question:
• Guide for country reporting FRA 2015• FRA 2015 Terms and Definitions
Category Definition
Reduction in canopycover
Forest that has undergone a reduction of canopy cover of more than 20% between the years 2000 and2010 within the forest canopy cover range of 30-80% as detected by the MODIS VCF sensor.
Table 9
Category Area of forest with reduced canopy cover (000 ha)
Reduction in canopycover
N/A
Tiers
Category Tier for reported trend
Reduction in canopycover
N/A
Tier criteria
Category Tier for reported trend
Reduction in canopycover
Tier 3 : Remote sensing with ground truthing and/or Landsat imagery Tier 2 : Remote sensing usingModis (using pre-filled data provided by FAO) Tier 1 : Expert opinion
Comments
Category Comments related to data definitions etc
Reduction in canopycover
N/A
Other general comments

FRA 2015 – Country Report, Italy
74
10. What forest policy and regulatory framework exists to support implementation ofsustainable forest management SFM?Documents for this question:
• Guide for country reporting FRA 2015• FRA 2015 Terms and Definitions
10.1 Categories and definitions
Category Definition
Policies supportingsustainable forestmanagement
Policies or strategies that explicitly encourage sustainable forest management.
Legislation andregulations supportingsustainable forestmanagement
Legislation and regulations that govern and guide sustainable forest management, operations and use.
10.2 National data
10.2.1 Data sources
References to sourcesof information
Variables Years Additional comments
1 Programma Quadro per ilSettore Forestale – PQSF(Framework Programmefor the Forest Sector) http://www.reterurale.it
SFM From 2008 N/A
2 National law n. 227 of18th May 2001 http://www.parlamento.it/leggi/deleghe/01227dl.htm
SFM From 2001 N/A
3 Regional Forest laws SFM various There are 21 regional Lawsas Regions are the finalresponsible for Forestmanagement in Italy
4 N/A N/A N/A N/A
10.2.2 Classification and definitions
National class Definition
National legislation Laws and acts in force on the whole Italian territory
Regional legislation Laws and acts in force at regional level
N/A N/A

FRA 2015 – Country Report, Italy
75
N/A N/A
10.2.3 Original data
Not applicable.
10.3 DataTable 10
Sub-nationalCategoryNational
Regional Provincial/State Local
Policies supportingsustainable forestmanagement
yes yes
... of which, in publiclyowned forests
... of which, in privatelyowned forests
Legislation andregulations supportingsustainable forestmanagement
yes yes
... of which, in publiclyowned forests
... of which, in privatelyowned forests
10.4 Comments
Variable / category Comments related to data definitions etc
Policies supporting sustainable forest management The total forest area has always been managed sustainably,according to national and sub-national legislation in force.Nevertheless, the complexity of the administrative share of forestcompetences among State, Regions and sub-regional institutionsdoes not allow the assignment of Yes/No judgement in the table10.
Legislation and regulations supporting sustainable forestmanagement
As above
Other general comments
In Italy the competence on forest Policy and management belong to Regions (20) and Autonomous Provinces(2), while the Minister of Agricultural, Food and Forest Policies (MiPAAF) is responsible for coordination of

FRA 2015 – Country Report, Italy
76
sub-national policies and for the enforcement of international agreements and regulations. At same time, theMinistry for the Environment and the Protection of Land and Sea is co-responsible for some forest matters:in particular for the designation and management of protected areas and general issues such as climate changeand carbon stock assessment.
Regions and autonomous Provinces are mainly responsible for sustainable forest management regulated bymeans of local forest acts and programmes aimed at the local implementation of a national forest strategy.
The Institution responsible for forest monitoring (NFI) and control is the “Corpo Forestale dello Stato”, whichis a police force eminently specialized in the prevention and repression of environmental crimes such as forestfires, food adulterations, agriculture fraud, illegal waste management and pollution.
The first National forest Plan was released in 1988, more recently (18 th December 2008) a new Nationalforest programme (Programma Quadro per il Settore Forestale – PQSF) for the coordination among differentMinistries and various administrative levels (State, Regions, Provinces and Municipalities), has been approved.This decennial programme - following the provisions of the national Financial law 2007 - has been shapedaround the EU Forest Action Plan and MCPFE resolutions aiming at a better implementation of internationalcommitments.
The Programme provides guidance for local forest sector development and foresees also a national Forest Boardto promote a better coordination of national and regional forest policies.
National law n. 227 of 18 th May 2001 represents the general framework for actions to be implemented mainlyat the local level by Regions which are responsible for sustainable forest management. The law containsthe national definition of forest, and promotes activities related to forestry, forest research and information.Defines the guidelines of national, underlining the need to implement the resolutions signed along the processof MCPFE.

FRA 2015 – Country Report, Italy
77
11. Is there a national platform that promotes stakeholder participation in forest policydevelopment?Documents for this question:
• Guide for country reporting FRA 2015• FRA 2015 Terms and Definitions
11.1 Categories and definitions
Category Definition
National stakeholderplatform
A recognized procedure that a broad range of stakeholders can use to provide opinions, suggestions,analysis, recommendations and other input into the development of national forest policy.
11.2 National data
11.2.1 Data sources
References to sources of information Years Additional comments
1 Programma Quadro per il SettoreForestale – PQSF (FrameworkProgramme for the Forest Sector) http://www.reterurale.it
From 2008 N/A
2 N/A N/A N/A
3 N/A N/A N/A
4 N/A N/A N/A
Table 11Is there a national platform that promotes or allows forstakeholder participation in forest policy development?
yes
11.3 Comments
Category Comments related to data definitions etc

FRA 2015 – Country Report, Italy
78
National stakeholder platform The previously mentioned National forest programme providesa Forest working party to promote a better coordination ofnational and local forest policies. Members of the Minister ofAgricultural, Food and Forest Policies (MiPAAF), Ministry forthe Environment and the Protection of Land and Sea, CorpoForestale dello Stato and of five Regions participate in thisworking party, which refers to the following two stakeholderplatforms: •Advisory group on Forest and wood, made up ofrepresentatives of forest owners and managers (public andprivate), wood industry, wood energy, Regions, professionalorganizations, non-profit organizations. Their role is to forwardspecific proposals for the national forestry policy. •Observatoryon forest products and services market, co-ordinated by theNational Council for Economics and Labour (CNEL), whichis a Constitutional body aimed at drafting legislative proposalsconcerning socio-economic aspects related to productiveactivities.
Other general comments
•

FRA 2015 – Country Report, Italy
79
12. What is the forest area intended to be in permanent forest land use and how has itchanged over time?Documents for this question:
• Guide for country reporting FRA 2015• FRA 2015 Terms and Definitions
12.1 Categories and definitions
Category Definition
Forest area intended to bein permanent forest landuse
Forest area that is designated or expected to be retained as forest and is highly unlikely to be convertedto other land use.
...of which permanentforest estate (sub-category)
Forest area that is designated by law or regulation to be retained as forest and may not be converted toother land use.
12.2 National data
12.2.1 Data sources
References to sourcesof information
Variables Years Additional comments
1 Gasparini P. Tabacchi G.,2011(eds). L’InventarioNazionale delle Foreste edei Serbatoi Forestali diCarbonio (INFC-2005).MiPAAF-CFS, CRA-MPF. Edagricole, Milano.http://www.sian.it/inventarioforestale/jsp/home.jsp
Forest and Forest Plantationsarea
2005 Hereinafter NFI2005
2 CFS-CRA, INFC2015,provisional results ofphotointerpretation (firstphase of the NFI survey)
Forest and Forest Plantationsarea
2015 Hereinafter NFI2015
3 N/A N/A N/A N/A
4 N/A N/A N/A N/A
12.2.2 Classification and definitions
National class Definition
Forest area Consistent with FRA (see table 1)
Specialised stands for wood production high stand plantations for wood production
N/A N/A

FRA 2015 – Country Report, Italy
80
N/A N/A
12.2.3 Original data
Management categories 2005 2015
(provisional estimate)
Category ha ha
Specialised stands for woodproduction
122252 126484
Forest area excluded stands forwood production
8636948 9170594
Source: NFI2005, NFI2015
12.3 Analysis and processing of national data
12.3.1 Adjustment
None needed.
12.3.2 Estimation and forecasting
The area of forest under sustainable management and the area of permanent forest estate have been estimatedtaking into account the Italian legal framework summarised in the following box.
Italian Forest Resources are 100% legally bound. The two main bindings provided by the laws n. 3267 of1923 and n. 431 of 1985 compel private and public owners to strictly respect limitations concerning theuse of their forest resources. As a matter of fact, each exploitation of forest resources must not compromisetheir perpetuation and therefore, any change of land use; this for the sake of hydro-geological, landscape andenvironmental protection in general (the same limitations apply also to burnt forest and OWL, due to the law n.353 on forest fires approved in 2000). As a consequence not only unplanned cuttings are always forbidden, butlocal prescriptions fix precise sylvicultural rules to be observed. Only exception made for productive forestryplantations, such as poplar stands, usually located on plains and managed according to intensive sylviculturaltechniques.
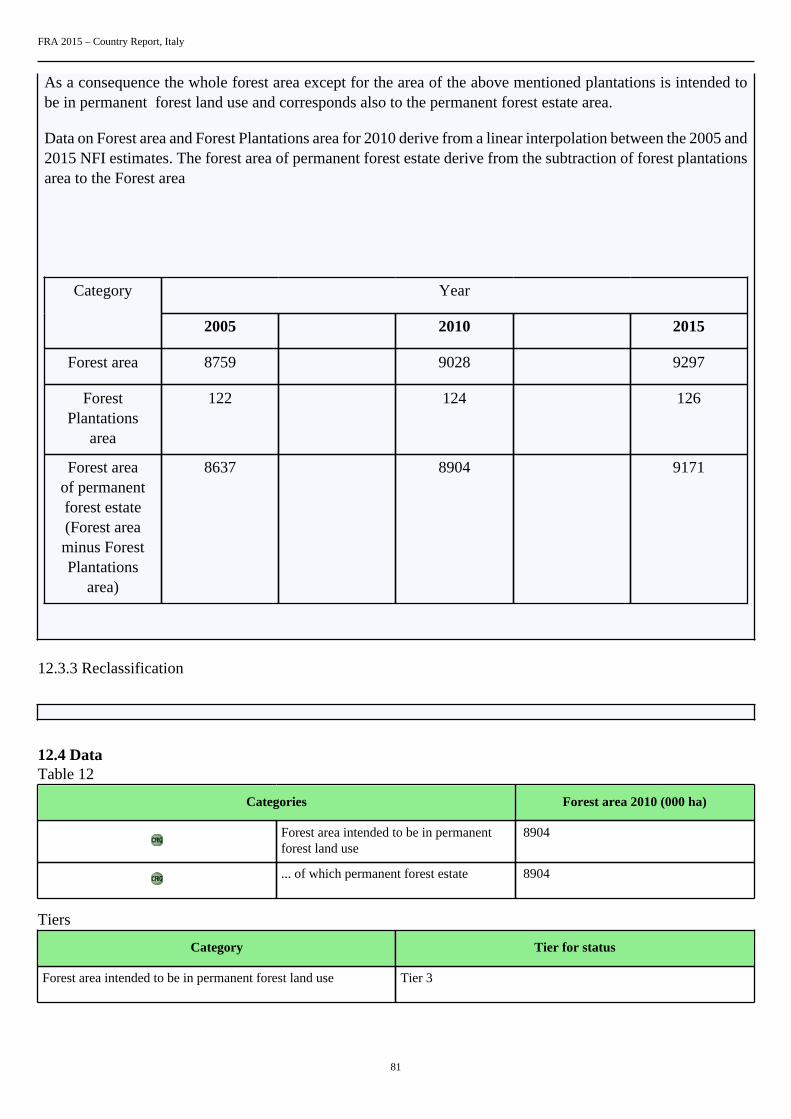
FRA 2015 – Country Report, Italy
81
As a consequence the whole forest area except for the area of the above mentioned plantations is intended tobe in permanent forest land use and corresponds also to the permanent forest estate area.
Data on Forest area and Forest Plantations area for 2010 derive from a linear interpolation between the 2005 and2015 NFI estimates. The forest area of permanent forest estate derive from the subtraction of forest plantationsarea to the Forest area
YearCategory
2005 2010 2015
Forest area 8759 9028 9297
ForestPlantations
area
122 124 126
Forest areaof permanentforest estate(Forest areaminus ForestPlantations
area)
8637 8904 9171
12.3.3 Reclassification
12.4 DataTable 12
Categories Forest area 2010 (000 ha)
Forest area intended to be in permanentforest land use
8904
... of which permanent forest estate 8904
Tiers
Category Tier for status
Forest area intended to be in permanent forest land use Tier 3
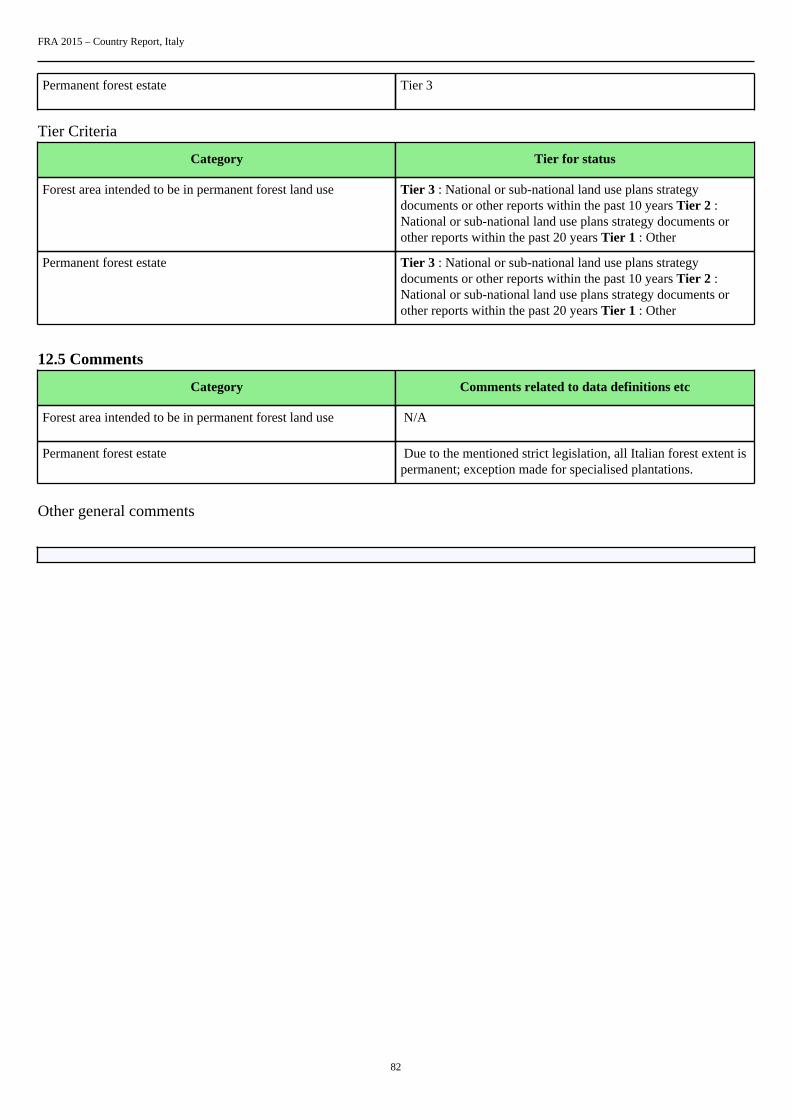
FRA 2015 – Country Report, Italy
82
Permanent forest estate Tier 3
Tier Criteria
Category Tier for status
Forest area intended to be in permanent forest land use Tier 3 : National or sub-national land use plans strategydocuments or other reports within the past 10 years Tier 2 :National or sub-national land use plans strategy documents orother reports within the past 20 years Tier 1 : Other
Permanent forest estate Tier 3 : National or sub-national land use plans strategydocuments or other reports within the past 10 years Tier 2 :National or sub-national land use plans strategy documents orother reports within the past 20 years Tier 1 : Other
12.5 Comments
Category Comments related to data definitions etc
Forest area intended to be in permanent forest land use N/A
Permanent forest estate Due to the mentioned strict legislation, all Italian forest extent ispermanent; exception made for specialised plantations.
Other general comments

FRA 2015 – Country Report, Italy
83
13. How does your country measure and report progress towards SFM at the nationallevel?Documents for this question:
• Guide for country reporting FRA 2015• FRA 2015 Terms and Definitions
13.1 Categories and definitions
Category Definition
Forest area monitoredunder a national forestmonitoring framework
Forest area monitored by a national monitoring framework or systems that provide measurement basedperiodic monitoring of forest extent and quality.
Forest reporting atnational scale
National reporting of forest extent and characteristics that includes some measure of progress towardsustainable forest management.
13.2 National data
13.2.1 Data sources
References to sourcesof information
Variables Years Additional comments
1 Ministero dell’Agricolturae delle Foreste - ISAFA.1988. Inventario ForestaleNazionale. Sintesimetodologica e risultati.
Forest extent and qualitymonitored
1985 N/A
2 Gasparini P. Tabacchi G.,2011(eds). L’InventarioNazionale delle Foreste edei Serbatoi Forestali diCarbonio (INFC-2005).MiPAAF-CFS, CRA-MPF. Edagricole, Milano.http://www.sian.it/inventarioforestale/jsp/home.jsp
Forest extent and qualitymonitored
2005 N/A
3 CFS-CRA, INFC2015,provisional results of photo-interpretation
Forest extent and qualitymonitored
2015 N/A
4 N/A N/A N/A N/A
13.2.2 Classification and definitions
National class Definition
N/A N/A
N/A N/A

FRA 2015 – Country Report, Italy
84
N/A N/A
N/A N/A
13.3 DataTable 13a
Check all boxes that apply
Category% of totalforest area
Mostrecent year
Continuous PeriodicPermanent
groundplots
Temporaryground
plots
Aerial/remotesensingsamplebased
Aerial/remote
sensing fullcoverage
Forestinventory
100 2005 yes yes yes yes
Other fieldassessments
N/A N/A
Updatesto othersources
N/A N/A
Expertestimate
N/A N/A
Table 13b
Type of forest reporting used at national scale Check boxes that apply
1 Criteria and Indicators reporting no
2 Periodic national state of the forest report yes
3 Other (please document)
4 None
Other type of forest reporting
N/A
13.4 Comments
Category Comments

FRA 2015 – Country Report, Italy
85
Sustainable Forest Management Both the already mentioned law 227/2001 and the NationalForestry Programme refer to the Criteria for Sustainable ForestManagement (SFM) defined and adopted by the Pan-EuropeanConference on the protection of forests in Europe. ItalianRegions (final responsible for forest policies by Constitutionalmandate) apply SFM strategies and monitor the state of theirforest resources. But, apart from NFI (carried out at state levelby Corpo Forestale dello Stato), no centralized and harmonizedcollection of SFM indicators is in force yet. Nevertheless Italyhas always been submitting national SFM reports to MCPFE-Forest Europe based on NFI and other national surveys andvarious statistical collections.
N/A N/A
N/A N/A
Other general comments

FRA 2015 – Country Report, Italy
86
14. What is the area of forest under a forest management plan and how is this monitored?Documents for this question:
• Guide for country reporting FRA 2015• FRA 2015 Terms and Definitions
14.1 Categories and definitions
Category Definition
Forest area withmanagement plan
Forest area that has a long-term documented management plan, aiming at defined management goalswhich is periodically revised
...of which for production(sub-category)
Forest management plan mainly focused on production
...of which forconservation (sub-category)
Forest management plan mainly focused on conservation
Monitoring of forestmanagement plans
Government monitoring of forest management plan implementation conducted through field visits oraudits of forest management plan performance
14.2 National data
14.2.1 Data sources
References to sourcesof information
Variables Years Additional comments
1 Gasparini P. Tabacchi G.,2011(eds). L’InventarioNazionale delle Foreste edei Serbatoi Forestali diCarbonio (INFC-2005).MiPAAF-CFS, CRA-MPF. Edagricole, Milano.http://www.sian.it/inventarioforestale/jsp/home.jsp
Forest functions 2005 The presence/absence offorest management plans issurveyed within the NFI
2 N/A N/A N/A N/A
3 N/A N/A N/A N/A
4 N/A N/A N/A N/A
14.3 DataTable 14a
Forest plan type Forest area 2010 (000 ha)
Forest area with management plan 1578
... of which for production N/A

FRA 2015 – Country Report, Italy
87
... of which for conservation N/A
Table 14b
Indicate which (if any) of the following are required in forest management plans in your country
1 Soil and water management
2 High conservation value forest delineation
3 Social considerations community involvement
Table 14c
Percent of area under forest management plan that is monitored annually N/A
Tiers
Category Tier for status
Forest area with management plan Tier 3
Percent of area under forest management plan that is monitoredannually
Tier 3
Tier criteria
Category Tier for status
Forest area with management plan Tier 3 : Reports that describe national records 5 years old or lessthat contain long-term forest monitoring plans Tier 2 : Industryor other records indicating the presence of a long-term forestmanagement plan Tier 1 : Other
Percent of area under forest management plan that is monitoredannually
Tier 3 : Government documentation of monitoring extent Tier 2: Reports from forest managers or other documental sources Tier1 : Other
14.4 Comments
Category Comments
Forest area with management plan The reported data refers to a comprehensive category of forestunder management plan. Due to the low interest of privateowners in cooperative associations and consortiums (65% ofForest is private and many farms are very small), managementplans are not much common. Even if forest planning is notvery common yet, the trend is positive and it could improve inthe future thanks to the National Forest Programme, which isenvisaging this activity as a priority for the improvement of theforest sector.
N/A N/A
N/A N/A

FRA 2015 – Country Report, Italy
88
Other general comments

FRA 2015 – Country Report, Italy
89
15. How are stakeholders involved in the management decision making for publiclyowned forests?Documents for this question:
• Guide for country reporting FRA 2015• FRA 2015 Terms and Definitions
15.1 Categories and definitions
Category Definition
Stakeholder involvement Stakeholder involvement is defined as significant inputs into at least one aspect of forest management atthe operational scale
Table 15
Please indicate the type of stakeholder involvement in forest management decision making required in your country
1. Planning phase yes
2. Operations phase no
3. Review of operations yes
Tiers
Category Tier for status
Type of stakeholder inputs Tier 1
Tier criteria
Category Tier for status
Type of stakeholder inputs Tier 3 : Government (national or sub-national) documentation ofstakeholder inputs Tier 2 : Government (national or subnational)requirement but stakeholder inputs not documented Tier 1 :Other
15.2 Comments
Category Comments
Stakeholder involvement Due to the regionalization of the forestry competences, Regionsare responsible for stakeholder consultations in case of planningand management of public forest. This usually happens for thedefinition of plans concerning National Parks, Protected Areasand other resources of particular common interest.
N/A N/A
N/A N/A

FRA 2015 – Country Report, Italy
90
Other general comments

FRA 2015 – Country Report, Italy
91
16. What is the area of forest under an independently verified forest certification scheme?Documents for this question:
• Guide for country reporting FRA 2015• FRA 2015 Terms and Definitions
16.1 Categories and definitions
Category Definition
FSC certification Forest area certified under the Forest Stewardship Council certification scheme
PEFC certification Forest area certified under the Programme for the Endorsement of Forest Certification scheme
Other international forestmanagement certification
Forest area certified under an international forest management certification scheme with publishedstandards and is independently verified by a third-party, excluding FSC and PEFC certification.
Certified forest areausing a domestic forestmanagement certificationscheme
Area certified under a forest management certification scheme with published standards that arenationally recognized and independently verified by a thirdparty
16.2 DataTable 16a
Forest area (000 ha)International forest
management certification2000 2001 2002 2003 2004 2005 2006
FSC 0 0 14.32 14.73 14.73 15.845 15.845
PEFC 0 0 0 0 356.053 607.345 637.846
Other 0 0 0 0 0 0 0
2007 2008 2009 2010 2011 2012
FSC 18.98 33.91 48.77 66.52 52.069 52.102
PEFC 652.33 699.755 704.912 744.538 761.063 768.689
Other 0 0 0 0 0 0
Table 16b
Forest area (000 ha)Domestic forest
management certification2000 2001 2002 2003 2004 2005 2006
N/A 0 0 0 0 0 0 0
N/A 0 0 0 0 0 0 0
N/A 0 0 0 0 0 0 0
FRA 2015 – Country Report, Italy
92
2007 2008 2009 2010 2011 2012
0 0 0 0 0 0
0 0 0 0 0 0
0 0 0 0 0 0
Tier criteria
Category Tier for status
International forest management certification Tier 3: International forest management scheme recordsmaintained by the certifying organization for the reporting yearTier 2: International forest management scheme records reportedby the certifying organization for a period 2 years prior to thereporting year Tier: 1 Other
Domestic forest management certification Tier 3: National registry reports for domestic forest managementcertification maintained by the certifying organization for thereporting year Tier 2: Domestic forest management schemerecords reported by the certifying organization for a period 2years prior to the reporting year Tier: 1 Other
Tiers
Category Tier for status
International forest management certification Tier 3
Domestic forest management certification N/A
16.3 Comments
Category Comments related to data definitions etc
Certified forest area using an international forest managementcertification scheme
N/A
Domestic forest management certification N/A
Other general comments

FRA 2015 – Country Report, Italy
93
17. How much money do governments collect from and spend on forests?Documents for this question:
• Guide for country reporting FRA 2015• FRA 2015 Terms and Definitions
17.1 Categories and definitions
Category Definition
Forest revenue All government revenue collected from the domestic production and trade of forest products andservices. For this purpose revenue include:• Goods : roundwood; sawnwood; biomass; woodbased panels; pulp and paper and non-wood forest
products.• Services : including concession fees and royalties, stumpage payments, public timber sales revenue
taxes and charges based on forest area or yield, taxes on domestic trade and export of forest products,special levies on forestry activities and payments into forest related funds, other miscellaneousinspection, licence and administrative fees levied by forest administrations, permit and licence feesfor recreation and other forest related activities.
Public expenditure onforestry
All government expenditure on forest related activities.
17.2 National data
17.2.1 Data sources
References to sourcesof information
Variables Years Additional comments
1 National Institute ofAgricultural Economics(INEA) – data base
Operational expenditures,Transfer Payments
2000 2005 2015 N/A
2 N/A N/A N/A N/A
3 N/A N/A N/A N/A
4 N/A N/A N/A N/A
17.3 DataTable 17
Revenues / expenditures (000 local currency)Category
2000 2005 2010
Forest revenue N/A N/A N/A
Public expenditure on forestry 1279577 1132694 1354027
2000 2005 2010
Name of Local Currency euro euro euro

FRA 2015 – Country Report, Italy
94
17.4 Comments
Category Comments related to data definitions etc
Forest revenue No information available
Public expenditure on forestry Operational expenditure: All government expenditure on publicinstitutions uniquely engaged in the forest sector includingthe ones involved in research, training and marketing. Datarefers to national, regional and EU funds. Transfer payments:All government expenditure on direct financial incentivespaid to ONG and private institutions, enterprises communitiesor individuals involved in the implementation forest relatedactivities. Data refers to national, regional and EU funds.
Other general comments N/A
Other general comments

FRA 2015 – Country Report, Italy
95
18. Who owns and manages the forests and how has this changed?Documents for this question:
• Guide for country reporting FRA 2015• FRA 2015 Terms and Definitions
18.1 Categories and definitions
Category Definition
Public ownership Forest owned by the State or administrative units of the public administration or by institutions orcorporations owned by the public administration.
...of which owned by thestate at national scale(sub-category)
Forest owned by the State at the national scale or administrative units of the public administration or byinstitutions or corporations owned by the public administration.
...of which owned by thestate at the sub-nationalgovernment scale (sub-category)
Forest owned by the State at the sub-national government scale or administrative units of the publicadministration or by institutions or corporations owned by the public administration.
Private ownership Forest owned by individuals, families, communities, private cooperatives corporations and otherbusiness entities, private, religious and educational institutions, pension or investment funds, NGOs,nature conservation associations and other private institutions.
...of which individuals(sub-category)
Forest owned by individuals and families.
...of which privatebusiness entities andinstitutions (sub-category)
Forest owned by private corporations cooperatives companies and other business entities as well asprivate nonprofit organizations such as NGOs nature conservation associations, and private religiousand educational institutions etc.
...of which local tribal andindigenous communities(sub-category)
Forest owned by a group of individuals belonging to the same community residing within or in thevicinity of a forest area or forest owned by communities of indigenous or tribal people The communitymembers are coowners that share exclusive rights and duties and benefits contribute to the communitydevelopment.
Unknown ownership Forest area where ownership is unknown includes areas where ownership is unclear or disputed.
Categories related tomanagement rights
of public forestsDefinition
Public Administration The Public Administration (or institutions or corporations owned by the Public Administration) retainsmanagement rights and responsibilities within the limits specified by the legislation.
Individuals households Forest management rights and responsibilities are transferred from the Public Administration toindividuals or households through long-term leases or management agreements.
Private companies Forest management rights and responsibilities are transferred from the Public Administration tocorporations, other business entities private cooperatives, private nonprofit institutions and associations,etc., through long-term leases or management agreements.
Communities Forest management rights and responsibilities are transferred from the Public Administration to localcommunities (including indigenous and tribal communities) through long-term leases or managementagreements.
Other form ofmanagement rights
Forests for which the transfer of management rights does not belong to any of the categories mentionedabove.
18.2 National data
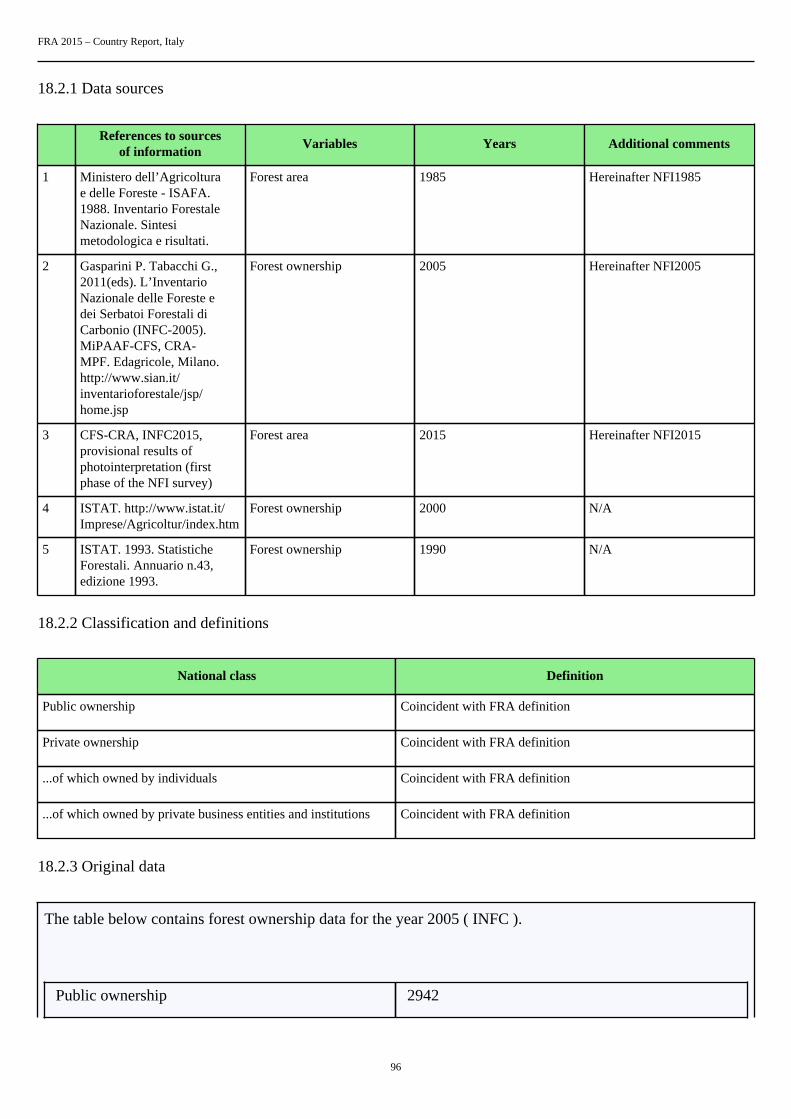
FRA 2015 – Country Report, Italy
96
18.2.1 Data sources
References to sourcesof information
Variables Years Additional comments
1 Ministero dell’Agricolturae delle Foreste - ISAFA.1988. Inventario ForestaleNazionale. Sintesimetodologica e risultati.
Forest area 1985 Hereinafter NFI1985
2 Gasparini P. Tabacchi G.,2011(eds). L’InventarioNazionale delle Foreste edei Serbatoi Forestali diCarbonio (INFC-2005).MiPAAF-CFS, CRA-MPF. Edagricole, Milano.http://www.sian.it/inventarioforestale/jsp/home.jsp
Forest ownership 2005 Hereinafter NFI2005
3 CFS-CRA, INFC2015,provisional results ofphotointerpretation (firstphase of the NFI survey)
Forest area 2015 Hereinafter NFI2015
4 ISTAT. http://www.istat.it/Imprese/Agricoltur/index.htm
Forest ownership 2000 N/A
5 ISTAT. 1993. StatisticheForestali. Annuario n.43,edizione 1993.
Forest ownership 1990 N/A
18.2.2 Classification and definitions
National class Definition
Public ownership Coincident with FRA definition
Private ownership Coincident with FRA definition
...of which owned by individuals Coincident with FRA definition
...of which owned by private business entities and institutions Coincident with FRA definition
18.2.3 Original data
The table below contains forest ownership data for the year 2005 ( INFC ).
Public ownership 2942

FRA 2015 – Country Report, Italy
97
Private ownership 5817
...of which owned by individuals 5126
...of which owned by private business entities andinstitutions
691
TOTAL 8759
ISTAT data for 1990 and 2000
Year Public Forest
(ha)
Private Forest
(ha)
1990 2933995 5448848
2000 3306382 6140424
18.3 Analysis and processing of national data
18.3.1 Adjustment
18.3.2 Estimation and forecasting
Data available at the Statistical National Institute (ISTAT) has only been used as a control of the 2005 NFI shareof public/private ownership. This in consideration of the fact that the definition of Forest adopted by ISTAT isdifferent from the FRA one and that this would lead to an evident underestimation of the total Forest extent.As reported in the following table, the share of ownership categories resulting from the analysis of the two datasets is very similar.
NFI 2005 ISTAT
Private Public Private Public

FRA 2015 – Country Report, Italy
98
% % % %
66 34 65 35
Thus the NFI 2005 percentage has been applied to the forest extent calculated in Question 1 obtaining the finaldata for table 18a.
18.3.3 Reclassification
None needed
18.4 DataTable 18a
Forest area (1000 hectares)Categories
1990 2000 2005 2010
Public ownership 2549 2811 2942 3032
... of which ownedby the state atnational scale
N/A N/A N/A N/A
... of which ownedby the state atthe sub-nationalgovernment scale
N/A N/A N/A N/A
Private ownership 5041 5558 5817 5996
... of which ownedby individuals
4442 4898 5126 5284
... of which ownedby private businessentities andinstitutions
599 660 691 712
... of which ownedby local, tribaland indigenouscommunities
0 0 0 0
Unknownownership
0 0 0 0
TOTAL 7590.00 8369.00 8759.00 9028.00
Tiers
Category Tier for status Tier for reported trend

FRA 2015 – Country Report, Italy
99
Public ownership Tier 2 Tier 2
Private ownership Tier 2 Tier 2
Unknown ownership Tier 2 Tier 2
Tier criteria
Category Tier for status Tier for reported trend
Ownership Tier 3: National forestry statistics registersof land titles or maps on land ownershipor all forest area under one ownershipcategory that is five years old or less. Tier2:National forestry statistics registers ofland titles or maps on land ownership orquestionnaires that are more than fiveyears old. Tier 1: Other
Tier 3 : Estimate based on repeatedcompatible tiers 3 (tier for status) Tier 2 :Estimate based on repeated compatible tier2 or combination tier 3 and 2 or 1 (tier forstatus) Tier 1 : Other
Table 18b - Holder of management rights of public forests
Forest area (000 hectares)Categories
1990 2000 2005 2010
Public Administration N/A N/A N/A N/A
Individuals N/A N/A N/A N/A
Private companies N/A N/A N/A N/A
Communities N/A N/A N/A N/A
Other N/A N/A N/A N/A
TOTAL .00 .00 .00 .00
Category Tier for reported trend Tier for status
Public Administration N/A N/A
Individuals N/A N/A
Private companies N/A N/A
Communities N/A N/A
Other N/A N/A
18.5 Comments
CategoryComments related todata definitions etc
Comments on the reported trend

FRA 2015 – Country Report, Italy
100
Public ownership The major part of the public forest isowned by Municipalities (more than 60%),followed by Regions, Provinces and State
The situation is stable in the observedperiod
Private ownership Individual own more about 80% of theprivate forest.
The situation is stable in the observedperiod
Unknown ownership Not applicable No trend observable
Management rights No exhaustive data available No trend observable
Other general comments to the table
As already stated, thanks to INFC 2005, the present report is more reliable than the previous Italian FRA releases. For instance, asconcerns the present table, INFC ownership data refers to forest area directly assessed adopting FRA definitions.

FRA 2015 – Country Report, Italy
101
19. How many people are directly employed in forestry?Documents for this question:
• Guide for country reporting FRA 2015• FRA 2015 Terms and Definitions
19.1 Categories and definitions
Category Definition
Full-time equivalents(FTE)
A measurement equal to one person working full-time during a specified reference period.
Employment in forestry Employment in activities related to production of goods derived from forests. This category correspondsto the ISIC/NACE Rev. 4 activity A02 (Forestry and logging).
19.2 National data
19.2.1 Data sources
References to sourcesof information
Variables Years Additional comments
1 MCPFE-UNECE/FAO 2003Report of Europe’s forest
Employment in Forestry 1990 N/A
2 Eurostat Forestry StatisticsPocketbook Edition 2007
Employment in Forestry 2000 and 2005 N/A
3 ISTAT – Labour forcestatistics
Employment in Forestry 2010 N/A
4 N/A N/A N/A N/A
19.2.2 Classification and definitions
National class Definition
FTE Consistent with international (ILO) definitions
N/A N/A
N/A N/A
N/A N/A
19.2.3 Original data
Forestry logging (thousands of people) FTE
1990 2000 2005 2010

FRA 2015 – Country Report, Italy
102
56 36 41 32
19.3 DataTable 19
Employment (000 years FTE)Category
1990 2000 2005 2010
Employment inforestry
56 36 41 32
... of which female N/A N/A N/A N/A
19.4 Comments
CategoryComments related todata definitions etc
Comments on the reported trend
Employment in forestry none 2005-2010 trend reflects the generalenduring crisis
Other general comments to the table
N/A

FRA 2015 – Country Report, Italy
103
20. What is the contribution of forestry to Gross Domestic Product (GDP)?Documents for this question:
• Guide for country reporting FRA 2015• FRA 2015 Terms and Definitions
20.1 Categories and definitions
Category Definition
Gross value added fromforestry (at basic prices)
This category corresponds to the ISIC/NACE Rev. 4 activity A02 (Forestry and logging).
20.2 DataTable 20 (Pre-filled data from UNdata/EUROSTAT)
Category Million CurrencyYear for latest
available information
Gross value added fromforestry (at basic prices)
562.813 euro 2012
20.3 Comments
Category Comments
Gross value added from forestry (at basic prices) The change in the order of magnitude of the data 2012compared to that reported in FRA 2010 is mainly due to thereclassification of NACE rev2 (NACE 2007). In particular, thenew classification has led to the relocation of some productsin the past attributed to Division 01 (agricultural crops andanimal production, hunting and related services) under Division02 (forestry and logging); in particular, the activities relatingto the collection of wild mushrooms and truffles, previouslyincluded in NACE 01.12.1, and gathering berries, nuts, wildfruits, previously included in NACE 01.13.4, are now consideredwithin the item Collection of non-wood forest products (NACE02.30.0).
Other general comments

FRA 2015 – Country Report, Italy
104
21. What is forest area likely to be in the futureDocuments for this question:
• Guide for country reporting FRA 2015• FRA 2015 Terms and Definitions
21.1 Categories and definitions
Category Definition
Government target/aspiration for forest area
Government target/aspiration for forest area for a specific year.
Forests earmarked forconversion
Forest area that is allocated/classified or scheduled to be converted into non-forest uses.
21.2 National data
21.2.1 Data sources
References to sourcesof information
Variables Years Additional comments
1 N/A N/A N/A N/A
2 N/A N/A N/A N/A
3 N/A N/A N/A N/A
4 N/A N/A N/A N/A
21.3 DataTable 21a
Forest area (000 ha)Category
2020 2030
Government target/aspiration for forestarea
N/A N/A
Table 21b
Forest area (000 ha)Category
2013
Forests earmarked for conversion N/A
21.4 Comments
Category Comments
Government target/aspiration for forest area N/A
FRA 2015 – Country Report, Italy
105
Forests earmarked for conversion N/A
Other general comments