Embed Size (px)
Citation preview
COUNTRY REPORT
RECENT REPORT ON COASTAL / MARINE AQUACULTURE
STATUS IN MALAYSIA
MOHD.FARIDUDDIN OTHMAN SENIOR RESEARCH OFFICER
DEPARTMENT OF FISHERIES MALAYSIA
MARCH 2006
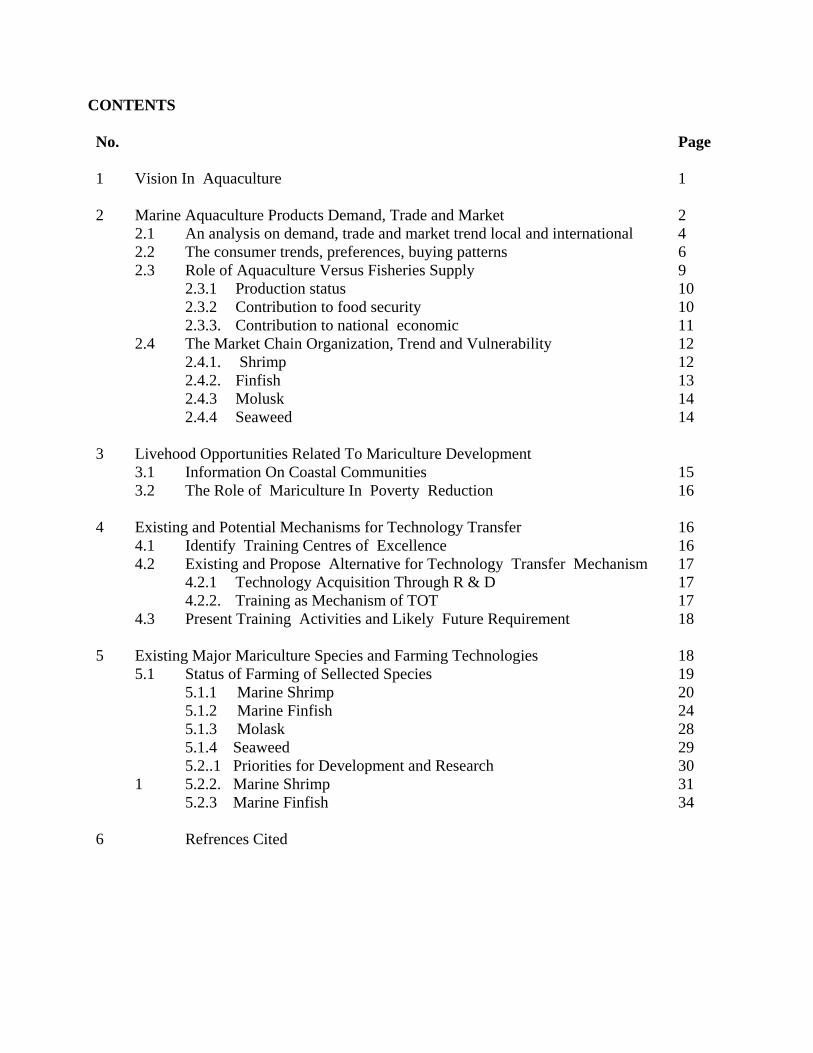
CONTENTS No. Page 1 Vision In Aquaculture 1 2 Marine Aquaculture Products Demand, Trade and Market 2 2.1 An analysis on demand, trade and market trend local and international 4 2.2 The consumer trends, preferences, buying patterns 6 2.3 Role of Aquaculture Versus Fisheries Supply 9 2.3.1 Production status 10 2.3.2 Contribution to food security 10 2.3.3. Contribution to national economic 11 2.4 The Market Chain Organization, Trend and Vulnerability 12 2.4.1. Shrimp 12 2.4.2. Finfish 13 2.4.3 Molusk 14 2.4.4 Seaweed 14 3 Livehood Opportunities Related To Mariculture Development 3.1 Information On Coastal Communities 15 3.2 The Role of Mariculture In Poverty Reduction 16 4 Existing and Potential Mechanisms for Technology Transfer 16 4.1 Identify Training Centres of Excellence 16 4.2 Existing and Propose Alternative for Technology Transfer Mechanism 17 4.2.1 Technology Acquisition Through R & D 17 4.2.2. Training as Mechanism of TOT 17 4.3 Present Training Activities and Likely Future Requirement 18 5 Existing Major Mariculture Species and Farming Technologies 18 5.1 Status of Farming of Sellected Species 19 5.1.1 Marine Shrimp 20 5.1.2 Marine Finfish 24 5.1.3 Molask 28 5.1.4 Seaweed 29 5.2..1 Priorities for Development and Research 30 1 5.2.2. Marine Shrimp 31 5.2.3 Marine Finfish 34 6 Refrences Cited
3
RECENT REPORT ON COASTAL / MARINE AQUACULTURE STATUS IN MALAYSIA
1 Vision In Aquaculture
Malaysia is located in the heart of southeast Asia. Consisting of 127,000 sq.miles
(330,200 sq. km). The country is divided into two main regions: Peninsular Malaysia,
which lies south of Thailand, and East Malaysia, which can be found north of Indonesia
on the island of Borneo. Although East Malaysia occupies the larger portion of
Malaysia’s total area, it is primarily comprised of undeveloped land and jungles. Hence
about three quarter of its 23 million population stay in the Peninsular Malaysia.
Being surrounded by sea, Malaysia has a coastline of 4800 km. Within this the
mangrove forest covered about 641,000 ha. A big portion are located in Sabah or 57
percent of the share, 26 percent in Sarawak and only 17 percent is in Peninsular
Malaysia. Beyond the shore are over two hundred islands with warm clear waters and
teeming marine life have delighted underwater adventures.
On climate side, average temperature is between 21 to 32 degree celcius. Humidity is
high. Rain tends to occur between November to February on the east coast of Peninsular
Malaysia, on the western Sarawak, and north-eastern Sabah. On the west coast of
Peninsular Malaysia the rainy seasons is April to May and October to November. With its
favorable climate supported by a vast resources Malaysia has a great potential for
aquaculture development.
As to look forward to become a develop country status by the year 2020, Malaysia
recognizes the significance of sustainable aquaculture as an integral part of efforts to
develop its natural resources. On the way Malaysia is putting up effort to increase its
aquaculture production. An area that is given attention is shrimp and marine finfish
aquaculture industry. Various institutions and government agencies had been given the
task to commercialize this sector, get involve in research, training and development. On
the other hand, mindful of the rising labor shortage in Malaysia, the government policy
4
is to promote capital intensive large scale commercial shrimp aquaculture farms. We
promote mechanization and automation whenever feasible. Farms are encouraged to
operate on an integrated and self-sustaining basis. Fry and feed production, processing
and packaging, as well as marketing, are built into these vertically integrated systems. In
achieving these Malaysia as well encouraged partnership. The government also interested
in attracting foreign capital and appropriate know-how whenever is available to develop
this sector through environment friendly technologies. As a step to get closer to
understand recent status of marine aquaculture in Malaysia some inputs are provided in
this report.
2 Marine Aquaculture Products Demand, Trade and Market
2.1 An analysis on demand, trade and market trend local and international Annually from 2002 to 2004 production of fish from marine sector in Malaysia were
about 1.4 million metric tons value slightly more than RM 5 billion. The bulk of the
production or closed to 90 percent of the contribution came from capture fisheries sector.
At an average 10 percent of the share is product from aquaculture. This was amounted to
about 1200 to 1400 metric tons which was valued between to RM 700-900 million
annually during the last five years period (Table 2.0). Overall, brackish water aquaculture
contributed on average 70 to 75 percent of the total aquaculture production. In term of
quantity, big chunk or about 30-40 percent and 10-20 percent of marine aquaculture
production were from cockle rearing and seaweed cultivation, respectively. Pond based
production which is typically for shrimp aquaculture and cage system contributed at
about 5 and 15 percent respectively in term of fish volume in marine aquaculture sector.
Despite the low volume, products from this sector earned highest trading value in fishery
product.
As a cheap source of animal protein fish is considered an important food item by local.
Due to easy access to fish and fish products Malaysia is among the country with highest
fish consumption in the world. Estimate put that on average per capita consumption was
49 kg per capita in year 2000. This was further increased to 53 kg per capita in the year
2005 and is expected to rise further to 56 kg percapita in the year 2010. The important of
5
fish as food is further reflected in expenditure of the household. On average this was
about 20 percent of their food budget (8th Malaysian plan). With the increase in number
of population of the country and increase in health consciousness among the people
apparently current local production will not able to meet the goal of self sufficiency
within these coming years. Basically, the self sufficiency was only 89 percent in year
2000. This was slightly increased to about 90 percent in year 2005 and expected to be
slightly increase to 94.3 percent in 2010 if strategies and action plans put under NAP3
new policy thrust is achieved.
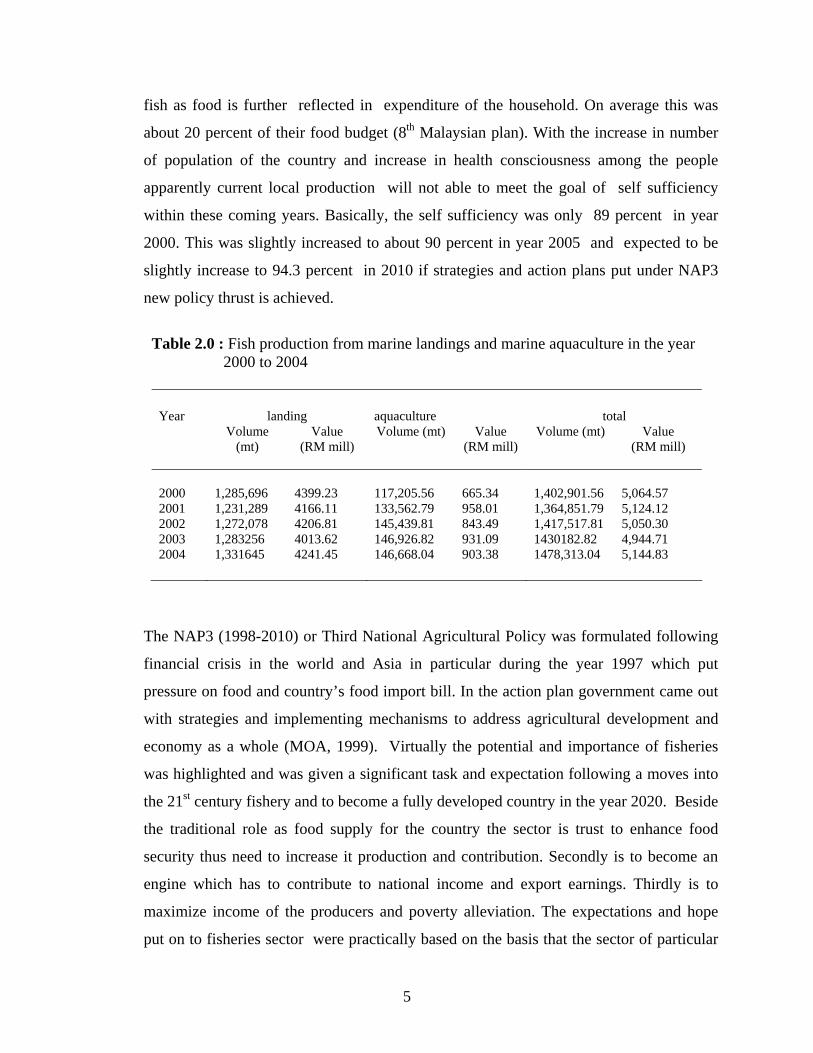
Table 2.0 : Fish production from marine landings and marine aquaculture in the year 2000 to 2004
Year landing aquaculture total Volume
(mt) Value
(RM mill) Volume (mt) Value
(RM mill) Volume (mt) Value
(RM mill) 2000
1,285,696
4399.23
117,205.56
665.34
1,402,901.56
5,064.57
2001 1,231,289 4166.11 133,562.79 958.01 1,364,851.79 5,124.12 2002 1,272,078 4206.81 145,439.81 843.49 1,417,517.81 5,050.30 2003 1,283256 4013.62 146,926.82 931.09 1430182.82 4,944.71 2004 1,331645 4241.45 146,668.04 903.38 1478,313.04 5,144.83
The NAP3 (1998-2010) or Third National Agricultural Policy was formulated following
financial crisis in the world and Asia in particular during the year 1997 which put
pressure on food and country’s food import bill. In the action plan government came out
with strategies and implementing mechanisms to address agricultural development and
economy as a whole (MOA, 1999). Virtually the potential and importance of fisheries
was highlighted and was given a significant task and expectation following a moves into
the 21st century fishery and to become a fully developed country in the year 2020. Beside
the traditional role as food supply for the country the sector is trust to enhance food
security thus need to increase it production and contribution. Secondly is to become an
engine which has to contribute to national income and export earnings. Thirdly is to
maximize income of the producers and poverty alleviation. The expectations and hope
put on to fisheries sector were practically based on the basis that the sector of particular
6
aquaculture can produce food at cost competitive. Aside to that the country still has a
vast suitable areas for the industry development. Last but not least was from the stand
point of economic. Previous records of earnings indicated that the fisheries sector was a
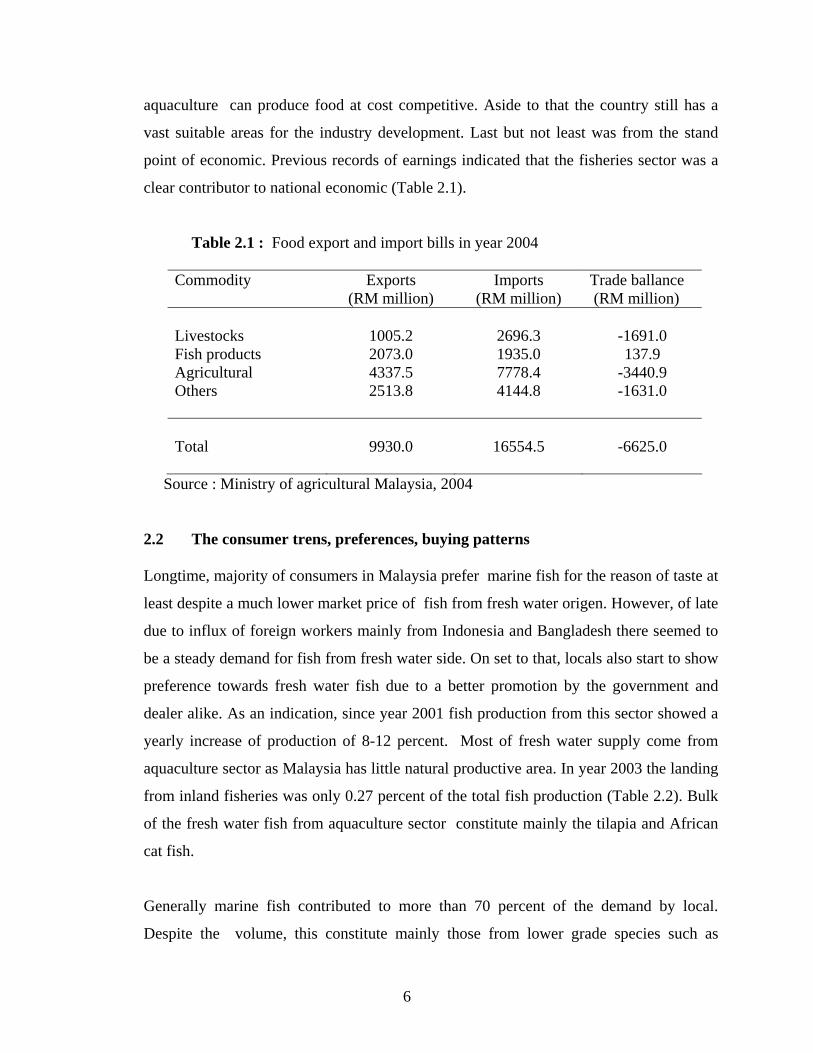
clear contributor to national economic (Table 2.1).
Table 2.1 : Food export and import bills in year 2004
Commodity Exports (RM million)
Imports (RM million)
Trade ballance (RM million)
Livestocks
1005.2
2696.3
-1691.0
Fish products 2073.0 1935.0 137.9 Agricultural 4337.5 7778.4 -3440.9 Others 2513.8 4144.8 -1631.0 Total
9930.0
16554.5
-6625.0
Source : Ministry of agricultural Malaysia, 2004 2.2 The consumer trens, preferences, buying patterns Longtime, majority of consumers in Malaysia prefer marine fish for the reason of taste at
least despite a much lower market price of fish from fresh water origen. However, of late
due to influx of foreign workers mainly from Indonesia and Bangladesh there seemed to
be a steady demand for fish from fresh water side. On set to that, locals also start to show
preference towards fresh water fish due to a better promotion by the government and
dealer alike. As an indication, since year 2001 fish production from this sector showed a
yearly increase of production of 8-12 percent. Most of fresh water supply come from
aquaculture sector as Malaysia has little natural productive area. In year 2003 the landing
from inland fisheries was only 0.27 percent of the total fish production (Table 2.2). Bulk
of the fresh water fish from aquaculture sector constitute mainly the tilapia and African
cat fish.
Generally marine fish contributed to more than 70 percent of the demand by local.
Despite the volume, this constitute mainly those from lower grade species such as
7
mackerel, sardines, scad and tuna. Beside economic reason it is worth noting that eating
habit and dining style of Malaysian especially the Malay ethnic group which is the
majority is inclined towards small fish serving. The big or high value fish such as
crustacean is normally served in restaurant and of high demand during festive season and
ceremony especially among the Chinese community. Except cockle and mussel, fish
from marine aquaculture sector generally do not really supply the need of ordinary
people.
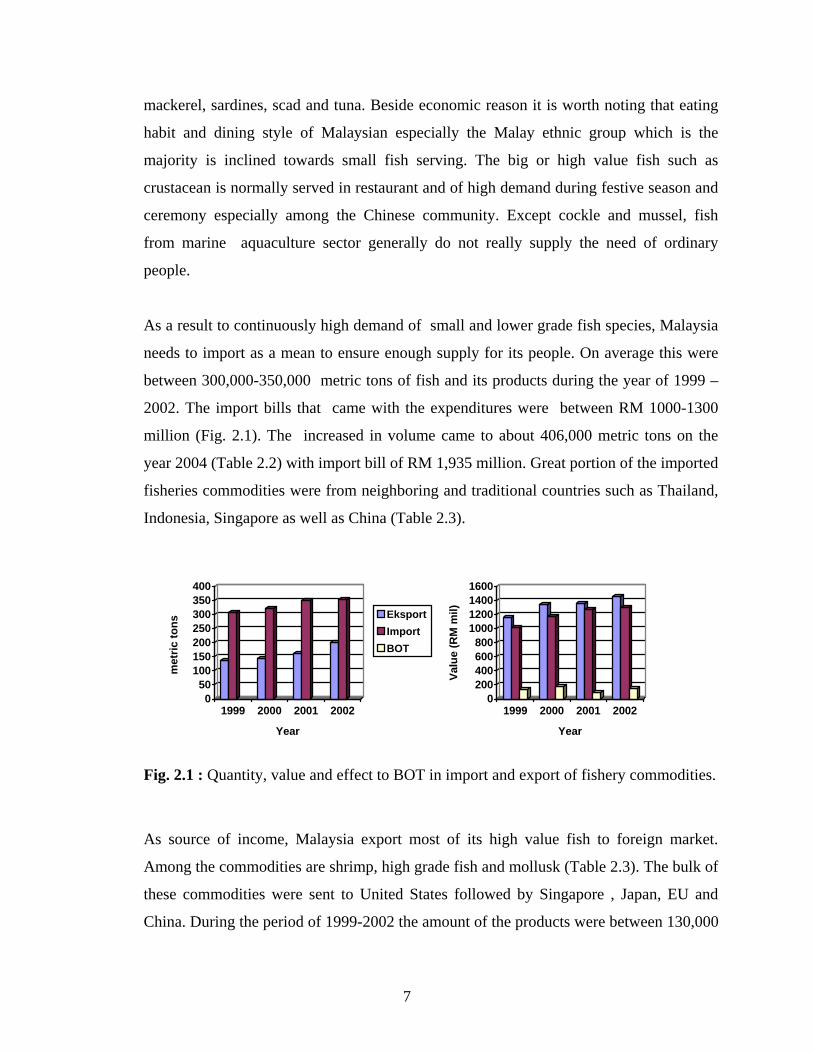
As a result to continuously high demand of small and lower grade fish species, Malaysia
needs to import as a mean to ensure enough supply for its people. On average this were
between 300,000-350,000 metric tons of fish and its products during the year of 1999 –
2002. The import bills that came with the expenditures were between RM 1000-1300
million (Fig. 2.1). The increased in volume came to about 406,000 metric tons on the
year 2004 (Table 2.2) with import bill of RM 1,935 million. Great portion of the imported
fisheries commodities were from neighboring and traditional countries such as Thailand,
Indonesia, Singapore as well as China (Table 2.3).
Fig. 2.1 : Quantity, value and effect to BOT in import and export of fishery commodities.
As source of income, Malaysia export most of its high value fish to foreign market.
Among the commodities are shrimp, high grade fish and mollusk (Table 2.3). The bulk of
these commodities were sent to United States followed by Singapore , Japan, EU and
China. During the period of 1999-2002 the amount of the products were between 130,000
050
100150200250300350400
met
ric to
ns
1999 2000 2001 2002
Year
EksportImportBOT
0200400600800
1000120014001600
Valu
e (R
M m
il)
1999 2000 2001 2002
Year
8
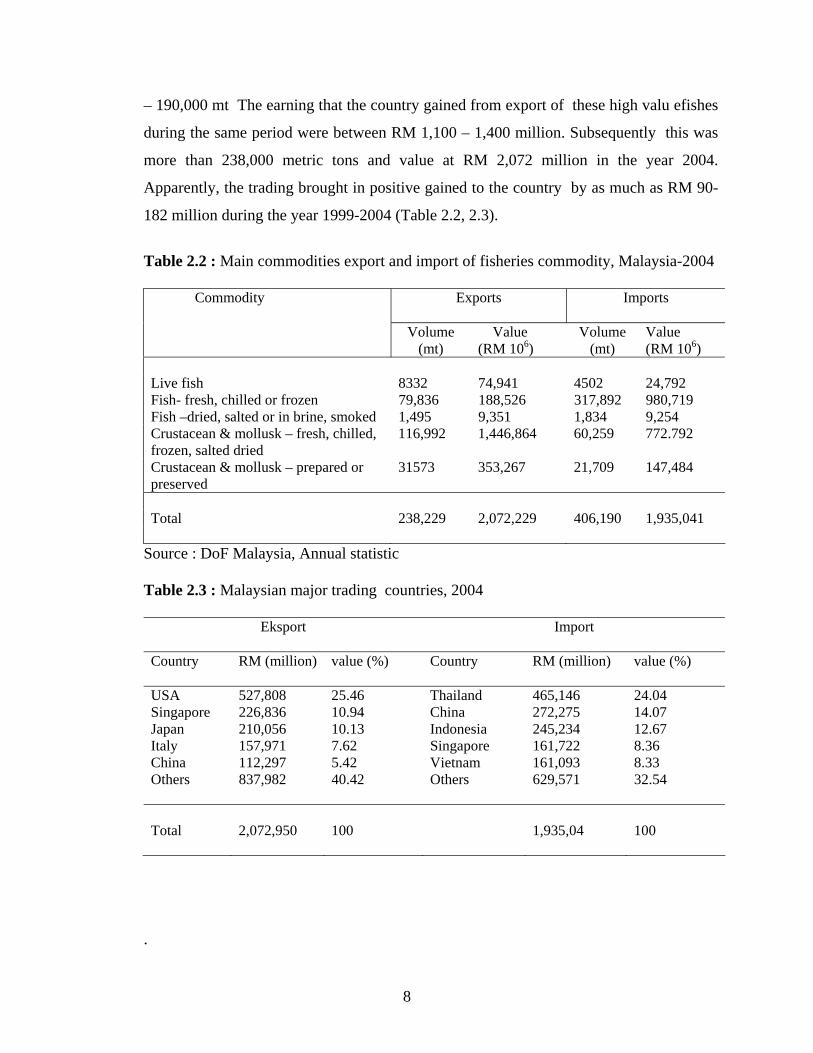
– 190,000 mt The earning that the country gained from export of these high valu efishes
during the same period were between RM 1,100 – 1,400 million. Subsequently this was
more than 238,000 metric tons and value at RM 2,072 million in the year 2004.
Apparently, the trading brought in positive gained to the country by as much as RM 90-
182 million during the year 1999-2004 (Table 2.2, 2.3).
Table 2.2 : Main commodities export and import of fisheries commodity, Malaysia-2004 Commodity Exports
Imports
Volume
(mt) Value (RM 106)
Volume (mt)
Value (RM 106)
Live fish 8332 74,941 4502 24,792 Fish- fresh, chilled or frozen 79,836 188,526 317,892 980,719 Fish –dried, salted or in brine, smoked 1,495 9,351 1,834 9,254 Crustacean & mollusk – fresh, chilled, frozen, salted dried
116,992 1,446,864 60,259 772.792
Crustacean & mollusk – prepared or preserved
31573 353,267 21,709 147,484
Total 238,229 2,072,229 406,190 1,935,041
Source : DoF Malaysia, Annual statistic Table 2.3 : Malaysian major trading countries, 2004
Eksport Import
Country RM (million) value (%) Country RM (million) value (%)
USA 527,808 25.46 Thailand 465,146 24.04 Singapore 226,836 10.94 China 272,275 14.07 Japan 210,056 10.13 Indonesia 245,234 12.67 Italy 157,971 7.62 Singapore 161,722 8.36 China 112,297 5.42 Vietnam 161,093 8.33 Others 837,982 40.42 Others 629,571 32.54
Total
2,072,950
100
1,935,04
100
.
9
2.3 Role of Aquaculture Versus Fisheries Supply
Similar to other Asian countries, fish and its product continue to play a vital role as a
main supplier of cheap source of protein to their population. The fact that there is very
little landing from inland fisheries and typical of Malaysian which put preference to
marine fish has make the need to put much weight to increase production from the marine
sector. Apparently however, landings from the coastal water which supply more than 80
percent of the fish sources was long time exploited to maximum and practically will not
contribute extra. The rely on sources from deep-sea water however was not taken
seriously by locals. Till end of 2004 the deep-sea fishing fleet stand at only 761 units.
Still a small fleet, it practically will not bring any significant changes to marine landing
to the country within these coming years. Hence, the only area left is aquaculture.
Obviously thus the government put up strategies to develop marine aquaculture and
clearly defined under Third National Agricultural Policy (NAP3) 1998-2010 as outlined
earlier in the text. The sector is trusted with a task of to enhance food security and create
income to balance out food import bills (BOT) which were long time showed a deficit.
While recognizing aquaculture as one of the thrust areas for development, the
government of Malaysia is fully aware of the growing concern over sustainability and
environmental impact of shrimp aquaculture. Human greed, coupled with profit driven,
irresponsible, shortsighted activities, are not to be allowed to tarnish the image of
aquaculture. In step toward realizing this, the impacts of aquaculture on coastal eco-
systems including mangroves, water and soil quality, as well as socio-economic linkages
in rural communities, are carefully studied. The government also interested in attracting
foreign capital and appropriate know-how whenever is available to develop this sector
through environment friendly technologies.
Malaysia fully supports the initiatives taken by UN bodies, such as FAO (FAO, 1997), to
introduce a Code of Conduct for Responsible Fisheries. The government has already
initiated steps to zone specific areas for aquaculture and develop standard for sustainable
aquaculture practice that do not lead to ecological imbalances. Legislative measures on
10
code of practice for shrimp aquaculture and establishment of fish health management
programmes of international standard are under active consideration (FAO, 2004).
2.3.1 Production status
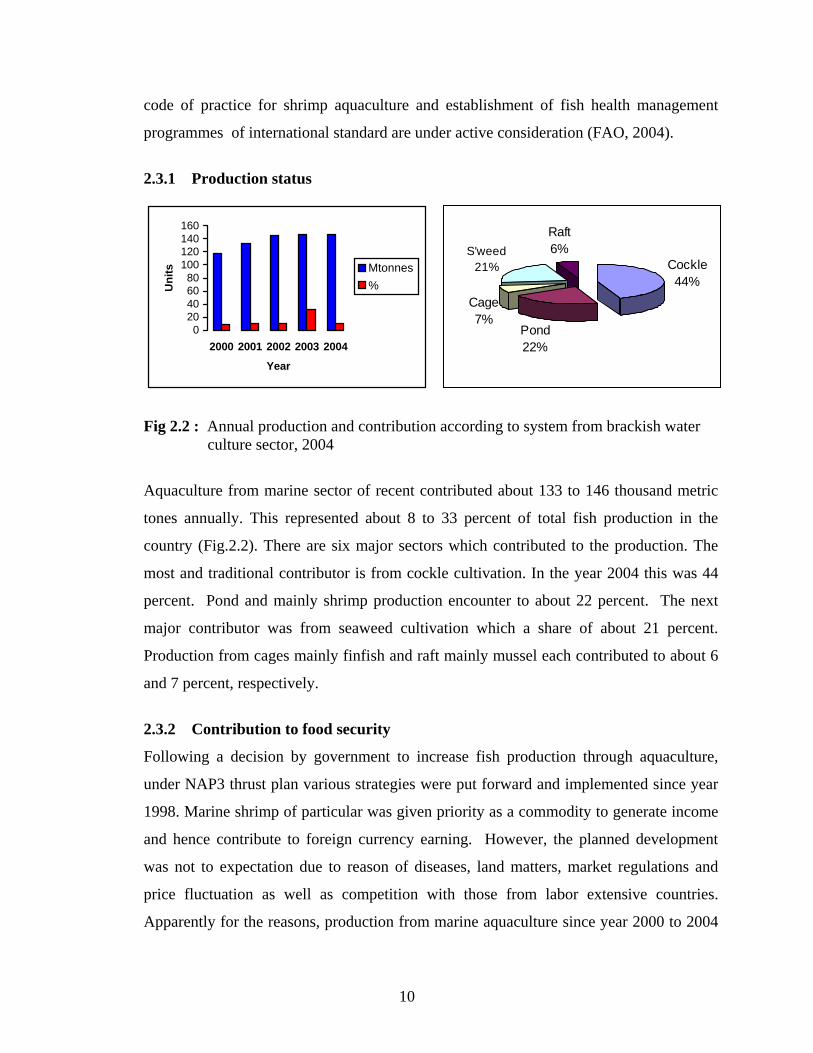
Fig 2.2 : Annual production and contribution according to system from brackish water culture sector, 2004
Aquaculture from marine sector of recent contributed about 133 to 146 thousand metric
tones annually. This represented about 8 to 33 percent of total fish production in the
country (Fig.2.2). There are six major sectors which contributed to the production. The
most and traditional contributor is from cockle cultivation. In the year 2004 this was 44
percent. Pond and mainly shrimp production encounter to about 22 percent. The next
major contributor was from seaweed cultivation which a share of about 21 percent.
Production from cages mainly finfish and raft mainly mussel each contributed to about 6
and 7 percent, respectively.
2.3.2 Contribution to food security
Following a decision by government to increase fish production through aquaculture,
under NAP3 thrust plan various strategies were put forward and implemented since year
1998. Marine shrimp of particular was given priority as a commodity to generate income
and hence contribute to foreign currency earning. However, the planned development
was not to expectation due to reason of diseases, land matters, market regulations and
price fluctuation as well as competition with those from labor extensive countries.
Apparently for the reasons, production from marine aquaculture since year 2000 to 2004
Pond22%
Cage7%
Raft6%S'weed
21% Cockle44%
020406080
100120140160
2000 2001 2002 2003 2004
Year
Uni
ts Mtonnes%
11
as a whole did not indicate much development. Obviously annual growth rate of about 20
percent is expected under NAP3. In early year of its implementation there seemed to be a
jump, however a temporary. After a slight jumped of about 13 percent from about 117
thousand metric tones in the year 2000 production from marine aquaculture almost did
not indicate any development as to the year 2004. The contributions were maintained in
the range of 133 to 146 thousand metric tones annually. From an increased of about 8
percent in the year 2002, the three consecutive years after that showed only an annual
increased of 1 percent (Fig. 2.2 ).
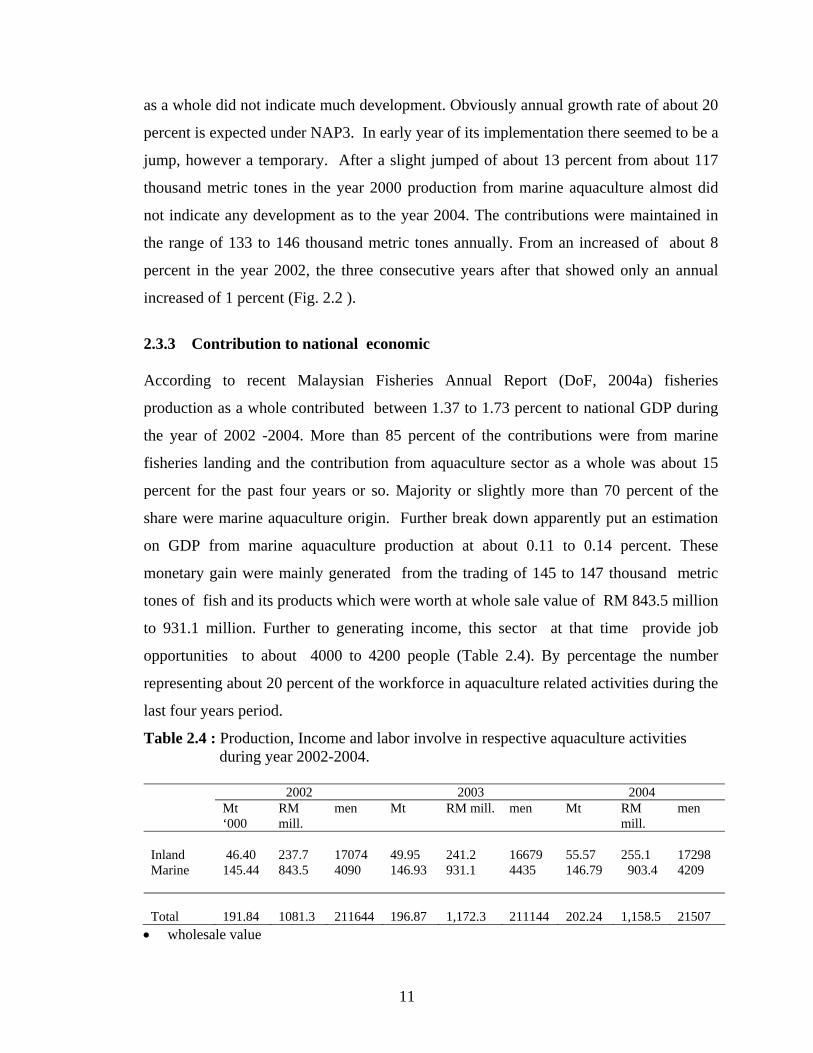
2.3.3 Contribution to national economic
According to recent Malaysian Fisheries Annual Report (DoF, 2004a) fisheries
production as a whole contributed between 1.37 to 1.73 percent to national GDP during
the year of 2002 -2004. More than 85 percent of the contributions were from marine
fisheries landing and the contribution from aquaculture sector as a whole was about 15
percent for the past four years or so. Majority or slightly more than 70 percent of the
share were marine aquaculture origin. Further break down apparently put an estimation
on GDP from marine aquaculture production at about 0.11 to 0.14 percent. These
monetary gain were mainly generated from the trading of 145 to 147 thousand metric
tones of fish and its products which were worth at whole sale value of RM 843.5 million
to 931.1 million. Further to generating income, this sector at that time provide job
opportunities to about 4000 to 4200 people (Table 2.4). By percentage the number
representing about 20 percent of the workforce in aquaculture related activities during the
last four years period.
Table 2.4 : Production, Income and labor involve in respective aquaculture activities during year 2002-2004.
2002 2003 2004 Mt
‘000 RM mill.
men Mt RM mill. men Mt RM mill.
men
Inland
46.40
237.7
17074
49.95
241.2
16679
55.57
255.1
17298
Marine 145.44 843.5 4090 146.93 931.1 4435 146.79 903.4 4209
Total
191.84
1081.3
211644
196.87
1,172.3
211144
202.24
1,158.5
21507
• wholesale value
12
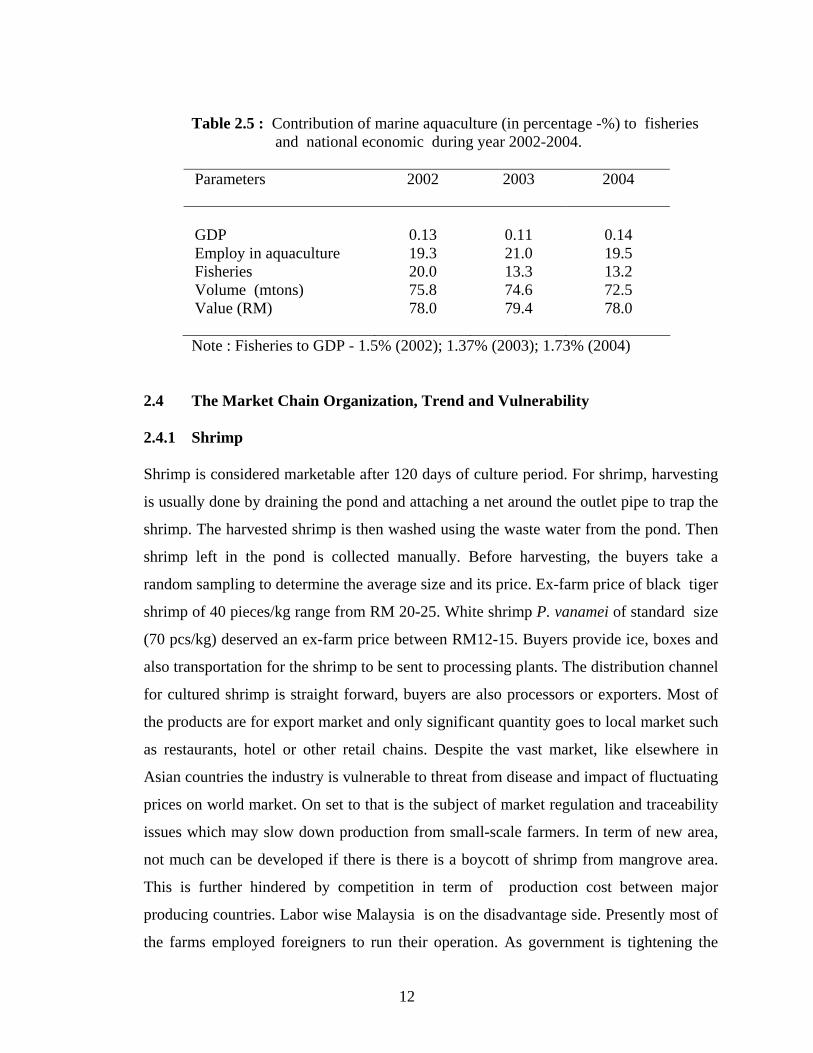
Table 2.5 : Contribution of marine aquaculture (in percentage -%) to fisheries and national economic during year 2002-2004.
Parameters 2002 2003 2004
GDP
0.13
0.11
0.14
Employ in aquaculture 19.3 21.0 19.5 Fisheries 20.0 13.3 13.2 Volume (mtons) 75.8 74.6 72.5 Value (RM) 78.0 79.4 78.0
Note : Fisheries to GDP - 1.5% (2002); 1.37% (2003); 1.73% (2004)
2.4 The Market Chain Organization, Trend and Vulnerability
2.4.1 Shrimp
Shrimp is considered marketable after 120 days of culture period. For shrimp, harvesting
is usually done by draining the pond and attaching a net around the outlet pipe to trap the
shrimp. The harvested shrimp is then washed using the waste water from the pond. Then
shrimp left in the pond is collected manually. Before harvesting, the buyers take a
random sampling to determine the average size and its price. Ex-farm price of black tiger
shrimp of 40 pieces/kg range from RM 20-25. White shrimp P. vanamei of standard size
(70 pcs/kg) deserved an ex-farm price between RM12-15. Buyers provide ice, boxes and
also transportation for the shrimp to be sent to processing plants. The distribution channel
for cultured shrimp is straight forward, buyers are also processors or exporters. Most of
the products are for export market and only significant quantity goes to local market such
as restaurants, hotel or other retail chains. Despite the vast market, like elsewhere in
Asian countries the industry is vulnerable to threat from disease and impact of fluctuating
prices on world market. On set to that is the subject of market regulation and traceability
issues which may slow down production from small-scale farmers. In term of new area,
not much can be developed if there is there is a boycott of shrimp from mangrove area.
This is further hindered by competition in term of production cost between major
producing countries. Labor wise Malaysia is on the disadvantage side. Presently most of
the farms employed foreigners to run their operation. As government is tightening the
13
procedure for entry Obviously however, if Malaysia could make used of fuel as its
strong point to reduce cost of production probably the industry have little more space to
remain competitive.
2.4.2 Finfish
Marine finfish is considered marketable at about 500 g. However, different markets may
takes different sizes. Consumers in Hong Kong prefer 600 g to 1.2 kg sizes for life
grouper. There are two mode of marketing channels. One to local markets and the other is
to overseas, mainly Hong Kong. Species cultured for local market are mostly seabass,
various species of snapper and black grouper. The ex-farm price for seabass is between
RM12-14 per kg, black grouper and snapper is between RM18-25 per kg. Despite that
local market for live marine finfish is very .limited to festivals and the peak season for
consumption is around January-March coincided with Chinese New Year. On ordinary
days the main outlet are Chinese seafood restaurant. The price of fish in restaurant is least
double than of the farm. Export market are fish of high-value such as tiger grouper and
mouse grouper. The price is reflected in international market.
For live finfish, handling and packaging are given a serious attention to ensure the best
price. Shipment of fish from cages to local market or to holding tanks or nets is done by
using truck equipped with an aerated seawater tank. Shipment of live fish is done in two
ways, one is actual packing in plastic bag and the other usually in large quantity is by
Live Fish Transport Vessel (LFTVs), usually owned by Hong Kong importer. Fish in
plastic bags are commonly for airfreight transportation. They are placed about 4-5 kg per
bag in a 4 layers plastic bag followed by a final packing into styrofoam boxes or simply
into cardboard boxes.
Typically the practice of production for live fish market will not see drastic scale up of
the production in near future as expected by government which was stipulated in NAP3.
Foremost it is constraint by seasonal demand and secondly dilemma to suit the changing
demands of market which need multi species of production. On set to that the industry is
vulnerable to supply of seed and space to expend the operation. Disregard the result of
14
ever changing species and seasonal in demand, seed is still a major constraint in
development of traditional fish such as seabass. While practically the number of supplier
is enough, most of them however practicing pond-based production system which
adversely vulnerable to infection and poor survival hence quality delivered to farmers.
Due to seasonal demand and multi species fish culture operation in nature also effect seed
supply. Seed producer is in dilemma to upgrade their system. On space of culture, there
seem to be little can be done as area is restricted and is further vulnerable to carrying
capacity and increasing coastal water pollution problem. Unless deep sea cage or land-
based system is employed the future direction of this industry is limited.
2.4.3 Molusk
By large production from cockle cultivation, green mussel and oyster are sold at local
market through middlemen. The retail price of a kg of cockle is RM1.50-2.00. Raw
mussel usually has retail price of about RM 5.00. The dried form may fetch a retail price
of about RM12-15. In volume fresh oyster is still small and mostly sent direct to seafood
restaurant or hotel. A piece of fresh mussel may fetch a ex-farm price of RM 1-3.
Typically a nature given commodity, harvest from cockle cultivation depend largely on
availability of suitable mudflat area and environmental free pollution zone. Future plan to
expand the cockle, mussel and oyster culture may look into constrain in the aspect of seed
supply, effect of harm full algal bloom and food safety issues. The food safety issue need
to address with rigorous environmental monitoring and quality controls.
2.4.4 Seaweed
Singularly a Sabah product, main commercial species culture is Eucheuma. cottonii.
Environmental conditions around the Sabah coastline are generally favorable for culture
of the species. Many of the operator there are Fillipino ancestry. Seaweed is sold as dried
item. It take approximately 9 kg of seaweed to produce a kg of its dried form. Seaweed
culture is low capital investment and has a fast turn over. In general according to report
by DoF seaweed production still profitable from steady production volume recorded of
recent (DoF, 2004a). Seaweed from Sabah is mainly for export market mainly to
Denmark . Its dried form is sold directly to exporter without using any middlemen.
15
Usually the later assists farmers by providing its aquaculture facilities hence an obligation
to sell the product back. The price for a kg of dried form is about RM1.50. Of late
however not many people wanted to get involve in the culture of seaweed because of
better opportunities in other sectors. Beside price incentive, commercial production of it
is quiet risky as the price is generally fluctuates and harvest largely depend on good sun-
drying condition. In addition future expend need to take into consideration of conflict
with trees passing of fishing boats and promotion of tourism industry.
3 Livehood Opportunities Related To Mariculture Development
3.1 Information On Coastal Communities
Majority of the coastal communities earned a living from activity related to fisheries. The
most common occupation is as fisherman. Other economically important activities
include small scale aquaculture and food processing related to fish products. As
fishermen, majority still dominate the traditional fishing sector. Unofficial estimate put a
figure of about 10 percent from total of more than 80,000 fishermen fall into poor
category or below poverty level (RM 529 per month) (Table 3.1). This category of
people mostly are employer which work in commercial fishing boats or as helper in
traditional fishing boats. The reason for them to remain in this part of occupation is
education background. Data from reliable sources indicated that 50 percent of the coastal
communities which involved in fishing industry finished their education up to only
primary level. Close to 20 percent did not has any formal education or never attended
school at all. Due to their economic well being about 20-25 percent do not own house.
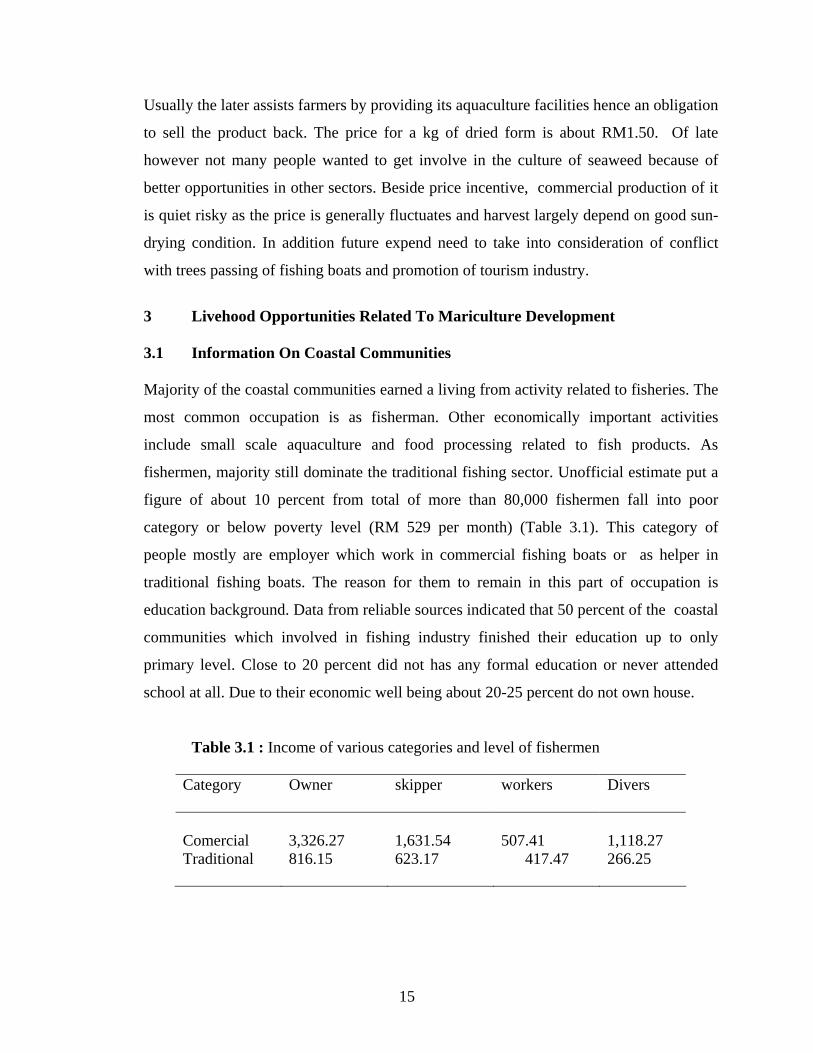
Table 3.1 : Income of various categories and level of fishermen
Category Owner skipper workers Divers
Comercial 3,326.27 1,631.54 507.41 1,118.27 Traditional 816.15 623.17 417.47 266.25
16
3.2 The Role of Mariculture In Poverty Reduction
The implementation of commercial scale aquaculture projects in coastal areas has good
potential to contribute to food production and poverty alleviation to coastal communities
beside earning income to producers and generate foreign exchange earning to the country
The activities can create employment to the communities and hopefully with much
better take home and a less risk job to that as fishermen. Beside, the infrastructure such
as electricity supply and communication and road access will spur up related economic
activities which finally has a direct impact to coastal communities. As envisaged by
government if the aquaculture production as targeted is fulfilled to maximum there is a
possibility that the percentage of population fall into poverty level will drop drastically
within few years from now (Table 3.2) and may be eradicated totally by end of 2009 or
before the final date of Ninth Malaysian Plan (RM9).
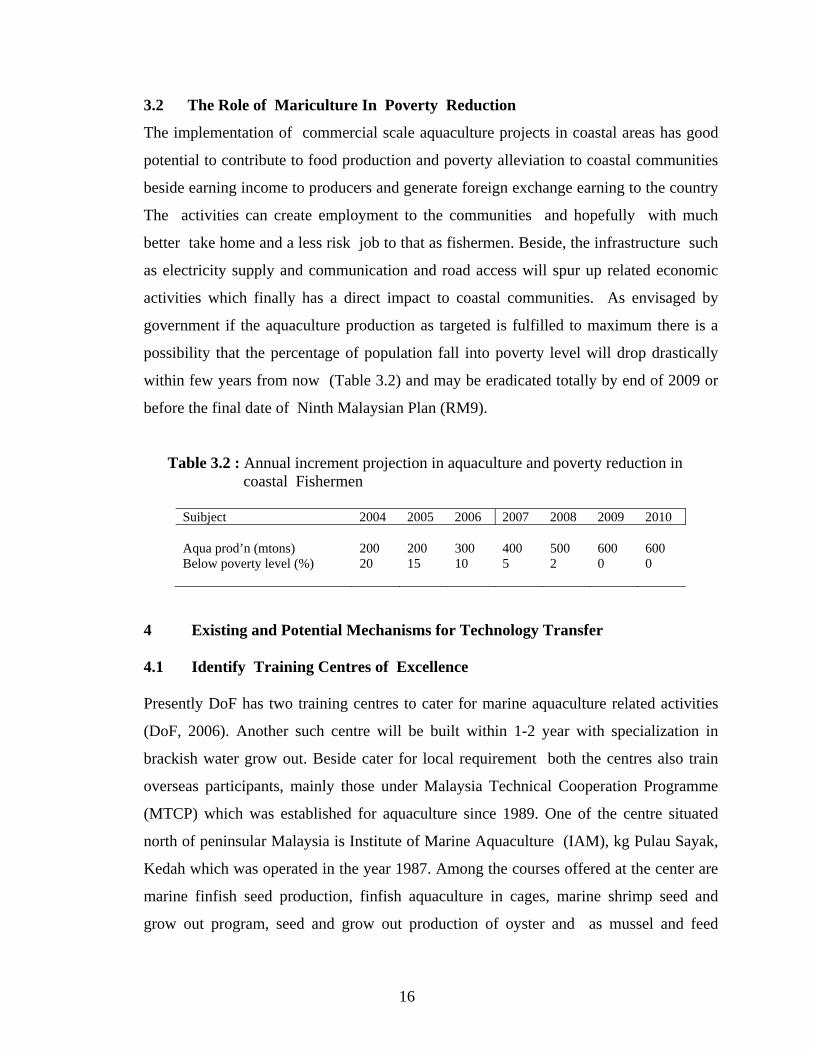
Table 3.2 : Annual increment projection in aquaculture and poverty reduction in coastal Fishermen
Suibject 2004 2005 2006 2007 2008 2009 2010 Aqua prod’n (mtons) 200 200 300 400 500 600 600 Below poverty level (%) 20 15 10 5 2 0 0
4 Existing and Potential Mechanisms for Technology Transfer
4.1 Identify Training Centres of Excellence
Presently DoF has two training centres to cater for marine aquaculture related activities
(DoF, 2006). Another such centre will be built within 1-2 year with specialization in
brackish water grow out. Beside cater for local requirement both the centres also train
overseas participants, mainly those under Malaysia Technical Cooperation Programme
(MTCP) which was established for aquaculture since 1989. One of the centre situated
north of peninsular Malaysia is Institute of Marine Aquaculture (IAM), kg Pulau Sayak,
Kedah which was operated in the year 1987. Among the courses offered at the center are
marine finfish seed production, finfish aquaculture in cages, marine shrimp seed and
grow out program, seed and grow out production of oyster and as mussel and feed
17
formulation for farm practice (DoF, 2006). The second training centre for marine
aquaculture in Malaysia is Marine Finfish Production and Research Centre (MFPRC)
Tanjung Demong, Besut, Terangganu located at the east coast of peninsular. At MFPRC
courses offered are marine finfish fry production and cage culture operation.
4.2 Existing and Propose Alternative for Technology Transfer Mechanism
In making a concerted bid to develop the aquaculture into a major industry by 2010
government of Malaysia through DoF had put emphasized on acquisition of technology
through research and development (R&D) and by mean of training mechanism to acquire
and transfer that technologies.
4.2.1 Technology Acquisition Through R & D
Realizing that private sectors play a critical role to spur development in this sector but yet
they may not keen to invest in research due to long term result government hence practice
a joint project. The area that is most looking for is in quality seed production, an example
is in production of SPF broodstock. Beside government too will provide high grade
broodstock to farmers as a mean to initiate them to produce high quality seed. To
facilitate research in such area government will develop her staff capability and skill in
area such as biotechnology, genetic engineering, breeding and disease. At the same time
outsourcing mechanism may be adapted as to bring in knowledge from outside.
4.2.2 Training As Mechanism of TOT
Since sometimes it was an obligation on the part of DoF to provide knowledge and
technology to aquaculturist and aquaculturist to be. With an increase demand from the
industry and to fulfill manpower requirement for development available facilities are
being upgraded and those new one will be built to increase the number so enable more
participant enrollment and access to knowledge. On side to that syllabus is improved and
personnel upgrade. Latest development in this aspect, DoF alongside with National
Vocational Training Authority (MLVK) lunched training school to produce qualified skill
manpower in various field of aquaculture.
18
4.3 Present Training Activities and Likely Future Requirement
Currently DOF is officially conducting 8 training programs in brackish water/marine
aquaculture as listed in Table 4.1 in two of her training station specialize in brackish
water/marine sector. Include in the syllabus of these training programme are subject as
disease diagnosis and water quality management. In near future no doubt additional
programme need to be included. Area that most likely to be likely included is finfish
broodstock management and spawning, and management and application of recirculating
system.
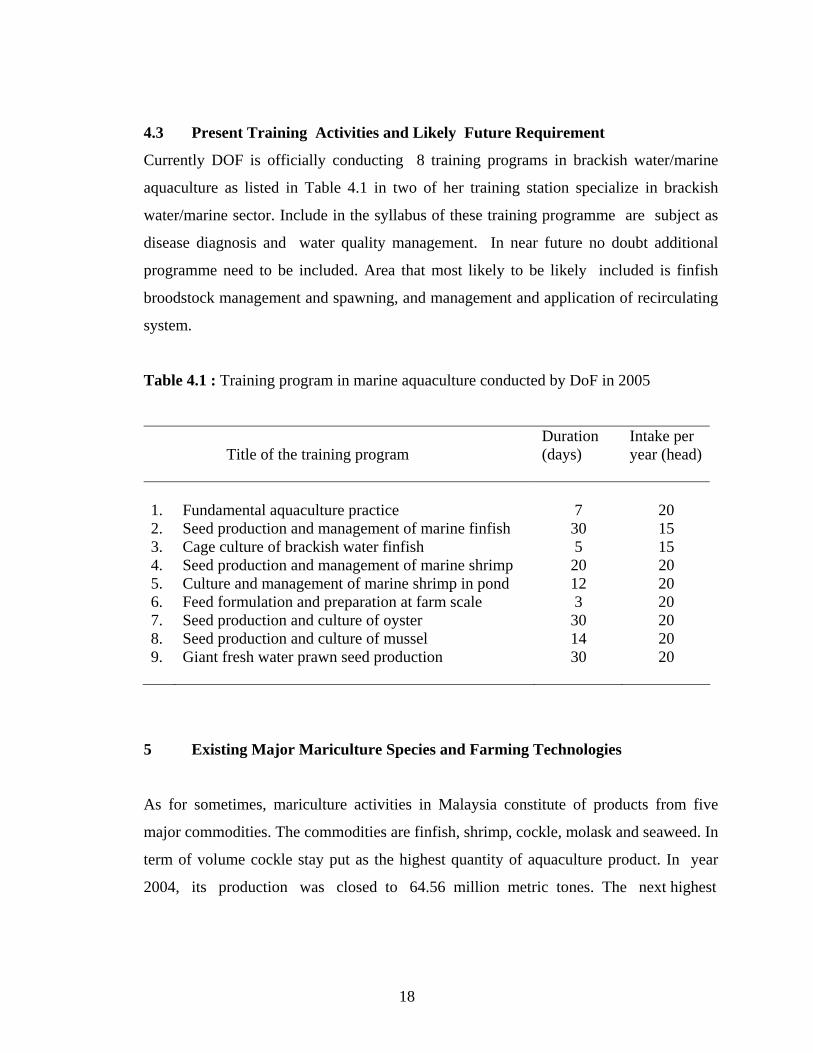
Table 4.1 : Training program in marine aquaculture conducted by DoF in 2005
Title of the training program
Duration (days)
Intake per year (head)
1.
Fundamental aquaculture practice
7
20
2. Seed production and management of marine finfish 30 15 3. Cage culture of brackish water finfish 5 15 4. Seed production and management of marine shrimp 20 20 5. Culture and management of marine shrimp in pond 12 20 6. Feed formulation and preparation at farm scale 3 20 7. Seed production and culture of oyster 30 20 8. Seed production and culture of mussel 14 20 9. Giant fresh water prawn seed production 30 20
5 Existing Major Mariculture Species and Farming Technologies
As for sometimes, mariculture activities in Malaysia constitute of products from five
major commodities. The commodities are finfish, shrimp, cockle, molask and seaweed. In
term of volume cockle stay put as the highest quantity of aquaculture product. In year
2004, its production was closed to 64.56 million metric tones. The next highest
19
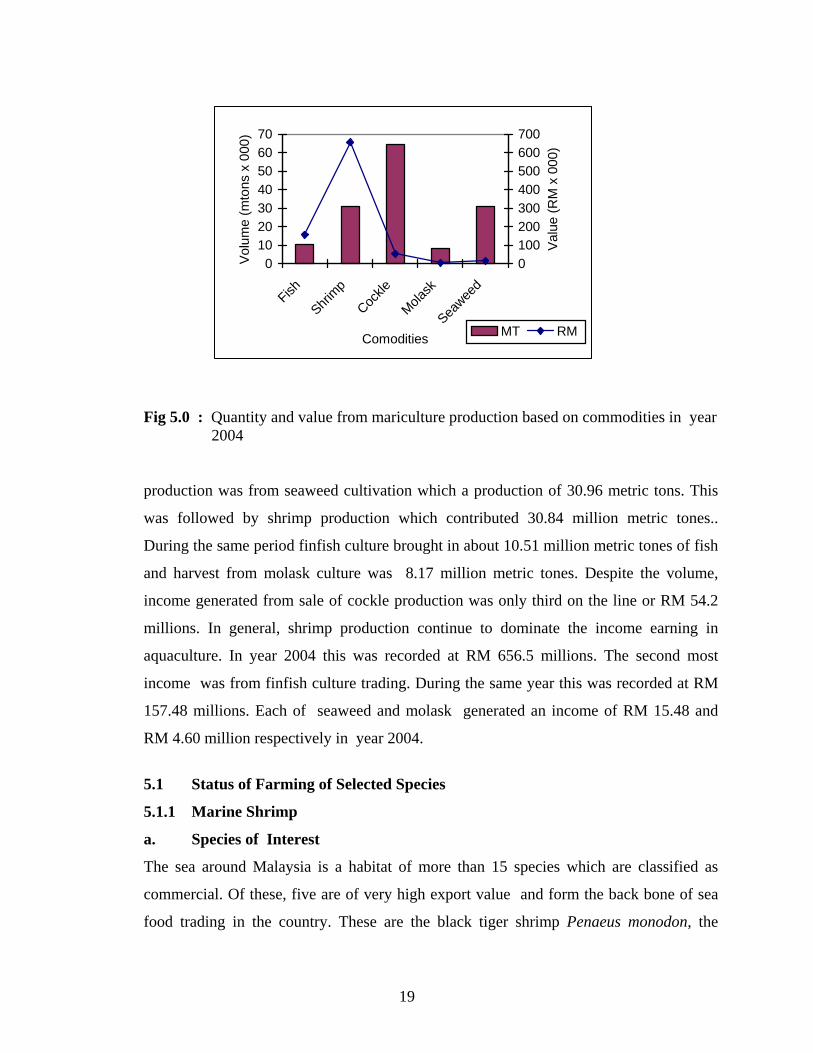
Fig 5.0 : Quantity and value from mariculture production based on commodities in year 2004 production was from seaweed cultivation which a production of 30.96 metric tons. This
was followed by shrimp production which contributed 30.84 million metric tones..
During the same period finfish culture brought in about 10.51 million metric tones of fish
and harvest from molask culture was 8.17 million metric tones. Despite the volume,
income generated from sale of cockle production was only third on the line or RM 54.2
millions. In general, shrimp production continue to dominate the income earning in
aquaculture. In year 2004 this was recorded at RM 656.5 millions. The second most
income was from finfish culture trading. During the same year this was recorded at RM
157.48 millions. Each of seaweed and molask generated an income of RM 15.48 and
RM 4.60 million respectively in year 2004.
5.1 Status of Farming of Selected Species 5.1.1 Marine Shrimp
a. Species of Interest
The sea around Malaysia is a habitat of more than 15 species which are classified as
commercial. Of these, five are of very high export value and form the back bone of sea
food trading in the country. These are the black tiger shrimp Penaeus monodon, the
010203040506070
Fish
Shrimp
Cockle
Molask
Seawee
d
Comodities
Volu
me
(mto
ns x
000
)0100200300400500600700
Valu
e (R
M x
000
)
MT RM
20
banana shrimp P. merguiensis/indicus, the flower shrimp P. semisulcatus and the greasy
back shrimp, Metapenaeus ensis. Despite having varieties, only P. monodon is cultured
at commercial scale ever since. Apparently, however the popularity of black tiger
shrimp P. monodon is slowly taken over by the Hawaian white shrimp Penaeus vanamei.
The illegal introduction of the species was recorded since year 2000. Despite being a
prohibited species, illegal production during year 2003 to 2005 was estimated between
5000 to 7000 metric tones. Considering of the yet unsolved disease problem in black
tiger shrimp, government finally took a stand to legalize its culture effective as April
2004. Nevertheless, in a step to contain disease transmission there is still a control on fry
and brood stock entry into the country.
As happening to many traditional P. monodon producing countries, in the coming years
will see a transitional period. P. vanamei is expected to take over the leading role in
shrimp aquaculture industry if there is yet anything come out toward revitalizing the later
species culture operation. While hoping for a better, department of Fisheries is always
encourage farmers to put interest on culture of local white shrimp P. merguiensis.
Rather not new, this local shrimp species was already being cultured at some scale prior
to a shift to P. vanamei. The product as lived shrimp market were mainly shipped to
Singapore. Beside the P. vanamei factor, for sometime poor interest shown toward
accepting P. merguiensis as an aquaculture organism is due to a fact that it shows poor-
growth-performance under high culture density. In long run however the problem could
be solved through selective breeding program. Such practiced was proven effective in
shrimp like P. vanamei, P. stylistoris and P. chinensis alike.
Being a great income generator government look forward to increase shrimp from
aquaculture production. Under NAP3 the target set was to achieve a production of
150,000 mt (Table 5.1) before or on year 2010. Concurrent to that various contingency
measures were undertaken of which the utmost is to increase culture area.
21
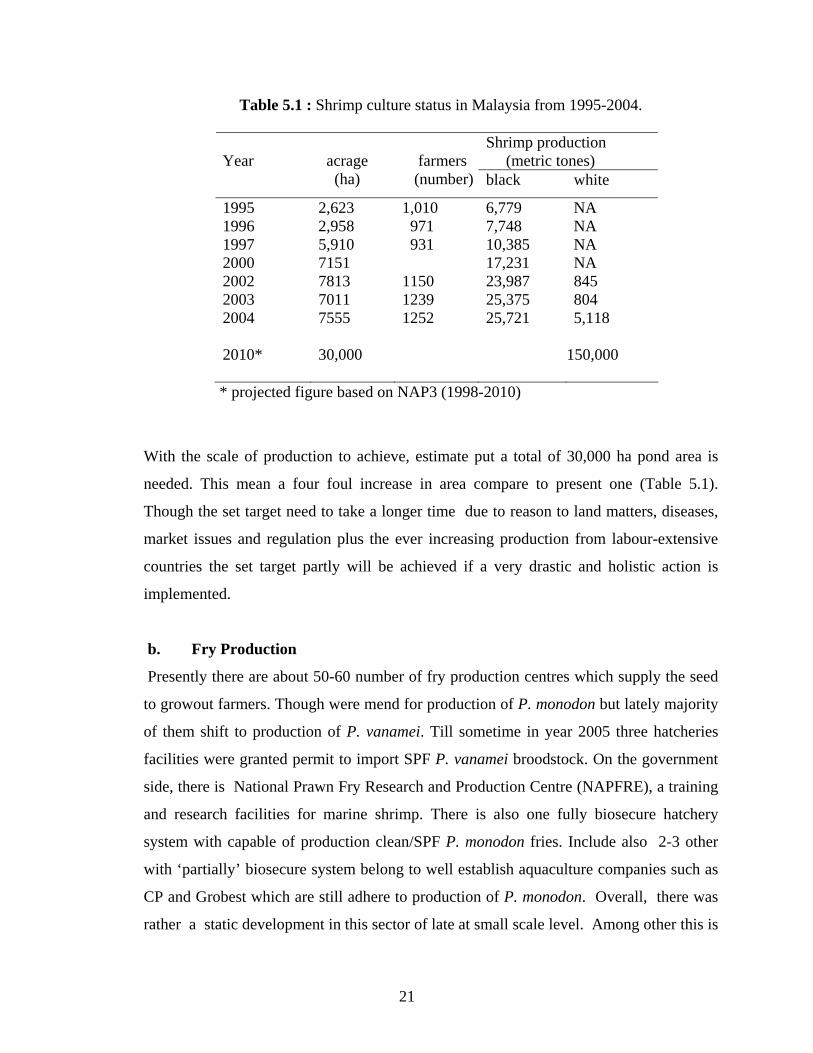
Table 5.1 : Shrimp culture status in Malaysia from 1995-2004.
Shrimp production (metric tones)
Year
acrage (ha)
farmers (number) black white
1995 2,623 1,010 6,779 NA 1996 2,958 971 7,748 NA 1997 5,910 931 10,385 NA 2000 7151 17,231 NA 2002 7813 1150 23,987 845 2003 7011 1239 25,375 804 2004 7555 1252 25,721 5,118 2010* 30,000 150,000
* projected figure based on NAP3 (1998-2010)
With the scale of production to achieve, estimate put a total of 30,000 ha pond area is
needed. This mean a four foul increase in area compare to present one (Table 5.1).
Though the set target need to take a longer time due to reason to land matters, diseases,
market issues and regulation plus the ever increasing production from labour-extensive
countries the set target partly will be achieved if a very drastic and holistic action is
implemented.
b. Fry Production
Presently there are about 50-60 number of fry production centres which supply the seed
to growout farmers. Though were mend for production of P. monodon but lately majority
of them shift to production of P. vanamei. Till sometime in year 2005 three hatcheries
facilities were granted permit to import SPF P. vanamei broodstock. On the government
side, there is National Prawn Fry Research and Production Centre (NAPFRE), a training
and research facilities for marine shrimp. There is also one fully biosecure hatchery
system with capable of production clean/SPF P. monodon fries. Include also 2-3 other
with ‘partially’ biosecure system belong to well establish aquaculture companies such as
CP and Grobest which are still adhere to production of P. monodon. Overall, there was
rather a static development in this sector of late at small scale level. Among other this is
22
attributed to inconsistent demand, strict quality requirement of fry and the demand for
warranty after some period in pond. System wise, most of the hatcheries are indoors type
and capable to produce 20-30 million seeds per year. Beside chlorination as a mean to
treat water it is also a common thing to see local hatcheries system equipped with extra
gadget such as UV or ozone facilities. Besides, there is also a trend toward application
of biotechnology products such as probotic bacteria, bioremediation and enzyme. Due to
space and limitation most hatcheries apply a single tank system to complete the fry
production cycle. Only those few establish one have a separate larval and nursery tanks
for that purpose.
With regard to P. monodon, currently local supply of the brood stock are still sufficient.
In fact following the interest on P. vanamei saw the demand on P. monodon dropped
drastically from time to time. In term of volume and quality stock from east of Malysia
mainly from Sabah waters is sort after. Once, those from strait of Malacca was good
enough but lately majority of the stock are found to be carrier of harm full pathogens. As
a biosecurity approach it is already become a practice for spawners to be screened for
MBV, WSSV and TSV pathogens. Except small scale operators which do direct
spawning or purchase only nauplii larval stage the procedure may not be adhered so
strictly. There are few wild spawners collecting centres which deliver such products to
small scale operators. The price for a million nauplii of P. monodon is around RM 400-
600 where as gravid broodstock is prized at RM200-250.00 a piece with body weight
size range of 130-160 g.
c. Pond Operation
Once, shrimp pond in Malaysia is synonym with mangrove swam area. However it is
slowly make way to less critical and better area such as coastal land, abandoned coconut
estates or paddy field which is close to infrastructure and facilities. Water source is
supplied by mean of pump or connected by canals. Commercial farms integrate reservoir
and sediment ponds to cater for their operation in ensuring good quality water supply.
Aside to that separate inlet and outlet drain is installed. Be it a small scale or commercial
operation, by large rectangular ponds of 0.5-1.0 ha dominate the present system of
23
operation. The depth is usually 1.2- 1.5 m. Water exchange is make less frequent or
reservoir is make as one of the accessory and facility in the farm. Pond sizes are in the
range of 0.5-1.0 ha. Ponds structure and design are of several types. The most common
one are earthen pond. Pond with plastic lining represent a small portion of the system.
Though available, pond with concrete wall structure is slightly rare.
In a believe to sustain water quality and increase productivity, of late farmers put aside
investment on various biotechnology products. Some of these are bacteria domination
compound, enzyme, yeast, inert feed, simple sugar and vitamins. A common practice for
tiger shrimp culture is to stock fry at PL stage 15-20 however for P. vanamei this is done
at PL 7-10. Under present system stocking are applied at 30-40 for P. monodon and up to
120 for P. vanamei. Prior to stock in, responsible farmers will do the acclimatization and
selection as a final step of to guarantee that only quality and healthy fries are stock in.
Fries are delivered by mean of plastic bag. In standard plastic bag of 5-8 liters, they are
packed between 500-1000 per liter. As a criteria for fry quality farmers insists on disease
test and certification beside adhere to physical, microscopic observation and stress test
implementation. In ensuring sufficient oxygen supply, paddle wheel of single or double
blades are installed between 4 – 6 pieces per pond. Aside to that long arm paddle wheels
of six to more blades are also installed at some corners to sweep and accumulate left
over feed from the feeding area. In feed adjustment process feeding trays of 1 m sq.
usually will be hanged between 4-6 in n umber per pond. Feeding commence with rate of
2x per day and is increased to 4 and up to 6-8 times daily upon reaching the harvesting
size. During the process various type of lime is applied to stabilise water pH. Harvest
usually commence upon the shrimp attained size of 30-50 pieces per kg for P. monodon
and about 70 pieces for P. vanamei.
5.1.2 Marine Finfish
Despite known activity existed about the same time as that of marine shrimp aquaculture
practice, the development of marine fish in Malaysia was however slow and less
dominance. One of the prominent reason is, it is over shadowed by the P. monodon
farming activity which was once attracted all level of people as it was a fast and lucrative
24
source of income at that moment. Another single factor is, it is not a land-based activity
hence restricted to certain small area. Being still at infant stage thus the industry still
hold concept of traditional farming. Almost all of the produce come from open floating
net-cages and is basically of small to medium size cage farms. As a commodity which
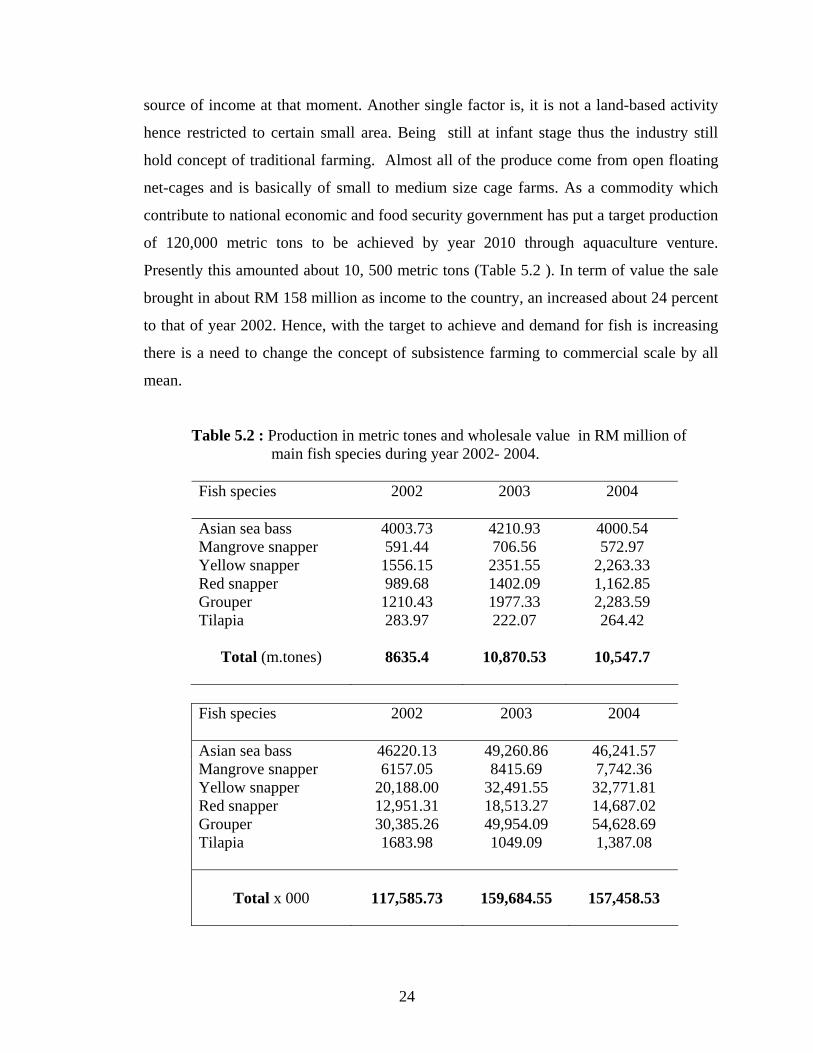
contribute to national economic and food security government has put a target production
of 120,000 metric tons to be achieved by year 2010 through aquaculture venture.
Presently this amounted about 10, 500 metric tons (Table 5.2 ). In term of value the sale
brought in about RM 158 million as income to the country, an increased about 24 percent
to that of year 2002. Hence, with the target to achieve and demand for fish is increasing
there is a need to change the concept of subsistence farming to commercial scale by all
mean.
Table 5.2 : Production in metric tones and wholesale value in RM million of main fish species during year 2002- 2004. Fish species
2002 2003 2004
Asian sea bass 4003.73 4210.93 4000.54 Mangrove snapper 591.44 706.56 572.97 Yellow snapper 1556.15 2351.55 2,263.33 Red snapper 989.68 1402.09 1,162.85 Grouper 1210.43 1977.33 2,283.59 Tilapia 283.97 222.07 264.42
Total (m.tones) 8635.4 10,870.53 10,547.7
Fish species 2002 2003 2004
Asian sea bass 46220.13 49,260.86 46,241.57 Mangrove snapper 6157.05 8415.69 7,742.36 Yellow snapper 20,188.00 32,491.55 32,771.81 Red snapper 12,951.31 18,513.27 14,687.02 Grouper 30,385.26 49,954.09 54,628.69 Tilapia 1683.98 1049.09 1,387.08
Total x 000
117,585.73
159,684.55
157,458.53
25
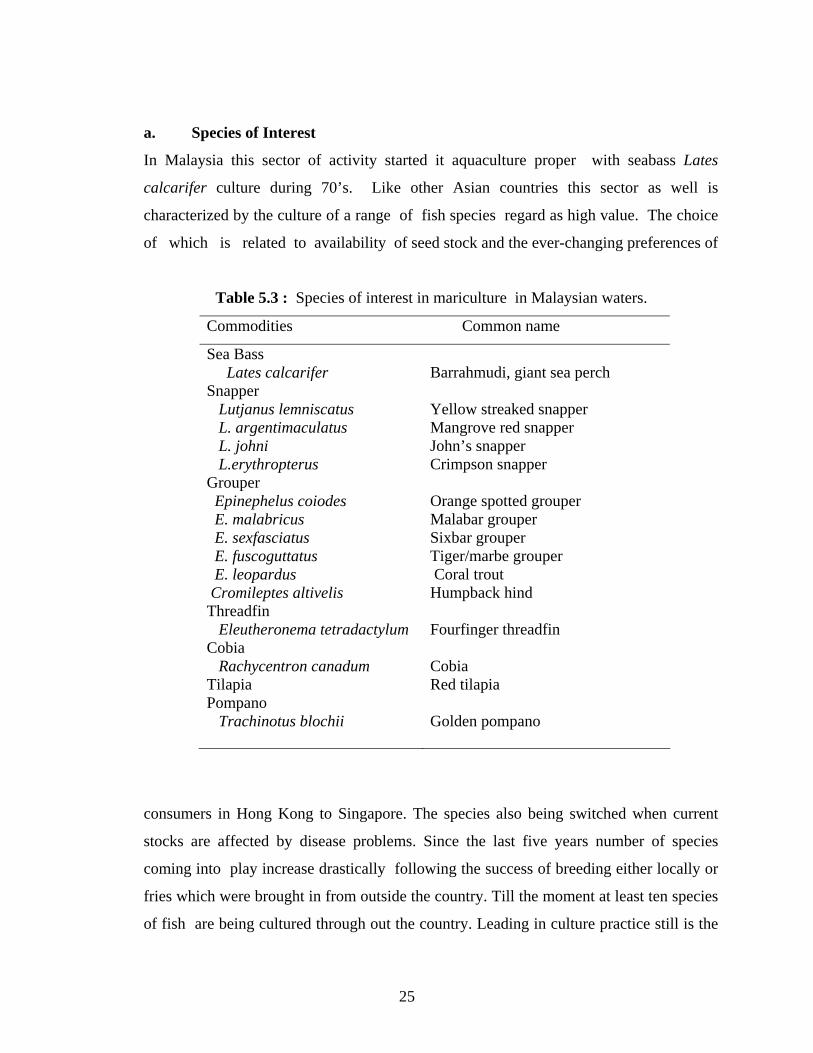
a. Species of Interest
In Malaysia this sector of activity started it aquaculture proper with seabass Lates
calcarifer culture during 70’s. Like other Asian countries this sector as well is
characterized by the culture of a range of fish species regard as high value. The choice
of which is related to availability of seed stock and the ever-changing preferences of
Table 5.3 : Species of interest in mariculture in Malaysian waters.
Commodities Common name
Sea Bass Lates calcarifer Barrahmudi, giant sea perch Snapper Lutjanus lemniscatus Yellow streaked snapper L. argentimaculatus Mangrove red snapper L. johni John’s snapper L.erythropterus Crimpson snapper Grouper Epinephelus coiodes Orange spotted grouper E. malabricus Malabar grouper E. sexfasciatus Sixbar grouper E. fuscoguttatus Tiger/marbe grouper E. leopardus Coral trout Cromileptes altivelis Humpback hind Threadfin Eleutheronema tetradactylum Fourfinger threadfin Cobia Rachycentron canadum Cobia Tilapia Red tilapia Pompano Trachinotus blochii Golden pompano
consumers in Hong Kong to Singapore. The species also being switched when current
stocks are affected by disease problems. Since the last five years number of species
coming into play increase drastically following the success of breeding either locally or
fries which were brought in from outside the country. Till the moment at least ten species
of fish are being cultured through out the country. Leading in culture practice still is the
26
traditional species sea bass, Lates calacarifer. Next to it is the Lutjanidae which comprise
of yellow streak snapper Lutjanus lemniscatus, mangrove snapper L. argentimaculatus ,
John’s snapper L. johni and red snapper L. erythropterus (Table 5.2 ). The interest in
grouper has led to at least six species already being introduced. Among the common one
are tiger grouper Epinephelus fuscoguttatus, Orange spotted E. coiodes and Malabar E.
malabricus. Other minor species are fourfinger threadfin Eleutheronema tetradactylum,
cobia Rachycentron canadum, pompano Trachinotus blochii and not the least is the red
tilapia.
b. Seed Production
Seed supply still a constraint in development of marine fish culture in Malaysia. Quiet a
significant amount are still being imported from neighboring countries such as Indonesia,
Thailand and Singapore and as far as from Taiwan. Beside seeds, eggs are also brought
in. At present, local seed production centres are still too small to supply the demand
especially when dealing with multi species way of fish production. More over most are
still crude in approach hence does not always meet the requirement to supply good
quality seed for a sustainable grow out farms. To supplement the demand, there are two
typical seed production system employed. These are the tank or hatchery system and the
pond-based system. Unofficial record indicated twelve land based fish hatcheries are on
operation currently. Two of them are government research and training centres which on
occasions distribute their produce to farmers. Each of the private hatchery has a capacity
of to produce about 0.5-2.0 million fries per year. As a complete set up some of these
hatcheries maintain broodstock where as the other still need to acquire eggs from
outside.
To supplement further to seed requirement there are more than 50 fry production unit
which adopt earthen or partially concrete ponds as their production system. Each of the
unit employs 3-10 ponds of 0.1-0.5 ha on average. The operation start with hatching of
eggs in hapar installed in pond or in separate tanks put closed to the pond. Few days after
hatching when larvae ready to consume outside food they are released. Prior, pond are
enriched with live food by mean of organic or inorganic fertilizers. Being low capital and
27
food-chain based, survival from this production system is on average between 1-5
percent. In fact, on occasion when natural food availability is not sufficient nothing is
produced. Nevertheless however production from this sector is quiet significant. Often,
each farm can produce between 0.2-1.0 million fingerling per year.
Broodstock and egg production is another part of job which is scrutinize and getting
improved. Currently egg are distributed by broodstock breeders which keep the stock in
floating cages. Egg production normally come out from process of natural spawning.
Indirectly so the operator need to keep large number of spawners so that by chance there
are few ready to release egg when needed. Upon spawning eggs are collected by net.
Though wild caught spawners are preferred for egg production but due some problem or
other collection are from those fish stock from normal cage production system. The
price of a million egg varies from RM 500-3000.00, depend on species of fish.
5.1.3 Farm Operation and Production
The main production system for marine fish is still floating net-cages. Pond production
till this moment is yet given a due consideration. Despite the volume it can produce,
pond production may yet be suitable for high value fish species which demand water of
higher salinity then pond located inland . Beside, pond culture is susceptible to off-flavor
effect and may not be convenient as a system for live fish market. Seeing the potential,
the venture into mass production using deep sea cage was initiated by government
through department of Fisheries a decade ago. Since then however there was not much a
development. The main reason seemed to be fish fry supply. The demand in term of
number and quality is yet match. Apparently this is due result to being a multi species
style of production. As of end of 2005 there were 100 units of the square type cages
measuring 6m x 6 m each and a total of 21 units of round type with a diameter of 15 m
each. All of these cages were harbored at Langkawi island, north of peninsular Malaysia.
Beside still faces with technical problems most of the time the cages were operated under
capacity.
28
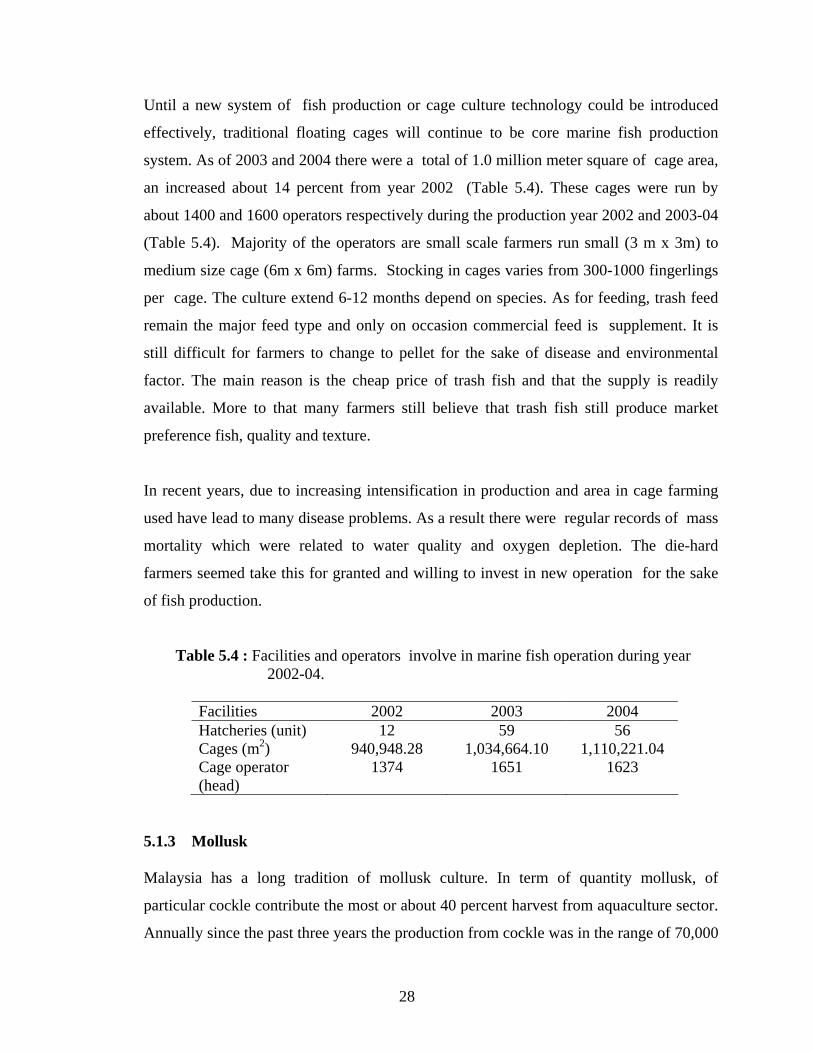
Until a new system of fish production or cage culture technology could be introduced
effectively, traditional floating cages will continue to be core marine fish production
system. As of 2003 and 2004 there were a total of 1.0 million meter square of cage area,
an increased about 14 percent from year 2002 (Table 5.4). These cages were run by
about 1400 and 1600 operators respectively during the production year 2002 and 2003-04
(Table 5.4). Majority of the operators are small scale farmers run small (3 m x 3m) to
medium size cage (6m x 6m) farms. Stocking in cages varies from 300-1000 fingerlings
per cage. The culture extend 6-12 months depend on species. As for feeding, trash feed
remain the major feed type and only on occasion commercial feed is supplement. It is
still difficult for farmers to change to pellet for the sake of disease and environmental
factor. The main reason is the cheap price of trash fish and that the supply is readily
available. More to that many farmers still believe that trash fish still produce market
preference fish, quality and texture.
In recent years, due to increasing intensification in production and area in cage farming
used have lead to many disease problems. As a result there were regular records of mass
mortality which were related to water quality and oxygen depletion. The die-hard
farmers seemed take this for granted and willing to invest in new operation for the sake
of fish production.
Table 5.4 : Facilities and operators involve in marine fish operation during year 2002-04.
Facilities 2002 2003 2004 Hatcheries (unit) 12 59 56 Cages (m2) 940,948.28 1,034,664.10 1,110,221.04 Cage operator (head)
1374 1651 1623
5.1.3 Mollusk
Malaysia has a long tradition of mollusk culture. In term of quantity mollusk, of
particular cockle contribute the most or about 40 percent harvest from aquaculture sector.
Annually since the past three years the production from cockle was in the range of 70,000
29
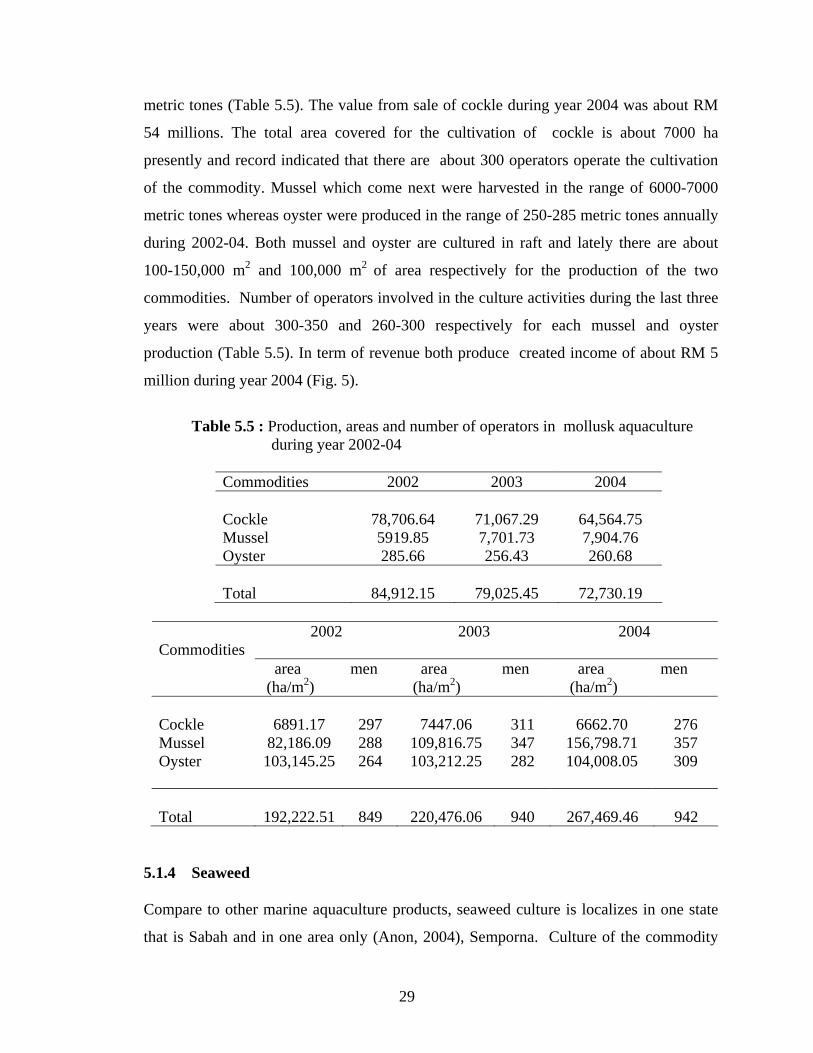
metric tones (Table 5.5). The value from sale of cockle during year 2004 was about RM
54 millions. The total area covered for the cultivation of cockle is about 7000 ha
presently and record indicated that there are about 300 operators operate the cultivation
of the commodity. Mussel which come next were harvested in the range of 6000-7000
metric tones whereas oyster were produced in the range of 250-285 metric tones annually
during 2002-04. Both mussel and oyster are cultured in raft and lately there are about
100-150,000 m2 and 100,000 m2 of area respectively for the production of the two
commodities. Number of operators involved in the culture activities during the last three
years were about 300-350 and 260-300 respectively for each mussel and oyster
production (Table 5.5). In term of revenue both produce created income of about RM 5
million during year 2004 (Fig. 5).
Table 5.5 : Production, areas and number of operators in mollusk aquaculture
during year 2002-04
Commodities 2002 2003 2004 Cockle
78,706.64
71,067.29
64,564.75
Mussel 5919.85 7,701.73 7,904.76 Oyster 285.66 256.43 260.68 Total
84,912.15
79,025.45
72,730.19
2002
2003 2004
Commodities area (ha/m2)
men area (ha/m2)
men area (ha/m2)
men
Cockle
6891.17
297
7447.06
311
6662.70
276
Mussel 82,186.09 288 109,816.75 347 156,798.71 357 Oyster 103,145.25 264 103,212.25 282 104,008.05 309
Total
192,222.51
849
220,476.06
940
267,469.46
942
5.1.4 Seaweed Compare to other marine aquaculture products, seaweed culture is localizes in one state
that is Sabah and in one area only (Anon, 2004), Semporna. Culture of the commodity
30
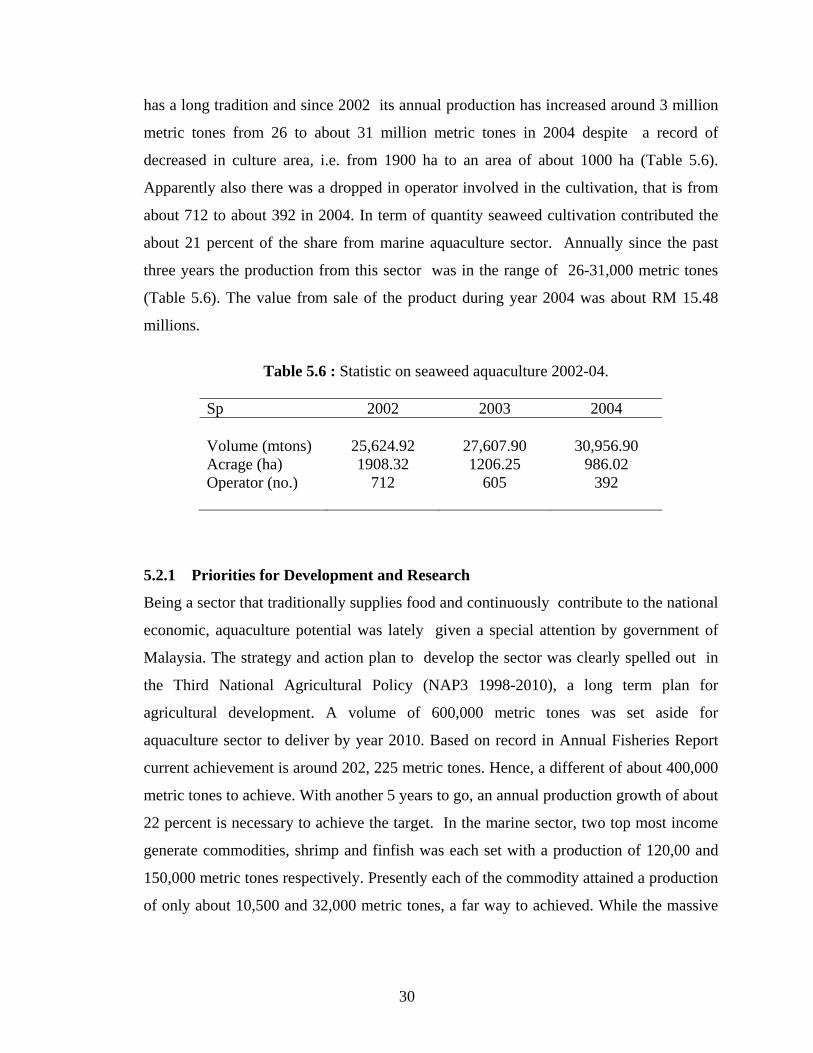
has a long tradition and since 2002 its annual production has increased around 3 million
metric tones from 26 to about 31 million metric tones in 2004 despite a record of
decreased in culture area, i.e. from 1900 ha to an area of about 1000 ha (Table 5.6).
Apparently also there was a dropped in operator involved in the cultivation, that is from
about 712 to about 392 in 2004. In term of quantity seaweed cultivation contributed the
about 21 percent of the share from marine aquaculture sector. Annually since the past
three years the production from this sector was in the range of 26-31,000 metric tones
(Table 5.6). The value from sale of the product during year 2004 was about RM 15.48
millions.
Table 5.6 : Statistic on seaweed aquaculture 2002-04.
Sp 2002 2003 2004 Volume (mtons)
25,624.92
27,607.90
30,956.90
Acrage (ha) 1908.32 1206.25 986.02 Operator (no.) 712 605 392
5.2.1 Priorities for Development and Research
Being a sector that traditionally supplies food and continuously contribute to the national
economic, aquaculture potential was lately given a special attention by government of
Malaysia. The strategy and action plan to develop the sector was clearly spelled out in
the Third National Agricultural Policy (NAP3 1998-2010), a long term plan for
agricultural development. A volume of 600,000 metric tones was set aside for
aquaculture sector to deliver by year 2010. Based on record in Annual Fisheries Report
current achievement is around 202, 225 metric tones. Hence, a different of about 400,000
metric tones to achieve. With another 5 years to go, an annual production growth of about
22 percent is necessary to achieve the target. In the marine sector, two top most income
generate commodities, shrimp and finfish was each set with a production of 120,00 and
150,000 metric tones respectively. Presently each of the commodity attained a production
of only about 10,500 and 32,000 metric tones, a far way to achieved. While the massive
31
increment in production will no doubt come from increase in area under culture, most of
it probably will be from intensification of existing culture practice.
5..2.1 Marine Shrimp
The major constraint in the development of traditional black tiger shrimp is disease
problem. Hence research priority in scope as listed below need to be considered :
a. Production of SPF broodstock and disease free post larvae
b. Application of best management practices
c. Automation toward reducing production cost
d. Development of sustainable production system
While the long traditional shrimp species need to be scrutinize and its problem solved the
importance of indigenous shrimp species such as the banana shrimp Penaeus merguinsis
should be given a due consideration to create interest for commercial production. In a
way this will create diversity of choice beside slowly get away with exotic species P.
vanamei. To attract commercial culture of the species mean research has to go all out to
solve the problem of poor-growth-performance under high density culture and to realize
a culture period of 120 days, a stereotype benchmark to many shrimp farmers in
Malaysia. As an action plan, research in the aspect listed below should be given due
consideration.
a. Domestication and selective breeding programme
b. Development of feed for its aquaculture program
c. Develop culture technology
5.2.2 Marine Finfish
Being at pioneer stage the marine finfish industry can learn a lot from story of success
and failure in shrimp industry. Foremost, seed should be of high quality and if possible a
SPF standard. To pursue, domestication and selective breeding program should be in the
list. Come along with the set is a biosecurity system. On the development aspect,
foremost to turn into a food industry focus should be given to a specific species to be
developed. Indirectly mean one cannot rely much on live fish market. Frozen fish market
should be main agenda and diversify the market through value added and varieties to
32
increase intake by local consumer. On set to that land based production system be it in
pond or tank should be a mean of production in future as environmental may no longer
permit waterway to use for cage operation. Forsee the upcoming problem hence priority
in research and development should be given to the list as underline below:
a. Research and Development on selected fish species
b. Development of broodstock bank
c. Research and development in domestication and selelctive breeding program.
d. Development of biosecurity fish fry production centre
e. Research and development in live food production.
f. Research and development in growout production facilities.
g. Research and development in nutrition and feed formulation.
5.3 Identification of Better Management Practices To Mitigate Environmental
Impacts
As a mean to mitigate environmental impact DOF in Malaysia comes out with a guide
line on Good Aquaculture Practices (GAqP). Mainly for shrimp industry at this moment
(FAO, 2003), this guide line uphold the standard requires by international body such as
FAO. The same guideline soon will be developed for marine finfish aquaculture activities
and others. A major task by government currently is however is to ensure that the guide
line is practice by culturist, of particular the down stream farmers. At this stage for that
level it is still difficult to implement because a free-for-all situation already existed for a
long time. Lack of institutional and legal support may jeopardize the action plan or
otherwise local government has to impose rule on domestic food safety standard from
aquaculture as being the requirement by many importing countries. Big scale operators
however on their own initiative implement good aquaculture practice as to comply
requirement for quality fish/shrimp products for export market. To be part of food
producer one has to has standard and environmental friendly production protocol.
Along this line, Department of Fisheries Malaysia for the past few years introduced Farm
Certification Scheme or SPLAM. The objective of SPLAM is to provide official
recognition to aquaculture entrepreneurs who have practiced Good Aquaculture Practices
33
(GAqP) and environmental friendly concepts to ensure the safety, quality, consistency
and competitiveness of the products based on the criteria, guidelines and standard
determined by the Department of Fisheries Malaysia. Farmers can obtain quality
certification for their products after some period of quality assessment by authorities. The
benefits derived from participating in the SPLAM programme among others are to
ensure the aquaculture products from the farm meet the food safety standards require by
domestic and international market. Secondly is to assist and expedite the issuance of
Health Certificate and Sanitary and Phytosanitary (SPS) Certificates, so that it does not
solely depend on the final product testing. The third benefit is to encourage consumer
acceptance of aquaculture product from local farms. Not the least is to assist the
development of the aquaculture industry in a sustainable and environmentally friendly
manner.
6 Refrences Cited
DoF. 1996. Masterplan for aquaculture development in Sabah (Mal/93/013)- Final Report. Department of Fisheries Sabah and Network of Aquaculture Centres in Asia-Pacific (NACA). 306 pp.
DoF. 2002. Annual fisheries statistics 2004. Department of Fisheries, Ministry of
Agriculture and Agro-based Industry Malaysia. Pp 239. DoF. 2003. Annual fisheries statistics 2004. Department of Fisheries, Ministry of
Agriculture and Agro-based Industry Malaysia. Pp 265. DoF. 2004a. Annual fisheries statistics 2004. Department of Fisheries, Ministry of
Agriculture and Agro-based Industry Malaysia. Pp 263.
DoF. 2004b. Malaysian aquaculture farm certification scheme (SPLAM). DOF Malaysia Kuala Lumpur. 11 pp.
DoF. 2006. Buku Program Latihan 2006. DOF Malaysia Kuala Lumpur. 64 pp.
MOA. 2003 . Third National Agricultural Policy (1998-2010)- a summary. Ministry of
Agricultural , Putrajaya, Malaysia (MOA). 18 pp.
FAO, 1997. Aquaculture Development. FAO technical Guidelines for responsible fisheries 5. 40 pp.

34
FAO, 2004. Proposed Code of Practice For Shrimp Farming in Malaysia. FAO, TCP/MAL/6611(A).
Mazuki B. H. and K. Subramaniam. 2005. Regional technical consultation on the
aquaculture of P. vannamei and other exotic shrimp in southeast asia. SEAFDEC Manila Philippines. 28 Feb.- 3 March 05.