Embed Size (px)
Citation preview
For Release: Wednesday, May 05, 2021 21-828-NEW
NEW YORK–NEW JERSEY INFORMATION OFFICE: New York City, N.Y.Technical information: (646) 264-3600 [email protected] www.bls.gov/regions/new-york-new-jerseyMedia contact: (646) 264-3620
County Employment and Wages in Puerto Rico — Third Quarter 2020Employment in Puerto Rico’s only large county, the municipio of San Juan, decreased 7.3 percent from September 2019 to September 2020, the U.S. Bureau of Labor Statistics reported today. (Large counties are defined as those with 2019 annual average employment of 75,000 or more.) Chief Regional Economist Martin Kohli noted that in September 2020, San Juan’s employment level of 223,600 accounted for 26.9 percent of total employment in the commonwealth. (See table 1.)
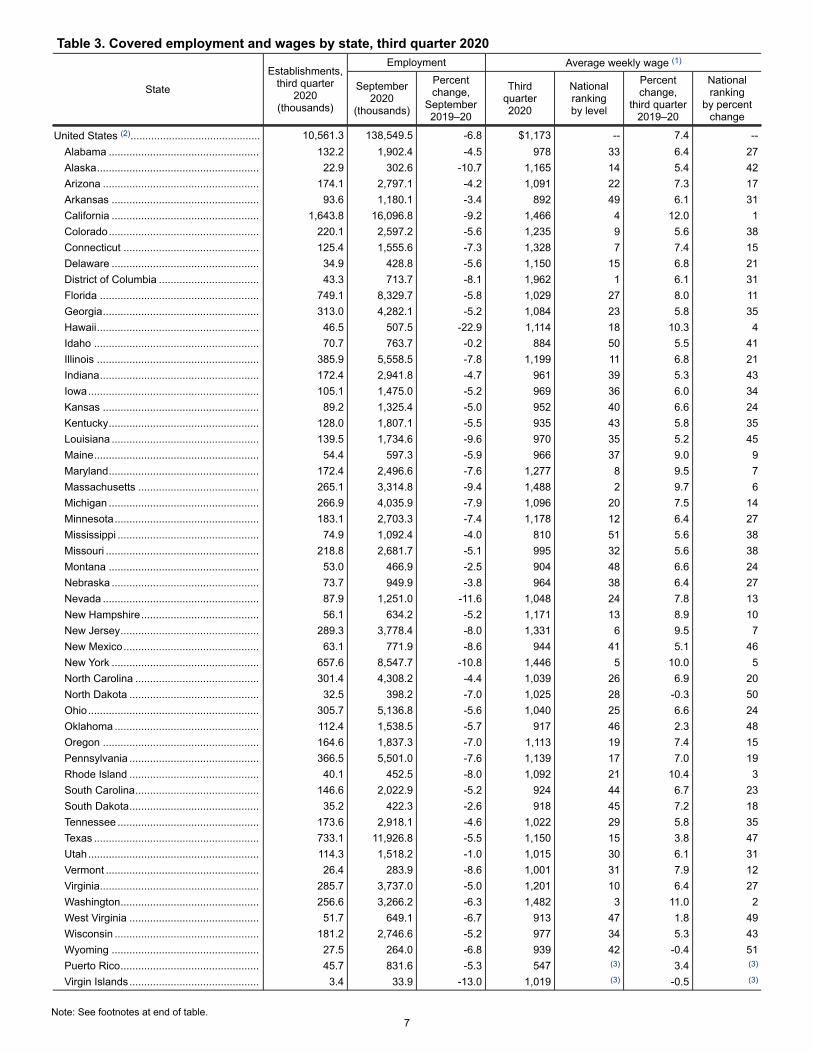
National employment decreased 6.8 percent over the year, with 355 of the 357 largest U.S. counties (not including San Juan) reporting declines. Maui + Kalawao, HI, had the largest over-the-year decrease in employment with a loss of 35.4 percent. Utah, UT, experienced the largest over-the-year percentage increase in employment with a gain of 1.9 percent.
The average weekly wage in San Juan was $669 in the third quarter of 2020, a 4.7-percent increase over the year. In the United States, the average weekly wage increased 7.4 percent to $1,173. Among the 357 largest counties in the United States, 350 had over-the-year wage increases. Nationally, the increases in average weekly wages largely reflect substantial employment loss among lower-paid industries. Employment declines occurring in some higher-paid industries also featured significant wage increases. San Mateo, CA, had the largest percentage wage increase (+23.2 percent). Ector, TX, had the largest over-the-year percentage decrease (-11.0 percent).
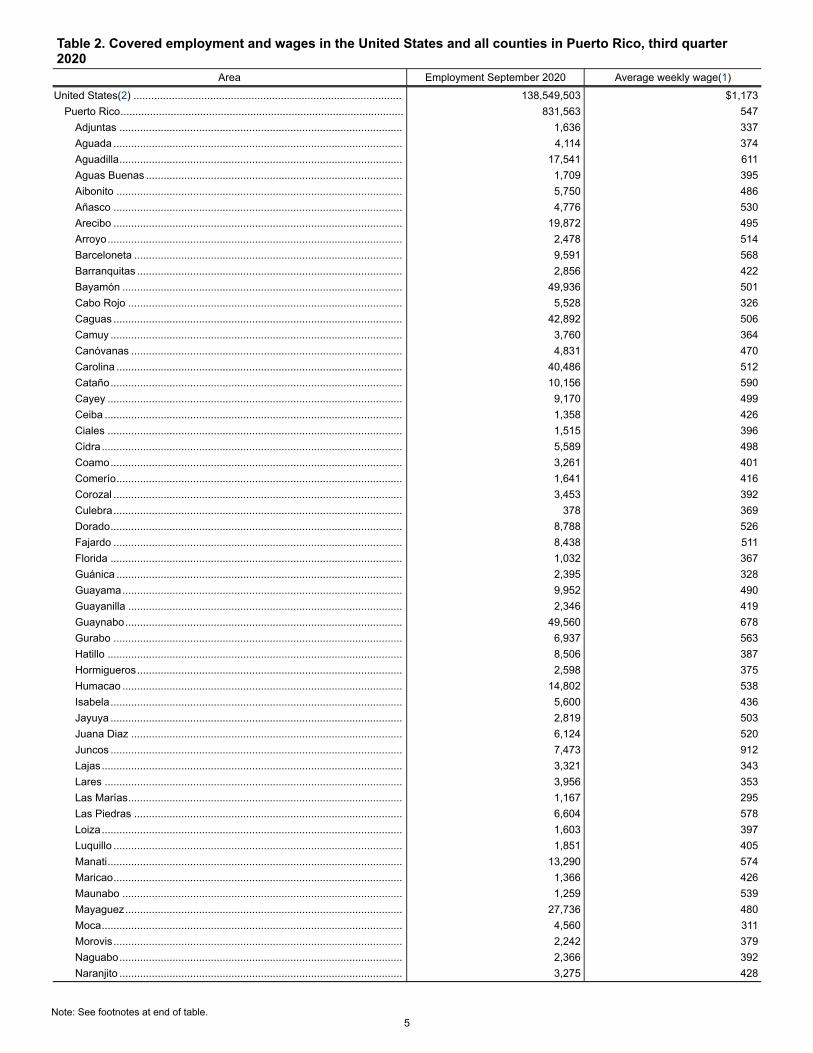
Employment and wage levels (but not over-the-year changes) are also available for the 77 municipios in Puerto Rico with employment below 75,000. All 77 municipios had wages below the U.S. average of $1,173. (See table 2.) Juncos, located on the eastern part of the island, had the highest average weekly wage at $912. Two small municipios, located in the northern part of the island, had average weekly wages above $600— Guaynabo ($678) and Aguadilla ($611). Twenty-six municipios had average weekly wages below $400, with the lowest wages reported in Cabo Rojo ($326), Moca ($311), and Las Marías ($295). (See chart 1.)
Additional statistics and other informationQCEW data for states have been included in this release in table 3. For additional information about quarterly employment and wages data, please read the Technical Note or visit www.bls.gov/cew.
Employment and Wages Annual Averages Online features comprehensive information by detailed industry on establishments, employment, and wages for the nation and all states. The 2019 edition of this publication, which was published in September 2020. Tables and additional content from the 2019 edition of Employment

2
and Wages Annual Averages Online are now available at www.bls.gov/cew/publications/employment-and- wages-annual-averages/2019/home.htm. The 2020 edition of Employment and Wages Annual Averages Online will be available in September 2021.
The County Employment and Wages release for fourth quarter 2020 is scheduled to be released on Wednesday, May 19, 2021. The County Employment and Wages full data update for fourth quarter 2020 is scheduled to be released on Wednesday, June 2, 2021.
Technical Note
Average weekly wage data by county are compiled under the Quarterly Census of Employment and Wages (QCEW) program, also known as the ES-202 program. The data are derived from summaries of employment and total pay of workers covered by state and federal unemployment insurance (UI) legislation and provided by State Workforce Agencies (SWAs). The average weekly wage values are calculated by dividing quarterly total wages by the average of the three monthly employment levels of those covered by UI programs. The result is then divided by 13, the number of weeks in a quarter. It is to be noted, therefore, that over-the-year wage changes for geographic areas may reflect shifts in the composition of employment by industry, occupation, and such other factors as hours of work. Thus, wages may vary among counties, metropolitan areas, or states for reasons other than changes in the average wage level. Data for all states, Metropolitan Statistical Areas (MSAs), counties, and the nation are available on the BLS web site at www.bls.gov/cew. However, data in QCEW press releases have been revised and may not match the data contained on the Bureau’s web site.
QCEW data are not designed as a time series. QCEW data are simply the sums of individual establishment records reflecting the number of establishments that exist in a county or industry at a point in time. Establishments can move in or out of a county or industry for a number of reasons–some reflecting economic events, others reflecting administrative changes.
3
The preliminary QCEW data presented in this release may differ from data released by the individual states as well as from the data presented on the BLS web site. These potential differences result from the states’ continuing receipt, review and editing of UI data over time. On the other hand, differences between data in this release and the data found on the BLS web site are the result of adjustments made to improve over-the-year comparisons. Specifically, these adjustments account for administrative (noneconomic) changes such as a correction to a previously reported location or industry classification. Adjusting for these administrative changes allows users to more accurately assess changes of an economic nature (such as a firm moving from one county to another or changing its primary economic activity) over a 12-month period. Currently, adjusted data are available only from BLS press releases.
Information in this release will be made available to individuals with sensory impairments upon request. Voice phone: (202) 691-5200; Federal Relay Service: (800) 877-8339.

4
Footnotes: (1) Average weekly wages were calculated using unrounded data. (2) Percent changes were computed from quarterly employment and pay data adjusted for noneconomic county reclassifications. (3) Totals for the United States do not include data for Puerto Rico or the Virgin Islands.
Table 1. Covered employment and wages in the United States, Puerto Rico, and San Juan, third quarter 2020
Area
Establishments, third quarter
2020 (thousands)
Employment Average weekly wage (1)
September 2020 (thousands)
Percent change, September 2019–20 (2)
Third quarter 2020
Percent change, third quarter 2019–20 (2)
United States (3)........................................................... 10,561.3 138,549.5 -6.8 $1,173 7.4Puerto Rico.............................................................. 45.7 831.6 -5.3 547 3.4
San Juan .............................................................. 10.8 223.6 -7.3 669 4.7
5
Table 2. Covered employment and wages in the United States and all counties in Puerto Rico, third quarter 2020
Area Employment September 2020 Average weekly wage(1)
United States(2) ........................................................................................... 138,549,503 $1,173Puerto Rico................................................................................................ 831,563 547
Adjuntas ................................................................................................ 1,636 337Aguada .................................................................................................. 4,114 374Aguadilla................................................................................................ 17,541 611Aguas Buenas ....................................................................................... 1,709 395Aibonito ................................................................................................. 5,750 486Añasco .................................................................................................. 4,776 530Arecibo .................................................................................................. 19,872 495Arroyo.................................................................................................... 2,478 514Barceloneta ........................................................................................... 9,591 568Barranquitas .......................................................................................... 2,856 422Bayamón ............................................................................................... 49,936 501Cabo Rojo ............................................................................................. 5,528 326Caguas .................................................................................................. 42,892 506Camuy ................................................................................................... 3,760 364Canóvanas ............................................................................................ 4,831 470Carolina ................................................................................................. 40,486 512Cataño................................................................................................... 10,156 590Cayey .................................................................................................... 9,170 499Ceiba ..................................................................................................... 1,358 426Ciales .................................................................................................... 1,515 396Cidra...................................................................................................... 5,589 498Coamo................................................................................................... 3,261 401Comerío................................................................................................. 1,641 416Corozal .................................................................................................. 3,453 392Culebra.................................................................................................. 378 369Dorado................................................................................................... 8,788 526Fajardo .................................................................................................. 8,438 511Florida ................................................................................................... 1,032 367Guánica ................................................................................................. 2,395 328Guayama............................................................................................... 9,952 490Guayanilla ............................................................................................. 2,346 419Guaynabo.............................................................................................. 49,560 678Gurabo .................................................................................................. 6,937 563Hatillo .................................................................................................... 8,506 387Hormigueros.......................................................................................... 2,598 375Humacao ............................................................................................... 14,802 538Isabela................................................................................................... 5,600 436Jayuya ................................................................................................... 2,819 503Juana Diaz ............................................................................................ 6,124 520Juncos ................................................................................................... 7,473 912Lajas...................................................................................................... 3,321 343Lares ..................................................................................................... 3,956 353Las Marías............................................................................................. 1,167 295Las Piedras ........................................................................................... 6,604 578Loiza...................................................................................................... 1,603 397Luquillo .................................................................................................. 1,851 405Manati.................................................................................................... 13,290 574Maricao.................................................................................................. 1,366 426Maunabo ............................................................................................... 1,259 539Mayaguez.............................................................................................. 27,736 480Moca...................................................................................................... 4,560 311Morovis.................................................................................................. 2,242 379Naguabo................................................................................................ 2,366 392Naranjito ................................................................................................ 3,275 428
Note: See footnotes at end of table.

6
Footnotes (1) Average weekly wages were calculated using unrounded data. (2) Totals for the United States do not include data for Puerto Rico or the Virgin Islands.Note: Includes workers covered by Unemployment Insurance (UI) and Unemployment Compensation for Federal Employees (UCFE) programs. Data are preliminary.
Table 2. Covered employment and wages in the United States and all counties in Puerto Rico, third quarter 2020 - Continued
Area Employment September 2020 Average weekly wage(1)
Orocovis ................................................................................................ 3,167 371Patillas................................................................................................... 1,453 471Peñuelas ............................................................................................... 2,498 419Ponce .................................................................................................... 42,555 472Quebradillas .......................................................................................... 2,194 369Rincón ................................................................................................... 1,740 379Rio Grande ............................................................................................ 4,457 429Sabana Grande ..................................................................................... 3,289 369Salinas................................................................................................... 3,320 482San Germán .......................................................................................... 7,093 427San Juan ............................................................................................... 223,610 669San Lorenzo .......................................................................................... 3,473 412San Sebastian ....................................................................................... 4,826 358Santa Isabel .......................................................................................... 5,689 411Toa Alta.................................................................................................. 3,720 415Toa Baja ................................................................................................ 12,321 462Trujillo Alto ............................................................................................. 10,037 365Utuado................................................................................................... 3,518 401Vega Alta ............................................................................................... 4,306 465Vega Baja .............................................................................................. 7,574 515Vieques.................................................................................................. 1,226 442Villalba ................................................................................................... 3,265 532Yabucoa................................................................................................. 2,611 383Yauco..................................................................................................... 5,474 418
7
Table 3. Covered employment and wages by state, third quarter 2020
State
Establishments, third quarter
2020 (thousands)
Employment Average weekly wage (1)
September 2020
(thousands)
Percent change,
September 2019–20
Third quarter 2020
National ranking by level
Percent change,
third quarter 2019–20
National ranking
by percent change
United States (2)............................................ 10,561.3 138,549.5 -6.8 $1,173 -- 7.4 --Alabama ................................................... 132.2 1,902.4 -4.5 978 33 6.4 27Alaska....................................................... 22.9 302.6 -10.7 1,165 14 5.4 42Arizona ..................................................... 174.1 2,797.1 -4.2 1,091 22 7.3 17Arkansas .................................................. 93.6 1,180.1 -3.4 892 49 6.1 31California .................................................. 1,643.8 16,096.8 -9.2 1,466 4 12.0 1Colorado................................................... 220.1 2,597.2 -5.6 1,235 9 5.6 38Connecticut .............................................. 125.4 1,555.6 -7.3 1,328 7 7.4 15Delaware .................................................. 34.9 428.8 -5.6 1,150 15 6.8 21District of Columbia .................................. 43.3 713.7 -8.1 1,962 1 6.1 31Florida ...................................................... 749.1 8,329.7 -5.8 1,029 27 8.0 11Georgia..................................................... 313.0 4,282.1 -5.2 1,084 23 5.8 35Hawaii....................................................... 46.5 507.5 -22.9 1,114 18 10.3 4Idaho ........................................................ 70.7 763.7 -0.2 884 50 5.5 41Illinois ....................................................... 385.9 5,558.5 -7.8 1,199 11 6.8 21Indiana...................................................... 172.4 2,941.8 -4.7 961 39 5.3 43Iowa.......................................................... 105.1 1,475.0 -5.2 969 36 6.0 34Kansas ..................................................... 89.2 1,325.4 -5.0 952 40 6.6 24Kentucky................................................... 128.0 1,807.1 -5.5 935 43 5.8 35Louisiana .................................................. 139.5 1,734.6 -9.6 970 35 5.2 45Maine........................................................ 54.4 597.3 -5.9 966 37 9.0 9Maryland................................................... 172.4 2,496.6 -7.6 1,277 8 9.5 7Massachusetts ......................................... 265.1 3,314.8 -9.4 1,488 2 9.7 6Michigan ................................................... 266.9 4,035.9 -7.9 1,096 20 7.5 14Minnesota................................................. 183.1 2,703.3 -7.4 1,178 12 6.4 27Mississippi ................................................ 74.9 1,092.4 -4.0 810 51 5.6 38Missouri .................................................... 218.8 2,681.7 -5.1 995 32 5.6 38Montana ................................................... 53.0 466.9 -2.5 904 48 6.6 24Nebraska .................................................. 73.7 949.9 -3.8 964 38 6.4 27Nevada ..................................................... 87.9 1,251.0 -11.6 1,048 24 7.8 13New Hampshire........................................ 56.1 634.2 -5.2 1,171 13 8.9 10New Jersey............................................... 289.3 3,778.4 -8.0 1,331 6 9.5 7New Mexico.............................................. 63.1 771.9 -8.6 944 41 5.1 46New York .................................................. 657.6 8,547.7 -10.8 1,446 5 10.0 5North Carolina .......................................... 301.4 4,308.2 -4.4 1,039 26 6.9 20North Dakota ............................................ 32.5 398.2 -7.0 1,025 28 -0.3 50Ohio.......................................................... 305.7 5,136.8 -5.6 1,040 25 6.6 24Oklahoma ................................................. 112.4 1,538.5 -5.7 917 46 2.3 48Oregon ..................................................... 164.6 1,837.3 -7.0 1,113 19 7.4 15Pennsylvania ............................................ 366.5 5,501.0 -7.6 1,139 17 7.0 19Rhode Island ............................................ 40.1 452.5 -8.0 1,092 21 10.4 3South Carolina.......................................... 146.6 2,022.9 -5.2 924 44 6.7 23South Dakota............................................ 35.2 422.3 -2.6 918 45 7.2 18Tennessee ................................................ 173.6 2,918.1 -4.6 1,022 29 5.8 35Texas ........................................................ 733.1 11,926.8 -5.5 1,150 15 3.8 47Utah.......................................................... 114.3 1,518.2 -1.0 1,015 30 6.1 31Vermont .................................................... 26.4 283.9 -8.6 1,001 31 7.9 12Virginia...................................................... 285.7 3,737.0 -5.0 1,201 10 6.4 27Washington............................................... 256.6 3,266.2 -6.3 1,482 3 11.0 2West Virginia ............................................ 51.7 649.1 -6.7 913 47 1.8 49Wisconsin ................................................. 181.2 2,746.6 -5.2 977 34 5.3 43Wyoming .................................................. 27.5 264.0 -6.8 939 42 -0.4 51Puerto Rico............................................... 45.7 831.6 -5.3 547 (3) 3.4 (3)
Virgin Islands............................................ 3.4 33.9 -13.0 1,019 (3) -0.5 (3)
Note: See footnotes at end of table.

8
Footnotes: (1) Average weekly wages were calculated using unrounded data. (2) Totals for the United States do not include data for Puerto Rico or the Virgin Islands. (3) Data not included in the national ranking.Note: Data are preliminary. Covered employment and wages includes workers covered by Unemployment Insurance (UI) and Unemployment Compensation for Federal Employees (UCFE) programs.