Embed Size (px)
Citation preview

Countywide Recycling and Disposal Facility Weekly Progress Report
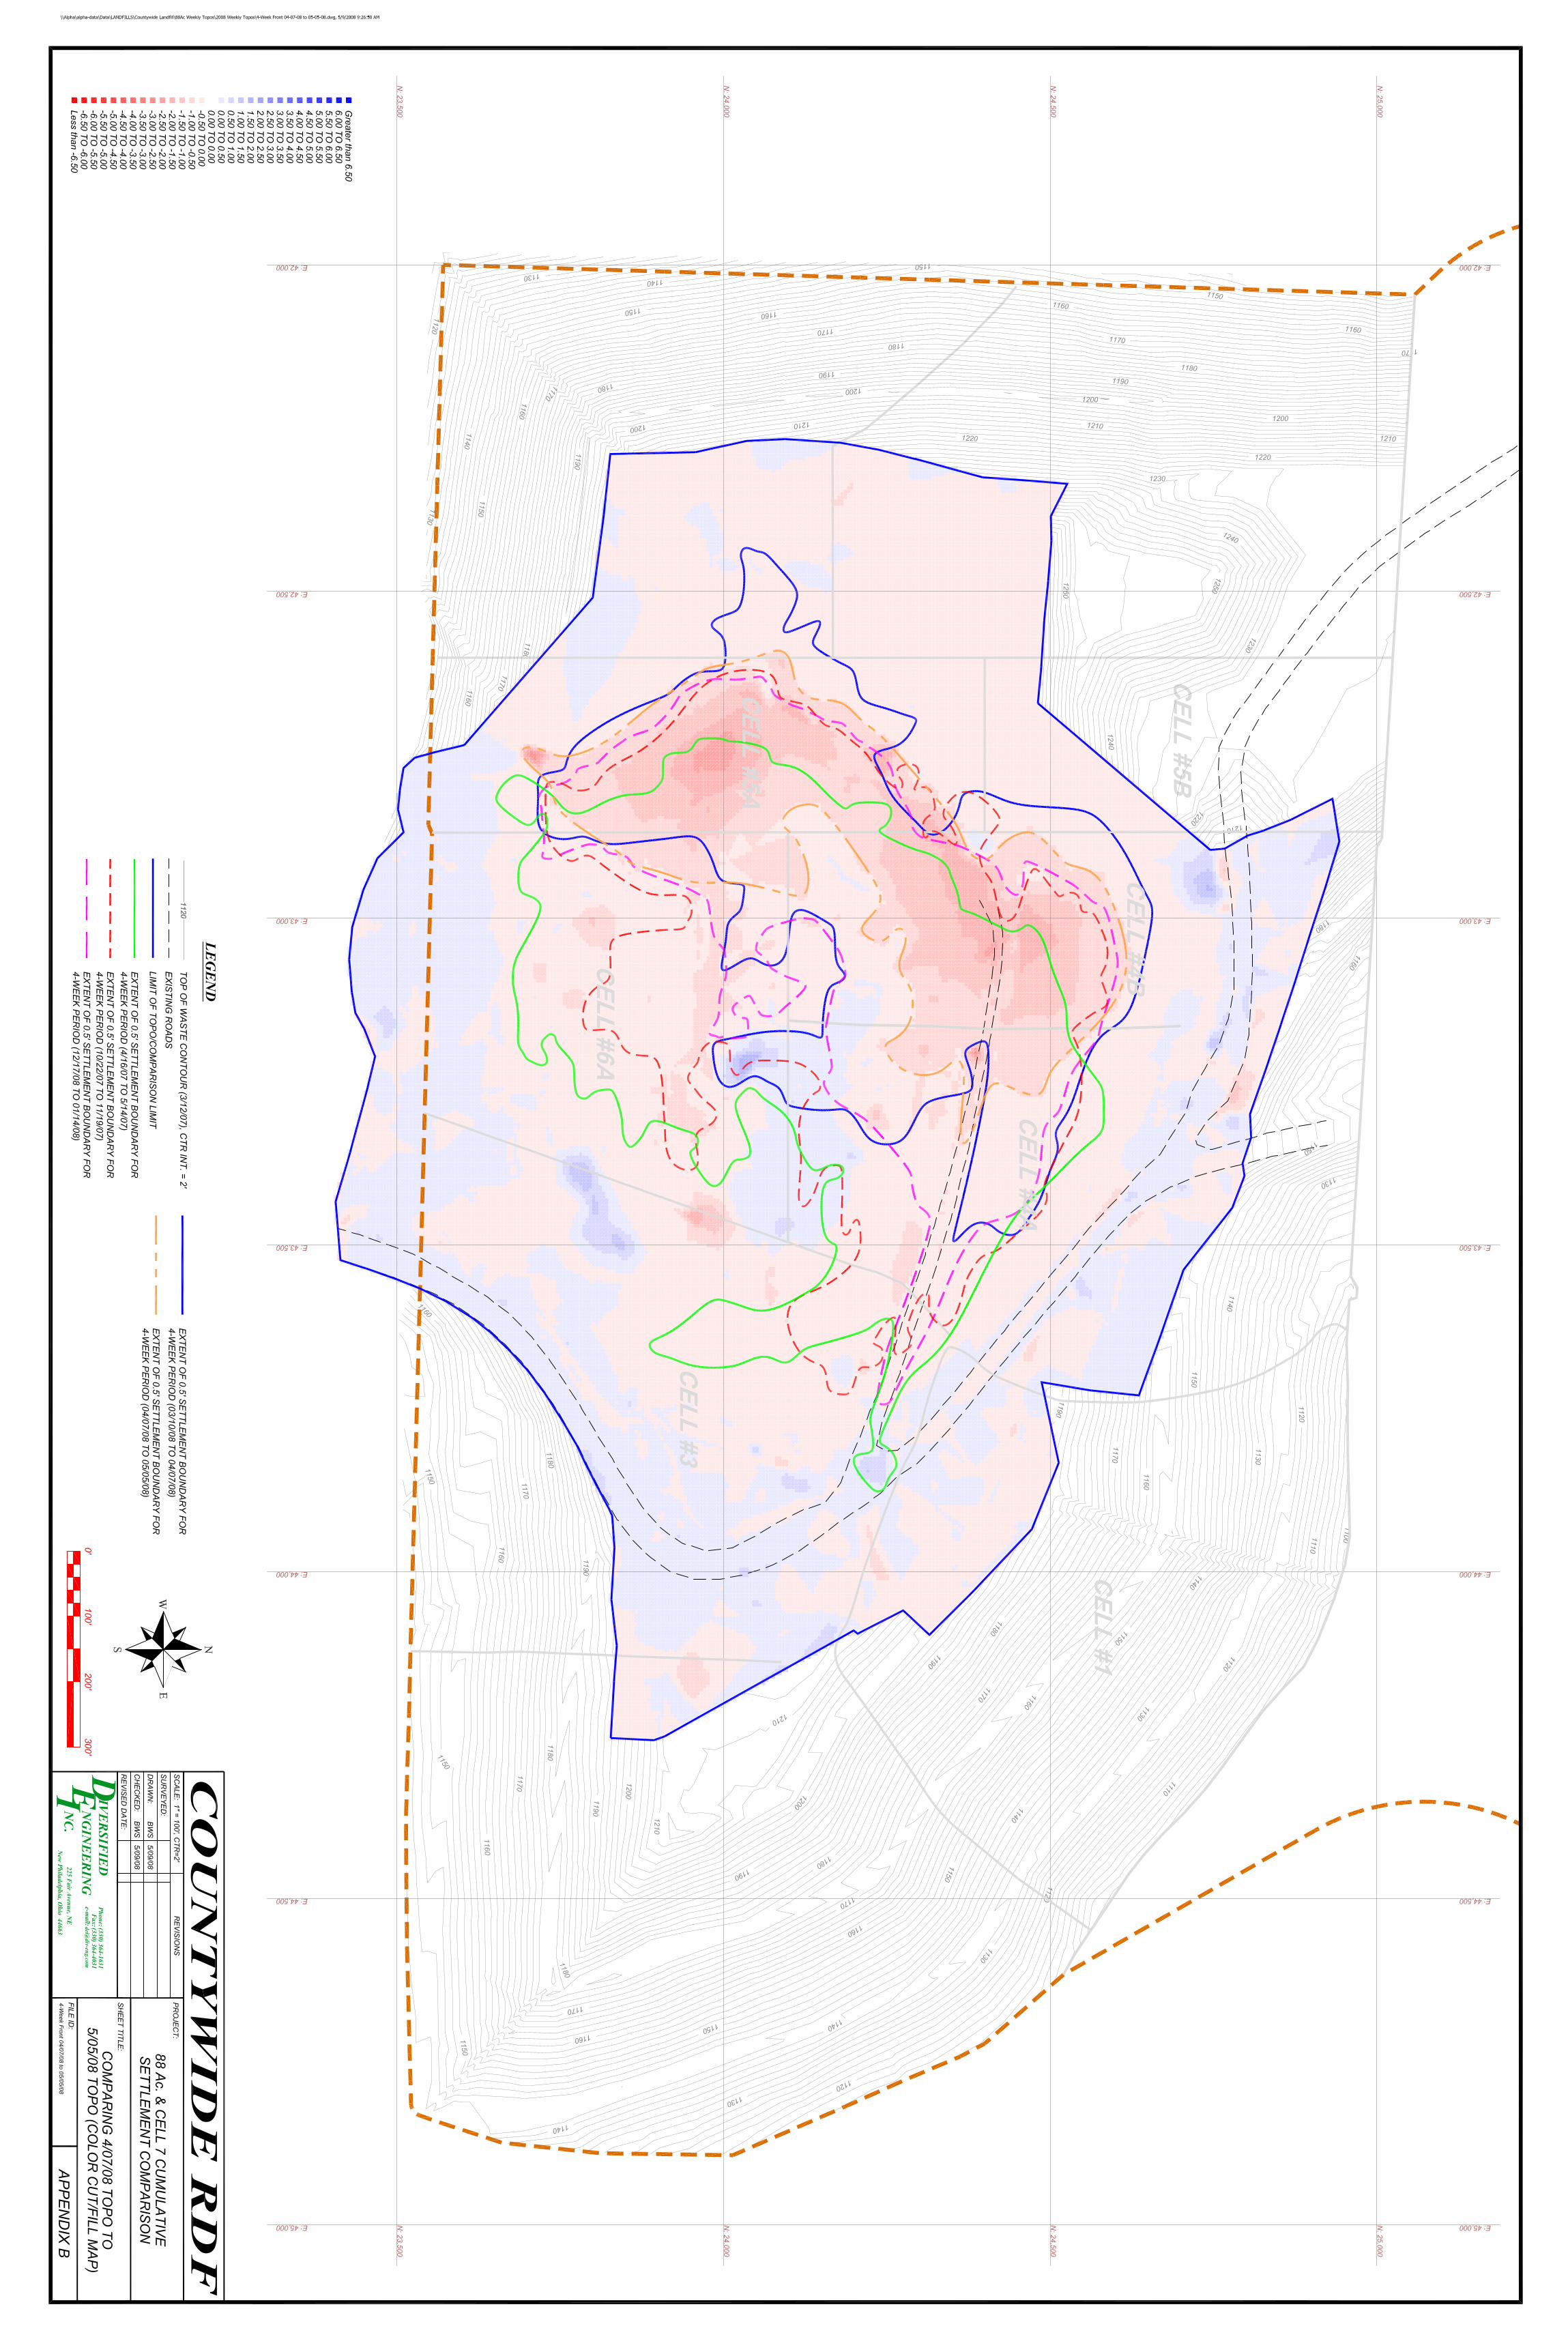
05/09/08 This Weekly Progress Report is prepared by Countywide and submitted to the OEPA weekly by the close of business on each Friday. This meets the requirement of Order No. 5 of the December 31, 2007 Findings and Orders to provide updates on progress of field activities. In addition, this report provides updated presentations of data being collected. All information presented in this report originates from the publicly-available data being gathered as part of the normal operational requirements of the facility or as part of the Director’s Findings and Orders. This report covers the period May 3, 2008 to May 9, 2008. PROGRESS ON FIELD ACTIVITIES TOWARD DECEMBER 31, 2007 ORDERS See the attached Table 1. DATA PRESENTATION Bold font in comments column means updated version included with this report. Attachment Attachment No. Comments Wellhead Temperature Graph 1 Updated April 11, 2008 Downhole Temp. Graph 2 Updated April 11, 2008 FBMP Max. In-Situ Temp. Graph 3 Updated May 9, 2008 Inclinometer Max. In-Situ Temp. Graph 4 Updated May 9, 2008 Leachate Sump Temperature. Graph 5 Updated April 25, 2008 LCS Temperature Graph 6 Updated April 25, 2008 Weekly Cumulative Sett. Graph 7 Updated May 9, 2008 Quarterly Cumulative Sett. Graph 8 Updated April 11, 2008 CO Graph 9 Updated May 2, 2008 Leachate Volume Graph 10 Updated April 11, 2008 Leachate COD Graph 11 Updated May 9, 2008 Leachate TDS Graph 12 Updated May 9, 2008 Appendices (transmitted separately) Appendix No. Comments Wellhead Temperature Zone Map A Updated April 11, 2008 4-Week Cumulative Sett. Front Map B Updated May 9, 2008 Carbon Monoxide Zone Map C Updated May 2, 2008 AMBIENT AIR SAMPLING ACTIVITIES LOG See attached Table 2. OUTSTANDING ISSUES Significant documents pending OEPA review, comment, and/or approval:
• Fire Suppression Plan submitted May 25, 2007 • Permit-to-Install (PTI) “Needs Analysis” submitted May 29, 2007 • Data Reduction Request submitted September 6, 2007 • Dewatering and EGES Enhancement Work Plan submitted on Jan. 14, 2008 • West Slope Monitoring Reduction Request submitted on Jan. 16, 2008. • Work Plan for Additional Ambient Air Testing, submitted Feb. 22, 2008 • Sampling Reduction Request, South Slope Gas Probes submitted March 24, 2008
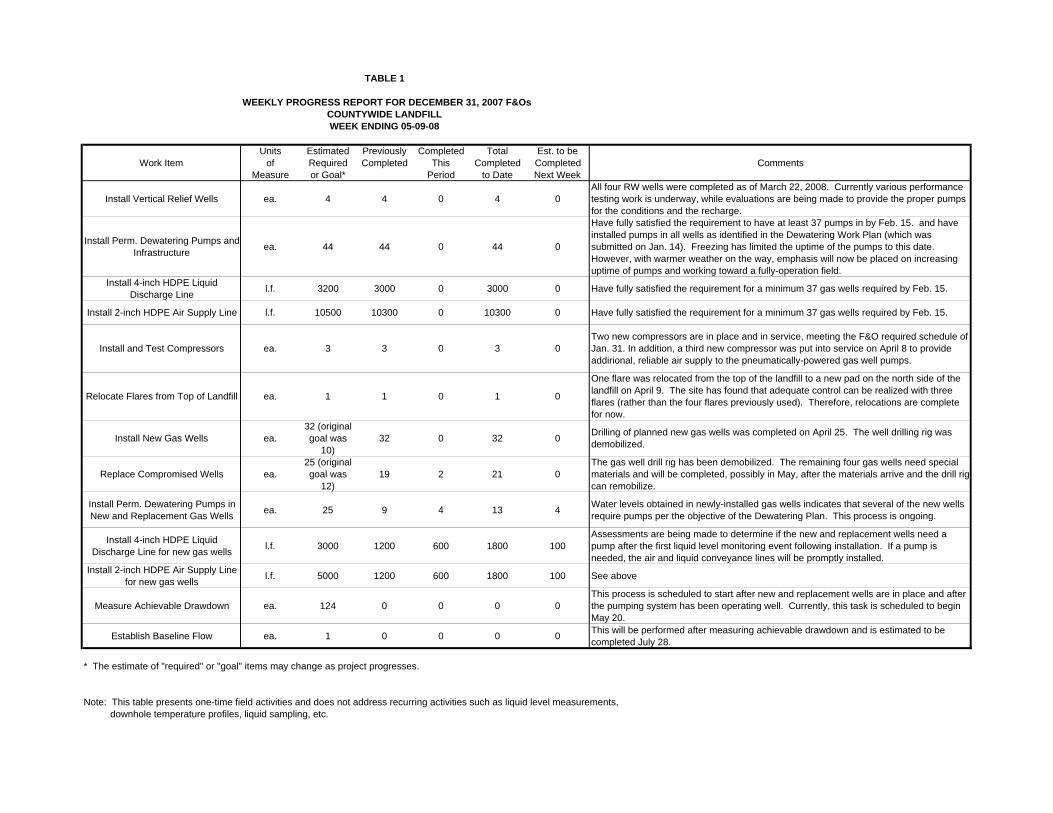
TABLE 1
WEEKLY PROGRESS REPORT FOR DECEMBER 31, 2007 F&OsCOUNTYWIDE LANDFILLWEEK ENDING 05-09-08
Units Estimated Previously Completed Total Est. to beWork Item of Required Completed This Completed Completed Comments
Measure or Goal* Period to Date Next Week
Install Vertical Relief Wells ea. 4 4 0 4 0All four RW wells were completed as of March 22, 2008. Currently various performance testing work is underway, while evaluations are being made to provide the proper pumps for the conditions and the recharge.
Install Perm. Dewatering Pumps and Infrastructure ea. 44 44 0 44 0
Have fully satisfied the requirement to have at least 37 pumps in by Feb. 15. and have installed pumps in all wells as identified in the Dewatering Work Plan (which was submitted on Jan. 14). Freezing has limited the uptime of the pumps to this date. However, with warmer weather on the way, emphasis will now be placed on increasing uptime of pumps and working toward a fully-operation field.
Install 4-inch HDPE Liquid Discharge Line l.f. 3200 3000 0 3000 0 Have fully satisfied the requirement for a minimum 37 gas wells required by Feb. 15.
Install 2-inch HDPE Air Supply Line l.f. 10500 10300 0 10300 0 Have fully satisfied the requirement for a minimum 37 gas wells required by Feb. 15.
Install and Test Compressors ea. 3 3 0 3 0Two new compressors are in place and in service, meeting the F&O required schedule of Jan. 31. In addition, a third new compressor was put into service on April 8 to provide addirional, reliable air supply to the pneumatically-powered gas well pumps.
Relocate Flares from Top of Landfill ea. 1 1 0 1 0
One flare was relocated from the top of the landfill to a new pad on the north side of the landfill on April 9. The site has found that adequate control can be realized with three flares (rather than the four flares previously used). Therefore, relocations are complete for now.
Install New Gas Wells ea.32 (original goal was
10)32 0 32 0 Drilling of planned new gas wells was completed on April 25. The well drilling rig was
demobilized.
Replace Compromised Wells ea.25 (original goal was
12)19 2 21 0
The gas well drill rig has been demobilized. The remaining four gas wells need special materials and will be completed, possibly in May, after the materials arrive and the drill rig can remobilize.
Install Perm. Dewatering Pumps in New and Replacement Gas Wells ea. 25 9 4 13 4 Water levels obtained in newly-installed gas wells indicates that several of the new wells
require pumps per the objective of the Dewatering Plan. This process is ongoing.
Install 4-inch HDPE Liquid Discharge Line for new gas wells l.f. 3000 1200 600 1800 100
Assessments are being made to determine if the new and replacement wells need a pump after the first liquid level monitoring event following installation. If a pump is needed, the air and liquid conveyance lines will be promptly installed.
Install 2-inch HDPE Air Supply Line for new gas wells l.f. 5000 1200 600 1800 100 See above
Measure Achievable Drawdown ea. 124 0 0 0 0This process is scheduled to start after new and replacement wells are in place and after the pumping system has been operating well. Currently, this task is scheduled to begin May 20.
Establish Baseline Flow ea. 1 0 0 0 0 This will be performed after measuring achievable drawdown and is estimated to be completed July 28.
* The estimate of "required" or "goal" items may change as project progresses.
Note: This table presents one-time field activities and does not address recurring activities such as liquid level measurements, downhole temperature profiles, liquid sampling, etc.
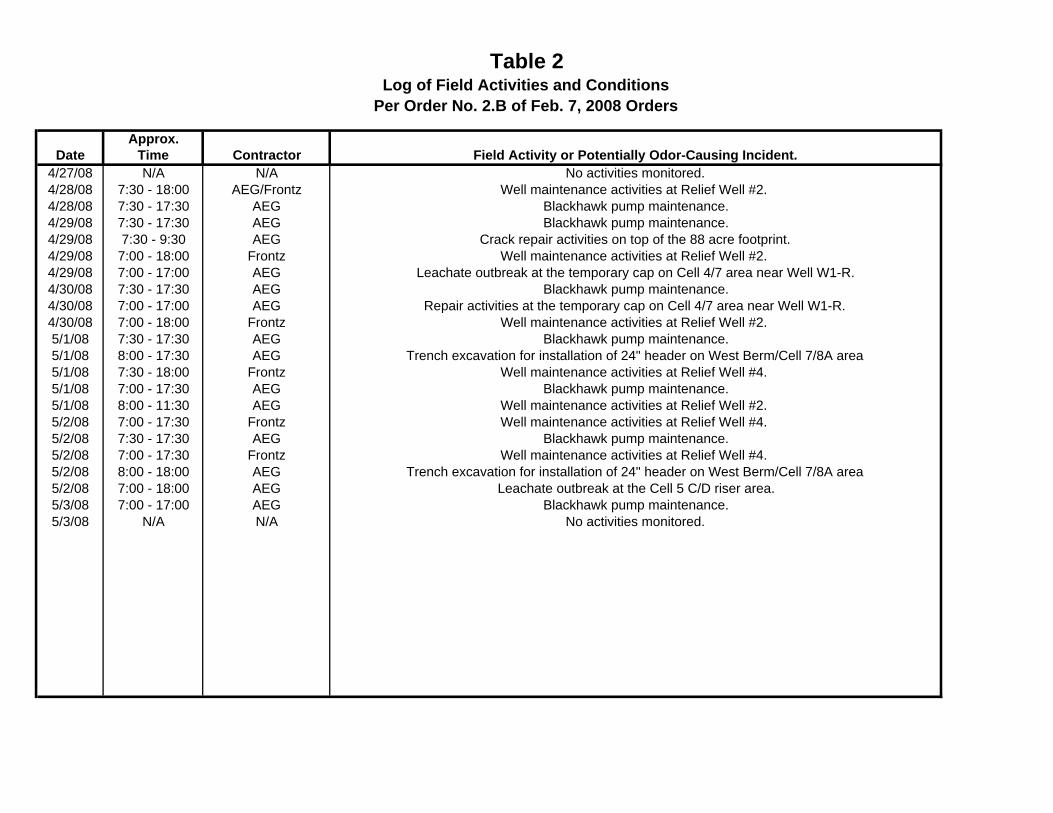
Table 2Log of Field Activities and Conditions
Per Order No. 2.B of Feb. 7, 2008 Orders
Approx.Date Time Contractor
4/27/08 N/A N/A4/28/08 7:30 - 18:00 AEG/Frontz4/28/08 7:30 - 17:30 AEG4/29/08 7:30 - 17:30 AEG4/29/08 7:30 - 9:30 AEG4/29/08 7:00 - 18:00 Frontz4/29/08 7:00 - 17:00 AEG4/30/08 7:30 - 17:30 AEG4/30/08 7:00 - 17:00 AEG4/30/08 7:00 - 18:00 Frontz5/1/08 7:30 - 17:30 AEG5/1/08 8:00 - 17:30 AEG5/1/08 7:30 - 18:00 Frontz5/1/08 7:00 - 17:30 AEG5/1/08 8:00 - 11:30 AEG5/2/08 7:00 - 17:30 Frontz5/2/08 7:30 - 17:30 AEG5/2/08 7:00 - 17:30 Frontz5/2/08 8:00 - 18:00 AEG5/2/08 7:00 - 18:00 AEG5/3/08 7:00 - 17:00 AEG5/3/08 N/A N/A
Well maintenance activities at Relief Well #4.Blackhawk pump maintenance.
Well maintenance activities at Relief Well #4.Trench excavation for installation of 24" header on West Berm/Cell 7/8A area
Leachate outbreak at the Cell 5 C/D riser area.Blackhawk pump maintenance.
No activities monitored.
Trench excavation for installation of 24" header on West Berm/Cell 7/8A areaWell maintenance activities at Relief Well #4.
Blackhawk pump maintenance.Well maintenance activities at Relief Well #2.
Blackhawk pump maintenance.Repair activities at the temporary cap on Cell 4/7 area near Well W1-R.
Well maintenance activities at Relief Well #2.Blackhawk pump maintenance.
Blackhawk pump maintenance.Crack repair activities on top of the 88 acre footprint.
Well maintenance activities at Relief Well #2.Leachate outbreak at the temporary cap on Cell 4/7 area near Well W1-R.
Field Activity or Potentially Odor-Causing Incident.No activities monitored.
Well maintenance activities at Relief Well #2.Blackhawk pump maintenance.
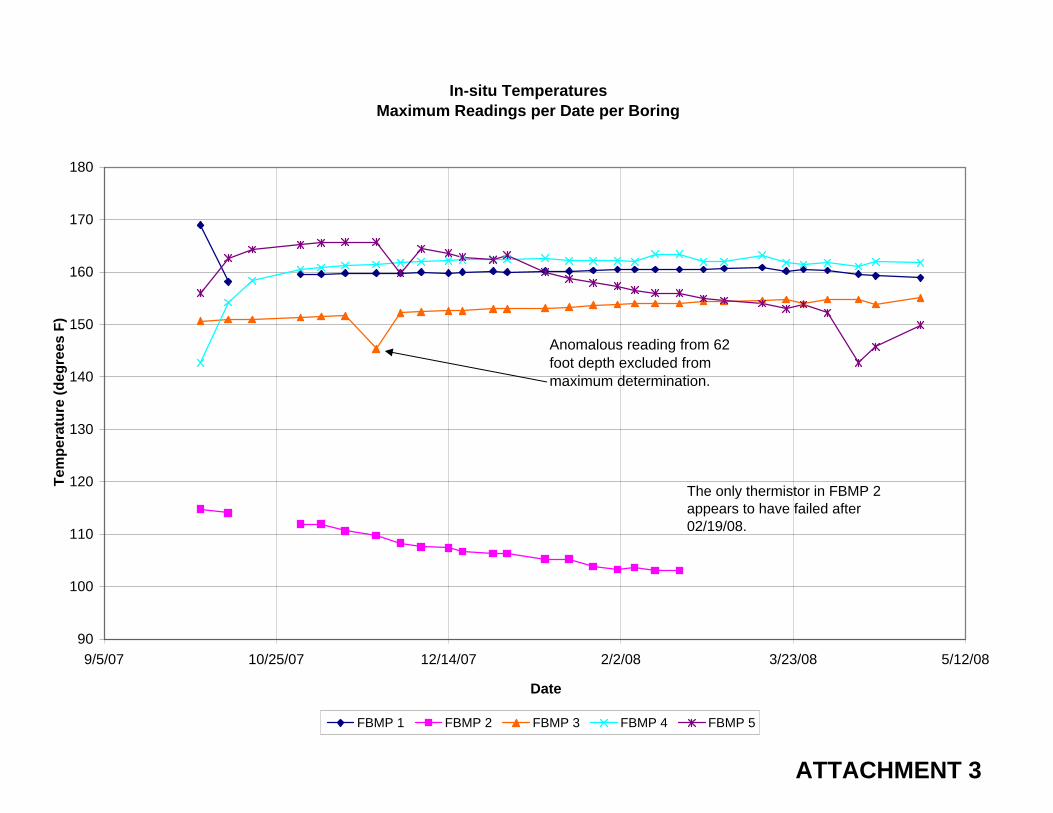
ATTACHMENT 3
In-situ TemperaturesMaximum Readings per Date per Boring
90
100
110
120
130
140
150
160
170
180
9/5/07 10/25/07 12/14/07 2/2/08 3/23/08 5/12/08
Date
Tem
pera
ture
(deg
rees
F)
FBMP 1 FBMP 2 FBMP 3 FBMP 4 FBMP 5
Anomalous reading from 62 foot depth excluded from maximum determination.
The only thermistor in FBMP 2 appears to have failed after 02/19/08.
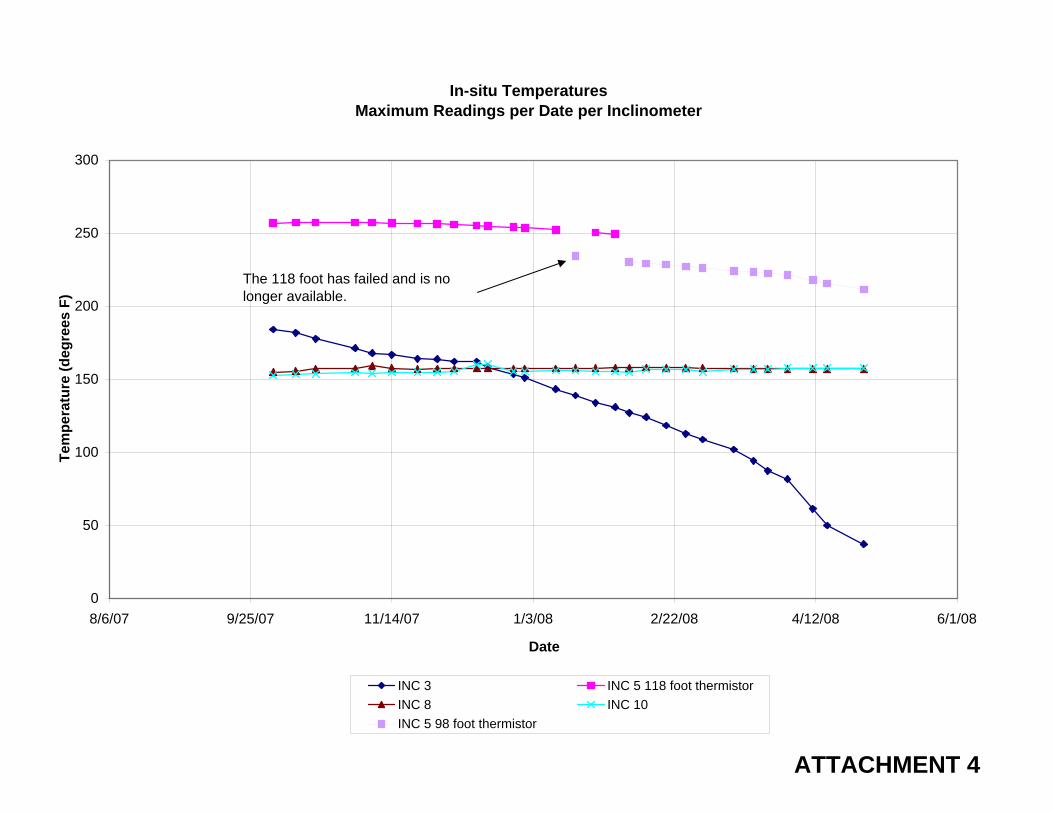
ATTACHMENT 4
In-situ TemperaturesMaximum Readings per Date per Inclinometer
0
50
100
150
200
250
300
8/6/07 9/25/07 11/14/07 1/3/08 2/22/08 4/12/08 6/1/08
Date
Tem
pera
ture
(deg
rees
F)
INC 3 INC 5 118 foot thermistorINC 8 INC 10INC 5 98 foot thermistor
The 118 foot has failed and is no longer available.
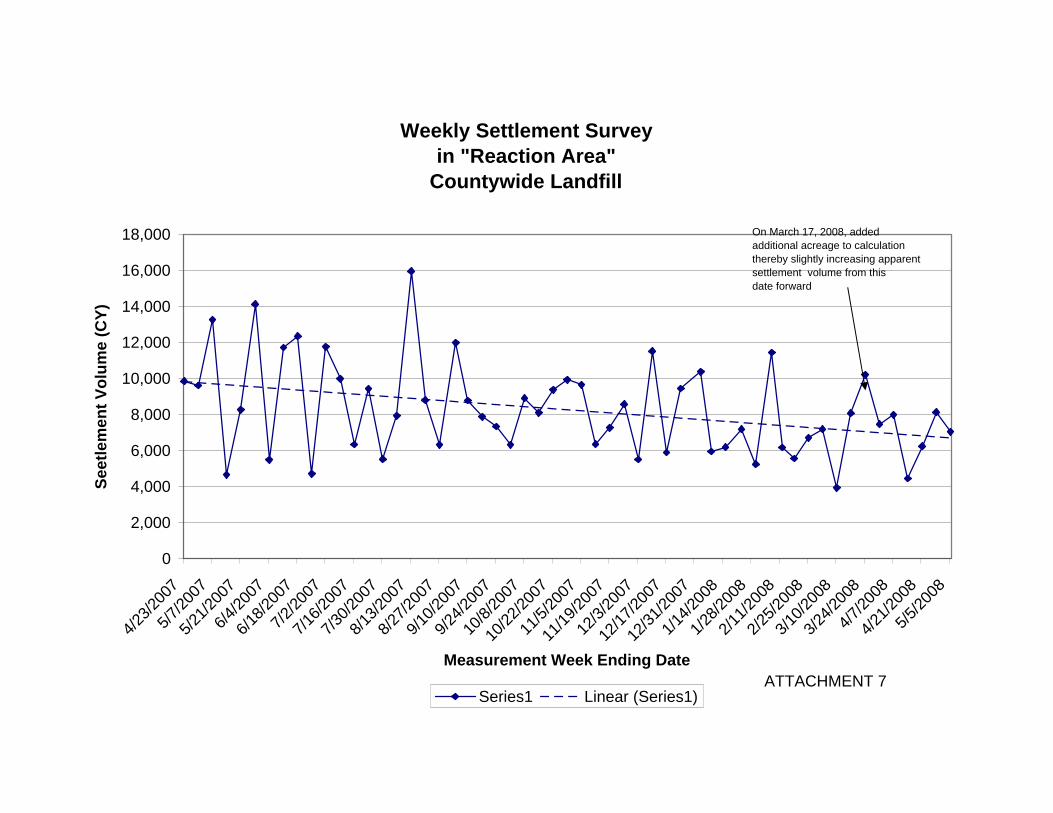
Weekly Settlement Surveyin "Reaction Area"
Countywide Landfill
0
2,000
4,000
6,000
8,000
10,000
12,000
14,000
16,000
18,000
4/23/2
007
5/7/20
075/2
1/200
76/4
/2007
6/18/2
007
7/2/20
077/1
6/200
77/3
0/200
78/1
3/200
78/2
7/200
79/1
0/200
79/2
4/200
710
/8/20
0710
/22/20
0711
/5/20
0711
/19/20
0712
/3/20
0712
/17/20
0712
/31/20
071/1
4/200
81/2
8/200
82/1
1/200
82/2
5/200
83/1
0/200
83/2
4/200
84/7
/2008
4/21/2
008
5/5/20
08
Measurement Week Ending Date
Seet
lem
ent V
olum
e (C
Y)
Series1 Linear (Series1)ATTACHMENT 7
On March 17, 2008, addedadditional acreage to calculationthereby slightly increasing apparentsettlement volume from this date forward
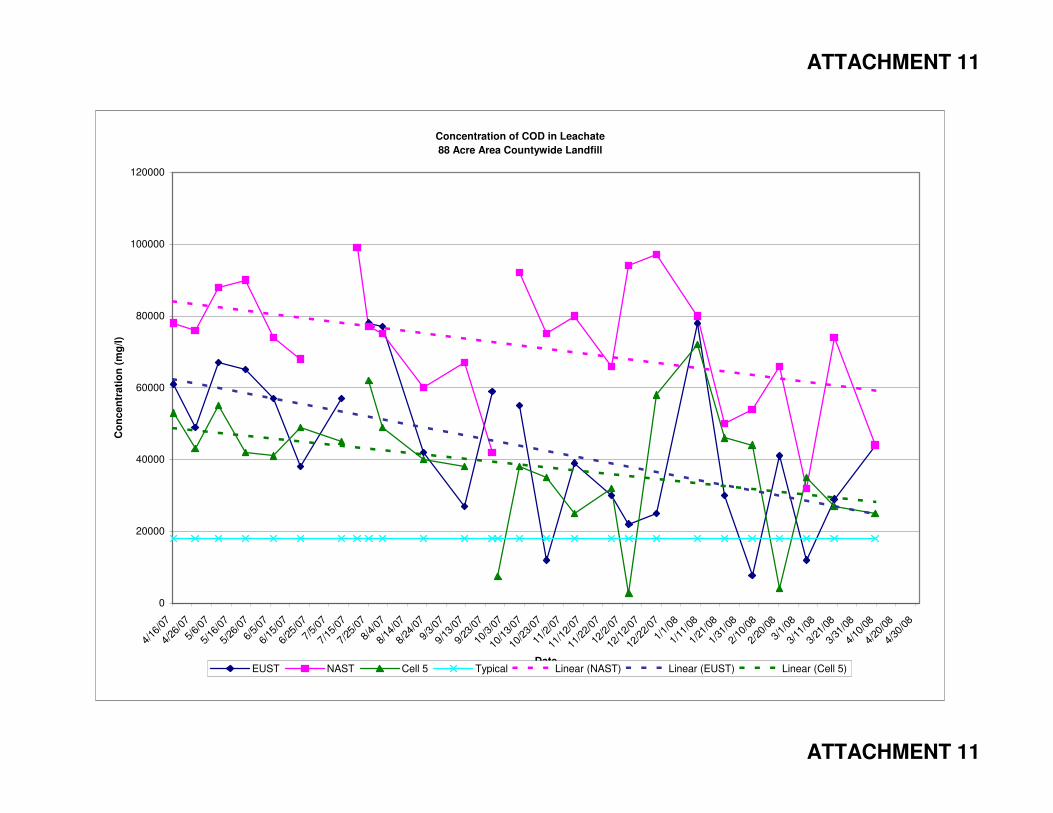
ATTACHMENT 11
Concentration of COD in Leachate
88 Acre Area Countywide Landfill
0
20000
40000
60000
80000
100000
120000
4/16
/07
4/26
/07
5/6/
075/
16/0
75/
26/0
76/
5/07
6/15
/07
6/25
/07
7/5/
077/
15/0
77/
25/0
78/
4/07
8/14
/07
8/24
/07
9/3/
079/
13/0
79/
23/0
710
/3/0
710
/13/
0710
/23/
0711
/2/0
711
/12/
0711
/22/
0712
/2/0
712
/12/
0712
/22/
071/
1/08
1/11
/08
1/21
/08
1/31
/08
2/10
/08
2/20
/08
3/1/
083/
11/0
83/
21/0
83/
31/0
84/
10/0
84/
20/0
84/
30/0
8
Date
Co
ncen
trati
on
(m
g/l)
EUST NAST Cell 5 Typical Linear (NAST) Linear (EUST) Linear (Cell 5)
ATTACHMENT 11
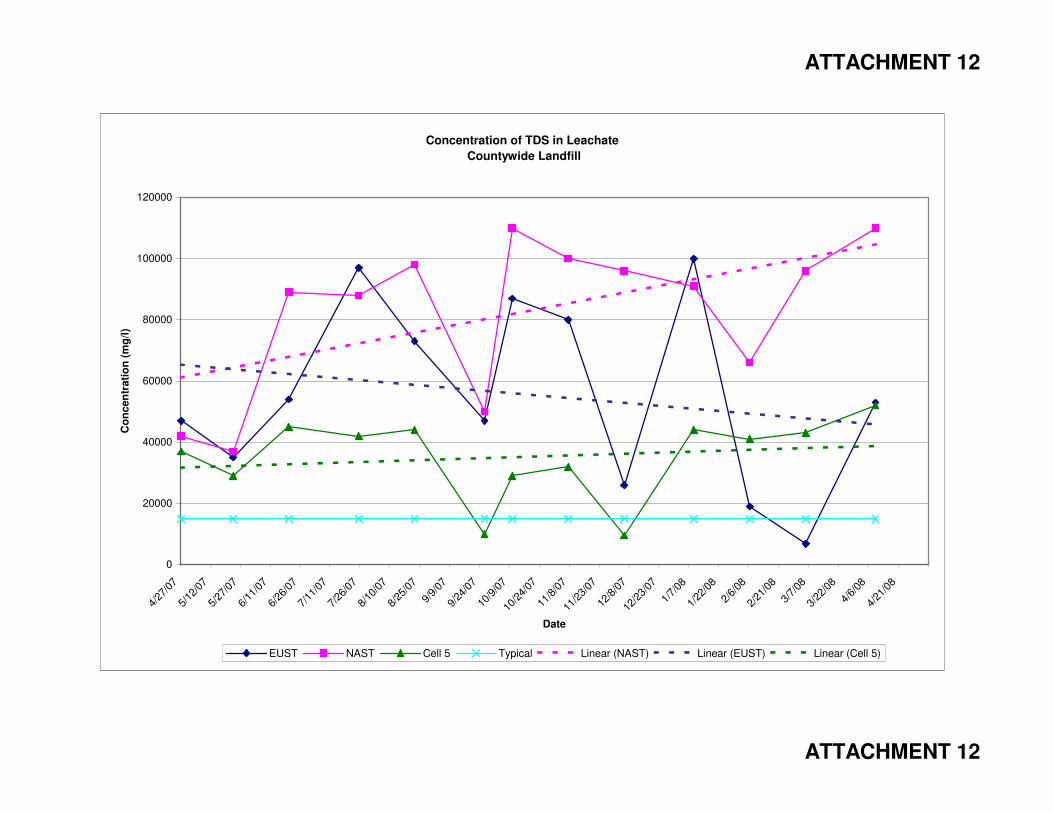
ATTACHMENT 12
Concentration of TDS in Leachate
Countywide Landfill
0
20000
40000
60000
80000
100000
120000
4/27
/07
5/12
/07
5/27
/07
6/11
/07
6/26
/07
7/11
/07
7/26
/07
8/10
/07
8/25
/07
9/9/
079/
24/0
710
/9/0
710
/24/
0711
/8/0
711
/23/
0712
/8/0
712
/23/
07
1/7/
081/
22/0
8
2/6/
082/
21/0
8
3/7/
083/
22/0
8
4/6/
084/
21/0
8
Date
Co
ncen
trati
on
(m
g/l
)
EUST NAST Cell 5 Typical Linear (NAST) Linear (EUST) Linear (Cell 5)
ATTACHMENT 12