Embed Size (px)
Citation preview
Zhongran Chie-mail: [email protected]
Jing Ren
Hongde Jiang
Department of Thermal Engineering,
Tsinghua University,
Beijing 100084, China
Coupled AerothermodynamicsOptimization for the CoolingSystem of a Turbine VaneThe cooling system design for air-cooled turbines is a critical issue in modern gas turbineengineering. Advances in the computational fluid dynamics (CFD) technology and opti-mization methodology are providing new prospects for turbine cooling system design, inthe sense that the optimum cooling system of the vanes and blades could be designedautomatically by the optimization search coupled with the full three-dimensionalconjugate heat transfer (CHT) analysis. An optimization platform for air-cooled turbines,which consists of the genetic algorithm (GA), a mesh generation tool (Coolmesh), and aCHT solver is presented in this paper. The optimization study was aimed at finding theoptimum cooling structure for a 2nd stage vane with, simultaneously, an acceptable metaltemperature distribution and limited amount of coolant. The vane was installed with animpingement and pin-fin cooling structure. The optimization search involved the designof the critical parameters of the cooling system, including the size of the impingementtube, diameter and distribution of impingement holes, and the size and distribution of thepin-fin near trailing edge. The design optimization was carried out under two engineoperating conditions in order to explore the effects of different boundary conditions. Aconstant pressure drop was assumed within the cooling system during each optimization.To make the problem computationally faster, the simulations were approached for the in-terior only (solid and coolant). A weighted function of the temperature distribution andcoolant mass flow was used as the objective of the single objective genetic algorithm(SOGA). The result showed that the optimal cooling system configuration with consider-able cooling performance could be designed through the SOGA optimization withouthuman interference. [DOI: 10.1115/1.4025178]
Introduction
Better gas turbine performance calls for a higher turbine inlettemperature. To ensure sufficient operating life expectancy, mod-ern high pressure turbine (HPT) blades are featured with complexcooling structures, therefore, the cooling design of air-cooled tur-bine blades is a critical issue in gas turbine engineering. In thepast several years, many turbine researchers were interested incooling structure design optimization because of the potential ofautomatically finding better cooling schemes for turbine blades.Moreover, the requirements on the design experience and humaninterference of a computer-automated optimization are signifi-cantly less than those of a traditional design method.
Some studies of engineering design optimization have beengiven by Dulikravich [1], indicating the possibility of design opti-mization using genetic algorithms (GAs). Martin [2,3] presentedthe problem of aero-thermo-elastic optimization of the convectivecooled blade and gave the integral methodology, strategy, andcomputer program dealing with it. Talya [4] studied the methodsfor blade profile and 2D film cooling optimization. For the optimi-zation of radial cooling channels inside the blades or vanes, manyresearchers such as Dennis [5,6], Haasenritter [7], Ruiz [8], Ama-ral [9,10], and Nowak [11,12] presented insightful studies, show-ing the capability of GA methods. These works show that, whilethe single objective genetic algorithms (SOGAs) can yield accept-able optimization results [8,11,12], multi-objective genetic algo-rithms (MOGAs) can find the Pareto-optimal front of the problemand help designers understand the comprehensive capability of thecooling structure used [7,10]. Parallel genetic algorithms can
accelerate the optimization process and sometimes introducing ar-tificial neural networks or radial basis function neural networkscan significantly reduce the computational costs [10]. Althoughthe high computational costs, including simulation preprocessingand solving, limited the optimizations to simple structures, thesestudies provide the foundation for more complex coolingoptimization within real turbine blades and vanes.
Most of the aforementioned optimization works depended onthe 1D flow network model of the cooling channel inside the bladecombined with empirical correlations on friction and heat transfer.However, the full 3D CHT simulation can give more realistic andreliable results for studying th aerothermodynamics phenomena ofair-cooled blades [13–15]. Therefore, the full three-dimensionalCHT simulation should be a more prospective approach for inte-gral air-cooled blade simulation compared with the 1D flow net-work solver and nonconjugated CFD methods. Introducing the 3DCHT simulation methods into the optimization for more realisticcooling structure optimization should be a beneficial extension ofthe current cooling optimization study.
In this paper, the optimization of the cooling system of the 2ndstage turbine vane of an aircraft engine is discussed. This work isaimed at realizing the coupled aero-thermo optimization of thecooling structure of a realistic air-cooled vane and attempting toautomatically find the optimal cooling structure arrangement thatyields better cooling performance with an acceptable amount ofcoolant mass flow rate.
Parametric Design and Mesh Methods
Parametric design methods could reduce the difficulty ofdesigning complex structures, accelerate the design process, andenable automated modeling, which is essential for design optimi-zation. Since the integral modeling and evaluation process shall
Contributed by the International Gas Turbine Institute (IGTI) of ASME forpublication in the JOURNAL OF TURBOMACHINERY. Manuscript received June 23, 2013;final manuscript received July 7, 2013; published online September 27, 2013. Editor:Ronald Bunker.
Journal of Turbomachinery MAY 2014, Vol. 136 / 051008-1Copyright VC 2014 by ASME
Downloaded From: http://turbomachinery.asmedigitalcollection.asme.org/ on 04/13/2014 Terms of Use: http://asme.org/terms
be automated during the optimization search, the methodology ofautomated mesh generation for the vane cooling system was alsoa critical issue for the cooling design optimization of gas turbines.
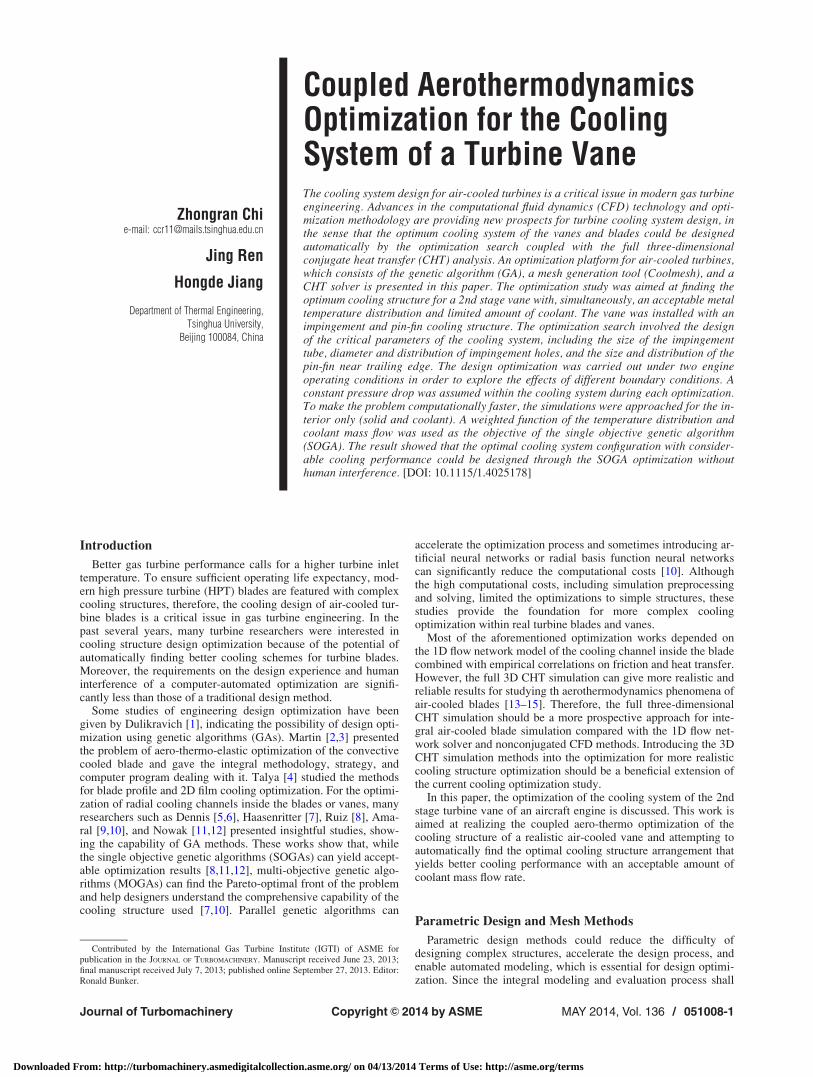
Parametric Design of the Vane Cooling System. The 3Daerodynamic profile of the studied vane was from the 2nd stageturbine of the E3 aircraft engine and the numbers of vanes andblades of the stage are 48 and 70, respectively. The profile of theturbine stage is shown in Fig. 1.
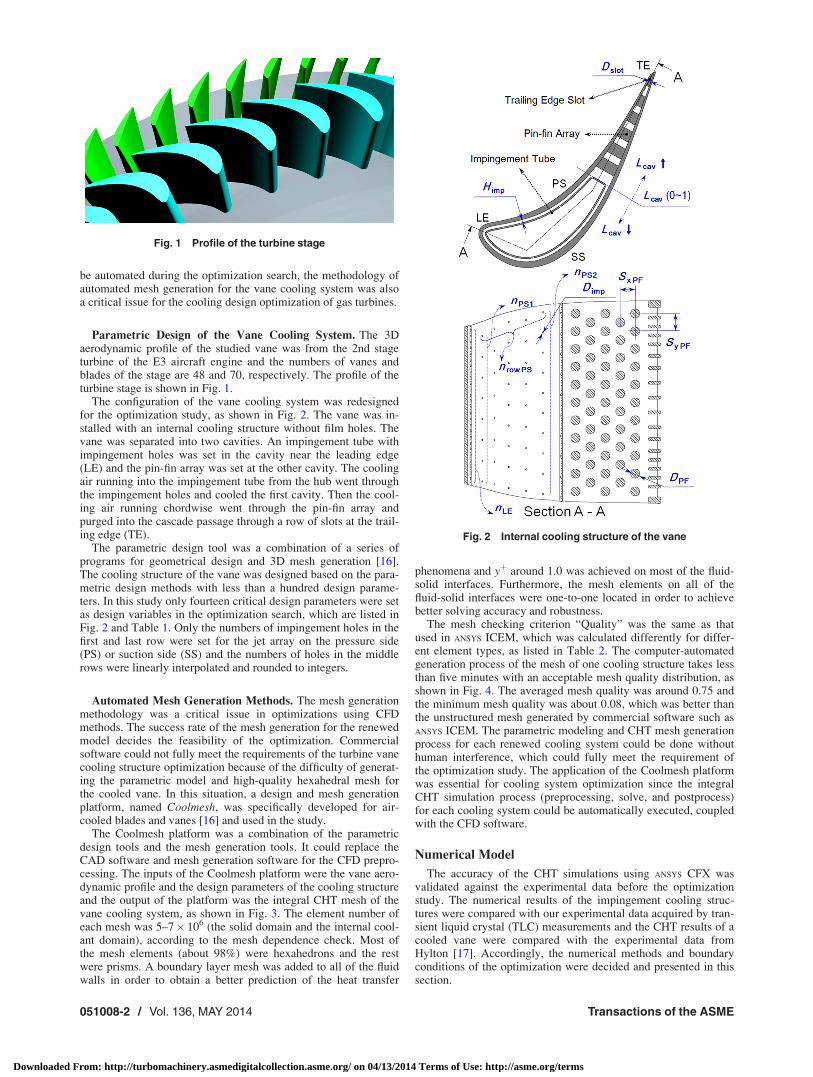
The configuration of the vane cooling system was redesignedfor the optimization study, as shown in Fig. 2. The vane was in-stalled with an internal cooling structure without film holes. Thevane was separated into two cavities. An impingement tube withimpingement holes was set in the cavity near the leading edge(LE) and the pin-fin array was set at the other cavity. The coolingair running into the impingement tube from the hub went throughthe impingement holes and cooled the first cavity. Then the cool-ing air running chordwise went through the pin-fin array andpurged into the cascade passage through a row of slots at the trail-ing edge (TE).
The parametric design tool was a combination of a series ofprograms for geometrical design and 3D mesh generation [16].The cooling structure of the vane was designed based on the para-metric design methods with less than a hundred design parame-ters. In this study only fourteen critical design parameters were setas design variables in the optimization search, which are listed inFig. 2 and Table 1. Only the numbers of impingement holes in thefirst and last row were set for the jet array on the pressure side(PS) or suction side (SS) and the numbers of holes in the middlerows were linearly interpolated and rounded to integers.
Automated Mesh Generation Methods. The mesh generationmethodology was a critical issue in optimizations using CFDmethods. The success rate of the mesh generation for the renewedmodel decides the feasibility of the optimization. Commercialsoftware could not fully meet the requirements of the turbine vanecooling structure optimization because of the difficulty of generat-ing the parametric model and high-quality hexahedral mesh forthe cooled vane. In this situation, a design and mesh generationplatform, named Coolmesh, was specifically developed for air-cooled blades and vanes [16] and used in the study.
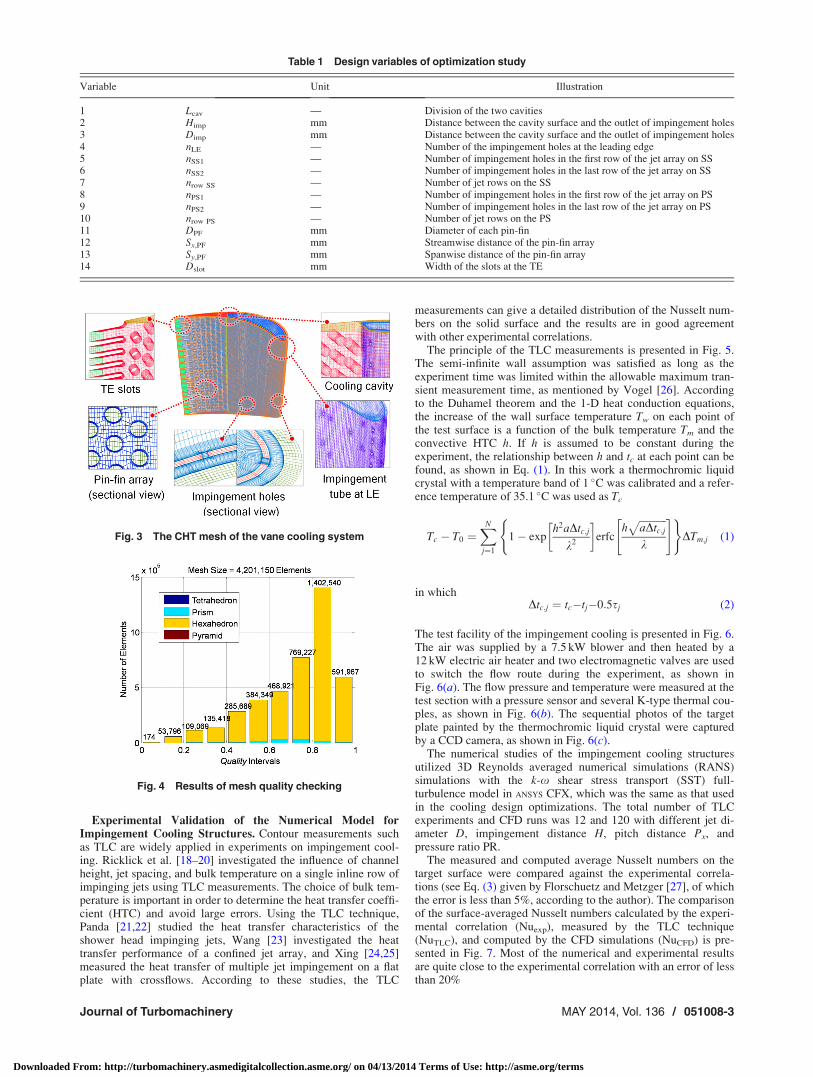
The Coolmesh platform was a combination of the parametricdesign tools and the mesh generation tools. It could replace theCAD software and mesh generation software for the CFD prepro-cessing. The inputs of the Coolmesh platform were the vane aero-dynamic profile and the design parameters of the cooling structureand the output of the platform was the integral CHT mesh of thevane cooling system, as shown in Fig. 3. The element number ofeach mesh was 5–7� 106 (the solid domain and the internal cool-ant domain), according to the mesh dependence check. Most ofthe mesh elements (about 98%) were hexahedrons and the restwere prisms. A boundary layer mesh was added to all of the fluidwalls in order to obtain a better prediction of the heat transfer
phenomena and yþ around 1.0 was achieved on most of the fluid-solid interfaces. Furthermore, the mesh elements on all of thefluid-solid interfaces were one-to-one located in order to achievebetter solving accuracy and robustness.
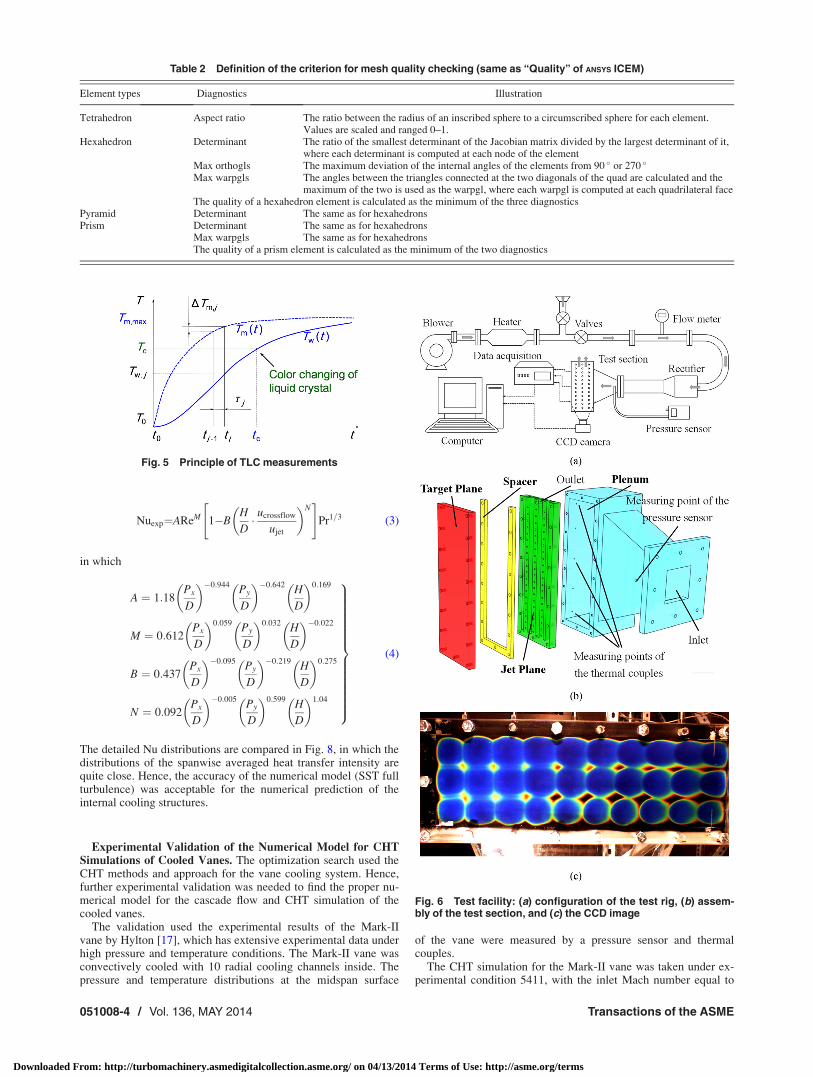
The mesh checking criterion “Quality” was the same as thatused in ANSYS ICEM, which was calculated differently for differ-ent element types, as listed in Table 2. The computer-automatedgeneration process of the mesh of one cooling structure takes lessthan five minutes with an acceptable mesh quality distribution, asshown in Fig. 4. The averaged mesh quality was around 0.75 andthe minimum mesh quality was about 0.08, which was better thanthe unstructured mesh generated by commercial software such asANSYS ICEM. The parametric modeling and CHT mesh generationprocess for each renewed cooling system could be done withouthuman interference, which could fully meet the requirement ofthe optimization study. The application of the Coolmesh platformwas essential for cooling system optimization since the integralCHT simulation process (preprocessing, solve, and postprocess)for each cooling system could be automatically executed, coupledwith the CFD software.
Numerical Model
The accuracy of the CHT simulations using ANSYS CFX wasvalidated against the experimental data before the optimizationstudy. The numerical results of the impingement cooling struc-tures were compared with our experimental data acquired by tran-sient liquid crystal (TLC) measurements and the CHT results of acooled vane were compared with the experimental data fromHylton [17]. Accordingly, the numerical methods and boundaryconditions of the optimization were decided and presented in thissection.
Fig. 1 Profile of the turbine stage
Fig. 2 Internal cooling structure of the vane
051008-2 / Vol. 136, MAY 2014 Transactions of the ASME
Downloaded From: http://turbomachinery.asmedigitalcollection.asme.org/ on 04/13/2014 Terms of Use: http://asme.org/terms
Experimental Validation of the Numerical Model forImpingement Cooling Structures. Contour measurements suchas TLC are widely applied in experiments on impingement cool-ing. Ricklick et al. [18–20] investigated the influence of channelheight, jet spacing, and bulk temperature on a single inline row ofimpinging jets using TLC measurements. The choice of bulk tem-perature is important in order to determine the heat transfer coeffi-cient (HTC) and avoid large errors. Using the TLC technique,Panda [21,22] studied the heat transfer characteristics of theshower head impinging jets, Wang [23] investigated the heattransfer performance of a confined jet array, and Xing [24,25]measured the heat transfer of multiple jet impingement on a flatplate with crossflows. According to these studies, the TLC
measurements can give a detailed distribution of the Nusselt num-bers on the solid surface and the results are in good agreementwith other experimental correlations.
The principle of the TLC measurements is presented in Fig. 5.The semi-infinite wall assumption was satisfied as long as theexperiment time was limited within the allowable maximum tran-sient measurement time, as mentioned by Vogel [26]. Accordingto the Duhamel theorem and the 1-D heat conduction equations,the increase of the wall surface temperature Tw on each point ofthe test surface is a function of the bulk temperature Tm and theconvective HTC h. If h is assumed to be constant during theexperiment, the relationship between h and tc at each point can befound, as shown in Eq. (1). In this work a thermochromic liquidcrystal with a temperature band of 1 �C was calibrated and a refer-ence temperature of 35.1 �C was used as Tc
Tc � T0 ¼XN
j¼1
1� exph2aDtc;j
k2
� �erfc
hffiffiffiffiffiffiffiffiffiffiffiaDtc;j
pk
" #)(DTm;j (1)
in whichDtc;j ¼ tc�tj�0:5sj (2)
The test facility of the impingement cooling is presented in Fig. 6.The air was supplied by a 7.5 kW blower and then heated by a12 kW electric air heater and two electromagnetic valves are usedto switch the flow route during the experiment, as shown inFig. 6(a). The flow pressure and temperature were measured at thetest section with a pressure sensor and several K-type thermal cou-ples, as shown in Fig. 6(b). The sequential photos of the targetplate painted by the thermochromic liquid crystal were capturedby a CCD camera, as shown in Fig. 6(c).
The numerical studies of the impingement cooling structuresutilized 3D Reynolds averaged numerical simulations (RANS)simulations with the k-x shear stress transport (SST) full-turbulence model in ANSYS CFX, which was the same as that usedin the cooling design optimizations. The total number of TLCexperiments and CFD runs was 12 and 120 with different jet di-ameter D, impingement distance H, pitch distance Px, andpressure ratio PR.
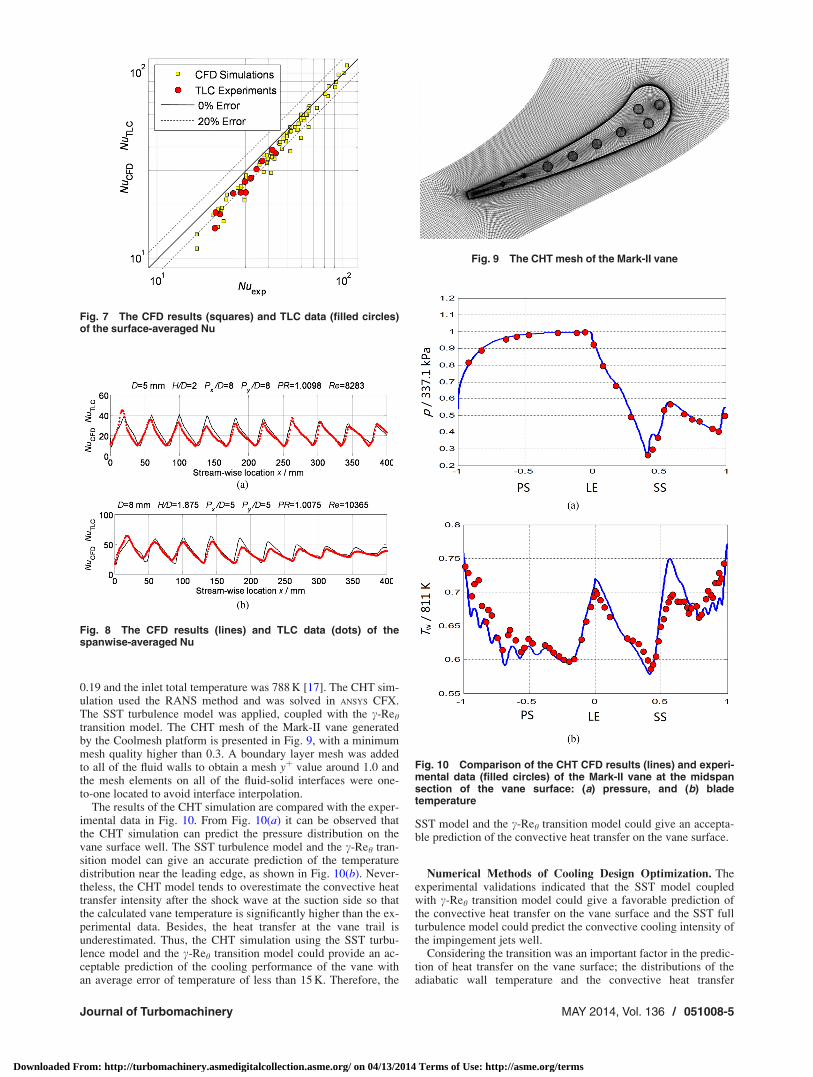
The measured and computed average Nusselt numbers on thetarget surface were compared against the experimental correla-tions (see Eq. (3) given by Florschuetz and Metzger [27], of whichthe error is less than 5%, according to the author). The comparisonof the surface-averaged Nusselt numbers calculated by the experi-mental correlation (Nuexp), measured by the TLC technique(NuTLC), and computed by the CFD simulations (NuCFD) is pre-sented in Fig. 7. Most of the numerical and experimental resultsare quite close to the experimental correlation with an error of lessthan 20%
Table 1 Design variables of optimization study
Variable Unit Illustration
1 Lcav — Division of the two cavities2 Himp mm Distance between the cavity surface and the outlet of impingement holes3 Dimp mm Distance between the cavity surface and the outlet of impingement holes4 nLE — Number of the impingement holes at the leading edge5 nSS1 — Number of impingement holes in the first row of the jet array on SS6 nSS2 — Number of impingement holes in the last row of the jet array on SS7 nrow SS — Number of jet rows on the SS8 nPS1 — Number of impingement holes in the first row of the jet array on PS9 nPS2 — Number of impingement holes in the last row of the jet array on PS10 nrow PS — Number of jet rows on the PS11 DPF mm Diameter of each pin-fin12 Sx,PF mm Streamwise distance of the pin-fin array13 Sy,PF mm Spanwise distance of the pin-fin array14 Dslot mm Width of the slots at the TE
Fig. 4 Results of mesh quality checking
Fig. 3 The CHT mesh of the vane cooling system
Journal of Turbomachinery MAY 2014, Vol. 136 / 051008-3
Downloaded From: http://turbomachinery.asmedigitalcollection.asme.org/ on 04/13/2014 Terms of Use: http://asme.org/terms
Nuexp¼AReM 1�BH
D� ucrossflow
ujet
� �N" #
Pr1=3 (3)
in which
A ¼ 1:18Px
D
� ��0:944 Py
D
� ��0:642 H
D
� �0:169
M ¼ 0:612Px
D
� �0:059 Py
D
� �0:032 H
D
� ��0:022
B ¼ 0:437Px
D
� ��0:095 Py
D
� ��0:219 H
D
� �0:275
N ¼ 0:092Px
D
� ��0:005 Py
D
� �0:599 H
D
� �1:04
9>>>>>>>>>>>>>>=>>>>>>>>>>>>>>;
(4)
The detailed Nu distributions are compared in Fig. 8, in which thedistributions of the spanwise averaged heat transfer intensity arequite close. Hence, the accuracy of the numerical model (SST fullturbulence) was acceptable for the numerical prediction of theinternal cooling structures.
Experimental Validation of the Numerical Model for CHTSimulations of Cooled Vanes. The optimization search used theCHT methods and approach for the vane cooling system. Hence,further experimental validation was needed to find the proper nu-merical model for the cascade flow and CHT simulation of thecooled vanes.
The validation used the experimental results of the Mark-IIvane by Hylton [17], which has extensive experimental data underhigh pressure and temperature conditions. The Mark-II vane wasconvectively cooled with 10 radial cooling channels inside. Thepressure and temperature distributions at the midspan surface
of the vane were measured by a pressure sensor and thermalcouples.
The CHT simulation for the Mark-II vane was taken under ex-perimental condition 5411, with the inlet Mach number equal to
Fig. 5 Principle of TLC measurements
Fig. 6 Test facility: (a) configuration of the test rig, (b) assem-bly of the test section, and (c) the CCD image
Table 2 Definition of the criterion for mesh quality checking (same as “Quality” of ANSYS ICEM)
Element types Diagnostics Illustration
Tetrahedron Aspect ratio The ratio between the radius of an inscribed sphere to a circumscribed sphere for each element.Values are scaled and ranged 0–1.
Hexahedron Determinant The ratio of the smallest determinant of the Jacobian matrix divided by the largest determinant of it,where each determinant is computed at each node of the element
Max orthogls The maximum deviation of the internal angles of the elements from 90 � or 270 �
Max warpgls The angles between the triangles connected at the two diagonals of the quad are calculated and themaximum of the two is used as the warpgl, where each warpgl is computed at each quadrilateral face
The quality of a hexahedron element is calculated as the minimum of the three diagnosticsPyramid Determinant The same as for hexahedronsPrism Determinant The same as for hexahedrons
Max warpgls The same as for hexahedronsThe quality of a prism element is calculated as the minimum of the two diagnostics
051008-4 / Vol. 136, MAY 2014 Transactions of the ASME
Downloaded From: http://turbomachinery.asmedigitalcollection.asme.org/ on 04/13/2014 Terms of Use: http://asme.org/terms
0.19 and the inlet total temperature was 788 K [17]. The CHT sim-ulation used the RANS method and was solved in ANSYS CFX.The SST turbulence model was applied, coupled with the c-Reh
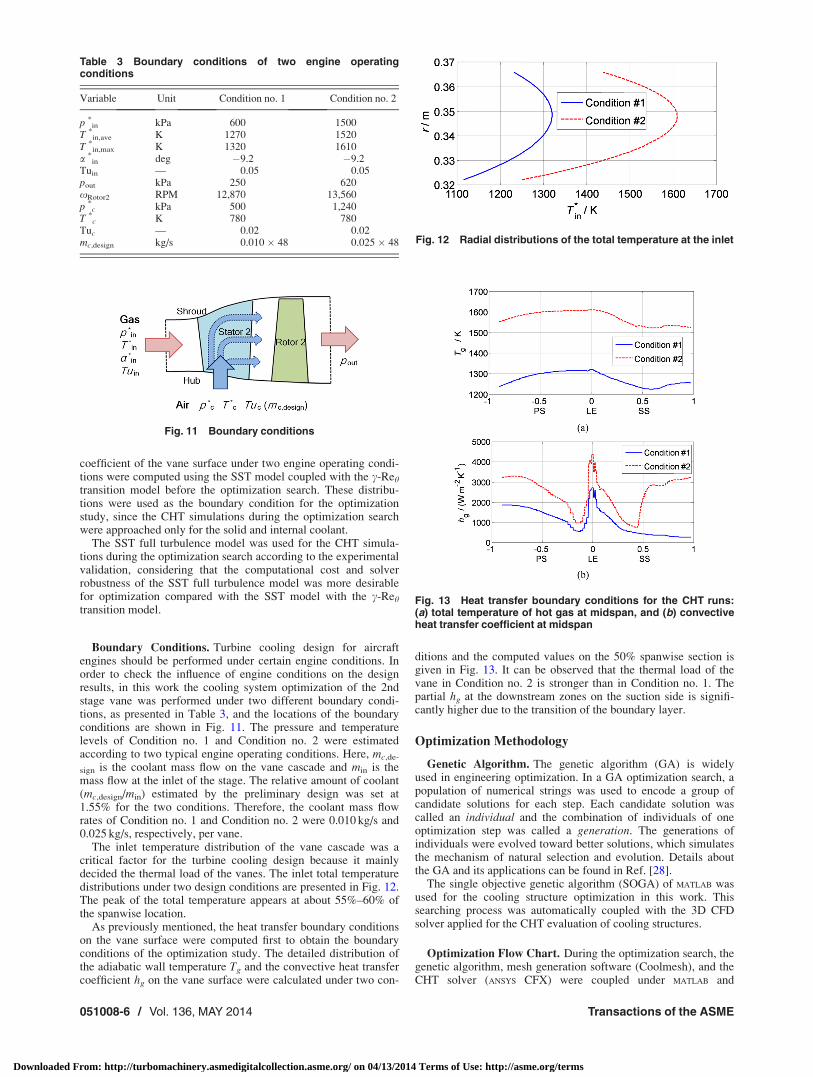
transition model. The CHT mesh of the Mark-II vane generatedby the Coolmesh platform is presented in Fig. 9, with a minimummesh quality higher than 0.3. A boundary layer mesh was addedto all of the fluid walls to obtain a mesh yþ value around 1.0 andthe mesh elements on all of the fluid-solid interfaces were one-to-one located to avoid interface interpolation.
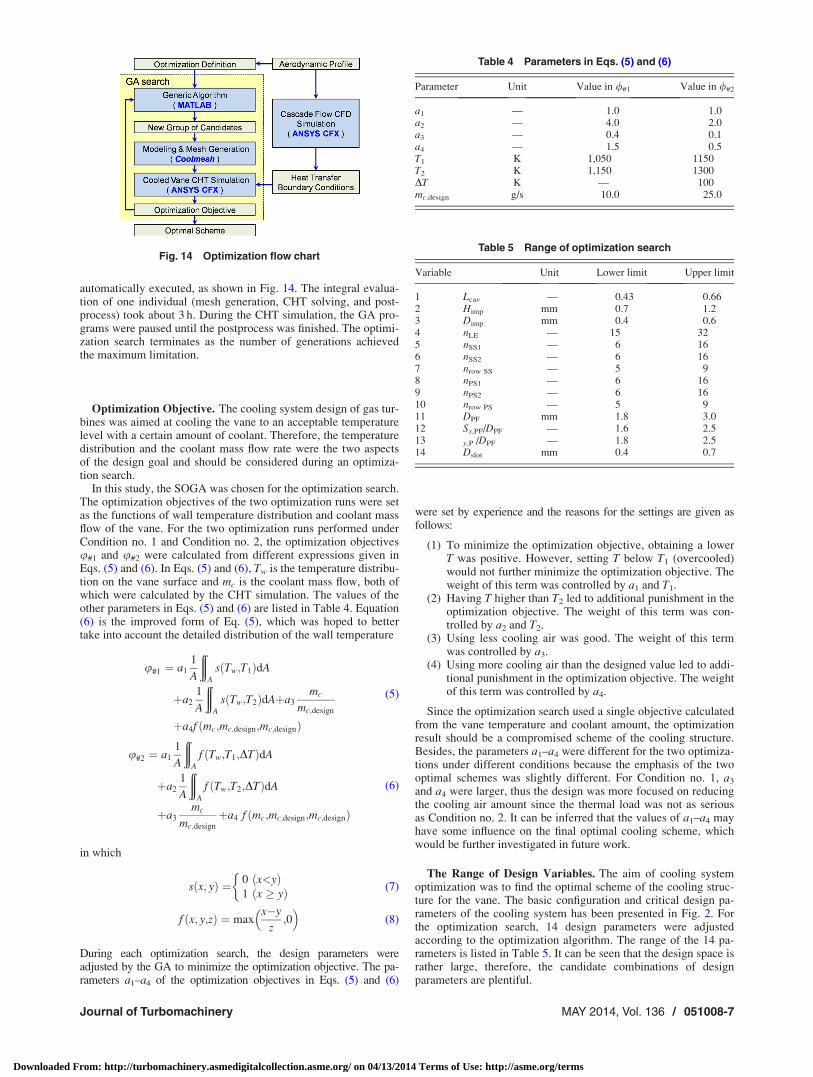
The results of the CHT simulation are compared with the exper-imental data in Fig. 10. From Fig. 10(a) it can be observed thatthe CHT simulation can predict the pressure distribution on thevane surface well. The SST turbulence model and the c-Reh tran-sition model can give an accurate prediction of the temperaturedistribution near the leading edge, as shown in Fig. 10(b). Never-theless, the CHT model tends to overestimate the convective heattransfer intensity after the shock wave at the suction side so thatthe calculated vane temperature is significantly higher than the ex-perimental data. Besides, the heat transfer at the vane trail isunderestimated. Thus, the CHT simulation using the SST turbu-lence model and the c-Reh transition model could provide an ac-ceptable prediction of the cooling performance of the vane withan average error of temperature of less than 15 K. Therefore, the
SST model and the c-Reh transition model could give an accepta-ble prediction of the convective heat transfer on the vane surface.
Numerical Methods of Cooling Design Optimization. Theexperimental validations indicated that the SST model coupledwith c-Reh transition model could give a favorable prediction ofthe convective heat transfer on the vane surface and the SST fullturbulence model could predict the convective cooling intensity ofthe impingement jets well.
Considering the transition was an important factor in the predic-tion of heat transfer on the vane surface; the distributions of theadiabatic wall temperature and the convective heat transfer
Fig. 8 The CFD results (lines) and TLC data (dots) of thespanwise-averaged Nu
Fig. 9 The CHT mesh of the Mark-II vane
Fig. 10 Comparison of the CHT CFD results (lines) and experi-mental data (filled circles) of the Mark-II vane at the midspansection of the vane surface: (a) pressure, and (b) bladetemperature
Fig. 7 The CFD results (squares) and TLC data (filled circles)of the surface-averaged Nu
Journal of Turbomachinery MAY 2014, Vol. 136 / 051008-5
Downloaded From: http://turbomachinery.asmedigitalcollection.asme.org/ on 04/13/2014 Terms of Use: http://asme.org/terms
coefficient of the vane surface under two engine operating condi-tions were computed using the SST model coupled with the c-Reh
transition model before the optimization search. These distribu-tions were used as the boundary condition for the optimizationstudy, since the CHT simulations during the optimization searchwere approached only for the solid and internal coolant.
The SST full turbulence model was used for the CHT simula-tions during the optimization search according to the experimentalvalidation, considering that the computational cost and solverrobustness of the SST full turbulence model was more desirablefor optimization compared with the SST model with the c-Reh
transition model.
Boundary Conditions. Turbine cooling design for aircraftengines should be performed under certain engine conditions. Inorder to check the influence of engine conditions on the designresults, in this work the cooling system optimization of the 2ndstage vane was performed under two different boundary condi-tions, as presented in Table 3, and the locations of the boundaryconditions are shown in Fig. 11. The pressure and temperaturelevels of Condition no. 1 and Condition no. 2 were estimatedaccording to two typical engine operating conditions. Here, mc,de-
sign is the coolant mass flow on the vane cascade and min is themass flow at the inlet of the stage. The relative amount of coolant(mc,design/min) estimated by the preliminary design was set at1.55% for the two conditions. Therefore, the coolant mass flowrates of Condition no. 1 and Condition no. 2 were 0.010 kg/s and0.025 kg/s, respectively, per vane.
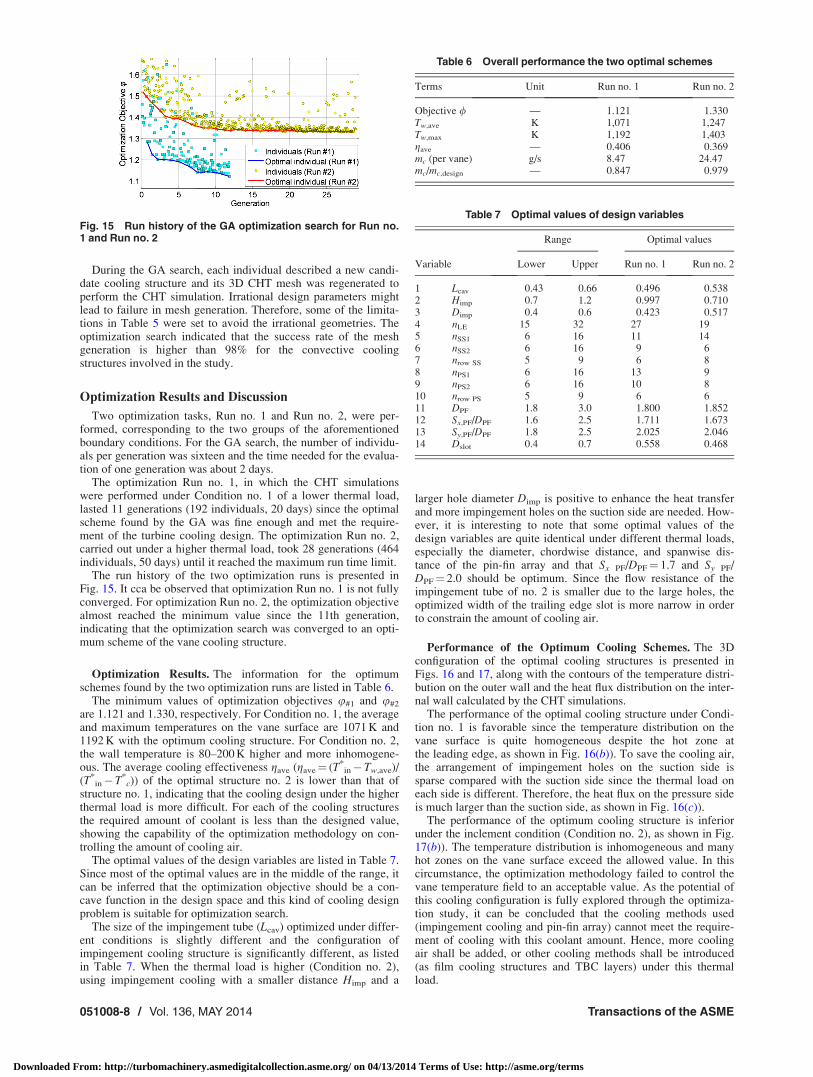
The inlet temperature distribution of the vane cascade was acritical factor for the turbine cooling design because it mainlydecided the thermal load of the vanes. The inlet total temperaturedistributions under two design conditions are presented in Fig. 12.The peak of the total temperature appears at about 55%–60% ofthe spanwise location.
As previously mentioned, the heat transfer boundary conditionson the vane surface were computed first to obtain the boundaryconditions of the optimization study. The detailed distribution ofthe adiabatic wall temperature Tg and the convective heat transfercoefficient hg on the vane surface were calculated under two con-
ditions and the computed values on the 50% spanwise section isgiven in Fig. 13. It can be observed that the thermal load of thevane in Condition no. 2 is stronger than in Condition no. 1. Thepartial hg at the downstream zones on the suction side is signifi-cantly higher due to the transition of the boundary layer.
Optimization Methodology
Genetic Algorithm. The genetic algorithm (GA) is widelyused in engineering optimization. In a GA optimization search, apopulation of numerical strings was used to encode a group ofcandidate solutions for each step. Each candidate solution wascalled an individual and the combination of individuals of oneoptimization step was called a generation. The generations ofindividuals were evolved toward better solutions, which simulatesthe mechanism of natural selection and evolution. Details aboutthe GA and its applications can be found in Ref. [28].
The single objective genetic algorithm (SOGA) of MATLAB wasused for the cooling structure optimization in this work. Thissearching process was automatically coupled with the 3D CFDsolver applied for the CHT evaluation of cooling structures.
Optimization Flow Chart. During the optimization search, thegenetic algorithm, mesh generation software (Coolmesh), and theCHT solver (ANSYS CFX) were coupled under MATLAB and
Table 3 Boundary conditions of two engine operatingconditions
Variable Unit Condition no. 1 Condition no. 2
p *in kPa 600 1500
T *in,ave K 1270 1520
T *in,max K 1320 1610
a *in deg �9.2 �9.2
Tuin — 0.05 0.05pout kPa 250 620xRotor2 RPM 12,870 13,560p *
c kPa 500 1,240T *
c K 780 780Tuc — 0.02 0.02mc,design kg/s 0.010 � 48 0.025 � 48
Fig. 11 Boundary conditions
Fig. 12 Radial distributions of the total temperature at the inlet
Fig. 13 Heat transfer boundary conditions for the CHT runs:(a) total temperature of hot gas at midspan, and (b) convectiveheat transfer coefficient at midspan
051008-6 / Vol. 136, MAY 2014 Transactions of the ASME
Downloaded From: http://turbomachinery.asmedigitalcollection.asme.org/ on 04/13/2014 Terms of Use: http://asme.org/terms
automatically executed, as shown in Fig. 14. The integral evalua-tion of one individual (mesh generation, CHT solving, and post-process) took about 3 h. During the CHT simulation, the GA pro-grams were paused until the postprocess was finished. The optimi-zation search terminates as the number of generations achievedthe maximum limitation.
Optimization Objective. The cooling system design of gas tur-bines was aimed at cooling the vane to an acceptable temperaturelevel with a certain amount of coolant. Therefore, the temperaturedistribution and the coolant mass flow rate were the two aspectsof the design goal and should be considered during an optimiza-tion search.
In this study, the SOGA was chosen for the optimization search.The optimization objectives of the two optimization runs were setas the functions of wall temperature distribution and coolant massflow of the vane. For the two optimization runs performed underCondition no. 1 and Condition no. 2, the optimization objectivesu#1 and u#2 were calculated from different expressions given inEqs. (5) and (6). In Eqs. (5) and (6), Tw is the temperature distribu-tion on the vane surface and mc is the coolant mass flow, both ofwhich were calculated by the CHT simulation. The values of theother parameters in Eqs. (5) and (6) are listed in Table 4. Equation(6) is the improved form of Eq. (5), which was hoped to bettertake into account the detailed distribution of the wall temperature
u#1 ¼ a1
1
A
ððA
s Tw;T1ð ÞdA
þa2
1
A
ððA
s Tw;T2ð ÞdAþa3
mc
mc;design
þa4f ðmc;mc;design;mc;designÞ
(5)
u#2 ¼ a1
1
A
ððA
f Tw;T1;DTð ÞdA
þa2
1
A
ððA
f Tw;T2;DTð ÞdA
þa3
mc
mc;design
þa4 f ðmc;mc;design;mc;designÞ
(6)
in which
sðx; yÞ ¼ 0 ðx<yÞ1 ðx � yÞ
�(7)
f ðx; y;zÞ ¼ maxx�y
z;0
� (8)
During each optimization search, the design parameters wereadjusted by the GA to minimize the optimization objective. The pa-rameters a1–a4 of the optimization objectives in Eqs. (5) and (6)
were set by experience and the reasons for the settings are given asfollows:
(1) To minimize the optimization objective, obtaining a lowerT was positive. However, setting T below T1 (overcooled)would not further minimize the optimization objective. Theweight of this term was controlled by a1 and T1.
(2) Having T higher than T2 led to additional punishment in theoptimization objective. The weight of this term was con-trolled by a2 and T2.
(3) Using less cooling air was good. The weight of this termwas controlled by a3.
(4) Using more cooling air than the designed value led to addi-tional punishment in the optimization objective. The weightof this term was controlled by a4.
Since the optimization search used a single objective calculatedfrom the vane temperature and coolant amount, the optimizationresult should be a compromised scheme of the cooling structure.Besides, the parameters a1–a4 were different for the two optimiza-tions under different conditions because the emphasis of the twooptimal schemes was slightly different. For Condition no. 1, a3
and a4 were larger, thus the design was more focused on reducingthe cooling air amount since the thermal load was not as seriousas Condition no. 2. It can be inferred that the values of a1–a4 mayhave some influence on the final optimal cooling scheme, whichwould be further investigated in future work.
The Range of Design Variables. The aim of cooling systemoptimization was to find the optimal scheme of the cooling struc-ture for the vane. The basic configuration and critical design pa-rameters of the cooling system has been presented in Fig. 2. Forthe optimization search, 14 design parameters were adjustedaccording to the optimization algorithm. The range of the 14 pa-rameters is listed in Table 5. It can be seen that the design space israther large, therefore, the candidate combinations of designparameters are plentiful.
Fig. 14 Optimization flow chart
Table 4 Parameters in Eqs. (5) and (6)
Parameter Unit Value in /#1 Value in /#2
a1 — 1.0 1.0a2 — 4.0 2.0a3 — 0.4 0.1a4 — 1.5 0.5T1 K 1,050 1150T2 K 1,150 1300DT K — 100mc,design g/s 10.0 25.0
Table 5 Range of optimization search
Variable Unit Lower limit Upper limit
1 Lcav — 0.43 0.662 Himp mm 0.7 1.23 Dimp mm 0.4 0.64 nLE — 15 325 nSS1 — 6 166 nSS2 — 6 167 nrow SS — 5 98 nPS1 — 6 169 nPS2 — 6 1610 nrow PS — 5 911 DPF mm 1.8 3.012 Sx,PF/DPF — 1.6 2.513 y,P /DPF — 1.8 2.514 Dslot mm 0.4 0.7
Journal of Turbomachinery MAY 2014, Vol. 136 / 051008-7
Downloaded From: http://turbomachinery.asmedigitalcollection.asme.org/ on 04/13/2014 Terms of Use: http://asme.org/terms
During the GA search, each individual described a new candi-date cooling structure and its 3D CHT mesh was regenerated toperform the CHT simulation. Irrational design parameters mightlead to failure in mesh generation. Therefore, some of the limita-tions in Table 5 were set to avoid the irrational geometries. Theoptimization search indicated that the success rate of the meshgeneration is higher than 98% for the convective coolingstructures involved in the study.
Optimization Results and Discussion
Two optimization tasks, Run no. 1 and Run no. 2, were per-formed, corresponding to the two groups of the aforementionedboundary conditions. For the GA search, the number of individu-als per generation was sixteen and the time needed for the evalua-tion of one generation was about 2 days.
The optimization Run no. 1, in which the CHT simulationswere performed under Condition no. 1 of a lower thermal load,lasted 11 generations (192 individuals, 20 days) since the optimalscheme found by the GA was fine enough and met the require-ment of the turbine cooling design. The optimization Run no. 2,carried out under a higher thermal load, took 28 generations (464individuals, 50 days) until it reached the maximum run time limit.
The run history of the two optimization runs is presented inFig. 15. It cca be observed that optimization Run no. 1 is not fullyconverged. For optimization Run no. 2, the optimization objectivealmost reached the minimum value since the 11th generation,indicating that the optimization search was converged to an opti-mum scheme of the vane cooling structure.
Optimization Results. The information for the optimumschemes found by the two optimization runs are listed in Table 6.
The minimum values of optimization objectives u#1 and u#2
are 1.121 and 1.330, respectively. For Condition no. 1, the averageand maximum temperatures on the vane surface are 1071 K and1192 K with the optimum cooling structure. For Condition no. 2,the wall temperature is 80–200 K higher and more inhomogene-ous. The average cooling effectiveness gave (gave¼ (T*
in� Tw,ave)/(T*
in� T*c)) of the optimal structure no. 2 is lower than that of
structure no. 1, indicating that the cooling design under the higherthermal load is more difficult. For each of the cooling structuresthe required amount of coolant is less than the designed value,showing the capability of the optimization methodology on con-trolling the amount of cooling air.
The optimal values of the design variables are listed in Table 7.Since most of the optimal values are in the middle of the range, itcan be inferred that the optimization objective should be a con-cave function in the design space and this kind of cooling designproblem is suitable for optimization search.
The size of the impingement tube (Lcav) optimized under differ-ent conditions is slightly different and the configuration ofimpingement cooling structure is significantly different, as listedin Table 7. When the thermal load is higher (Condition no. 2),using impingement cooling with a smaller distance Himp and a
larger hole diameter Dimp is positive to enhance the heat transferand more impingement holes on the suction side are needed. How-ever, it is interesting to note that some optimal values of thedesign variables are quite identical under different thermal loads,especially the diameter, chordwise distance, and spanwise dis-tance of the pin-fin array and that Sx PF/DPF¼ 1.7 and Sy PF/DPF¼ 2.0 should be optimum. Since the flow resistance of theimpingement tube of no. 2 is smaller due to the large holes, theoptimized width of the trailing edge slot is more narrow in orderto constrain the amount of cooling air.
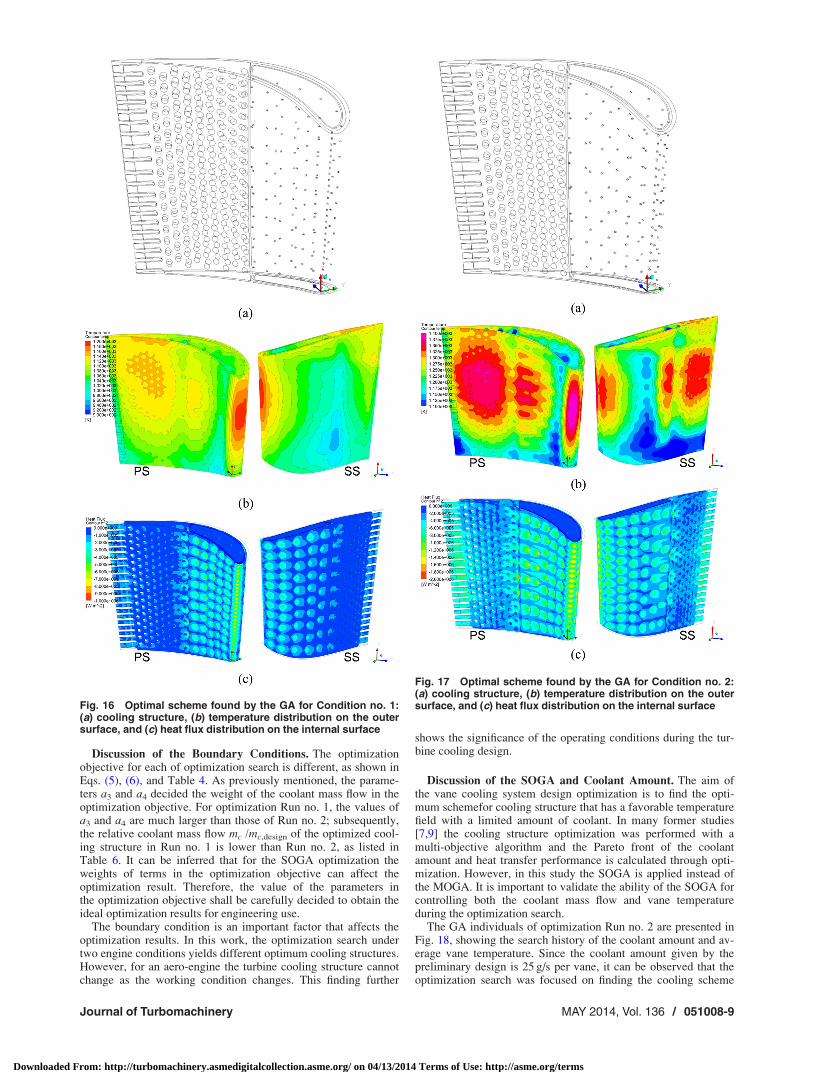
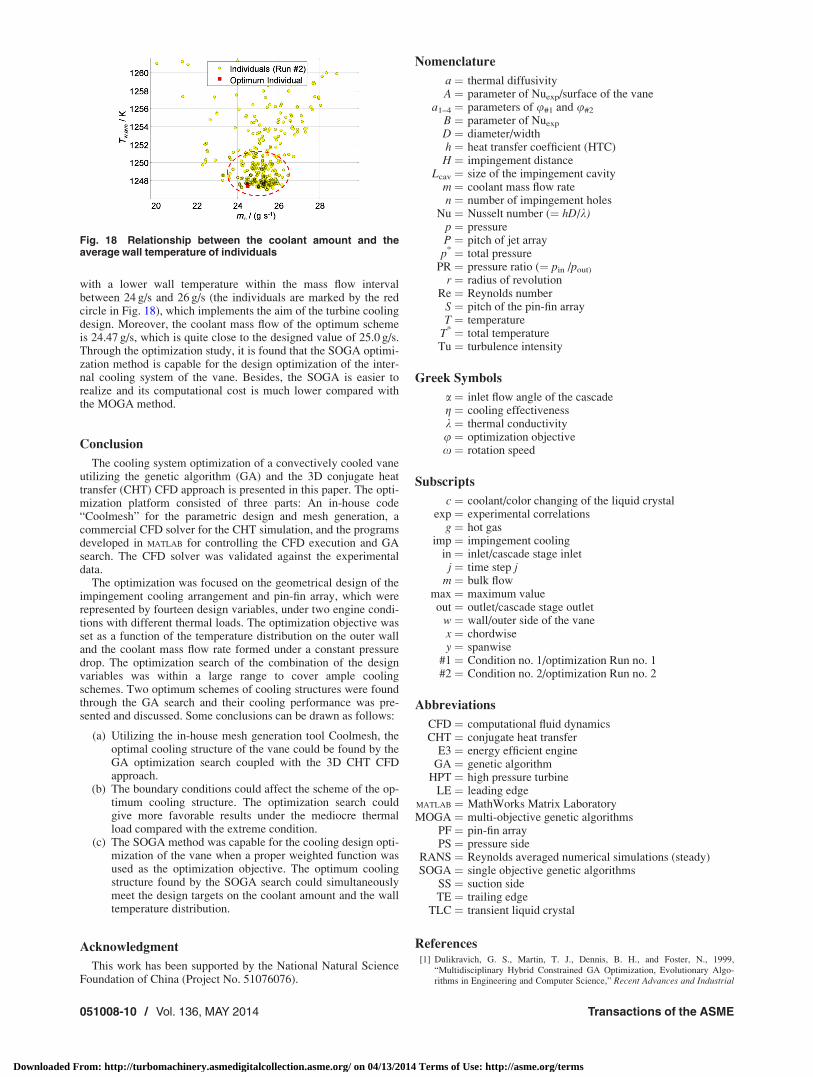
Performance of the Optimum Cooling Schemes. The 3Dconfiguration of the optimal cooling structures is presented inFigs. 16 and 17, along with the contours of the temperature distri-bution on the outer wall and the heat flux distribution on the inter-nal wall calculated by the CHT simulations.
The performance of the optimal cooling structure under Condi-tion no. 1 is favorable since the temperature distribution on thevane surface is quite homogeneous despite the hot zone atthe leading edge, as shown in Fig. 16(b)). To save the cooling air,the arrangement of impingement holes on the suction side issparse compared with the suction side since the thermal load oneach side is different. Therefore, the heat flux on the pressure sideis much larger than the suction side, as shown in Fig. 16(c)).
The performance of the optimum cooling structure is inferiorunder the inclement condition (Condition no. 2), as shown in Fig.17(b)). The temperature distribution is inhomogeneous and manyhot zones on the vane surface exceed the allowed value. In thiscircumstance, the optimization methodology failed to control thevane temperature field to an acceptable value. As the potential ofthis cooling configuration is fully explored through the optimiza-tion study, it can be concluded that the cooling methods used(impingement cooling and pin-fin array) cannot meet the require-ment of cooling with this coolant amount. Hence, more coolingair shall be added, or other cooling methods shall be introduced(as film cooling structures and TBC layers) under this thermalload.
Fig. 15 Run history of the GA optimization search for Run no.1 and Run no. 2
Table 6 Overall performance the two optimal schemes
Terms Unit Run no. 1 Run no. 2
Objective / — 1.121 1.330Tw,ave K 1,071 1,247Tw,max K 1,192 1,403gave — 0.406 0.369mc (per vane) g/s 8.47 24.47mc/mc,design — 0.847 0.979
Table 7 Optimal values of design variables
Range Optimal values
Variable Lower Upper Run no. 1 Run no. 2
1 Lcav 0.43 0.66 0.496 0.5382 Himp 0.7 1.2 0.997 0.7103 Dimp 0.4 0.6 0.423 0.5174 nLE 15 32 27 195 nSS1 6 16 11 146 nSS2 6 16 9 67 nrow SS 5 9 6 88 nPS1 6 16 13 99 nPS2 6 16 10 810 nrow PS 5 9 6 611 DPF 1.8 3.0 1.800 1.85212 Sx,PF/DPF 1.6 2.5 1.711 1.67313 Sy,PF/DPF 1.8 2.5 2.025 2.04614 Dslot 0.4 0.7 0.558 0.468
051008-8 / Vol. 136, MAY 2014 Transactions of the ASME
Downloaded From: http://turbomachinery.asmedigitalcollection.asme.org/ on 04/13/2014 Terms of Use: http://asme.org/terms
Discussion of the Boundary Conditions. The optimizationobjective for each of optimization search is different, as shown inEqs. (5), (6), and Table 4. As previously mentioned, the parame-ters a3 and a4 decided the weight of the coolant mass flow in theoptimization objective. For optimization Run no. 1, the values ofa3 and a4 are much larger than those of Run no. 2; subsequently,the relative coolant mass flow mc /mc,design of the optimized cool-ing structure in Run no. 1 is lower than Run no. 2, as listed inTable 6. It can be inferred that for the SOGA optimization theweights of terms in the optimization objective can affect theoptimization result. Therefore, the value of the parameters inthe optimization objective shall be carefully decided to obtain theideal optimization results for engineering use.
The boundary condition is an important factor that affects theoptimization results. In this work, the optimization search undertwo engine conditions yields different optimum cooling structures.However, for an aero-engine the turbine cooling structure cannotchange as the working condition changes. This finding further
shows the significance of the operating conditions during the tur-bine cooling design.
Discussion of the SOGA and Coolant Amount. The aim ofthe vane cooling system design optimization is to find the opti-mum schemefor cooling structure that has a favorable temperaturefield with a limited amount of coolant. In many former studies[7,9] the cooling structure optimization was performed with amulti-objective algorithm and the Pareto front of the coolantamount and heat transfer performance is calculated through opti-mization. However, in this study the SOGA is applied instead ofthe MOGA. It is important to validate the ability of the SOGA forcontrolling both the coolant mass flow and vane temperatureduring the optimization search.
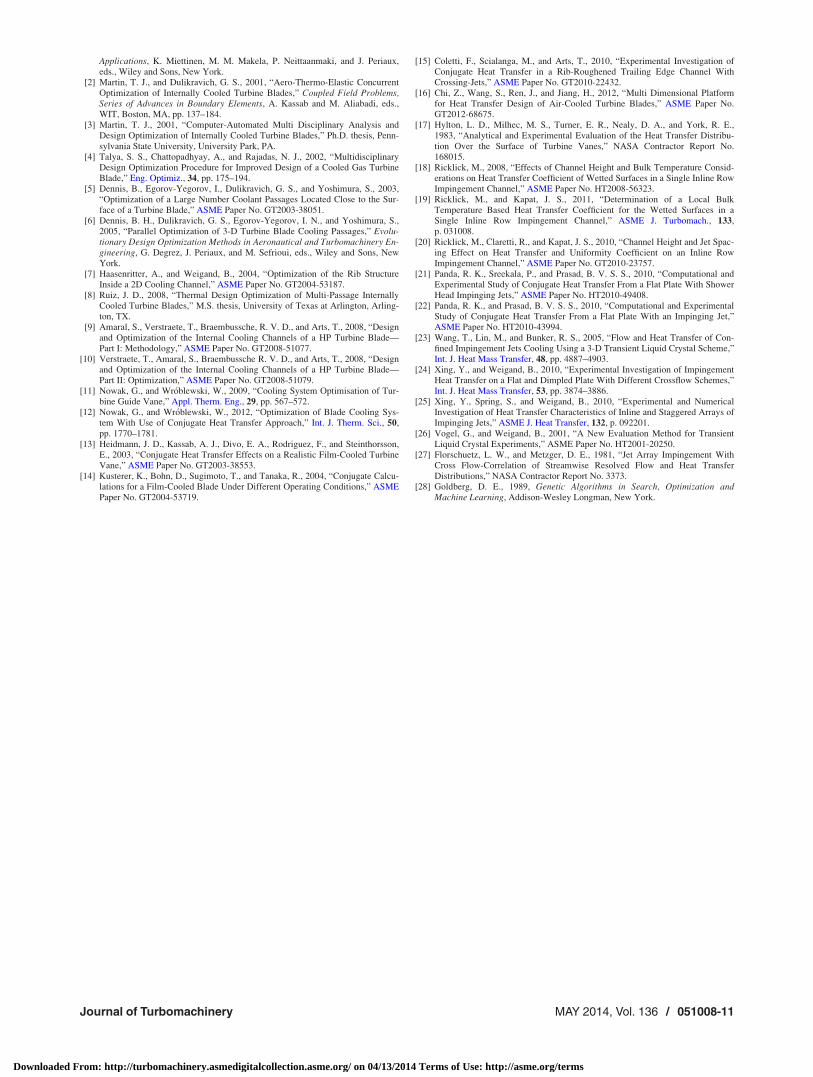
The GA individuals of optimization Run no. 2 are presented inFig. 18, showing the search history of the coolant amount and av-erage vane temperature. Since the coolant amount given by thepreliminary design is 25 g/s per vane, it can be observed that theoptimization search was focused on finding the cooling scheme
Fig. 16 Optimal scheme found by the GA for Condition no. 1:(a) cooling structure, (b) temperature distribution on the outersurface, and (c) heat flux distribution on the internal surface
Fig. 17 Optimal scheme found by the GA for Condition no. 2:(a) cooling structure, (b) temperature distribution on the outersurface, and (c) heat flux distribution on the internal surface
Journal of Turbomachinery MAY 2014, Vol. 136 / 051008-9
Downloaded From: http://turbomachinery.asmedigitalcollection.asme.org/ on 04/13/2014 Terms of Use: http://asme.org/terms
with a lower wall temperature within the mass flow intervalbetween 24 g/s and 26 g/s (the individuals are marked by the redcircle in Fig. 18), which implements the aim of the turbine coolingdesign. Moreover, the coolant mass flow of the optimum schemeis 24.47 g/s, which is quite close to the designed value of 25.0 g/s.Through the optimization study, it is found that the SOGA optimi-zation method is capable for the design optimization of the inter-nal cooling system of the vane. Besides, the SOGA is easier torealize and its computational cost is much lower compared withthe MOGA method.
Conclusion
The cooling system optimization of a convectively cooled vaneutilizing the genetic algorithm (GA) and the 3D conjugate heattransfer (CHT) CFD approach is presented in this paper. The opti-mization platform consisted of three parts: An in-house code“Coolmesh” for the parametric design and mesh generation, acommercial CFD solver for the CHT simulation, and the programsdeveloped in MATLAB for controlling the CFD execution and GAsearch. The CFD solver was validated against the experimentaldata.
The optimization was focused on the geometrical design of theimpingement cooling arrangement and pin-fin array, which wererepresented by fourteen design variables, under two engine condi-tions with different thermal loads. The optimization objective wasset as a function of the temperature distribution on the outer walland the coolant mass flow rate formed under a constant pressuredrop. The optimization search of the combination of the designvariables was within a large range to cover ample coolingschemes. Two optimum schemes of cooling structures were foundthrough the GA search and their cooling performance was pre-sented and discussed. Some conclusions can be drawn as follows:
(a) Utilizing the in-house mesh generation tool Coolmesh, theoptimal cooling structure of the vane could be found by theGA optimization search coupled with the 3D CHT CFDapproach.
(b) The boundary conditions could affect the scheme of the op-timum cooling structure. The optimization search couldgive more favorable results under the mediocre thermalload compared with the extreme condition.
(c) The SOGA method was capable for the cooling design opti-mization of the vane when a proper weighted function wasused as the optimization objective. The optimum coolingstructure found by the SOGA search could simultaneouslymeet the design targets on the coolant amount and the walltemperature distribution.
Acknowledgment
This work has been supported by the National Natural ScienceFoundation of China (Project No. 51076076).
Nomenclature
a ¼ thermal diffusivityA ¼ parameter of Nuexp/surface of the vane
a1–4 ¼ parameters of u#1 and u#2
B ¼ parameter of Nuexp
D ¼ diameter/widthh ¼ heat transfer coefficient (HTC)H ¼ impingement distance
Lcav ¼ size of the impingement cavitym ¼ coolant mass flow raten ¼ number of impingement holes
Nu ¼ Nusselt number (¼ hD/k)p ¼ pressureP ¼ pitch of jet array
p* ¼ total pressurePR ¼ pressure ratio (¼ pin /pout)
r ¼ radius of revolutionRe ¼ Reynolds number
S ¼ pitch of the pin-fin arrayT ¼ temperature
T* ¼ total temperatureTu ¼ turbulence intensity
Greek Symbols
a ¼ inlet flow angle of the cascadeg ¼ cooling effectivenessk ¼ thermal conductivityu ¼ optimization objectivex ¼ rotation speed
Subscripts
c ¼ coolant/color changing of the liquid crystalexp ¼ experimental correlations
g ¼ hot gasimp ¼ impingement cooling
in ¼ inlet/cascade stage inletj ¼ time step j
m ¼ bulk flowmax ¼ maximum valueout ¼ outlet/cascade stage outlet
w ¼ wall/outer side of the vanex ¼ chordwisey ¼ spanwise
#1 ¼ Condition no. 1/optimization Run no. 1#2 ¼ Condition no. 2/optimization Run no. 2
Abbreviations
CFD ¼ computational fluid dynamicsCHT ¼ conjugate heat transfer
E3 ¼ energy efficient engineGA ¼ genetic algorithm
HPT ¼ high pressure turbineLE ¼ leading edge
MATLAB ¼ MathWorks Matrix LaboratoryMOGA ¼ multi-objective genetic algorithms
PF ¼ pin-fin arrayPS ¼ pressure side
RANS ¼ Reynolds averaged numerical simulations (steady)SOGA ¼ single objective genetic algorithms
SS ¼ suction sideTE ¼ trailing edge
TLC ¼ transient liquid crystal
References[1] Dulikravich, G. S., Martin, T. J., Dennis, B. H., and Foster, N., 1999,
“Multidisciplinary Hybrid Constrained GA Optimization, Evolutionary Algo-rithms in Engineering and Computer Science,” Recent Advances and Industrial
Fig. 18 Relationship between the coolant amount and theaverage wall temperature of individuals
051008-10 / Vol. 136, MAY 2014 Transactions of the ASME
Downloaded From: http://turbomachinery.asmedigitalcollection.asme.org/ on 04/13/2014 Terms of Use: http://asme.org/terms
Applications, K. Miettinen, M. M. Makela, P. Neittaanmaki, and J. Periaux,eds., Wiley and Sons, New York.
[2] Martin, T. J., and Dulikravich, G. S., 2001, “Aero-Thermo-Elastic ConcurrentOptimization of Internally Cooled Turbine Blades,” Coupled Field Problems,Series of Advances in Boundary Elements, A. Kassab and M. Aliabadi, eds.,WIT, Boston, MA, pp. 137–184.
[3] Martin, T. J., 2001, “Computer-Automated Multi Disciplinary Analysis andDesign Optimization of Internally Cooled Turbine Blades,” Ph.D. thesis, Penn-sylvania State University, University Park, PA.
[4] Talya, S. S., Chattopadhyay, A., and Rajadas, N. J., 2002, “MultidisciplinaryDesign Optimization Procedure for Improved Design of a Cooled Gas TurbineBlade,” Eng. Optimiz., 34, pp. 175–194.
[5] Dennis, B., Egorov-Yegorov, I., Dulikravich, G. S., and Yoshimura, S., 2003,“Optimization of a Large Number Coolant Passages Located Close to the Sur-face of a Turbine Blade,” ASME Paper No. GT2003-38051.
[6] Dennis, B. H., Dulikravich, G. S., Egorov-Yegorov, I. N., and Yoshimura, S.,2005, “Parallel Optimization of 3-D Turbine Blade Cooling Passages,” Evolu-tionary Design Optimization Methods in Aeronautical and Turbomachinery En-gineering, G. Degrez, J. Periaux, and M. Sefrioui, eds., Wiley and Sons, NewYork.
[7] Haasenritter, A., and Weigand, B., 2004, “Optimization of the Rib StructureInside a 2D Cooling Channel,” ASME Paper No. GT2004-53187.
[8] Ruiz, J. D., 2008, “Thermal Design Optimization of Multi-Passage InternallyCooled Turbine Blades,” M.S. thesis, University of Texas at Arlington, Arling-ton, TX.
[9] Amaral, S., Verstraete, T., Braembussche, R. V. D., and Arts, T., 2008, “Designand Optimization of the Internal Cooling Channels of a HP Turbine Blade—Part I: Methodology,” ASME Paper No. GT2008-51077.
[10] Verstraete, T., Amaral, S., Braembussche R. V. D., and Arts, T., 2008, “Designand Optimization of the Internal Cooling Channels of a HP Turbine Blade—Part II: Optimization,” ASME Paper No. GT2008-51079.
[11] Nowak, G., and Wr�oblewski, W., 2009, “Cooling System Optimisation of Tur-bine Guide Vane,” Appl. Therm. Eng., 29, pp. 567–572.
[12] Nowak, G., and Wr�oblewski, W., 2012, “Optimization of Blade Cooling Sys-tem With Use of Conjugate Heat Transfer Approach,” Int. J. Therm. Sci., 50,pp. 1770–1781.
[13] Heidmann, J. D., Kassab, A. J., Divo, E. A., Rodriguez, F., and Steinthorsson,E., 2003, “Conjugate Heat Transfer Effects on a Realistic Film-Cooled TurbineVane,” ASME Paper No. GT2003-38553.
[14] Kusterer, K., Bohn, D., Sugimoto, T., and Tanaka, R., 2004, “Conjugate Calcu-lations for a Film-Cooled Blade Under Different Operating Conditions,” ASMEPaper No. GT2004-53719.
[15] Coletti, F., Scialanga, M., and Arts, T., 2010, “Experimental Investigation ofConjugate Heat Transfer in a Rib-Roughened Trailing Edge Channel WithCrossing-Jets,” ASME Paper No. GT2010-22432.
[16] Chi, Z., Wang, S., Ren, J., and Jiang, H., 2012, “Multi Dimensional Platformfor Heat Transfer Design of Air-Cooled Turbine Blades,” ASME Paper No.GT2012-68675.
[17] Hylton, L. D., Milhec, M. S., Turner, E. R., Nealy, D. A., and York, R. E.,1983, “Analytical and Experimental Evaluation of the Heat Transfer Distribu-tion Over the Surface of Turbine Vanes,” NASA Contractor Report No.168015.
[18] Ricklick, M., 2008, “Effects of Channel Height and Bulk Temperature Consid-erations on Heat Transfer Coefficient of Wetted Surfaces in a Single Inline RowImpingement Channel,” ASME Paper No. HT2008-56323.
[19] Ricklick, M., and Kapat, J. S., 2011, “Determination of a Local BulkTemperature Based Heat Transfer Coefficient for the Wetted Surfaces in aSingle Inline Row Impingement Channel,” ASME J. Turbomach., 133,p. 031008.
[20] Ricklick, M., Claretti, R., and Kapat, J. S., 2010, “Channel Height and Jet Spac-ing Effect on Heat Transfer and Uniformity Coefficient on an Inline RowImpingement Channel,” ASME Paper No. GT2010-23757.
[21] Panda, R. K., Sreekala, P., and Prasad, B. V. S. S., 2010, “Computational andExperimental Study of Conjugate Heat Transfer From a Flat Plate With ShowerHead Impinging Jets,” ASME Paper No. HT2010-49408.
[22] Panda, R. K., and Prasad, B. V. S. S., 2010, “Computational and ExperimentalStudy of Conjugate Heat Transfer From a Flat Plate With an Impinging Jet,”ASME Paper No. HT2010-43994.
[23] Wang, T., Lin, M., and Bunker, R. S., 2005, “Flow and Heat Transfer of Con-fined Impingement Jets Cooling Using a 3-D Transient Liquid Crystal Scheme,”Int. J. Heat Mass Transfer, 48, pp. 4887–4903.
[24] Xing, Y., and Weigand, B., 2010, “Experimental Investigation of ImpingementHeat Transfer on a Flat and Dimpled Plate With Different Crossflow Schemes,”Int. J. Heat Mass Transfer, 53, pp. 3874–3886.
[25] Xing, Y., Spring, S., and Weigand, B., 2010, “Experimental and NumericalInvestigation of Heat Transfer Characteristics of Inline and Staggered Arrays ofImpinging Jets,” ASME J. Heat Transfer, 132, p. 092201.
[26] Vogel, G., and Weigand, B., 2001, “A New Evaluation Method for TransientLiquid Crystal Experiments,” ASME Paper No. HT2001-20250.
[27] Florschuetz, L. W., and Metzger, D. E., 1981, “Jet Array Impingement WithCross Flow-Correlation of Streamwise Resolved Flow and Heat TransferDistributions,” NASA Contractor Report No. 3373.
[28] Goldberg, D. E., 1989, Genetic Algorithms in Search, Optimization andMachine Learning, Addison-Wesley Longman, New York.
Journal of Turbomachinery MAY 2014, Vol. 136 / 051008-11
Downloaded From: http://turbomachinery.asmedigitalcollection.asme.org/ on 04/13/2014 Terms of Use: http://asme.org/terms