Embed Size (px)
Citation preview
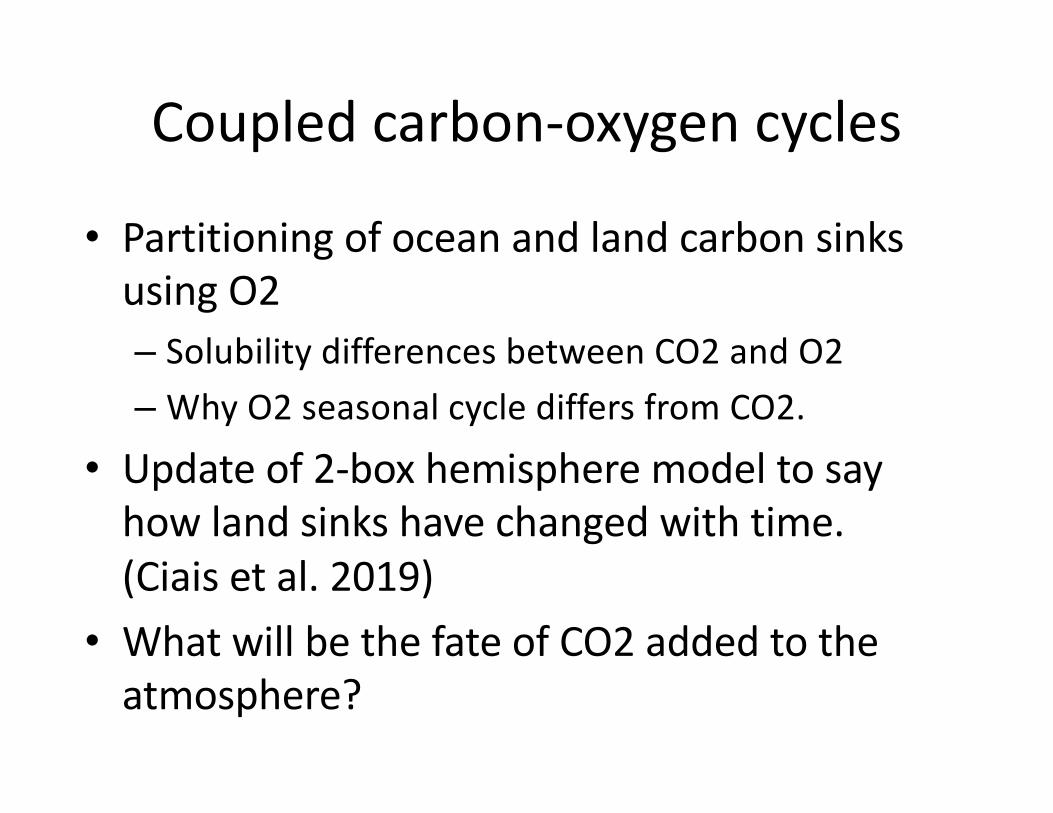
Coupled carbon-oxygen cycles
• Partitioning of ocean and land carbon sinks using O2– Solubility differences between CO2 and O2– Why O2 seasonal cycle differs from CO2.
• Update of 2-box hemisphere model to say how land sinks have changed with time. (Ciais et al. 2019)
• What will be the fate of CO2 added to the atmosphere?

CO2 + H2O = H2CO3
Atmosphere~800CO2
Fossil Resources4300
Organic C
Ocean ~35,000 DIC~1000 DOC
Plants: ~600Soils: ~2000-3000Organic C
CO2 + H2O = H2CO3 H2CO3 = H+ +
HCO3-
HCO3- = H+ + CO3
2-
We count carbon in units of Petagrams – 1 PgC = 1 billion tons or 1015 grams C
carbonate rocks : 60,000,000Kerogen: 15,000,000

CO2 + H2O = H2CO3
Respiration + Decomposition + Fire~120 PgC/yr
Photosynthesis~120 PgC/yr
Dissolution/Gas exchange~70 PgC/yr
Fossil fuels form very slowly(<0.01% of C fixed every year)
The natural Carbon cycle involves exchanges between land, air, ocean and transformations between organic and inorganic forms
CO2 + H2O = H2CO3 H2CO3 = H+ + HCO3
-
HCO3- = H+ + CO3
2-
sedimentation,diagenesis
weathering River transport


CO2 + H2O = H2CO3
Respiration + Decomposition~120 PgC/yr
Photosynthesis~120 PgC/yr
Dissolution/Gas exchange~100 PgC/yr
CO2 + H2O = H2CO3 H2CO3 = H+ + HCO3
-
HCO3- = H+ + CO3
2-
Fossil fuel burning~10 PgC/yr now~350 PgC since 1750
Deforestation ~1-2 PgC/yr~200 PgC since 1750
sedimentation,diagenesissedimentation,diagenesis
weathering River transport
Modern Carbon Cycle (changes every year….)


Only about ~55% of fossil fuel emitted to the atmosphere each year accumulates there - where does the rest go?
Slide from Ralph Keeling Scripps Inst. oceanography


Updated from Le Quéré et al. 2009, Nature Geoscience; Data: NOAA 2010, CDIAC 2010
Key Diagnostic of the Carbon CycleEvolution of the fraction of total emissions that remain in the atmosphere
Total CO2 emissions
Atmosphere
CO2
Partit
ioning
(PgC
y-1)
1960 20101970 1990 20001980
10
8
6
4
2
Time (y)
Rate ofCO2increase

Interhemispheric gradient depends on gradient of sources in the absence of sinks
(see model – you can also access this from the web site but have to download Wolfram player)

29%11.6 GtCO2/yr
Fate of anthropogenic CO2 emissions (2008–2017)
Source: CDIAC; NOAA-ESRL; Houghton and Nassikas 2017; Hansis et al 2015; Le Quéré et al 2018; Global Carbon Budget 2018
22%8.9 GtCO2/yr
34.4 GtCO2/yr
87%
13%5.3 GtCO2/yr
17.3 GtCO2/yr
44%
Sources = Sinks
5%1.9 GtCO2/yr
Budget Imbalance: (the difference between estimated sources & sinks)

Ocean CO2 sinks: Dissolution in seawater expected + possibly changes in ocean productivity
These are estimated using models that are tested against observations
Surface waters equilibrate quickly; CO2 reacts with water
Falling particles move organic carbon into the deep ocean
Sinking waters in polar regions isolate water that has equilibrated at the surface (cold waters)
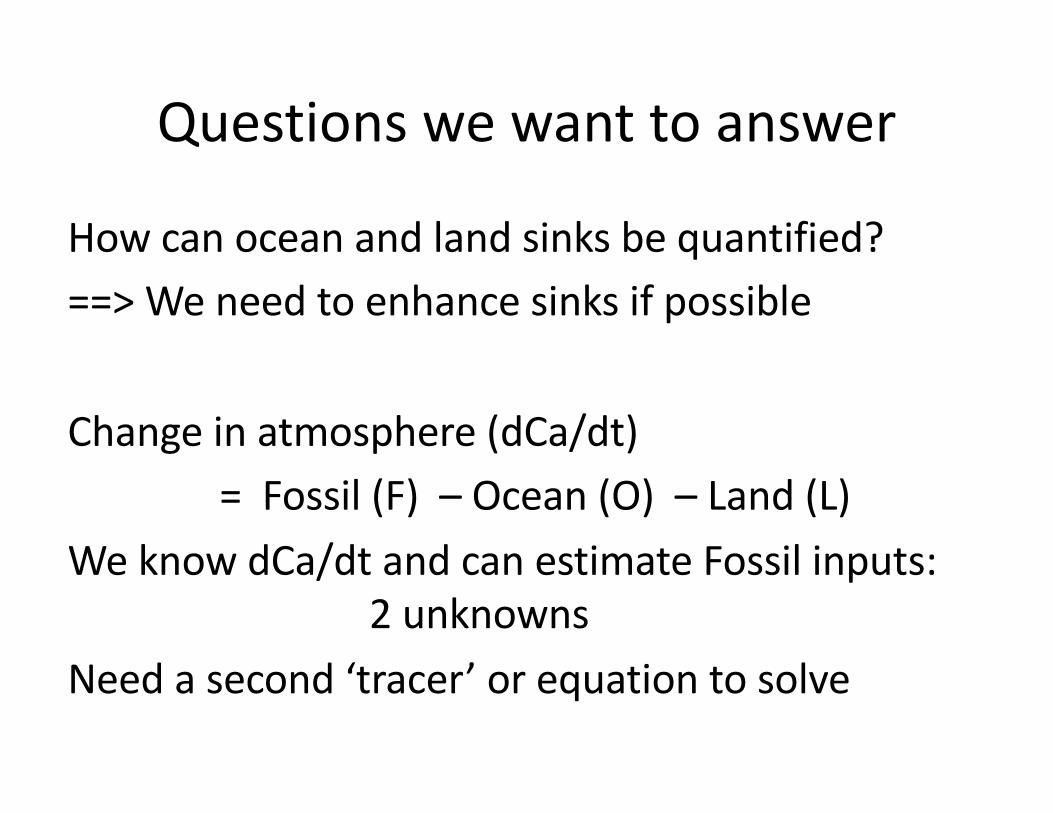
Questions we want to answer
How can ocean and land sinks be quantified? ==> We need to enhance sinks if possible
Change in atmosphere (dCa/dt)= Fossil (F) – Ocean (O) – Land (L)
We know dCa/dt and can estimate Fossil inputs: 2 unknowns
Need a second ‘tracer’ or equation to solve
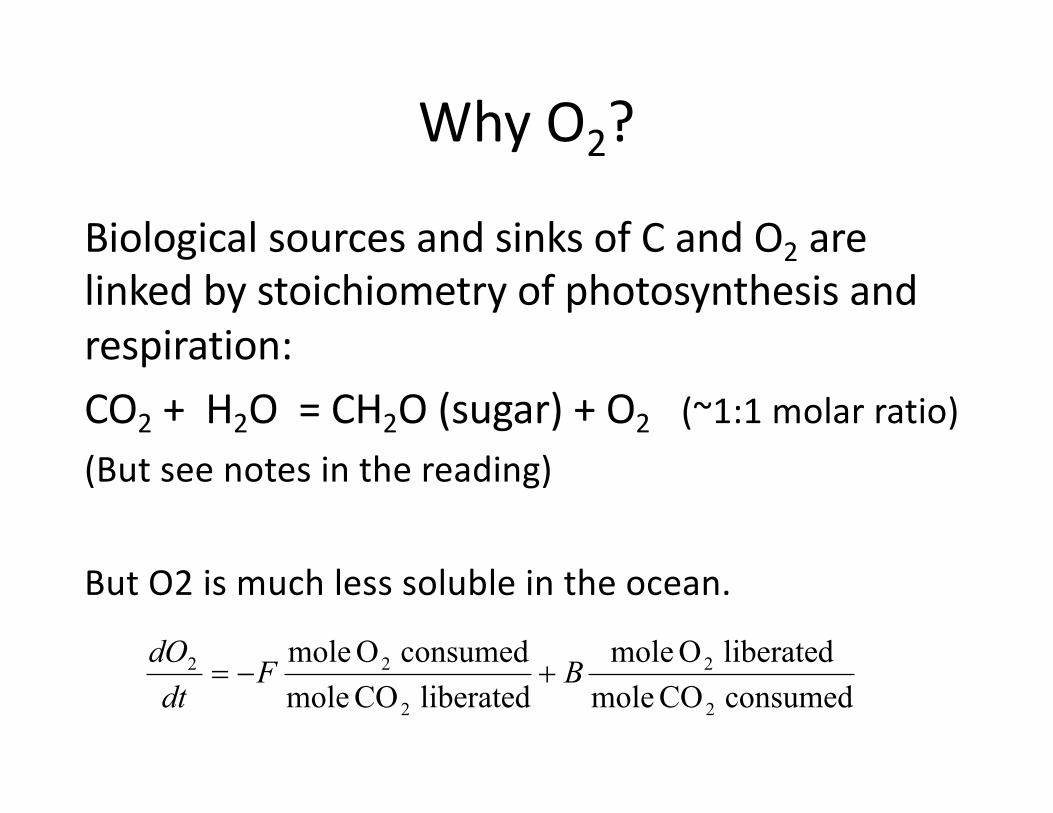
Why O2?
Biological sources and sinks of C and O2 are linked by stoichiometry of photosynthesis and respiration:CO2 + H2O = CH2O (sugar) + O2 (~1:1 molar ratio)(But see notes in the reading)
But O2 is much less soluble in the ocean.
consumed CO moleliberated O mole
liberated CO moleconsumed O mole
2
2
2
22 BFdtdO
+-=
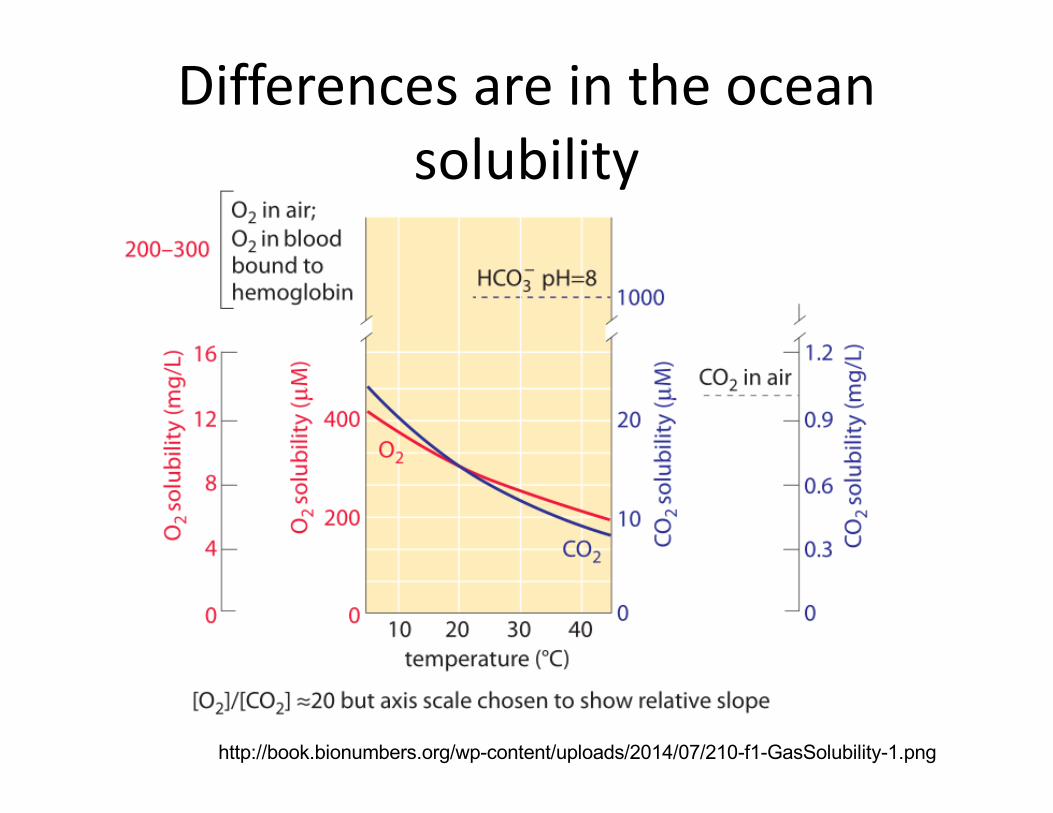
Differences are in the ocean solubility
http://book.bionumbers.org/wp-content/uploads/2014/07/210-f1-GasSolubility-1.png

Global O2 cycle gives us a second equation(dCO2/dt) = F - O - L(dO2/dt) = -1.3 F + 1.1 L
Factors 1.4 and 1.1 come from stoichiometry (that adds uncertainty

"CO2 pump hg" by derivative work: McSush (talk)CO2_pump_hg.png: Hannes Grobe 21:52, 12 August 2006 (UTC), Alfred Wegener Institute for Polar and Marine Research, Bremerhaven, Germany - CO2_pump_hg.png. Licensed under CC BY-SA 2.5 via Wikimedia Commons -http://commons.wikimedia.org/wiki/File:CO2_pump_hg.svg#/media/File:CO2_pump_hg.svg

Depth distribution of O2 reflects biological and solubility pump effects

We will come back to this later – the distribution of O2 in the ocean is related to biology but also to water temperature; solubility is higher in cold water.
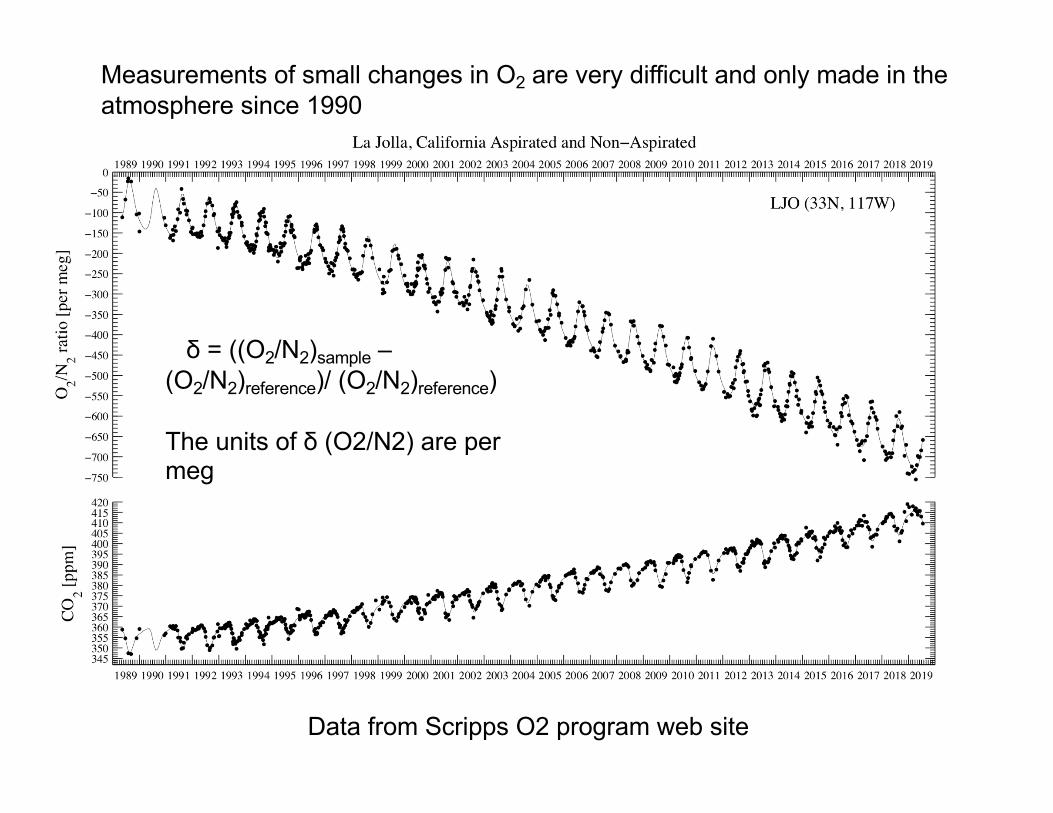
Data from Scripps O2 program web site
δ = ((O2/N2)sample –(O2/N2)reference)/ (O2/N2)reference)
The units of δ (O2/N2) are per meg
Measurements of small changes in O2 are very difficult and only made in the atmosphere since 1990

Fossil fuel burningSlope is -1.3 mole O2consumed per mole CO2producedBiosphere uptake, loss will have the same slope
Land uptakeSlope is +1.1 mole O2produced per mole C removed from the atmosphere by plants
Ocean uptake –why is the slope zero?
Outgassing – as the ocean warms, what happens to the solubility of O2?
Observation: O2 decline in the atmosphere is faster than expected from CO2increase alone
IPCCBased on on Keeling 1996

-900
-800
-700
-600
-500
-400
-300
-200
-100
300 400 500 600
O =121 PgB = 37 Pg
F = 232 Pg C
A = 55 Pg C
Updated to 2019 Does not add up because:- no ocean warming correction (what will this do?)- possible errors in slopes for fossil fuel (1.3) and
biosphere (1.1) stoichiometry
O2/N2 ratio(per meg)
CO2 (ppm)
Slope = -1.3*F
Slope = -1.1*F
Slope = 0


Where is the C being taken up?Interhemispheric gradient indicates
northern hemisphere
Interhemispheric gradient in CO2 is less than expected based on emissions–implies additional uptake of CO2beyond what is dissolving in oceans.
Model prediction
Observations
Tans, Fung and Takahaski 1990, Science

CNCS t
F
FS LNLS ONOS
Fossil fuel sources (N, S)L Biosphere (N, S)O Ocean sinks (N, S)C Atmospheric CO2 (N, S)
Two Box Model of the atmosphereInterhemispheric Gradient of CO2
FN
a = 1.06 PgC/ppm
See Ciais et al. Nature 2019

Observed gradient
Gradient predicted just from fossil fuel inputs

Fossil emissions mostly in NH

Ocean uptake larger in NH, increasing with time in models
Resulting Land sink in North Hemisphere – increasing with time

DpCO2 (seawater-air); Upwelling Zones andRegions of Biological Productivity are Evident
Takahashi et al. (1997)

What will be the fate of fossil fuel CO2?
• Revelle factor• Controls on different timescales
dissolution in surface ocean (pH concerns)transport by biological pump into deep oceanthermohaline circulation into deep oceandissolution of CaCO3 in ocean sedimentsincreased weathering
See http://climatemodels.uchicago.edu/geocarb/


Revelle Factor
Low latitudes haveHigher CO3
2-
And lower R factor
CO2 increases by ~10% when DIC increases by ~1%

If we add 500 Pg C to the atmopshere, how much will by the surface ocean and how much will remain in the atmosphere? (best estimate currently is ~400 Pg C burned).
Revelle factor (DpCO2/pCO2)/(DDIC/DIC) ~10 - this is the “buffering” of the ocean by the carbonate system
If you equilibrate with just the surface ocean (~1020 PgC as DIC)
DpCO2 = pCO2* 10 *(DDIC/DIC); DpCO2 = 6(DDIC)
For the deep ocean (38,000 PgC = DIC); DpCO2 = 0.11DDIC
But mass balance says change in the ocean DIC plus change in the atmosphere must equal 500 PgC; i.e. DDIC + DpCO2 = 500PgCSo
for pCO2 = 480 and DIC = 1020;
DpCO2 (1+1/6) = 500; DpCO2 = 430 PgC
For DIC = 38,000 (i.e. equilibrate with whole ocean),DpCO2 (1+1/.11) = 500; DpCO2 = 50 PgC

Sabine et al.
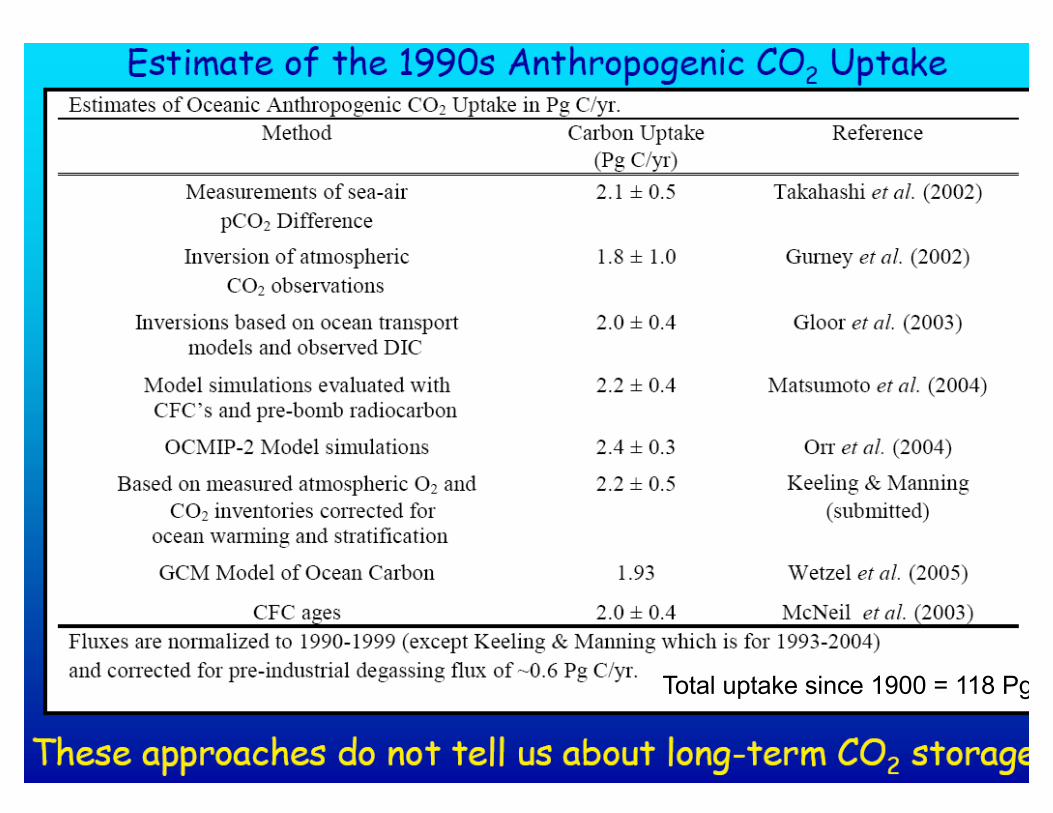
Total uptake since 1900 = 118 Pg

Orr et al. pH will change as pCO2 increases


Feedbacks – net short-term effect will be Positive (as CO2 increases, capacity to absorb CO2 decreases