Embed Size (px)
Citation preview
2/19/2015
1
Chapter 1 Introduction to Quality
University of Hail College of Engineering
ISE 320 - Quality Control and Industrial Statistics
Prof. Mohamed AichouniProf. Mohamed Aichouni
Chapter 1 Introduction to Quality
Lectures notes adapted from: PowerPoint presentation to accompanyBesterfield, Quality Improvement, 9th edition
Course Webpage: faculty.uoh.edu.sa/m.aichouni/ise320-quality/
Lectures notes adapted from: PowerPoint presentation to accompanyBesterfield, Quality Improvement, 9th edition
Course Webpage: faculty.uoh.edu.sa/m.aichouni/ise320-quality/
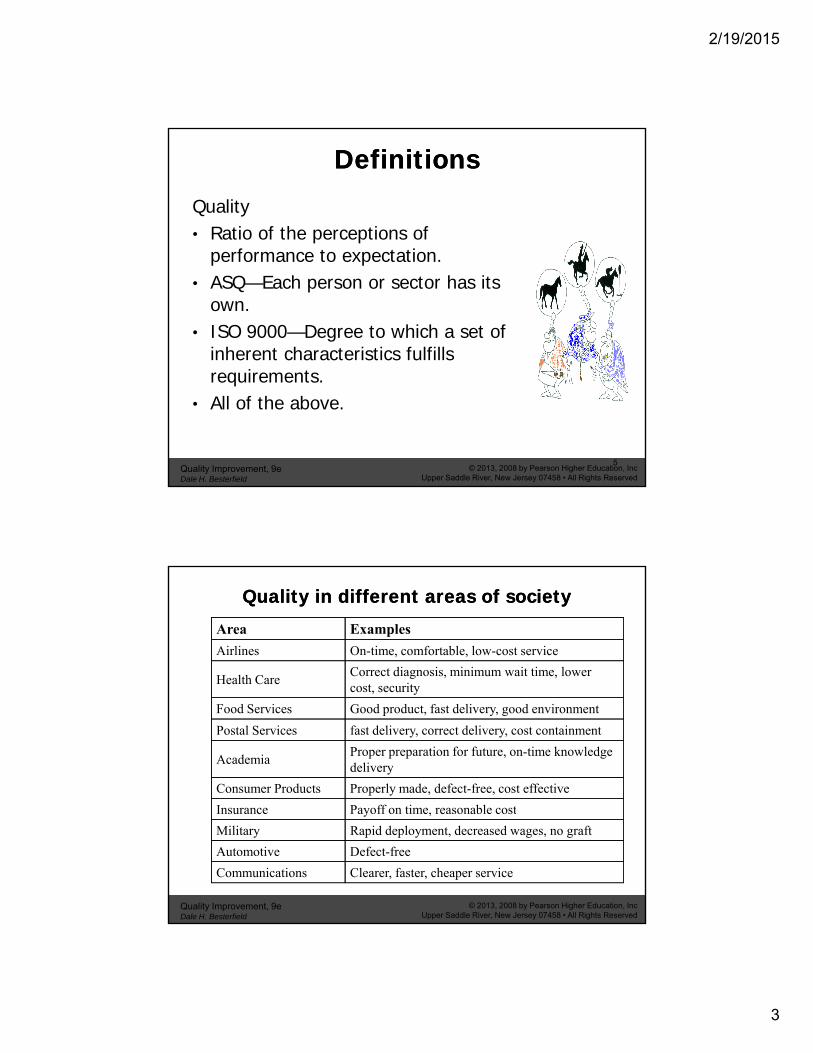
Course OutlineCourse Outline1. Introduction to quality control and
process improvement. f ff f2. Cost of quality and the effects of
quality on productivity. 3. Concepts of variation. Statistical
process control (SPC tools). 4. Control charts for variables
Quality Improvement, 9eDale H. Besterfield
© 2013, 2008 by Pearson Higher Education, IncUpper Saddle River, New Jersey 07458 • All Rights Reserved
2
5. Control charts for attributes (applications in process control).

2/19/2015
2
Course OutlineCourse Outline
6. Process capability studies. 7 Acceptance sampling7. Acceptance sampling. 8. Case studies in applied quality control
Quality Improvement, 9eDale H. Besterfield
© 2013, 2008 by Pearson Higher Education, IncUpper Saddle River, New Jersey 07458 • All Rights Reserved
3
Learning ObjectivesLearning ObjectivesWhen you have completed this chapter you should be able to:
Define quality, quality control, quality improvement, statistical quality control, quality assurance, and process.
Be able to describe FMEA, QFD, ISO 9000, ISO
Quality Improvement, 9eDale H. Besterfield
© 2013, 2008 by Pearson Higher Education, IncUpper Saddle River, New Jersey 07458 • All Rights Reserved
4
Be able to describe FMEA, QFD, ISO 9000, ISO 14000, Benchmarking, TPM, Quality by Design, Products Liability, and IT
2/19/2015
3
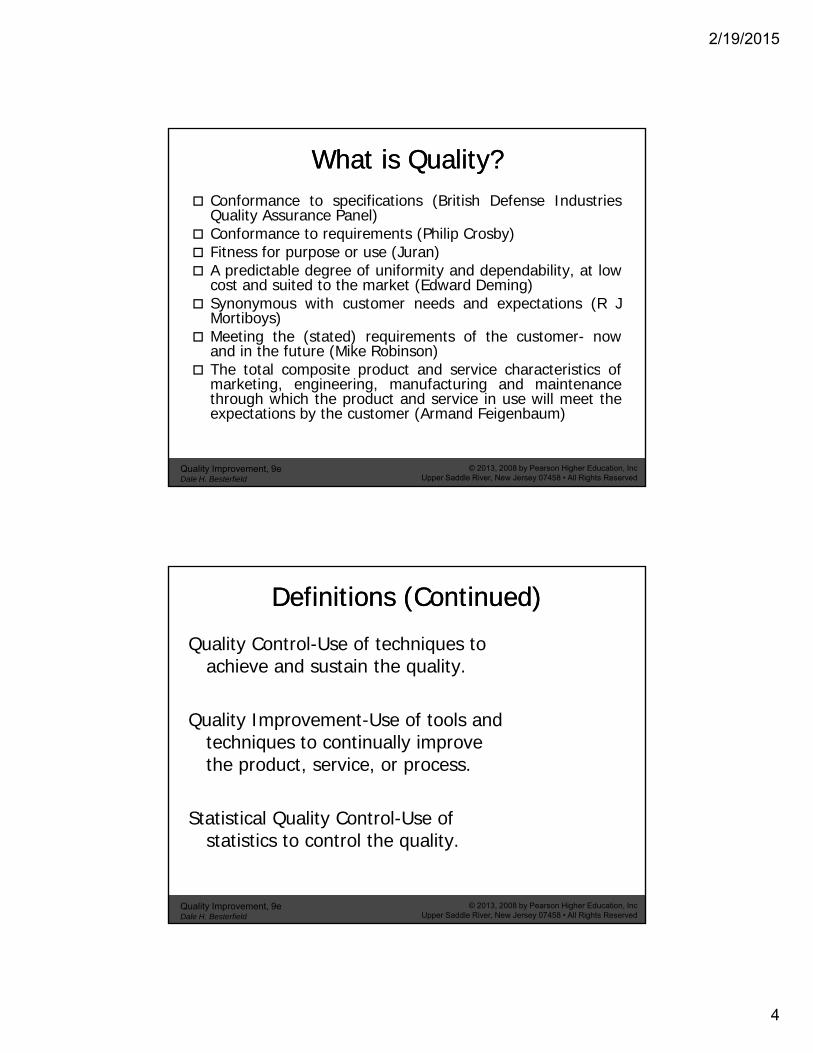
Definitions Definitions Quality• Ratio of the perceptions of
fperformance to expectation.• ASQ—Each person or sector has its
own.• ISO 9000—Degree to which a set of
inherent characteristics fulfills
Quality Improvement, 9eDale H. Besterfield
© 2013, 2008 by Pearson Higher Education, IncUpper Saddle River, New Jersey 07458 • All Rights Reserved
5
requirements.• All of the above.
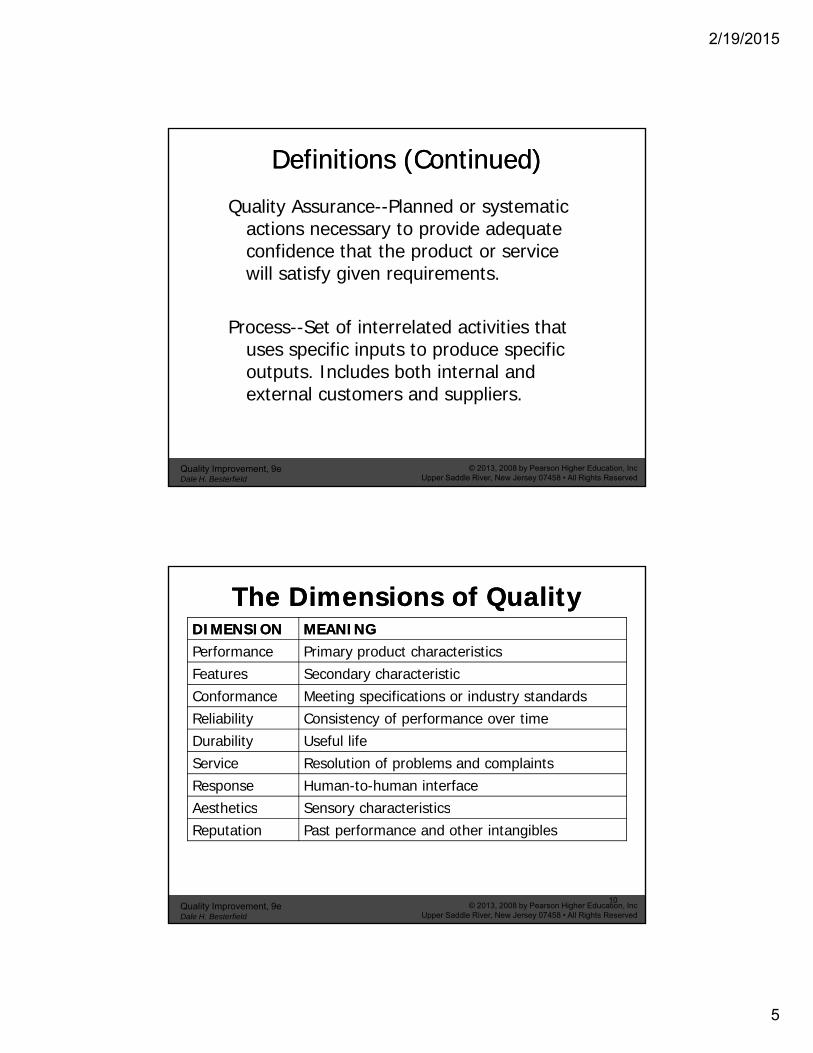
Quality in different areas of societyQuality in different areas of societyArea Examples
Airlines On-time, comfortable, low-cost service
Health CareCorrect diagnosis, minimum wait time, lower
t itcost, security
Food Services Good product, fast delivery, good environment
Postal Services fast delivery, correct delivery, cost containment
AcademiaProper preparation for future, on-time knowledge delivery
Consumer Products Properly made, defect-free, cost effective
ff i bl
Quality Improvement, 9eDale H. Besterfield
© 2013, 2008 by Pearson Higher Education, IncUpper Saddle River, New Jersey 07458 • All Rights Reserved
Insurance Payoff on time, reasonable cost
Military Rapid deployment, decreased wages, no graft
Automotive Defect-free
Communications Clearer, faster, cheaper service
2/19/2015
4
What is Quality?What is Quality? Conformance to specifications (British Defense Industries
Quality Assurance Panel) Conformance to requirements (Philip Crosby)
Fit f (J ) Fitness for purpose or use (Juran) A predictable degree of uniformity and dependability, at low
cost and suited to the market (Edward Deming) Synonymous with customer needs and expectations (R J
Mortiboys) Meeting the (stated) requirements of the customer- now
and in the future (Mike Robinson) The total composite product and service characteristics of
Quality Improvement, 9eDale H. Besterfield
© 2013, 2008 by Pearson Higher Education, IncUpper Saddle River, New Jersey 07458 • All Rights Reserved
The total composite product and service characteristics ofmarketing, engineering, manufacturing and maintenancethrough which the product and service in use will meet theexpectations by the customer (Armand Feigenbaum)
Definitions (Continued)Definitions (Continued)Quality Control-Use of techniques to
achieve and sustain the quality.
Quality Improvement-Use of tools and techniques to continually improve the product, service, or process.
Quality Improvement, 9eDale H. Besterfield
© 2013, 2008 by Pearson Higher Education, IncUpper Saddle River, New Jersey 07458 • All Rights Reserved
Statistical Quality Control-Use of statistics to control the quality.
2/19/2015
5
Definitions (Continued)Definitions (Continued)Quality Assurance--Planned or systematic
actions necessary to provide adequate confidence that the product or serviceconfidence that the product or service will satisfy given requirements.
Process--Set of interrelated activities that uses specific inputs to produce specific
t t I l d b th i t l d
Quality Improvement, 9eDale H. Besterfield
© 2013, 2008 by Pearson Higher Education, IncUpper Saddle River, New Jersey 07458 • All Rights Reserved
outputs. Includes both internal and external customers and suppliers.
The Dimensions of QualityThe Dimensions of QualityDIMENSIONDIMENSION MEANINGMEANINGPerformance Primary product characteristicsFeatures Secondary characteristicConformance Meeting specifications or industry standardsReliability Consistency of performance over timeDurability Useful lifeService Resolution of problems and complaintsResponse Human-to-human interfaceAesthetics Senso cha acte istics
Quality Improvement, 9eDale H. Besterfield
© 2013, 2008 by Pearson Higher Education, IncUpper Saddle River, New Jersey 07458 • All Rights Reserved
10
Aesthetics Sensory characteristicsReputation Past performance and other intangibles
2/19/2015
6
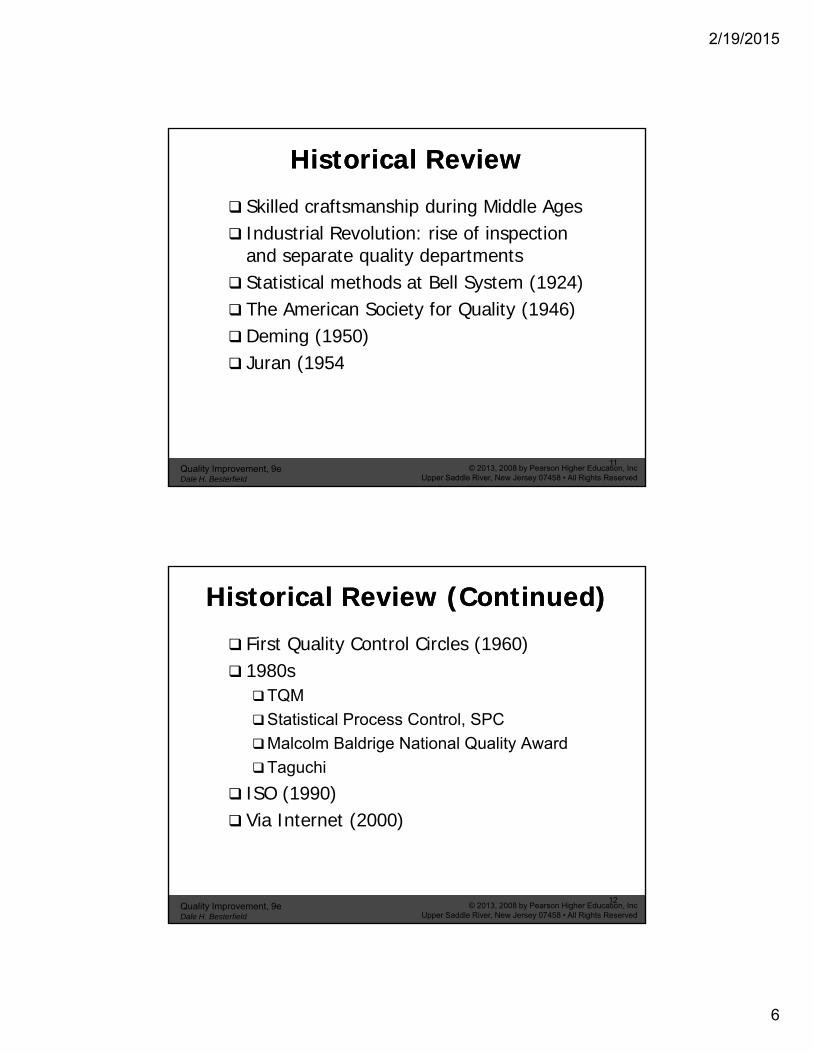
Historical ReviewHistorical Review Skilled craftsmanship during Middle Ages Industrial Revolution: rise of inspection
and separate quality departments Statistical methods at Bell System (1924) The American Society for Quality (1946) Deming (1950) Juran (1954
Quality Improvement, 9eDale H. Besterfield
© 2013, 2008 by Pearson Higher Education, IncUpper Saddle River, New Jersey 07458 • All Rights Reserved
11
Juran (1954
Historical Review (Continued)Historical Review (Continued) First Quality Control Circles (1960) 1980sTQM
Statistical Process Control, SPC
Malcolm Baldrige National Quality Award
Taguchi
ISO (1990)
Quality Improvement, 9eDale H. Besterfield
© 2013, 2008 by Pearson Higher Education, IncUpper Saddle River, New Jersey 07458 • All Rights Reserved
12
Via Internet (2000)
2/19/2015
7
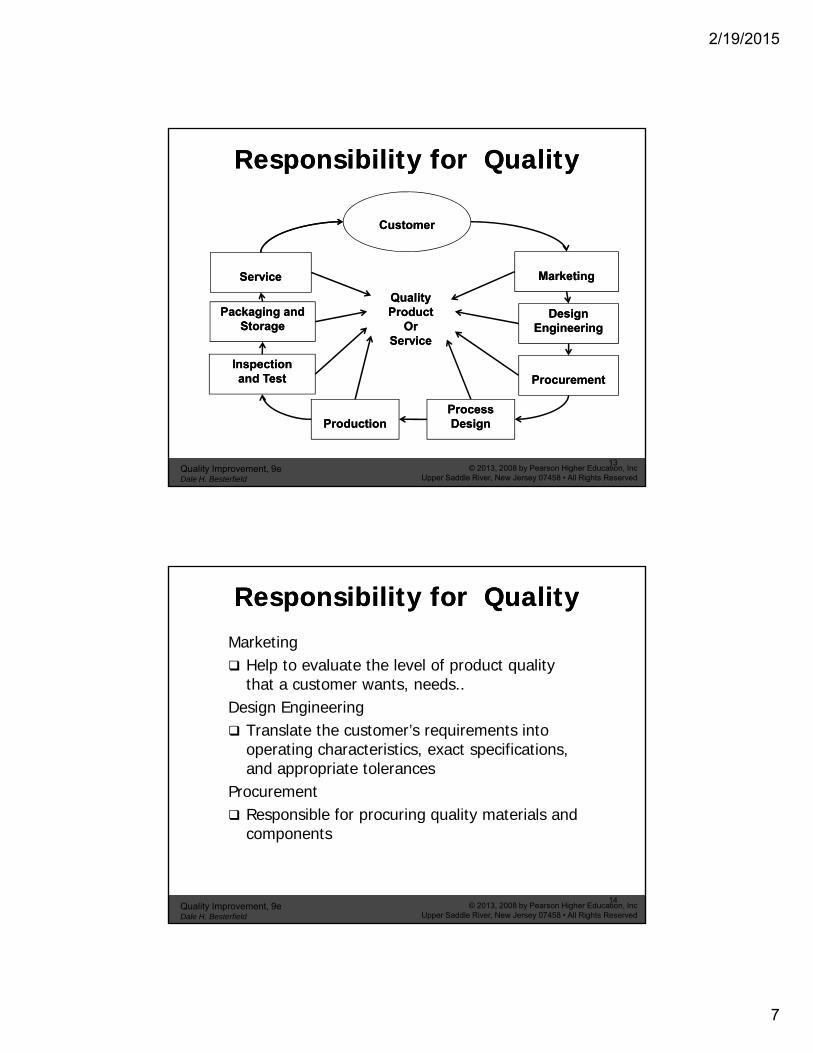
Responsibility for QualityResponsibility for Quality
CustomerCustomer
ServiceService
Packaging andPackaging andStorageStorage
InspectionInspection
DesignDesignEngineeringEngineering
MarketingMarketing
QualityQualityProductProduct
OrOrServiceService
Quality Improvement, 9eDale H. Besterfield
© 2013, 2008 by Pearson Higher Education, IncUpper Saddle River, New Jersey 07458 • All Rights Reserved
13
InspectionInspectionand Testand Test
ProductionProductionProcessProcessDesignDesign
ProcurementProcurement
Responsibility for QualityResponsibility for QualityMarketing Help to evaluate the level of product quality
that a customer wants needsthat a customer wants, needs.. Design Engineering Translate the customer’s requirements into
operating characteristics, exact specifications, and appropriate tolerances
Procurement
Quality Improvement, 9eDale H. Besterfield
© 2013, 2008 by Pearson Higher Education, IncUpper Saddle River, New Jersey 07458 • All Rights Reserved
14
Responsible for procuring quality materials and components
2/19/2015
8
Responsibility for Quality Responsibility for Quality (Continued)(Continued)
Process Design Develops processes and procedures
that will produce a quality product/servicethat will produce a quality product/serviceProduction Produce quality products and servicesInspection and Test Appraise the quality of purchased and
manufactured items and to report the results
Quality Improvement, 9eDale H. Besterfield
© 2013, 2008 by Pearson Higher Education, IncUpper Saddle River, New Jersey 07458 • All Rights Reserved
15
a u a u d a d o po u
Responsibility for Quality Responsibility for Quality (Continued)(Continued)
Packaging and Storage Preserve and protect the quality of the productInspection and Test Appraise the quality of purchased and
manufactured items and to report the resultsService Fully realizing the intended function of the
Quality Improvement, 9eDale H. Besterfield
© 2013, 2008 by Pearson Higher Education, IncUpper Saddle River, New Jersey 07458 • All Rights Reserved
16
Fully realizing the intended function of the product during its expected life
2/19/2015
9
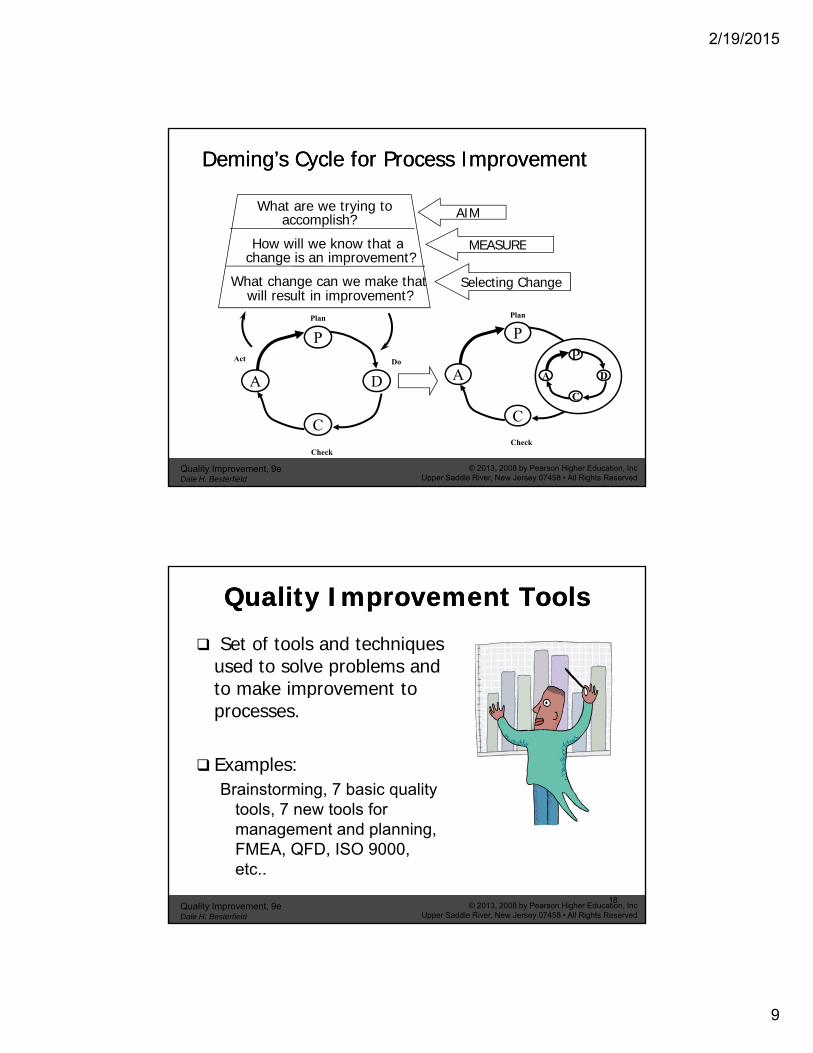
Deming’s Cycle for Process ImprovementDeming’s Cycle for Process Improvement
What are we trying toaccomplish?
How will we know that a
AIM
MEASURE
Act
P
Plan
Do
PPlan
DoP
How will we know that achange is an improvement?
MEASURE
What change can we make thatwill result in improvement?
Selecting Change
Quality Improvement, 9eDale H. Besterfield
© 2013, 2008 by Pearson Higher Education, IncUpper Saddle River, New Jersey 07458 • All Rights Reserved
A D
C
Check
A D
C
Check
A D
C
Quality Improvement ToolsQuality Improvement Tools Set of tools and techniques
used to solve problems and to make improvement toto make improvement to processes.
Examples:Brainstorming, 7 basic quality
t l 7 t l f
Quality Improvement, 9eDale H. Besterfield
© 2013, 2008 by Pearson Higher Education, IncUpper Saddle River, New Jersey 07458 • All Rights Reserved
18
tools, 7 new tools for management and planning, FMEA, QFD, ISO 9000, etc..
2/19/2015
10
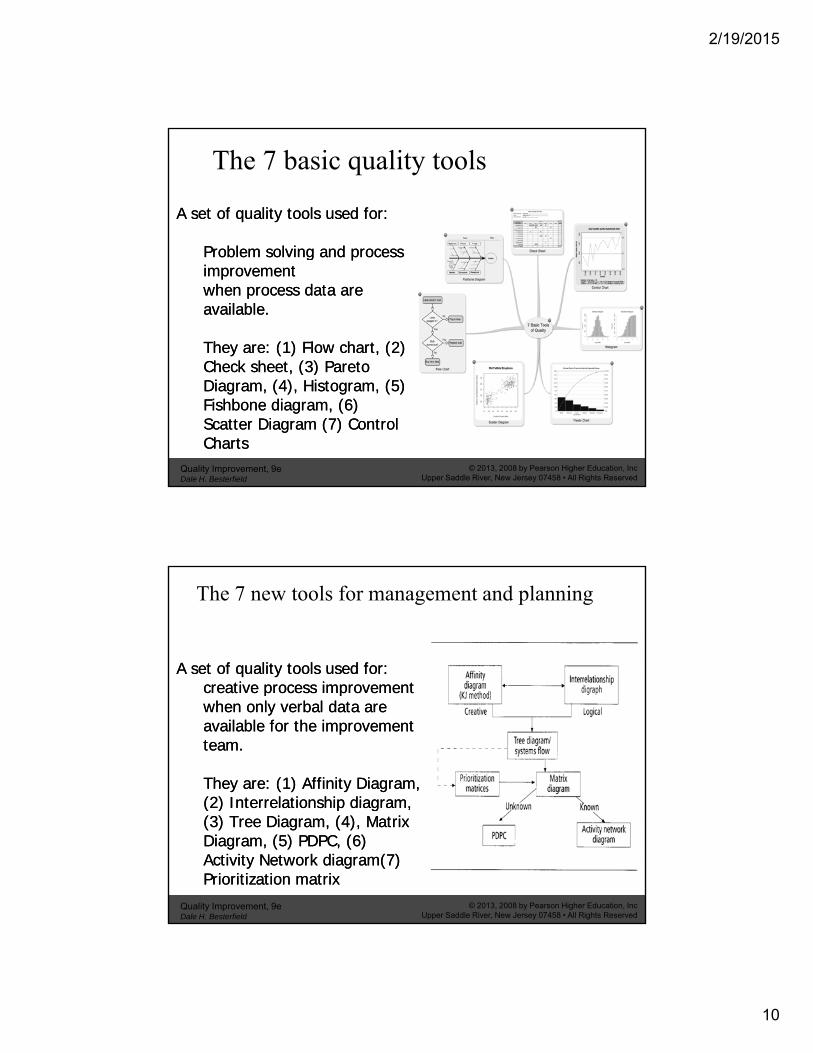
A set of quality tools used for:A set of quality tools used for:
P bl l i dP bl l i d
The 7 basic quality tools
Problem solving and process Problem solving and process improvement improvement when process data are when process data are available.available.
They are: They are: ((11) Flow chart, () Flow chart, (22) ) Check sheet (Check sheet (33) Pareto) Pareto
Quality Improvement, 9eDale H. Besterfield
© 2013, 2008 by Pearson Higher Education, IncUpper Saddle River, New Jersey 07458 • All Rights Reserved
Check sheet, (Check sheet, (33) Pareto ) Pareto Diagram, (Diagram, (44), Histogram, (), Histogram, (55) ) Fishbone diagram, (Fishbone diagram, (66) ) Scatter Diagram (Scatter Diagram (77) Control ) Control Charts Charts
A set of quality tools used for:A set of quality tools used for:creative process improvementcreative process improvement
The 7 new tools for management and planning
creative process improvement creative process improvement when only verbal data are when only verbal data are available for the improvement available for the improvement team.team.
They are: They are: ((11) Affinity Diagram, ) Affinity Diagram, ((22) Interrelationship diagram) Interrelationship diagram
Quality Improvement, 9eDale H. Besterfield
© 2013, 2008 by Pearson Higher Education, IncUpper Saddle River, New Jersey 07458 • All Rights Reserved
((22) Interrelationship diagram, ) Interrelationship diagram, ((33) Tree Diagram, () Tree Diagram, (44), Matrix ), Matrix Diagram, (Diagram, (55) PDPC, () PDPC, (66) ) Activity Network diagram(Activity Network diagram(77) ) Prioritization matrixPrioritization matrix
2/19/2015
11
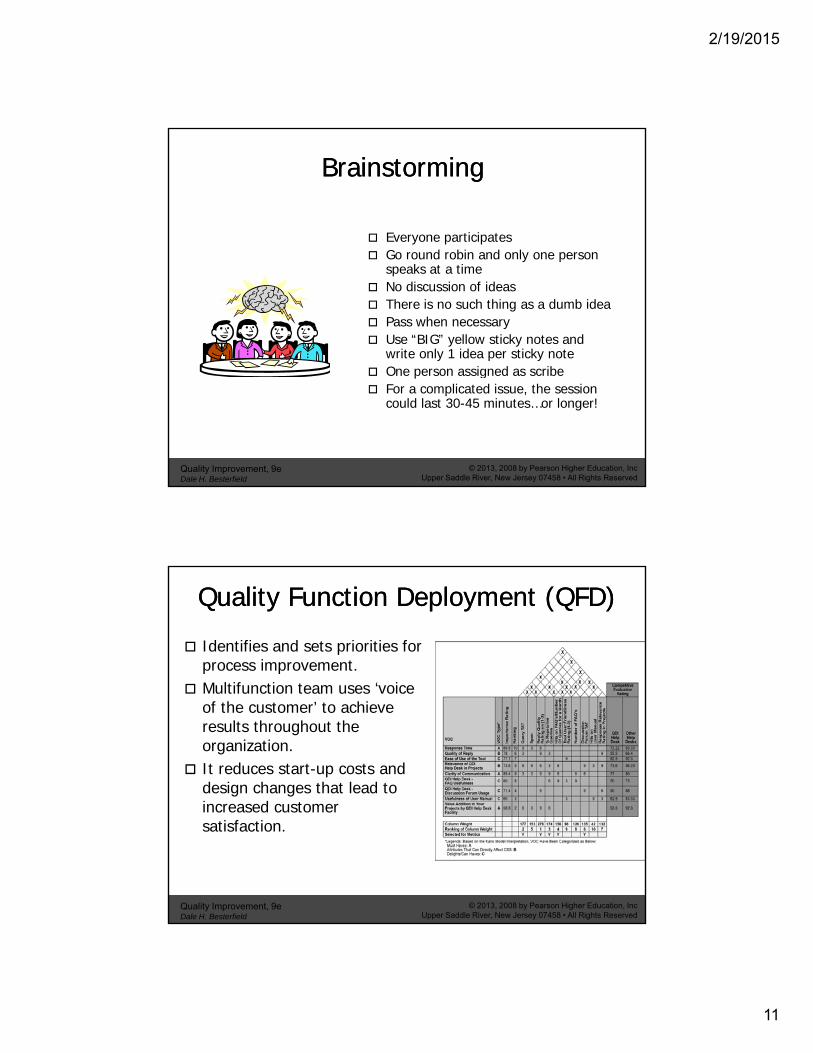
BBrainstormingrainstorming
Everyone participates Go round robin and only one person
speaks at a time No discussion of ideas There is no such thing as a dumb idea Pass when necessary Use “BIG” yellow sticky notes and
write only 1 idea per sticky noteO i d ib
Quality Improvement, 9eDale H. Besterfield
© 2013, 2008 by Pearson Higher Education, IncUpper Saddle River, New Jersey 07458 • All Rights Reserved
One person assigned as scribe For a complicated issue, the session
could last 30-45 minutes…or longer!
Quality Function Deployment (QFD)Quality Function Deployment (QFD) Identifies and sets priorities for
process improvement. Multifunction team uses ‘voice Multifunction team uses ‘voice
of the customer’ to achieve results throughout the organization.
It reduces start-up costs and design changes that lead to increased customer
Quality Improvement, 9eDale H. Besterfield
© 2013, 2008 by Pearson Higher Education, IncUpper Saddle River, New Jersey 07458 • All Rights Reserved
increased customer satisfaction.
2/19/2015
12
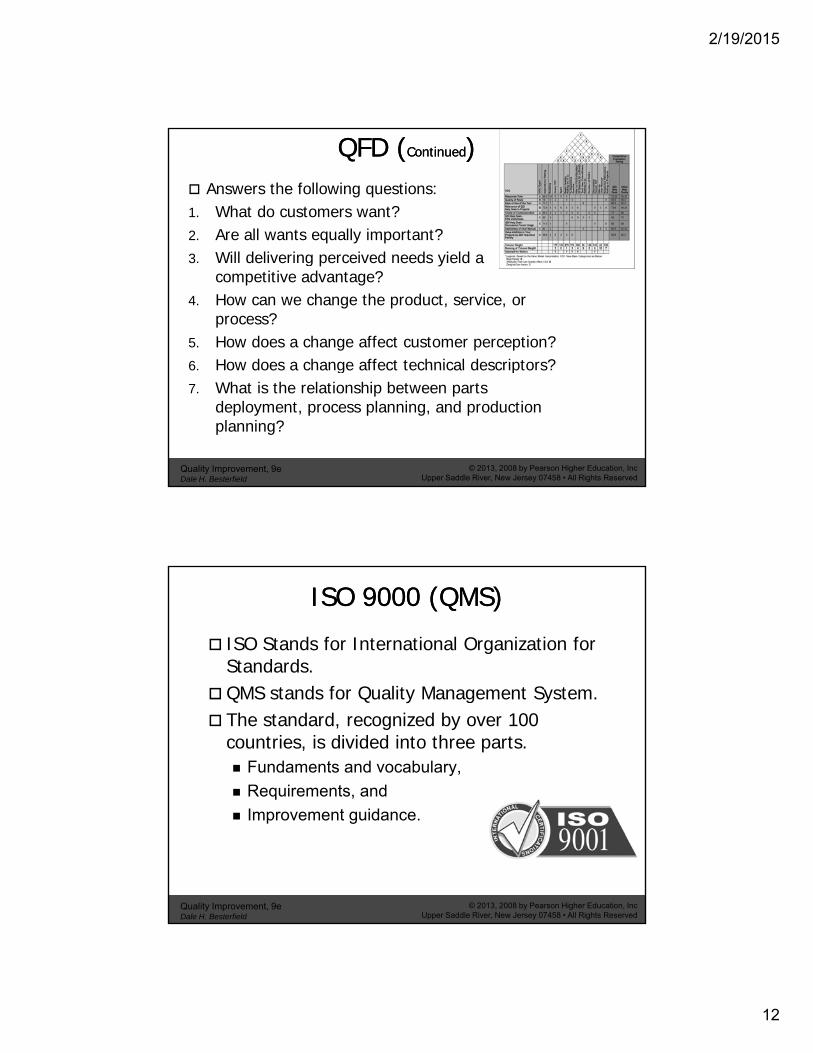
QFD (QFD (ContinuedContinued)) Answers the following questions:1. What do customers want?2. Are all wants equally important?3. Will delivering perceived needs yield a
competitive advantage?4. How can we change the product, service, or
process?5. How does a change affect customer perception? 6 How does a change affect technical descriptors?
Quality Improvement, 9eDale H. Besterfield
© 2013, 2008 by Pearson Higher Education, IncUpper Saddle River, New Jersey 07458 • All Rights Reserved
6. How does a change affect technical descriptors? 7. What is the relationship between parts
deployment, process planning, and production planning?
ISO ISO 9000 9000 (QMS)(QMS) ISO Stands for International Organization for
Standards.fQMS stands for Quality Management System.
The standard, recognized by over 100 countries, is divided into three parts. Fundaments and vocabulary,
Requirements, and
Quality Improvement, 9eDale H. Besterfield
© 2013, 2008 by Pearson Higher Education, IncUpper Saddle River, New Jersey 07458 • All Rights Reserved
Improvement guidance.
2/19/2015
13
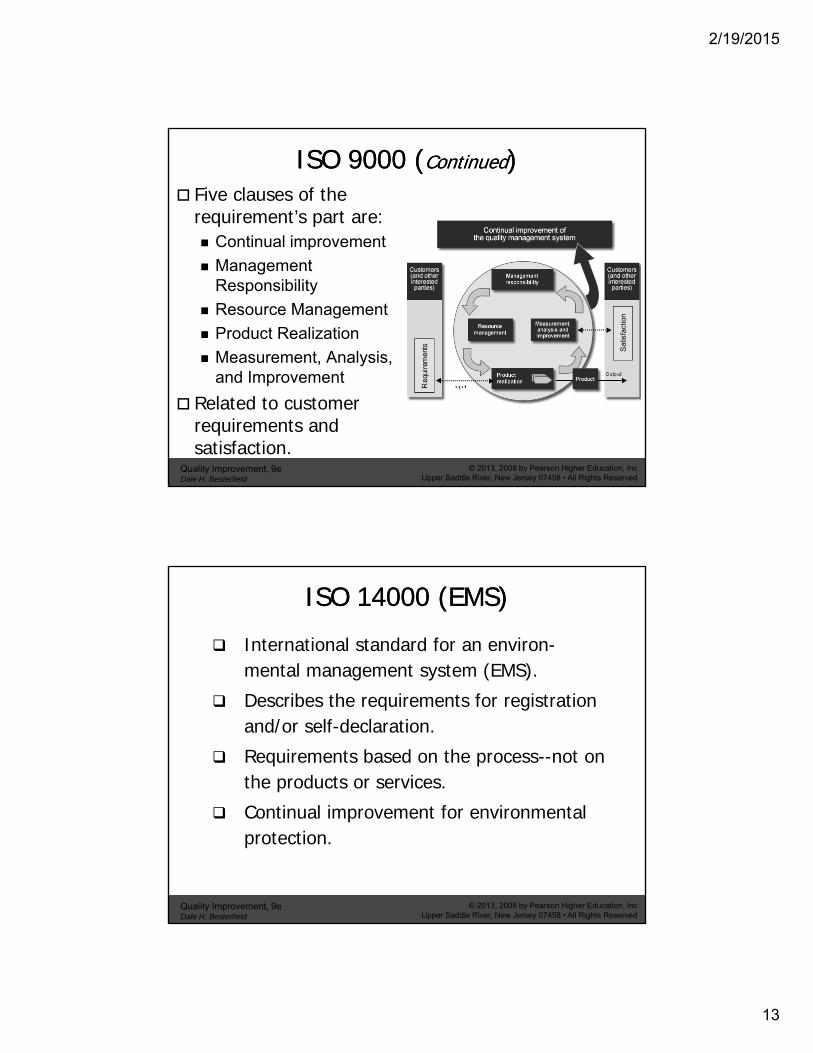
ISO ISO 9000 9000 ((ContinuedContinued)) Five clauses of the
requirement’s part are: Continual improvementp
Management Responsibility
Resource Management
Product Realization
Measurement, Analysis,
Quality Improvement, 9eDale H. Besterfield
© 2013, 2008 by Pearson Higher Education, IncUpper Saddle River, New Jersey 07458 • All Rights Reserved
and Improvement
Related to customer requirements and satisfaction.
ISO ISO 14000 14000 (EMS)(EMS) International standard for an environ-
mental management system (EMS). Describes the requirements for registration
and/or self-declaration. Requirements based on the process--not on
the products or services.C l f l
Quality Improvement, 9eDale H. Besterfield
© 2013, 2008 by Pearson Higher Education, IncUpper Saddle River, New Jersey 07458 • All Rights Reserved
Continual improvement for environmental protection.
2/19/2015
14
ISO 14000 (Continued)ISO 14000 (Continued) The four sections are:
Environment policy,
Planning, implementation, & operations,
Checking and corrective action,
Management review.
Quality Improvement, 9eDale H. Besterfield
© 2013, 2008 by Pearson Higher Education, IncUpper Saddle River, New Jersey 07458 • All Rights Reserved
Computers & Quality ControlComputers & Quality Control
Can be programmed to perform complex calculations to control acomplex calculations, to control a process or test, to analyze data, to write reports, and to recall information on command
Quality Improvement, 9eDale H. Besterfield
© 2013, 2008 by Pearson Higher Education, IncUpper Saddle River, New Jersey 07458 • All Rights Reserved
28
2/19/2015
15
Computers & Quality Control Computers & Quality Control ((ContinuedContinued))
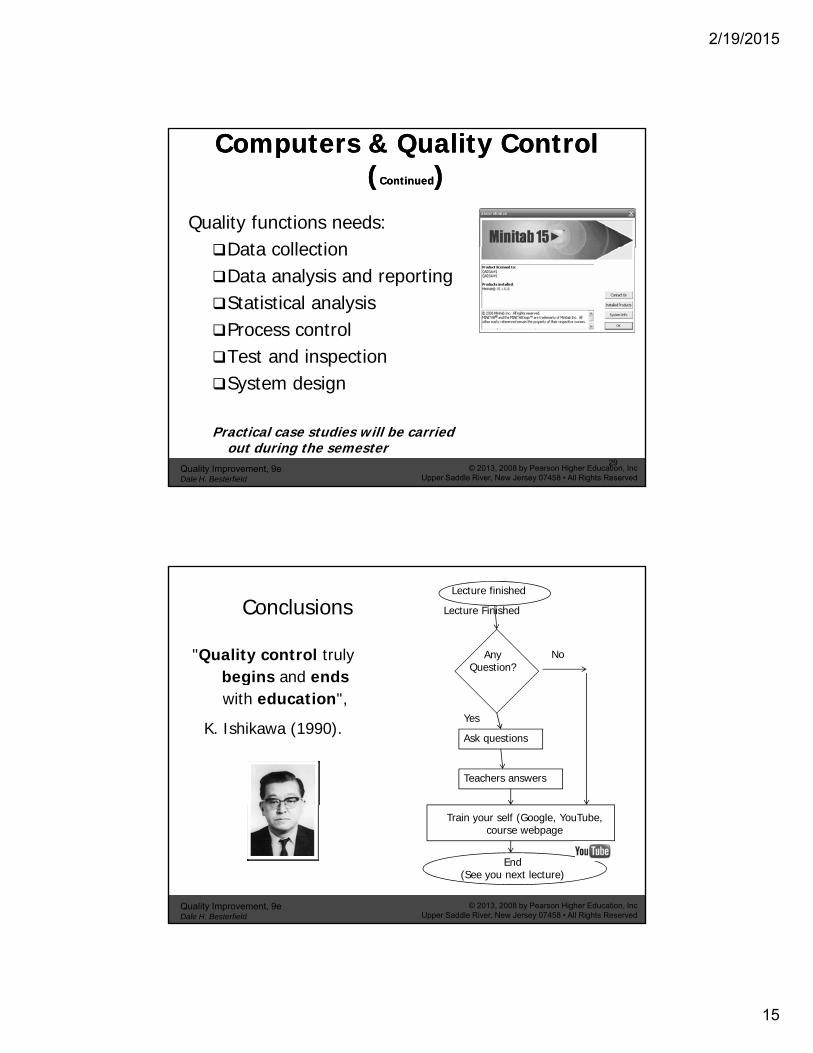
Quality functions needs:Data collectionData collectionData analysis and reporting Statistical analysisProcess controlTest and inspection
Quality Improvement, 9eDale H. Besterfield
© 2013, 2008 by Pearson Higher Education, IncUpper Saddle River, New Jersey 07458 • All Rights Reserved
29
System design
Practical case studies will be carried out during the semester
Conclusions
"Quality control truly begins and ends
Lecture Finished
Any Question?
Lecture finished
No
gwith education",
K. Ishikawa (1990). Ask questions
Teachers answers
Yes
Quality Improvement, 9eDale H. Besterfield
© 2013, 2008 by Pearson Higher Education, IncUpper Saddle River, New Jersey 07458 • All Rights Reserved
Train your self (Google, YouTube, course webpage
End (See you next lecture)
2/19/2015
16
Thank you
Any Questions ?
Prof. Mohamed Aichouni
Quality Improvement, 9eDale H. Besterfield
© 2013, 2008 by Pearson Higher Education, IncUpper Saddle River, New Jersey 07458 • All Rights Reserved
31
http://faculty.uoh.edu.sa/m.aichouni/ise320-quality