Embed Size (px)
Citation preview

Gonzalo Gómez [email protected]
Madrid, May 25th, 2010.
::: Normalization methods and data preprocessing
Course on Microarray Gene Expression Analysis
Bioinformatics Unit CNIO

::: Introduction.
The probe-level data must be cleaned and processed to obtain biologically meaningful measurement:
Background correction: eliminate signals due to non-specific binding;
• Normalization: make multiple arrays comparable;
• Preprocessing: Scale linearization, summarization (calculating ratios, log scale transformation), missing values imputation, etc.
Bckg. subst. Normaliz. Preprocess.
Normalization Methods and Data Preprocessing

Normalization techniques are needed to accurately interpret the results:
• Remove aberrations and outliers due to non-biological factors.
• Reveal the patterns and outliers of actual biological factors.
::: Why normalize?
Bckg. subst. Normaliz. Preprocess.
Normalization Methods and Data Preprocessing

::: Why normalize?
Bckg. subst. Normaliz. Preprocess.
Sources of variation between multiple high-density oligonucleotidearrays:
• Biological (e.g., diseased vs. normal) • Non-biological:
- Total RNA preparation, transcription, amplification, abundances; - Sample labeling differences; - Hybridization parametres; - Scanner differences; - Image analysis; etc.
Goal: make multiple arrays comparable.
Normalization Methods and Data Preprocessing

• Changes in expression are independent of abundance. Rare transcripts are as likely to change in response to a given stress as common ones.
• Most transcripts are not differentially expressed in response to a given stress. Expression ratio of typical spot: tumor/control= 1
• Range of abundance begins at 0. “Negative transcripts” = error measurement
• Outliers are biologically relevant. Average cases are less interesting.
::: Normalization Assumptions
Bckg. subst. Normaliz. Preprocess.
Normalization Methods and Data Preprocessing

Boxplots Bckg. subst. Normaliz. Preprocess.
Normalization Methods and Data Preprocessing
IQR: InterQuartile Range Median
Outliers <1.5 IQR below 0-25 quartile
Outliers >1.5 IQR over 75-100 quartile
“the difference between the 75th percentile and 25th percentile”
Whiskers: In most cases represents 1.5 times the box width. Can be customized.
::: Normalization plots
::: Normalization plots
Bckg. subst. Normaliz. Preprocess.
Normalization Methods and Data Preprocessing
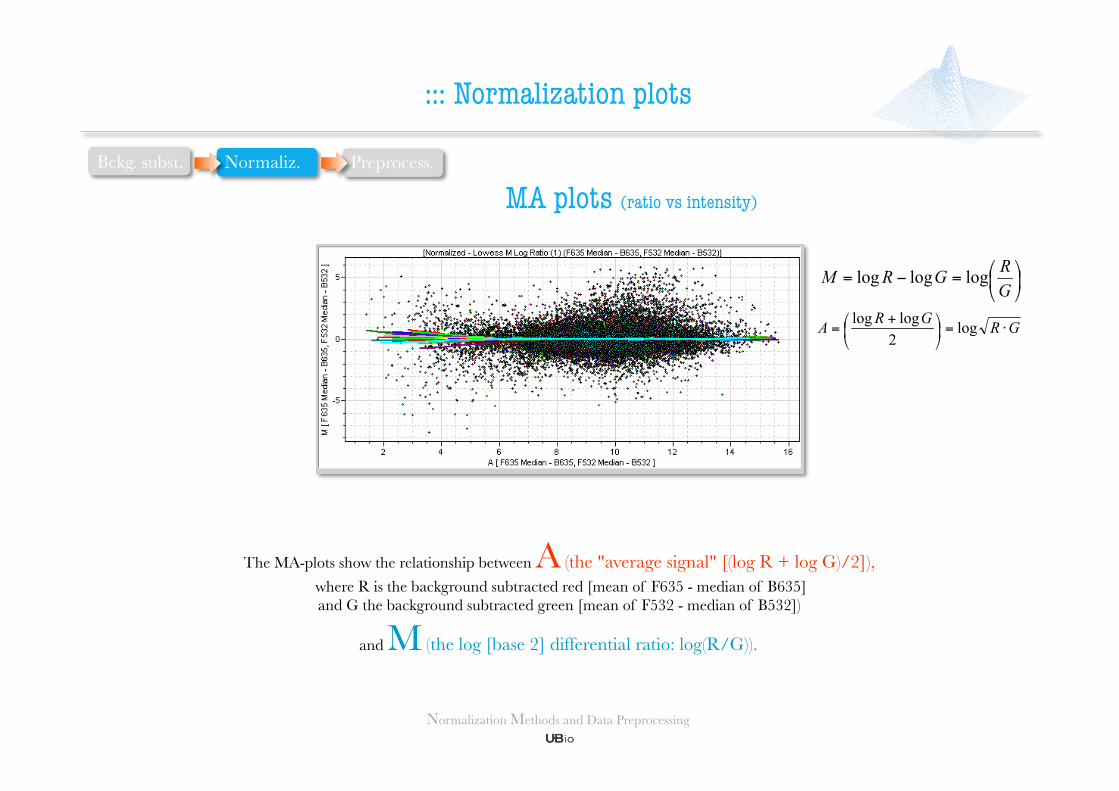
MA plots (ratio vs intensity)
The MA-plots show the relationship between A (the "average signal" [(log R + log G)/2]), where R is the background subtracted red [mean of F635 - median of B635] and G the background subtracted green [mean of F532 - median of B532])
and M (the log [base 2] differential ratio: log(R/G)).
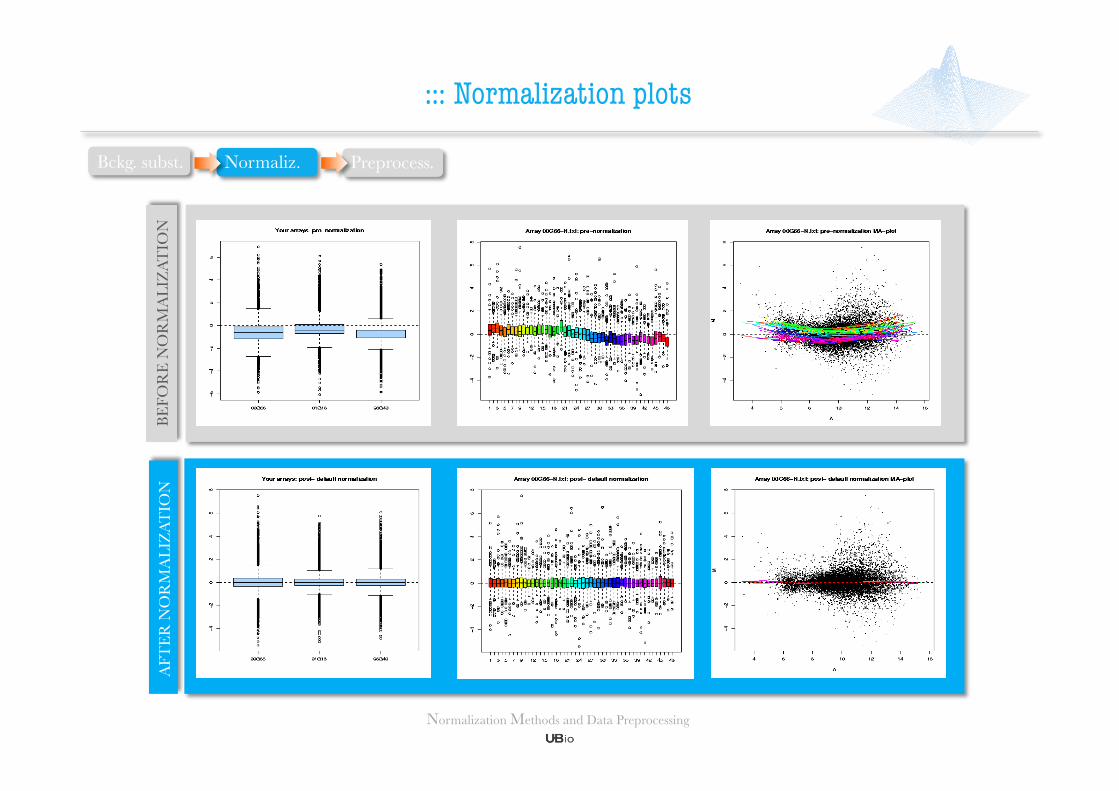
::: Normalization plots
Bckg. subst. Normaliz. Preprocess.
Normalization Methods and Data Preprocessing
AFT
ER
NO
RM
AL
IZA
TIO
N
BE
FOR
E N
OR
MA
LIZ
AT
ION

Two main categories for study:
• Intra-slide normalization (within array). Normalizes expression values to make intensities consistent within each array.
• Inter-slide normalization (between array). Normalizes expression values to achieve consistency between arrays.
Normalization between arrays is usually, but not necessarily, applied after normalization within arrays (an exception in VSN method).
::: Normalization methods
Bckg. subst. Normaliz. Preprocess.
Normalization Methods and Data Preprocessing

::: Normalization methods
Bckg. subst. Normaliz. Preprocess.
Normalization Methods and Data Preprocessing
Within-array normalization.
• Median: Subtracts the weighted median from the M-values for each array. • Lowess: LOcally WEighted Scatterplot Smoothing, 2-channel microarrays. Utilize a locally weighted polynomial regression of theintensity scatterplot in order to obtain the calibration factor. • Print-tip Lowess: Regional Lowess. 2-channel spotted microarrays. • Control: Fits a global loess curve through a set of control spots and applies that curve to all the other spots. • Robustspline: Normalize the M-values for a single microarray using robustly fitted regression splines
and empirical Bayes shrinkage.
Between-array normalization.
• Scale: Simply to scale the log-ratios to have the same median-absolute-deviation across arrays • MAS5: Affymetrix • RMA: Affymetrix • Cyclic Loess: Affymetrix, CodeLink • Quantiles: Ensures that the intensities have the same empirical distribution across arrays and across channels. Affymetrix, Agilent • Invariant set normalization: Affymetrix • VSN: Variance Stabilization Normalization
::: Within-array methods
Bckg. subst. Normaliz. Preprocess.
Normalization Methods and Data Preprocessing
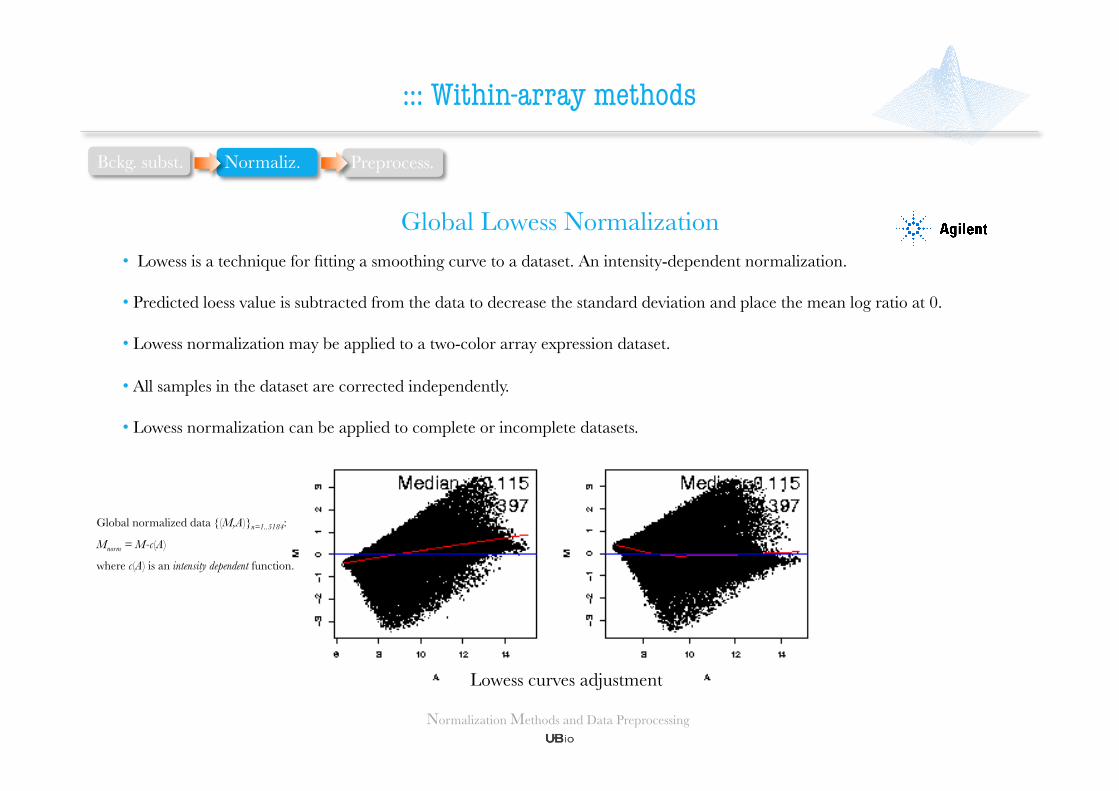
Global Lowess Normalization
Lowess curves adjustment
• Lowess is a technique for fitting a smoothing curve to a dataset. An intensity-dependent normalization.
• Predicted loess value is subtracted from the data to decrease the standard deviation and place the mean log ratio at 0.
• Lowess normalization may be applied to a two-color array expression dataset.
• All samples in the dataset are corrected independently.
• Lowess normalization can be applied to complete or incomplete datasets.
Global normalized data {(M,A)}n=1..5184:
Mnorm = M-c(A)
where c(A) is an intensity dependent function.

• One loess line for each block (print-tip block).
::: Within-array methods
Bckg. subst. Normaliz. Preprocess.
Print-tip Lowess normalization
Print-tip normalized data {(M,A)}n=1..5184:
Mp,norm = Mp-cp(A); p=print tip (1-16)
where cp(A) is an intensity dependent function for print tip p.
1 2 3 4
5 6 7 8
9 10 11 12
13 14 15 16
Oncochip
Normalization Methods and Data Preprocessing

• Significant variation in the distribution of intensity values across arrays • Transforms the distribution of probe intensities to be same across arrays • Final distribution is the average of each quantile across chips
Den
sity
Log Intensities
::: Between-array methods
Bckg. subst. Normaliz. Preprocess.
Bolstad et al, Bioinformatics (2003)
Normalization Methods and Data Preprocessing
Quantiles normalization

Sort each column of original matrix
Take average across rows
Substitute each value to corresponding row average
Unsort columns of matrix to original order
::: Between-array methods
Bckg. subst. Normaliz. Preprocess.
Normalization Methods and Data Preprocessing
Quantiles normalization

::: Between-array methods
Bckg. subst. Normaliz. Preprocess.
Normalization Methods and Data Preprocessing
Variance Stabilization Normalization (VSN) Huber W. et al. Bioinformatics (2002)
• VSN transformation = asinh(ai + bi * y)
• Well-defined and meaningful close to 0.
• Original intensities may be negative.
log
asinh
≈ log ≈ linear

::: Preprocessing.
Bckg. subst. Normaliz. Preprocess.
Normalization Methods and Data Preprocessing
Log Transformation
• Common technique used for two-color arrays (one-color as well) • Log ratio transformations convert data to a linear scale • M= log2(Cy5/Cy3) • A=log2(Cy5*Cy3)*0.5
No Log transform
After Log transform
Ratio scale
Log scale (lineal)
1
0 1 -1
2 0.5 0.25
-2
4
2

::: Preprocessing.
Bckg. subst. Normaliz. Preprocess.
Normalization Methods and Data Preprocessing
Imputing Missing Values
• Fill with zeros: Replace missing values by zeros.
• Fill with row average: Replace missing values by the. row average.
• Fill with row median: Replace missing values by the. row median.
• K-Nearest Neighbors (KNN) impute: Replace missing values by the average value of the K nearest patterns.

::: Preprocessing.
Bckg. subst. Normaliz. Preprocess.
KNN Imputing
• Machine learning algorithm. • Usually euclidean (or Manhattan) metric, confined to the columns for which that gene is NOT missing • K < number of samples in smallest class.
1 2 3 4
5 6 7 8
9 10 11 12
13 14 15 16
1 2 3 4
5 6 7 8
9 10 na 12
13 14 15 16
1 2 3 4
5 na 7 8
9 10 11 12
13 14 15 16
Class A Class B

::: Preprocessing.
Bckg. subst. Normaliz. Preprocess.
Other Parametres
• Filter Flat Patterns (no relevant differences between classes):
- By number of peaks - By root mean square - By standard deviation
• Standardize Patterns: Subtracts the mean of the pattern and divide it by the standard deviation (z-score). Allows comparison of observations from different distributions (recommended)
Indicates how many standard deviations an observation is above or below the mean.


![WhiB5, a Transcriptional Regulator That Contributes to ... · .bioinfo.cnio.es/]) (41), using the print-tip lowess method after back-ground subtraction. Genes significantly differentially](https://img.pdfslide.net/doc/110x75/608836f405d0b82a904408c1/whib5-a-transcriptional-regulator-that-contributes-to-41-using-the-print-tip.jpg)
![Syntax - Lane Kenworthy...258[G-2] graph twoway lowess— Local linear smooth plots Notice also the y-axis title: “Mileage (mpg)/Fitted values/lowess mpg weight”. The “Fitted](https://img.pdfslide.net/doc/110x75/60cc1f6bfcb6833164720505/syntax-lane-kenworthy-258g-2-graph-twoway-lowessa-local-linear-smooth.jpg)