Embed Size (px)
Citation preview
Court 9th December 2011Financial Statements for the year ended
31st July 2011
Review of the Financial Statements for the year ended 31st July 2011
Highlights from the accounts Results for the year Cash Flow for the year Balance Sheet KPIs Key Features from the 5 year review Summary of our projected cash flows to 31st July
2015
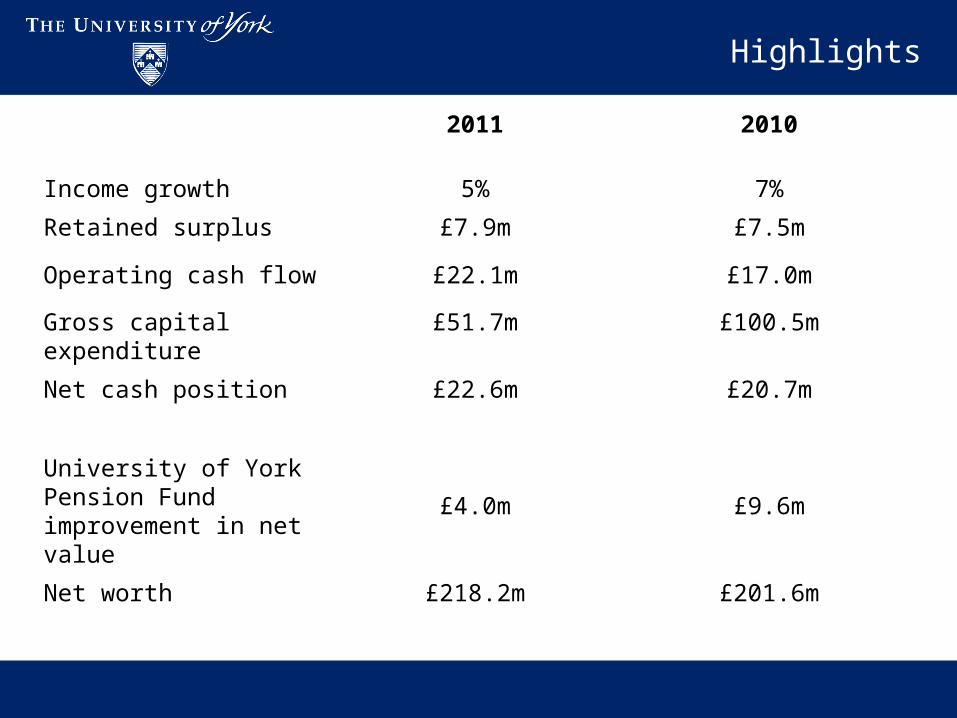
Highlights
2011 2010
Income growth 5% 7%
Retained surplus £7.9m £7.5m
Operating cash flow £22.1m £17.0m
Gross capital expenditure £51.7m £100.5m
Net cash position £22.6m £20.7m
University of York Pension Fund improvement in net value
£4.0m £9.6m
Net worth £218.2m £201.6m
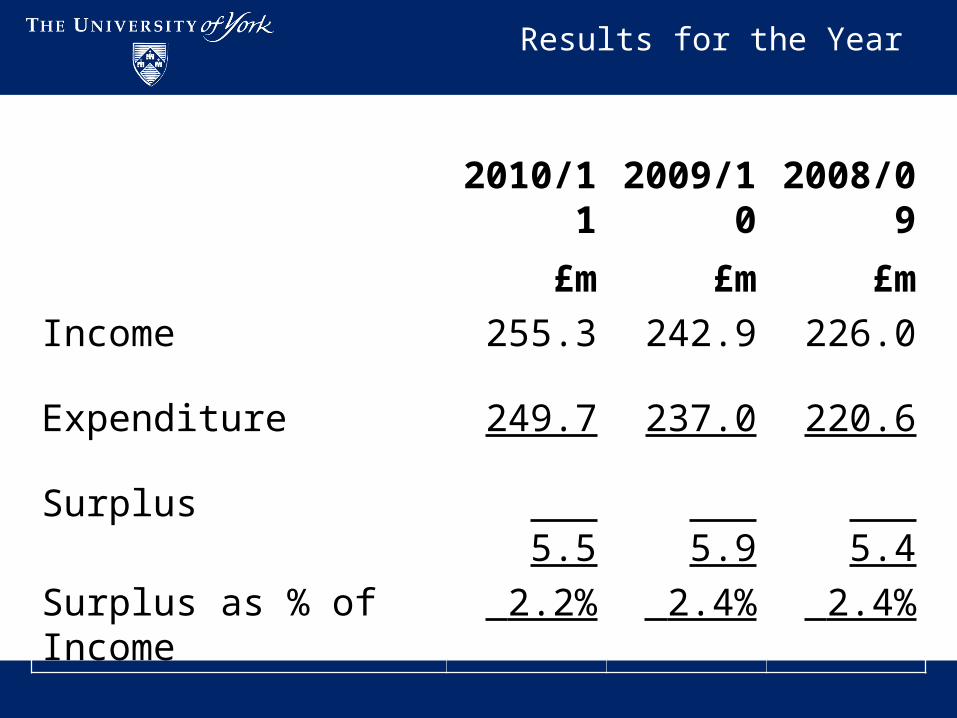
Results for the Year
2010/11
£m
2009/10
£m
2008/09
£m
Income 255.3 242.9 226.0
Expenditure 249.7 237.0 220.6
Surplus 5.5 5.9 5.4
Surplus as % of Income 2.2% 2.4% 2.4%
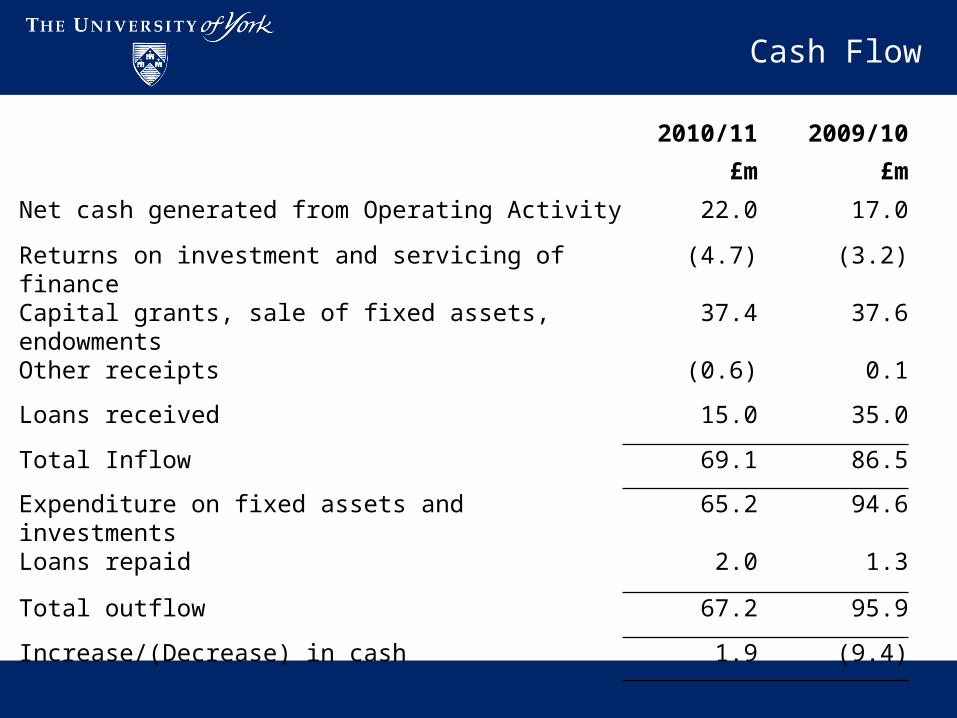
Cash Flow
2010/11
£m
2009/10
£m
Net cash generated from Operating Activity 22.0 17.0
Returns on investment and servicing of finance (4.7) (3.2)
Capital grants, sale of fixed assets, endowments 37.4 37.6
Other receipts (0.6) 0.1
Loans received 15.0 35.0
Total Inflow 69.1 86.5
Expenditure on fixed assets and investments 65.2 94.6
Loans repaid 2.0 1.3
Total outflow 67.2 95.9
Increase/(Decrease) in cash 1.9 (9.4)
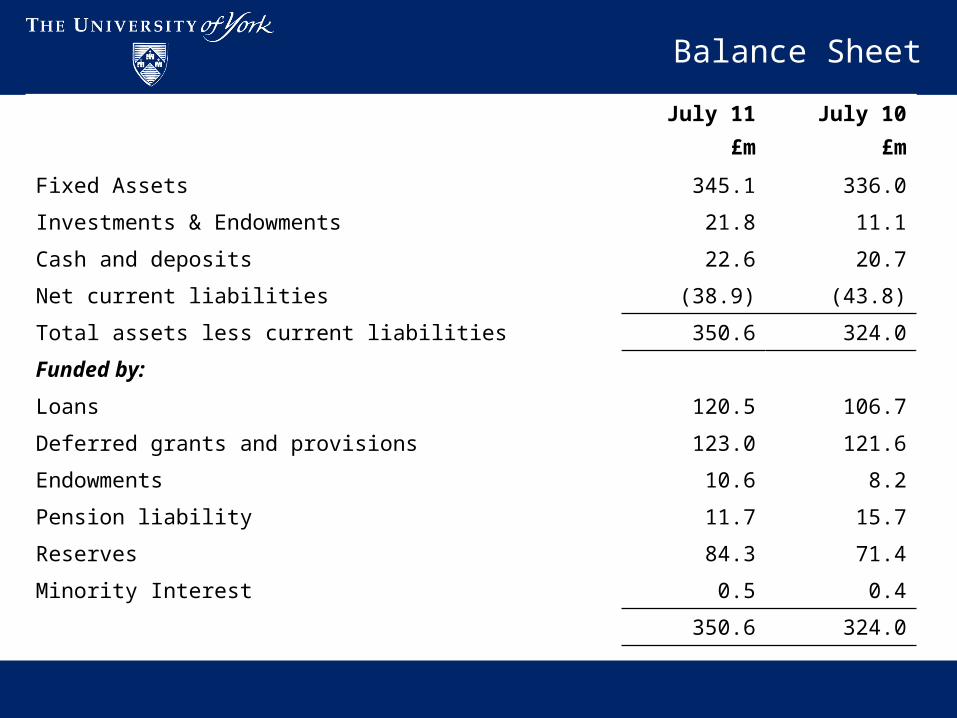
Balance Sheet
July 11
£m
July 10
£m
Fixed Assets 345.1 336.0
Investments & Endowments 21.8 11.1
Cash and deposits 22.6 20.7
Net current liabilities (38.9) (43.8)
Total assets less current liabilities 350.6 324.0
Funded by:
Loans 120.5 106.7
Deferred grants and provisions 123.0 121.6
Endowments 10.6 8.2
Pension liability 11.7 15.7
Reserves 84.3 71.4
Minority Interest 0.5 0.4
350.6 324.0
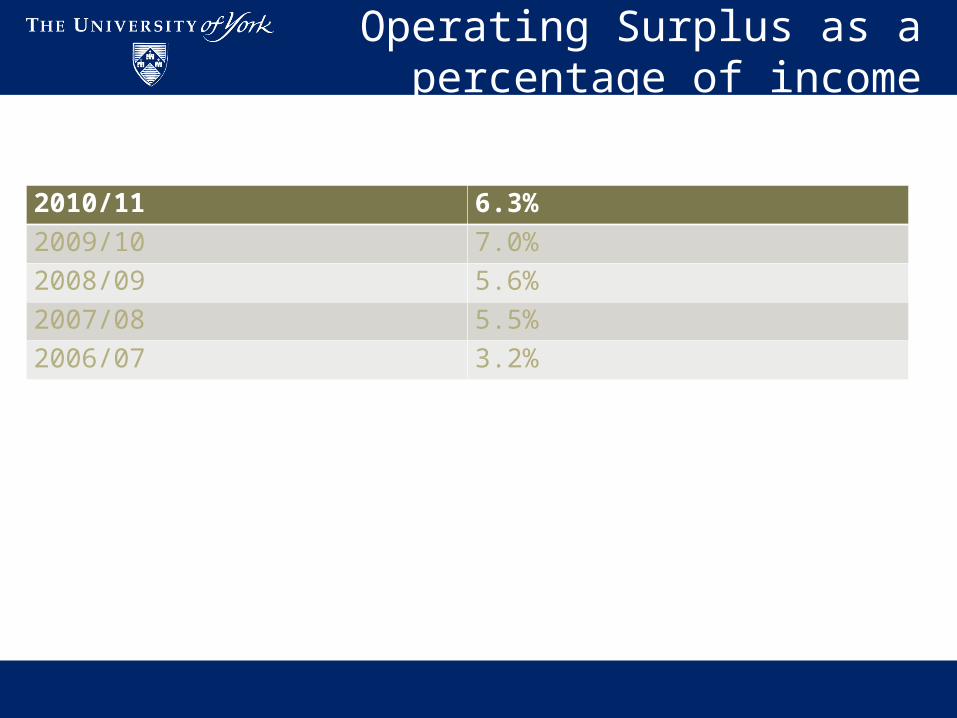
Operating Surplus as a percentage of income
2010/11 6.3%
2009/10 7.0%
2008/09 5.6%
2007/08 5.5%
2006/07 3.2%
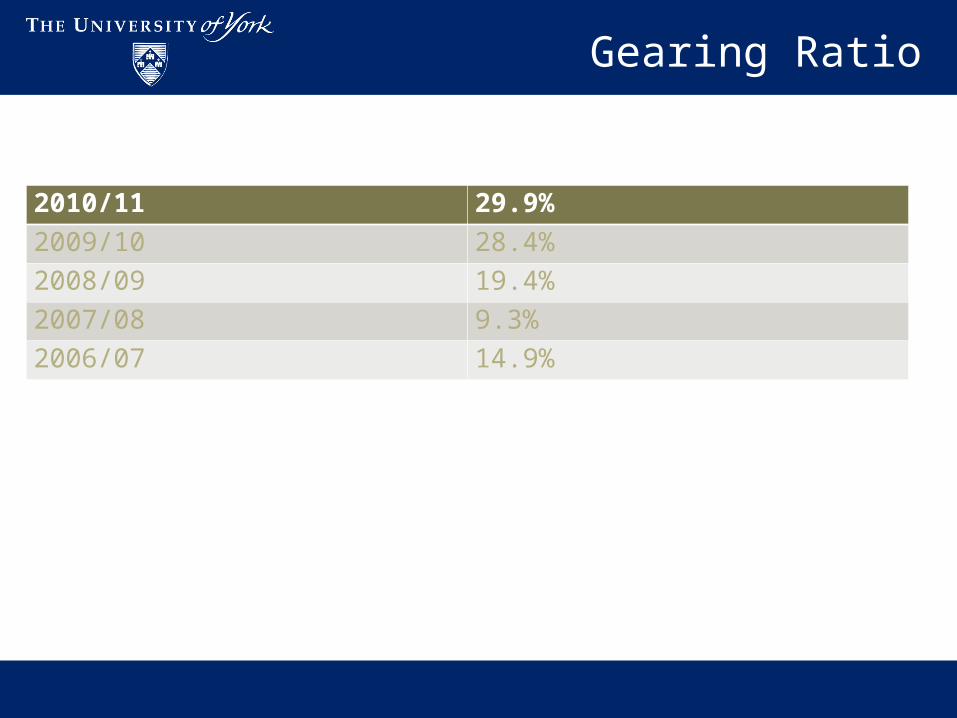
Gearing Ratio
2010/11 29.9%
2009/10 28.4%
2008/09 19.4%
2007/08 9.3%
2006/07 14.9%
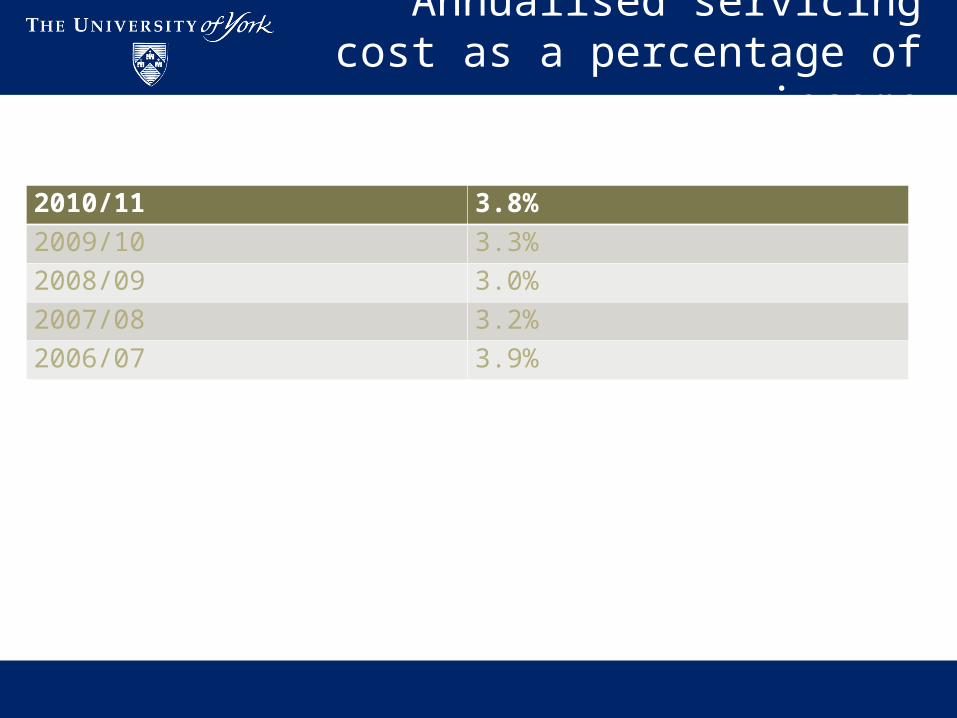
Annualised servicing cost as a percentage of income
2010/11 3.8%
2009/10 3.3%
2008/09 3.0%
2007/08 3.2%
2006/07 3.9%
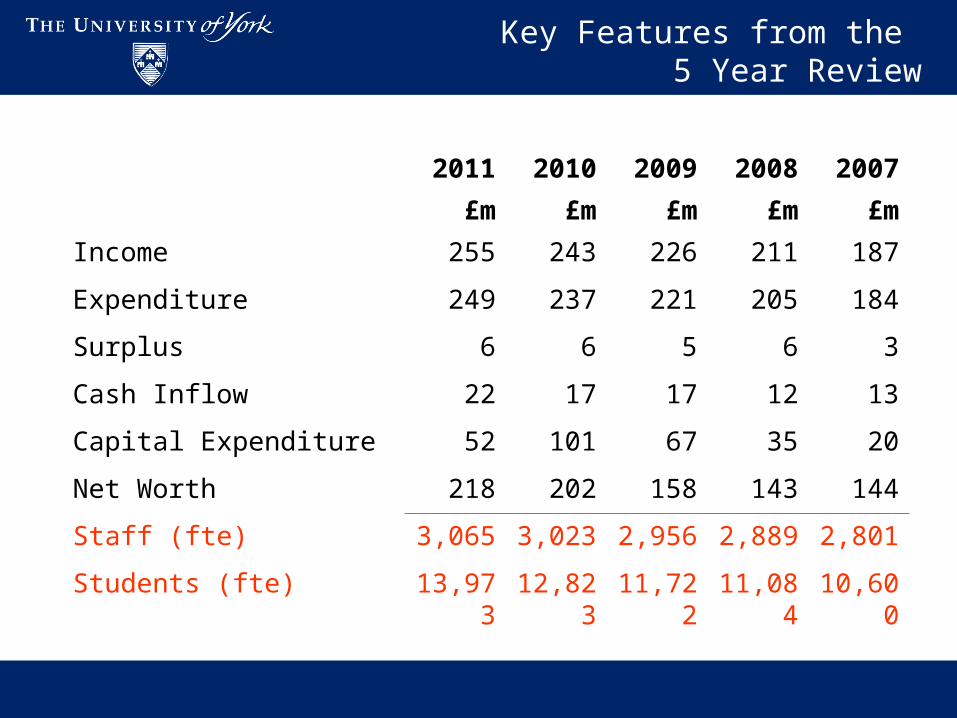
Key Features from the 5 Year Review
2011
£m
2010
£m
2009
£m
2008
£m
2007
£m
Income 255 243 226 211 187
Expenditure 249 237 221 205 184
Surplus 6 6 5 6 3
Cash Inflow 22 17 17 12 13
Capital Expenditure 52 101 67 35 20
Net Worth 218 202 158 143 144
Staff (fte) 3,065 3,023 2,956 2,889 2,801
Students (fte) 13,973 12,823 11,722 11,084 10,600
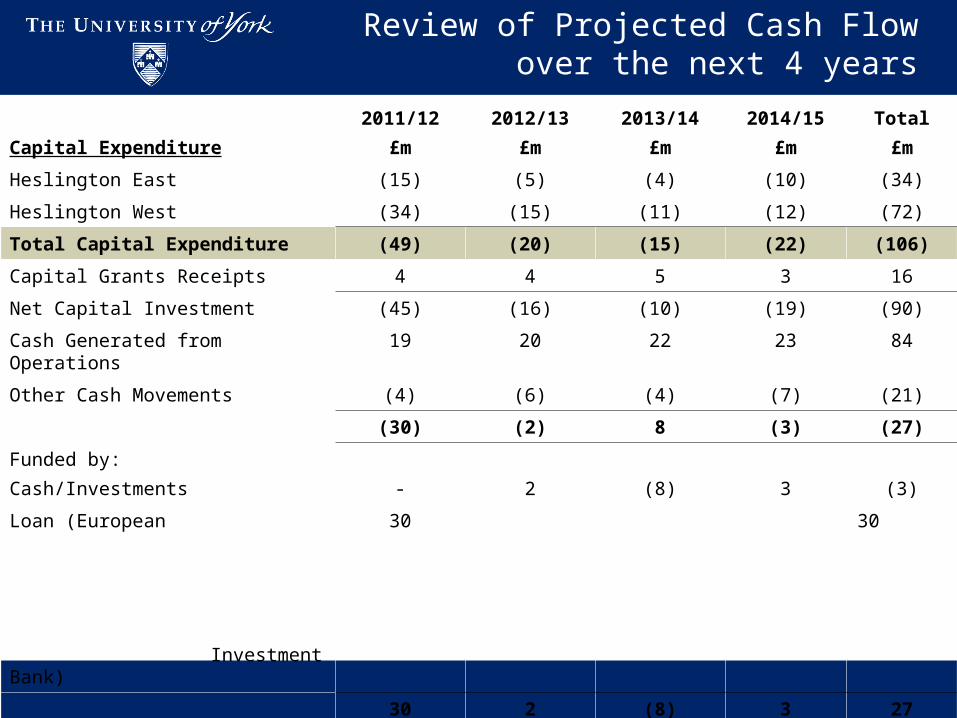
Review of Projected Cash Flow over the next 4 years
Capital Expenditure
2011/12
£m
2012/13
£m
2013/14
£m
2014/15
£m
Total
£m
Heslington East (15) (5) (4) (10) (34)
Heslington West (34) (15) (11) (12) (72)
Total Capital Expenditure (49) (20) (15) (22) (106)
Capital Grants Receipts 4 4 5 3 16
Net Capital Investment (45) (16) (10) (19) (90)
Cash Generated from Operations 19 20 22 23 84
Other Cash Movements (4) (6) (4) (7) (21)
(30) (2) 8 (3) (27)
Funded by:
Cash/Investments - 2 (8) 3 (3)
Loan (European Investment Bank)
30 30
30 2 (8) 3 27
Cash Balances 18 16 24 21
Loan Account 149 147 145 143
Summary
Results that support the strategic objectives of the University
Consistent surpluses Strong financial reporting systems Borrowing in place at appropriate cost and
remaining within the funding covenants Don’t anticipate future income