Embed Size (px)
Citation preview
et discipline ou spécialité
Jury :
le
Université Toulouse 3 Paul Sabatier (UT3 Paul Sabatier)
Cotutelle internationale avec l'Université de Chongqing (Chine)
Song XIAOjeudi 21 juillet 2016
Research on Insulation Performance of SF6 Substitute CF3I/CO2 under PowerFrequency Voltage and the Influence of Micro-moisture on CF3I
ED GEET : Ingénierie des PLASMAS
LAPLACE, UMR 5213
Yann CRESSAULT, Maître de Conférences, Université Paul Sabatier ToulouseDunpin HONG, Professeur, Université d'Orléans, rapporteur
Kun LIU, Maître de Conférences, , Université de Chongqing, examinateurFan YANG, Professeur, Université de Chongqing, rapporteur
Xiaoxing ZHANG, Professeur, Université de ChongqingGeorges ZISSIS, Professeur, Université Paul Sabatier Toulouse, examinateur
Yann CRESSAULT, Maître de Conférences, Université Paul Sabatier, Toulouse, FranceXiaoxing ZHANG, Professeur, Université de Chongqing, Chine


1
AUTHOR : Song XIAO
TITLE : Research on insulation performance of SF6 substitute CF3I/CO2 under power
frequency voltage and the influence of micro-moisture on CF3I
THESIS SUPERVISOR : Yann CRESSAULT
SITE : LAPLACE UMR 5213 CNRS, Université Paul Sabatier, 118 route de Narbonne, Bât.
3R3, 31062 Toulouse Cedex 9
____________________________________________________________________
Abstract In order to realize the goal of global energy interconnection and optimize the energy
structure as well as support the long-distance ultra-high voltage power transmission project all
around the world, a large amount of gas insulated equipment are applied widely as the key part
of power system. Gas insulated equipment develop quickly and used widely in high and ultra-
high voltage field owing to its high stability, less maintenance work, smaller floor space, and
flexible configuration.
Nowadays, SF6 is adopted as the main insulation medium of gas insulated equipment,
which is considered a kind of dangerous greenhouse gas to environment. Global climate
warming caused by greenhouse effect brings disastrous consequences to our living conditions.
Most emission of SF6 comes from electric devices, which makes it urgent to find a kind of
environment-friendly substitute insulating gas. Besides, the decomposed products of SF6 under
discharge may be corrosive to internal material and poisonous to workers from electric power
company.
In the early period of global research and development of environment-friendly insulated
devices, mastering the formula and key technique of substitute gas is vital to electrical
development. According to the above circumstance, systematic investigation of the insulating
characteristics of CF3I/CO2 mixed gases under power-frequency voltage was carried out firstly,
which could provide useful information for the best mixed ratio of CF3I/CO2 and the design of
internal structure in matching devices. Then insulating characteristic of CF3I/CO2 and CF3I
were tested under a kind of normal insulating defect of free metal particles defect, and the
influence of metal particles on the thermodynamic characteristics and transmission properties
of CF3I discharge plasma were calculated theoretically. The overall performance of CF3I/CO2
under typical defects were tested for the choice of internal metal materials of electrical devices.
Finally, the influence of moisture, the main hazardous material on gas insulated equipment, on
the insulating performance of CF3I were conducted experimentally and theoretically, which
proved the harmful effect of moisture on the new insulating medium and provided theoretical
foundation for the standard constitution of moisture content.
Keywords: CF3I/CO2, partial discharge inception voltage in positive and negative half cycle,
electric field utilization coefficient, metal particles, trace-H2O

2
3
ACKNOWLEDGMENT The life of my study as a doctor student was bittersweet. Even through there were lots of
hard work, and I have not had any rest at weekend for a long time, I love my study and was
excited when we got good research results.
I am deeply indebted to my Chinese supervisor, Professor Dr. Xiaoxing ZHANG, School
of Electrical Engineering, Wuhan University, for all his insightful guidance, valuable discussion
and great encouragement to my research work. Working with him has been the most valuable
experience in my doctoral student life.
I'm so grateful to my French supervisor, Associate Professor Dr. Yann CRESSAULT,
LAboratoire PLasma et Conversion d'Energie (LAPLACE), Université Paul Sabatier - Toulouse
III, for all his help in my research and the life in Toulouse. He is also my best French friend.
I would like to express my special thanks to Professor Dr. Ju Tang, Professor Dr. Dunpin
Hong, Professor Dr. Philippe Teulet, Professor Dr. Fan Yang and my colleagues. The research
cannot be carried out without support and help from them.
I would also like to thank to Chongqing University and Université Paul Sabatier, which
give an opportunity to me to pursue my study, and thanks to China Scholarship Council (CSC),
which give a financial support to me to study in France.
Finally, I would like to express my sincere thanks to my parents, for their great
encouragement and inseparable support for me to proceed this work successfully.

4

5
TABLE DES MATIERES
CHAPTER I. INTRODUCTION .................................................................................................................................... 7
1.1 BACKGROUND AND SIGNIFICANCE ......................................................................................................................... 7 1.1.1 Use of SF6-insulated electrical equipment .......................................................................................... 7 1.1.2 Greenhouse efect of SF6 ..................................................................................................................... 8 1.1.3 Toxicity of SF6 and its decomposition products .................................................................................. 9
1.2 RESEARCH ACTUALITY ....................................................................................................................................... 11 1.2.1 Mixture study in SF6 .......................................................................................................................... 11 1.2.2 Research on electronegative gases and mixtures as SF6 substitute ................................................. 12 1.2.3 Research on CF3I gases and mixtures as SF6 substitutes................................................................... 15 1.2.3.1 Physiochemical property ......................................................................................................... 15 1.2.3.2 Decomposition characteristics and toxicity ............................................................................. 16 1.2.3.3 Thermodynamic characteristics .............................................................................................. 18 1.2.3.4 Electrical performance ............................................................................................................ 19 1.2.4 Conclusion ........................................................................................................................................ 23
1.3 RESEARCH PURPOSE AND TECHNICAL ROUTE ......................................................................................................... 25
CHAPTER II. RESEARCH ON PARTIAL DISCHARGE CHARACTERISTICS OF CF3I/CO2 AT POWER FREQUENCY
VOLTAGE………..…………………………………………………………………………………………………………………………………………………29
2.1 COMPREHENSIVE EXPERIMENTAL PLATFORM ......................................................................................................... 29 2.2 TEST METHOD ................................................................................................................................................. 34
2.2.1 Preparation before experiment ........................................................................................................ 34 2.2.2 Gas-filling method ............................................................................................................................ 35 2.2.3 Experimental method ans data collection ........................................................................................ 36
2.3 PARTIAL DISCHARGE CHARACTERISTICS IN THE NEGATIVE HALF CYCLE ......................................................................... 38 2.4 PARTIAL DISCHARGE CHARACTERISTICS IN THE POSITIVE HALF CYCLE .......................................................................... 44
2.4.1 The influence of k and pressure on PDIV+ of CF3I/CO2 ..................................................................... 44 2.4.2 The PDIV+ of CF3I/CO2 with low k ..................................................................................................... 46 2.4.3 Analysis of the substitutability woth PD experiment under highly non-uniform electric field ........ 48
2.5 CONCLUSIONS ................................................................................................................................................. 50
CHAPTER III. EXPERIMENTAL STUDIES ON POWER FREQUENCY BREAKDOWN VOLTAGE OF CF3I/CO2 MIXED
GAS UNDER DIFFERENT ELECTRIC FIELDS ............................................................................................................. 51
3.1 POWER FREQUENCY BREAKDOW EXPERIMENTS OF CF3I/CO2 MIXTURE ..................................................................... 51 3.2 POWER FREQUENCY BREAKDOWN VOLTAGE OF CF3I/CO2 AND SF6/CO2 ALONG WITH CHANGE OF PRESSURE .................. 53 3.3 INFLUENCE OF ELECTRIC FIELD UNIFORMITY ON POWER FREQUENCY BREAKDOWN VOLTAGE OF CF3I/CO2 AND SF6/CO2 .... 55 3.4 SUNERGETIC EFFECT OF CF3I/CO2 MIXED GAS....................................................................................................... 57 3.5 THE COMPARISON OF THE BREAKDOWN VOLTAGES BETWEEN CF3I/CO2 MIXED GAS AND PURE SF6 GAS UNDER DIFFERENT
ELECTRIC FIELDS ..................................................................................................................................................... 63 3.6 CONCLUSION .................................................................................................................................................. 65
CHAPTER IV. INSULATION PEFORMANCE OF CF3I AND CF3I/CO2 UNDER FREE METAL PARTICLES DEFECTS ..... 67
4.1 EXPERIMENTAL METHOD ................................................................................................................................... 68 4.2 STUDY ON BREAKDONW CHARACTERISTICS OF CF3I/CO2 UNDER METAL PARTICLES DEFECT............................................ 72 4.3 THE INFLUENCE OF FREE METAL PARTICLES WITH DIFFERENT NUMBER AND MATERIAL ON THE BREAKDOWN CHARACTERISTICS
OF CF3I ................................................................................................................................................................ 75 4.3.1 Comparative study of the breakdwon characteristics of CF3I and SF6 with metal particles ............. 75 4.3.2 Influence of CF3I from different types of metal particles to the insulating property ....................... 77
4.4 THERMODYNAMIC PROPERTIES AND TRANSPORT COEFFICIENTS OF CF3I PLASMAS MIXED WITH CU, AL OR FE ................... 79

6
4.4.1 Equilibrium composition and thermodynamic properties ............................................................... 80 4.4.2 Transport coefficients ....................................................................................................................... 85
4.4 CONCLUSION ................................................................................................................................................... 88
CHAPTER V. INFLUENCE OF HUMIDITY OF THE DECOMPOSITION PRODUCTS AND INSULATING CHARACTERISTICS OF CF3I ..................................................................................................................................... 91
5.1 CALCULATION MODEL ....................................................................................................................................... 91
5.1.1 Calculation model ............................................................................................................................. 91 5.1.2 Optimization of the calculation model ............................................................................................. 94
5.2 ANALYSIS OF SIMULATION RESULTS ...................................................................................................................... 94 5.2.1 Decomposition of pure CF3I .............................................................................................................. 94 5.2.2 Decomposition of CF3I nfluence of H2O ........................................................................................... 96 5.2.3 Decomposition of CF3I with micro-moisture .................................................................................... 98
5.3 EXPERIMENTAL VERIFICATION ........................................................................................................................... 103 5.4 CONCLUSION ................................................................................................................................................ 107
CHAPTER VI. SUMMURY AND PROSPECTS ....................................................................................................... 109
6.1 CONCLUSIONS ............................................................................................................................................... 109 6.2 PROSPECTS OF FOLLOWING RESEARCH WORK ...................................................................................................... 110
REFERENCES ...................................................................................................................................................... 113

7
CHAPTER 1
INTRODUCTION
1.1 Background and significance
In the 21st century, global energy production and consumption continue to grow, and a
significant amount of fossil energy is developed and utilized, thereby resulting in resource
constraints, environmental pollution, climate change, and other global problems that pose a
serious threat to human survival and development. In recent years, haze and other
environmental problems have raised new questions regarding energy restructuring. Thus, the
road to sustainable development has been taken. Developing the power industry has become a
key factor to resolve economic development and environmental conflict issues. In the context
of rapid development of electric power, high-voltage electrical equipment is an important link
in a power system [1].
1.1.1 Use of SF6-insulated electrical equipment
The proportion of gas-insulated electrical equipment in high-voltage electrical equipment
rises annually. In 1937, the French first used sulfur hexafluoride (SF6) as an insulating medium
for high-voltage electrical equipment. The high-voltage electrical field has experienced a major
revamp and rapid development. In the 1960s, the United States produced the first gas-insulated
switchgear (GIS), which used SF6 gas as insulating medium. Since SF6 GIS was operated in
Germany for the first time in 1967, it has been rapidly and widely used in high-voltage power
and in high-voltage power system, extra high-voltage power system and ultra-high-voltage
power system because of its high reliability, low maintenance cost, small footprint, and flexible
configuration.[2–4] Gas-insulated transformers (GIT), gas-insulated lines (GIL), gas-insulated
circuit breakers (GCB), cubicle-type gas-insulated switchgear (C-GIS), and other SF6-insulated
equipment are widely used in power systems with the development of technology. In the
Chinese power equipment industry, SF6 demand reached 5000 tons in 2010 from only 820 tons
in 2001 [5]. The great development of the power industry brought the high-voltage electrical
equipment industry to a golden period for more than 10 years. However, it also led to the rapid
increase in the use of SF6 (see Table 1.1).

8
Table 1.1 Newly installed capacities of electric power supply over the years and trend
prediction of SF6 demand quantity
Year New capacity / million kW Annual demand of SF6 / t
2001 15 820
2002 22 930
2003 34.8 2300
2004 51 2800
2005 66.02 3500
2006 105 4500
2007 115 4500
2008 90.51 4800
2009 89.70 5200
2010 85 5000
2011–2020 55–60 4500–5500
1.1.2 Greenhouse effect of SF6
SF6 gas is considered as one of the most harmful kinds of atmospheric greenhouse gases [6].
Its global warming potential (GWP) is 23,900 times higher than that of CO2, and the life span
of this gas is 3,400 years in the atmosphere[6]. Global warming, ozone depletion, and drastic
reduction of biological species are known as the three major environmental problems. Humans
are not threatened by short-term greenhouse effects. However, global warming caused by
climate change is bound to have disastrous consequences to human conditions in the long run.
SF6 gas in the atmosphere has an annual growth rate of 8.7% [7]. At present, SF6 gas accounts
for more than 15% of greenhouse gas emissions. The Kyoto Protocol, which was signed by
several parties during the United Nations Convention on Climate Change in 1997, lists SF6 as
one of the six greenhouse gases that are restricted for use, thereby limiting the use of SF6 gas.
California proposes gradually reducing the amount of SF6 in electrical field starting in 2020. In
2014, the European Union planned to reduce SF6 emissions by two-thirds by 2030 [8]. On the
contrary, discussions in International Council on Large Electric systems (CIGRE) determined
that SF6 has obviously become one of the major causes of power development and
environmental protection.
In the electric power industry, high-voltage switchgear accounts for SF6 gas consumption
of more than 80%, whereas approximately one-tenth is consumed by the medium-voltage
switchgear. Mainly used in 126–252 kV high voltage, 330–800 kV EHV fields, particularly in
126, 252, and 550 kV GCB, GIS, C-GIS, and GIL [9]. Reasonable and correct use of SF6 gas
reduces emissions to a nonregulation point. Natural Resources Defense Council, an
environmental organization that compares the climate commitments of all countries, believes
that the commitments of the EU, US, and China can be ranked in the world’s top three. However,

9
these three countries are also the major emitters of greenhouse gases in the world [10]. Thus,
they need to limit the use of greenhouse gases, particularly SF6.
SF6 enters into the atmosphere through normal leak, commissioning, maintenance, and SF6
gas recycling. At present, measures to reduce SF6 emissions include the following: the regular
use of advanced SF6 leak detection equipment to detect leakage in SF6 gas-insulated equipment
and the timely use of advanced materials to plug the leak site [11], research and application of
SF6 gas recycling technology, and the use of SF6 gas mixture instead of pure SF6 gas. These
measures may reduce SF6 emissions to a certain extent, but they cannot eradicate hidden
dangers. Looking for an environmentally friendly alternative to the insulating medium of SF6
with an electrical equipment should not be delayed. Reduction and substitution of SF6 are urgent
problems that must be solved in the electrical switch industry. They are also unavoidable
responsibilities and obligations in power-switching equipment research and manufacturing field.
1.1.3 Toxicity of SF6 and its decomposition products
SF6 and electrical equipment commonly use metals because other organic materials do not
chemically react. However, in a high-power arc, spark discharge and corona discharge, products
such as SF4 are emitted when SF6 breaks down. SOF, SOF2, SO2F2, and other toxic substances
can be generated when SF4 reacts with oxygen in electrical equipment. With water inside, SF4
reacts and generates not only H2SO4 and HF, which cause insulation, breaking performance
degradation, and corrosion of parts, but also HF, SO2F2, SOF2, SO2, and other toxic substances.
SF6 and its decomposition products generate WF4, AlF3, CuF2, and other toxic substances when
they react with copper tungsten alloy electrode, copper, aluminum, and other metal materials,
thereby affecting the properties of metallic materials. Insulating material reacts with toxic
products, such as epoxy phenolic glass insulating member that contains silicon component or
quartz sand. Epoxy resin casting parts use glass as filler. Silicone rubber and grease set off a
chemical reaction, thereby producing SiF4, Si(CH3)2F2, and other products [12].
Other substances cause corrosion in insulation equipment, thereby causing insulation
accident risk and affecting the reliability and normal operation of a power system. In addition,
toxic products pose risks to the health of workers, which may even be life threatening. SF6 is a
simple asphyxiating gas. Contact with this gas may accelerate breathing rate and heart rate. The
gas can also slightly affect muscle coordination, and it can cause emotional irritability, fatigue,
nausea, vomiting, and other symptoms. Repeated exposure to high levels of SF6 may cause
fluorosis and dental fluorosis, and nausea, vomiting, loss of appetite, diarrhea, or constipation
may be experienced. Nosebleeds and sinus problems may also occur. Under normal

10
circumstances, SF6 gas contains oxyfluorides. Hydrolyzing these gas can generate HF, SO2F2,
SOF2, S2F10, and other substances. These substances are strong irritants and directly endanger
human health. Moreover, S2F10 is highly toxic [13]. The summary of clinical symptoms caused
by SF6 by-products is shown in Table 1.2 [14].
Table 1.2 Main clinical symptoms caused by toxic decomposition products of SF6 Decomposition gas of
SF6
Clinical symptoms
SF4
It can cause lung damage, which affects the
respiratory system; its toxicity is similar to
phosgene toxicity.
S2F10
Its toxicity is greater than phosgene toxicity;
the respiratory system is mainly damaged,
which may result in pulmonary edema.
SOF2 It can cause severe pulmonary edema and
mucous membrane irritation.
SO2F2 Inhalation of this odorless gas can quickly
result in death.
SOF4 It can cause lung damage.
HFSO2
It has a strong stimulating effect on the skin
and mucous membranes; it can cause water in
lungs, mucous membrane irritation, swelling,
pneumonia, and respiratory system damage.
The health damage caused by SF6 and its by-products obviously exist. In 1990, Kraut and
Lilis reported six workers who contacted SF6 decomposition products in an appliance repair
facility; the workers were exposed without protection in a closed space for more than 6h [15].
The initial symptoms included shortness of breath, chest tightness, coughing, eye and nose
irritation, headache, fatigue, nausea, and vomiting. These symptoms diminished after
termination of contacting with gas, but the symptoms of four of the six workers lasted for a
month. Lung imaging showed the temporary discrete sheet atelectasis of one of the workers.
Moreover, slight diffuse infiltration on the left lower lobe appeared on a worker. Pulmonary
function tests showed that one worker had transient obstructive changes. The result of the
examination was normal after a follow-up one year later. In 1988, Pulling and Jones reported
two workers who entered a high-voltage circuit breaker equipped with a tower [16]. The circuit
breaker had SF6 concentration of 1500 ppm and SO2F2 concentration of 50 ppm. The workers
experienced dyspnea, hemoptysis, cyanosis, and other symptoms. For the safety of power line

11
workers, a nontoxic alternative to SF6 gas must be used to avoid the recurrence of the
aforementioned incidents.
Therefore, SF6 use in electrical equipment aggravates greenhouse effects. It also has
security implications for power line workers. Searching for safe, reliable, environmentally
friendly, and high-performance insulation alternative gases is necessary, and their use must be
promoted.
1.2 Research Actuality
In 1900, SF6 gas was first synthesized directly with elemental sulfur and fluorine by Lebeau
and Modsson from Université de Paris, France. SF6 is a non-combustible gas with good
insulating properties and quenching arc performance. By 1938, Cooper from American
suggested it as an insulating medium. In the same year, V. Grosse from German has proposed
SF6 as arc media of the high-voltage circuit breaker. SF6 gas was supplied commercially in 1947.
Until 1955 the world's first SF6 circuit breakers was made by Westinghouse Electric
Corporation and put into operation in the 115kV grid. Since then, SF6 has been widely used in
various types of high-voltage electrical equipment as insulating medium. Due to strong
electronegativity, high stability and excellent thermal conductivity, even to this day, SF6 is still
the insulating gas with the most extensive range of application and the maximum usage.
1.2.1 Mixture Study in SF6
Since the 1970s, the research on SF6 gas mixture as an insulating material has gradually
expanded. The primary purpose of the research is to solve the issue in extremely cold areas,
where SF6 could easily liquefy. SF6 is expensive and sensitive to nonuniform electric field and
other issues. The international discussion on SF6 mixed gas began in the 1950s [17]. During the
1970s, scientists at the University of Windsor applied direct current, alternating current, and
pulse voltage breakdown in a uniform and nonuniform electric field to study the breakdown
characteristics of SF6 (with air, N2O, and N2) gas mixture. The dielectric strength of a SF6/N2
(including 50%–60% SF6) mixed gas can reach 85%–90% of pure SF6, and it can increase the
breakdown strength in pulse and a nonuniform electric field. An 800 kV transmission line that
uses mixed gas costs only 21% of pure SF6, and the pressure of which can be higher than the
SF6 pressure of 600 KPa [18].
In the 1980s, Qiu Yuchang from Xi’an Jiao Tong University led a team to study the
insulating properties under different field conditions of SF6 and air, N2O, N2, CO2, and other
hybrid gases. The team collaborated with domestic manufacturers to develop a hybrid SF6 GIT,

12
capacitor, switchgear, and other electrical equipment [19, 20]. Zhao Hu and Li Xingwen of Xi’an
University studied the insulation characteristics of SF6/CF4 mixed gas[21]. SF6 mixed gas was
also applied as an insulating medium power equipment in actual engineering. The world’s first
SF6/N2 mixed gas-insulated transmission line operated in the early 2000s in the international
airport of Geneva, Switzerland[22]. Elecricite de France (EDF) works with Asea Brown Boveri
Ltd. (ABB) to develop long-range SF6/N2 gas mixture GIL to eliminate the negative effect of
overhead transmission lines on the environment and to lessen SF6 in the mixed gas by 30% by
replacing the 420 kV overhead transmission line in France [23]. At present, many scholars are
studying SF6 gas mixture. The demand of high-voltage equipment based on the DC in the power
system construction is gradually increased. Scholars at North China Electric Power University
investigated the SF6/N2 gas mixture in the DC voltage affected by metal particles and
liquefaction temperature issues [24]. The promotion and use of SF6 mixed gas-insulated electric
equipment can reduce the use and SF6 emissions to a certain extent.
1.2.2 Research on electronegative gases and mixtures as SF6 substitute
Although SF6 gas mixture can reduce the use of SF6 to a certain extent, using the latter in
high-voltage equipment cannot be completely avoided. Thus, scholars began searching for an
insulating gas substitute for SF6. Its physical and chemical properties must be determined
according to the structural characteristics to meet or exceed SF6 insulating properties. Gases
with similar characteristics must be determined as well. SF6 is an electronegative gas. The
attached cross section is relatively large, and the electron can be easily absorbed into the anion.
The moving speed of the anion is considerably smaller than that of electrons. Complex reaction
between anion and ion may occur easily. Thus, charged particles in gas are greatly reduced,
thereby causing difficulty in the formation and development of discharge. In addition,
electronegative gas molecular usually is so large that its free path is short. Sufficient energy
cannot be obtained easily. Thus, collision ionization cannot occur effectively, thereby increasing
the electric strength of SF6. Therefore, stable, nontoxic electronegative gas molecules can be
used as an alternative because of their advantage in physical properties.

13
Fig. 1.1. Structure of SF6
In the 1980s, Devins studied the breakdown voltage of certain electronegative gases such
as CF4, C3F8, C4F10, and C2F6. These gases are ranked as follows according to their insulating
properties: C6F14 > C4F10 > C3F8 > C2F6 > CF4 [25]. In the early 1990s, a study [26] determined
that CF2Cl2 has a dielectric strength similar to that of SF6, whereas mixed gas CF2Cl2-CO2 has
insulation properties similar to those of CF2Cl2-N2 when they are in the same concentration.
However, compared with SF6-CO2 in the same concentration of electronegative gases, the
insulation properties are different. In the late 1990s, the problem of greenhouse effect worsened;
thus, the electrical field research opened a new chapter on new alternative gases. Some
hydrofluorocarbons (HFCs) and perfluorocarbons (PFCs) gained attention because of their
excellent dielectric properties and relatively low greenhouse effect. Takuma In order to solve
the problem, Tadasu et al. from Kyoto University investigated the physicochemical properties
and insulating property of pure c-C4F8. They determined that its insulating property in the
uniform electric field is 1.18 to 1.25 times higher than that of SF6. However, this gas has a high
liquefaction temperature and cannot be used in high-altitude areas [27]. Yamada Hiroaki et al.
from the same laboratory mixed c-C4F8 with N2 to solve the problem. On the basis of streamer
theory, the withstand voltage of the mixed gas was studied with Boltzmann equation analysis.
This withstand voltage was compared with that of SF6/N2 mixed gas [28]. Then, they discussed
the insulating properties of three mixed gases, namely, c-C4F8/N2, c-C4F8/air, and c-C4F8/CO2,
under the ball-board electrode and needle-board electrode. They also studied the possibility of
using these mixed gas into GIL. The three mixed gases of c-C4F8 have a similar dielectric
strength of SF6/N2 in the quasi-uniform electrical field. The dielectric strength is higher than
that of SF6/N2 in the uniform electrical field. c-C4F8/N2, c-C4F8/air, and c-C4F8/CO2 are the
mixed gases with synergistic effect[29]. This research team also studied C3F8/N2 and C2F6/N2

14
mixed gases in terms of breakdown and partial discharge (PD), and these gases were compared
with SF6/N2[30]. Xiao Dengming et al. from Shanghai Jiao Tong University recently studied the
insulating properties and discharge mechanism of c-C4F8 mixed with some buffer gases, such
as N2, CO2, N2O, CHF3, and CF4. They measured the electronic collapse current in the condition
of steady-state Townsend (SST) discharge, and they determined ionization coefficient α,
adsorption coefficient η, and effective ionization coefficient (α−η). Then, they obtained the
critical electric strength (E/N)lim. They also compared the results with SF6 mixed with the same
buffer gases. The study showed that the dielectric strength of c-C4F8/N2, c-C4F8/CO2, and c-
C4F8/CF4 almost linearly increases with the increase of c-C4F8 mixing ratio. The frequency
dielectric strength of c-C4F8/N2 is similar to that of SF6/N2. The best-mixing ratios of c-
C4F8/CO2 and c-C4F8/N2 in AC dielectric strength are 10% and 20%. Compared with c-
C4F8/CO2 and c-C4F8/CF4, c-C4F8/N2 and c-C4F8/N2O have advantages in replacing SF6 when
the ambient temperature is above 0 °C. Compared with 10% c-C4F8/CO2/N2 and 10% c-
C4F8/CO2/N2O, 10% c-C4F8/N2O/N2 has advantages in replacing SF6 when the ambient
temperature is above −20 °C. These mixed gases are ranked as follows according to their
insulating properties: c-C4F8/N2 > c-C4F8/CHF3 > c-C4F8/CO2 > c-C4F8/CF4. Compared with the
critical electric field strength of some buffer gases, c-C4F8/N2, c-C4F8/N2O, c-C4F8/CO2, and c-
C4F8/CF4 have synergistic effects. However, c-C4F8 precipitate carbon atoms in discharging
decomposition, thereby reducing the insulating properties of the gas-insulated medium [31–36].
The Institute of Electrical Engineering of the Chinese Academy of Sciences studied the PD
property of c-C4F8/N2 in different atmospheric pressures, ratios, and electrode distances. The
findings proved that the initial voltage in PD of the pure c-C4F8 is approximately 1.3 times
higher than that of the pure SF6 gas. c-C4F8 has a synergistic effect with N2, and the synergistic
coefficient is approximately 0.45[37]. They also studied the decomposition products of c-C4F8
and N2 mixed gas in faults, such as local overheat, PD, spark discharge, and arc discharge. They
also discussed the danger of the decomposition products [38]. Tokyo Electric Power also studied
the breakdown characteristics of C3F8 and C2F6 mixed with N2 and CO2. The study showed that
mixed gas with 20% C3F8 and 80% N2 shows good characteristics. Researchers from Xi’an
Jiaotong University studied and calculated the joint behavior of C3F8 at room and high
temperature, and they determined that C3F8/N2 has excellent insulating properties at room
temperature. It is also far superior to other mixtures of buffer gas and C3F8. However, the
dielectric properties of C3F8 are inferior to those of SF6 at a high temperature [40].
Scholars completed a comprehensive study on c-C4F8, C3F8, and other potential substitute
gases, and their excellent insulating properties were proved. However, these PFC discharges at

15
high energy may precipitate carbon, and the insulation capacity may be affected. Their
performance is easily affected by temperature and electric field conditions, compared with SF6
instability. Although C4F8 and C3F8 are not typical greenhouse gases, their GWP remains high
at 8700 and 7000, respectively. Their atmospheric lifetime of survival are 3200 years and 2600
years, respectively. The problem of potential greenhouse problems in insulation gas cannot be
fundamentally solved. At this stage, the best studied c-C4F8 liquefaction temperature is high (at
standard atmospheric pressure of −6 °C). They cannot be used in low-temperature high-pressure
areas, which limit the development of related equipment manufacturing industry. Therefore, the
feasibility of alternative gases must be explored.
1.2.3 Research on CF3I gases and mixtures as SF6 substitute
In recent years, CF3I has attracted attention in the research field of dielectric materials as a
stable and typical electronegative gas. A mixed gas CF3I with the buffer gas in the physical and
chemical properties, thermodynamic properties, and electrical performance is outstanding. CF3I
is also the most promising insulating gas alternative to SF6 that we have found in recent years.
Thus, scholars have been conducting research on CF3I.
1.2.3.1 Physicochemical property
CF3I is a synthetic gas with a molecule that consists of three fluorine atoms and one iodine
atom in the composition of a central carbon atom, as shown in Figure 1.2. A fluorine atom is
the highest electronegative atom in nature; an iodine atom and a carbon atom have relatively
high electron affinity (+295 kJ/mol and +122 kJ/mol) [41]. They also have high electronegativity.
Therefore, three kinds of atomic electrons, which are easily absorbed, cannot lose electrons
easily, thereby reducing the number of free electrons in CF3I gas and suppressing the generated
and developed gas discharge.
Fig. 1.2 Structure of CF3I
CF3I is the preferred alternative of Halon 1301 as fire extinguishing agent, which was
certified by American National Fire Protection Association (NFPA) standard agent. It has been

16
applied widely in the semiconductor etching, blowing agents, and other fields. CF3I gas is
colorless, odorless, and nonflammable [42, 43]. It has GWP of less than 5, which is far below that
of the SF6 gas. The atmospheric lifetime of CF3I gas is only 0.005 years, and its environmental
impact is minimal. Its ozone depletion potential (ODP), which is related to placement, is only
approximately 0.006 to 0.008 [44, 45]. The polar bond (C-I bond) of CF3I is relatively easy to
break. Thus, irradiation decomposition may occur in troposphere, and most CF3I cannot reach
atmosphere. Table 1.3 shows the basic properties of CF3I and SF6.
Table 1.3 General properties of CF3I gas [46-48]
Gas CF3I SF6
Color Colorless Colorless
Odor Odorless Odorless
Water-soluble Trace Trace
Inflammability Nonflammable Nonflammable
Relative molecular mass 195.91 146.05
GWP <5 23900
ODP 0.006–0.008 0
Atmospheric lifetime (years) 0.005 3200
Liquefaction temperature (0.1 MPa) −22.3 °C −63.9 °C
Bond dissociation energy
(kcal/mol) 54 (I-CF3) 92 (F-SF5)
Electron affinity (kJ/mol) 150 ± 20 138
Radiation efficiency (Wm-2 pb-1) 0.23 0.52
In the normal pressure, the liquefaction temperature of CF3I is −22.5 °C, which is lower
than that of c-C4F8 (−6 °C) and higher than that of SF6 (−63.9 °C). This property is a
disadvantage of CF3I as an insulating gas. The relatively high liquefaction temperature makes
the pure CF3I difficult to use directly, and CF3I needs to be mixed with buffer gases that have
relatively low liquefaction temperature. According to Dalton’s law of partial pressures, the
partial pressure of CF3I is only 0.15 MPa when mixed gas CF3I/CO2 (30%/70%) is at 0.5 MPa
and the liquefaction temperature is below −12.5 °C [49]. The problem of high liquefaction
temperature can be avoided to a certain extent. When the insulating properties are not
considered, the mixed gas can meet the majority of the requirements of the insulating equipment.
1.2.3.2 Decomposition characteristics and toxicity
Similar to SF6, CF3I may produce some decomposition by-products after severe discharge.
The destructiveness should be examined to propose targeted countermeasures by studying the
product. The major products can be the characteristic components to judge the discharge
problems, and the result can be applied to new online insulation monitoring devices in the future.

17
Kyushu Institute of Technology used Gas Chromatography-Mass Spectrometer to examine the
decomposition products of CF3I and the changing trends of the decomposition products under
different discharge quantities of PD. They determined that the decomposition products of CH3I
by PD include C2F6, C2F4, C2F5I, C3F8, CHF3, C3F6, and CH3I. CH3I appears after a certain
period in PD. Decomposition products mainly include C2F6, which is followed by C2F4. Other
product contents are low. The content of these products is ranked as follows: C2F6 > C2F4 >
C2F5I > CH3I > C3F8 > CHF3 > C3F6. The discharge products increase rapidly and stabilize
gradually with the increase of cumulative charge. After PD, except for CHF3 gas, the content
of other products gradually stabilized within a few hours after a small decline. The content of
CH3I fluctuates after a sharp decline, and it cannot be fully restored to its original state after PD
[50]. Takeda Toshinobu from University of Tokyo studied the decomposition products of CF3I
when a breakdown or insulator surface flashover occurs in a severe nonuniform electric field
and in a slightly uneven electric field. They determined that C2F6, C2F4, CHF3, C3F8, C3F6, and
C2F5I are by-products after a severe discharge. They also determined that C2F6 remains as the
major product that is independent of electric field uniformity. CF3I has a strong resiliency. After
1400 times breakdown, the content of C2F6 is only 150 ppm [51]. After a long-time severe
discharge, trace solid iodine precipitates, namely, I2 and C2F6, were mainly derived from the
chemical reaction: 2CF3I→C2F6+I2. Czech Academy of Sciences Institute of Physics studied
the process of decomposing atom iodine in glow discharge via oxygen–iodine laser [52]. Russia
Troitsk Institute of Innovation and Integration studied and suggested that I2 is produced
primarily by electron collision and dissociation of CF3I [53].
C2F6 can be produced with high voltage and severe discharge. As an electronegative gas,
C2F6 has superior insulating properties. However, iodine precipitation may lead to a decline of
dielectric strength. After many longtime high-voltage breakdowns that occurs more than 1300
times, the flashover voltage of CF3I decreases at 11% [54]. Kasuya et al. from Tokyo Denki
University proposed to use high purity-activated carbon C2X as adsorbent to avoid the decline
of the insulating properties of CF3I with iodine precipitation after a long and severe discharge
by eliminating the trace iodine vapor generated during discharge [44]. The content of CF3I
decreases by mixing buffer gases to reduce the probability of C-I bond breakage, which curbs
the generation of C2F6 and I2.
The harmful effect of SF6 on humans has been confirmed. CF3I is the most promising
alternative of SF6; thus, its toxicity is a wide-ranging concern. According to an animal breathing
experiment, CF3I shows slight toxicity. The Toxicology Committee of the US National
Research Council stated the following: human beings in the production, transportation, and

18
storage process will inevitably come into contact with CF3I. In general, CF3I has low toxicity,
and it causes no harm to the human immune and reproductive systems [55]. The committee set
0.2% CF3I for heart sensitivity as no observed adverse effect level, whereas the lowest observed
adverse level is 0.4%.
The median lethal concentration (LC50) of CF3I to Sprague Dawley rats is approximately
27.4%. A potential health hazard exists in the area of cardiac sensitization following acute
exposure to concentrations of CF3I greater than 0.2%. The effect of CF3I on reproductive
parameters is equivocal. Exposure to CF3I could possibly be reduced through use of personal
protective equipment and engineering methodologies [48]. The standard of the American
Compressed Gas Association divides CF3I into nontoxic gases [56]. As a discharge
decomposition product, C3F8 (Perfluoropropane) needs significant attention. If workers inhale
a significant amount in a short time, they can experience dizziness, weakness, poor sleep, and
other symptoms. Thus, wearing protective gear is important when contacting with C3F8.
However, C3F8 takes a small proportion in the discharge products in the aforementioned works.
A study [57] showed that a flashover discharge only produces 0.00122 ppm C3F8 in the uniform
electric field and 0.000501 ppm in the uneven electric field. The minimal content is insufficient
to cause harm to humans. Even if CF3I is characterized by low toxicity, its concentration should
be decreased by adding buffer gases to ensure safety.
1.2.3.3 Thermodynamic characteristics
In the 1990s, Duan Siyuan et al. from Tsinghua University first studied the thermodynamic
characteristics of CF3I systematically and comprehensively when they examined the substitute
of refrigerants. They measured the saturated vapor pressure of CF3I at the temperature from
below the normal boiling point temperature to the critical temperature. They also established a
high-precision saturated vapor pressure equation and the vapor state equation. According to the
position of the gas–liquid interface disappearance and the critical opalescence strength, they
identified the critical temperature of CF3I (396.44 K) and its critical density (868 kg / m3). They
also identified the critical pressure (3.953 MPa) by calculating vapor pressure measurements,
and they measured the saturated liquid viscosity, gas-phase area thermal conductivity
coefficient, and speed of sound [58].
Yokomizu et al. from Nagoya University Japan investigated high-temperature plasma of
CF3I/CO2. They determined that the conductivity of CF3I/CO2 increases with the increase of
CF3I when the temperature is below 10kK. Its thermal conductivity is related to CF3I when the
temperature is approximately 7000 K. Its conductance of arc declines when the mass fraction

19
of CF3I is higher than 0.9 in the mixed gas, and the arc quenching capacity strengthens [59].
Yann Cressault from Laplace Laboratory in France calculated the equilibrium composition of
mixed gas (air/CO2/N2 mixed with CF3I). Its thermodynamic properties (i.e., mass density,
enthalpy, and specific heat) and transmission characteristics (i.e., conductivity, thermal
conductivity, and viscosity) were determined and compared with the statistics of SF6. The
results confirmed that the thermal conductivity of CF3I was close to that of SF6, and the
capacities, such as heat conduction and interrupter of CF3I, could reach the level of SF6. The
gas mixed by CF3I and air/CO2/N2 has conductivity lower than that of pure SF6, thereby proving
that CF3I and its mixed gases have good breaking capability and are better at inhibiting the
production and development of discharge than SF6[60]. The study on CF3I and its
thermodynamic properties of gas mixture provides a theoretical basis for their engineering
application.
1.2.3.4 Electrical performance
Before gas is used as an insulating medium for high-voltage electrical equipment. It is
necessary to study its insulating properties and main electrical parameters. The insulating
properties, including breakdown characteristics, volt–second (V-t) characteristics, PD
characteristics, and arc resistance are determined mainly through experiments. CF3I exhibits
good physical and chemical properties, decomposition characteristics, and thermodynamic
properties. As a result, it has become one of the most promising alternatives to SF6 in recent
years. Researchers conducted experimental and theoretical studies to expand its insulating
properties.
① Breakdown characteristics
Toyota and Nakauchi et al. from Tokyo University first used the up-and-down method to
measure the 50% breakdown voltage of CF3I and SF6 at 0.1 MPa under the rod-board electrode.
They determined that when the distance of electrodes is 10 mm, the breakdown voltage of CF3I
is 0.74 times higher than that of SF6 under positive voltage. However, it is 1.17 times higher
than that of SF6 under negative voltage. Under low pressure, the breakdown voltage of CF3I is
relatively lower than that of SF6 in spark discharge with low utilization factor of the electric
field and the uneven electric field [57]. Researchers from Tokyo Denki University measured the
50% breakdown voltage of pure CF3I, CF3I/CO2, and pure SF6 by applying the standard
lightning impulse voltage under the ball–ball gap. The breakdown characteristic of pure CF3I
is 1.2 times as much as that of pure SF6. When the content of CF3I is 60% in the CF3I/CO2
mixed gas, its insulating strength can reach the level of pure SF6 and the insulating strength of

20
mix gas CF3I/CO2 (CF3I/CO2) is 0.75–0.8 times as much as that of pure SF6. The breakdown
strength of CF3I/CO2 mixed gas increases linearly with the increase of the volume fraction of
CF3I [61]. Researchers from the University of Grenoble in France used ball–ball electrode model
to simulate the quasi-uniform electric field to test the DC insulation breakdown characteristics
of CF3I and CF3I/N2 gas mixture. At the same mixture ratio, the breakdown voltage of CF3I/N2
is lower than SF6/N2. The increase of CF3I ratio results in a linear growth trend of the DC
breakdown voltage of the CF3I/N2 gas mixture; however, SF6/N2 exhibits a nonlinear growth
trend [62]. Takeda from Tokyo University studied the breakdown characteristics of CF3I in a
different electric field. The 50% breakdown voltage is higher than that of SF6 when the electric
field utilization factor is greater than 0.38. Under the uniform electric field, the breakdown
voltage of CF3I is 1.2 times as much as that of pure SF6, but it declines to 0.7 under the
nonuniform electric field [63]. Researchers from Cardiff University tested the breakdown for the
mixed gas under the rod-board electrode, ball–ball electrode, and board–board electrode to test
the influence of the uniformity of electric field to 30%/70% CF3I/CO2. The result showed that
the breakdown voltage of the mixed gas increases with uniformity or long distance of electrodes
[64]. Tu Youping from North China Electric Power University proved that the insulating property
of 30%/70% CF3I/N2 is similar to that of 20%/80% SF6/N2 [65].
The breakdown occurs in the gas and on the contract surface of the gas and solid. Thus, the
flashover of gas on the surface of solid should be considered. Takeda et al. studied the insulating
properties under the impulse voltage on the surface of pure CF3I and polytetrafluoroethylene.
The first flashover voltage along the surface of CF3I is 1–1.2 times as much as that of pure SF6,
and then it declines to approximately 0.6 times and remains at that level. Solid iodine
precipitates on the interface and influences insulation [59].
② Voltage–time characteristic
Voltage-time (V–t) characteristic is a way to show the breakdown characteristic, and it is
significant in insulation coordination. It is also an important characteristic to evaluate the
insulation property. Takeda from Tokyo University compared the V–t characteristics of CF3I
and SF6 under the condition of 16 ns of the front time and the peak of 200 kV of the impulse
voltage. The result showed that the voltage–time characteristic of CF3I increases with the high
use ratio of the electric field. At low use ratio, the V–t characteristic of SF6 improves [59]. This
team used the same impulse voltage to investigate the V–t characteristics of CF3I/N2, CF3I/air,
and other mixed gases under the condition of 0.89 of the electric field use coefficient and 10
mm of the electrode distance at the ball-plate electrode. The result showed that when the mix
21
ratio of CF3I reaches 60%, the V–t characteristic of CF3I/N2 or CF3I/air mixture gas is similar
to that of SF6[43]. Compared with SF6, the uneven degree of the electric field has a significant
effect on the V–t characteristics of CF3I [59].
③ Characteristics of PD
PD is the early stage of insulation failure of electrical equipment and is a key factor that
causes serious fault breakdown. Thus, the characteristics of PD in CF3I must be studied.
Researchers from Kyushu University of Technology measured the PD inception voltage of pure
CF3I and SF6 in the needle plate electrode. They determined that the negative half cycle initial
discharge voltage of CF3I is nearly equal to that of SF6 under 0.1 MPa [66]. Xiaoxing Zhang
from Chongqing University examined the PD performance of CF3I and CF3I gas mixtures and
analyzed the influence of mixture ratio, pressure, and electrode spacing factors on the properties
of power frequency and PD of the two gas mixtures, namely, CF3I/N2 and CF3I/CO2. The results
showed that buffer gases, such as N2 and CO2, can reduce the liquefaction temperature of mixed
gases. The PD inception voltage of CF3I/CO2 gas mixture was 0.9–1.1 times as much as that of
SF6/CO2 under the same conditions. When the volume fraction of CF3I was 30%–70%, the PD
performance of CF3I/CO2 gas mixture was approximately 0.74 times as much as that of pure
SF6. When the volume fraction of CF3I was 20%, the PD inception voltage of CF3I/N2 gas
mixture was 0.92–0.94 times as much as that of SF6/N2 gas mixture under the same conditions.
The characteristics of PD of CF3I/CO2 gas mixture showed a favorable synergistic effect and
the value of synergistic effect was 0.53 [6, 67, 68].
④ Arc extinguishing (breaking) performance
Researchers from Tokyo Mechanical and Electrical University studied the breaking
performance of CF3I, CF3I/CO2, and CF3I/N2 gas mixtures in the open close fault (SLF) and at
the end of circuit breaker (BTF). They determined that the breaking performance of CF3I in
SLF was 0.9 times as much as that of pure SF6. The breaking performance of CF3I/N2
(20%/80%) gas mixture in SLF, relative to that of CF3I, was closer to that of N2, whereas the
breaking performance of CF3I/CO2 gas mixture containing the same proportion of CF3I in SLF
can achieve 95% that of pure CF3I, which is considerably better than that of CO2. The breaking
performance of CF3I in BTF was 0.67 times as much as that of SF6, and the breaking
performance of CF3I/CO2 (30%/70%) gas mixture in BTF was 0.32 times as much as that of
SF6. The breaking performance of CF3I/CO2 gas mixture containing the same proportion of
CF3I in SLF was nearly the same as that of pure CF3I. In SLF and BTF, the breaking
performance of CF3I/CO2 showed nonlinear growth with the increase of CF3I mixing ratio,

22
whereas the breaking performance of CF3I/N2 gas mixture exhibited approximately linear
growth [61, 69]. Researchers from the University of Tokyo studied the arc quenching performance
of CF3I and its mixed gases in arcing chamber model and calculated the arc power loss
coefficient and arc time constant of CF3I, SF6, and some buffer gas with Mary formula. The
breaking performance of CF3I and its mixed gases in SLF was also evaluated. The results
showed that the relationship of the power loss coefficient of each gas was H2 > SF6 > CO2 >
Air > N2 > CF3I, and the relationship of arc time constant was SF6 < CF3I < CO2 < H2 <Air <N2.
The breaking performance of pure CF3I in SLF was 0.9 times as much as that of pure SF6 in the
same conditions. The breaking performance of CF3I/CO2 gas mixture showed
a favorable synergistic effect, whereas the synergistic effect of the breaking performance of
CF3I/N2 gas mixture was not obvious. The breaking performance of CF3I/CO2 gas mixture in
SLF was nearly the same as that of pure CF3I when the mixing ratio of CF3I reached 20% [46].
⑤ Study on the Mechanism
The free electrons play an important role in the generation and development of gas
discharge. Reducing its number and speed and improving the ionization energy can effectively
improve the dielectric insulation level and arc extinguishing characteristics. Insulation gas
molecules should be electronegative to reduce the amount of free electrons. They can adsorb
electrons and control the ionization cross section to reduce the supply of free electrons.
Reducing the moving speed of free electrons can be convenient for electronic capture. The
energy of electron impact ionization should be as high as possible to avoid or curb the
development of electron avalanche. The research on discharge mechanism is helpful to analyze
the development process of gas discharge current and to determine the effective methods of
restraining the breakdown. The scholars study the CF3I and its mixed gas based on these
findings.
For the insulating gas, the smaller the electron drift velocity Ve is, the better its insulating
property is. Ve is generally linear with the equivalent electric field (E/N). E is the electric field
(V/cm), and N is the gas density (mols/cm3) [70]. Researchers from Hokkaido University
calculated the electronic group parameter, electronic drift velocity Ve, and ionization coefficient
(α-η)/N of CF3I at critical electric field. The results showed that in the low E/N range, the
electron adsorption ability of CF3I was stronger than that of CF4, whereas the critical electric
field strength (E/N)Lim was higher than that of CF4 [71]. Urquijo studied the electron drift velocity,
effective ionization coefficient, and critical electric field strength parameters of CF3I and its
mixed gases through pulsed Townsend experiment. The results showed that the electron drift

23
velocity of pure CF3I was slightly lower than that of SF6, whereas the (E/N)lim of pure CF3I was
437 Td (1 Td = 10−17V cm2). It was larger than that of pure SF6, which was 360Td. The Ve of
CF3I/CO2 gas mixture was lower than that of CF3I/N2 when CF3I/CO2 gas mixture and CF3I/N2
gas mixture contained the same proportion of CF3I [72]. Dengming Xiao from Shanghai Jiaotong
University also studied the aforementioned parameters by solving the Boltzmann transport
equation under the steady-state Townsend (SST) test conditions. He confirmed that the CF3I/N2
gas mixture performed better than CF3I mixed with Ar, Xe, He, N2, or CO2. The performance
of CF3I/CO2 ranked the second [73]. The variation trend of the electron drift velocity of CF3I/N2
gas mixture with the electric field was nearly the same as that of SF6 and that of CF3I/CO2 gas
mixture when the CF3I mixing ratio was higher than 70%. The (E/N)lim of CF3I/CO2 gas mixture
and that of CF3I/CO2 gas mixture could attain that of pure SF6, so could that of CF3I/CO2 gas
mixture. The when the CF3I mixing ratio reached 75% [74]. Researchers from the State Key
Laboratory of power equipment and electrical insulation at Xi’an Jiao Tong University
calculated the α/N, η/N, (α-η)/N, and (E/N)lim of CF3I/CO2 gas mixture and CF3I/N2 gas mixture
with different CF3I mixing ratios. They determined that the (E/N)lim of CF3I/N2 was larger than
that of SF6/N2 gas mixture when the mole fraction of CF3I was larger than 65%. The (E/N)lim
of CF3I/N2 was larger than that of pure SF6 when the mole fraction of CF3I was larger than 70%.
The (E/N)lim of CF3I/CO2 was larger than that of SF6/CO2 gas mixture when the mole fraction
of CF3I was larger than 40% [75].
1.2.4 Conclusion
Compared with the SF6 mixed gas and other potential alternative gases, CF3I shows great
comprehensive strength. CF3I has attracted significant attention because of its excellent
environmental characteristics, relatively stable physical and chemical properties, low toxicity,
and excellent thermal conductivity and insulation characteristics, which are even better than
those of SF6. Thus, CF3I exhibits significant potential. However, with the development of
research on CF3I, several findings determine that it has high liquefaction temperature, is more
likely to decompose than SF6, has slight toxicity when the concentration is high, and has other
defects; thus, buffer gas is needed to improve its performance by reducing liquefaction
temperature, controlling gas decomposition, and decreasing toxicity. Therefore, the researchers
studied the physical properties and electrical characteristics of CF3I mixed gas theoretically and
experimentally. The results showed that the performance of CF3I/CO2 gas mixture is the best.
As a buffer gas, CO2 performs well for defects of pure CF3I, and it shows high synergistic effect
to ensure the insulation performance of gas mixture in the low CF3I content.

24
At present, high-voltage electrical equipment is mainly used in AC voltage. However, the
investigations and experiments on the insulation characteristics of CF3I/CO2 gas mixture in
power frequency voltage are few and are from a single perspective. The investigations and
experiments do not consider the effect of insulation characteristics by different pressures and
electric field environments. The discharge caused by the internal insulation faults of an AC
electrical equipment go through three stages: negative half-cycle PD, positive half-cycle PD,
and breakdown. These three physical processes are the important nodes to generate and develop
the streamer. An experimental study on PD inception voltage and breakdown voltage on
positive and negative half cycle must be performed to conduct a comprehensive inspection of
the insulating ability of the mixed gas. This experimental study should consider the influences
from gas pressure, mixing ratio, and electric field, and these parameters should be compared
with those of SF6 and SF6/CO2 gas mixture to obtain the optimal mixing ratio. Thus, theoretical
and experimental bases can be provided for the application of CF3I/CO2 in various types of AC
high-voltage electrical equipment.
Free metal particle is one of the most worrying defects in SF6 dielectric medium in slightly
uneven electric field. It may dramatically reduce the level of insulation of a gas-insulated
electrical equipment. The existence of free metal particles leads to a decrease of SF6 insulation
strength by up to more than 80%. It can also cause the insulation failure of SF6 [76]. A study on
the simulation and experiment of the influences of free metal particles on the insulation
performance of SF6 has been reported [77-79]. The study confirmed that the existence of fine
particles can seriously affect the PD characteristics and breakdown characteristics of SF6 gas
and can lead to the change of SF6 decomposition products. As a potential substitute of SF6, the
discharge characteristics of particles in CF3I and CF3I/CO2 gas mixture must be studied.
The type of decomposition product of CF3I in the discharge process and its toxicity has
been studied through experiments. However, the theoretical analysis on the decomposition
process is lacking. Thus, the key factors that induce and promote the chemical decomposition
of CF3I during the discharge process cannot be judged. Simulation research on the conditions
and steps of product generation is needed to avoid discharge decomposition and to provide a
theoretical basis for the future use of the decomposition component in monitoring the insulation
failure of CF3I gas insulation equipment by understanding the influence of the decomposition
process on the insulation performance of CF3I and by proposing appropriate measures.
Micro moisture has a significant effect on the discharge development and decomposition
process of SF6. It is also the key factor in failure. However, studies on the effect of micro
moisture on the characteristics of CF3I discharge plasma and the type of decomposition

25
products are lacking. Micro water is a potential substitute for gas; thus, its degree of influence
and its mechanism should be investigated.
1.3 Research purpose and technical route
At present, the research on the substitution of SF6 with CF3I and its mixed gas applied to
high-voltage electrical equipment remains at the exploratory stage. The outstanding
performance and high security of CF3I/CO2 gas mixture in the physical and chemical properties
are proved through the existing works. Therefore, our research subject focuses mainly on the
insulation characteristics of the mixed gas in different conditions and on the effect of micro
moisture on CF3I.
Gas-insulated electrical equipment can inevitably produce many kinds of insulation defects
that gradually deteriorate and lead to insulation failure. The most common electrical insulation
failure feature is the occurrence of PD before the complete breakdown or flashover of insulation.
At present, the main electrical equipment is operated in the power frequency AC voltage. PD is
generated first in the negative half cycle. With the development of the serious degree of
discharge, the positive half cycle begins to produce PD and eventually induces breakdown and
other serious accidents. As the two important symbols of the development of power frequency,
the negative half-cycle PD starting voltage and the positive half-cycle PD starting voltage are
the key parameters to describe the performance of gas insulation. Therefore, this study aims to
investigate the positive and negative half-cycle starting discharge voltage of CF3I/CO2 mixed
gas under different pressures, mixing ratios, and electrode distances under the power frequency
PD tests, and it is compared with that of SF6/CO2 mixed gas and SF6.
The further development of PD results in the tendency of the equipment to break down and
then to stop working. Breakdown voltage is the key indicator of insulation gas pressure strength.
The internal electric field distribution of the actual gas-insulated electrical equipment is
complicated, and the sensitivity of the insulating medium to the electric field directly affects
the insulation capacity of the gas, thereby affecting the safety and service life of the equipment.
SF6 gas encounters a problem of sensitivity to the electric field. Thus, our study aims to
determine the breakdown characteristics of CF3I/CO2 mixed gas under different electric fields
based on the power frequency breakdown test and to discuss the sensitivity of CF3I/CO2 mixed
gas to the uniformity of electric field and the synergistic effect of gas mixtures, combined with
liquefaction temperature factors and characteristics of PD. The mixtures of gas instead of SF6
and the possibility of the optimal ratio are also discussed. We should also analyze the feasibility
and optimal ratio of CF3I/CO2 mixed gas to replace SF6.

26
The existence of free conductive particles in the gas-insulated electrical equipment is
inevitable. The equipment is not completely clean, and the metal particles produced in the
process of production and assembly may be retained inside the equipment. When the equipment
is running, various materials and shapes of metal particles are produced inevitably because of
internal insulation aging, vibration, and other reasons. These free conductive particles attached
to the electrode surface and the insulator surface cause the device to reduce the level of
insulation. A large number of studies [77-79] have shown that the particles affect the performance
of SF6 insulation, thereby possibly inducing PD and causing a breakdown accident. The metal
particles may induce PD when the electric field reaches a certain intensity, and CF3I-metal
hybrid plasma may be generated. Different metal elements lead to different influences on the
thermodynamic properties and transfer coefficient of the plasma. Thus, the development of the
streamer and the discharge intensity differ. In view of this kind of typical fault, our study
investigates the effect of particles on the discharge process of potential substitutes through the
breakdown experiments of CF3I and CF3I gas mixture under different types and numbers of
metal particles and by calculating the thermodynamic properties and transport coefficients of
CF3I-metal plasma.
In the process of synthesis and charging of the insulating gas, some concerns exist, such as
technical limitations or defects in the sealing performance of the insulation equipment. Thus, a
trace of H2O mixed with the insulation gas exists. In addition, the assembly and disassembly
and maintenance of the equipment inevitably lead to entering and tracing H2O on the surfaces
of components and containers. The H2O attached to the wall of the device can diffuse into the
insulating gas when the temperature is raised. A relevant study on the decomposition of CF3I
that considers micro water at the present stage is lacking. However, the effect of micro water
on the decomposition of SF6 gas is well known in the research field and power industry [80].
When moisture exceeds the standard, it can change the characteristics of SF6 decomposition
products and can participate in the production of certain corrosive components. An electrical
equipment is subject to corrosion, which can diminish equipment life [81, 82]. Therefore,
International Electrotechnical Commission (IEC) has developed a strict standard for H2O [83, 84].
As a possible substitute for SF6, the PD decomposition process of CF3I in micro water
environment should be studied. Therefore, our research intends to start with the simulation of
quantum chemistry and to explore the effect of H2O on CF3I in the process of discharge
decomposition and product types. Then, the effect of micro water on its insulation performance
is verified by measuring the discharge capacity of CF3I at different levels of micro water to

27
provide theoretical and experimental data for the water standard of the new gas-insulation
electric equipment.
Based on the preceding research purpose, a comprehensive investigation of CF3I/CO2 gas
mixture is conducted in this study, and an optimal mixing ratio is proposed. We also study the
effects of different metals on CF3I and CF3I/CO2 under particle defect and the harmful effects
of micro water on CF3I insulation. We intend to solve the following key issues:
(1) The double-tank structure gas discharge test device is designed and manufactured to
address the weaknesses of the current discharge test chambers. These weaknesses include
discharging on the floating potential of high-voltage side, inability of the electrode distance to
adjust accurately, and low pressurization of tank.
(2) The positive and negative half-cycle starting discharge voltages of CF3I/CO2 PD are
measured at different gas pressures, concentrations, and electrode distances.
(3) A needle plate electrode, a rod plate electrode, and a ball electrode are designed to
produce a highly nonuniform electric field, a slightly nonuniform electric field, and a quasi-
uniform field.
(4) The simulation calculation of the discharge decomposition process of pure CF3I and
CF3I containing H2O is performed with Material Studio, and the effect of micro water on the
chemical reaction process and product is obtained.
(5) The PD test device and test methods are designed with different micro water contents
in CF3I, and the effect of micro water on the insulation performance of CF3I is verified by
testing the variation of discharge capacity in different micro water contents.
(6) The discharge test apparatus and method of CF3I are designed in different metal
materials and contents, and the effect of different metal particles on the insulation performance
of CF3I is obtained by testing the variation of discharge capacity in different kinds and quantities
of metal particles.
(7) The thermodynamic properties, transport properties, and radiation characteristics of
CF3I-metal plasma are calculated through the plasma thermodynamics, and the effects of
different metal elements on the development of CF3I discharge process are explored.

28

29
CHAPTER 2
RESEARCH ON PARTIAL DISCHARGE CHARACTERISTICS OF
CF3I/CO2 AT POWER FREQUENCY VOLTAGE
The most common electrical failure characteristics of gas insulated electrical equipment are
partial discharge (PD) before the complete breakdown or flashover. Because the high-voltage
electrical equipment accidents are mainly caused by the insulation failure, and the main
manifestations of the early insulation fault is PD, which is not only the main reason of insulation
deterioration, but the characteristics of the insulation condition. As a potential substitute, it is
necessary to study the partial discharge characteristics of CF3I/CO2 systematically.
2.1 Comprehensive experimental platform
Figure 2.1 is the circuit of comprehensive experimental platform for gas discharge
experiment used in this paper. The experiment was based on pulse current method for the
measurement of partial discharge (PD) voltage, according to the standards of IEC60270 [85].
Ambient temperature was controlled at a temperature of 25°C.
Fig.2.1 Experimental circuit
1. Induction voltage regulator: TEDGC-25, input voltage: 220V, output voltage: 0-250V,
rated power 25 kVA;
2. Non corona test transformer: Model YDTW-25kVA/100 kV, it can provide the power
frequency test voltage of 100kV;
3. Protection resistance: R=10 kΩ, it can protect the transformer from being damaged in
breakdown;
4. Capacitive divider: C1/C2=2nf/1μF, the test voltage with high amplitude can be converted

30
into the lower value which can be measured directly by the voltmeter;
5. Voltmeter: Measure the voltage through the capacitive divider;
6. Gas insulation performance test: The device equipped with different kinds of electrodes
and filled with the test gas is used to product PD or breakdown and test the gas insulation
performance;
7、8. Coupling capacitance and non-inductive resistance: The breakdown may cause
damage to the testing equipment. In order to make sure that the pulse current method is safe,
parallel circuit in Figure 2.1 was used;
9. Digital storage oscilloscope: Tektronix DPO7104, channel: 4, bandwidth: 1GHz,
sampling rate: 20GS/s.
The gas insulated performance test device is the most important part in this experiment
circuit, but traditional PD test equipment [67] has some defects. There may be floating potential
discharge between the high voltage terminal and the shell, which may affect the accuracy of the
measured data. Low anti-pressure capability of tank cannot bear high pressure test. These
defects limit the high voltage and high pressure test. Based on the traditional gas insulation
performance test device, we designed the bistratal test device, as shown in Figure 2.2.
Fig.2.2 Bistratal test device for gas insulation performance
The improved gas insulation performance testing device is composed of two parts, the outer
tank and the inner tank. Considering the integration, pressure resistance and practicability of

31
equipment manufacturing, the main body of the double tanks is made of cylindrical structure.
Inner tank is a sealed container with PTFE cover plate and cylindrical high pressure transparent
organic glass. According to the experimental demands, the types of electrodes can be changed,
which can be filled with gas and can be tested by partial discharge, spark discharge and
breakdown. The outer tank is a closed vessel which is composed of a detachable stainless steel
flange and a cylinder shaped stainless steel tank, which is inlaid with an organic glass. The inner
tank is fixed into the outer tank by the support plate, and the high voltage terminal is connected
with the experimental circuit encased by an insulating sleeve. The low voltage terminal is
connected with the outer tank body, and the outer tank body is connected with the ground. The
outer tank is equipped with two vacuum pressure gauges: one is connected to the outer tank
vent, which is used to monitor the pressure inside the outer tank; another one is directly
connected with the inner tank through the gas guide tube, which is used to monitor the pressure
inside the inner tank. And the gas vent can be used for inflation/deflation of inner tank. The
structure of gas insulation performance test device of double tank is shown in Figure 2.3.
1
3
4567
8
910
11
12
13
15 14
19
17
18
20
2
16
(1: Shell of the outer tank, 2: Gas-guide tube, 3: Baro-vacuum gauge, 4: Wire of high-voltage end, 5: Grading shield, 6, 9:
High-voltage guide rod, 7, 10, 16: Insulating bush, 8: Connecting wire, 11: Cover plate of the inner tank, 12: Dead plate of the
inner tank, 13: Shell of the inner tank, 14: Pedestal of the inner tank, 15: Needle-plate electrodes, 17: Support pillar, 18:
Mounting plate of the inner tank, 19: Electrode spacing regulating element, 20: Ground wire)
Fig.2.3 Structure of gas insulation test device
In the experimental process, the outer tank filled with excellent insulation performance gas
(such as SF6). It can inhibit the discharge between the external metal parts of the inner tank and

32
the high voltage side and avoid its interference to the data acquisition of PD signals between
the electrodes. Experimental results show that the applied voltage can be up to 100kV, if
breakdown doesn’t occur between the electrodes. At the same time, the pressure inside the
internal tank can be offset by the outer tank’s pressure, which reduces the differential pressure
between inside and outside of the shell of the inner tank. This increase in experimental tank
pressure range can also avoid the potential danger of experiment in high pressure. After testing,
the maximum pressure of the outer tank is 0.3MPa, the maximum pressure of the inner tank is
0.4MPa. The double tank structure is adopted to raise the pressure level of the inner tank, the
maximum pressure of the inner tank can exceed 0.6MPa. The device can ensure that the
pressure value is constant within 100 hours under vacuum or high pressure state. The distance
of electrodes in this equipment can be accurately adjusted. It is convenient to observe the
experimental phenomenon with the visual window on the external tank. The volume of the inner
tank is small, which can reduce the test cost.
This equipment can produce partial discharge between electrodes. The voltage amplitude
of partial discharge of CF3I/CO2 in each stage was researched so as to detect the insulation
characteristics under different conditions. For this purpose, we choose the needle plate
electrodes, which are easy to produce stable partial discharge. The needle electrode is very sharp,
and the high strength field can be easily formed at the tip of the needle. At the same time, needle
plate electrodes are often used to simulate typical fault types: metal protrusion defect. In
equipment manufacturing, assembly, disassembly and operation and maintenance process, it is
easy to cause this kind of internal faults, which may cause partial discharge or even equipment
insulation failure. Considering the experimental condition and the practical operation, we
choose the needle plate electrodes for the PD experiment.
In this paper, the needle plate electrodes are shown in Figure 2.4. The needle plate
electrodes are made from brass, the length of needle electrode is 17mm, and the length of tip is
7mm, the radius of curvature is 0.3mm. The needle electrode is connected with the inner side
of the inner tank. The thickness of the plate electrode is 8mm, the diameter is 100mm. There is
an inner threaded hole at the center of the plate electrode and it is fixedly connected with ground
rod. The distance between the needle electrode and the plate electrode can be adjusted
accurately by the electrode spacing adjustment component at the bottom of the inner tank
(Figure 2.5). In this way, we can simulate the needle plate discharge with different spacing. In
this experiment, 5mm, 10mm and 15mm were selected as the gap distance between the needle
and the plate, and the effect of electrode distance on the performance of gas insulation was
investigated.
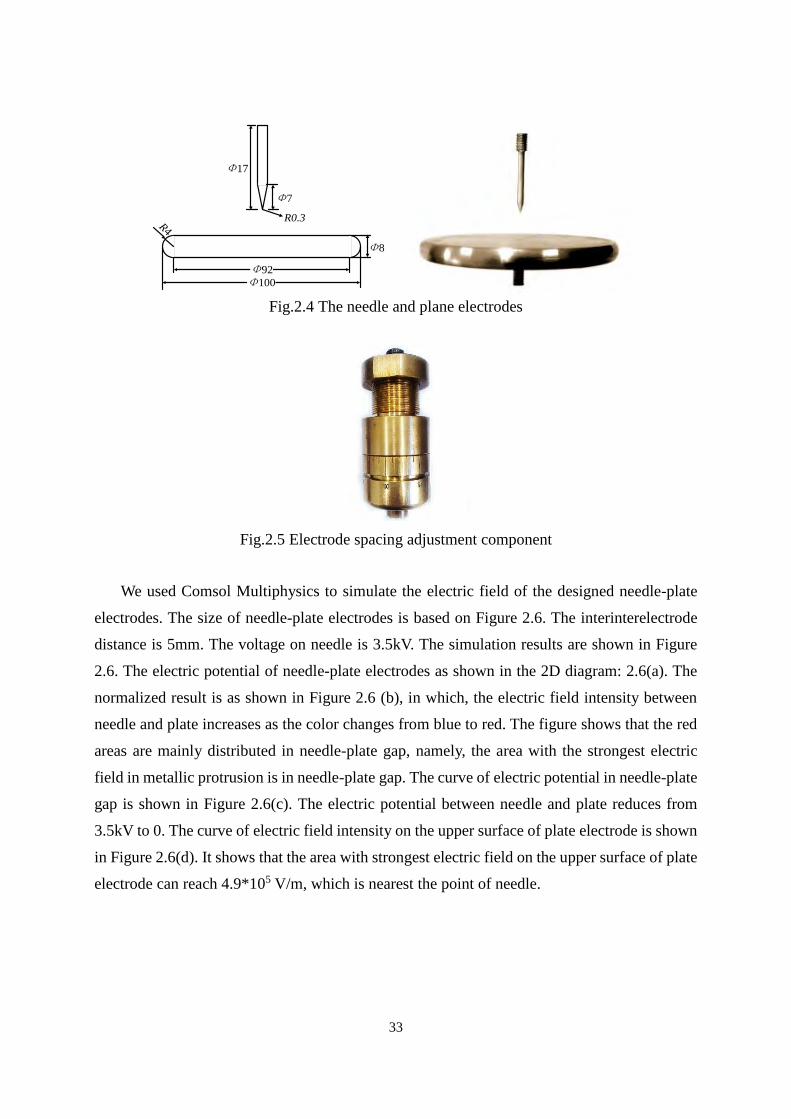
33
Φ100
Φ8
Φ7
Φ17
R0.3R4
Φ92
Fig.2.4 The needle and plane electrodes
Fig.2.5 Electrode spacing adjustment component
We used Comsol Multiphysics to simulate the electric field of the designed needle-plate
electrodes. The size of needle-plate electrodes is based on Figure 2.6. The interinterelectrode
distance is 5mm. The voltage on needle is 3.5kV. The simulation results are shown in Figure
2.6. The electric potential of needle-plate electrodes as shown in the 2D diagram: 2.6(a). The
normalized result is as shown in Figure 2.6 (b), in which, the electric field intensity between
needle and plate increases as the color changes from blue to red. The figure shows that the red
areas are mainly distributed in needle-plate gap, namely, the area with the strongest electric
field in metallic protrusion is in needle-plate gap. The curve of electric potential in needle-plate
gap is shown in Figure 2.6(c). The electric potential between needle and plate reduces from
3.5kV to 0. The curve of electric field intensity on the upper surface of plate electrode is shown
in Figure 2.6(d). It shows that the area with strongest electric field on the upper surface of plate
electrode can reach 4.9*105 V/m, which is nearest the point of needle.

34
(a) Electric potential
(b) The electric field intensity
(c) The curve of electric potential in needle-plate gap
(d) The curve of electric field intensity on the upper
surface of plate electrode
Fig. 2.6 Electric field distribution of needle-plate electrodes
The simulation results of electric field distribution in the experimental container indicate
that the strongest electric field is around the needlepoint, so the simulator can simulate PD in
electrical equipment effectively and be used to achieve data of PD.
2.2 Test method
2.2.1 Preparation before experiment
Before the experiment, the clean silk cloth with anhydrous alcohol was used to clean the
two tanks, to avoid the pollution, metal particles, non-metallic particles, water and other
potential interference. After the cleaning work is completed, the inner tank and the outer tank
need to be placed in a dry and clean environment. Next, finish the assembly work of inner tank
and outer tank, the inner tank was fitted with new and smooth surface electrodes, which can

35
adjust the distance of the electrode according to the experimental requirements, then the device
was fixedly connected with the upper fixing plate by a screw and a sealing ring. The inner tank
was connected with the outer tank high pressure by guide rod, and the low voltage terminal was
connected with the outer tank body. At the same time, the inner and outer tank was connected
through gas guide tube.
After the gas insulation performance test device was assembled, the gas tightness of the test
device was checked. Vacuum pump was used to extract gas from the inner tank and the outer
tank simultaneously. When the pressure gauge reading was less than 0.005MPa, close the vent
valve on the tank and stop pumping gas. Keep this state for more than 60 minutes. If the pressure
reading did not change significantly, which indicated that the gas tightness of the device was
good; the inner tank was then filled with 0.4MPa of CO2, and the outer tank was filled with
0.3MPa of CO2. In order to protect the tank from hyperbaria, the differential pressure between
the inner tank and the outer tank should not be more than 0.1MPa. When the pressure value was
reached, close the vent valves of the two tank and stop the injection.
2.2.2 Gas-filling method
The experiment pressure was set to 0.1, 0.15, 0.2, 0.25, 0.3 MPa (absolute pressure).
Considering the liquefaction temperature of CF3I, toxicity analysis and research status of
insulation characteristics of CF3I/CO2 mixture, the experimental mixing ratio (k) was set to 0%,
20%, 25%, 30%, 40% and 100%. The gas used in the experiment was CF3I gas, CO2 gas and
SF6 gas. Among them, the purity of CF3I gas was higher than 99.9%, the water content was less
than 10ppm; the purity of CO2 was higher than 99.99%, the water content was less than 10ppm;
the purity of SF6 was 99.999%, the water content was less than 10ppm.
According to the requirements of the mixing ratio, intelligent dynamic distribution
apparatus (GC400, as shown in Figure 2.7) was used to accurately prepare mixed gas. After the
gas tightness of the device was checked, the inner tank was filled with the test gas. In order to
eliminate the influence of air and other gas impurities on the experimental results, the inner
tank should be washed before charging. Firstly, vacuum pump was used to exhaust gas from
the inner tank. When the pressure reading reached the limit and no longer changed, stop
pumping. Then, inflate experimental gas (0.1MPa) to the inner tank and exhaust it again. After
the operation was repeated 2~3 times, the tank can be filled in experimental gas of required
pressure.

36
Fig.2.7 Intelligent dynamic distribution apparatus
2.2.3 Experimental method and data collection
CF3I/CO2 and SF6/CO2 were used as mixture gases in this experiment. k is set to 0%、20%、
25%、30%、40% and 100%. The interelectrode distance is set to 5, 10 and 15 mm. Under
different test conditions, the experimental subject is applied with 50 Hz power frequency
voltage [86].
The needle electrode is connected with the high voltage terminal. According to the
simulation above, the strongest electric field is around the needlepoint. The electric field
intensity can reach breakdown field intensity of mixture gas with the increasing of applied
voltage, then PD can be generated. Due to the obvious polarity effect in highly non-uniform
electric field, the negative needle electrode is easy to emit electrons. Electrons move to the plate
electrode quickly and lots of positive space charge is accumulated near the needle electrode,
which increase the electric field intensity there and make it much easier for PD to occur. On the
contrary, when the needle electrode is positive, the positive space charge near the needle
electrode will decrease the intensity of electrical field there and reduce the possibility of PD.
For this reason, the PD starts to appear in the negative half cycle of power frequency, when the
applied voltage is relatively low and the pulses are low and serried. This applied voltage (6.8kV)
at this moment is the partial discharge inception voltages in the negative half cycle of power
frequency (PDIV-) as shown in Figure 2.8(a). With the increasing of the applied voltage, the
electric field intensity between needle and plate increases. Positive ions quickly move to the
needle electrode for neutralizing, while electrons are attached on the neutral molecules to
become negative ions. Negative ions move more slowly than electrons. A large number of
negative ions accumulate between electrodes to reduce the electric field intensity near needle
electrode. With the applied voltage increasing (7.6kV), the magnitude of PD in positive half
cycle of power frequency increases rarely, as shown in Figure 2.8 (b). With the applied voltage
(8.2kV) rising further, a few high magnitude PD pulses begins to appear in positive half cycle,
as shown in Figure 2.8 (c).

37
(a) The inceptive partial discharge in the negative half cycle (6.8kV)
(b) The obvious partial discharge in the negative half cycle (7.6kV)
(c) The inceptive partial discharge in the positive half cycle (8.2kV)
(d) The obvious partial discharge in both positive and negative half cycle (14.7kV)
Fig. 2.8 Waveform records of PD in positive and negative half cycle of power frequency

38
This applied voltage at this moment is the partial discharge inception voltages in the
positive half cycle of power frequency (PDIV+). Because the positive space charge near the
needle electrode can increase the intensity of electrical field between the two electrodes, with
higher applied voltage (14.7kV), discharge area expands to the plate electrode, and PD become
more and more serious until the breakdown phenomena occurs, as shown in Figure 2.8 (d) [87].
Figure 2.8 (a)-(d) came from the experimental data of discharge between needle-plate
electrodes (10mm) in SF6/CO2 (k=20%).
The oscilloscope can explore whether there is PD in experimental container by recording
the pulse signal captured on non-sense detection impedance Z in a cycle of power frequency. If
the applied voltage is high enough, when high voltage alternating current passes needle
electrode and produces negative voltage, PD may produce pulse voltage in the negative half
cycle of power frequency by Z, similarly, positive voltage on needle electrode may produce
pulse voltage in the positive half cycle of power frequency. All these pulse signals will be
showed on the oscilloscope.
2.3 Partial discharge characteristics in the negative half cycle
Because of some defects caused by imperfect manufacture, floating potential caused by
loose parts or poor contact, local overheating, insulation aging and metal particles, there may
be insulation deterioration in electrical equipment, which can also lead to PD. Intensifying PD
eventually leads to insulation fault. Usually, corona inception mainly depends on the negative
half cycle of power frequency, so inception voltages of PD in the negative half cycle of power
frequency is an important criterion of PD performance [88]. This is determined by the process of
point discharge [89]. PD mainly starts in the negative half cycle of power frequency. Figure 2.9 shows the plots of power frequency PDIV- with the gas pressure changes when
the CF3I/CO2 and SF6/CO2 mixing ratios are 10%, 20%, 25%, 30% and 40% with gap distance
of 5 mm. The ratios of the two types of mixed gas PDIV with different mixing ratios under
different gas pressures are summarized in Table 2.1.

39
0.10 0.15 0.20 0.25 0.30
3
4
5
6
7
PD
IV(k
V)
Pressure(MPa)
5mm CF3I/CO
2
5mm SF6/CO
2
k=10%
0.10 0.15 0.20 0.25 0.30
3
4
5
6
7
8
9
PD
IV(k
V)
Pressure(MPa)
5mm CF3I/CO
2
5mm SF6/CO
2
k=20%
0.10 0.15 0.20 0.25 0.30
3
4
5
6
7
8
9
PD
IV(k
V)
Pressure(MPa)
5mm CF3I/CO
2
5mm SF6/CO
2
k=25%

40
0.10 0.15 0.20 0.25 0.30
3
4
5
6
7
8
9
PD
IV(k
V)
Pressure(MPa)
5mm CF3I/CO
2
5mm SF6/CO
2
k=30%
0.10 0.15 0.20 0.25 0.30
5
6
7
8
9
10
11
Pressure(MPa)
PD
IV-(
kV
)
5mm CF3I/CO
2
5mm SF6/CO
2
k=40%
Fig. 2.9 PDIV- of mixtures with the gap pressure changes (5 mm)
Table 2.1 The ratio of PDIV- of CF3I-CO2 and SF6-CO2
Pressure (MPa)
k 0.1 0.15 0.2 0.25 0.3
10% 1.19 1.21 1.22 1.05 1.02
20% 1.13 1.18 1.13 1.16 1.11
25% 1.21 1.16 1.2 1.15 1.08
30% 1.13 1.1 1.16 1.1 1.08
40% 1.08 1.09 1.05 1.12 1.09
Table 2.1 shows that the PDIV- of CF3I/CO2 is approximately 1.2 times that of SF6/CO2
under low mixing ratio of 10% to 25% at low gas pressure of 0.1 MPa to 0.2 MPa, where CF3I
bears gas pressure between 0.01 MPa to 0.05 MPa. The ratio slightly declines with the increase

41
of gas pressure and mixing ratio. Generally, the PDIV- of CF3I/CO2 is approximately 1 to 1.2
times that of SF6/CO2 at different mixing ratios under the same conditions.
The PDIV- of CF3I/CO2 and SF6/CO2 linearly increases with the increase of gas pressure
under certain mixing ratio k and gap distance, indicating that the relationship between PDIV-:
VPD-(kV) and gas pressure P (MPa) can linearly fit according to equation (2.1). The fitting
results are shown in Figure 2.10
PDV aP b (2.1)
The slope a of the fitting line is introduced to indicate the PDIV- speed level of the mixed
gas with different mixing ratios k along with the increase of gas pressure P. A larger a suggests
that the PDIV- of the mixed gas increases rapidly with the increasing gas pressure and vice
versa. Table 2 shows the fitting line slope rate of CF3I/CO2 and SF6/CO2 mixed gas PDIV- under
the same conditions. Several experiments have been developed to test the PDIV- changes of the
two mixed gases along with the gas pressure under different mixing ratios with gap distance of
10 and 15 mm. The change rules are roughly similar to that of 5 mm. The measurement results
are shown in Table 2.2
0.10 0.15 0.20 0.25 0.30
3
4
5
6
7
PD
IV(k
V)
Pressure(MPa)
5mm CF3I/CO
2
5mm SF6/CO
2
k=10%
aSF6
=15
aCF3I
=11.4

42
0.10 0.15 0.20 0.25 0.30
3
4
5
6
7
8
9
PD
IV(k
V)
Pressure(MPa)
5mm CF3I/CO
2
5mm SF6/CO
2
k=20%
aSF6
=17.8
aCF3I
=19.4
0.10 0.15 0.20 0.25 0.30
3
4
5
6
7
8
9
aSF6
=18.6
PD
IV(k
V)
Pressure(MPa)
5mm CF3I/CO
2
5mm SF6/CO
2
k=25% aCF3I
=17.8
0.10 0.15 0.20 0.25 0.30
3
4
5
6
7
8
9
PD
IV(k
V)
Pressure(MPa)
5mm CF3I/CO
2
5mm SF6/CO
2
k=30%
aSF6
=16.2
aCF3I
=16.6

43
0.10 0.15 0.20 0.25 0.30
5
6
7
8
9
10
11
Pressure(MPa)
PD
IV-(
kV
)
aSF6
=23
aCF3I
=26
k=40% 5mm CF
3I/CO
2
5mm SF6/CO
2
Fig. 2.10 The PDIV- of different concentrations of CF3I-CO2 and SF6-CO2 mixtures (5 mm)
Table 2.2 The rate of PDIV- of CF3I/CO2 / The rate of PDIV- of SF6/CO2
Gap Distance
(mm)
k
5
10
15
10% 0.76 0.67 0.68
20% 1.09 1.23 1.1
25% 0.96 1.05 1.08
30% 1.02 1.13 1.17
40% 1.13 0.83 0.80
Table 2.2 shows that the change rate ratio floats slightly with the increase of gap distance
at the same mixing ratio. The PDIV- change rate of CF3I/CO2 is always lower than that of
SF6/CO2 when the mixing ratio is 10%. The ratio remains at approximately 1 with the increase
of mixing ratio k. The sensitivity of the CF3I/CO2 PDIV- to gas pressure is close to SF6/CO2
when the amount of electronegative gas increases to more than 20%. In addition, the two PDIV-
curves of the mixed gases which change along with the gas pressure show an approximately
similar trend.
The results indicate that the PDIV- of CF3I/CO2 is higher than that of SF6/CO2 when the
mixing ratio is 10% to 40% at 0.1 MPa to 0.3 MPa. The insulation performance of CF3I/CO2 in
these conditions is close to or even better than that of SF6/CO2.

44
2.4 Partial discharge characteristics in the positive half cycle
2.4.1 The influence of k and pressure on PDIV+ of CF3I/CO2
PD signals appear in the positive half cycle with the voltage rising, which means PDIV+ is
between the PD inceptive voltage and breakdown voltage, and it is an important physical
quantity in the generation of streamer [90]. PDIV+ marks the important stage of insulation
destruction. Examining and analyzing PDIV+ will contribute to the in-depth exploration of
mixture gas. Therefore, before CF3I/CO2 is used as an insulating medium, it is necessary to
study its PDIV+ with common defects such as metallic protrusion.
Figure 2.11 shows the PDIV+ with the changes in gas pressure when k of CF3I/CO2 and
SF6/CO2 are 10%, 20%, 25%, 30% and 40% and the inter-electrode distance is 5 mm.
0.10 0.15 0.20 0.25 0.30
4
5
6
7
8
9
10
11
12
k=10%
5mm CF3I/CO2
5mm SF6/CO2
Pressure(MPa)
PD
IV+
(kV
)
0.10 0.15 0.20 0.25 0.30
4
5
6
7
8
9
10
11
12
k=20%
5mm CF3I/CO2
5mm SF6/CO2
Pressure(MPa)
PD
IV+
(kV
)

45
0.10 0.15 0.20 0.25 0.30
4
5
6
7
8
9
10
11
12
k=25%
5mm CF3I/CO2
5mm SF6/CO2
Pressure(MPa)
PD
IV+
(kV
)
0.10 0.15 0.20 0.25 0.30
4
5
6
7
8
9
10
11
12
k=30%
5mm CF3I/CO2
5mm SF6/CO2
Pressure(MPa)
PD
IV+
(kV
)
0.10 0.15 0.20 0.25 0.30
4
5
6
7
8
9
10
11
12
k=40%
k=30%
PD
IV+
(kV
)
5mm CF3I/CO2
5mm SF6/CO2
Pressure(MPa) Fig. 2.11 The changes of PDIV+ of CF3I/CO2 and SF6/CO2 with gas pressure (5 mm)

46
In Figure 2.11, the PDIV+ of CF3I/CO2 is about 1.1 times that of SF6/CO2. When k and
interelectrode distance are constants, with the increase of pressure, the PDIV+ of CF3I/CO2 and
SF6/CO2 approximately linearly increase. With the same k, the PDIV+ of these two mixture
gases have the same variation trend. The change rate ratios of these two mixture gases are
shown in Table 2.3 with linear fit.
Table 2.3 The rate of PDIV+ of CF3I/CO2 / The rate of PDIV+ of SF6/CO2
Gap Distance
(mm)
k
5
10
15
10% 0.85 0.68 0.67
20% 1.14 0.99 1.01
25% 0.97 0.99 1.02
30% 1.03 1.03 1.03
40% 0.96 1.24 1.11
Table 2.3 shows that the change rate ratio fluctuates slightly with the increase of k at the
same interelectrode distance, the ratio remains at approximately 1. The change rate ratio for
PDIV+ of CF3I/CO2 with the changes in gas pressure is higher than SF6/CO2 when the amount
of the electronegative gases (CF3I and SF6) are low; The PDIV+ of CF3I/CO2 influenced by gas
pressure is close to that of SF6/CO2 when the amount of the electronegative gases increases to
more than 20%, when the two curves show an similar trend.
With the analysis of the change rate ratio, the PDIV+ of CF3I/CO2 is higher than that of
SF6/CO2 when k is 10%-40% with the interelectrode distance of 5 mm at more than 0.1 MPa.
2.4.2 The PDIV+ of CF3I/CO2 with low k
From the change rate ratios of k=10% shown in Table 2.3, when k is low, the pressure has
less impact for the PDIV+ of CF3I/CO2 than that of SF6/CO2. In order to reduce the usage of
electronegative gases, it is necessary to compare the insulating property of CF3I/CO2 and
SF6/CO2 at low concentration. After the discharge test of k=10% with different interelectrode
distances, we got the data in Figure 2.12.

47
0.10 0.15 0.20 0.25 0.30
4
5
6
7
8
9
10
11
12
5mm
5mm CF3I/CO2
5mm SF6/CO2
Pressure(MPa)
PD
IV+
(k
V)
0.10 0.15 0.20 0.25 0.30
4
5
6
7
8
9
10
11
12
10mm
10mm CF3I/CO2
10mm SF6/CO2
Pressure(MPa)
PD
IV+
(k
V)
0.10 0.15 0.20 0.25 0.30
4
5
6
7
8
9
10
11
12
15mm
10mm CF3I/CO2
10mm SF6/CO2
Pressure(MPa)
PD
IV+
(k
V)
Fig. 2.12 The PDIV+ of CF3I/CO2 and SF6/CO2 with different interelectrode distances
(k=10%)

48
From Figure 2.12, it can be observed that when k is low, the change rates of PDIV+ with
the changes in gas pressure of the two mixture gases are different. The PDIV+ of CF3I/CO2 is
higher than that of SF6/CO2 at low pressure. With the increase of pressure, two curves intersect
and then the PDIV+ of CF3I/CO2 fall behind.
The PDIV+ of CF3I/CO2 is higher than that of SF6/CO2 at low pressure and low k, but the
insulating property of them cannot reach the standard of insulation for C-GIS; however, in high
pressure, the PDIV+ of CF3I/CO2 is lower than that of SF6/CO2. So CF3I/CO2 at low
concentration (k≤10%) is not recommended because of the relatively poor insulating property.
In addition, by observing the experimental results of different interelectrode distances, we
found that the intersection of the two curves moves to high pressure gradually with the
decreasing of interelectrode distance which also lead to the increasing of inhomogeneity of
electric field. The shortening of interelectrode distance leads to that the PDIV+ of SF6/CO2
reaches the level of CF3I/CO2 at higher pressure. For example, at 0.2MPa, PDIV+ of these two
mixture gases approximately equal with distance of 15mm. However, if the distance is
shortened to 10mm or even 5mm, the PDIV+ of CF3I/CO2 is higher than that of SF6/CO2.
Therefore, at low k, the more non-uniform the electric field is, the better the insulating property
of CF3I/CO2 is than that of SF6/CO2.
The results indicate that, the property of CF3I/CO2 is better than that of SF6/CO2 at the same
k (20%≤k≤40%) below 0.3MPa.
2.4.3 Analysis of the substitutability with PD experiment under highly non-
uniform electric field
According to the experimental results above and the requirement of boiling point, k of CF3I
in CF3I/CO2 is between 20% and 40%. Under the same conditions, the higher k is, the higher
the PDIV+ of CF3I/CO2 is. We selected CF3I/CO2 with k of 30% and 40% to compare with pure
SF6 and pure CO2. The PD experimental results for PDIV+ is shown in Figure 2.13.

49
0.10 0.15 0.20 0.25 0.30
4
6
8
10
12
14
16
18
5mm
Pressure(MPa)
PD
IV+
(k
V)
SF6
30% CF3I/CO2
40% CF3I/CO2
CO2
0.10 0.15 0.20 0.25 0.30
4
6
8
10
12
14
16
18
10mm
Pressure(MPa)
PD
IV+
(k
V)
SF6
30% CF3I/CO2
40% CF3I/CO2
CO2
0.10 0.15 0.20 0.25 0.30
4
6
8
10
12
14
16
18
15mm
Pressure(MPa)
PD
IV+
(k
V)
SF6
30% CF3I/CO2
40% CF3I/CO2
CO2
Fig. 2.13 The PDIV+ of CF3I/CO2 (30%-40%), SF6 and CO2

50
According to Figure 2.13, it can significantly improve the insulating property of CO2 by
mixing CF3I. The PDIV+ of CF3I/CO2 (30%-40%) at 0.15-0.2MPa can exceed the level of pure
SF6 at 0.1MPa. The PDIV+ of CF3I/CO2 (30%-40%) at 0.25-0.3MPa can exceed the level of
pure SF6 at 0.2MPa. So CF3I/CO2 (30%-40%) can be used in electrical equipment of relatively
low voltage level, such as C–GIS, GIL and so on.
“2.3 Partial discharge characteristics in the negative half cycle” researched CF3I/CO2 by
PDIV- measured in PD experiment. Because higher insulating strength is needed in GIS then in
C-GIS, the pressure of SF6 used in GIS is higher. Avoiding the high boiling temperature of CF3I
in high pressure, k should not be more than 30%. Under this situation, experimental results
show that CF3I/CO2 (20%-30%) may be used to replace SF6 in GIS. CF3I/CO2 (40%) in lower
pressure can be used in C-GIS or GIL meeting the requirement of boiling temperature. Figure
2.13 shows that the PDIV+ of CF3I/CO2 (30%-40%) at higher pressure can reach the level of
SF6. Considering both PDIV+ and PDIV-, CF3I/CO2 has the potential to replace SF6 for the
characteristics of partial discharge.
2.5 Conclusions
The partial discharge insulation features of CF3I/CO2 mixed gas under needle-plate
electrode are investigated by experiments. The influences of mixing ratio, gas pressure, and gap
distance between the needle electrode and the plate electrode to the PDIV- and PDIV+ of
CF3I/CO2 mixed gas are also analyzed.
PDIV- of the CF3I/CO2 mixed gas is approximately 1 to 1.2 times that of SF6/CO2 mixed
gas when mixing ratio k is high. However, the PDIV- trends of the two kinds of mixed gas with
pressure are almost the same and are suitable for different gap distances. Furthermore,
CF3I/CO2 mixed gas exhibits better features than SF6/CO2 mixed gas. The PDIV+ of CF3I/CO2
is higher than that of SF6/CO2 when k is 10%-40% with the interelectrode distance of 5 mm at
0.1-0.3 MPa. At low k, the more non-uniform the electric field is, the better the insulating
property of CF3I/CO2 is than that of SF6/CO2, but the insulating property of mixture gases with
k≤10% cannot reach the standard of insulation for C-GIS or GIL. The PDIV+ of CF3I/CO2
(30%-40%) at 0.25-0.3MPa can exceed the level of pure SF6 at 0.2MPa.
CF3I/CO2 with the mixed ratio of 30% at the atmosphere pressure of 0.3MPa performs
best in the partial discharge characteristics and meets the requirement of condensing
temperature.

51
CHAPTER 3
EXPERIMENTAL STUDIES ON POWER FREQUENCY
BREAKDOWN VOLTAGE OF CF3I/CO2 MIXED GAS UNDER
DIFFERENT ELECTRIC FIELDS
In electrical equipment, non-uniform electric field, easily caused by defects in production
process, assembly errors and the aging of the system, could result in occurrence of partial
discharge, which may even develop into breakdown accident. In ultra-high voltage equipment,
mild distortion of electric field is a common phenomenon because internal environment is
difficult to be absolutely reliable. Even slightly non-uniform electric field may result in
accidents under the effect of high voltage. So the insulative condition of electrical equipment
is closely related to uniformity of electric field. Electric field can affect the discharge in
insulating gas. And different insulating gases have different sensitivities to electric field. But
there is no relevant studies about the influence of uniformity to the insulating properties of CF3I
and its mixed gases and the contrast with SF6. Most insulation equipment run under power
frequency AC voltage and the insulation defects with different kinds of uniformity can destroy
the insulation of gases at different levels. However, there is no systemic and comprehensive
analysis about the power frequency AC breakdown experiments related to the gas characteristic
of insulation and voltage resistance, especially the influence of different electric field
environments on breakdown voltage of CF3I and its mixed gases. In this chapter, under different
types of electric fields , the influence of both gas pressure (0.1-0.3 MPa) and mixing ratio of
CF3I (10%, 20%, 30%, 50% and 100%) on power frequency breakdown characteristics of CF3I
and its mixed gas CF3I/CO2 were studied, which can provided data support for their replacement
of SF6.
3.1 Power frequency breakdown experiments of CF3I/CO2 mixture
The breakdown experiments was done using the experiment circuit shown in Figure 2.1.
The coupling capacitance (No. 7), non-sense detection impedance (No. 8) and digital storage
oscilloscope Tektronix (No. 9) in Figure 2.1 need to be removed. We used this testing system
to get the breakdown voltage data under different conditions. Breakdown voltages in one
situation should be measured repeatedly more than 5 times to avoid accidental errors. Then, the
averaged value is the power frequency breakdown voltage of this gas under this condition.
There are differences for the insulation properties of the insulating gases under the electric
fields with different uniformity. It is needed to research the impact of different electric field

52
uniformity on insulating gases by testing of breakdown voltage under different electric fields.
In the view of the uniform degree of electric fields, they can be divided into uniform electric
fields and non-uniform electric fields, and non-uniform electric fields can be divided into highly
non-uniform electric fields and slightly non-uniform electric fields [91]. From the point of gas
breakdown in short-gap, these two kinds of non-uniform electric fields are different. Slightly
non-uniform electric field cannot keep persistent corona discharge. Once self-maintained
discharge appears, breakdown happens. However, in highly non-uniform electric field,
persistent corona discharge can be existed, as the increase electric potential, breakdown happens
eventually. Absolutely uniform electric field is very rare in electrical equipment, the electric
fields with high uniformity and approximating to uniform electric field are called quasi uniform
electric field. In order to characterize the electric fields with different uniformity, we define the
electric field utilization coefficient η and the average electric field strength avE as follows:
av
max
E
E (3.1) and
av
UE
d (3.2)
Where maxE is the maximum electric field strength, U is the voltage between the electrodes,
and d is electrode spacing.
If η=1, the electric field is a uniform electric field; if 3/4<η<1, it is quasi uniform electric
field; If 1/4<η≤3/4, it is slightly non-uniform electric field; If η≤1/4, it is highly non-uniform
electric field. We choose quasi uniform electric field, not uniform electric field, as one of our
research subject, because it is very difficult to make perfect electrodes to create absolutely
uniform electric field. And uniform electric field is lack of practical significance. By contrast,
quasi uniform electric field is easier to implement and common in electrical equipment.
We used needle-plate electrodes, hemisphere head rod-plate electrodes and ball-ball
electrodes to simulate highly non-uniform electric field, slightly non-uniform electric field and
quasi uniform electric field respectively. All of the electrode material is brass which has good
conductivity. The configuration of the needle-plate electrodes used in this experiment is shown
in Figure 3.1, that of the hemisphere head rod-plate electrodes in Figure 3.2 and that of the ball-
ball electrodes in Figure 3.3. Because of the low melting point of the brass, breakdown test can
easily damage electrodes by meltdown, which would cause the change of electric field
utilization coefficient and affect the accuracy of experimental results. When breakdown test,
we have to renew electrodes periodically. The electric field utilization coefficients of three kinds
of electric fields which are calculated by simulation [91], is shown in Table 3.1.

53
Φ100
Φ8
Φ7
Φ17
R0.3R4
Φ92
Fig.3.1 Needle-plate electrodes
Fig. 3.2 Hemisphere head rod-plate
electrodes
Fig. 3.3 Ball-ball electrodes
Table 3.1 Electric field utilization coefficient
Electrode Type Electric field Electric field utilization
coefficient (η)
Needle-plate electrodes Highly non-uniform
Electric field 0.21
Hemisphere head rod-
plate electrodes
Slightly non-uniform
electric field 0.53
Ball-ball electrodes Quasi uniform electric
field 0.95
3.2 Power frequency breakdown voltage of CF3I/CO2 and SF6/CO2
along with change of pressure
Figure 3.4 presents the behavior of the power frequency breakdown voltage of CF3I/CO2
and SF6/CO2 with gas pressure. The mixing ratio is 10%, 30%, 50% and 100% of CF3I of SF6.
Under the same electric field, with the increase of mixing ratio, the linearity of the breakdown
voltage of SF6/CO2 is gradually decreased with the increase of gas pressure. At the same mixing
ratio, with the increase of electric field utilization coefficient, the linearity of breakdown voltage
of SF6/CO2 along gradually increases with the growth of gas pressure, and this phenomenon is
particularly obvious in pure SF6. The breakdown voltage of SF6/CO2 with mixing ratio less than
30% tends to improve linearly with increase of gas pressure, while there is no huge difference
for the variation trends of breakdown voltage of CF3I/CO2 with changing of gas pressure under
different mixing ratios in different electric fields, which all linearly increase. Compared with
pure SF6, slopes of pure CF3I are less influenced by gas pressure, which means, for pure gases,
Φ100
Φ8
Φ30
R2.5R4
Φ92
Φ5
Φ15
R25

54
the growth rate of CF3I with increase of gas pressure is more stable. With the increase of electric
field utilization coefficient, breakdown voltages of CF3I/CO2 and SF6/CO2 at different mixing
ratios were all significantly increased. For CF3I/CO2 mixed gas, with the increase of electric
field utilization coefficient, the linear growth rate of breakdown voltage with increase of gas
pressure gradually improve, which shows the more uniform electric field was and the higher
gas pressure was, the better power frequency breakdown characteristics of CF3I/CO2 mixed gas
was.
0.10 0.15 0.20 0.25 0.30
10
15
20
25
30
Gas pressure (MPa)
Po
wer
fre
qu
ency
bre
akd
ow
n v
olt
age
(kV
)
k=10%A SF6/CO
2
B SF6/CO
2
C SF6/CO
2
A CF3I/CO
2
B CF3I/CO
2
C CF3I/CO
2
A SF6/CO
2
B SF6/CO
2
C SF6/CO
2
A CF3I/CO
2
B CF3I/CO
2
C CF3I/CO
2
0.10 0.15 0.20 0.25 0.3010
15
20
25
30
35
40
Po
wer
freq
uen
cy
bre
ak
do
wn
vo
ltag
e (
kV
)
Gas pressure (MPa)
k=30%
A SF6/CO
2
B SF6/CO
2
C SF6/CO
2
A CF3I/CO
2
B CF3I/CO
2
C CF3I/CO
2
0.10 0.15 0.20 0.25 0.30
15
20
25
30
35
40
45
Po
wer
fre
qu
ency
bre
akd
ow
n v
olt
age
(kV
)
Gas pressure (MPa)
k=50%
A SF6/CO
2
B SF6/CO
2
C SF6/CO
2
A CF3I/CO
2
B CF3I/CO
2
C CF3I/CO
2
0.10 0.15 0.20 0.25 0.3015
20
25
30
35
40
45
50
Gas pressure (MPa)
Po
wer
freq
uen
cy
bre
ak
do
wn
vo
ltag
e (
kV
)
k=100%
A- Highly non-uniform electric field; B- Slightly non-uniform electric field; C-Quasi uniform electric field
Fig. 3.4 Power frequency breakdown voltage of SF6/CO2 and CF3I/CO2 as a function of gas
pressure
The ratio between the breakdown voltages of CF3I/CO2 and SF6/CO2 under the same
condition is shown in Table 3.2. For highly non-uniform electric field, breakdown voltage of
pure CF3I only reaches 0.78 times of that of SF6. However, after mixing with CO2, breakdown
voltages of CF3I/CO2 with different mixing ratios reached 0.9 times those of SF6/CO2,
averagely. For slightly non-uniform electric field, the ratios of voltages of different mixing
ratios were similar. The breakdown voltages of CF3I/CO2 can reach an average of 0.9-0.93
times of that of SF6/CO2, which means the ratios of the breakdown voltages of these two mixed

55
gases in slight non-uniform electric field were bigger than those in highly non-uniform electric
field, especially for pure gases. For quasi uniform electric field, ratio increased slightly with the
increase of mixing ratio. On the whole, breakdown voltages of CF3I/CO2 can reach an average
of 0.92-1.05 times those of SF6/CO2. Compared with slight non-uniform electric field, ratios of
these two mixed gases increased slightly, also especially for pure gases. When the mixing ratio
is more than 50%, breakdown voltage of CF3I/CO2 was close to or even more than that of
SF6/CO2. The more uniform electric field was, the more excellent the breakdown characteristics
of CF3I/CO2 compared with SF6/CO2 were. With distortion of electric field being not a serious
defect, CF3I and CF3I/CO2 mixed gas could reach or surpass the voltage endurance capability
of SF6/CO2.
Table 3.2 Power frequency breakdown voltage of (CF3I/CO2) / (SF6/CO2)
Electric field Electrode
Type k (%)
Gas pressure (MPa) Average
value 0.10 0.15 0.20 0.25 0.30
Highly non-
uniform
Electric
field
Needle-plate
electrodes
10 1 0.93 0.89 0.88 0.84 0.91
20 1.04 0.87 0.91 0.88 0.9 0.92
30 1.03 0.91 0.84 0.87 0.86 0.9
50 1 0.89 0.84 0.83 0.92 0.9
100 0.89 0.7 0.66 0.69 0.94 0.78
Slightly non-
uniform
electric field
Hemisphere
head rod-
plate
electrodes
10 0.93 0.97 0.86 0.82 0.99 0.91
20 0.94 0.91 0.87 0.98 0.97 0.93
30 0.86 0.94 0.93 0.92 0.96 0.92
50 0.88 0.9 0.89 0.91 0.9 0.9
100 0.92 0.88 0.84 09 0.96 0.9
Quasi
uniform
electric field
Ball-ball
electrodes
10 0.95 0.94 0.94 1.01 0.95 0.96
20 0.92 0.97 0.92 0.88 0.92 0.92
30 0.87 0.93 0.95 0.97 0.97 0.94
50 1.02 0.99 1.03 0.95 1.01 1
100 1.12 1.06 1.03 1 1.03 1.05
3.3 Influence of electric field uniformity on power frequency
breakdown voltage of CF3I/CO2 and SF6/CO2
From Figure 3.5, the breakdown voltages of CF3I/CO2 and SF6/CO2 under different type of
electric field were different, especially for pure CF3I and pure SF6 under highly non-uniform
electric field in Figure 3.5 (d). This is because SF6 is extremely sensitive to non-uniformity of
the electrical field [91]. Even though mixing with CO2 could reduce its sensitivity, there was still
difference between CF3I/CO2 and SF6/CO2. Figure 3.5 shows the changes of power frequency
breakdown voltages of CF3I/CO2 and SF6/CO2 along with electric field utilization coefficient.

56
0.1MPa SF6/CO
2
0.2MPa SF6/CO
2
0.3MPa SF6/CO
2
0.1MPa CF3I/CO
2
0.2MPa CF3I/CO
2
0.3MPa CF3I/CO
2
0.2 0.3 0.4 0.5 0.6 0.7 0.8 0.9 1.0
10
15
20
25
30
35
Pow
er f
requen
cy b
reak
dow
n v
olt
age
(kV
)
Electric field utilization coefficient
k=10%
0.1MPa SF6/CO
2
0.2MPa SF6/CO
2
0.3MPa SF6/CO
2
0.1MPa CF3I/CO
2
0.2MPa CF3I/CO
2
0.3MPa CF3I/CO
2
0.2 0.3 0.4 0.5 0.6 0.7 0.8 0.9 1.010
15
20
25
30
35
40
45
Po
wer
fre
qu
ency
bre
akd
ow
n v
olt
age
(kV
)
Electric field utilization coefficient
k=30%
0.1MPa SF6/CO
2
0.2MPa SF6/CO
2
0.3MPa SF6/CO
2
0.1MPa CF3I/CO
2
0.2MPa CF3I/CO
2
0.3MPa CF3I/CO
2
0.2 0.3 0.4 0.5 0.6 0.7 0.8 0.9 1.0
15
20
25
30
35
40
45
Po
wer
fre
qu
ency
bre
akd
ow
n v
olt
age
(kV
)
Electric field utilization coefficient
k=50%
0.1MPa SF6/CO
2
0.2MPa SF6/CO
2
0.3MPa SF6/CO
2
0.1MPa CF3I/CO
2
0.2MPa CF3I/CO
2
0.3MPa CF3I/CO
2
0.2 0.3 0.4 0.5 0.6 0.7 0.8 0.9 1.015
20
25
30
35
40
45
50
Po
wer
freq
uen
cy
bre
ak
do
wn
vo
ltag
e (
kV
)
Electric field utilization coefficient
k=100%
Fig. 3.5 Changes of power frequency breakdown voltages of CF3I/CO2 and SF6/CO2 along
with electric field utilization coefficient
The breakdown voltages of CF3I/CO2 and SF6/CO2 gradually increased with the increase
of electric field utilization coefficient. This means that the more uniform electric field was, the
more difficult discharge occurrence was. At the gas pressure of 0.1 MPa, breakdown voltages
of CF3I/CO2 and SF6/CO2 are generally similar, whose growth trends were also similar along
with the growth of electric field utilization coefficient. But with the increase of gas pressure
and mixing ratio, growth trends of two kinds of mixed gases showed differences along with
growth of electric field utilization. Growth rate of breakdown voltage of CF3I/CO2 along with
field utilization coefficient was higher than that of SF6/CO2. When electric field utilization
coefficient was low, breakdown voltages of CF3I/CO2 gas of different mixing ratios were
obviously lower than those of SF6/CO2 gas in the same conditions. As electric field utilization
coefficient increased, breakdown voltage of CF3I/CO2 was gradually close to or even larger
than that of SF6/CO2. Decreased degree of gas insulating performance in experimental electric

57
field compared with that in uniform electric field is defined sensitivity of gas to electric field.
The differences between the breakdown voltages in quasi uniform electric field and in highly
non-uniform electric field for CF3I/CO2 with k≥50% were bigger than those of SF6/CO2 in the
same condition, so the sensitivity of CF3I/CO2 mixed gas to uniformity of electric field was
higher than that of SF6/CO2. The sensitivity of pure CF3I to electric field was particularly high,
which was consistent with the conclusion of literature [63]. [63] pointed out that flashover
voltage of pure CF3I was 1.2 times that of SF6 under the uniform electric field, which reduced
to 0.7 times under highly non-uniform electric field. The greatest impact from electric field on
pure gas was at 0.2 MPa, at which pressure the power frequency breakdown voltage of pure
CF3I in quasi uniform electric field was 1.03 times that of pure SF6 gas, which was 0.66 times
under highly non-uniform electric field. The addition of CO2 improved the sensitivity of CF3I
and SF6 to electric field. In contrast with pure gas, sensitivity of CF3I/CO2 mixed gas was similar
to SF6/CO2 mixed gas in the same condition.
3.4 Synergetic effect of CF3I/CO2 mixed gas
As the relationship between SF6/CO2 and CF3I/CO2 these two mixed gases and gas pressure
or electric field has been discussed previously, it can be seen that mixing ratio of mixed gas has
effects on insulation performance. Studies of mixing ratio will provide references of the
optimal proportion of mixed gases for new substitution in electric power industry. Therefore,
in this section, the impact of mixing ratio (k) on breakdown voltage will be analyzed.
The variation of power frequency breakdown voltage of SF6/CO2 and CF3I/CO2 along with
mixing ratio is shown in Figure 3.6. Under different electric fields, power frequency breakdown
voltages of these two kinds of mixed gases are not linear with the increase of mixing ratio. With
the increase of gas pressure, under highly non-uniform electric field, the rate of increase of
breakdown voltages of SF6/CO2 gradually decreases with the increase of mixing ratio, the
maximum values of breakdown voltages are found in the situation of pure SF6 gas except at
0.3MPa, but the maximum values of breakdown voltage of CF3I/CO2 are found in the situation
of mixed gas at more than 0.15MPa. Moreover, with the increase of gas pressure, the maximum
values tend to occur in the direction that mixing ratio decrease. Under the slightly non-uniform
electric field, power frequency breakdown voltages of SF6/CO2 and CF3I/CO2 showed a
changing trend of "growth-saturation" with the increase of mixing ratio.

58
0 20 40 60 80 1005
10
15
20
25
30P
ow
er f
requen
cy b
reak
dow
n v
olt
age
(kV
)
Mixing ratio ( %)
CF3I/CO
2
0.10MPa
0.15MPa
0.20MPa
0.25MPa
0.30MPa
0.10MPa
0.15MPa
0.20MPa
0.25MPa
0.30MPa
0 20 40 60 80 1005
10
15
20
25
30
35
Mixing ratio ( %)
Po
wer
fre
qu
ency
bre
akd
ow
n v
olt
age
(kV
)
SF6/CO
2
(a) Highly non-uniform electric field
0 20 40 60 80 1005
10
15
20
25
30
35
Po
wer
fre
qu
ency
bre
akd
ow
n v
olt
age
(kV
)
Mixing ratio ( %)
CF3I/CO
2
0.10MPa
0.15MPa
0.20MPa
0.25MPa
0.30MPa
0 20 40 60 80 100
5
10
15
20
25
30
35
40
Mixing ratio ( %)
Pow
er f
requen
cy b
reak
dow
n v
olt
age
(kV
)SF
6/CO
2
0.10MPa
0.15MPa
0.20MPa
0.25MPa
0.30MPa
(b) Slightly non-uniform electric field
0 20 40 60 80 1005
10
15
20
25
30
35
40
45
50
Po
wer
fre
qu
ency
bre
akd
ow
n v
olt
age
(kV
)
Mixing ratio ( %)
CF3I/CO
2
0.10MPa
0.15MPa
0.20MPa
0.25MPa
0.30MPa
0 20 40 60 80 100
5
10
15
20
25
30
35
40
45
50
Po
wer
fre
qu
ency
bre
akd
ow
n v
olt
age
(kV
)
Mixing ratio ( %)
SF6/CO
2
0.10MPa
0.15MPa
0.20MPa
0.25MPa
0.30MPa
(c) Quasi uniform electric field
Fig. 3.6 The relation between the power frequency breakdown voltage of SF6/CO2 and
CF3I/CO2 and mixing ratio

59
When the mixing ratio is less than 30%, with the increase of gas pressure, power frequency
breakdown voltages of these two mixed gases increases quickly, while power frequency
breakdown voltage increases slowly with the increase of gas pressure, tending to saturation, if
mixing ratio is more than 50%. Under quasi uniform electric field, just as the same as slightly
non-uniform electric field, power frequency breakdown voltage of SF6/CO2 and CF3I/CO2 also
increases with the increase of mixing ratios in the trend of "growth-saturation". The breakdown
characteristics of pure electronegative gases (SF6 and CF3I) was not much better than those of
their mixed gases with relatively low mixing ratios.
Breakdown of gas is due to collisions of electrons with gas molecules, which promote the
produce and development of electron avalanche, eventually cause self-sustained discharge. SF6
and CF3I, both strong electronegative gases, can adsorb free electrons to become negative ions,
reducing the density of free electrons. As the mass of negative ion is much larger than that of
electron, ions will hardly participate in the subsequent phases of ionization process, making it
difficult to form self-sustained discharge, so that gases have very high dielectric strength. With
mixing ratio of SF6 and CF3I increasing, number of low-energy free electrons decreases,
reducing the production probability of negative ions from gas molecules by absorbing electrons.
The number of low-energy free electrons is always limited under certain conditions. Even
though volume fraction of electronegative gas continues to increase, breakdown voltage will
not be improved significantly and become saturated, finally.
Actually, degree of nonlinearity can be used to describe the degree of synergetic effect.
After two kinds of gases are mixed (at least one is electronegative gas), the insulation
performance of mixed gas shows four different changing forms with the content of
electronegative gas increasing: negatively synergistic effect, linear relation effect, synergistic
effect and positively synergistic effect [92]. If the breakdown voltage of mixed gas is higher than
the weighted sum of breakdown voltages of two kind of ingredient gases according to their
proportions, this mixed gas has synergistic effect, and conversely, it has negative synergistic
effect. If the breakdown voltage of mixed gas is higher than that of any one of ingredient gases
at the same gas pressure, the mixed gas has positively synergistic effect, which is a special case
of synergistic effect. Mixed gas with negatively synergistic effect is rare. [93] mentioned that
only CBrClF2/SF6 mixed gas met negative synergistic effect. According to the curves in figures,
synergistic effect types of two kinds of mixed gases can be judged qualitatively. Under highly
non-uniform electric field, SF6/CO2 mixed gas generally has synergistic effect except at 30MPa,
and CF3I/CO2 mixed gas even has positively synergistic effect. Under slightly non-uniform
electric field and quasi uniform electric field, two kinds of mixed gases all have synergistic

60
effect. Chosen as insulating gas, mixed gas with positively synergistic effect has great
advantages, which means its insulating performance is equal to or better than pure
electronegative gas, as shown in Figure 3.7(a). Under highly non-uniform electric field,
CF3I/CO2 mixed gas with mixing ratio from 20% to 40% performs equivalent power frequency
breakdown voltage with pure CF3I gas. The more obvious synergistic effect is, the greater
advantage mixed gas will have as insulating gas. But it is difficult to accurately distinguish the
extent of synergistic effect according to qualitative judgment. C is defined as synergistic effect
index. Relationship of C, breakdown voltage and mixing ratio is shown in equation (3.3) [91]:
1 22
( )
(1 )m
k V VV V
k k C
V1>V2 (3.3)
In the equation, V1 and V2 are breakdown voltages of pure gas. Vm is breakdown voltage of
mixed gas. k is mixing ratio. Based on equation (3.3), values of synergistic effect indexes of
CF3I/CO2 and SF6/CO2 under three kinds of electric fields are obtained, respectively, as shown
in Table 3.3-3.5. In [91], the average value of synergistic effect indexes of different mixing
ratios under the same gas pressure was defined as synergistic effect index 𝐶, which represents
the whole situation of the synergistic effect of the mixed gas in the same electric field. There
are negative values of synergistic effect indexes of CF3I/CO2 mixed gas in the calculation
results, however, [91] only made explanations for synergistic effect indexes of 0≤C<1, and only
defined synergistic effect and linear relation effect. Therefore, it is necessary to make
supplements, and put forward a quantitative analysis method according to the value of C of
mixed gas to determine the type and the intensity of synergistic effect:
(1) When k<m and C<0 or 0<m≤k<1 and C>1 (k equals to m, when Vm = V2), the mixed gas
belongs to negatively synergistic effect type. The larger the value of C is, the more obvious the
negatively synergistic effect is;
(2) When C>1, the mixed gas belongs to negatively synergistic effect type. The larger the
value of C is, the more obvious synergistic effect is;
(3) When C=1, the mixed gas belongs to linear relation effect, Vm increases linearly from
V2 to V1 with the increase of k;
(4) When 0<C<1, mixed gas belongs to synergistic effect type, and the more close to 0 C
is, the more obvious synergy effect is;
(5) When k<m and 0<C<1 or 0<m≤k<1 and C<0, (k equals to m, when Vm = V1), the mixed
gas belongs to positively synergistic effect type. The less the value of C is, the more obvious
the positively synergistic effect is.
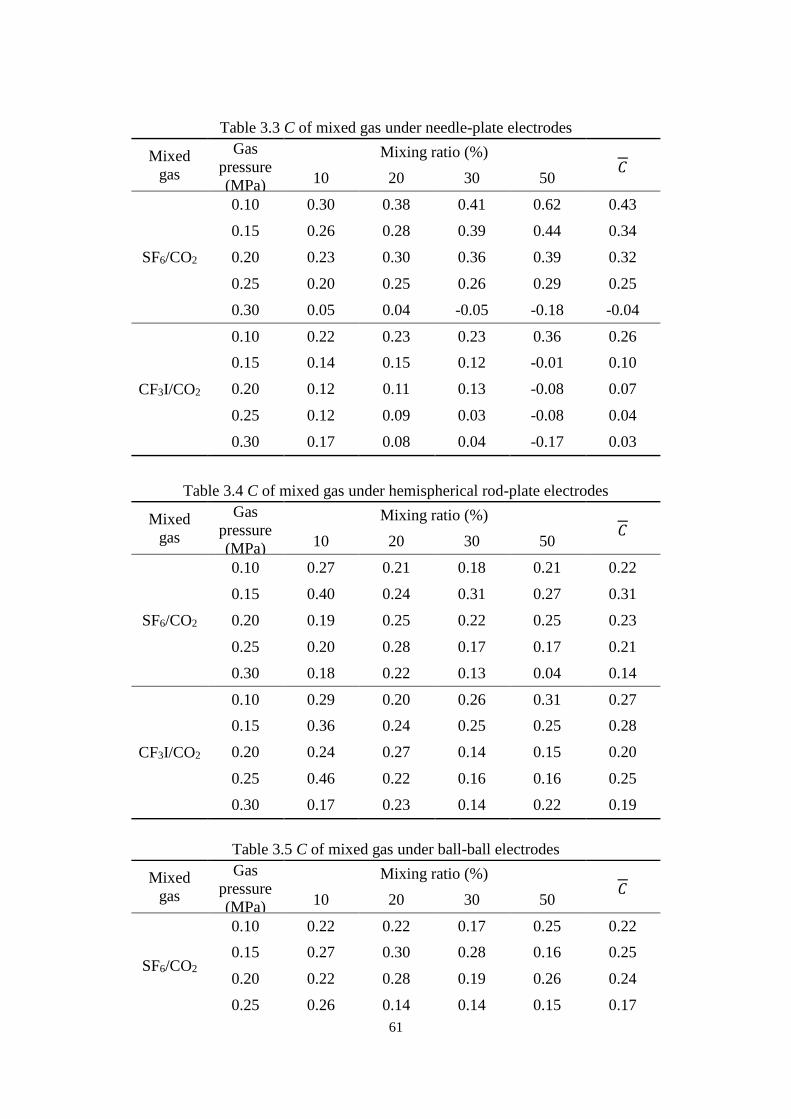
61
Table 3.3 C of mixed gas under needle-plate electrodes
Mixed
gas
Gas
pressure
(MPa)
Mixing ratio (%) 𝐶
10 20 30 50
SF6/CO2
0.10 0.30 0.38 0.41 0.62 0.43
0.15 0.26 0.28 0.39 0.44 0.34
0.20 0.23 0.30 0.36 0.39 0.32
0.25 0.20 0.25 0.26 0.29 0.25
0.30 0.05 0.04 -0.05 -0.18 -0.04
CF3I/CO2
0.10 0.22 0.23 0.23 0.36 0.26
0.15 0.14 0.15 0.12 -0.01 0.10
0.20 0.12 0.11 0.13 -0.08 0.07
0.25 0.12 0.09 0.03 -0.08 0.04
0.30 0.17 0.08 0.04 -0.17 0.03
Table 3.4 C of mixed gas under hemispherical rod-plate electrodes
Mixed
gas
Gas
pressure
(MPa)
Mixing ratio (%) 𝐶
10 20 30 50
SF6/CO2
0.10 0.27 0.21 0.18 0.21 0.22
0.15 0.40 0.24 0.31 0.27 0.31
0.20 0.19 0.25 0.22 0.25 0.23
0.25 0.20 0.28 0.17 0.17 0.21
0.30 0.18 0.22 0.13 0.04 0.14
CF3I/CO2
0.10 0.29 0.20 0.26 0.31 0.27
0.15 0.36 0.24 0.25 0.25 0.28
0.20 0.24 0.27 0.14 0.15 0.20
0.25 0.46 0.22 0.16 0.16 0.25
0.30 0.17 0.23 0.14 0.22 0.19
Table 3.5 C of mixed gas under ball-ball electrodes
Mixed
gas
Gas
pressure
(MPa)
Mixing ratio (%) 𝐶
10 20 30 50
SF6/CO2
0.10 0.22 0.22 0.17 0.25 0.22
0.15 0.27 0.30 0.28 0.16 0.25
0.20 0.22 0.28 0.19 0.26 0.24
0.25 0.26 0.14 0.14 0.15 0.17

62
0.30 0.13 0.16 0.17 0.14 0.15
CF3I/CO2
0.10 0.33 0.42 0.48 0.44 0.42
0.15 0.41 0.40 0.49 0.31 0.40
0.20 0.31 0.43 0.30 0.26 0.33
0.25 0.25 0.29 0.19 0.26 0.25
0.30 0.19 0.23 0.25 0.17 0.21
As can be seen from Table 3.3-3.5, under highly non-uniform electric field, the variation
trend of 𝐶 of SF6/CO2 mixed gas showed synergistic effect except at high gas pressure
(0.3MPa), at which 𝐶 showed positively synergistic effect. Value of 𝐶 decreased gradually
with the increase of gas pressure, and synergistic effect increased gradually. The values of 𝐶
of CF3I/CO2 mixed gas were negative at more than 0.15MPa with k=50%, under such condition,
CF3I/CO2 mixed gas had positively synergistic effect. According to the change of 𝐶 with gas
pressure, the synergistic characteristic of mixed gas changed gradually from synergistic effect
to positively synergistic effect with the increase of gas pressure, under highly non-uniform
electric field, which proved that the insulating performance of CF3I and CO2 can be promoted
by each other. With k≤50%, the synergistic effect of CF3I/CO2 mixed gas can be improved by
increasing k. The synergistic effect of CF3I/CO2 mixed gas is significantly better than that of
SF6/CO2 mixed gas, which makes up for the weakness of insulating performance of pure CF3I
under highly non-uniform electric field. This means CF3I/CO2 has better application value than
pure CF3I.
Under slightly non-uniform electric field and quasi uniform electric field, values of C of
SF6/CO2 and CF3I/CO2 all showed synergistic effect. Under slightly non-uniform electric field,
the values of 𝐶 of two kinds of mixed gases were about 0.2-0.3, which proved that under such
electric field, the synergistic characteristic of breakdown voltage of these two kinds of mixed
gases are similar. Under quasi uniform electric field, values of 𝐶 of SF6/CO2 mixed gas were
between 0.15 and 0.22, while values of 𝐶 of CF3I/CO2 mixed gas were between 0.21 and 0.42,
which shows synergistic characteristics of SF6/CO2 mixed gas is better than that of CF3I/CO2.
For CF3I/CO2 mixed gas, as electric field changes, its synergistic effect changes comparatively
greatly, but there is no significant difference in synergistic effects of SF6/CO2 mixed gas under
different electric fields.
Under three kinds of electric fields, values of 𝐶 of SF6/CO2 and CF3I/CO2 all have
downward trends with the increase of gas pressure. The higher the pressure is, the smaller the
value of 𝐶 is, and the more obvious synergistic effect is. As pressure increases, the number of

63
electronegativity molecules increases, and the mean free path of electron will be shorten, which
makes electrons not easy to accumulate energy, leading to an increasing number of low energy
electrons. As a result, probability of electrons adsorbed by electronegativity gas increases.
Therefore, when mixing ratio is high, increasing gas pressure can relieve the saturated trend of
breakdown voltage changing with the increase of mixing ratio, and make its synergetic effect
more obvious. But saturated trend will also appear with gas pressure continuing to rise.
3.5 The comparison of the breakdown voltages between CF3I/CO2
mixed gas and pure SF6 gas under different electric fields
The breakdown voltages of CF3I/CO2 with mixing ratio of 10%-50% and gas pressure of
0.1-0.3MPa in highly non-uniform electric field, slightly non-uniform electric field and quasi
uniform electric field can reach 0.91, 0.92 and 0.96 times of the breakdown voltages of SF6/CO2
under the same conditions, respectively. The more uniform electric field, the better the
breakdown characteristics of CF3I/CO2 are, compared with SF6/CO2. The breakdown voltages
of CF3I/CO2 in different electric fields grow linearly as the gas pressure increases.
After analyzing the experimental data in different situations of electric fields, it can be
proved that the breakdown voltages of CF3I/CO2 with mixing ratio of 10%-50% and gas
pressure of 0.1-0.3MPa are similar to SF6/CO2 and this mixture are qualified to be used as
insulating medium in the electrical equipment used SF6/CO2. But the insulating gas used in
most of the high-voltage electrical equipment is SF6. In order to research the potential of
CF3I/CO2 as the substitution of SF6, we compared the breakdown voltages of CF3I/CO2 with
different mixing ratios and different gas pressures and the breakdown voltages of pure SF6 with
different gas pressures in the same electric field.
It is found by comparison that the power-frequency withstand strength of CF3I/CO2 with
mixing ratio of 30% at 0.3MPa can reach the levels of pure SF6 at 0.15-0.2MPa in highly non-
uniform electric field, slightly non-uniform electric field and quasi uniform electric field. The
withstand strength of CF3I/CO2 with mixing ratio of 50% at 0.3MPa can reach the levels of
pure SF6 at 0.2-0.3MPa in the 3 kinds of electric fields, respectively. Under such condition with
mixing ratio of 50%, there are more differences about the substitute capacity of CF3I/CO2
among the 3 different electric fields than the condition with mixing ratio of 30%. This is because
of the analysis result above that the sensitivity of CF3I/CO2 to electric field is comparatively
high. With the increase of CF3I content of mixed gas, the insulating property of CF3I/CO2
improves more in more uniform electric field.

64
0.10 0.15 0.20 0.25 0.30
10
15
20
25
30
35
Po
wer
fre
qu
ency
bre
akd
ow
n v
olt
age
(kV
)
Gas pressure (MPa)
10%
30%
50%
SF6
(a) Highly non-uniform electric field
0.10 0.15 0.20 0.25 0.3010
15
20
25
30
35
Po
wer
fre
qu
ency
bre
akd
ow
n v
olt
age
(kV
)
Gas pressure (MPa)
10%
30%
50%
SF6
(b) Slightly non-uniform electric field
0.10 0.15 0.20 0.25 0.30
15
20
25
30
35
40
45
Po
wer
fre
qu
ency
bre
akd
ow
n v
olt
age
(kV
)
Gas pressure (MPa)
10%
30%
50%
SF6
(c) Quasi uniform electric field
Fig.3.7 Breakdown voltages of CF3I with different mixing ratios and pure SF6 with the
changes of gas pressure

65
According to the experimental results, CF3I/CO2 with mixing ratio of 30% at 0.3MPa can
replace pure SF6 applied in C-GIS or GIL and so on. For the electrical equipment with high
insulation requirement, it is needed to increase the gas pressure of CF3I/CO2 or the content of
CF3I.
3.6 Conclusion
(1) Power frequency breakdown voltage of CF3I/CO2 increased linearly with growth of gas
pressure under different electric fields and different mixing ratios. Compared with SF6/CO2
mixed gas, gas pressure has less influence on the power frequency breakdown voltage of
CF3I/CO2 mixed gas. For CF3I/CO2 mixed gas, with the increase of electric field utilization
coefficient, the linear growth rate of power frequency breakdown voltage gradually improved
with the increase of pressure, which shows that the more uniform electric field and the higher
pressure are, the more excellent power frequency breakdown characteristics of CF3I/CO2 mixed
gas are.
(2) The sensitivity of pure CF3I to electric field is relatively high. Addition of CO2 can
improve the sensitivity of CF3I to electric field. Compared with pure gas, sensitivity of
CF3I/CO2 mixed gas to uniformity of electric field decreased, nonetheless it was slightly higher
than that of SF6/CO2 mixed gas in the same condition.
(3) Under highly non-uniform electric field, CF3I/CO2 mixed gas with at above 0.15 MPa
with k=50% was positively synergies, and its synergistic effect was obviously better than that
of SF6/CO2 mixed gas. Under slightly non-uniform electric field and quasi uniform electric field,
SF6/CO2 and CF3I/CO2 mixed gas showed synergistic effect. These two types of mixed gases
in the aspect of breakdown characteristic presented similar synergistic effect. Under three kinds
of electric fields, the value of 𝐶 of SF6/CO2 and CF3I/CO2 mixed gases all showed declined
trend with gas pressure increasing. The higher gas pressure was, the smaller 𝐶 value was, and
the more obvious synergistic effect was.
(4) With the analysis result of previous chapter, power frequency breakdown characteristic,
liquefaction temperature, and greenhouse effect comprehensively considered, CF3I/CO2 with
mixing ratio of 30% at 0.3 MPa could be used to replace pure SF6 for application in GIL, C-
GIS and other electrical equipment of lower insulating requirements.

66

67
CHAPTER 4
INSULATION PERFORMANCE OF CF3I AND CF3I/CO2 UNDER
FREE METAL PARTICLES DEFECTS
The occurrence reasons of PD in gas insulated electrical equipment are manifold. The
proportion of metal particles and other external impurities is 20%, which are the most common
insulation defects in the SF6 gas insulated switchgear, and they are also the main cause of
insulation fault.
There are two main causes that produce free metal particles: 1. Gas insulated equipment
is not thoroughly cleaned from the manufacturer, so metal particles may remain in the device
during the link of the production and assembly. 2. During the operation of device, metal particles
with different material and shape may inexorably produce because of aging of internal
insulation and vibration of circuit breaker.
Normally, the shape of free metal particles is powder, flake or large size solid particles and
so on. Those particles obtain charges under the effect of electric field, which move or bounce
because of the electrostatic force. When the electric field reaches a certain strength, metal
particles will move everywhere affected by electric field force, which are likely across the gap
between the shell and high voltage conductors or move to insulation defect parts. As the electric
field strength strengthened further, the electric field distortion caused by free metal particles
will produce partial discharge and even breakdown. When metal particles close to but not
contact the high voltage conductor, PD is the most common phenomenon. Statistics show that
when metal particles close to but not contact the high voltage conductor, the discharge
possibility is about 10 times higher than fixed particles. Therefore, free metal particles can be
harmful to the electrical equipment insulation, and the hazard from discharge caused by metal
particles is the most serious.
Since the eighties last century, scholars have studied the harm of free metal particles in gas
insulated electrical equipment. The experiment proved that few (> 100 mg) free metal particles
with diameter less than 30 μm will reduce the dielectric strength in gas insulated electrical
equipment. The extent of the insulating impact depends on the size, shape and material of free
metal particles and SF6 gas pressure (with all other things being equal, the lighter the free metal
particle is, the more the breakdown voltage reduce). For example, if there are some linear metal
particles (Φ 0.45mm×6.4 mm) in the device filling with SF6 gas, the withstand voltage level
will drop 90 percent under DC voltage [93, 94]. The simulation results prove that the trajectory of
metal particles between electrodes will be influenced by the initial position of particles, the

68
electric field uniformity, particle size and the frequency and the amplitude of voltage. With the
increase of voltage frequency and particle size, breakdown may occur between gas gap easily
[95].
As internal common defects types causing failure in gas insulated electrical equipment, it
is necessary to explore the influence of the particles on insulation performance of CF3I and
CF3I/CO2 with different gas pressure and the mixing ratio. In this chapter, the power frequency
breakdown characteristic of CF3I/CO2 with different pressures and mixing ratios were studied
under condition with free metal particles and compared with the breakdown performance of
pure SF6 under the same conditions, which validated the substitutability of CF3I/CO2 gas
mixture; In order to understand the influence degree and mechanism of free metal particles on
CF3I gas, the influence of the particles type, particles number and the electrode distance on
power frequency breakdown voltage of CF3I is studied in this chapter, and the CF3I plasma
thermodynamic properties and transport coefficient are calculated and analyzed through
thermodynamic calculation under different content of the metal (copper, aluminum, iron).
4.1 Experimental method
In this chapter, the experiment platform for the power frequency breakdown test is the
same as that in chapter 3. In order to study the effect of the different metal particles on the
insulation performance of CF3I and CF3I/CO2 gas mixture, free metal particles defect model
needs to be designed.
In order to maximize the gas insulated intensity and reduce gas consumption and
equipment area, generally the electric field, between the conductive body and metal case, is
quasi-uniform in the gas insulated equipment. Residue metal particles in the device may jump
under the action of electric field electric field force. In our research, the spheric-bowl electrodes
model is chosen to simulate the quasi-uniform electric field, as shown in Figure 4.1. The metal
particles are placed between two electrodes to simulate the free metal particles defects in gas
insulated equipment.
R 20
R 30R 35
30
Ø15
R 25
R 30R 35
30
Ø15
Fig.4.1 Spheric-bowl electrodes

69
Bowl electrode is a stainless steel hemisphere, of which outer radius and inside radius are
35 mm and 30 mm, respectively. The length of connecting rod of the spheric electrode is 30
mm. In order to exclude the influence of different quasi-uniform field on experiment results,
two spheric electrode models, the sphere of 20 mm and 25 mm, are adopted, respectively, which
make the spheric-bowl distance are 10 mm and 5 mm, respectively, and spheric electrodes are
also stainless steel. In order to make each direction of spheric-bowl are equidistant, the spherical
center of sphere and bowl electrodes are coincident, so that electric field is nearly uniform
electric field between electrodes to avoid influence of electric field distortion on the experiment
result.
To simulate the free moving metal particles in the discharge more closely and prove that
the experiment data acquisition is effective and reasonable, we used Comsol Multiphysics to
simulate the electric field of the designed sphere-bowl electrodes and confirm its uniform
behavior without free moving metal particles. The inter-electrode distance was 5 mm or 10 mm.
The voltage on the ball was 30 kV. The electric potential simulations of the sphere-bowl
electrodes are shown in Figure 4.2.
(a) 5mm (b) 10mm
Fig.4.2 Electric field simulation of spheric-bowl electrodes
The simulation results show that the electric field between the sphere and the bowl is
uniform. However, because of limitations in manufacturing technology, ensuring that the
surface of the electrodes is perfectly smooth is difficult, as is ensuring that the curvatures of
any point in the electrodes are equal. Thus, we assume that the electric field between the sphere
and the bowl is quasi-uniform.
But due to the limitation of the existing mechanical processing technology, it is difficult
to guarantee electrodes surface are completely smooth and electrodes curvature are completely
same, so the actual electric field between sphere and bowl electrodes is quasi uniform field.

70
According to the design, electrodes are fabricated, as shown in figure 4.3.
Fig.4.3 Spheric-bowl electrodes
Before experiment the spheric-bowl electrodes are installed in gas insulation test device.
According to electrodes size, the distance between the electrodes is precisely adjusted to ensure
the spherical center of sphere and bowl electrodes coincident.
Fig.4.4 Photo of equipment with electrodes in it
Because main materials of the actual metal particles, in the real electrical insulation
devices, include copper, aluminum, iron and so on, and the particle shape is sheet, needle, and
other irregular shape [95]. The most common materials copper (Cu), aluminum (Al) and iron
particles (Fe) are chosen in this experiment. On the choice of particle size, it must be considered
that the sizes of different metal particles are difficult to be controlled if the particle sizes are too
small, which may affect the accuracy of experimental results because of no unified test objects.
At the same time, the particles with too small size may easily jump out of the spheric-bowl
electrodes, which leads the experimental conditions change and affects the authenticity of the

71
breakdown voltage data; [96] proved that maximum length of real particles in GIS equipment
is about 3 mm. Taking uncontrollable factors of small size particles and the actual situation into
comprehensive consideration, we selected square shape (2×2 mm2) sheet particles as the
experimental object, as shown in Figure 4.5. In order to ensure the weight and size of three
kinds of metal particles were the same, there are differences in the material thickness of metal
particles, and the thickness of copper, aluminum and iron were 0.24 mm, 0.73 mm and 0.25
mm, respectively. The volumes of three kinds of metal particles are 0.96 mm3, 2.92 mm3 and
1.0 mm3, and the theory density of the three kinds of metal are: ρCu=8.6g/cm3, ρAl=2.7g/cm3
and ρFe=7.8g/cm3. It can be calculated that the theoretical quality of three kinds of metal
particles respectively are: MCu=8.256×10⁻³g, MAl=7.884×10⁻³g and MFe=7.8×10⁻³g , and
practical measured values are 8.37×10⁻³g, 7.73×10⁻³g and 7.87×10⁻³g, respectively. there are
differences between the theoretical calculated value and actual value for the reasons of purity
and so on, but the difference is minor and acceptable. Due to the cutting error, it is probable
that there are nuances of the weight of the same metal particles, but the weight of every piece
particle must be tested and controlled in 8±0.5×10⁻³g before the experiment. By experimental
verification, these particles can be effectively prevented jumping out of the electrodes.
Fig.4.5 Surface area of square metal particles
Gas insulation test device, installed with the spheric-bowl electrodes containing a specified
number and type of metal particles, was connected in the experimental circuit in Figure 2.1.
The experimental object is pure CF3I, pure SF6, CF3I/CO2 and SF6/CO2 gas mixture, and test
preparation process and gas-filling methods are exactly the same as chapter 3.
The breakdown characteristic research of CF3I/CO2 and SF6/CO2 under the particles
defects is the continuation of research in chapter 3 and the insulating efficiency test for real
insulation defect. During the experiment, gas pressure is kept at 0.10, 0.15, 0.20, 0.25 and 0.30
MPa (absolute pressure), mixing ratio k is kept at 0%, 10%, 30%, 50%, 70% and 100%, the
material of metal particles is copper, the number of metal particles is 3, and the distance of
spheric-bowl electrodes is 5 mm.

72
Breakdown voltages may be different because of different metal elements, so it is
necessary to further discuss the influence of particles with different type and quantity on the
breakdown characteristic of electronegative gas (CF3I and SF6) of mixture gases (CF3I/CO2 and
SF6/CO2).
Experimental gas pressure is kept at 0.10 MPa (absolute pressure), number of metal
particles is kept at 0, 1, 3, 5, 7, 9, materials of metal particles are copper, aluminum and iron,
and the distances of spheric-bowl electrodes are 5 mm and 10mm.
The starting test voltage was sufficiently low when power frequency voltage of 50 Hz was
applied to the spheric electrode to prevent switching overvoltage. The test voltage was increased
slowly by 0.1 kV/s from 0 kV until breakdown appeared, then, the voltage was recorded. Under
each condition, breakdown voltage should has been measured repeatedly 5 times with interval
of more than 10 minutes to avoid accidental errors. The averaged value was assimilated to the
breakdown voltage under this condition.
4.2 Study on breakdown characteristic of CF3I/CO2 under metal
particles defect
In chapter 2 and chapter 3, insulation characteristic of CF3I/CO2 gas mixture under
different conditions has studied integratedly, which confirms that CF3I/CO2 has a potential
application to replace SF6 or SF6/CO2. On the condition with real fault and defect, its insulation
ability remains to be tested. So it is necessary to research its insulation performance under the
typical defects. In this section, the performances of CF3I/CO2 are measured and compared with
SF6 and SF6/CO2 through breakdown test under free metal particles defect.
Copper particles are chosen, which are the most common metal particles in electrical
equipment, and the number of metal particles is 3 in order to avoid accidental error if number
is small and great difference between the reality and the experiment if number is large. There is
a low probability that a large number of particles appear at the same time. In addition, stability
of the results will be influenced by interaction between particles and the particles may link up
and connect the spheric-bowl electrodes. This phenomenon is almost impossible to occur in
electrical equipment. By comparison with the experiment results in Figure 4.6, it can be found
that variation trend of breakdown voltage of the different mixing ratio of CF3I/CO2 and SF6/CO2
along with the change of gas pressure are similar, two kinds of mixed gases have same
sensitivity to the copper particles. As a whole, breakdown characteristic of CF3I/CO2 is slightly
inferior to the SF6/CO2 but with little difference, and in some cases CF3I/CO2 can reach the
same levels as SF6/CO2.

73
0.10 0.15 0.20 0.25 0.30
3
4
5
6
7
8
9
Gas pressure (MPa)
Po
wer
fre
qu
ency
bre
akd
ow
n v
olt
age
(kV
)
k=10% 5mm CF
3I/CO
2
5mm SF6/CO
2
0.10 0.15 0.20 0.25 0.304
5
6
7
8
9
10
11
12
Pow
er f
requen
cy b
reak
dow
n v
olt
age
(kV
)
Gas pressure (MPa)
k=30% 5mm CF3I/CO
2
5mm SF6/CO
2
0.10 0.15 0.20 0.25 0.304
5
6
7
8
9
10
11
12
13
Gas pressure (MPa)
Po
wer
fre
qu
ency
bre
akd
ow
n v
olt
age
(kV
)
k=50% 5mm CF
3I/CO
2
5mm SF6/CO
2
0.10 0.15 0.20 0.25 0.30
5
6
7
8
9
10
11
12
13
Po
wer
fre
qu
ency
bre
akd
ow
n v
olt
age
(kV
)
Gas pressure (MPa)
k=70% 5mm CF
3I/CO
2
5mm SF6/CO
2
0.10 0.15 0.20 0.25 0.305
6
7
8
9
10
11
12
13
14
Gas pressure (MPa)
Pow
er f
requen
cy b
reak
dow
n v
olt
age
(kV
)
k=100% 5mm CF
3I/CO
2
5mm SF6/CO
2
Fig 4.6 Breakdown voltage of mixtures with the pressure changes and free metal particles
It shows in Figure 4.6 that the ability of reducing the discharge induced by free metal
particles for two types of mixed gas is similar. For preventing discharge in free metal particle
defects, the CF3I/CO2 with the same mixing ratio and the pressure can be used to alternate the
SF6/CO2.
In addition, it is necessary to compare the insulation ability between CF3I/CO2 (k≤50%)

74
and pure SF6 under free metal particle. Figure 4.7 show that breakdown voltage trend of
CF3I/CO2 with mixing ratio of 10%, 30%, 50%, pure CO2 and pure SF6 along with the change
of gas pressure under the free metal particles.
0.10 0.15 0.20 0.25 0.30
4
6
8
10
12
14P
ow
er f
requen
cy b
reak
dow
n v
olt
age
(kV
)
Gas pressure (MPa)
CO2
10% CF3I/CO
2
30% CF3I/CO
2
50% CF3I/CO
2
SF6
Fig. 4.7 Breakdown voltages of CF3I/CO2 with different mixing ratios and pure SF6 with free
metal particles
From Figure 4.7 it can be found that the breakdown voltage of the CF3I/CO2 mixtures under
lower mixed ratio (10%) has little difference with pure CO2. At around 0.5MPa, the breakdown
voltage of the CF3I/CO2 is even less than pure CO2. Low content of CF3I cannot improve the
resistance capacity of gas discharge in free metal particle defect for CO2 much. But with the
increase of CF3I content, promotion effect of breakdown voltage is obvious. The breakdown
voltage of CF3I/CO2 (k=30%) is twice that of pure CO2 in the same pressure conditions. The
improvement of insulating ability is obvious, it can even reach 92% of the breakdown voltage
of pure SF6. With the increase of pressure, although the gap of breakdown voltages of CF3I/CO2
(k=30%) and pure SF6 expands gradually, but the breakdown voltage of CF3I/CO2 (k=30%) can
still reach 81% of the breakdown voltage of pure SF6 under higher pressure (0.3MPa). The
breakdown performance of CF3I/CO2 (k=30%) under 0.3MPa is equivalent to pure SF6 at
0.2~0.25MPa. The breakdown voltage didn’t increase a lot by increasing the contents of CF3I,
when the mixed ratio is higher than 30%. The breakdown voltage of CF3I/CO2 (k=50%) is
similar to that of CF3I/CO2 (k=30%). Considering liquefaction temperature and toxicity issues,
CF3I/CO2 with mixed ratio 30% can be used to replace pure SF6 to resist insulation fault caused
by free metal particles.

75
4.3 The influence of free metal particles with different number and
material on the breakdown characteristics of CF3I
Experimental results show that the presence of free metal particles may cause the decrease
of the withstand voltage level of insulating gas, and induce partial discharge even breakdown
phenomenon. Metal particles are generally derived from an internal metal structure of the
device, and metal elements are not the same because of the different components used in device.
It is necessary to do targeted research on the effects of different metal particles on the CF3I gas
insulating ability. This study could provide a theoretical basis for the material choice of key
parts of the metal structure inside gas insulated electrical equipment filled with CF3I or a mixed
gas. At the same time, the number of particles may also have different effects on the CF3I
insulation capability, so the research on the function of CF3I breakdown voltage with the
number of metal particles is helpful to understand reduced insulating properties by metal
particles and provide theoretical and experimental basis for the standards about the metal
particle content. 4.3.1 Comparative study of the breakdown characteristics of CF3I and SF6 with metal particles
Figure 4.8 shows that the power frequency breakdown voltages depend on the quantities of
Cu, Al or Fe particles when the gas pressure was 0.1 MPa and the inter-electrode distance was
fixed at 5 mm or 10 mm. Additionally, the curves have virtually the same tendency: the
breakdown voltages of CF3I and SF6 diminish with the rise of the number of particles for
constant gas pressure and inter-electrode distance. Nevertheless, the breakdown voltage of CF3I
gas usually exceeds the breakdown voltage of the SF6 gas under the same conditions.
To describe the level of reduced insulation capacity with metal particles in gas-insulated
equipment, Metal Particle Impact Factor (MPIF) was defined as the ratio of the breakdown
voltage with metal particles to the breakdown voltage with metal particles at the same condition.
We used MPIF to compare the breakdown characteristics of CF3I and SF6 with the same type
of metal particle at an inter-electrode distance of 5 mm or 10 mm. Results are shown in Table
4.1.
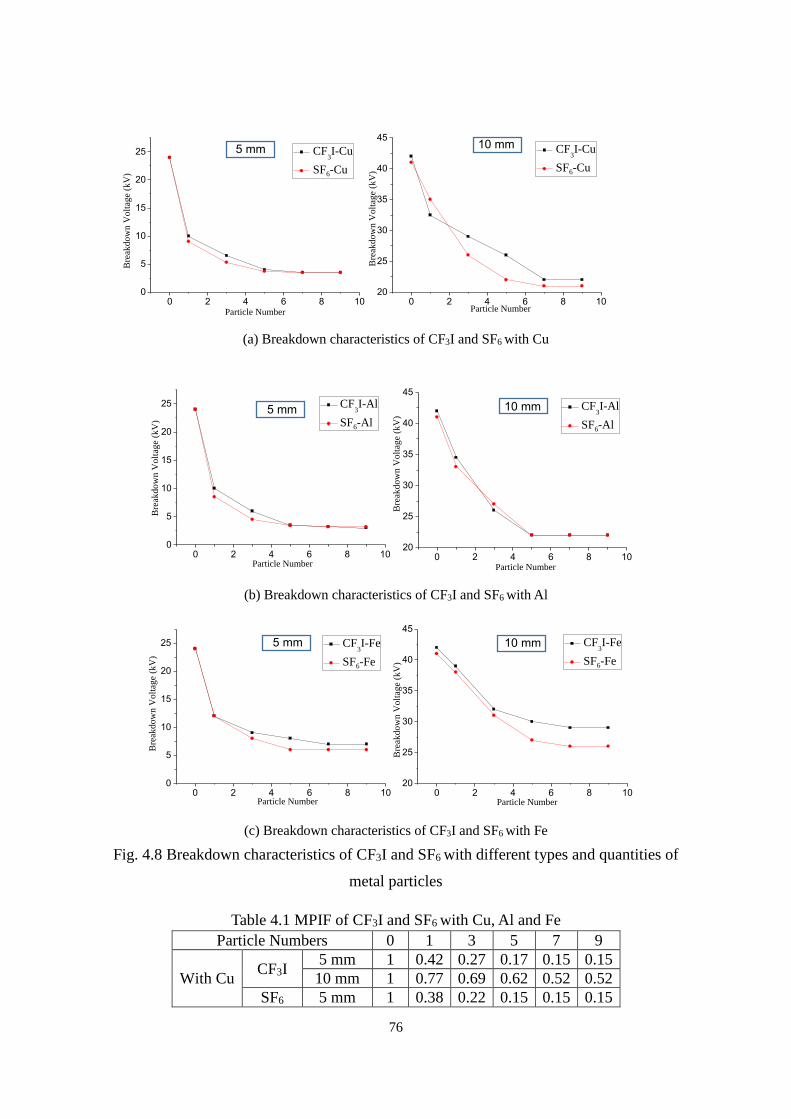
76
0 2 4 6 8 100
5
10
15
20
25 5 mm
Bre
akd
ow
n V
olt
age
(kV
)
Particle Number
CF3I-Cu
SF6-Cu
0 2 4 6 8 1020
25
30
35
40
45
Bre
akd
ow
n V
olt
age
(kV
)
Particle Number
CF3I-Cu
SF6-Cu
10 mm
(a) Breakdown characteristics of CF3I and SF6 with Cu
0 2 4 6 8 1020
25
30
35
40
45B
reak
do
wn
Vo
ltag
e (k
V)
Particle Number
CF3I-Al
SF6-Al
10 mm
0 2 4 6 8 100
5
10
15
20
25
Bre
akd
ow
n V
olt
age
(kV
)
Particle Number
CF3I-Al
SF6-Al 5 mm
(b) Breakdown characteristics of CF3I and SF6 with Al
0 2 4 6 8 1020
25
30
35
40
45
10 mm
Bre
akd
ow
n V
olt
age
(kV
)
Particle Number
CF3I-Fe
SF6-Fe
0 2 4 6 8 100
5
10
15
20
25
Bre
akd
ow
n V
olt
age
(kV
)
Particle Number
5 mm CF3I-Fe
SF6-Fe
(c) Breakdown characteristics of CF3I and SF6 with Fe
Fig. 4.8 Breakdown characteristics of CF3I and SF6 with different types and quantities of
metal particles
Table 4.1 MPIF of CF3I and SF6 with Cu, Al and Fe
Particle Numbers 0 1 3 5 7 9
With Cu CF3I
5 mm 1 0.42 0.27 0.17 0.15 0.15
10 mm 1 0.77 0.69 0.62 0.52 0.52
SF6 5 mm 1 0.38 0.22 0.15 0.15 0.15

77
10 mm 1 0.83 0.63 0.52 0.51 0.51
With Al
CF3I 5 mm 1 0.42 0.25 0.15 0.14 0.13
10 mm 1 0.82 0.62 0.52 0.52 0.52
SF6 5 mm 1 0.35 0.19 0.14 0.13 0.13
10 mm 1 0.80 0.66 0.54 0.54 0.54
With Fe
CF3I 5 mm 1 0.50 0.38 0.33 0.29 0.29
10 mm 1 0.93 0.76 0.71 0.69 0.69
SF6 5 mm 1 0.50 0.33 0.25 0.25 0.25
10 mm 1 0.93 0.76 0.66 0.63 0.63
Table 4.1 indicates that these three types of metal particles can all result in the significant
decline in breakdown voltage of CF3I and SF6. With the rise of quantities of metal particles, the
rate of descent of breakdown voltage decreases. When the number of particles was more than
seven, the breakdown voltage tended to be smoother. Hara shows that metal particles can
significantly reduce corona inception voltage and promote the development of positive and
negative streamer discharges [97]. Furthermore, metal particles cause electric field distortion and
make the electric field between sphere-bowl electrodes non-uniform, which also reduces the
breakdown voltage. When the quantities of metal particles are small and more metal particles
occur, electric field distortion becomes more serious. Sarathi shows that the random motion of
particles can lead to severe gas discharge and decrease the strength of insulation [98]. When the
strength of the electric field is sufficient, the metal particles can move and make contact with
electrodes frequently, which shortens the insulation distance and may cause a short circuit
between electrodes. This outcome is also one of the most important factors of gas breakdown
[97]. Thus, with the same type and number of metal particles, the shorter the inter-electrode
distance is, the higher the probability of discharge is. This explains why the MPIF of 5 mm was
lower than the MPIF of 10 mm when other things were equal. As the number of metal particles
increased, the breakdown voltage of 5 mm fell faster than did the breakdown voltage of 10 mm.
The metal particles in narrow special gas-insulated equipment cause much more serious harm
to internal insulation, which can cause partial discharge and even breakdown more easily.
Figure 4.8 and Tables 1 show that, under the same conditions, the breakdown voltages and
MPIF of CF3I were close to those of SF6. Thus, at the point of breakdown characteristics with
the same type and number of metal particles, the insulating strength of CF3I can be close to or
even beyond that of SF6 at a pressure of 0.1 MPa, which can be used in C-GIS and GIL.
4.3.2 Influence of CF3I from different types of metal particles to the insulating property
The research of comparison above provides the experimental basis of electric strength with
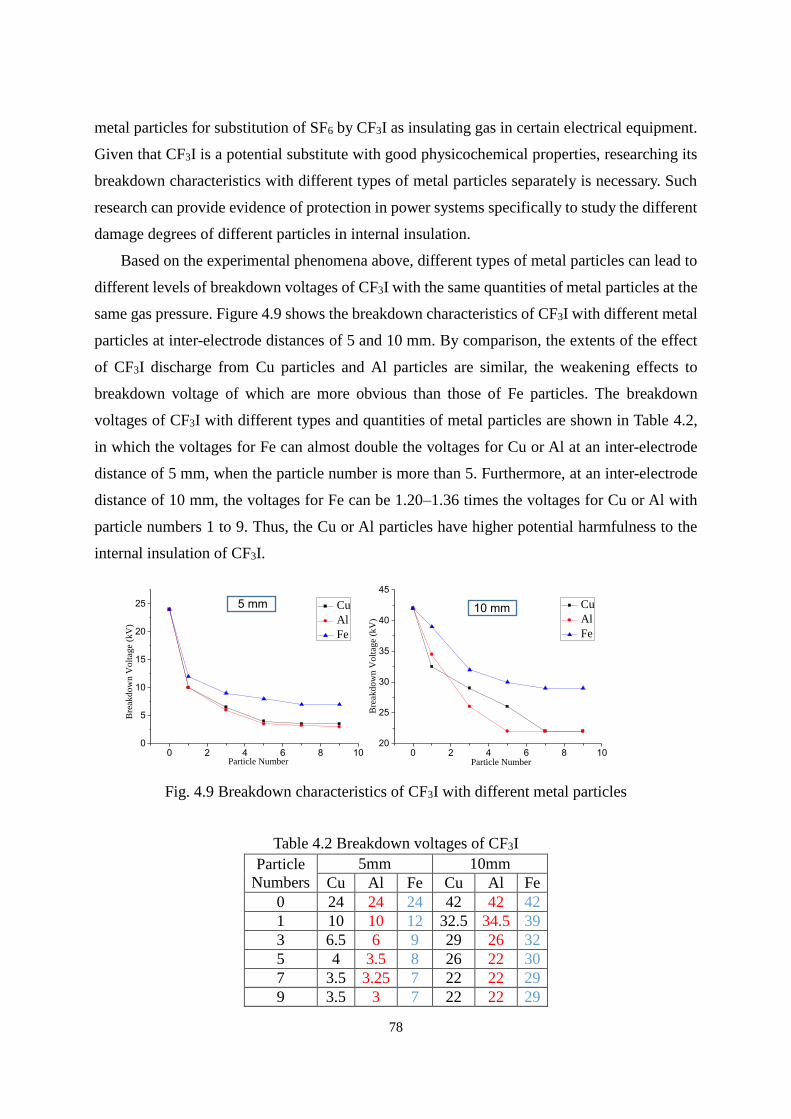
78
metal particles for substitution of SF6 by CF3I as insulating gas in certain electrical equipment.
Given that CF3I is a potential substitute with good physicochemical properties, researching its
breakdown characteristics with different types of metal particles separately is necessary. Such
research can provide evidence of protection in power systems specifically to study the different
damage degrees of different particles in internal insulation.
Based on the experimental phenomena above, different types of metal particles can lead to
different levels of breakdown voltages of CF3I with the same quantities of metal particles at the
same gas pressure. Figure 4.9 shows the breakdown characteristics of CF3I with different metal
particles at inter-electrode distances of 5 and 10 mm. By comparison, the extents of the effect
of CF3I discharge from Cu particles and Al particles are similar, the weakening effects to
breakdown voltage of which are more obvious than those of Fe particles. The breakdown
voltages of CF3I with different types and quantities of metal particles are shown in Table 4.2,
in which the voltages for Fe can almost double the voltages for Cu or Al at an inter-electrode
distance of 5 mm, when the particle number is more than 5. Furthermore, at an inter-electrode
distance of 10 mm, the voltages for Fe can be 1.20–1.36 times the voltages for Cu or Al with
particle numbers 1 to 9. Thus, the Cu or Al particles have higher potential harmfulness to the
internal insulation of CF3I.
0 2 4 6 8 100
5
10
15
20
25 5 mm
Bre
akd
ow
n V
olt
age
(kV
)
Particle Number
Cu
Al
Fe
0 2 4 6 8 1020
25
30
35
40
45
10 mm
Bre
akd
ow
n V
olt
age
(kV
)
Particle Number
Cu
Al
Fe
Fig. 4.9 Breakdown characteristics of CF3I with different metal particles
Table 4.2 Breakdown voltages of CF3I
Particle
Numbers
5mm 10mm
Cu Al Fe Cu Al Fe
0 24 24 24 42 42 42
1 10 10 12 32.5 34.5 39
3 6.5 6 9 29 26 32
5 4 3.5 8 26 22 30
7 3.5 3.25 7 22 22 29
9 3.5 3 7 22 22 29

79
In the process from partial discharge to breakdown between the electrodes, the plasma of
the mixture of CF3I and metal arises and develops gradually until streamer emerges and causes
breakdown. The metal particles can destroy the uniformity of the electric field and provide free
electrons and charged microscopic particles. The free electrons can cause impact ionization and
generate new electrons under the action of the electric field. The new electrons and the original
electrons obtain kinetic energy from the effect of the electric field, as well as promote the
increase of charged particles between electrodes and induce electron avalanche. Electron
avalanche was composed of plasma comprising mixed micro particles, which promote the
development of streamer from partial discharge to breakdown. CF3I, as one type of strongly
electro-negative gas, can inhibit the growth of electron avalanche. Free electrons and charged
particles produced by Cu, Al and Fe can affect the thermodynamic properties and transport
coefficients of the plasma, thereby causing a difference in breakdown voltage. To interpret the
observation from the microcosmic point of view, we calculated the thermodynamic properties
and transport coefficients of the plasma in the developing process of discharge of the mixture
of CF3I and the three metals.
4.4 Thermodynamic properties and transport coefficients of CF3I
plasmas mixed with Cu, Al or Fe
When discharge occurs between the sphere-bowl electrodes, plasmas can be produced in
discharge areas. The plasma is composed of CF3I and metal vapors. The experimental results
above indicate that metal may affect the insulating ability of CF3I. To study the influence of
metals on the CF3I plasma and interpret the experiment results, investigating the plasma
properties is necessary, such as the equilibrium composition, thermodynamic properties (mass
density, enthalpy, and specific heat at constant pressure), and transport coefficients (viscosity,
electrical conductivity, and thermal conductivity). The specific heat capacity at constant
pressure can indicate the heat absorption and dissipation capacity of plasma when the pressure
remains unchanged. The larger the specific heat capacity is, the greater the heat absorption and
dissipation capacity are, which means that the increase in temperature is lower when absorbing
the same amount of heat. A good insulating medium should have a high capacity of heat
conduction and dissipation so that the temperature of the discharge area does not rise too rapidly.
Plasma generated by partial discharge has a higher electrical conductivity; this characteristic
represents greater electron transport ability, the ability to reduce the insulating property of the
region to a greater extent, and the expansion of the discharge region. A reason is that electrical
conductivity is a parameter to describe the difficulty of charge flow inside a material. Therefore,

80
in order to study the effect of metal on the dielectric properties of the discharge region of CF3I,
we calculated the specific heat at constant pressure and the electrical conductivity of CF3I–
metal (Cu, Al or Fe) mixtures for a given pressure of 0.1 MPa, the temperature range 300–
50000 K, and several metal concentrations.
4.4.1 Equilibrium composition and thermodynamic properties
The computation of equilibrium compositions of mixtures was performed using a method
based on the mass action law and the chemical base concept. The Saha, Guldberg-Waage, and
Dalton equations coupled with those of electric neutrality and conservation of stoichiometric
equilibrium enable the calculation of the population number densities as a function of
temperature, pressure, and molar proportions of metal [99]. Considering only the discharge area,
all the compounds were supposed to be gaseous. The considered species are F, C, Cu, Fe, Al, I,
F-, F+, F2+, F3+, F4+, C-, C+, C2+, C3+, C4+, Cu-, Cu+, Cu2+, Cu3+, Cu4+, Cu5+, Fe-, Fe+, Fe2+, Fe3+,
Fe4+, Fe5+, Al-, Al+, Al2+, Al3+, Al4+, Al5+, I-, I+, I2+, I3+, I4+, I5+, F2, F2+, F2
-, C2, C2+, C2
-, CF, CF+,
CF-, Cu2, CuF, Fe2, Al2, Al2-, AlC, AlC-, AlCu, CuI, CFe, CFe+, CFe-, FFe, AlI, AlF, AlF+, I2,
I2+, I2
-, IF, CF2, C2F2, CF3, CF4, C2F4, C2F6, C3, C4, C5, CF2+, CF3
+, C2F, C2F3, C2F5, C6, C7, C3-,
CuF2, FeF3, FeI2, Fe2I4, FeF2, AlI3, Al2F6, Al2I6, AlF2, AlF2+, AlF2
-, AlF3, AlF4-, CF3I, F5I, F7I,
C3F, FC2CF2, CF3C2, C3F4, C3F6, C3F7, C4F2, C4F6-buta and C4F6-cyclo (two C4F6 isomers),
C6F6, and electrons. The condensed species, such as C, Cu, Al, Fe, CuF2, FeF3, FeI2, FeF2, AlI3,
Al4C3, and AlF3 in solid or liquid, are not considered.
In thermal plasmas, the charged species lead to a coulomb field, which is the source of
interactions taking away the plasma of the state of perfect gas, the Dalton law is dominant in
high temperatures when the number densities of the ions are important. The interactions
between the neutral microscopic particles lead to a departure from the state of an ideal gas at
low temperatures. The effects of the interactions between neutral chemical species at low
temperatures is considered with the Virial correction and the effects due to the coulombian
interactions between charged microscopic particles at high temperatures [1] is considered with
the Debye–Hückel correction. As example, Figure 4.10 shows the composition of a 95%CF3I–
5%Fe mixture.

81
F
C
FeI
e-
F-
F+
C-
C+
Fe+I- I+
Fig. 4.10 Population number densities for a 95%CF3I-5%Fe mixture
According to Figure 4.10, the ionization of iron atoms occurs in the temperature before
10 kK. The number density charged microscopic particles climb sharply and the total
population reaches a maximum value of roughly 10 kK. After 10 kK, the electron density tends
to be relatively stable, and the number densities of certain microscopic particles decrease
gradually. Given the rise of metal ions and electrons into the plasma, the state of particles in the
plasma also changes and their activity is strengthened. The number of charged microscopic
particles increases, which makes the partial discharge more serious. The metallic vapors mixed
in the insulating gas discharge plasma in electrical equipment mainly come from exposed metal
or metal impurities, the content of which is concerned with the severity of discharge and the
size of contact area between discharge plasma and metal. The content range of metallic vapor
in insulating gas discharge plasma in electrical equipment was not previously reported. For
the CF3I plasmas mixed with the same kind of metal, the variation trends of the number densities
of metal microscopic particles with temperature are similar. For these reasons, the maximum
concentration of metal vapors was set at 30% in this study. The maximum in calculation was
set at 30% in this calculation. Figures 4.11–4.13 show the number densities of microscopic
particles containing metal element for CF3I plasma with 30% metallic vapor (Cu, Al and Fe,
respectively). Below 5 kK, metal elements exist in molecules or atoms. Between 5 kK and
15 kK, molecules that contain metal disappear and uncharged metal atom decrease gradually.
Metal atoms that lose an electron are the main microscopic particles containing metal element
in this temperature region. Above 15 kK, the number of metal atoms that lose an electron

82
decrease, and metal atoms that lose two electrons appear and increase with the rise of
temperature. Above 20 kK, the number of metal atoms that lose one or two electrons decrease
and metal ions with more positive charge increase. The total number densities and types of
microscopic particles that contain metal element decrease with temperature rise, which
gradually reduces the effect on plasma.
CuI
CuF
Cu
CuF2
Cu+
Cu++
Cu+++
Cu++++
Fig. 4.11 Population number densities of main particles in 70%CF3I-30%Cu mixture at 1 bar
(by mole)
Al2F6
AlF3
AlF2
AlF
Al
Al+
Al++
Al+++
Fig. 4.12 Population number densities of main particles in 70%CF3I-30%Al mixture at 1 bar
(by mole)

83
FeF3
Fe
FeF2
FeF
Fe+
Fe++
Fe+++
Fe++++
Fig. 4.13 Population number densities of main particles in 70%CF3I-30%Fe mixture at 1 bar
(by mole)
Figures 4.11–4.13 show the existing form of these three types of metallic elements in the
plasma in different temperature regions, which may change the thermodynamic properties of
CF3I plasma. We calculated the specific heat at constant pressure of the CF3I–metal plasma with
different content metallic vapors between 300 K and 20 kK, in which the number densities of
microscopic particles that contain metal are relatively large. The equilibrium composition
enables the specific heat at constant pressure Cp (J·kg−1·K−1) to be estimated; it is deduced
according to Equation (4.1) [99]:
CP=(∂H
∂T)p (4.1)
H (J·kg−1) is the specific enthalpy that is obtained based on the number densities, T is the
temperature and p is gas pressure. Cp depends on the nature of the gases in the mixture,
specifically on the chemical reactions occurring in the plasma [1]. Figures 4.14–4.16 show the
evolution of the specific heat Cp as a function of temperature for a CF3I plasma contaminated
by metallic vapors (Cu, Al and Fe).
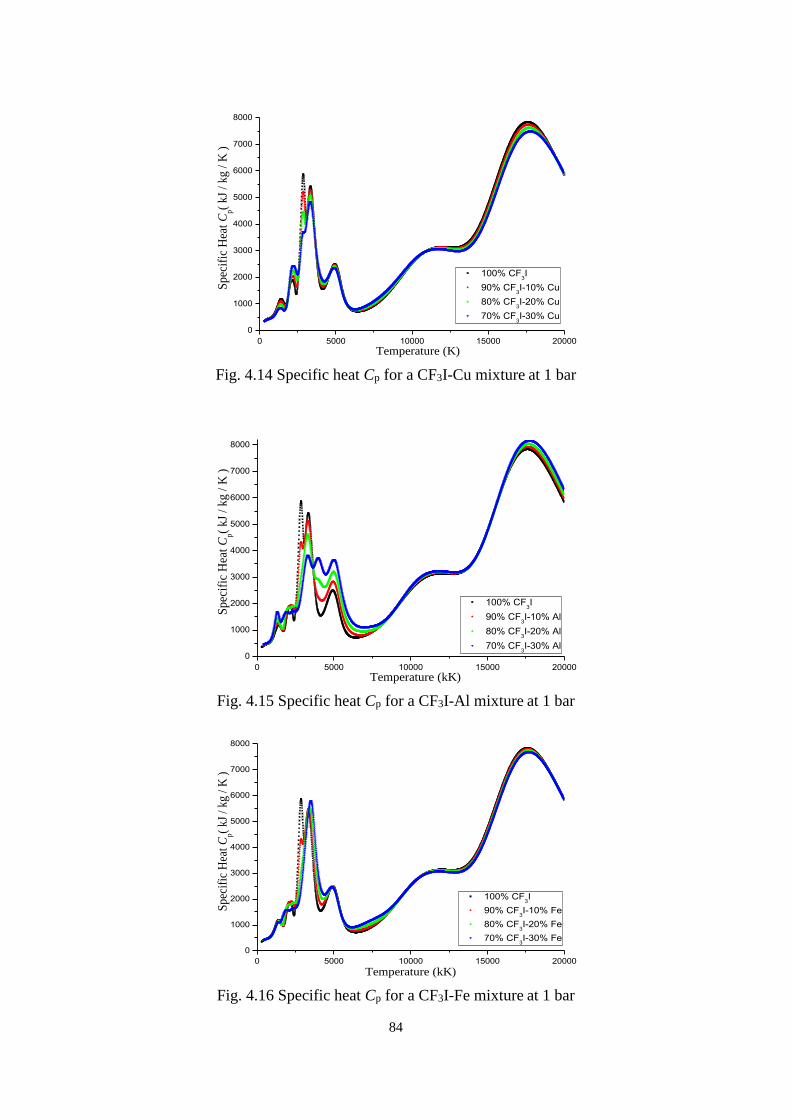
84
0 5000 10000 15000 20000
0
1000
2000
3000
4000
5000
6000
7000
8000
Sp
ecif
ic H
eat
Cp(
kJ
/ k
g /
K )
Temperature (K)
100% CF3I
90% CF3I-10% Cu
80% CF3I-20% Cu
70% CF3I-30% Cu
Fig. 4.14 Specific heat Cp for a CF3I-Cu mixture at 1 bar
0 5000 10000 15000 20000
0
1000
2000
3000
4000
5000
6000
7000
8000
Sp
ecif
ic H
eat
Cp(
kJ
/ k
g /
K )
Temperature (kK)
100% CF3I
90% CF3I-10% Al
80% CF3I-20% Al
70% CF3I-30% Al
Fig. 4.15 Specific heat Cp for a CF3I-Al mixture at 1 bar
0 5000 10000 15000 20000
0
1000
2000
3000
4000
5000
6000
7000
8000
Spe
cifi
c H
eat
Cp(
kJ /
kg
/ K
)
Temperature (kK)
100% CF3I
90% CF3I-10% Fe
80% CF3I-20% Fe
70% CF3I-30% Fe
Fig. 4.16 Specific heat Cp for a CF3I-Fe mixture at 1 bar

85
In Figures 4.14–4.16, the variation trends of these three types of mixtures are similar.
Between 300 and 5 kK, multiple peaks occur in the Cp–T curves of these three types of mixture
plasma, in which temperature complex physicochemical reactions occur inside plasma. The
number of peaks increases more with the increase of Al concentration than Cu or Fe in this
temperature region. Figures 4.11–4.13 indicate that the total number densities and types of
molecules that contain Al are much more than molecules containing Cu or Fe in the plasma
containing the same content of metal. Thus, more physicochemical reactions are related to Al
in CF3I–Al mixture than with the other two types of metals. At 2 kK–3 kK, metal can exist as
atoms (Figures 4.11–4.13), which can reduce the specific heat of mixture plasma. Between 5 kK
and 20 kK, metal ions with a positive charge are the main microscopic particles that contain
metal element. In Figures 4.11–4.13, the number densities of metal ions with a positive charge
respectively reach their maximum values in these three types of mixture plasma at 10 kK, and
the number densities of uncharged atoms decrease rapidly after this temperature. In Figures
4.14–4.16, a peak occurs in the Cp–T curve respectively around 10 kK. Before this peak, the
specific heat increases with increasing contents of metal. After this peak, for plasma that
contains Cu or Fe, the specific heat decreases with increasing contents of metal. Thus, Cu+ or
Fe+ in CF3I plasma may cause temperature to rise faster than CF3I plasma without metal
absorbing the same energy, which promotes the growing of discharge plasma and accelerates
the breakdown. Another obvious peak occurs in the three curves at 17 kK, at which metal ions
with more positive charges continuously increase and enlarge the influence on plasma.
According to the analysis of calculation, metal ions can make the CF3I plasma more active in
high temperature. In serious discharge, the temperature is high enough that metallic element
may be motivated and launch into plasma, thereby exacerbating its seriousness. Thus, the metal
impurities in electrical equipment may be harmful to the insulation properties of CF3I.
4.4.2 Transport coefficients
To evaluate the conductive capability of the plasma, calculating the transport coefficients
such as electrical conductivity is necessary. Electrical conductivity is an important physical
quantity to describe and explain the electron transporting feature. It is closely related to the
electron number density and degree of ionization, which may be influenced by different metallic
elements. The calculation of electrical conductivity is based on a resolution of the Boltzmann
integro-differential equation by the Chapman–Enskog method [1] applied to the complex
mixtures. Knowing the population number densities and collision integrals (Ωij(l,s)
) is necessary;
these values depend on the potential chosen to characterize the interaction between two

86
microscopic particles I and j. Ωij(l,s)
is defined by [100]
Ωij(l,s)
=(kbT
2πμij
)1
2⁄
∫ exp(-γij2)γ
ij2s+3Q
ij
(l)(εr)dγ
ij
∞
0 (4.2)
γij=(
εrkbT⁄ )
12⁄ (4.3)
μij is the reduced mass, εr is the kinetic energy, and Q
ij
(l)(εr) is the total transport cross section,
which depends on the differential cross section and, consequently, on the interaction potential.
The number of couples (l,s) corresponds to the number of collision integrals to be calculated.
The electrical conductivity σ is calculated following the third approximation order of the
Chapman–Enskog method based on literature [100]. The variation of the electrical conductivity
of the CF3I–metal plasma with temperature was analyzed in the temperature range (300K–
20kK), in which the metal elements become active and the number densities of microscopic
particles are large. Figures 4.17–4.19 show the evolution of the electrical conductivity σ (S/m)
for CF3I/metal (Cu, Al, or Fe) mixtures at 1 bar.
2000 4000 6000 8000 10000 12000 14000 16000 18000 20000
10
100
1000
10000
Temperature (K)
Ele
ctri
cal
conduct
ivit
y (
S/m
)
100% CF3I
90% CF3I-10% Cu
80% CF3I-20% Cu
70% CF3I-30% Cu
Fig. 4.17 Electrical conductivity σ of CF3I-Cu at 1 bar

87
0 2000 4000 6000 8000 10000 12000 14000 16000 18000 20000
10
100
1000
10000
Ele
ctr
ical
conducti
vit
y (
S/m
)
Temperature (K)
100% CF3I
90% CF3I-10% Al
80% CF3I-20% Al
70% CF3I-30% Al
Fig. 4.18 Electrical conductivity σ of CF3I-Al at 1 bar
0 2000 4000 6000 8000 10000 12000 14000 16000 18000 20000
10
100
1000
10000
Ele
ctri
cal
conduct
ivit
y (
S/m
)
Temperature (K)
100% CF3I
90% CF3I-10% Fe
80% CF3I-20% Fe
70% CF3I-30% Fe
Fig. 4.19 Electrical conductivity σ of CF3I-Fe at 1 bar
We observe that the electrical conductivities of these three types of CF3I–metal
mixtures all increase with the rise of the metal vapors for temperatures between 5 and
15 kK, at which the electron number density strongly increases because of the presence of
these particles. Consequently, the addition of metal vapors improves the electrical
conductivity capability. The increase of free electrons facilitates the faster development of
partial discharge, which results in insulating property reduction. The increase of the metal
element in the experiment tests increases the electron number density in the plasma and
diminishes the breakdown voltage. Figure 4.20 shows the electrical conductivity σ of CF3I
with the same content of metal (Cu, Al and Fe) at 1 bar and temperature between 5 and
15 kK. At this temperature, many metal atoms lose electrons and become positive ions. By

88
comparison, the effects of different metal on the electrical conductivities of CF3I plasma
are different. This comparison emphasizes that the electrical conductivity capability of a
CF3I plasma contaminated by Cu or Al is more effective than that by Fe, and that Cu or Al
element have more potential harmfulness on the CF3I insulation. The result from
thermodynamic calculation agrees well with that from the experiment and explains the
different effects on breakdown characteristics from different metal particles.
6000 9000 12000 15000
0
1000
2000
3000
4000
5000
6000
7000
Ele
ctri
cal
conduct
ivit
y (
S/m
)
Temperature (K)
100% CF3I
80% CF3I- 20% Fe
80% CF3I- 20% Al
80% CF3I- 20% Cu
Fig. 4.20 Electrical conductivity of CF3I with 20% of metal vapors (Cu, Al and Fe) at 1 bar
4.5 Conclusion
Breakdown voltage of the different mixing ratio of CF3I/CO2 and SF6/CO2 at the same gas
pressure are similar, two kinds of mixed gases have same sensitivity to the copper particles. The
breakdown performance of CF3I/CO2 (k=30%) under 0.3MPa is equivalent to pure SF6 at
0.2~0.25MPa. Considering liquefaction temperature and toxicity issues, CF3I/CO2 with mixed
ratio 30% can be used to replace pure SF6 to resist insulation fault caused by free metal particles.
The breakdown voltage of CF3I diminishes with the rise of the number of free metal
particles. The breakdown voltage of CF3I is higher than that of the SF6 gas under the same
conditions. The metal particles in narrow special gas-insulated equipment cause serious harm
to internal insulation, which can cause partial discharge and even break down more easily. The
insulating strength of CF3I can be close to or even beyond that of SF6 at a pressure of 0.1 MPa,
which can be used in C-GIS and GIL. Compared with Fe particles, Cu or Al particles have more
potential harmfulness to the insulating capability of CF3I.
Partial plasma may occur in the discharge process. In the CF3I-metal plasma, before 5 kK,
metal elements exist in molecules or atoms. After 5 kK, the number of metal ions increase and

89
the ionizations of metal atoms are accelerated. At approximately 10 kK, the number of metal
ions reached a maximum value. With the increase of metal ions, temperature rises faster in
CF3I–Cu plasma or CF3I–Fe plasma than in CF3I plasma without metal absorbing the same
energy. The fast development of ionization can promote the increase of free electrons and the
rise of electric conductivity. By comparison, the electrical conductivity capability of a CF3I
plasma contaminated by Cu or Al is more effective than that by Fe, and that Cu or Al element
have more potential harmfulness on the CF3I insulation.
The electrical studies based on the voltage breakdown test indicate that free metal particles
can reduce the insulation performance of CF3I, which is similar to SF6. Thermal studies show
that the metallic element can affect the specific heat at constant pressure and electrical
conductivity. Both studies prove that metallic element, especially Cu and Al, from free metal
particles can weaken the insulating property of CF3I. Thus, free metal particles should be
avoided inside the electrical equipment, and the metal structure should be wrapped with
insulating varnish and enamel or insulating sleeve, not exposed directly in CF3I.

90

91
CHAPTER 5
INFLUENCE OF HUMIDITY ON THE DECOMPOSITION
PRODUCTS AND INSULATING CHARACTERISTICS OF CF3I
In the processes of production and charging of insulating gas, there is always micro-moisture
mixing in it, because of the defect of technology and sealing. Besides, H2O can also go into
equipment and adhere to the walls and components when assembling and repairing. With the
increase in temperature, the adherent H2O diffusions into insulating gas. There are various
measures to control the content of H2O in GIS such as using moisture filter, but H2O cannot be
completely avoided [80]. The influence of H2O to the decomposition of SF6 in discharge has been
confirmed by research results and power industrial standards [81-83]. The moisture content over
standard in SF6 gas-insulated apparatus will affect the decomposition rate and products types in
discharge, which will further damage its insulating property. And the corrosive products can destroy
the apparatus and shorten their working life [80]. So International Electrotechnical Commission
(IEC) planed strict criteria about moisture content in SF6 [84]. It is necessary to research the
decomposition characteristics of CF3I with micro-moisture in discharge, because the results could
help determine whether it is needed to avoid or reduce moisture in equipment using CF3I or its
mixture as insulating medium and help to provide theoretic foundation for condition assessment
with these characteristic products.
There is very little research about the influence of H2O to the decomposition characteristics and
insulating property of CF3I in discharge. Experimental results show that the main decomposition
products of CF3I are C2F6, C2F4, C2F5I, C3F8, CF3H, etc., C2F6 is the principal product, when
water content of CF3I is from 250 to 400 ppm [50]. Due to the shortage of experimental methods and
measurement techniques, the decomposition products cannot all be detected and the process of
decomposition cannot be accurately analyzed just by existing experimental data. So, in this paper,
we use quantum chemistry simulation to research the decomposition characteristics of CF3I with
micro-moisture in discharge and study the effects on the species and amount of decomposition
products, which can provide theoretical basis for the analysis of its insulating property and
possibility to replace SF6.
5.1 Calculation model
5.1.1 Calculation method
Through argumentation, computational method of quantum chemistry theory was adopted

92
to investigate the formation mechanism of CF3I decomposed components. The results of
quantum chemistry computation can provide much valuable information including molecular
structure of reactant and product, structure of intermediate and critical complex, the minimum
energy path, etc. Among the above information, energy datum, the most important one, involves
the following parts.
1) The changing energy from reactants to products determines the reaction is exothermic
or endothermic, which can be used to judge whether the reaction is spontaneous or not and the
required conditions for the reaction to occur.
2) The activation energy, which determines the trend of reaction, is a good way to estimate
relative scale of nascent product and the importance of reaction.
The energy analyzed by quantum chemistry computation shows the intrinsic nature of each
component, which doesn’t change with the change of any other conditions. The changes of
external conditions, such as temperature, pressure, electric field, all need to be reflected by
means of energy path calculated according to quantum chemistry method. In general case,
statistical thermodynamics method is adopted for observable or verified parameters that can be
measured in experiment, such as rate of reaction and productivity, thus the relationship between
macroscopic phenomena and microcosmic essence can be founded. Therefore, external energy
condition where decomposed components are produced can be extracted by the calculation data
in this research. Formation process and results of decomposed components can be determined
on condition that GIS using CF3I as insulating gas contains micro-moisture.
In the simulation research of this paper, we use DMol3 in Material Studio (MS) 4.3
developed and distributed by Accelrys Company. DMol3 is a commercial (and academic)
software package which uses density functional theory (DFT) with a numerical radial function
[101]. DFT is a computational quantum mechanical modelling method to investigate the
electronic structure of many-body systems, in particular atoms, molecules, and the condensed
phases. With this theory, the properties of a many-electron system can be determined by using
functionals, which in this case is the spatially dependent electron density.
DFT is proposed by Hohenberg and Kohn [102] in 1964. According to their theorem, for any
system of interacting electrons in an external potential V , the potential V is determined
uniquely, apart from a trivial additive constant, by the ground-state electron density :
E E (5.1)
It states that there is one-to-one implicit relation between the ground-state electron density
and the external potential V , and this means that the many-body ground state and

93
energy are unique functionals of , since fixes the many-body Hamiltonian can be
obtained through the solution of this Hamiltonian. Thus, the ground-state energy can be found
by this theorem [103].
There exists a universal functional F ,
eeF T V (5.2)
where T is the functional of kinetic energy and eeV is the functional of electron
interaction energy. is independent of V such that the functional VE , which is
given by
V
E F V d (5.3)
has the following properties: in the space of all densities such that 3d r N ,
where N is a number of electrons, the functional VE has a global minimum at the exact
ground-state density, and this minimum energy is equal to the exact ground-state energy. This
is concerned with the variational principle for the ground-state energy in terms of the electron
density and states that, through minimization of the functional VE in equation (5.3) under
appropriate constraints, the exact ground-state energy E and density can be found [103].
And then the energy of particles in the reactions can be calculated.
DMol3 uses density function method on atomic orbit to calculate the band structure of the
molecules, and then uses variational method to obtain molecular orbital wave function and
energy. Dmol3 can be used to predict the structure and energy of particles, search and optimize
reaction transition states, and reveal the reaction path by graphs. Delley has used full electronic
calculation and pseudo-potential method to analyze the energy of H, C, O, N, F, Cl atoms
accurately [101].
In the simulation calculation, we used Geometry Optimization task of Dmol3 to optimize
each molecule and get the values of bond angles and bond lengths. By comparing them with
the values of bond angles and bond lengths in references, it can be judged whether the model is
effective and reasonable or not. And it can be assured that the later calculations are based on
the right model. On this basis, reaction heat for direct decomposition reactions is obtained by
calculating the difference between the products and reactants energy; Reaction heat with
transition states is obtained by Transition State (TS) Search in Dmol3 to search transition states
among molecules and free radicals (Figure 5.1). We used the Perdew-Wang functional in local-
density approximations (LDA-PWC) of DFT in both geometry optimization and TS Search.
Symmetry calculation is chosen. Self-Consistent Field (SCF) error, maximum period of SCF
and smearing are set as 10-5, 50 and 0.005, respectively. If there is an odd number of electrons
V
F

94
in the computing system, “Spin-Unrestricted” should be chosen. If there is an even number of
electrons in the computing system, “Spin-Unrestricted” should not be chosen. Complete search
mode and frequency calculation of parameters search should be chosen in TS Search to make
sure that all the particles can be calculated. Calculation of transition state optimization should
be done after TS Search to ensure the accuracy.
Fig. 5.1. DMol3 Transition State Search
5.1.2 Optimization of the calculation model
In order to calculate the heat of reaction at normal temperature and atmospheric pressure
(NTP) in the process of MS simulation, we used the correcting values of enthalpy ΔE0 and ΔE1:
1 1 0 0( ) ( )E E E E E (5.4)
E1 and E0 represent the energy of products and reactants at vacuum and absolute zero,
respectively. ΔE1 and ΔE0 represent the correcting values of enthalpy of products and reactants
under 1 atm and 298.5 K, respectively
5.2 Analysis of simulation results
5.2.1 Decomposition of pure CF3I
The process of decomposition of pure CF3I in discharge was simulated and the reaction
pathways and dynamic balance of pure CF3I were analyzed. The situation was set at 15kV
between needle-plate gap of 10mm and pressure, temperature are 1atm and 298.5K,
respectively. And some experiments were done to make sure that gas discharge could occur in
pure CF3I in such situation. Most of the electronic energy in this situation is between 4.3-6.7
eV [104].
The bond angles and bond lengths of products during the process of decomposition of CF3I

95
are given in Table 5.1 and Table 5.2. After comparing with [105-109], results in this paper
approximately agree with the references. It proves that LDA-PWC function is reliable to be
used in Geometry Optimization.
Table 5.1 Bond angles of CF3I molecule and free radicals (unit: degree)
Particles Bond Angles Simulation
Results References [105-109]
CF3I F-C-F 108.5 108.1
F-C-I 110.5 110.5
CF3∙ F-C-F 109.5 109.3
CF3+ F-C-F 109.3
Table 5.2 Bond lengths of CF3I molecule and free radicals (unit: angstrom)
Particles Bond Lengths Simulation
Results References [105-109]
CF3I C-F 1.33 1.34
C-I 2.18 2.14
CF3∙ C-F 1.49 1.70
CF3+ C-F 1.49
C-I bond is the frailest bond in CF3I molecule during discharge whose bond energy is only
53.3 kcal/mol. Generation of radical CF3∙ after the breaking of C-I bond is the basis of latter
series of reactions. When electric field exists, charged particles accelerate in the electric field
direction under the impact of electric field force. Then these particles impact CF3I molecules
and lead to ionization or dissociation. Because the diameter of electrons is much far smaller
than molecules and ions, the average free path of an electron between two adjacent crashes is
much larger than molecules’ and ions’. Therefore, the state of electrons can influence ionization
and dissociation, and reaction processes relate to the energy of electrons.
The main decomposition paths of CF3I [110, 111]:
1) 1a * *
3 3CF I e CF I e (5.5)
1) 1b (5.6)
2) (5.7)
3) (5.8)
4) (5.9)
e* represents a high energy electron. Reaction heats of equations (5.5-5.9) are 26.73 kcal/mol,
53.38 kcal/mol,53.38 kcal/mol, 260.17 kcal/mol, 255.23 kcal/mol, respectively. They are all
endothermic reactions.
Decomposition path 1) consists of both equations (5.5) and (5.6). Equation (5.5) represents
that a high energy electron attaches to a CF3I molecule and energizes it. Equation (5.6) shows
96
that a CF3I molecule in excited state break C-I bond. Equations (6) and (5.7) can both disconnect
C-I bond and both need to absorb 53.38 kcal/mol, which is also consistent with [112]. So the
energy of path 2) absorbed is less than path 1), therefore, reactions through path 2) are easier to
occur. The reaction heat of paths 1) and 2) show that lots of CF3I molecules directly decompose
after crashing with ordinary electrons rather than excite and decompose after attracting traces
of high energy electrons in the space. Paths 3) and 4) correspond respectively with equations
(5.8) and (5.9), they absorb 292.74 kcal/mol and 251.47 kcal/mol, respectively [111], which
matches with the simulation results in this paper, approximately. Energy of most electrons in
low temperature plasma ranges from 99.12 to 154.44 kcal/mol (4.3-6.7 eV) [104]. So the
reactions (5.8-5.9) occur with lower probability, which requires the participation of high-energy
photoelectron.
C2F4 and C3F8, the decomposition products of CF3I, both have CF2: structure which is
usually produced by decomposing from CF3∙. The breaking of C-F bond in CF3∙ is further
studied, shown as equation (5.10).
(5.10)
By the calculation, the absorbed reaction heat of (5.10) is 84.92 kcal/mol, which is
consistent with the research of Okamoto. Y and Tomonari. M [107]. The reaction heat of (5.10)
shows that it is possible for the existing of CF2: in the dynamic balance of CF3I and its
decomposition products.
To study the dynamic balance of CF3I and its decomposition products completely, we also
investigated the possibility of the generation of CF⋮. CF2: can become CF⋮ by losing an F atom.
By calculating, 267.36 kcal is needed to break the C-F bonds in a mole of CF2:. However, this
is almost impossible at NTP in the process of CF3I discharge. This also proves that the
decomposition products of CF3I in discharge do not have the particles containing CF⋮ [102].
Taking into account (5.5-5.10), we got the main dynamic balance of pure CF3I gas with high
dielectric strength in discharge, which is shown as equation (5.11).
(5.11)
5.2.2 Decomposition of H2O
In the study about the impact of micro-moisture on the decomposition products of CF3I in
discharge, researching free radicals generated by H2O is indispensable. Meanwhile, we
analyzed all kinds of possible reaction pathways that H2O is decomposed into free radicals H∙
and OH∙. The bond angles and bond lengths of H2O molecules and ions are given in Table 5.3
and Table 5.4.

97
Table 5.3 Bond angles of H2O molecule and ions (unit: degree).
Particles Bond Angles Simulation
Results Reference [111]
H2O H-O-H 104.8 104.3
H2O+ H-O-H 108.7
H2O- H-O-H 99.2 99.0
Table 5.4 Bond lengths of H2O molecule and ions (unit: angstrom).
Particles Bond Lengths Simulation
Results Reference [113]
H2O H-O 0.98 0.96
H2O+ H-O 1.03
H2O- H-O 1.04 1.03
Table 5.5 shows the decomposition reactions of H2O with the action of high energy
electrons. The calculation results achieve high conformity with [113], which also proves using
LDA-PWC function of DFT in TS Search is feasible.
Table 5.5 The decomposition of H2O with high energy electrons
Number Reaction Equations Reaction Heat (kcal/mol)
(5.12) 197.70
(5.13) 89.90
(5.14) 120.96
(5.15) *
2 2H O e H O
47.64
(5.16) 120.93
(5.17) *
2 2H O e H O 2e
297.98
(5.18) 419.88
(5.19) 436.73
(5.20) *
2 2H O e H O 2e
447.53
(5.21) *
2 2H O e H O 2e
474.81
Through calculation, the reactions (5.12-5.21) are all endothermic. The reaction heat of
(5.12) and (5.17-5.21) is more than 154.44 kcal/mol, the energy scope of the majority of
electrons. In comparison, the incidences of reactions (5.13-5.16) are higher, of which, the
adsorption reaction (5.15) requires the lowest energy of reaction and it is most likely to react.
After the reaction (5.15), H2O- may collide with a high energy electron and then decompose,
such as reaction (5.22).
(5.22)
This reaction is endothermic and needs 68.62 kcal/mol. At 298.15K, [113] shows that OH-
need to absorb at least 31.05 kcal/mol to turn into OH∙ and H- can release 4.19 kcal/mol to turn
into H ∙ . As a result, the easiest way of forming H ∙ is reaction (5.13) that just needs

98
89.90kcal/mol. The easiest way of forming OH∙ is reaction (5.15), in which H2O attaches an
electron, and then react as (5.22). This process needs at least 116.26 kcal/mol in total.
5.2.3 Decomposition of CF3I with micro-moisture
On the basis of the dynamic balance of pure CF3I and the formation of free radicals from
H2O above, we investigated the possible decompositions of CF3I with micro-moisture. Through
analyzing the chemical elements from CF3I and H2O and the possible molecules that can exist
stably, we found that the main possible decompositions of CF3I with micro-moisture are C2F6,
I2, C2F4, C2F5I, C3F8, HF, H2, COF2, CF3H and CF3OH. Through simulation, Table 5.6 and
Table 5.7 show the bond angles and bond lengths of decompositions, respectively.
Table 5.6 Bond angles of possible decompositions (unit: degree)
Particles Bond Angles Simulation
Results References [105-109]
C2F6 F-C-F 109.0 108.8 F-C-C 110.0 109.5
C2F4- F-C=C 123.1 123.2
F-C-F 113.7 113.4
C3F8 F-C-F(CF3) 109.1 110.3
F-C-F(CF2) 109.5 110.5
C-C-C 115.2 114.9
F(CF3)-C-C 108.6 119.0
F(CF2)-C-C 108.0 107.5
C2F5I F-C-F(CF3) 109.5
F-C-F(CF2I) 108.3
I-C-F 110.0
I-C-C 112.0
F(CF3)-C-C 110.3
F(CF2)-C-C 108.3
CF3H F-C-F 108.4 109.3
F-C-H 110.5 109.8
COF2 F-C-F 107.3 108.5
F-C=O 126.0 125.9
CF3OH F-C-F 108.7
O-C-F 112.5
C-O-H 108.7
Table 5.7 Bond lengths of possible decompositions (unit: angstrom).
Particles Bond Lengths Simulation
Results References[105-109]
C2F6 C-C 1.54 1.54 C-F 1.33 1.32

99
C2F4- C=C 1.33 1.34
C-F 1.31 1.38
C3F8 C-C 1.54 1.56
F-C (CF3) 1.33 1.38
F-C(CF2) 1.34 1.37
C2F5I C-C 1.54
F-C (CF2I) 1.49
F-C(CF3) 1.49
I-C 2.10
CF3H C-F 1.34 1.38
C-H 1.10 1.09
COF2 C-F 1.49
C=O 1.51
HF H-F 0.95 0.92
HI H-I 1.65 1.61
CF3OH C-F 1.49
C-O 1.51
O-H 1.11
H2 H-H 0.74 0.75
I2 I-I 2.66 2.66
The simulation results of bond angles and bond lengths of the possible decompositions
approach to the data from references, which proves the validity of our simulation model. So we
calculated the decomposition reactions and reaction heat with this simulation model. The results
are listed in Table 5.8.
Table 5.8 Reaction of the decompositions of CF3I with H2O
Number Reaction Equations Reaction Heat (kcal/mol)
(5.23) 3 2 6 22CF I C F I 24.57
(5.24) 2 6 2 3 8C F CF C F : 68.11
(5.25) -125.51
(5.26) -90.77
(5.27) -117.50
(5.28) 2 22HI H I 2.94
(5.29) -94.15
(5.30) -132.96
(5.31) 3 2CF OH COF +HF 19.41
Equation (5.23) shows that CF3I can decompose into C2F6 and I2 in discharge. The
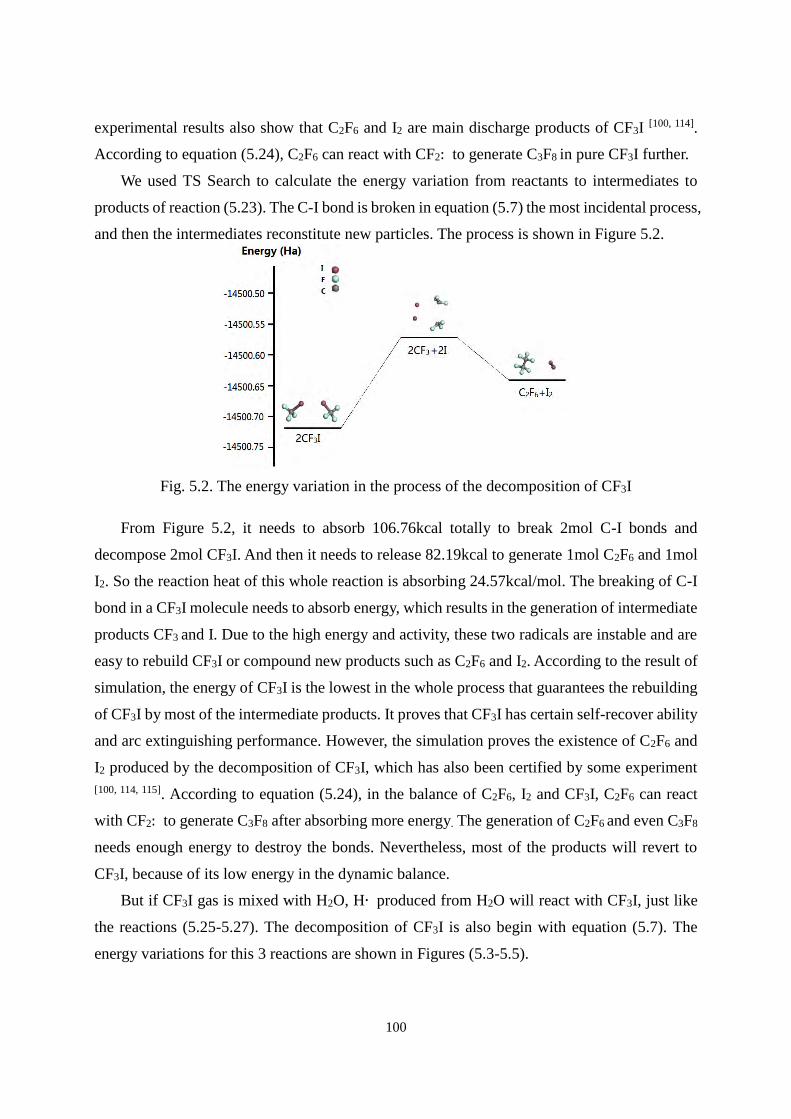
100
experimental results also show that C2F6 and I2 are main discharge products of CF3I [100, 114].
According to equation (5.24), C2F6 can react with CF2: to generate C3F8 in pure CF3I further.
We used TS Search to calculate the energy variation from reactants to intermediates to
products of reaction (5.23). The C-I bond is broken in equation (5.7) the most incidental process,
and then the intermediates reconstitute new particles. The process is shown in Figure 5.2.
Fig. 5.2. The energy variation in the process of the decomposition of CF3I
From Figure 5.2, it needs to absorb 106.76kcal totally to break 2mol C-I bonds and
decompose 2mol CF3I. And then it needs to release 82.19kcal to generate 1mol C2F6 and 1mol
I2. So the reaction heat of this whole reaction is absorbing 24.57kcal/mol. The breaking of C-I
bond in a CF3I molecule needs to absorb energy, which results in the generation of intermediate
products CF3 and I. Due to the high energy and activity, these two radicals are instable and are
easy to rebuild CF3I or compound new products such as C2F6 and I2. According to the result of
simulation, the energy of CF3I is the lowest in the whole process that guarantees the rebuilding
of CF3I by most of the intermediate products. It proves that CF3I has certain self-recover ability
and arc extinguishing performance. However, the simulation proves the existence of C2F6 and
I2 produced by the decomposition of CF3I, which has also been certified by some experiment
[100, 114, 115]. According to equation (5.24), in the balance of C2F6, I2 and CF3I, C2F6 can react
with CF2: to generate C3F8 after absorbing more energy. The generation of C2F6 and even C3F8
needs enough energy to destroy the bonds. Nevertheless, most of the products will revert to
CF3I, because of its low energy in the dynamic balance.
But if CF3I gas is mixed with H2O, H∙ produced from H2O will react with CF3I, just like
the reactions (5.25-5.27). The decomposition of CF3I is also begin with equation (5.7). The
energy variations for this 3 reactions are shown in Figures (5.3-5.5).

101
Fig. 5.3 The energy variation of CF3I and H∙ generating C2F5I, HF and HI
Fig. 5.4 The energy variation of CF3I and H∙ generating C2F4, HF and I2
Fig. 5.5 The energy variation of CF3I and H∙ generating CF3H and HI

102
The energy variations between all stages from reactants to products are showed in Figures
(5.3-5.5). The processes of generating free radicals are all endothermic, while the processes for
rebuilding of free radicals are exothermic. The energy of final products in these three reactions
is lower than the energy of reactants, which is different from the situation without H2O in Figure
5.2. This means that the final products in these 3 reactions can exist stably, which can inhibit
the reverse reaction and the self-recovery of CF3I. H∙ promotes CF3I molecules to decompose.
If there is H2O in CF3I, it can aid the process of decomposition of CF3I molecule under
discharge. Because CF3I is the sole effective insulative component, whose decomposed
products, such as C2F5I, C2F4, CF3H, HF and HI, cannot reach its insulation level. In the area
of partial discharge (PD), content of CF3I reduces because of its decomposition, which leads to
reduced insulation strength. This condition intensifies the discharge. This creates a vicious
circle that makes this PD more and more serious. The discharge quantity will increase under
such condition. In addition, the chemical property of HI is instable and decomposed easily.
According to the calculation of reaction (5.28), 1mol HI may decompose into H2 and I2 by
absorbing at least 2.94kcal. So the decomposition products may contain a little H2. The
decomposition products contain trace of H2.
Meanwhile, H2O can also decompose into OH∙, as is shown in Figure 5.6. Equations (5.29-
5.30) illustrate that there are two possible paths for the reaction between OH∙ and CF3I [111], in
which COF2, HF and CF3OH are produced, respectively. Meanwhile, CF3OH is thermolabile
and instable and it may decompose into COF2 and HF easily, as is shown in equation (5.31).
Similar to the effect of H·, OH· promotes the generation of stable molecules and reduces the
ratio of CF3I rebuilding.
It is shown by the simulation results that CF3I can generate corrosive and toxic gases, such
as HF and COF2, in discharge with micro-moisture, which corresponds to [100]. COF2 is called
carbonyl fluoride in chemistry, which is extremely poisonous with a threshold limit value of 2
ppm for short-term exposure and can endanger life and health by over exposure [116].

103
Fig. 5.6 The energy variation of CF3I and H∙ generating CF3H, HI
According to the results of analysis, H∙ and OH∙ decomposed from H2O can complicate
and diversify the decomposition products as well as destroy the dynamic balance of CF3I in
discharge, which reduces the content of CF3I. COF2 and CF3OH also cannot reach the insulation
level of CF3I. So discharge because more and more serious and the insulation protection in this
area has been destroyed and cannot recover because of H2O. In addition, the harmful gases
produced during CF3I decomposition can endanger health of people and erode equipment.
5.3 Experimental verification
Discharge quantity is an important physical quantity to describe the severity of PD.
Nowadays, discharge quantity used as reference quantity of severity of insulation failures
corresponds to the characteristic values measured by relevant detect methods in most electrical
equipment online monitoring system, which can be used to detect the degration of insulating
material. PD is the beginning of development of insulation fault and early warning. There is
practical significance by researching the influence of H2O to CF3I in PD under the same
condition, the increase of discharge quantity means the increase of discharge strength and the
decrease of insulating ability. Discharge quantity is the concrete expression of micro-
phenomenon, which can characterize the voltage withstand level of CF3I with different amounts
of H2O. According to the analysis above, trace of H2O can accelerate the decomposition of CF3I
in discharge and inhibit its self-recovery indirectly. In order to validate the simulation results,
we collected the experiment data of PD of CF3I with micro-moisture. The relationship between
discharge quantity and moisture content in PD is researched at the same pressure and voltage.
The pulse current method used to measure discharge quantity in this experiment was based on
the IEC60270 standard [86]. The experimental container for PD experiment is shown in Figure

104
5.7. The cylindrical container with the volume of 15 L is made of stainless steel. The inception
PD voltage of the device is 45 kV. Needle-plate electrodes made of copper are adopted to do
PD experiment. The inter-electrode distance is 10mm, the curve radius of needle tip is 0.3mm,
the point angle is 30°, the diameter of grounded plate electrode is 120mm and the thickness is
10mm. The inception PD voltage (U0) of the electrodes in pure CF3I at NTP is 7.6kV. The test
voltage for this experiment was set at 1.5U0=11.4kV.
Fig. 5.7 The experimental container
The accurate trace H2O introduction system showed in Figure 5.8 was designed and used
to control the moisture content in the container. This system is connected with the experimental
container by a connecting pipe through the switch C, which mainly contains micro-syringe,
stainless steel tubule, three-way valve and quartz glass tube.
(a) The picture of the actual object (b) The structure of the system
Fig. 5.8 Accurate trace H2O introduction system
Before the experiment, the volume of liquid water injected into the system should be

105
calculated according to the amount of water vapor needed in the experiment. From an empirical
formula: V1=kV, V1 represents water vapor content in the container, whose unit is μL/L;V
represents the injection volume of liquid water in the micro-syringe, whose unit is μL; k
represents a conversion coefficient determined by pressure, volume and humidity. k equals to
3.125/L in this experimental environment.
Because CF3I substituting SF6 as insulation medium in electric equipment is still in the
research phase, there is no standard of moisture content applied for CF3I at this stage. This
paper refers to IEC 60480-2004 (Ed2, version3) [83], which provides the upper limit of moisture
in SF6 gas used in electric equipment. The standard prescribes that the moisture content in main
chamber of electric equipment, e.g. GIS, can’t exceed 320 μL/L, respectively. To simulate CF3I
decomposition in GIS with standard and substandard moisture, we prepare CF3I/H2O of 5
different concentrations for PD tests: 0, 80, 250, 750, 1500μL/L. The content of H2O in the
container is tested by GE600 chilled-mirror dew-point hygrometer showed in Figure 5.9, the
distinguishability of which is 0.1 μL/L. Because of the water adsorbed on the wall of container,
not fully vaporizable H2O in quartz glass tube and not fully diffused H2O, the actual measured
content of H2O has a certain difference with the target value, as shown in Table 5.9. “Target
value” in the table represents the content of water vapor required in the test; “Calculated value”
represents the volume of injected liquid water calculated by the empirical formula; “Measured
value” the content of water vapor measured by the dew-point hygrometer after liquid water
evaporating and entering the container.
Fig. 5.9 GE600 chilled-mirror dew-point hygrometer

106
Table 5.9 List of the injection H2O
Target Value
(μL/L)
Calculated Value
(μL)
Measured Value
(μL/L)
0 0 16.2
100 32 93.2
250 80 211.6
750 240 719.3
1500 480 1439.8
The experiment process goes as follows: before applying voltage on the container, turn on
the switches A and C. A vacuum pump is used to extract gas from the container and accurate
trace H2O introduction device through the connecting pipe of switch A, with the pressure value
on the barometer observed at the same time. After vacuumizing device, close switch A and
vacuum pump in turn. Turn on switch B and inject CF3I gas slowly into the container until the
pressure is 0.10 MPa. Close switch B and then vacuumize the container. The process must be
repeated at least 3 times so as to exhaust gaseous impurities sufficiently. After the completion
of cleaning, keep the container vacuum and use micro-syringe to pump a certain amount of
liquid distilled water and inject it into the quartz glass tube under vacuum. When all the water
in the syringes is injected into the quartz glass tube, pull out the syringes. Use hair dryer to heat
quartz glass tube until the water in the quartz glass tube is completely vaporized. After water is
completely vaporized, keep the the quartz glass tube heated for another 5-10 minutes to make
water vapor to fully spread into the container. 30 minutes later, close switch C and turn on
switch B to inject CF3I. When the pressure reaches 0.10 MPa, close switch B. After 12 hours
of standing of the container with mixture inside, dew-point hygrometer is used to detect actual
content of H2O. If it does not accord with standard of experiment, repeat the above steps until
it meets the requirements. After it meets the requirement, apply 11.4 kV voltage to the container,
and measure the discharge quantity of PD after 10 hours. The measured results shown in Figure
5.10.

107
0 200 400 600 800 1000 1200 1400 1600
1000
2000
3000
4000
5000
Dis
ch
arg
e M
ag
nit
ud
e (
pC
)
H2O content (uL/L)
Fig. 5.10 The changes of discharge quantity with the changes of H2O content.
According to the Figure 5.10, the discharge quantity of PD between needle-plate electrodes
gradually increases with the increase of H2O content, which indicates that severity of PD
increases as the micro-moisture content in CF3I increases gradually. It confirms the results of
simulation in this paper: under the condition of discharge, micro-moisture damages dynamic
balance of CF3I and reduces insulation strength of CF3I gas.
5.4 Conclusion
The main decomposition way of CF3I molecule in the electric field is direct decomposition
after colliding with an ordinary electron. Dynamic balance of CF3I gas in electric field mainly
involves CF3I, CF3∙, I∙, CF2: and F∙. Two main free radicals of H∙ and OH∙ can be easily
produced by H2O decomposition. Under the impact of them, decomposition products of CF3I
include the main components C2F6, I2 and other components such as C2F4, C2F5I, C3F8, HF, H2,
COF2, CF3H, CF3OH, which can damage the original balance of CF3I and prevent the rebuilding
of CF3I. As a result, the process of CF3I decomposition is promoted, which leads to decline of
CF3I insulation performance. Based on the results of experiment, with the increase of H2O
content, PD intensity in CF3I increases gradually, which confirms the damage of gas insulation
property. Therefore, if CF3I or its mixtures can be used as insulating gases, the influence of
micro-moisture is noteworthy and should be avoided.

108

109
CHAPTER 6
SUMMARY AND PROSPECTS
6.1 Conclusions
In this paper, systematic investigation of power frequency insulation properties of
CF3I/CO2 under different pressures, mixed ratios and electrical environments were carried out
for the first time, with the possibility of substituting for pure SF6 or SF6/CO2 mixed gases used
in gas insulated electric equipment inquired. Experiments were conducted to verify the ability
to resist discharge caused by electric defects under free metal particles, a kind of typical
insulation defects inside gas insulated electric equipment. What’s more, aimed at investigating
different effects of metal materials on the insulation performances of CF3I, thermodynamic
calculations of CF3I-metal plasma were launched. Considering the application prospect of
environmental-friendly substitute gas containing CF3I used in electric equipment, simulation
and partial discharge experiments were finished to study decomposition mechanism with
moisture. The main innovative achievements and conclusions are as follows.
① Because of the several disadvantages of traditional testing equipment of gas insulating
characteristics, double tank structure of insulation property test equipment was designed in
order to enhance the safety and accuracy of experiment. The electric field or the defect type can
be changed through different tailor-made electrodes to realize the multi-functionalization of the
experimental platform.
② Incipient discharge voltage of positive half cycle was proposed as one of the standards
to evaluate gas insulation characteristic under power frequency alternating voltage. Incipient
discharge voltages of different mixed ratios, voltages, and distances in both positive and
negative half cycles under power frequency partial discharge were measured at needle-plane
electrodes, which could prove that CF3I/CO2 performed as good as or even better than SF6/CO2
in the aspects of partial discharge characteristic and sensitivity to the uniformity of electric field.
CF3I/CO2 with the mixed ratio of 30% at the pressure of 0.3MPa performs best in the partial
discharge characteristics and meets the requirement of liquefaction temperature.
③ By simulating the possible different electric fields inside the devices, the influence of
electric field utilization coefficient on the power frequency breakdown performance of
CF3I/CO2 and CF3I were tested systematically. In different electric fields, CF3I/CO2 performed
as good as or even better than SF6/CO2 in the aspect of breakdown characteristics with good
stability. The breakdown performances of CF3I/CO2 with the mixed ratio of 30% at the pressure

110
of 0.3MPa were better than that of SF6 at the pressure of 0.15MPa.
④ Synergistic effect of CF3I/CO2 and SF6/CO2 mixed gases under different uniformity of
electric field were compared and analyzed: Synergistic effect of CF3I/CO2 under extremely
non-uniform electric field was better than that of SF6/CO2. With the increase of gas pressure,
the synergistic effects of SF6/CO2 and CF3I/CO2 improved gradually and tend to be saturated.
Furthermore, the adjunction of CO2 improved the sensitivity of CF3I and SF6 to electric field,
the effect to CF3I is more obvious.
⑤ Power frequency breakdown performance of CF3I/CO2 under free metal particle defect
was investigated. The breakdown voltages of CF3I/CO2 under different conditions were similar
to that of SF6/CO2, and the breakdown performance of CF3I/CO2 of 30%mixed ratio at the
pressure of 0.3MPa is equal to that of SF6 at the pressure of 0.2~0.25MPa.
⑥ The influences of the amount of metal particles and the species of metal elements on
the insulation performances of CF3I were studied by experimental and thermodynamics
calculation. The results show that, the metal particles of Cu, Al and Fe will lead to the decrease
of breakdown voltage of CF3I. The larger the amount of particles is, the lower the breakdown
voltage is. Compared with Fe, the particles of Cu and Al cause more serious damage to
insulation property of CF3I. Thermodynamics calculation show that, with the increase of metal
ions, temperature rises faster in CF3I–Cu plasma or CF3I–Fe plasma than in CF3I plasma
without metal absorbing the same energy. The fast development of ionization can promote the
increase of free electrons and the rise of electric conductivity. Metallic element, especially Cu
and Al, from free metal particles can weaken the insulating property of CF3I. Thus, free metal
particles should be avoided inside the electrical equipment, and the metal structure should be
wrapped with insulating varnish and enamel or insulating sleeve, not exposed directly in CF3I.
⑦ For the first time, the experiment of capacity test of partial discharge of CF3I with
moisture of different contents proved that, H2O can be harmful to the insulating performances
of CF3I. Theoretical research was carried out to investigate the discharge process and products
species of CF3I with and without moisture. The decomposed mechanism and main products
were obtained, which provides the evidence that the adjunction of H2O does harm to the self-
recovery process and promotes the decomposed process, thus leading to the decrease of
insulating property.
6.2 Prospects of following research work
Insulation performances and ability of CF3I/CO2 and pure CF3I to resist typical insulation

111
defects under power frequency voltages were investigated, with the most proper CF3I/CO2
mixed ratio proposed for electric equipment application. Furthermore, the effects of metal
materials and moisture on the discharge process and physicochemical properties of CF3I were
studied, which provided theoretical and experimental support for choice of inner materials and
content standard of moisture when CF3I and its moisture were adopted as environmental-
friendly substitute gases for electric equipment insulation. This kind of research needs further
improvements.
① Arc extinction properties of CF3I/CO2 need more studies. Arc extinction ability should
be investigated inside switchgear where arc discharge can possibly happen from experimental
and simulation aspects.
② Transport coefficients of CF3I-metal plasma need more investigations. Properties such
as viscosity and thermal conductivity as well as the energy exchange and motions of particles
during the process of streamer development should be studied to prove the experimental results.
③ Insulation characteristics of CF3I/CO2 under other kinds of discharges such as impulse
voltage and DC voltage should be studied experimentally, so as to supply experimental support
for the wide application of such substitute gases.

112

113
Reference [1]. Xiaoxing Z., Song X., Yefei H., Cressault Y. Experimental studies on power frequency breakdown voltage
of CF3I/N2 mixed gas under different electric fields [J]. Applied Physics Letters, 2016, 108(9): 092901.
[2]. Chu F. Y. SF6 decomposition in gas-insulated equipment [J]. Electrical Insulation, IEEE Transactions on,
1986(5):693-725.
[3]. Christophorou L. G., Olthoff J. K., Van Brunt R. J. Sulfur hexafluoride and the electric power industry [J].
IEEE Electrical Insulation Magazine, 1997, 5(13):20-24.
[4]. Tominaga S., Kuwahara H., Hirooka K., et al. SF6 gas analysis technique and its application for evaluation
of internal conditions in SF6 gas equipment [J]. Power Apparatus and Systems, IEEE Transactions on,
1981(9):4196-4206.
[5]. Mingliang X. Analysis on the development of sulfur hexafluoride industry in China. Chemical propellant
with high polymer material [J]. 2010. (04). 65-67.
[6]. Xiaoxing Z., Junjie Z., Ju T., Song X., Min Z., Experimental study on partial discharge characteristics of
CF3I/N2 gas mixture. High voltage technology [J]. 2013. (02). 287-293.
[7]. Hong Z., Research on Insulation Performance of C4F8, CF4 gas mixture [D]. Shanghai Jiao Tong University.
2006
[8]. Mota-Babiloni A., Navarro-Esbrí J., Barragán-Cervera Á., et al. Analysis based on EU Regulation No
517/2014 of new HFC/HFO mixtures as alternatives of high GWP refrigerants in refrigeration and HVAC
systems[J]. International Journal of Refrigeration, 2015. (52). 21-31.
[9]. Yanabu S., Arai S., Kawaguchi Y., et al. New concept of switchgear for replacing SF6 gas or gas mixture[M]
Gaseous Dielectrics IX, Springer, 2001, 497-504.
[10]. Min H., China-EU joint statement on climate change. Petroleum refinery engineering [J]. 2015. (08). 40
[11]. Rui L., Jianji L., Yan T., Hongchun X., Zongyi L., Safe use of SF6 in the medium and high voltage
switchgear [J]. Electrical application. 2009. (20). 16-20
[12]. Bin L., Further Discussion on Monitoring and Threshold of Moisture in SF6 Gas [J]. High voltage Electrical
Equipment. 2006. (02). 109-112
[13]. Yafen W., Minliang S., Tsaicheng H., Tsaiperng J., Total toxicity equivalents emissions of SF6, CHF3, and
CCl2F2 decomposed in a RF plasma environment [J]. Chemosphere. 2006. 62(10). 1681-1688
[14]. Luwen X., Occupational hazards of sulphur hexafluoride in power system [J]. China Occupational
Medicine. 2004. 31(5). 66-67
[15]. Kraut A., Lilis R., Pulmonary effects of acute exposure to degradation products of sulphur hexafluoride
during electrical cable repair work [J]. British journal of industrial medicine, 1990, 47(12):829-832.
[16]. Pilling K. J., Jones H. W., Inhalation of degraded sulphur hexafluoride resulting in pulmonary oedema [J].
Occupational Medicine, 1988, 38(3):82-84.

114
[17]. Lingal H. J., Strom A. P., Browne T. E., An Investigation of the Arc-Quenching Behavior of Sulfur
Hexafloride [J]. Power Apparatus and Systems, Part III. Transactions of the American Institute of Electrical
Engineers, 1953, 72(2).
[18]. Malik N. H., Qureshi A. H., A review of electrical breakdown in mixtures of SF6 and other gases[J].
Electrical Insulation, IEEE Transactions on, 1979(1):1-13.
[19]. Yuchang Q., Yunping F., Calculation of Dielectric Strength of SF6/N2 Gas Mixtures. Journal of Chinese
Electrical Engineering Science [J]. 1993. (S1). 59-64
[20]. Yuchang Q., Dengming X., The insulation stength of SF6/CO2 mixed gases [J]. High Voltage Apparatus .
1994. (03). 7-11
[21]. Hu Z., Xingwen L., Shenli J., Zhifang L., Qinxiao D., Study of Dielectric Breakdown Properties in 50%SF6-
50%CF4 Mixtures at 1 atm [J]. Proceedings of the CSEE. 2013. (19). 200-207
[22]. Koch H., Hopkins M. Overview of gas insulated lines (GIL) [C]. IEEE, 2005.
[23]. Diessner A., Finkel M., Grund A., et al. Dielectric Properties of N2/SF6 Mixtures for Use in GIS or GIL[C].
IET, 1999.
[24]. Youping T., Zhikang Y., Bing L., Cong W., Xiangjun Z., Xueqiang D., Calculation on Dew Temperatures
of Binary Gas Mixtures SF6/N2 and SF6/CO2 Under 0.4~0.8 MPa Gas Pressures [J]. High Voltage
Engineering. 2015. (05). 1446-1450
[25]. Devins J. C., Replacement gases for SF6 [J]. IEEE Transactions on Electrical Insulation, 1980:81-86.
[26]. Qiu Y., Ren X., Liu Z. Y., et al. Negative n- Synergism in CF2Cl2-N2 and CF2Cl2-CO2 Gas Mixtures [M]
Gaseous Dielectrics VI, Springer, 1991, 89-94.
[27]. Takuma T., Hamada S., Yamamoto O., Application of a gas mixture with c-C4F8 in gas insulation [C]. IET,
1999.
[28]. Yamada H., Analysis of Discharge Voltage in c-C4F8 Mixtures with N2 [J]. Papers of Technical Meeting
on Plasma Science and Technology, IEE Japan.2000, 2000, 44-53:39-44.
[29]. Yamamoto O., Takuma T., Hamada S., Applying a gas mixture containing c-C4F8 as an insulation medium
[J]. Dielectrics and Electrical Insulation, IEEE Transactions on, 2001, 8(6):1075-1081.
[30]. Okubo H., Yamada T., Hatta K., Partial discharge and breakdown mechanisms in ultra-dilute SF6 and PFC
gases mixed with N2 gas [J]. Journal of Physics D: Applied Physics, 2002, 35(21):2760.
[31]. Liuchun Z., Dengming X., Dong Z., Biantao W., SST Experimental Analysis on the Feasibility of c-
C4F8/CF4 Substituting SF6 as Insulation Medium [J]. TRANSACTIONS OF CHINA
ELECTROTECHNICAL SOCIETY. 2008. (06). 14-18
[32]. Biantao W. Researches on insulation characteristic of c-C4F8 and its mixtures. [D]. Shanghai JiaoTong
University. 2007.
[33]. Liuchun Z., Study on insulation characteristics of c-C4F8 and its gas mixtures substituting SF6. [D].

115
Shanghai JiaoTong University. 2007.
[34]. Yunkun D., Dengming X., Xuewen L., Measurement of Electron Swarm Parameters in Nitrous Oxide [J].
Plasma Science and Technology, 2013, 15(5):425.
[35]. Dengming X., Yunkun D. Determination of Electron Swarm Parameters in Pure CHF3 and CF4 by a Time-
Resolved Method [J]. Plasma Science and Technology, 2013, 15(1):25.
[36]. Biantao W., Dengming X., Zhangsheng L., Analysis of insulation characteristics of c-C4F8 and N2 gas
mixtures by the Monte Carlo method [J]. Journal of Physics D: Applied Physics, 2006, 39(19):4204.
[37]. Weijun X., Guoqiang Z., Kang L., Wenhao N., Xin W., Yingying W, Experimental study on partial
discharge characteristics of C4F8/N2 mixed gas [J]. Chinese Journal of Electrical Engineering. 2011. (07).
119-124
[38]. Kang L., Guoqiang Z., Weijun X., Dong H., Wenhao N., Experimental analysis of C4F8 and its
decomposition products with N2 mixed gas in typical fault [J]. High voltage technology. 2012. (04). 985-
992
[39]. Okabe S., Wada J., Ueta G., Dielectric properties of gas mixtures with C3F8/C2F6 and N2/CO2 [J].
Dielectrics and Electrical Insulation, IEEE Transactions on, 2015, 22(4):2108-2116.
[40]. Wang X., Zhong L., Yan J., Investigation of dielectric properties of cold C3F8 mixtures and hot C3F8 gas as
Substitutes for SF6[J]. The European Physical Journal D, 2015, 69(10):1-7.
[41]. Atkins P., Jones L. Chemistry: Molecules, matter and change, ed WH Freeman New York [J]. 1997.
[42]. Nakayama N., Ferrenz E. E., Ostling D. R., Surface chemistry and radiation chemistry of
trifluoroiodomethane (CF3I) on Mo (110) [J]. The Journal of Physical Chemistry B, 2004, 108(13):4080-
4085.
[43]. Toyota H., Matsuoka S., Hidaka K., Measurement of sparkover voltage and time lag characteristics in CF3I-
N2 and CF3I-air gas mixtures by using steep-front square voltage [J]. IEEJ Transactions on Fundamentals
and Materials, 2005, 125:409-414.
[44]. Kasuya H., Katagiri H., Kawamura Y., Measurement of Decomposed Gas Density of CF3I-CO2 Mixture
[C]. 2009.
[45]. Ngoc M. N., Denat A., Bonifaci N., Impulse partial discharges and breakdown of CF3I in highly non-
uniform field [C]. 2010.
[46]. Taki M., Maekawa D., Odaka H., Interruption capability of CF3I Gas as a substitution candidate for SF6
gas [J]. Dielectrics and Electrical Insulation, IEEE Transactions on, 2007, 14(2):341-346.
[47]. Lide D. R. CRC handbook of chemistry and physics [M]. CRC press, 2004.
[48]. Mccain W. C., Macko J., Toxicity review for iodotrifluoromethane (CF3I) [C]. 1999.
[49]. Kasuya H., Katagiri H., Kawamura Y., Measurement of Decomposed Gas Density of CF3I-CO2 Mixture
[C]. 2009.

116
[50]. Jamil M. K. M., Ohtsuka S., Hikita M., Gas by-products of CF3I under AC partial discharge [J]. Journal of
Electrostatics, 2011, 69(6):611-617.
[51]. Takeda T., Matsuoka S., Kumada A., By-product generation through electrical discharge in CF3I gas and
its effect to insulation characteristics [J]. IEEJ Transactions on Power and Energy, 2011, 131:859-864.
[52]. Jirásek V., Schmiedberger J., čenský M., Production of iodine atoms by RF discharge decomposition of
CF3I [J]. Journal of Physics D: Applied Physics, 2011, 44(11):115204.
[53]. Kochetov I. V., Napartovich A. P., Vagin N. P., Mechanism of pulse discharge production of iodine atoms
from CF3I molecules for a chemical oxygen-iodine laser [J]. Journal of Physics D: Applied Physics, 2009,
42(5):55201.
[54]. Takeda T., By-products of CF3I produced by spark discharge [Z]. Tokyo, Japan: The University of Tokyo,
2007157-160.
[55]. Committee on Toxicology, Board on Environmental Studies and Toxicology, Division on Earth and Life
Studies, National Research Council, “Iodotrifluoromethane: Toxicity Review”, National Academy of
Sciences, USA, 2004.
[56]. Association C. G., CGA P-20: Standard for the Classification of Toxic Gas Mixtures [S]. 2013.
[57]. Takeda T., Matsuoka S., Kumada A., Sparkover and surface flashover characteristics of CF3I gas under
applications of nanosecond square pulse voltage [C]. 2009.
[58]. Yuanyuan D., Study on the thermal physical properties of three fluorine methane and two fluorine methane
[D], Tsinghua University, UK, 1998.
[59]. Yokomizu Y., Ochiai R., Matsumura T., Electrical and thermal conductivities of high-temperature CO2-
CF3I mixture and transient conductance of residual arc during its extinction process [J]. Journal of Physics
D: Applied Physics, 2009, 42(21):215204.
[60]. Y. Cressault, V. Connord, H. Hingana, et al. Transport properties of CF3I thermal plasmas mixed with CO2,
air or N2 as an alternative to SF6 plasmas in high-voltage circuit breakers [J]. Journal of Physics D: Applied
Physics, 2011, 44(49):495202.
[61]. Katagiri H., Kasuya H., Mizoguchi H., et al. Investigation of the performance of CF3I Gas as a Possible
Substitute for SF6 [J]. Dielectrics and Electrical Insulation, IEEE Transactions on, 2008, 15(5):1424-1429.
[62]. Ngoc M. N., Denat A., Bonifaci N., Electrical breakdown of CF3I and CF3I-N2 gas mixtures [C]. IEEE,
2009.
[63]. Takeda T., Insulation performance of CF3I and its by-products by sparkover discharge [Z]. Tokyo, Japan:
The University of Tokyo, 2008.
[64]. Kamarudin M., Experimental investigation of CF3I-CO2 gas mixtures on the breakdown characteristics in
uniform and nonuniform field configurations [D]. Cardiff University, 2013.
[65]. Youping T., Yan L., Cong W., Breakdown characteristics of CF3I and CF3I/N2 gas mixtures in uniform

117
field[C]. IEEE, 2015.
[66]. M. Kamarol, Gas Decomposition Analysis of CF3I under AC Partial Discharge of Non-uniform Electric
Field Configuration [Z]. 2007161-164.
[67]. Xiaoxing Z., Junjie Z., Ju T., Ran Z., Yang C., Experimental study on partial discharge insulation
characteristics of CF3I/CO2 mixed gas in a needle plate electrode [J]. Transactions of China Electrotechnical
Society.2013. (01). 36-42
[68]. Xiaoxing Z., Junjie Z, Ju T., Song X., Yefei H., Experimental study on insulation characteristics of partial
discharge of CF3I/CO2 and CF3I/N2 in two kinds of mixed gases [J]. Chinese Journal of Electrical
Engineering. 2014. (12). 1948-1956
[69]. Katagiri H., Kasuya H., Mizoguchi H., BTF interruption capability of CF3I-CO2 mixture [C]. IEEE, 2008.
[70]. Widger P., Investigation into CF3I-CO2 gas mixtures for insulation of gas-insulated distribution equipment
[D]. Cardiff University, 2014.
[71]. Hasegawa H., Shimozuma M., Itoh H., Properties of electron swarms in CF3I [J]. Applied Physics Letters,
2009, 95(10):101504.
[72]. De Urquijo J., Juárez A. M., Basurto E., Electron impact ionization and attachment, drift velocities and
longitudinal diffusion in CF3I and CF3I-N2 mixtures [J]. Journal of Physics D: Applied Physics, 2007,
40(7):2205.
[73]. Deng Y., Xiao D., Analysis of the insulation characteristics of CF3I gas mixtures with Ar, Xe, He, N2, and
CO2 using Boltzmann equation method [J]. Japanese Journal of Applied Physics, 2014, 53(9):96201.
[74]. Yunkun D., Dengming X., The effective ionization coefficients and electron drift velocities in gas mixtures
of CF3I with N2 and CO2 obtained from Boltzmann equation analysis [J]. Chinese Physics B, 2013,
22(3):35101.
[75]. Hu Z., Xingwen L., Shenli J., Calculation and analysis of mixed gas insulation characteristics of CF3I-N2
and CF3I-CO2 under different ratios of 300K [J]. High voltage technology. 2013. (07). 1692-1697
[76]. Qingguo C., Qiaogen Z., Yuchang Q., Xinfang W., Chun M. Discharge characteristics of GIS under fast
transient overvoltage [J]. Power grid technology. 2000. (09). 1-4
[77]. Caliap L., Lesaint O., Denat A., Influence of a metallic particle at a metal/insulator/gas triple junction in
air and SF6 [C]. IEEE, 2009.
[78]. Lundgaard L. E., Particles in GIS characterization from acoustic signatures [J]. Dielectrics and Electrical
Insulation, IEEE Transactions on, 2001, 8(6):1064-1074.
[79]. Hattori T., Honda M., Aoyagi H., A study on effects of conducting particles in SF6 gas and test methods
for GIS [J]. Power Delivery, IEEE Transactions on, 1988, 3(1):197-204.
[80]. Zeng F., Tang J., Zhang X., Influence regularity of trace H2O on SF6 decomposition characteristics under
partial discharge of needle-plate electrode[J]. Dielectrics and Electrical Insulation, IEEE Transactions on,

118
2015, 22(1):287-295.
[81]. Zeng F., Tang J., Zhang X., Study on the influence mechanism of trace H2O on SF6 thermal decomposition
characteristic components [J]. Dielectrics and Electrical Insulation, IEEE Transactions on, 2015, 22(2):766-
774.
[82]. Sauers I., Harman G., A mass spectrometric study of positive and negative ion formation in an SF6 corona.
II. Influence of water and SF6 neutral by-products [J]. Journal of Physics D: Applied Physics, 1992,
25(5):774.
[83]. Iec I., guidelines for the checking and treatment of sulfur hexafluoride (SF6) taken from electrical equipment
and specification for its re-use [Z]. SI]: IEC, 2004.
[84]. Std I., IEEE Guide for Moisture Measurement and Control in SF6 Gas-Insulated Equipment [S]. 1993.
[85]. Commission I. E. IEC 60270 Standard [S]. 2000.
[86]. Xiaoxing Z., Song X., Junjie Z., Experimental analysis of the feasibility of CF3I/CO2 substituting SF6 as
insulation medium using needle-plate electrodes [J], Dielectrics and Electrical Insulation. IEEE
Transactions on, 2014, 21(4): 1895-1900.
[87]. Jonas U., Krüger C., The effect of polar, nonpolar, and electrostatic interactions and wetting behavior on
the particle assembly at patterned surfaces [J], Journal of Supramolecular Chemistry, 2002, 2(1): 255-270.
[88]. Gulski E., Digital analysis of partial discharges [J], IEEE Transactions on Dielectrics and Electrical
Insulation, 1995, 2(5): 822-837.
[89]. Van Brunt R. J., Leep D., Characterization of point-plane corona pulses in SF6 [J], Journal of Applied
Physics, 1981, 52(11): 6588-6600.
[90]. Gulski E., Kreuger F.H., Computer-aided recognition of discharge sources [J], IEEE Transactions on
Electrical Insulation, 1992, 27(1): 82-92.
[91]. Xiaoxing Z., Song X., Yefei H., Experimental studies on power frequency breakdown voltage of CF3I/N2
mixed gas under different electric fields [J], Applied Physics Letters, 2016, 108(9): 092901.
[92]. Zhengying L., A survey on the limiting breakdown strength and electron attachment rate constants in
electronegative gas mixtures [J], Acta Physica Sinica. 1990, 39: 1040-1046.
[93]. Laghari J. R., Qureshi A. H. A review of particle-contaminated gas breakdown [J]. Electrical
Insulation, IEEE Transactions on, 1981(5):388-398.
[94]. Cookson A. H., Bolin P. C., Doepken H. C., Recent research in the United States on the effect of
particle contamination reducing the breakdown voltage in compressed gas-insulated systems [C]. 1976.
[95]. Metwally I. A., Dynamic analysis of motion of spherical metallic particles in non-uniform electric
field [J]. Dielectrics and Electrical Insulation, IEEE Transactions on, 2002, 9(2):282-293.
[96]. Purnomoadi A. P., Al-Suhaily M., Meijer S., The influence of free moving particles on the breakdown
voltage of GIS under different electrical stresses [C]. IEEE, 2012

119
[97]. Hara M, Negara Y, Setoguchi M, Particle-triggered pre-breakdown phenomena in atmospheric air gap
under AC voltage [J]. Dielectrics and Electrical Insulation, IEEE Transactions on, 2005, 12(5): 1071-
1081.
[98]. Sarathi R., Umamaheswari R., Understanding the partial discharge activity generated due to particle
movement in a composite insulation under AC voltages [J]. International Journal of Electrical Power
& Energy Systems, 2013, 48: 1-9.
[99]. B. Chervy, A. Gleizes, M. Razafinimanana, Thermodynamic properties and transport coefficients in
SF6-Cu mixtures at temperatures of 300-30000 K and pressures of 0.1-1 MPa [J]. Journal of Physics
D: Applied Physics, 1994, 27(6): 1193.
[100]. Y. Cressault, A. Gleizes, Thermodynamic properties and transport coefficients in Ar–H2–Cu plasmas
[J]. Journal of Physics D: Applied Physics, 2004, 37(4): 560.
[101]. Delley B., An all-electron numerical method for solving the local density functional for polyatomic
molecules [J]. J. Chem. Phys., 1990, 92(1): 508-517.
[102]. Hohenberg P., Kohn W., Inhomogeneous electron gas [J]. Phys. Rev., 1964, 136 (3B): B864.
[103]. Ortmann F., Roche S. and Valenzuela S. O. Topological Insulators: Fundamentals and Perspectives [J].
John Wiley & Sons, 2015.
[104]. Christophorou L. G., Electron-Molecule Interactions and Their Applications [J]. Academic Press,
2013, 2.
[105]. Roszak S., Kaufman W. J., Balasubramanian K., Structure and energetics of CF3Cl-CF3Br, and CF3I-
radical anions [J]. J. Chem. Phys. 1997, 106 (18): 7709-7713.
[106]. Swick D. A., Karle I. L., Structure and internal motion of C2F6 and Si2Cl6 vapors [J]. J. Chem. Phys.,
1954, 23(8): 1499-1504.
[107]. Okamoto Y., and Tomonari M., Ab initio calculations on reactions of CHF3 with its fragments [J]. J.
Phys. Chem., 2000, 104 (12): 2729-2733.
[108]. Christophorou L. G., Olthoff J. K., Fundamental Electron Interactions with Plasma Processing Gases
[M], Springer Science & Business Media, 2012.
[109]. Yannoni C. S., Dailey B. P., Ceasar G. P., Studies of chemical shift anisotropy in liquid crystal solvents.
IV. Results for some fluorine compounds [J]. J. Chem. Phys., 1971, 54(9): 4020-4023.
[110]. Jirásek V., Schmiedberger J. and Čenský M., Production of iodine atoms by RF discharge
decomposition of CF3I [J]. J. Phys. D: Appl. Phys., 2011, 44(11): 204-211.
[111]. Gilles M. K., Talukdar R. K., Ravishankara A. R., Rate coefficients for the OH+ CF3I reaction between
271 and 370 K [J]. J. Phys. Chem. A, 2000, 104(39): 8945-8950.
[112]. Kumaran S. S., Su M. C., Lim K. P., Michael J. V., Thermal decomposition of CF3I using I-atom
absorption [J]. Chem. Phys. Letters, 1995, 2(43): 59-63.

120
[113]. Claydon C. R., Segal G. A.,Taylor H. S., Theoretical interpretation of the optical and electron
scattering spectra of H2O [J]. J. Chem. Phys., 1971, 54(9): 3799-3816.
[114]. Kamarudin M., Experimental Investigation of CF3I-CO2 Gas mixtures on the breakdown
characteristics in uniform and nonuniform field configurations [D], Cardiff University, UK, 2013.
[115]. Katagiri H., Kasuya H., Mizoguchi H., Yanabu S., Investigation of the performance of CF3I gas as a
possible substitute for SF6 [J]. Dielectrics and Electrical Insulation. IEEE Transactions on, 2008, 15(5):
1424–1429.
[116]. Farlow M. W., Man E. H., Tullock C. W., Carbonyl Fluoride [J]. Inorganic Syntheses, 1960, 6: 155-
158.

121
AUTHOR : Song XIAO
TITLE : Research on insulation performance of SF6 substitute CF3I/CO2 under power
frequency voltage and the influence of micro-moisture on CF3I
THESIS SUPERVISOR : Yann CRESSAULT
SITE : LAPLACE UMR 5213 CNRS, Université Paul Sabatier, 118 route de Narbonne, Bât.
3R3, 31062 Toulouse Cedex 9
____________________________________________________________________
Abstract
A large amount of gas insulated equipment are applied widely as the key part of power
system. Gas insulated equipment develop quickly and used widely in high and ultra-high
voltage field owing to its high stability, less maintenance work, smaller floor space, and
flexible configuration.
Nowadays, SF6 is adopted as the main insulation medium of gas insulated equipment,
which is considered a kind of dangerous greenhouse gas to environment. Global climate
warming caused by greenhouse effect brings disastrous consequences to our living
conditions. Electric devices account much for the emission of SF6, which makes it urgent
to find a kind of environment-friendly substitute insulating gas. Besides, the decomposed
products of SF6 under discharge may be corrosive to internal material and poisonous to
power workers.
In the early period of global research and development of environment-friendly
insulated devices, mastering the formula and key technique of substitute gas is vital to
electrical development. According to the above circumstance, systematic investigation of
the insulating characteristics of CF3I/CO2 mixed gases under power-frequency voltage was
carried out firstly, which could provide useful information for the best mixed ratio of
CF3I/CO2 and the design of internal structure in matching devices. Then insulating
characteristic of CF3I/CO2 and CF3I were tested under a kind of normal insulating defect
of free metal particles defect, and the influence of metal particles on the thermodynamic
characteristics and transmission properties of CF3I discharge plasma were calculated
theoretically. The overall performance of CF3I/CO2 under typical defects were tested for
the choice of internal metal materials of electrical devices. Finally, the influence of
moisture, the main hazardous material on gas insulated equipment, on the insulating
performance of CF3I were conducted experimentally and theoretically, which proved the
harmful effect of moisture on the new insulating medium and provided theoretical
foundation for the standard constitution of moisture content.

122


![[B3] XIAO Guangrui_TF 2012 Xiao Sichuan Roads Development Projects](https://img.pdfslide.net/doc/110x75/577ce47b1a28abf1038e7451/b3-xiao-guangruitf-2012-xiao-sichuan-roads-development-projects.jpg)