Embed Size (px)
DESCRIPTION
Covariation in Productivity of Mid-Columbia Steelhead Populations. Brian Pyper & Steve Cramer. S.P. Cramer & Associates, Inc. 600 N.W. Fariss Road Gresham, OR 97030 www.spcramer.com. Mid – Columbia Study Area. Background. Mid-Columbia steelhead ESU listed as threatened - PowerPoint PPT Presentation
Citation preview

Covariation in Productivity ofMid-Columbia Steelhead
Populations
S.P. Cramer & Associates, Inc.600 N.W. Fariss RoadGresham, OR 97030www.spcramer.com
Brian Pyper & Steve Cramer

Mid – Columbia Study Area

Background
»Population abundance»Population growth rate
(productivity)»Spatial structure »Diversity
• Mid-Columbia steelhead ESU listed as threatened
• NMFS uses four measures to evaluate viable salmonid populations (McElhany et al. 2000):

Background
• “Lambda” analysis a key tool used by NMFS to assess productivity (Homes 2001; McClure et al. 2003)
• “Lambda” measures population growth rate and extinction risk using time series of escapement data (increasing or decreasing trend?)
• Model is not mechanistic
• Assumes no density dependence in spawner-recruit dynamics

Spawner-recruit analysis
• Examined spawner-recruit data for 8 populations (Cramer et al. 2005)
• Estimated intrinsic growth rates and capacity
• Compared 4 spawner-recruit models:» Density independent model» Ricker model» Beverton-Holt model» Hockey-stick model
• Used simulations to examine potential bias

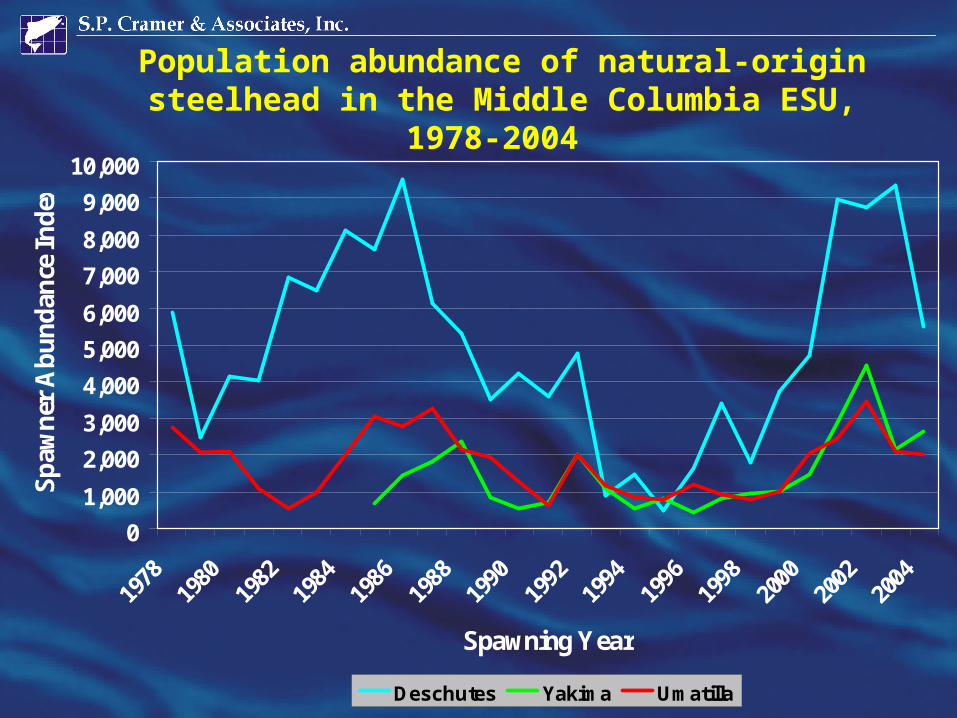
Data• Dam counts of natural-origin
spawners :» Deschutes » Yakima» Umatilla
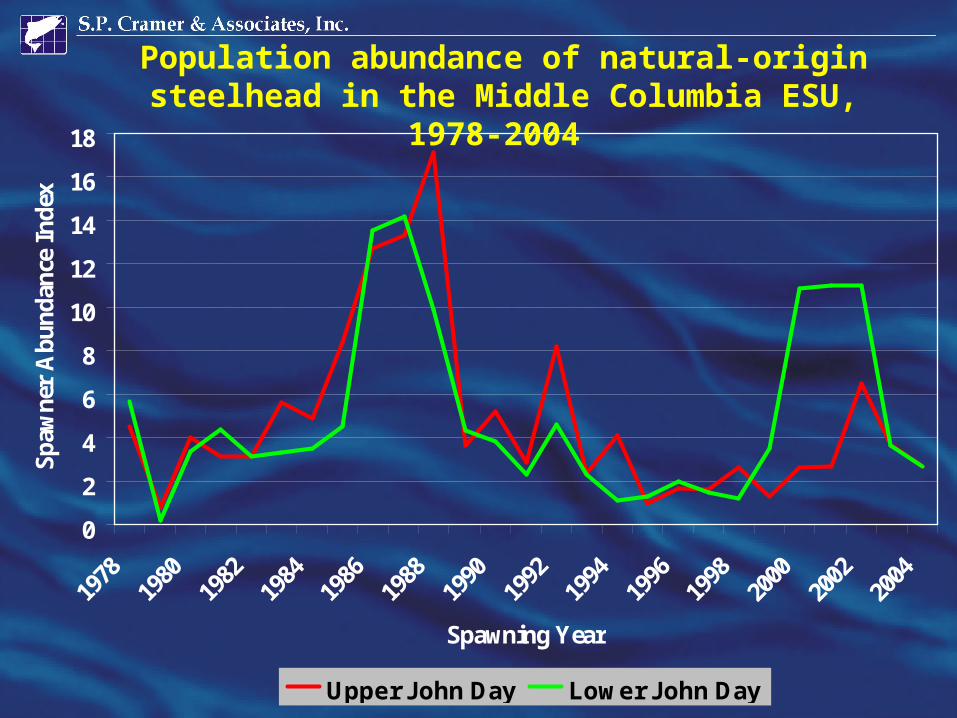
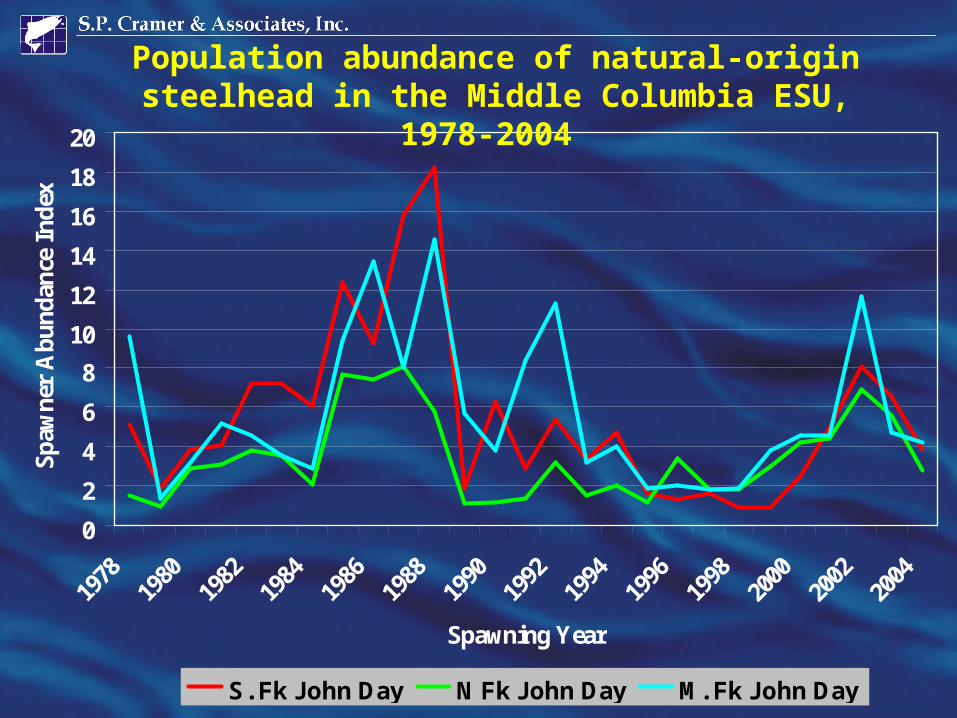
• Redd counts (index) for 5 John Day subpopulations:
» Upper and Lower Mainstem
» South, Middle, and North Forks
• Recruitment indices based on available harvest and age-structure data
0
1,000
2,000
3,000
4,000
5,000
6,000
7,000
8,000
9,000
10,000
Spawning Year
Sp
awn
er A
bu
nd
ance
In
dex
Deschutes Yakima Umatilla
Population abundance of natural-origin steelhead in the Middle Columbia ESU,
1978-2004
0
2
4
6
8
10
12
14
16
18
Spawning Year
Sp
awn
er A
bu
nd
ance
In
dex
Upper John Day Lower John Day
Population abundance of natural-origin steelhead in the Middle Columbia ESU,
1978-2004
0
2
4
6
8
10
12
14
16
18
20
1978
1980
1982
1984
1986
1988
1990
1992
1994
1996
1998
2000
2002
2004
Spawning Year
Sp
awn
er A
bu
nd
ance
In
dex
S. Fk John Day N Fk John Day M. Fk John Day
Population abundance of natural-origin steelhead in the Middle Columbia ESU,
1978-2004
Covariation in recruitment
• Escapement indices correlated (Avg. r = 0.63)
• Suggests shared influence of freshwater or marine conditions on survival
• Suggests limited measurement error
• Next step: Fit spawner-recruit models …
0 2 4 6 80
2
4
6
8
10
85
86 87
88
DI
RK
1:1
BH
HS
Spawner Index
Re
crui
t In
dex
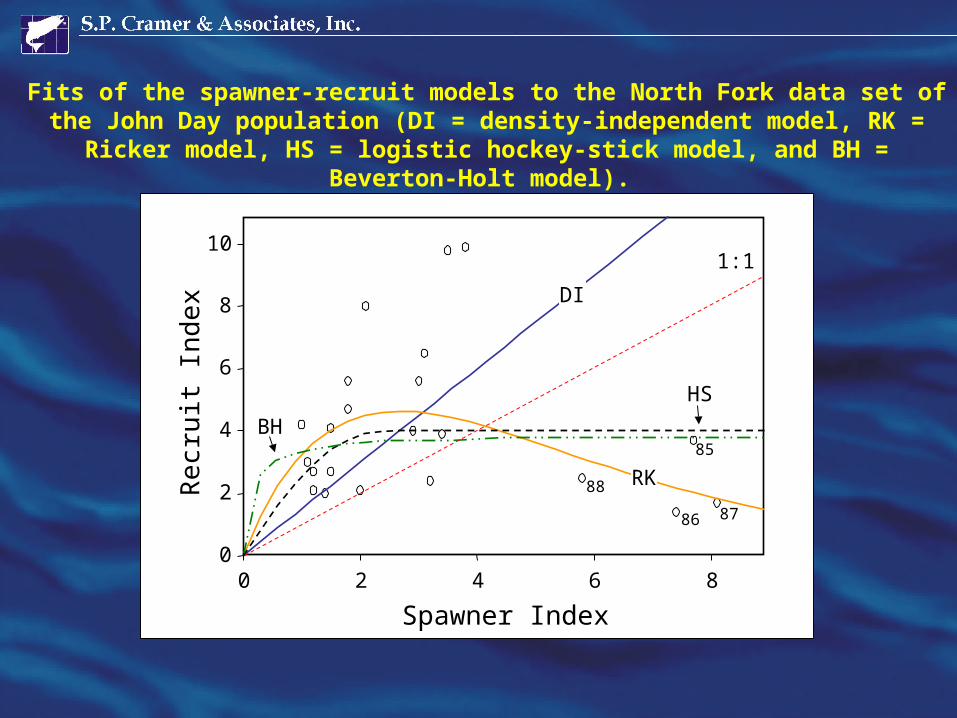
Fits of the spawner-recruit models to the North Fork data set of the John Day population (DI = density-independent model, RK = Ricker model, HS = logistic hockey-stick model, and BH = Beverton-Holt
model).
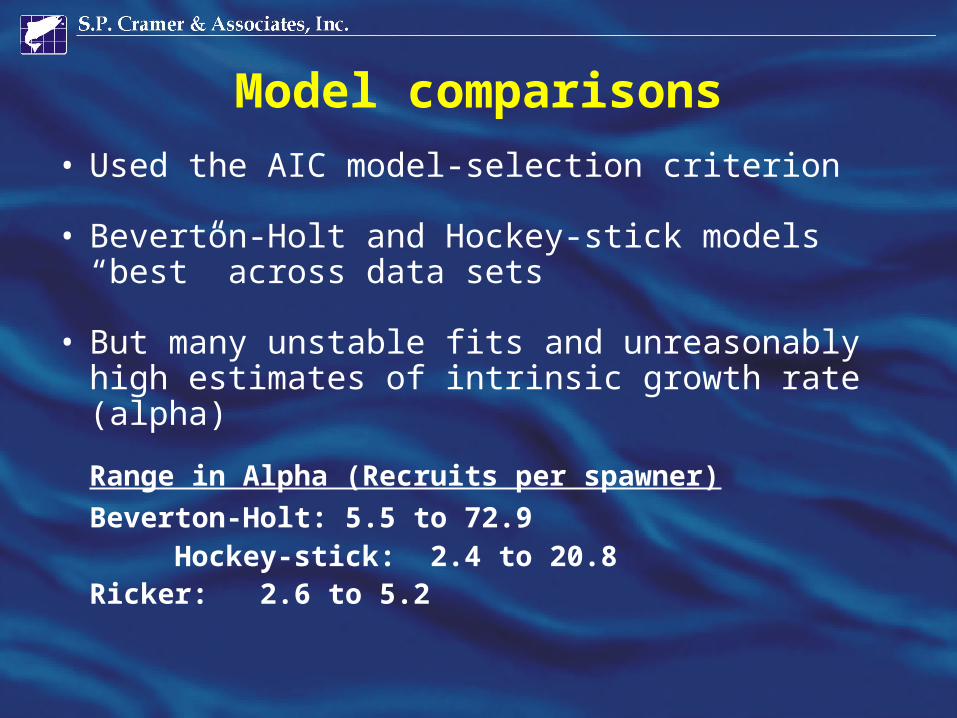
Model comparisons• Used the AIC model-selection criterion
• Beverton-Holt and Hockey-stick models “best” across data sets
• But many unstable fits and unreasonably high estimates of intrinsic growth rate (alpha)
Range in Alpha (Recruits per spawner)
Beverton-Holt: 5.5 to 72.9 Hockey-stick: 2.4 to 20.8
Ricker: 2.6 to 5.2
Model comparisons
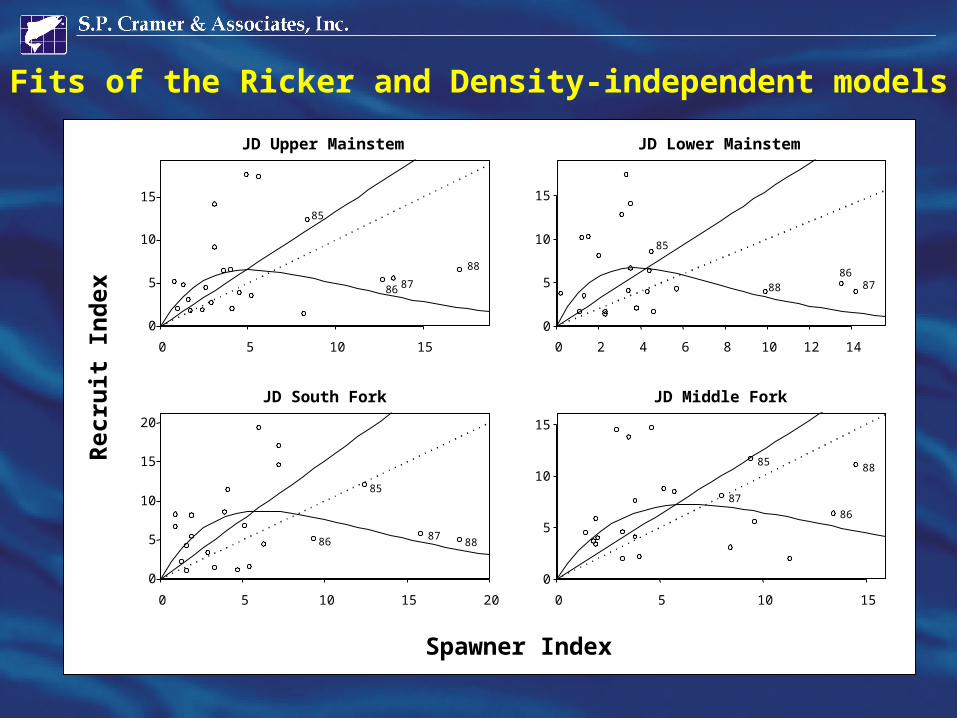
• Ricker model stable with biologically reasonable estimates of growth rate (alpha)
• Ricker fits much better than Density- Independent model for all 8 data sets
• Note: Estimates of capacity similar across forms (Ricker, Beverton-Holt, Hockey-stick)
• Density Independent model assumes no limit to capacity
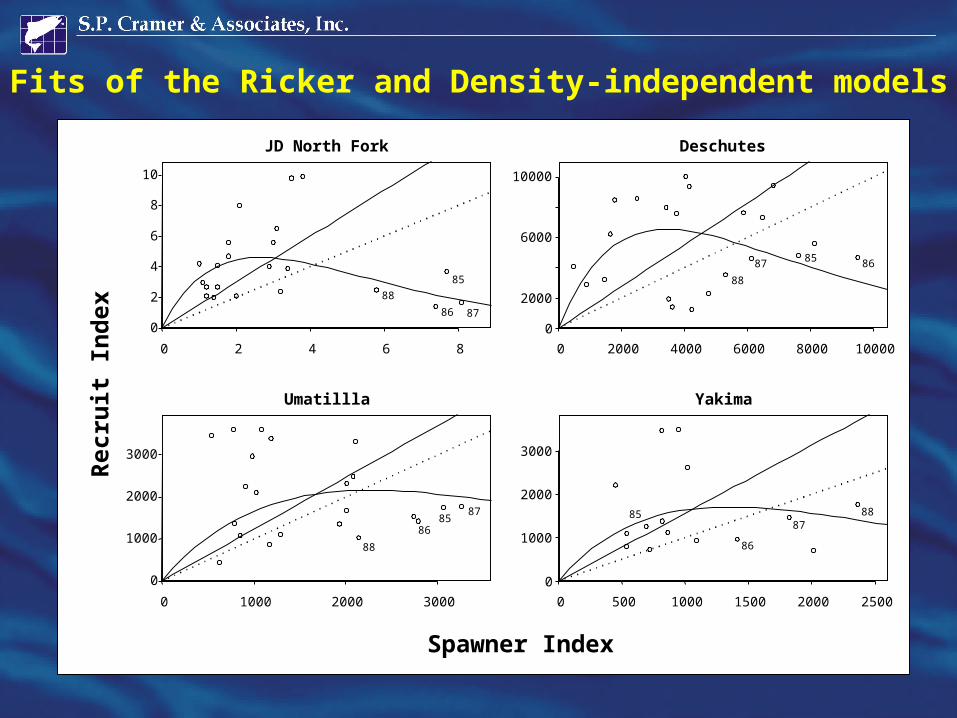
Fits of the Ricker and Density-independent models
0 2 4 6 8
0
2
4
6
8
10
JD North Fork
0 2000 4000 6000 8000 10000
0
2000
6000
10000
Deschutes
0 1000 2000 3000
0
1000
2000
3000
Umatillla
0 500 1000 1500 2000 2500
0
1000
2000
3000
Yakima
Spawner Index
Rec
ruit
In
dex
85
86 87
88
85 8687
88
8586
87
88
85
86
8788
0 5 10 15
0
5
10
15
JD Upper Mainstem
0 2 4 6 8 10 12 14
0
5
10
15
JD Lower Mainstem
0 5 10 15 20
0
5
10
15
20
JD South Fork
0 5 10 15
0
5
10
15
JD Middle Fork
Spawner Index
Rec
ruit
In
dex
85
86 87
88
85
868788
85
86 8788
85
86
87
88
Fits of the Ricker and Density-independent models
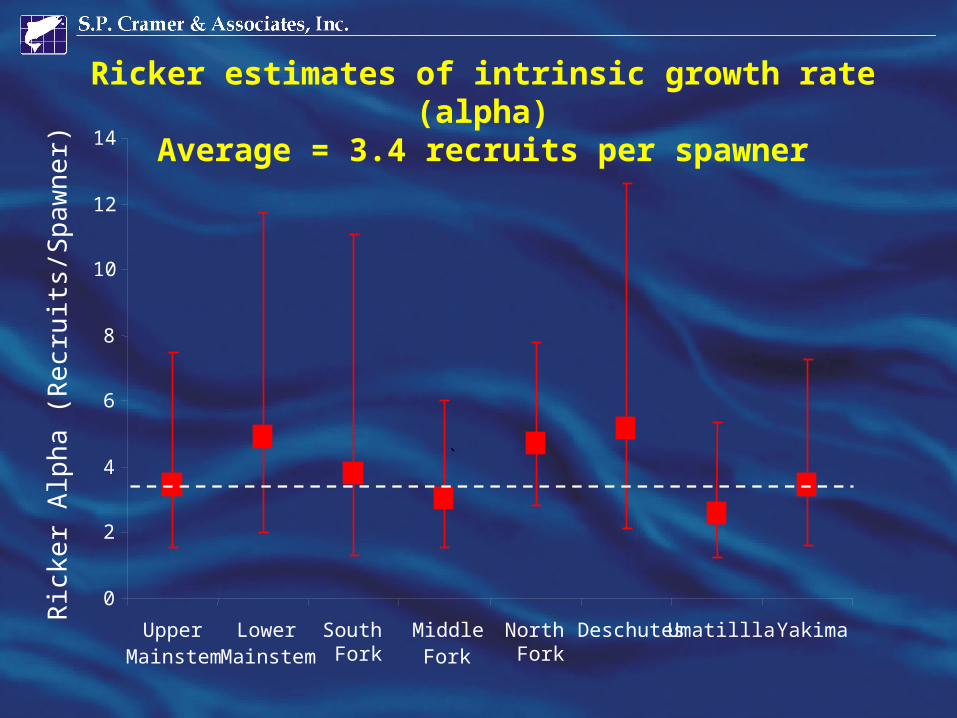
Ricker estimates of intrinsic growth rate (alpha)Average = 3.4 recruits per spawner
0
2
4
6
8
10
12
14
UpperMainstem
LowerMainstem
South Fork
MiddleFork
North Fork
Deschutes Umatillla Yakima
Ric
ker
Alp
ha
(Re
crui
ts/S
paw
ner)
`
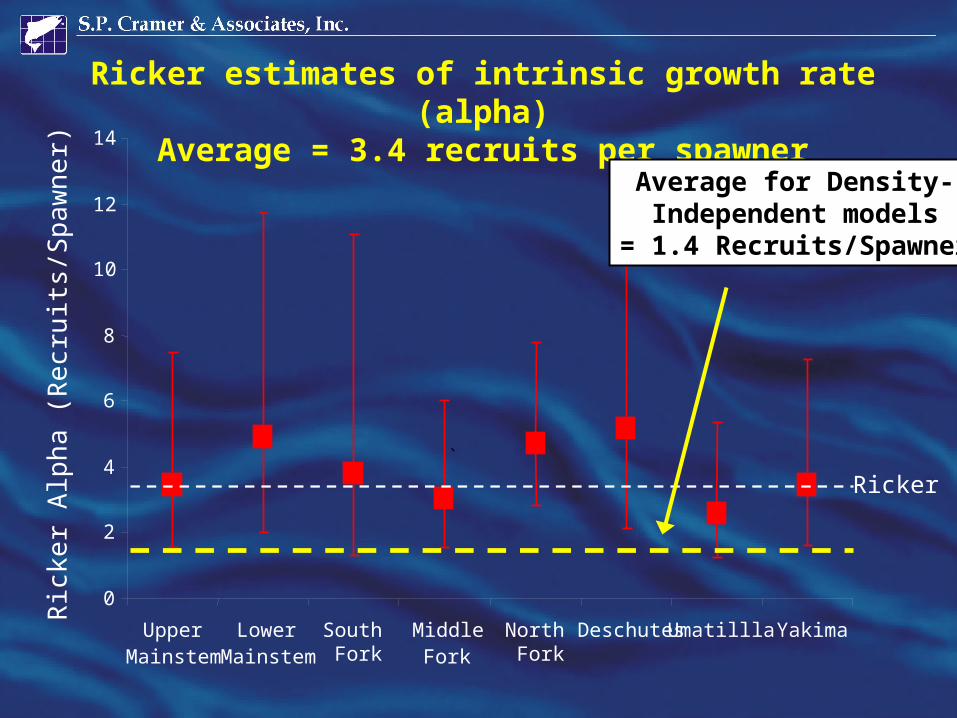
Ricker estimates of intrinsic growth rate (alpha)Average = 3.4 recruits per spawner
0
2
4
6
8
10
12
14
UpperMainstem
LowerMainstem
South Fork
MiddleFork
North Fork
Deschutes Umatillla Yakima
Ric
ker
Alp
ha
(Re
crui
ts/S
paw
ner)
`
Ricker
Average for Density-Independent models
= 1.4 Recruits/Spawner
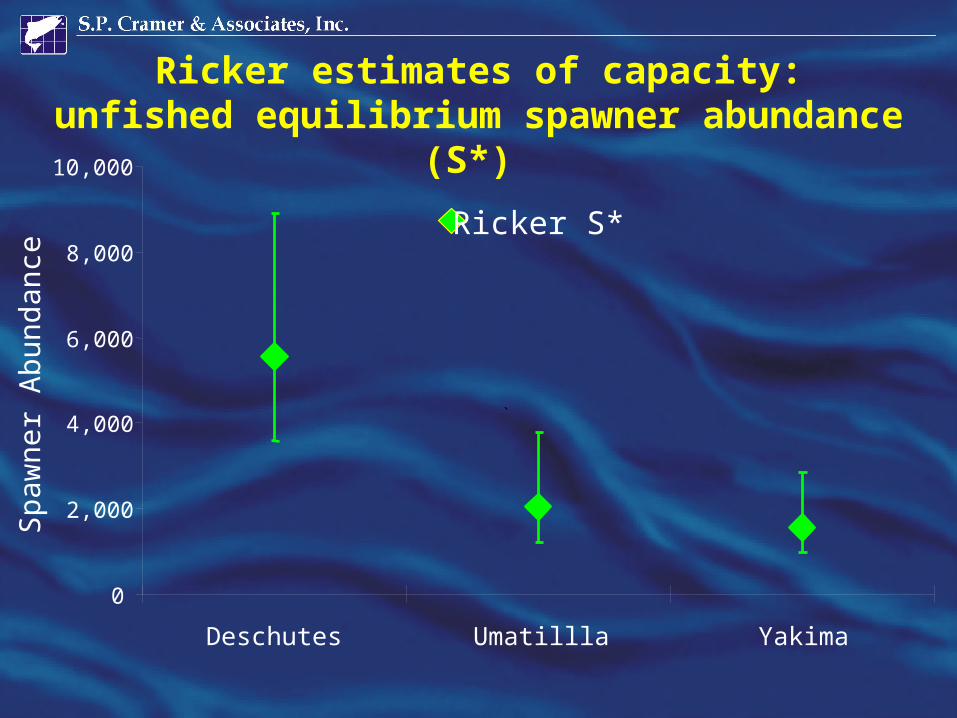
Ricker estimates of capacity:unfished equilibrium spawner abundance
(S*)
0
2,000
4,000
6,000
8,000
10,000
Deschutes Umatillla Yakima
Ricker S*
`
Spa
wne
r A
bund
ance
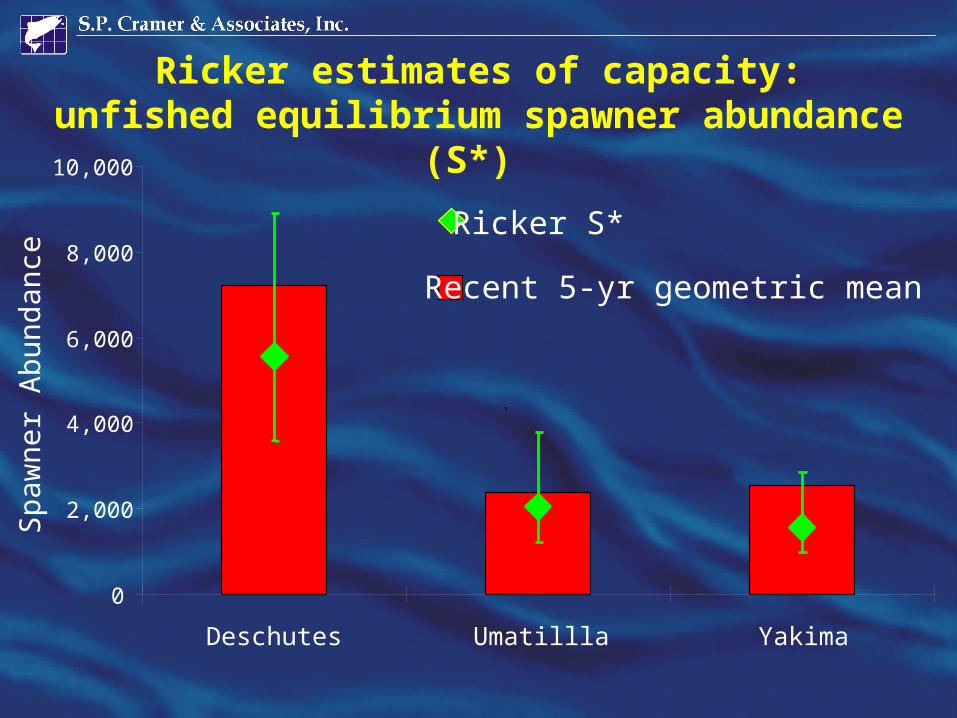
Ricker estimates of capacity:unfished equilibrium spawner abundance
(S*)
0
2,000
4,000
6,000
8,000
10,000
Deschutes Umatillla Yakima
Recent 5-yr geometric mean
Ricker S*
`
Spa
wne
r A
bund
ance
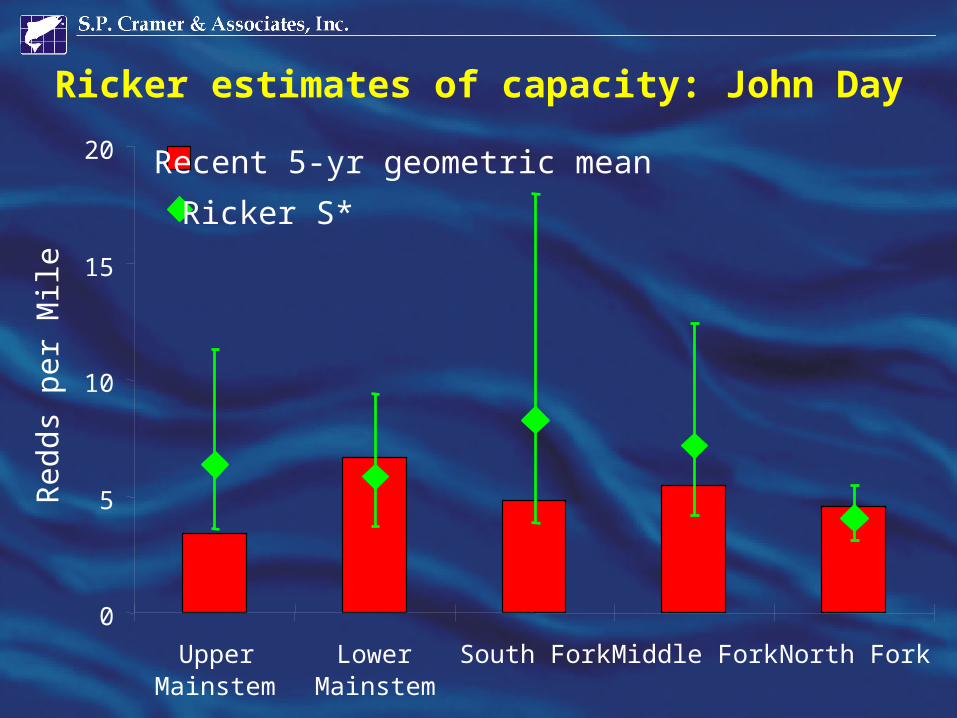
Ricker estimates of capacity: John Day
0
5
10
15
20
UpperMainstem
LowerMainstem
South Fork Middle Fork North Fork
Recent 5-yr geometric mean
Ricker S*
Re
dd
s p
er
Mile
0 5 10 15
0
5
10
15
JD Upper Mainstem
0 2 4 6 8 10 12 14
0
5
10
15
JD Lower Mainstem
0 5 10 15 20
0
5
10
15
20
JD South Fork
0 5 10 15
0
5
10
15
JD Middle Fork
Spawner Index
Rec
ruit
In
dex
85
868788
85
868788
85
86 87 88
85
8687
88
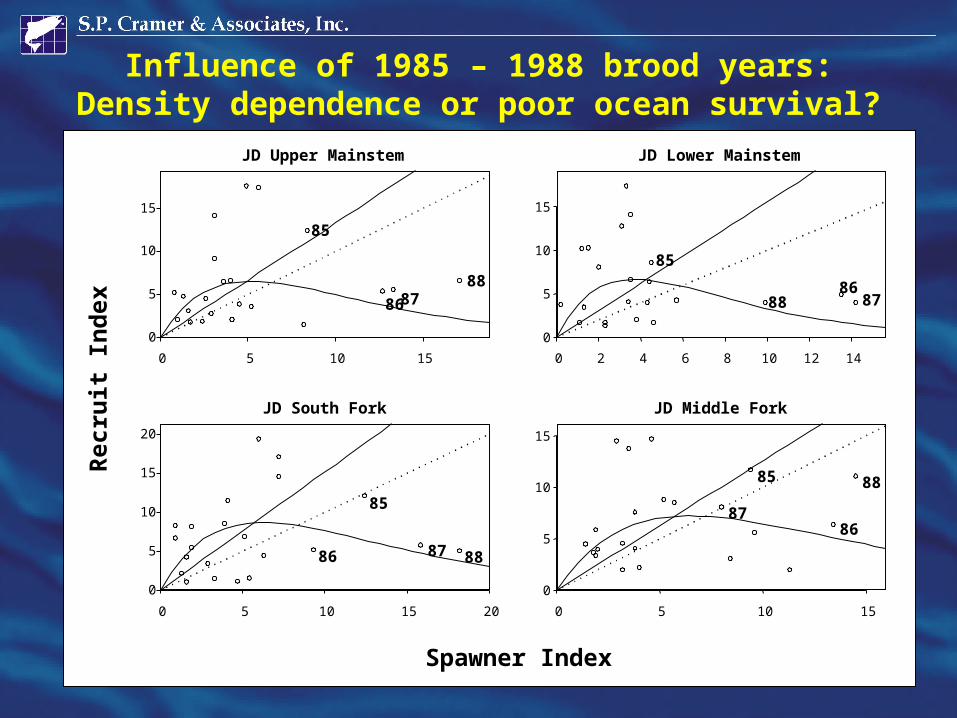
Influence of 1985 – 1988 brood years:Density dependence or poor ocean survival?
• Removed years and re-fit Ricker models
• Similar results – still get strong evidence of density dependence (P < 0.01) for 8 data sets
• Consistent estimates of growth rate (alpha)
Influence of 1985 – 1988 brood years
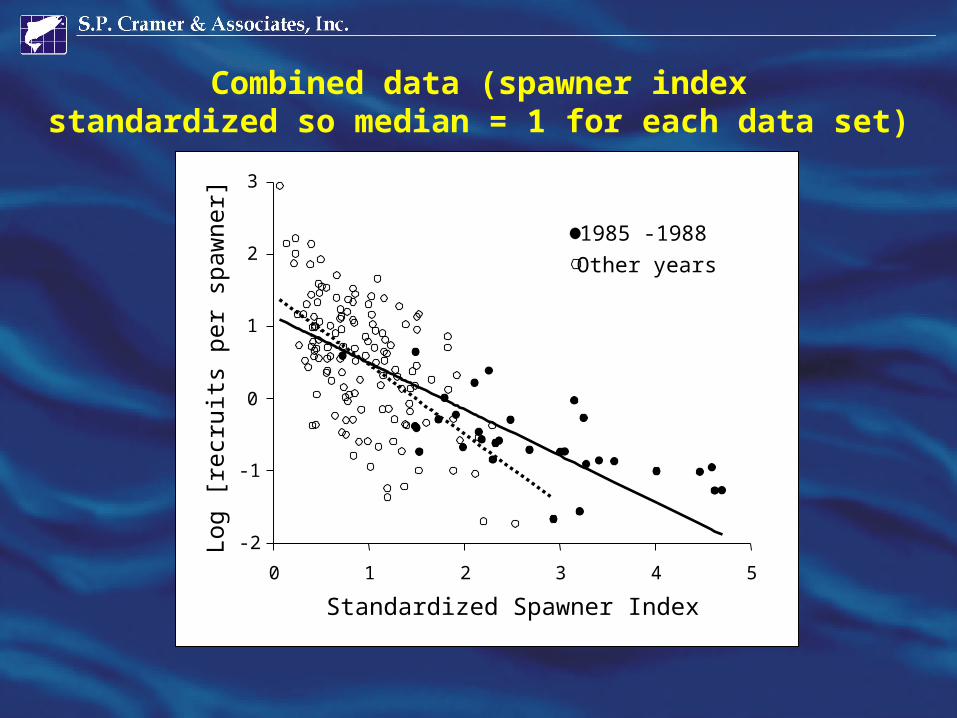
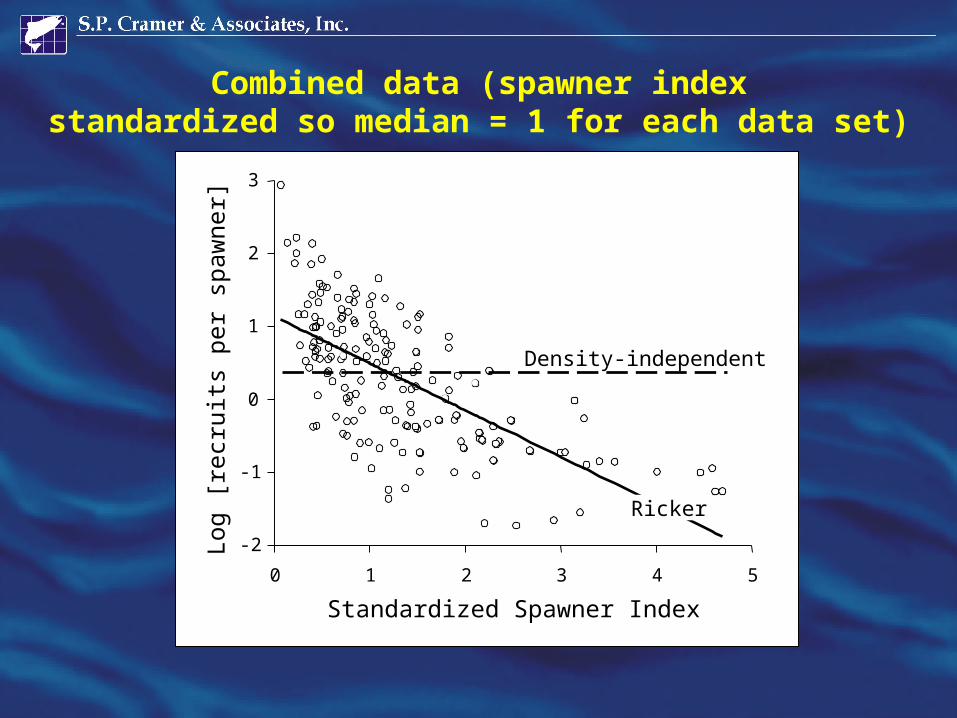
Combined data (spawner indexstandardized so median = 1 for each data set)
Standardized Spawner Index
0 1 2 3 4 5
-2
-1
0
1
2
3
Log
[rec
ruits
per
spa
wne
r] 1985 -1988
Other years
Combined data (spawner indexstandardized so median = 1 for each data set)
Standardized Spawner Index
0 1 2 3 4 5
-2
-1
0
1
2
3
Log
[rec
ruits
per
spa
wne
r]
Density-independent
Ricker
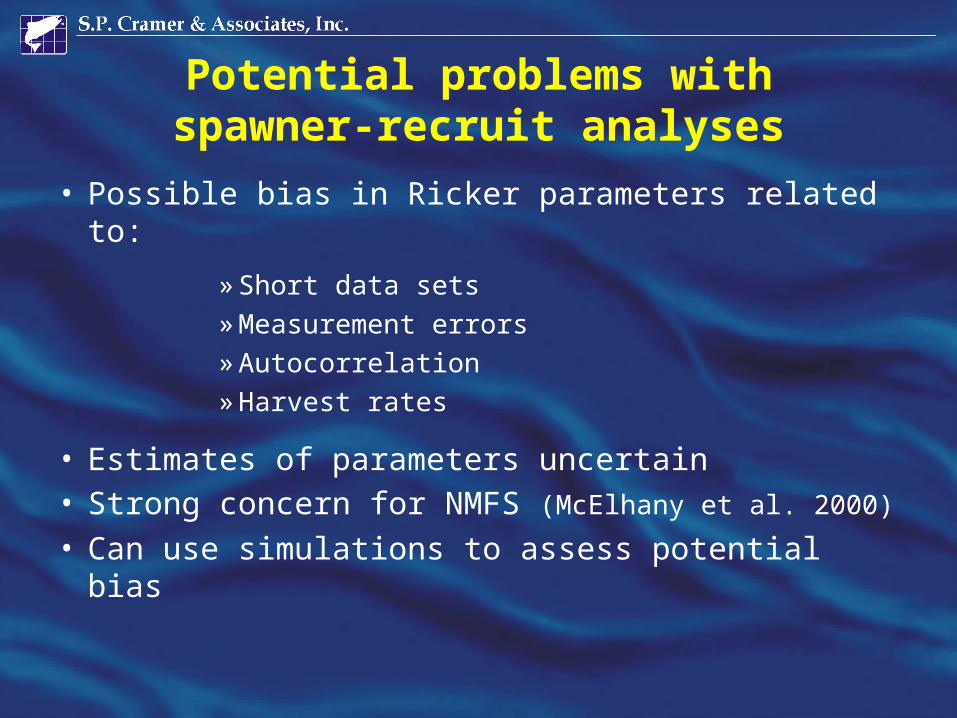
• Possible bias in Ricker parameters related to:
»Short data sets»Measurement errors»Autocorrelation»Harvest rates
• Estimates of parameters uncertain• Strong concern for NMFS (McElhany et al. 2000)
• Can use simulations to assess potential bias
Potential problems withspawner-recruit analyses
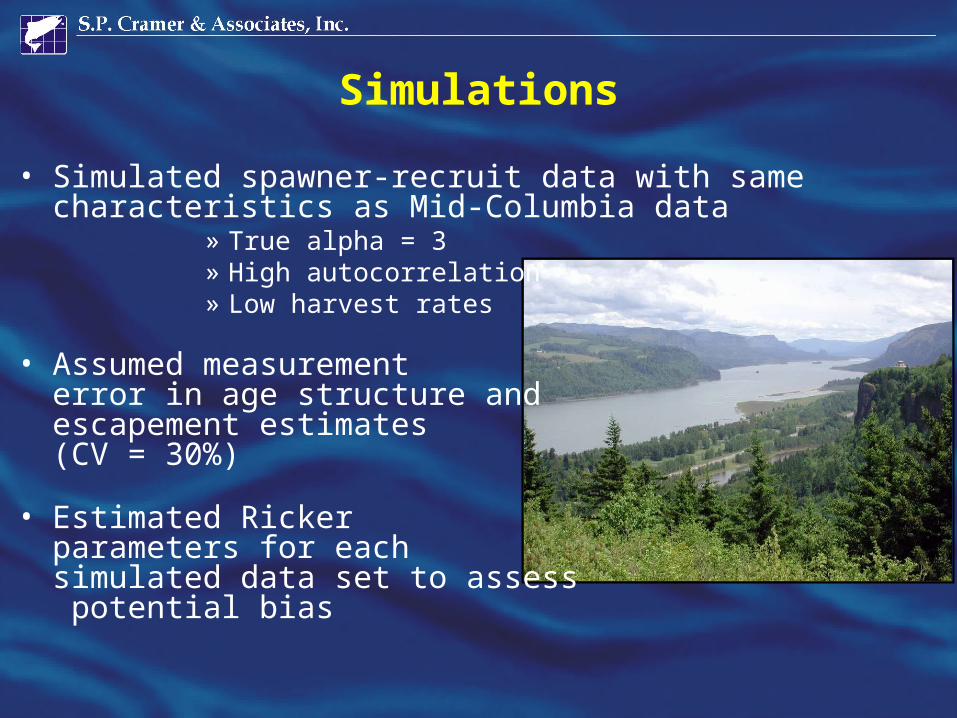
• Simulated spawner-recruit data with same characteristics as Mid-Columbia data
» True alpha = 3» High autocorrelation» Low harvest rates
• Assumed measurement error in age structure and escapement estimates (CV = 30%)
• Estimated Ricker parameters for each simulated data set to assess potential bias
Simulations
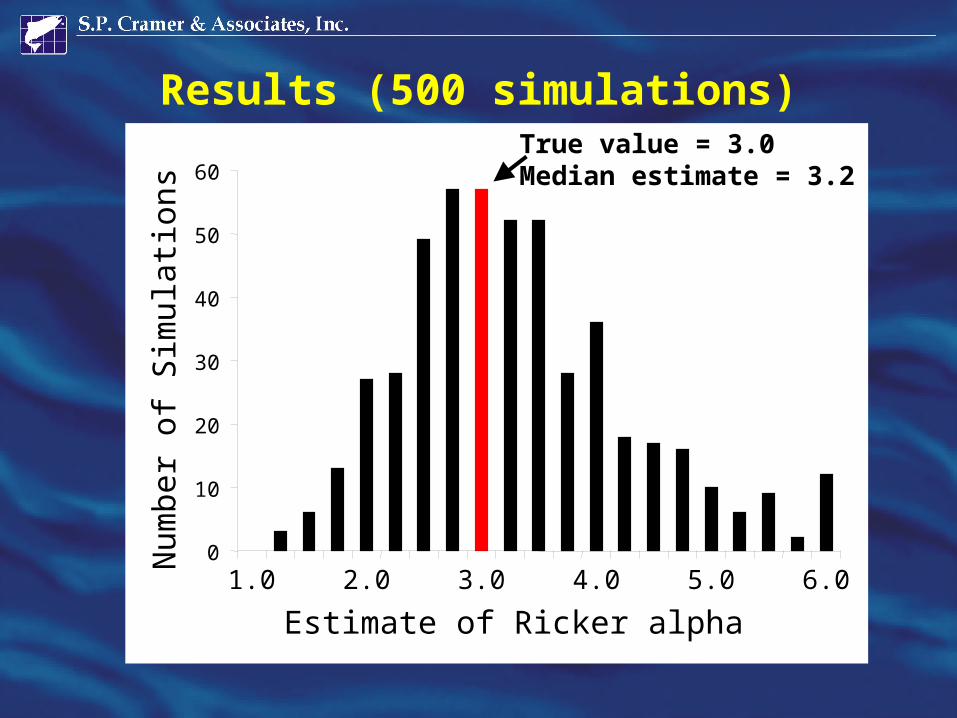
Results (500 simulations)
0
10
20
30
40
50
60
1.0 2.0 3.0 4.0 5.0 6.0
Estimate of Ricker alpha
Num
ber
of S
imul
atio
nsTrue value = 3.0Median estimate = 3.2
• Bias in Ricker parameters was minimal (10 to 20%) for range of conditions typical of Mid-Columbia steelhead data sets
• Primary reason was low harvest rates (20% across most years)
• Significant bias expected for harvest rates = 40% or greater across years
Simulations results
• Widespread evidence of density dependence in Mid-Columbia steelhead data sets
• Consistent estimates of intrinsic growth rates (avg. = 3.4 recruits per spawner)
• No evidence that one or more populations experienced relatively poor productivity
• “Lambda” only useful as a red-flag indicator
• Intrinsic growth rates suggest resilience to short-term increases in mortality
Summary