Embed Size (px)
Citation preview

Cover StoryWe, at Fauji Fertilizer, understand the importance of resilience, as a team we have had to power through various struggles, and we’re proud to say that we have emerged stronger than ever. With a brighter future ahead, we cherish our place in the world as a team that can play a significant part in providing better opportunities for growth. Our focus is on the future while we work hard to make the present more meaningful.
Vision
Mission
To be a leading national enterprise with global aspirations, effectively pursuing multiple growth opportunities, maximizing returns to the stakeholders, remaining socially and ethically responsible
To provide our customers with premium quality products in a safe, reliable, efficient and environmentally sound manner, deliver exceptional services and customer support, maximizing returns to the shareholders through core business and diversification, providing a dynamic and challenging environment for our employees
1Annual Report 2018
Contents
4Product Portfolio
13Highlights 2018
22Profile of the Board
7Geographical Presence
14Strategy and Resource Allocation
27Board Committees
8Code of Conduct
16Company Information
30Management Committees
9Core Values
18How we Evolved
31SWOT Analysis
10Company Profile & Group Structure
20Business Model
32Stakeholders’ Engagement
12Organizational Chart
21Calendar of Major Events during the Year
34Notice of Annual General Meeting
38
Management
146How we Create and Share Value
168Forward Looking Statement
169Appendices
118Contents
122Overview
129Positioned for Value Creation
138Creating Valuein a Sustainable Manner
Sustainability Report
Board’s Reviews
114Forward Looking Statement
116
50Financial Performance
72Key Risks and Opportunities
60DuPont Analysis
56Six Year Analysis of Financial Position and Performance
54Horizontal Analysis Statement of Financial Position
55Vertical Analysis Statement of Financial Position
53Horizontal & Vertical Analysis Statement of Profit or Loss
61Quarterly Analysis - 2018
4940 Chairman’s Review
41 42CE & MD’s Overview
43 44Financial Capital
112Human Capital
94Manufactured Capital
98Corporate Governance
110Intellectual Capital
87 91Social and Relationship Capital
93Statement of Value Added
مواقع اور خطرات اں نما�ی
2 Management Report
Financial Statements
Consolidated Financial Statements
191Report of the Audit Committee on Adherence to the Code of Corporate Governance
194Statement of Compliance with Listed Companies (Code of Corporate Governance) Regulations, 2017
196Review Report to the Members on the Statement of Code of Corporate Governance
197Independent Auditors’ Report to the Members
200Statement of Financial Position
202Statement of Profit or Loss
203Statement of Comprehensive Income
204Statement of Cash Flows
205Statement of Changes in Equity
206Notes to the Financial Statements
346Pattern of Shareholdings - FFC
356Pattern of Shareholding - FFCEL & FFF
353Financial Calendar
357Definitions & Glossary of Terms
361Form of Proxy
354 355
Shareholders’ Information
254Chairman’s Review on Consolidated Financial Statements
290Notes to the Consolidated Financial Statements
287Consolidated Statement of Comprehensive Income
288Consolidated Statement of Cash Flows
289Consolidated Statement of Changes in Equity
284Consolidated Statement of Financial Position
281Independent Auditors’ Report to the Members
286Consolidated Statement of Profit or Loss
280Horizontal & Vertical Analysis Consolidated Statement of Profit or Loss
276Consolidated Financial Performance
278Horizontal Analysis Consolidated Statement of Financial Position
279Vertical Analysis Consolidated Statement of Financial Position
256Directors’ Report on Consolidated Financial Statements
275255
363
3Annual Report 2018
Product Portfolio
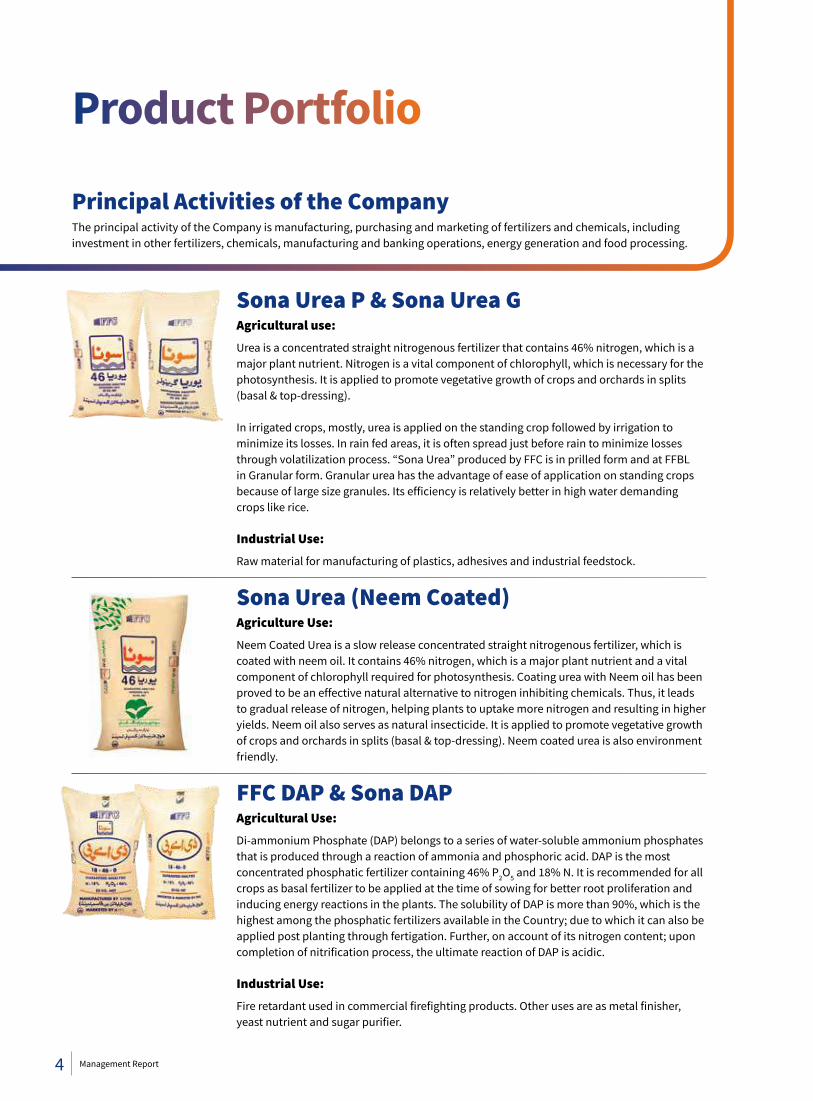
Sona Urea P & Sona Urea GAgricultural use:Urea is a concentrated straight nitrogenous fertilizer that contains 46% nitrogen, which is a major plant nutrient. Nitrogen is a vital component of chlorophyll, which is necessary for the photosynthesis. It is applied to promote vegetative growth of crops and orchards in splits (basal & top-dressing).
In irrigated crops, mostly, urea is applied on the standing crop followed by irrigation to minimize its losses. In rain fed areas, it is often spread just before rain to minimize losses through volatilization process. “Sona Urea” produced by FFC is in prilled form and at FFBL in Granular form. Granular urea has the advantage of ease of application on standing crops because of large size granules. Its efficiency is relatively better in high water demanding crops like rice.
Industrial Use:Raw material for manufacturing of plastics, adhesives and industrial feedstock.
Sona Urea (Neem Coated)Agriculture Use:Neem Coated Urea is a slow release concentrated straight nitrogenous fertilizer, which is coated with neem oil. It contains 46% nitrogen, which is a major plant nutrient and a vital component of chlorophyll required for photosynthesis. Coating urea with Neem oil has been proved to be an effective natural alternative to nitrogen inhibiting chemicals. Thus, it leads to gradual release of nitrogen, helping plants to uptake more nitrogen and resulting in higher yields. Neem oil also serves as natural insecticide. It is applied to promote vegetative growth of crops and orchards in splits (basal & top-dressing). Neem coated urea is also environment friendly.
FFC DAP & Sona DAP Agricultural Use:Di-ammonium Phosphate (DAP) belongs to a series of water-soluble ammonium phosphates that is produced through a reaction of ammonia and phosphoric acid. DAP is the most concentrated phosphatic fertilizer containing 46% P2O5 and 18% N. It is recommended for all crops as basal fertilizer to be applied at the time of sowing for better root proliferation and inducing energy reactions in the plants. The solubility of DAP is more than 90%, which is the highest among the phosphatic fertilizers available in the Country; due to which it can also be applied post planting through fertigation. Further, on account of its nitrogen content; upon completion of nitrification process, the ultimate reaction of DAP is acidic.
Industrial Use:Fire retardant used in commercial firefighting products. Other uses are as metal finisher, yeast nutrient and sugar purifier.
Principal Activities of the CompanyThe principal activity of the Company is manufacturing, purchasing and marketing of fertilizers and chemicals, including investment in other fertilizers, chemicals, manufacturing and banking operations, energy generation and food processing.
4 Management Report
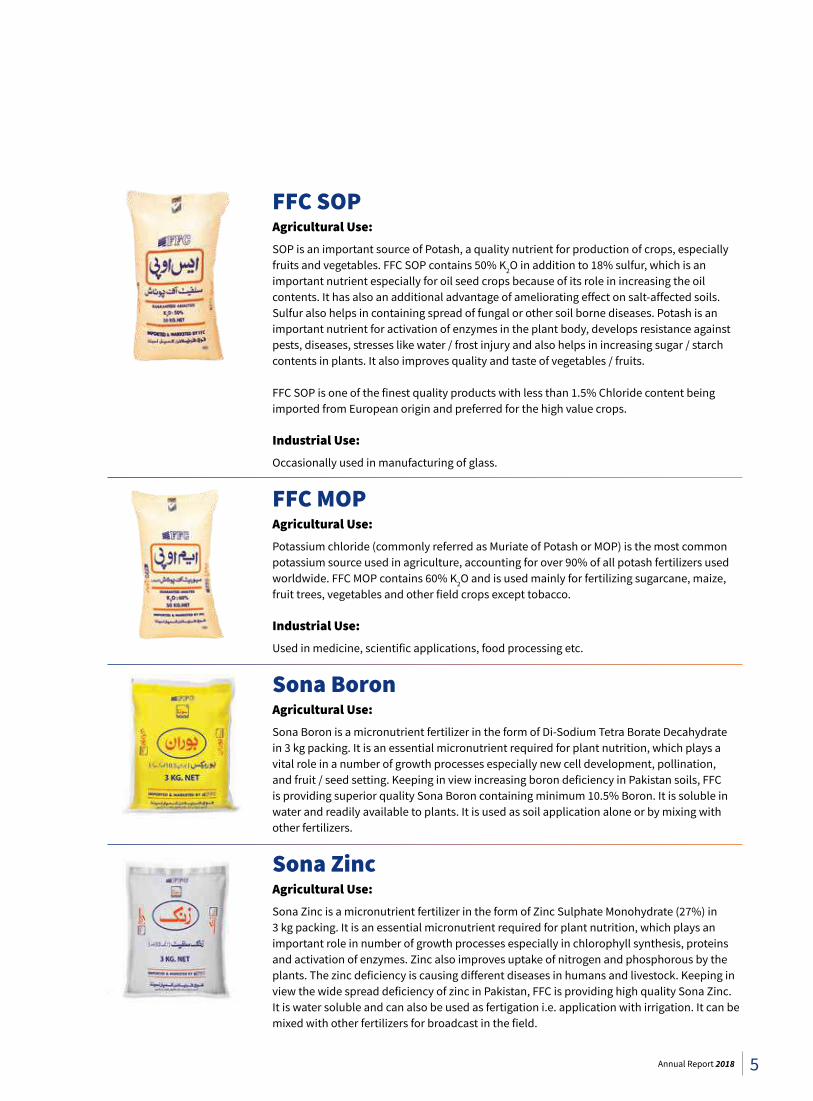
FFC SOPAgricultural Use:SOP is an important source of Potash, a quality nutrient for production of crops, especially fruits and vegetables. FFC SOP contains 50% K2O in addition to 18% sulfur, which is an important nutrient especially for oil seed crops because of its role in increasing the oil contents. It has also an additional advantage of ameliorating effect on salt-affected soils. Sulfur also helps in containing spread of fungal or other soil borne diseases. Potash is an important nutrient for activation of enzymes in the plant body, develops resistance against pests, diseases, stresses like water / frost injury and also helps in increasing sugar / starch contents in plants. It also improves quality and taste of vegetables / fruits.
FFC SOP is one of the finest quality products with less than 1.5% Chloride content being imported from European origin and preferred for the high value crops.
Industrial Use:Occasionally used in manufacturing of glass.
FFC MOPAgricultural Use:Potassium chloride (commonly referred as Muriate of Potash or MOP) is the most common potassium source used in agriculture, accounting for over 90% of all potash fertilizers used worldwide. FFC MOP contains 60% K2O and is used mainly for fertilizing sugarcane, maize, fruit trees, vegetables and other field crops except tobacco.
Industrial Use:Used in medicine, scientific applications, food processing etc.
Sona BoronAgricultural Use:Sona Boron is a micronutrient fertilizer in the form of Di-Sodium Tetra Borate Decahydrate in 3 kg packing. It is an essential micronutrient required for plant nutrition, which plays a vital role in a number of growth processes especially new cell development, pollination, and fruit / seed setting. Keeping in view increasing boron deficiency in Pakistan soils, FFC is providing superior quality Sona Boron containing minimum 10.5% Boron. It is soluble in water and readily available to plants. It is used as soil application alone or by mixing with other fertilizers.
Sona ZincAgricultural Use:Sona Zinc is a micronutrient fertilizer in the form of Zinc Sulphate Monohydrate (27%) in 3 kg packing. It is an essential micronutrient required for plant nutrition, which plays an important role in number of growth processes especially in chlorophyll synthesis, proteins and activation of enzymes. Zinc also improves uptake of nitrogen and phosphorous by the plants. The zinc deficiency is causing different diseases in humans and livestock. Keeping in view the wide spread deficiency of zinc in Pakistan, FFC is providing high quality Sona Zinc. It is water soluble and can also be used as fertigation i.e. application with irrigation. It can be mixed with other fertilizers for broadcast in the field.
5Annual Report 2018
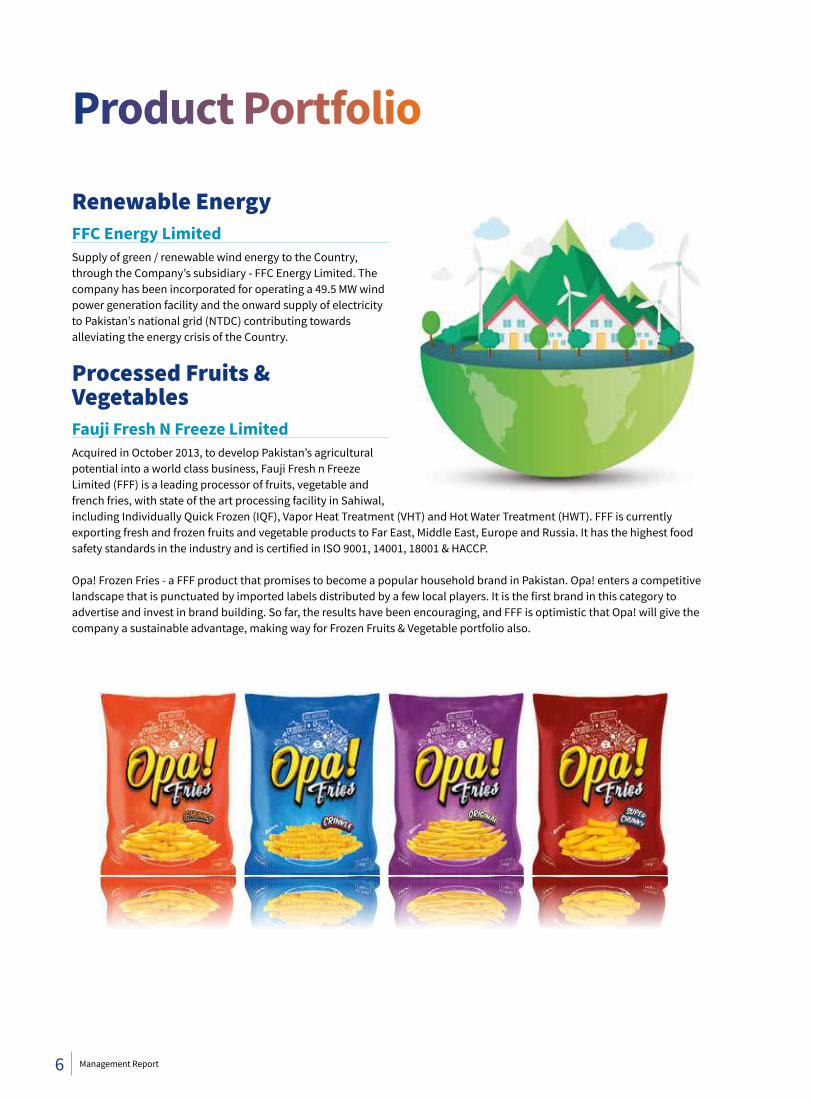
Renewable EnergyFFC Energy LimitedSupply of green / renewable wind energy to the Country, through the Company’s subsidiary - FFC Energy Limited. The company has been incorporated for operating a 49.5 MW wind power generation facility and the onward supply of electricity to Pakistan’s national grid (NTDC) contributing towards alleviating the energy crisis of the Country.
Processed Fruits & VegetablesFauji Fresh N Freeze LimitedAcquired in October 2013, to develop Pakistan’s agricultural potential into a world class business, Fauji Fresh n Freeze Limited (FFF) is a leading processor of fruits, vegetable and french fries, with state of the art processing facility in Sahiwal, including Individually Quick Frozen (IQF), Vapor Heat Treatment (VHT) and Hot Water Treatment (HWT). FFF is currently exporting fresh and frozen fruits and vegetable products to Far East, Middle East, Europe and Russia. It has the highest food safety standards in the industry and is certified in ISO 9001, 14001, 18001 & HACCP.
Opa! Frozen Fries - a FFF product that promises to become a popular household brand in Pakistan. Opa! enters a competitive landscape that is punctuated by imported labels distributed by a few local players. It is the first brand in this category to advertise and invest in brand building. So far, the results have been encouraging, and FFF is optimistic that Opa! will give the company a sustainable advantage, making way for Frozen Fruits & Vegetable portfolio also.
Product Portfolio
6 Management Report
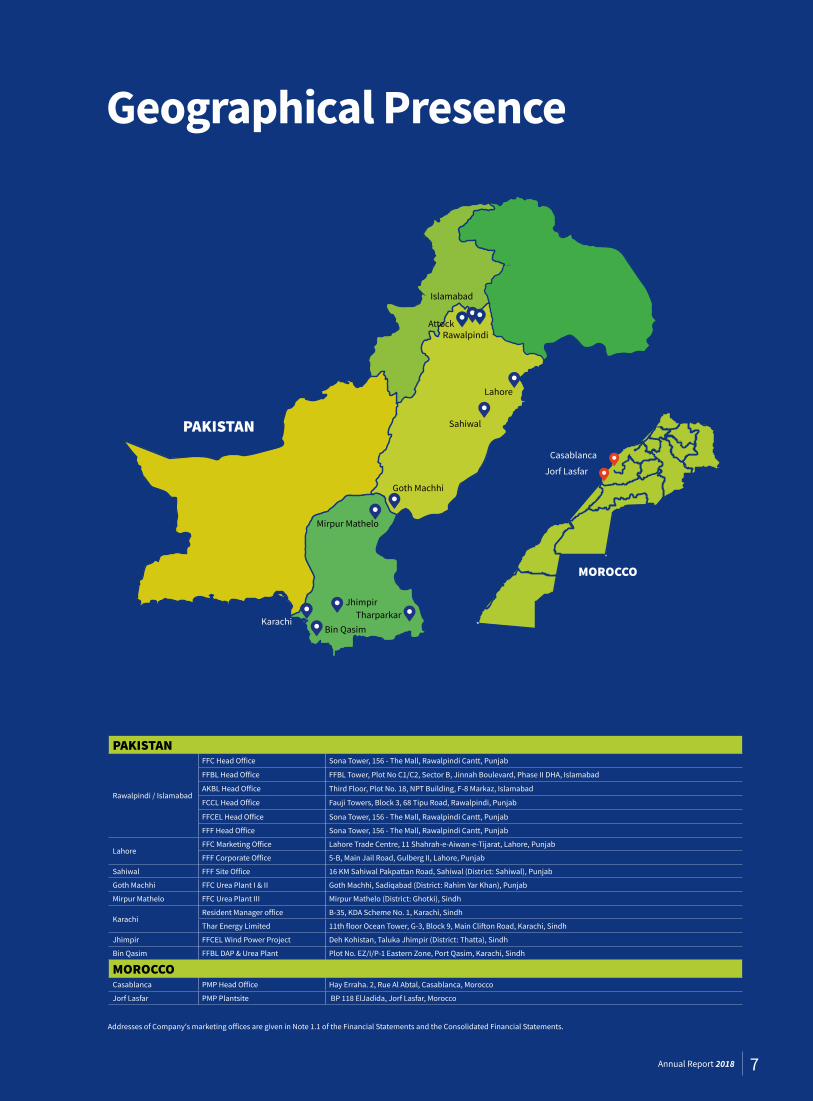
Geographical Presence
MOROCCO
Casablanca
Jorf Lasfar
PAKISTAN
Bin QasimKarachi
Sahiwal
Mirpur Mathelo
Goth Machhi
JhimpirTharparkar
RawalpindiAttock
Lahore
Islamabad
PAKISTAN
Rawalpindi / Islamabad
FFC Head Office Sona Tower, 156 - The Mall, Rawalpindi Cantt, Punjab
FFBL Head Office FFBL Tower, Plot No C1/C2, Sector B, Jinnah Boulevard, Phase II DHA, Islamabad
AKBL Head Office Third Floor, Plot No. 18, NPT Building, F-8 Markaz, Islamabad
FCCL Head Office Fauji Towers, Block 3, 68 Tipu Road, Rawalpindi, Punjab
FFCEL Head Office Sona Tower, 156 - The Mall, Rawalpindi Cantt, Punjab
FFF Head Office Sona Tower, 156 - The Mall, Rawalpindi Cantt, Punjab
LahoreFFC Marketing Office Lahore Trade Centre, 11 Shahrah-e-Aiwan-e-Tijarat, Lahore, Punjab
FFF Corporate Office 5-B, Main Jail Road, Gulberg II, Lahore, Punjab
Sahiwal FFF Site Office 16 KM Sahiwal Pakpattan Road, Sahiwal (District: Sahiwal), Punjab
Goth Machhi FFC Urea Plant I & II Goth Machhi, Sadiqabad (District: Rahim Yar Khan), Punjab
Mirpur Mathelo FFC Urea Plant III Mirpur Mathelo (District: Ghotki), Sindh
KarachiResident Manager office B-35, KDA Scheme No. 1, Karachi, Sindh
Thar Energy Limited 11th floor Ocean Tower, G-3, Block 9, Main Clifton Road, Karachi, Sindh
Jhimpir FFCEL Wind Power Project Deh Kohistan, Taluka Jhimpir (District: Thatta), Sindh
Bin Qasim FFBL DAP & Urea Plant Plot No. EZ/I/P-1 Eastern Zone, Port Qasim, Karachi, Sindh
MOROCCOCasablanca PMP Head Office Hay Erraha. 2, Rue Al Abtal, Casablanca, Morocco
Jorf Lasfar PMP Plantsite BP 118 ElJadida, Jorf Lasfar, Morocco
Product Portfolio
Addresses of Company's marketing offices are given in Note 1.1 of the Financial Statements and the Consolidated Financial Statements.
7Annual Report 2018
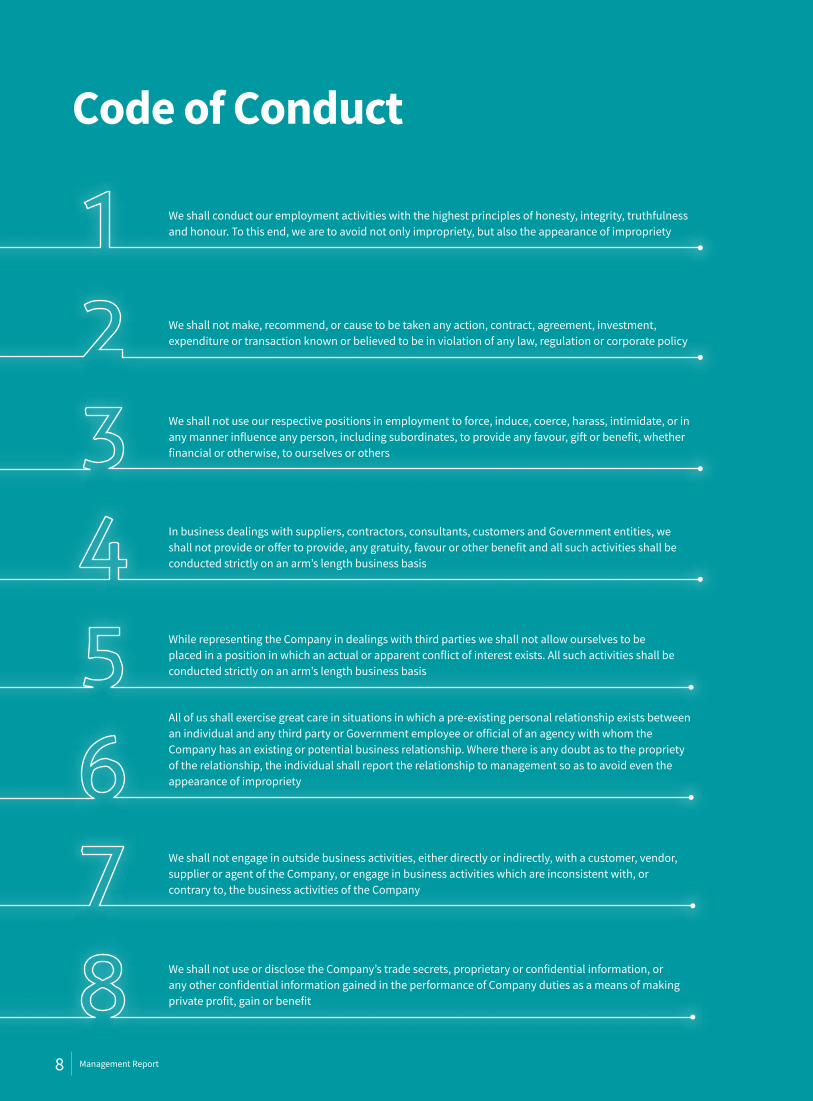
We shall conduct our employment activities with the highest principles of honesty, integrity, truthfulness and honour. To this end, we are to avoid not only impropriety, but also the appearance of impropriety
We shall not make, recommend, or cause to be taken any action, contract, agreement, investment, expenditure or transaction known or believed to be in violation of any law, regulation or corporate policy
We shall not use our respective positions in employment to force, induce, coerce, harass, intimidate, or in any manner influence any person, including subordinates, to provide any favour, gift or benefit, whether financial or otherwise, to ourselves or others
In business dealings with suppliers, contractors, consultants, customers and Government entities, we shall not provide or offer to provide, any gratuity, favour or other benefit and all such activities shall be conducted strictly on an arm’s length business basis
While representing the Company in dealings with third parties we shall not allow ourselves to be placed in a position in which an actual or apparent conflict of interest exists. All such activities shall be conducted strictly on an arm’s length business basis
All of us shall exercise great care in situations in which a pre-existing personal relationship exists between an individual and any third party or Government employee or official of an agency with whom the Company has an existing or potential business relationship. Where there is any doubt as to the propriety of the relationship, the individual shall report the relationship to management so as to avoid even the appearance of impropriety
We shall not engage in outside business activities, either directly or indirectly, with a customer, vendor, supplier or agent of the Company, or engage in business activities which are inconsistent with, or contrary to, the business activities of the Company
We shall not use or disclose the Company’s trade secrets, proprietary or confidential information, or any other confidential information gained in the performance of Company duties as a means of making private profit, gain or benefit
Code of Conduct
8 Management Report
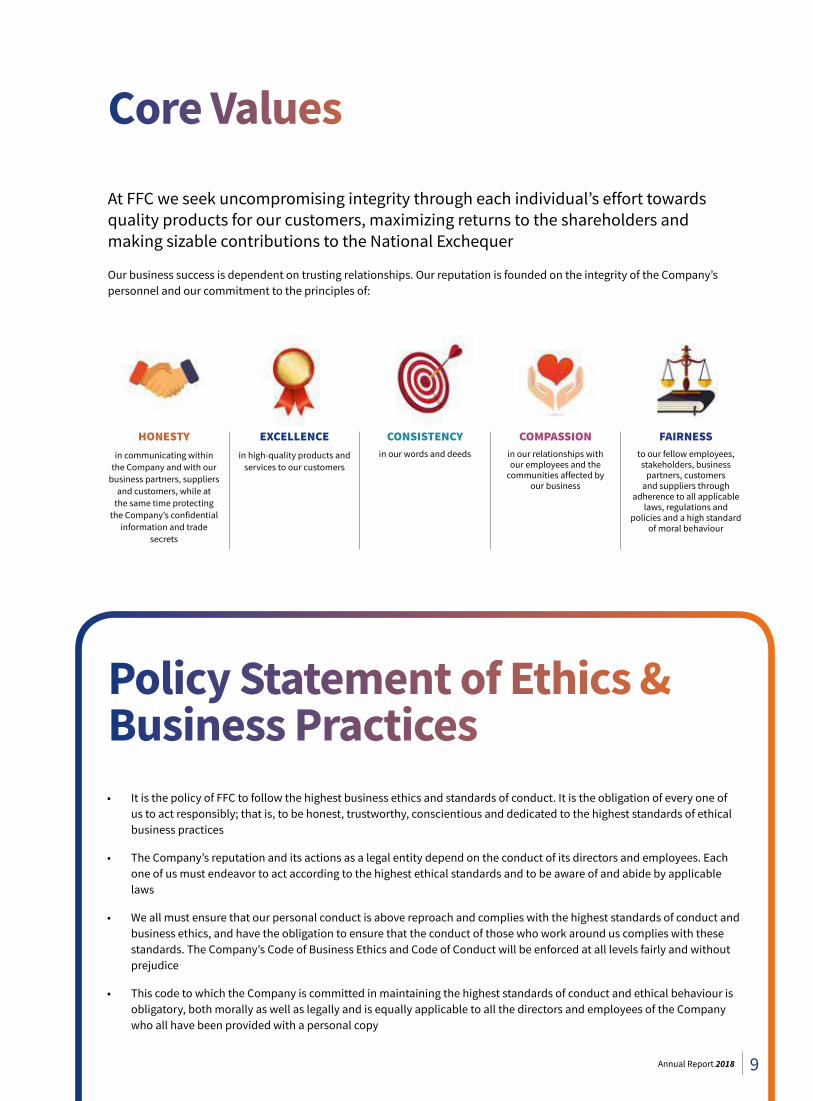
Core Values
At FFC we seek uncompromising integrity through each individual’s effort towards quality products for our customers, maximizing returns to the shareholders and making sizable contributions to the National Exchequer
Our business success is dependent on trusting relationships. Our reputation is founded on the integrity of the Company’s personnel and our commitment to the principles of:
Policy Statement of Ethics & Business Practices• It is the policy of FFC to follow the highest business ethics and standards of conduct. It is the obligation of every one of
us to act responsibly; that is, to be honest, trustworthy, conscientious and dedicated to the highest standards of ethical business practices
• The Company’s reputation and its actions as a legal entity depend on the conduct of its directors and employees. Each one of us must endeavor to act according to the highest ethical standards and to be aware of and abide by applicable laws
• We all must ensure that our personal conduct is above reproach and complies with the highest standards of conduct and business ethics, and have the obligation to ensure that the conduct of those who work around us complies with these standards. The Company’s Code of Business Ethics and Code of Conduct will be enforced at all levels fairly and without prejudice
• This code to which the Company is committed in maintaining the highest standards of conduct and ethical behaviour is obligatory, both morally as well as legally and is equally applicable to all the directors and employees of the Company who all have been provided with a personal copy
HONESTY
in communicating within the Company and with our
business partners, suppliers and customers, while at
the same time protecting the Company’s confidential
information and trade secrets
EXCELLENCE
in high-quality products and services to our customers
CONSISTENCY
in our words and deeds
COMPASSION
in our relationships with our employees and the
communities affected by our business
FAIRNESSto our fellow employees, stakeholders, business
partners, customers and suppliers through
adherence to all applicable laws, regulations and
policies and a high standard of moral behaviour
9Annual Report 2018
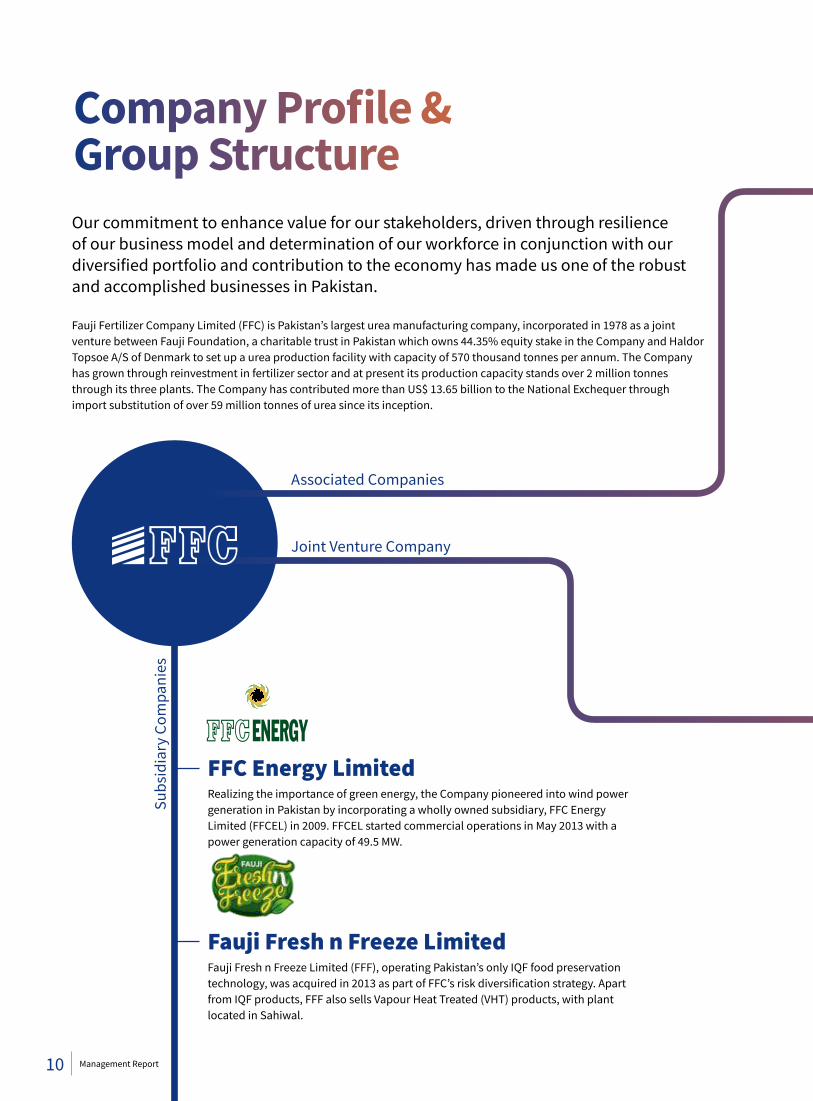
Company Profile & Group StructureOur commitment to enhance value for our stakeholders, driven through resilience of our business model and determination of our workforce in conjunction with our diversified portfolio and contribution to the economy has made us one of the robust and accomplished businesses in Pakistan.
Fauji Fertilizer Company Limited (FFC) is Pakistan’s largest urea manufacturing company, incorporated in 1978 as a joint venture between Fauji Foundation, a charitable trust in Pakistan which owns 44.35% equity stake in the Company and Haldor Topsoe A/S of Denmark to set up a urea production facility with capacity of 570 thousand tonnes per annum. The Company has grown through reinvestment in fertilizer sector and at present its production capacity stands over 2 million tonnes through its three plants. The Company has contributed more than US$ 13.65 billion to the National Exchequer through import substitution of over 59 million tonnes of urea since its inception.
FFC Energy LimitedRealizing the importance of green energy, the Company pioneered into wind power generation in Pakistan by incorporating a wholly owned subsidiary, FFC Energy Limited (FFCEL) in 2009. FFCEL started commercial operations in May 2013 with a power generation capacity of 49.5 MW.
Fauji Fresh n Freeze LimitedFauji Fresh n Freeze Limited (FFF), operating Pakistan’s only IQF food preservation technology, was acquired in 2013 as part of FFC’s risk diversification strategy. Apart from IQF products, FFF also sells Vapour Heat Treated (VHT) products, with plant located in Sahiwal.
Subs
idia
ry C
ompa
nies
Associated Companies
Joint Venture Company
10 Management Report
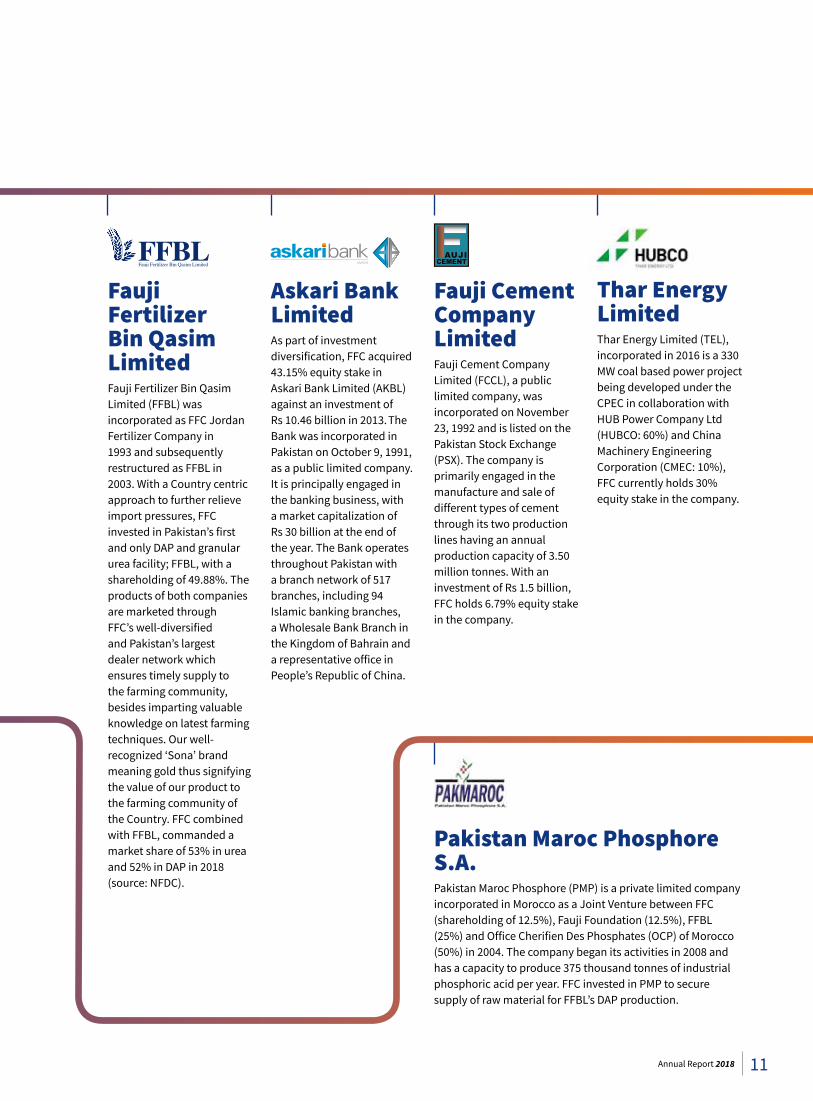
Fauji Fertilizer Bin Qasim Limited Fauji Fertilizer Bin Qasim Limited (FFBL) was incorporated as FFC Jordan Fertilizer Company in 1993 and subsequently restructured as FFBL in 2003. With a Country centric approach to further relieve import pressures, FFC invested in Pakistan’s first and only DAP and granular urea facility; FFBL, with a shareholding of 49.88%. The products of both companies are marketed through FFC’s well-diversified and Pakistan’s largest dealer network which ensures timely supply to the farming community, besides imparting valuable knowledge on latest farming techniques. Our well-recognized ‘Sona’ brand meaning gold thus signifying the value of our product to the farming community of the Country. FFC combined with FFBL, commanded a market share of 53% in urea and 52% in DAP in 2018 (source: NFDC).
Askari Bank LimitedAs part of investment diversification, FFC acquired 43.15% equity stake in Askari Bank Limited (AKBL) against an investment of Rs 10.46 billion in 2013. The Bank was incorporated in Pakistan on October 9, 1991, as a public limited company. It is principally engaged in the banking business, with a market capitalization of Rs 30 billion at the end of the year. The Bank operates throughout Pakistan with a branch network of 517 branches, including 94 Islamic banking branches, a Wholesale Bank Branch in the Kingdom of Bahrain and a representative office in People’s Republic of China.
Fauji Cement Company LimitedFauji Cement Company Limited (FCCL), a public limited company, was incorporated on November 23, 1992 and is listed on the Pakistan Stock Exchange (PSX). The company is primarily engaged in the manufacture and sale of different types of cement through its two production lines having an annual production capacity of 3.50 million tonnes. With an investment of Rs 1.5 billion, FFC holds 6.79% equity stake in the company.
Thar Energy Limited Thar Energy Limited (TEL), incorporated in 2016 is a 330 MW coal based power project being developed under the CPEC in collaboration with HUB Power Company Ltd (HUBCO: 60%) and China Machinery Engineering Corporation (CMEC: 10%), FFC currently holds 30% equity stake in the company.
Pakistan Maroc Phosphore S.A.Pakistan Maroc Phosphore (PMP) is a private limited company incorporated in Morocco as a Joint Venture between FFC (shareholding of 12.5%), Fauji Foundation (12.5%), FFBL (25%) and Office Cherifien Des Phosphates (OCP) of Morocco (50%) in 2004. The company began its activities in 2008 and has a capacity to produce 375 thousand tonnes of industrial phosphoric acid per year. FFC invested in PMP to secure supply of raw material for FFBL’s DAP production.
11Annual Report 2018
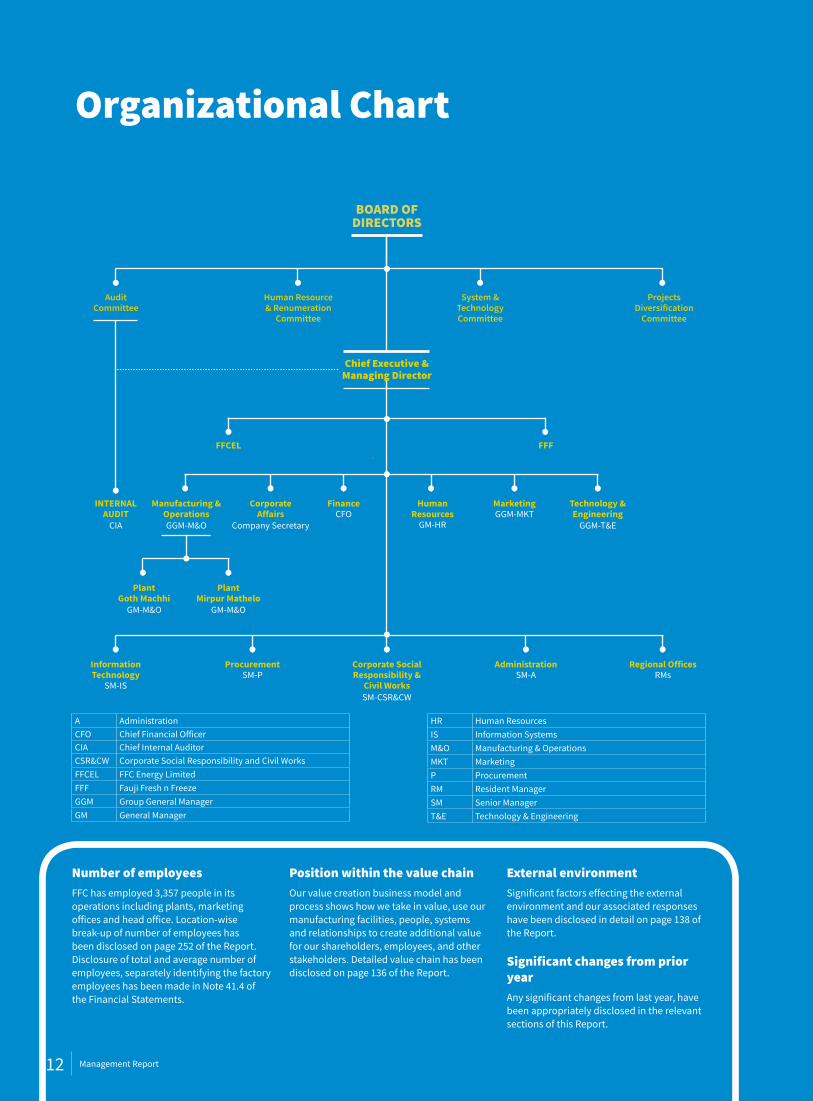
Organizational Chart
AuditCommittee
System & Technology Committee
Human Resource & Renumeration
Committee
Projects Diversification
Committee
A AdministrationCFO Chief Financial OfficerCIA Chief Internal AuditorCSR&CW Corporate Social Responsibility and Civil WorksFFCEL FFC Energy LimitedFFF Fauji Fresh n FreezeGGM Group General ManagerGM General Manager
BOARD OF DIRECTORS
Chief Executive & Managing Director
FFCEL FFF
CIA
Procurement Corporate Social Responsibility &
Civil Works
Administration Regional Offices
HumanResources
GM-HR
InformationTechnology
SM-ISSM-P
SM-CSR&CW
SM-A RMs
Technology & Engineering
Corporate Affairs
Company Secretary
Manufacturing & OperationsGGM-M&O GGM-T&E
Number of employeesFFC has employed 3,357 people in its operations including plants, marketing offices and head office. Location-wise break-up of number of employees has been disclosed on page 252 of the Report. Disclosure of total and average number of employees, separately identifying the factory employees has been made in Note 41.4 of the Financial Statements.
Position within the value chainOur value creation business model and process shows how we take in value, use our manufacturing facilities, people, systems and relationships to create additional value for our shareholders, employees, and other stakeholders. Detailed value chain has been disclosed on page 136 of the Report.
External environmentSignificant factors effecting the external environment and our associated responses have been disclosed in detail on page 138 of the Report.
Significant changes from prior yearAny significant changes from last year, have been appropriately disclosed in the relevant sections of this Report.
FinanceCFO
MarketingGGM-MKT
PlantMirpur Mathelo
GM-M&O
Plant Goth Machhi
GM-M&O
INTERNAL AUDIT
HR Human ResourcesIS Information SystemsM&O Manufacturing & OperationsMKT MarketingP ProcurementRM Resident ManagerSM Senior ManagerT&E Technology & Engineering
12 Management Report
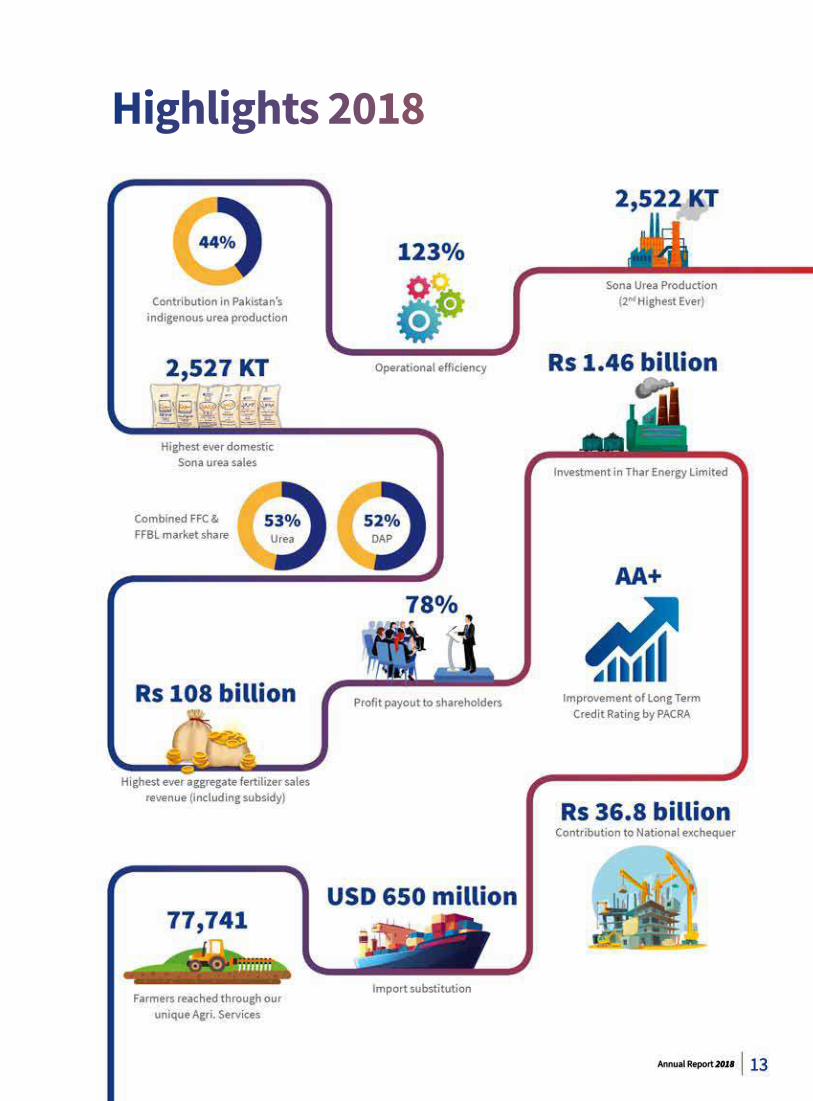
Highlights 2018
13Annual Report 2018
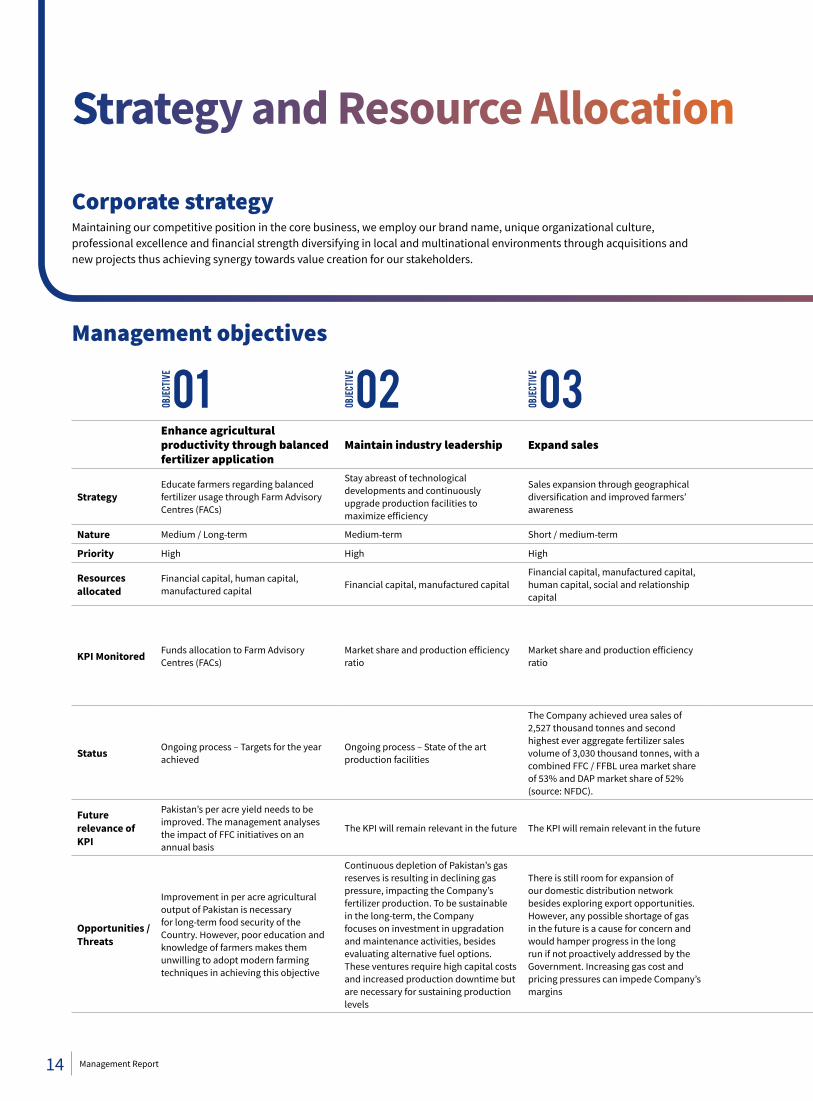
Strategy and Resource Allocation
Management objectives
01OBJECT
IVE
02OBJECT
IVE
03OBJECT
IVE
Corporate strategyMaintaining our competitive position in the core business, we employ our brand name, unique organizational culture, professional excellence and financial strength diversifying in local and multinational environments through acquisitions and new projects thus achieving synergy towards value creation for our stakeholders.
Enhance agricultural productivity through balanced fertilizer application
Maintain industry leadership Expand salesCreate / enter new lines of business to augment profitability and achieve sustained economic growth
Enhance operational efficiency to achieve synergies Costs Economization
StrategyEducate farmers regarding balanced fertilizer usage through Farm Advisory Centres (FACs)
Stay abreast of technological developments and continuously upgrade production facilities to maximize efficiency
Sales expansion through geographical diversification and improved farmers’ awareness
Continuously seek profitable avenues to diversify within and outside the Fertilizer Industry
Align our business processes, reducing time and money losses
Keeping our resource utilization at an optimum level through strict governance policies
Nature Medium / Long-term Medium-term Short / medium-term Medium / Long-term Short-term Short / medium term
Priority High High High High High High
Resources allocated
Financial capital, human capital, manufactured capital
Financial capital, manufactured capitalFinancial capital, manufactured capital, human capital, social and relationship capital
Human capital, intellectual capital, financial capital
All capitalsHuman capital, intellectual capital, financial capital
KPI Monitored Funds allocation to Farm Advisory Centres (FACs)
Market share and production efficiency ratio
Market share and production efficiency ratio
Profitability: EPS, ROE, Asset Turnover and DPSSustainability: Current Ratio, Gearing and Interest Cover
Diversification: Annual resource allocated for expansion of the projects already acquired in addition to identification and development of new investment projects
Market share and production efficiency ratio Gross Profit Margin & Net Profit Margin
Status Ongoing process – Targets for the year achieved
Ongoing process – State of the art production facilities
The Company achieved urea sales of 2,527 thousand tonnes and second highest ever aggregate fertilizer sales volume of 3,030 thousand tonnes, with a combined FFC / FFBL urea market share of 53% and DAP market share of 52% (source: NFDC).
An evolving process – During the year, the Company invested Rs 1.46 billion in Thar Energy Limited. EPC contract has been awarded. Financial close is expected soon
Ongoing process – Plans for 2018 achieved
Ongoing process – The management has implemented effective cost controls which enable savings in production and other operating / financing costs
Future relevance of KPI
Pakistan’s per acre yield needs to be improved. The management analyses the impact of FFC initiatives on an annual basis
The KPI will remain relevant in the future The KPI will remain relevant in the future The KPI will remain relevant in the future The KPI will remain relevant in the future The KPI will remain relevant in the future
Opportunities /Threats
Improvement in per acre agricultural output of Pakistan is necessary for long-term food security of the Country. However, poor education and knowledge of farmers makes them unwilling to adopt modern farming techniques in achieving this objective
Continuous depletion of Pakistan’s gas reserves is resulting in declining gas pressure, impacting the Company’s fertilizer production. To be sustainable in the long-term, the Company focuses on investment in upgradation and maintenance activities, besides evaluating alternative fuel options. These ventures require high capital costs and increased production downtime but are necessary for sustaining production levels
There is still room for expansion of our domestic distribution network besides exploring export opportunities. However, any possible shortage of gas in the future is a cause for concern and would hamper progress in the long run if not proactively addressed by the Government. Increasing gas cost and pricing pressures can impede Company’s margins
FFC’s strong financial position and expertise alongwith adequate resources enable it to diversify its investment portfolio while prudently mitigating associated risks
There is always room for improving efficiency. With focused management strategies, operational productivity can be enhanced
We remain focused on optimizing resource allocation through application of effective policies. However, uncontrollable factors particularly increase in input costs by Government and any potential decline in international prices may impact the Company adversely
14 Management Report
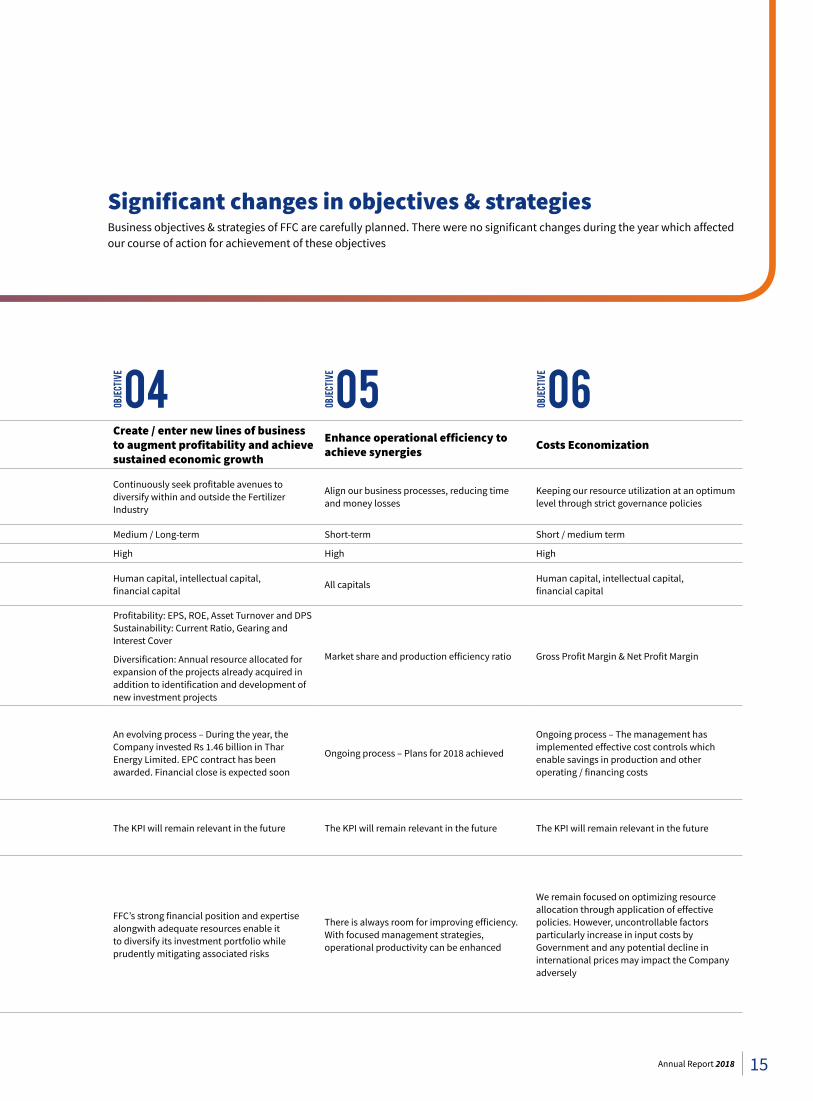
04OBJECT
IVE
05OBJECT
IVE
06OBJECT
IVE
Enhance agricultural productivity through balanced fertilizer application
Maintain industry leadership Expand salesCreate / enter new lines of business to augment profitability and achieve sustained economic growth
Enhance operational efficiency to achieve synergies Costs Economization
StrategyEducate farmers regarding balanced fertilizer usage through Farm Advisory Centres (FACs)
Stay abreast of technological developments and continuously upgrade production facilities to maximize efficiency
Sales expansion through geographical diversification and improved farmers’ awareness
Continuously seek profitable avenues to diversify within and outside the Fertilizer Industry
Align our business processes, reducing time and money losses
Keeping our resource utilization at an optimum level through strict governance policies
Nature Medium / Long-term Medium-term Short / medium-term Medium / Long-term Short-term Short / medium term
Priority High High High High High High
Resources allocated
Financial capital, human capital, manufactured capital
Financial capital, manufactured capitalFinancial capital, manufactured capital, human capital, social and relationship capital
Human capital, intellectual capital, financial capital
All capitalsHuman capital, intellectual capital, financial capital
KPI Monitored Funds allocation to Farm Advisory Centres (FACs)
Market share and production efficiency ratio
Market share and production efficiency ratio
Profitability: EPS, ROE, Asset Turnover and DPSSustainability: Current Ratio, Gearing and Interest Cover
Diversification: Annual resource allocated for expansion of the projects already acquired in addition to identification and development of new investment projects
Market share and production efficiency ratio Gross Profit Margin & Net Profit Margin
Status Ongoing process – Targets for the year achieved
Ongoing process – State of the art production facilities
The Company achieved urea sales of 2,527 thousand tonnes and second highest ever aggregate fertilizer sales volume of 3,030 thousand tonnes, with a combined FFC / FFBL urea market share of 53% and DAP market share of 52% (source: NFDC).
An evolving process – During the year, the Company invested Rs 1.46 billion in Thar Energy Limited. EPC contract has been awarded. Financial close is expected soon
Ongoing process – Plans for 2018 achieved
Ongoing process – The management has implemented effective cost controls which enable savings in production and other operating / financing costs
Future relevance of KPI
Pakistan’s per acre yield needs to be improved. The management analyses the impact of FFC initiatives on an annual basis
The KPI will remain relevant in the future The KPI will remain relevant in the future The KPI will remain relevant in the future The KPI will remain relevant in the future The KPI will remain relevant in the future
Opportunities /Threats
Improvement in per acre agricultural output of Pakistan is necessary for long-term food security of the Country. However, poor education and knowledge of farmers makes them unwilling to adopt modern farming techniques in achieving this objective
Continuous depletion of Pakistan’s gas reserves is resulting in declining gas pressure, impacting the Company’s fertilizer production. To be sustainable in the long-term, the Company focuses on investment in upgradation and maintenance activities, besides evaluating alternative fuel options. These ventures require high capital costs and increased production downtime but are necessary for sustaining production levels
There is still room for expansion of our domestic distribution network besides exploring export opportunities. However, any possible shortage of gas in the future is a cause for concern and would hamper progress in the long run if not proactively addressed by the Government. Increasing gas cost and pricing pressures can impede Company’s margins
FFC’s strong financial position and expertise alongwith adequate resources enable it to diversify its investment portfolio while prudently mitigating associated risks
There is always room for improving efficiency. With focused management strategies, operational productivity can be enhanced
We remain focused on optimizing resource allocation through application of effective policies. However, uncontrollable factors particularly increase in input costs by Government and any potential decline in international prices may impact the Company adversely
Significant changes in objectives & strategiesBusiness objectives & strategies of FFC are carefully planned. There were no significant changes during the year which affected our course of action for achievement of these objectives
15Annual Report 2018
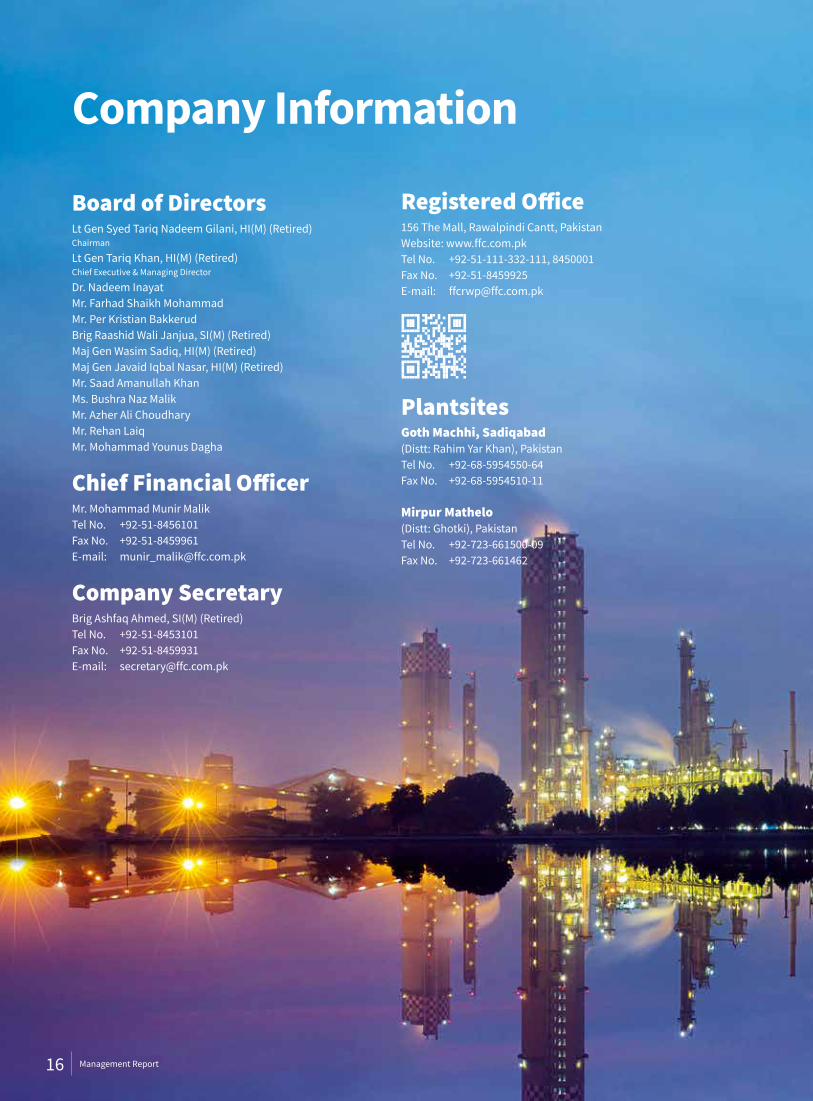
Company Information
Board of DirectorsLt Gen Syed Tariq Nadeem Gilani, HI(M) (Retired)Chairman
Lt Gen Tariq Khan, HI(M) (Retired)Chief Executive & Managing Director
Dr. Nadeem InayatMr. Farhad Shaikh MohammadMr. Per Kristian Bakkerud Brig Raashid Wali Janjua, SI(M) (Retired)Maj Gen Wasim Sadiq, HI(M) (Retired)Maj Gen Javaid Iqbal Nasar, HI(M) (Retired)Mr. Saad Amanullah KhanMs. Bushra Naz MalikMr. Azher Ali Choudhary Mr. Rehan Laiq Mr. Mohammad Younus Dagha
Chief Financial OfficerMr. Mohammad Munir Malik Tel No. +92-51-8456101Fax No. +92-51-8459961 E-mail: [email protected]
Company Secretary Brig Ashfaq Ahmed, SI(M) (Retired)Tel No. +92-51-8453101Fax No. +92-51-8459931E-mail: [email protected]
Registered Office156 The Mall, Rawalpindi Cantt, PakistanWebsite: www.ffc.com.pkTel No. +92-51-111-332-111, 8450001Fax No. +92-51-8459925E-mail: [email protected]
PlantsitesGoth Machhi, Sadiqabad(Distt: Rahim Yar Khan), PakistanTel No. +92-68-5954550-64Fax No. +92-68-5954510-11
Mirpur Mathelo(Distt: Ghotki), PakistanTel No. +92-723-661500-09Fax No. +92-723-661462
16 Management Report
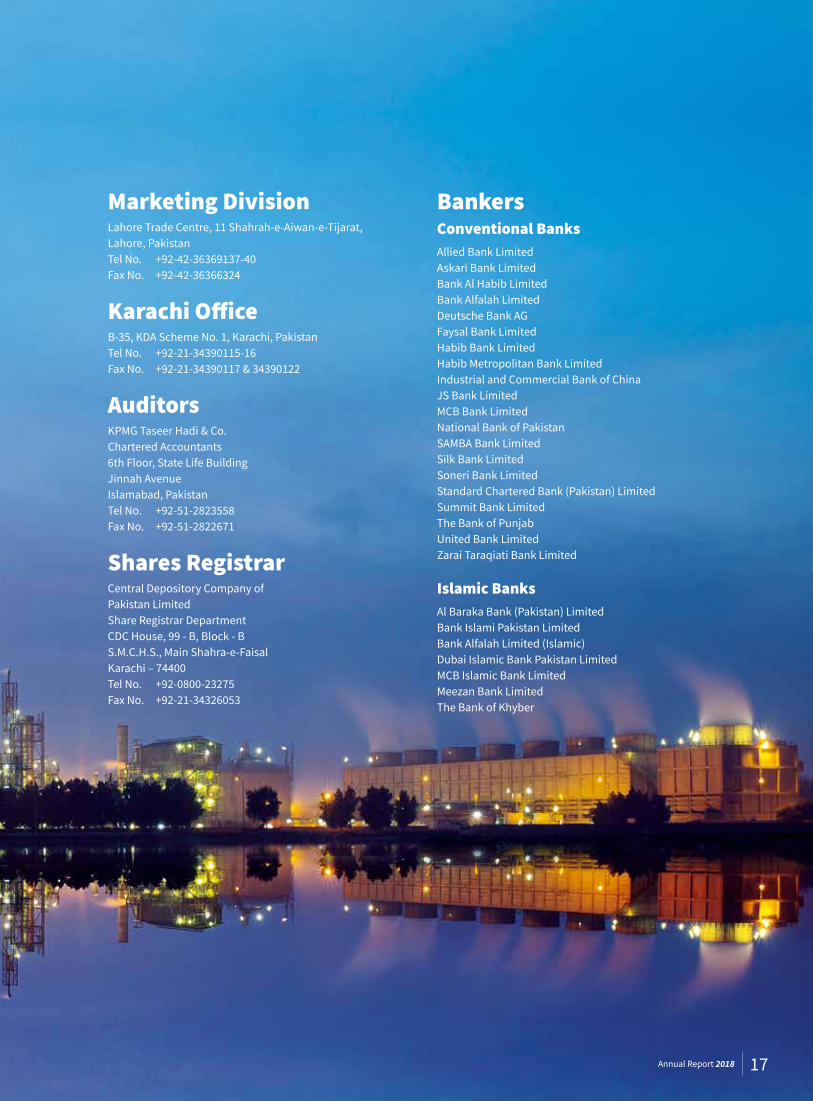
Marketing DivisionLahore Trade Centre, 11 Shahrah-e-Aiwan-e-Tijarat, Lahore, PakistanTel No. +92-42-36369137-40Fax No. +92-42-36366324
Karachi OfficeB-35, KDA Scheme No. 1, Karachi, PakistanTel No. +92-21-34390115-16Fax No. +92-21-34390117 & 34390122
AuditorsKPMG Taseer Hadi & Co.Chartered Accountants6th Floor, State Life BuildingJinnah AvenueIslamabad, Pakistan Tel No. +92-51-2823558Fax No. +92-51-2822671
Shares RegistrarCentral Depository Company ofPakistan LimitedShare Registrar DepartmentCDC House, 99 - B, Block - BS.M.C.H.S., Main Shahra-e-FaisalKarachi – 74400Tel No. +92-0800-23275Fax No. +92-21-34326053
BankersConventional Banks Allied Bank LimitedAskari Bank LimitedBank Al Habib LimitedBank Alfalah LimitedDeutsche Bank AGFaysal Bank LimitedHabib Bank LimitedHabib Metropolitan Bank LimitedIndustrial and Commercial Bank of ChinaJS Bank LimitedMCB Bank LimitedNational Bank of PakistanSAMBA Bank LimitedSilk Bank LimitedSoneri Bank LimitedStandard Chartered Bank (Pakistan) LimitedSummit Bank LimitedThe Bank of PunjabUnited Bank LimitedZarai Taraqiati Bank Limited Islamic Banks Al Baraka Bank (Pakistan) LimitedBank Islami Pakistan LimitedBank Alfalah Limited (Islamic)Dubai Islamic Bank Pakistan LimitedMCB Islamic Bank LimitedMeezan Bank LimitedThe Bank of Khyber
17Annual Report 2018
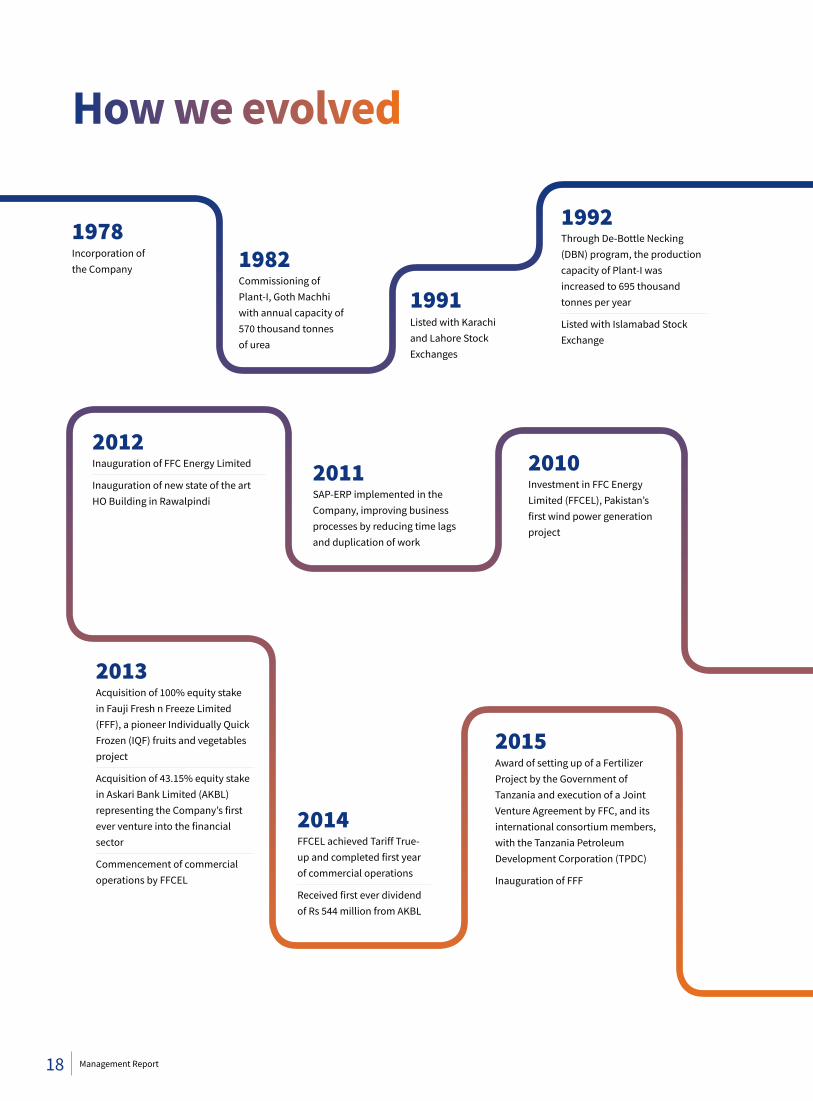
19781982
1991
Incorporation of the Company
Commissioning of Plant-I, Goth Machhi with annual capacity of 570 thousand tonnes of urea
Listed with Karachi and Lahore Stock Exchanges
2012
2013
2014
Inauguration of FFC Energy Limited
Inauguration of new state of the art HO Building in Rawalpindi
Acquisition of 100% equity stake in Fauji Fresh n Freeze Limited (FFF), a pioneer Individually Quick Frozen (IQF) fruits and vegetables project
Acquisition of 43.15% equity stake in Askari Bank Limited (AKBL) representing the Company’s first ever venture into the financial sector
Commencement of commercial operations by FFCEL
FFCEL achieved Tariff True-up and completed first year of commercial operations
Received first ever dividend of Rs 544 million from AKBL
2011 2010SAP-ERP implemented in the Company, improving business processes by reducing time lags and duplication of work
Investment in FFC Energy Limited (FFCEL), Pakistan’s first wind power generation project
How we evolved
1992Through De-Bottle Necking (DBN) program, the production capacity of Plant-I was increased to 695 thousand tonnes per year
Listed with Islamabad Stock Exchange
2015Award of setting up of a Fertilizer Project by the Government of Tanzania and execution of a Joint Venture Agreement by FFC, and its international consortium members, with the Tanzania Petroleum Development Corporation (TPDC)
Inauguration of FFF
18 Management Report
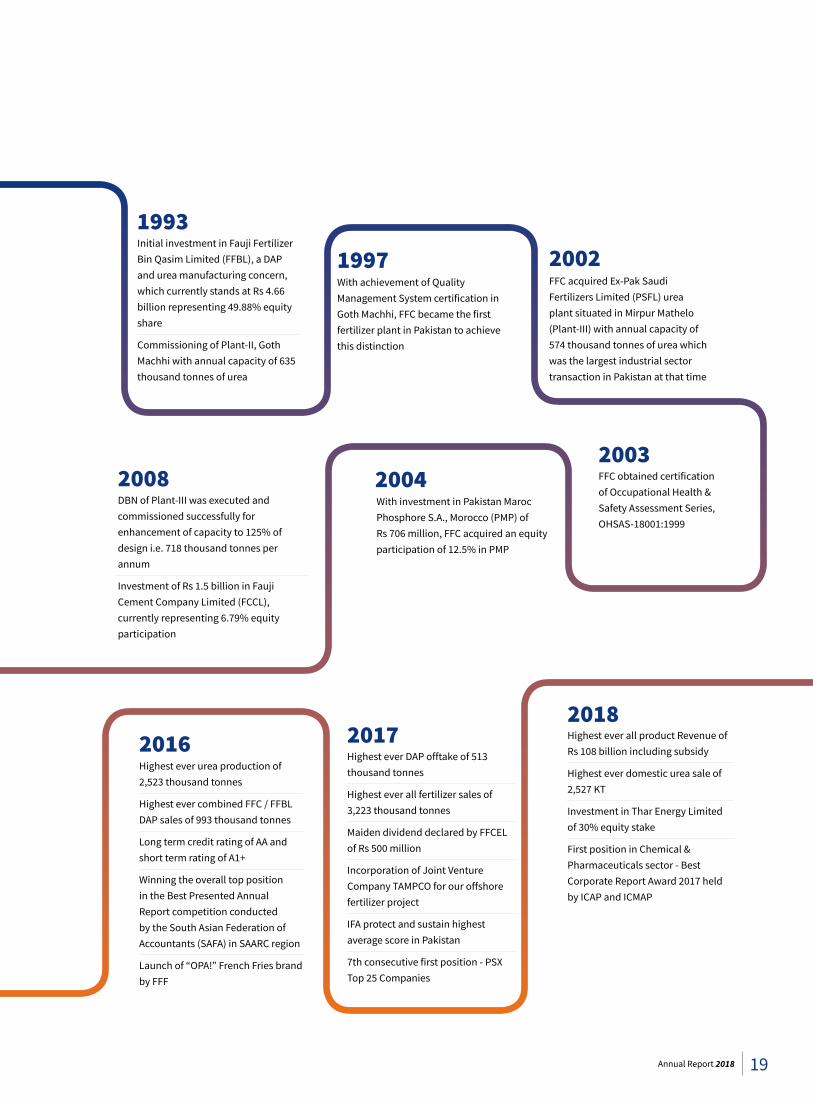
20042003
2002
FFC obtained certification of Occupational Health & Safety Assessment Series, OHSAS-18001:1999
With investment in Pakistan Maroc Phosphore S.A., Morocco (PMP) of Rs 706 million, FFC acquired an equity participation of 12.5% in PMP
FFC acquired Ex-Pak Saudi Fertilizers Limited (PSFL) urea plant situated in Mirpur Mathelo (Plant-III) with annual capacity of 574 thousand tonnes of urea which was the largest industrial sector transaction in Pakistan at that time
2008DBN of Plant-III was executed and commissioned successfully for enhancement of capacity to 125% of design i.e. 718 thousand tonnes per annum
Investment of Rs 1.5 billion in Fauji Cement Company Limited (FCCL), currently representing 6.79% equity participation
19931997
Initial investment in Fauji Fertilizer Bin Qasim Limited (FFBL), a DAP and urea manufacturing concern, which currently stands at Rs 4.66 billion representing 49.88% equity share
Commissioning of Plant-II, Goth Machhi with annual capacity of 635 thousand tonnes of urea
With achievement of Quality Management System certification in Goth Machhi, FFC became the first fertilizer plant in Pakistan to achieve this distinction
2016 20172018
Highest ever urea production of 2,523 thousand tonnes
Highest ever combined FFC / FFBL DAP sales of 993 thousand tonnes
Long term credit rating of AA and short term rating of A1+
Winning the overall top position in the Best Presented Annual Report competition conducted by the South Asian Federation of Accountants (SAFA) in SAARC region
Launch of “OPA!” French Fries brand by FFF
Highest ever DAP offtake of 513 thousand tonnes
Highest ever all fertilizer sales of 3,223 thousand tonnes
Maiden dividend declared by FFCEL of Rs 500 million
Incorporation of Joint Venture Company TAMPCO for our offshore fertilizer project
IFA protect and sustain highest average score in Pakistan
7th consecutive first position - PSX Top 25 Companies
Highest ever all product Revenue of Rs 108 billion including subsidy
Highest ever domestic urea sale of 2,527 KT
Investment in Thar Energy Limited of 30% equity stake
First position in Chemical & Pharmaceuticals sector - Best Corporate Report Award 2017 held by ICAP and ICMAP
19Annual Report 2018
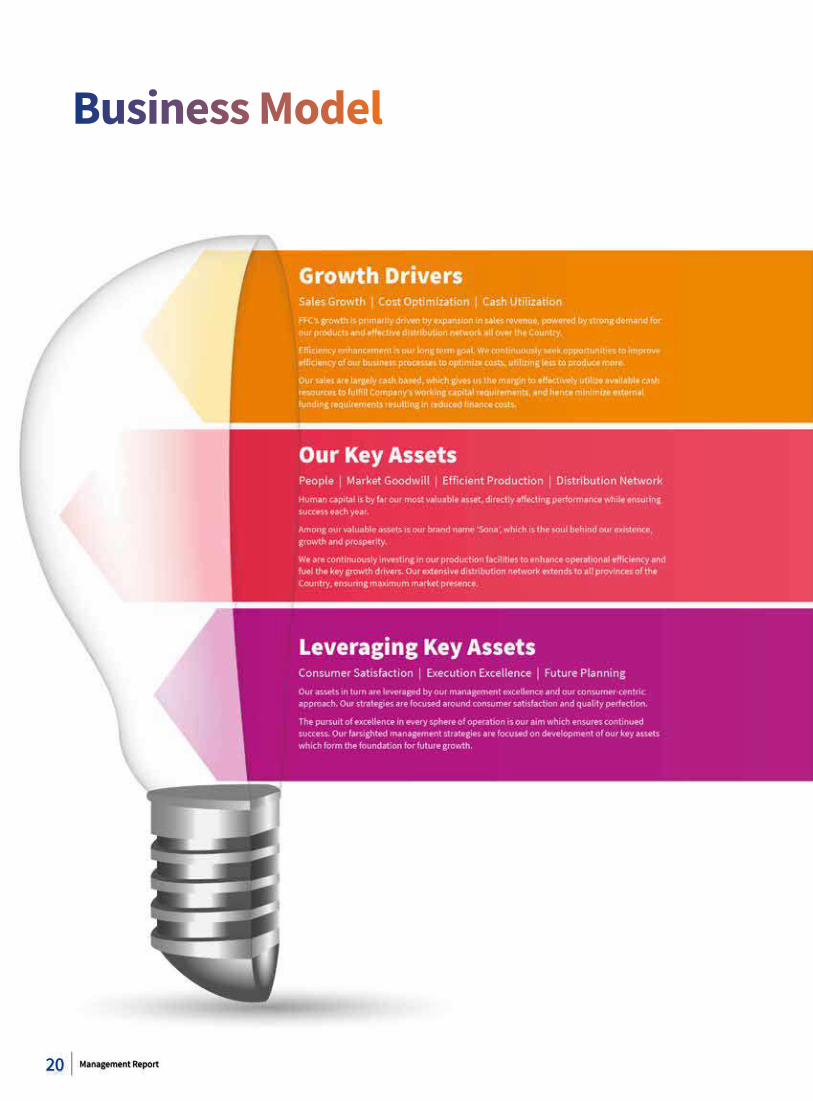
Business Model
20 Management Report

Calendar of Major Events During the Year
21Annual Report 2018
Profile of the Board
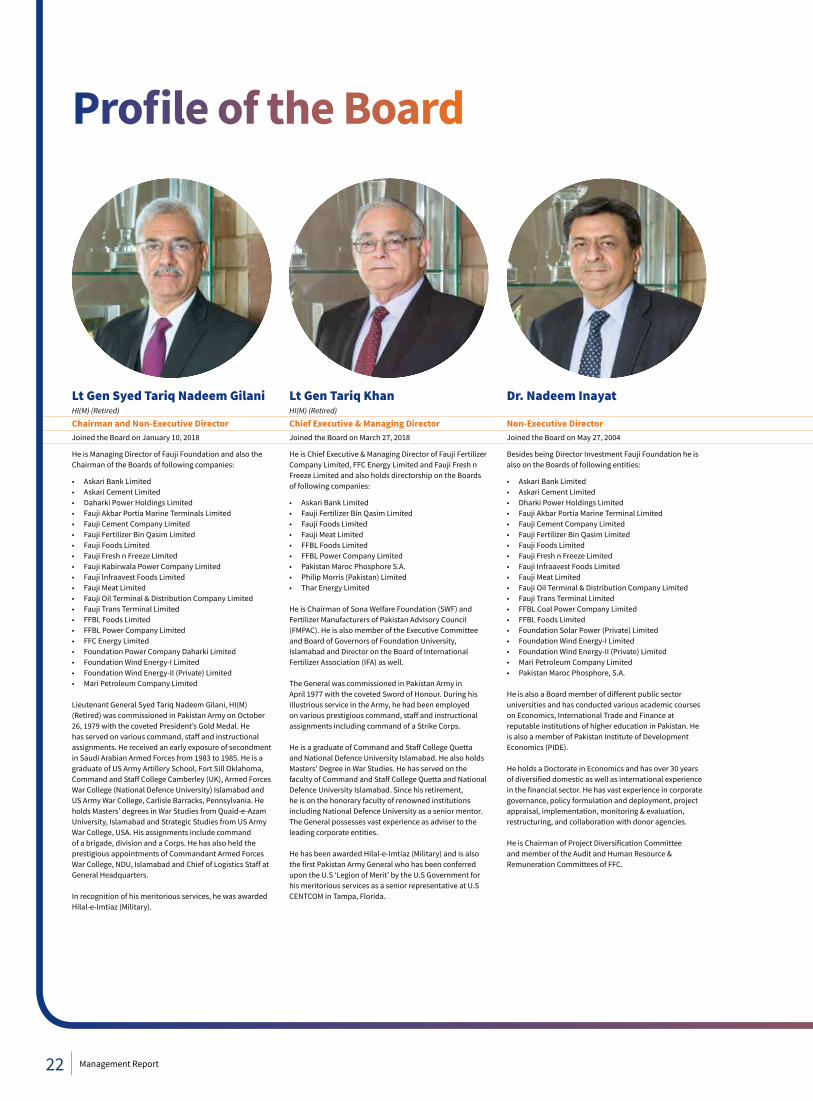
Lt Gen Tariq KhanHI(M) (Retired)
Chief Executive & Managing DirectorJoined the Board on March 27, 2018
He is Chief Executive & Managing Director of Fauji Fertilizer Company Limited, FFC Energy Limited and Fauji Fresh n Freeze Limited and also holds directorship on the Boards of following companies:
• Askari Bank Limited• Fauji Fertilizer Bin Qasim Limited• Fauji Foods Limited• Fauji Meat Limited• FFBL Foods Limited• FFBL Power Company Limited• Pakistan Maroc Phosphore S.A.• Philip Morris (Pakistan) Limited• Thar Energy Limited
He is Chairman of Sona Welfare Foundation (SWF) and Fertilizer Manufacturers of Pakistan Advisory Council (FMPAC). He is also member of the Executive Committee and Board of Governors of Foundation University, Islamabad and Director on the Board of International Fertilizer Association (IFA) as well.
The General was commissioned in Pakistan Army in April 1977 with the coveted Sword of Honour. During his illustrious service in the Army, he had been employed on various prestigious command, staff and instructional assignments including command of a Strike Corps.
He is a graduate of Command and Staff College Quetta and National Defence University Islamabad. He also holds Masters’ Degree in War Studies. He has served on the faculty of Command and Staff College Quetta and National Defence University Islamabad. Since his retirement, he is on the honorary faculty of renowned institutions including National Defence University as a senior mentor. The General possesses vast experience as adviser to the leading corporate entities.
He has been awarded Hilal-e-Imtiaz (Military) and is also the first Pakistan Army General who has been conferred upon the U.S ‘Legion of Merit’ by the U.S Government for his meritorious services as a senior representative at U.S CENTCOM in Tampa, Florida.
Lt Gen Syed Tariq Nadeem GilaniHI(M) (Retired)
Chairman and Non-Executive DirectorJoined the Board on January 10, 2018
He is Managing Director of Fauji Foundation and also the Chairman of the Boards of following companies:
• Askari Bank Limited• Askari Cement Limited• Daharki Power Holdings Limited• Fauji Akbar Portia Marine Terminals Limited• Fauji Cement Company Limited• Fauji Fertilizer Bin Qasim Limited• Fauji Foods Limited• Fauji Fresh n Freeze Limited• Fauji Kabirwala Power Company Limited• Fauji lnfraavest Foods Limited• Fauji Meat Limited• Fauji Oil Terminal & Distribution Company Limited• Fauji Trans Terminal Limited• FFBL Foods Limited• FFBL Power Company Limited• FFC Energy Limited• Foundation Power Company Daharki Limited• Foundation Wind Energy-I Limited• Foundation Wind Energy-II (Private) Limited• Mari Petroleum Company Limited
Lieutenant General Syed Tariq Nadeem Gilani, HI(M) (Retired) was commissioned in Pakistan Army on October 26, 1979 with the coveted President’s Gold Medal. He has served on various command, staff and instructional assignments. He received an early exposure of secondment in Saudi Arabian Armed Forces from 1983 to 1985. He is a graduate of US Army Artillery School, Fort Sill Oklahoma, Command and Staff College Camberley (UK), Armed Forces War College (National Defence University) Islamabad and US Army War College, Carlisle Barracks, Pennsylvania. He holds Masters’ degrees in War Studies from Quaid-e-Azam University, Islamabad and Strategic Studies from US Army War College, USA. His assignments include command of a brigade, division and a Corps. He has also held the prestigious appointments of Commandant Armed Forces War College, NDU, Islamabad and Chief of Logistics Staff at General Headquarters.
In recognition of his meritorious services, he was awarded Hilal-e-lmtiaz (Military).
Dr. Nadeem Inayat
Non-Executive DirectorJoined the Board on May 27, 2004
Besides being Director Investment Fauji Foundation he is also on the Boards of following entities:
• Askari Bank Limited • Askari Cement Limited• Dharki Power Holdings Limited• Fauji Akbar Portia Marine Terminal Limited• Fauji Cement Company Limited• Fauji Fertilizer Bin Qasim Limited• Fauji Foods Limited• Fauji Fresh n Freeze Limited• Fauji Infraavest Foods Limited• Fauji Meat Limited• Fauji Oil Terminal & Distribution Company Limited• Fauji Trans Terminal Limited• FFBL Coal Power Company Limited• FFBL Foods Limited• Foundation Solar Power (Private) Limited• Foundation Wind Energy-I Limited• Foundation Wind Energy-II (Private) Limited• Mari Petroleum Company Limited• Pakistan Maroc Phosphore, S.A.
He is also a Board member of different public sector universities and has conducted various academic courses on Economics, International Trade and Finance at reputable institutions of higher education in Pakistan. He is also a member of Pakistan Institute of Development Economics (PIDE).
He holds a Doctorate in Economics and has over 30 years of diversified domestic as well as international experience in the financial sector. He has vast experience in corporate governance, policy formulation and deployment, project appraisal, implementation, monitoring & evaluation, restructuring, and collaboration with donor agencies. He is Chairman of Project Diversification Committee and member of the Audit and Human Resource & Remuneration Committees of FFC.
22 Management Report
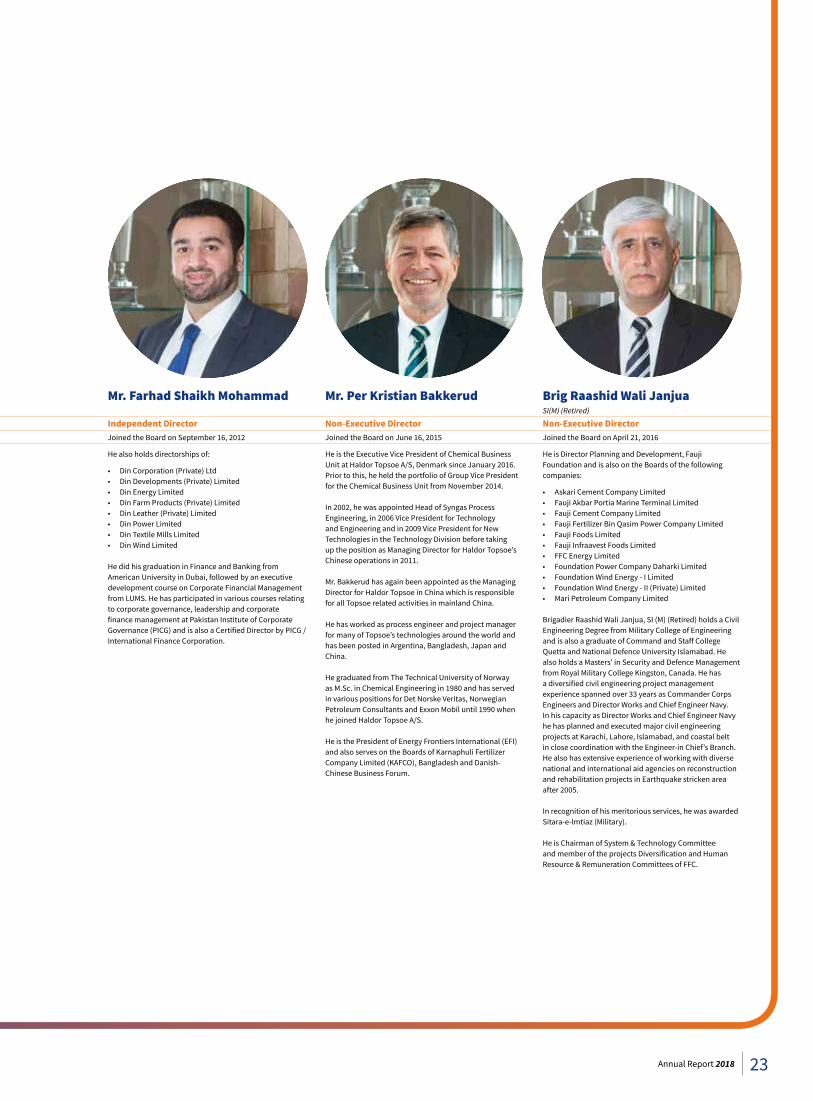
Mr. Farhad Shaikh Mohammad
Independent DirectorJoined the Board on September 16, 2012
He also holds directorships of:
• Din Corporation (Private) Ltd• Din Developments (Private) Limited• Din Energy Limited• Din Farm Products (Private) Limited• Din Leather (Private) Limited• Din Power Limited• Din Textile Mills Limited• Din Wind Limited
He did his graduation in Finance and Banking from American University in Dubai, followed by an executive development course on Corporate Financial Management from LUMS. He has participated in various courses relating to corporate governance, leadership and corporate finance management at Pakistan Institute of Corporate Governance (PICG) and is also a Certified Director by PICG / International Finance Corporation.
Mr. Per Kristian Bakkerud
Non-Executive DirectorJoined the Board on June 16, 2015
He is the Executive Vice President of Chemical Business Unit at Haldor Topsoe A/S, Denmark since January 2016. Prior to this, he held the portfolio of Group Vice President for the Chemical Business Unit from November 2014.
In 2002, he was appointed Head of Syngas Process Engineering, in 2006 Vice President for Technology and Engineering and in 2009 Vice President for New Technologies in the Technology Division before taking up the position as Managing Director for Haldor Topsoe’s Chinese operations in 2011.
Mr. Bakkerud has again been appointed as the Managing Director for Haldor Topsoe in China which is responsible for all Topsoe related activities in mainland China.
He has worked as process engineer and project manager for many of Topsoe’s technologies around the world and has been posted in Argentina, Bangladesh, Japan and China.
He graduated from The Technical University of Norway as M.Sc. in Chemical Engineering in 1980 and has served in various positions for Det Norske Veritas, Norwegian Petroleum Consultants and Exxon Mobil until 1990 when he joined Haldor Topsoe A/S.
He is the President of Energy Frontiers International (EFI) and also serves on the Boards of Karnaphuli Fertilizer Company Limited (KAFCO), Bangladesh and Danish-Chinese Business Forum.
Brig Raashid Wali JanjuaSI(M) (Retired)
Non-Executive DirectorJoined the Board on April 21, 2016
He is Director Planning and Development, Fauji Foundation and is also on the Boards of the following companies:
• Askari Cement Company Limited• Fauji Akbar Portia Marine Terminal Limited• Fauji Cement Company Limited• Fauji Fertilizer Bin Qasim Power Company Limited• Fauji Foods Limited• Fauji Infraavest Foods Limited• FFC Energy Limited• Foundation Power Company Daharki Limited • Foundation Wind Energy - I Limited• Foundation Wind Energy - II (Private) Limited • Mari Petroleum Company Limited
Brigadier Raashid Wali Janjua, SI (M) (Retired) holds a Civil Engineering Degree from Military College of Engineering and is also a graduate of Command and Staff College Quetta and National Defence University Islamabad. He also holds a Masters’ in Security and Defence Management from Royal Military College Kingston, Canada. He has a diversified civil engineering project management experience spanned over 33 years as Commander Corps Engineers and Director Works and Chief Engineer Navy. In his capacity as Director Works and Chief Engineer Navy he has planned and executed major civil engineering projects at Karachi, Lahore, Islamabad, and coastal belt in close coordination with the Engineer-in Chief’s Branch. He also has extensive experience of working with diverse national and international aid agencies on reconstruction and rehabilitation projects in Earthquake stricken area after 2005.
In recognition of his meritorious services, he was awarded Sitara-e-lmtiaz (Military).
He is Chairman of System & Technology Committee and member of the projects Diversification and Human Resource & Remuneration Committees of FFC.
23Annual Report 2018
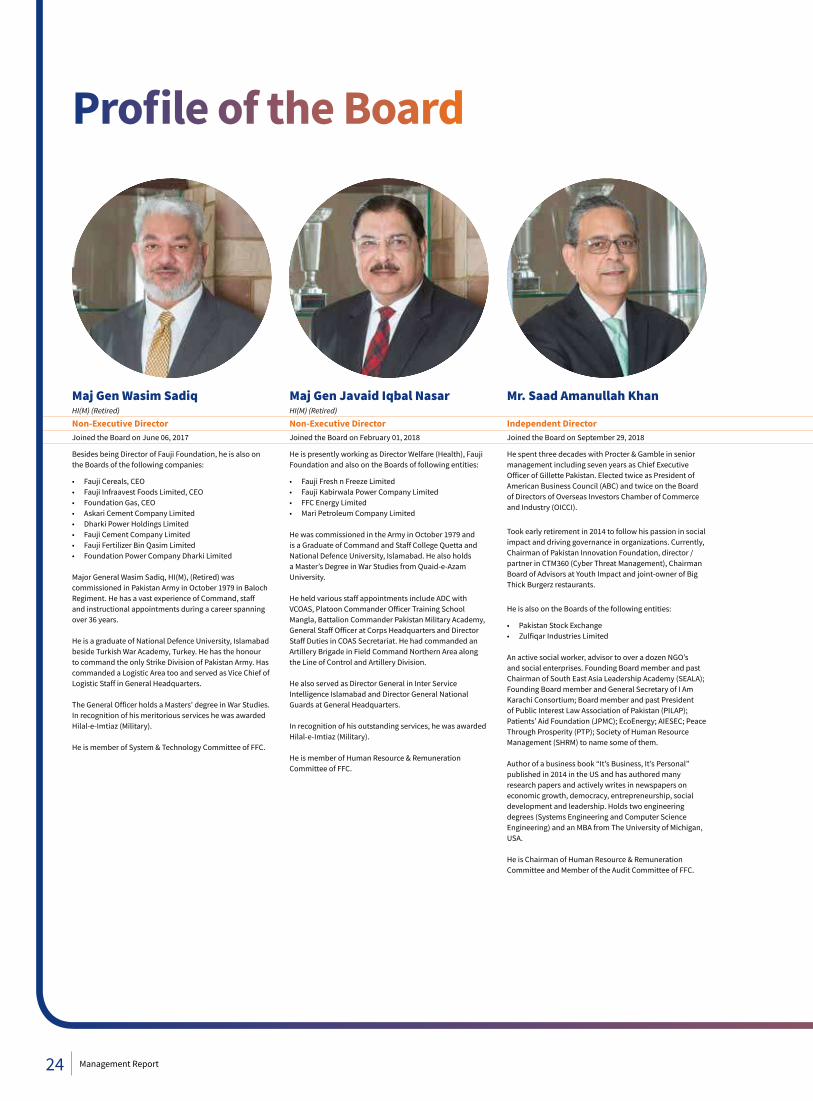
Maj Gen Wasim SadiqHI(M) (Retired)
Non-Executive DirectorJoined the Board on June 06, 2017
Besides being Director of Fauji Foundation, he is also on the Boards of the following companies:
• Fauji Cereals, CEO• Fauji Infraavest Foods Limited, CEO• Foundation Gas, CEO • Askari Cement Company Limited• Dharki Power Holdings Limited• Fauji Cement Company Limited• Fauji Fertilizer Bin Qasim Limited• Foundation Power Company Dharki Limited
Major General Wasim Sadiq, HI(M), (Retired) was commissioned in Pakistan Army in October 1979 in Baloch Regiment. He has a vast experience of Command, staff and instructional appointments during a career spanning over 36 years.
He is a graduate of National Defence University, Islamabad beside Turkish War Academy, Turkey. He has the honour to command the only Strike Division of Pakistan Army. Has commanded a Logistic Area too and served as Vice Chief of Logistic Staff in General Headquarters.
The General Officer holds a Masters’ degree in War Studies. In recognition of his meritorious services he was awarded Hilal-e-Imtiaz (Military).
He is member of System & Technology Committee of FFC.
Maj Gen Javaid Iqbal NasarHI(M) (Retired)
Non-Executive DirectorJoined the Board on February 01, 2018
He is presently working as Director Welfare (Health), Fauji Foundation and also on the Boards of following entities:
• Fauji Fresh n Freeze Limited• Fauji Kabirwala Power Company Limited• FFC Energy Limited• Mari Petroleum Company Limited
He was commissioned in the Army in October 1979 and is a Graduate of Command and Staff College Quetta and National Defence University, Islamabad. He also holds a Master’s Degree in War Studies from Quaid-e-Azam University.
He held various staff appointments include ADC with VCOAS, Platoon Commander Officer Training School Mangla, Battalion Commander Pakistan Military Academy, General Staff Officer at Corps Headquarters and Director Staff Duties in COAS Secretariat. He had commanded an Artillery Brigade in Field Command Northern Area along the Line of Control and Artillery Division.
He also served as Director General in Inter Service Intelligence Islamabad and Director General National Guards at General Headquarters.
In recognition of his outstanding services, he was awarded Hilal-e-Imtiaz (Military).
He is member of Human Resource & Remuneration Committee of FFC.
Mr. Saad Amanullah Khan
Independent DirectorJoined the Board on September 29, 2018
He spent three decades with Procter & Gamble in senior management including seven years as Chief Executive Officer of Gillette Pakistan. Elected twice as President of American Business Council (ABC) and twice on the Board of Directors of Overseas Investors Chamber of Commerce and Industry (OICCI).
Took early retirement in 2014 to follow his passion in social impact and driving governance in organizations. Currently, Chairman of Pakistan Innovation Foundation, director / partner in CTM360 (Cyber Threat Management), Chairman Board of Advisors at Youth Impact and joint-owner of Big Thick Burgerz restaurants.
He is also on the Boards of the following entities:
• Pakistan Stock Exchange • Zulfiqar Industries Limited
An active social worker, advisor to over a dozen NGO’s and social enterprises. Founding Board member and past Chairman of South East Asia Leadership Academy (SEALA); Founding Board member and General Secretary of I Am Karachi Consortium; Board member and past President of Public Interest Law Association of Pakistan (PILAP); Patients’ Aid Foundation (JPMC); EcoEnergy; AIESEC; Peace Through Prosperity (PTP); Society of Human Resource Management (SHRM) to name some of them.
Author of a business book “It’s Business, It’s Personal” published in 2014 in the US and has authored many research papers and actively writes in newspapers on economic growth, democracy, entrepreneurship, social development and leadership. Holds two engineering degrees (Systems Engineering and Computer Science Engineering) and an MBA from The University of Michigan, USA.
He is Chairman of Human Resource & Remuneration Committee and Member of the Audit Committee of FFC.
Profile of the Board
24 Management Report
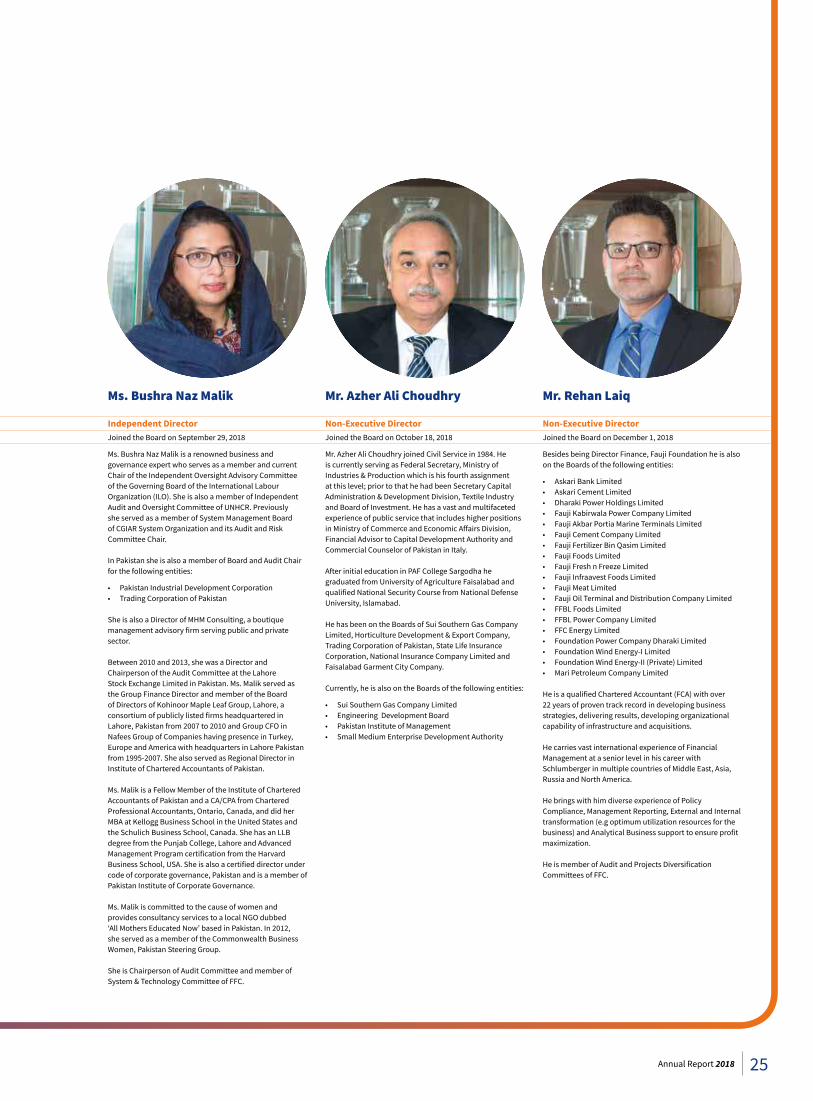
Ms. Bushra Naz Malik
Independent DirectorJoined the Board on September 29, 2018
Ms. Bushra Naz Malik is a renowned business and governance expert who serves as a member and current Chair of the Independent Oversight Advisory Committee of the Governing Board of the International Labour Organization (ILO). She is also a member of Independent Audit and Oversight Committee of UNHCR. Previously she served as a member of System Management Board of CGIAR System Organization and its Audit and Risk Committee Chair.
In Pakistan she is also a member of Board and Audit Chair for the following entities:
• Pakistan Industrial Development Corporation • Trading Corporation of Pakistan
She is also a Director of MHM Consulting, a boutique management advisory firm serving public and private sector.
Between 2010 and 2013, she was a Director and Chairperson of the Audit Committee at the Lahore Stock Exchange Limited in Pakistan. Ms. Malik served as the Group Finance Director and member of the Board of Directors of Kohinoor Maple Leaf Group, Lahore, a consortium of publicly listed firms headquartered in Lahore, Pakistan from 2007 to 2010 and Group CFO in Nafees Group of Companies having presence in Turkey, Europe and America with headquarters in Lahore Pakistan from 1995-2007. She also served as Regional Director in Institute of Chartered Accountants of Pakistan.
Ms. Malik is a Fellow Member of the Institute of Chartered Accountants of Pakistan and a CA/CPA from Chartered Professional Accountants, Ontario, Canada, and did her MBA at Kellogg Business School in the United States and the Schulich Business School, Canada. She has an LLB degree from the Punjab College, Lahore and Advanced Management Program certification from the Harvard Business School, USA. She is also a certified director under code of corporate governance, Pakistan and is a member of Pakistan Institute of Corporate Governance.
Ms. Malik is committed to the cause of women and provides consultancy services to a local NGO dubbed ‘All Mothers Educated Now’ based in Pakistan. In 2012, she served as a member of the Commonwealth Business Women, Pakistan Steering Group.
She is Chairperson of Audit Committee and member of System & Technology Committee of FFC.
Mr. Azher Ali Choudhry
Non-Executive DirectorJoined the Board on October 18, 2018
Mr. Azher Ali Choudhry joined Civil Service in 1984. He is currently serving as Federal Secretary, Ministry of Industries & Production which is his fourth assignment at this level; prior to that he had been Secretary Capital Administration & Development Division, Textile Industry and Board of Investment. He has a vast and multifaceted experience of public service that includes higher positions in Ministry of Commerce and Economic Affairs Division, Financial Advisor to Capital Development Authority and Commercial Counselor of Pakistan in Italy.
After initial education in PAF College Sargodha he graduated from University of Agriculture Faisalabad and qualified National Security Course from National Defense University, Islamabad.
He has been on the Boards of Sui Southern Gas Company Limited, Horticulture Development & Export Company, Trading Corporation of Pakistan, State Life Insurance Corporation, National Insurance Company Limited and Faisalabad Garment City Company.
Currently, he is also on the Boards of the following entities:
• Sui Southern Gas Company Limited• Engineering Development Board• Pakistan Institute of Management• Small Medium Enterprise Development Authority
Mr. Rehan Laiq
Non-Executive DirectorJoined the Board on December 1, 2018
Besides being Director Finance, Fauji Foundation he is also on the Boards of the following entities:
• Askari Bank Limited• Askari Cement Limited• Dharaki Power Holdings Limited• Fauji Kabirwala Power Company Limited• Fauji Akbar Portia Marine Terminals Limited• Fauji Cement Company Limited• Fauji Fertilizer Bin Qasim Limited• Fauji Foods Limited• Fauji Fresh n Freeze Limited• Fauji Infraavest Foods Limited• Fauji Meat Limited• Fauji Oil Terminal and Distribution Company Limited• FFBL Foods Limited• FFBL Power Company Limited• FFC Energy Limited• Foundation Power Company Dharaki Limited• Foundation Wind Energy-I Limited• Foundation Wind Energy-II (Private) Limited• Mari Petroleum Company Limited
He is a qualified Chartered Accountant (FCA) with over 22 years of proven track record in developing business strategies, delivering results, developing organizational capability of infrastructure and acquisitions.
He carries vast international experience of Financial Management at a senior level in his career with Schlumberger in multiple countries of Middle East, Asia, Russia and North America.
He brings with him diverse experience of Policy Compliance, Management Reporting, External and Internal transformation (e.g optimum utilization resources for the business) and Analytical Business support to ensure profit maximization.
He is member of Audit and Projects Diversification Committees of FFC.
25Annual Report 2018
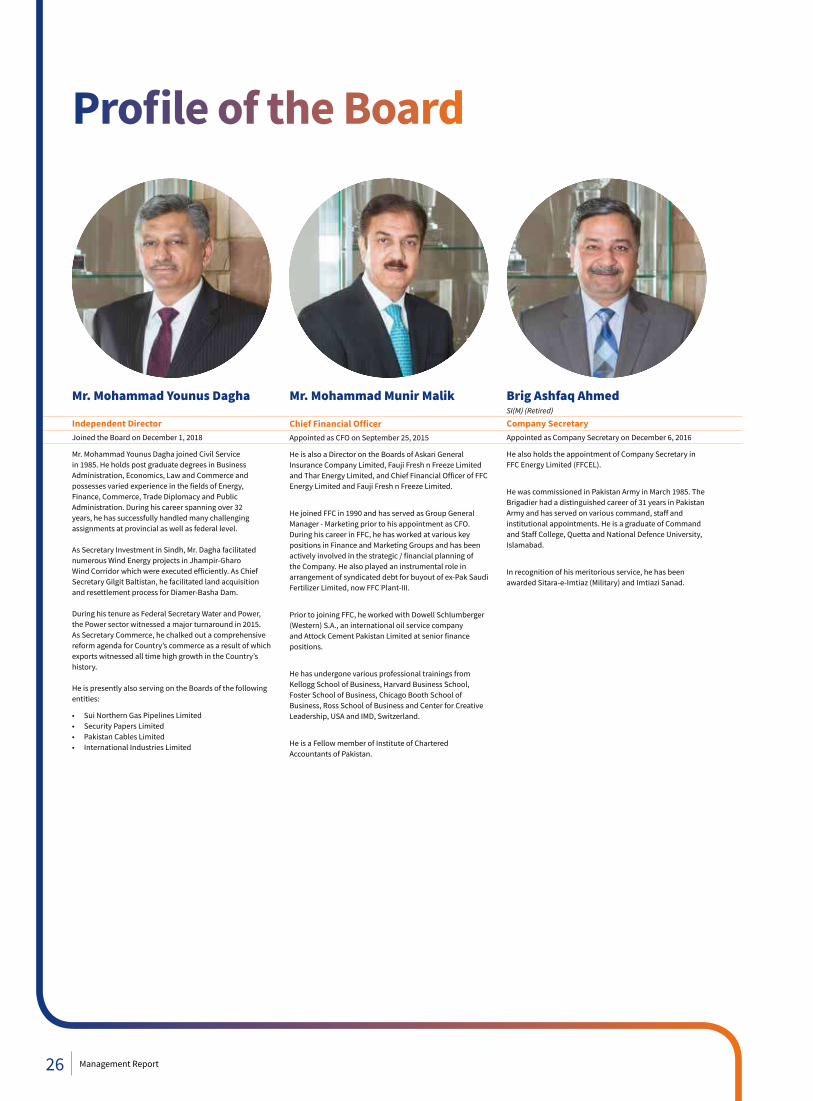
Mr. Mohammad Younus Dagha
Independent DirectorJoined the Board on December 1, 2018
Mr. Mohammad Younus Dagha joined Civil Service in 1985. He holds post graduate degrees in Business Administration, Economics, Law and Commerce and possesses varied experience in the fields of Energy, Finance, Commerce, Trade Diplomacy and Public Administration. During his career spanning over 32 years, he has successfully handled many challenging assignments at provincial as well as federal level.
As Secretary Investment in Sindh, Mr. Dagha facilitated numerous Wind Energy projects in Jhampir-Gharo Wind Corridor which were executed efficiently. As Chief Secretary Gilgit Baltistan, he facilitated land acquisition and resettlement process for Diamer-Basha Dam.
During his tenure as Federal Secretary Water and Power, the Power sector witnessed a major turnaround in 2015. As Secretary Commerce, he chalked out a comprehensive reform agenda for Country’s commerce as a result of which exports witnessed all time high growth in the Country’s history.
He is presently also serving on the Boards of the following entities:
• Sui Northern Gas Pipelines Limited• Security Papers Limited• Pakistan Cables Limited• International Industries Limited
Mr. Mohammad Munir Malik
Chief Financial OfficerAppointed as CFO on September 25, 2015
He is also a Director on the Boards of Askari General Insurance Company Limited, Fauji Fresh n Freeze Limited and Thar Energy Limited, and Chief Financial Officer of FFC Energy Limited and Fauji Fresh n Freeze Limited.
He joined FFC in 1990 and has served as Group General Manager - Marketing prior to his appointment as CFO. During his career in FFC, he has worked at various key positions in Finance and Marketing Groups and has been actively involved in the strategic / financial planning of the Company. He also played an instrumental role in arrangement of syndicated debt for buyout of ex-Pak Saudi Fertilizer Limited, now FFC Plant-III.
Prior to joining FFC, he worked with Dowell Schlumberger (Western) S.A., an international oil service company and Attock Cement Pakistan Limited at senior finance positions.
He has undergone various professional trainings from Kellogg School of Business, Harvard Business School, Foster School of Business, Chicago Booth School of Business, Ross School of Business and Center for Creative Leadership, USA and IMD, Switzerland.
He is a Fellow member of Institute of Chartered Accountants of Pakistan.
Brig Ashfaq AhmedSI(M) (Retired)
Company SecretaryAppointed as Company Secretary on December 6, 2016
He also holds the appointment of Company Secretary in FFC Energy Limited (FFCEL).
He was commissioned in Pakistan Army in March 1985. The Brigadier had a distinguished career of 31 years in Pakistan Army and has served on various command, staff and institutional appointments. He is a graduate of Command and Staff College, Quetta and National Defence University, Islamabad.
In recognition of his meritorious service, he has been awarded Sitara-e-Imtiaz (Military) and Imtiazi Sanad.
Profile of the Board
26 Management Report
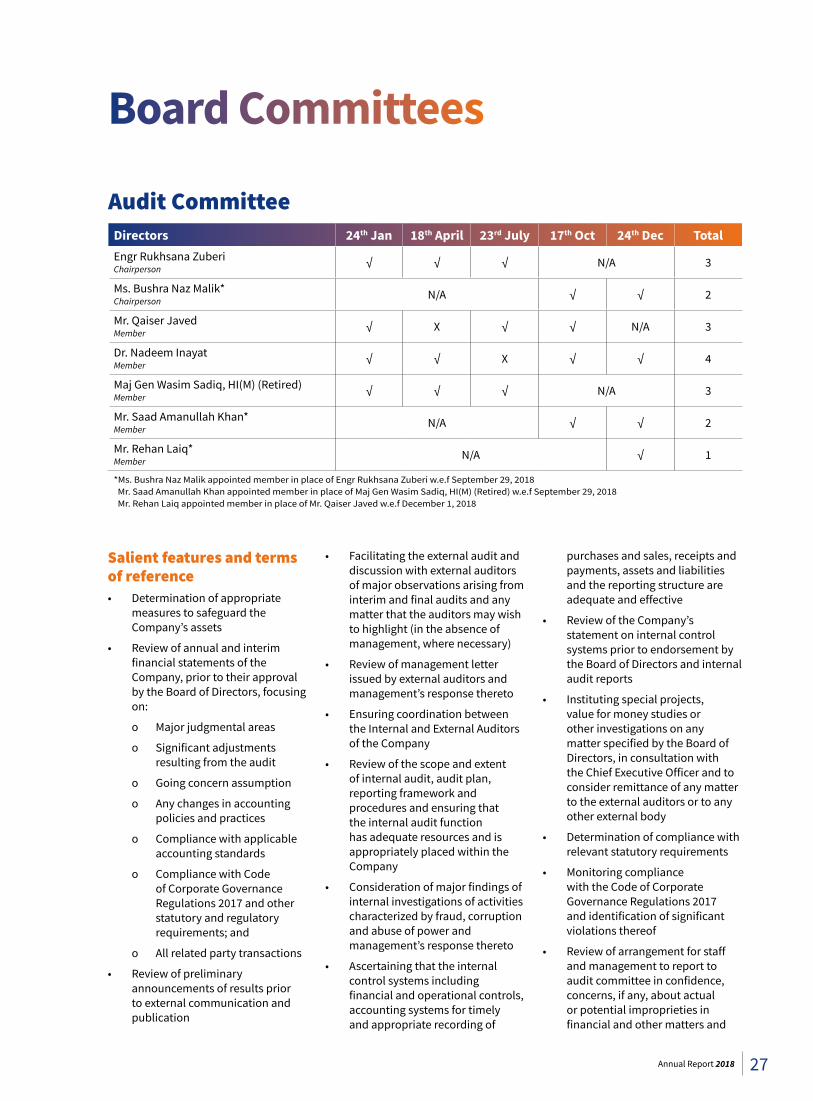
Directors 24th Jan 18th April 23rd July 17th Oct 24th Dec TotalEngr Rukhsana ZuberiChairperson √ √ √ N/A 3
Ms. Bushra Naz Malik*Chairperson N/A √ √ 2
Mr. Qaiser JavedMember √ X √ √ N/A 3
Dr. Nadeem InayatMember √ √ X √ √ 4
Maj Gen Wasim Sadiq, HI(M) (Retired)Member √ √ √ N/A 3
Mr. Saad Amanullah Khan*Member N/A √ √ 2
Mr. Rehan Laiq*Member N/A √ 1
*Ms. Bushra Naz Malik appointed member in place of Engr Rukhsana Zuberi w.e.f September 29, 2018 Mr. Saad Amanullah Khan appointed member in place of Maj Gen Wasim Sadiq, HI(M) (Retired) w.e.f September 29, 2018 Mr. Rehan Laiq appointed member in place of Mr. Qaiser Javed w.e.f December 1, 2018
Salient features and terms of reference• Determination of appropriate
measures to safeguard the Company’s assets
• Review of annual and interim financial statements of the Company, prior to their approval by the Board of Directors, focusing on:
o Major judgmental areas
o Significant adjustments resulting from the audit
o Going concern assumption
o Any changes in accounting policies and practices
o Compliance with applicable accounting standards
o Compliance with Code of Corporate Governance Regulations 2017 and other statutory and regulatory requirements; and
o All related party transactions
• Review of preliminary announcements of results prior to external communication and publication
Audit Committee
• Facilitating the external audit and discussion with external auditors of major observations arising from interim and final audits and any matter that the auditors may wish to highlight (in the absence of management, where necessary)
• Review of management letter issued by external auditors and management’s response thereto
• Ensuring coordination between the Internal and External Auditors of the Company
• Review of the scope and extent of internal audit, audit plan, reporting framework and procedures and ensuring that the internal audit function has adequate resources and is appropriately placed within the Company
• Consideration of major findings of internal investigations of activities characterized by fraud, corruption and abuse of power and management’s response thereto
• Ascertaining that the internal control systems including financial and operational controls, accounting systems for timely and appropriate recording of
purchases and sales, receipts and payments, assets and liabilities and the reporting structure are adequate and effective
• Review of the Company’s statement on internal control systems prior to endorsement by the Board of Directors and internal audit reports
• Instituting special projects, value for money studies or other investigations on any matter specified by the Board of Directors, in consultation with the Chief Executive Officer and to consider remittance of any matter to the external auditors or to any other external body
• Determination of compliance with relevant statutory requirements
• Monitoring compliance with the Code of Corporate Governance Regulations 2017 and identification of significant violations thereof
• Review of arrangement for staff and management to report to audit committee in confidence, concerns, if any, about actual or potential improprieties in financial and other matters and
Board Committees
27Annual Report 2018
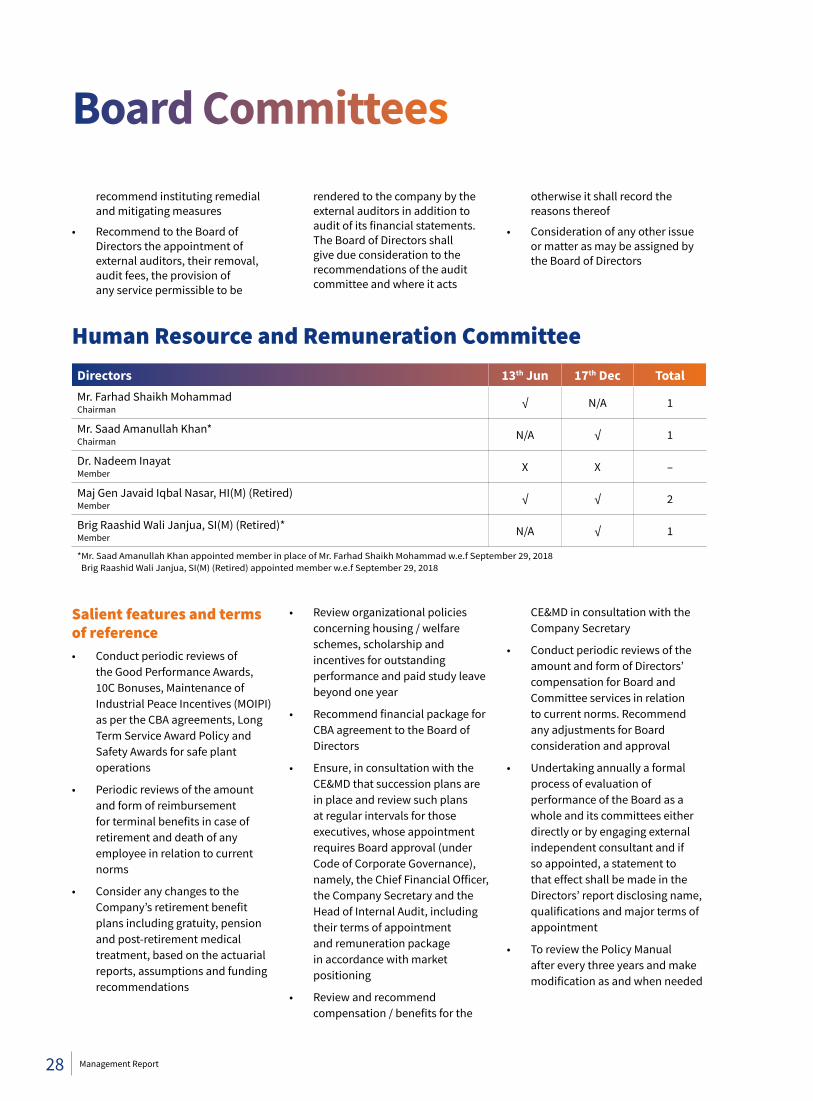
Directors 13th Jun 17th Dec TotalMr. Farhad Shaikh MohammadChairman √ N/A 1
Mr. Saad Amanullah Khan*Chairman N/A √ 1
Dr. Nadeem InayatMember X X –
Maj Gen Javaid Iqbal Nasar, HI(M) (Retired)Member √ √ 2
Brig Raashid Wali Janjua, SI(M) (Retired)*Member N/A √ 1
*Mr. Saad Amanullah Khan appointed member in place of Mr. Farhad Shaikh Mohammad w.e.f September 29, 2018 Brig Raashid Wali Janjua, SI(M) (Retired) appointed member w.e.f September 29, 2018
Human Resource and Remuneration Committee
recommend instituting remedial and mitigating measures
• Recommend to the Board of Directors the appointment of external auditors, their removal, audit fees, the provision of any service permissible to be
rendered to the company by the external auditors in addition to audit of its financial statements. The Board of Directors shall give due consideration to the recommendations of the audit committee and where it acts
otherwise it shall record the reasons thereof
• Consideration of any other issue or matter as may be assigned by the Board of Directors
Salient features and terms of reference• Conduct periodic reviews of
the Good Performance Awards, 10C Bonuses, Maintenance of Industrial Peace Incentives (MOIPI) as per the CBA agreements, Long Term Service Award Policy and Safety Awards for safe plant operations
• Periodic reviews of the amount and form of reimbursement for terminal benefits in case of retirement and death of any employee in relation to current norms
• Consider any changes to the Company’s retirement benefit plans including gratuity, pension and post-retirement medical treatment, based on the actuarial reports, assumptions and funding recommendations
• Review organizational policies concerning housing / welfare schemes, scholarship and incentives for outstanding performance and paid study leave beyond one year
• Recommend financial package for CBA agreement to the Board of Directors
• Ensure, in consultation with the CE&MD that succession plans are in place and review such plans at regular intervals for those executives, whose appointment requires Board approval (under Code of Corporate Governance), namely, the Chief Financial Officer, the Company Secretary and the Head of Internal Audit, including their terms of appointment and remuneration package in accordance with market positioning
• Review and recommend compensation / benefits for the
CE&MD in consultation with the Company Secretary
• Conduct periodic reviews of the amount and form of Directors’ compensation for Board and Committee services in relation to current norms. Recommend any adjustments for Board consideration and approval
• Undertaking annually a formal process of evaluation of performance of the Board as a whole and its committees either directly or by engaging external independent consultant and if so appointed, a statement to that effect shall be made in the Directors’ report disclosing name, qualifications and major terms of appointment
• To review the Policy Manual after every three years and make modification as and when needed
Board Committees
28 Management Report
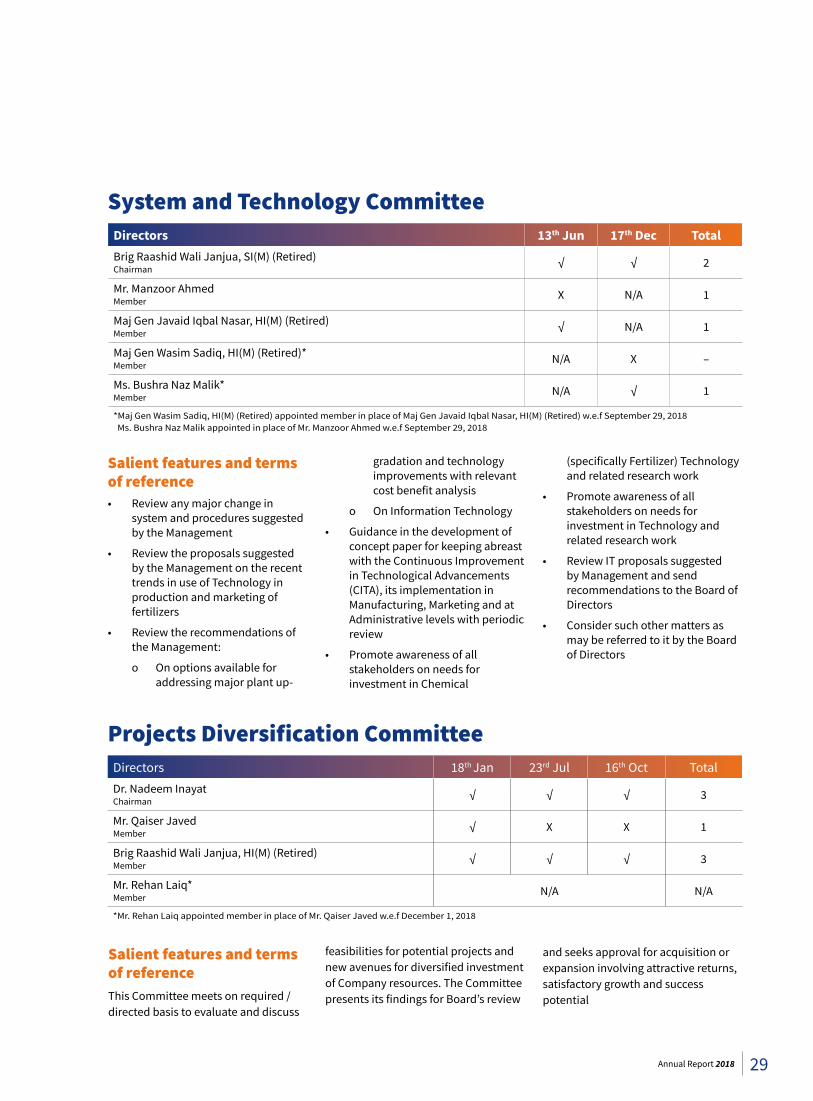
System and Technology Committee
Salient features and terms of reference• Review any major change in
system and procedures suggested by the Management
• Review the proposals suggested by the Management on the recent trends in use of Technology in production and marketing of fertilizers
• Review the recommendations of the Management:
o On options available for addressing major plant up-
gradation and technology improvements with relevant cost benefit analysis
o On Information Technology
• Guidance in the development of concept paper for keeping abreast with the Continuous Improvement in Technological Advancements (CITA), its implementation in Manufacturing, Marketing and at Administrative levels with periodic review
• Promote awareness of all stakeholders on needs for investment in Chemical
(specifically Fertilizer) Technology and related research work
• Promote awareness of all stakeholders on needs for investment in Technology and related research work
• Review IT proposals suggested by Management and send recommendations to the Board of Directors
• Consider such other matters as may be referred to it by the Board of Directors
Projects Diversification Committee
Salient features and terms of referenceThis Committee meets on required / directed basis to evaluate and discuss
Directors 18th Jan 23rd Jul 16th Oct TotalDr. Nadeem InayatChairman √ √ √ 3
Mr. Qaiser JavedMember √ X X 1
Brig Raashid Wali Janjua, HI(M) (Retired)Member √ √ √ 3
Mr. Rehan Laiq* Member N/A N/A
*Mr. Rehan Laiq appointed member in place of Mr. Qaiser Javed w.e.f December 1, 2018
Directors 13th Jun 17th Dec TotalBrig Raashid Wali Janjua, SI(M) (Retired)Chairman √ √ 2
Mr. Manzoor AhmedMember X N/A 1
Maj Gen Javaid Iqbal Nasar, HI(M) (Retired)Member √ N/A 1
Maj Gen Wasim Sadiq, HI(M) (Retired)*Member N/A X –
Ms. Bushra Naz Malik*Member N/A √ 1
*Maj Gen Wasim Sadiq, HI(M) (Retired) appointed member in place of Maj Gen Javaid Iqbal Nasar, HI(M) (Retired) w.e.f September 29, 2018 Ms. Bushra Naz Malik appointed in place of Mr. Manzoor Ahmed w.e.f September 29, 2018
feasibilities for potential projects and new avenues for diversified investment of Company resources. The Committee presents its findings for Board’s review
and seeks approval for acquisition or expansion involving attractive returns, satisfactory growth and success potential
29Annual Report 2018
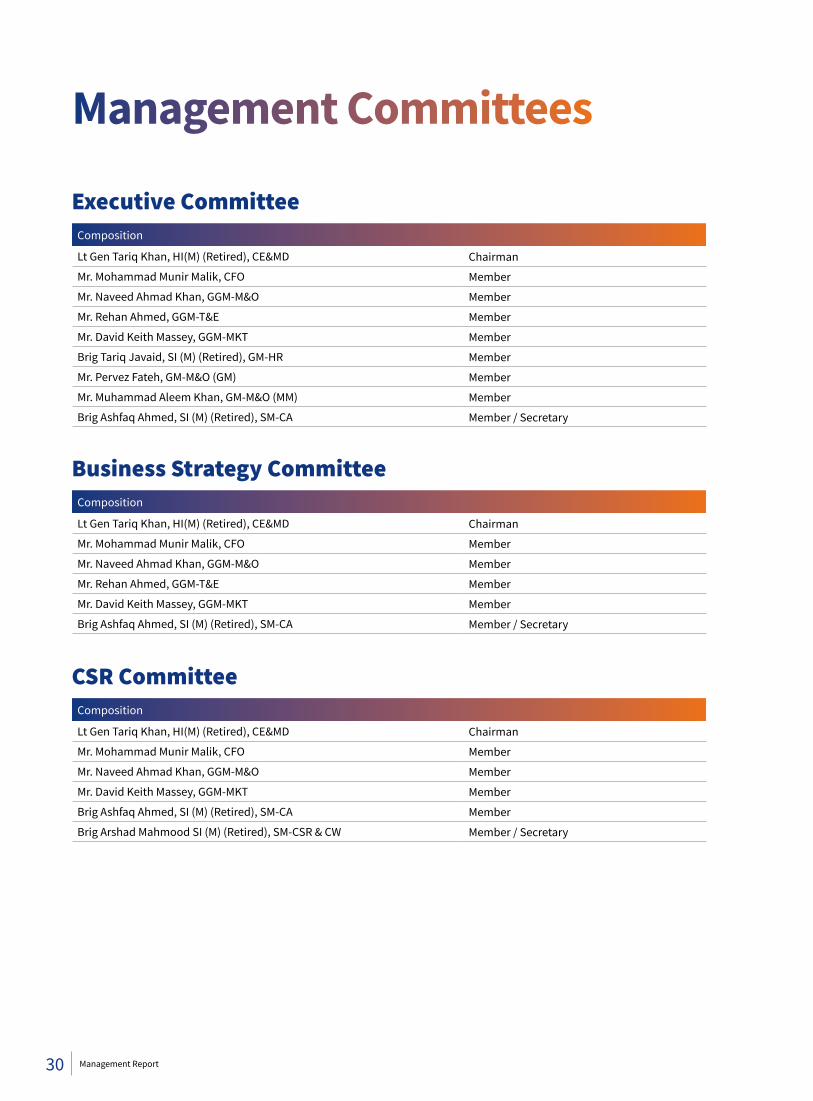
Executive Committee
Business Strategy Committee
CSR Committee
Management Committees
Composition
Lt Gen Tariq Khan, HI(M) (Retired), CE&MD Chairman
Mr. Mohammad Munir Malik, CFO Member
Mr. Naveed Ahmad Khan, GGM-M&O Member
Mr. Rehan Ahmed, GGM-T&E Member
Mr. David Keith Massey, GGM-MKT Member
Brig Tariq Javaid, SI (M) (Retired), GM-HR Member
Mr. Pervez Fateh, GM-M&O (GM) Member
Mr. Muhammad Aleem Khan, GM-M&O (MM) Member
Brig Ashfaq Ahmed, SI (M) (Retired), SM-CA Member / Secretary
Composition
Lt Gen Tariq Khan, HI(M) (Retired), CE&MD Chairman
Mr. Mohammad Munir Malik, CFO Member
Mr. Naveed Ahmad Khan, GGM-M&O Member
Mr. Rehan Ahmed, GGM-T&E Member
Mr. David Keith Massey, GGM-MKT Member
Brig Ashfaq Ahmed, SI (M) (Retired), SM-CA Member / Secretary
Composition
Lt Gen Tariq Khan, HI(M) (Retired), CE&MD Chairman
Mr. Mohammad Munir Malik, CFO Member
Mr. Naveed Ahmad Khan, GGM-M&O Member
Mr. David Keith Massey, GGM-MKT Member
Brig Ashfaq Ahmed, SI (M) (Retired), SM-CA Member
Brig Arshad Mahmood SI (M) (Retired), SM-CSR & CW Member / Secretary
30 Management Report
31Annual Report 2018
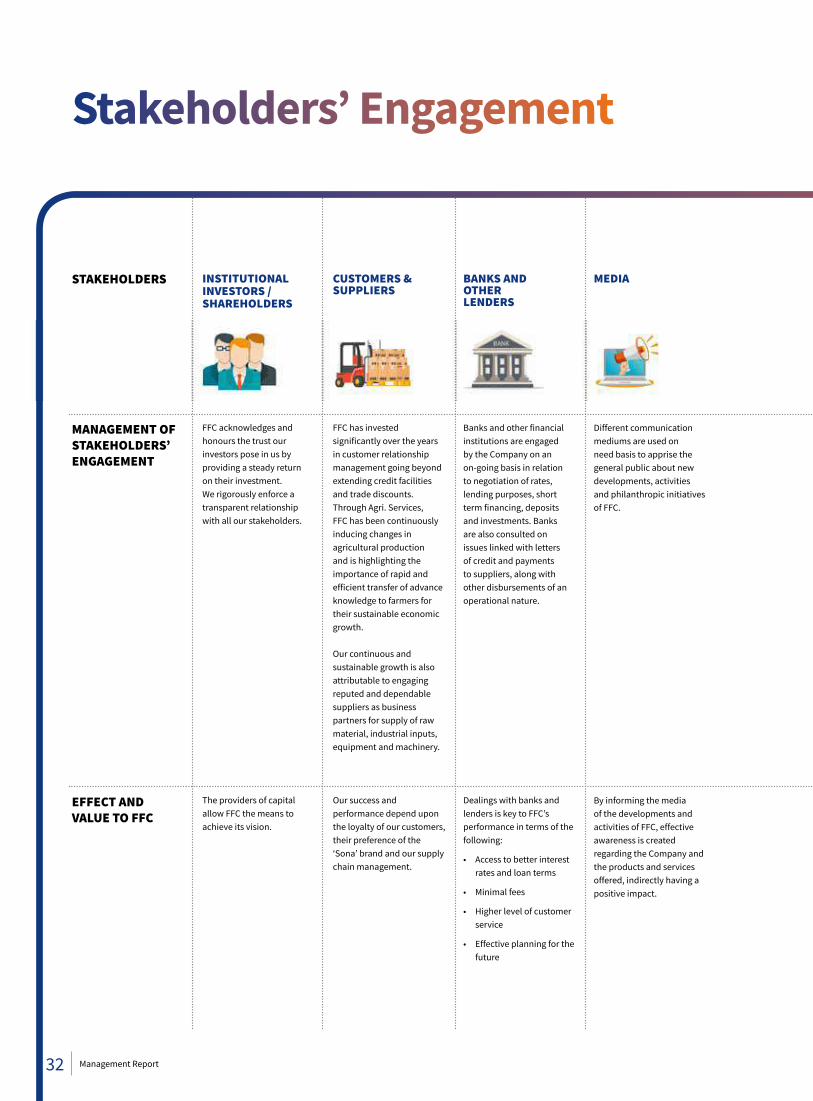
Stakeholders’ Engagement
STAKEHOLDERS
MANAGEMENT OF STAKEHOLDERS’ ENGAGEMENT
EFFECT AND VALUE TO FFC
INSTITUTIONAL INVESTORS / SHAREHOLDERS
CUSTOMERS & SUPPLIERS
BANKS AND OTHER LENDERS
MEDIA
FFC acknowledges and honours the trust our investors pose in us by providing a steady return on their investment. We rigorously enforce a transparent relationship with all our stakeholders.
The providers of capital allow FFC the means to achieve its vision.
Our success and performance depend upon the loyalty of our customers, their preference of the ‘Sona’ brand and our supply chain management.
Dealings with banks and lenders is key to FFC’s performance in terms of the following:
• Access to better interest rates and loan terms
• Minimal fees
• Higher level of customer service
• Effective planning for the future
FFC has invested significantly over the years in customer relationship management going beyond extending credit facilities and trade discounts. Through Agri. Services, FFC has been continuously inducing changes in agricultural production and is highlighting the importance of rapid and efficient transfer of advance knowledge to farmers for their sustainable economic growth.
Our continuous and sustainable growth is also attributable to engaging reputed and dependable suppliers as business partners for supply of raw material, industrial inputs, equipment and machinery.
Banks and other financial institutions are engaged by the Company on an on-going basis in relation to negotiation of rates, lending purposes, short term financing, deposits and investments. Banks are also consulted on issues linked with letters of credit and payments to suppliers, along with other disbursements of an operational nature.
Different communication mediums are used on need basis to apprise the general public about new developments, activities and philanthropic initiatives of FFC.
By informing the media of the developments and activities of FFC, effective awareness is created regarding the Company and the products and services offered, indirectly having a positive impact.
32 Management Report
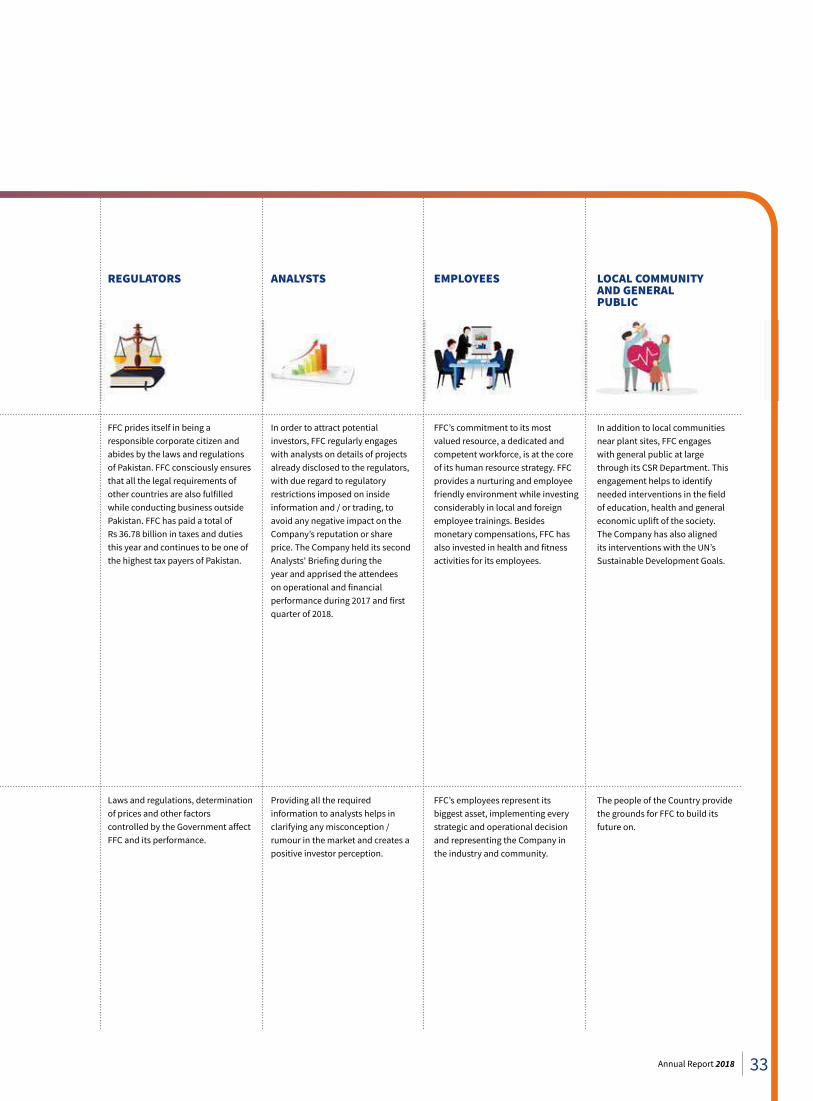
REGULATORS ANALYSTS EMPLOYEES LOCAL COMMUNITY AND GENERAL PUBLIC
FFC prides itself in being a responsible corporate citizen and abides by the laws and regulations of Pakistan. FFC consciously ensures that all the legal requirements of other countries are also fulfilled while conducting business outside Pakistan. FFC has paid a total of Rs 36.78 billion in taxes and duties this year and continues to be one of the highest tax payers of Pakistan.
Laws and regulations, determination of prices and other factors controlled by the Government affect FFC and its performance.
In order to attract potential investors, FFC regularly engages with analysts on details of projects already disclosed to the regulators, with due regard to regulatory restrictions imposed on inside information and / or trading, to avoid any negative impact on the Company’s reputation or share price. The Company held its second Analysts' Briefing during the year and apprised the attendees on operational and financial performance during 2017 and first quarter of 2018.
Providing all the required information to analysts helps in clarifying any misconception / rumour in the market and creates a positive investor perception.
FFC’s commitment to its most valued resource, a dedicated and competent workforce, is at the core of its human resource strategy. FFC provides a nurturing and employee friendly environment while investing considerably in local and foreign employee trainings. Besides monetary compensations, FFC has also invested in health and fitness activities for its employees.
FFC’s employees represent its biggest asset, implementing every strategic and operational decision and representing the Company in the industry and community.
In addition to local communities near plant sites, FFC engages with general public at large through its CSR Department. This engagement helps to identify needed interventions in the field of education, health and general economic uplift of the society. The Company has also aligned its interventions with the UN’s Sustainable Development Goals.
The people of the Country provide the grounds for FFC to build its future on.
33Annual Report 2018
Notice of Annual General Meeting
Notice is hereby given that the 41st Annual General Meeting of the shareholders of Fauji Fertilizer Company Limited will be held at FFC Head Office, 156 The Mall, Rawalpindi on Tuesday, March 26, 2019 at 1000 hours to transact the following business:
Ordinary Business 1. To confirm the minutes of Extraordinary General Meeting held on September 28, 2018.
2. To consider, approve and adopt separate and consolidated audited financial statements of FFC together with Directors’ Reports on separate and consolidated financial statements and Auditors’ Reports thereon for the year ended December 31, 2018.
3. To appoint Auditors for the year 2019 and to fix their remuneration. (The retiring Auditors M/s KPMG Taseer Hadi & Co., Chartered Accountants being eligible have offered themselves for
re-appointment for the year 2019. Besides this, a notice has been received from a member in terms of Section 246(3) of the Companies Act 2017, recommending appointment of M/s A.F.Ferguson & Co, Chartered Accountants as Auditors of the Company, in place of retiring Auditors at the Annual General Meeting of the Company).
4. To consider and approve payment of Final Dividend for the year ended December 31, 2018 as recommended by the Board of Directors.
5. To transact any other business with the permission of the Chair.
By Order of the Board
Rawalpindi Brig Ashfaq Ahmed SI (M) (Retired)March 04, 2019 Company Secretary
E-VotingMembers can exercise their right to poll subject to meeting of requirement of Section 143-145 of the Companies Act, 2017 and applicable clauses of Companies (Postal Ballot) Regulations, 2018.
Video Conference FacilityPursuant to Section 132(2) of the Companies Act 2017, if the Company receives consent from members holding in aggregate 10% or more shareholding residing at geographical location, to
participate in the meeting through video conference at least 7 days prior to the date of meeting, the Company will arrange video conference facility in that city subject to availability of such facility in that city.
Notes:1. The share transfer books of the
Company will remain closed from March 20, 2019 to March 26, 2019 (both days inclusive) and no request for transfer of shares will be accepted for registration. Transfers received at Company’s Share Registrar namely Central Depository Company of Pakistan
Limited, Shares Registrar Department, CDC House 99-B, Block ‘B’ S.M.C.H.S, Main Shahra-e-Faisal Karachi-74400 by the close of business on March 19, 2019 will be considered in time for the purpose of payment of final dividend to the transferees.
2. A member of the Company entitled to attend and vote at the Meeting may appoint a person /representative as proxy to attend and vote in place of the member. Proxies in order to be effective must be received at the Company’s Registered Office, 156-The Mall, Rawalpindi, Pakistan not later than
34 Management Report
48 hours before the time of holding the Meeting and no account shall be taken of any part of the day that is not a working day. A member shall not be entitled to appoint more than one proxy.
3. Any Individual Beneficial Owner
of CDC, entitled to vote at this Meeting, must bring his / her original Computerized National Identity Card (CNIC) to prove identity, and in case of proxy, a copy of shareholder’s attested CNIC must be attached with the proxy form. Representatives of corporate members should bring the usual documents required for such purpose.
CDC Account Holders will also have to follow the under mentioned guidelines as laid down in Circular 1 dated January 26, 2000 issued by the Securities and Exchange Commission of Pakistan (SECP).
A. For attending the Meeting:
i. In case of individuals, the account holder or sub-account holder and / or the person, whose securities are in group account and their registration details are uploaded as per the regulations, shall authenticate identity by showing his / her original Computerized National Identity Card (CNIC) or original passport at the time of attending the Meeting.
ii. Members registered on CDC are also requested to bring their particulars, I.D. Numbers and account numbers in CDS.
iii. In case of corporate entity, the Board of Directors’ resolution / power of attorney with specimen signature of the nominee shall be produced (unless it has been provided earlier) at the time of Meeting.
B. For appointing proxies:
i. In case of individuals, the account holder or sub-account holder and / or the person whose securities are in group account and their registration detail is uploaded as per the regulations, shall submit the proxy form as per the above requirement.
ii. The proxy form shall be witnessed by the person whose name, address and CNIC number shall be mentioned on the form.
iii. Attested copies of CNIC or the passport of the beneficial owners and the proxy shall be furnished with the proxy form.
iv. The proxy shall produce his / her original CNIC or original passport at the time of Meeting.
v. In case of corporate entity, the Board of Directors’ resolution / power of attorney with specimen signature shall be submitted (unless it has been provided earlier) along with proxy form to the Company.
4. Consent for video conference facility
As allowed by Section 132(2) of the Companies Act 2017 members can avail video conference facility for this Annual General Meeting, at Lahore and Karachi provided the Company receives consent from the members holding in aggregate 10% or more shareholding, residing at above mentioned locations, at least 7 days prior to date of the meeting.
Subject to the fulfillment of the above conditions, members shall be informed of the venue, 5 days before the date of the General Meeting along with complete
information necessary to access the facility.
In this regard please send a duly signed request as per following format at the registered address of the Company 7 days before holding of General Meeting.
I/We,_________________________________________ of ________________________, being a member of Fauji Fertilizer Company Limited, holder of ____________________ Ordinary Share(s) as per Register Folio / CDC Account No __________________ hereby opt for video conference facility at __________________.
_________________ Signature of member
5. Withholding Tax on dividends
Pursuant to the provisions of the Finance Act 2017 effective July 1, 2017, the rates of deduction of income tax from dividend payments under the Income Tax Ordinance, 2001 have been revised as under:-
(a) For filers of income tax returns: 15%
(b) For non-filers of income tax returns: 20%
To enable the Company to make tax deduction on the amount of cash dividend @ 15% instead of 20%, all the shareholders whose names are not entered into the Active Tax-payers List (ATL) provided on the website of FBR, despite the fact that they are filers, are advised to make sure that their names are entered into ATL before the date for approval of the cash dividend i.e. March 26, 2019; otherwise tax on their cash dividend will be deducted @ 20% instead of 15%.
35Annual Report 2018
The corporate shareholders having CDC accounts are required to have their National Tax Numbers (NTNs) updated with their respective participants, whereas corporate physical shareholders should send a copy of their NTN certificate to the Company or its Share Registrar i.e. Central Depository Company of Pakistan Limited, Shares Registrar Department, CDC House 99-B, Block ‘B’ S.M.C.H.S, Main Shahra-e-Faisal Karachi-74400. The shareholders while sending NTN or NTN certificates, as the case may be, must quote Company name and their respective folio numbers.
Tax in case of Joint Shareholders
The FBR vide its clarification letter No. I(54) Exp/2014-132872-R of September 25, 2014 has clarified that holders of shares held in joint names or joint accounts will be treated individually as filers or non-filers and tax will be deducted according to the proportionate holding of each shareholder.
Joint shareholders should intimate the proportion of their respective joint holding to the share registrar latest by March 19, 2019, in the following form
CDC
Account number
Folio # Total Shares
Principle shareholder Joint Shareholder
Name & CNIC Shareholding proportion
Name & CNIC Shareholding proportion
6. Under the provisions of Section 242 of the Companies Act, 2017, it is mandatory for a listed Company to pay cash dividend to its shareholders only through electronic mode directly into bank account designated by the entitled shareholders. In order to receive dividends directly into their bank account, shareholders are requested to fill in Electronic Credit Mandate Form available on Company’s website and send it duly signed along with a copy of CNIC to the Registrar of the
having opted to receive such communication in electronic format. Other members who wish to receive the Annual Report 2018 in electronic form may file an application as per the format provided on the Company’s website in compliance with the subject SRO. The members who have provided consent to receive Annual Report 2018 through email can subsequently request a hard copy which shall be provided free of cost within seven days.
Members are also requested to intimate any change in their registered email addresses on a timely manner, to ensure effective communication by the Company.
9. Annual Audited Financial Statements of the Company for the financial year ended December 31, 2018 have also been provided on the Company’s website i.e.
www.ffc.com.pk
10. For any further assistance, the members may contact the Company or the Share Registrar at the following phone numbers, email addresses:
FFC Shares Department Telephone: 92-51-8453235 Email: [email protected]
Central Depository Company of Pakistan Limited
Shares Registrar Department, CDC House 99-B, Block ‘B’
S.M.C.H.S, Main Shahra-e-Faisal Karachi-74400 Telephone: 0800-23275 Email: [email protected]
Company M/s. Central Depository Company of Pakistan Limited, Shares Registrar Department, CDC House 99-B, Block ‘B’ S.M.C.H.S, Main Shahra-e-Faisal Karachi in case of physical shares. In case shares are held in CDC then Electronic Credit Mandate Form must be submitted directly to shareholder’s broker/participant/CDC account services.
Electronic mandate formFolio Number
Name of Shareholder
Title of the Bank Account
International Bank Account Number (IBAN)
Name of Bank
Name of Bank Branch and Address
Cellular & Landline Number of Shareholder
CNIC / NTN number (attach copy)
Signature of Shareholder
7. SECP through its SRO 470(1)/2016,
dated May 31, 2016, has allowed companies to circulate the annual balance sheet, profit and loss account, auditors’ report and Directors’ report etc (“annual audited accounts”) to its members through CD/DVD/USB at their registered addresses. In view of the above, the Company has sent its Annual Report 2018 to its shareholders in the form of CD. Any member requiring printed copy of Annual Report 2018 may send a request using a Standard Request Form placed on Company website.
8. Members are hereby informed that pursuant to SECP SRO 787(1)/2014 dated September 8, 2014, and under Section 223(6) of the Companies Act 2017, circulation of Audited Financial Statements and Notice of Annual General Meeting has been allowed in electronic format through email.
In compliance with the above requirements, soft copies of the Annual Report 2018 are being emailed to the members
Notice of Annual General Meeting
36 Management Report
37Annual Report 2018
38 Management Report
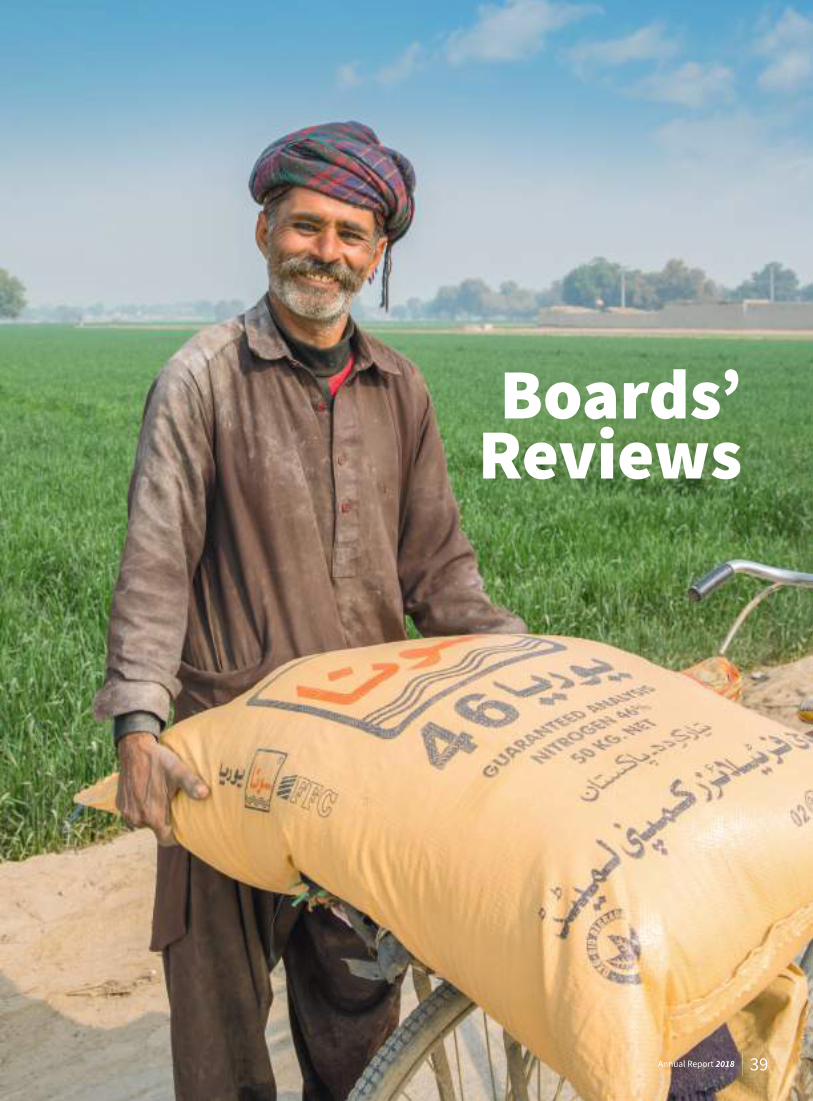
Boards’ Reviews
39Annual Report 2018
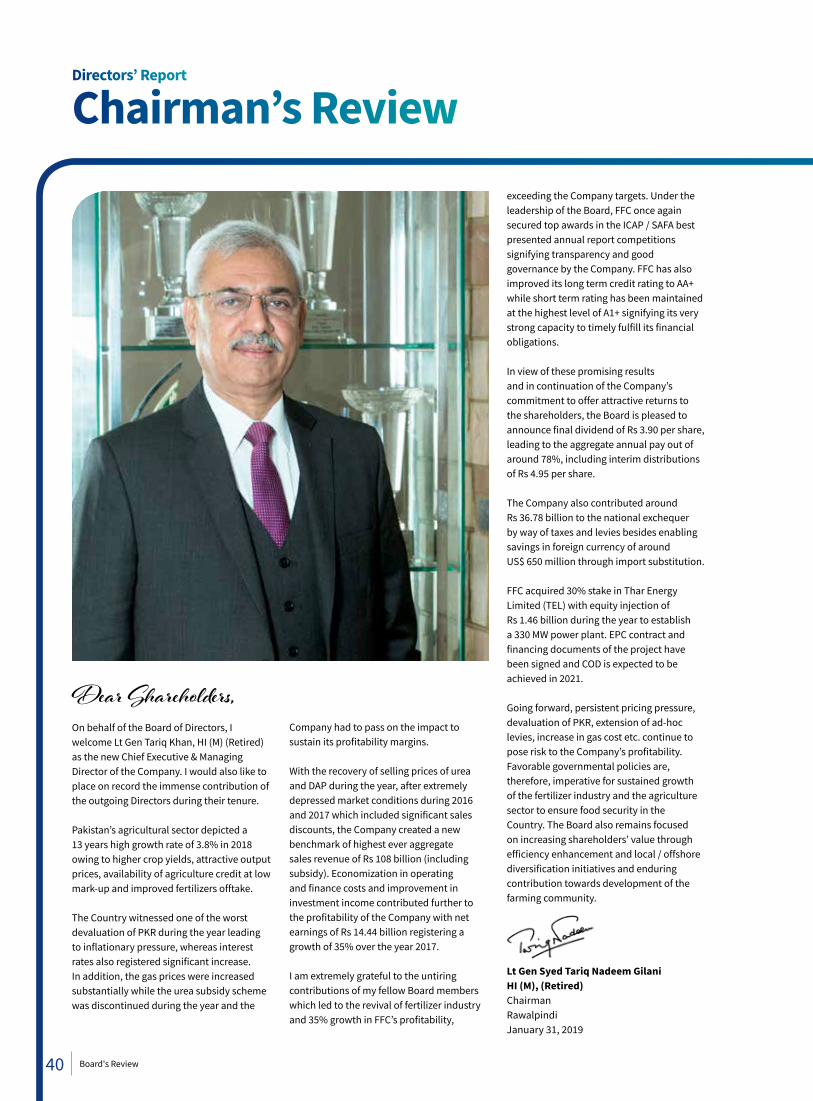
Directors’ Report
Dear Shareholders,On behalf of the Board of Directors, I welcome Lt Gen Tariq Khan, HI (M) (Retired) as the new Chief Executive & Managing Director of the Company. I would also like to place on record the immense contribution of the outgoing Directors during their tenure.
Pakistan’s agricultural sector depicted a 13 years high growth rate of 3.8% in 2018 owing to higher crop yields, attractive output prices, availability of agriculture credit at low mark-up and improved fertilizers offtake.
The Country witnessed one of the worst devaluation of PKR during the year leading to inflationary pressure, whereas interest rates also registered significant increase. In addition, the gas prices were increased substantially while the urea subsidy scheme was discontinued during the year and the
exceeding the Company targets. Under the leadership of the Board, FFC once again secured top awards in the ICAP / SAFA best presented annual report competitions signifying transparency and good governance by the Company. FFC has also improved its long term credit rating to AA+ while short term rating has been maintained at the highest level of A1+ signifying its very strong capacity to timely fulfill its financial obligations.
In view of these promising results and in continuation of the Company’s commitment to offer attractive returns to the shareholders, the Board is pleased to announce final dividend of Rs 3.90 per share, leading to the aggregate annual pay out of around 78%, including interim distributions of Rs 4.95 per share.
The Company also contributed around Rs 36.78 billion to the national exchequer by way of taxes and levies besides enabling savings in foreign currency of around US$ 650 million through import substitution.
FFC acquired 30% stake in Thar Energy Limited (TEL) with equity injection of Rs 1.46 billion during the year to establish a 330 MW power plant. EPC contract and financing documents of the project have been signed and COD is expected to be achieved in 2021.
Going forward, persistent pricing pressure, devaluation of PKR, extension of ad-hoc levies, increase in gas cost etc. continue to pose risk to the Company’s profitability. Favorable governmental policies are, therefore, imperative for sustained growth of the fertilizer industry and the agriculture sector to ensure food security in the Country. The Board also remains focused on increasing shareholders’ value through efficiency enhancement and local / offshore diversification initiatives and enduring contribution towards development of the farming community.
Lt Gen Syed Tariq Nadeem Gilani HI (M), (Retired)ChairmanRawalpindiJanuary 31, 2019
Chairman’s Review
Company had to pass on the impact to sustain its profitability margins.
With the recovery of selling prices of urea and DAP during the year, after extremely depressed market conditions during 2016 and 2017 which included significant sales discounts, the Company created a new benchmark of highest ever aggregate sales revenue of Rs 108 billion (including subsidy). Economization in operating and finance costs and improvement in investment income contributed further to the profitability of the Company with net earnings of Rs 14.44 billion registering a growth of 35% over the year 2017.
I am extremely grateful to the untiring contributions of my fellow Board members which led to the revival of fertilizer industry and 35% growth in FFC’s profitability,
40 Board's Review
41Annual Report 2018
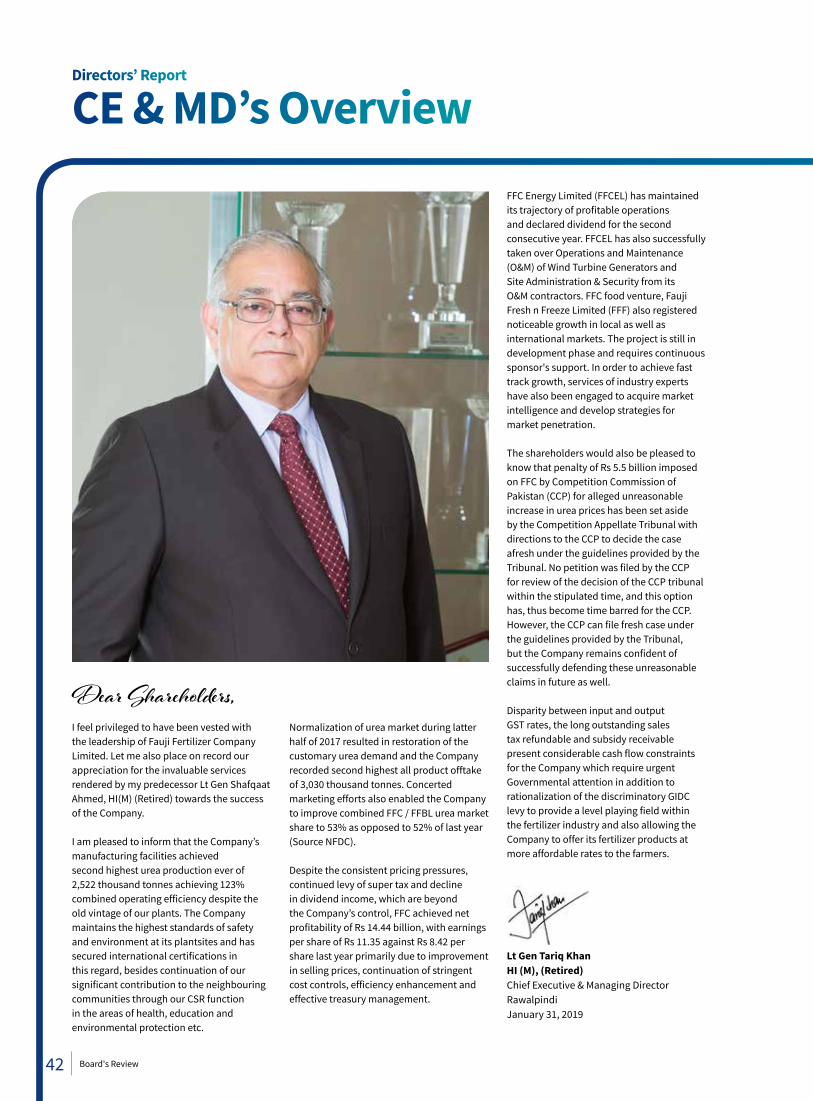
Dear Shareholders,I feel privileged to have been vested with the leadership of Fauji Fertilizer Company Limited. Let me also place on record our appreciation for the invaluable services rendered by my predecessor Lt Gen Shafqaat Ahmed, HI(M) (Retired) towards the success of the Company.
I am pleased to inform that the Company’s manufacturing facilities achieved second highest urea production ever of 2,522 thousand tonnes achieving 123% combined operating efficiency despite the old vintage of our plants. The Company maintains the highest standards of safety and environment at its plantsites and has secured international certifications in this regard, besides continuation of our significant contribution to the neighbouring communities through our CSR function in the areas of health, education and environmental protection etc.
Normalization of urea market during latter half of 2017 resulted in restoration of the customary urea demand and the Company recorded second highest all product offtake of 3,030 thousand tonnes. Concerted marketing efforts also enabled the Company to improve combined FFC / FFBL urea market share to 53% as opposed to 52% of last year (Source NFDC).
Despite the consistent pricing pressures, continued levy of super tax and decline in dividend income, which are beyond the Company’s control, FFC achieved net profitability of Rs 14.44 billion, with earnings per share of Rs 11.35 against Rs 8.42 per share last year primarily due to improvement in selling prices, continuation of stringent cost controls, efficiency enhancement and effective treasury management.
Directors’ Report
CE & MD’s OverviewFFC Energy Limited (FFCEL) has maintained its trajectory of profitable operations and declared dividend for the second consecutive year. FFCEL has also successfully taken over Operations and Maintenance (O&M) of Wind Turbine Generators and Site Administration & Security from its O&M contractors. FFC food venture, Fauji Fresh n Freeze Limited (FFF) also registered noticeable growth in local as well as international markets. The project is still in development phase and requires continuous sponsor's support. In order to achieve fast track growth, services of industry experts have also been engaged to acquire market intelligence and develop strategies for market penetration.
The shareholders would also be pleased to know that penalty of Rs 5.5 billion imposed on FFC by Competition Commission of Pakistan (CCP) for alleged unreasonable increase in urea prices has been set aside by the Competition Appellate Tribunal with directions to the CCP to decide the case afresh under the guidelines provided by the Tribunal. No petition was filed by the CCP for review of the decision of the CCP tribunal within the stipulated time, and this option has, thus become time barred for the CCP. However, the CCP can file fresh case under the guidelines provided by the Tribunal, but the Company remains confident of successfully defending these unreasonable claims in future as well.
Disparity between input and output GST rates, the long outstanding sales tax refundable and subsidy receivable present considerable cash flow constraints for the Company which require urgent Governmental attention in addition to rationalization of the discriminatory GIDC levy to provide a level playing field within the fertilizer industry and also allowing the Company to offer its fertilizer products at more affordable rates to the farmers.
Lt Gen Tariq Khan HI (M), (Retired)Chief Executive & Managing DirectorRawalpindiJanuary 31, 2019
42 Board's Review
43Annual Report 2018

FFC PerformanceProfit or Loss AnalysisThe Company achieved all its major targets for 2018 in terms of production, sales, revenues, finance cost and investment income, thus attaining a profitability of Rs 14.44 billion as compared to Rs 10.71 billion earned last year.
Dividend income, which is beyond the Company’s control, registered a decline compared to 2017 and restricted the profitability growth to 35% against last year. The growth in profitability was further impacted by continued levy of Super Tax besides additional tax burden on imported fertilizers due to implementation of Minimum Tax regime.
The increased disparity between GST rates, with output GST brought down to 2% by Finance Act 2018 while keeping the input GST rates between 5% to 17%, negatively affected Company’s cash flows. The increasing balance of unadjusted GST and long
outstanding subsidy receivables led to further opportunity costs to FFC.
Sona urea production by the three plants recorded second highest output ever of 2,522 thousand tonnes, only one thousand tonne short of highest ever production of 2,523 thousand tonnes achieved in 2016.
Sona urea sales recorded at 2,527 thousand tonnes were 6% lower than last year owing to lower product availability, which comprised of current year’s Sona urea production and a minimal inventory of 8 thousand tonnes carried over from last year.
The Company improved its combined FFC / FFBL urea market share to 53% as opposed to 52% last year owing to brand preference by the customers, whereas combined DAP market share stood at 52%, compared to 56% in 2017. (Source: NFDC)
FFC also achieved a new benchmark in terms of highest ever sales revenue, which exceeded Rs 100 billion mark for
the very first time and stood at Rs 105.96 billion, 17% higher than last year.
The revival of urea selling prices after two years of depressed market conditions resulted in increased Sona urea revenue of Rs 73.86 billion.
Revenue from imported fertilizers stood at Rs 32.10 billion registering an increase of 27% over last year due to better selling prices.
Aggregate cost of sales of Sona urea and imported fertilizers, recorded at Rs 77.99 billion, was 7% above last year.
Urea cost of sales stood at Rs 51.47 billion and was almost in line with last year mainly due to lower sales volume and continued cost controls being implemented by the Company. However, urea production cost at Rs 51.39 billion increased by 7% primarily due to substantial hike in gas rates during the last quarter of 2018, general inflation and significant Rupee devaluation during the year.
Directors’ Report
Financial Capital
44 Board's Review
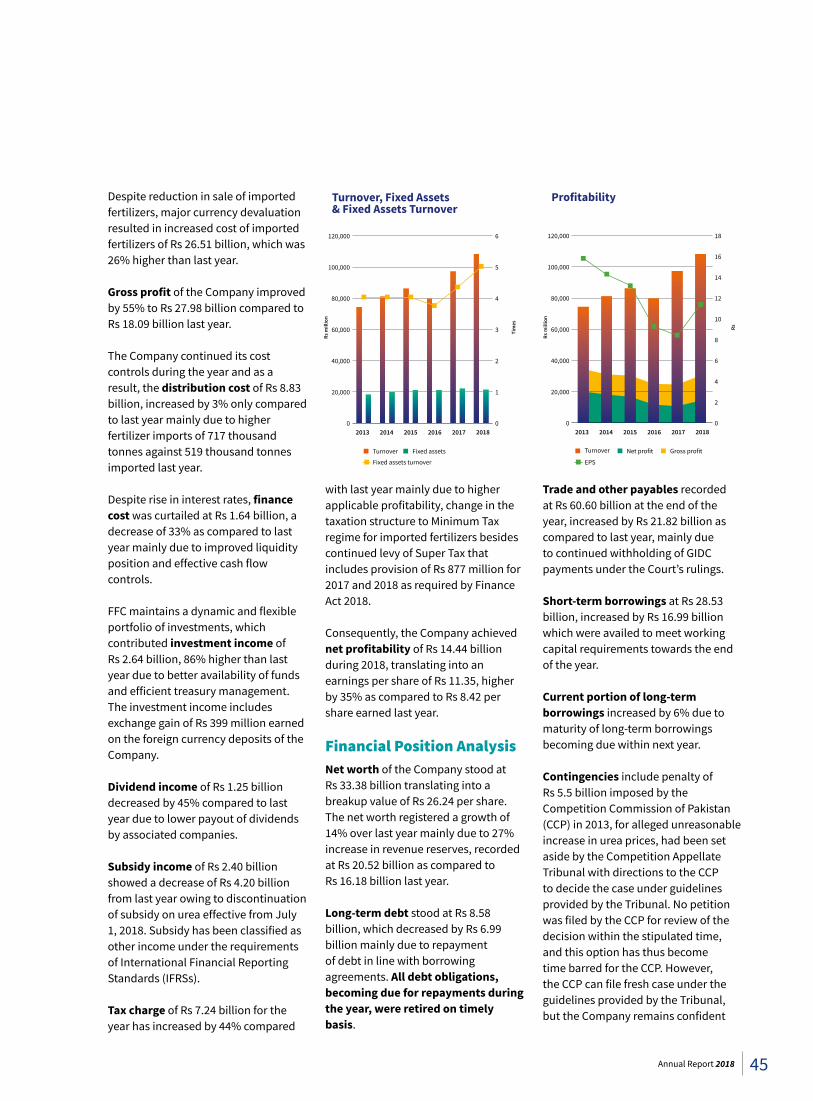
Despite reduction in sale of imported fertilizers, major currency devaluation resulted in increased cost of imported fertilizers of Rs 26.51 billion, which was 26% higher than last year. Gross profit of the Company improved by 55% to Rs 27.98 billion compared to Rs 18.09 billion last year.
The Company continued its cost controls during the year and as a result, the distribution cost of Rs 8.83 billion, increased by 3% only compared to last year mainly due to higher fertilizer imports of 717 thousand tonnes against 519 thousand tonnes imported last year.
Despite rise in interest rates, finance cost was curtailed at Rs 1.64 billion, a decrease of 33% as compared to last year mainly due to improved liquidity position and effective cash flow controls.
FFC maintains a dynamic and flexible portfolio of investments, which contributed investment income of Rs 2.64 billion, 86% higher than last year due to better availability of funds and efficient treasury management. The investment income includes exchange gain of Rs 399 million earned on the foreign currency deposits of the Company.
Dividend income of Rs 1.25 billion decreased by 45% compared to last year due to lower payout of dividends by associated companies.
Subsidy income of Rs 2.40 billion showed a decrease of Rs 4.20 billion from last year owing to discontinuation of subsidy on urea effective from July 1, 2018. Subsidy has been classified as other income under the requirements of International Financial Reporting Standards (IFRSs).
Tax charge of Rs 7.24 billion for the year has increased by 44% compared
with last year mainly due to higher applicable profitability, change in the taxation structure to Minimum Tax regime for imported fertilizers besides continued levy of Super Tax that includes provision of Rs 877 million for 2017 and 2018 as required by Finance Act 2018.
Consequently, the Company achieved net profitability of Rs 14.44 billion during 2018, translating into an earnings per share of Rs 11.35, higher by 35% as compared to Rs 8.42 per share earned last year.
Financial Position AnalysisNet worth of the Company stood at Rs 33.38 billion translating into a breakup value of Rs 26.24 per share. The net worth registered a growth of 14% over last year mainly due to 27% increase in revenue reserves, recorded at Rs 20.52 billion as compared toRs 16.18 billion last year.
Long-term debt stood at Rs 8.58 billion, which decreased by Rs 6.99 billion mainly due to repayment of debt in line with borrowing agreements. All debt obligations, becoming due for repayments during the year, were retired on timely basis.
Trade and other payables recorded at Rs 60.60 billion at the end of the year, increased by Rs 21.82 billion as compared to last year, mainly due to continued withholding of GIDC payments under the Court’s rulings.
Short-term borrowings at Rs 28.53 billion, increased by Rs 16.99 billion which were availed to meet working capital requirements towards the end of the year.
Current portion of long-term borrowings increased by 6% due to maturity of long-term borrowings becoming due within next year.
Contingencies include penalty of Rs 5.5 billion imposed by the Competition Commission of Pakistan (CCP) in 2013, for alleged unreasonable increase in urea prices, had been set aside by the Competition Appellate Tribunal with directions to the CCP to decide the case under guidelines provided by the Tribunal. No petition was filed by the CCP for review of the decision within the stipulated time, and this option has thus become time barred for the CCP. However, the CCP can file fresh case under the guidelines provided by the Tribunal, but the Company remains confident
2017 20182013 2014 2015 2016
Rs m
illio
n
Tim
es
Turnover Fixed assets
Fixed assets turnover
Turnover, Fixed Assets& Fixed Assets Turnover
0
20,000
40,000
60,000
80,000
100,000
120,000
0
1
2
3
4
5
6
2017 20182013 2014 2015 2016
Rs m
illio
n
Rs
Profitability
Turnover Net profit Gross profit
EPS
0
20,000
40,000
60,000
80,000
100,000
120,000
0
2
4
6
8
10
12
14
16
18
45Annual Report 2018
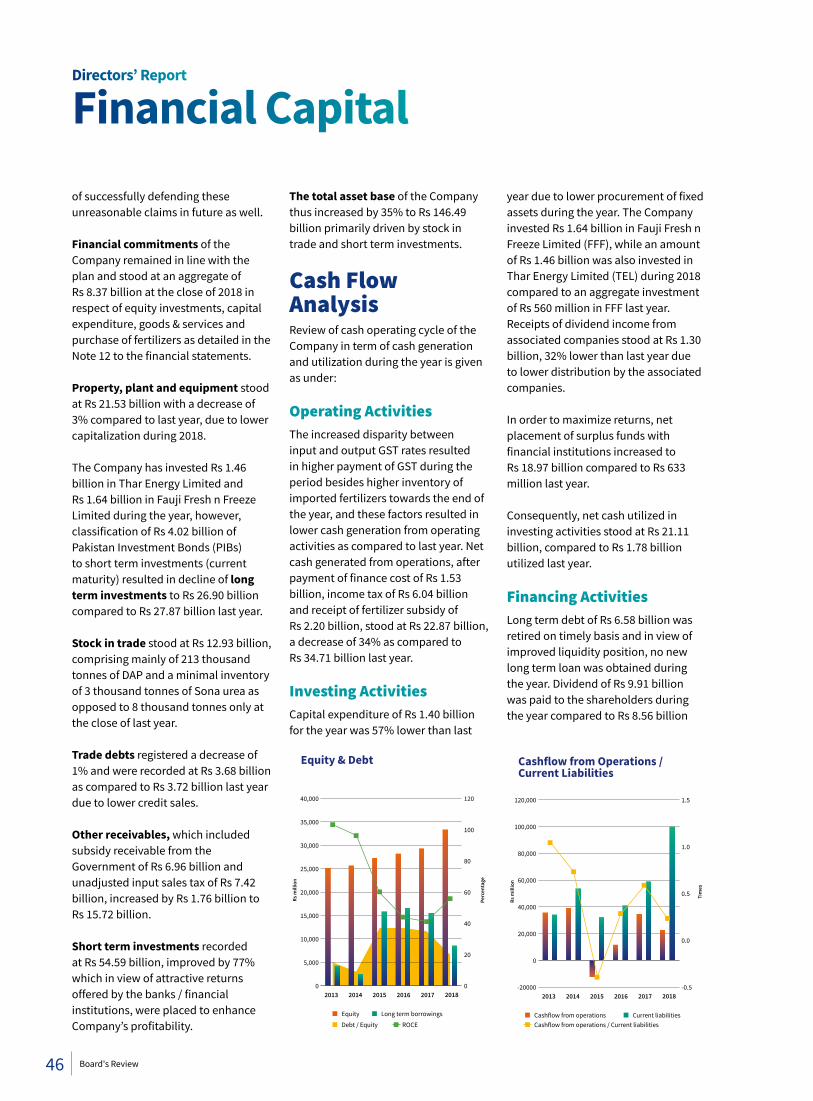
of successfully defending these unreasonable claims in future as well.
Financial commitments of the Company remained in line with the plan and stood at an aggregate of Rs 8.37 billion at the close of 2018 in respect of equity investments, capital expenditure, goods & services and purchase of fertilizers as detailed in the Note 12 to the financial statements.
Property, plant and equipment stood at Rs 21.53 billion with a decrease of 3% compared to last year, due to lower capitalization during 2018.
The Company has invested Rs 1.46 billion in Thar Energy Limited and Rs 1.64 billion in Fauji Fresh n Freeze Limited during the year, however, classification of Rs 4.02 billion of Pakistan Investment Bonds (PIBs) to short term investments (current maturity) resulted in decline of long term investments to Rs 26.90 billion compared to Rs 27.87 billion last year.
Stock in trade stood at Rs 12.93 billion, comprising mainly of 213 thousand tonnes of DAP and a minimal inventory of 3 thousand tonnes of Sona urea as opposed to 8 thousand tonnes only at the close of last year.
Trade debts registered a decrease of 1% and were recorded at Rs 3.68 billion as compared to Rs 3.72 billion last year due to lower credit sales.
Other receivables, which included subsidy receivable from the Government of Rs 6.96 billion and unadjusted input sales tax of Rs 7.42 billion, increased by Rs 1.76 billion to Rs 15.72 billion.
Short term investments recorded at Rs 54.59 billion, improved by 77% which in view of attractive returns offered by the banks / financial institutions, were placed to enhance Company’s profitability.
The total asset base of the Company thus increased by 35% to Rs 146.49 billion primarily driven by stock in trade and short term investments.
Cash Flow AnalysisReview of cash operating cycle of the Company in term of cash generation and utilization during the year is given as under:
Operating ActivitiesThe increased disparity between input and output GST rates resulted in higher payment of GST during the period besides higher inventory of imported fertilizers towards the end of the year, and these factors resulted in lower cash generation from operating activities as compared to last year. Net cash generated from operations, after payment of finance cost of Rs 1.53 billion, income tax of Rs 6.04 billion and receipt of fertilizer subsidy of Rs 2.20 billion, stood at Rs 22.87 billion, a decrease of 34% as compared to Rs 34.71 billion last year.
Investing ActivitiesCapital expenditure of Rs 1.40 billion for the year was 57% lower than last
year due to lower procurement of fixed assets during the year. The Company invested Rs 1.64 billion in Fauji Fresh n Freeze Limited (FFF), while an amount of Rs 1.46 billion was also invested in Thar Energy Limited (TEL) during 2018 compared to an aggregate investment of Rs 560 million in FFF last year. Receipts of dividend income from associated companies stood at Rs 1.30 billion, 32% lower than last year due to lower distribution by the associated companies.
In order to maximize returns, net placement of surplus funds with financial institutions increased to Rs 18.97 billion compared to Rs 633 million last year.
Consequently, net cash utilized in investing activities stood at Rs 21.11 billion, compared to Rs 1.78 billion utilized last year.
Financing ActivitiesLong term debt of Rs 6.58 billion was retired on timely basis and in view of improved liquidity position, no new long term loan was obtained during the year. Dividend of Rs 9.91 billion was paid to the shareholders during the year compared to Rs 8.56 billion
Directors’ Report
Financial Capital
2017 20182013 2014 2015 2016
Rs m
illio
n
Perc
enta
ge
Equity & Debt
Equity Long term borrowings
Debt / Equity ROCE
0
5,000
10,000
15,000
20,000
25,000
30,000
35,000
40,000
0
20
40
60
80
100
120
Cashflow from Operations /Current Liabilities
Cashflow from operations Current liabilitiesCashflow from operations / Current liabilities
2017 20182013 2014 2015 2016
Rs m
illio
n
Tim
es
-20000
0
20,000
40,000
60,000
80,000
100,000
120,000
-0.5
0.0
0.5
1.0
1.5
46 Board's Review
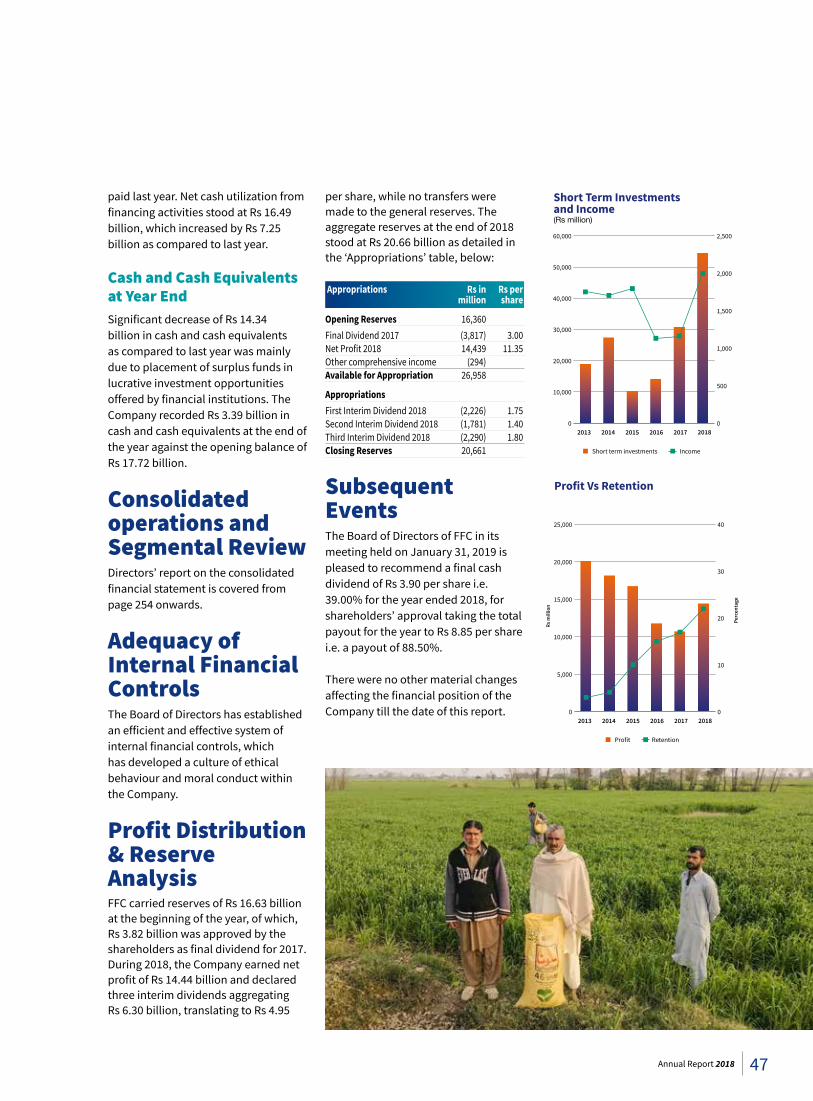
paid last year. Net cash utilization from financing activities stood at Rs 16.49 billion, which increased by Rs 7.25 billion as compared to last year.
Cash and Cash Equivalents at Year EndSignificant decrease of Rs 14.34 billion in cash and cash equivalents as compared to last year was mainly due to placement of surplus funds in lucrative investment opportunities offered by financial institutions. The Company recorded Rs 3.39 billion in cash and cash equivalents at the end of the year against the opening balance of Rs 17.72 billion.
Consolidated operations and Segmental ReviewDirectors’ report on the consolidated financial statement is covered from page 254 onwards.
Adequacy of Internal Financial ControlsThe Board of Directors has established an efficient and effective system of internal financial controls, which has developed a culture of ethical behaviour and moral conduct within the Company.
Profit Distribution & Reserve AnalysisFFC carried reserves of Rs 16.63 billion at the beginning of the year, of which, Rs 3.82 billion was approved by the shareholders as final dividend for 2017. During 2018, the Company earned net profit of Rs 14.44 billion and declared three interim dividends aggregating Rs 6.30 billion, translating to Rs 4.95
per share, while no transfers were made to the general reserves. The aggregate reserves at the end of 2018 stood at Rs 20.66 billion as detailed in the ‘Appropriations’ table, below:
Appropriations Rs in Rs per million share
Opening Reserves 16,360 Final Dividend 2017 (3,817) 3.00 Net Profit 2018 14,439 11.35 Other comprehensive income (294) Available for Appropriation 26,958
Appropriations First Interim Dividend 2018 (2,226) 1.75 Second Interim Dividend 2018 (1,781) 1.40 Third Interim Dividend 2018 (2,290) 1.80 Closing Reserves 20,661
Subsequent Events The Board of Directors of FFC in its meeting held on January 31, 2019 is pleased to recommend a final cash dividend of Rs 3.90 per share i.e. 39.00% for the year ended 2018, for shareholders’ approval taking the total payout for the year to Rs 8.85 per share i.e. a payout of 88.50%.
There were no other material changes affecting the financial position of the Company till the date of this report.
2017 20182013 2014 2015 20160
10,000
20,000
30,000
40,000
50,000
60,000
0
500
1,000
1,500
2,000
2,500
Short Term Investmentsand Income(Rs million)
IncomeShort term investments
2017 20182013 2014 2015 20160
5,000
10,000
15,000
20,000
25,000
0
10
20
30
40
Profit Vs Retention
Profit Retention
Rs m
illio
n
Perc
enta
ge
47Annual Report 2018
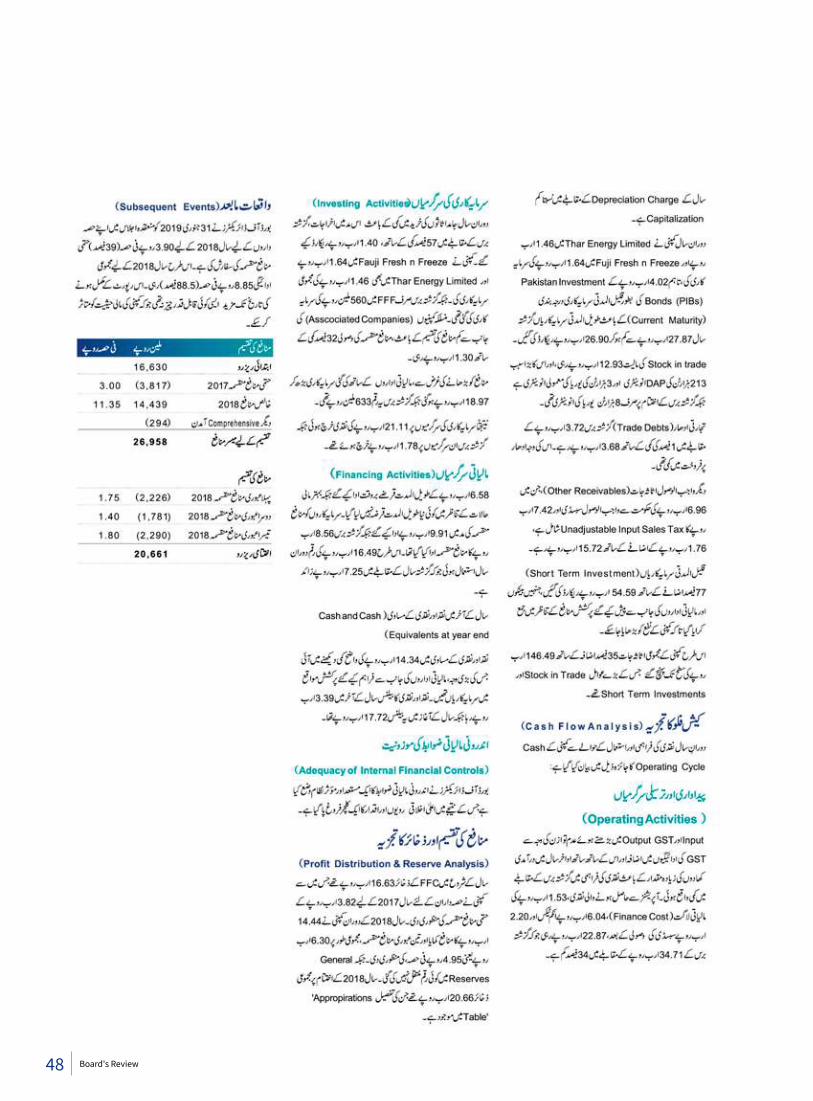
48 Board's Review
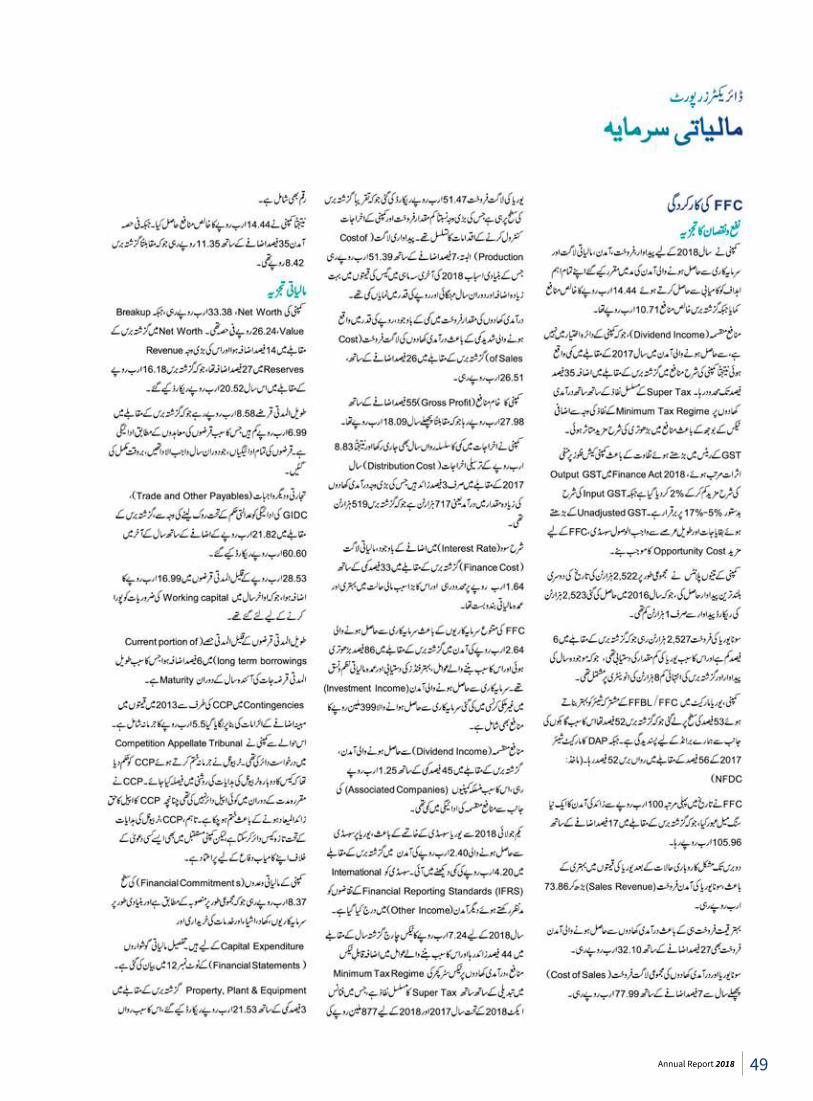
49Annual Report 2018
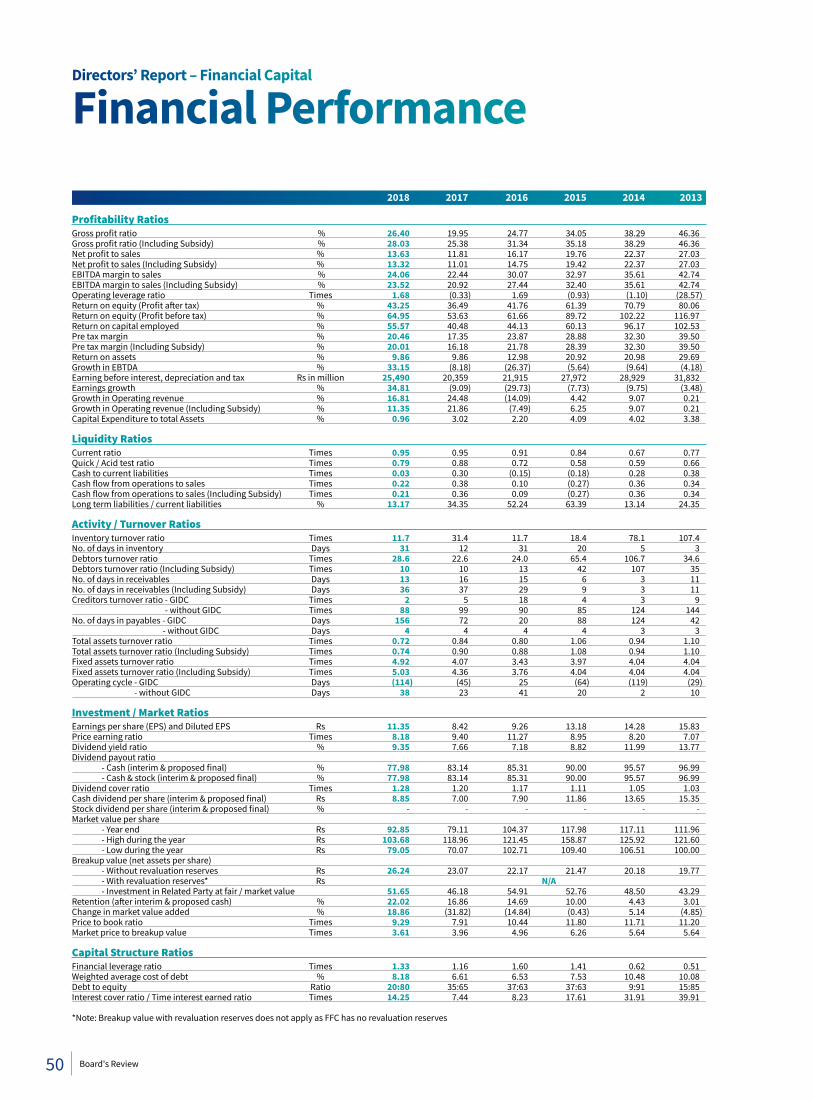
2018 2017 2016 2015 2014 2013
Profitability Ratios Gross profit ratio % 26.40 19.95 24.77 34.05 38.29 46.36 Gross profit ratio (Including Subsidy) % 28.03 25.38 31.34 35.18 38.29 46.36 Net profit to sales % 13.63 11.81 16.17 19.76 22.37 27.03 Net profit to sales (Including Subsidy) % 13.32 11.01 14.75 19.42 22.37 27.03 EBITDA margin to sales % 24.06 22.44 30.07 32.97 35.61 42.74 EBITDA margin to sales (Including Subsidy) % 23.52 20.92 27.44 32.40 35.61 42.74 Operating leverage ratio Times 1.68 (0.33) 1.69 (0.93) (1.10) (28.57)Return on equity (Profit after tax) % 43.25 36.49 41.76 61.39 70.79 80.06 Return on equity (Profit before tax) % 64.95 53.63 61.66 89.72 102.22 116.97 Return on capital employed % 55.57 40.48 44.13 60.13 96.17 102.53 Pre tax margin % 20.46 17.35 23.87 28.88 32.30 39.50 Pre tax margin (Including Subsidy) % 20.01 16.18 21.78 28.39 32.30 39.50 Return on assets % 9.86 9.86 12.98 20.92 20.98 29.69 Growth in EBTDA % 33.15 (8.18) (26.37) (5.64) (9.64) (4.18)Earning before interest, depreciation and tax Rs in million 25,490 20,359 21,915 27,972 28,929 31,832 Earnings growth % 34.81 (9.09) (29.73) (7.73) (9.75) (3.48)Growth in Operating revenue % 16.81 24.48 (14.09) 4.42 9.07 0.21 Growth in Operating revenue (Including Subsidy) % 11.35 21.86 (7.49) 6.25 9.07 0.21 Capital Expenditure to total Assets % 0.96 3.02 2.20 4.09 4.02 3.38 Liquidity Ratios Current ratio Times 0.95 0.95 0.91 0.84 0.67 0.77 Quick / Acid test ratio Times 0.79 0.88 0.72 0.58 0.59 0.66 Cash to current liabilities Times 0.03 0.30 (0.15) (0.18) 0.28 0.38 Cash flow from operations to sales Times 0.22 0.38 0.10 (0.27) 0.36 0.34 Cash flow from operations to sales (Including Subsidy) Times 0.21 0.36 0.09 (0.27) 0.36 0.34 Long term liabilities / current liabilities % 13.17 34.35 52.24 63.39 13.14 24.35 Activity / Turnover Ratios Inventory turnover ratio Times 11.7 31.4 11.7 18.4 78.1 107.4 No. of days in inventory Days 31 12 31 20 5 3 Debtors turnover ratio Times 28.6 22.6 24.0 65.4 106.7 34.6 Debtors turnover ratio (Including Subsidy) Times 10 10 13 42 107 35 No. of days in receivables Days 13 16 15 6 3 11 No. of days in receivables (Including Subsidy) Days 36 37 29 9 3 11 Creditors turnover ratio - GIDC Times 2 5 18 4 3 9 - without GIDC Times 88 99 90 85 124 144 No. of days in payables - GIDC Days 156 72 20 88 124 42 - without GIDC Days 4 4 4 4 3 3 Total assets turnover ratio Times 0.72 0.84 0.80 1.06 0.94 1.10 Total assets turnover ratio (Including Subsidy) Times 0.74 0.90 0.88 1.08 0.94 1.10 Fixed assets turnover ratio Times 4.92 4.07 3.43 3.97 4.04 4.04 Fixed assets turnover ratio (Including Subsidy) Times 5.03 4.36 3.76 4.04 4.04 4.04 Operating cycle - GIDC Days (114) (45) 25 (64) (119) (29) - without GIDC Days 38 23 41 20 2 10 Investment / Market Ratios Earnings per share (EPS) and Diluted EPS Rs 11.35 8.42 9.26 13.18 14.28 15.83 Price earning ratio Times 8.18 9.40 11.27 8.95 8.20 7.07 Dividend yield ratio % 9.35 7.66 7.18 8.82 11.99 13.77 Dividend payout ratio - Cash (interim & proposed final) % 77.98 83.14 85.31 90.00 95.57 96.99 - Cash & stock (interim & proposed final) % 77.98 83.14 85.31 90.00 95.57 96.99 Dividend cover ratio Times 1.28 1.20 1.17 1.11 1.05 1.03 Cash dividend per share (interim & proposed final) Rs 8.85 7.00 7.90 11.86 13.65 15.35 Stock dividend per share (interim & proposed final) % - - - - - - Market value per share - Year end Rs 92.85 79.11 104.37 117.98 117.11 111.96 - High during the year Rs 103.68 118.96 121.45 158.87 125.92 121.60 - Low during the year Rs 79.05 70.07 102.71 109.40 106.51 100.00 Breakup value (net assets per share) - Without revaluation reserves Rs 26.24 23.07 22.17 21.47 20.18 19.77 - With revaluation reserves* Rs N/A - Investment in Related Party at fair / market value 51.65 46.18 54.91 52.76 48.50 43.29 Retention (after interim & proposed cash) % 22.02 16.86 14.69 10.00 4.43 3.01 Change in market value added % 18.86 (31.82) (14.84) (0.43) 5.14 (4.85)Price to book ratio Times 9.29 7.91 10.44 11.80 11.71 11.20 Market price to breakup value Times 3.61 3.96 4.96 6.26 5.64 5.64 Capital Structure Ratios Financial leverage ratio Times 1.33 1.16 1.60 1.41 0.62 0.51 Weighted average cost of debt % 8.18 6.61 6.53 7.53 10.48 10.08 Debt to equity Ratio 20:80 35:65 37:63 37:63 9:91 15:85 Interest cover ratio / Time interest earned ratio Times 14.25 7.44 8.23 17.61 31.91 39.91 *Note: Breakup value with revaluation reserves does not apply as FFC has no revaluation reserves
Directors’ Report – Financial Capital
Financial Performance
50 Board's Review
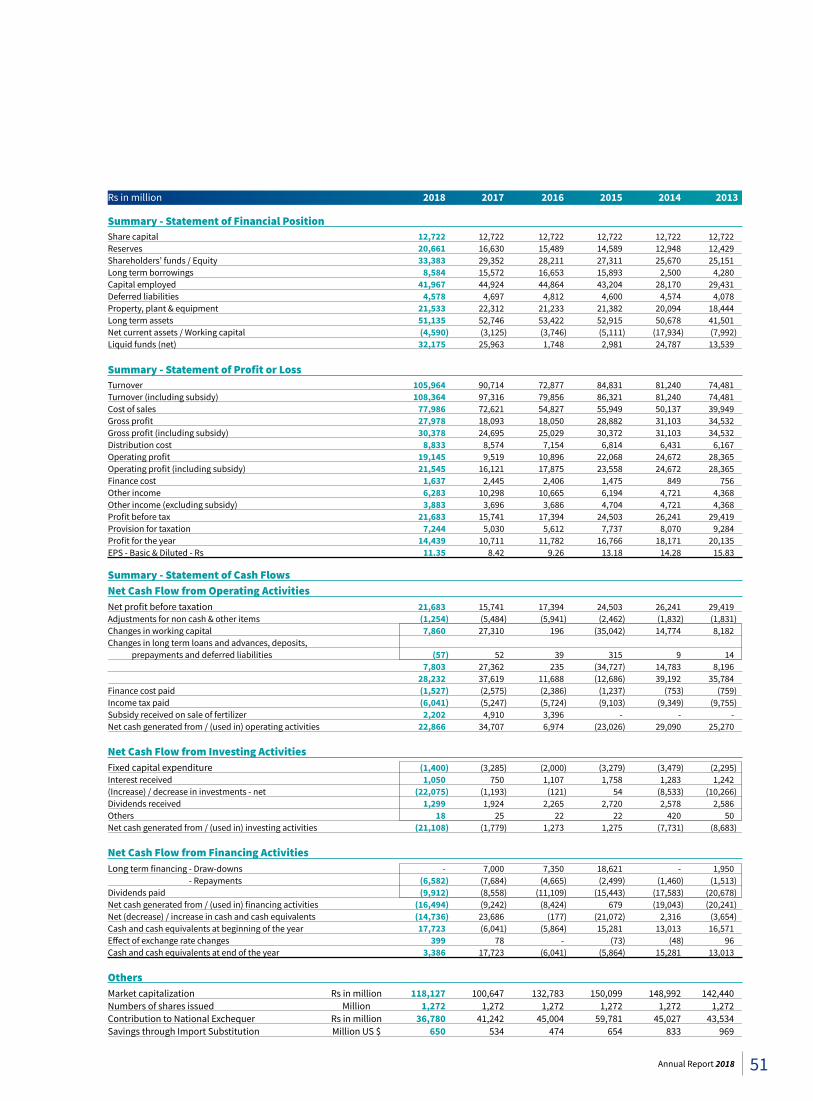
Rs in million 2018 2017 2016 2015 2014 2013
Summary - Statement of Financial Position Share capital 12,722 12,722 12,722 12,722 12,722 12,722 Reserves 20,661 16,630 15,489 14,589 12,948 12,429 Shareholders’ funds / Equity 33,383 29,352 28,211 27,311 25,670 25,151 Long term borrowings 8,584 15,572 16,653 15,893 2,500 4,280 Capital employed 41,967 44,924 44,864 43,204 28,170 29,431 Deferred liabilities 4,578 4,697 4,812 4,600 4,574 4,078 Property, plant & equipment 21,533 22,312 21,233 21,382 20,094 18,444 Long term assets 51,135 52,746 53,422 52,915 50,678 41,501 Net current assets / Working capital (4,590) (3,125) (3,746) (5,111) (17,934) (7,992)Liquid funds (net) 32,175 25,963 1,748 2,981 24,787 13,539
Summary - Statement of Profit or Loss Turnover 105,964 90,714 72,877 84,831 81,240 74,481 Turnover (including subsidy) 108,364 97,316 79,856 86,321 81,240 74,481 Cost of sales 77,986 72,621 54,827 55,949 50,137 39,949 Gross profit 27,978 18,093 18,050 28,882 31,103 34,532 Gross profit (including subsidy) 30,378 24,695 25,029 30,372 31,103 34,532 Distribution cost 8,833 8,574 7,154 6,814 6,431 6,167 Operating profit 19,145 9,519 10,896 22,068 24,672 28,365 Operating profit (including subsidy) 21,545 16,121 17,875 23,558 24,672 28,365 Finance cost 1,637 2,445 2,406 1,475 849 756 Other income 6,283 10,298 10,665 6,194 4,721 4,368 Other income (excluding subsidy) 3,883 3,696 3,686 4,704 4,721 4,368 Profit before tax 21,683 15,741 17,394 24,503 26,241 29,419 Provision for taxation 7,244 5,030 5,612 7,737 8,070 9,284 Profit for the year 14,439 10,711 11,782 16,766 18,171 20,135 EPS - Basic & Diluted - Rs 11.35 8.42 9.26 13.18 14.28 15.83
Summary - Statement of Cash Flows Net Cash Flow from Operating Activities Net profit before taxation 21,683 15,741 17,394 24,503 26,241 29,419 Adjustments for non cash & other items (1,254) (5,484) (5,941) (2,462) (1,832) (1,831)Changes in working capital 7,860 27,310 196 (35,042) 14,774 8,182 Changes in long term loans and advances, deposits, prepayments and deferred liabilities (57) 52 39 315 9 14 7,803 27,362 235 (34,727) 14,783 8,196 28,232 37,619 11,688 (12,686) 39,192 35,784 Finance cost paid (1,527) (2,575) (2,386) (1,237) (753) (759)Income tax paid (6,041) (5,247) (5,724) (9,103) (9,349) (9,755)Subsidy received on sale of fertilizer 2,202 4,910 3,396 - - - Net cash generated from / (used in) operating activities 22,866 34,707 6,974 (23,026) 29,090 25,270
Net Cash Flow from Investing Activities Fixed capital expenditure (1,400) (3,285) (2,000) (3,279) (3,479) (2,295)Interest received 1,050 750 1,107 1,758 1,283 1,242 (Increase) / decrease in investments - net (22,075) (1,193) (121) 54 (8,533) (10,266)Dividends received 1,299 1,924 2,265 2,720 2,578 2,586 Others 18 25 22 22 420 50 Net cash generated from / (used in) investing activities (21,108) (1,779) 1,273 1,275 (7,731) (8,683) Net Cash Flow from Financing Activities Long term financing - Draw-downs - 7,000 7,350 18,621 - 1,950 - Repayments (6,582) (7,684) (4,665) (2,499) (1,460) (1,513)Dividends paid (9,912) (8,558) (11,109) (15,443) (17,583) (20,678)Net cash generated from / (used in) financing activities (16,494) (9,242) (8,424) 679 (19,043) (20,241)Net (decrease) / increase in cash and cash equivalents (14,736) 23,686 (177) (21,072) 2,316 (3,654)Cash and cash equivalents at beginning of the year 17,723 (6,041) (5,864) 15,281 13,013 16,571 Effect of exchange rate changes 399 78 - (73) (48) 96 Cash and cash equivalents at end of the year 3,386 17,723 (6,041) (5,864) 15,281 13,013 Others Market capitalization Rs in million 118,127 100,647 132,783 150,099 148,992 142,440 Numbers of shares issued Million 1,272 1,272 1,272 1,272 1,272 1,272 Contribution to National Exchequer Rs in million 36,780 41,242 45,004 59,781 45,027 43,534 Savings through Import Substitution Million US $ 650 534 474 654 833 969
51Annual Report 2018
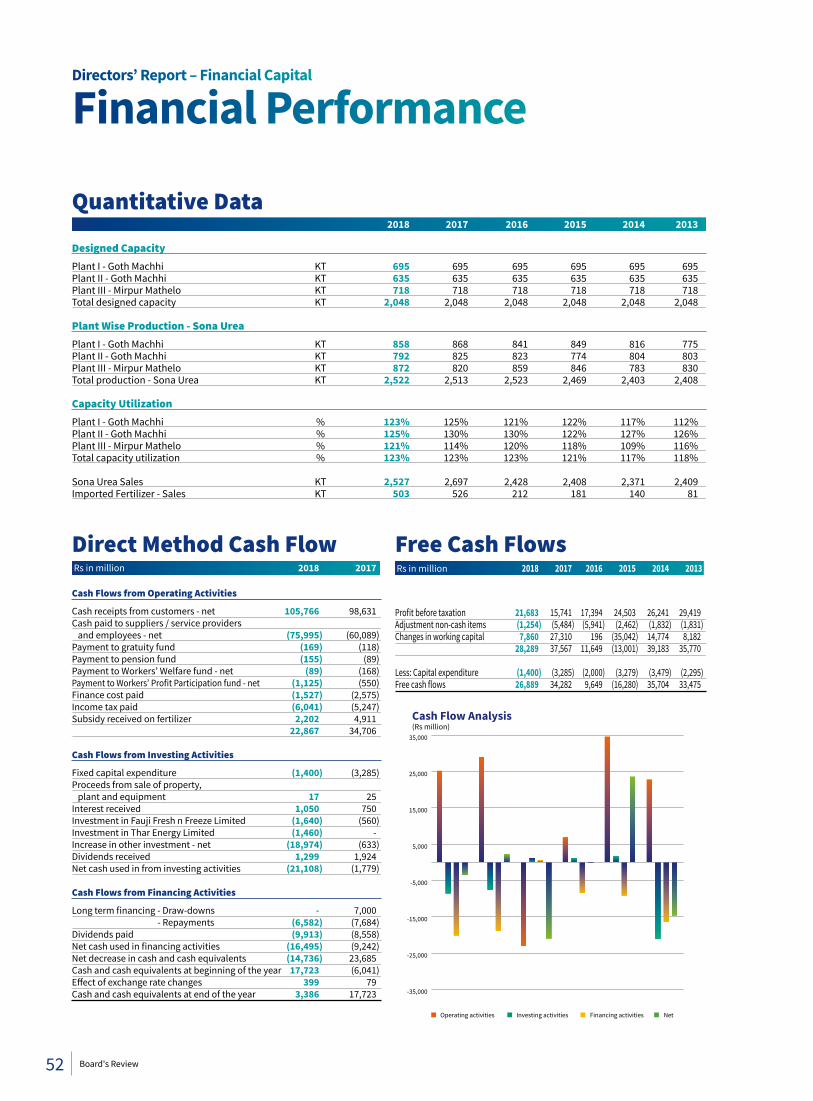
Directors’ Report – Financial Capital
Financial Performance
Direct Method Cash Flow Rs in million 2018 2017
Cash Flows from Operating Activities
Cash receipts from customers - net 105,766 98,631 Cash paid to suppliers / service providers and employees - net (75,995) (60,089)Payment to gratuity fund (169) (118)Payment to pension fund (155) (89)Payment to Workers’ Welfare fund - net (89) (168)Payment to Workers’ Profit Participation fund - net (1,125) (550)Finance cost paid (1,527) (2,575)Income tax paid (6,041) (5,247)Subsidy received on fertilizer 2,202 4,911 22,867 34,706 Cash Flows from Investing Activities
Fixed capital expenditure (1,400) (3,285)Proceeds from sale of property, plant and equipment 17 25 Interest received 1,050 750 Investment in Fauji Fresh n Freeze Limited (1,640) (560)Investment in Thar Energy Limited (1,460) - Increase in other investment - net (18,974) (633)Dividends received 1,299 1,924 Net cash used in from investing activities (21,108) (1,779) Cash Flows from Financing Activities
Long term financing - Draw-downs - 7,000 - Repayments (6,582) (7,684)Dividends paid (9,913) (8,558)Net cash used in financing activities (16,495) (9,242)Net decrease in cash and cash equivalents (14,736) 23,685 Cash and cash equivalents at beginning of the year 17,723 (6,041)Effect of exchange rate changes 399 79 Cash and cash equivalents at end of the year 3,386 17,723
2018 2017 2016 2015 2014 2013
Designed Capacity Plant I - Goth Machhi KT 695 695 695 695 695 695 Plant II - Goth Machhi KT 635 635 635 635 635 635 Plant III - Mirpur Mathelo KT 718 718 718 718 718 718 Total designed capacity KT 2,048 2,048 2,048 2,048 2,048 2,048 Plant Wise Production - Sona Urea Plant I - Goth Machhi KT 858 868 841 849 816 775 Plant II - Goth Machhi KT 792 825 823 774 804 803 Plant III - Mirpur Mathelo KT 872 820 859 846 783 830 Total production - Sona Urea KT 2,522 2,513 2,523 2,469 2,403 2,408 Capacity Utilization Plant I - Goth Machhi % 123% 125% 121% 122% 117% 112%Plant II - Goth Machhi % 125% 130% 130% 122% 127% 126%Plant III - Mirpur Mathelo % 121% 114% 120% 118% 109% 116%Total capacity utilization % 123% 123% 123% 121% 117% 118% Sona Urea Sales KT 2,527 2,697 2,428 2,408 2,371 2,409 Imported Fertilizer - Sales KT 503 526 212 181 140 81
Quantitative Data
Rs in million 2018 2017 2016 2015 2014 2013
Profit before taxation 21,683 15,741 17,394 24,503 26,241 29,419 Adjustment non-cash items (1,254) (5,484) (5,941) (2,462) (1,832) (1,831)Changes in working capital 7,860 27,310 196 (35,042) 14,774 8,182 28,289 37,567 11,649 (13,001) 39,183 35,770
Less: Capital expenditure (1,400) (3,285) (2,000) (3,279) (3,479) (2,295)Free cash flows 26,889 34,282 9,649 (16,280) 35,704 33,475
Free Cash Flows
-35,000
-25,000
-15,000
-5,000
5,000
15,000
25,000
35,000
Operating activities Investing activities Financing activities Net
Cash Flow Analysis(Rs million)
52 Board's Review
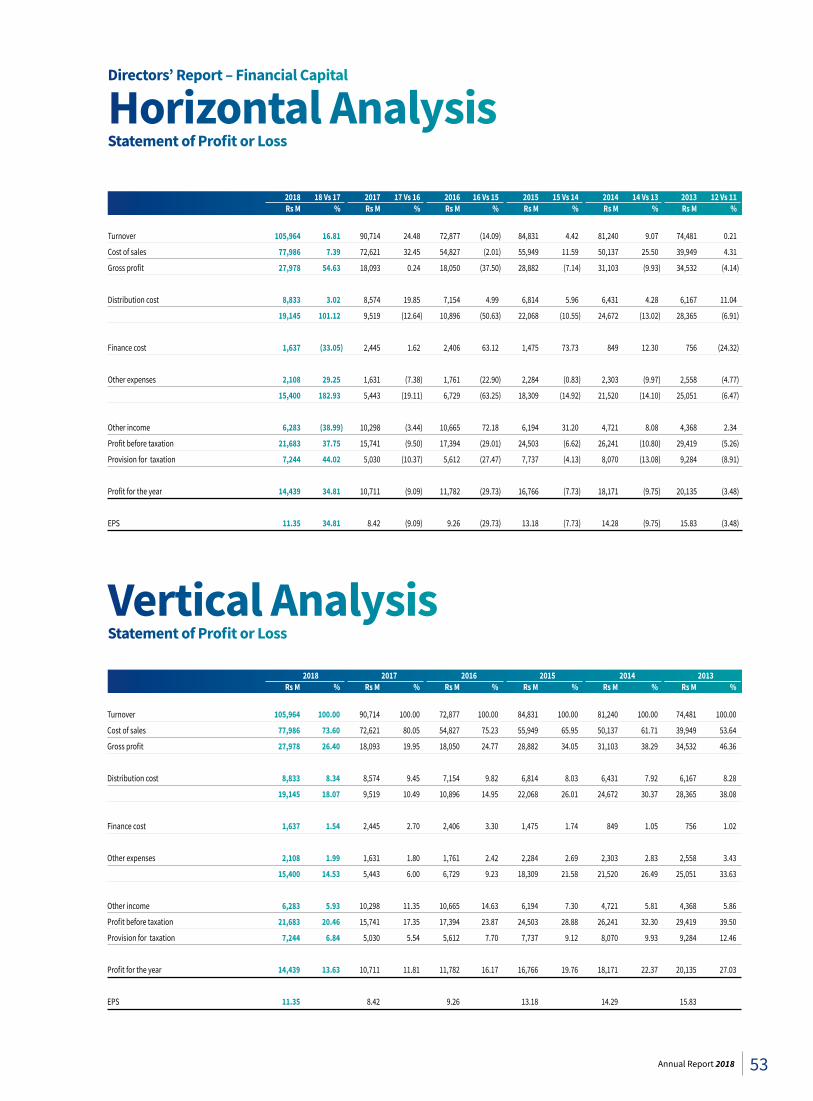
2018 18 Vs 17 2017 17 Vs 16 2016 16 Vs 15 2015 15 Vs 14 2014 14 Vs 13 2013 12 Vs 11 Rs M % Rs M % Rs M % Rs M % Rs M % Rs M %
Turnover 105,964 16.81 90,714 24.48 72,877 (14.09) 84,831 4.42 81,240 9.07 74,481 0.21
Cost of sales 77,986 7.39 72,621 32.45 54,827 (2.01) 55,949 11.59 50,137 25.50 39,949 4.31
Gross profit 27,978 54.63 18,093 0.24 18,050 (37.50) 28,882 (7.14) 31,103 (9.93) 34,532 (4.14)
Distribution cost 8,833 3.02 8,574 19.85 7,154 4.99 6,814 5.96 6,431 4.28 6,167 11.04
19,145 101.12 9,519 (12.64) 10,896 (50.63) 22,068 (10.55) 24,672 (13.02) 28,365 (6.91)
Finance cost 1,637 (33.05) 2,445 1.62 2,406 63.12 1,475 73.73 849 12.30 756 (24.32)
Other expenses 2,108 29.25 1,631 (7.38) 1,761 (22.90) 2,284 (0.83) 2,303 (9.97) 2,558 (4.77)
15,400 182.93 5,443 (19.11) 6,729 (63.25) 18,309 (14.92) 21,520 (14.10) 25,051 (6.47)
Other income 6,283 (38.99) 10,298 (3.44) 10,665 72.18 6,194 31.20 4,721 8.08 4,368 2.34
Profit before taxation 21,683 37.75 15,741 (9.50) 17,394 (29.01) 24,503 (6.62) 26,241 (10.80) 29,419 (5.26)
Provision for taxation 7,244 44.02 5,030 (10.37) 5,612 (27.47) 7,737 (4.13) 8,070 (13.08) 9,284 (8.91)
Profit for the year 14,439 34.81 10,711 (9.09) 11,782 (29.73) 16,766 (7.73) 18,171 (9.75) 20,135 (3.48)
EPS 11.35 34.81 8.42 (9.09) 9.26 (29.73) 13.18 (7.73) 14.28 (9.75) 15.83 (3.48)
2018 2017 2016 2015 2014 2013 Rs M % Rs M % Rs M % Rs M % Rs M % Rs M %
Turnover 105,964 100.00 90,714 100.00 72,877 100.00 84,831 100.00 81,240 100.00 74,481 100.00
Cost of sales 77,986 73.60 72,621 80.05 54,827 75.23 55,949 65.95 50,137 61.71 39,949 53.64
Gross profit 27,978 26.40 18,093 19.95 18,050 24.77 28,882 34.05 31,103 38.29 34,532 46.36
Distribution cost 8,833 8.34 8,574 9.45 7,154 9.82 6,814 8.03 6,431 7.92 6,167 8.28
19,145 18.07 9,519 10.49 10,896 14.95 22,068 26.01 24,672 30.37 28,365 38.08
Finance cost 1,637 1.54 2,445 2.70 2,406 3.30 1,475 1.74 849 1.05 756 1.02
Other expenses 2,108 1.99 1,631 1.80 1,761 2.42 2,284 2.69 2,303 2.83 2,558 3.43
15,400 14.53 5,443 6.00 6,729 9.23 18,309 21.58 21,520 26.49 25,051 33.63
Other income 6,283 5.93 10,298 11.35 10,665 14.63 6,194 7.30 4,721 5.81 4,368 5.86
Profit before taxation 21,683 20.46 15,741 17.35 17,394 23.87 24,503 28.88 26,241 32.30 29,419 39.50
Provision for taxation 7,244 6.84 5,030 5.54 5,612 7.70 7,737 9.12 8,070 9.93 9,284 12.46
Profit for the year 14,439 13.63 10,711 11.81 11,782 16.17 16,766 19.76 18,171 22.37 20,135 27.03
EPS 11.35 8.42 9.26 13.18 14.29 15.83
Directors’ Report – Financial Capital
Statement of Profit or Loss
Statement of Profit or Loss
Horizontal Analysis
Vertical Analysis
53Annual Report 2018
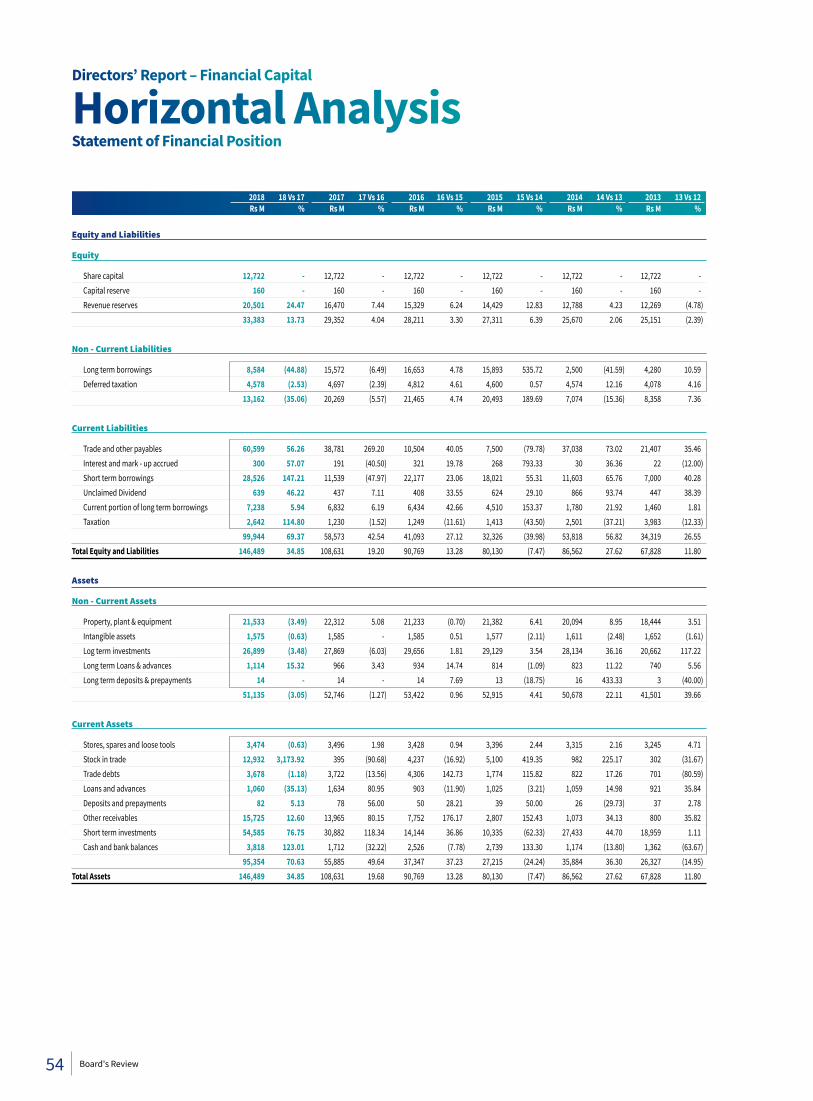
2018 18 Vs 17 2017 17 Vs 16 2016 16 Vs 15 2015 15 Vs 14 2014 14 Vs 13 2013 13 Vs 12 Rs M % Rs M % Rs M % Rs M % Rs M % Rs M %
Equity and Liabilities
Equity
Share capital 12,722 - 12,722 - 12,722 - 12,722 - 12,722 - 12,722 - Capital reserve 160 - 160 - 160 - 160 - 160 - 160 - Revenue reserves 20,501 24.47 16,470 7.44 15,329 6.24 14,429 12.83 12,788 4.23 12,269 (4.78) 33,383 13.73 29,352 4.04 28,211 3.30 27,311 6.39 25,670 2.06 25,151 (2.39)
Non - Current Liabilities
Long term borrowings 8,584 (44.88) 15,572 (6.49) 16,653 4.78 15,893 535.72 2,500 (41.59) 4,280 10.59 Deferred taxation 4,578 (2.53) 4,697 (2.39) 4,812 4.61 4,600 0.57 4,574 12.16 4,078 4.16 13,162 (35.06) 20,269 (5.57) 21,465 4.74 20,493 189.69 7,074 (15.36) 8,358 7.36 Current Liabilities
Trade and other payables 60,599 56.26 38,781 269.20 10,504 40.05 7,500 (79.78) 37,038 73.02 21,407 35.46 Interest and mark - up accrued 300 57.07 191 (40.50) 321 19.78 268 793.33 30 36.36 22 (12.00) Short term borrowings 28,526 147.21 11,539 (47.97) 22,177 23.06 18,021 55.31 11,603 65.76 7,000 40.28 Unclaimed Dividend 639 46.22 437 7.11 408 33.55 624 29.10 866 93.74 447 38.39 Current portion of long term borrowings 7,238 5.94 6,832 6.19 6,434 42.66 4,510 153.37 1,780 21.92 1,460 1.81 Taxation 2,642 114.80 1,230 (1.52) 1,249 (11.61) 1,413 (43.50) 2,501 (37.21) 3,983 (12.33) 99,944 69.37 58,573 42.54 41,093 27.12 32,326 (39.98) 53,818 56.82 34,319 26.55 Total Equity and Liabilities 146,489 34.85 108,631 19.20 90,769 13.28 80,130 (7.47) 86,562 27.62 67,828 11.80
Assets
Non - Current Assets
Property, plant & equipment 21,533 (3.49) 22,312 5.08 21,233 (0.70) 21,382 6.41 20,094 8.95 18,444 3.51 Intangible assets 1,575 (0.63) 1,585 - 1,585 0.51 1,577 (2.11) 1,611 (2.48) 1,652 (1.61) Log term investments 26,899 (3.48) 27,869 (6.03) 29,656 1.81 29,129 3.54 28,134 36.16 20,662 117.22 Long term Loans & advances 1,114 15.32 966 3.43 934 14.74 814 (1.09) 823 11.22 740 5.56 Long term deposits & prepayments 14 - 14 - 14 7.69 13 (18.75) 16 433.33 3 (40.00) 51,135 (3.05) 52,746 (1.27) 53,422 0.96 52,915 4.41 50,678 22.11 41,501 39.66
Current Assets
Stores, spares and loose tools 3,474 (0.63) 3,496 1.98 3,428 0.94 3,396 2.44 3,315 2.16 3,245 4.71 Stock in trade 12,932 3,173.92 395 (90.68) 4,237 (16.92) 5,100 419.35 982 225.17 302 (31.67) Trade debts 3,678 (1.18) 3,722 (13.56) 4,306 142.73 1,774 115.82 822 17.26 701 (80.59) Loans and advances 1,060 (35.13) 1,634 80.95 903 (11.90) 1,025 (3.21) 1,059 14.98 921 35.84 Deposits and prepayments 82 5.13 78 56.00 50 28.21 39 50.00 26 (29.73) 37 2.78 Other receivables 15,725 12.60 13,965 80.15 7,752 176.17 2,807 152.43 1,073 34.13 800 35.82 Short term investments 54,585 76.75 30,882 118.34 14,144 36.86 10,335 (62.33) 27,433 44.70 18,959 1.11 Cash and bank balances 3,818 123.01 1,712 (32.22) 2,526 (7.78) 2,739 133.30 1,174 (13.80) 1,362 (63.67) 95,354 70.63 55,885 49.64 37,347 37.23 27,215 (24.24) 35,884 36.30 26,327 (14.95)Total Assets 146,489 34.85 108,631 19.68 90,769 13.28 80,130 (7.47) 86,562 27.62 67,828 11.80
Directors’ Report – Financial Capital
Statement of Financial PositionHorizontal Analysis
54 Board's Review
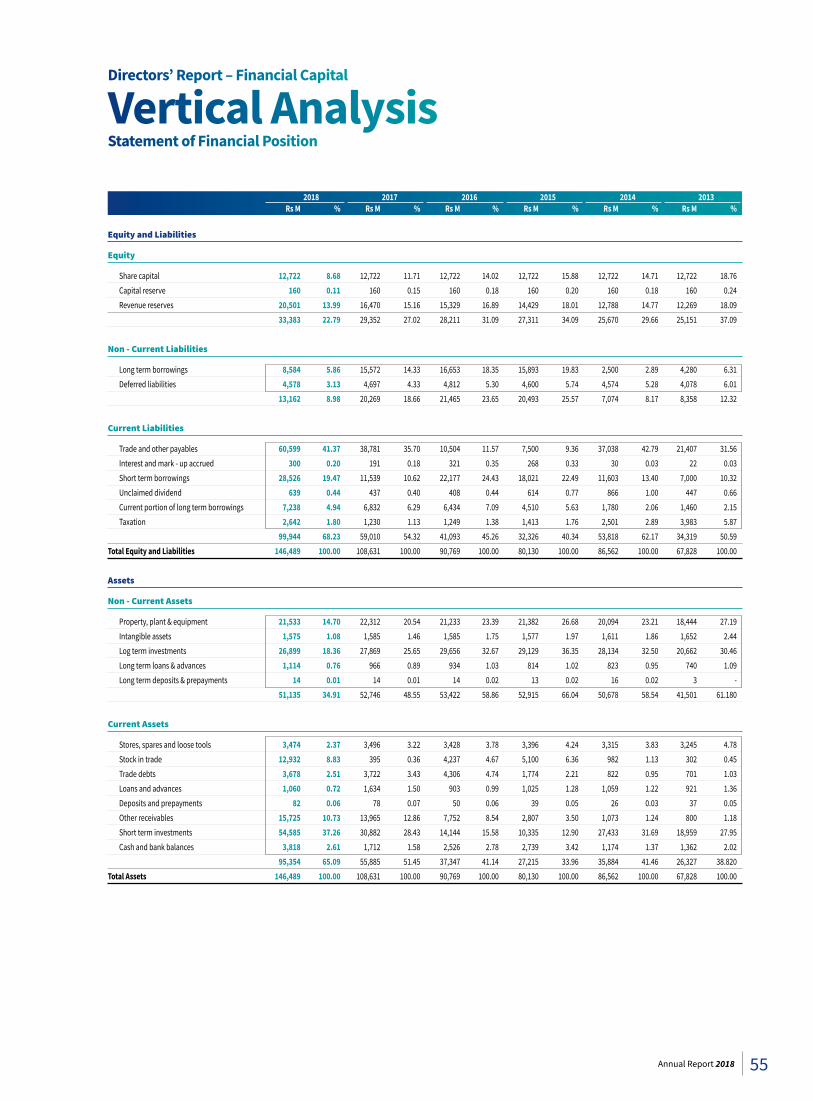
2018 2017 2016 2015 2014 2013 Rs M % Rs M % Rs M % Rs M % Rs M % Rs M %
Equity and Liabilities
Equity
Share capital 12,722 8.68 12,722 11.71 12,722 14.02 12,722 15.88 12,722 14.71 12,722 18.76 Capital reserve 160 0.11 160 0.15 160 0.18 160 0.20 160 0.18 160 0.24 Revenue reserves 20,501 13.99 16,470 15.16 15,329 16.89 14,429 18.01 12,788 14.77 12,269 18.09 33,383 22.79 29,352 27.02 28,211 31.09 27,311 34.09 25,670 29.66 25,151 37.09
Non - Current Liabilities
Long term borrowings 8,584 5.86 15,572 14.33 16,653 18.35 15,893 19.83 2,500 2.89 4,280 6.31 Deferred liabilities 4,578 3.13 4,697 4.33 4,812 5.30 4,600 5.74 4,574 5.28 4,078 6.01 13,162 8.98 20,269 18.66 21,465 23.65 20,493 25.57 7,074 8.17 8,358 12.32 Current Liabilities
Trade and other payables 60,599 41.37 38,781 35.70 10,504 11.57 7,500 9.36 37,038 42.79 21,407 31.56 Interest and mark - up accrued 300 0.20 191 0.18 321 0.35 268 0.33 30 0.03 22 0.03 Short term borrowings 28,526 19.47 11,539 10.62 22,177 24.43 18,021 22.49 11,603 13.40 7,000 10.32 Unclaimed dividend 639 0.44 437 0.40 408 0.44 614 0.77 866 1.00 447 0.66 Current portion of long term borrowings 7,238 4.94 6,832 6.29 6,434 7.09 4,510 5.63 1,780 2.06 1,460 2.15 Taxation 2,642 1.80 1,230 1.13 1,249 1.38 1,413 1.76 2,501 2.89 3,983 5.87 99,944 68.23 59,010 54.32 41,093 45.26 32,326 40.34 53,818 62.17 34,319 50.59 Total Equity and Liabilities 146,489 100.00 108,631 100.00 90,769 100.00 80,130 100.00 86,562 100.00 67,828 100.00
Assets
Non - Current Assets
Property, plant & equipment 21,533 14.70 22,312 20.54 21,233 23.39 21,382 26.68 20,094 23.21 18,444 27.19 Intangible assets 1,575 1.08 1,585 1.46 1,585 1.75 1,577 1.97 1,611 1.86 1,652 2.44 Log term investments 26,899 18.36 27,869 25.65 29,656 32.67 29,129 36.35 28,134 32.50 20,662 30.46 Long term loans & advances 1,114 0.76 966 0.89 934 1.03 814 1.02 823 0.95 740 1.09 Long term deposits & prepayments 14 0.01 14 0.01 14 0.02 13 0.02 16 0.02 3 - 51,135 34.91 52,746 48.55 53,422 58.86 52,915 66.04 50,678 58.54 41,501 61.180
Current Assets
Stores, spares and loose tools 3,474 2.37 3,496 3.22 3,428 3.78 3,396 4.24 3,315 3.83 3,245 4.78 Stock in trade 12,932 8.83 395 0.36 4,237 4.67 5,100 6.36 982 1.13 302 0.45 Trade debts 3,678 2.51 3,722 3.43 4,306 4.74 1,774 2.21 822 0.95 701 1.03 Loans and advances 1,060 0.72 1,634 1.50 903 0.99 1,025 1.28 1,059 1.22 921 1.36 Deposits and prepayments 82 0.06 78 0.07 50 0.06 39 0.05 26 0.03 37 0.05 Other receivables 15,725 10.73 13,965 12.86 7,752 8.54 2,807 3.50 1,073 1.24 800 1.18 Short term investments 54,585 37.26 30,882 28.43 14,144 15.58 10,335 12.90 27,433 31.69 18,959 27.95 Cash and bank balances 3,818 2.61 1,712 1.58 2,526 2.78 2,739 3.42 1,174 1.37 1,362 2.02 95,354 65.09 55,885 51.45 37,347 41.14 27,215 33.96 35,884 41.46 26,327 38.820 Total Assets 146,489 100.00 108,631 100.00 90,769 100.00 80,130 100.00 86,562 100.00 67,828 100.00
Directors’ Report – Financial Capital
Statement of Financial PositionVertical Analysis
55Annual Report 2018
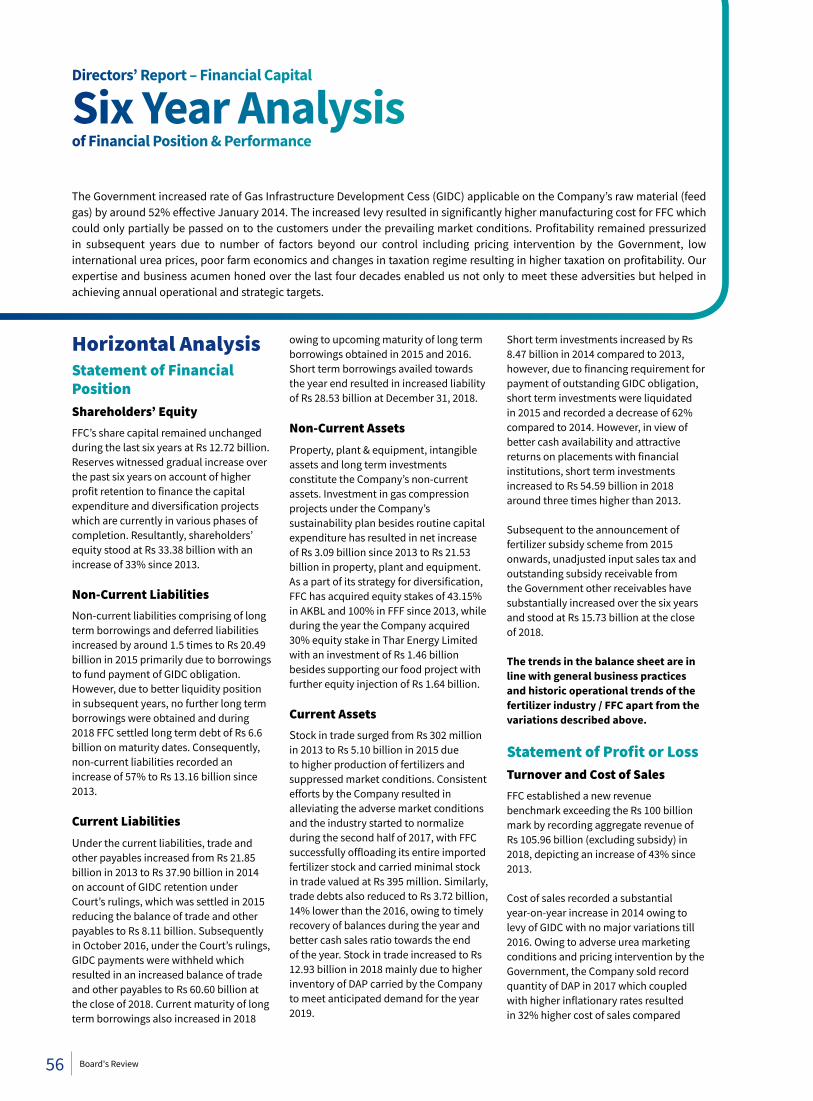
Horizontal AnalysisStatement of Financial PositionShareholders’ EquityFFC’s share capital remained unchanged during the last six years at Rs 12.72 billion. Reserves witnessed gradual increase over the past six years on account of higher profit retention to finance the capital expenditure and diversification projects which are currently in various phases of completion. Resultantly, shareholders’ equity stood at Rs 33.38 billion with an increase of 33% since 2013.
Non-Current LiabilitiesNon-current liabilities comprising of long term borrowings and deferred liabilities increased by around 1.5 times to Rs 20.49 billion in 2015 primarily due to borrowings to fund payment of GIDC obligation. However, due to better liquidity position in subsequent years, no further long term borrowings were obtained and during 2018 FFC settled long term debt of Rs 6.6 billion on maturity dates. Consequently, non-current liabilities recorded an increase of 57% to Rs 13.16 billion since 2013.
Current LiabilitiesUnder the current liabilities, trade and other payables increased from Rs 21.85 billion in 2013 to Rs 37.90 billion in 2014 on account of GIDC retention under Court’s rulings, which was settled in 2015 reducing the balance of trade and other payables to Rs 8.11 billion. Subsequently in October 2016, under the Court’s rulings, GIDC payments were withheld which resulted in an increased balance of trade and other payables to Rs 60.60 billion at the close of 2018. Current maturity of long term borrowings also increased in 2018
owing to upcoming maturity of long term borrowings obtained in 2015 and 2016. Short term borrowings availed towards the year end resulted in increased liability of Rs 28.53 billion at December 31, 2018.
Non-Current AssetsProperty, plant & equipment, intangible assets and long term investments constitute the Company’s non-current assets. Investment in gas compression projects under the Company’s sustainability plan besides routine capital expenditure has resulted in net increase of Rs 3.09 billion since 2013 to Rs 21.53 billion in property, plant and equipment. As a part of its strategy for diversification, FFC has acquired equity stakes of 43.15% in AKBL and 100% in FFF since 2013, while during the year the Company acquired 30% equity stake in Thar Energy Limited with an investment of Rs 1.46 billion besides supporting our food project with further equity injection of Rs 1.64 billion.
Current AssetsStock in trade surged from Rs 302 million in 2013 to Rs 5.10 billion in 2015 due to higher production of fertilizers and suppressed market conditions. Consistent efforts by the Company resulted in alleviating the adverse market conditions and the industry started to normalize during the second half of 2017, with FFC successfully offloading its entire imported fertilizer stock and carried minimal stock in trade valued at Rs 395 million. Similarly, trade debts also reduced to Rs 3.72 billion, 14% lower than the 2016, owing to timely recovery of balances during the year and better cash sales ratio towards the end of the year. Stock in trade increased to Rs 12.93 billion in 2018 mainly due to higher inventory of DAP carried by the Company to meet anticipated demand for the year 2019.
Short term investments increased by Rs 8.47 billion in 2014 compared to 2013, however, due to financing requirement for payment of outstanding GIDC obligation, short term investments were liquidated in 2015 and recorded a decrease of 62% compared to 2014. However, in view of better cash availability and attractive returns on placements with financial institutions, short term investments increased to Rs 54.59 billion in 2018 around three times higher than 2013.
Subsequent to the announcement of fertilizer subsidy scheme from 2015 onwards, unadjusted input sales tax and outstanding subsidy receivable from the Government other receivables have substantially increased over the six years and stood at Rs 15.73 billion at the close of 2018.
The trends in the balance sheet are in line with general business practices and historic operational trends of the fertilizer industry / FFC apart from the variations described above.
Statement of Profit or LossTurnover and Cost of SalesFFC established a new revenue benchmark exceeding the Rs 100 billion mark by recording aggregate revenue of Rs 105.96 billion (excluding subsidy) in 2018, depicting an increase of 43% since 2013.
Cost of sales recorded a substantial year-on-year increase in 2014 owing to levy of GIDC with no major variations till 2016. Owing to adverse urea marketing conditions and pricing intervention by the Government, the Company sold record quantity of DAP in 2017 which coupled with higher inflationary rates resulted in 32% higher cost of sales compared
The Government increased rate of Gas Infrastructure Development Cess (GIDC) applicable on the Company’s raw material (feed gas) by around 52% effective January 2014. The increased levy resulted in significantly higher manufacturing cost for FFC which could only partially be passed on to the customers under the prevailing market conditions. Profitability remained pressurized in subsequent years due to number of factors beyond our control including pricing intervention by the Government, low international urea prices, poor farm economics and changes in taxation regime resulting in higher taxation on profitability. Our expertise and business acumen honed over the last four decades enabled us not only to meet these adversities but helped in achieving annual operational and strategic targets.
Directors’ Report – Financial Capital
of Financial Position & PerformanceSix Year Analysis
56 Board's Review
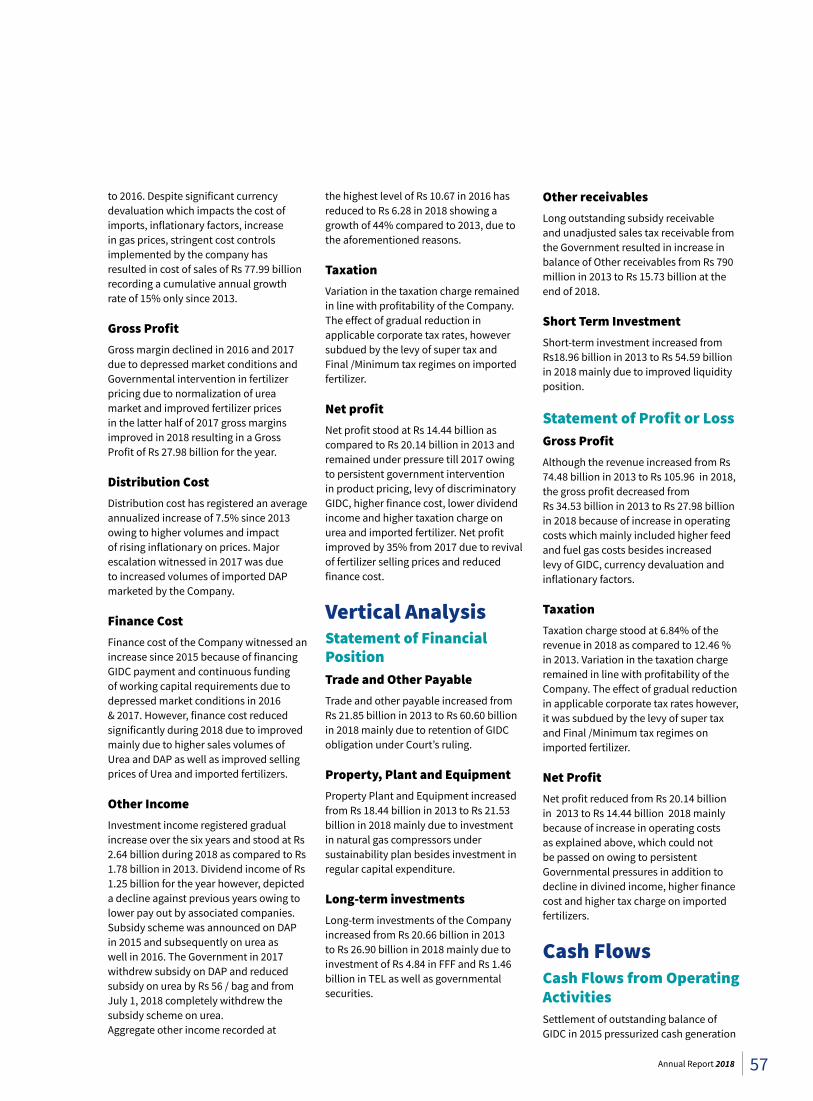
to 2016. Despite significant currency devaluation which impacts the cost of imports, inflationary factors, increase in gas prices, stringent cost controls implemented by the company has resulted in cost of sales of Rs 77.99 billion recording a cumulative annual growth rate of 15% only since 2013.
Gross ProfitGross margin declined in 2016 and 2017 due to depressed market conditions and Governmental intervention in fertilizer pricing due to normalization of urea market and improved fertilizer prices in the latter half of 2017 gross margins improved in 2018 resulting in a Gross Profit of Rs 27.98 billion for the year.
Distribution Cost Distribution cost has registered an average annualized increase of 7.5% since 2013 owing to higher volumes and impact of rising inflationary on prices. Major escalation witnessed in 2017 was due to increased volumes of imported DAP marketed by the Company.
Finance CostFinance cost of the Company witnessed an increase since 2015 because of financing GIDC payment and continuous funding of working capital requirements due to depressed market conditions in 2016 & 2017. However, finance cost reduced significantly during 2018 due to improved mainly due to higher sales volumes of Urea and DAP as well as improved selling prices of Urea and imported fertilizers.
Other IncomeInvestment income registered gradual increase over the six years and stood at Rs 2.64 billion during 2018 as compared to Rs 1.78 billion in 2013. Dividend income of Rs 1.25 billion for the year however, depicted a decline against previous years owing to lower pay out by associated companies. Subsidy scheme was announced on DAP in 2015 and subsequently on urea as well in 2016. The Government in 2017 withdrew subsidy on DAP and reduced subsidy on urea by Rs 56 / bag and from July 1, 2018 completely withdrew the subsidy scheme on urea. Aggregate other income recorded at
the highest level of Rs 10.67 in 2016 has reduced to Rs 6.28 in 2018 showing a growth of 44% compared to 2013, due to the aforementioned reasons.
TaxationVariation in the taxation charge remained in line with profitability of the Company. The effect of gradual reduction in applicable corporate tax rates, however subdued by the levy of super tax and Final /Minimum tax regimes on imported fertilizer.
Net profit Net profit stood at Rs 14.44 billion as compared to Rs 20.14 billion in 2013 and remained under pressure till 2017 owing to persistent government intervention in product pricing, levy of discriminatory GIDC, higher finance cost, lower dividend income and higher taxation charge on urea and imported fertilizer. Net profit improved by 35% from 2017 due to revival of fertilizer selling prices and reduced finance cost.
Vertical AnalysisStatement of Financial PositionTrade and Other PayableTrade and other payable increased from Rs 21.85 billion in 2013 to Rs 60.60 billion in 2018 mainly due to retention of GIDC obligation under Court’s ruling.
Property, Plant and EquipmentProperty Plant and Equipment increased from Rs 18.44 billion in 2013 to Rs 21.53 billion in 2018 mainly due to investment in natural gas compressors under sustainability plan besides investment in regular capital expenditure.
Long-term investments Long-term investments of the Company increased from Rs 20.66 billion in 2013 to Rs 26.90 billion in 2018 mainly due to investment of Rs 4.84 in FFF and Rs 1.46 billion in TEL as well as governmental securities.
Other receivablesLong outstanding subsidy receivable and unadjusted sales tax receivable from the Government resulted in increase in balance of Other receivables from Rs 790 million in 2013 to Rs 15.73 billion at the end of 2018.
Short Term InvestmentShort-term investment increased from Rs18.96 billion in 2013 to Rs 54.59 billion in 2018 mainly due to improved liquidity position.
Statement of Profit or LossGross ProfitAlthough the revenue increased from Rs 74.48 billion in 2013 to Rs 105.96 in 2018, the gross profit decreased from Rs 34.53 billion in 2013 to Rs 27.98 billion in 2018 because of increase in operating costs which mainly included higher feed and fuel gas costs besides increased levy of GIDC, currency devaluation and inflationary factors.
TaxationTaxation charge stood at 6.84% of the revenue in 2018 as compared to 12.46 % in 2013. Variation in the taxation charge remained in line with profitability of the Company. The effect of gradual reduction in applicable corporate tax rates however, it was subdued by the levy of super tax and Final /Minimum tax regimes on imported fertilizer.
Net ProfitNet profit reduced from Rs 20.14 billion in 2013 to Rs 14.44 billion 2018 mainly because of increase in operating costs as explained above, which could not be passed on owing to persistent Governmental pressures in addition to decline in divined income, higher finance cost and higher tax charge on imported fertilizers.
Cash FlowsCash Flows from Operating ActivitiesSettlement of outstanding balance of GIDC in 2015 pressurized cash generation
57Annual Report 2018
from operating activities. However, after revival of the customary urea demand the Company generated net cash from operations of Rs 34.71 billion in 2017. Cash flow from operations in the year 2018 were recorded at Rs 22.87 billion depicted an increase of 57% compared to the average cash flows from 2013 to 2017 but remained below 2017 owing to higher DAP inventory maintained at the year end.
Cash Flows from Investing ActivitiesInvesting activities mainly comprise of equity investments in subsidiaries and associates in addition to capital expenditure and long / short term investments. Cash outflows on capital expenditure has been in line with the need to maintain reliable and sustained operations from its production facilities over the past 6 years. Cumulative equity investment in the last six years has been Rs 10.51 billion. Cash outflow on investments increased considerably during the year due to improved liquidity, while inflows from dividends declined due to lower dividend payout by our associated companies.
Cash Flows from Financing ActivitiesFinancing cash flows mainly consisting of proceeds / repayment of long term loans in addition to our demonstrated commitment of sustained shareholders’ returns in form of attractive dividend payout every year. Dividend payout is primarily responsible for net cash used in financing activities, except for 2015 when the Company obtained substantial debt to settle GIDC obligation. Net cash utilization of Rs 16.49 billion in the current year increased from Rs 9.24 billion recorded in 2017 because of loan repayments on due dates and dividend payout while no long term debt has been obtained during 2018.
Ratio AnalysisProfitability RatiosDespite consistent increase in the Company’s revenue, barring the year 2016 when revenue declined owing to
Governmental pricing intervention. The constant increase in cost of sales including imposition of GIDC coupled with Company’s restricted pass through ability has resulted in declining gross profit margins till the year 2017. Improvements in selling prices eased the pressures on gross margins (excluding subsidy), which were recorded at 26.40% in 2018 compared to 19.95% earned in 2017.
Net profit margins remained pressurized since 2015 owing to higher finance cost, lower dividend income and higher tax charge on imported fertilizers, however consistent cost controls, improved fertilizer market resulted in a net margin of 13.63% compared to 11.81% recorded in 2017.
Liquidity RatiosThe current ratio of 0.95 times improved over last six years average of 0.85 times owing to increase in short term investments. Quick ratio of 0.79 times, although higher than the six year average of 0.70 times, recorded a decline from 2017 by 0.09 times owing to higher closing inventory of DAP.
Cash to current liabilities of 0.03 times declined below the last six year average owing to retention of GIDC payments.
Activity / Turnover RatiosRevival of customary urea demand has resulted in improvement of market dynamics, hence despite higher record revenue the Company has successfully curtailed credit sales, leading to increased debtors turnover from 23 times in 2017 to 29 times in the 2018. Creditor turnover days have increased to 156 days compared to six year average of 84 days owing to withholding of GIDC under Court’s rulings. The Company’s operating cycle was thus recorded at negative 114 days compared to negative 29 days in 2013. Record domestic urea offtake resulted in improvement of fixed asset turnover ratio including subsidy to 5.03 times in 2018, higher by 0.67 times compared to 2017.
Investment / Market RatiosThe Company’s share traded on Pakistan Stock exchange in the range of Rs 79.05 to Rs 103.68 with closing rate at balance sheet date of Rs 92.85 compared to Rs 79.11 at the close of 2017. The share price to earnings ratio remained at 8.18 times against six years’ average of 8.85 times.
The breakup value of FFC share improved to Rs 26.24 per share against six years average of Rs 22.15 per share owing to better operational performance of the Company and profit retention.
The retention of profits to finance Company’s diversification projects, dividend payout ratio for 2018 was recorded at above 78% against 83% last year, translating into a total cash dividend for per share of Rs 8.85 for 2018 against annual dividend of Rs 7.00 per share last year.
Capital Structure RatiosFinancial leverage ratio of 1.33 times was higher than 2017 by 0.17 times owing to higher short term borrowings towards the end of the year. Debt to equity ratio improved to 20:80 against 35:65 recorded in 2017 owing to repayment of long term debt. Low finance cost due to reduced borrowing improved interest cover ratio to 14.25 times compared to six years’ average of 19.89 times.
Explanation of Negative Changes in Performance Over The PeriodNegative changes in performance against prior years; including the analysis of financial statements and the vertical and horizontal analysis of statement of financial position, statement of profit or loss and statement of cash flows have been appropriately explained in the relevant sections of this Report.
Directors’ Report – Financial Capital
of Financial Position & PerformanceSix Year Analysis
58 Board's Review
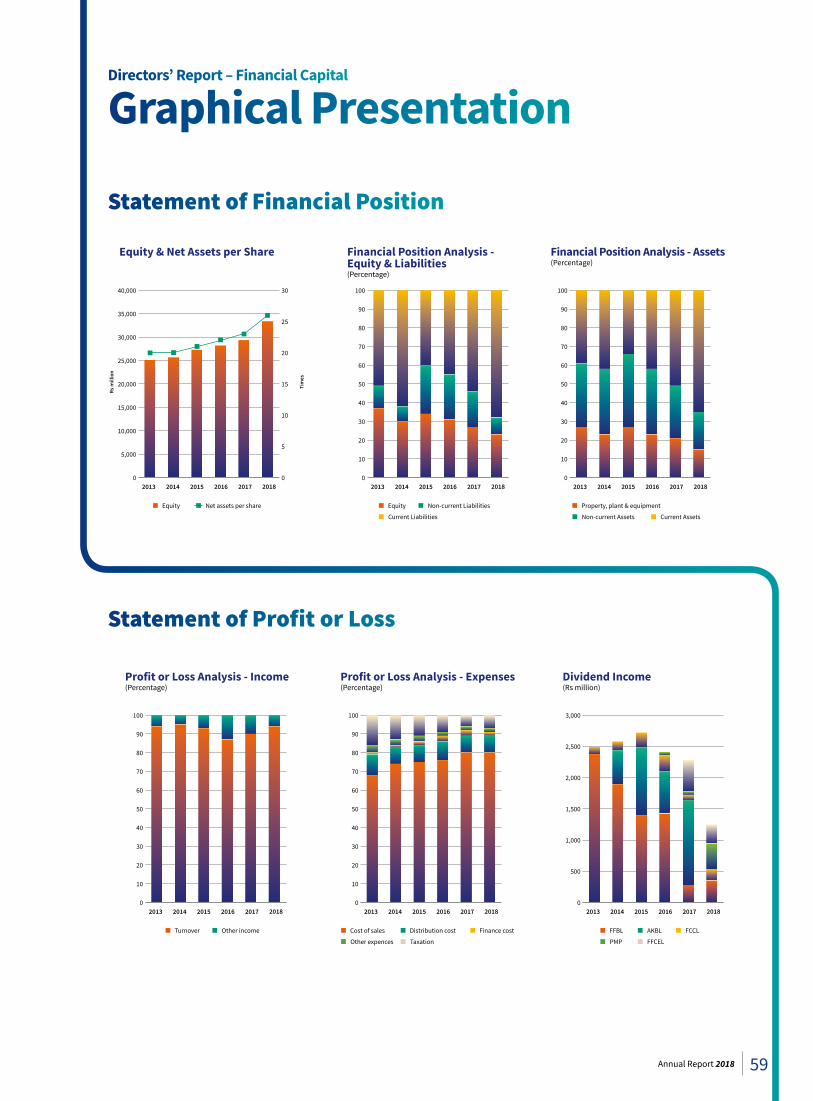
Directors’ Report – Financial Capital
Statement of Financial Position
Statement of Profit or Loss
Graphical Presentation
2017 20182013 2014 2015 20160
10
20
30
40
50
60
70
80
90
100
Financial Position Analysis - Assets(Percentage)
Property, plant & equipment
Non-current Assets Current Assets
2017 20182013 2014 2015 20160
10
20
30
40
50
60
70
80
90
100
Financial Position Analysis -Equity & Liabilities(Percentage)
Equity Non-current Liabilities
Current Liabilities
2017 20182013 2014 2015 20160
10
20
30
40
50
60
70
80
90
100
Profit or Loss Analysis - Expenses(Percentage)
Cost of sales Distribution cost Finance cost
Other expences Taxation
2017 20182013 2014 2015 20160
10
20
30
40
50
60
70
80
90
100
Profit or Loss Analysis - Income(Percentage)
Turnover Other income
2017 20182013 2014 2015 20160
500
1,000
1,500
2,000
2,500
3,000
Dividend Income(Rs million)
FFBL AKBL FCCL
PMP FFCEL
2017 20182013 2014 2015 20160
5,000
10,000
15,000
20,000
25,000
30,000
35,000
40,000
0
5
10
15
20
25
30
Equity & Net Assets per Share
Rs m
illio
n
Tim
es
Equity Net assets per share
59Annual Report 2018
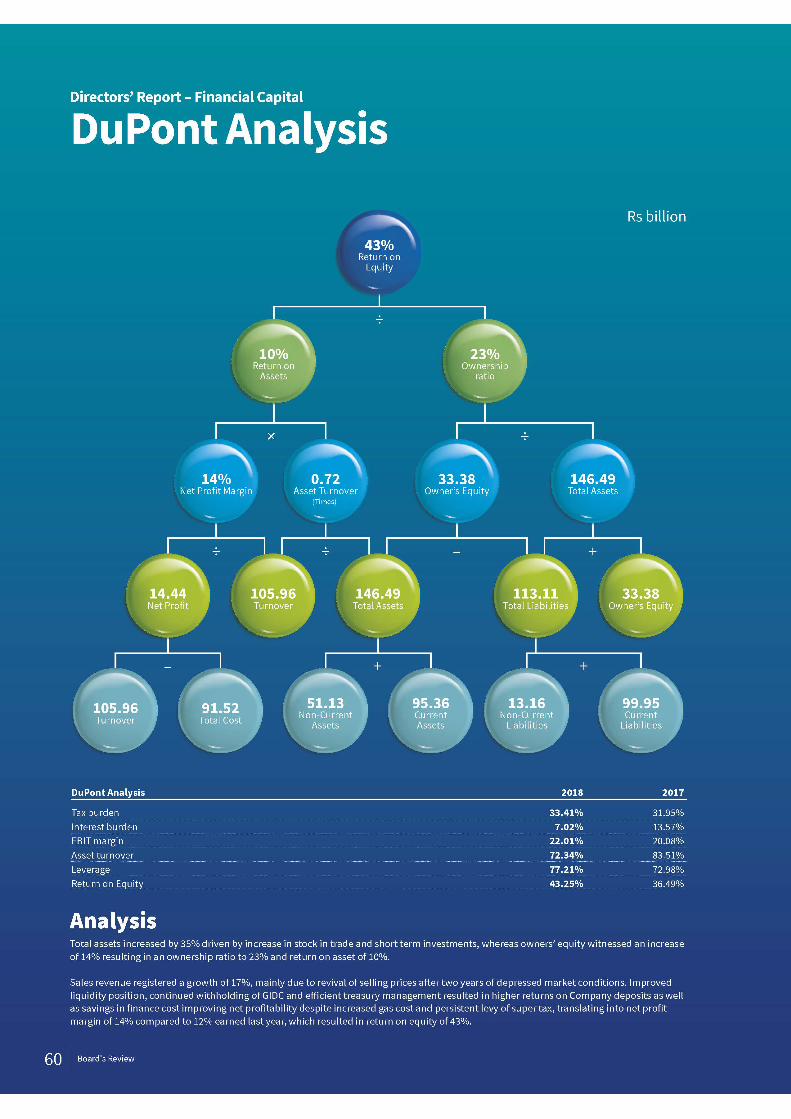
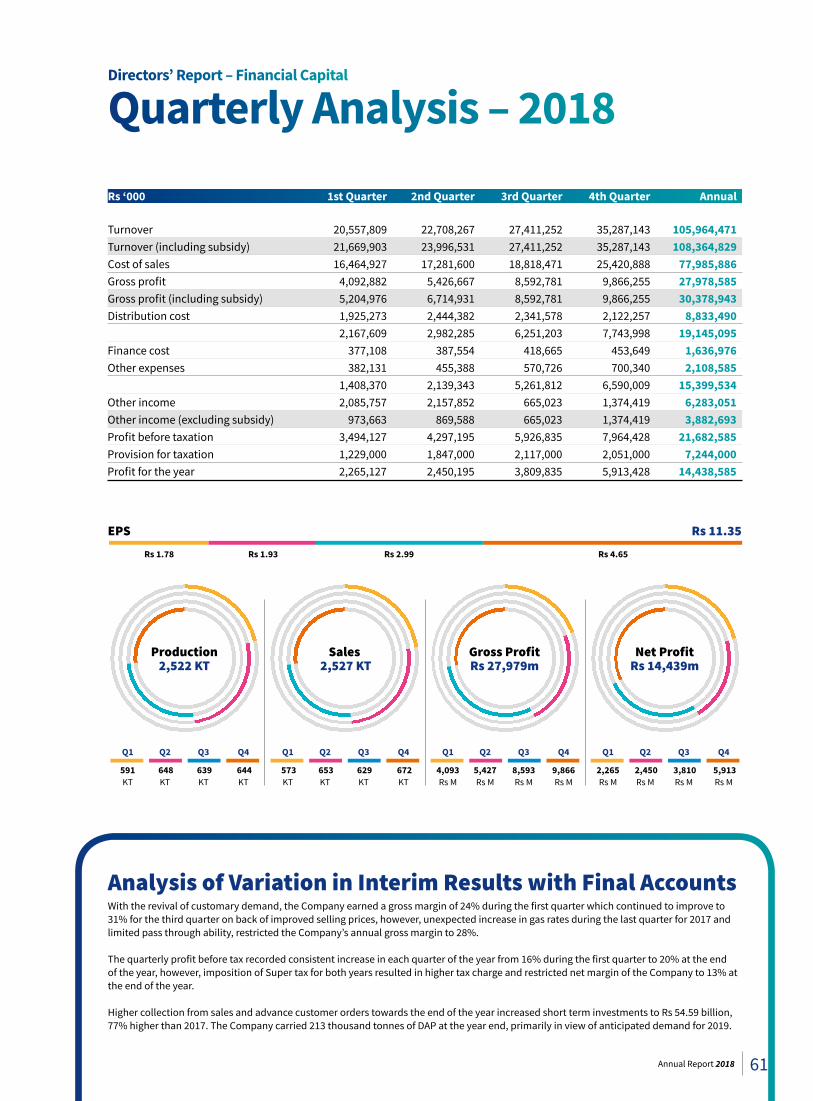
Rs ‘000 1st Quarter 2nd Quarter 3rd Quarter 4th Quarter Annual
Turnover 20,557,809 22,708,267 27,411,252 35,287,143 105,964,471 Turnover (including subsidy) 21,669,903 23,996,531 27,411,252 35,287,143 108,364,829 Cost of sales 16,464,927 17,281,600 18,818,471 25,420,888 77,985,886 Gross profit 4,092,882 5,426,667 8,592,781 9,866,255 27,978,585 Gross profit (including subsidy) 5,204,976 6,714,931 8,592,781 9,866,255 30,378,943 Distribution cost 1,925,273 2,444,382 2,341,578 2,122,257 8,833,490 2,167,609 2,982,285 6,251,203 7,743,998 19,145,095 Finance cost 377,108 387,554 418,665 453,649 1,636,976 Other expenses 382,131 455,388 570,726 700,340 2,108,585 1,408,370 2,139,343 5,261,812 6,590,009 15,399,534 Other income 2,085,757 2,157,852 665,023 1,374,419 6,283,051 Other income (excluding subsidy) 973,663 869,588 665,023 1,374,419 3,882,693 Profit before taxation 3,494,127 4,297,195 5,926,835 7,964,428 21,682,585 Provision for taxation 1,229,000 1,847,000 2,117,000 2,051,000 7,244,000 Profit for the year 2,265,127 2,450,195 3,809,835 5,913,428 14,438,585
Directors’ Report – Financial Capital
Quarterly Analysis – 2018
Analysis of Variation in Interim Results with Final AccountsWith the revival of customary demand, the Company earned a gross margin of 24% during the first quarter which continued to improve to 31% for the third quarter on back of improved selling prices, however, unexpected increase in gas rates during the last quarter for 2017 and limited pass through ability, restricted the Company’s annual gross margin to 28%.
The quarterly profit before tax recorded consistent increase in each quarter of the year from 16% during the first quarter to 20% at the end of the year, however, imposition of Super tax for both years resulted in higher tax charge and restricted net margin of the Company to 13% at the end of the year.
Higher collection from sales and advance customer orders towards the end of the year increased short term investments to Rs 54.59 billion, 77% higher than 2017. The Company carried 213 thousand tonnes of DAP at the year end, primarily in view of anticipated demand for 2019.
Production2,522 KT
Sales 2,527 KT
Gross ProfitRs 27,979m
Net ProfitRs 14,439m
591 648 639 644 KT KT KT KT
573 653 629 672 KT KT KT KT
4,093 5,427 8,593 9,866 Rs M Rs M Rs M Rs M
2,265 2,450 3,810 5,913 Rs M Rs M Rs M Rs M
Q1 Q2 Q3 Q4 Q1 Q2 Q3 Q4 Q1 Q2 Q3 Q4 Q1 Q2 Q3 Q4
EPS Rs 11.35
Rs 1.78 Rs 1.93 Rs 2.99 Rs 4.65
61Annual Report 2018
ProductionWith view of maintaining the manufacturing plants’ optimal efficiency, routine maintenance of Plant II was conducted during the first quarter of the year which restricted Sona urea production to 591 thousand tonnes, 7% lower than corresponding quarter of last year whereas overall operational efficiency remained at 116% against 126% achieved during the same period of 2017.
Sales, Revenue and IncomeAfter almost 2 years of pressurized marketing conditions, the urea market normalized during second half of 2017 resulting in revival of customary urea demand. First quarter Sona urea offtake of 573 thousand tonnes was 52% higher, whereas DAP sales of 105 thousand tonnes improved by 2.4 times compared to the corresponding quarter 2017. Aggregated sales revenue (including subsidy) created a new first quarter benchmark of Rs 21.67 billion compared to Rs 12.60 billion earned last year. Dividend income which is beyond the Company’s control, was recorded at Rs 349 million owing to lower payouts from associated companies and restricted other income to Rs 974 million 29% lower than last year.
Operating costs (Cost of Sales and Distribution Costs)In line with higher sales, cost of sales of Rs 16.47 billion was 92% higher than last year whereas higher imports of DAP increased distribution cost to Rs 1.93 billion, 15% above the corresponding period of last year.
ProfitImprovement in sales volume resulted in gross profit of Rs 5.21 billion, 30% higher than last year, however, warehousing cost of higher quantities of DAP imports and lower dividend income restricted net profit to Rs 2.27 billion, 3% higher than the corresponding period.
In order to provide steady stream of returns, first interim dividend of 17.50% (Rs 1.75 per share) was declared by the Board for its shareholders with a payout ratio of 98%.
Net Assets Encashment of short term investments to cater for the working capital needs reduced total assets to Rs 96.08 billion lower by 12% compared to December 2017. Net assets decreased by Rs 1.63 billion at Rs 27.72 billion, lower by 6% compared to the end of 2017.
Production On the back of improved operational efficiencies, the Company achieved its highest ever second quarter urea production of 647 thousand tonnes, 1% higher than corresponding period of 2017 and also 9% higher than the previous quarter.
Sales, Revenue and IncomeUrea demand continued to show improvement and the Company recorded urea sales of 653 thousand tonnes, 14% higher than the previous quarter, whereas aggregate urea sales for the first two quarters were 12% higher than last year. Sales revenue (including subsidy) of around Rs 24 billion increased by 12% compared to the second quarter of 2017 and 11% higher than the previous quarter. Higher dividend declaration by associated companies during the quarter improved other income to Rs 870 million, 2.6 times more than last year but remained 11% below the previous quarter owing to lower returns on investments.
Operating costs (Cost of Sales and Distribution Costs)Cost of sales increased by 5% only to Rs 17.28 billion despite higher offtake compared to the previous quarter, whereas handling cost associated with higher imports of DAP resulted in distribution cost of Rs 2.44 billion, 27% above the last quarter.
ProfitHigher sales revenue translated in an improved, gross profit (including subsidy) of Rs 6.71 billion, 29% higher than the previous quarter and 10% above last year. Net margin improved to 10% with earnings of Rs 2.45 billion, and FFC earned an aggregate net profit of Rs 4.72 billion for the first half of 2018, which was 24% higher than last year. The Company declared second interim dividend of Rs 1.40 per share, with aggregate distribution of Rs 3.15 per share for the half year, 26% higher last year.
Net AssetsInvestments in Thar Energy Limited and maintaining higher stocks of imported fertilizer in view of anticipated demand during the second half of the year, resulted in total assets of Rs 113.76 billion, 18% higher than the preceding quarter. Net assets of Rs 27.88 billion remained in line with the previous quarter despite payment of first interim dividend owing to higher profitability.
Directors’ Report – Financial Capital
Quarterly Analysis – 2018
62 Board's Review
ProductionSona urea production of 639 thousand tonnes, was only 1% lower than the last quarter as well as the highest ever third quarter production recorded in 2017.
Sales, Revenue and IncomeUrea sales for the quarter were recorded at 629 thousand tonnes, only 2% lower than comparative period of last year and 4% lower than last quarter due to increased prices in view of discontinuation of urea subsidy of Rs 100 per bag effective July 1, 2018. DAP sales for the quarter registered increase of 44% compared to the last quarter however remained 54% lower than the highest quarterly sales of last year due to higher prices in view of steep PKR devaluation. Improved selling prices during the quarter resulted in aggregate all fertilizer sales revenue (including subsidy) of Rs 27.41 billion, which was 14% higher than the previous quarter but remained 5% lower compared to same quarter of 2017 owing to lower offtake. Better cash availability resulted in improved other income of Rs 665 million, 54% higher compared to the third quarter of 2017 but remained 24% lower than the previous quarter owing to lower dividend income.
Operating costs (Cost of Sales and Distribution Costs)Lower fertilizer offtake compared to the previous year resulted in 15% lower cost of sales at Rs 18.82 billion. Distribution cost of Rs 2.34 billion also decreased by 5% as compared to the same period of last year and 4% against the previous quarter owing to lower product handling during the quarter.
ProfitDue to improved selling prices, quarterly gross margin recorded at 31%, was 5% higher than the average margin earned during the previous two quarters, translating into a net profit of Rs 3.81 billion, which was significantly higher by 80% over the corresponding period of last year and 55% above the previous quarter.
Remaining consistent with its commitment to provide sustained returns to the shareholders, the Board declared third interim dividend of Rs 1.80 per share with cumulative distribution of Rs 4.95 per share for the nine months.
Net AssetsAccumulating balance of subsidy receivable from the Government and unadjusted balance of sales tax resulted in total assets of Rs 116.52 billion, 2% higher than the total assets of Rs 113.76 billion recorded at June 30, 2018 mainly due to decline in external borrowings. Higher retention resulted in improved net assets of Rs 29.83 billion, 7% higher than the previous quarter.
ProductionSona urea production of 644 thousand tonnes for the last quarter of 2018 was 10% higher compared to the corresponding quarter of 2017 owing to maintenance turnaround conducted in 2017, and remained broadly in line with the previous quarter.
Building on our commitment for excellence, the Company recorded its second highest annual urea production of 2,522 thousand tonnes during the year. In view of increasing DAP costs due to currency devaluation and expected DAP demand for 2019, 128 thousand tonnes of DAP were also imported during the quarter.
Sales, Revenue and IncomeSona urea offtake was recorded at 672 thousand tonnes 9% higher than the average sales of last three quarters, while lower opening inventory restricted annual sales to 2,527 thousand tonnes, 6% lower than last year, these were the highest ever urea sales in domestic market by the Company. Despite lower offtake, improved selling prices resulted in highest ever quarterly revenue of Rs 35.29 billion, 2% higher than last year and 29% higher than the previous quarter, translating into highest ever annual aggregate sales revenue including subsidy of Rs 108.36 billion, 11% higher than 2017.
Improved investment income due to better cash availability and second consistent dividend declaration by FFCEL augmented the Company’s annual other income to Rs 3.88 billion, 5% higher than last year.
Operating costs (Cost of Sales and Distribution Costs)Increase in gas prices by the Government resulted in higher production cost of sales for the quarter of Rs 25.42 billion, 35% higher than the previous quarter, however, it remained 4% lower compared to 2017 owing to reduced fertilizer offtake. Aggregate cost of sales for 2018 were recorded at Rs 77.99 billion, 7% higher than last year primarily due to increased raw material prices and impact of currency devaluation. Distribution cost for the quarter remained 9% lower than the last quarter due to lower product handling during the period, whereas annual distribution cost of Rs 8.83 million increased by 3% compared to last year owing to inflationary impact on costs.
ProfitImproved selling prices during the quarter resulted in quarterly gross profit of Rs 9.87 billion, 21% higher compared to the same quarter of 2017 and 15% above the previous quarter. Gross profit of Rs 30.38 billion was achieved at the end of the year registering an increase of 23% over last year. The decline in net profits witnessed during the previous years due to adverse marketing conditions, higher raw material prices, urea pricing pressures by the Government, reversed at the end of 2018 with earnings of Rs 14.44 billion registering a growth of 35% compared to last year.
Net AssetsInvestment of surplus cash and higher DAP inventory resulted in an asset base of Rs 146.49 billion 35% above last year. Higher profits and retention translated into net assets of Rs 33.38 billion, 14% above 2017.
63Annual Report 2018
Liquidity Position Analysis The Company remained liquid during the year owing to higher collection from customers because of improved revenues besides proactive cash flow management and continued retention of GIDC payments.
Liquidity and Cash Flow ManagementStrategy to Overcome Liquidity ProblemsThe cash flow requirements of the Company are managed, primarily, through internal cash generation sourced mainly from sales revenue in addition to dividend income from diversified equity portfolio, with external financing acting as a secondary mean of funding. Sales revenue receipts are handled through optimized control of customer credit, in addition to securing advance customer orders.
Treasury Management System ensures profitable returns by placement of surplus funds in high yield investments to generate incremental income and cash flows for the Company. External means of financing are also availed where such financing provides cheaper alternates to encashment of profitable investments.
In order to safeguard against cash flow risks, the liquidity position of the Company is monitored vigilantly to ensure availability of adequate funds to meet operational requirements through effective cash flow forecasting, maintenance and management of maturity profiles of assets and liabilities thereby optimizing the working capital cycle.
Treasury ManagementThe Treasury Management System of the Company focuses on maintenance of a dynamic and flexible portfolio of investments to enhance profitability and increase shareholders’ return, through placement of surplus funds in the money market / Government securities, term deposits with banks / financial institutions and any other investment schemes, by way of the following processes:
• Periodic evaluation of planned revenues from sales / investment income and comparison with the timing and quantum of working capital requirements
• Matching of maturity dates of investments with working capital / other funding requirements to ensure availability of sufficient liquidity for operations as well as further placements to generate incremental revenues and cash flows
• Identification of cash surpluses for investment in suitable opportunities offering optimal returns while providing preservation of invested capital
• Investment through short / long term placements, with high credit rated institutions to minimize credit risk
• Maintenance of a fairly diversified portfolio to earn maximum returns, remaining within prudent levels of risks and exposure
Financing Arrangements Reliance on external financing is secondary to internally generated cash, which represents the Company’s primary source of working capital thereby minimizing financing
costs through effective liquidity management.
External financing is arranged, when required, only after exhaustive cash flow forecasting, in view of various outflow requirements of the Company. Preference is accorded to short-term debt over long term because of lower financing costs.
Total borrowings, including short term and current maturity of long term borrowings, increased by 31 % to Rs 44.35 billion, compared to last year mainly to meet working capital requirements towards the end of year.
In view of strong financial position and Company's ability to generate internal funds, FFC has the capacity to meet funding requirements for its diversification needs.
Repayment of Debts and Recovery of LossesAmounts due during the year relating to long term borrowings were settled on timely basis, whereas short term borrowings in excess of the Company’s requirement were periodically retired, while cash flow forecasts provide sufficient confidence of the Company’s ability to discharge the outstanding long and short term borrowings on timely basis as well.
The Company carried a long term financing balance of Rs 8.58 billion at the close of 2018 which reduced by around Rs 7.0 billion compared to last year as no additional funds were borrowed on long term basis during the year. All debt repayments maturing this year were paid on their due time and there has been no defaults in repayment of any debt during the year.
Directors’ Report
Financial Capital
64 Board's Review
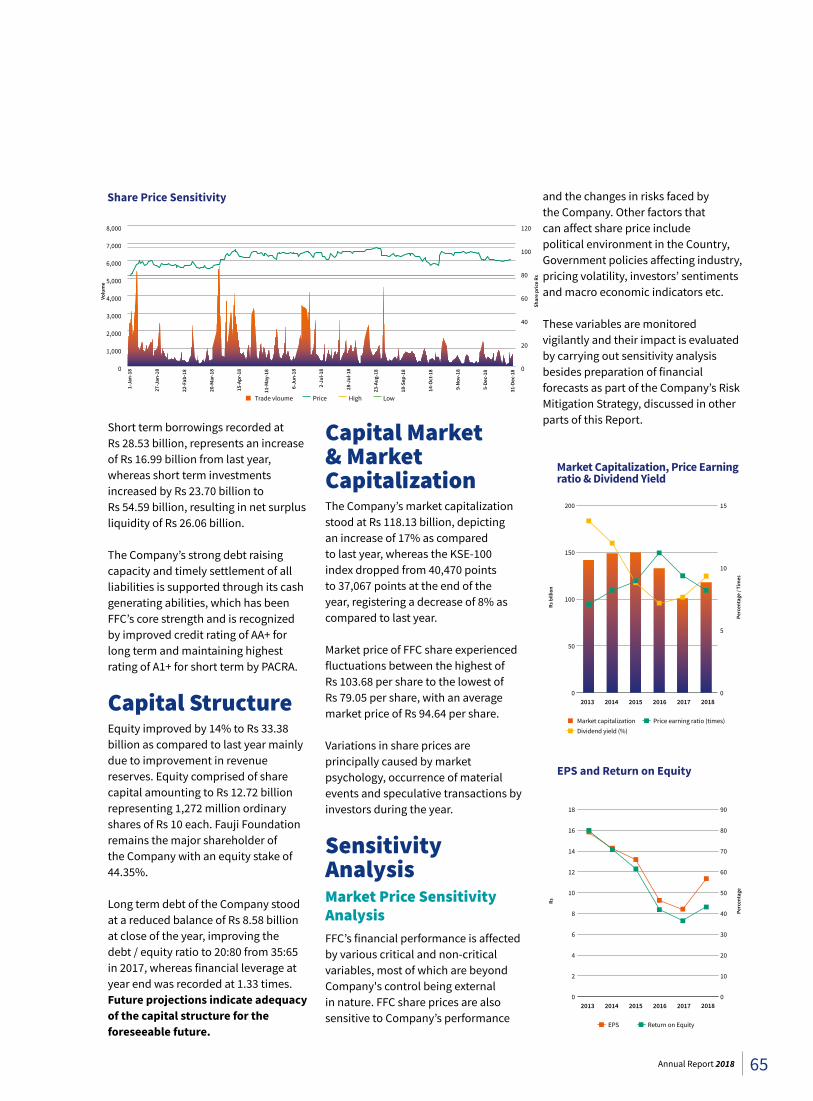
Short term borrowings recorded at Rs 28.53 billion, represents an increase of Rs 16.99 billion from last year, whereas short term investments increased by Rs 23.70 billion to Rs 54.59 billion, resulting in net surplus liquidity of Rs 26.06 billion.
The Company’s strong debt raising capacity and timely settlement of all liabilities is supported through its cash generating abilities, which has been FFC’s core strength and is recognized by improved credit rating of AA+ for long term and maintaining highest rating of A1+ for short term by PACRA.
Capital StructureEquity improved by 14% to Rs 33.38 billion as compared to last year mainly due to improvement in revenue reserves. Equity comprised of share capital amounting to Rs 12.72 billion representing 1,272 million ordinary shares of Rs 10 each. Fauji Foundation remains the major shareholder of the Company with an equity stake of 44.35%.
Long term debt of the Company stood at a reduced balance of Rs 8.58 billion at close of the year, improving the debt / equity ratio to 20:80 from 35:65 in 2017, whereas financial leverage at year end was recorded at 1.33 times. Future projections indicate adequacy of the capital structure for the foreseeable future.
Capital Market & Market CapitalizationThe Company’s market capitalization stood at Rs 118.13 billion, depicting an increase of 17% as compared to last year, whereas the KSE-100 index dropped from 40,470 points to 37,067 points at the end of the year, registering a decrease of 8% as compared to last year.
Market price of FFC share experienced fluctuations between the highest of Rs 103.68 per share to the lowest of Rs 79.05 per share, with an average market price of Rs 94.64 per share.
Variations in share prices are principally caused by market psychology, occurrence of material events and speculative transactions by investors during the year.
Sensitivity AnalysisMarket Price Sensitivity AnalysisFFC’s financial performance is affected by various critical and non-critical variables, most of which are beyond Company's control being external in nature. FFC share prices are also sensitive to Company’s performance
and the changes in risks faced by the Company. Other factors that can affect share price include political environment in the Country, Government policies affecting industry, pricing volatility, investors’ sentiments and macro economic indicators etc.
These variables are monitored vigilantly and their impact is evaluated by carrying out sensitivity analysis besides preparation of financial forecasts as part of the Company’s Risk Mitigation Strategy, discussed in other parts of this Report.
Volu
me
Shar
e pr
ice
Rs
0
1,000
2,000
3,000
4,000
5,000
6,000
7,000
8,000
Share Price Sensitivity
1-Ja
n-18
27-J
an-1
8
22-F
ab-1
8
20-M
ar-1
8
15-A
pr-1
8
11-M
ay-1
8
6-Ju
n-18
2-Ju
l-18
28-J
ul-1
8
23-A
ug-1
8
18-S
ep-1
8
31-D
ec-1
8
5-De
c-18
9-No
v-18
14-O
ct-1
8 0
20
40
60
80
100
120
Trade vloume Price High Low
2017 20182013 2014 2015 20160
50
100
150
200
0
5
10
15
Market Capitalization, Price Earningratio & Dividend Yield
Rs b
illio
n
Perc
enta
ge /
Tim
es
Market capitalization Price earning ratio (times)Dividend yield (%)
2017 20182013 2014 2015 2016
Rs
Perc
enta
ge
0
2
4
6
8
10
12
14
16
18
0
10
20
30
40
50
60
70
80
90
EPS and Return on Equity
EPS Return on Equity
65Annual Report 2018
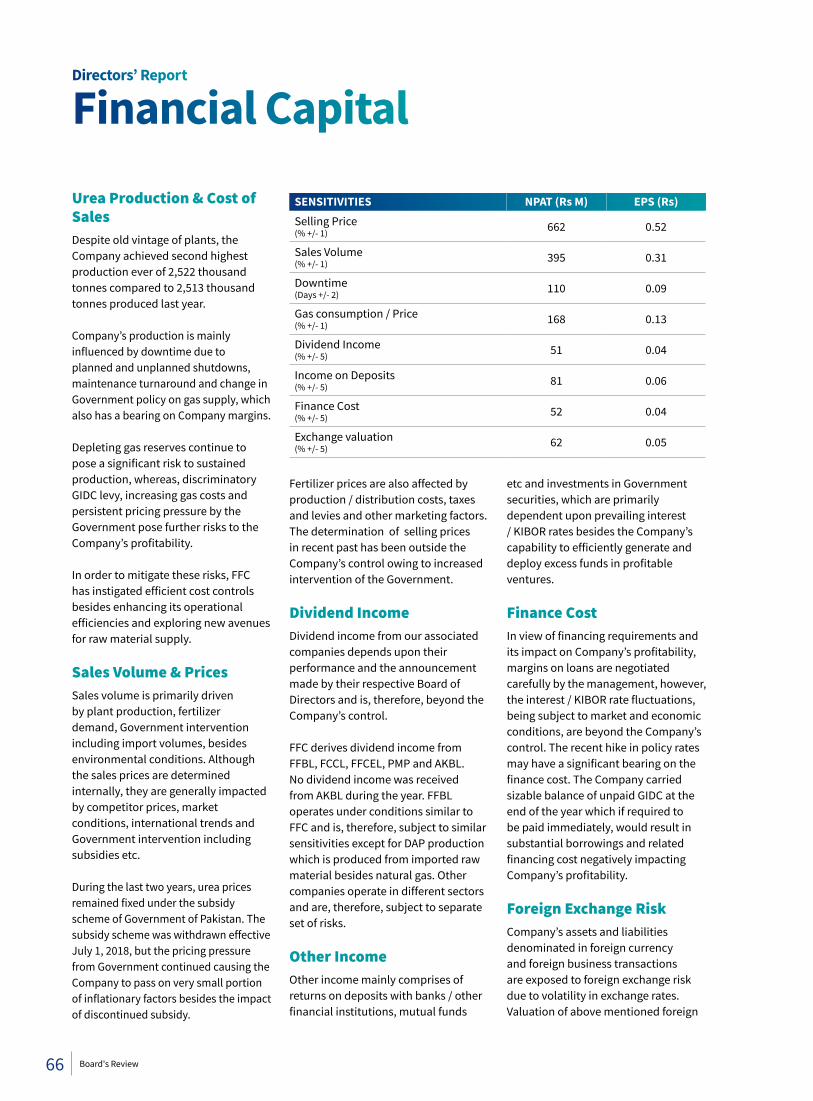
Urea Production & Cost of SalesDespite old vintage of plants, the Company achieved second highest production ever of 2,522 thousand tonnes compared to 2,513 thousand tonnes produced last year.
Company’s production is mainly influenced by downtime due to planned and unplanned shutdowns, maintenance turnaround and change in Government policy on gas supply, which also has a bearing on Company margins.
Depleting gas reserves continue to pose a significant risk to sustained production, whereas, discriminatory GIDC levy, increasing gas costs and persistent pricing pressure by the Government pose further risks to the Company’s profitability.
In order to mitigate these risks, FFC has instigated efficient cost controls besides enhancing its operational efficiencies and exploring new avenues for raw material supply.
Sales Volume & PricesSales volume is primarily driven by plant production, fertilizer demand, Government intervention including import volumes, besides environmental conditions. Although the sales prices are determined internally, they are generally impacted by competitor prices, market conditions, international trends and Government intervention including subsidies etc.
During the last two years, urea prices remained fixed under the subsidy scheme of Government of Pakistan. The subsidy scheme was withdrawn effective July 1, 2018, but the pricing pressure from Government continued causing the Company to pass on very small portion of inflationary factors besides the impact of discontinued subsidy.
Fertilizer prices are also affected by production / distribution costs, taxes and levies and other marketing factors. The determination of selling prices in recent past has been outside the Company’s control owing to increased intervention of the Government.
Dividend IncomeDividend income from our associated companies depends upon their performance and the announcement made by their respective Board of Directors and is, therefore, beyond the Company’s control.
FFC derives dividend income from FFBL, FCCL, FFCEL, PMP and AKBL. No dividend income was received from AKBL during the year. FFBL operates under conditions similar to FFC and is, therefore, subject to similar sensitivities except for DAP production which is produced from imported raw material besides natural gas. Other companies operate in different sectors and are, therefore, subject to separate set of risks.
Other IncomeOther income mainly comprises of returns on deposits with banks / other financial institutions, mutual funds
etc and investments in Government securities, which are primarily dependent upon prevailing interest / KIBOR rates besides the Company’s capability to efficiently generate and deploy excess funds in profitable ventures.
Finance CostIn view of financing requirements and its impact on Company’s profitability, margins on loans are negotiated carefully by the management, however, the interest / KIBOR rate fluctuations, being subject to market and economic conditions, are beyond the Company’s control. The recent hike in policy rates may have a significant bearing on the finance cost. The Company carried sizable balance of unpaid GIDC at the end of the year which if required to be paid immediately, would result in substantial borrowings and related financing cost negatively impacting Company’s profitability.
Foreign Exchange RiskCompany’s assets and liabilities denominated in foreign currency and foreign business transactions are exposed to foreign exchange risk due to volatility in exchange rates. Valuation of above mentioned foreign
SENSITIVITIES NPAT (Rs M) EPS (Rs)Selling Price (% +/- 1) 662 0.52
Sales Volume (% +/- 1) 395 0.31
Downtime (Days +/- 2) 110 0.09
Gas consumption / Price (% +/- 1) 168 0.13
Dividend Income(% +/- 5) 51 0.04
Income on Deposits(% +/- 5) 81 0.06
Finance Cost (% +/- 5) 52 0.04
Exchange valuation (% +/- 5) 62 0.05
Directors’ Report
Financial Capital
66 Board's Review
denominated assets and liabilities, carried out at the balance sheet date, also affects Company’s profitability.
During 2018, the Country witnessed one of the highest devaluation of Pakistani Rupee leading to inflationary pressures and higher operating cost. However, we were able to mitigate the impact of this exchange rate fluctuation to a very large extent by realizing substantial exchange gain on our foreign currency deposits with financial institutions.
Prospects of the Entity Including Targets for Financial and Non-Financial MeasuresProspects of the EntityImproved market conditions after revival of urea selling prices together with trade of imported fertilizers in line with the Company’s product realignment strategy resulted in highest ever all product revenue. Utilization of surplus funds through proactive treasury management and planned diversification projects provide sufficient support to the management’s projections of sustained earnings and returns to shareholders.
In view of expected decline in gas pressures, FFC is evaluating alternative raw material sources to sustain core operations and profitability. Owing to high cost of natural gas, alternatives such as LNG, coal gasification is also under consideration.
Fauji Fresh n Freeze continued to register growth in both local as well as international markets with OPA French Fries exceeding the sales targets. The Project is still in development phase and FFF has also engaged industry
experts to acquire market intelligence and develop strategies for market penetration as well as product range.
During the year, FFC Energy Limited recorded net earnings of Rs 1.10 billion, an improvement of 30% over last year and has declared its second dividend of Rs 1.25 per share valuing Rs 305 million. The management expects consistent returns from the project in future.
In line with the Company’s diversification strategy, FFC has acquired 30% stake in Thar Energy Limited (TEL) to establish a 330 MW mine-mouth lignite-fired power plant with equity injection of Rs 1.46 billion during the year. EPC contract and financing documents of the project have been executed while Commercial Operational Date (COD) is planned in 2021. Financial MeasuresTargets for the year were set after estimation of various factors and variables, most of which are outside the control of the Company while others can either be monitored or their impact alleviated to a possible extent.
Prices of raw materials coupled with Government intervention over fertilizer pricing, significant PKR devaluation, change in taxes and levies, in addition to weather and natural calamities are all external factors affecting the Company’s cost of production.
Thorough evaluation and effective implementation was carried out during the year in order for the Company to achieve its set goals and targets. This is evident from the fact that despite Government intervention in pricing and higher taxation on imported fertilizers, exceptional sales / revenues were achieved in excess of the operating targets in 2018.
Looking forward, significant increase in gas prices, substantial devaluation of PKR, besides persistent pricing pressure and regulatory measures on the fertilizer industry, continue to pose risks to the operations and profitability of the Company. Favorable Governmental policies including elimination of the significant disparity between input and output GST rates, besides settlement of long outstanding subsidy dues, are, therefore, vital towards the sustainability of the fertilizer industry as well as ensuring food security in the Country.
Non-Financial MeasuresFollowing key non-financial measures are identified as critical for the Company:• Transparency, accountability and
good governance• Compliance with the regulatory
framework • Relationship with customers and
business partners• Responsibility towards the society• Energy conservation• Employee satisfaction and
wellbeing• Maintenance of product quality
for fulfillment of customer needs • Corporate image• Stakeholders’ engagement• Brand preference• Environmental protection
Responsibility for implementation of these measures is delegated to the management with regular monitoring and control by the Board.
Analysis on non-financial performance is disclosed in detail in the Sustainability section of this Report.
67Annual Report 2018
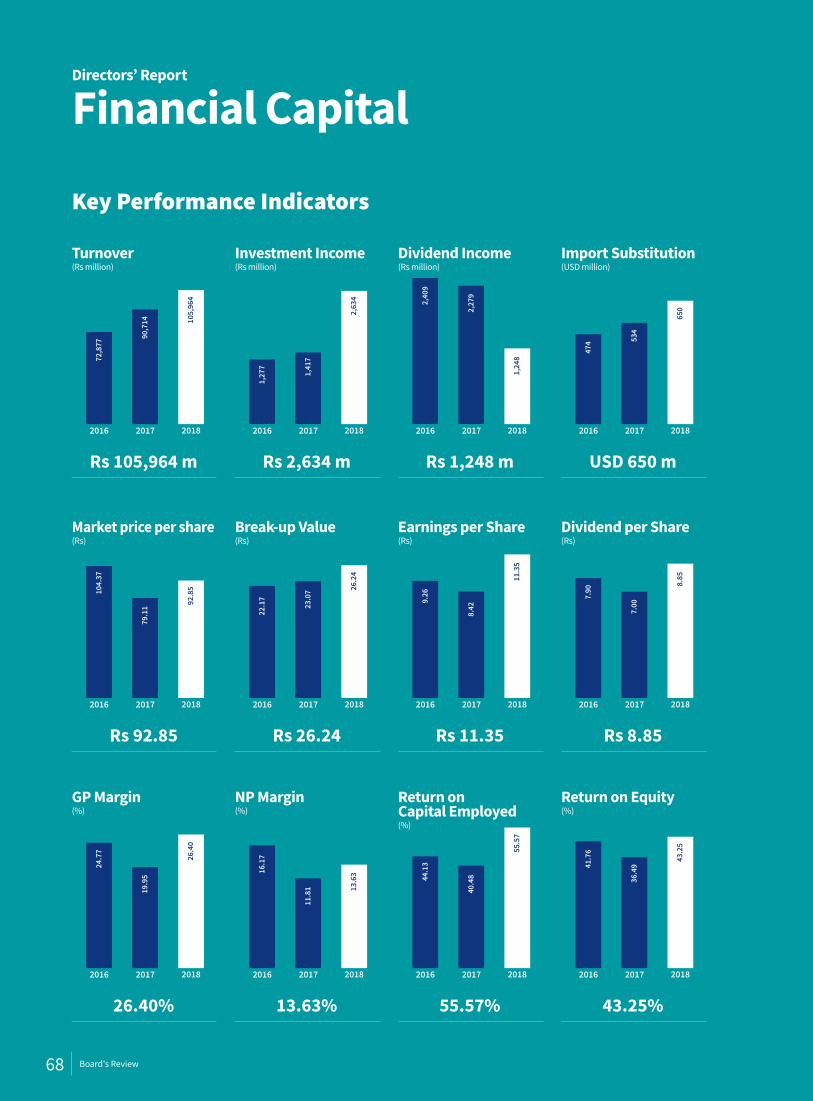
Directors’ Report
Financial Capital
Key Performance Indicators
2017 20182016
Rs 105,964 m
Turnover(Rs million)
72,8
77
90,7
14 105,
964
Rs 2,634 m
Investment Income(Rs million)
1,27
7
1,41
7
2,63
4
2017 20182016
Rs 1,248 m
Dividend Income(Rs million)
2,40
9
2,27
9
1,24
8
2017 20182016 2017 20182016
USD 650 m
Import Substitution(USD million)
474 53
4
650
2017 20182016
Rs 92.85
Market price per share(Rs)
104.
37
79.1
1 92.8
5
2017 20182016
Rs 26.24
Break-up Value(Rs)
22.1
7
23.0
7 26.2
4
2017 20182016
Rs 11.35
Earnings per Share(Rs)
9.26
8.42
11.3
5
2017 20182016
Rs 8.85
Dividend per Share(Rs)
7.90
7.00
8.85
2017 20182016
26.40%
GP Margin(%)
24.7
7
19.9
5
26.4
0
2017 20182016
13.63%
NP Margin(%)
16.1
7
11.8
1 13.6
3
2017 20182016
55.57%
Return on Capital Employed(%)
44.1
3
40.4
8
55.5
7
2017 20182016
43.25%
Return on Equity(%)
41.7
6
36.4
9
43.2
5
68 Board's Review
Changes in financial indicators compared to previous years have been explained in detail in the Financial Capital section of this Report.
Management’s Responsibility Towards the Financial Statements The management of the Company is responsible for adopting sound accounting policies, establishing and maintaining a system of internal controls and preparation and presentation of the financial statements in conformity with the approved accounting standards and the requirements of the Companies Act, 2017.
Statement Of Unreserved Compliance Of IFRS Issued By IASBCompany’s financial statements have been prepared in accordance with the approved accounting standards as applicable in Pakistan. Approved accounting standards comprise of such International Financial Reporting Standards (IFRSs) issued by the International Accounting Standards Board (IASB) as are notified under the Companies Act, 2017. In case requirements differ, the provisions or directives of the Companies Act, 2017, shall prevail.
Note 3.21 of the financial statements specifies the standards and interpretations which are yet to be effective in Pakistan. The Company believes that the impact of these standards and interpretations does
not have any material impact on the financial statements.
Risk and Opportunity ReportFFC’s ability to create value for its shareholders is affected primarily by changes in the macro-economic environment in which it operates and associated risks and opportunities. Accordingly, the Company performs an in-depth analysis of internal, external and industry-specific risks and opportunities in order to develop effective strategies.
Risk Management PolicyThe Board of Directors has overall responsibility for the establishment and oversight of an effective risk management framework in the Company. The Board is also responsible for developing and monitoring risk management policies to determine the Company’s level of risk tolerance.
Risk Management Policy of the Company presents a mechanism for identification and management of risk including evaluating and devising a mechanism to minimize the negative impact of such risks on Company business. The Policy provides entity-wide risk management guidelines that cover key risk areas, including Strategic, Commercial, Reputational, Operational, Financial, Political and other risks.
Assessment of Principle RisksThe Board of Directors has carried out an in depth and critical analysis of the principal risks / threats faced
Methods and Assumptions Used in Compiling The IndicatorsKey performance indicators effectively reflect the Company’s performance. The management regularly analyzes these indicators to better gauge the Company’ performance against pre-defined benchmarks. Some of the basic indicators of the Company’s performance and profitability have been mentioned above.
Turnover represents the total amount of revenue generated by the business during the mentioned periods. It aids in tracking sales levels trends in order to spot meaningful changes in activity levels. Investment income includes subsidy income in addition to interest and dividend earned on investments made by the Company.
Market price per share is the measure of perception of the Company in the market. The difference between Book Value and Market Value shows investors’ confidence on script.
Earnings per share measures the net earnings of the Company against the total outstanding shares, whereas dividend per share represents dividend declared by the Company for every outstanding ordinary share. The Company manages its dividend policy with the purpose of increasing shareholders’ wealth. The dividend payment is an indicator of how well earnings support the dividends. Profitability ratios analyze the Company’s financial health.
Changes in Financial and Non-Financial IndicatorsThere were no significant changes in the financial and non-financial indicators as compared to previous years.
69Annual Report 2018
by the Company business, including those that would threaten the business model, future performance, solvency or liquidity of the Company.
The Board has delegated the responsibility of monitoring and control of business risks to the management of the Company.
Business Strategy Committee (BSC), comprising of senior management of the Company and headed by the CE&MD, is responsible for the overall implementation and oversight of risk identification and management policy and procedures. All Functions / Departments of the Company are responsible for identification and evaluation of all types of risks relating to their areas, devising adequate mitigating strategies thereof and report any changes / additions therein to BSC on half-yearly basis.
Status of the risk identification and mitigation measures implemented by the Company is also updated to the Board on half-yearly basis.
Key Sources of UncertaintyPreparation of financial statements in conformity with the International Financial reporting Standards involves judgments, estimates and assumptions that affect the application of accounting policies and the reported amounts of assets and liabilities, income and expenses.
The estimates and relevant assumptions are based on historical experience and various other factors that are believed to be reasonable under the circumstances, the results of which form the basis of making judgments about the carrying values of assets and liabilities that are not readily apparent from other sources.
Actual results may differ from these estimates.These estimates and underlying assumptions are reviewed on an ongoing basis. Revisions to accounting estimates are recognized in the period in which the estimates are revised if the revision affects only that period, or in the period of the revision and future periods.
Details of significant accounting estimates and judgments including those related to retirement benefits, estimation of useful life of property, plant and equipment and intangible assets, recoverable amount of goodwill and investment in associated companies along with provision of taxation, have been disclosed in Note 2.4 to the both separate and consolidated financial statements of the Company.
Strategic, Commercial, Operational and Financial RisksFFC’s proactive culture of risk management and its effective systems identify, assess and mitigate various risks and uncertainties that come across during ordinary course of business in a timely manner.
The strategic, commercial, operational and financial risks can arise from uncertainty in financial markets, system breakdowns, project delays, fluctuations in product markets including Government price pressures, competitive position, legal liabilities, credit risk, accidents, natural causes and disasters, or other events of uncertain or unpredictable nature.
These key sources of uncertainty in estimation carry a significant risk which may cause a material adjustment to the carrying amounts of assets and liabilities within the next financial year. These risks are detailed in the following sections:
Strategic RisksStrategic risks are mostly external, associated with operating in a particular industry and are beyond Company’s control and are created by the Company’s strategic objectives and business strategy decisions that could affect its long term positioning and performance. The Board of Directors actively oversees the management of these risks and devises mitigating strategies wherever required.
Commercial RisksThese risks emanate from the commercial substance of an organization. Decline in an entity’s market share owing to demand supply, product price regulation by Government or a new constitutional amendment posing threat to the organization’s profitability and commercial viability are a few examples of these risks.
Operational RisksThese are risks associated with internal factors, administrative and operational procedures like employee turnover, supply chain disruption, IT system shutdowns or control failures.
Financial RisksFinancial risks are divided in the following categories:
I. Credit Risk
Credit risk is the risk of financial loss to a Company if a customer or counterparty to a financial instrument fails to meet its contractual obligations, and arises principally from trade debts, investments, loans and advances, deposits, other receivables, short term investments and bank balances.
The Company limits its exposure to credit risk by investing only
Directors’ Report
Financial Capital
70 Board's Review
in liquid securities and with counterparties that have high credit rating. Management actively monitors credit ratings and given that the Company has invested in securities with high ratings only, management does not expect any counterparty to fail in meeting its obligations.
II. Market Risk
Market risk is the risk that value of financial instruments may fluctuate as a result of changes in market interest rates or the market price due to change in credit rating of the issuer or the instrument, change in market sentiments, speculative activities, supply and demand of securities and liquidity in the market. The Company incurs financial liabilities to manage its market risk. All such activities are carried out with the approval of the Board.
III. Liquidity Risk
Liquidity risk is the risk that the Company will not be able to meet its financial obligations as they fall due. The Company’s approach to managing liquidity is to ensure, as far as possible, that it will always have sufficient liquidity to meet its liabilities when due, under both normal and stressed conditions, without incurring unacceptable losses or risking damage to the Company’s reputation.
The Company has improved its long term rating of AA to AA+ and maintained highest short term rating of A1+ during the year, evidencing our strong liquidity position. The Company uses different methods to monitor cash flow requirements and optimize its cash return on investments.
The Company proactively ensures availability of sufficient cash through arrangement of adequate
lines of credit, to meet expected operational expenses for a reasonable period, including the servicing of financial obligations; this excludes the potential impact of extreme circumstances that cannot be predicted in a reasonable manner, such as natural disasters.
Plans and Strategies for Mitigating these Risks and Potential OpportunitiesRISK GOVERNANCEThe roles and responsibilities at various levels of our risk management program are outlined in our risk governance structure.
I. Board and Committees
The Board oversees the risk management process primarily through its committees:
• The Audit Committee monitors the Company’s risk management process on half yearly basis, focusing primarily on financial and regulatory compliance risks
• The Human Resources & Remuneration Committee focuses on risks in its area of oversight, including assessment of compensation programs to ensure they do not escalate corporate risk, in addition to succession planning with a view to ensure availability of competent human resources in each area of critical Company operations
• The System & Technology Committee evaluates the need for technological upgradation in various processes to reduce the risk of obsolescence and inefficiency in plant operations besides determining the capital expenditure requirements to sustain plant efficiencies
while keeping control over unnecessary cash outflows
• The Projects Diversification Committee focuses on exploring new opportunities for expansion and risk diversification ensuring that thorough due diligence is carried out covering all aspects of the project before according its recommendation to the Board
II. Policies & Procedures
Policies and procedures represent a vital part of the Company’s risk governance framework and ensure management of financial, operational and compliance risks. Board and its committees have adopted a set of policies and procedures based on best practices, promoting a culture of ethics and values with authority delegated to senior management for appropriate implementation.
III. Control Activities
Senior management assesses the risks and places appropriate controls to mitigate and respond to these risks through preventive, detective and corrective actions.
IV. Performance Management
In order to avoid risks associated with performance, a continuous cycle of monitoring is carried out to evaluate and analyse the effectiveness of implemented controls and to identify areas of weakness to devise strategic plans for improvement.
V. Internal Audit
Internal Audit function provides independent and objective evaluations and reports to the Audit Committee on the effectiveness of governance, risk management and control processes.
71Annual Report 2018
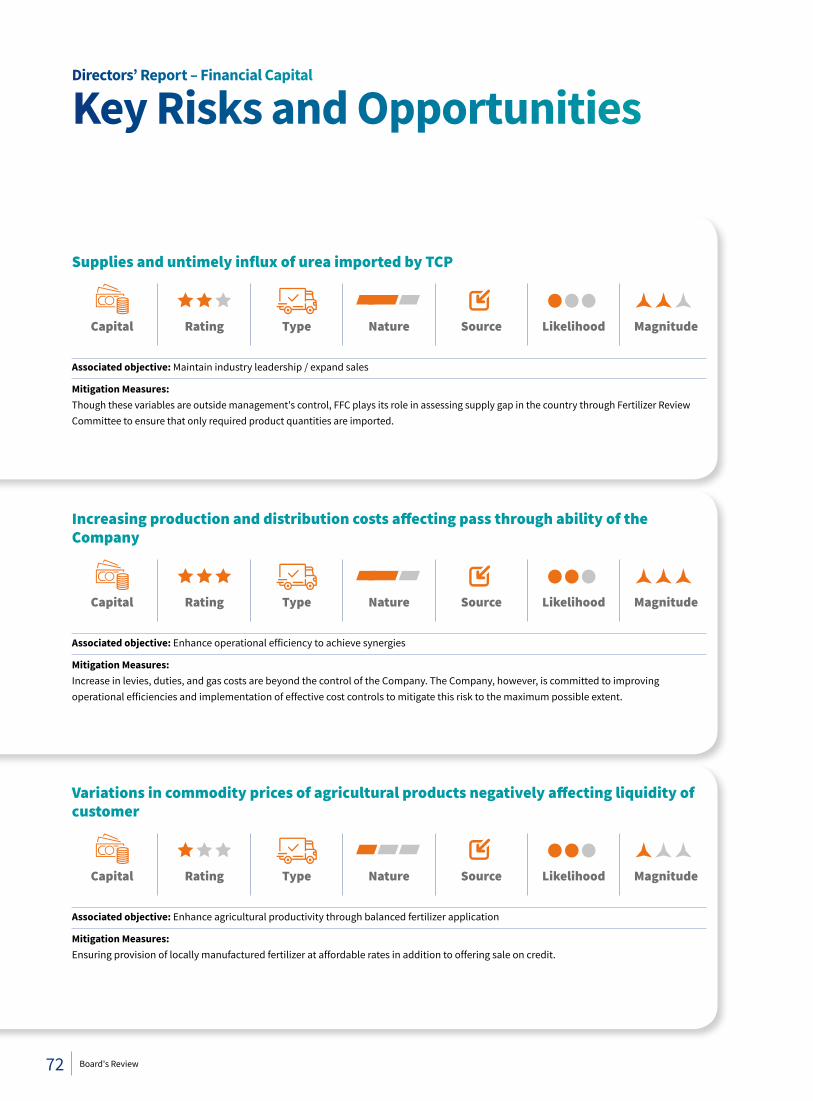
Directors’ Report – Financial Capital
Key Risks and Opportunities
Supplies and untimely influx of urea imported by TCP
Associated objective: Maintain industry leadership / expand sales
Mitigation Measures:Though these variables are outside management's control, FFC plays its role in assessing supply gap in the country through Fertilizer Review Committee to ensure that only required product quantities are imported.
Capital Rating Nature Source Likelihood MagnitudeType
Increasing production and distribution costs affecting pass through ability of the Company
Associated objective: Enhance operational efficiency to achieve synergies
Mitigation Measures:Increase in levies, duties, and gas costs are beyond the control of the Company. The Company, however, is committed to improving operational efficiencies and implementation of effective cost controls to mitigate this risk to the maximum possible extent.
Capital Rating Type Nature Source Likelihood Magnitude
Variations in commodity prices of agricultural products negatively affecting liquidity of customer
Associated objective: Enhance agricultural productivity through balanced fertilizer application
Mitigation Measures:Ensuring provision of locally manufactured fertilizer at affordable rates in addition to offering sale on credit.
Capital Rating Type Nature Source Likelihood Magnitude
72 Board's Review
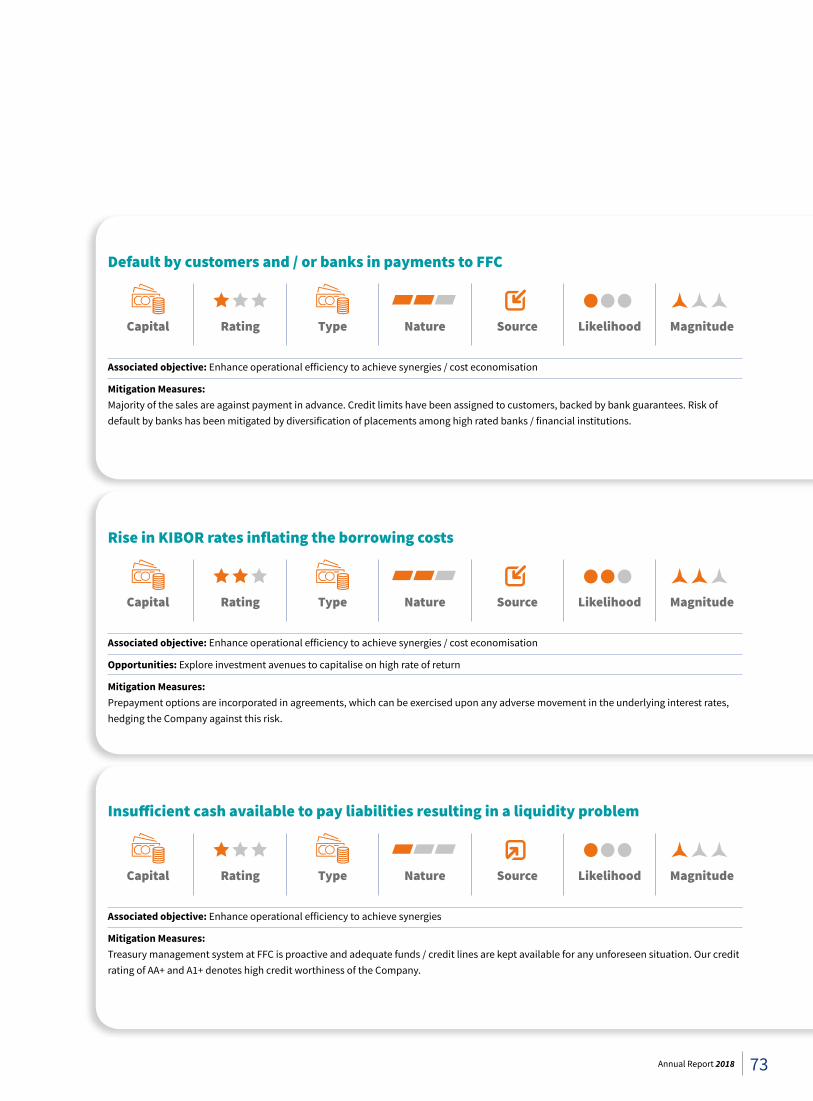
Default by customers and / or banks in payments to FFC
Associated objective: Enhance operational efficiency to achieve synergies / cost economisation
Mitigation Measures:Majority of the sales are against payment in advance. Credit limits have been assigned to customers, backed by bank guarantees. Risk of default by banks has been mitigated by diversification of placements among high rated banks / financial institutions.
Capital Rating Type Nature Source Likelihood Magnitude
Insufficient cash available to pay liabilities resulting in a liquidity problem
Associated objective: Enhance operational efficiency to achieve synergies
Mitigation Measures:Treasury management system at FFC is proactive and adequate funds / credit lines are kept available for any unforeseen situation. Our credit rating of AA+ and A1+ denotes high credit worthiness of the Company.
Capital Rating Type Nature Source Likelihood Magnitude
Rise in KIBOR rates inflating the borrowing costs
Associated objective: Enhance operational efficiency to achieve synergies / cost economisation
Opportunities: Explore investment avenues to capitalise on high rate of return
Mitigation Measures:Prepayment options are incorporated in agreements, which can be exercised upon any adverse movement in the underlying interest rates, hedging the Company against this risk.
Capital Rating Type Nature Source Likelihood Magnitude
73Annual Report 2018
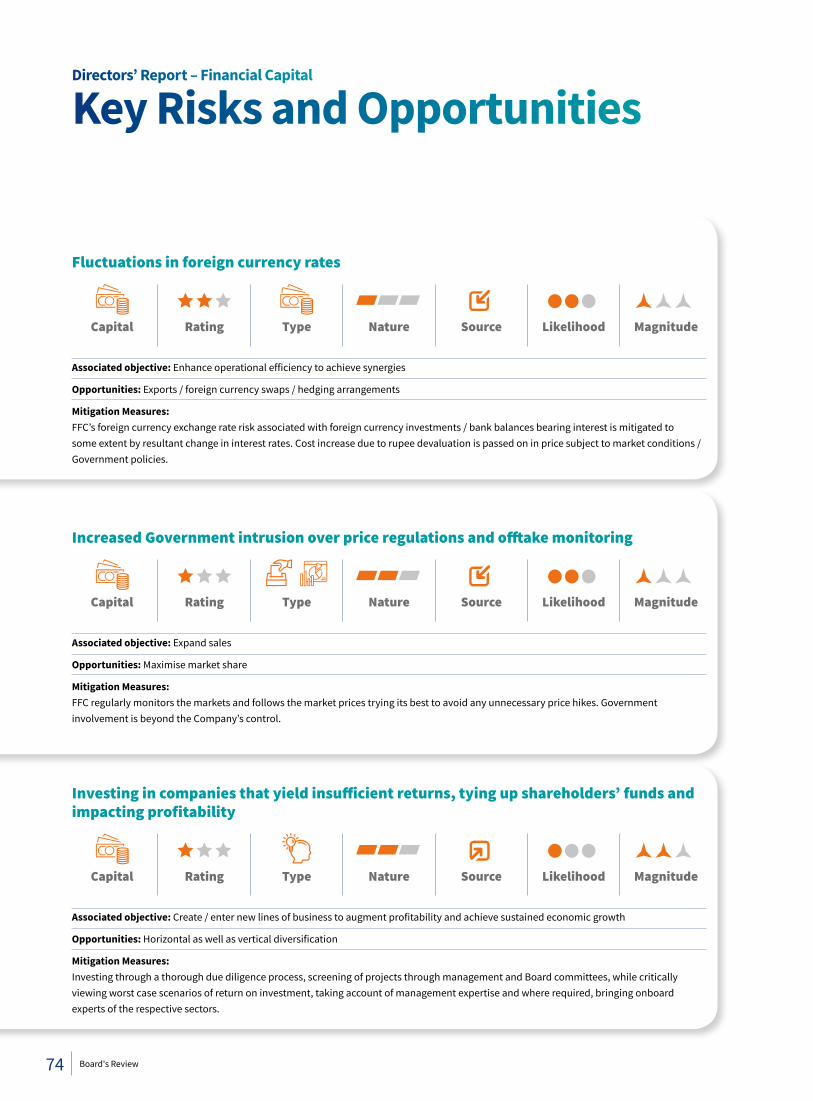
Fluctuations in foreign currency rates
Associated objective: Enhance operational efficiency to achieve synergies
Opportunities: Exports / foreign currency swaps / hedging arrangements
Mitigation Measures:FFC’s foreign currency exchange rate risk associated with foreign currency investments / bank balances bearing interest is mitigated to some extent by resultant change in interest rates. Cost increase due to rupee devaluation is passed on in price subject to market conditions / Government policies.
Capital Rating Type Nature Source Likelihood Magnitude
Increased Government intrusion over price regulations and offtake monitoring
Associated objective: Expand sales
Opportunities: Maximise market share
Mitigation Measures:FFC regularly monitors the markets and follows the market prices trying its best to avoid any unnecessary price hikes. Government involvement is beyond the Company’s control.
Capital Rating Nature Source Likelihood MagnitudeType
Investing in companies that yield insufficient returns, tying up shareholders’ funds and impacting profitability
Associated objective: Create / enter new lines of business to augment profitability and achieve sustained economic growth
Opportunities: Horizontal as well as vertical diversification
Mitigation Measures:Investing through a thorough due diligence process, screening of projects through management and Board committees, while critically viewing worst case scenarios of return on investment, taking account of management expertise and where required, bringing onboard experts of the respective sectors.
Capital Rating Nature Source Likelihood MagnitudeType
Directors’ Report – Financial Capital
Key Risks and Opportunities
74 Board's Review
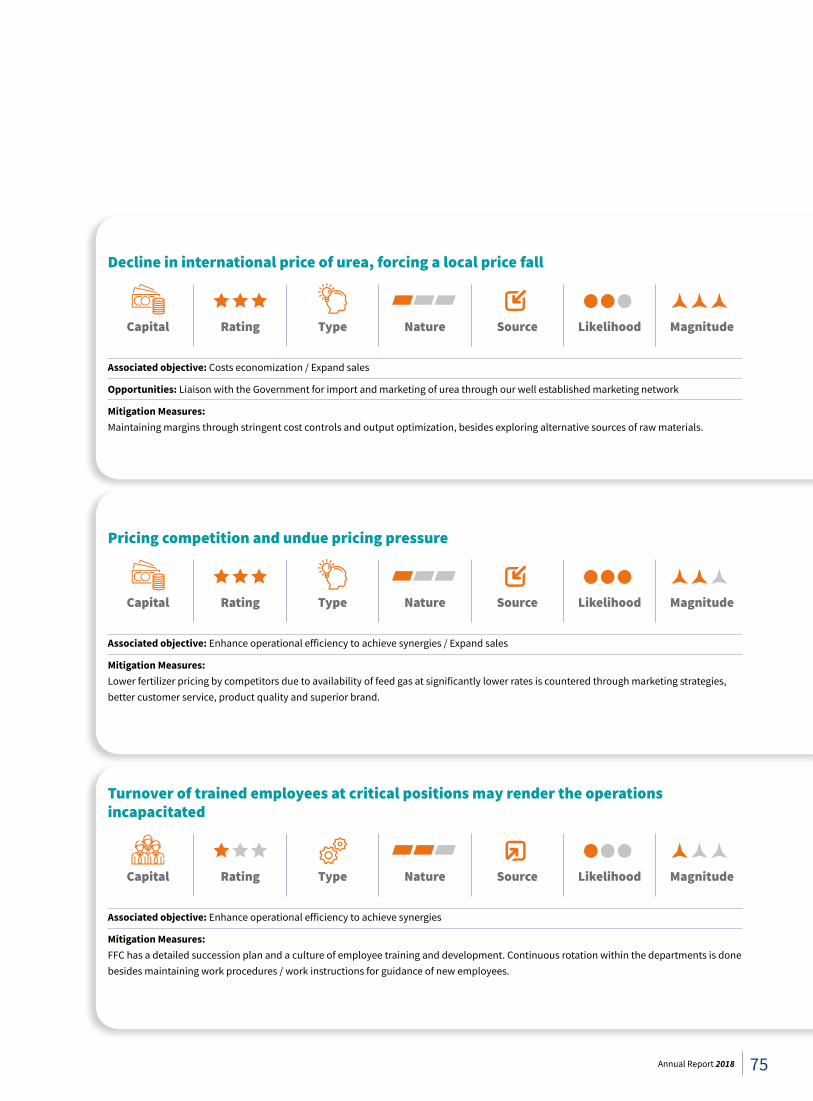
Decline in international price of urea, forcing a local price fall
Associated objective: Costs economization / Expand sales
Opportunities: Liaison with the Government for import and marketing of urea through our well established marketing network
Mitigation Measures:Maintaining margins through stringent cost controls and output optimization, besides exploring alternative sources of raw materials.
Capital Rating Nature Source Likelihood MagnitudeType
Pricing competition and undue pricing pressure
Associated objective: Enhance operational efficiency to achieve synergies / Expand sales
Mitigation Measures:Lower fertilizer pricing by competitors due to availability of feed gas at significantly lower rates is countered through marketing strategies, better customer service, product quality and superior brand.
Capital Rating Nature Source Likelihood MagnitudeType
Turnover of trained employees at critical positions may render the operations incapacitated
Associated objective: Enhance operational efficiency to achieve synergies
Mitigation Measures:FFC has a detailed succession plan and a culture of employee training and development. Continuous rotation within the departments is done besides maintaining work procedures / work instructions for guidance of new employees.
Capital Rating Nature Source Likelihood MagnitudeType
75Annual Report 2018
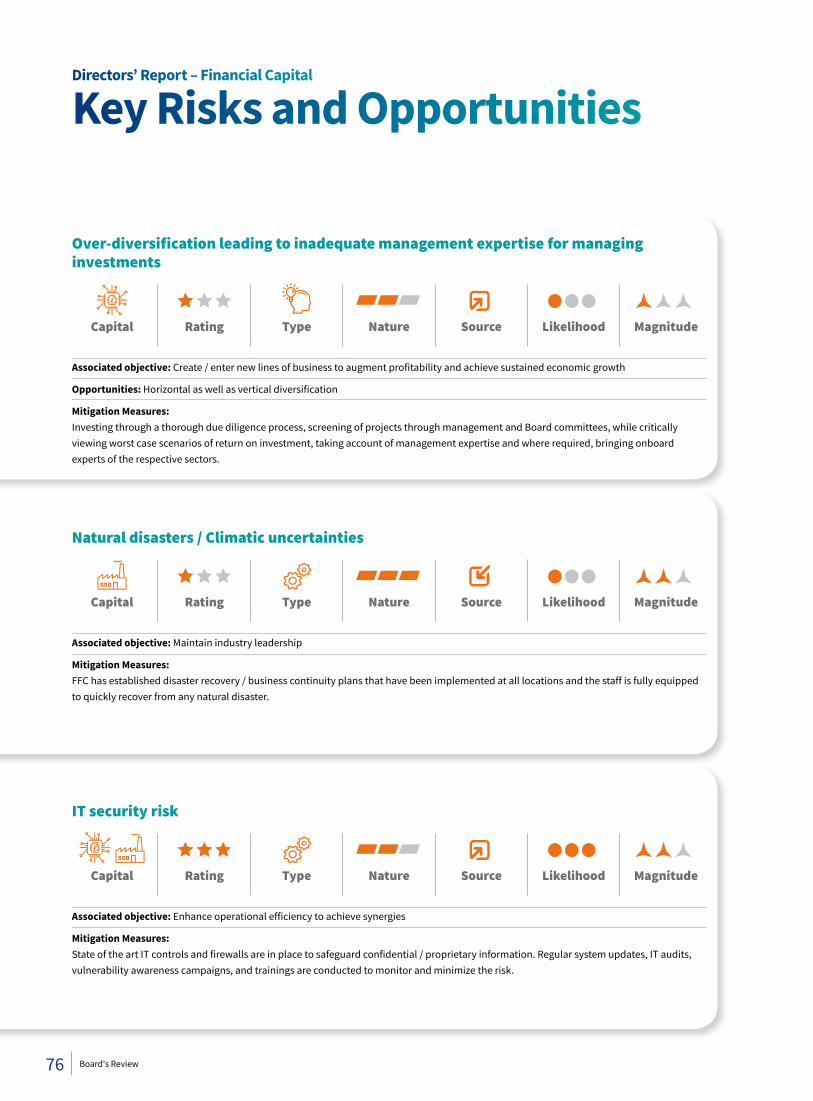
Natural disasters / Climatic uncertainties
Associated objective: Maintain industry leadership
Mitigation Measures:FFC has established disaster recovery / business continuity plans that have been implemented at all locations and the staff is fully equipped to quickly recover from any natural disaster.
Capital Rating Nature Source Likelihood MagnitudeType
IT security risk
Associated objective: Enhance operational efficiency to achieve synergies
Mitigation Measures:State of the art IT controls and firewalls are in place to safeguard confidential / proprietary information. Regular system updates, IT audits, vulnerability awareness campaigns, and trainings are conducted to monitor and minimize the risk.
Capital Rating Nature Source Likelihood MagnitudeType
Nature Source Likelihood Magnitude
Over-diversification leading to inadequate management expertise for managing investments
Associated objective: Create / enter new lines of business to augment profitability and achieve sustained economic growth
Opportunities: Horizontal as well as vertical diversification
Mitigation Measures:Investing through a thorough due diligence process, screening of projects through management and Board committees, while critically viewing worst case scenarios of return on investment, taking account of management expertise and where required, bringing onboard experts of the respective sectors.
Capital Rating Type
Directors’ Report – Financial Capital
Key Risks and Opportunities
76 Board's Review
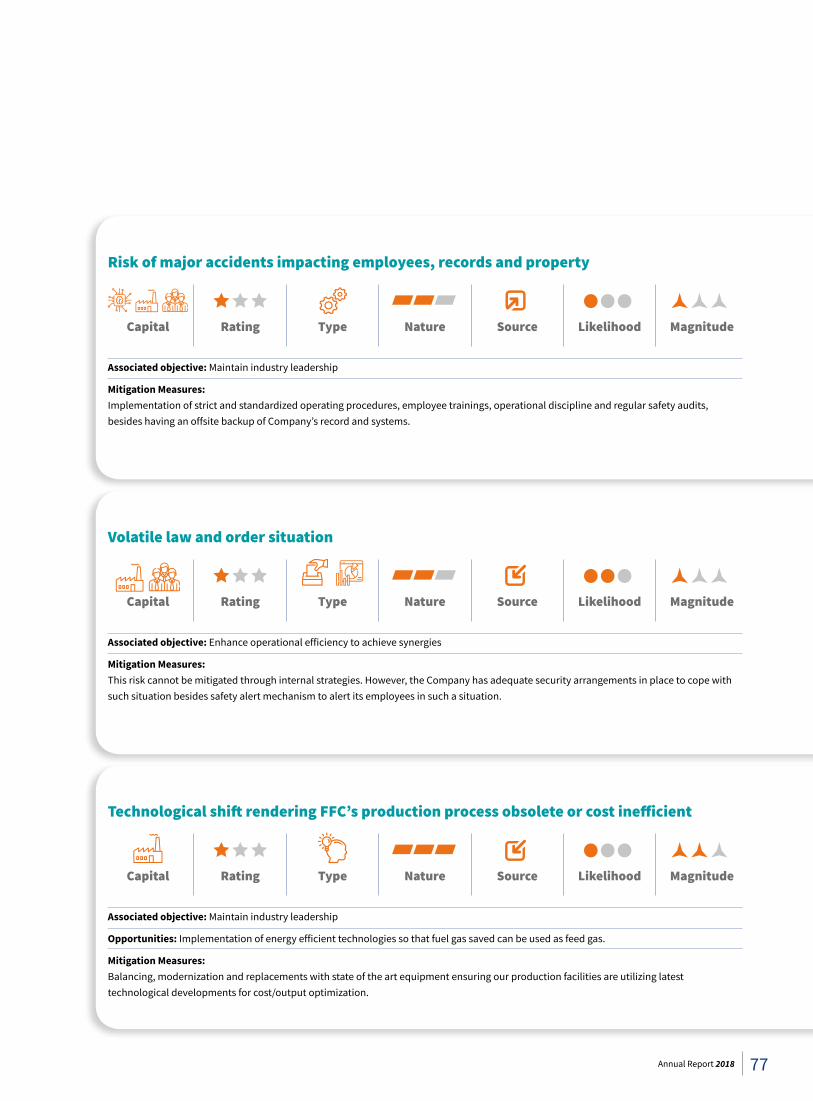
Risk of major accidents impacting employees, records and property
Associated objective: Maintain industry leadership
Mitigation Measures:Implementation of strict and standardized operating procedures, employee trainings, operational discipline and regular safety audits, besides having an offsite backup of Company’s record and systems.
Capital Rating Nature Source Likelihood MagnitudeType
Volatile law and order situation
Associated objective: Enhance operational efficiency to achieve synergies
Mitigation Measures:This risk cannot be mitigated through internal strategies. However, the Company has adequate security arrangements in place to cope with such situation besides safety alert mechanism to alert its employees in such a situation.
Capital Rating Nature Source Likelihood MagnitudeType
Technological shift rendering FFC’s production process obsolete or cost inefficient
Associated objective: Maintain industry leadership
Opportunities: Implementation of energy efficient technologies so that fuel gas saved can be used as feed gas.
Mitigation Measures:Balancing, modernization and replacements with state of the art equipment ensuring our production facilities are utilizing latest technological developments for cost/output optimization.
Capital Rating Nature Source Likelihood MagnitudeType
77Annual Report 2018
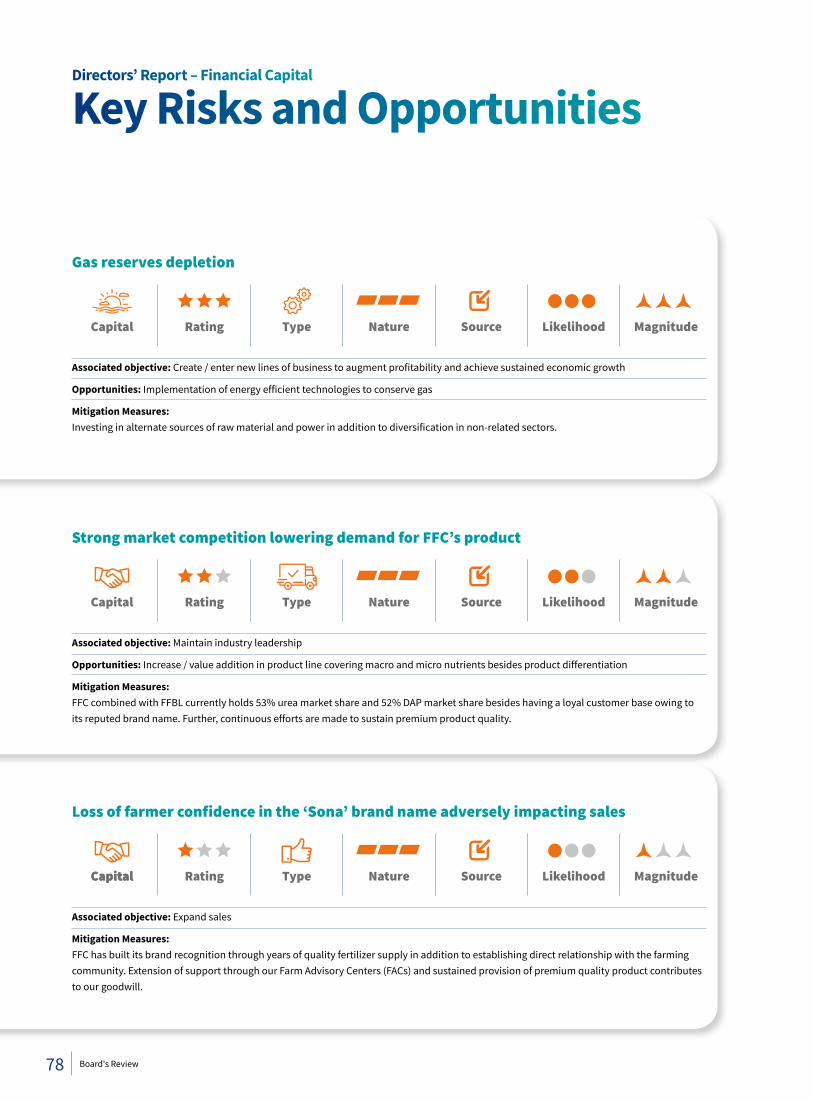
Nature Source Likelihood Magnitude
Gas reserves depletion
Associated objective: Create / enter new lines of business to augment profitability and achieve sustained economic growth
Opportunities: Implementation of energy efficient technologies to conserve gas
Mitigation Measures:Investing in alternate sources of raw material and power in addition to diversification in non-related sectors.
Capital Rating Type
Strong market competition lowering demand for FFC’s product
Associated objective: Maintain industry leadership
Opportunities: Increase / value addition in product line covering macro and micro nutrients besides product differentiation
Mitigation Measures:FFC combined with FFBL currently holds 53% urea market share and 52% DAP market share besides having a loyal customer base owing to its reputed brand name. Further, continuous efforts are made to sustain premium product quality.
Rating Nature Source Likelihood MagnitudeCapital Type
Loss of farmer confidence in the ‘Sona’ brand name adversely impacting sales
Associated objective: Expand sales
Mitigation Measures:FFC has built its brand recognition through years of quality fertilizer supply in addition to establishing direct relationship with the farming community. Extension of support through our Farm Advisory Centers (FACs) and sustained provision of premium quality product contributes to our goodwill.
Capital Rating Nature Source Likelihood MagnitudeTypeCapital
Directors’ Report – Financial Capital
Key Risks and Opportunities
78 Board's Review
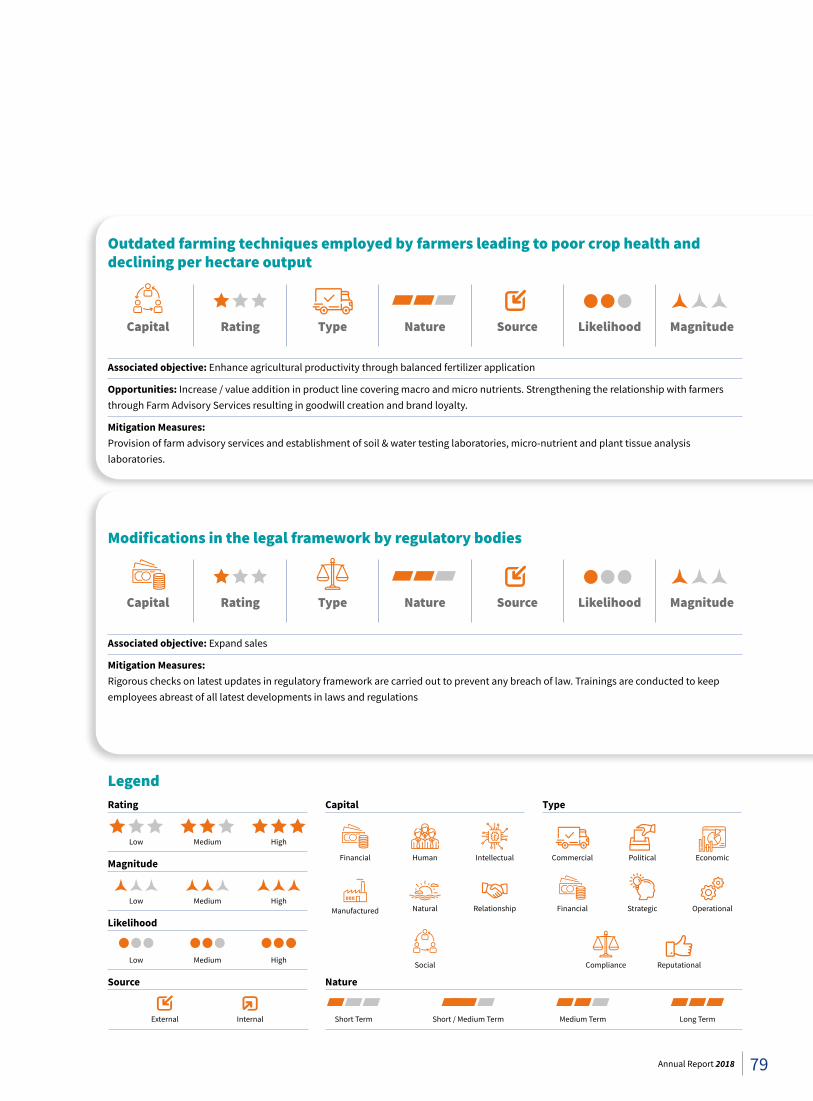
Legend
Outdated farming techniques employed by farmers leading to poor crop health and declining per hectare output
Associated objective: Enhance agricultural productivity through balanced fertilizer application
Opportunities: Increase / value addition in product line covering macro and micro nutrients. Strengthening the relationship with farmers through Farm Advisory Services resulting in goodwill creation and brand loyalty.
Mitigation Measures:Provision of farm advisory services and establishment of soil & water testing laboratories, micro-nutrient and plant tissue analysis laboratories.
Capital Rating Nature Source Likelihood MagnitudeType
Modifications in the legal framework by regulatory bodies
Associated objective: Expand sales
Mitigation Measures:Rigorous checks on latest updates in regulatory framework are carried out to prevent any breach of law. Trainings are conducted to keep employees abreast of all latest developments in laws and regulations
Capital Rating Nature Source Likelihood MagnitudeType
Low Medium High
Rating
Short Term Short / Medium Term Medium Term Long Term
Nature
Low Medium High
Likelihood
Low Medium High
Magnitude
Source
External Internal
Financial Human
Capital
Natural
Intellectual
RelationshipManufactured
Social
Financial Strategic
Type
Commercial Political Economic
Operational
Compliance Reputational
79Annual Report 2018
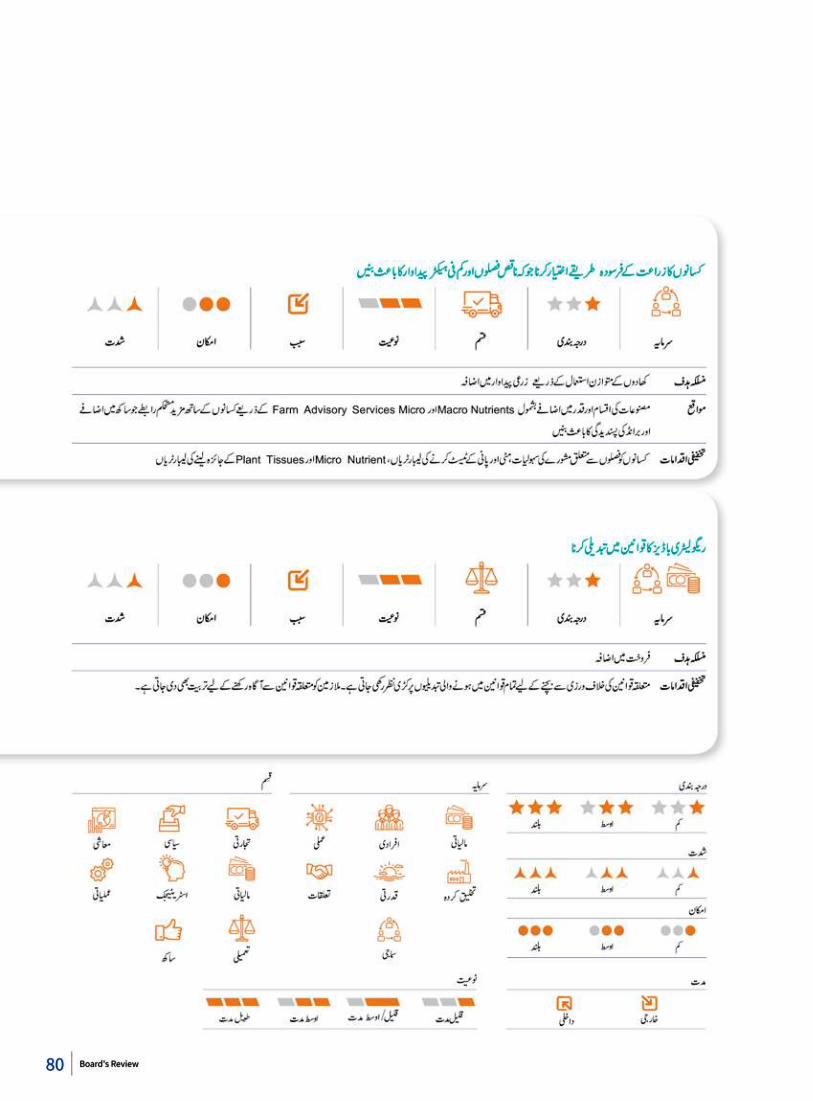
80 Board's Review
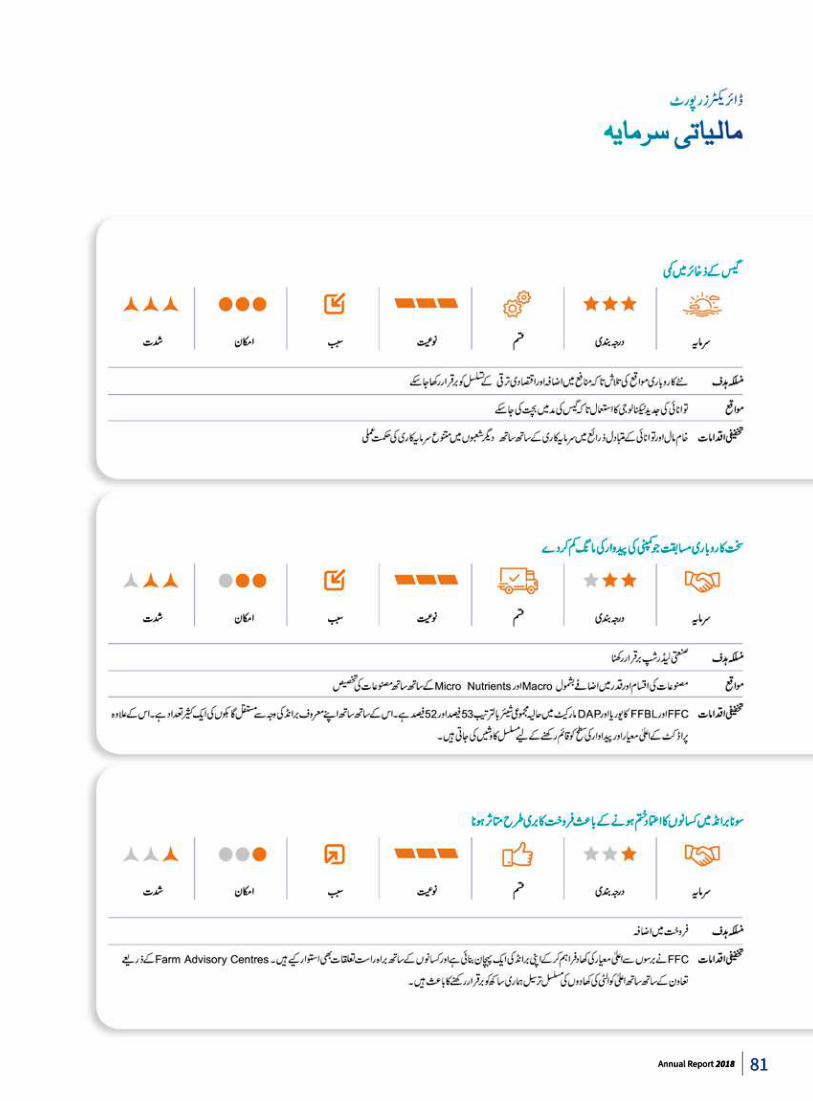
81Annual Report 2018
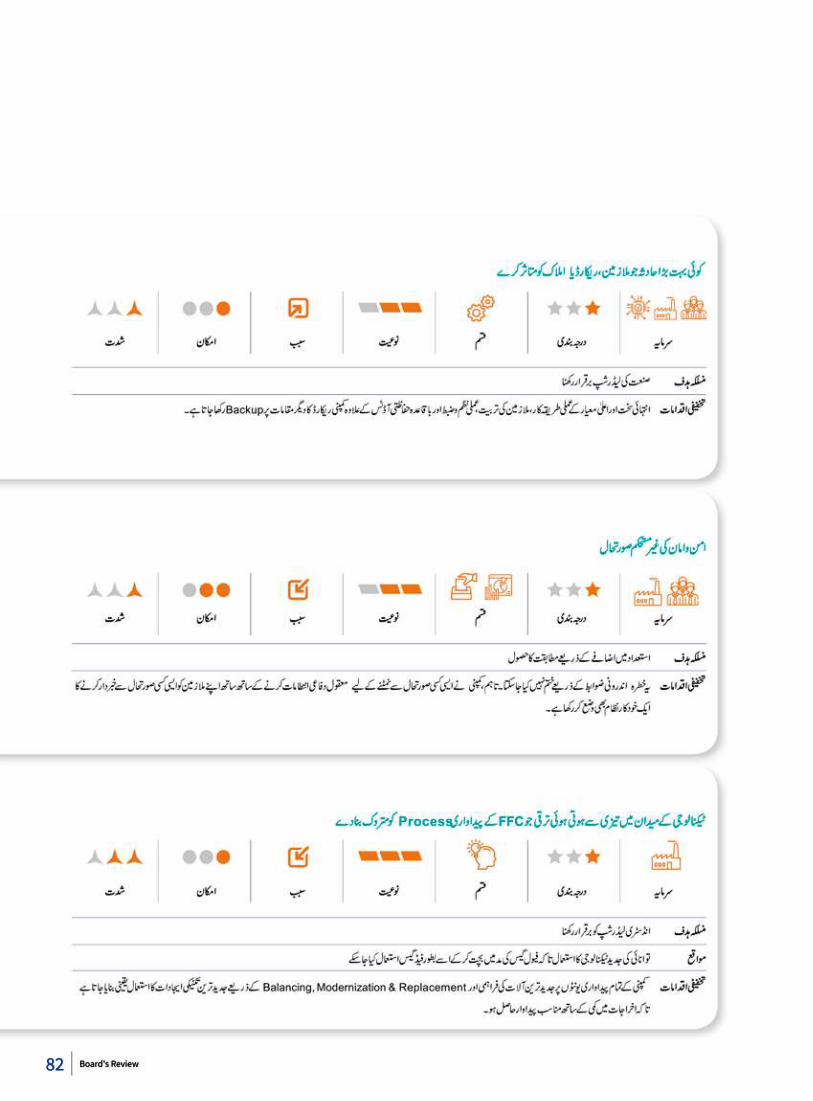
82 Board's Review
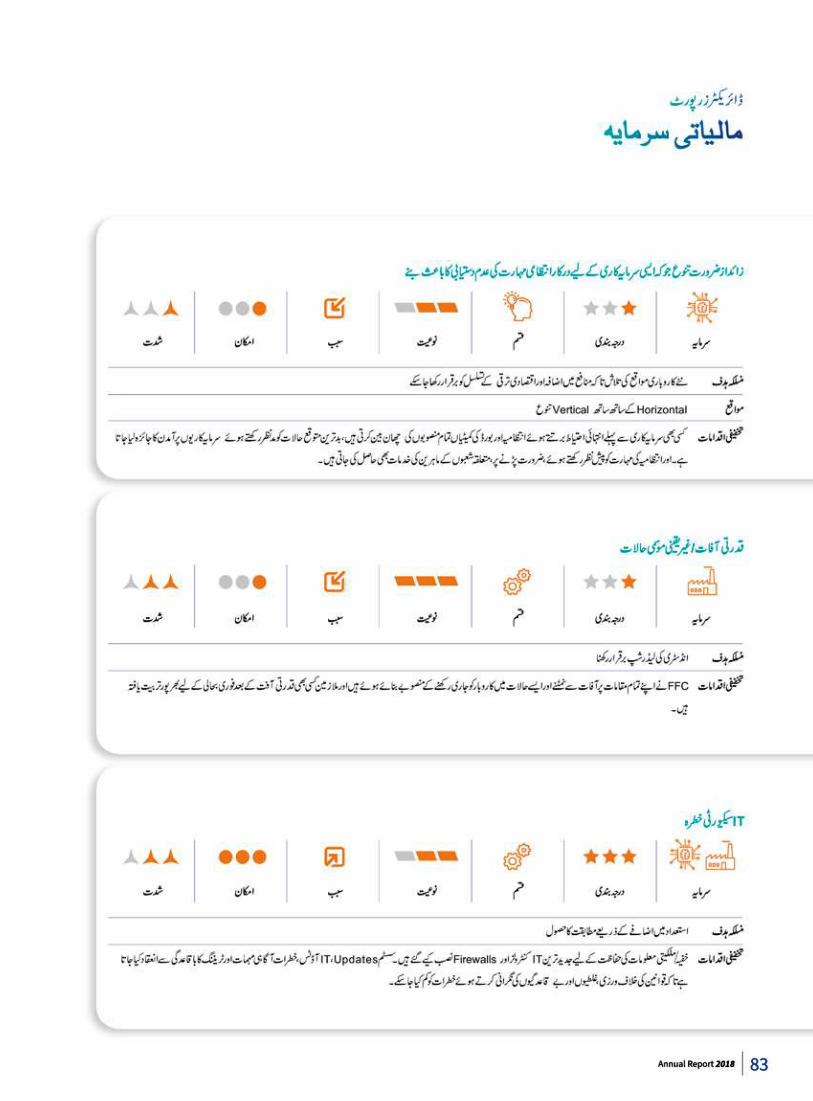
83Annual Report 2018
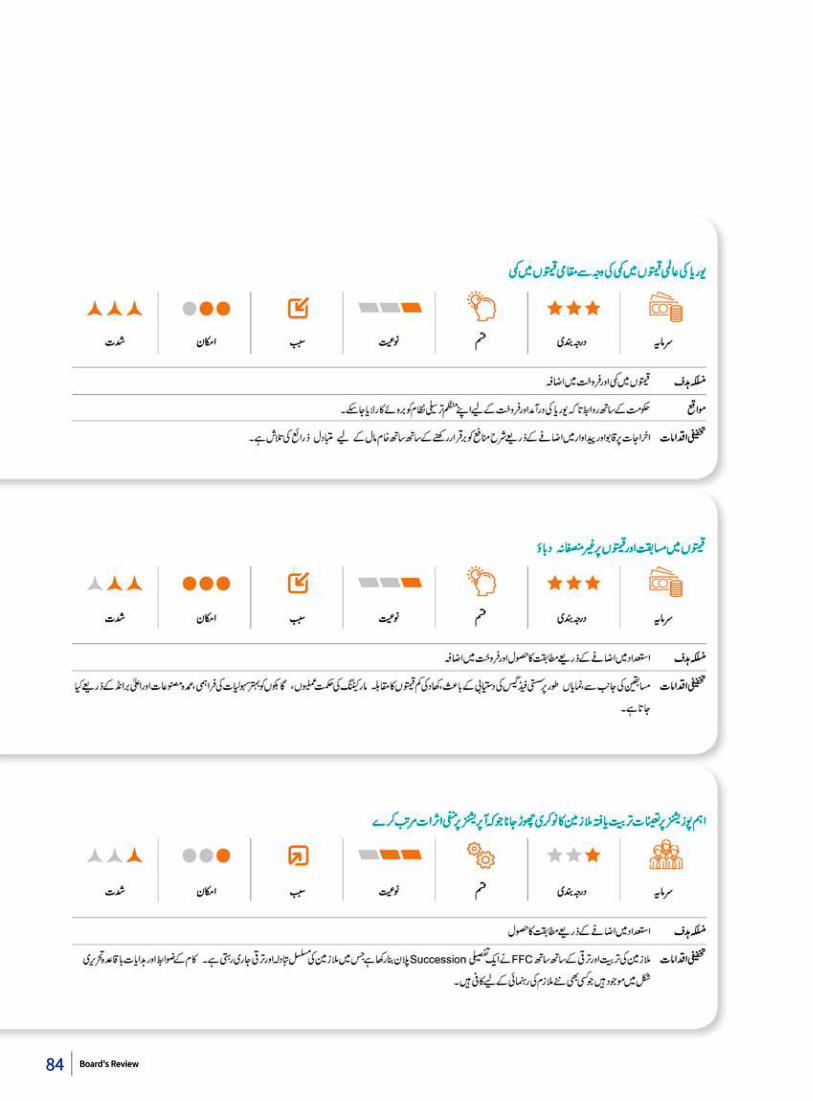
84 Board's Review
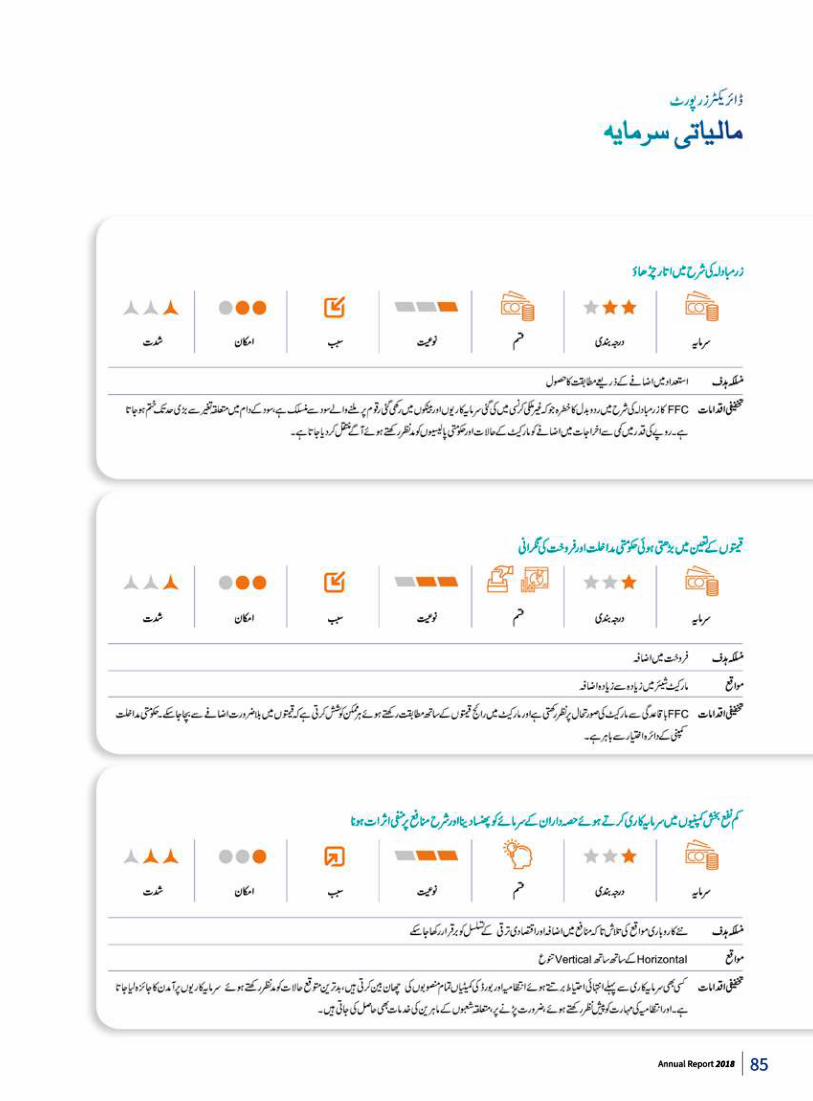
85Annual Report 2018
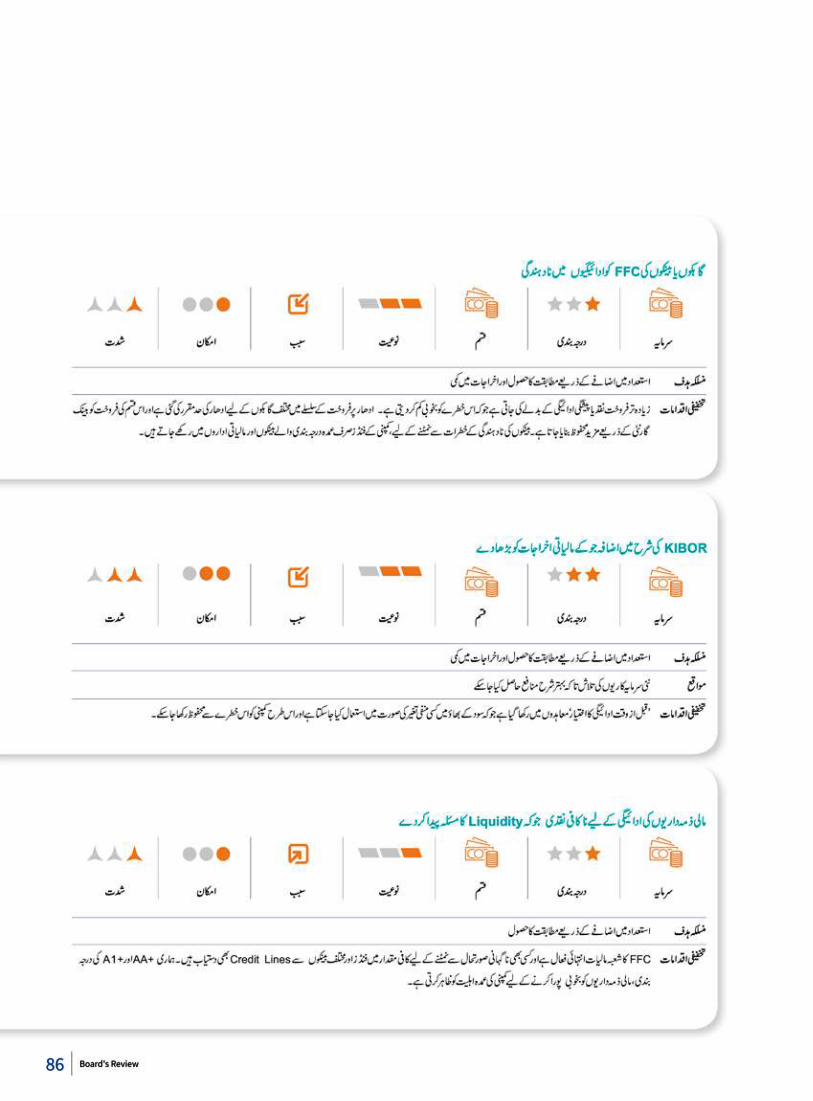
86 Board's Review
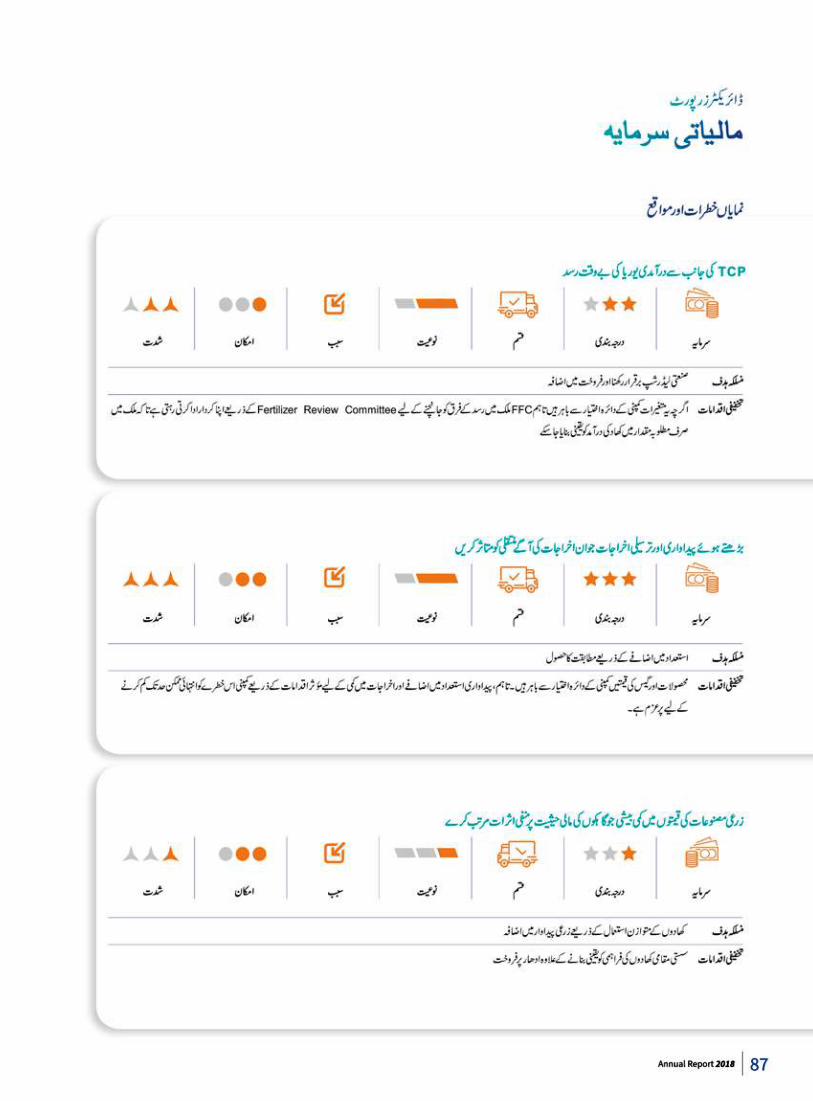
87Annual Report 2018
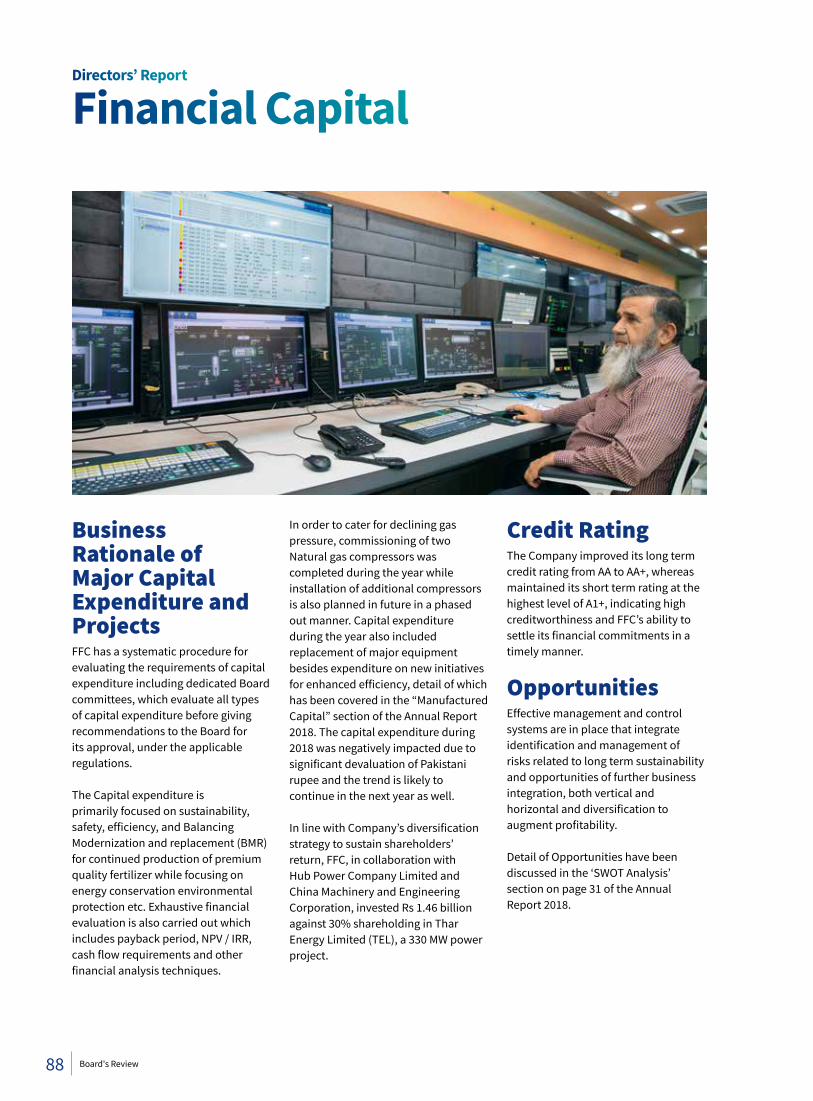
Business Rationale of Major Capital Expenditure and Projects FFC has a systematic procedure for evaluating the requirements of capital expenditure including dedicated Board committees, which evaluate all types of capital expenditure before giving recommendations to the Board for its approval, under the applicable regulations.
The Capital expenditure is primarily focused on sustainability, safety, efficiency, and Balancing Modernization and replacement (BMR) for continued production of premium quality fertilizer while focusing on energy conservation environmental protection etc. Exhaustive financial evaluation is also carried out which includes payback period, NPV / IRR, cash flow requirements and other financial analysis techniques.
In order to cater for declining gas pressure, commissioning of two Natural gas compressors was completed during the year while installation of additional compressors is also planned in future in a phased out manner. Capital expenditure during the year also included replacement of major equipment besides expenditure on new initiatives for enhanced efficiency, detail of which has been covered in the “Manufactured Capital” section of the Annual Report 2018. The capital expenditure during 2018 was negatively impacted due to significant devaluation of Pakistani rupee and the trend is likely to continue in the next year as well.
In line with Company’s diversification strategy to sustain shareholders’ return, FFC, in collaboration with Hub Power Company Limited and China Machinery and Engineering Corporation, invested Rs 1.46 billion against 30% shareholding in Thar Energy Limited (TEL), a 330 MW power project.
Directors’ Report
Financial Capital
Credit RatingThe Company improved its long term credit rating from AA to AA+, whereas maintained its short term rating at the highest level of A1+, indicating high creditworthiness and FFC’s ability to settle its financial commitments in a timely manner.
OpportunitiesEffective management and control systems are in place that integrate identification and management of risks related to long term sustainability and opportunities of further business integration, both vertical and horizontal and diversification to augment profitability.
Detail of Opportunities have been discussed in the ‘SWOT Analysis’ section on page 31 of the Annual Report 2018.
88 Board's Review
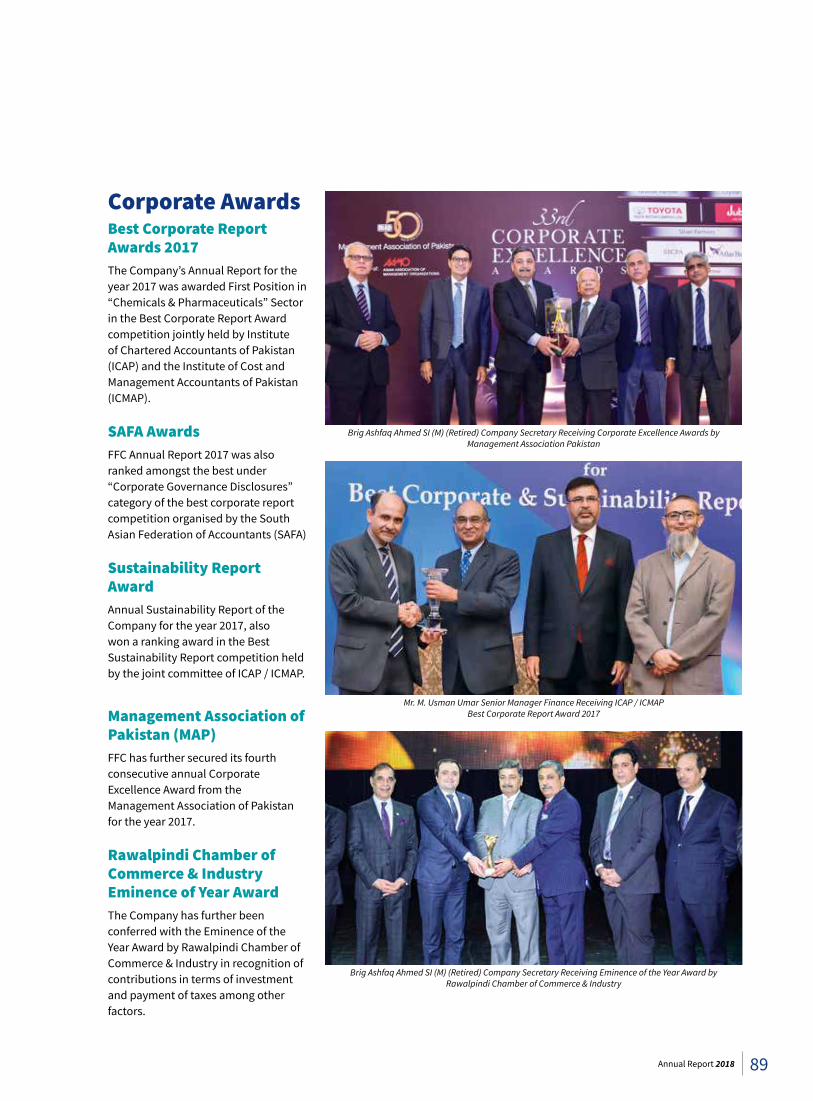
Corporate Awards Best Corporate Report Awards 2017The Company’s Annual Report for the year 2017 was awarded First Position in “Chemicals & Pharmaceuticals” Sector in the Best Corporate Report Award competition jointly held by Institute of Chartered Accountants of Pakistan (ICAP) and the Institute of Cost and Management Accountants of Pakistan (ICMAP).
SAFA AwardsFFC Annual Report 2017 was also ranked amongst the best under “Corporate Governance Disclosures” category of the best corporate report competition organised by the South Asian Federation of Accountants (SAFA)
Sustainability Report AwardAnnual Sustainability Report of the Company for the year 2017, also won a ranking award in the Best Sustainability Report competition held by the joint committee of ICAP / ICMAP.
Management Association of Pakistan (MAP)FFC has further secured its fourth consecutive annual Corporate Excellence Award from the Management Association of Pakistan for the year 2017.
Rawalpindi Chamber of Commerce & Industry Eminence of Year AwardThe Company has further been conferred with the Eminence of the Year Award by Rawalpindi Chamber of Commerce & Industry in recognition of contributions in terms of investment and payment of taxes among other factors.
Brig Ashfaq Ahmed SI (M) (Retired) Company Secretary Receiving Corporate Excellence Awards by Management Association Pakistan
Brig Ashfaq Ahmed SI (M) (Retired) Company Secretary Receiving Eminence of the Year Award by Rawalpindi Chamber of Commerce & Industry
Mr. M. Usman Umar Senior Manager Finance Receiving ICAP / ICMAP Best Corporate Report Award 2017
89Annual Report 2018
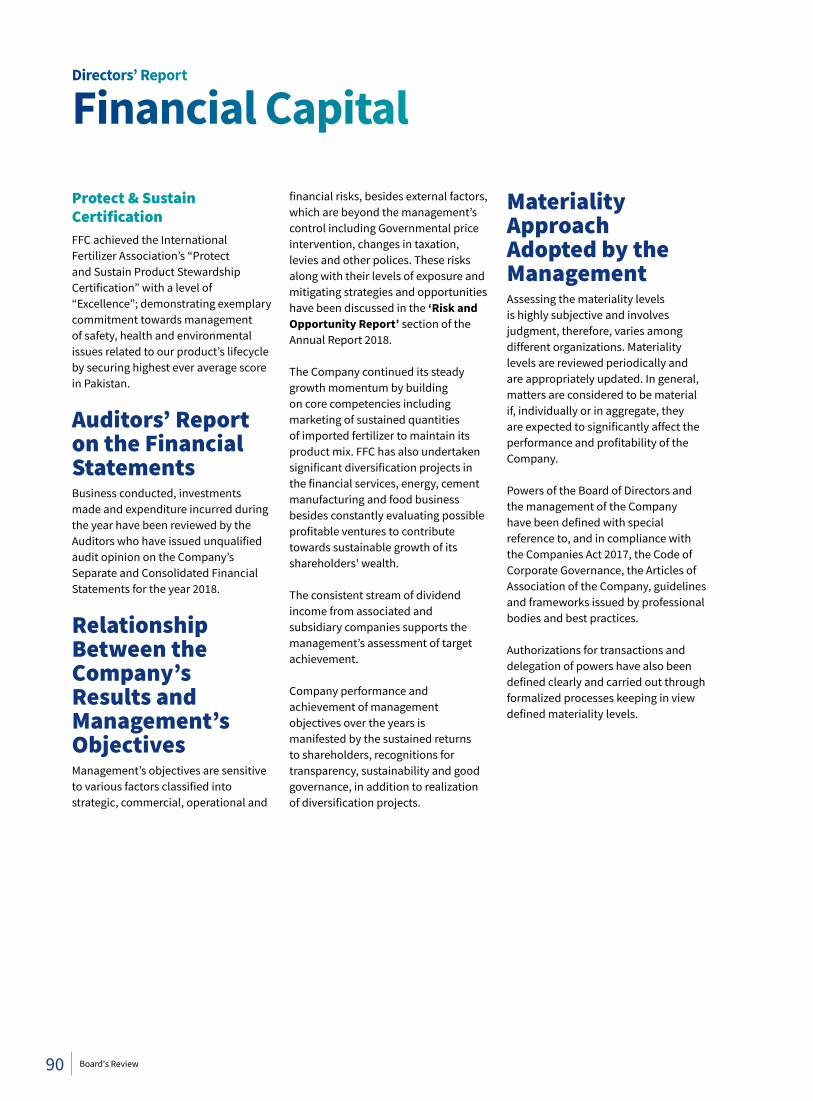
Protect & Sustain CertificationFFC achieved the International Fertilizer Association’s “Protect and Sustain Product Stewardship Certification” with a level of “Excellence”; demonstrating exemplary commitment towards management of safety, health and environmental issues related to our product’s lifecycle by securing highest ever average score in Pakistan.
Auditors’ Report on the Financial Statements Business conducted, investments made and expenditure incurred during the year have been reviewed by the Auditors who have issued unqualified audit opinion on the Company’s Separate and Consolidated Financial Statements for the year 2018.
Relationship Between the Company’s Results and Management’s ObjectivesManagement’s objectives are sensitive to various factors classified into strategic, commercial, operational and
financial risks, besides external factors, which are beyond the management’s control including Governmental price intervention, changes in taxation, levies and other polices. These risks along with their levels of exposure and mitigating strategies and opportunities have been discussed in the ‘Risk and Opportunity Report’ section of the Annual Report 2018.
The Company continued its steady growth momentum by building on core competencies including marketing of sustained quantities of imported fertilizer to maintain its product mix. FFC has also undertaken significant diversification projects in the financial services, energy, cement manufacturing and food business besides constantly evaluating possible profitable ventures to contribute towards sustainable growth of its shareholders' wealth.
The consistent stream of dividend income from associated and subsidiary companies supports the management’s assessment of target achievement.
Company performance and achievement of management objectives over the years is manifested by the sustained returns to shareholders, recognitions for transparency, sustainability and good governance, in addition to realization of diversification projects.
Directors’ Report
Financial Capital
Materiality Approach Adopted by the ManagementAssessing the materiality levels is highly subjective and involves judgment, therefore, varies among different organizations. Materiality levels are reviewed periodically and are appropriately updated. In general, matters are considered to be material if, individually or in aggregate, they are expected to significantly affect the performance and profitability of the Company.
Powers of the Board of Directors and the management of the Company have been defined with special reference to, and in compliance with the Companies Act 2017, the Code of Corporate Governance, the Articles of Association of the Company, guidelines and frameworks issued by professional bodies and best practices.
Authorizations for transactions and delegation of powers have also been defined clearly and carried out through formalized processes keeping in view defined materiality levels.
90 Board's Review
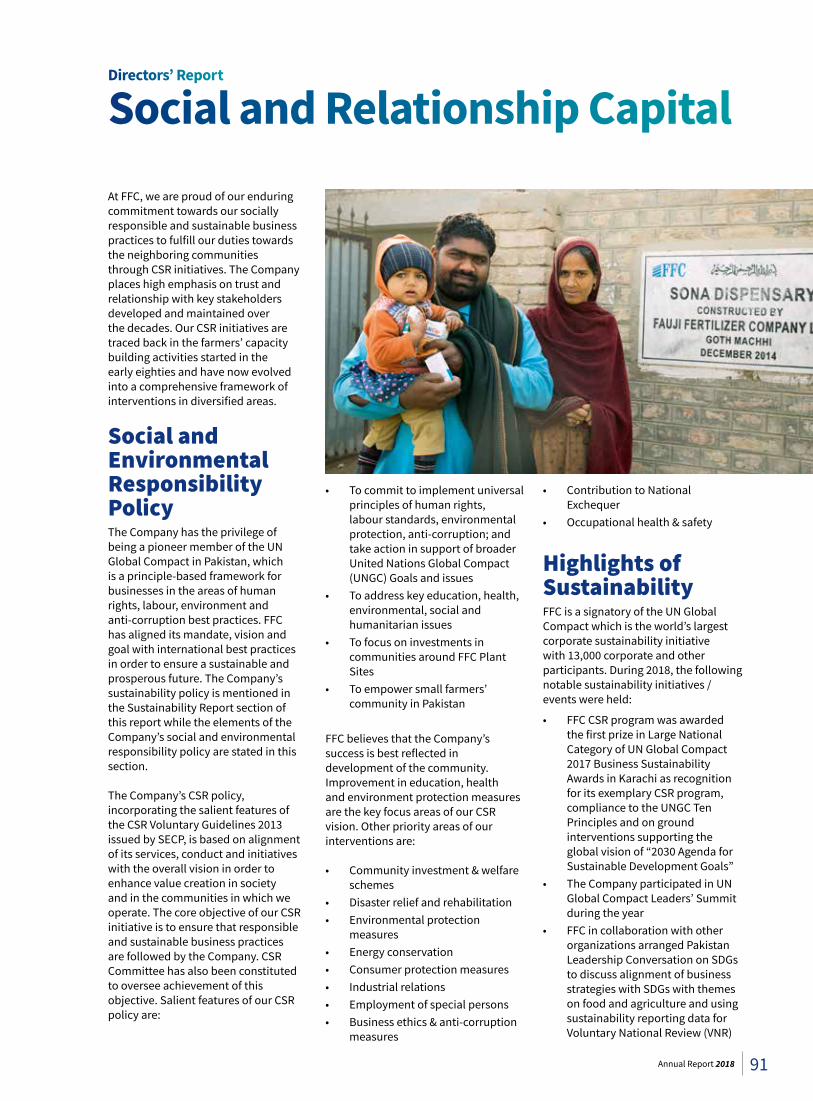
At FFC, we are proud of our enduring commitment towards our socially responsible and sustainable business practices to fulfill our duties towards the neighboring communities through CSR initiatives. The Company places high emphasis on trust and relationship with key stakeholders developed and maintained over the decades. Our CSR initiatives are traced back in the farmers’ capacity building activities started in the early eighties and have now evolved into a comprehensive framework of interventions in diversified areas.
Social and Environmental Responsibility PolicyThe Company has the privilege of being a pioneer member of the UN Global Compact in Pakistan, which is a principle-based framework for businesses in the areas of human rights, labour, environment and anti-corruption best practices. FFC has aligned its mandate, vision and goal with international best practices in order to ensure a sustainable and prosperous future. The Company’s sustainability policy is mentioned in the Sustainability Report section of this report while the elements of the Company’s social and environmental responsibility policy are stated in this section.
The Company’s CSR policy, incorporating the salient features of the CSR Voluntary Guidelines 2013 issued by SECP, is based on alignment of its services, conduct and initiatives with the overall vision in order to enhance value creation in society and in the communities in which we operate. The core objective of our CSR initiative is to ensure that responsible and sustainable business practices are followed by the Company. CSR Committee has also been constituted to oversee achievement of this objective. Salient features of our CSR policy are:
• To commit to implement universal principles of human rights, labour standards, environmental protection, anti-corruption; and take action in support of broader United Nations Global Compact (UNGC) Goals and issues
• To address key education, health, environmental, social and humanitarian issues
• To focus on investments in communities around FFC Plant Sites
• To empower small farmers’ community in Pakistan
FFC believes that the Company’s success is best reflected in development of the community. Improvement in education, health and environment protection measures are the key focus areas of our CSR vision. Other priority areas of our interventions are:
• Community investment & welfare schemes
• Disaster relief and rehabilitation• Environmental protection
measures• Energy conservation• Consumer protection measures• Industrial relations• Employment of special persons • Business ethics & anti-corruption
measures
• Contribution to National Exchequer
• Occupational health & safety
Highlights of SustainabilityFFC is a signatory of the UN Global Compact which is the world’s largest corporate sustainability initiative with 13,000 corporate and other participants. During 2018, the following notable sustainability initiatives / events were held:
• FFC CSR program was awarded the first prize in Large National Category of UN Global Compact 2017 Business Sustainability Awards in Karachi as recognition for its exemplary CSR program, compliance to the UNGC Ten Principles and on ground interventions supporting the global vision of “2030 Agenda for Sustainable Development Goals”
• The Company participated in UN Global Compact Leaders’ Summit during the year
• FFC in collaboration with other organizations arranged Pakistan Leadership Conversation on SDGs to discuss alignment of business strategies with SDGs with themes on food and agriculture and using sustainability reporting data for Voluntary National Review (VNR)
Directors’ Report
Social and Relationship Capital
91Annual Report 2018
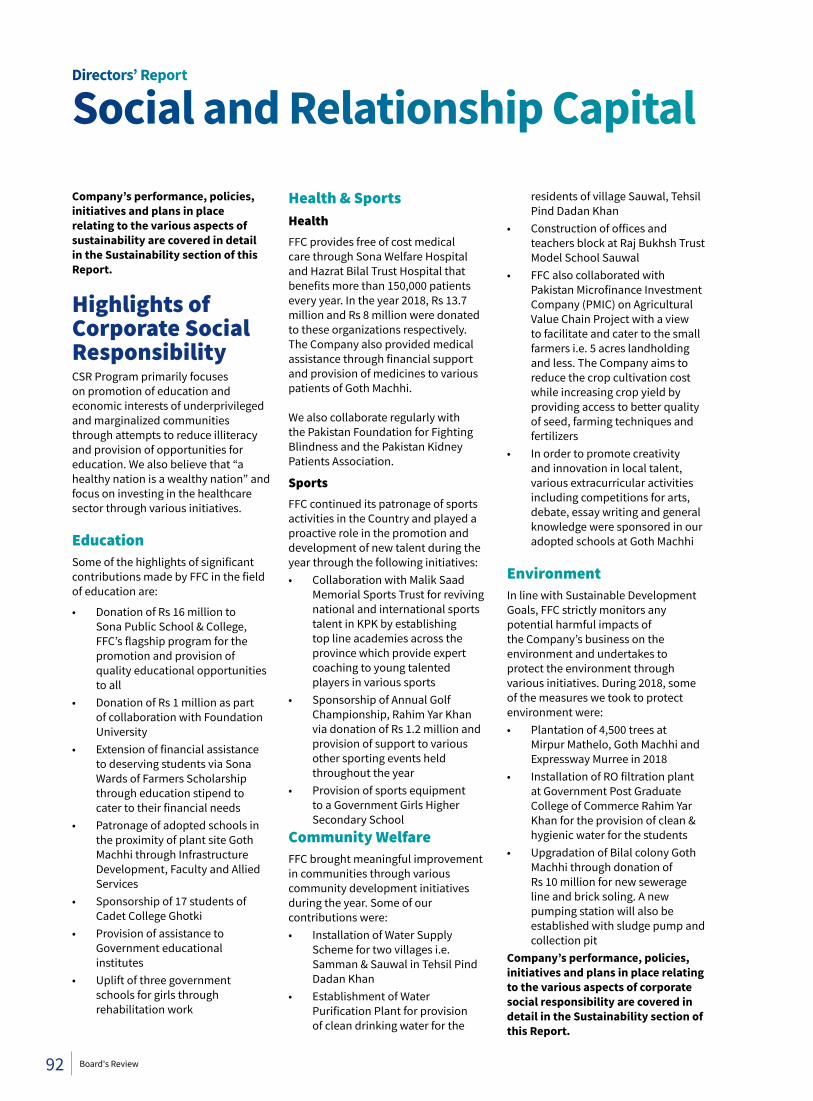
Company’s performance, policies, initiatives and plans in place relating to the various aspects of sustainability are covered in detail in the Sustainability section of this Report.
Highlights of Corporate Social ResponsibilityCSR Program primarily focuses on promotion of education and economic interests of underprivileged and marginalized communities through attempts to reduce illiteracy and provision of opportunities for education. We also believe that “a healthy nation is a wealthy nation” and focus on investing in the healthcare sector through various initiatives.
EducationSome of the highlights of significant contributions made by FFC in the field of education are:
• Donation of Rs 16 million to Sona Public School & College, FFC’s flagship program for the promotion and provision of quality educational opportunities to all
• Donation of Rs 1 million as part of collaboration with Foundation University
• Extension of financial assistance to deserving students via Sona Wards of Farmers Scholarship through education stipend to cater to their financial needs
• Patronage of adopted schools in the proximity of plant site Goth Machhi through Infrastructure Development, Faculty and Allied Services
• Sponsorship of 17 students of Cadet College Ghotki
• Provision of assistance to Government educational institutes
• Uplift of three government schools for girls through rehabilitation work
Health & SportsHealthFFC provides free of cost medical care through Sona Welfare Hospital and Hazrat Bilal Trust Hospital that benefits more than 150,000 patients every year. In the year 2018, Rs 13.7 million and Rs 8 million were donated to these organizations respectively. The Company also provided medical assistance through financial support and provision of medicines to various patients of Goth Machhi.
We also collaborate regularly with the Pakistan Foundation for Fighting Blindness and the Pakistan Kidney Patients Association.
SportsFFC continued its patronage of sports activities in the Country and played a proactive role in the promotion and development of new talent during the year through the following initiatives:• Collaboration with Malik Saad
Memorial Sports Trust for reviving national and international sports talent in KPK by establishing top line academies across the province which provide expert coaching to young talented players in various sports
• Sponsorship of Annual Golf Championship, Rahim Yar Khan via donation of Rs 1.2 million and provision of support to various other sporting events held throughout the year
• Provision of sports equipment to a Government Girls Higher Secondary School
Community WelfareFFC brought meaningful improvement in communities through various community development initiatives during the year. Some of our contributions were:• Installation of Water Supply
Scheme for two villages i.e. Samman & Sauwal in Tehsil Pind Dadan Khan
• Establishment of Water Purification Plant for provision of clean drinking water for the
residents of village Sauwal, Tehsil Pind Dadan Khan
• Construction of offices and teachers block at Raj Bukhsh Trust Model School Sauwal
• FFC also collaborated with Pakistan Microfinance Investment Company (PMIC) on Agricultural Value Chain Project with a view to facilitate and cater to the small farmers i.e. 5 acres landholding and less. The Company aims to reduce the crop cultivation cost while increasing crop yield by providing access to better quality of seed, farming techniques and fertilizers
• In order to promote creativity and innovation in local talent, various extracurricular activities including competitions for arts, debate, essay writing and general knowledge were sponsored in our adopted schools at Goth Machhi
Environment In line with Sustainable Development Goals, FFC strictly monitors any potential harmful impacts of the Company’s business on the environment and undertakes to protect the environment through various initiatives. During 2018, some of the measures we took to protect environment were:• Plantation of 4,500 trees at
Mirpur Mathelo, Goth Machhi and Expressway Murree in 2018
• Installation of RO filtration plant at Government Post Graduate College of Commerce Rahim Yar Khan for the provision of clean & hygienic water for the students
• Upgradation of Bilal colony Goth Machhi through donation of Rs 10 million for new sewerage line and brick soling. A new pumping station will also be established with sludge pump and collection pit
Company’s performance, policies, initiatives and plans in place relating to the various aspects of corporate social responsibility are covered in detail in the Sustainability section of this Report.
Directors’ Report
Social and Relationship Capital
92 Board's Review
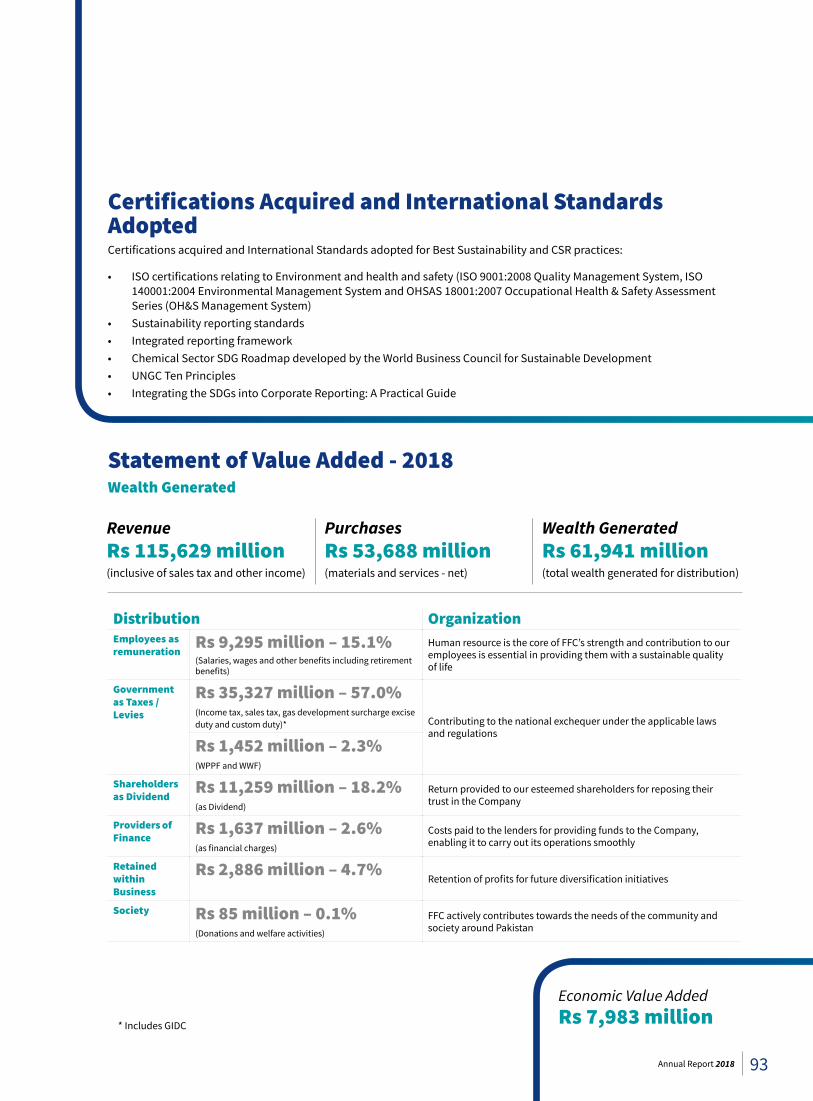
Statement of Value Added - 2018Wealth Generated
Rs 7,983 millionEconomic Value Added
* Includes GIDC
RevenueRs 115,629 million(inclusive of sales tax and other income)
PurchasesRs 53,688 million(materials and services - net)
Wealth GeneratedRs 61,941 million(total wealth generated for distribution)
Distribution OrganizationEmployees as remuneration
Rs 9,295 million – 15.1%(Salaries, wages and other benefits including retirement benefits)
Human resource is the core of FFC’s strength and contribution to our employees is essential in providing them with a sustainable quality of life
Government as Taxes / Levies
Rs 35,327 million – 57.0%(Income tax, sales tax, gas development surcharge excise duty and custom duty)* Contributing to the national exchequer under the applicable laws
and regulationsRs 1,452 million – 2.3%(WPPF and WWF)
Shareholders as Dividend
Rs 11,259 million – 18.2%(as Dividend)
Return provided to our esteemed shareholders for reposing their trust in the Company
Providers of Finance
Rs 1,637 million – 2.6%(as financial charges)
Costs paid to the lenders for providing funds to the Company, enabling it to carry out its operations smoothly
Retained within Business
Rs 2,886 million – 4.7%Retention of profits for future diversification initiatives
Society Rs 85 million – 0.1%(Donations and welfare activities)
FFC actively contributes towards the needs of the community and society around Pakistan
Certifications Acquired and International Standards AdoptedCertifications acquired and International Standards adopted for Best Sustainability and CSR practices:
• ISO certifications relating to Environment and health and safety (ISO 9001:2008 Quality Management System, ISO 140001:2004 Environmental Management System and OHSAS 18001:2007 Occupational Health & Safety Assessment Series (OH&S Management System)
• Sustainability reporting standards• Integrated reporting framework• Chemical Sector SDG Roadmap developed by the World Business Council for Sustainable Development• UNGC Ten Principles• Integrating the SDGs into Corporate Reporting: A Practical Guide
93Annual Report 2018
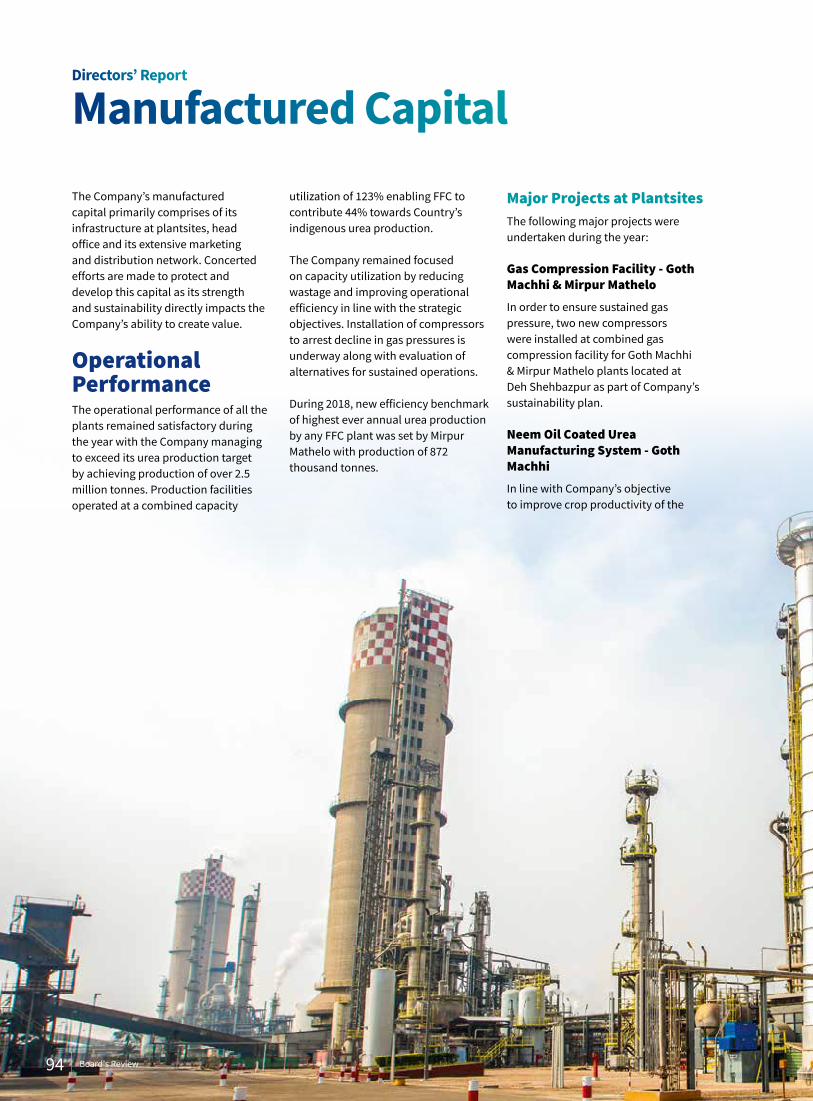
The Company’s manufactured capital primarily comprises of its infrastructure at plantsites, head office and its extensive marketing and distribution network. Concerted efforts are made to protect and develop this capital as its strength and sustainability directly impacts the Company’s ability to create value.
Operational PerformanceThe operational performance of all the plants remained satisfactory during the year with the Company managing to exceed its urea production target by achieving production of over 2.5 million tonnes. Production facilities operated at a combined capacity
utilization of 123% enabling FFC to contribute 44% towards Country’s indigenous urea production.
The Company remained focused on capacity utilization by reducing wastage and improving operational efficiency in line with the strategic objectives. Installation of compressors to arrest decline in gas pressures is underway along with evaluation of alternatives for sustained operations.
During 2018, new efficiency benchmark of highest ever annual urea production by any FFC plant was set by Mirpur Mathelo with production of 872 thousand tonnes.
Major Projects at PlantsitesThe following major projects were undertaken during the year:
Gas Compression Facility - Goth Machhi & Mirpur MatheloIn order to ensure sustained gas pressure, two new compressors were installed at combined gas compression facility for Goth Machhi & Mirpur Mathelo plants located at Deh Shehbazpur as part of Company’s sustainability plan.
Neem Oil Coated Urea Manufacturing System - Goth MachhiIn line with Company’s objective to improve crop productivity of the
Directors’ Report
Manufactured Capital
94 Board's Review
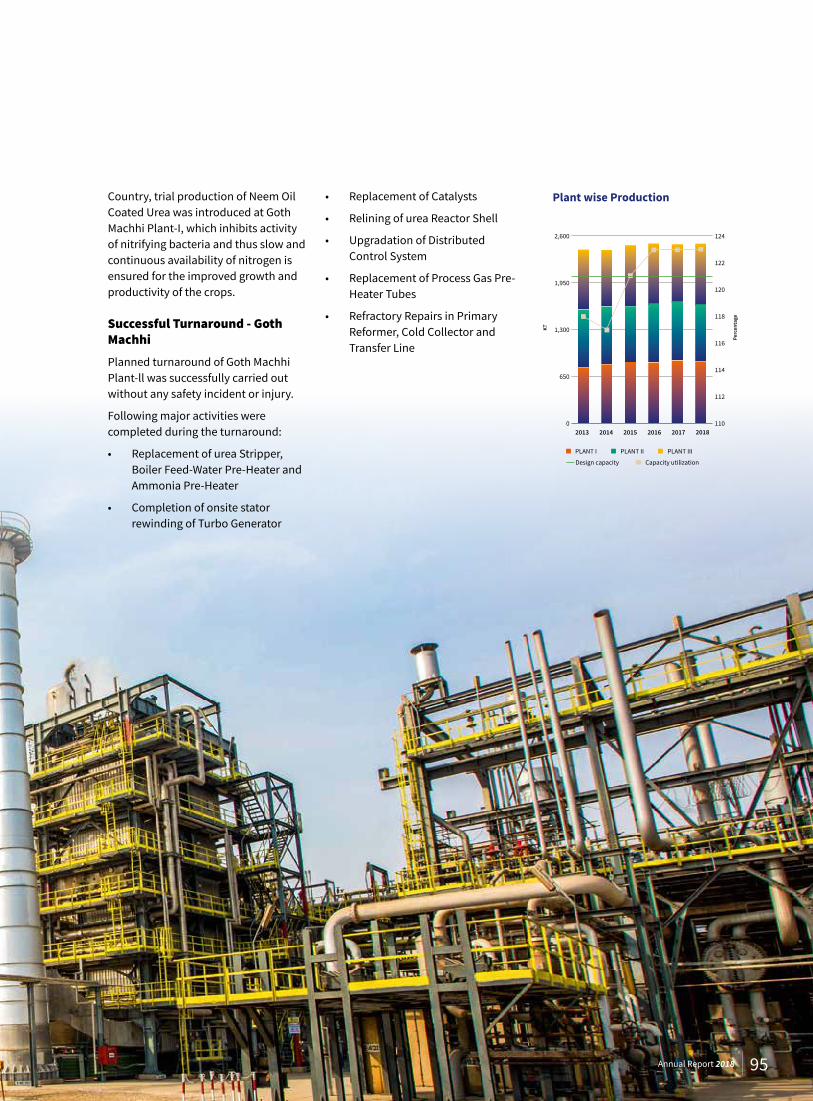
2017 20182013 2014 2015 20160
650
1,300
1,950
2,600
110
112
114
116
118
120
122
124
Plant wise Production
KT
Perc
enta
ge
PLANT I PLANT II PLANT III
Design capacity Capacity utilization
Country, trial production of Neem Oil Coated Urea was introduced at Goth Machhi Plant-I, which inhibits activity of nitrifying bacteria and thus slow and continuous availability of nitrogen is ensured for the improved growth and productivity of the crops.
Successful Turnaround - Goth MachhiPlanned turnaround of Goth Machhi Plant-ll was successfully carried out without any safety incident or injury.
Following major activities were completed during the turnaround:
• Replacement of urea Stripper, Boiler Feed-Water Pre-Heater and Ammonia Pre-Heater
• Completion of onsite stator rewinding of Turbo Generator
• Replacement of Catalysts
• Relining of urea Reactor Shell
• Upgradation of Distributed Control System
• Replacement of Process Gas Pre-Heater Tubes
• Refractory Repairs in Primary Reformer, Cold Collector and Transfer Line
95Annual Report 2018
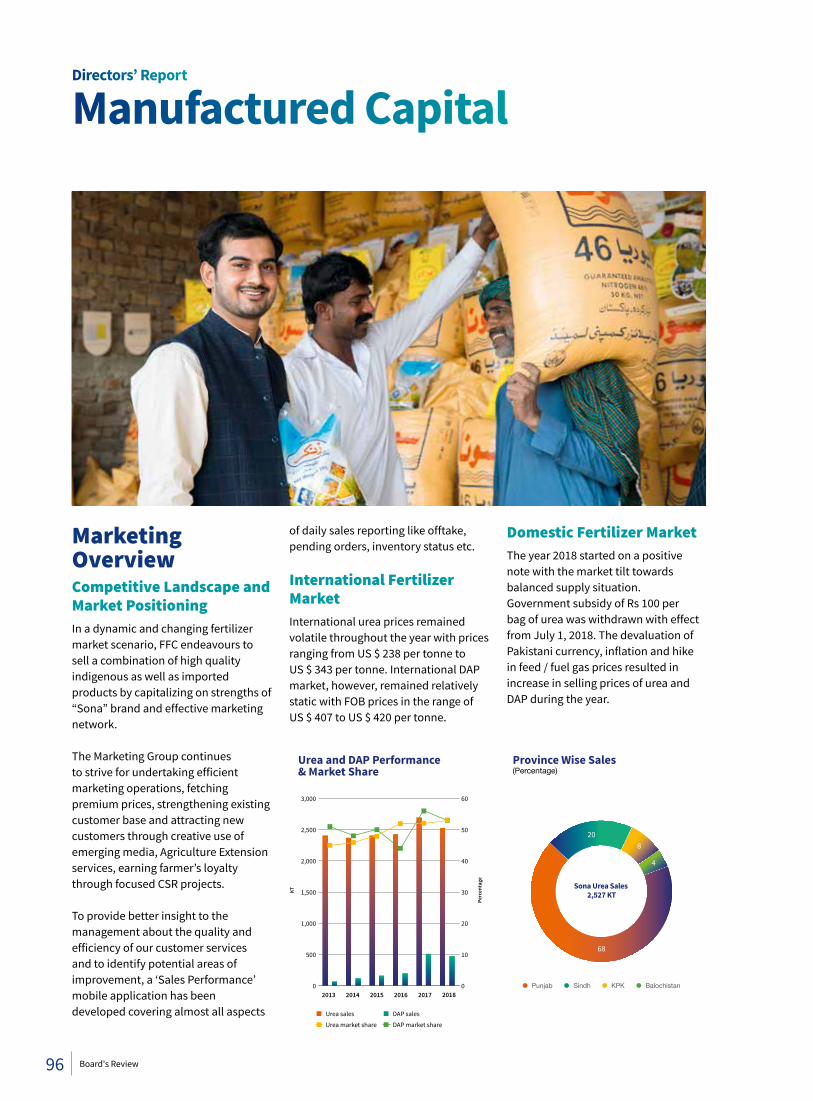
Marketing OverviewCompetitive Landscape and Market PositioningIn a dynamic and changing fertilizer market scenario, FFC endeavours to sell a combination of high quality indigenous as well as imported products by capitalizing on strengths of “Sona” brand and effective marketing network.
The Marketing Group continues to strive for undertaking efficient marketing operations, fetching premium prices, strengthening existing customer base and attracting new customers through creative use of emerging media, Agriculture Extension services, earning farmer’s loyalty through focused CSR projects.
To provide better insight to the management about the quality and efficiency of our customer services and to identify potential areas of improvement, a ‘Sales Performance’ mobile application has been developed covering almost all aspects
of daily sales reporting like offtake, pending orders, inventory status etc.
International Fertilizer MarketInternational urea prices remained volatile throughout the year with prices ranging from US $ 238 per tonne to US $ 343 per tonne. International DAP market, however, remained relatively static with FOB prices in the range of US $ 407 to US $ 420 per tonne.
Domestic Fertilizer MarketThe year 2018 started on a positive note with the market tilt towards balanced supply situation. Government subsidy of Rs 100 per bag of urea was withdrawn with effect from July 1, 2018. The devaluation of Pakistani currency, inflation and hike in feed / fuel gas prices resulted in increase in selling prices of urea and DAP during the year.
2017 20182013 2014 2015 2016
KT
Perc
enta
ge
Urea and DAP Performance& Market Share
Urea sales DAP sales
Urea market share DAP market share
0
500
1,000
1,500
2,000
2,500
3,000
0
10
20
30
40
50
60
Sona Urea Sales 2,527 KT
68
20
4
8
Punjab Sindh KPK Balochistan
Province Wise Sales(Percentage)
Directors’ Report
Manufactured Capital
96 Board's Review
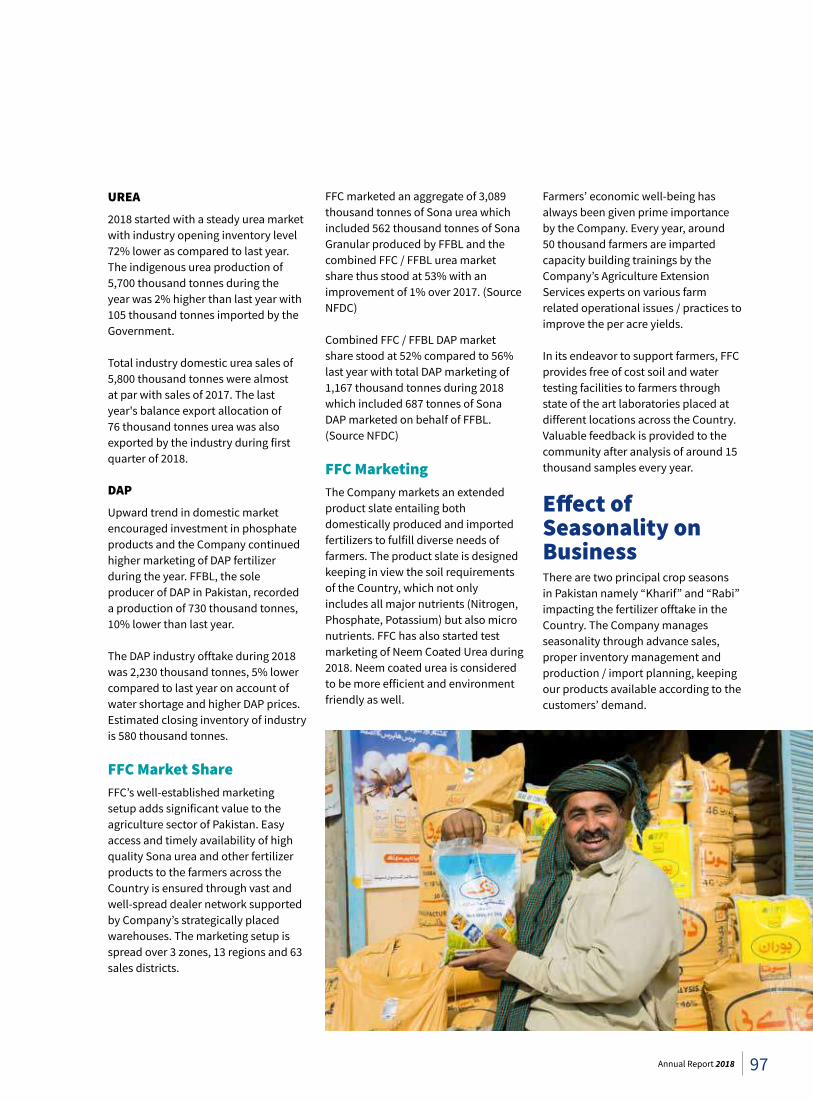
UREA2018 started with a steady urea market with industry opening inventory level 72% lower as compared to last year. The indigenous urea production of 5,700 thousand tonnes during the year was 2% higher than last year with 105 thousand tonnes imported by the Government.
Total industry domestic urea sales of 5,800 thousand tonnes were almost at par with sales of 2017. The last year's balance export allocation of 76 thousand tonnes urea was also exported by the industry during first quarter of 2018.
DAPUpward trend in domestic market encouraged investment in phosphate products and the Company continued higher marketing of DAP fertilizer during the year. FFBL, the sole producer of DAP in Pakistan, recorded a production of 730 thousand tonnes, 10% lower than last year.
The DAP industry offtake during 2018 was 2,230 thousand tonnes, 5% lower compared to last year on account of water shortage and higher DAP prices. Estimated closing inventory of industry is 580 thousand tonnes.
FFC Market ShareFFC’s well-established marketing setup adds significant value to the agriculture sector of Pakistan. Easy access and timely availability of high quality Sona urea and other fertilizer products to the farmers across the Country is ensured through vast and well-spread dealer network supported by Company’s strategically placed warehouses. The marketing setup is spread over 3 zones, 13 regions and 63 sales districts.
FFC marketed an aggregate of 3,089 thousand tonnes of Sona urea which included 562 thousand tonnes of Sona Granular produced by FFBL and the combined FFC / FFBL urea market share thus stood at 53% with an improvement of 1% over 2017. (Source NFDC)
Combined FFC / FFBL DAP market share stood at 52% compared to 56% last year with total DAP marketing of 1,167 thousand tonnes during 2018 which included 687 tonnes of Sona DAP marketed on behalf of FFBL. (Source NFDC)
FFC MarketingThe Company markets an extended product slate entailing both domestically produced and imported fertilizers to fulfill diverse needs of farmers. The product slate is designed keeping in view the soil requirements of the Country, which not only includes all major nutrients (Nitrogen, Phosphate, Potassium) but also micro nutrients. FFC has also started test marketing of Neem Coated Urea during 2018. Neem coated urea is considered to be more efficient and environment friendly as well.
Farmers’ economic well-being has always been given prime importance by the Company. Every year, around 50 thousand farmers are imparted capacity building trainings by the Company’s Agriculture Extension Services experts on various farm related operational issues / practices to improve the per acre yields.
In its endeavor to support farmers, FFC provides free of cost soil and water testing facilities to farmers through state of the art laboratories placed at different locations across the Country. Valuable feedback is provided to the community after analysis of around 15 thousand samples every year.
Effect of Seasonality on BusinessThere are two principal crop seasons in Pakistan namely “Kharif” and “Rabi” impacting the fertilizer offtake in the Country. The Company manages seasonality through advance sales, proper inventory management and production / import planning, keeping our products available according to the customers’ demand.
97Annual Report 2018
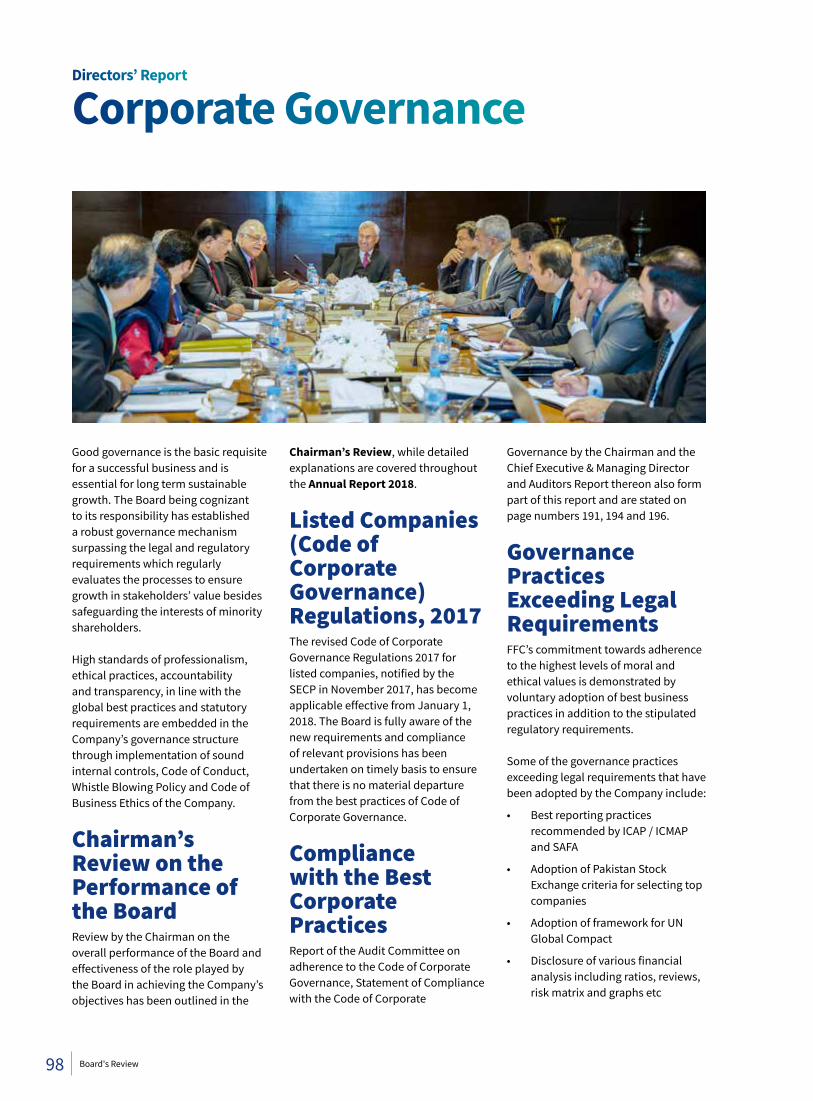
Good governance is the basic requisite for a successful business and is essential for long term sustainable growth. The Board being cognizant to its responsibility has established a robust governance mechanism surpassing the legal and regulatory requirements which regularly evaluates the processes to ensure growth in stakeholders’ value besides safeguarding the interests of minority shareholders.
High standards of professionalism, ethical practices, accountability and transparency, in line with the global best practices and statutory requirements are embedded in the Company’s governance structure through implementation of sound internal controls, Code of Conduct, Whistle Blowing Policy and Code of Business Ethics of the Company.
Chairman’s Review on the Performance of the BoardReview by the Chairman on the overall performance of the Board and effectiveness of the role played by the Board in achieving the Company’s objectives has been outlined in the
Chairman’s Review, while detailed explanations are covered throughout the Annual Report 2018.
Listed Companies (Code of Corporate Governance) Regulations, 2017The revised Code of Corporate Governance Regulations 2017 for listed companies, notified by the SECP in November 2017, has become applicable effective from January 1, 2018. The Board is fully aware of the new requirements and compliance of relevant provisions has been undertaken on timely basis to ensure that there is no material departure from the best practices of Code of Corporate Governance.
Compliance with the Best Corporate PracticesReport of the Audit Committee on adherence to the Code of Corporate Governance, Statement of Compliance with the Code of Corporate
Governance by the Chairman and the Chief Executive & Managing Director and Auditors Report thereon also form part of this report and are stated on page numbers 191, 194 and 196.
Governance Practices Exceeding Legal RequirementsFFC’s commitment towards adherence to the highest levels of moral and ethical values is demonstrated by voluntary adoption of best business practices in addition to the stipulated regulatory requirements.
Some of the governance practices exceeding legal requirements that have been adopted by the Company include:
• Best reporting practices recommended by ICAP / ICMAP and SAFA
• Adoption of Pakistan Stock Exchange criteria for selecting top companies
• Adoption of framework for UN Global Compact
• Disclosure of various financial analysis including ratios, reviews, risk matrix and graphs etc
Directors’ Report
Corporate Governance
98 Board's Review
• Implementation of aggressive Health, Safety and Environment strategies to ensure safety of employees and equipment
• Implementation of Directors training program ahead of prescribed timeframe
Directors’ Compliance StatementThe Board is pleased to state that:
• The financial statements prepared by the Company’s management, present fairly its state of affairs, the result of its operations, cash flows and changes in equity
• Proper books of account of the Company have been maintained
• There are no significant doubts regarding the Company’s ability to continue as a going concern
• Appropriate accounting policies have been consistently applied in preparation of the financial statements and accounting estimates are based on reasonable and prudent judgment
• International Financial Reporting Standards, as applicable in Pakistan, have been followed in preparation of the financial statements and any departure there from has been adequately disclosed
• The system of internal control is sound in design and has been effectively implemented and monitored
• There has been no material departure from the best practices of corporate governance, as detailed in the Listing Regulations
• Information regarding outstanding taxes and levies, as required by Listing Regulations, is disclosed in the notes to the financial statements
Statement of Value of Investments in respect of employees’ retirement plans has been disclosed in Note 9.3 to the financial statements.
Ethics and ComplianceHigh standards of ethical behaviour are embedded in all aspects of business conduct and decision making, through implementation of a comprehensive ethics and compliance framework. Principles of framework together with the Code of Conduct have been circulated to all employees of the Company in addition to being available on the Company’s website as required by the Code of Corporate Governance.
Proper systems and controls are in place for prompt identification and redressal of grievances arising due to any unethical practices. The framework is regularly updated in line with changes in applicable laws and regulations, ensuring sustained business growth and stakeholders’ confidence in the Company.
Inside information register is also maintained by the Company in compliance with the regulatory requirements.
Conflict of Interest Among Board MembersThe Code of Business Ethics implemented by the Board comprises not only of the principles provided under the regulatory requirements but also features global best practices.
The Code provides guidance on what constitutes a conflict of interest and how such a conflict will be managed. In order to avoid any actual or perceived conflict of interest, formal disclosure of vested interests is required by the Code.
Policy For Disclosure Of Conflict Of InterestAll Directors are obligated to avoid actual, potential and perceived conflicts of interest. Agenda points for the Board’s proceedings are finalized after obtaining relevant information regarding vested interests and quantification thereof, whereas all observations / suggestions of Board members during their proceedings are accordingly recorded.
Whistle Blowing PolicyDemonstrating the commitment towards maintaining highest standards of accountability, transparency and integrity, FFC has established an effective Whistle Blowing Mechanism that encourages all employees, management, Board of Directors and other stakeholders to raise alerts against occupational fraud, non-compliance with applicable regulatory requirements, Company policies, Code of Conduct and Ethics, health, safety and environmental standards, and regulatory framework. The mechanism encompasses the requirements of Code of Corporate Governance in addition to being compliant with the best global practices.
The Company employees are required to report concerns directly to immediate supervisors. However, where reporting to supervisors is impracticable, concerns may be escalated to the senior management. The policy encourages stakeholders to raise question and concerns, monitor the progress of resultant inquiries, provide feedback and where required, also voice concerns against any unsatisfactory inquiry or proceeding.
99Annual Report 2018
The Policy encompasses possible fraud / corruption, and all stakeholders including contractors, suppliers, business partners and shareholders come within the ambit of the Whistle Blowing Policy who are encouraged to participate without fear of reprisal or repercussions, in confidentiality, under defined reporting channels. Due emphasis has also been placed on environmental risk and illegal use of sensitive Company data.
Instances During the YearThere were no instances qualified as material enough to be reportable to the Audit Committee regarding improprieties in financial, operating, legal or other matters of the Company. All minor events requiring management’s attention were duly addressed during the year with appropriate actions taken for avoidance of such incidents in future.
Social and Environmental Responsibility PolicyFFC is cognizant of the assertion that success of the Company can best be reflected through development of the connected communities and environment. The Company has consistently demonstrated its commitment to the uplift and welfare of the connected community and environment.
Being a pioneer member of the UN Global Compact, the Company has aligned its mandate, vision and goal with the international best practice for ensuring a sustainable and prosperous future. Our Social and Environmental practices and interventions have been detailed in the section relating to ‘Social and Relationship Capital’.
Stakeholders’ EngagementFFC recognizes that the development of sustained stakeholders’ relationships is of paramount importance for improved risk management, compliance with regulatory and lender requirements, better corporate visibility and overall growth of the Company.
‘Stakeholders’ Engagement’ process ensures management communication with all stakeholders across the spectrum of its activities. Continuous feedback is also sought to bring the plan in line with global best practices.
Frequency of EngagementsThe Company, as a policy, aims to provide disclosure of all material information besides providing a wide range of information about strategy and financial information through its Annual Report and website to all stakeholders. The Corporate Communication department actively links the Company with the public.
The frequency of engagements is based on the business and corporate requirements as provided in the applicable regulatory framework, contractual obligations or on requirement basis. Employee communication is undertaken through in-house newsletters, televised broadcasts, employee portals and electronic bulletin boards. Information regarding the mode of engagement with following stakeholders, along with their impact on the Company’s operations is detailed on Page 32 of the Annual Report 2018:
• Institutional Investors / Shareholders
• Customers and Suppliers• Banks and other lenders• Media
• Regulators • Analysts• Employees• Local community and general
public
Analyst Briefing FFC conducted analysts’ briefing during the year to apprise the stakeholders about the Company’s operational and financial performance during the year. Marked interest was shown by PSX representatives, analysts from all over the Country and other stakeholders.
CFO summarized the Company performance of 2017 and first quarter of 2018. The briefing was also attended by the Head of Manufacturing & Operation, Head of Technology & Engineering and Company Secretary. Progress on ongoing projects besides highlighting the challenges and risks faced by FFC was presented. A Question & Answer session was also held afterwards to provide further explanation depicting our commitment to a transparent and continuously evolving stakeholders’ engagement approach.
Investors’ Relations Section on FFC WebsiteFFC executes its shareholders’ and investors’ outreach program through a mix of mediums including its corporate website, maintained and regularly updated under applicable regulatory requirements to disseminate comprehensive and up-to-date Company information regarding financial highlights, investor information, share pattern / value, dividend history and other requisite information besides the link to SECP’s
Directors’ Report
Corporate Governance
100 Board's Review
investor education portal, the ‘Jamapunji’.
In compliance with applicable regulatory framework, material information is maintained in both English and Urdu languages, to better facilitate the stakeholders.
The ‘Investors’ Relations’ section is also maintained on FFC website www.ffc.com.pk to promote investor relations and facilitate access to the Company for grievance / other query registration.
Investors’ Grievance Policy/ Redressal of Investors’ ComplaintsThe shareholders have been facilitated and encouraged to file their grievances with the Company in an effective manner. All queries including grievances and information requests lodged by shareholders and potential investors are handled on priority by the Corporate Affairs department through an effective grievance management mechanism. All matters are resolved in line with the legal requirements and in a timely manner.
Under the mechanism, the Company caters to requested information including specific queries relating to shareholders’ investment, dividend distribution or circulation of regulatory publications by the Company, received directly or through any regulatory body. Key elements of the system include:
• Informing investors on various modes for filing queries
• Ensuring timely response to investor grievances
• Unbiased and impartial handling of grievances by the Company’s relevant employees in good faith
• Any grievances requiring attention of the management or the Board of Directors, are presented to the appropriate higher levels by disclosing the entire facts of the case, for judicious settlement
• Appropriate remedial action is taken immediately to ensure avoidance in the future
Material information is also disseminated through newspapers, publication on Company’s website, notices to the Stock Exchange and regulators etc.
In accordance with our resolve to maintain excellent investor relations, the Company launched an electronic dividend payment mechanism consisting of monitoring, dividend distribution, reconciliation and reporting system to improve the timeliness and accuracy of dividend payments to our esteemed shareholders. The Company has now been technologically enabled to electronically reconcile dividend calculations and speed up payment cycles by minimizing manual interventions.
Policy for Safeguarding of RecordsThe Company’s comprehensive Business Continuity Plan (BCP) covers safety of records beyond the legal requirements to ensure sustained business operation in case of occurrence of any adverse event.
All material record is efficiently archived in digital form and uploaded on the Company’s secure onsite and
off-site servers, ensuring safety of record and easy retrieval thereof as well as protection of record for durations exceeding the legal requirements.
The record including books of account, documentation pertaining to secretarial, legal, contractual, taxation and other matters, has been archived in a well preserved manner as follows:
• Real-time back up of data at on and off-site locations
• Storage of data at secure location with state of the art protections against physical deterioration, fire, natural disasters etc.
• Management hierarchy based record retrieval authorization coupled with password security, including the Company’s SAP-ERP system
• Whistle Blowing - Immediate reporting of breach of security or damage of record to the management
• Establishment of remote Disaster Recovery site to provide immediate backup of all primary data, in line with business continuity practices
• Delegation of responsibility for all Company departments regarding safeguarding of their respective record
• Electronic backup of printed data through an E-DOX computer system, enabling prompt retrieval of relevant documents in a secure environment based on appropriate access controls and authorization systems
Composition of the Board of DirectorsComposition of the Board of Directors of the Company is governed primarily by the requirements of the Companies Act 2017 and the Code of Corporate
101Annual Report 2018
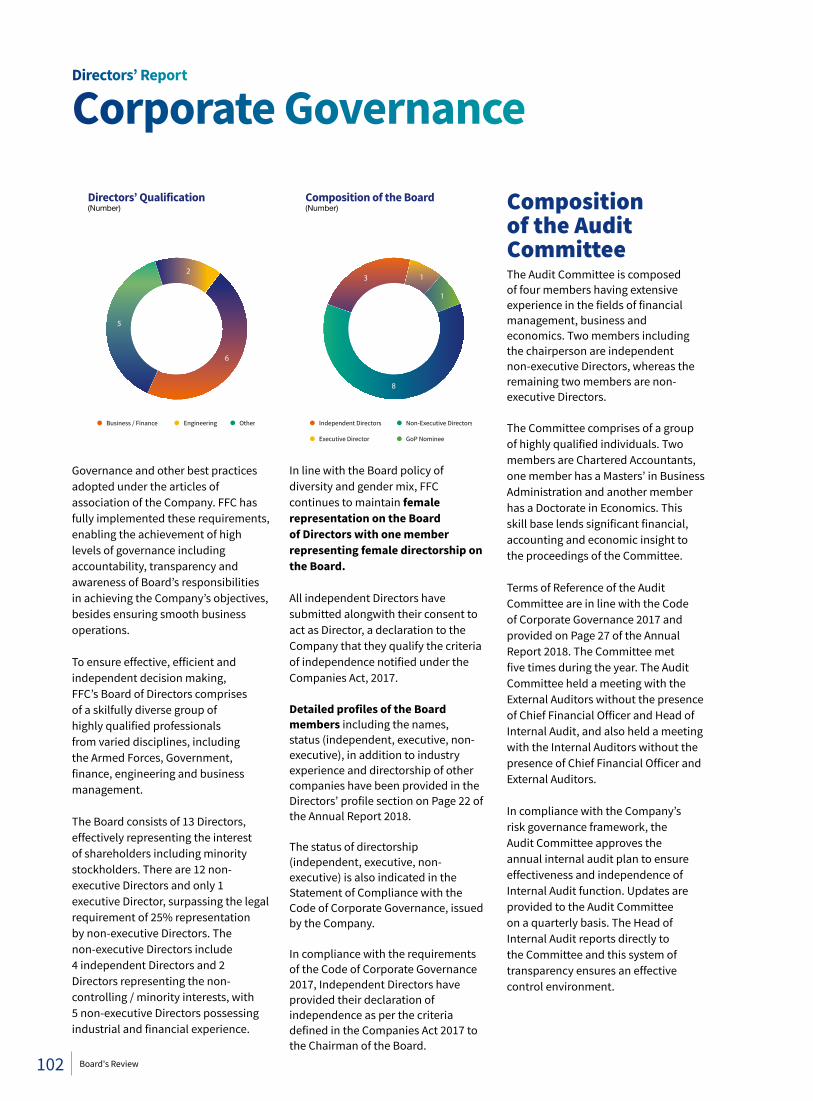
Governance and other best practices adopted under the articles of association of the Company. FFC has fully implemented these requirements, enabling the achievement of high levels of governance including accountability, transparency and awareness of Board’s responsibilities in achieving the Company’s objectives, besides ensuring smooth business operations.
To ensure effective, efficient and independent decision making, FFC’s Board of Directors comprises of a skilfully diverse group of highly qualified professionals from varied disciplines, including the Armed Forces, Government, finance, engineering and business management.
The Board consists of 13 Directors, effectively representing the interest of shareholders including minority stockholders. There are 12 non-executive Directors and only 1 executive Director, surpassing the legal requirement of 25% representation by non-executive Directors. The non-executive Directors include 4 independent Directors and 2 Directors representing the non-controlling / minority interests, with 5 non-executive Directors possessing industrial and financial experience.
In line with the Board policy of diversity and gender mix, FFC continues to maintain female representation on the Board of Directors with one member representing female directorship on the Board.
All independent Directors have submitted alongwith their consent to act as Director, a declaration to the Company that they qualify the criteria of independence notified under the Companies Act, 2017.
Detailed profiles of the Board members including the names, status (independent, executive, non-executive), in addition to industry experience and directorship of other companies have been provided in the Directors’ profile section on Page 22 of the Annual Report 2018.
The status of directorship (independent, executive, non-executive) is also indicated in the Statement of Compliance with the Code of Corporate Governance, issued by the Company.
In compliance with the requirements of the Code of Corporate Governance 2017, Independent Directors have provided their declaration of independence as per the criteria defined in the Companies Act 2017 to the Chairman of the Board.
Composition of the Audit CommitteeThe Audit Committee is composed of four members having extensive experience in the fields of financial management, business and economics. Two members including the chairperson are independent non-executive Directors, whereas the remaining two members are non-executive Directors.
The Committee comprises of a group of highly qualified individuals. Two members are Chartered Accountants, one member has a Masters’ in Business Administration and another member has a Doctorate in Economics. This skill base lends significant financial, accounting and economic insight to the proceedings of the Committee.
Terms of Reference of the Audit Committee are in line with the Code of Corporate Governance 2017 and provided on Page 27 of the Annual Report 2018. The Committee met five times during the year. The Audit Committee held a meeting with the External Auditors without the presence of Chief Financial Officer and Head of Internal Audit, and also held a meeting with the Internal Auditors without the presence of Chief Financial Officer and External Auditors.
In compliance with the Company’s risk governance framework, the Audit Committee approves the annual internal audit plan to ensure effectiveness and independence of Internal Audit function. Updates are provided to the Audit Committee on a quarterly basis. The Head of Internal Audit reports directly to the Committee and this system of transparency ensures an effective control environment.
Directors’ Report
Corporate Governance
Independent Directors Non-Executive Directors
Executive Director GoP Nominee
Composition of the Board(Number)
8
3 1
1
6
5
2
Directors’ Qualification(Number)
Business / Finance Engineering Other
102 Board's Review
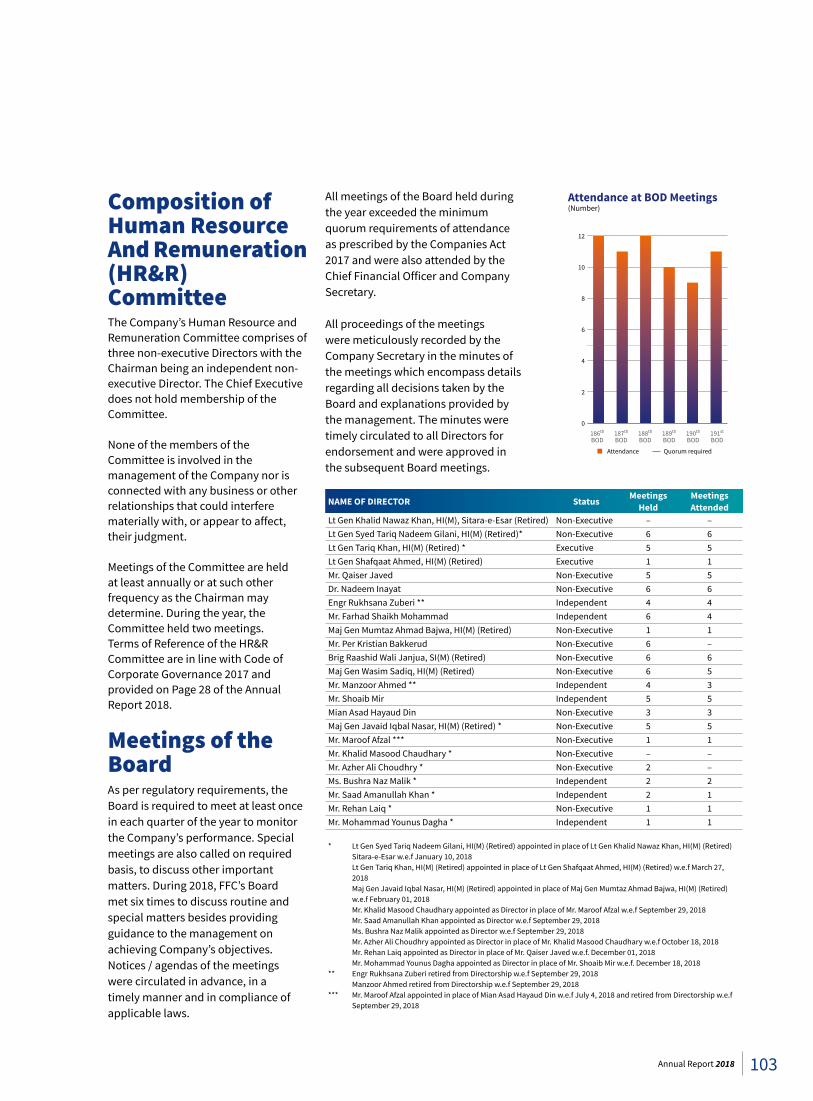
Composition of Human Resource And Remuneration (HR&R) CommitteeThe Company’s Human Resource and Remuneration Committee comprises of three non-executive Directors with the Chairman being an independent non-executive Director. The Chief Executive does not hold membership of the Committee.
None of the members of the Committee is involved in the management of the Company nor is connected with any business or other relationships that could interfere materially with, or appear to affect, their judgment.
Meetings of the Committee are held at least annually or at such other frequency as the Chairman may determine. During the year, the Committee held two meetings. Terms of Reference of the HR&R Committee are in line with Code of Corporate Governance 2017 and provided on Page 28 of the Annual Report 2018.
Meetings of the BoardAs per regulatory requirements, the Board is required to meet at least once in each quarter of the year to monitor the Company’s performance. Special meetings are also called on required basis, to discuss other important matters. During 2018, FFC’s Board met six times to discuss routine and special matters besides providing guidance to the management on achieving Company’s objectives. Notices / agendas of the meetings were circulated in advance, in a timely manner and in compliance of applicable laws.
NAME OF DIRECTOR Status Meetings Held
Meetings Attended
Lt Gen Khalid Nawaz Khan, HI(M), Sitara-e-Esar (Retired) Non-Executive – –Lt Gen Syed Tariq Nadeem Gilani, HI(M) (Retired)* Non-Executive 6 6Lt Gen Tariq Khan, HI(M) (Retired) * Executive 5 5Lt Gen Shafqaat Ahmed, HI(M) (Retired) Executive 1 1Mr. Qaiser Javed Non-Executive 5 5Dr. Nadeem Inayat Non-Executive 6 6Engr Rukhsana Zuberi ** Independent 4 4Mr. Farhad Shaikh Mohammad Independent 6 4Maj Gen Mumtaz Ahmad Bajwa, HI(M) (Retired) Non-Executive 1 1Mr. Per Kristian Bakkerud Non-Executive 6 –Brig Raashid Wali Janjua, SI(M) (Retired) Non-Executive 6 6Maj Gen Wasim Sadiq, HI(M) (Retired) Non-Executive 6 5Mr. Manzoor Ahmed ** Independent 4 3Mr. Shoaib Mir Independent 5 5Mian Asad Hayaud Din Non-Executive 3 3Maj Gen Javaid Iqbal Nasar, HI(M) (Retired) * Non-Executive 5 5Mr. Maroof Afzal *** Non-Executive 1 1Mr. Khalid Masood Chaudhary * Non-Executive – –Mr. Azher Ali Choudhry * Non-Executive 2 –Ms. Bushra Naz Malik * Independent 2 2Mr. Saad Amanullah Khan * Independent 2 1Mr. Rehan Laiq * Non-Executive 1 1Mr. Mohammad Younus Dagha * Independent 1 1
* Lt Gen Syed Tariq Nadeem Gilani, HI(M) (Retired) appointed in place of Lt Gen Khalid Nawaz Khan, HI(M) (Retired) Sitara-e-Esar w.e.f January 10, 2018
Lt Gen Tariq Khan, HI(M) (Retired) appointed in place of Lt Gen Shafqaat Ahmed, HI(M) (Retired) w.e.f March 27, 2018
Maj Gen Javaid Iqbal Nasar, HI(M) (Retired) appointed in place of Maj Gen Mumtaz Ahmad Bajwa, HI(M) (Retired) w.e.f February 01, 2018
Mr. Khalid Masood Chaudhary appointed as Director in place of Mr. Maroof Afzal w.e.f September 29, 2018 Mr. Saad Amanullah Khan appointed as Director w.e.f September 29, 2018 Ms. Bushra Naz Malik appointed as Director w.e.f September 29, 2018 Mr. Azher Ali Choudhry appointed as Director in place of Mr. Khalid Masood Chaudhary w.e.f October 18, 2018 Mr. Rehan Laiq appointed as Director in place of Mr. Qaiser Javed w.e.f. December 01, 2018 Mr. Mohammad Younus Dagha appointed as Director in place of Mr. Shoaib Mir w.e.f. December 18, 2018** Engr Rukhsana Zuberi retired from Directorship w.e.f September 29, 2018 Manzoor Ahmed retired from Directorship w.e.f September 29, 2018*** Mr. Maroof Afzal appointed in place of Mian Asad Hayaud Din w.e.f July 4, 2018 and retired from Directorship w.e.f
September 29, 2018
All meetings of the Board held during the year exceeded the minimum quorum requirements of attendance as prescribed by the Companies Act 2017 and were also attended by the Chief Financial Officer and Company Secretary.
All proceedings of the meetings were meticulously recorded by the Company Secretary in the minutes of the meetings which encompass details regarding all decisions taken by the Board and explanations provided by the management. The minutes were timely circulated to all Directors for endorsement and were approved in the subsequent Board meetings.
Attendance at BOD Meetings(Number)
186th
BOD187th
BOD188th
BOD189th
BOD190th
BOD191st
BOD
Attendance Quorum required
0
2
4
6
8
10
12
103Annual Report 2018
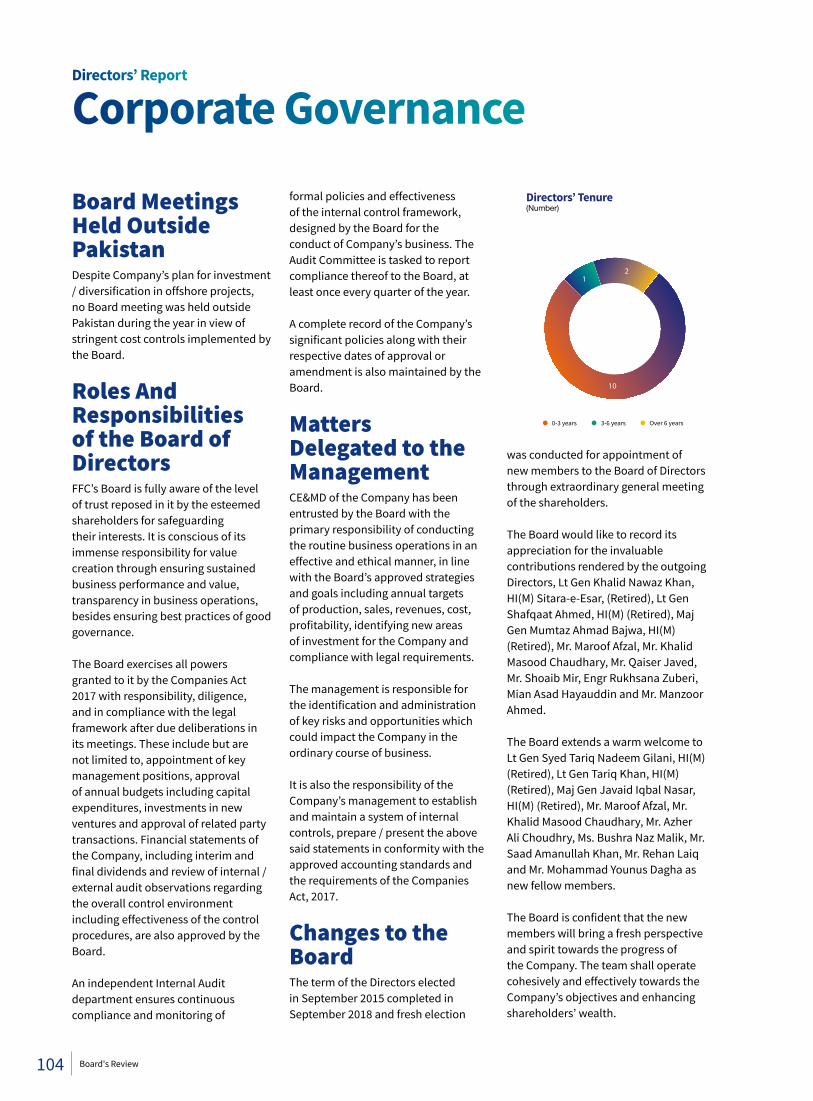
Board Meetings Held Outside PakistanDespite Company’s plan for investment / diversification in offshore projects, no Board meeting was held outside Pakistan during the year in view of stringent cost controls implemented by the Board.
Roles And Responsibilities of the Board of DirectorsFFC’s Board is fully aware of the level of trust reposed in it by the esteemed shareholders for safeguarding their interests. It is conscious of its immense responsibility for value creation through ensuring sustained business performance and value, transparency in business operations, besides ensuring best practices of good governance.
The Board exercises all powers granted to it by the Companies Act 2017 with responsibility, diligence, and in compliance with the legal framework after due deliberations in its meetings. These include but are not limited to, appointment of key management positions, approval of annual budgets including capital expenditures, investments in new ventures and approval of related party transactions. Financial statements of the Company, including interim and final dividends and review of internal / external audit observations regarding the overall control environment including effectiveness of the control procedures, are also approved by the Board.
An independent Internal Audit department ensures continuous compliance and monitoring of
formal policies and effectiveness of the internal control framework, designed by the Board for the conduct of Company’s business. The Audit Committee is tasked to report compliance thereof to the Board, at least once every quarter of the year.
A complete record of the Company’s significant policies along with their respective dates of approval or amendment is also maintained by the Board.
Matters Delegated to the ManagementCE&MD of the Company has been entrusted by the Board with the primary responsibility of conducting the routine business operations in an effective and ethical manner, in line with the Board’s approved strategies and goals including annual targets of production, sales, revenues, cost, profitability, identifying new areas of investment for the Company and compliance with legal requirements.
The management is responsible for the identification and administration of key risks and opportunities which could impact the Company in the ordinary course of business.
It is also the responsibility of the Company’s management to establish and maintain a system of internal controls, prepare / present the above said statements in conformity with the approved accounting standards and the requirements of the Companies Act, 2017.
Changes to the BoardThe term of the Directors elected in September 2015 completed in September 2018 and fresh election
was conducted for appointment of new members to the Board of Directors through extraordinary general meeting of the shareholders.
The Board would like to record its appreciation for the invaluable contributions rendered by the outgoing Directors, Lt Gen Khalid Nawaz Khan, HI(M) Sitara-e-Esar, (Retired), Lt Gen Shafqaat Ahmed, HI(M) (Retired), Maj Gen Mumtaz Ahmad Bajwa, HI(M) (Retired), Mr. Maroof Afzal, Mr. Khalid Masood Chaudhary, Mr. Qaiser Javed, Mr. Shoaib Mir, Engr Rukhsana Zuberi, Mian Asad Hayauddin and Mr. Manzoor Ahmed.
The Board extends a warm welcome to Lt Gen Syed Tariq Nadeem Gilani, HI(M) (Retired), Lt Gen Tariq Khan, HI(M) (Retired), Maj Gen Javaid Iqbal Nasar, HI(M) (Retired), Mr. Maroof Afzal, Mr. Khalid Masood Chaudhary, Mr. Azher Ali Choudhry, Ms. Bushra Naz Malik, Mr. Saad Amanullah Khan, Mr. Rehan Laiq and Mr. Mohammad Younus Dagha as new fellow members.
The Board is confident that the new members will bring a fresh perspective and spirit towards the progress of the Company. The team shall operate cohesively and effectively towards the Company’s objectives and enhancing shareholders’ wealth.
Directors’ Report
Corporate Governance
10
12
Directors’ Tenure(Number)
0-3 years 3-6 years Over 6 years
104 Board's Review
Directors’ RemunerationIn order to enhance value creation, FFC has implemented an independent, formal and transparent system for fixing executive Directors’ remuneration to attract well qualified and experienced Directors. The system is in compliance with legal requirements and it is ensured that remuneration is not at a level that could be perceived to compromise the independence of non-executive Directors.
As per the requirements of regulatory framework and internal procedures, these remuneration packages are subject to prior approval of the Board and no Director is involved in deciding their own remuneration.
Policy on Non-Executive and Independent Directors’ RemunerationEvery Director, including all non-executive and independent Directors, is entitled to remuneration for their services, as decided by the Board for attending Board and Committee meetings. They are also entitled to reimbursement of expenses including boarding / lodging and travel expenses incurred in connection to attendance of the Board / Board Committee meetings.
Any Director who serves on any Committee or who devotes special attention to the business of the Company or who otherwise performs services which, in the opinion of the Board, are outside the scope of statutory duties of a Director, may be paid such extra remuneration as the Board may determine.
Detail of the remuneration paid to executive and non-executive Directors during the year is given in Note 34 of the attached financial statements.
Connection of External Search Consultancy for Selection of Independent DirectorsThe election of the Directors was carried out during the year upon completion of the tenure of the retiring Directors. Selection of the independent Directors as replacement of the outgoing Director was carried out from a list of independent Directors maintained by the Pakistan Institute of Corporate Governance (PICG) under the Companies (Manner and Selection of Independent Directors) Regulations, 2018.
The PICG has no other connections with the Company, except for providing access to the database on independent directors besides directors training and evaluation of Board and / or individual directors’ performance.
Policy of Retention of Board Fee By the Executive Director in Other Companies FFC CE&MD is also an Executive Director on the Company’s Board of Directors by virtue of the Companies Act 2017. He also holds position as Non-Executive Director on the Boards of other Companies as disclosed on Page 22 of the Annual Report.
Fees paid by these companies are in compliance with policies of respective
companies which have been approved by their Board of Directors.
Evaluation of Board’s PerformanceCode of Corporate Governance requires evaluation of Board’s performance which is carried out at three levels:• Performance of individual
members
• Performance of the Board
• Performance of the Board Committees
Self EvaluationIndividual Director Evaluation questionnaire developed by the Pakistan Institute of Corporate Governance, in conformity with the Code of Corporate Governance and in line with best Global practices, is circulated to the Directors, for evaluation of their performance based on the following factors:
• Board composition
• Strategic planning
• Board & CEO effectiveness
• Board information
• Board Committees
• Board Procedures
• Board interaction
• Board & CEO Compensation
• Control environment
Strict level of confidentiality is practiced upon receiving of filled questionnaire and Directors’ comments by the Company Secretary.
Completed forms are then evaluated through a dedicated software to identify areas requiring improvement and differences of opinion.
105Annual Report 2018
External EvaluationAn evaluation conducted by external parties brings objectivity to the process and is recognized as a sign of Board’s commitment towards excellence in corporate governance.
In this regard, the Company has appointed Pakistan Institute of Corporate Governance to evaluate the performance of the Board and its Committees.
Results from internal as well as external performance evaluations are then discussed in detail in the subsequent Board meeting to address the highlighted areas and improve the Board’s performance.
Offices of the Chairman & CEOIn compliance with global best practices of corporate governance, the positions of the Chairman of the Board of Directors and the office of the Chief Executive are held by separate incumbents with clear demarcation of roles and responsibilities.
Brief Roles & Responsibilities of Chairman & CEOThe Board of Directors has clearly and distinctly outlined the respective roles and responsibilities of the Chairman and the Chief Executive Officer of the Company.
The Chairman is a non-executive Director of the Board, entrusted with the overall supervision and direction of the Board’s proceedings, and has the power to set the agenda, give directions and sign the minutes of the Board meetings. He is also responsible to ensure that the Board plays an effective role in fulfilling its responsibilities, besides assessing
and making recommendations on the efficiency of the Committees and individual Directors in fulfilling their responsibilities and avoidance of conflicts of interests.
Chief Executive Officer is an executive Director who also acts as the head of the Company’s Management. He is authorized for implementing the Board’s policies within delegated limits besides other responsibilities which include:
• Compliance with regulations and best practices
• Ensuring effective functioning of the internal control system
• Identifying risks and designing mitigation strategies
• Safeguarding of Company assets
• Development of human capital and good investor relations
• Sustainable growth of shareholder value
• Identification of potential diversification / investment projects
• Implementation of projects approved by the Board
• Preservation and promotion of the Company’s corporate image
CEO’s Performance Review By The BoardCEO is appointed by the Board for a tenure of 3 years and his performance is evaluated on an annual basis with respect to the KPIs assigned to him and his roles and responsibilities as prescribed under the regulatory framework.
Improvement in profitability of 35% despite lower dividend income, continued adhoc taxation, besides
significant devaluation of PKR is testament of the CEO’s performance during the year. The Company achieved highest ever all product sales revenue under the CEO’s astute leadership and the Board is also pleased with his performance, portraying Company’s good governance and transparency which is also recognized and rewarded on both national and international forums.
Formal Orientation at InductionA comprehensive orientation is conducted for each new member of the Board upon induction apprising them on the business operations, environment and long term strategy of the Company, in addition, extensive training programs are offered to the Directors for enhancement of managerial and governance skills.
The formal orientation and familiarization program mainly features the following:
• Role and responsibility of the director as per the Companies Act, 2017 , the Code of Corporate Governance and other regulatory requirements applicable in Pakistan
• Organizational / group structure, subsidiaries, associates and other related parties Company’s visions and strategies
• Major external and internal risks, including legal and regulatory risks and constraints
• FFC’s expectations from the Board, in terms of output, professional behavior, values and ethics
• Critical performance indicators
• Policy on Directors’ fees and other expenses
Directors’ Report
Corporate Governance
106 Board's Review
• Important documents pertaining to the Company’s legal status
• Company’s core competencies, investments, diversification ventures, etc.
• Summary of the Company’s major assets, liabilities, noteworthy contracts and major competitors
• Summary of major shareholders, suppliers, auditors and other stakeholders
o Status of Company affairs
o Strategic plans
o Market analysis
o Forecasts, budget and 5 year projections
o Latest financial statements
o Important minutes of past meetings
o Major litigations, current and potential
o Policy in relation to dividends, health & safety, environment, ethics, corporate social responsibility, anti-corruption, whistle blowing and conflict of interest, among others
Members of the Board also attended training courses to enhance their managerial skills and remain abreast with the latest and best management practices and policies adopted by leading corporations across the globe.
Directors’ Training ProgramBoard of DirectorsUnder the requirements of Code of Corporate Governance, the Directors of the Company have been appropriately certified under the Directors’ Training Program from SECP approved institutions well ahead of the timeframe set by the Code. Owing to
changes in the Board’s composition, only one member of the Board is yet to obtain the requisite certification which is scheduled during the current year to ensure certification of FFC’s entire Board.
Names of Directors who have obtained certification from SECP approved institutions are provided below:
• Lt Gen Syed Tariq Nadeem Gilani, HI(M) (Retired)
• Lt Gen Tariq Khan, HI(M) (Retired)
• Dr. Nadeem Inayat
• Mr. Farhad Shaikh Mohammad
• Mr. Per Kristian Bakkerud
• Brig Raashid Wali Janjua, SI(M) (Retired)
• Maj Gen Wasim Sadiq, HI(M) (Retired)
• Maj Gen Javaid Iqbal Nasar, HI(M) (Retired)
• Mr. Azher Ali Choudhry
• Mr. Saad Amanullah Khan
• Ms. Bushra Naz Malik
• Mr. Rehan Laiq
Heads of Departments & Female ExecutivesPursuant to the requirement of the revised Code of Corporate Governance regarding training of at least one head of department and one female executive every year, under the Directors’ Training Program, appropriate measures have been taken to ensure that the Company complies with the requirement within the time period stipulated by the Code.
Issues Raised at Last AGMGeneral clarifications were sought by the shareholders on Company’s published Annual Report, however,
no significant issue was raised during the 40th AGM of the Company held on March 13, 2018.
Trading in Shares by Directors and ExecutivesExecutives of the Company traded in a total of 1,628,489 shares of FFC during the year. Besides this, no other trading was conducted by the Directors, executives and their spouses and minor children. Upon information received by the Company, PSX is being regularly updated on trading of Company’s shares by Management Employees.
The Board determines thresholds for identification of “Executives” in addition to those already specified in the Code of Corporate Governance and reviews them annually in compliance with the Code.
Quarterly and Annual Financial StatementsIn compliance with requirements of applicable regulatory framework, the CE&MD and CFO duly endorsed periodic financial statements of the Company and consolidated financial statements of the Group for circulation to the Directors.
These were approved by the Board and circulated to shareholders within one month of the reporting date in case of quarterly financial statements and within the permitted limit of two months in case of half yearly financial statements.
The annual financial statements along with consolidated financial statements of the Group have also been audited by the External Auditors and recommended by the Board for
107Annual Report 2018
shareholders’ approval within one month after the closing date and will be presented to the shareholders in the upcoming Annual General Meeting for approval.
Other non-financial information to be circulated to governing bodies and other stakeholders was also delivered in an accurate and timely manner in accordance with the applicable regulatory requirements.
External AuditorsKPMG Taseer Hadi & Co., Chartered Accountants have completed the annual audit for the year ended December 31, 2018, and have issued an unqualified audit report. The auditors will retire on the conclusion of the upcoming Annual General Meeting of the Company, and being eligible, have offered themselves for reappointment for the year ending December 31, 2019.
Based on notice received from a shareholder, the Board has recommended appointment of A.F. Ferguson & Co. Chartered Accountants as external Auditors of the Company for the upcoming financial year, at a fee of Rs 1, 975 thousand.
Pattern of ShareholdingAs at December 31, 2018, the Sponsors, Directors and Executives of the Company held the following number of shares:
Particulars Numbers of Shares
Sponsors 564,204,254
Directors 2,001,100
Executives 633,401
A detailed pattern of shareholding is disclosed on page 346 of the Annual Report 2018.
Policy for Security Clearance of Foreign Directors Every foreign Director on the Board of FFC is required to furnish a declaration that necessary documents have been submitted with the Company Registration Office (CRO), Islamabad and that in case his name is not cleared for security purposes by the Ministry of Interior, the Company shall facilitate arrangement of such clearance, and in case the clearance could not still be arranged, then the Company shall take steps for replacement of such Director as considered appropriate.
Diversity PolicyFFC is committed to encouraging diversity and ensuring equal opportunities for individuals based on merit. We believe in free and equitable treatment of employees by embracing and encouraging diversity in the form of age, gender, ethnicity, physical and mental ability, and other such characteristics that make our employees a unique blend of cultural diversity.
FFC believes in providing respectable career opportunities to special persons and has extended employment to such persons along with an inclusive, accessible and barrier free work environment. Almost 2% of our workforce consist of special persons employed in various positions throughout the Company with due consideration to their special needs.
FFC has been on the forefront of advocating alleviation of gender discrimination in the Country, a principle that is instilled in our human capital strategy. The Company
provides one of the most rewarding career opportunities in the Country while providing a motivating working environment, thereby attracting competent professionals, and transforming them into future global leaders.
List of Companies in which Executive Director is acting as a Non-Executive DirectorIn addition to being the Chief Executive & Managing Director of the Company, Lt Gen Tariq Khan, HI(M) (Retired) holds Non-Executive Directorship on the Board of the following companies:
• Askari Bank Limited
• Fauji Fertilizer Bin Qasim Limited
• Fauji Foods Limited
• Fauji Meat Limited
• FFBL Foods Limited
• FFBL Power Company Limited
• Pakistan Maroc Phosphore S.A.
• Phillip Morris (Pakistan) Limited
• Thar Energy Limited
Related PartiesThe Company maintains a comprehensive and updated list of all related parties. Names of all such related parties along with whom the Company had entered into transactions during the year, along with the nature of their relationship and percentage holdings have been appropriately disclosed in Note 38.1 of the Financial Statements.
As per the requirements of Fourth schedule of the Companies Act 2017, detailed disclosure regarding related party transactions has been presented in Note 38.3 of the Financial Statements.
Directors’ Report
Corporate Governance
108 Board's Review
All transactions with related parties arising in the normal course of business are carried out on an unbiased, arm’s length basis at normal commercial terms and conditions.
All transactions with related parties where majority of Directors of FFC are interested, are referred to the shareholders in a general meeting for ratification / approval.
In compliance with the Code of Corporate Governance and applicable laws, a comprehensive list of all related party transactions was placed before the Audit Committee for review at the end of each quarter. After review by the Committee, the transactions were considered and approved by the Board keeping in view the recommendations made by the Committee.
Understanding of the views of Major Shareholders by the Non-Executive DirectorsFauji Foundation (FF) holds major equity stake in the Company, comprising 44.35% ordinary shares at the end of the year. FF conducts a detailed orientation process for each new member of the Board upon induction, apprising them on the expectation of the majority shareholder and their responsibilities.
Presence of the Chairperson Audit Committee at the AGMAt FFC, we acknowledge and honor the trust reposed in us by the shareholders, and strive to enforce a transparent relationship with all
stakeholders. Shareholders are invited to all General Meetings and are encouraged to share their concerns and queries.
Members of the Board, the Chief Executive and other senior management personnel were present at the General Meetings held during the year, to address all concerns and queries raised by the shareholders.
Chairperson of the Audit committee was also present at these meetings to answer any questions on the Audit Committee’s activities and matters within the scope of the Committee’s responsibilities.
Encouraging Minority Shareholders to Attend General Meetings The Company disseminates the notice for its general and extraordinary meetings in English and Urdu newspapers having vast circulation across the Country, besides sending the notices through shareholders’ email addresses to encourage maximum attendance at the meetings.
Stakeholders’ Engagement At FFC, we consider engagement with stakeholders of paramount importance and ensure the same through dissemination of material information to the stock exchanges on timely basis, analysts briefings, meeting with stakeholders, besides maintaining an updated Investors Relations section on Company website which can be accessed through the following web link: http://www.ffc.com.pk/investors-relations/.
An interactive email interface is provided on the Company website for direct contact with the concerned function, besides providing names, email addresses and contact number of Functional-heads.
Our prime stakeholders - the farmers are engaged through our Agri-extension services involving farmers meetings, farm visits, crop demonstration and group discussion for their capacity building and yield improvement.
The Company has also developed mobile application on fertilizer recommendation for farmers besides “Kashtkar desk” on Company website containing useful literature, reports and documentaries for the farmers in local languages. Facility of a toll free farmers help line has also been provided.
109Annual Report 2018
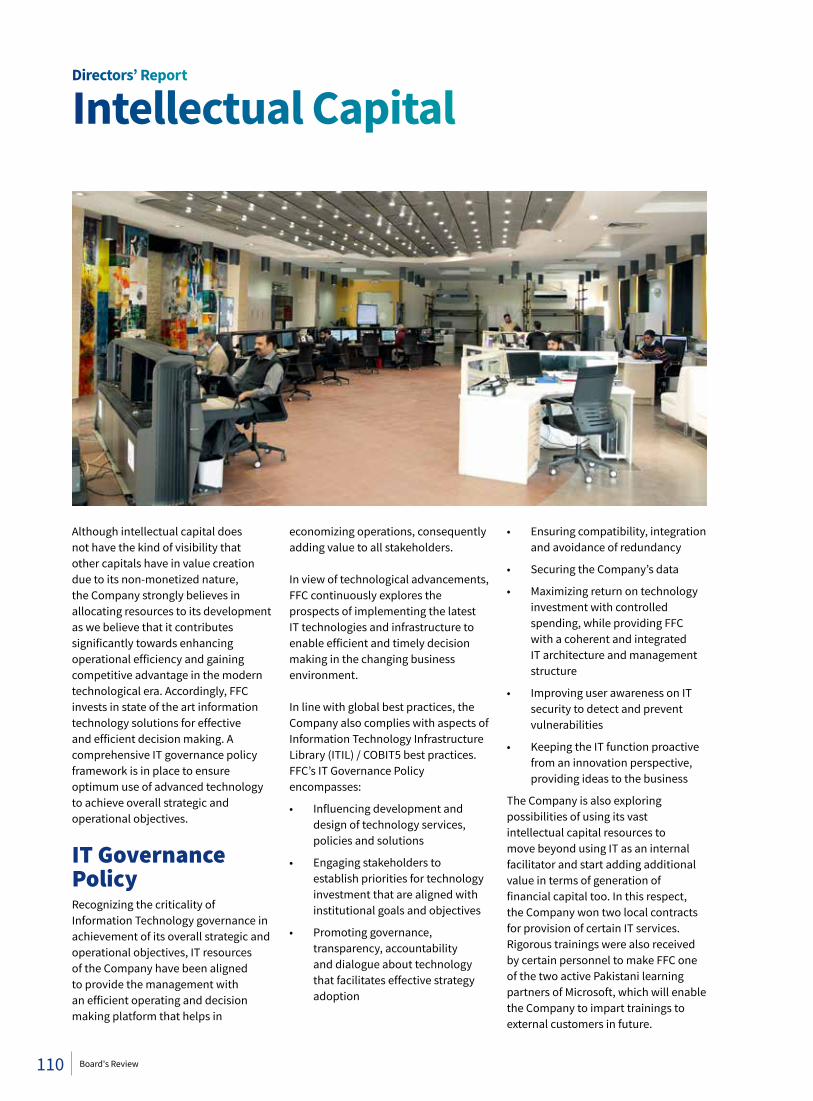
Although intellectual capital does not have the kind of visibility that other capitals have in value creation due to its non-monetized nature, the Company strongly believes in allocating resources to its development as we believe that it contributes significantly towards enhancing operational efficiency and gaining competitive advantage in the modern technological era. Accordingly, FFC invests in state of the art information technology solutions for effective and efficient decision making. A comprehensive IT governance policy framework is in place to ensure optimum use of advanced technology to achieve overall strategic and operational objectives.
IT Governance PolicyRecognizing the criticality of Information Technology governance in achievement of its overall strategic and operational objectives, IT resources of the Company have been aligned to provide the management with an efficient operating and decision making platform that helps in
economizing operations, consequently adding value to all stakeholders.
In view of technological advancements, FFC continuously explores the prospects of implementing the latest IT technologies and infrastructure to enable efficient and timely decision making in the changing business environment.
In line with global best practices, the Company also complies with aspects of Information Technology Infrastructure Library (ITIL) / COBIT5 best practices.FFC’s IT Governance Policy encompasses:
• Influencing development and design of technology services, policies and solutions
• Engaging stakeholders to establish priorities for technology investment that are aligned with institutional goals and objectives
• Promoting governance, transparency, accountability and dialogue about technology that facilitates effective strategy adoption
• Ensuring compatibility, integration and avoidance of redundancy
• Securing the Company’s data
• Maximizing return on technology investment with controlled spending, while providing FFC with a coherent and integrated IT architecture and management structure
• Improving user awareness on IT security to detect and prevent vulnerabilities
• Keeping the IT function proactive from an innovation perspective, providing ideas to the business
The Company is also exploring possibilities of using its vast intellectual capital resources to move beyond using IT as an internal facilitator and start adding additional value in terms of generation of financial capital too. In this respect, the Company won two local contracts for provision of certain IT services. Rigorous trainings were also received by certain personnel to make FFC one of the two active Pakistani learning partners of Microsoft, which will enable the Company to impart trainings to external customers in future.
Directors’ Report
Intellectual Capital
110 Board's Review
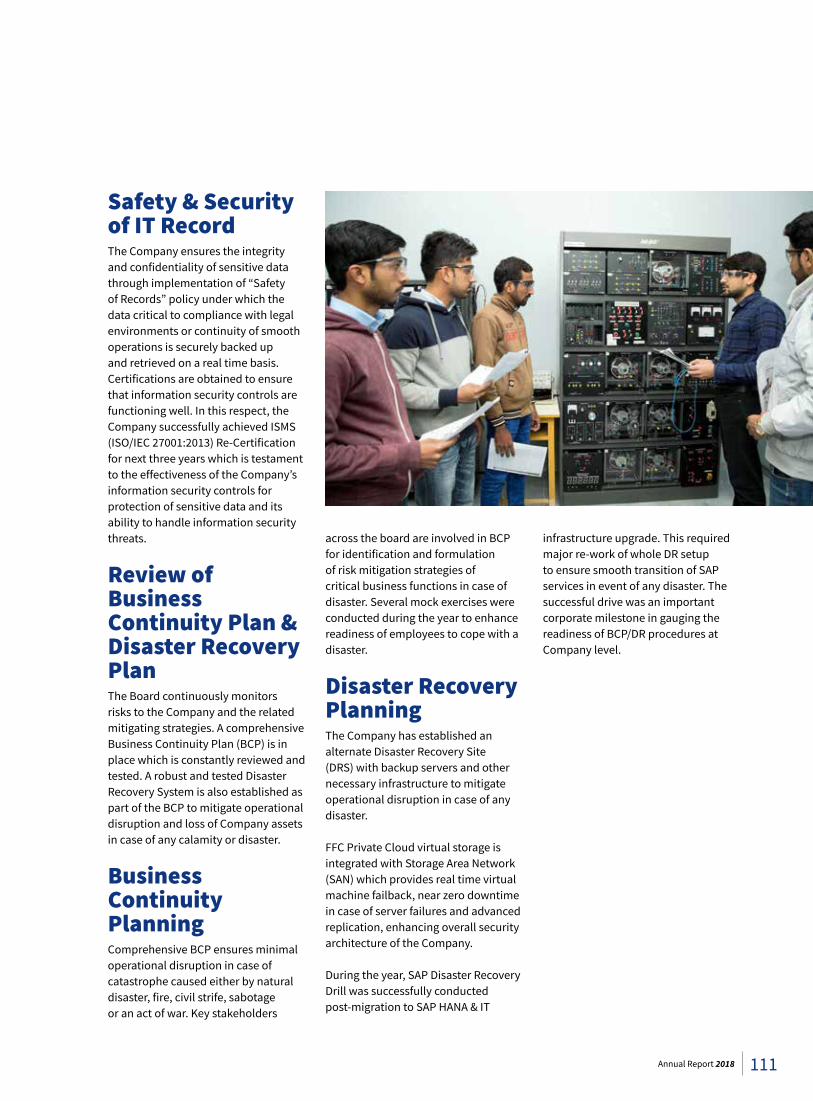
Safety & Security of IT Record The Company ensures the integrity and confidentiality of sensitive data through implementation of “Safety of Records” policy under which the data critical to compliance with legal environments or continuity of smooth operations is securely backed up and retrieved on a real time basis. Certifications are obtained to ensure that information security controls are functioning well. In this respect, the Company successfully achieved ISMS (ISO/IEC 27001:2013) Re-Certification for next three years which is testament to the effectiveness of the Company’s information security controls for protection of sensitive data and its ability to handle information security threats.
Review of Business Continuity Plan & Disaster Recovery PlanThe Board continuously monitors risks to the Company and the related mitigating strategies. A comprehensive Business Continuity Plan (BCP) is in place which is constantly reviewed and tested. A robust and tested Disaster Recovery System is also established as part of the BCP to mitigate operational disruption and loss of Company assets in case of any calamity or disaster.
Business Continuity Planning Comprehensive BCP ensures minimal operational disruption in case of catastrophe caused either by natural disaster, fire, civil strife, sabotage or an act of war. Key stakeholders
across the board are involved in BCP for identification and formulation of risk mitigation strategies of critical business functions in case of disaster. Several mock exercises were conducted during the year to enhance readiness of employees to cope with a disaster.
Disaster Recovery Planning The Company has established an alternate Disaster Recovery Site (DRS) with backup servers and other necessary infrastructure to mitigate operational disruption in case of any disaster.
FFC Private Cloud virtual storage is integrated with Storage Area Network (SAN) which provides real time virtual machine failback, near zero downtime in case of server failures and advanced replication, enhancing overall security architecture of the Company.
During the year, SAP Disaster Recovery Drill was successfully conducted post-migration to SAP HANA & IT
infrastructure upgrade. This required major re-work of whole DR setup to ensure smooth transition of SAP services in event of any disaster. The successful drive was an important corporate milestone in gauging the readiness of BCP/DR procedures at Company level.
111Annual Report 2018
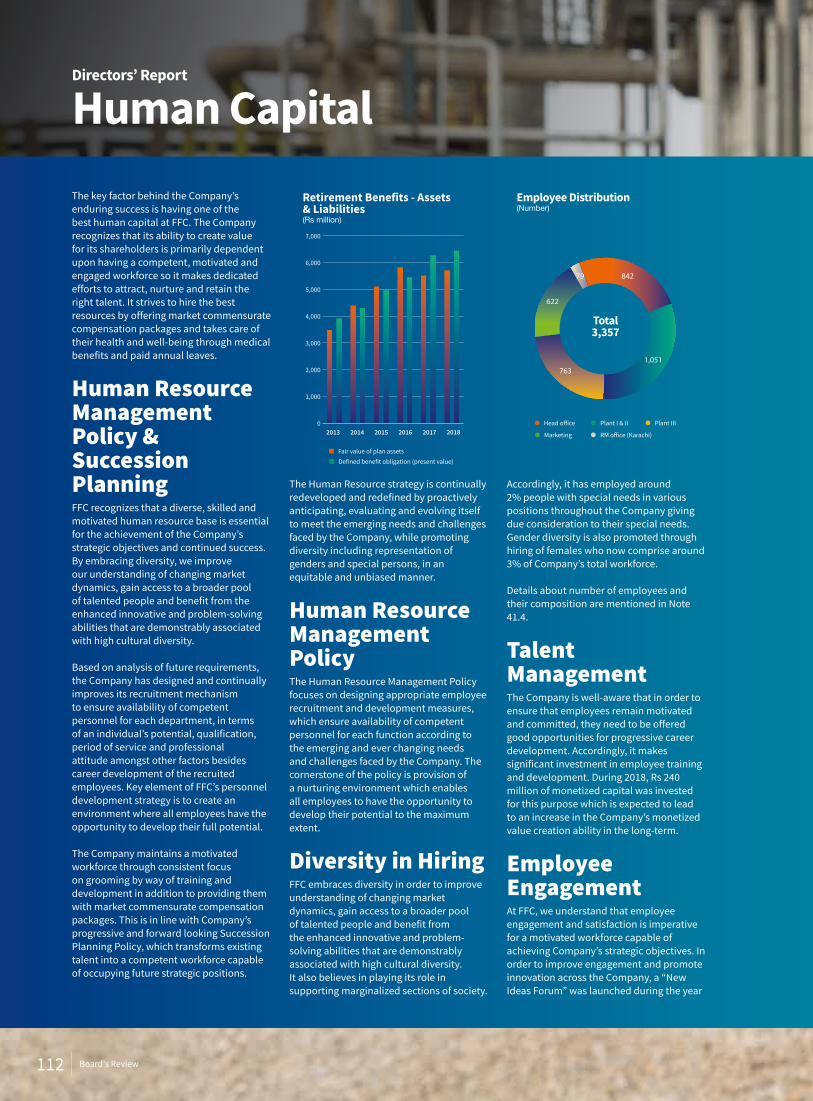
The key factor behind the Company’s enduring success is having one of the best human capital at FFC. The Company recognizes that its ability to create value for its shareholders is primarily dependent upon having a competent, motivated and engaged workforce so it makes dedicated efforts to attract, nurture and retain the right talent. It strives to hire the best resources by offering market commensurate compensation packages and takes care of their health and well-being through medical benefits and paid annual leaves.
Human Resource Management Policy & Succession PlanningFFC recognizes that a diverse, skilled and motivated human resource base is essential for the achievement of the Company’s strategic objectives and continued success. By embracing diversity, we improve our understanding of changing market dynamics, gain access to a broader pool of talented people and benefit from the enhanced innovative and problem-solving abilities that are demonstrably associated with high cultural diversity.
Based on analysis of future requirements, the Company has designed and continually improves its recruitment mechanism to ensure availability of competent personnel for each department, in terms of an individual’s potential, qualification, period of service and professional attitude amongst other factors besides career development of the recruited employees. Key element of FFC’s personnel development strategy is to create an environment where all employees have the opportunity to develop their full potential.
The Company maintains a motivated workforce through consistent focus on grooming by way of training and development in addition to providing them with market commensurate compensation packages. This is in line with Company’s progressive and forward looking Succession Planning Policy, which transforms existing talent into a competent workforce capable of occupying future strategic positions.
The Human Resource strategy is continually redeveloped and redefined by proactively anticipating, evaluating and evolving itself to meet the emerging needs and challenges faced by the Company, while promoting diversity including representation of genders and special persons, in an equitable and unbiased manner.
Human Resource Management PolicyThe Human Resource Management Policy focuses on designing appropriate employee recruitment and development measures, which ensure availability of competent personnel for each function according to the emerging and ever changing needs and challenges faced by the Company. The cornerstone of the policy is provision of a nurturing environment which enables all employees to have the opportunity to develop their potential to the maximum extent.
Diversity in HiringFFC embraces diversity in order to improve understanding of changing market dynamics, gain access to a broader pool of talented people and benefit from the enhanced innovative and problem-solving abilities that are demonstrably associated with high cultural diversity. It also believes in playing its role in supporting marginalized sections of society.
Accordingly, it has employed around 2% people with special needs in various positions throughout the Company giving due consideration to their special needs. Gender diversity is also promoted through hiring of females who now comprise around 3% of Company’s total workforce.
Details about number of employees and their composition are mentioned in Note 41.4.
Talent ManagementThe Company is well-aware that in order to ensure that employees remain motivated and committed, they need to be offered good opportunities for progressive career development. Accordingly, it makes significant investment in employee training and development. During 2018, Rs 240 million of monetized capital was invested for this purpose which is expected to lead to an increase in the Company’s monetized value creation ability in the long-term.
Employee EngagementAt FFC, we understand that employee engagement and satisfaction is imperative for a motivated workforce capable of achieving Company’s strategic objectives. In order to improve engagement and promote innovation across the Company, a “New Ideas Forum” was launched during the year
Directors’ Report
Human Capital
2017 20182013 2014 2015 2016
Fair value of plan assetsDefined benefit obligation (present value)
Retirement Benefits - Assets& Liabilities(Rs million)
0
1,000
2,000
3,000
4,000
5,000
6,000
7,000
Employee Distribution(Number)
Total3,357
1,051763
622
79 842
Head office Plant I & II
RM office (Karachi)
Plant III
Marketing
112 Board's Review
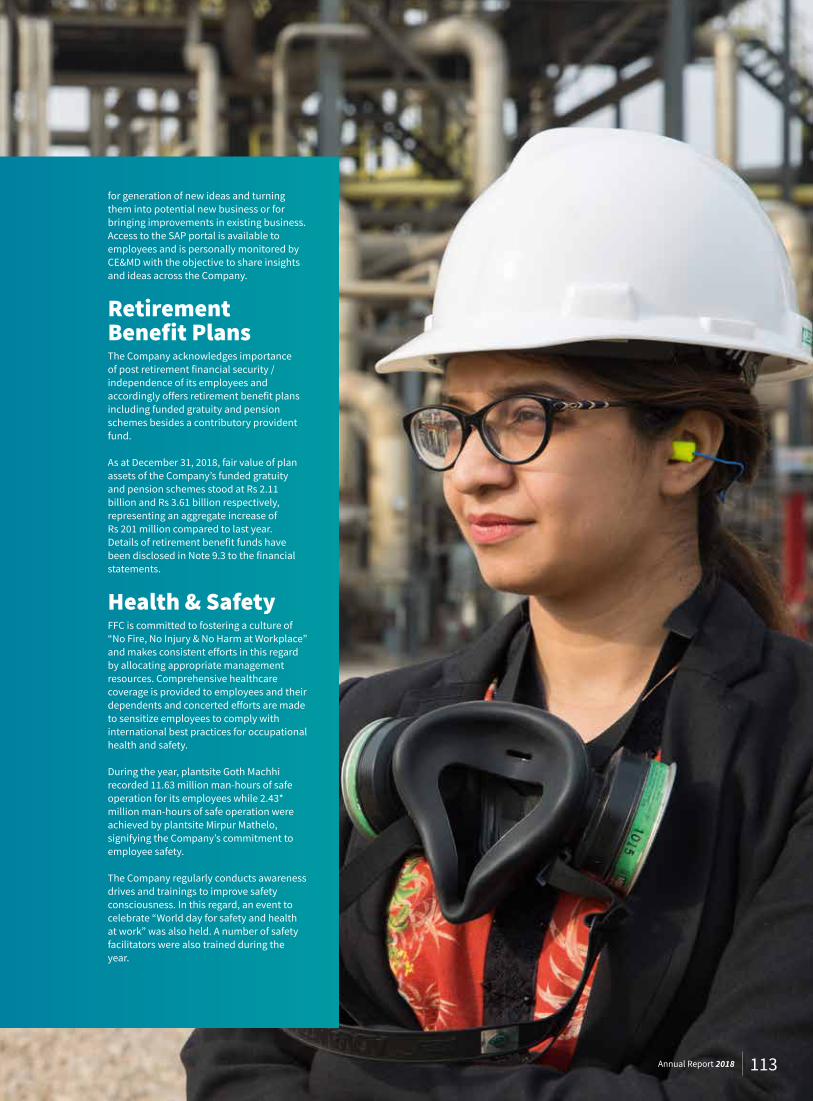
for generation of new ideas and turning them into potential new business or for bringing improvements in existing business. Access to the SAP portal is available to employees and is personally monitored by CE&MD with the objective to share insights and ideas across the Company.
Retirement Benefit PlansThe Company acknowledges importance of post retirement financial security /independence of its employees and accordingly offers retirement benefit plans including funded gratuity and pension schemes besides a contributory provident fund.
As at December 31, 2018, fair value of plan assets of the Company’s funded gratuity and pension schemes stood at Rs 2.11 billion and Rs 3.61 billion respectively, representing an aggregate increase of Rs 201 million compared to last year. Details of retirement benefit funds have been disclosed in Note 9.3 to the financial statements.
Health & SafetyFFC is committed to fostering a culture of “No Fire, No Injury & No Harm at Workplace” and makes consistent efforts in this regard by allocating appropriate management resources. Comprehensive healthcare coverage is provided to employees and their dependents and concerted efforts are made to sensitize employees to comply with international best practices for occupational health and safety.
During the year, plantsite Goth Machhi recorded 11.63 million man-hours of safe operation for its employees while 2.43* million man-hours of safe operation were achieved by plantsite Mirpur Mathelo, signifying the Company’s commitment to employee safety.
The Company regularly conducts awareness drives and trainings to improve safety consciousness. In this regard, an event to celebrate “World day for safety and health at work” was also held. A number of safety facilitators were also trained during the year.
113Annual Report 2018
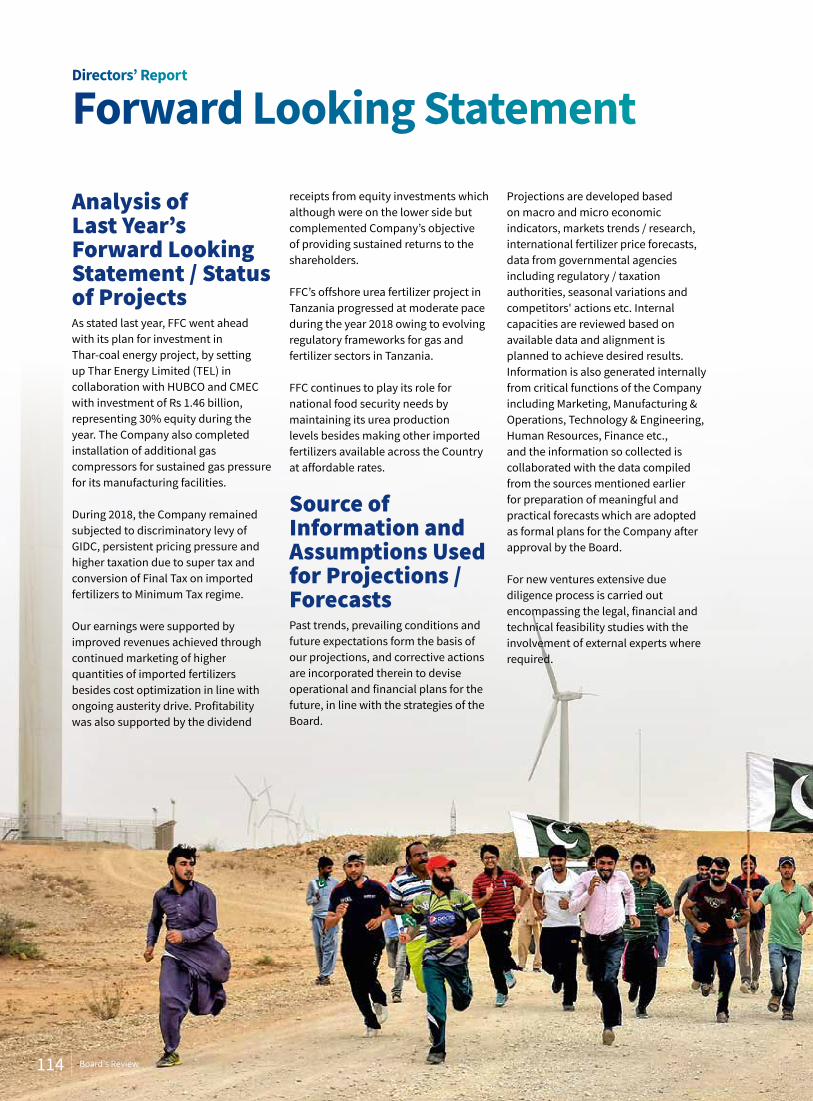
Analysis of Last Year’s Forward Looking Statement / Status of ProjectsAs stated last year, FFC went ahead with its plan for investment in Thar-coal energy project, by setting up Thar Energy Limited (TEL) in collaboration with HUBCO and CMEC with investment of Rs 1.46 billion, representing 30% equity during the year. The Company also completed installation of additional gas compressors for sustained gas pressure for its manufacturing facilities.
During 2018, the Company remained subjected to discriminatory levy of GIDC, persistent pricing pressure and higher taxation due to super tax and conversion of Final Tax on imported fertilizers to Minimum Tax regime.
Our earnings were supported by improved revenues achieved through continued marketing of higher quantities of imported fertilizers besides cost optimization in line with ongoing austerity drive. Profitability was also supported by the dividend
receipts from equity investments which although were on the lower side but complemented Company’s objective of providing sustained returns to the shareholders.
FFC’s offshore urea fertilizer project in Tanzania progressed at moderate pace during the year 2018 owing to evolving regulatory frameworks for gas and fertilizer sectors in Tanzania.
FFC continues to play its role for national food security needs by maintaining its urea production levels besides making other imported fertilizers available across the Country at affordable rates.
Source of Information and Assumptions Used for Projections /ForecastsPast trends, prevailing conditions and future expectations form the basis of our projections, and corrective actions are incorporated therein to devise operational and financial plans for the future, in line with the strategies of the Board.
Projections are developed based on macro and micro economic indicators, markets trends / research, international fertilizer price forecasts, data from governmental agencies including regulatory / taxation authorities, seasonal variations and competitors' actions etc. Internal capacities are reviewed based on available data and alignment is planned to achieve desired results. Information is also generated internally from critical functions of the Company including Marketing, Manufacturing & Operations, Technology & Engineering, Human Resources, Finance etc., and the information so collected is collaborated with the data compiled from the sources mentioned earlier for preparation of meaningful and practical forecasts which are adopted as formal plans for the Company after approval by the Board.
For new ventures extensive due diligence process is carried out encompassing the legal, financial and technical feasibility studies with the involvement of external experts where required.
Directors’ Report
Forward Looking Statement
114 Board's Review
Forward Looking StatementOn technological and environmental front, FFC continue to maintain its edge through well-maintained manufacturing facilities despite old vintage of its plants, along with highly trained human capital, developed with the vision to embrace changes to the advantage of Company in foreseeable future.
The Business Model at FFC is devised to ensure continued improvement through efficiency enhancement, stringent cost controls and resilience against adverse market conditions. The Company is also committed to cope with such challenges through concerted marketing efforts to capitalise and enhance customers' loyalty with the Sona brand.
The dedication of our talented workforce enabled the Company of 35% improvement in the net earnings for 2018 which also provides confidence for sustained results in the future while maintaining the highest levels of governance and integrity.
In order to sustain the recent growth of Agriculture sector of the Country, supply of fertilizers at affordable rates is pivotal which requires improvement in macroeconomic indicators besides favourable fiscal policies for fertilizer sector, including removal of disparity in input and output GST rates, early release of long outstanding subsidy claims and rationalization of discriminatory levy of GIDC.
Going forward, the growth in revenues would depend on favourable governmental policies enabling us to pass on the impact of inflation and other factors which, along with dividend receipts from equity investments are expected to result in continuation of the profitable trajectory of the Company, and also provide attractive returns to the shareholders.
Lt Gen Syed Tariq Nadeem Gilani HI (M), (Retired)Chairman
Lt Gen Tariq KhanHI (M), (Retired)Chief Executive & Managing Director
RawalpindiJanuary 31, 2019
115Annual Report 2018
116 Board's Review
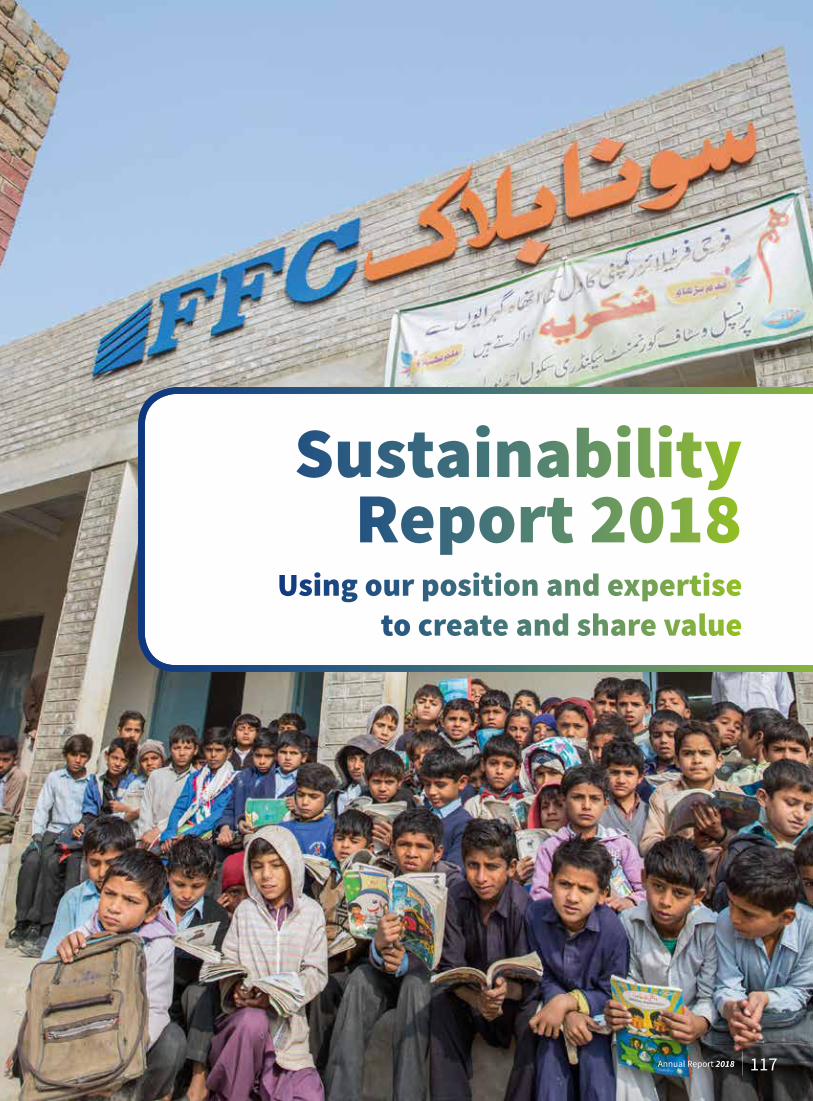
Sustainability Report 2018
Using our position and expertise to create and share value
117Annual Report 2018
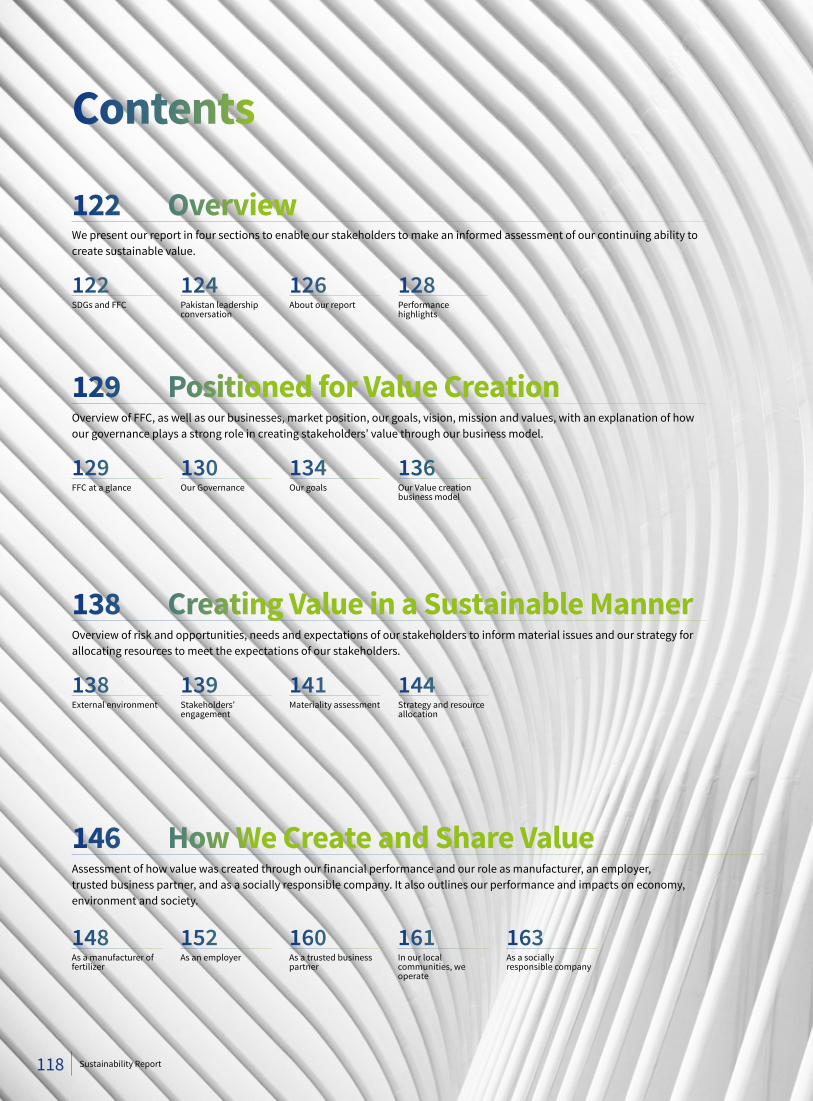
Contents
Overview of FFC, as well as our businesses, market position, our goals, vision, mission and values, with an explanation of how our governance plays a strong role in creating stakeholders’ value through our business model.
Overview of risk and opportunities, needs and expectations of our stakeholders to inform material issues and our strategy for allocating resources to meet the expectations of our stakeholders.
Assessment of how value was created through our financial performance and our role as manufacturer, an employer, trusted business partner, and as a socially responsible company. It also outlines our performance and impacts on economy, environment and society.
148As a manufacturer of fertilizer
129FFC at a glance
138External environment
152As an employer
130Our Governance
139Stakeholders’ engagement
160As a trusted business partner
134Our goals
141Materiality assessment
161In our local communities, we operate
163As a socially responsible company
136Our Value creation business model
144Strategy and resource allocation
We present our report in four sections to enable our stakeholders to make an informed assessment of our continuing ability to create sustainable value.
122SDGs and FFC
124Pakistan leadership conversation
126About our report
128Performance highlights
129 Positioned for Value Creation
122 Overview
138 Creating Value in a Sustainable Manner
146 How We Create and Share Value
118 Sustainability Report
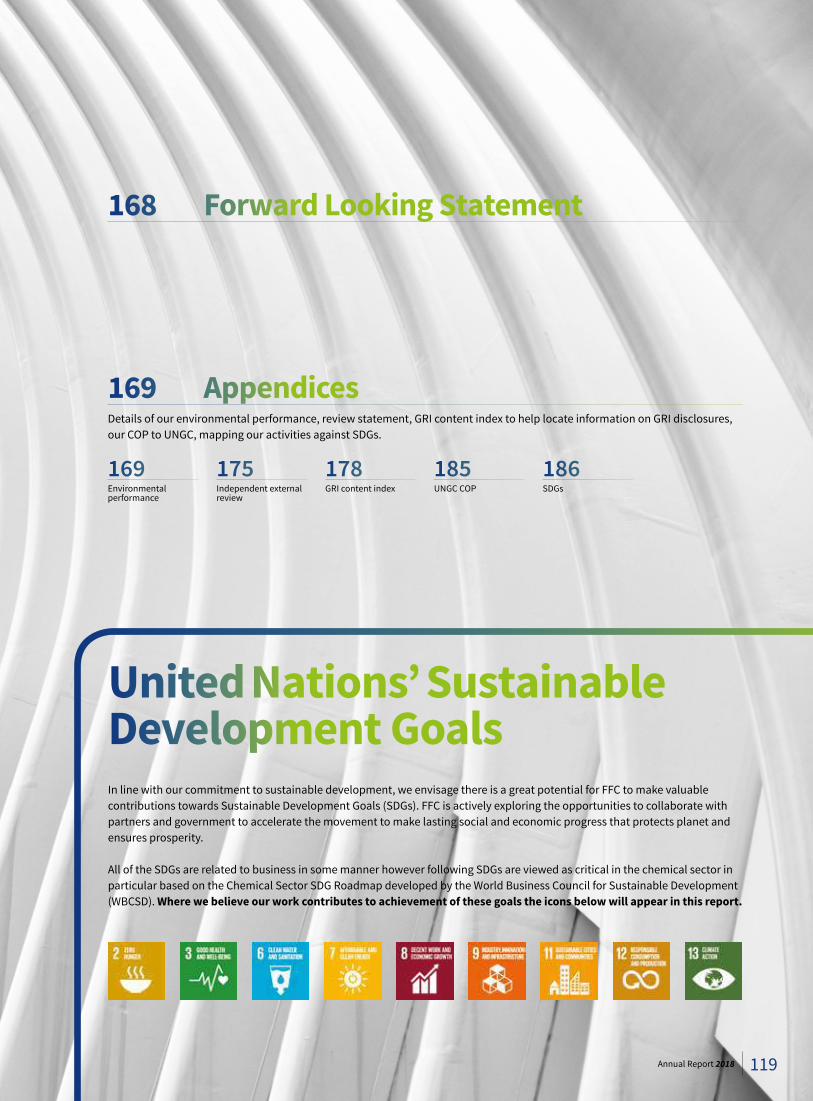
United Nations’ Sustainable Development GoalsIn line with our commitment to sustainable development, we envisage there is a great potential for FFC to make valuable contributions towards Sustainable Development Goals (SDGs). FFC is actively exploring the opportunities to collaborate with partners and government to accelerate the movement to make lasting social and economic progress that protects planet and ensures prosperity.
All of the SDGs are related to business in some manner however following SDGs are viewed as critical in the chemical sector in particular based on the Chemical Sector SDG Roadmap developed by the World Business Council for Sustainable Development (WBCSD). Where we believe our work contributes to achievement of these goals the icons below will appear in this report.
168 Forward Looking Statement
Details of our environmental performance, review statement, GRI content index to help locate information on GRI disclosures, our COP to UNGC, mapping our activities against SDGs.
169Environmental performance
175Independent external review
178GRI content index
185UNGC COP
186SDGs
169 Appendices
119Annual Report 2018

GIVING BACK TO THE SOCIETY
120 Sustainability Report

121Annual Report 2018
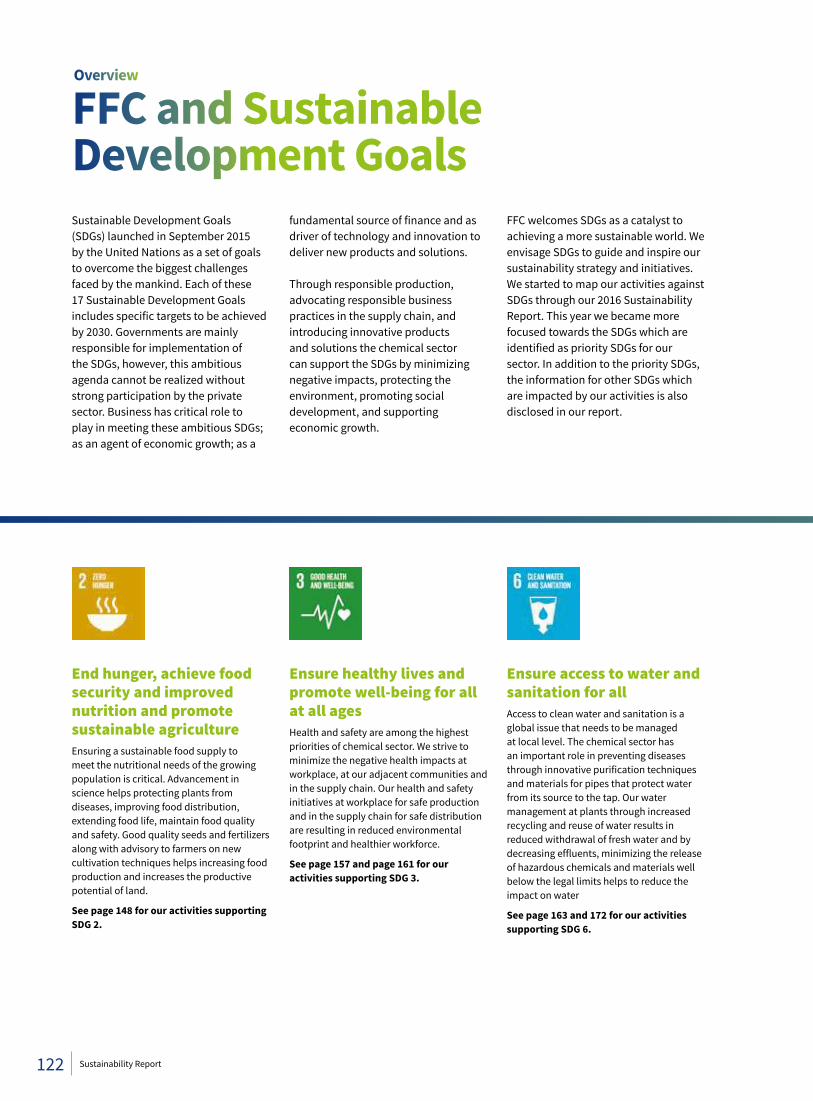
FFC and Sustainable Development GoalsSustainable Development Goals (SDGs) launched in September 2015 by the United Nations as a set of goals to overcome the biggest challenges faced by the mankind. Each of these 17 Sustainable Development Goals includes specific targets to be achieved by 2030. Governments are mainly responsible for implementation of the SDGs, however, this ambitious agenda cannot be realized without strong participation by the private sector. Business has critical role to play in meeting these ambitious SDGs; as an agent of economic growth; as a
End hunger, achieve food security and improved nutrition and promote sustainable agricultureEnsuring a sustainable food supply to meet the nutritional needs of the growing population is critical. Advancement in science helps protecting plants from diseases, improving food distribution, extending food life, maintain food quality and safety. Good quality seeds and fertilizers along with advisory to farmers on new cultivation techniques helps increasing food production and increases the productive potential of land.
See page 148 for our activities supporting SDG 2.
fundamental source of finance and as driver of technology and innovation to deliver new products and solutions.
Through responsible production, advocating responsible business practices in the supply chain, and introducing innovative products and solutions the chemical sector can support the SDGs by minimizing negative impacts, protecting the environment, promoting social development, and supporting economic growth.
FFC welcomes SDGs as a catalyst to achieving a more sustainable world. We envisage SDGs to guide and inspire our sustainability strategy and initiatives. We started to map our activities against SDGs through our 2016 Sustainability Report. This year we became more focused towards the SDGs which are identified as priority SDGs for our sector. In addition to the priority SDGs, the information for other SDGs which are impacted by our activities is also disclosed in our report.
Ensure healthy lives and promote well-being for all at all ages Health and safety are among the highest priorities of chemical sector. We strive to minimize the negative health impacts at workplace, at our adjacent communities and in the supply chain. Our health and safety initiatives at workplace for safe production and in the supply chain for safe distribution are resulting in reduced environmental footprint and healthier workforce.
See page 157 and page 161 for our activities supporting SDG 3.
Ensure access to water and sanitation for allAccess to clean water and sanitation is a global issue that needs to be managed at local level. The chemical sector has an important role in preventing diseases through innovative purification techniques and materials for pipes that protect water from its source to the tap. Our water management at plants through increased recycling and reuse of water results in reduced withdrawal of fresh water and by decreasing effluents, minimizing the release of hazardous chemicals and materials well below the legal limits helps to reduce the impact on water
See page 163 and 172 for our activities supporting SDG 6.
Overview
122 Sustainability Report
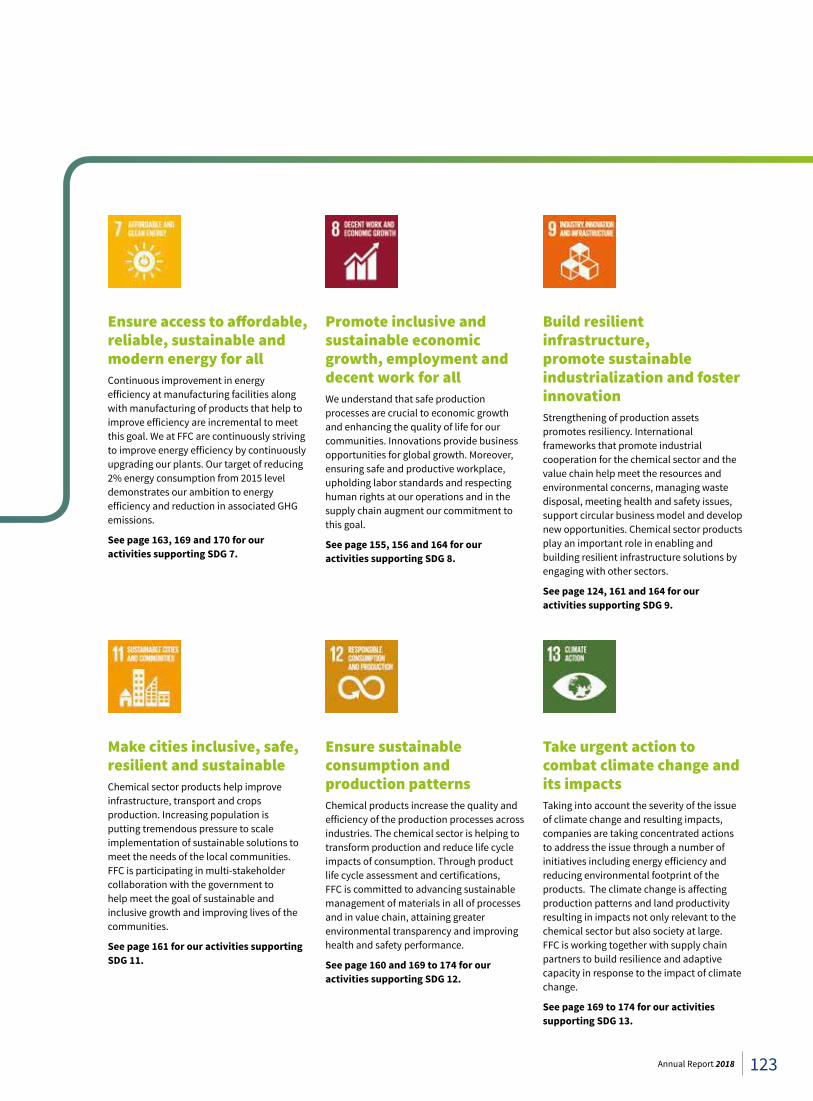
Ensure access to affordable, reliable, sustainable and modern energy for allContinuous improvement in energy efficiency at manufacturing facilities along with manufacturing of products that help to improve efficiency are incremental to meet this goal. We at FFC are continuously striving to improve energy efficiency by continuously upgrading our plants. Our target of reducing 2% energy consumption from 2015 level demonstrates our ambition to energy efficiency and reduction in associated GHG emissions.
See page 163, 169 and 170 for our activities supporting SDG 7.
Make cities inclusive, safe, resilient and sustainableChemical sector products help improve infrastructure, transport and crops production. Increasing population is putting tremendous pressure to scale implementation of sustainable solutions to meet the needs of the local communities. FFC is participating in multi-stakeholder collaboration with the government to help meet the goal of sustainable and inclusive growth and improving lives of the communities.
See page 161 for our activities supporting SDG 11.
Promote inclusive and sustainable economic growth, employment and decent work for all We understand that safe production processes are crucial to economic growth and enhancing the quality of life for our communities. Innovations provide business opportunities for global growth. Moreover, ensuring safe and productive workplace, upholding labor standards and respecting human rights at our operations and in the supply chain augment our commitment to this goal.
See page 155, 156 and 164 for our activities supporting SDG 8.
Ensure sustainable consumption and production patterns Chemical products increase the quality and efficiency of the production processes across industries. The chemical sector is helping to transform production and reduce life cycle impacts of consumption. Through product life cycle assessment and certifications, FFC is committed to advancing sustainable management of materials in all of processes and in value chain, attaining greater environmental transparency and improving health and safety performance.
See page 160 and 169 to 174 for our activities supporting SDG 12.
Build resilient infrastructure, promote sustainable industrialization and foster innovationStrengthening of production assets promotes resiliency. International frameworks that promote industrial cooperation for the chemical sector and the value chain help meet the resources and environmental concerns, managing waste disposal, meeting health and safety issues, support circular business model and develop new opportunities. Chemical sector products play an important role in enabling and building resilient infrastructure solutions by engaging with other sectors.
See page 124, 161 and 164 for our activities supporting SDG 9.
Take urgent action to combat climate change and its impactsTaking into account the severity of the issue of climate change and resulting impacts, companies are taking concentrated actions to address the issue through a number of initiatives including energy efficiency and reducing environmental footprint of the products. The climate change is affecting production patterns and land productivity resulting in impacts not only relevant to the chemical sector but also society at large. FFC is working together with supply chain partners to build resilience and adaptive capacity in response to the impact of climate change.
See page 169 to 174 for our activities supporting SDG 13.
123Annual Report 2018
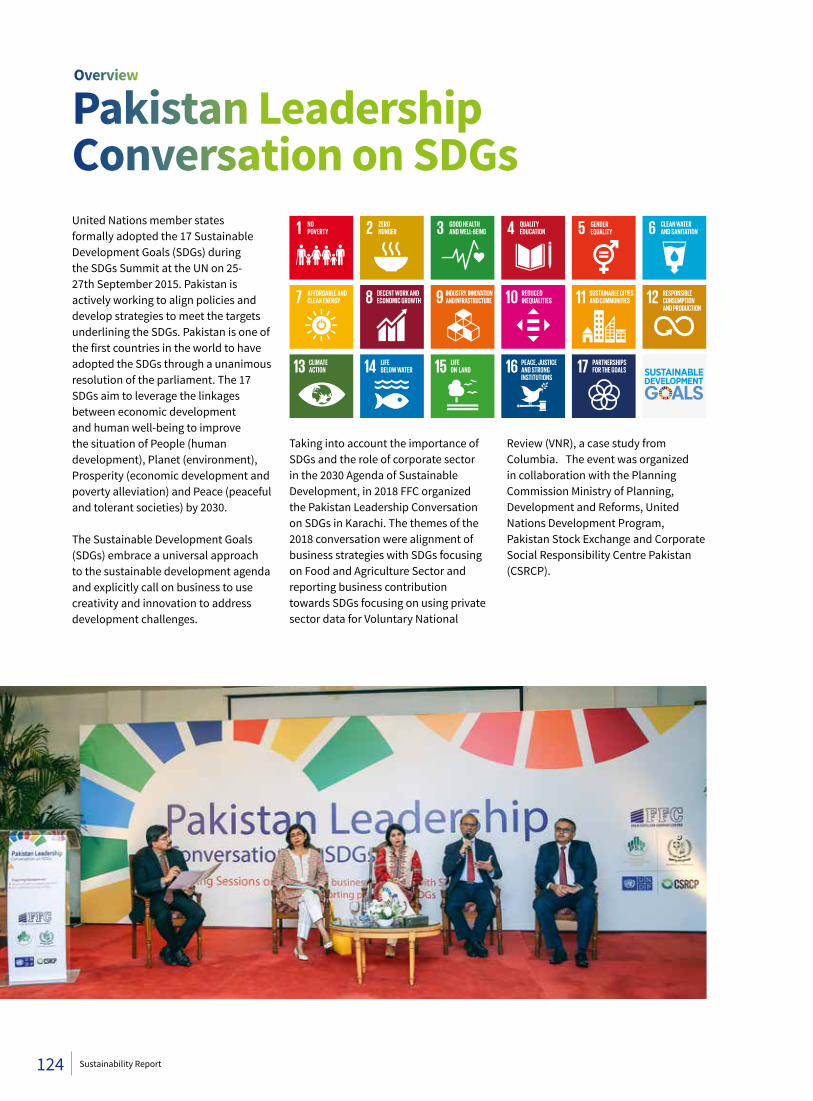
Pakistan Leadership Conversation on SDGs United Nations member states formally adopted the 17 Sustainable Development Goals (SDGs) during the SDGs Summit at the UN on 25-27th September 2015. Pakistan is actively working to align policies and develop strategies to meet the targets underlining the SDGs. Pakistan is one of the first countries in the world to have adopted the SDGs through a unanimous resolution of the parliament. The 17 SDGs aim to leverage the linkages between economic development and human well-being to improve the situation of People (human development), Planet (environment), Prosperity (economic development and poverty alleviation) and Peace (peaceful and tolerant societies) by 2030.
The Sustainable Development Goals (SDGs) embrace a universal approach to the sustainable development agenda and explicitly call on business to use creativity and innovation to address development challenges.
Taking into account the importance of SDGs and the role of corporate sector in the 2030 Agenda of Sustainable Development, in 2018 FFC organized the Pakistan Leadership Conversation on SDGs in Karachi. The themes of the 2018 conversation were alignment of business strategies with SDGs focusing on Food and Agriculture Sector and reporting business contribution towards SDGs focusing on using private sector data for Voluntary National
Review (VNR), a case study from Columbia. The event was organized in collaboration with the Planning Commission Ministry of Planning, Development and Reforms, United Nations Development Program, Pakistan Stock Exchange and Corporate Social Responsibility Centre Pakistan (CSRCP).
Overview
124 Sustainability Report
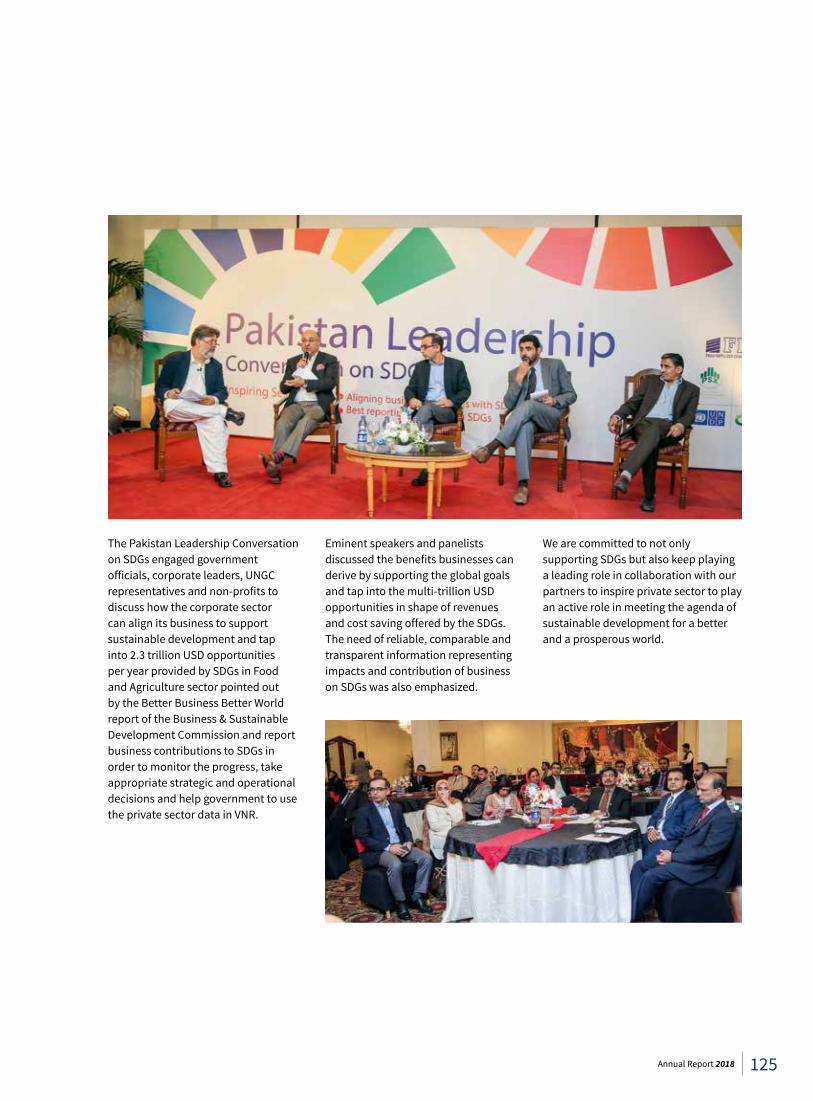
The Pakistan Leadership Conversation on SDGs engaged government officials, corporate leaders, UNGC representatives and non-profits to discuss how the corporate sector can align its business to support sustainable development and tap into 2.3 trillion USD opportunities per year provided by SDGs in Food and Agriculture sector pointed out by the Better Business Better World report of the Business & Sustainable Development Commission and report business contributions to SDGs in order to monitor the progress, take appropriate strategic and operational decisions and help government to use the private sector data in VNR.
Eminent speakers and panelists discussed the benefits businesses can derive by supporting the global goals and tap into the multi-trillion USD opportunities in shape of revenues and cost saving offered by the SDGs. The need of reliable, comparable and transparent information representing impacts and contribution of business on SDGs was also emphasized.
We are committed to not only supporting SDGs but also keep playing a leading role in collaboration with our partners to inspire private sector to play an active role in meeting the agenda of sustainable development for a better and a prosperous world.
125Annual Report 2018
About our Report
This report is prepared in accordance with International Integrated Reporting Council (IIRC) Integrated Reporting (IR) framework, Global Reporting Initiative (GRI) GRI Standards: comprehensive option, and United Nations Global Compact (UNGC) “Ten Principles” requirements to provide stakeholders a concise and transparent assessment of our ability to use our position and expertise to create sustainable value.
Scope and boundary Reporting PeriodThe report is produced and published annually. The 2018 report covers the period I January to 31 December 2018.
Operating businessesThe report covers the activities of FFC only and does not include information about subsidiary and associated companies. The economic and social data presented in the report includes data of FFC’s manufacturing plants, marketing offices and head office, while the environmental data relates to plant sites and does not include the environmental impact of other locations except for the environmental impacts of fuel used in company vehicles. The information about the impact of our activities – while creating value - beyond FFC operations is not discussed due to non-availability of reliable and verifiable data.
Financial and non-financial reportingThe report includes both financial and non-financial performance, risks and opportunities and outcomes attributable to our activities and key stakeholders having significant influence on our value creation ability.
Target readersThe report is primarily intended to address the needs of the investors to provide them a holistic view of our value creation potential taking into account financial and non-financial risks and opportunities. The information is also presented for other key stakeholders including our employees, suppliers, regulators and society.
Report content and methodologyReport contentThe contents are based on the results of our engagement with stakeholders, (IR) framework and the GRI Sustainability Reporting Standards requirements. All material topics, which are of interest to different stakeholders and which reflect significant impact of our activities on economy, environment, and society are included in this report.
Report methodologyThe compilation of data has been done on the basic scientific measurement and mathematical calculus methods on actual basis, but in some cases where actual data is unavailable due to some reasons, different logical methodologies are used for calculations. The usage of any such method is mentioned at respective places in the report. The data measurement techniques are the same as used for the previous year. There has been no change in the reporting period, scope and boundary of the report. There are no changes that can significantly affect the comparability of data from period to period. Previous years’ figures have been regrouped/ rearranged wherever found necessary to conform to this year’s classification.
The report is part of the annual reporting process subject to independent review and approval by CSR Committee, the highest decision making body headed by CE&MD. FFC makes every effort to ensure the accuracy of the sustainability information. From time to time, however, figures may be updated. The online pdf version of the sustainability report will be considered the most current version and takes precedence over any previously printed version. The online PDF as well as HTML version can be accessed at http://www.ffc.com.pk/sustainability/.
FeedbackWe value your feedback. Please connect with the sustainability team for questions or suggestions. Ms. Sadaf KhanPhone: +92-51- 111-332-111, 8452926 Email: [email protected]
Overview
126 Sustainability Report
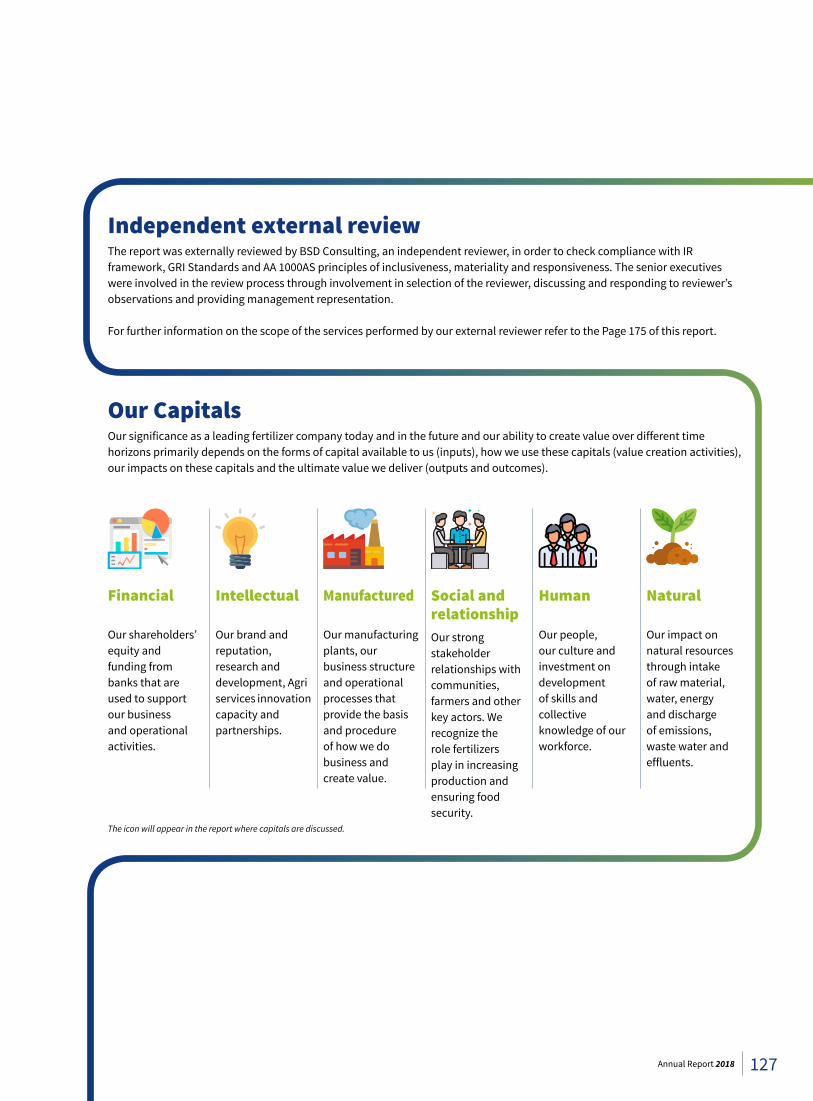
Independent external reviewThe report was externally reviewed by BSD Consulting, an independent reviewer, in order to check compliance with IR framework, GRI Standards and AA 1000AS principles of inclusiveness, materiality and responsiveness. The senior executives were involved in the review process through involvement in selection of the reviewer, discussing and responding to reviewer’s observations and providing management representation.
For further information on the scope of the services performed by our external reviewer refer to the Page 175 of this report.
Our CapitalsOur significance as a leading fertilizer company today and in the future and our ability to create value over different time horizons primarily depends on the forms of capital available to us (inputs), how we use these capitals (value creation activities), our impacts on these capitals and the ultimate value we deliver (outputs and outcomes).
Financial
Our shareholders’ equity and funding from banks that are used to support our business and operational activities.
The icon will appear in the report where capitals are discussed.
Manufactured
Our manufacturing plants, our business structure and operational processes that provide the basis and procedure of how we do business and create value.
Intellectual
Our brand and reputation, research and development, Agri services innovation capacity and partnerships.
Human
Our people, our culture and investment on development of skills and collective knowledge of our workforce.
Social and relationship Our strong stakeholder relationships with communities, farmers and other key actors. We recognize the role fertilizers play in increasing production and ensuring food security.
Natural
Our impact on natural resources through intake of raw material, water, energy and discharge of emissions, waste water and effluents.
127Annual Report 2018
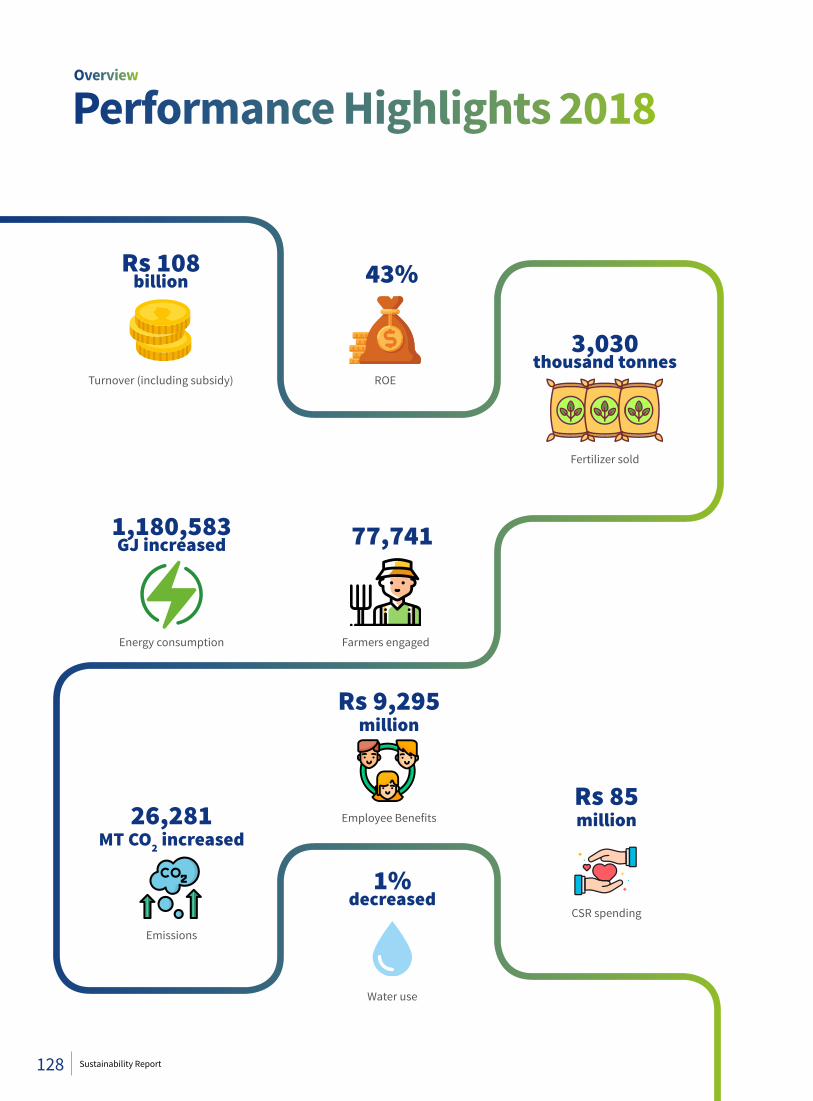
Performance Highlights 2018
Rs 108 billion
3,030 thousand tonnes
1,180,583 GJ increased
26,281 MT CO2 increased
Rs 9,295 million
Rs 85 million
1% decreased
43%
77,741
Turnover (including subsidy) ROE
Farmers engaged
Fertilizer sold
Energy consumption
Emissions
Employee Benefits
CSR spending
Water use
Overview
128 Sustainability Report
FFC at a Glance
Fauji Fertilizer Company Limited is a public listed company with its business across Pakistan. Headquartered at Rawalpindi with marketing group office at Lahore, manufacturing plants at Goth Machhi, and Mirpur Mathelo, we are one of the leading fertilizer manufacturers in Pakistan. Our net revenues for the year 2018 were Rs 105.96 billion with net profit of Rs 14.44 billion. Total assets were Rs 146,489 million with owners’ equity of Rs 33,383 million. During the year, there were no significant changes in size or capital structure of our operations.
Detailed information about the group structure, product portfolio and distribution network is given in the relevant sections of the Annual Report.
1,771Suppliers
Rs 53,688mPayment to suppliers
during 2018
Supply chainRaw materials, packaging material, capital equipment, services, and other materials are major inputs for our operations. Our supply chain consist of local suppliers and foreign suppliers, including large companies, small privately held companies, contractors and small businesses. The major raw material and other components are procured locally while the materials and components which are not available in Pakistan are purchased from abroad. We are not particularly dependent on any of our suppliers. Our supply chain is mixed including labor intensive and technology intensive. There were no major changes in the location, operations, and structure of the organization and its supply chain during the year.
Commitments, membership and awardsWe not only abide by legal obligations but also endeavor to follow several externally developed voluntary initiatives in the areas of economic, environment and social management. No substantial funding is provided to the associations however, events like exhibitions/ seminars/workshops are sponsored. We remain engaged with these organizations on a continuous basis and actively take part in activities related to us. Our Agri. Services officers are members of the Soil Science Society of Pakistan and the annual subscription for each officer is borne by FFC. Moreover, our R&D officials also hold honorary positions with international research organizations like University of Nottingham, British Geological Survey, and Society for Environmental
Geochemistry and Health (European Chapter). We participate in conferences, seminars and events organized by the Soil Sciences Society of Pakistan and give our input in public policy development.
List of awards secured by FFC Reports is given on page 89 of this Report.
Membership• United Nations Global Compact
(UNGC) – Membership obtained on March 23, 2010
• Marketing Association of Pakistan (MAP)
• Fertilizer Manufacturers of Pakistan Advisory Council (FMPAC)
• Fertilizer Industry Public Relations Committee (FIPRC)
• International Fertilizer Industry Association
• Arab Fertilizer Association• Farmers Association of Pakistan• World Wildlife Fund (WWF)
Positioned for Value Creation
129Annual Report 2018
Our Governance
Our governance structure is central to our ability and positions us to create long-term value. The internally developed code of conduct, policy statement of ethics and business statement, code of corporate governance and best available practices are guiding pillars for us. Extensive information regarding code of conduct and related matters can be found on page 08 of this Annual Report.
The highest management body is the Board of Directors (Board) where directors are re-elected after every three years. The Board comprises of thirteen directors; one executive director and twelve non-executive directors. Out of twelve non-executive directors four are non-executive independent directors including two directors representing minority/non-controlling interest. The independent directors do not have any material pecuniary relationship with FFC. Twelve members of the Board are male, and one board member is female.
The Chairman of the Board is non-executive director. His only relationship with FFC is his role as Chairman of the Board. The Chairman and members of the Board Committees are selected
from the board members. The Board has constituted Committees of Directors with adequate delegation of powers to effectively focus on the issues and ensure expedient resolution. These Committees meet as often as required to oversee the performance in respective areas. Each Committee has its own charter with goals and responsibilities.
The Committees of the Board are Audit Committee, System and Technology Committee, Project Diversification Committee, Human Resource & Remuneration Committee and Management Committees i.e., Executive Committee, Business Strategy Committee and CSR Committee. Extensive details on Board Committees can be found at page 27 of this Annual
Report. The Board meets at least once a quarter. The CE & MD, CFO and other members of the Executive Committee and/or other employees or third parties regularly attend the meetings of the Board at the invitation of the Chairman for the purpose of reporting or imparting information. The Committees report on their activities and results to the Board. The Committees also prepare the business of the Board in their assigned areas. The Board has delegated the executive management of the company to the CE & MD for smooth operation of company’s business.
Balanced management structure
Positioned for Value Creation
130 Sustainability Report
Management personnelIn 2018, the Board consisted of twelve Pakistani citizens and one Danish citizen. The members of the Board were all at least 50 years old except one. FFC has not introduced any specific quotas for specific nationalities, ethnic minorities or special age groups for the Board. The members of the Board also hold significant positions in other companies, the details of which can be found in “Profile of the Board” section on page 22 of this Annual Report.
The members of the Board are elected through an election at the general meeting. The existing board members were re-elected in September 2018 at an extra-ordinary general meeting. The nominated directors are appointed by the sponsoring body and financial institutions. The applicable legal and regulatory framework which defines parameters regarding qualification and composition of the Board for smooth running of the business and promotion of good corporate culture is followed. FFC is an equal opportunity employer and members of the highest governing body are selected on merit. FFC has on its Board highly competent and committed personnel with vast experience, expertise, integrity, and with a strong sense of responsibility required for safeguarding stakeholders’ interest. The Board is comprised of qualified directors with diverse backgrounds in the field of business, finance, engineering and other disciplines.
Code of business ethics and anti-corruption measures are in place to avoid conflict of interest among highest governance body members as well as among employees. The code clearly refrains from conflict of interest and in case a conflict of interest is not avoidable, it requires it to be reported
to the highest governing body for resolution.
CSR committee Key structural and control responsibilities related to sustainability are delegated to the CSR Committee which evaluates and guides all sustainability efforts as efficiently and effectively as possible at every level of the organization. The CE&MD chairs the Committee, while Finance, Internal Audit, Marketing, Production, and CSR heads are the committee members. Committee is designed to ensure that all relevant strategic sustainability initiatives and activities are agreed with FFC’s governance bodies.
The Committee evaluates challenges and trends, sets the company’s medium and long-term objectives and initiates sustainability initiatives accordingly. The Committee is entrusted with the responsibility of steering the direction of CSR activities from donations and welfare activities to mainstream sustainability initiatives and review and approval of annual sustainability report. The CSR Committee ensures that the company, being a member of the United Nations Global Compact, strictly adheres to its principles and makes a notable contribution to the Sustainable Development Goals.
Management’s role in shaping sustainability policyThe Board’s role in setting company’s purpose, values and strategy is implemented through Board Committees which provide input in development, approval and updating of company’s purpose, values, mission statement, strategic policies and goals in respective areas. The Executive
Committee and CSR Committee provide guidelines for sustainable operation and effective control thereof, and have the powers to define guidelines. The frameworks and measures are monitored by FFC’s Robust Risk Management System, a system to identify, evaluate and manage (relevant) risks to the company’s operations. Risk management is designed to:
• Coordinate and develop entire organization’s risk management activities and integrate risk management into the business process. A differentiation is made between strategy, operational, financial, commercial and other corporate areas;
• Clearly allocate risk management responsibilities;
• Inform, train and motivate employees to effectively implement the risk management system;
• Identify and analyze risks reliably, carefully draw up meaningful reports, and avoid risks;
• Ensure that all significant risks and avoidance/counteractive measures are indeed reported to the respective Board Committees via the relevant managerial levels, and serious risks are presented to the Board via CE&MD for appraisal.
The Board of Directors has delegated the responsibility to respective committees for ensuring that the Enterprise Risk Management (ERM) system is operational and working. The Committees therefore have managerial responsibility for the implementation and performance of the ERM system. The Committees also take into account stakeholders’ concerns identified through stakeholders’ engagement.
131Annual Report 2018
Monitoring sustainability efforts Sustainability efforts require continuous monitoring and evaluation to make necessary adjustments. The Heath Safety and Environment (HSE) system ensures production safety to limit the impact of manufacturing operations on the health, safety and environment. One of the important corporate goals is to ensure human safety and protect the environment; therefore an extensive set of policies and measures are in place as part of HSE management. The processes, procedures and measures are continually monitored, both in-house and by external audits of the management systems.
We are aware that the sustainability management system is a component of strategy planning, objectives and processes. It includes an ongoing review of the activities undertaken to ensure that planned sustainability activities are effectively implemented and the impacts are being properly managed. The implementation is
carried out through line manager and reviewed at departmental level. The final results are deliberated at CSR Committee meetings. The results of these activities are included in the risk control system, analyzed for urgency and relevance, and then implemented as per requirement.
We are also taking steps to include sustainability criteria in our business relationship with suppliers, contractors and service providers. The selection procedure that is part of procurement management now takes into account economic, environmental and social aspects. We are committed to working with our supply chain on sustainability to manage our impacts in the supply chain as well as to improve the entire value chain.
Reporting to managementThe extensive information on potential risks and opportunities, environment and social impacts and factors affecting the ability to create value over time, is shared with the management. The
Committees use the risk management system to record, analyze and present all relevant risks for consideration and action. The reporting is carried out periodically and discussed in the relevant Committees. The HSE related risks are communicated through the HSE department while other risks are reported separately through the Risk Management System of the company. The Audit Committee reviews major issues regarding the status of compliance with laws and regulations, and the code of conduct. The internal audit department reports to the Audit Committee with regard to the status of the compliance with laws, but also with regard to the code of conduct violations that occurred during the year, how they were investigated and, if necessary, how violators were disciplined and organizational measures were implemented to avoid similar violations in the future. Based on the inputs of different Board Committees, the Board formally reviews and discusses organizational impact, risks and opportunities in its quarterly meetings.
Human Resource and Remuneration Committee of the Board evaluates, the degree to which objectives of the company as a whole and particularly those of the Executive Committee have been met. Based on the evaluation of the performance against operational and sustainability related goals, recommendations
Evaluation of corporate performance are made for approval of the Board. This procedure ensures that bonus payments to employees, including executives, are also in line with FFC’s overall performance and objectives. The members of the Board and especially the Executive Committee have expertise in managing economic, environmental and social issues. In
order to ensure that they keep abreast of current trends and developments in the aforementioned areas, FFC ensures participation of its management and staff in relevant trainings and involvements in international and national conferences.
Our GovernancePositioned for Value Creation
132 Sustainability Report
Management payTo retain the best talent, our compensation policies are structured in line with current industry standards and business practices. The appraisal system practiced is comprehensive in nature and includes a performance review on financial and non-financial parameters.
The remuneration policy of directors aims at encouraging and rewarding good performance. The directors’ performance is evaluated by setting specific, measurable, achievable and realistic goals for the year and evaluation of the performance of each member against these goals. The evaluation of the Board’s performance is a self-assessment against defined goals, carried out quarterly and discussed in the Board meetings to take necessary actions to meet the defined objectives. There were no changes in membership or organizational practice as a result of performance evaluation. The remuneration of CE & MD is paid as recommended by the Human Resource and Remuneration Committee and approved by the Board. A fee is paid to the directors to meet the expenses incurred by them in attending the Board meetings, which is also approved by the Board and is in accordance with applicable guidelines. FFC does not pay remuneration to non-executive directors, except for the directors’ fee. FFC does not disclose some of the information, being
sensitive and proprietary in nature, i.e., ratio of annual compensation within the organization and the ratio of percentage increase in annual compensation within the organization.
The Human Resource and Remuneration Committee analyzes and discusses market developments and their possible impact on FFC for providing recommendations to the Board. FFC’s decision-making processes are very open and also involve key stakeholders in important decisions. The stakeholders input, with respect to the remunerations, is collected through annual meetings as well as Collective Bargaining Agents.
Shareholder and employee recommendationsWe value the concerns/recommendations of our shareholders. The shareholders can give their feedback/recommendation in General Meetings of the company as well as by sending letters or emails to the corporate affairs department using the address available on the company’s website. The concerned officials regularly evaluate the feedback and appropriate action is taken accordingly.
The employees may submit requests or recommendations at any time to the company, its management, or the appropriate bodies through
their supervisors or managers. The Board has delegated the collection of recommendations to the Executive Committee. FFC values the concerns of its employees with the aim of providing a balanced working environment for achieving the company’s objectives. Due consideration is given and suitable actions are taken on the suggestions/ideas of the shareholders and employees. However, this is subject to the suggestion being found practicable, appropriate and in the interests of the company.
The HR department at the head office, marketing and plants provide support in connection with issues relating to the ethically correct and legally compliant conduct of employees as per the code of conduct and company policies. In this regard, regular checks and inquiries are carried out by the HR department depending on the number of queries received in relation to compliance topics as well as particular issues and measures. The company has a dedicated system on intranet to further facilitate the process. In addition to the reporting of breaches of the code of conduct, it provides employees with the opportunity to ask questions anonymously via an intranet portal. These questions will then answered by the concerned officers responsible within a reasonable period of time.
“Our corporate governance principles define the managerial structure, organization and processes to provide transparency
and guaranteed sustainable long-term success.”
133Annual Report 2018
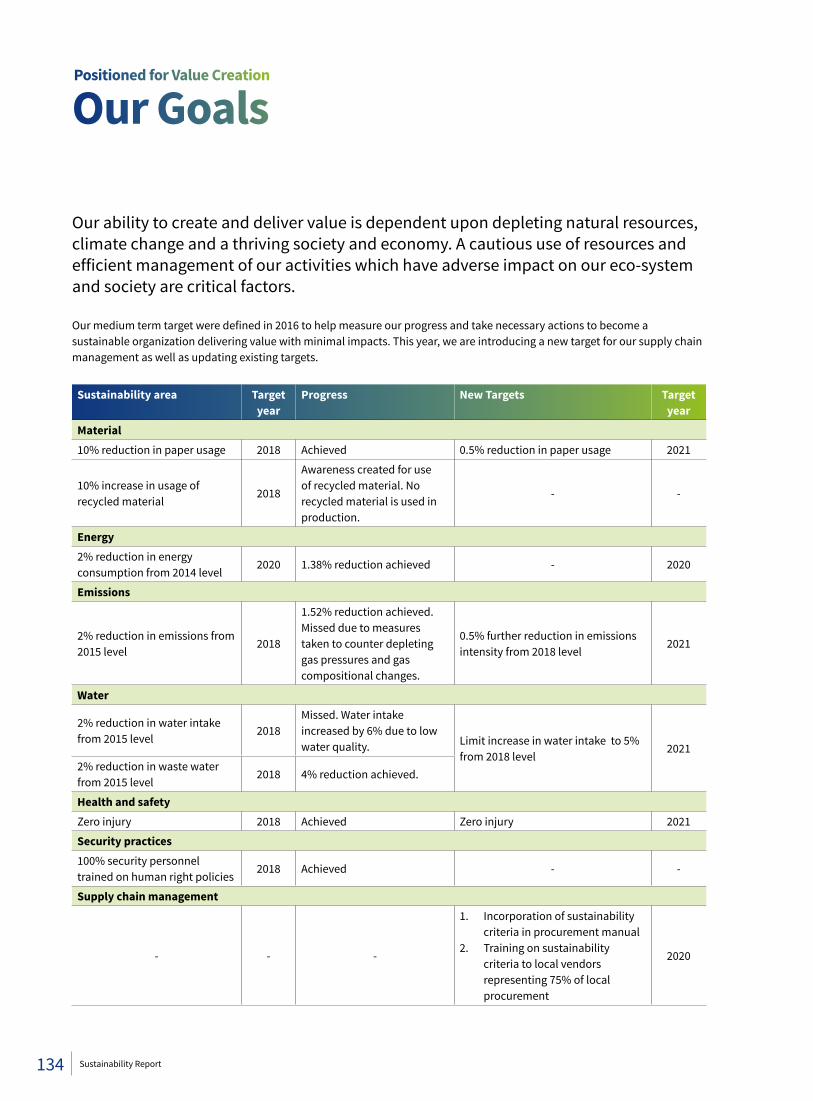
Our Goals
Our ability to create and deliver value is dependent upon depleting natural resources, climate change and a thriving society and economy. A cautious use of resources and efficient management of our activities which have adverse impact on our eco-system and society are critical factors.
Our medium term target were defined in 2016 to help measure our progress and take necessary actions to become a sustainable organization delivering value with minimal impacts. This year, we are introducing a new target for our supply chain management as well as updating existing targets.
Sustainability area Target year
Progress New Targets Target year
Material10% reduction in paper usage 2018 Achieved 0.5% reduction in paper usage 2021
10% increase in usage of recycled material
2018
Awareness created for use of recycled material. No recycled material is used in production.
- -
Energy2% reduction in energy consumption from 2014 level
2020 1.38% reduction achieved - 2020
Emissions
2% reduction in emissions from 2015 level
2018
1.52% reduction achieved. Missed due to measures taken to counter depleting gas pressures and gas compositional changes.
0.5% further reduction in emissions intensity from 2018 level
2021
Water
2% reduction in water intake from 2015 level
2018Missed. Water intake increased by 6% due to low water quality. Limit increase in water intake to 5%
from 2018 level2021
2% reduction in waste water from 2015 level
2018 4% reduction achieved.
Health and safetyZero injury 2018 Achieved Zero injury 2021
Security practices100% security personnel trained on human right policies
2018 Achieved - -
Supply chain management
- - -
1. Incorporation of sustainability criteria in procurement manual
2. Training on sustainability criteria to local vendors representing 75% of local procurement
2020
Positioned for Value Creation
134 Sustainability Report
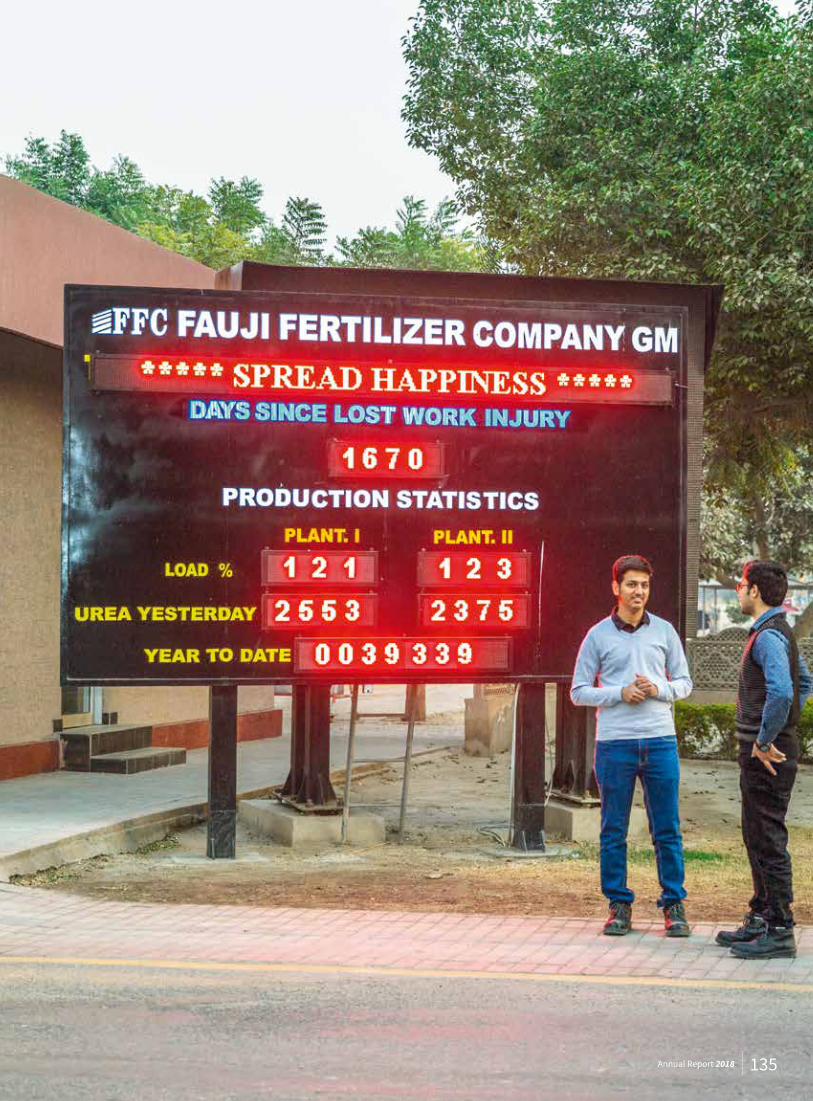
135Annual Report 2018
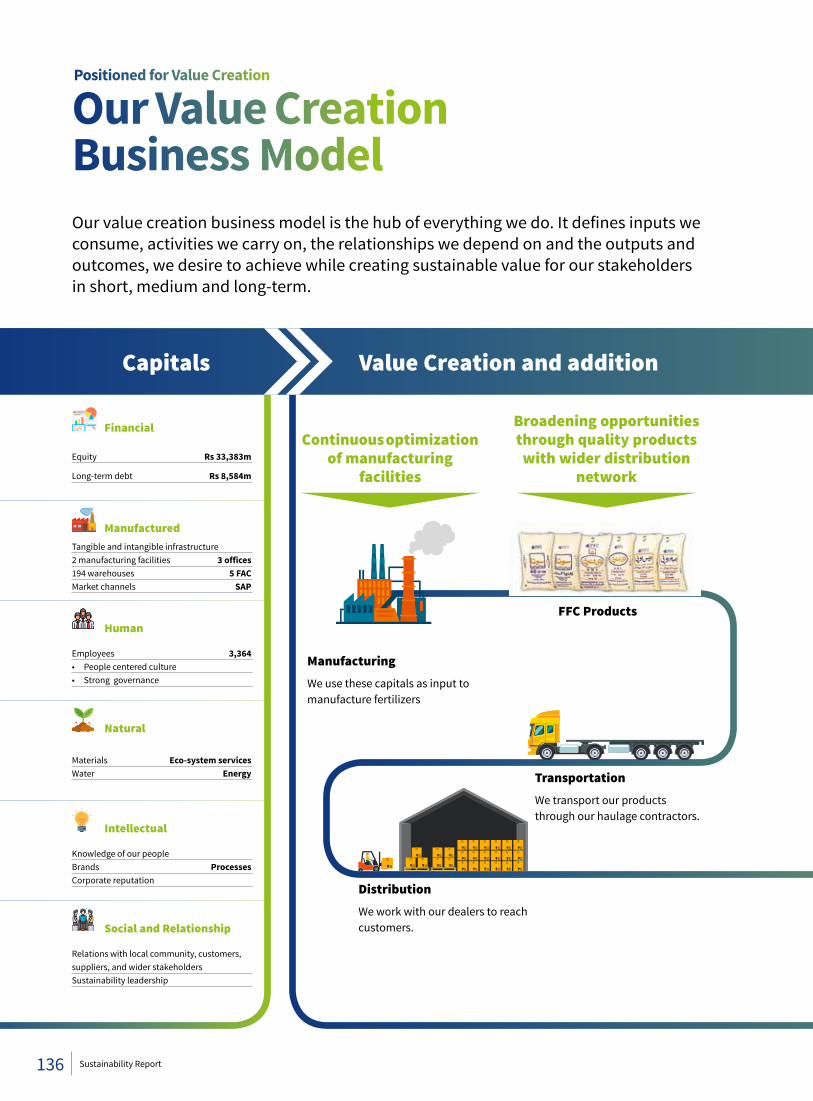
Our Value Creation Business ModelOur value creation business model is the hub of everything we do. It defines inputs we consume, activities we carry on, the relationships we depend on and the outputs and outcomes, we desire to achieve while creating sustainable value for our stakeholders in short, medium and long-term.
Capitals
FinancialContinuous optimization
of manufacturing facilities
Manufacturing
We use these capitals as input to manufacture fertilizers
FFC Products
TransportationWe transport our products through our haulage contractors.
DistributionWe work with our dealers to reach customers.
Broadening opportunities through quality products with wider distribution
network
Manufactured
Human
Natural
Intellectual
Social and Relationship
Equity Rs 33,383m
Long-term debt Rs 8,584m
Tangible and intangible infrastructure2 manufacturing facilities 3 offices194 warehouses 5 FACMarket channels SAP
Employees 3,364• People centered culture• Strong governance
Materials Eco-system servicesWater Energy
Knowledge of our peopleBrands ProcessesCorporate reputation
Relations with local community, customers, suppliers, and wider stakeholdersSustainability leadership
Capitals Value Creation and addition
Positioned for Value Creation
136 Sustainability Report
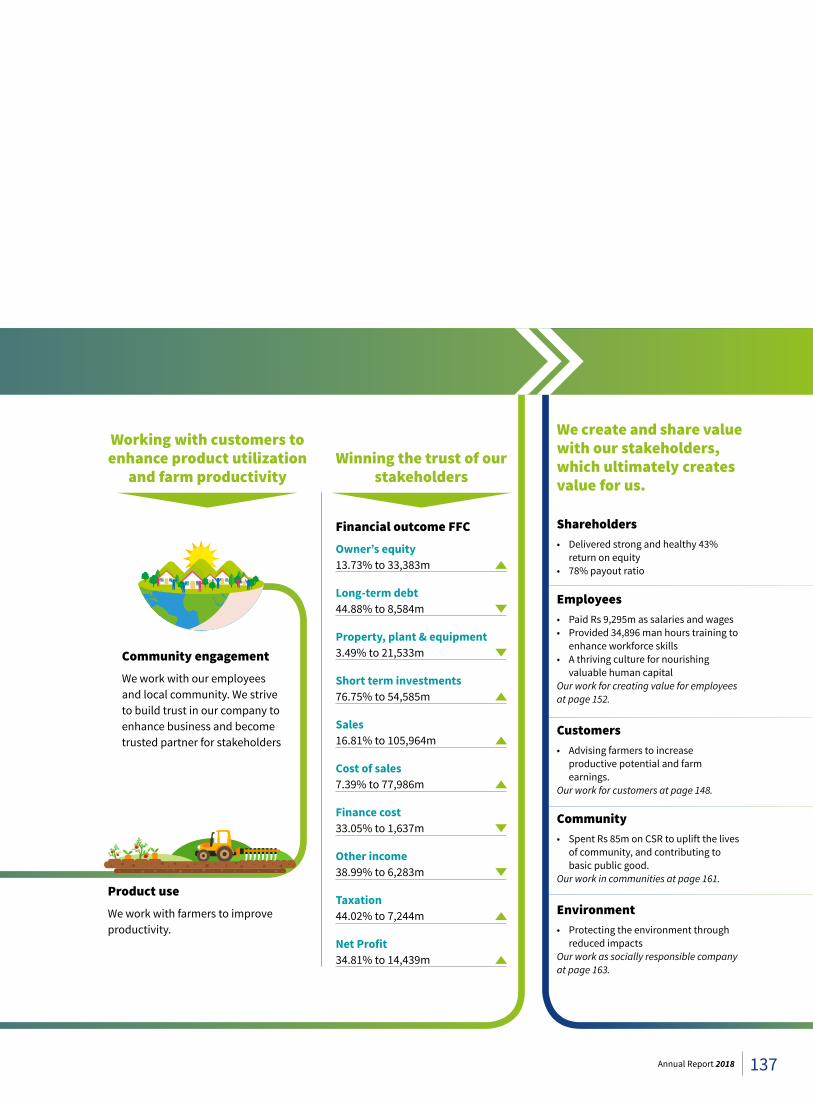
Product use We work with farmers to improve productivity.
Community engagementWe work with our employees and local community. We strive to build trust in our company to enhance business and become trusted partner for stakeholders
Winning the trust of our stakeholders
Financial outcome FFCOwner’s equity13.73% to 33,383m
Long-term debt44.88% to 8,584m
Property, plant & equipment3.49% to 21,533m
Short term investments76.75% to 54,585m
Sales16.81% to 105,964m
Cost of sales7.39% to 77,986m
Finance cost33.05% to 1,637m
Other income38.99% to 6,283m
Taxation44.02% to 7,244m
Net Profit34.81% to 14,439m
We create and share value with our stakeholders, which ultimately creates value for us.
Shareholders• Delivered strong and healthy 43%
return on equity• 78% payout ratio
Employees• Paid Rs 9,295m as salaries and wages• Provided 34,896 man hours training to
enhance workforce skills • A thriving culture for nourishing
valuable human capital Our work for creating value for employees at page 152.
Customers• Advising farmers to increase
productive potential and farm earnings.
Our work for customers at page 148.
Community• Spent Rs 85m on CSR to uplift the lives
of community, and contributing to basic public good.
Our work in communities at page 161.
Environment• Protecting the environment through
reduced impactsOur work as socially responsible company at page 163.
Working with customers to enhance product utilization
and farm productivity
137Annual Report 2018
External Environment
Persistently changing external environment has resulted in volatility on the political, economic, technological, environmental and social fronts. The volatility has material impact on our ability to create value. Our strategy ensures that we are best positioned in our external environment to manage the risks and optimize the opportunities associated with these four key areas.
Political and macroeconomic Global economic growth outlook during the year remained stable, regardless of increasing trade related protectionist measures being practiced by US against China and ongoing uncertainty associated with the Brexit deal between UK and EU. However, in Pakistan the economy slowed down after five years’ rise on account of elections, financial instability faced by the new government and slashing down of development budget. A slowdown is expected in the next year as the country grapples with economic imbalances, slow growth in remittances, depreciation of Pakistan rupee, increasing inflation, increasing interest rates and ongoing government negotiations with the IMF for financial support.
During the year, agriculture sector recorded a remarkable growth of 3.81 percent and surpassed its targeted growth and last year’s growth. This stemmed from higher yields, attractive output prices and supportive government policies, better availability of certified seeds, pesticides, agriculture credit and intensive fertilizers offtake. The increasing farmers’ income coupled with supportive government policies and increased credit disbursement for agriculture sector will result in stable growth for next year
Social The stable growth over the years has resulted in increase in per capita income and reduced poverty level in Pakistan. However, social, environmental and economic challenges, such as limited resources, especially water scarcity, climate change, urbanization, rising inequality and growing unemployment are major social problems posing risk and opportunities for businesses. Lack of access to health facilities, food, education clean water and sanitation is resulting in under-privileged and deprived population. It poses a challenge for Government to provide basic facilities for uplifting the lives of these communities and utilize the unemployed youth for economic development. The prevailing conditions place a responsibility on businesses to support government and reap the dividends by aligning business strategies to solve these problems.
Environmental Reducing negative impacts of operations are vital for continuous operations. The deteriorating environment, and rising temperatures require immediate action, if we do not act now, we could compromise the ability of future generations to meet their needs. Globally as well as in Pakistan, climate change is causing devastating floods, droughts and
affecting crops’ growing patterns resulting in productivity loss and pushing up food inflation. The decreasing water level in most parts of Pakistan, resulting in water scarcity, is an important issue which requires instant steps. The increasing use of renewables and decrease in cost of clean technologies has helped in managing energy crises in Pakistan. However, a number of steps are required to decrease the negative impacts of industries to reduce water pollution, CO2 emission, and effective handling of waste. The changing climate affecting crop patterns and decreasing gas reserves are the major risks to the fertilizer industry.
RegulatoryThe recently introduced Code of Corporate Governance for listed companies and company law, along with ongoing directives by the regulator, are increasing the compliance requirements for the corporate sector in Pakistan. The ongoing international debate on non-financial reporting, investor specific reporting and discussion on private sector role in meeting the SDGs, is expected to introduce new codes and regulations in Pakistan. The increased regulatory requirements in this regard will shape the agenda for the corporate sector and will increase the cost of compliance
Creating Value in a Sustainable Manner
138 Sustainability Report
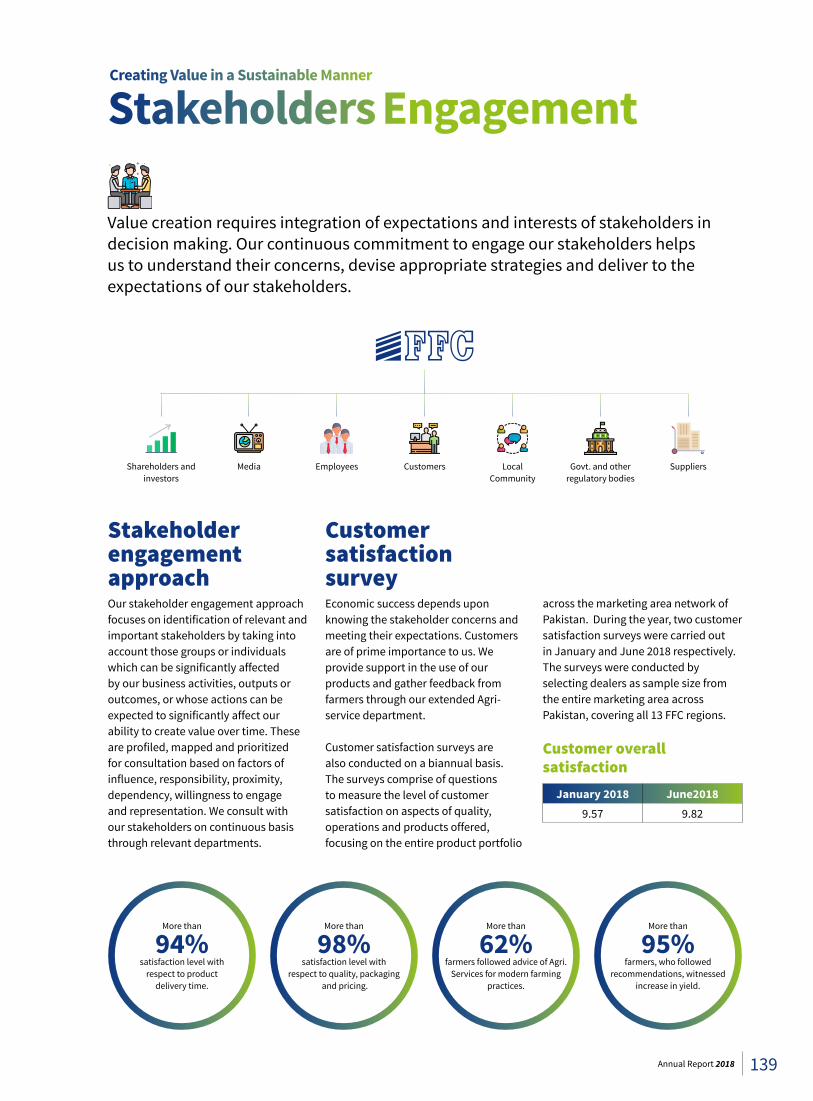
More than
94% satisfaction level with
respect to product delivery time.
More than
98% satisfaction level with
respect to quality, packaging and pricing.
More than
62% farmers followed advice of Agri.
Services for modern farming practices.
More than
95% farmers, who followed
recommendations, witnessed increase in yield.
Stakeholders Engagement
Value creation requires integration of expectations and interests of stakeholders in decision making. Our continuous commitment to engage our stakeholders helps us to understand their concerns, devise appropriate strategies and deliver to the expectations of our stakeholders.
Stakeholder engagement approachOur stakeholder engagement approach focuses on identification of relevant and important stakeholders by taking into account those groups or individuals which can be significantly affected by our business activities, outputs or outcomes, or whose actions can be expected to significantly affect our ability to create value over time. These are profiled, mapped and prioritized for consultation based on factors of influence, responsibility, proximity, dependency, willingness to engage and representation. We consult with our stakeholders on continuous basis through relevant departments.
Shareholders and investors
Media Employees Customers Local Community
Govt. and other regulatory bodies
Suppliers
Customer satisfaction survey Economic success depends upon knowing the stakeholder concerns and meeting their expectations. Customers are of prime importance to us. We provide support in the use of our products and gather feedback from farmers through our extended Agri-service department.
Customer satisfaction surveys are also conducted on a biannual basis. The surveys comprise of questions to measure the level of customer satisfaction on aspects of quality, operations and products offered, focusing on the entire product portfolio
across the marketing area network of Pakistan. During the year, two customer satisfaction surveys were carried out in January and June 2018 respectively. The surveys were conducted by selecting dealers as sample size from the entire marketing area across Pakistan, covering all 13 FFC regions.
Customer overall satisfaction
January 2018 June20189.57 9.82
Creating Value in a Sustainable Manner
139Annual Report 2018
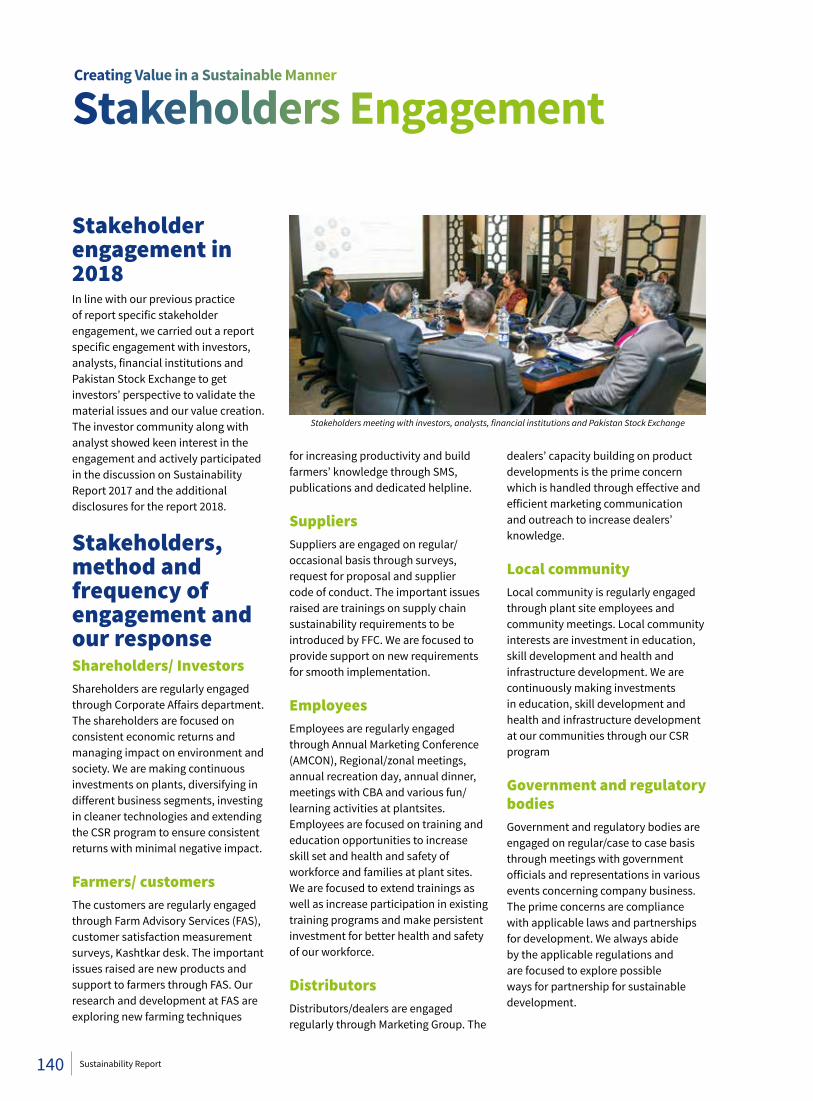
Stakeholder engagement in 2018In line with our previous practice of report specific stakeholder engagement, we carried out a report specific engagement with investors, analysts, financial institutions and Pakistan Stock Exchange to get investors’ perspective to validate the material issues and our value creation. The investor community along with analyst showed keen interest in the engagement and actively participated in the discussion on Sustainability Report 2017 and the additional disclosures for the report 2018.
Stakeholders, method and frequency of engagement and our responseShareholders/ InvestorsShareholders are regularly engaged through Corporate Affairs department. The shareholders are focused on consistent economic returns and managing impact on environment and society. We are making continuous investments on plants, diversifying in different business segments, investing in cleaner technologies and extending the CSR program to ensure consistent returns with minimal negative impact.
Farmers/ customersThe customers are regularly engaged through Farm Advisory Services (FAS), customer satisfaction measurement surveys, Kashtkar desk. The important issues raised are new products and support to farmers through FAS. Our research and development at FAS are exploring new farming techniques
for increasing productivity and build farmers’ knowledge through SMS, publications and dedicated helpline.
SuppliersSuppliers are engaged on regular/occasional basis through surveys, request for proposal and supplier code of conduct. The important issues raised are trainings on supply chain sustainability requirements to be introduced by FFC. We are focused to provide support on new requirements for smooth implementation.
EmployeesEmployees are regularly engaged through Annual Marketing Conference (AMCON), Regional/zonal meetings, annual recreation day, annual dinner, meetings with CBA and various fun/learning activities at plantsites. Employees are focused on training and education opportunities to increase skill set and health and safety of workforce and families at plant sites. We are focused to extend trainings as well as increase participation in existing training programs and make persistent investment for better health and safety of our workforce.
DistributorsDistributors/dealers are engaged regularly through Marketing Group. The
dealers’ capacity building on product developments is the prime concern which is handled through effective and efficient marketing communication and outreach to increase dealers’ knowledge.
Local community Local community is regularly engaged through plant site employees and community meetings. Local community interests are investment in education, skill development and health and infrastructure development. We are continuously making investments in education, skill development and health and infrastructure development at our communities through our CSR program
Government and regulatory bodiesGovernment and regulatory bodies are engaged on regular/case to case basis through meetings with government officials and representations in various events concerning company business. The prime concerns are compliance with applicable laws and partnerships for development. We always abide by the applicable regulations and are focused to explore possible ways for partnership for sustainable development.
Stakeholders meeting with investors, analysts, financial institutions and Pakistan Stock Exchange
Stakeholders EngagementCreating Value in a Sustainable Manner
140 Sustainability Report
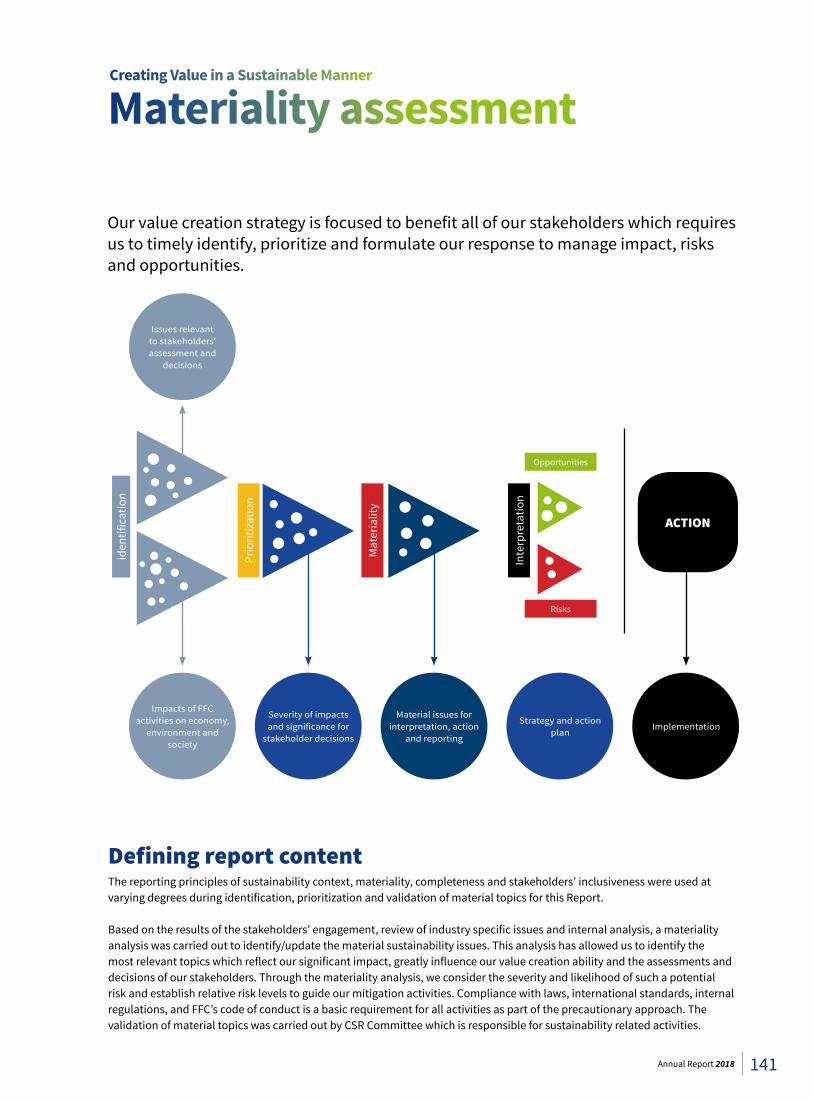
Materiality assessment
Our value creation strategy is focused to benefit all of our stakeholders which requires us to timely identify, prioritize and formulate our response to manage impact, risks and opportunities.
Defining report contentThe reporting principles of sustainability context, materiality, completeness and stakeholders’ inclusiveness were used at varying degrees during identification, prioritization and validation of material topics for this Report.
Based on the results of the stakeholders’ engagement, review of industry specific issues and internal analysis, a materiality analysis was carried out to identify/update the material sustainability issues. This analysis has allowed us to identify the most relevant topics which reflect our significant impact, greatly influence our value creation ability and the assessments and decisions of our stakeholders. Through the materiality analysis, we consider the severity and likelihood of such a potential risk and establish relative risk levels to guide our mitigation activities. Compliance with laws, international standards, internal regulations, and FFC’s code of conduct is a basic requirement for all activities as part of the precautionary approach. The validation of material topics was carried out by CSR Committee which is responsible for sustainability related activities.
Creating Value in a Sustainable Manner
Impacts of FFC activities on economy,
environment and society
Issues relevant to stakeholders’ assessment and
decisions
Severity of impacts and significance for
stakeholder decisions
Material issues for interpretation, action
and reporting
Strategy and action plan
Implementation
Iden
tific
atio
n
Prio
ritiz
atio
n
Mat
eria
lity
Inte
rpre
tatio
n
Opportunities
Risks
ACTION
141Annual Report 2018
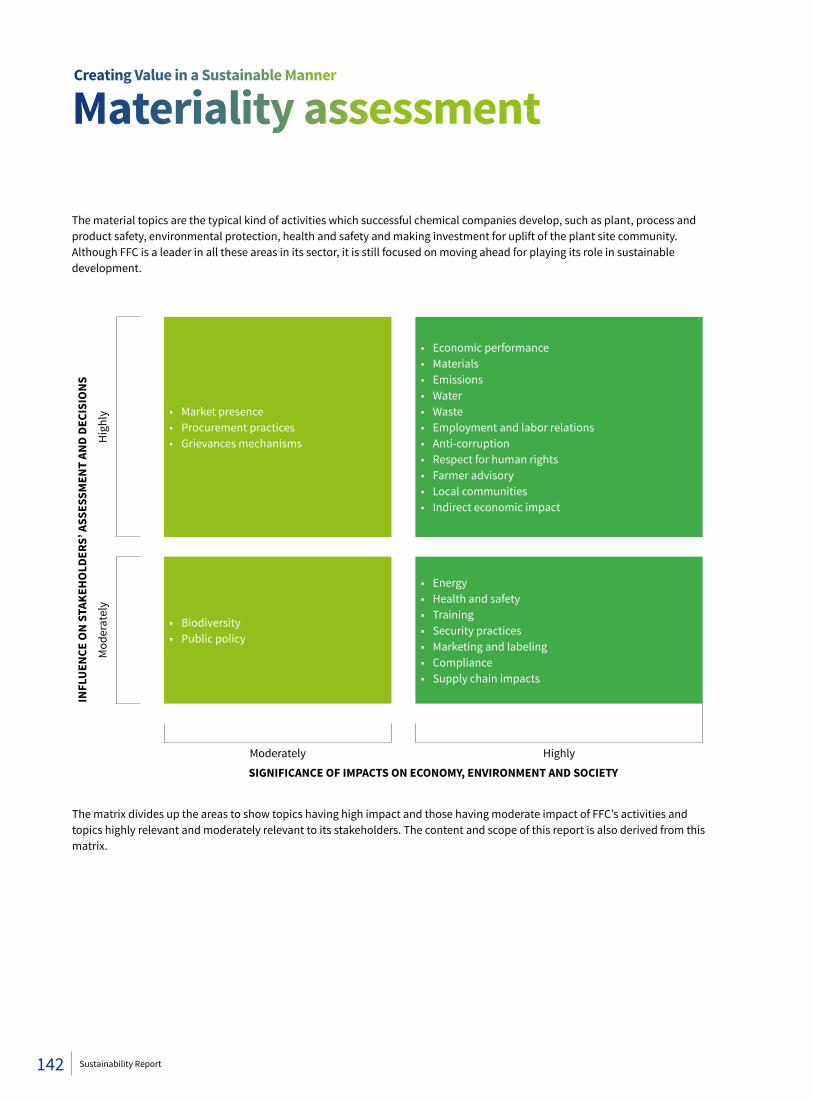
INFL
UEN
CE O
N S
TAKE
HO
LDER
S’ A
SSES
SMEN
T AN
D DE
CISI
ON
S
Hig
hly • Market presence
• Procurement practices• Grievances mechanisms
• Economic performance • Materials• Emissions • Water • Waste • Employment and labor relations• Anti-corruption• Respect for human rights• Farmer advisory • Local communities• Indirect economic impact
Mod
erat
ely
• Biodiversity• Public policy
• Energy • Health and safety • Training • Security practices• Marketing and labeling• Compliance• Supply chain impacts
Moderately Highly
SIGNIFICANCE OF IMPACTS ON ECONOMY, ENVIRONMENT AND SOCIETY
The matrix divides up the areas to show topics having high impact and those having moderate impact of FFC’s activities and topics highly relevant and moderately relevant to its stakeholders. The content and scope of this report is also derived from this matrix.
The material topics are the typical kind of activities which successful chemical companies develop, such as plant, process and product safety, environmental protection, health and safety and making investment for uplift of the plant site community. Although FFC is a leader in all these areas in its sector, it is still focused on moving ahead for playing its role in sustainable development.
Materiality assessmentCreating Value in a Sustainable Manner
142 Sustainability Report
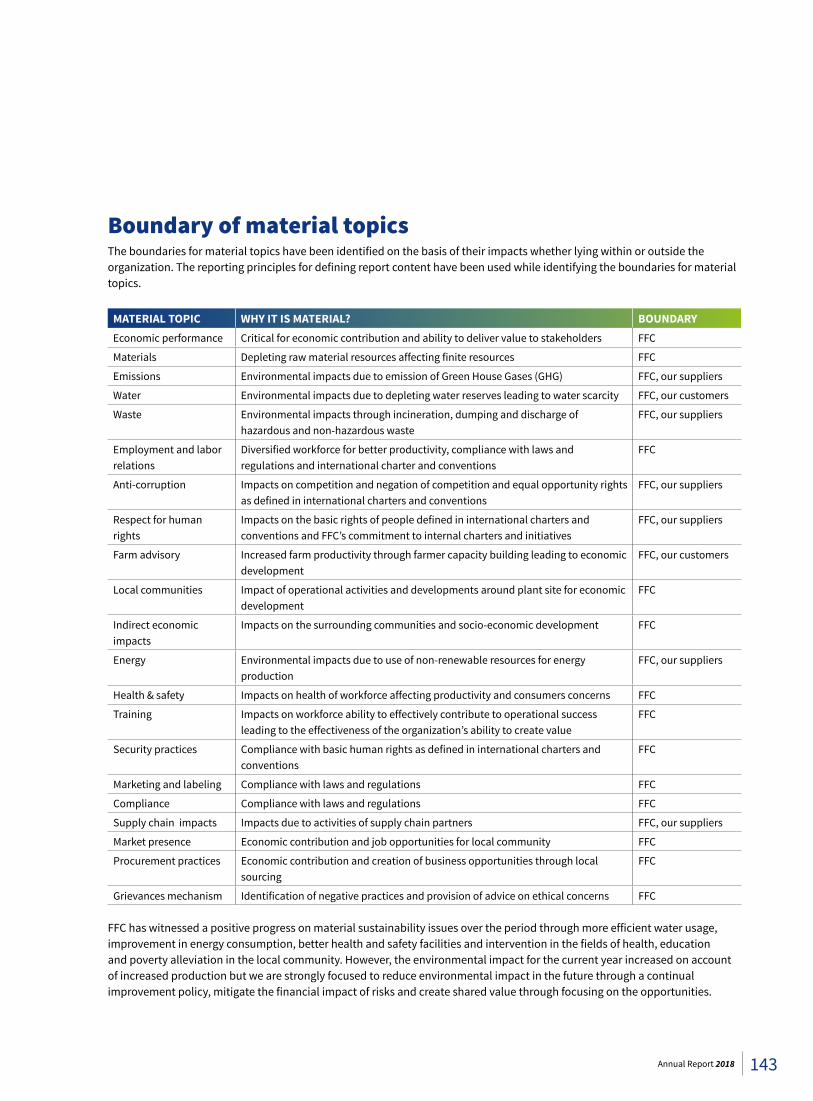
Boundary of material topicsThe boundaries for material topics have been identified on the basis of their impacts whether lying within or outside the organization. The reporting principles for defining report content have been used while identifying the boundaries for material topics.
MATERIAL TOPIC WHY IT IS MATERIAL? BOUNDARYEconomic performance Critical for economic contribution and ability to deliver value to stakeholders FFC
Materials Depleting raw material resources affecting finite resources FFC
Emissions Environmental impacts due to emission of Green House Gases (GHG) FFC, our suppliers
Water Environmental impacts due to depleting water reserves leading to water scarcity FFC, our customers
Waste Environmental impacts through incineration, dumping and discharge of hazardous and non-hazardous waste
FFC, our suppliers
Employment and labor relations
Diversified workforce for better productivity, compliance with laws and regulations and international charter and conventions
FFC
Anti-corruption Impacts on competition and negation of competition and equal opportunity rights as defined in international charters and conventions
FFC, our suppliers
Respect for human rights
Impacts on the basic rights of people defined in international charters and conventions and FFC’s commitment to internal charters and initiatives
FFC, our suppliers
Farm advisory Increased farm productivity through farmer capacity building leading to economic development
FFC, our customers
Local communities Impact of operational activities and developments around plant site for economic development
FFC
Indirect economic impacts
Impacts on the surrounding communities and socio-economic development FFC
Energy Environmental impacts due to use of non-renewable resources for energy production
FFC, our suppliers
Health & safety Impacts on health of workforce affecting productivity and consumers concerns FFC
Training Impacts on workforce ability to effectively contribute to operational success leading to the effectiveness of the organization’s ability to create value
FFC
Security practices Compliance with basic human rights as defined in international charters and conventions
FFC
Marketing and labeling Compliance with laws and regulations FFC
Compliance Compliance with laws and regulations FFC
Supply chain impacts Impacts due to activities of supply chain partners FFC, our suppliers
Market presence Economic contribution and job opportunities for local community FFC
Procurement practices Economic contribution and creation of business opportunities through local sourcing
FFC
Grievances mechanism Identification of negative practices and provision of advice on ethical concerns FFC
FFC has witnessed a positive progress on material sustainability issues over the period through more efficient water usage, improvement in energy consumption, better health and safety facilities and intervention in the fields of health, education and poverty alleviation in the local community. However, the environmental impact for the current year increased on account of increased production but we are strongly focused to reduce environmental impact in the future through a continual improvement policy, mitigate the financial impact of risks and create shared value through focusing on the opportunities.
143Annual Report 2018
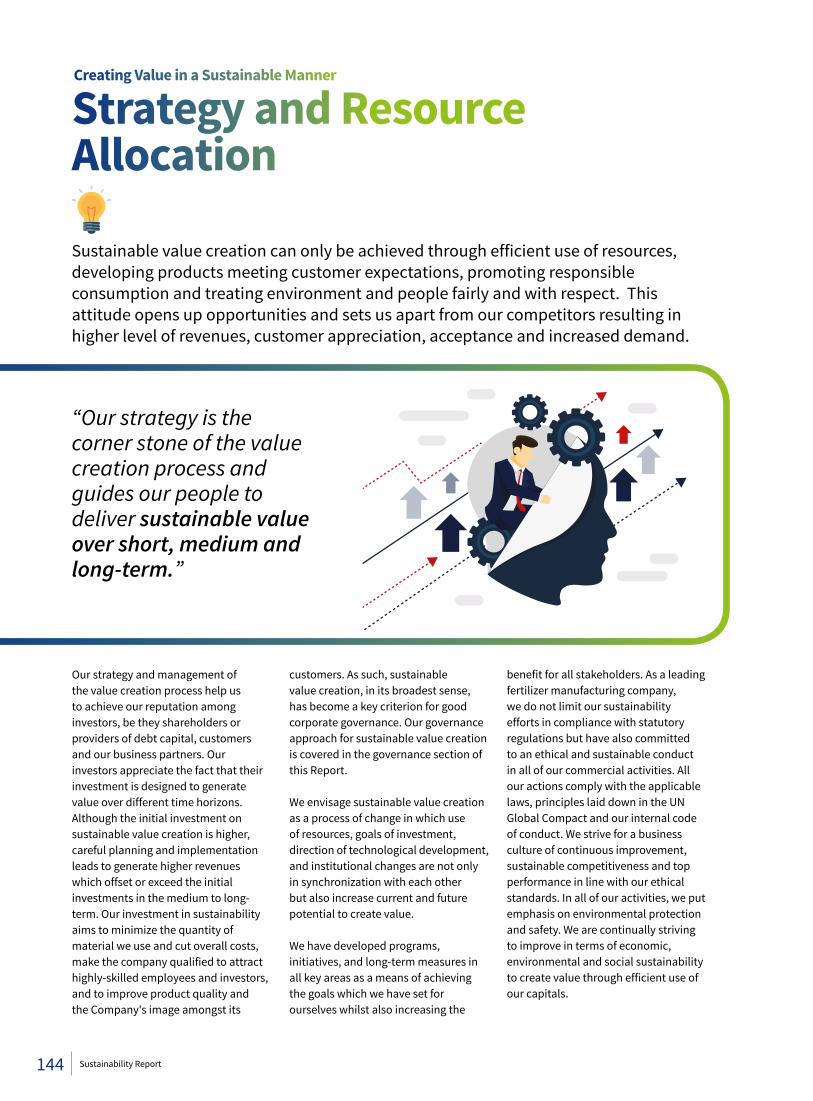
Strategy and Resource Allocation
Sustainable value creation can only be achieved through efficient use of resources, developing products meeting customer expectations, promoting responsible consumption and treating environment and people fairly and with respect. This attitude opens up opportunities and sets us apart from our competitors resulting in higher level of revenues, customer appreciation, acceptance and increased demand.
Our strategy and management of the value creation process help us to achieve our reputation among investors, be they shareholders or providers of debt capital, customers and our business partners. Our investors appreciate the fact that their investment is designed to generate value over different time horizons. Although the initial investment on sustainable value creation is higher, careful planning and implementation leads to generate higher revenues which offset or exceed the initial investments in the medium to long-term. Our investment in sustainability aims to minimize the quantity of material we use and cut overall costs, make the company qualified to attract highly-skilled employees and investors, and to improve product quality and the Company's image amongst its
customers. As such, sustainable value creation, in its broadest sense, has become a key criterion for good corporate governance. Our governance approach for sustainable value creation is covered in the governance section of this Report.
We envisage sustainable value creation as a process of change in which use of resources, goals of investment, direction of technological development, and institutional changes are not only in synchronization with each other but also increase current and future potential to create value.
We have developed programs, initiatives, and long-term measures in all key areas as a means of achieving the goals which we have set for ourselves whilst also increasing the
benefit for all stakeholders. As a leading fertilizer manufacturing company, we do not limit our sustainability efforts in compliance with statutory regulations but have also committed to an ethical and sustainable conduct in all of our commercial activities. All our actions comply with the applicable laws, principles laid down in the UN Global Compact and our internal code of conduct. We strive for a business culture of continuous improvement, sustainable competitiveness and top performance in line with our ethical standards. In all of our activities, we put emphasis on environmental protection and safety. We are continually striving to improve in terms of economic, environmental and social sustainability to create value through efficient use of our capitals.
“Our strategy is the corner stone of the value creation process and guides our people to deliver sustainable value over short, medium and long-term.”
Creating Value in a Sustainable Manner
144 Sustainability Report

145Annual Report 2018
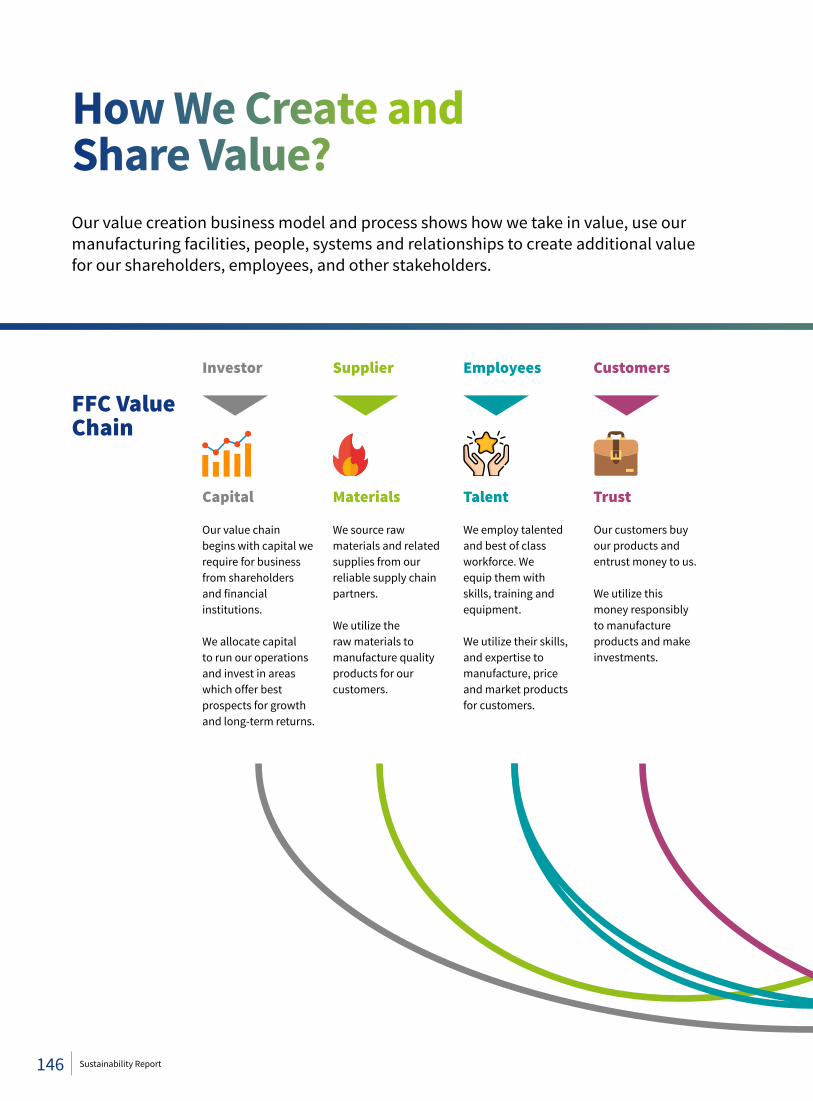
How We Create and Share Value?
FFC Value Chain
Our value creation business model and process shows how we take in value, use our manufacturing facilities, people, systems and relationships to create additional value for our shareholders, employees, and other stakeholders.
Capital
Investor
Materials
Supplier
Talent
Employees
Trust
Customers
Our value chain begins with capital we require for business from shareholders and financial institutions.
We allocate capital to run our operations and invest in areas which offer best prospects for growth and long-term returns.
We source raw materials and related supplies from our reliable supply chain partners.
We utilize the raw materials to manufacture quality products for our customers.
We employ talented and best of class workforce. We equip them with skills, training and equipment.
We utilize their skills, and expertise to manufacture, price and market products for customers.
Our customers buy our products and entrust money to us.
We utilize this money responsibly to manufacture products and make investments.
146 Sustainability Report
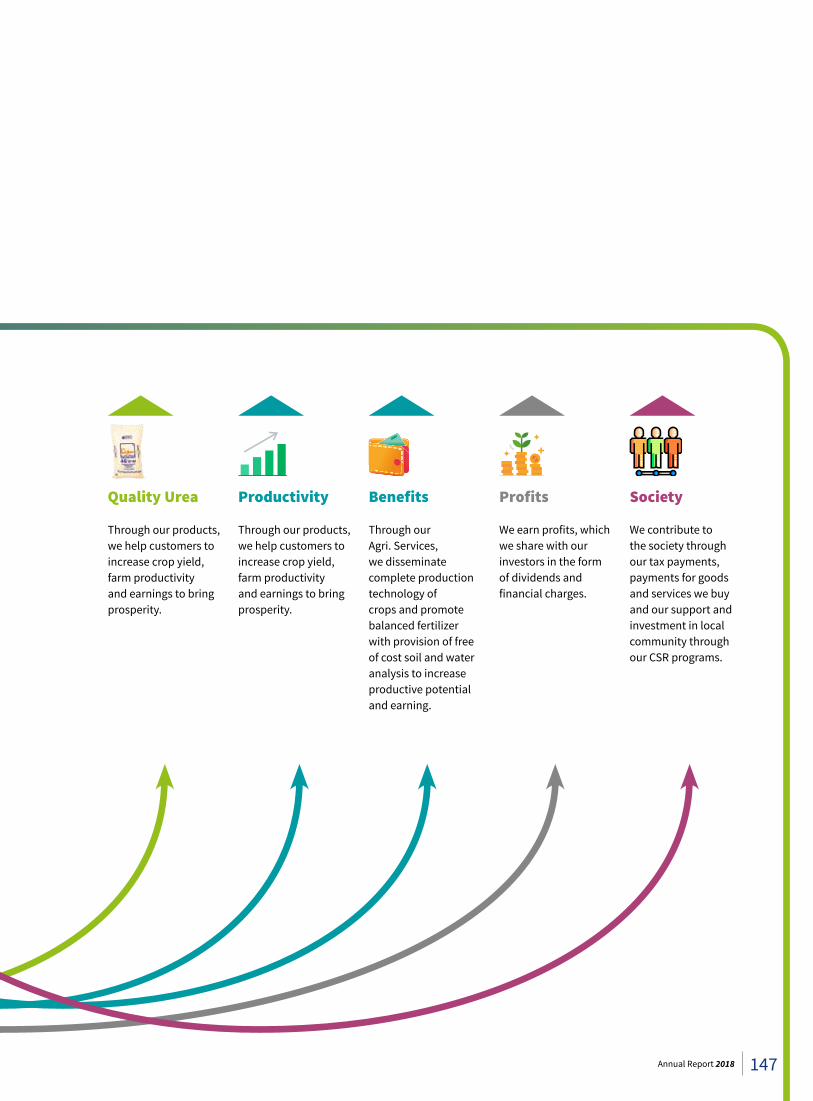
Quality Urea Productivity Benefits Profits Society
Through our products, we help customers to increase crop yield, farm productivity and earnings to bring prosperity.
Through our products, we help customers to increase crop yield, farm productivity and earnings to bring prosperity.
Through our Agri. Services, we disseminate complete production technology of crops and promote balanced fertilizer with provision of free of cost soil and water analysis to increase productive potential and earning.
We earn profits, which we share with our investors in the form of dividends and financial charges.
We contribute to the society through our tax payments, payments for goods and services we buy and our support and investment in local community through our CSR programs.
147Annual Report 2018
How do we Create and Share Value as a Manufacturer of Fertilizer?
By Producing Quality Fertilizer We create value for our customers and economy through producing and marketing quality fertilizers. Our products are additives for better crop productivity and our purpose is to protect and enhance productive potential of farms and our end consumers’ earnings. We have thousands of customers in Pakistan ranging from small farmers to large farm holdings and farm houses. To meet the expectations of our customers and in line with our strategy, we are committed to producing only quality products which correspond to the international environment and safety standards. Constant monitoring and regular reviews are carried out on all business aspects and processes in order to ensure that they continue to conform to our commitment to produce quality products. Quality and performance monitoring is an integral part of our business processes and strategic planning. External certification of health and safety of production systems are performed regularly. The results are used in the evaluation of our approach and related adjustments in processes are carried out, where required. Product responsibility lies with the manufacturing department and the Chief Executive & Managing Director overviews all functions of the Company so as to deliver quality products to our customers and create value to our shareholders.
FFC ensures that employees, customers, general public and the environment can rely on the safety of its products throughout the entire product lifecycle. Regular trainings are conducted covering aspects related
to health & safety of product and product quality. Standard weight of fertilizer bags is ensured and regular quality analysis of product samples is performed in respect of average prill size, biuret, moisture, crushing strength and total fitness. FFC made assessment of health and safety impacts of all products during the year in order to identify improvements and support its commitment of producing customer friendly products. During the year, our products were in compliance with regulations and voluntary codes concerning health and safety impacts of products.
By Investing in Better Farm ProductivityGrowers are vital in our strategy to ensure a sustained long-term growth. We have built a loyal customer base through our continuous commitment and investment in farm advisory which promotes the brand in the marketplace and contributes to our overall success. We adopt an integrated approach of agronomic, extension and soil testing activities for accomplishing the objectives of Farm Advisory Services. Our agronomic activities include laying out crop demonstration plots and conducting fertilizer trials in farmers’
fields while extension activities include agricultural seminars, farmer meetings, group discussions, field days, training programs and farm visits. Our soil testing service is a valuable tool to identify soil problems and to propagate appropriate and balanced use of fertilizers. In order to ensure incessant support to the farming community, we continuously invest in our Farm Advisory Services. We operate 5 Farm Advisory Centers (FAC) and 23 Agri. Services Offices (ASO). A Farm advisory Center comprises of a team of professionals fully equipped with modern and sophisticated computerized soil & water testing laboratory and a demonstration van with high tech audio visual equipment. It operates for 4-5 years in an area providing guidance in line with area crops and socio-economic position of the farmers. We maintain close liaison with research organizations to transfer the latest findings to the farming community through our farm advisory services. The experts and professionals from agricultural institutions and government departments are invited to deliberate upon problems of the farming community. We are collaborating with various national and international companies on R&D activities including University of Cologne, Germany, University of Nottingham, UK, Rothamsted Research UK, Solvay, Belgium and NARC, Islamabad. Our R&D activities are not limited to slow release fertilizers, biologically enhanced fertilizers, micro nutrients impregnated fertilizers and N-inhibitor fertilizers. FFC is operating Fertilizer Research Centre at Faisalabad as a testing and evaluation platform for newly developed products. Moreover,
05Farmer advisory center
21Agri. service office
How We Create and Share Value
148 Sustainability Report
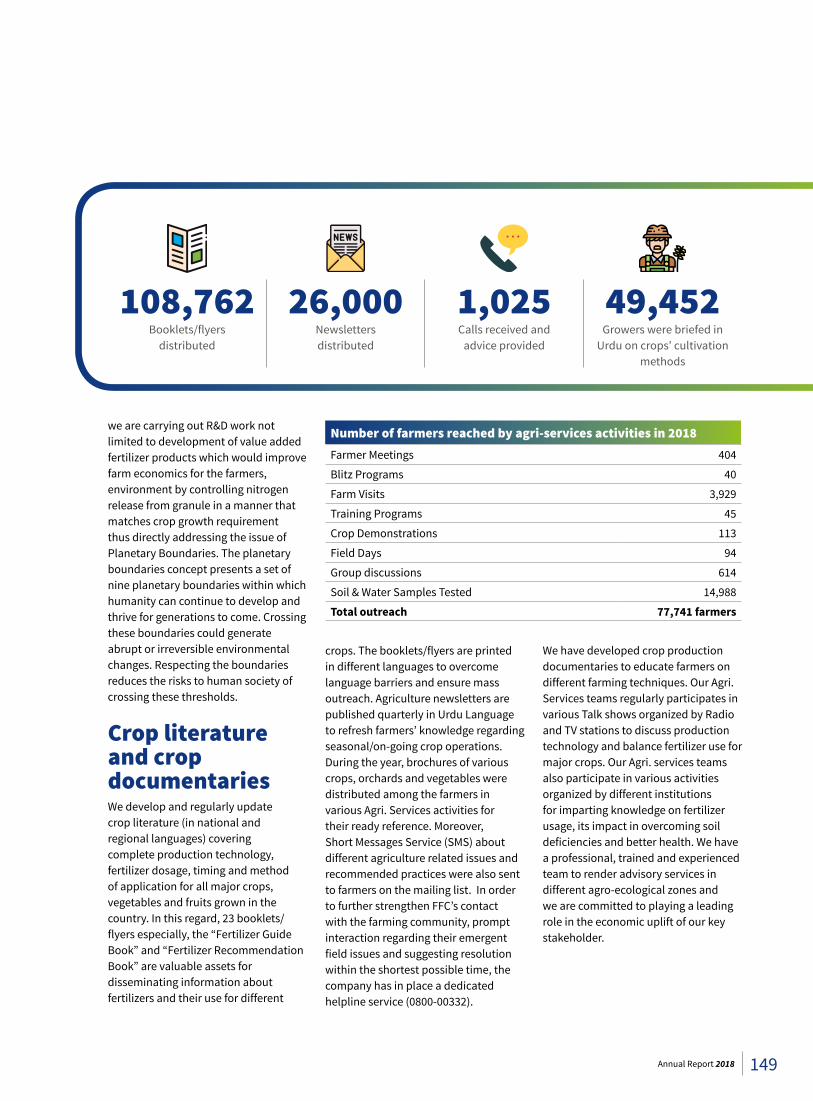
we are carrying out R&D work not limited to development of value added fertilizer products which would improve farm economics for the farmers, environment by controlling nitrogen release from granule in a manner that matches crop growth requirement thus directly addressing the issue of Planetary Boundaries. The planetary boundaries concept presents a set of nine planetary boundaries within which humanity can continue to develop and thrive for generations to come. Crossing these boundaries could generate abrupt or irreversible environmental changes. Respecting the boundaries reduces the risks to human society of crossing these thresholds.
Crop literature and crop documentariesWe develop and regularly update crop literature (in national and regional languages) covering complete production technology, fertilizer dosage, timing and method of application for all major crops, vegetables and fruits grown in the country. In this regard, 23 booklets/flyers especially, the “Fertilizer Guide Book” and “Fertilizer Recommendation Book” are valuable assets for disseminating information about fertilizers and their use for different
Number of farmers reached by agri-services activities in 2018Farmer Meetings 404
Blitz Programs 40
Farm Visits 3,929
Training Programs 45
Crop Demonstrations 113
Field Days 94
Group discussions 614
Soil & Water Samples Tested 14,988
Total outreach 77,741 farmers
108,762 Booklets/flyers
distributed
26,000Newsletters distributed
1,025Calls received and
advice provided
49,452Growers were briefed in
Urdu on crops’ cultivation methods
crops. The booklets/flyers are printed in different languages to overcome language barriers and ensure mass outreach. Agriculture newsletters are published quarterly in Urdu Language to refresh farmers’ knowledge regarding seasonal/on-going crop operations. During the year, brochures of various crops, orchards and vegetables were distributed among the farmers in various Agri. Services activities for their ready reference. Moreover, Short Messages Service (SMS) about different agriculture related issues and recommended practices were also sent to farmers on the mailing list. In order to further strengthen FFC’s contact with the farming community, prompt interaction regarding their emergent field issues and suggesting resolution within the shortest possible time, the company has in place a dedicated helpline service (0800-00332).
We have developed crop production documentaries to educate farmers on different farming techniques. Our Agri. Services teams regularly participates in various Talk shows organized by Radio and TV stations to discuss production technology and balance fertilizer use for major crops. Our Agri. services teams also participate in various activities organized by different institutions for imparting knowledge on fertilizer usage, its impact in overcoming soil deficiencies and better health. We have a professional, trained and experienced team to render advisory services in different agro-ecological zones and we are committed to playing a leading role in the economic uplift of our key stakeholder.
149Annual Report 2018
Development of Soil Fertility Atlas of Pakistan FFC collaborated with FAO, USDA, in the development of the Soil Fertility Atlas of Pakistan (Balochistan & Khyber Pakhtunkhwa) through sharing soil analysis data of FFC Labs or the development of Atlas. Last year, FFC collaborated with FAO for the development of the Atlas for Sindh and Punjab. The Atlas is an important tool for better management of land, enhances productive potential, increases incomes of small scale farmers and reduces food insecurity and hunger directly contributing to SDG 2 “Zero Hunger”.
Agriculture Value Chain Project FFC continued collaboration with the Pakistan Micro Finance Investment Company (PMFIC) to implement an Agriculture Value Chain in districts of Sheikhupura, Gujranwala and Nankana Sahib for 5,000 rice and 5,000 wheat growers. The value chain project includes capacity building of the farmers, creation of backward and forward linkages and informational messaging service. FFC provided farmer trainings through farmer meetings, field trainings, group discussions, farm visits, soil sampling, and distribution of crop literature/brochure. The project goals are to improve productive potential of land, increasing farmers’ capacity, improved access to information and markets leading to increase in subsistence farmers’ income contributing to SDG 1 “No Poverty”
Mobile App on Fertilizer Recommendations for Farmers In order to facilitate the farming community in the use of balanced fertilizer, FFC initiated work on the development of a Mobile App on Fertilizer recommendations for farmers. This model would help to predict fertilizer recommendations for those farmers who could not avail soil analysis facility and will result in better production and earnings for the farming community.
Promotion of Bio-fortified Wheat Variety In Pakistan 185 million people are deficient in zinc which is a vital nutrient for human life. In order to overcome Zinc deficiency, offer improved food security and higher income, a nutrient fortified wheat variety “Zincol” was introduced by the government in the year 2016. FFC coordinated and collaborated with HarvestPlus to propagate the nutrient (Zinc) fortified Wheat Variety Zincol in the country. This year, five demonstrations of Zincol Biofortified Wheat varieties were organized to promote this seed in the country. FFC has organized total 19 demonstration of Zincol till 2018.
How do we Create and Share Value as a Manufacturer of Fertilizer?
How We Create and Share Value
150 Sustainability Report
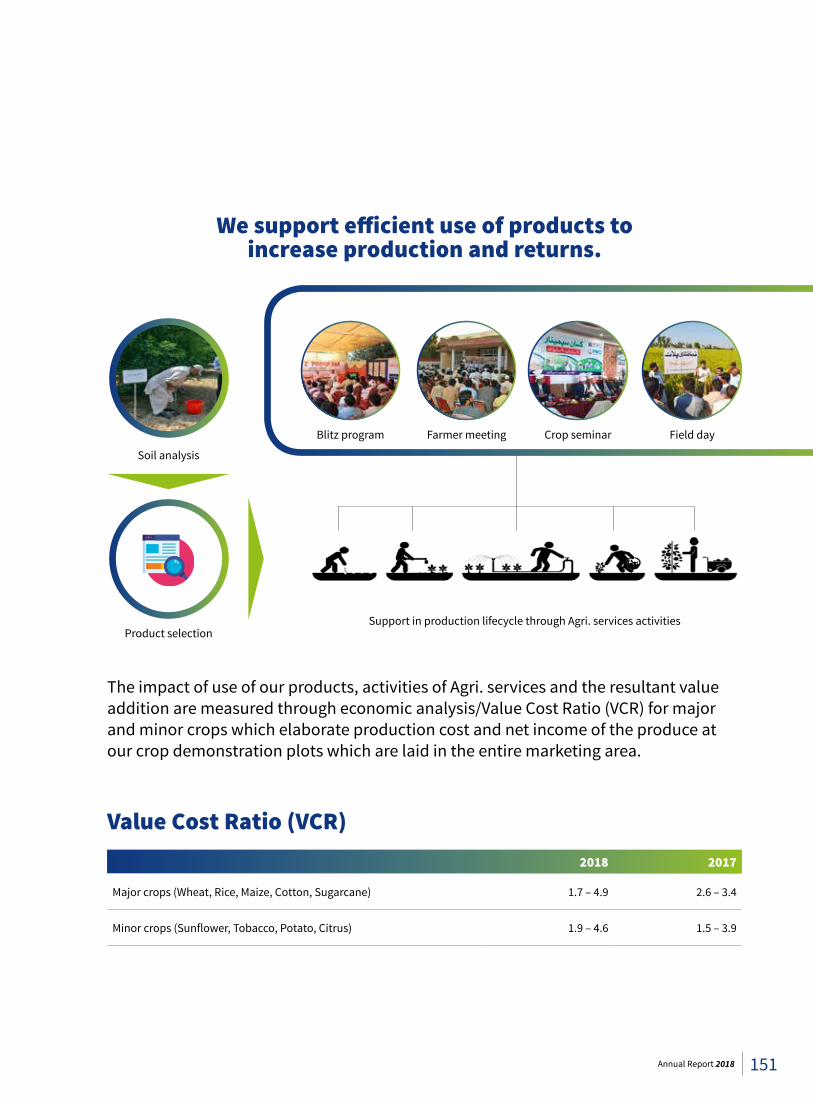
We support efficient use of products to increase production and returns.
Blitz program
Soil analysis
Product selection
Farmer meeting Crop seminar Field day
Support in production lifecycle through Agri. services activities
The impact of use of our products, activities of Agri. services and the resultant value addition are measured through economic analysis/Value Cost Ratio (VCR) for major and minor crops which elaborate production cost and net income of the produce at our crop demonstration plots which are laid in the entire marketing area.
Value Cost Ratio (VCR)2018 2017
Major crops (Wheat, Rice, Maize, Cotton, Sugarcane) 1.7 – 4.9 2.6 – 3.4
Minor crops (Sunflower, Tobacco, Potato, Citrus) 1.9 – 4.6 1.5 – 3.9
151Annual Report 2018
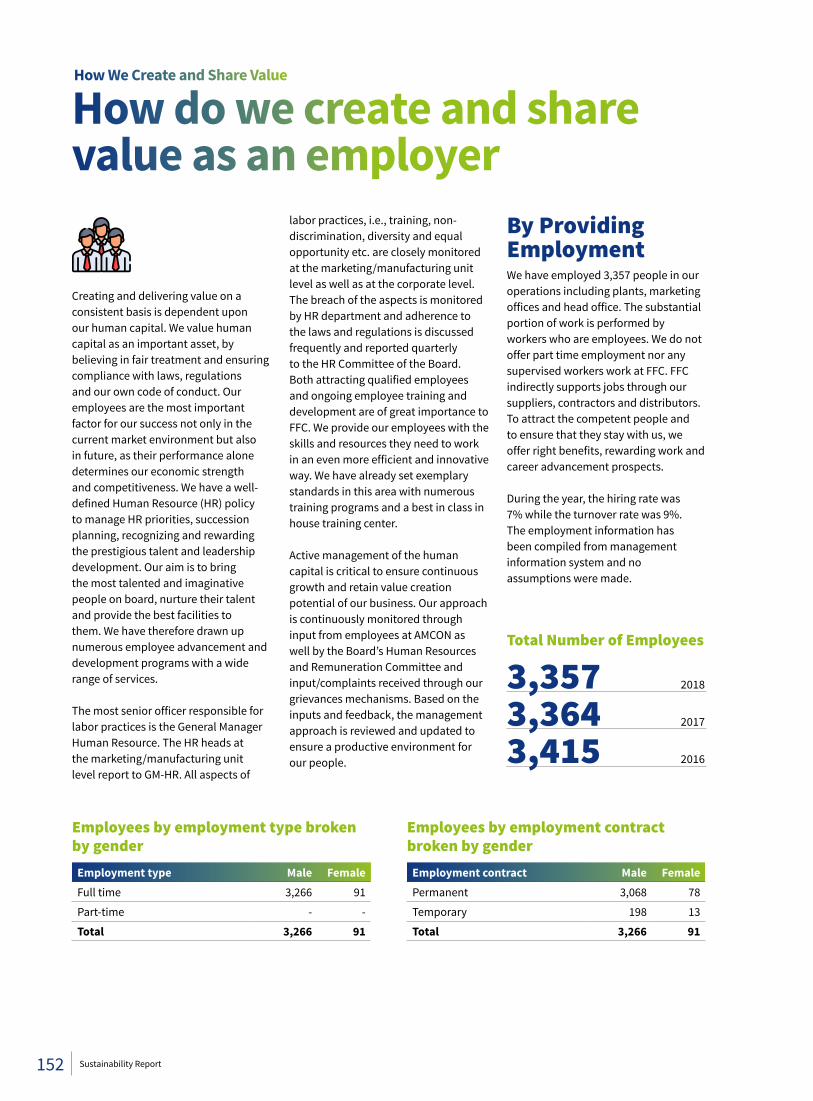
How do we create and share value as an employer
Creating and delivering value on a consistent basis is dependent upon our human capital. We value human capital as an important asset, by believing in fair treatment and ensuring compliance with laws, regulations and our own code of conduct. Our employees are the most important factor for our success not only in the current market environment but also in future, as their performance alone determines our economic strength and competitiveness. We have a well-defined Human Resource (HR) policy to manage HR priorities, succession planning, recognizing and rewarding the prestigious talent and leadership development. Our aim is to bring the most talented and imaginative people on board, nurture their talent and provide the best facilities to them. We have therefore drawn up numerous employee advancement and development programs with a wide range of services.
The most senior officer responsible for labor practices is the General Manager Human Resource. The HR heads at the marketing/manufacturing unit level report to GM-HR. All aspects of
labor practices, i.e., training, non-discrimination, diversity and equal opportunity etc. are closely monitored at the marketing/manufacturing unit level as well as at the corporate level. The breach of the aspects is monitored by HR department and adherence to the laws and regulations is discussed frequently and reported quarterly to the HR Committee of the Board. Both attracting qualified employees and ongoing employee training and development are of great importance to FFC. We provide our employees with the skills and resources they need to work in an even more efficient and innovative way. We have already set exemplary standards in this area with numerous training programs and a best in class in house training center.
Active management of the human capital is critical to ensure continuous growth and retain value creation potential of our business. Our approach is continuously monitored through input from employees at AMCON as well by the Board’s Human Resources and Remuneration Committee and input/complaints received through our grievances mechanisms. Based on the inputs and feedback, the management approach is reviewed and updated to ensure a productive environment for our people.
Total Number of Employees
3,357 2018
3,364 2017
3,415 2016
Employees by employment type broken by gender
Employment type Male FemaleFull time 3,266 91
Part-time - -
Total 3,266 91
Employees by employment contract broken by gender
Employment contract Male FemalePermanent 3,068 78
Temporary 198 13
Total 3,266 91
By Providing EmploymentWe have employed 3,357 people in our operations including plants, marketing offices and head office. The substantial portion of work is performed by workers who are employees. We do not offer part time employment nor any supervised workers work at FFC. FFC indirectly supports jobs through our suppliers, contractors and distributors. To attract the competent people and to ensure that they stay with us, we offer right benefits, rewarding work and career advancement prospects.
During the year, the hiring rate was 7% while the turnover rate was 9%. The employment information has been compiled from management information system and no assumptions were made.
How We Create and Share Value
152 Sustainability Report
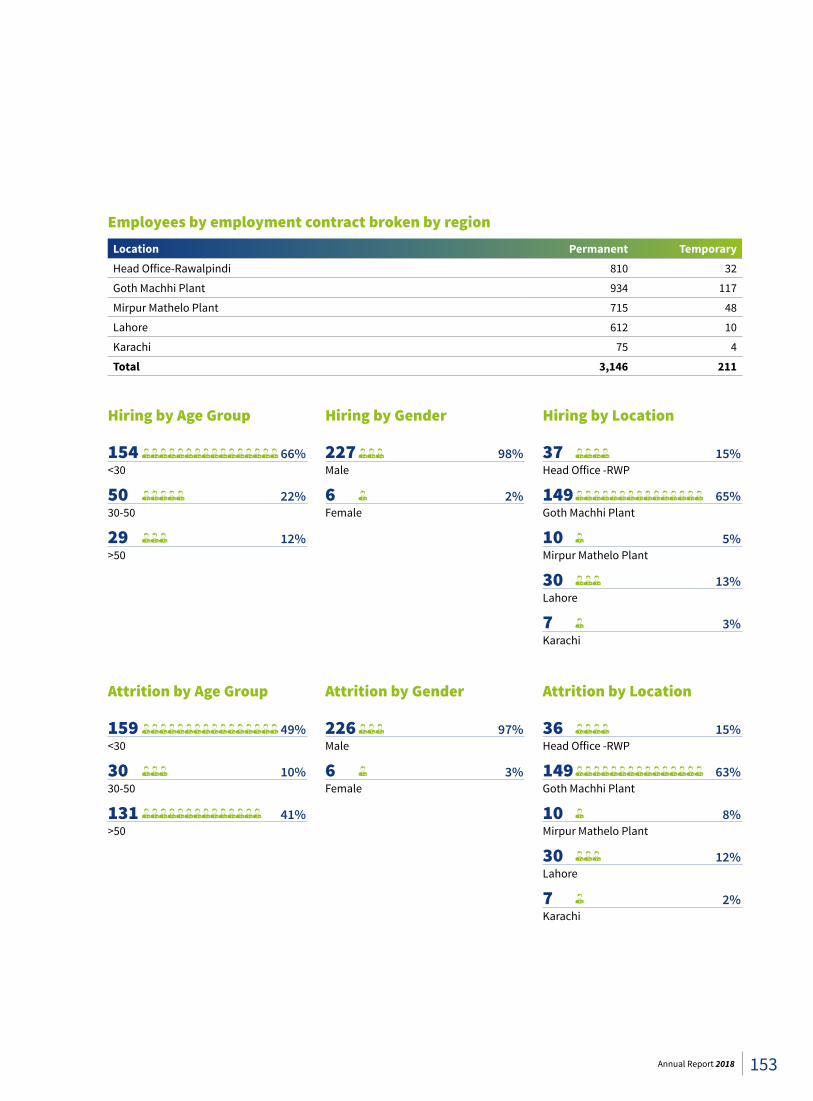
Employees by employment contract broken by region Location Permanent TemporaryHead Office-Rawalpindi 810 32
Goth Machhi Plant 934 117
Mirpur Mathelo Plant 715 48
Lahore 612 10
Karachi 75 4
Total 3,146 211
Hiring by Age Group
Attrition by Age Group
154 66%<30
50 22%30-50
29 12%>50
159 49%<30
30 10%30-50
131 41%>50
227 98%Male
6 2%Female
226 97%Male
6 3%Female
37 15%Head Office -RWP
149 65%Goth Machhi Plant
10 5%Mirpur Mathelo Plant
30 13%Lahore
7 3%Karachi
36 15%Head Office -RWP
149 63%Goth Machhi Plant
10 8%Mirpur Mathelo Plant
30 12%Lahore
7 2%Karachi
Hiring by Gender
Attrition by Gender
Hiring by Location
Attrition by Location
153Annual Report 2018
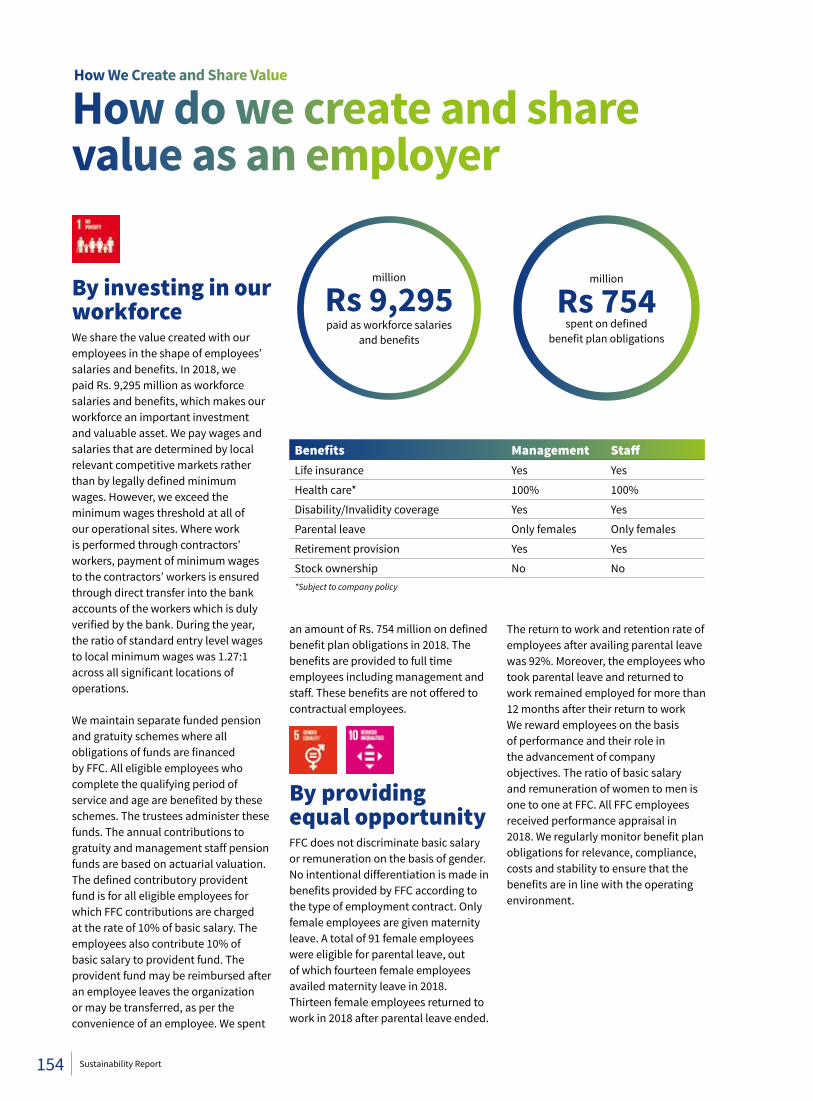
By investing in our workforce We share the value created with our employees in the shape of employees’ salaries and benefits. In 2018, we paid Rs. 9,295 million as workforce salaries and benefits, which makes our workforce an important investment and valuable asset. We pay wages and salaries that are determined by local relevant competitive markets rather than by legally defined minimum wages. However, we exceed the minimum wages threshold at all of our operational sites. Where work is performed through contractors’ workers, payment of minimum wages to the contractors’ workers is ensured through direct transfer into the bank accounts of the workers which is duly verified by the bank. During the year, the ratio of standard entry level wages to local minimum wages was 1.27:1 across all significant locations of operations.
We maintain separate funded pension and gratuity schemes where all obligations of funds are financed by FFC. All eligible employees who complete the qualifying period of service and age are benefited by these schemes. The trustees administer these funds. The annual contributions to gratuity and management staff pension funds are based on actuarial valuation. The defined contributory provident fund is for all eligible employees for which FFC contributions are charged at the rate of 10% of basic salary. The employees also contribute 10% of basic salary to provident fund. The provident fund may be reimbursed after an employee leaves the organization or may be transferred, as per the convenience of an employee. We spent
an amount of Rs. 754 million on defined benefit plan obligations in 2018. The benefits are provided to full time employees including management and staff. These benefits are not offered to contractual employees.
By providing equal opportunity FFC does not discriminate basic salary or remuneration on the basis of gender. No intentional differentiation is made in benefits provided by FFC according to the type of employment contract. Only female employees are given maternity leave. A total of 91 female employees were eligible for parental leave, out of which fourteen female employees availed maternity leave in 2018. Thirteen female employees returned to work in 2018 after parental leave ended.
Benefits Management StaffLife insurance Yes Yes
Health care* 100% 100%
Disability/Invalidity coverage Yes Yes
Parental leave Only females Only females
Retirement provision Yes Yes
Stock ownership No No*Subject to company policy
million
Rs 9,295 paid as workforce salaries
and benefits
million
Rs 754 spent on defined
benefit plan obligations
The return to work and retention rate of employees after availing parental leave was 92%. Moreover, the employees who took parental leave and returned to work remained employed for more than 12 months after their return to work We reward employees on the basis of performance and their role in the advancement of company objectives. The ratio of basic salary and remuneration of women to men is one to one at FFC. All FFC employees received performance appraisal in 2018. We regularly monitor benefit plan obligations for relevance, compliance, costs and stability to ensure that the benefits are in line with the operating environment.
How do we create and share value as an employer
How We Create and Share Value
154 Sustainability Report
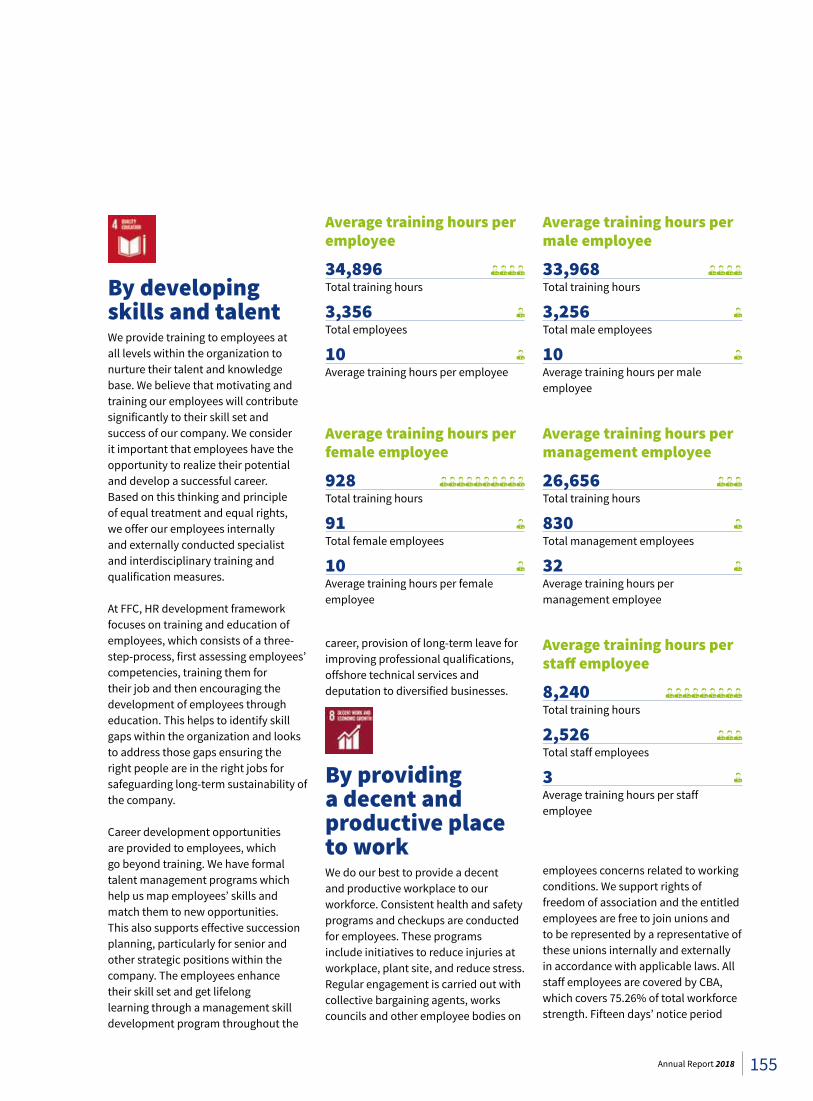
By developing skills and talent We provide training to employees at all levels within the organization to nurture their talent and knowledge base. We believe that motivating and training our employees will contribute significantly to their skill set and success of our company. We consider it important that employees have the opportunity to realize their potential and develop a successful career. Based on this thinking and principle of equal treatment and equal rights, we offer our employees internally and externally conducted specialist and interdisciplinary training and qualification measures.
At FFC, HR development framework focuses on training and education of employees, which consists of a three-step-process, first assessing employees’ competencies, training them for their job and then encouraging the development of employees through education. This helps to identify skill gaps within the organization and looks to address those gaps ensuring the right people are in the right jobs for safeguarding long-term sustainability of the company.
Career development opportunities are provided to employees, which go beyond training. We have formal talent management programs which help us map employees’ skills and match them to new opportunities. This also supports effective succession planning, particularly for senior and other strategic positions within the company. The employees enhance their skill set and get lifelong learning through a management skill development program throughout the
career, provision of long-term leave for improving professional qualifications, offshore technical services and deputation to diversified businesses.
By providing a decent and productive place to work We do our best to provide a decent and productive workplace to our workforce. Consistent health and safety programs and checkups are conducted for employees. These programs include initiatives to reduce injuries at workplace, plant site, and reduce stress. Regular engagement is carried out with collective bargaining agents, works councils and other employee bodies on
34,896 Total training hours
3,356 Total employees
10 Average training hours per employee
Average training hours per employee
928 Total training hours
91 Total female employees
10 Average training hours per female employee
Average training hours per female employee
33,968 Total training hours
3,256 Total male employees
10 Average training hours per male employee
Average training hours per male employee
26,656 Total training hours
830 Total management employees
32 Average training hours per management employee
Average training hours per management employee
8,240 Total training hours
2,526 Total staff employees
3 Average training hours per staff employee
Average training hours per staff employee
employees concerns related to working conditions. We support rights of freedom of association and the entitled employees are free to join unions and to be represented by a representative of these unions internally and externally in accordance with applicable laws. All staff employees are covered by CBA, which covers 75.26% of total workforce strength. Fifteen days’ notice period
155Annual Report 2018
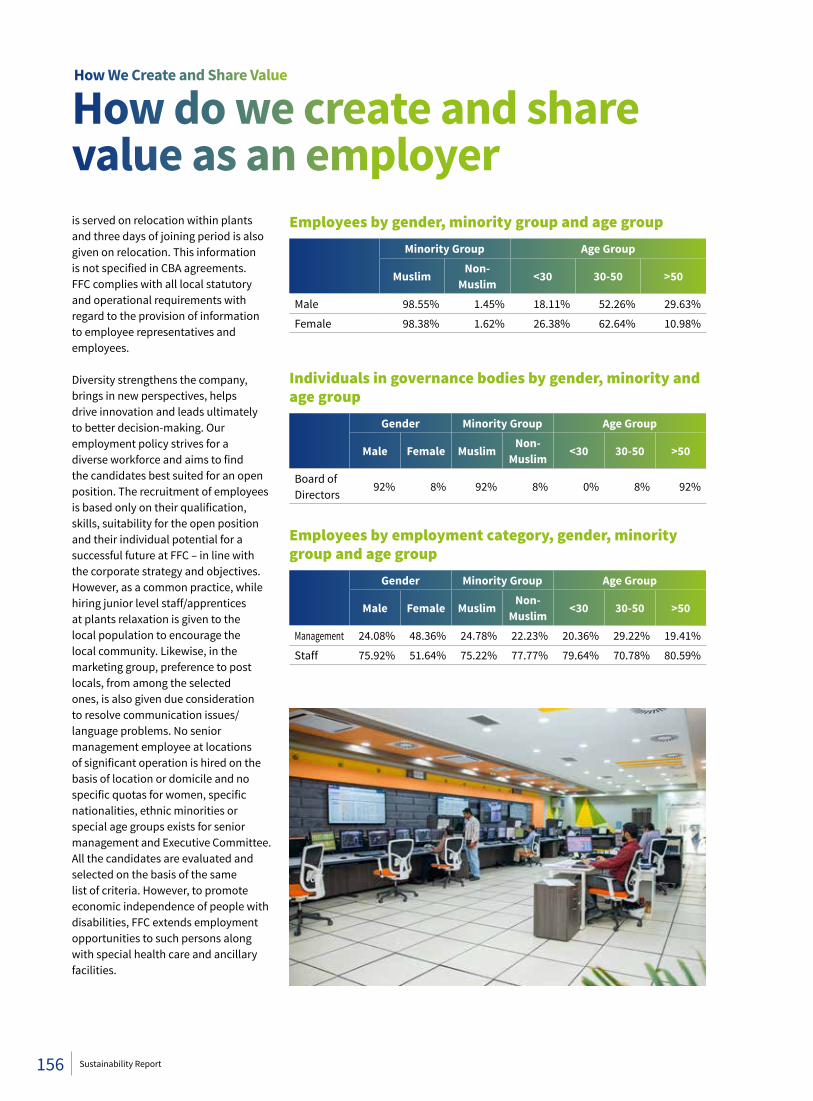
is served on relocation within plants and three days of joining period is also given on relocation. This information is not specified in CBA agreements. FFC complies with all local statutory and operational requirements with regard to the provision of information to employee representatives and employees.
Diversity strengthens the company, brings in new perspectives, helps drive innovation and leads ultimately to better decision-making. Our employment policy strives for a diverse workforce and aims to find the candidates best suited for an open position. The recruitment of employees is based only on their qualification, skills, suitability for the open position and their individual potential for a successful future at FFC – in line with the corporate strategy and objectives. However, as a common practice, while hiring junior level staff/apprentices at plants relaxation is given to the local population to encourage the local community. Likewise, in the marketing group, preference to post locals, from among the selected ones, is also given due consideration to resolve communication issues/language problems. No senior management employee at locations of significant operation is hired on the basis of location or domicile and no specific quotas for women, specific nationalities, ethnic minorities or special age groups exists for senior management and Executive Committee. All the candidates are evaluated and selected on the basis of the same list of criteria. However, to promote economic independence of people with disabilities, FFC extends employment opportunities to such persons along with special health care and ancillary facilities.
Employees by gender, minority group and age groupMinority Group Age Group
MuslimNon-
Muslim<30 30-50 >50
Male 98.55% 1.45% 18.11% 52.26% 29.63%
Female 98.38% 1.62% 26.38% 62.64% 10.98%
Individuals in governance bodies by gender, minority and age group
Gender Minority Group Age Group
Male Female MuslimNon-
Muslim<30 30-50 >50
Board of Directors
92% 8% 92% 8% 0% 8% 92%
Employees by employment category, gender, minority group and age group
Gender Minority Group Age Group
Male Female MuslimNon-
Muslim<30 30-50 >50
Management 24.08% 48.36% 24.78% 22.23% 20.36% 29.22% 19.41%
Staff 75.92% 51.64% 75.22% 77.77% 79.64% 70.78% 80.59%
How do we create and share value as an employer
How We Create and Share Value
156 Sustainability Report
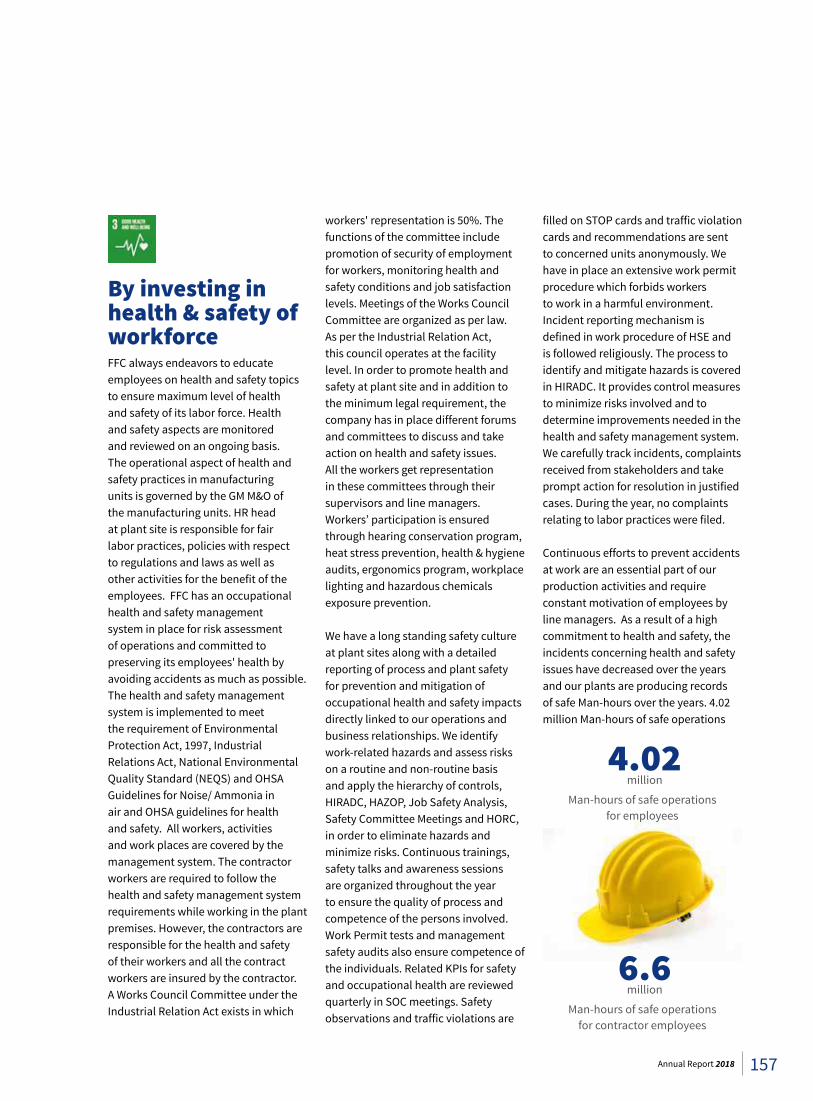
By investing in health & safety of workforce FFC always endeavors to educate employees on health and safety topics to ensure maximum level of health and safety of its labor force. Health and safety aspects are monitored and reviewed on an ongoing basis. The operational aspect of health and safety practices in manufacturing units is governed by the GM M&O of the manufacturing units. HR head at plant site is responsible for fair labor practices, policies with respect to regulations and laws as well as other activities for the benefit of the employees. FFC has an occupational health and safety management system in place for risk assessment of operations and committed to preserving its employees' health by avoiding accidents as much as possible. The health and safety management system is implemented to meet the requirement of Environmental Protection Act, 1997, Industrial Relations Act, National Environmental Quality Standard (NEQS) and OHSA Guidelines for Noise/ Ammonia in air and OHSA guidelines for health and safety. All workers, activities and work places are covered by the management system. The contractor workers are required to follow the health and safety management system requirements while working in the plant premises. However, the contractors are responsible for the health and safety of their workers and all the contract workers are insured by the contractor. A Works Council Committee under the Industrial Relation Act exists in which
workers' representation is 50%. The functions of the committee include promotion of security of employment for workers, monitoring health and safety conditions and job satisfaction levels. Meetings of the Works Council Committee are organized as per law. As per the Industrial Relation Act, this council operates at the facility level. In order to promote health and safety at plant site and in addition to the minimum legal requirement, the company has in place different forums and committees to discuss and take action on health and safety issues. All the workers get representation in these committees through their supervisors and line managers. Workers’ participation is ensured through hearing conservation program, heat stress prevention, health & hygiene audits, ergonomics program, workplace lighting and hazardous chemicals exposure prevention.
We have a long standing safety culture at plant sites along with a detailed reporting of process and plant safety for prevention and mitigation of occupational health and safety impacts directly linked to our operations and business relationships. We identify work-related hazards and assess risks on a routine and non-routine basis and apply the hierarchy of controls, HIRADC, HAZOP, Job Safety Analysis, Safety Committee Meetings and HORC, in order to eliminate hazards and minimize risks. Continuous trainings, safety talks and awareness sessions are organized throughout the year to ensure the quality of process and competence of the persons involved. Work Permit tests and management safety audits also ensure competence of the individuals. Related KPIs for safety and occupational health are reviewed quarterly in SOC meetings. Safety observations and traffic violations are
filled on STOP cards and traffic violation cards and recommendations are sent to concerned units anonymously. We have in place an extensive work permit procedure which forbids workers to work in a harmful environment. Incident reporting mechanism is defined in work procedure of HSE and is followed religiously. The process to identify and mitigate hazards is covered in HIRADC. It provides control measures to minimize risks involved and to determine improvements needed in the health and safety management system. We carefully track incidents, complaints received from stakeholders and take prompt action for resolution in justified cases. During the year, no complaints relating to labor practices were filed.
Continuous efforts to prevent accidents at work are an essential part of our production activities and require constant motivation of employees by line managers. As a result of a high commitment to health and safety, the incidents concerning health and safety issues have decreased over the years and our plants are producing records of safe Man-hours over the years. 4.02 million Man-hours of safe operations
4.02million
Man-hours of safe operations for employees
6.6million
Man-hours of safe operations for contractor employees
157Annual Report 2018
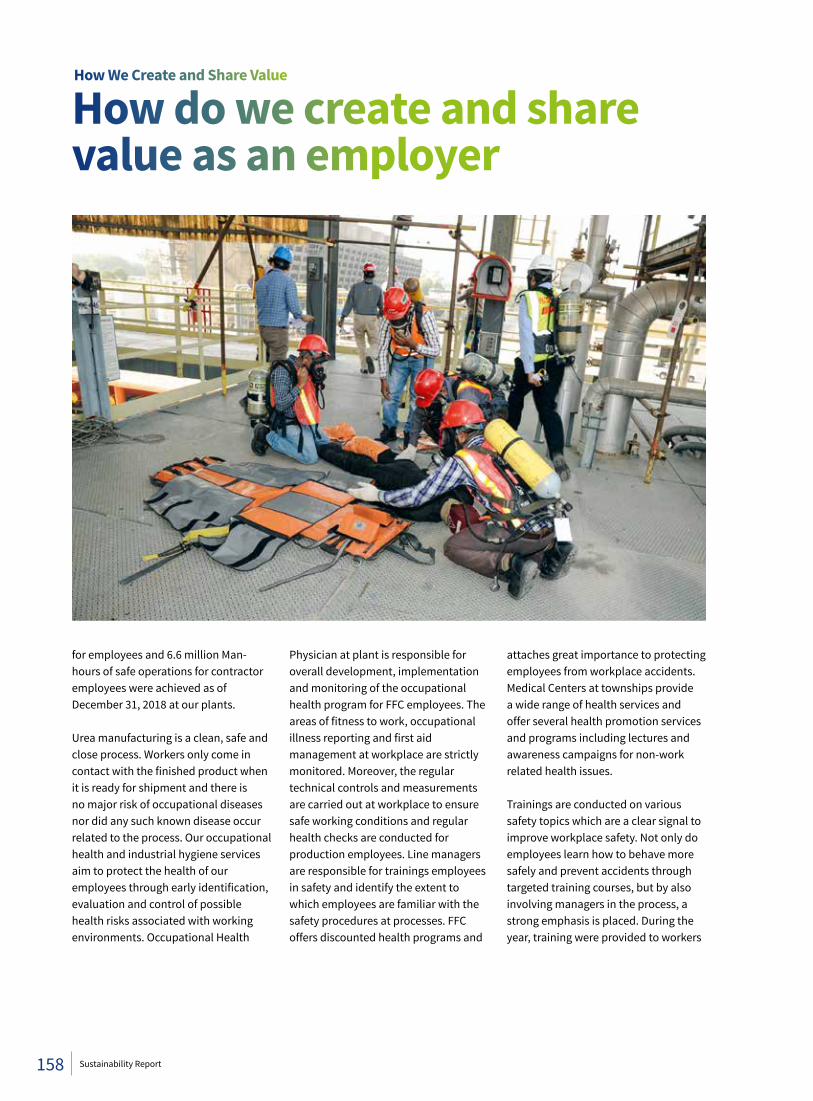
for employees and 6.6 million Man-hours of safe operations for contractor employees were achieved as of December 31, 2018 at our plants.
Urea manufacturing is a clean, safe and close process. Workers only come in contact with the finished product when it is ready for shipment and there is no major risk of occupational diseases nor did any such known disease occur related to the process. Our occupational health and industrial hygiene services aim to protect the health of our employees through early identification, evaluation and control of possible health risks associated with working environments. Occupational Health
Physician at plant is responsible for overall development, implementation and monitoring of the occupational health program for FFC employees. The areas of fitness to work, occupational illness reporting and first aid management at workplace are strictly monitored. Moreover, the regular technical controls and measurements are carried out at workplace to ensure safe working conditions and regular health checks are conducted for production employees. Line managers are responsible for trainings employees in safety and identify the extent to which employees are familiar with the safety procedures at processes. FFC offers discounted health programs and
attaches great importance to protecting employees from workplace accidents. Medical Centers at townships provide a wide range of health services and offer several health promotion services and programs including lectures and awareness campaigns for non-work related health issues.
Trainings are conducted on various safety topics which are a clear signal to improve workplace safety. Not only do employees learn how to behave more safely and prevent accidents through targeted training courses, but by also involving managers in the process, a strong emphasis is placed. During the year, training were provided to workers
How do we create and share value as an employer
How We Create and Share Value
158 Sustainability Report
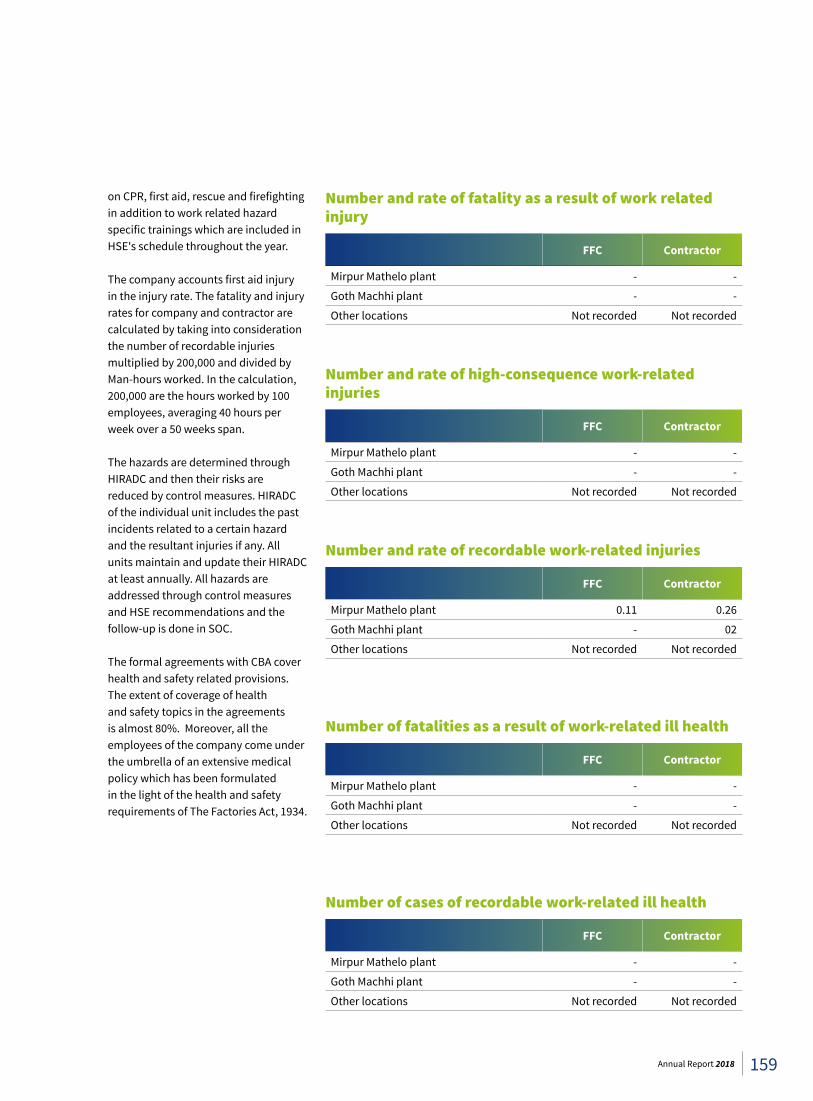
Number and rate of fatality as a result of work related injury
FFC Contractor
Mirpur Mathelo plant - -
Goth Machhi plant - -
Other locations Not recorded Not recorded
Number and rate of high-consequence work-related injuries
FFC Contractor
Mirpur Mathelo plant - -
Goth Machhi plant - -
Other locations Not recorded Not recorded
Number and rate of recordable work-related injuries
FFC Contractor
Mirpur Mathelo plant 0.11 0.26
Goth Machhi plant - 02
Other locations Not recorded Not recorded
Number of fatalities as a result of work-related ill health
FFC Contractor
Mirpur Mathelo plant - -
Goth Machhi plant - -
Other locations Not recorded Not recorded
Number of cases of recordable work-related ill health
FFC Contractor
Mirpur Mathelo plant - -
Goth Machhi plant - -
Other locations Not recorded Not recorded
on CPR, first aid, rescue and firefighting in addition to work related hazard specific trainings which are included in HSE's schedule throughout the year.
The company accounts first aid injury in the injury rate. The fatality and injury rates for company and contractor are calculated by taking into consideration the number of recordable injuries multiplied by 200,000 and divided by Man-hours worked. In the calculation, 200,000 are the hours worked by 100 employees, averaging 40 hours per week over a 50 weeks span.
The hazards are determined through HIRADC and then their risks are reduced by control measures. HIRADC of the individual unit includes the past incidents related to a certain hazard and the resultant injuries if any. All units maintain and update their HIRADC at least annually. All hazards are addressed through control measures and HSE recommendations and the follow-up is done in SOC.
The formal agreements with CBA cover health and safety related provisions. The extent of coverage of health and safety topics in the agreements is almost 80%. Moreover, all the employees of the company come under the umbrella of an extensive medical policy which has been formulated in the light of the health and safety requirements of The Factories Act, 1934.
159Annual Report 2018
How do we create and share value as a trusted business partner?
By procuring locallySuppliers are strategic allies who support our success and ensure consistent provision of products to customers. Our supplier relationships go beyond the purely commercial sphere and include a mutual understanding of what it takes to promote good practices and pursue responsible and sustainable development. The procurement function at head office, marketing and plant sites is responsible for management of procurement practices in line with the company policies. The procurement policies are evaluated regularly and updated on need basis. During the year, the evaluation of the procurement policy was carried out and new registration criteria covering environmental and social factors was uploaded,
We procure most of our requirements from the locations in which our respective operating facilities are located as far as qualitatively compatible, technically feasible, and economically justifiable. This way, FFC’s activities support the economic development of the surrounding areas. FFC is not particularly dependent on any of its suppliers except the supplier for natural gas which is the basic raw material for fertilizer manufacturing. Our suppliers consist of local suppliers and foreign suppliers. The major raw material and other components which can be easily purchased from Pakistan are procured locally while the materials and components which are not available in Pakistan are purchased from abroad. 51% of our purchases are from local suppliers and 49% from foreign suppliers.
51%Local Supplier
49%Foreign Supplier
By working on sustainability in the supply chain Today’s complex business environment and impact beyond organizational boundaries require active supply chain management. Incorporation of sustainability criteria in selection and working with suppliers help limit exposure to unexpected events, negative environmental and social impacts and supply disruption, while building long-term core competence and effective management of supply chain. We have sustainability criteria to select and manage our suppliers, outsourcing partners, and service providers. The selection criteria takes into account conditions relating to sustainability factors such as, environmental management, working conditions, respect for human rights, safety standards and financial creditworthiness. The evaluation of the procurement selection criteria was carried out during the year. Based on the evaluation results, the upgrading of the criteria is under consideration to include more comprehensive criteria by including other factors relating to labor management practices, human rights and society related practices in the procurement manual. We plan to educate our supply chain partners on the criteria through inclusion of the relevant suppliers in FFC’s supplier assessment process. In order to monitor how suppliers deploy FFC’s sustainability criteria, FFC will require major suppliers to produce third party verification with respect to FFC’s
sustainability criteria and may also carry out on-site audits in the future, if deemed necessary. The suppliers’ sustainability criteria will strengthen the efforts and will provide a reference framework for social and environmental protection in the supply chain. As part of its supplier relationship management and to strengthen its vision and approach of a sustainable supply chain, FFC regularly hosts trainings for its haulage contractors as well as dealers. Apart from creating awareness, these activities help FFC to engage with its supply chain for the deployment and realization of different activities. We are focused on working with suppliers and partners to improve the entire supply chain from a sustainability perspective.
The ultimate governance of strategy in relation to supplier management lies at the highest level of the management. The respective departments deal with suppliers. FFC evaluates the effectiveness of its management approach through feedback from various stakeholders and surveys. Our investment agreements include human rights clauses and undergo human rights screening. All major investments must be approved by the Board of Directors. The Board Committees recommend the investments proposal after detailed working and review which is based on financial, strategic and sustainability criteria, the last of which also includes human rights aspects. Moreover, regular procurement also takes into account the sustainability criteria to screen the new suppliers. 56 suppliers (100%), who applied and registered during the year, were screened against existing sustainability criteria. FFC does not collect data of environmental and social impacts in the supply chain thus is not aware of any negative impacts of supplier’s operations during the year.
How We Create and Share Value
160 Sustainability Report
By supporting local communities Sustainable Development Goals and the national priorities are the guiding principles for us while creating and sharing value with our local communities. We have a well-defined CSR policy in place which serves as a guiding document and encompasses commitments, targets and responsibilities for effective management of our activities. We support communities through taxes, local procurement, donations, and provision of facilities around the plant site. In 2018, we spent Rs. 85 million on CSR activities. Most of the spending was in the areas of education, health care, community support and uplift and event sponsorships.
The implementation and monitoring of the social activities are routed through Sr. Manager CSR who also reviews and analyzes the monthly progress. We use various tools to monitor and follow-up performance and commitments to society including independent monitors as well as in-house reviews. Progress is reported to the senior management on a continuous basis. Our work in communities is implemented through Sona Welfare Foundation (SWF), which is a fully dedicated entity to carry out interventions in the fields of healthcare, education, sports and rural development. Acting responsibly in all our activities, we are playing an active role towards sustainable development in areas of operations and support local economic development. The major indirect impacts are enhancing skills
and knowledge, jobs in the supply chain and new businesses resulting in economic development of the area. We are raising living standards of population in areas of operations, both directly and indirectly, by creating added value. Our approach is driven by the needs of the targeted community, carried out through surveys, focal groups and meetings with the local community. Based on these guidelines, the interventions are devised to deliver maximum benefit and impact. We regularly engage with local communities to identify any negative effect of our operations on local communities and as result of these engagements, we identified that there were no significant negative effects on local communities during the year. We have carried out local community engagement, impact assessment and development programs at all (100%) operational locations. As a result of these engagements and assessments, the activities in defined areas are planned and implemented.
Healthcare Healthy societies are vital for economic development and prosperity. In line with SDG 3, “Good Health and Well-being” and national priorities, we continued our emphasis on provision of health care facilities not only at our plants, adjacent localities but also nationally in collaboration with different entities. During the year, we contributed Rs. 21.7 million to Hazarat Bilal Trust Hospital and Sona Welfare Hospital located at Goth Machhi and Mirpur Mathelo plants. These hospitals provide good healthcare facilities and treatment of approximately 150,000 patients annually of the surrounding community. FFC partnered with Pink Ribbon for the first ever dedicated breast cancer hospital in Lahore which
million
Rs 85 spent on CSR
activities during 2018
Year Donation in million
2018 85
2017 89
2016 122
2015 168
2014 188
will cater to the rising ratio of the disease. FFC also illuminated Sona Tower in support of the Global Breast Cancer Awareness month marked October. FFC donated Rs. 2.206 million to various NPOs working on health issues for deserving patients including Pakistan Kidney Patients Association, Pakistan Foundation for Fighting Blindness and AMMEER-UN-NISA Foundation.
Education Education is an important factor for better societies and a long-term investment for sustainable economic development. Our interventions in the field of education help in uplifting education level and the socio economic development of the surrounding communities. FFC contributed Rs. 5.5 million under its adopted schools programs which included 20 annual
How do we create and share value in local communities we operate?
How We Create and Share Value
161Annual Report 2018
scholarships, distribution of books and stationery besides improvement in infrastructure and payment of salaries of government schools. Rs. 16 million was provided in shape of financial support to Sona public school and 135 new scholarships were provided under the ‘Ward of Farmer Scholarship’. FFC donated Rs 2.5 million for the uplifting of the Government Secondary School Ahmed Pur Lamma which is providing education to 300 students from the local community. The uplifting includes a Sona block comprising of 4 class rooms with a total covered area of 2040 square feet and associated facility. Moreover, FFC contributed an amount of Rs. 6.855 under various scholarships programs to the talented and deserving students of the under-privileged communities.
SportsThrough our sports sponsorships, we encourage healthier lifestyles and grassroots participation in sports activities which result in productive minds and societies. Keeping its tradition of promoting healthy sports activities, we made donations for various sports activities and sponsored sports events.
Building Partnerships In line with SDG 17 Partnerships for Sustainable Development, FFC strongly believes in partnerships to promote the goal of sustainable development through shared resources and expertise. During the year, FFC collaborated with the Planning Commission, Government of Pakistan, United Nations Development Program, Pakistan Stock Exchange and Corporate Social Responsibility Centre Pakistan to create awareness on opportunities
provided by SDGs and how the private sector can play its role in meeting SDGs.
Rural development programs Our rural development programs are dedicated to overcome severe problems faced by the communities, create opportunities to reduce poverty and make contributions towards the economic development of our country. During 2018, FFC has undertaken different activities in Pind Dadan Khan covering provision of water to two villages i.e. Samman & Sauwal covering installation of water purification plant for provision of clean drinking water for the residents of village Sauwal, and construction of Offices and Teachers block at Raj Bukhsh Trust Model School Sauwal. FFC donated Rs. 10 million for up gradation scheme for Bilal Colony Goth Machhi covering a new sewerage line and brick soling along with new pumping station as well with sludge pump and collection pit. FFC donated Rs. 1.4 million for the annual charity funfair at Goth Machhi and Mirpur Mathelo Plants, the revenue collected from the event is spent on community welfare activities at plant sites. Moreover, donation of Rs. 0.65 million was made for family assistance program and livelihood support program at Goth Machhi.
By Contributing To National ExchequerWe recognize that we have a role to play in supporting public services through our tax payments and value addition in terms of foreign exchange savings. Besides corporate income tax, we pay taxes as an employer and sales tax
on our products. We also act as a tax collector – through tax deduction on employees’ salaries and on payments to suppliers and contractors. Our approach comprises of two principles. Firstly, we actively manage our compliance by working within the rules set by government. Secondly, we work on tax optimization. Once our business decisions are finalized, we work on optimization of our taxes. We take decisions for business reason not based on tax advantages only. However, we do take into consideration the tax incidence in decision making to avoid any disadvantage to our shareholders.
During the year, cash contribution to national exchequer comprising of taxes, levies and accrued GIDC was Rs. 36.78 billion. Value addition in terms of foreign exchange savings was US$650 million through import substitution of 2,527 thousand tonnes urea sold during the year.
How do we create and share value in local communities we operate?
How We Create and Share Value
162 Sustainability Report
We are aware of our ethical responsibility for environment friendly and fair business transactions. Our employees are educated and trained to take responsibility in line with their function, authority and qualifications to enrich our corporate responsibility of ethical business. The Rio Declaration requires that countries take a precautionary approach, according to their capabilities, in order to protect the environment. Thus, measures to prevent environmental degradation must not be postponed where there are threats of serious or irreversible environmental damage. Nevertheless, such measures should not pose an excessive financial burden as Principle 15 of the declaration combines environmental protection with a cost-benefit analysis. In order to protect the environment, we apply the precautionary approach in our operations. Our sustainability policy clearly defines objectives and states the importance of inclusive growth as one of the key areas for sustainable development.
By efficiently managing environmental footprintWe are committed to protecting nature and environment through continued investments in environment friendly technologies and production processes. We efficiently program our production processes to ensure a continuous improvement in energy and water efficiency and lower levels of (pollutant) emissions and waste. The biodegradable packing material for Urea along with renewable resource utilization, where applicable, is
How do we create and share value as a socially responsible Company?
Effective management of environmental impacts of our
operations helps to reduce our environmental footprint.
helping us to move forward towards establishment of a widely sustainable value chain.
FFC is continuously improving its processes and production procedures on an ongoing basis in line with its environment management approach which has helped to reduce the absolute as well as relative volume of used resources, waste, waste water and air emissions. FFC has an integrated Environmental, Health & Safety policy which is applicable to all manufacturing plants for maintaining high standards of Health, Safety & Environment (HSE). The objective is to preserve the environment from degradation and provide a safe and healthy workplace, while improving the quality of life of employees, contractors, visitors and plant site community. The GM M&O at each plant is responsible for performance, regulatory affairs and monitors the compliance across the manufacturing plants. FFC regularly conducts trainings for senior management of manufacturing units as well as employees working on line functions. FFC has specifically designed training modules for different internal trainings and employees are nominated for external trainings as well. HSE systems are regularly monitored for ensuring compliance with internal HSE policies and applicable laws and regulations. The manufacturing plants are certified for ISO 9001:2008 Quality Management System, ISO 140001:2004 Environmental Management System and OHSAS 18001:2007 Occupational Health & Safety Assessment Series (OH&S Management System). These management systems enable us to identify the risks and potential opportunities, improved internal data management, building the confidence of stakeholders and identify energy management spots. The SOC & EMR forums at facility level perform an internal check to find out the gaps on a regular basis. The environmental
management approach is evaluated regularly based on the results of the internal checks and external certifications of the management systems. The required adjustments are made to reduce the environmental footprint of our operations. As a result of these efforts and stringent voluntary commitments, there was no violation of laws, regulations and voluntary codes of practice in connection with nature and environmental protection. Moreover, FFC did not have to pay any fines or non-monetary penalties for non-compliance with environmental laws and regulations in 2018. FFC has an environmental grievances mechanism in place where complaints regarding negative environmental impacts of operations can be filed. The resident manager at plant site deals with such complaints and necessary actions are taken as per need. During the year, no complaint was filed.
FFC has identified that climate change may have impact on its business in shape of physical as well as financial nature. The changing weather patterns may affect the product consumption patterns and farm productivity resulting in reduced purchasing power of end consumers. FFC is aware of this important issue and has set priorities by making sustainability an integral part of its corporate strategy regardless of economic or seasonal fluctuations and exceptions. However,
How We Create and Share Value
163Annual Report 2018
the expected financial impact of climate change related risks on operations are not monetized as the risks are not substantial at the moment and no systems to compile such data were available. FFC is planning to develop a system to calculate the financial implications of climate change related risks and opportunities on its operations. FFC regularly makes investments for environmental protection and management. The investments and expenses occurred on environmental protection and mitigation of the impacts, are recorded at respective units, where these occur. The figures are consolidated at the end of each year under two broader heads i.e., prevention and management costs. It is an integral part of general investment planning and subject neither to a cost-benefit analysis nor a specific return on investment period. The environmental investment totaled about Rs. 8.81 million in 2018, of which 75% was spent on waste disposal, emission treatment and remediation and approximately 25% on environmental management.
Detailed information on our environmental impacts is available at pages 169 & 170 of this Report.
By respecting human rightsRespecting international proclaimed human rights are cornerstone of our corporate values. We support and abide by international charters on human rights in our sphere of influence. We have in place a number of internal policies to safeguard basic human rights as defined in the legislation and international charters. Some of the policies in relation to human rights management are nondiscrimination policy, forced and compulsory labor policy, child labor policy and anti-sexual harassment policy. The code of conduct for employees provides
basic guidance on human rights, non-discrimination and freedom of association. A varied workforce is of great value to us, consequently, we do not tolerate any discrimination based on the race, ethnicity, sex, religion, views, a disability, age or sexual identity of employees. We have a notification and reporting system in place for taking action on complaints with respect to human rights violations. The most senior officer responsible for managing human rights issues and implementation of various policies related to human rights is the General Manager (GM)-HR. Complaints are received via line managers or works councils within the relevant statutory framework. Beyond this, if the aforementioned procedure does not achieve the desired outcome, complaints can also be made through HR department. The legal department reviews the complaints filed for amicable solution and possible legal impacts. In 2018, no complaints were received.
FFC respects the freedom of association right of entitled employees. There were no cases in which freedom of association or the right-to-collective-bargaining were seriously endangered or breached. However, we are not aware of breach of right to collective bargaining at suppliers due to non-availability of reliable data. We reject any form of child labor, forced labor or slavery and strictly comply with local regulations concerning legal minimum age requirements for work permits. There were no cases of child labor or forced labor in the Company. However, we are not aware of cases of child labor or forced labor with our suppliers due to non-availability of reliable data. We are aware of the fact that the non-compliance with minimum human rights regulations by the supply chain partners may have material impacts and we support and encourage our supply chain partner to obey the human
right laws and adopt best available practices in this area. Keeping in view, the level of compliance, we have not carried out any evaluation of our approach of managing and respecting human rights.
All significant investment agreements have been scanned for human rights issues while performing due diligence for that specific agreement. FFC is a member of UNGC and strictly adheres to the human rights charter and applicable laws. FFC carries out regular review of the operations for human right impacts and in the year 2018, FFC carried out a review of 100% of operations for human rights impact assessments. During the year, 08 hours of training were devoted for human rights policies and procedures involving 25% of workforce. All security personnel received training on human rights policies or procedures during the year. The training of security personnel provided by third parties will be carried out in the next phase.
By providing returns for our investorsSustainable returns to our shareholders and providers of capital is one of the primary functions of our business and support our sustainability initiatives. We have well defined goals for revenue, costs, production, sales and profit along with policies, procedures, and resources supported by state-of-the-art business management systems for operational management and delivering exceptional results. The boundary for the financial impacts
How do we create and share value as a socially responsible Company?
How We Create and Share Value
164 Sustainability Report
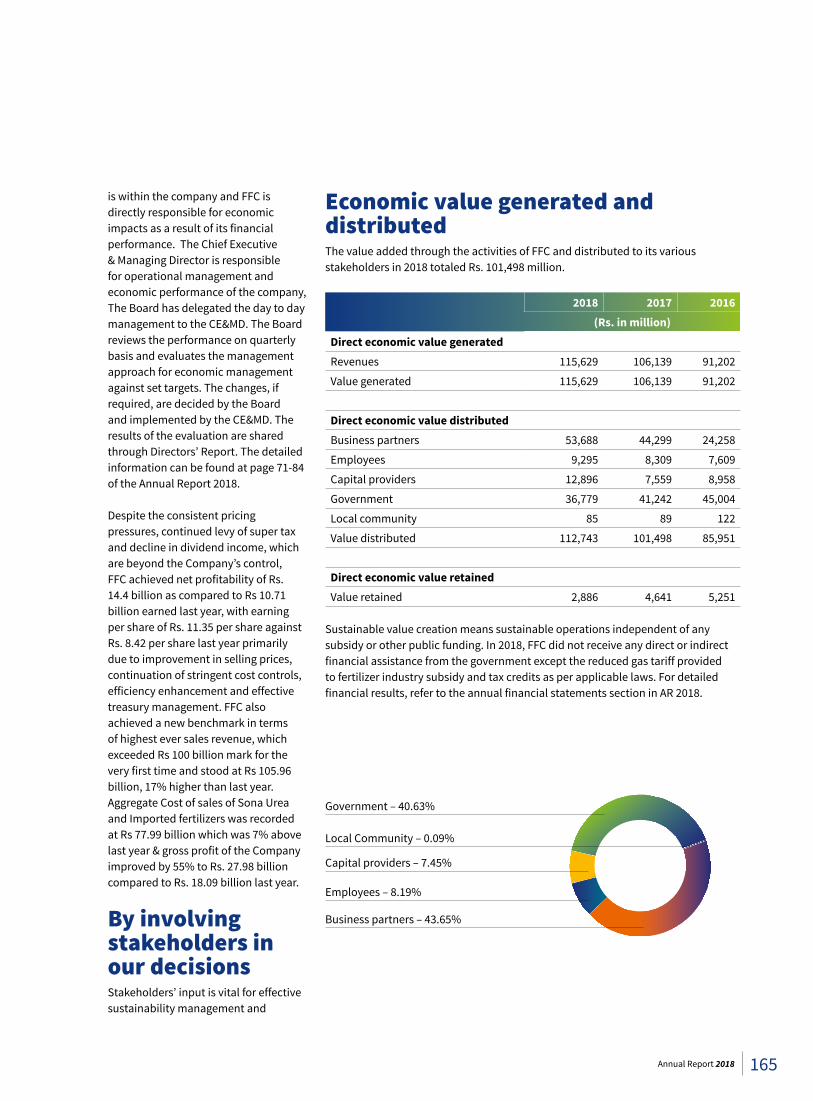
is within the company and FFC is directly responsible for economic impacts as a result of its financial performance. The Chief Executive & Managing Director is responsible for operational management and economic performance of the company, The Board has delegated the day to day management to the CE&MD. The Board reviews the performance on quarterly basis and evaluates the management approach for economic management against set targets. The changes, if required, are decided by the Board and implemented by the CE&MD. The results of the evaluation are shared through Directors’ Report. The detailed information can be found at page 71-84 of the Annual Report 2018.
Despite the consistent pricing pressures, continued levy of super tax and decline in dividend income, which are beyond the Company’s control, FFC achieved net profitability of Rs. 14.4 billion as compared to Rs 10.71 billion earned last year, with earning per share of Rs. 11.35 per share against Rs. 8.42 per share last year primarily due to improvement in selling prices, continuation of stringent cost controls, efficiency enhancement and effective treasury management. FFC also achieved a new benchmark in terms of highest ever sales revenue, which exceeded Rs 100 billion mark for the very first time and stood at Rs 105.96 billion, 17% higher than last year. Aggregate Cost of sales of Sona Urea and Imported fertilizers was recorded at Rs 77.99 billion which was 7% above last year & gross profit of the Company improved by 55% to Rs. 27.98 billion compared to Rs. 18.09 billion last year.
By involving stakeholders in our decisionsStakeholders’ input is vital for effective sustainability management and
Economic value generated and distributed The value added through the activities of FFC and distributed to its various stakeholders in 2018 totaled Rs. 101,498 million.
2018 2017 2016(Rs. in million)
Direct economic value generated Revenues 115,629 106,139 91,202
Value generated 115,629 106,139 91,202
Direct economic value distributedBusiness partners 53,688 44,299 24,258
Employees 9,295 8,309 7,609
Capital providers 12,896 7,559 8,958
Government 36,779 41,242 45,004
Local community 85 89 122
Value distributed 112,743 101,498 85,951
Direct economic value retainedValue retained 2,886 4,641 5,251
Sustainable value creation means sustainable operations independent of any subsidy or other public funding. In 2018, FFC did not receive any direct or indirect financial assistance from the government except the reduced gas tariff provided to fertilizer industry subsidy and tax credits as per applicable laws. For detailed financial results, refer to the annual financial statements section in AR 2018.
Business partners – 43.65%
Employees – 8.19%
Capital providers – 7.45%
Local Community – 0.09%
Government – 40.63%
165Annual Report 2018
creating shared value. Their feedback and input help to improve our products and decision-making process. Our stakeholders include shareholders, customers, local community, regulator and our business partners. Our engagement with stakeholders varies depending upon the stakeholder groups and its relation with FFC and includes, face-to-face, group discussions, meetings, surveys and seminars.
Our engagement helps identify possible risks and new opportunities in areas like product quality, pricing, Agri. Services and, more broadly, in terms of our reputation as a responsible manufacturer and marketer of fertilizer products. More details on our involvement with stakeholders are available on page 142-143 of this report.
By avoiding corruption, breaches of code of conduct & laws Smooth functioning of economic systems and availability of equal opportunities are crucial for social balance in the society. Corruption leads to distortions in the economic systems and creates social imbalance in the society. The impact occurs at FFC and our suppliers through our business relationship. We are strict on combating corruption in all of our business areas including in dealings with the suppliers. We have a strict code of conduct containing organizational policy on corruption and effective risk management system to identify corruption risks. Corruption risks are investigated through ongoing internal auditing activity.
Risk assessment for corruption risk covering all of our operations was carried out during the year according to our risk management system. No significant risk related to corruption or incidents of corruption were identified and reported. Therefore, no specific training on anticorruption policies and procedures was conducted during the year. The anti-corruption policies and procedures have been communicated to all directors and employees at all location of operations. The new hires receive orientation at the time of joining which includes a briefing about anti-corruption policies and procedures. Moreover, the anti-corruption policies and procedures are also communicated to all business partners at the time of engagement. We have an official slogan “Say no to corruption” in all our official correspondence reinforcing our commitment towards zero tolerance of corruption. During the year, there was no violation of laws, regulations and voluntary codes of practice in the economic or social areas and no fines or non-monetary penalties for failure to comply with legal regulations were paid. FFC attaches particular importance to fair interaction with competitors, suppliers and customers. FFC has developed formal procedure for dealing with complaints, if any, at each location of operation, where interest groups may contact the resident managers of the relevant location at any time to lodge complaints. Bodies also exist to deal with specific issues, e.g., works councils, which address workforce concerns. In the year in question, there was no complaint by interest groups or institutions at the relevant locations regarding issues of public or social concern.
By respecting our commitments Complying with applicable laws, respecting and honoring commitments are corner stones of corporate governance. We adhere to laws, regulations and code of corporate governance as applicable in Pakistan. In addition, we have international commitments in the shape of memberships and compliance with international charters. We are member of UN Global Compact which is a strategic initiative for companies which voluntarily commit to ensure that their business activities and strategies are in line with ten universally recognized principles relating to human rights, labor standards, environmental protection and fight against corruption. Being a signatory, we have underscored our comprehensive commitment to sustainable development and responsible corporate governance. FFC commits that, within its sphere of influence, it will work for protection of human rights, create working conditions which at minimum meet the legal requirements, protect the environment and combat corruption. The membership enables the company to share information and ideas with other stakeholders on sustainability efforts. We are also member of Business for Peace (B4P) group of UNGC. The vision behind B4P is to build a sustained network among participating members to carry their CSR interventions into high risk areas and work in collaboration to build peace across the globe. We also support the sustainable development goals which stimulate businesses to actively contribute to the sustainable development.
How do we create and share value as a socially responsible Company?
How We Create and Share Value
166 Sustainability Report
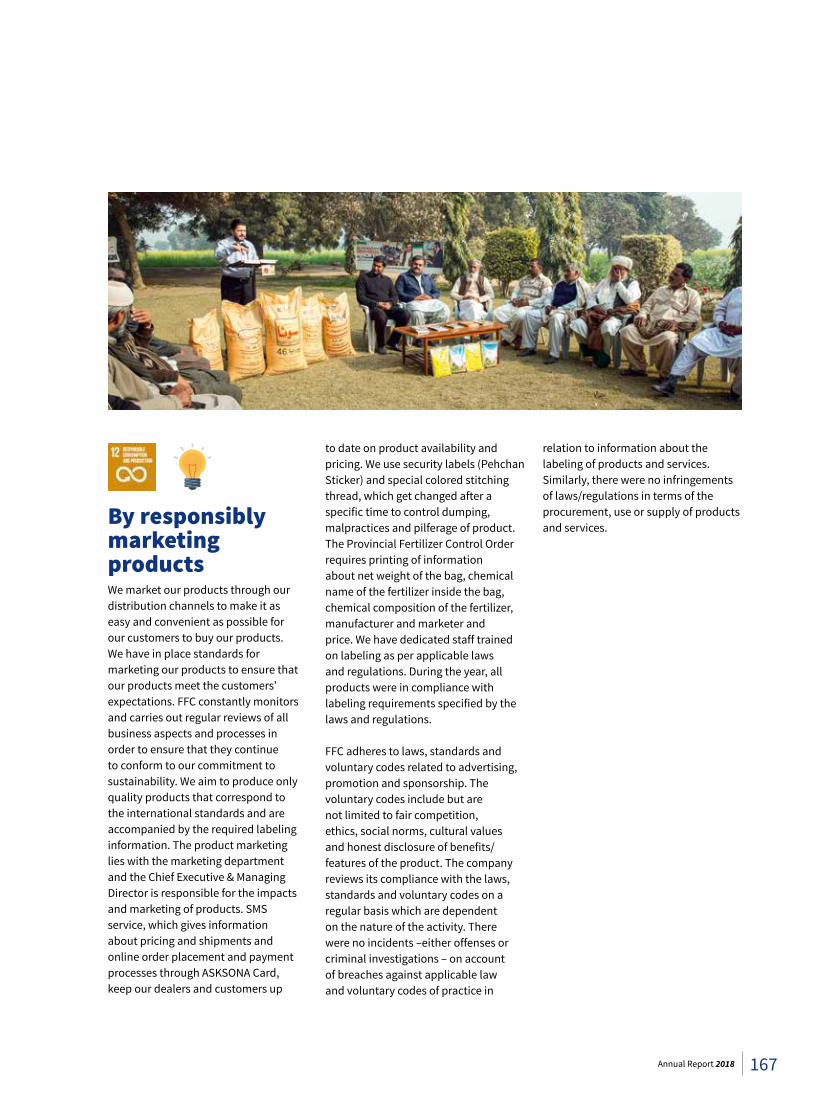
By responsibly marketing products We market our products through our distribution channels to make it as easy and convenient as possible for our customers to buy our products. We have in place standards for marketing our products to ensure that our products meet the customers’ expectations. FFC constantly monitors and carries out regular reviews of all business aspects and processes in order to ensure that they continue to conform to our commitment to sustainability. We aim to produce only quality products that correspond to the international standards and are accompanied by the required labeling information. The product marketing lies with the marketing department and the Chief Executive & Managing Director is responsible for the impacts and marketing of products. SMS service, which gives information about pricing and shipments and online order placement and payment processes through ASKSONA Card, keep our dealers and customers up
to date on product availability and pricing. We use security labels (Pehchan Sticker) and special colored stitching thread, which get changed after a specific time to control dumping, malpractices and pilferage of product. The Provincial Fertilizer Control Order requires printing of information about net weight of the bag, chemical name of the fertilizer inside the bag, chemical composition of the fertilizer, manufacturer and marketer and price. We have dedicated staff trained on labeling as per applicable laws and regulations. During the year, all products were in compliance with labeling requirements specified by the laws and regulations.
FFC adheres to laws, standards and voluntary codes related to advertising, promotion and sponsorship. The voluntary codes include but are not limited to fair competition, ethics, social norms, cultural values and honest disclosure of benefits/features of the product. The company reviews its compliance with the laws, standards and voluntary codes on a regular basis which are dependent on the nature of the activity. There were no incidents –either offenses or criminal investigations – on account of breaches against applicable law and voluntary codes of practice in
relation to information about the labeling of products and services. Similarly, there were no infringements of laws/regulations in terms of the procurement, use or supply of products and services.
167Annual Report 2018
Forward Looking Statement
The prevailing tough economic conditions coupled with depleting gas reserves and changing climate require a holistic management of capitals to preserve value creation potential and offer good returns on a long-term basis. Taking into account, the risks and opportunities offered by the external environment, we are committed to adjusting our strategies for efficient use of our available stock of capitals, reduce impairment and increase the capital stocks through our value creating activities. We defined targets for important sustainability areas in 2016 to stretch ourselves for meeting these targets to deliver positive impact on environment and society. The targets except targets for reduction in emissions and fresh water intake were achieved which show our commitment to sustainability. This year, we have revised the target with new timelines and are committed to meeting these targets to reduce our impact on the environment.
Providing returns to the stakeholders and playing a role in the sustainable development requires economic stability. Increasing input costs, decreasing gas pressure, low agriculture products prices nationally and globally, changing weather patterns are the major challenges for our growth in the near future. However, with the upcoming agriculture friendly policies, consistent supply of gas to fertilizer units and increasing prices and demand of fertilizer globally, we are confident to achieve our future targets. We are also exploring options for alternative resources for raw material and installing additional gas compressors to keep sustained gas pressure for our plants. Continuing from 2018, we are partnering with national and international partners to construct coal-to-energy project from indigenous coal reserves of Thar Coal mines under CPEC project. We are dedicated to decrease our costs, become more efficient and continue our diversification strategy for delivering healthy and sustainable returns to our shareholders and other stakeholders.
Our management of natural capitals requires better management of scarce depleting resources, efficient energy management and reduce greenhouse
gas emissions and waste. We are focused to reduce our environmental impact through continuous upgrades at our plants and adoption of cleaner technologies. This year, our environment targets have been revised to reposition ourselves for better environmental management and we are confident to achieve these goals through better management of our footprint.
Human capital is a major component in our value creation process. It integrates other capitals and enables us to deliver remarkable results through effective use of other capitals. We understand that a high quality, motivated and diversified workforce is critical for our operations. We nurture our human capital through training, productive and competitive work place, creating a culture of trust and belonging and rewarding with competitive benefits. We commit to abide by all human rights laws, regulations and voluntary commitments for better management of our human capital.
Creating and maintaining trust with stakeholders requires excellence in corporate governance. Complying with laws, regulations and internal codes and adopting leading management
practices to play an important role in the society help to become more transparent and accountable towards our stakeholders. We commit to continue following best in class governance practices, act as role model for our sector and engage with our stakeholder on issues of interest to stakeholders and company.Increased agriculture output is essential for food security, save millions of people from hunger and uplifting of millions of people connected with agriculture. To play our part, we are committed to keep expanding our farm advisory program outreach to build farmers’ capacity, introduce new farming methods and advising on balanced fertilizer use. We are confident that our activities for the betterment of the farming community will result in reducing poverty levels and bring economic stability in the farming community. Our plant site communities are partner in our growth and we aim to continue to carry out intervention in defined fields in line with our policy and support socio economic development around plant sites as well as for larger society.
168 Sustainability Report
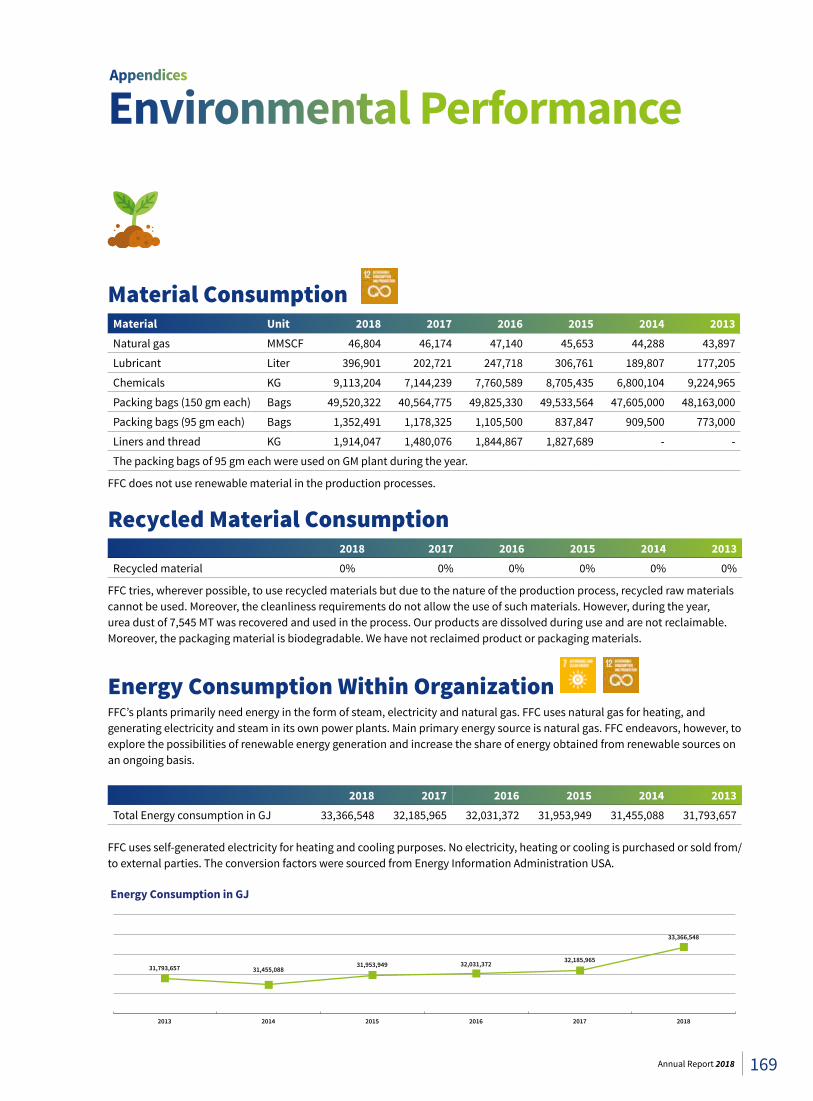
Environmental Performance
Material Consumption Material Unit 2018 2017 2016 2015 2014 2013Natural gas MMSCF 46,804 46,174 47,140 45,653 44,288 43,897
Lubricant Liter 396,901 202,721 247,718 306,761 189,807 177,205
Chemicals KG 9,113,204 7,144,239 7,760,589 8,705,435 6,800,104 9,224,965
Packing bags (150 gm each) Bags 49,520,322 40,564,775 49,825,330 49,533,564 47,605,000 48,163,000
Packing bags (95 gm each) Bags 1,352,491 1,178,325 1,105,500 837,847 909,500 773,000
Liners and thread KG 1,914,047 1,480,076 1,844,867 1,827,689 - -
The packing bags of 95 gm each were used on GM plant during the year.
FFC does not use renewable material in the production processes.
Recycled Material Consumption 2018 2017 2016 2015 2014 2013
Recycled material 0% 0% 0% 0% 0% 0%
FFC tries, wherever possible, to use recycled materials but due to the nature of the production process, recycled raw materials cannot be used. Moreover, the cleanliness requirements do not allow the use of such materials. However, during the year, urea dust of 7,545 MT was recovered and used in the process. Our products are dissolved during use and are not reclaimable. Moreover, the packaging material is biodegradable. We have not reclaimed product or packaging materials.
Energy Consumption Within Organization FFC’s plants primarily need energy in the form of steam, electricity and natural gas. FFC uses natural gas for heating, and generating electricity and steam in its own power plants. Main primary energy source is natural gas. FFC endeavors, however, to explore the possibilities of renewable energy generation and increase the share of energy obtained from renewable sources on an ongoing basis.
2018 2017 2016 2015 2014 2013Total Energy consumption in GJ 33,366,548 32,185,965 32,031,372 31,953,949 31,455,088 31,793,657
FFC uses self-generated electricity for heating and cooling purposes. No electricity, heating or cooling is purchased or sold from/to external parties. The conversion factors were sourced from Energy Information Administration USA.
2017 20182013
31,793,657 31,455,08831,953,949 32,031,372 32,185,965
33,366,548
2014 2015 2016
Energy Consumption in GJ
Appendices
169Annual Report 2018
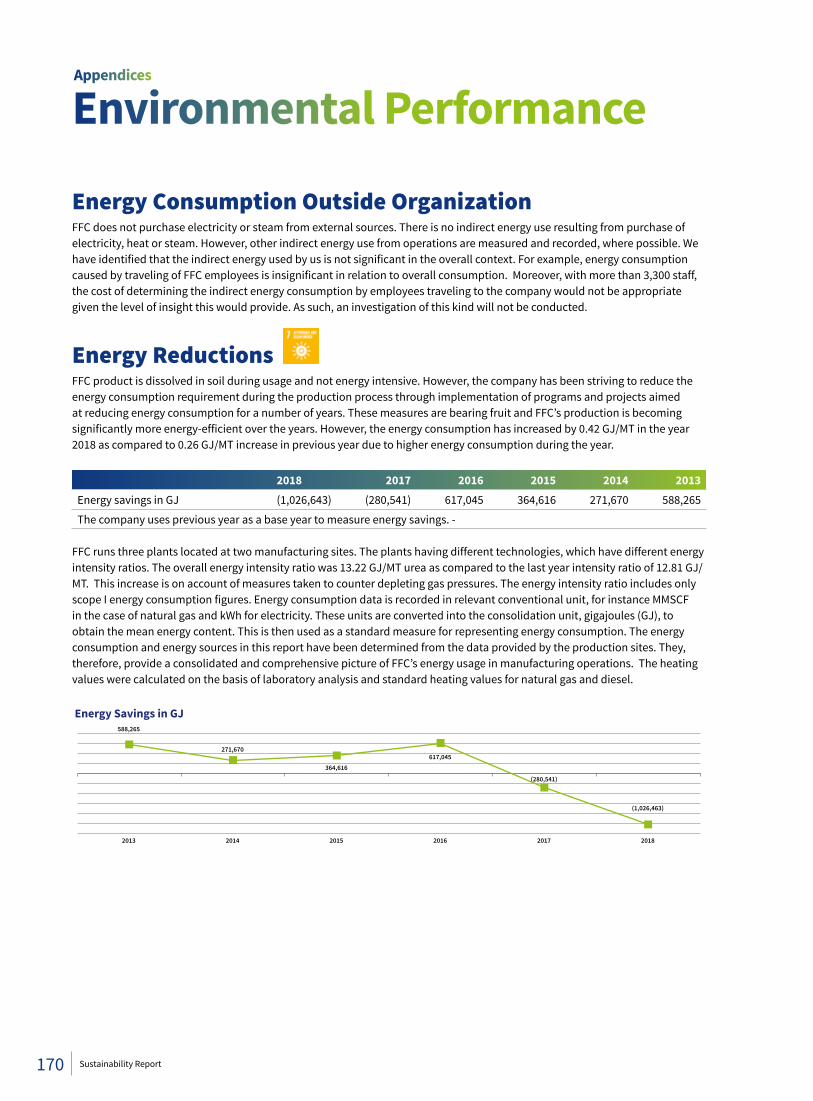
Energy Consumption Outside OrganizationFFC does not purchase electricity or steam from external sources. There is no indirect energy use resulting from purchase of electricity, heat or steam. However, other indirect energy use from operations are measured and recorded, where possible. We have identified that the indirect energy used by us is not significant in the overall context. For example, energy consumption caused by traveling of FFC employees is insignificant in relation to overall consumption. Moreover, with more than 3,300 staff, the cost of determining the indirect energy consumption by employees traveling to the company would not be appropriate given the level of insight this would provide. As such, an investigation of this kind will not be conducted.
Energy Reductions FFC product is dissolved in soil during usage and not energy intensive. However, the company has been striving to reduce the energy consumption requirement during the production process through implementation of programs and projects aimed at reducing energy consumption for a number of years. These measures are bearing fruit and FFC’s production is becoming significantly more energy-efficient over the years. However, the energy consumption has increased by 0.42 GJ/MT in the year 2018 as compared to 0.26 GJ/MT increase in previous year due to higher energy consumption during the year.
2018 2017 2016 2015 2014 2013Energy savings in GJ (1,026,643) (280,541) 617,045 364,616 271,670 588,265
The company uses previous year as a base year to measure energy savings. -
FFC runs three plants located at two manufacturing sites. The plants having different technologies, which have different energy intensity ratios. The overall energy intensity ratio was 13.22 GJ/MT urea as compared to the last year intensity ratio of 12.81 GJ/MT. This increase is on account of measures taken to counter depleting gas pressures. The energy intensity ratio includes only scope I energy consumption figures. Energy consumption data is recorded in relevant conventional unit, for instance MMSCF in the case of natural gas and kWh for electricity. These units are converted into the consolidation unit, gigajoules (GJ), to obtain the mean energy content. This is then used as a standard measure for representing energy consumption. The energy consumption and energy sources in this report have been determined from the data provided by the production sites. They, therefore, provide a consolidated and comprehensive picture of FFC’s energy usage in manufacturing operations. The heating values were calculated on the basis of laboratory analysis and standard heating values for natural gas and diesel.
2017 20182013
588,265
271,670
364,616
617,045
(280,541)
(1,026,463)
2014 2015 2016
Energy Savings in GJ
Environmental Performance Appendices
170 Sustainability Report
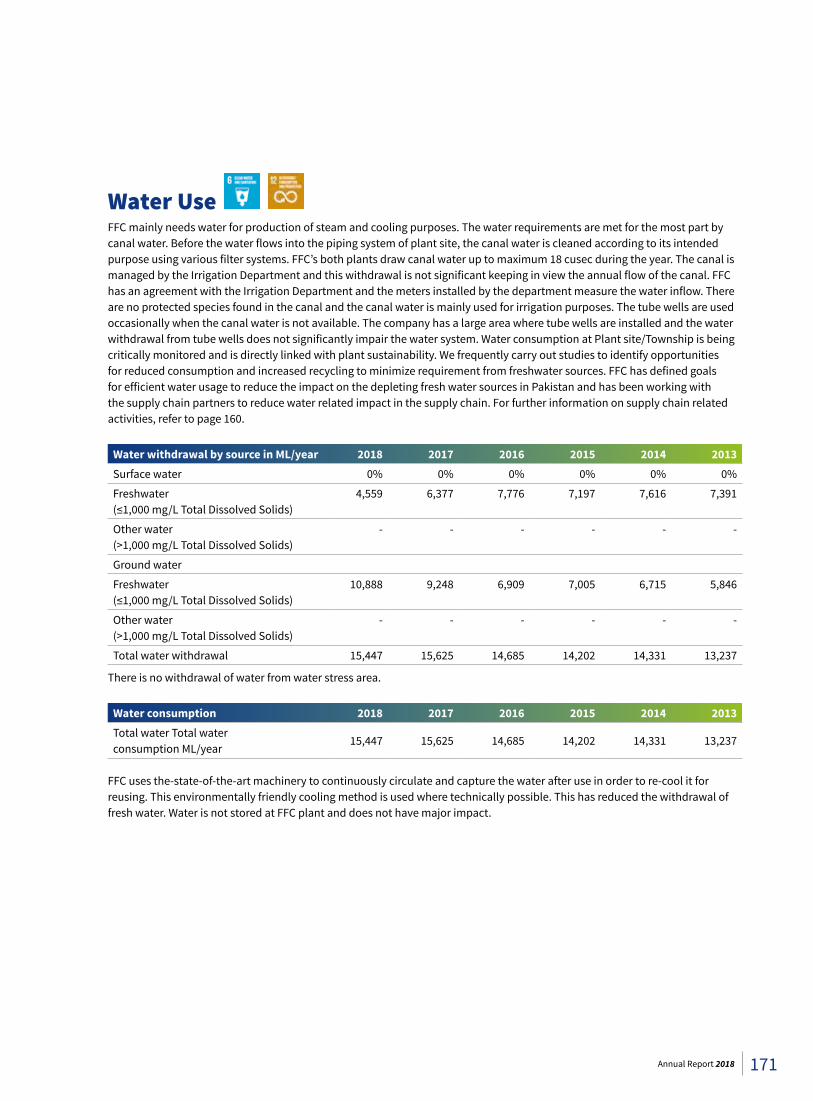
Water Use FFC mainly needs water for production of steam and cooling purposes. The water requirements are met for the most part by canal water. Before the water flows into the piping system of plant site, the canal water is cleaned according to its intended purpose using various filter systems. FFC’s both plants draw canal water up to maximum 18 cusec during the year. The canal is managed by the Irrigation Department and this withdrawal is not significant keeping in view the annual flow of the canal. FFC has an agreement with the Irrigation Department and the meters installed by the department measure the water inflow. There are no protected species found in the canal and the canal water is mainly used for irrigation purposes. The tube wells are used occasionally when the canal water is not available. The company has a large area where tube wells are installed and the water withdrawal from tube wells does not significantly impair the water system. Water consumption at Plant site/Township is being critically monitored and is directly linked with plant sustainability. We frequently carry out studies to identify opportunities for reduced consumption and increased recycling to minimize requirement from freshwater sources. FFC has defined goals for efficient water usage to reduce the impact on the depleting fresh water sources in Pakistan and has been working with the supply chain partners to reduce water related impact in the supply chain. For further information on supply chain related activities, refer to page 160.
Water withdrawal by source in ML/year 2018 2017 2016 2015 2014 2013Surface water 0% 0% 0% 0% 0% 0%
Freshwater (≤1,000 mg/L Total Dissolved Solids)
4,559 6,377 7,776 7,197 7,616 7,391
Other water (>1,000 mg/L Total Dissolved Solids)
- - - - - -
Ground water
Freshwater (≤1,000 mg/L Total Dissolved Solids)
10,888 9,248 6,909 7,005 6,715 5,846
Other water (>1,000 mg/L Total Dissolved Solids)
- - - - - -
Total water withdrawal 15,447 15,625 14,685 14,202 14,331 13,237
There is no withdrawal of water from water stress area.
Water consumption 2018 2017 2016 2015 2014 2013Total water Total water consumption ML/year
15,447 15,625 14,685 14,202 14,331 13,237
FFC uses the-state-of-the-art machinery to continuously circulate and capture the water after use in order to re-cool it for reusing. This environmentally friendly cooling method is used where technically possible. This has reduced the withdrawal of fresh water. Water is not stored at FFC plant and does not have major impact.
171Annual Report 2018
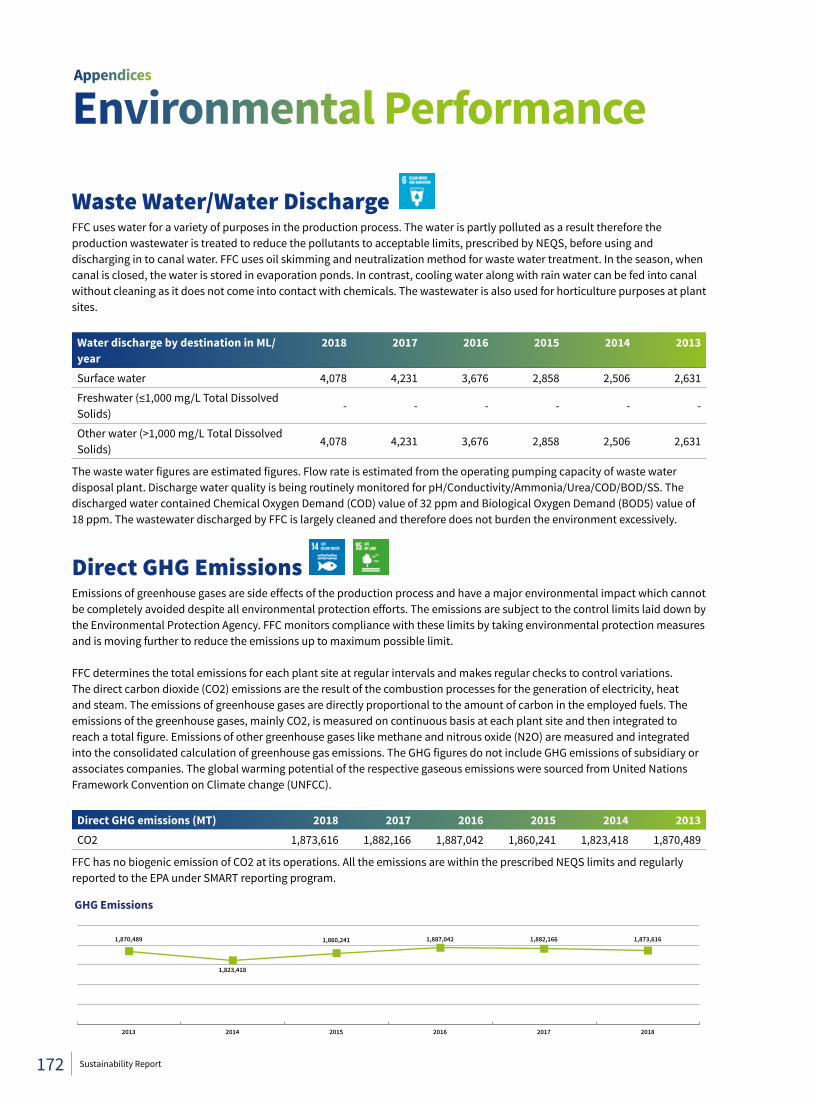
Waste Water/Water Discharge FFC uses water for a variety of purposes in the production process. The water is partly polluted as a result therefore the production wastewater is treated to reduce the pollutants to acceptable limits, prescribed by NEQS, before using and discharging in to canal water. FFC uses oil skimming and neutralization method for waste water treatment. In the season, when canal is closed, the water is stored in evaporation ponds. In contrast, cooling water along with rain water can be fed into canal without cleaning as it does not come into contact with chemicals. The wastewater is also used for horticulture purposes at plant sites.
Water discharge by destination in ML/year
2018 2017 2016 2015 2014 2013
Surface water 4,078 4,231 3,676 2,858 2,506 2,631
Freshwater (≤1,000 mg/L Total Dissolved Solids)
- - - - - -
Other water (>1,000 mg/L Total Dissolved Solids)
4,078 4,231 3,676 2,858 2,506 2,631
The waste water figures are estimated figures. Flow rate is estimated from the operating pumping capacity of waste water disposal plant. Discharge water quality is being routinely monitored for pH/Conductivity/Ammonia/Urea/COD/BOD/SS. The discharged water contained Chemical Oxygen Demand (COD) value of 32 ppm and Biological Oxygen Demand (BOD5) value of 18 ppm. The wastewater discharged by FFC is largely cleaned and therefore does not burden the environment excessively.
Direct GHG Emissions Emissions of greenhouse gases are side effects of the production process and have a major environmental impact which cannot be completely avoided despite all environmental protection efforts. The emissions are subject to the control limits laid down by the Environmental Protection Agency. FFC monitors compliance with these limits by taking environmental protection measures and is moving further to reduce the emissions up to maximum possible limit.
FFC determines the total emissions for each plant site at regular intervals and makes regular checks to control variations. The direct carbon dioxide (CO2) emissions are the result of the combustion processes for the generation of electricity, heat and steam. The emissions of greenhouse gases are directly proportional to the amount of carbon in the employed fuels. The emissions of the greenhouse gases, mainly CO2, is measured on continuous basis at each plant site and then integrated to reach a total figure. Emissions of other greenhouse gases like methane and nitrous oxide (N2O) are measured and integrated into the consolidated calculation of greenhouse gas emissions. The GHG figures do not include GHG emissions of subsidiary or associates companies. The global warming potential of the respective gaseous emissions were sourced from United Nations Framework Convention on Climate change (UNFCC).
Direct GHG emissions (MT) 2018 2017 2016 2015 2014 2013CO2 1,873,616 1,882,166 1,887,042 1,860,241 1,823,418 1,870,489
FFC has no biogenic emission of CO2 at its operations. All the emissions are within the prescribed NEQS limits and regularly reported to the EPA under SMART reporting program.
2017 20182013
1,870,489
1,823,418
1,860,241 1,887,042 1,882,166 1,873,616
2014 2015 2016
GHG Emissions
Environmental Performance Appendices
172 Sustainability Report
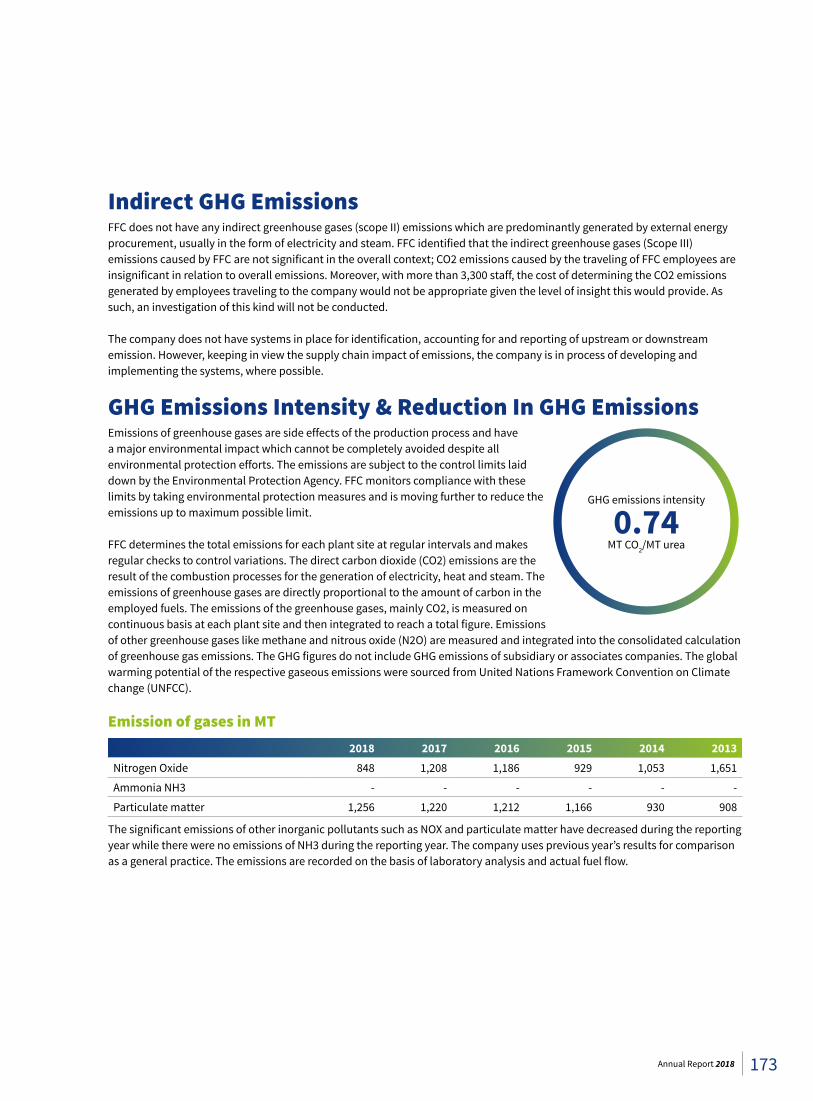
Indirect GHG EmissionsFFC does not have any indirect greenhouse gases (scope II) emissions which are predominantly generated by external energy procurement, usually in the form of electricity and steam. FFC identified that the indirect greenhouse gases (Scope III) emissions caused by FFC are not significant in the overall context; CO2 emissions caused by the traveling of FFC employees are insignificant in relation to overall emissions. Moreover, with more than 3,300 staff, the cost of determining the CO2 emissions generated by employees traveling to the company would not be appropriate given the level of insight this would provide. As such, an investigation of this kind will not be conducted.
The company does not have systems in place for identification, accounting for and reporting of upstream or downstream emission. However, keeping in view the supply chain impact of emissions, the company is in process of developing and implementing the systems, where possible.
GHG Emissions Intensity & Reduction In GHG Emissions Emissions of greenhouse gases are side effects of the production process and have a major environmental impact which cannot be completely avoided despite all environmental protection efforts. The emissions are subject to the control limits laid down by the Environmental Protection Agency. FFC monitors compliance with these limits by taking environmental protection measures and is moving further to reduce the emissions up to maximum possible limit.
FFC determines the total emissions for each plant site at regular intervals and makes regular checks to control variations. The direct carbon dioxide (CO2) emissions are the result of the combustion processes for the generation of electricity, heat and steam. The emissions of greenhouse gases are directly proportional to the amount of carbon in the employed fuels. The emissions of the greenhouse gases, mainly CO2, is measured on continuous basis at each plant site and then integrated to reach a total figure. Emissions of other greenhouse gases like methane and nitrous oxide (N2O) are measured and integrated into the consolidated calculation of greenhouse gas emissions. The GHG figures do not include GHG emissions of subsidiary or associates companies. The global warming potential of the respective gaseous emissions were sourced from United Nations Framework Convention on Climate change (UNFCC).
Emission of gases in MT 2018 2017 2016 2015 2014 2013
Nitrogen Oxide 848 1,208 1,186 929 1,053 1,651
Ammonia NH3 - - - - - -
Particulate matter 1,256 1,220 1,212 1,166 930 908
The significant emissions of other inorganic pollutants such as NOX and particulate matter have decreased during the reporting year while there were no emissions of NH3 during the reporting year. The company uses previous year’s results for comparison as a general practice. The emissions are recorded on the basis of laboratory analysis and actual fuel flow.
GHG emissions intensity
0.74MT CO2/MT urea
173Annual Report 2018
Effluents and Waste FFC focuses on prevention of waste as a priority over recovery or disposal. However, unavoidable production waste is recycled or disposed of properly. FFC procedures require that each type of waste is recorded and precisely analyzed and described. Waste is properly documented in internal records, including where the waste originated, which quantities have arisen during the year, the classification of the waste as hazardous/non-hazardous and the possible disposal method. Waste is accumulated and dumped at the plant site and when the waste quantity reaches at a significant level, it is disposed of according to best available option.
Unit 2018 2017 2016 2015 2014 2013Recycling MT - - - - - -
Landfill Liter 396,901 202,721 247,718 306,761 189,807 177,205
CaCO3 and waste lime stone MT 5,555 6,392 2,344 5,603 4,621 4,150
Incineration (mass burn) Bags 49,520,322 40,564,775 49,825,330 49,533,564 47,605,000 48,163,000
Papers, clothes, etc MT 470 134.23 59.11 77.03 592 593
On-site storage KG 1,914,047 1,480,076 1,844,867 1,827,689 - -
Waste water m3 1,881,926 2,045,204 1,516,550 1,526,000 1,409,260 350,000
Other
Damaged urea bags, iron scrap etc.
MT 374 262.75 481 715 309 511
The urea dust solution is excluded from the recycling figure after deliberation that recovery is part of normal manufacturing process. However, the dust solution sold to external parties is reported under others.
The first priority is to recycle or treat the waste and only unsuitable waste is disposed of in landfills, which is then sold to a carefully selected supplier. The company carried out incineration under controlled conditions and specifically required high temperatures for incineration. During the year, 920 Ton hazardous waste was sold to government approved contractor for onward disposal as per approved method. FFC does not transport waste to cross borders. FFC strives to prevent spills at its plant sites as spills not only lead to waste generation but incur further costs in the shape of cleaning measures. During the year, no spill occurred. FFC treats waste handling very carefully and no incidence has been recorded where the waste was not disposed of properly, leading to adverse impact on the biodiversity and habitats around plant sites.
Environmental Performance Appendices
174 Sustainability Report
Independent External ReviewBSD Consulting performed an independent review of the Fauji Fertilizer Company Limited (FFC) Sustainability Report 2018, which was prepared in accordance with Global Reporting Initiative’s (GRI) Standards´ Comprehensive option and was also guided by the Integrated Reporting (<IR>) framework. The objective of the critical review is to provide FFC’s stakeholders with an independent opinion about the quality of the report and the adherence to the Accountability Principles of Inclusivity, Materiality and Responsiveness, as well as an evaluation against principles of the Integrated Reporting (<IR>) framework and the associated capital concepts.
IndependenceWe work independently and ensure that none of the BSD staff members maintained or maintains business ties with FFC.
Our QualificationBSD is a consulting firm specialized in sustainability. The review process was conducted by professionals with long-standing experience in independent assurance and sustainability reporting considering the provisions of ISAE3000.
ResponsibilitiesFFC has prepared the Sustainability Report and is responsible for all its content. BSD was responsible for the independent review of the report.
Scope and limitsThe scope of our work covers all information included in the FFC 2018 Sustainability Report, referring to the period from January 1st, 2018, through December 31st, 2018. The verification of financial figures and sustainability performance data was not object of BSD´s work and the review of the Annual Report, which integrates the
Sustainability Report 2018, was not in the scope of the assessment.
MethodologyThe methodology applied was a desk review of the final draft report, and the following approach and procedures were developed during the review process:
• Critical review of the FFC Sustainability Report 2018 and respective Content Index to check consistency and adherence to GRI´s Universal and Topic-Specific Standards.
• Evaluation of report’s adherence to the in accordance: Comprehensive option
• Analysis against Integrated Reporting principles and the concept of the six capitals
• Elaboration of an adjustment report
• Final review of the report content
• Analysis of the report content against Accountability’s Principles of Inclusivity, Materiality and Responsiveness
• Elaboration of the Independent Review Statement.
GRI Standards in accordance option FFC declares the report to be in accordance with the GRI Standard: Comprehensive option. BSD evaluated the application of the GRI Standards Universal and Topic-Specific Standards. Based on the analysis, recommendations to complete the content or to adjust the disclosure level in the Content Index have been made. Furthermore, the company already used the revised Standards 303 (Water) and 403 (Health and Safety), released in 2018 and only mandatory in 2021. The company has integrated our recommendations and we can confirm
that the report is attending the above mentioned in accordance option, while still offering some areas of continuous improvement.
Analysis against <IR> framework Principles and CapitalsBSD has evaluated the application of IIRC Guiding Principles, Content Elements and Capitals in FFC’s report. For this report, the main considerations of this analysis were the following:
• The report is addressing in different sections the strategy and the future challenges, which include climate change and upcoming water stress. The Forward Looking Statement is addressing these future challenges and how the company is prepared to address these.
• Although the content has been linked with SDGs and commitments such as the Global Compact, there remains lack to connect the different topics and their interrelation with the performance results in the different capitals. One good example is the information that training of farmers has improved significantly the yields, but similar connections may be made in future reports.
• With regard to risks and opportunities, the report is mainly focused on environmental and H&S-risk and opportunities. We recommend expanding the analysis in the next reports, and also including new opportunities that the company can address as agent of food security and local development.
• The report describes in an overall manner how resource allocation takes place. There is still room to
Appendices
175Annual Report 2018
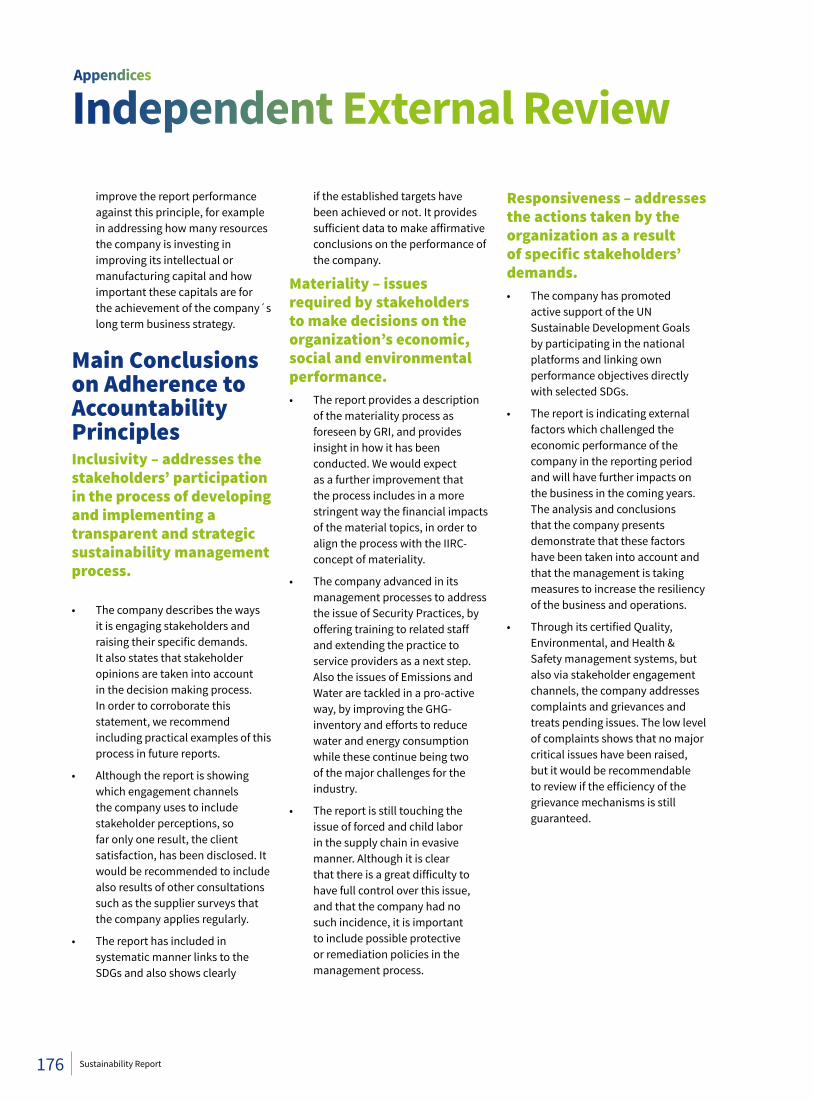
improve the report performance against this principle, for example in addressing how many resources the company is investing in improving its intellectual or manufacturing capital and how important these capitals are for the achievement of the company´s long term business strategy.
Main Conclusions on Adherence to Accountability Principles Inclusivity – addresses the stakeholders’ participation in the process of developing and implementing a transparent and strategic sustainability management process.
• The company describes the ways it is engaging stakeholders and raising their specific demands. It also states that stakeholder opinions are taken into account in the decision making process. In order to corroborate this statement, we recommend including practical examples of this process in future reports.
• Although the report is showing which engagement channels the company uses to include stakeholder perceptions, so far only one result, the client satisfaction, has been disclosed. It would be recommended to include also results of other consultations such as the supplier surveys that the company applies regularly.
• The report has included in systematic manner links to the SDGs and also shows clearly
if the established targets have been achieved or not. It provides sufficient data to make affirmative conclusions on the performance of the company.
Materiality – issues required by stakeholders to make decisions on the organization’s economic, social and environmental performance.• The report provides a description
of the materiality process as foreseen by GRI, and provides insight in how it has been conducted. We would expect as a further improvement that the process includes in a more stringent way the financial impacts of the material topics, in order to align the process with the IIRC-concept of materiality.
• The company advanced in its management processes to address the issue of Security Practices, by offering training to related staff and extending the practice to service providers as a next step. Also the issues of Emissions and Water are tackled in a pro-active way, by improving the GHG-inventory and efforts to reduce water and energy consumption while these continue being two of the major challenges for the industry.
• The report is still touching the issue of forced and child labor in the supply chain in evasive manner. Although it is clear that there is a great difficulty to have full control over this issue, and that the company had no such incidence, it is important to include possible protective or remediation policies in the management process.
Responsiveness – addresses the actions taken by the organization as a result of specific stakeholders’ demands.• The company has promoted
active support of the UN Sustainable Development Goals by participating in the national platforms and linking own performance objectives directly with selected SDGs.
• The report is indicating external factors which challenged the economic performance of the company in the reporting period and will have further impacts on the business in the coming years. The analysis and conclusions that the company presents demonstrate that these factors have been taken into account and that the management is taking measures to increase the resiliency of the business and operations.
• Through its certified Quality, Environmental, and Health & Safety management systems, but also via stakeholder engagement channels, the company addresses complaints and grievances and treats pending issues. The low level of complaints shows that no major critical issues have been raised, but it would be recommendable to review if the efficiency of the grievance mechanisms is still guaranteed.
Independent External ReviewAppendices
176 Sustainability Report
Final ConsiderationsBased on our assessment, we can confirm that the company has applied the GRI Standards and IIRC-Framework provisions. Compliance with GRI Standards has been disclosed in more detail in the attached GRI Content Index which provides an overview of which standards have been fully or partially responded. In terms of the principles of the IR-Framework, FFC has achieved a good stage of compliance by incorporating the concept of value creation, delivering a clear business model and an input/output-analysis based on multiple capitals. For the next report, we consider it important to strengthen the report in terms of connectivity of the information, in order to demonstrate how sustainability efforts can positively impact results regarding the financial capital of the company and add value beyond the social and natural capital.
São Paulo, January 16th, 2019 Islamabad, January 16th, 2019
Beat Grüninger, Nadeem Safdar Managing Director, BSD Consulting (Brazil) Managing Partner, Nadeem Safdar & Co., Chartered Accountants, Pakistan ICAP Membership No. 2396
177Annual Report 2018
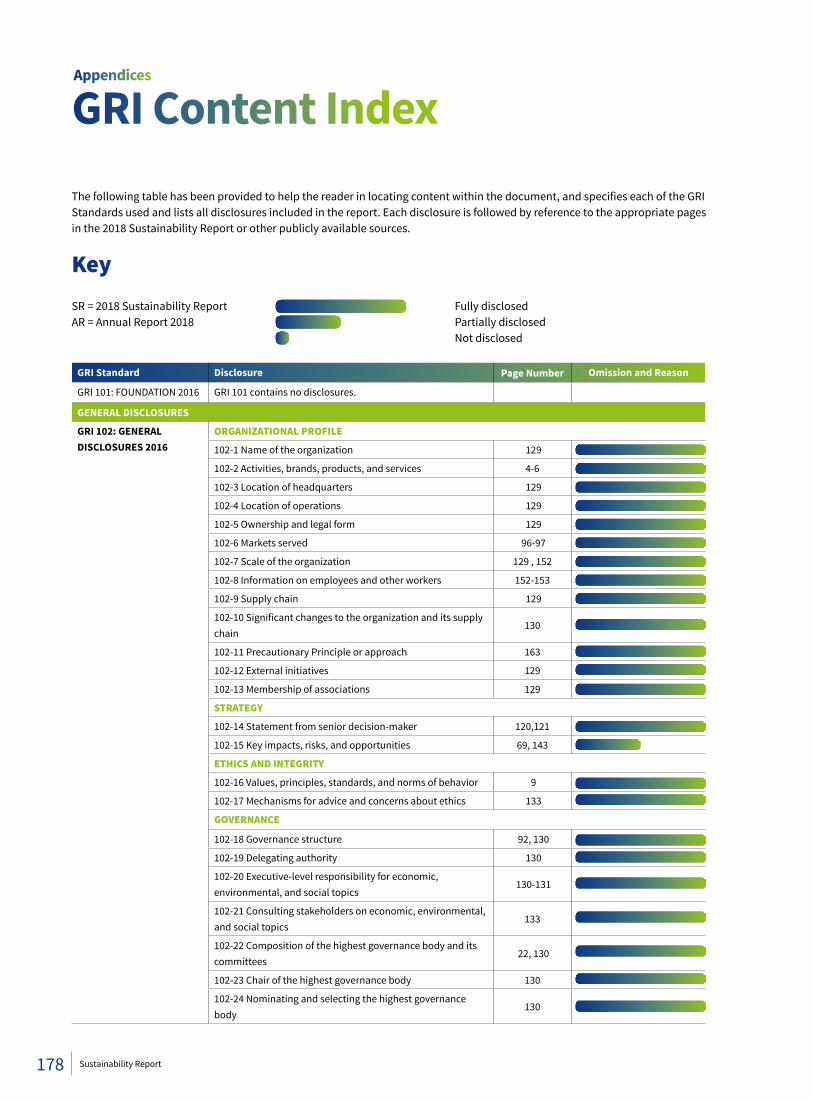
GRI Content IndexThe following table has been provided to help the reader in locating content within the document, and specifies each of the GRI Standards used and lists all disclosures included in the report. Each disclosure is followed by reference to the appropriate pages in the 2018 Sustainability Report or other publicly available sources.
KeySR = 2018 Sustainability Report Fully disclosedAR = Annual Report 2018 Partially disclosed Not disclosed
GRI Standard Disclosure Page Number Omission and Reason
GRI 101: FOUNDATION 2016 GRI 101 contains no disclosures.
GENERAL DISCLOSURES
GRI 102: GENERAL DISCLOSURES 2016
ORGANIZATIONAL PROFILE
102-1 Name of the organization 129
102-2 Activities, brands, products, and services 4-6
102-3 Location of headquarters 129
102-4 Location of operations 129
102-5 Ownership and legal form 129
102-6 Markets served 96-97
102-7 Scale of the organization 129 , 152
102-8 Information on employees and other workers 152-153
102-9 Supply chain 129
102-10 Significant changes to the organization and its supply chain
130
102-11 Precautionary Principle or approach 163
102-12 External initiatives 129
102-13 Membership of associations 129
STRATEGY
102-14 Statement from senior decision-maker 120,121
102-15 Key impacts, risks, and opportunities 69, 143
ETHICS AND INTEGRITY
102-16 Values, principles, standards, and norms of behavior 9
102-17 Mechanisms for advice and concerns about ethics 133
GOVERNANCE
102-18 Governance structure 92, 130
102-19 Delegating authority 130
102-20 Executive-level responsibility for economic, environmental, and social topics
130-131
102-21 Consulting stakeholders on economic, environmental, and social topics
133
102-22 Composition of the highest governance body and its committees
22, 130
102-23 Chair of the highest governance body 130
102-24 Nominating and selecting the highest governance body
130
Appendices
178 Sustainability Report
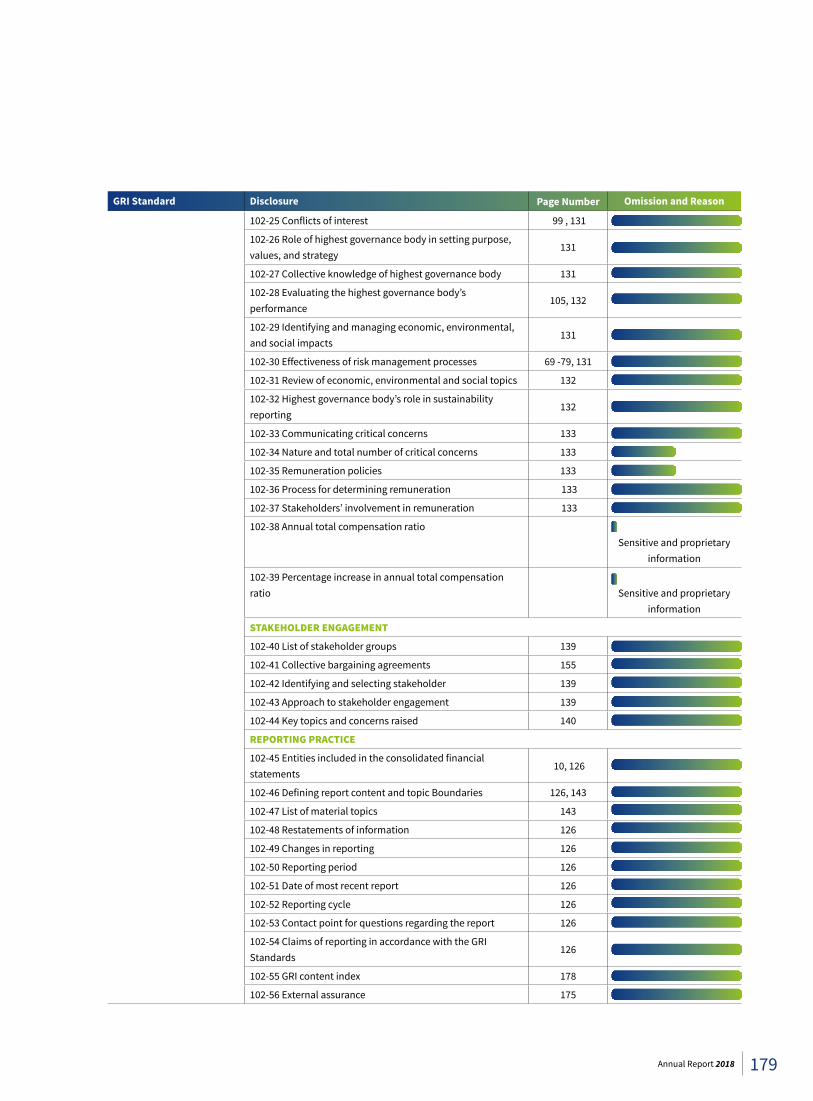
GRI Standard Disclosure Page Number Omission and Reason
102-25 Conflicts of interest 99 , 131
102-26 Role of highest governance body in setting purpose, values, and strategy
131
102-27 Collective knowledge of highest governance body 131
102-28 Evaluating the highest governance body’s performance
105, 132
102-29 Identifying and managing economic, environmental, and social impacts
131
102-30 Effectiveness of risk management processes 69 -79, 131
102-31 Review of economic, environmental and social topics 132
102-32 Highest governance body’s role in sustainability reporting
132
102-33 Communicating critical concerns 133
102-34 Nature and total number of critical concerns 133
102-35 Remuneration policies 133
102-36 Process for determining remuneration 133
102-37 Stakeholders’ involvement in remuneration 133
102-38 Annual total compensation ratioSensitive and proprietary
information
102-39 Percentage increase in annual total compensation ratio Sensitive and proprietary
information
STAKEHOLDER ENGAGEMENT
102-40 List of stakeholder groups 139
102-41 Collective bargaining agreements 155
102-42 Identifying and selecting stakeholder 139
102-43 Approach to stakeholder engagement 139
102-44 Key topics and concerns raised 140
REPORTING PRACTICE
102-45 Entities included in the consolidated financial statements
10, 126
102-46 Defining report content and topic Boundaries 126, 143
102-47 List of material topics 143
102-48 Restatements of information 126
102-49 Changes in reporting 126
102-50 Reporting period 126
102-51 Date of most recent report 126
102-52 Reporting cycle 126
102-53 Contact point for questions regarding the report 126
102-54 Claims of reporting in accordance with the GRI Standards
126
102-55 GRI content index 178
102-56 External assurance 175
179Annual Report 2018
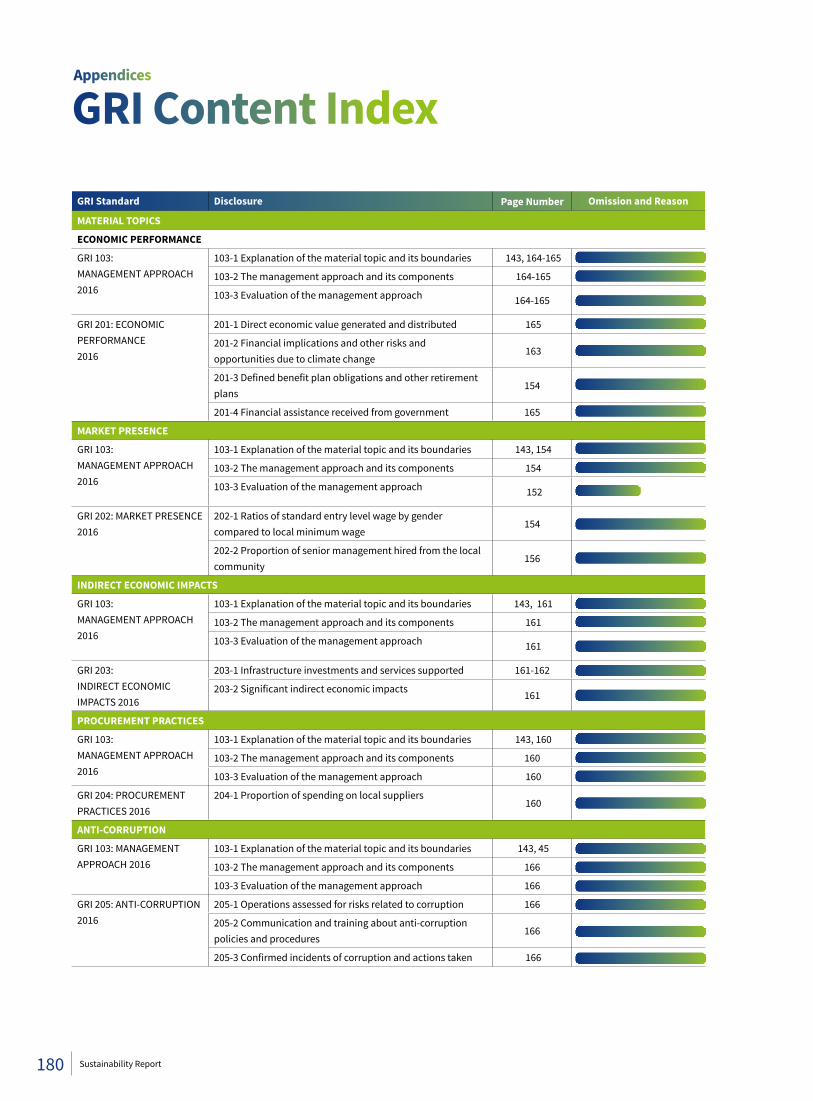
GRI Standard Disclosure Page Number Omission and Reason
MATERIAL TOPICS
ECONOMIC PERFORMANCE
GRI 103:MANAGEMENT APPROACH 2016
103-1 Explanation of the material topic and its boundaries 143, 164-165
103-2 The management approach and its components 164-165
103-3 Evaluation of the management approach 164-165
GRI 201: ECONOMIC PERFORMANCE2016
201-1 Direct economic value generated and distributed 165
201-2 Financial implications and other risks and opportunities due to climate change
163
201-3 Defined benefit plan obligations and other retirement plans
154
201-4 Financial assistance received from government 165
MARKET PRESENCE
GRI 103:MANAGEMENT APPROACH 2016
103-1 Explanation of the material topic and its boundaries 143, 154
103-2 The management approach and its components 154
103-3 Evaluation of the management approach 152
GRI 202: MARKET PRESENCE 2016
202-1 Ratios of standard entry level wage by gender compared to local minimum wage
154
202-2 Proportion of senior management hired from the local community
156
INDIRECT ECONOMIC IMPACTS
GRI 103:MANAGEMENT APPROACH 2016
103-1 Explanation of the material topic and its boundaries 143, 161
103-2 The management approach and its components 161
103-3 Evaluation of the management approach 161
GRI 203:INDIRECT ECONOMICIMPACTS 2016
203-1 Infrastructure investments and services supported 161-162
203-2 Significant indirect economic impacts 161
PROCUREMENT PRACTICES
GRI 103:MANAGEMENT APPROACH 2016
103-1 Explanation of the material topic and its boundaries 143, 160
103-2 The management approach and its components 160
103-3 Evaluation of the management approach 160
GRI 204: PROCUREMENT PRACTICES 2016
204-1 Proportion of spending on local suppliers 160
ANTI-CORRUPTION
GRI 103: MANAGEMENT APPROACH 2016
103-1 Explanation of the material topic and its boundaries 143, 45
103-2 The management approach and its components 166
103-3 Evaluation of the management approach 166
GRI 205: ANTI-CORRUPTION 2016
205-1 Operations assessed for risks related to corruption 166
205-2 Communication and training about anti-corruption policies and procedures
166
205-3 Confirmed incidents of corruption and actions taken 166
GRI Content IndexAppendices
180 Sustainability Report
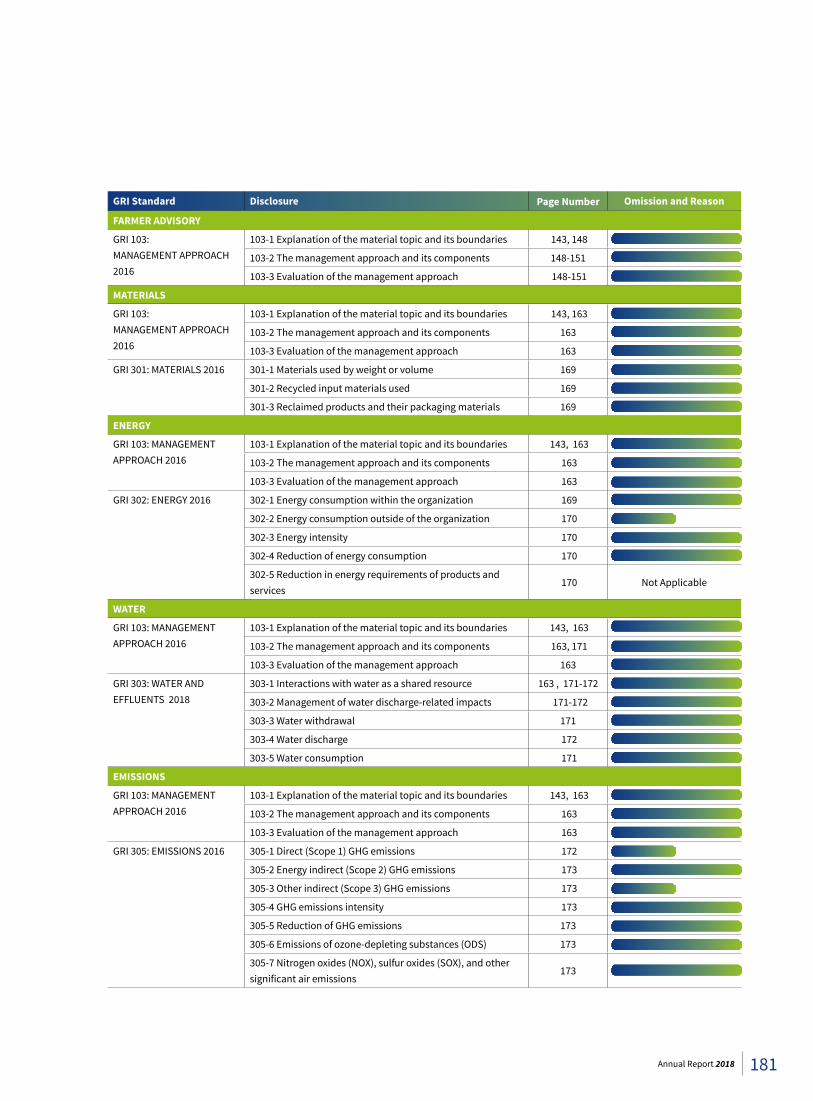
GRI Standard Disclosure Page Number Omission and Reason
FARMER ADVISORY
GRI 103:MANAGEMENT APPROACH 2016
103-1 Explanation of the material topic and its boundaries 143, 148
103-2 The management approach and its components 148-151
103-3 Evaluation of the management approach 148-151
MATERIALS
GRI 103:MANAGEMENT APPROACH 2016
103-1 Explanation of the material topic and its boundaries 143, 163
103-2 The management approach and its components 163
103-3 Evaluation of the management approach 163
GRI 301: MATERIALS 2016 301-1 Materials used by weight or volume 169
301-2 Recycled input materials used 169
301-3 Reclaimed products and their packaging materials 169
ENERGY
GRI 103: MANAGEMENT APPROACH 2016
103-1 Explanation of the material topic and its boundaries 143, 163
103-2 The management approach and its components 163
103-3 Evaluation of the management approach 163
GRI 302: ENERGY 2016 302-1 Energy consumption within the organization 169
302-2 Energy consumption outside of the organization 170
302-3 Energy intensity 170
302-4 Reduction of energy consumption 170
302-5 Reduction in energy requirements of products and services
170 Not Applicable
WATER
GRI 103: MANAGEMENT APPROACH 2016
103-1 Explanation of the material topic and its boundaries 143, 163
103-2 The management approach and its components 163, 171
103-3 Evaluation of the management approach 163
GRI 303: WATER AND EFFLUENTS 2018
303-1 Interactions with water as a shared resource 163 , 171-172
303-2 Management of water discharge-related impacts 171-172
303-3 Water withdrawal 171
303-4 Water discharge 172
303-5 Water consumption 171
EMISSIONS
GRI 103: MANAGEMENT APPROACH 2016
103-1 Explanation of the material topic and its boundaries 143, 163
103-2 The management approach and its components 163
103-3 Evaluation of the management approach 163
GRI 305: EMISSIONS 2016 305-1 Direct (Scope 1) GHG emissions 172
305-2 Energy indirect (Scope 2) GHG emissions 173
305-3 Other indirect (Scope 3) GHG emissions 173
305-4 GHG emissions intensity 173
305-5 Reduction of GHG emissions 173
305-6 Emissions of ozone-depleting substances (ODS) 173
305-7 Nitrogen oxides (NOX), sulfur oxides (SOX), and other significant air emissions
173
181Annual Report 2018
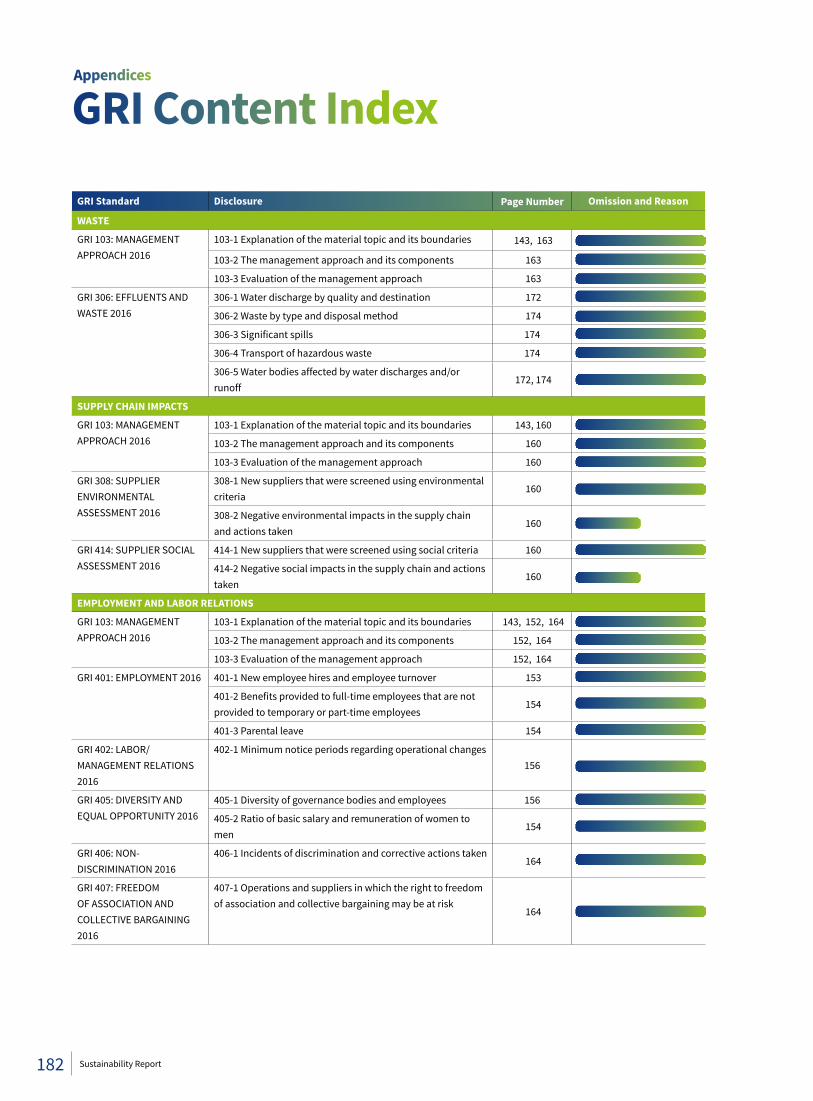
GRI Standard Disclosure Page Number Omission and Reason
WASTE
GRI 103: MANAGEMENT APPROACH 2016
103-1 Explanation of the material topic and its boundaries 143, 163
103-2 The management approach and its components 163
103-3 Evaluation of the management approach 163
GRI 306: EFFLUENTS AND WASTE 2016
306-1 Water discharge by quality and destination 172
306-2 Waste by type and disposal method 174
306-3 Significant spills 174
306-4 Transport of hazardous waste 174
306-5 Water bodies affected by water discharges and/or runoff
172, 174
SUPPLY CHAIN IMPACTS
GRI 103: MANAGEMENT APPROACH 2016
103-1 Explanation of the material topic and its boundaries 143, 160
103-2 The management approach and its components 160
103-3 Evaluation of the management approach 160
GRI 308: SUPPLIER ENVIRONMENTAL ASSESSMENT 2016
308-1 New suppliers that were screened using environmental criteria
160
308-2 Negative environmental impacts in the supply chain and actions taken
160
GRI 414: SUPPLIER SOCIAL ASSESSMENT 2016
414-1 New suppliers that were screened using social criteria 160
414-2 Negative social impacts in the supply chain and actions taken
160
EMPLOYMENT AND LABOR RELATIONS
GRI 103: MANAGEMENT APPROACH 2016
103-1 Explanation of the material topic and its boundaries 143, 152, 164
103-2 The management approach and its components 152, 164
103-3 Evaluation of the management approach 152, 164
GRI 401: EMPLOYMENT 2016 401-1 New employee hires and employee turnover 153
401-2 Benefits provided to full-time employees that are not provided to temporary or part-time employees
154
401-3 Parental leave 154
GRI 402: LABOR/MANAGEMENT RELATIONS 2016
402-1 Minimum notice periods regarding operational changes156
GRI 405: DIVERSITY AND EQUAL OPPORTUNITY 2016
405-1 Diversity of governance bodies and employees 156
405-2 Ratio of basic salary and remuneration of women to men
154
GRI 406: NON-DISCRIMINATION 2016
406-1 Incidents of discrimination and corrective actions taken 164
GRI 407: FREEDOM OF ASSOCIATION AND COLLECTIVE BARGAINING 2016
407-1 Operations and suppliers in which the right to freedom of association and collective bargaining may be at risk
164
GRI Content IndexAppendices
182 Sustainability Report
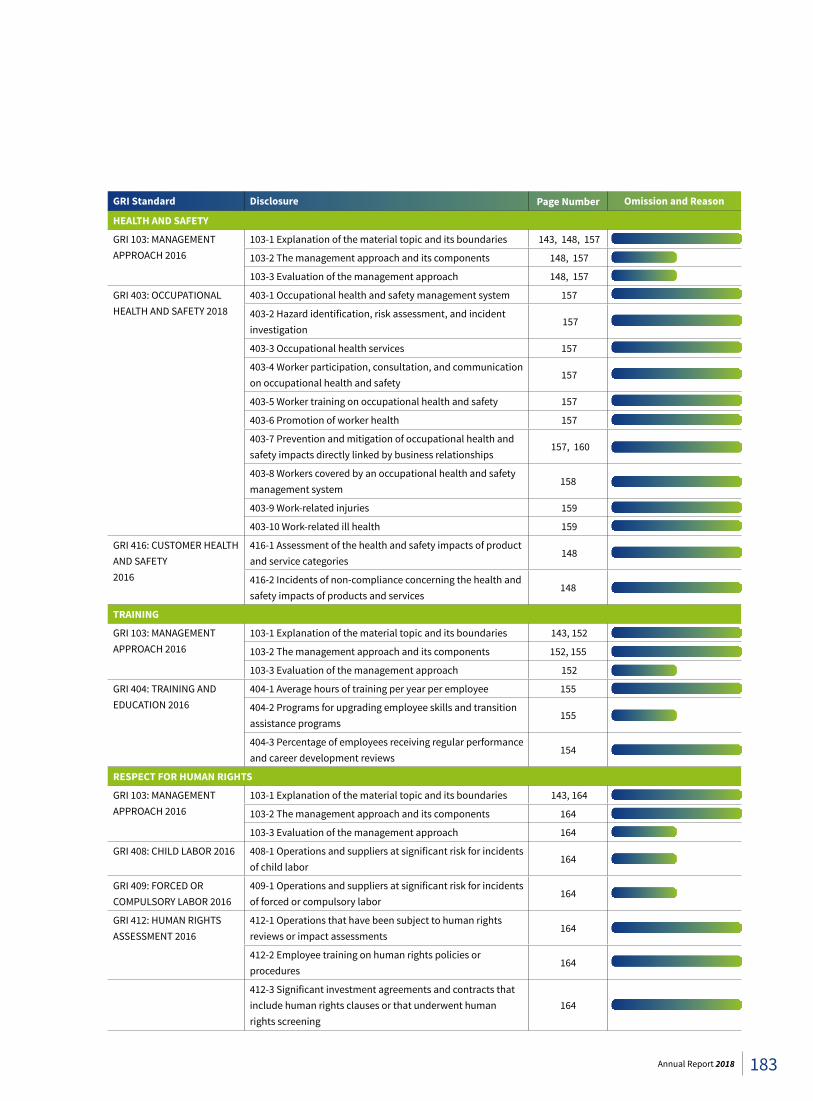
GRI Standard Disclosure Page Number Omission and Reason
HEALTH AND SAFETY
GRI 103: MANAGEMENT APPROACH 2016
103-1 Explanation of the material topic and its boundaries 143, 148, 157
103-2 The management approach and its components 148, 157
103-3 Evaluation of the management approach 148, 157
GRI 403: OCCUPATIONAL HEALTH AND SAFETY 2018
403-1 Occupational health and safety management system 157
403-2 Hazard identification, risk assessment, and incident investigation
157
403-3 Occupational health services 157
403-4 Worker participation, consultation, and communication on occupational health and safety
157
403-5 Worker training on occupational health and safety 157
403-6 Promotion of worker health 157
403-7 Prevention and mitigation of occupational health and safety impacts directly linked by business relationships
157, 160
403-8 Workers covered by an occupational health and safety management system
158
403-9 Work-related injuries 159
403-10 Work-related ill health 159
GRI 416: CUSTOMER HEALTH AND SAFETY2016
416-1 Assessment of the health and safety impacts of product and service categories
148
416-2 Incidents of non-compliance concerning the health and safety impacts of products and services
148
TRAINING
GRI 103: MANAGEMENT APPROACH 2016
103-1 Explanation of the material topic and its boundaries 143, 152
103-2 The management approach and its components 152, 155
103-3 Evaluation of the management approach 152
GRI 404: TRAINING AND EDUCATION 2016
404-1 Average hours of training per year per employee 155
404-2 Programs for upgrading employee skills and transition assistance programs
155
404-3 Percentage of employees receiving regular performance and career development reviews
154
RESPECT FOR HUMAN RIGHTS
GRI 103: MANAGEMENT APPROACH 2016
103-1 Explanation of the material topic and its boundaries 143, 164
103-2 The management approach and its components 164
103-3 Evaluation of the management approach 164
GRI 408: CHILD LABOR 2016 408-1 Operations and suppliers at significant risk for incidents of child labor
164
GRI 409: FORCED OR COMPULSORY LABOR 2016
409-1 Operations and suppliers at significant risk for incidents of forced or compulsory labor
164
GRI 412: HUMAN RIGHTS ASSESSMENT 2016
412-1 Operations that have been subject to human rights reviews or impact assessments
164
412-2 Employee training on human rights policies or procedures
164
412-3 Significant investment agreements and contracts that include human rights clauses or that underwent human rights screening
164
183Annual Report 2018
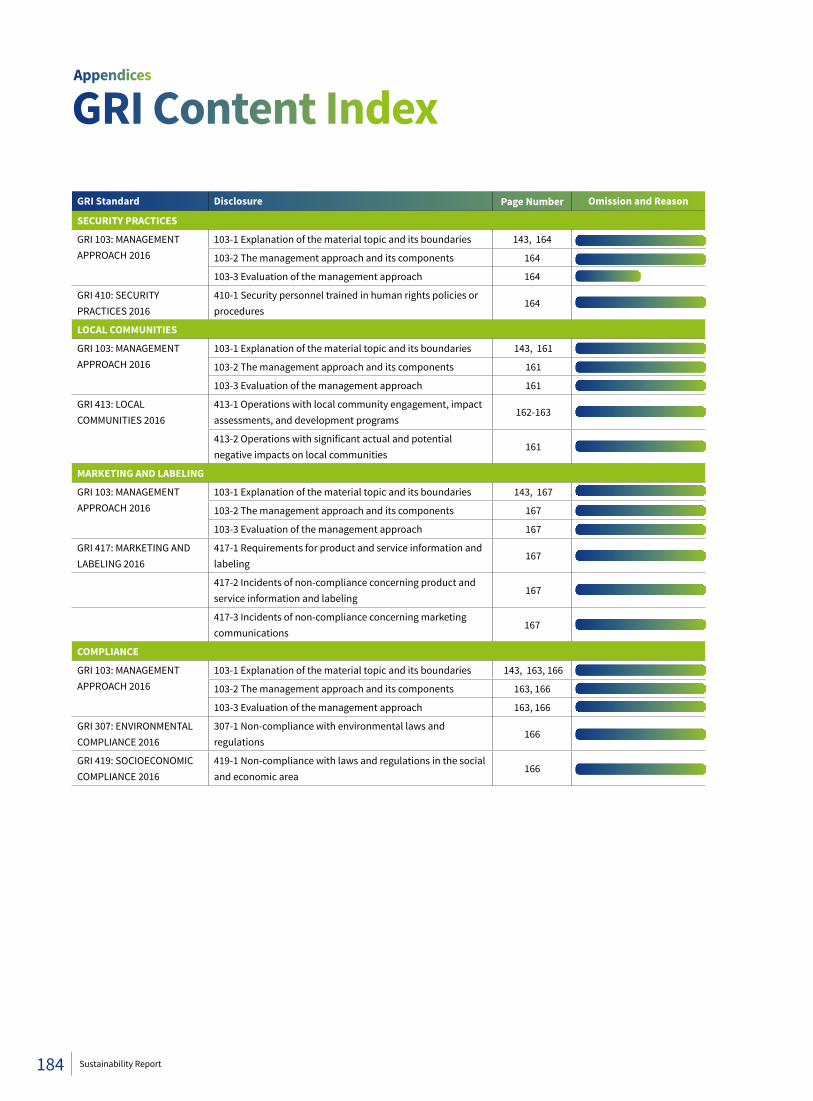
GRI Standard Disclosure Page Number Omission and Reason
SECURITY PRACTICES
GRI 103: MANAGEMENT APPROACH 2016
103-1 Explanation of the material topic and its boundaries 143, 164
103-2 The management approach and its components 164
103-3 Evaluation of the management approach 164
GRI 410: SECURITY PRACTICES 2016
410-1 Security personnel trained in human rights policies or procedures
164
LOCAL COMMUNITIES
GRI 103: MANAGEMENT APPROACH 2016
103-1 Explanation of the material topic and its boundaries 143, 161
103-2 The management approach and its components 161
103-3 Evaluation of the management approach 161
GRI 413: LOCAL COMMUNITIES 2016
413-1 Operations with local community engagement, impact assessments, and development programs
162-163
413-2 Operations with significant actual and potential negative impacts on local communities
161
MARKETING AND LABELING
GRI 103: MANAGEMENT APPROACH 2016
103-1 Explanation of the material topic and its boundaries 143, 167
103-2 The management approach and its components 167
103-3 Evaluation of the management approach 167
GRI 417: MARKETING AND LABELING 2016
417-1 Requirements for product and service information and labeling
167
417-2 Incidents of non-compliance concerning product and service information and labeling
167
417-3 Incidents of non-compliance concerning marketing communications
167
COMPLIANCE
GRI 103: MANAGEMENT APPROACH 2016
103-1 Explanation of the material topic and its boundaries 143, 163, 166
103-2 The management approach and its components 163, 166
103-3 Evaluation of the management approach 163, 166
GRI 307: ENVIRONMENTAL COMPLIANCE 2016
307-1 Non-compliance with environmental laws and regulations
166
GRI 419: SOCIOECONOMIC COMPLIANCE 2016
419-1 Non-compliance with laws and regulations in the social and economic area
166
GRI Content IndexAppendices
184 Sustainability Report
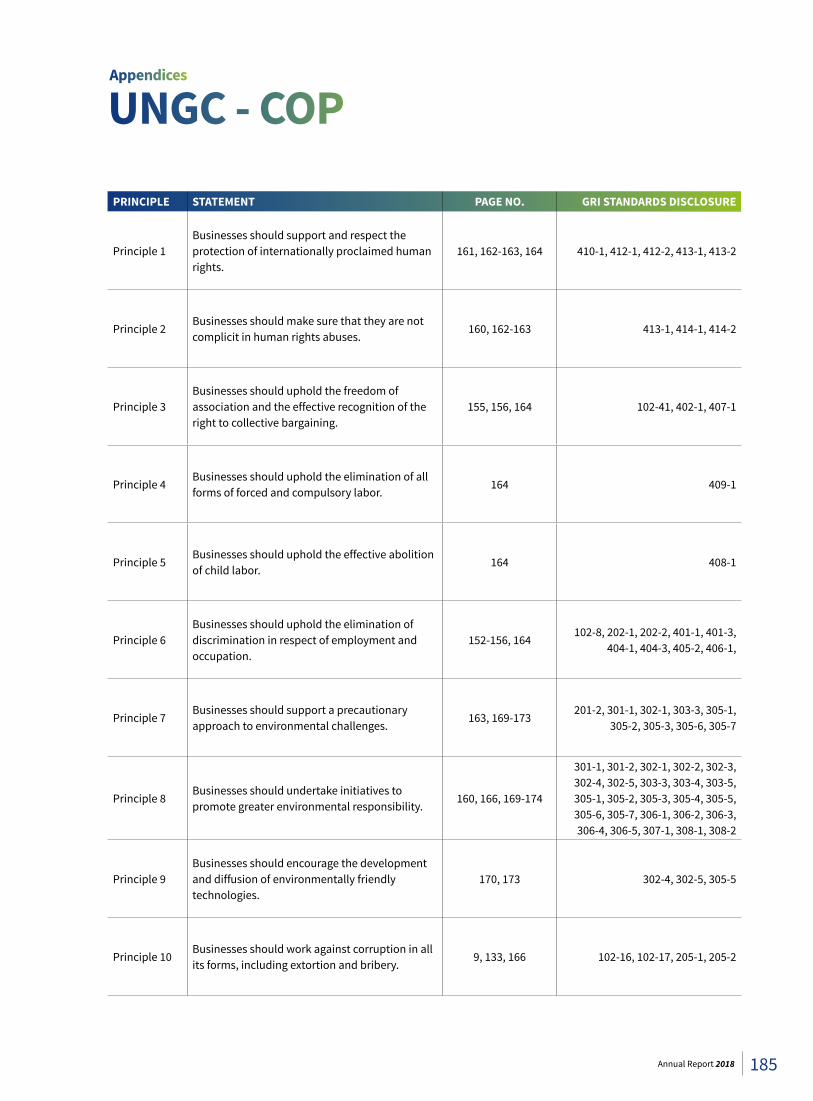
UNGC - COP
PRINCIPLE STATEMENT PAGE NO. GRI STANDARDS DISCLOSURE
Principle 1Businesses should support and respect the protection of internationally proclaimed human rights.
161, 162-163, 164 410-1, 412-1, 412-2, 413-1, 413-2
Principle 2Businesses should make sure that they are not complicit in human rights abuses.
160, 162-163 413-1, 414-1, 414-2
Principle 3Businesses should uphold the freedom of association and the effective recognition of the right to collective bargaining.
155, 156, 164 102-41, 402-1, 407-1
Principle 4Businesses should uphold the elimination of all forms of forced and compulsory labor.
164 409-1
Principle 5Businesses should uphold the effective abolition of child labor.
164 408-1
Principle 6Businesses should uphold the elimination of discrimination in respect of employment and occupation.
152-156, 164102-8, 202-1, 202-2, 401-1, 401-3,
404-1, 404-3, 405-2, 406-1,
Principle 7Businesses should support a precautionary approach to environmental challenges.
163, 169-173201-2, 301-1, 302-1, 303-3, 305-1,
305-2, 305-3, 305-6, 305-7
Principle 8Businesses should undertake initiatives to promote greater environmental responsibility.
160, 166, 169-174
301-1, 301-2, 302-1, 302-2, 302-3, 302-4, 302-5, 303-3, 303-4, 303-5, 305-1, 305-2, 305-3, 305-4, 305-5, 305-6, 305-7, 306-1, 306-2, 306-3, 306-4, 306-5, 307-1, 308-1, 308-2
Principle 9Businesses should encourage the development and diffusion of environmentally friendly technologies.
170, 173 302-4, 302-5, 305-5
Principle 10Businesses should work against corruption in all its forms, including extortion and bribery.
9, 133, 166 102-16, 102-17, 205-1, 205-2
Appendices
185Annual Report 2018
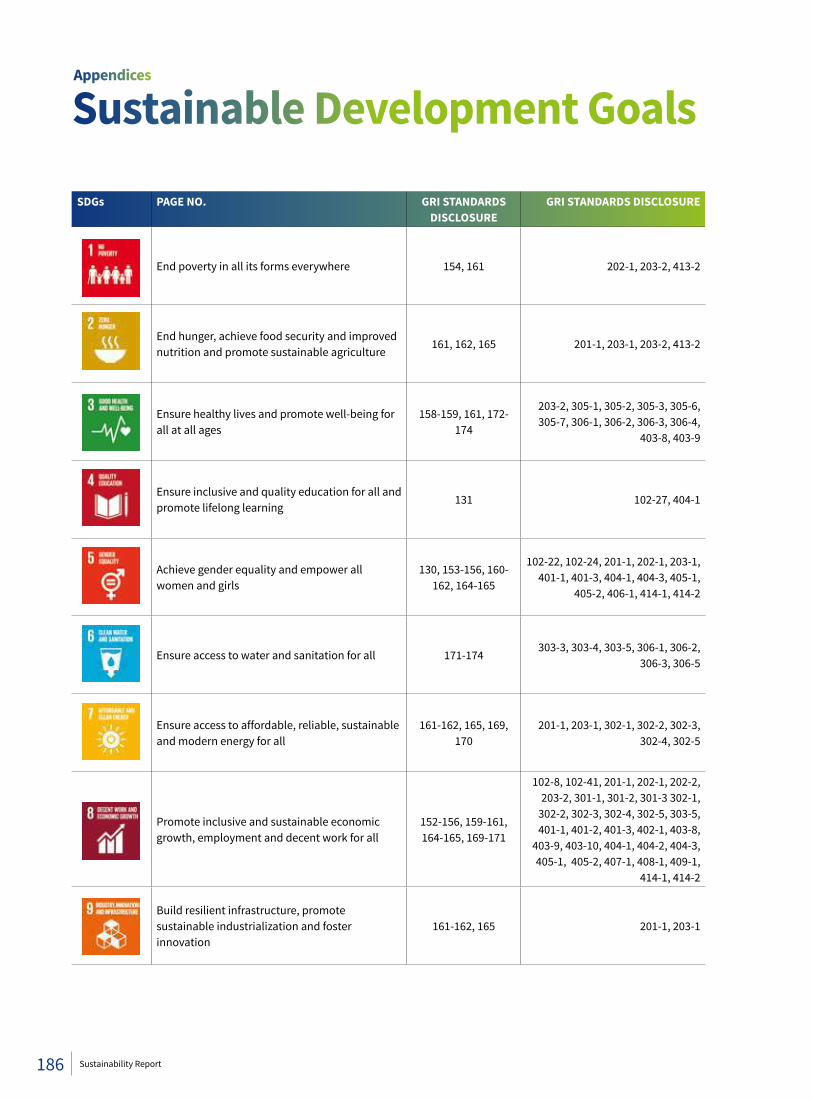
Sustainable Development Goals
SDGs PAGE NO. GRI STANDARDS DISCLOSURE
GRI STANDARDS DISCLOSURE
End poverty in all its forms everywhere 154, 161 202-1, 203-2, 413-2
End hunger, achieve food security and improved nutrition and promote sustainable agriculture
161, 162, 165 201-1, 203-1, 203-2, 413-2
Ensure healthy lives and promote well-being for all at all ages
158-159, 161, 172-174
203-2, 305-1, 305-2, 305-3, 305-6, 305-7, 306-1, 306-2, 306-3, 306-4,
403-8, 403-9
Ensure inclusive and quality education for all and promote lifelong learning
131 102-27, 404-1
Achieve gender equality and empower all women and girls
130, 153-156, 160-162, 164-165
102-22, 102-24, 201-1, 202-1, 203-1, 401-1, 401-3, 404-1, 404-3, 405-1,
405-2, 406-1, 414-1, 414-2
Ensure access to water and sanitation for all 171-174303-3, 303-4, 303-5, 306-1, 306-2,
306-3, 306-5
Ensure access to affordable, reliable, sustainable and modern energy for all
161-162, 165, 169, 170
201-1, 203-1, 302-1, 302-2, 302-3, 302-4, 302-5
Promote inclusive and sustainable economic growth, employment and decent work for all
152-156, 159-161, 164-165, 169-171
102-8, 102-41, 201-1, 202-1, 202-2, 203-2, 301-1, 301-2, 301-3 302-1,
302-2, 302-3, 302-4, 302-5, 303-5, 401-1, 401-2, 401-3, 402-1, 403-8,
403-9, 403-10, 404-1, 404-2, 404-3, 405-1, 405-2, 407-1, 408-1, 409-1,
414-1, 414-2
Build resilient infrastructure, promote sustainable industrialization and foster innovation
161-162, 165 201-1, 203-1
Appendices
186 Sustainability Report
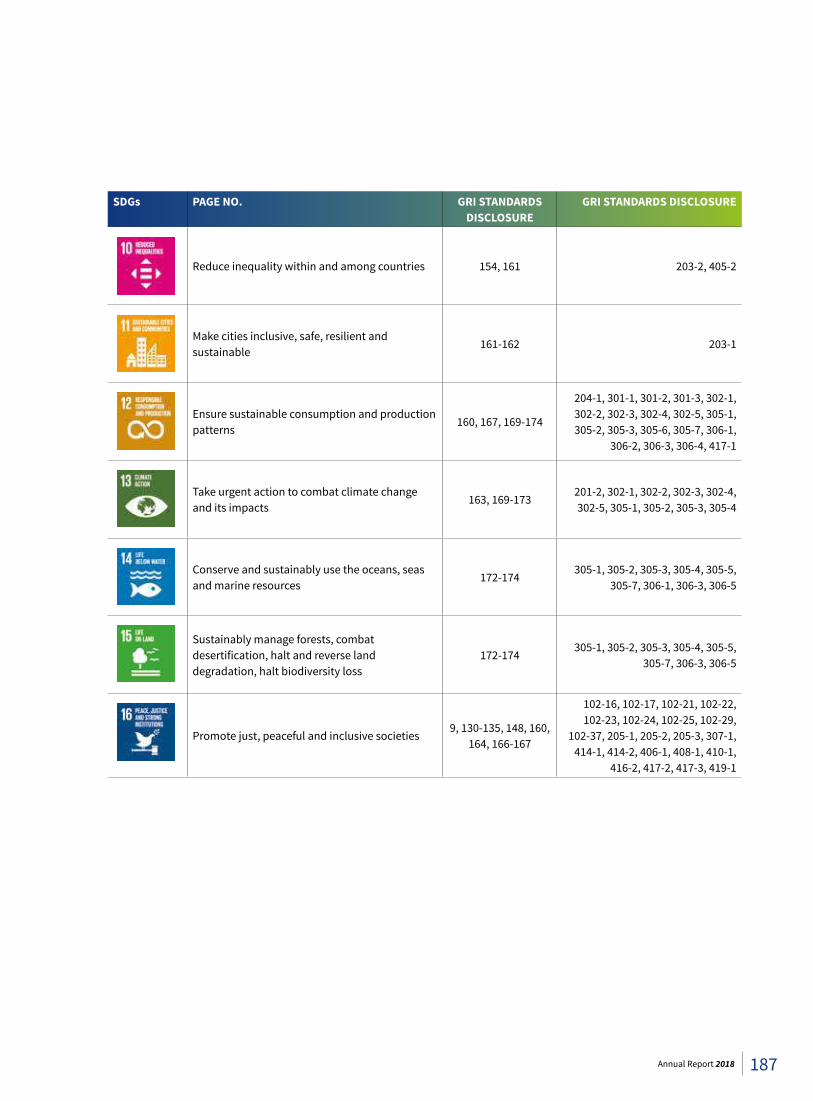
SDGs PAGE NO. GRI STANDARDS DISCLOSURE
GRI STANDARDS DISCLOSURE
Reduce inequality within and among countries 154, 161 203-2, 405-2
Make cities inclusive, safe, resilient and sustainable
161-162 203-1
Ensure sustainable consumption and production patterns
160, 167, 169-174
204-1, 301-1, 301-2, 301-3, 302-1, 302-2, 302-3, 302-4, 302-5, 305-1, 305-2, 305-3, 305-6, 305-7, 306-1,
306-2, 306-3, 306-4, 417-1
Take urgent action to combat climate change and its impacts
163, 169-173201-2, 302-1, 302-2, 302-3, 302-4, 302-5, 305-1, 305-2, 305-3, 305-4
Conserve and sustainably use the oceans, seas and marine resources
172-174305-1, 305-2, 305-3, 305-4, 305-5,
305-7, 306-1, 306-3, 306-5
Sustainably manage forests, combat desertification, halt and reverse land degradation, halt biodiversity loss
172-174 305-1, 305-2, 305-3, 305-4, 305-5,
305-7, 306-3, 306-5
Promote just, peaceful and inclusive societies9, 130-135, 148, 160,
164, 166-167
102-16, 102-17, 102-21, 102-22, 102-23, 102-24, 102-25, 102-29,
102-37, 205-1, 205-2, 205-3, 307-1, 414-1, 414-2, 406-1, 408-1, 410-1,
416-2, 417-2, 417-3, 419-1
187Annual Report 2018

188 Sustainability Report
Financial StatementsFauji Fertilizer Company Limited

SAY NO TO CORRUPTION
190 Financial Statements
Composition of the Audit Committee
The Audit Committee of FFC comprises of four members. Two members including the Chairperson are independent non-executive directors, whereas the remaining two members are non-executive directors. Upon retirement of preceding Committee members, the Audit Committee has been reconstituted during the year. The incumbent members are qualified finance professionals and the Committee as a whole possess significant economic, financial and business acumen.
The names and profiles of the Audit Committee members are given on Page No. 22 and 27 of the Annual Report 2018.
Chief Financial Officer of the Company attends the meeting by invitation, while the Committee meetings are attended by the Internal and External Auditors on requirement basis.
The Financial Statements
The Committee has concluded its annual review of the conduct and operations of the Company during 2018, and reports that:
• The separate and consolidated financial statements of FFC for the year ended December 31, 2018 have been prepared on a going concern basis under requirements of Companies Act 2017, incorporating the requirements of the Code of Corporate Governance, International Financial Reporting Standards and other applicable regulations.
• There were no issues in the first time application of Companies Act 2017 which also did not have any material effect on the financial statements, and these financial statements present a true and fair view of the Company’s state of affairs, results of operations, profits, cash flows and changes in equity of the Company and its subsidiaries for the year under review.
• In line with the Auditors (Reporting Obligations) Regulations, 2018 issued by SECP, contents of the Audit Report for year 2018 have changed significantly compared to previous year and the Auditors have issued unmodified audit reports in respect of the above financial statements for the year 2018.
• Appropriate accounting policies have been consistently applied except for the changes, if any, which have been appropriately disclosed in the financial statements.
• The Chairman of the Board, Chief Executive Officer, a director and the Chief Financial Officer have endorsed the separate and consolidated financial statements of the Company, while the Directors’ Report is signed by the Chairman and the Chief Executive Officer. They acknowledge their responsibility for true and fair presentation of the Company’s financial condition and results, compliance with regulations, applicable accounting standards and establishment and maintenance of internal controls and systems of the Company.
• Accounting estimates are based on reasonable and prudent judgment. Proper and adequate accounting records have been maintained by the Company in accordance with the Companies Act, 2017. The financial statements comply with the requirements of the Fourth Schedule to the Companies Act, 2017 and the external reporting is consistent with management processes and adequate for shareholder needs.
• All related Party transactions have been reviewed by the Committee prior to approval by the Board.
• The Company has issued a “Statement of Compliance with the Code of Corporate Governance” which has also been reviewed and certified by the External Auditors of the Company.
• Understanding and compliance with Company codes and policies has been affirmed by the members of the Board, the Management and employees of the Company. Equitable treatment of shareholders has also been ensured.
• Trading and holdings of Company’s shares by Directors & executives or their spouses were notified in writing to the Company Secretary along with the price, number of shares, form of share certificates and nature of
Report of the Audit Committeeon Adherence to the Code of Corporate Governance
191Annual Report 2018
transaction which were notified by the Company Secretary to the Board within the stipulated time. All such holdings have been disclosed in the Pattern of Shareholding. The Annual Secretarial Compliance Certificates are being filed regularly within stipulated time.
• Closed periods were duly determined and announced by the Company, precluding the Directors, the Chief Executive and executives of the Company from dealing in Company shares, prior to each Board meeting involving announcement of interim / final results, distribution to shareholders or any other business decision, which could materially affect the share market price of the Company, along with maintenance of confidentiality of all business information.
Risk Management and Internal Control
• The Company has developed a sound mechanism for identification of risks and assigning appropriate criticality level and devising appropriate mitigation measures which are regularly monitored and implemented by the management across all major functions of the Company and presented to the Audit Committee for information and review.
• The Company has devised and implemented an effective internal control framework which also includes an independent internal audit function.
• The Internal Audit department is responsible for monitoring of compliance, inherent and other risks associated with the internal controls and other areas of operations of the Company.
• The Company’s approach towards risk management has been disclosed in the risk assessment portion of the Directors’ Report .The types and detail of risks alongwith mitigating measures are disclosed in relevant section of the Annual Report.
Internal Audit
• The Company’s system of internal controls is sound in design and has been continually evaluated for effectiveness and adequacy.
• The Audit Committee has ensured the achievement of operational, compliance, risk management, financial reporting and control objectives, safeguarding of the assets of the Company and the shareholders’ wealth at all levels within the Company.
• The Internal Audit function has carried out its duties under the charter defined by the Committee. The Committee has reviewed material Internal Audit findings, taking appropriate action or bringing the matters to the Board’s attention where required.
• Audit Committee has provided proper arrangement for staff and management to report to Audit Committee in confidence, concerns, if any, about actual or potential improprieties in financial and other matters. Adequate remedial and mitigating measures are applied, where necessary.
• The Head of Internal Audit has direct access to the Chairperson of the Audit Committee and the Committee has ensured staffing of personnel with sufficient internal audit acumen and that the function has all necessary access to Management and the right to seek information and explanations.
• Coordination between the External and Internal Auditors was facilitated to ensure efficiency and contribution to the Company’s objectives, including a reliable financial reporting system and compliance with laws and regulations.
External Auditors
• The statutory Auditors of the Company, KPMG Taseer Hadi & Co., Chartered Accountants, have completed their audit assignment of the “Company’s Financial Statements”, the “Consolidated Financial Statements” and the “Statement of Compliance with the Code of Corporate Governance” for the financial year ended December 31, 2018 and shall retire on the conclusion of the 41st Annual General Meeting.
Report of the Audit Committeeon Adherence to the Code of Corporate Governance
192 Financial Statements
• The Audit Committee has discussed the audit process and the observation, if any, of the auditors regarding the preparation of the financial statements including compliance with the applicable regulations or any other issues.
• The Auditors attended all the Audit Committee meetings where their reports were discussed. The Auditors also attended General Meetings of the Company during the year and have confirmed attendance of the 41st Annual General Meeting scheduled for March 26, 2019. The Auditors have also indicated their willingness to continue as Auditors.
• The Auditors do not provide any services other than external audit of the Company. The audit firm has no financial or other relationship of any kind with the Company except that of External Auditors.
• Being eligible, KPMG have offered themselves to be reappointed as Auditors for the financial year 2019. However, based on a notice received from a shareholder, the appointment of A.F. Ferguson & Co, Chartered Accountants, has been recommended by the Committee as Auditors of the Company for the financial year 2019.
Annual Report 2018
• The Company has issued a very comprehensive Annual Report which besides presentation of the financial statements and the Directors’ Reports of the Company, also discloses other information much in excess of the regulatory requirements to offer an in depth understanding about the management style, the policies set in place by the Company, its performance during the year, and future prospects to various stakeholder of the Company.
• The information has been disclosed in the form of ratios, trends, graphs, analysis, explanatory notes and statements etc., and the Audit Committee believes that the Annual Report 2018 gives a detailed view of how the Company evolved, its state of affairs and future prospects.
The Audit Committee
• The Audit Committee believes that it has carried out responsibilities to the full, in accordance with Terms of Reference approved by the Board which included principally the items mentioned above and the actions taken by the Audit Committee in respect of each of these responsibilities. Evaluation of the Board performance, which also included members of the Audit Committee was carried out separately and is detailed in the Annual Report.
Bushra Naz Malik Chairperson – Audit Committee Rawalpindi January 31, 2019
193Annual Report 2018
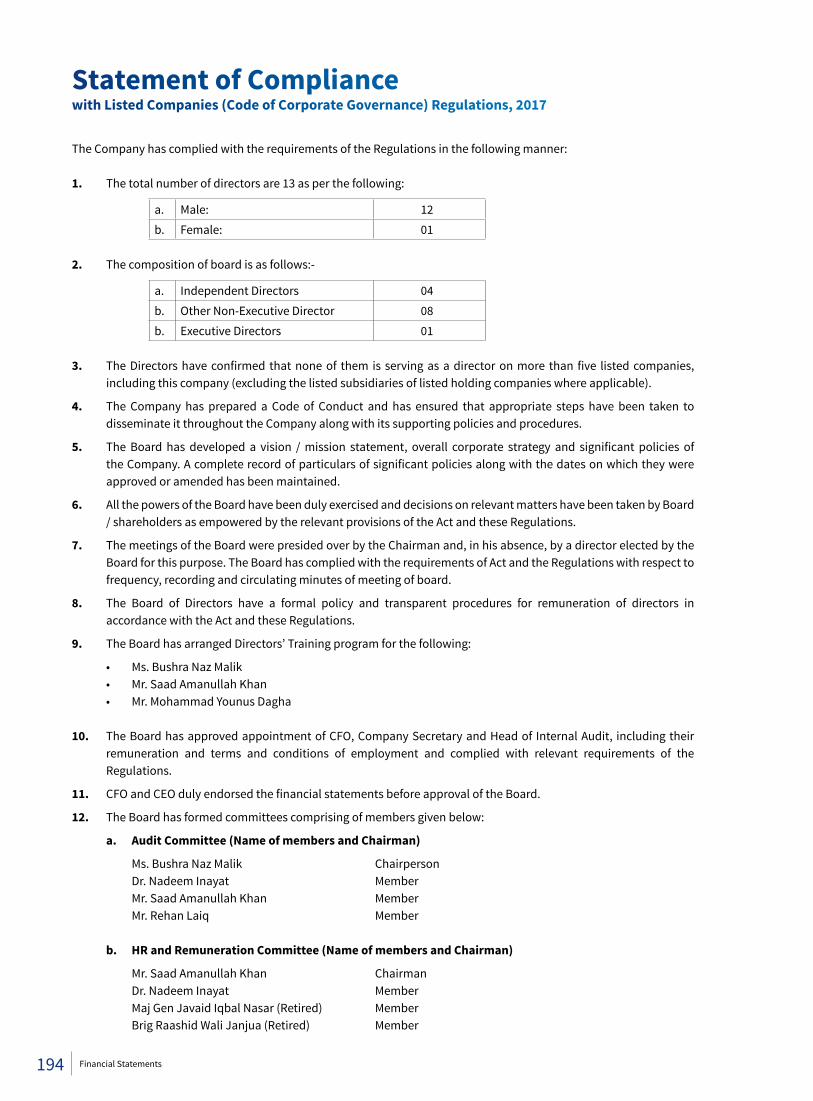
The Company has complied with the requirements of the Regulations in the following manner:
1. The total number of directors are 13 as per the following:
a. Male: 12b. Female: 01
2. The composition of board is as follows:-
a. Independent Directors 04b. Other Non-Executive Director 08b. Executive Directors 01
3. The Directors have confirmed that none of them is serving as a director on more than five listed companies, including this company (excluding the listed subsidiaries of listed holding companies where applicable).
4. The Company has prepared a Code of Conduct and has ensured that appropriate steps have been taken to disseminate it throughout the Company along with its supporting policies and procedures.
5. The Board has developed a vision / mission statement, overall corporate strategy and significant policies of the Company. A complete record of particulars of significant policies along with the dates on which they were approved or amended has been maintained.
6. All the powers of the Board have been duly exercised and decisions on relevant matters have been taken by Board / shareholders as empowered by the relevant provisions of the Act and these Regulations.
7. The meetings of the Board were presided over by the Chairman and, in his absence, by a director elected by the Board for this purpose. The Board has complied with the requirements of Act and the Regulations with respect to frequency, recording and circulating minutes of meeting of board.
8. The Board of Directors have a formal policy and transparent procedures for remuneration of directors in accordance with the Act and these Regulations.
9. The Board has arranged Directors’ Training program for the following:
• Ms. Bushra Naz Malik • Mr. Saad Amanullah Khan • Mr. Mohammad Younus Dagha
10. The Board has approved appointment of CFO, Company Secretary and Head of Internal Audit, including their remuneration and terms and conditions of employment and complied with relevant requirements of the Regulations.
11. CFO and CEO duly endorsed the financial statements before approval of the Board.
12. The Board has formed committees comprising of members given below:
a. Audit Committee (Name of members and Chairman)
Ms. Bushra Naz Malik Chairperson Dr. Nadeem Inayat Member Mr. Saad Amanullah Khan Member Mr. Rehan Laiq Member
b. HR and Remuneration Committee (Name of members and Chairman)
Mr. Saad Amanullah Khan Chairman Dr. Nadeem Inayat Member Maj Gen Javaid Iqbal Nasar (Retired) Member Brig Raashid Wali Janjua (Retired) Member
Statement of Compliancewith Listed Companies (Code of Corporate Governance) Regulations, 2017
194 Financial Statements
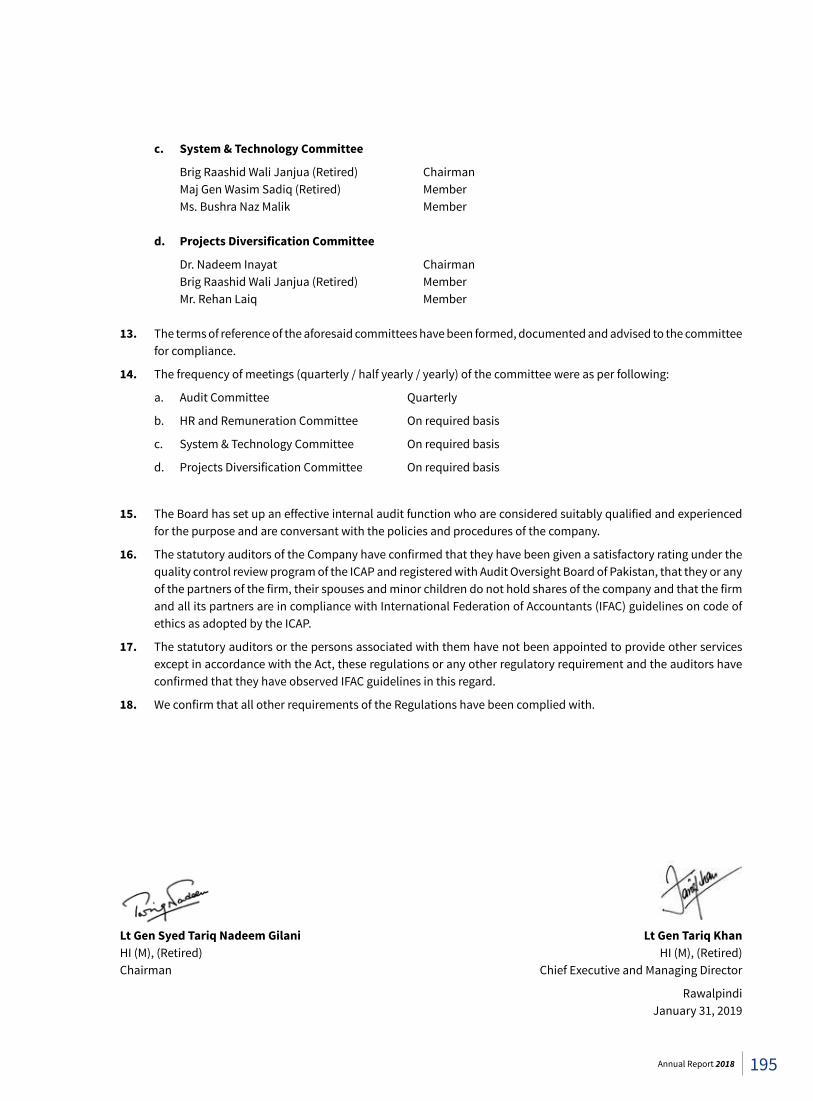
c. System & Technology Committee
Brig Raashid Wali Janjua (Retired) Chairman Maj Gen Wasim Sadiq (Retired) Member Ms. Bushra Naz Malik Member
d. Projects Diversification Committee
Dr. Nadeem Inayat Chairman Brig Raashid Wali Janjua (Retired) Member Mr. Rehan Laiq Member
13. The terms of reference of the aforesaid committees have been formed, documented and advised to the committee for compliance.
14. The frequency of meetings (quarterly / half yearly / yearly) of the committee were as per following:
a. Audit Committee Quarterly
b. HR and Remuneration Committee On required basis
c. System & Technology Committee On required basis
d. Projects Diversification Committee On required basis
15. The Board has set up an effective internal audit function who are considered suitably qualified and experienced for the purpose and are conversant with the policies and procedures of the company.
16. The statutory auditors of the Company have confirmed that they have been given a satisfactory rating under the quality control review program of the ICAP and registered with Audit Oversight Board of Pakistan, that they or any of the partners of the firm, their spouses and minor children do not hold shares of the company and that the firm and all its partners are in compliance with International Federation of Accountants (IFAC) guidelines on code of ethics as adopted by the ICAP.
17. The statutory auditors or the persons associated with them have not been appointed to provide other services except in accordance with the Act, these regulations or any other regulatory requirement and the auditors have confirmed that they have observed IFAC guidelines in this regard.
18. We confirm that all other requirements of the Regulations have been complied with.
Lt Gen Syed Tariq Nadeem Gilani HI (M), (Retired)Chairman
Lt Gen Tariq KhanHI (M), (Retired)
Chief Executive and Managing Director
RawalpindiJanuary 31, 2019
195Annual Report 2018
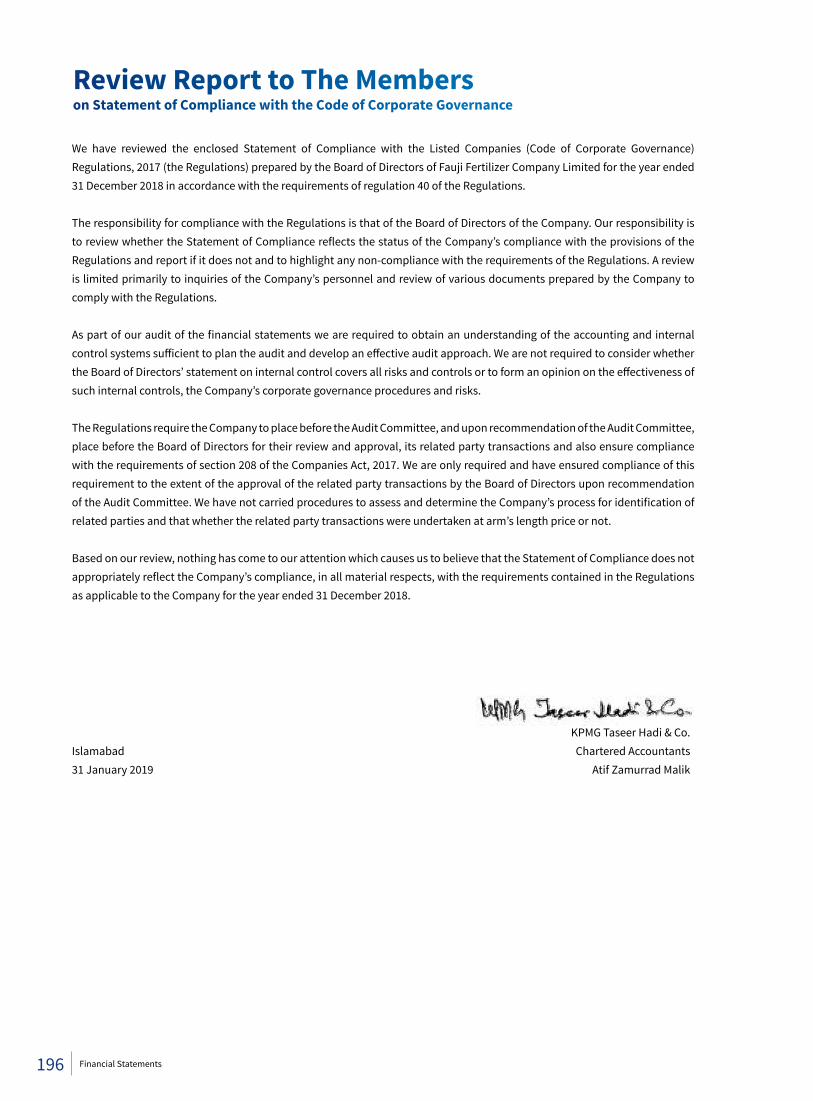
We have reviewed the enclosed Statement of Compliance with the Listed Companies (Code of Corporate Governance) Regulations, 2017 (the Regulations) prepared by the Board of Directors of Fauji Fertilizer Company Limited for the year ended 31 December 2018 in accordance with the requirements of regulation 40 of the Regulations.
The responsibility for compliance with the Regulations is that of the Board of Directors of the Company. Our responsibility is to review whether the Statement of Compliance reflects the status of the Company’s compliance with the provisions of the Regulations and report if it does not and to highlight any non-compliance with the requirements of the Regulations. A review is limited primarily to inquiries of the Company’s personnel and review of various documents prepared by the Company to comply with the Regulations.
As part of our audit of the financial statements we are required to obtain an understanding of the accounting and internal control systems sufficient to plan the audit and develop an effective audit approach. We are not required to consider whether the Board of Directors’ statement on internal control covers all risks and controls or to form an opinion on the effectiveness of such internal controls, the Company’s corporate governance procedures and risks.
The Regulations require the Company to place before the Audit Committee, and upon recommendation of the Audit Committee, place before the Board of Directors for their review and approval, its related party transactions and also ensure compliance with the requirements of section 208 of the Companies Act, 2017. We are only required and have ensured compliance of this requirement to the extent of the approval of the related party transactions by the Board of Directors upon recommendation of the Audit Committee. We have not carried procedures to assess and determine the Company’s process for identification of related parties and that whether the related party transactions were undertaken at arm’s length price or not.
Based on our review, nothing has come to our attention which causes us to believe that the Statement of Compliance does not appropriately reflect the Company’s compliance, in all material respects, with the requirements contained in the Regulations as applicable to the Company for the year ended 31 December 2018.
KPMG Taseer Hadi & Co.Islamabad Chartered Accountants31 January 2019 Atif Zamurrad Malik
Review Report to The Memberson Statement of Compliance with the Code of Corporate Governance
196 Financial Statements
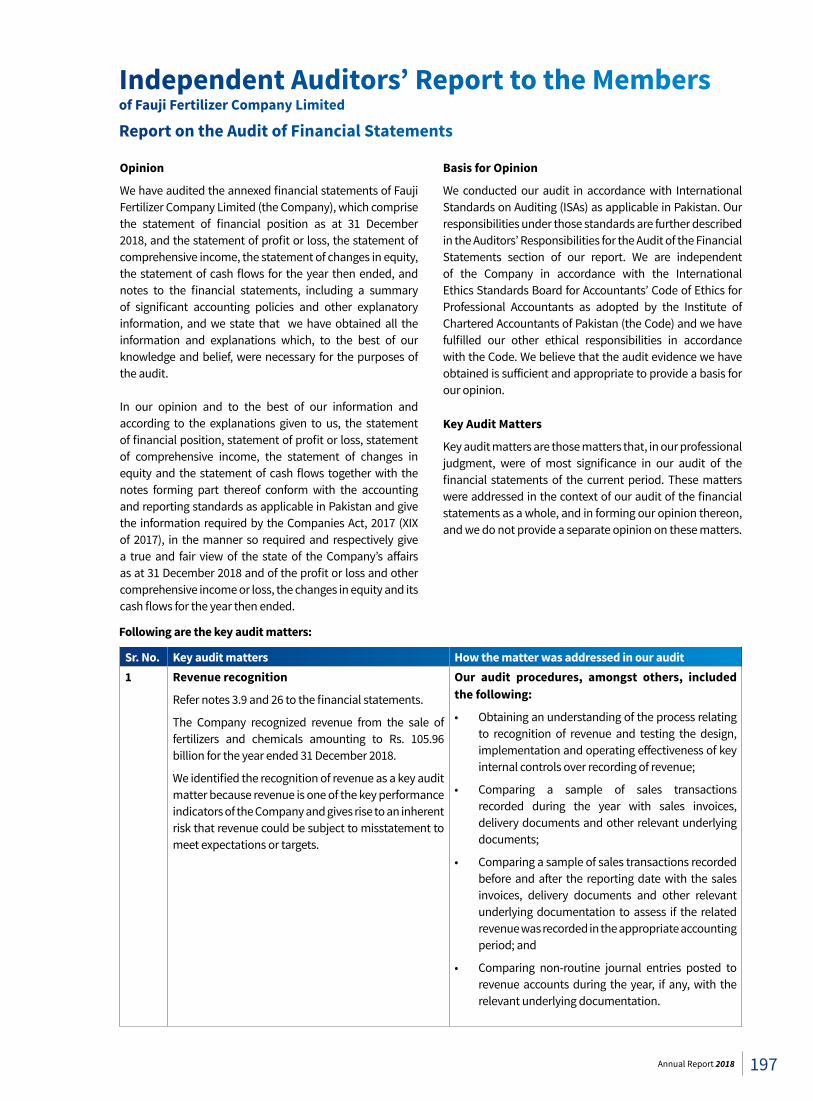
Independent Auditors’ Report to the Membersof Fauji Fertilizer Company Limited
Report on the Audit of Financial Statements
Opinion
We have audited the annexed financial statements of Fauji Fertilizer Company Limited (the Company), which comprise the statement of financial position as at 31 December 2018, and the statement of profit or loss, the statement of comprehensive income, the statement of changes in equity, the statement of cash flows for the year then ended, and notes to the financial statements, including a summary of significant accounting policies and other explanatory information, and we state that we have obtained all the information and explanations which, to the best of our knowledge and belief, were necessary for the purposes of the audit.
In our opinion and to the best of our information and according to the explanations given to us, the statement of financial position, statement of profit or loss, statement of comprehensive income, the statement of changes in equity and the statement of cash flows together with the notes forming part thereof conform with the accounting and reporting standards as applicable in Pakistan and give the information required by the Companies Act, 2017 (XIX of 2017), in the manner so required and respectively give a true and fair view of the state of the Company’s affairs as at 31 December 2018 and of the profit or loss and other comprehensive income or loss, the changes in equity and its cash flows for the year then ended.
Sr. No. Key audit matters How the matter was addressed in our audit1 Revenue recognition
Refer notes 3.9 and 26 to the financial statements.
The Company recognized revenue from the sale of fertilizers and chemicals amounting to Rs. 105.96 billion for the year ended 31 December 2018.
We identified the recognition of revenue as a key audit matter because revenue is one of the key performance indicators of the Company and gives rise to an inherent risk that revenue could be subject to misstatement to meet expectations or targets.
Our audit procedures, amongst others, included the following:
• Obtaining an understanding of the process relating to recognition of revenue and testing the design, implementation and operating effectiveness of key internal controls over recording of revenue;
• Comparing a sample of sales transactions recorded during the year with sales invoices, delivery documents and other relevant underlying documents;
• Comparing a sample of sales transactions recorded before and after the reporting date with the sales invoices, delivery documents and other relevant underlying documentation to assess if the related revenue was recorded in the appropriate accounting period; and
• Comparing non-routine journal entries posted to revenue accounts during the year, if any, with the relevant underlying documentation.
Following are the key audit matters:
Basis for Opinion
We conducted our audit in accordance with International Standards on Auditing (ISAs) as applicable in Pakistan. Our responsibilities under those standards are further described in the Auditors’ Responsibilities for the Audit of the Financial Statements section of our report. We are independent of the Company in accordance with the International Ethics Standards Board for Accountants’ Code of Ethics for Professional Accountants as adopted by the Institute of Chartered Accountants of Pakistan (the Code) and we have fulfilled our other ethical responsibilities in accordance with the Code. We believe that the audit evidence we have obtained is sufficient and appropriate to provide a basis for our opinion. Key Audit Matters
Key audit matters are those matters that, in our professional judgment, were of most significance in our audit of the financial statements of the current period. These matters were addressed in the context of our audit of the financial statements as a whole, and in forming our opinion thereon, and we do not provide a separate opinion on these matters.
197Annual Report 2018
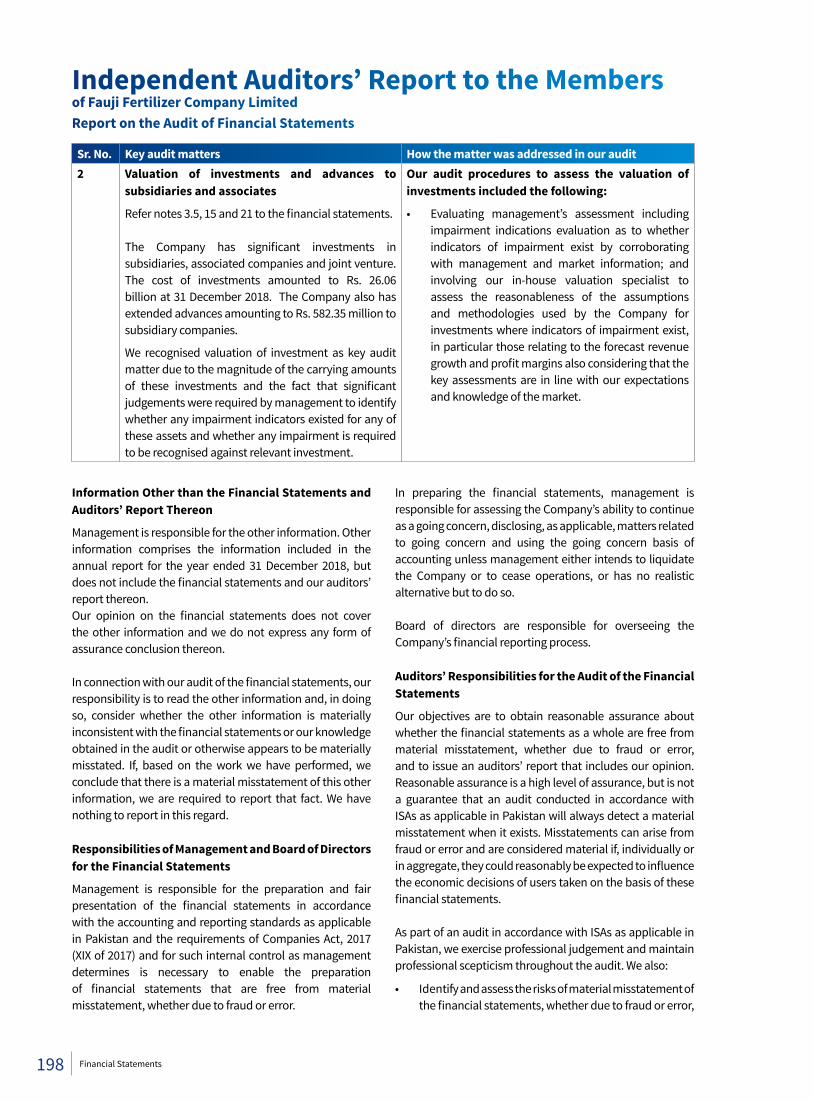
Sr. No. Key audit matters How the matter was addressed in our audit2 Valuation of investments and advances to
subsidiaries and associates
Refer notes 3.5, 15 and 21 to the financial statements.
The Company has significant investments in subsidiaries, associated companies and joint venture. The cost of investments amounted to Rs. 26.06 billion at 31 December 2018. The Company also has extended advances amounting to Rs. 582.35 million to subsidiary companies.
We recognised valuation of investment as key audit matter due to the magnitude of the carrying amounts of these investments and the fact that significant judgements were required by management to identify whether any impairment indicators existed for any of these assets and whether any impairment is required to be recognised against relevant investment.
Our audit procedures to assess the valuation of investments included the following:
• Evaluating management’s assessment including impairment indications evaluation as to whether indicators of impairment exist by corroborating with management and market information; and involving our in-house valuation specialist to assess the reasonableness of the assumptions and methodologies used by the Company for investments where indicators of impairment exist, in particular those relating to the forecast revenue growth and profit margins also considering that the key assessments are in line with our expectations and knowledge of the market.
Information Other than the Financial Statements and Auditors’ Report Thereon
Management is responsible for the other information. Other information comprises the information included in the annual report for the year ended 31 December 2018, but does not include the financial statements and our auditors’ report thereon.Our opinion on the financial statements does not cover the other information and we do not express any form of assurance conclusion thereon.
In connection with our audit of the financial statements, our responsibility is to read the other information and, in doing so, consider whether the other information is materially inconsistent with the financial statements or our knowledge obtained in the audit or otherwise appears to be materially misstated. If, based on the work we have performed, we conclude that there is a material misstatement of this other information, we are required to report that fact. We have nothing to report in this regard.
Responsibilities of Management and Board of Directors for the Financial Statements
Management is responsible for the preparation and fair presentation of the financial statements in accordance with the accounting and reporting standards as applicable in Pakistan and the requirements of Companies Act, 2017 (XIX of 2017) and for such internal control as management determines is necessary to enable the preparation of financial statements that are free from material misstatement, whether due to fraud or error.
In preparing the financial statements, management is responsible for assessing the Company’s ability to continue as a going concern, disclosing, as applicable, matters related to going concern and using the going concern basis of accounting unless management either intends to liquidate the Company or to cease operations, or has no realistic alternative but to do so.
Board of directors are responsible for overseeing the Company’s financial reporting process.
Auditors’ Responsibilities for the Audit of the Financial Statements
Our objectives are to obtain reasonable assurance about whether the financial statements as a whole are free from material misstatement, whether due to fraud or error, and to issue an auditors’ report that includes our opinion. Reasonable assurance is a high level of assurance, but is not a guarantee that an audit conducted in accordance with ISAs as applicable in Pakistan will always detect a material misstatement when it exists. Misstatements can arise from fraud or error and are considered material if, individually or in aggregate, they could reasonably be expected to influence the economic decisions of users taken on the basis of these financial statements. As part of an audit in accordance with ISAs as applicable in Pakistan, we exercise professional judgement and maintain professional scepticism throughout the audit. We also:
• Identify and assess the risks of material misstatement of the financial statements, whether due to fraud or error,
Independent Auditors’ Report to the Membersof Fauji Fertilizer Company LimitedReport on the Audit of Financial Statements
198 Financial Statements
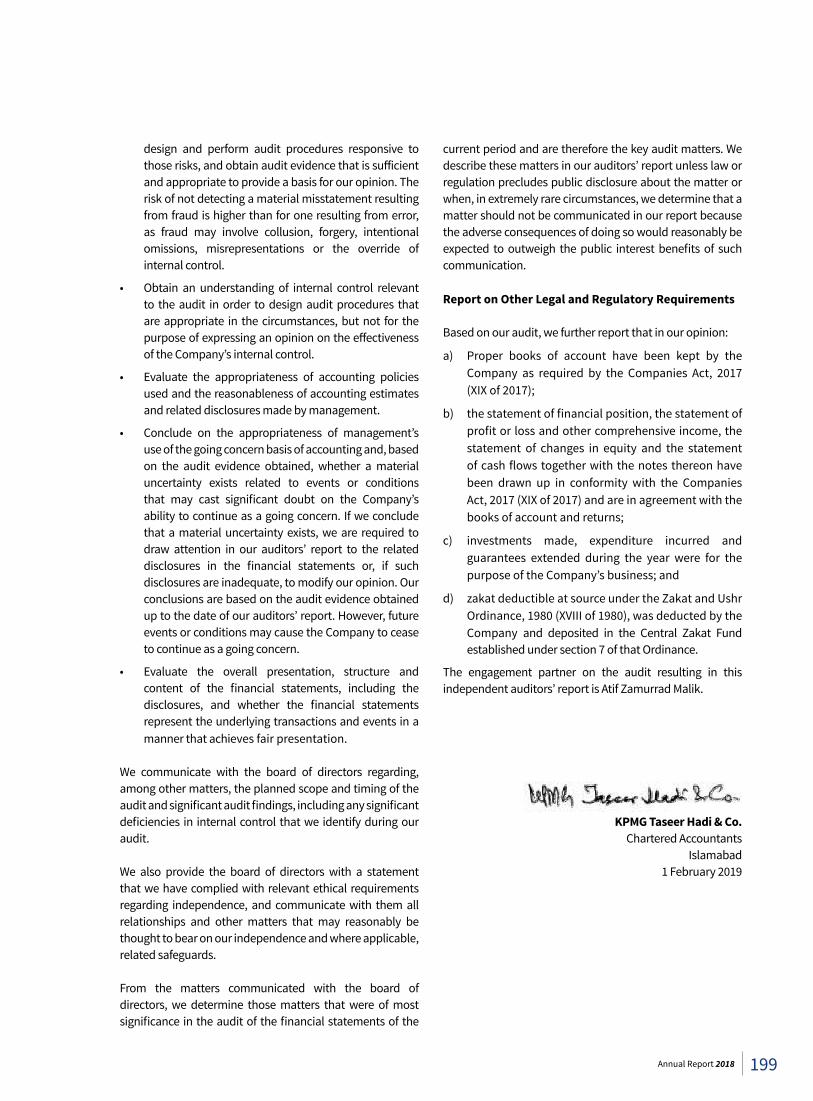
design and perform audit procedures responsive to those risks, and obtain audit evidence that is sufficient and appropriate to provide a basis for our opinion. The risk of not detecting a material misstatement resulting from fraud is higher than for one resulting from error, as fraud may involve collusion, forgery, intentional omissions, misrepresentations or the override of internal control.
• Obtain an understanding of internal control relevant to the audit in order to design audit procedures that are appropriate in the circumstances, but not for the purpose of expressing an opinion on the effectiveness of the Company’s internal control.
• Evaluate the appropriateness of accounting policies used and the reasonableness of accounting estimates and related disclosures made by management.
• Conclude on the appropriateness of management’s use of the going concern basis of accounting and, based on the audit evidence obtained, whether a material uncertainty exists related to events or conditions that may cast significant doubt on the Company’s ability to continue as a going concern. If we conclude that a material uncertainty exists, we are required to draw attention in our auditors’ report to the related disclosures in the financial statements or, if such disclosures are inadequate, to modify our opinion. Our conclusions are based on the audit evidence obtained up to the date of our auditors’ report. However, future events or conditions may cause the Company to cease to continue as a going concern.
• Evaluate the overall presentation, structure and content of the financial statements, including the disclosures, and whether the financial statements represent the underlying transactions and events in a manner that achieves fair presentation.
We communicate with the board of directors regarding, among other matters, the planned scope and timing of the audit and significant audit findings, including any significant deficiencies in internal control that we identify during our audit.
We also provide the board of directors with a statement that we have complied with relevant ethical requirements regarding independence, and communicate with them all relationships and other matters that may reasonably be thought to bear on our independence and where applicable, related safeguards.
From the matters communicated with the board of directors, we determine those matters that were of most significance in the audit of the financial statements of the
current period and are therefore the key audit matters. We describe these matters in our auditors’ report unless law or regulation precludes public disclosure about the matter or when, in extremely rare circumstances, we determine that a matter should not be communicated in our report because the adverse consequences of doing so would reasonably be expected to outweigh the public interest benefits of such communication.
Report on Other Legal and Regulatory Requirements
Based on our audit, we further report that in our opinion:
a) Proper books of account have been kept by the Company as required by the Companies Act, 2017 (XIX of 2017);
b) the statement of financial position, the statement of profit or loss and other comprehensive income, the statement of changes in equity and the statement of cash flows together with the notes thereon have been drawn up in conformity with the Companies Act, 2017 (XIX of 2017) and are in agreement with the books of account and returns;
c) investments made, expenditure incurred and guarantees extended during the year were for the purpose of the Company’s business; and
d) zakat deductible at source under the Zakat and Ushr Ordinance, 1980 (XVIII of 1980), was deducted by the Company and deposited in the Central Zakat Fund established under section 7 of that Ordinance.
The engagement partner on the audit resulting in this independent auditors’ report is Atif Zamurrad Malik.
KPMG Taseer Hadi & Co. Chartered Accountants Islamabad 1 February 2019
199Annual Report 2018
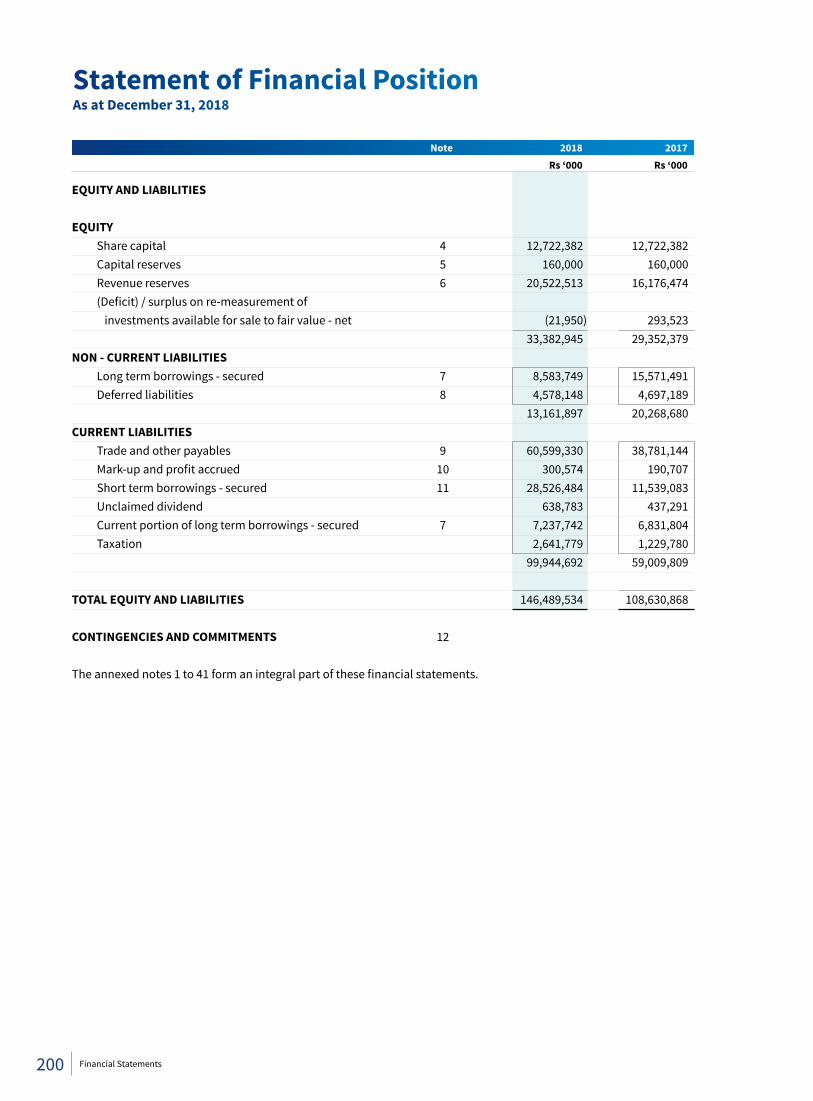
Note 2018 2017 Rs ‘000 Rs ‘000
EQUITY AND LIABILITIES EQUITY Share capital 4 12,722,382 12,722,382 Capital reserves 5 160,000 160,000 Revenue reserves 6 20,522,513 16,176,474 (Deficit) / surplus on re-measurement of investments available for sale to fair value - net (21,950) 293,523 33,382,945 29,352,379 NON - CURRENT LIABILITIES Long term borrowings - secured 7 8,583,749 15,571,491 Deferred liabilities 8 4,578,148 4,697,189 13,161,897 20,268,680 CURRENT LIABILITIES Trade and other payables 9 60,599,330 38,781,144 Mark-up and profit accrued 10 300,574 190,707 Short term borrowings - secured 11 28,526,484 11,539,083 Unclaimed dividend 638,783 437,291 Current portion of long term borrowings - secured 7 7,237,742 6,831,804 Taxation 2,641,779 1,229,780 99,944,692 59,009,809 TOTAL EQUITY AND LIABILITIES 146,489,534 108,630,868 CONTINGENCIES AND COMMITMENTS 12
The annexed notes 1 to 41 form an integral part of these financial statements.
Statement of Financial PositionAs at December 31, 2018
200 Financial Statements
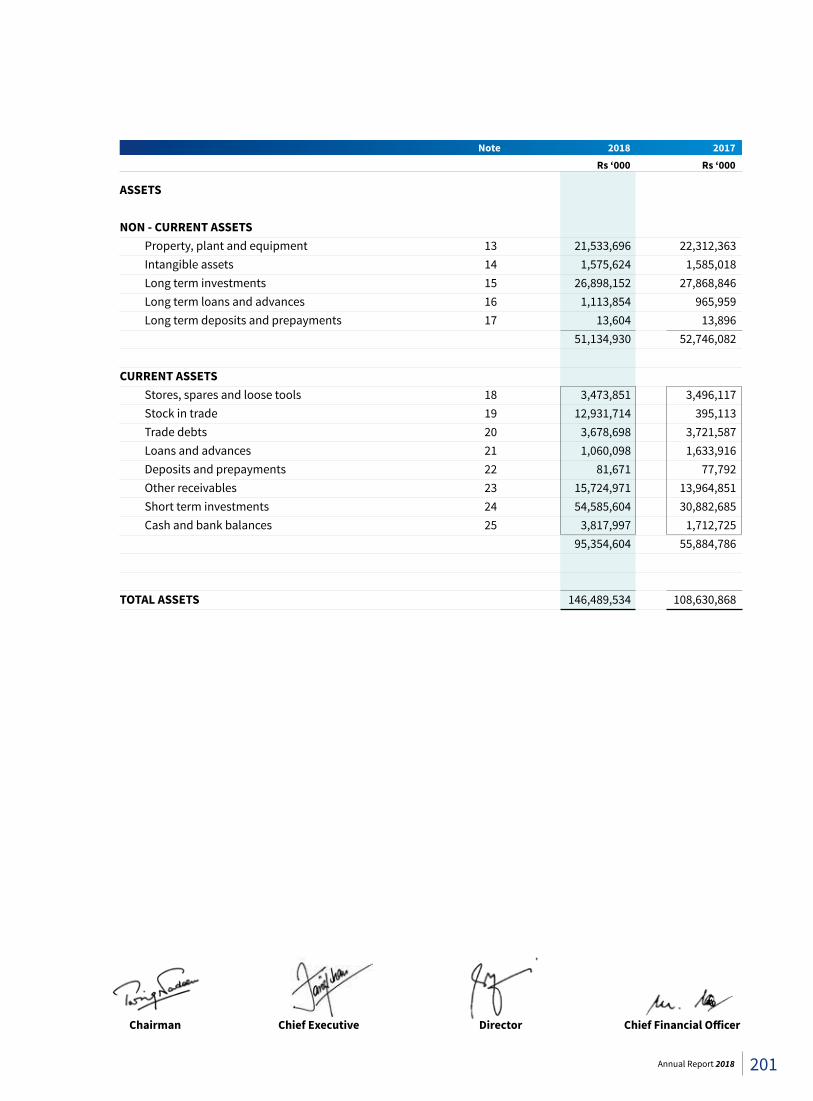
Note 2018 2017 Rs ‘000 Rs ‘000
ASSETS NON - CURRENT ASSETS Property, plant and equipment 13 21,533,696 22,312,363 Intangible assets 14 1,575,624 1,585,018 Long term investments 15 26,898,152 27,868,846 Long term loans and advances 16 1,113,854 965,959 Long term deposits and prepayments 17 13,604 13,896 51,134,930 52,746,082 CURRENT ASSETS Stores, spares and loose tools 18 3,473,851 3,496,117 Stock in trade 19 12,931,714 395,113 Trade debts 20 3,678,698 3,721,587 Loans and advances 21 1,060,098 1,633,916 Deposits and prepayments 22 81,671 77,792 Other receivables 23 15,724,971 13,964,851 Short term investments 24 54,585,604 30,882,685 Cash and bank balances 25 3,817,997 1,712,725 95,354,604 55,884,786
TOTAL ASSETS 146,489,534 108,630,868
Chairman ChiefExecutive Director ChiefFinancialOfficer
201Annual Report 2018
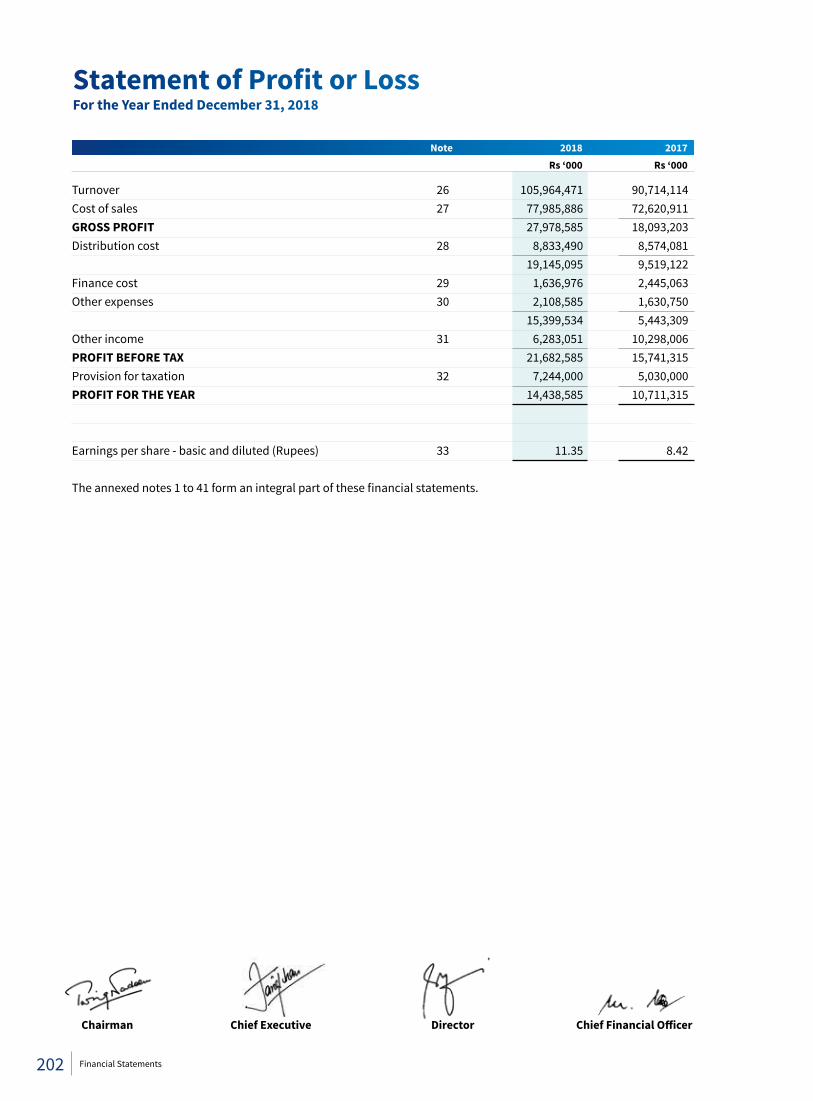
Note 2018 2017 Rs ‘000 Rs ‘000
Turnover 26 105,964,471 90,714,114 Cost of sales 27 77,985,886 72,620,911 GROSS PROFIT 27,978,585 18,093,203 Distribution cost 28 8,833,490 8,574,081 19,145,095 9,519,122 Finance cost 29 1,636,976 2,445,063 Other expenses 30 2,108,585 1,630,750 15,399,534 5,443,309 Other income 31 6,283,051 10,298,006 PROFIT BEFORE TAX 21,682,585 15,741,315 Provision for taxation 32 7,244,000 5,030,000 PROFIT FOR THE YEAR 14,438,585 10,711,315 Earnings per share - basic and diluted (Rupees) 33 11.35 8.42 The annexed notes 1 to 41 form an integral part of these financial statements.
StatementofProfitorLossFor the Year Ended December 31, 2018
Chairman ChiefExecutive Director ChiefFinancialOfficer
202 Financial Statements
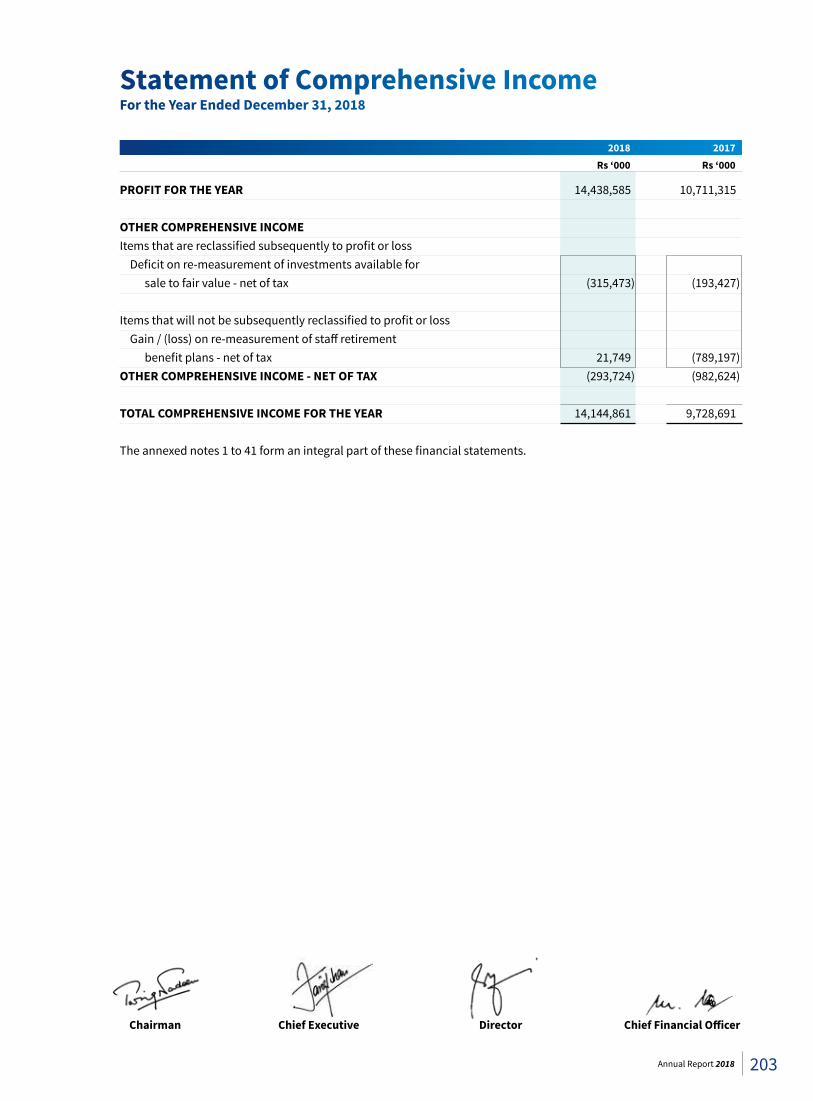
2018 2017 Rs ‘000 Rs ‘000
PROFIT FOR THE YEAR 14,438,585 10,711,315 OTHER COMPREHENSIVE INCOME Items that are reclassified subsequently to profit or loss Deficit on re-measurement of investments available for sale to fair value - net of tax (315,473) (193,427) Items that will not be subsequently reclassified to profit or loss Gain / (loss) on re-measurement of staff retirement benefit plans - net of tax 21,749 (789,197)OTHER COMPREHENSIVE INCOME - NET OF TAX (293,724) (982,624) TOTAL COMPREHENSIVE INCOME FOR THE YEAR 14,144,861 9,728,691 The annexed notes 1 to 41 form an integral part of these financial statements.
Statement of Comprehensive IncomeFor the Year Ended December 31, 2018
Chairman ChiefExecutive Director ChiefFinancialOfficer
203Annual Report 2018
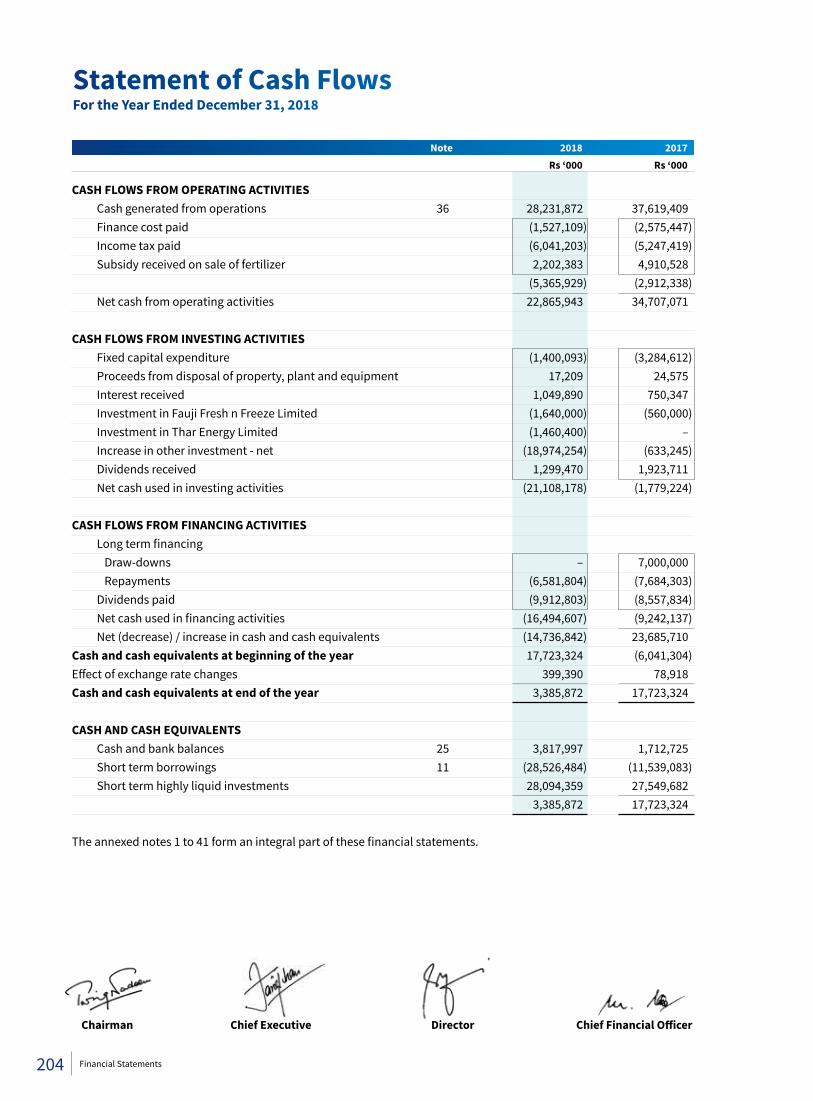
Note 2018 2017 Rs ‘000 Rs ‘000
CASH FLOWS FROM OPERATING ACTIVITIES Cash generated from operations 36 28,231,872 37,619,409 Finance cost paid (1,527,109) (2,575,447) Income tax paid (6,041,203) (5,247,419) Subsidy received on sale of fertilizer 2,202,383 4,910,528 (5,365,929) (2,912,338) Net cash from operating activities 22,865,943 34,707,071 CASH FLOWS FROM INVESTING ACTIVITIES Fixed capital expenditure (1,400,093) (3,284,612) Proceeds from disposal of property, plant and equipment 17,209 24,575 Interest received 1,049,890 750,347 Investment in Fauji Fresh n Freeze Limited (1,640,000) (560,000) Investment in Thar Energy Limited (1,460,400) – Increase in other investment - net (18,974,254) (633,245) Dividends received 1,299,470 1,923,711 Net cash used in investing activities (21,108,178) (1,779,224) CASH FLOWS FROM FINANCING ACTIVITIES Long term financing Draw-downs – 7,000,000 Repayments (6,581,804) (7,684,303) Dividends paid (9,912,803) (8,557,834) Net cash used in financing activities (16,494,607) (9,242,137) Net (decrease) / increase in cash and cash equivalents (14,736,842) 23,685,710 Cash and cash equivalents at beginning of the year 17,723,324 (6,041,304)Effect of exchange rate changes 399,390 78,918 Cash and cash equivalents at end of the year 3,385,872 17,723,324 CASH AND CASH EQUIVALENTS Cash and bank balances 25 3,817,997 1,712,725 Short term borrowings 11 (28,526,484) (11,539,083) Short term highly liquid investments 28,094,359 27,549,682 3,385,872 17,723,324
The annexed notes 1 to 41 form an integral part of these financial statements.
Statement of Cash FlowsFor the Year Ended December 31, 2018
Chairman ChiefExecutive Director ChiefFinancialOfficer
204 Financial Statements
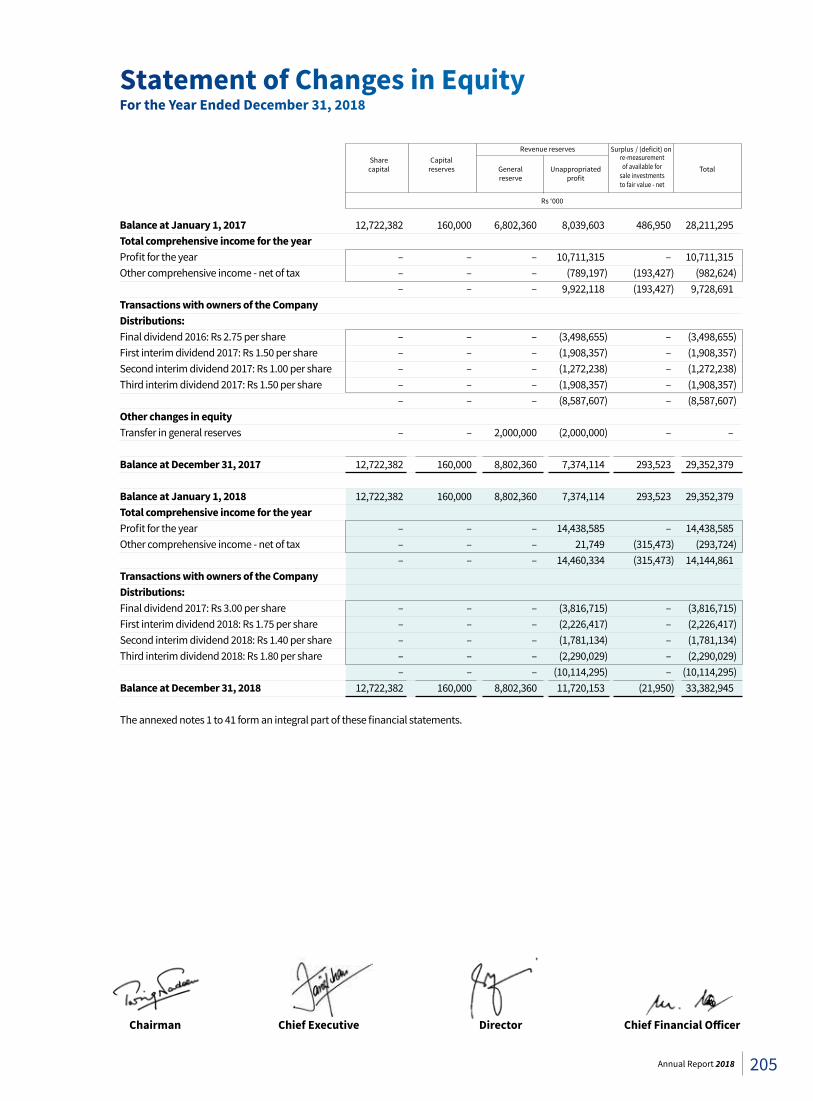
Balance at January 1, 2017 12,722,382 160,000 6,802,360 8,039,603 486,950 28,211,295 Total comprehensive income for the year Profit for the year – – – 10,711,315 – 10,711,315 Other comprehensive income - net of tax – – – (789,197) (193,427) (982,624) – – – 9,922,118 (193,427) 9,728,691 Transactions with owners of the Company Distributions: Final dividend 2016: Rs 2.75 per share – – – (3,498,655) – (3,498,655)First interim dividend 2017: Rs 1.50 per share – – – (1,908,357) – (1,908,357)Second interim dividend 2017: Rs 1.00 per share – – – (1,272,238) – (1,272,238)Third interim dividend 2017: Rs 1.50 per share – – – (1,908,357) – (1,908,357) – – – (8,587,607) – (8,587,607)Other changes in equity Transfer in general reserves – – 2,000,000 (2,000,000) – – Balance at December 31, 2017 12,722,382 160,000 8,802,360 7,374,114 293,523 29,352,379 Balance at January 1, 2018 12,722,382 160,000 8,802,360 7,374,114 293,523 29,352,379 Total comprehensive income for the year Profit for the year – – – 14,438,585 – 14,438,585 Other comprehensive income - net of tax – – – 21,749 (315,473) (293,724) – – – 14,460,334 (315,473) 14,144,861 Transactions with owners of the Company Distributions: Final dividend 2017: Rs 3.00 per share – – – (3,816,715) – (3,816,715)First interim dividend 2018: Rs 1.75 per share – – – (2,226,417) – (2,226,417)Second interim dividend 2018: Rs 1.40 per share – – – (1,781,134) – (1,781,134)Third interim dividend 2018: Rs 1.80 per share – – – (2,290,029) – (2,290,029) – – – (10,114,295) – (10,114,295)Balance at December 31, 2018 12,722,382 160,000 8,802,360 11,720,153 (21,950) 33,382,945
The annexed notes 1 to 41 form an integral part of these financial statements.
Revenue reserves Surplus / (deficit) on Share Capital re-measurement capital reserves General Unappropriated of available for Total reserve profit sale investments to fair value - net
Rs ‘000
Statement of Changes in EquityFor the Year Ended December 31, 2018
Chairman ChiefExecutive Director ChiefFinancialOfficer
205Annual Report 2018
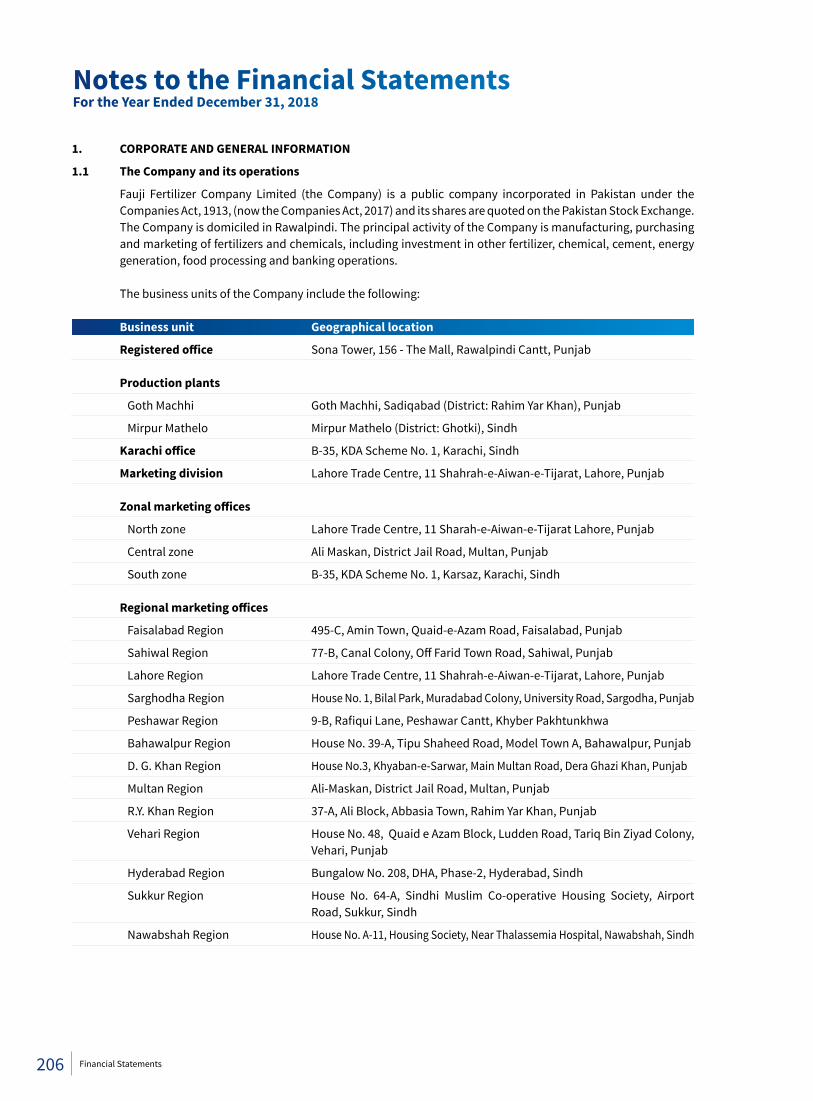
1. CORPORATE AND GENERAL INFORMATION
1.1 The Company and its operations
Fauji Fertilizer Company Limited (the Company) is a public company incorporated in Pakistan under the Companies Act, 1913, (now the Companies Act, 2017) and its shares are quoted on the Pakistan Stock Exchange. The Company is domiciled in Rawalpindi. The principal activity of the Company is manufacturing, purchasing and marketing of fertilizers and chemicals, including investment in other fertilizer, chemical, cement, energy generation, food processing and banking operations.
The business units of the Company include the following:
Business unit Geographical location
Registeredoffice Sona Tower, 156 - The Mall, Rawalpindi Cantt, Punjab
Production plants
Goth Machhi Goth Machhi, Sadiqabad (District: Rahim Yar Khan), Punjab
Mirpur Mathelo Mirpur Mathelo (District: Ghotki), Sindh
Karachioffice B-35, KDA Scheme No. 1, Karachi, Sindh
Marketing division Lahore Trade Centre, 11 Shahrah-e-Aiwan-e-Tijarat, Lahore, Punjab
Zonalmarketingoffices
North zone Lahore Trade Centre, 11 Sharah-e-Aiwan-e-Tijarat Lahore, Punjab
Central zone Ali Maskan, District Jail Road, Multan, Punjab
South zone B-35, KDA Scheme No. 1, Karsaz, Karachi, Sindh
Regionalmarketingoffices
Faisalabad Region 495-C, Amin Town, Quaid-e-Azam Road, Faisalabad, Punjab
Sahiwal Region 77-B, Canal Colony, Off Farid Town Road, Sahiwal, Punjab
Lahore Region Lahore Trade Centre, 11 Shahrah-e-Aiwan-e-Tijarat, Lahore, Punjab
Sarghodha Region House No. 1, Bilal Park, Muradabad Colony, University Road, Sargodha, Punjab
Peshawar Region 9-B, Rafiqui Lane, Peshawar Cantt, Khyber Pakhtunkhwa
Bahawalpur Region House No. 39-A, Tipu Shaheed Road, Model Town A, Bahawalpur, Punjab
D. G. Khan Region House No.3, Khyaban-e-Sarwar, Main Multan Road, Dera Ghazi Khan, Punjab
Multan Region Ali-Maskan, District Jail Road, Multan, Punjab
R.Y. Khan Region 37-A, Ali Block, Abbasia Town, Rahim Yar Khan, Punjab
Vehari Region House No. 48, Quaid e Azam Block, Ludden Road, Tariq Bin Ziyad Colony, Vehari, Punjab
Hyderabad Region Bungalow No. 208, DHA, Phase-2, Hyderabad, Sindh
Sukkur Region House No. 64-A, Sindhi Muslim Co-operative Housing Society, Airport Road, Sukkur, Sindh
Nawabshah Region House No. A-11, Housing Society, Near Thalassemia Hospital, Nawabshah, Sindh
Notes to the Financial StatementsFor the Year Ended December 31, 2018
206 Financial Statements
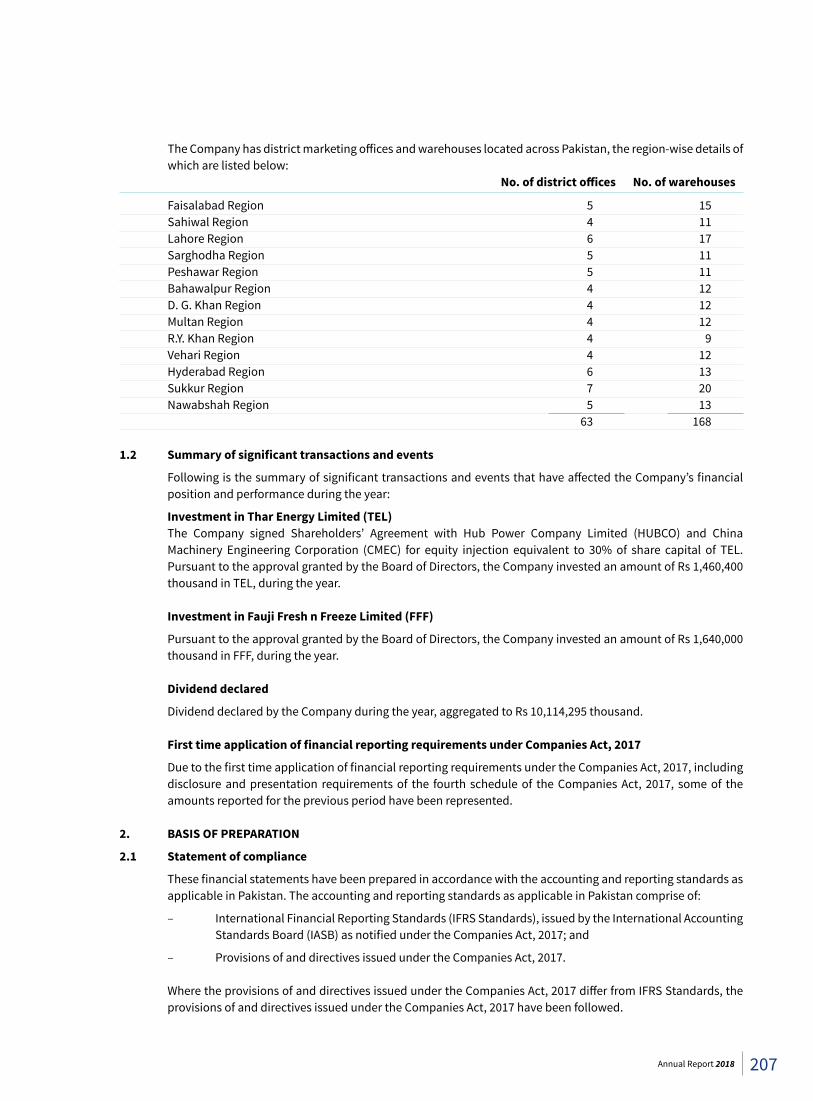
The Company has district marketing offices and warehouses located across Pakistan, the region-wise details of which are listed below:
No.ofdistrictoffices No.ofwarehouses
Faisalabad Region 5 15 Sahiwal Region 4 11 Lahore Region 6 17 Sarghodha Region 5 11 Peshawar Region 5 11 Bahawalpur Region 4 12 D. G. Khan Region 4 12 Multan Region 4 12 R.Y. Khan Region 4 9 Vehari Region 4 12 Hyderabad Region 6 13 Sukkur Region 7 20 Nawabshah Region 5 13 63 168 1.2 Summaryofsignificanttransactionsandevents
Following is the summary of significant transactions and events that have affected the Company’s financial position and performance during the year:
Investment in Thar Energy Limited (TEL) The Company signed Shareholders’ Agreement with Hub Power Company Limited (HUBCO) and China
Machinery Engineering Corporation (CMEC) for equity injection equivalent to 30% of share capital of TEL. Pursuant to the approval granted by the Board of Directors, the Company invested an amount of Rs 1,460,400 thousand in TEL, during the year.
Investment in Fauji Fresh n Freeze Limited (FFF)
Pursuant to the approval granted by the Board of Directors, the Company invested an amount of Rs 1,640,000 thousand in FFF, during the year.
Dividend declared
Dividend declared by the Company during the year, aggregated to Rs 10,114,295 thousand. FirsttimeapplicationoffinancialreportingrequirementsunderCompaniesAct,2017
Due to the first time application of financial reporting requirements under the Companies Act, 2017, including disclosure and presentation requirements of the fourth schedule of the Companies Act, 2017, some of the amounts reported for the previous period have been represented.
2. BASIS OF PREPARATION
2.1 Statement of compliance
These financial statements have been prepared in accordance with the accounting and reporting standards as applicable in Pakistan. The accounting and reporting standards as applicable in Pakistan comprise of:
– International Financial Reporting Standards (IFRS Standards), issued by the International Accounting Standards Board (IASB) as notified under the Companies Act, 2017; and
– Provisions of and directives issued under the Companies Act, 2017.
Where the provisions of and directives issued under the Companies Act, 2017 differ from IFRS Standards, the provisions of and directives issued under the Companies Act, 2017 have been followed.
207Annual Report 2018
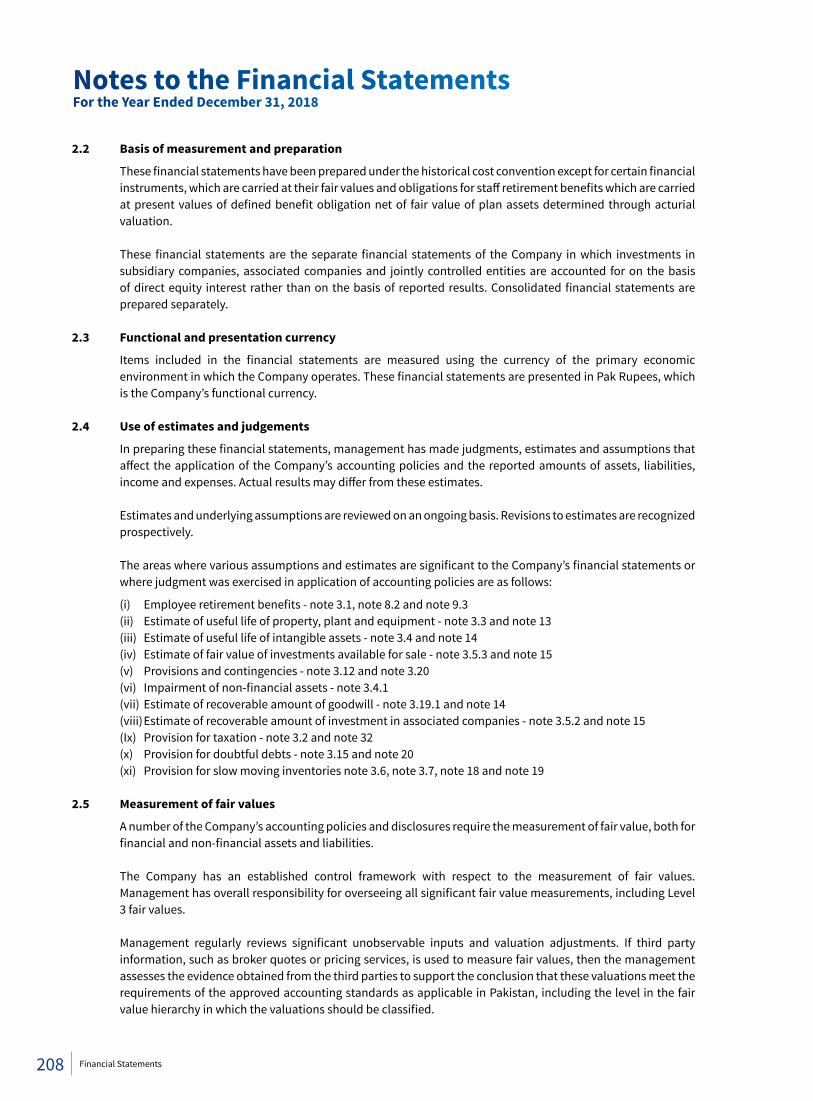
2.2 Basis of measurement and preparation
These financial statements have been prepared under the historical cost convention except for certain financial instruments, which are carried at their fair values and obligations for staff retirement benefits which are carried at present values of defined benefit obligation net of fair value of plan assets determined through acturial valuation.
These financial statements are the separate financial statements of the Company in which investments in
subsidiary companies, associated companies and jointly controlled entities are accounted for on the basis of direct equity interest rather than on the basis of reported results. Consolidated financial statements are prepared separately.
2.3 Functional and presentation currency
Items included in the financial statements are measured using the currency of the primary economic environment in which the Company operates. These financial statements are presented in Pak Rupees, which is the Company’s functional currency.
2.4 Use of estimates and judgements
In preparing these financial statements, management has made judgments, estimates and assumptions that affect the application of the Company’s accounting policies and the reported amounts of assets, liabilities, income and expenses. Actual results may differ from these estimates.
Estimates and underlying assumptions are reviewed on an ongoing basis. Revisions to estimates are recognized
prospectively.
The areas where various assumptions and estimates are significant to the Company’s financial statements or where judgment was exercised in application of accounting policies are as follows:
(i) Employee retirement benefits - note 3.1, note 8.2 and note 9.3 (ii) Estimate of useful life of property, plant and equipment - note 3.3 and note 13 (iii) Estimate of useful life of intangible assets - note 3.4 and note 14 (iv) Estimate of fair value of investments available for sale - note 3.5.3 and note 15 (v) Provisions and contingencies - note 3.12 and note 3.20 (vi) Impairment of non-financial assets - note 3.4.1 (vii) Estimate of recoverable amount of goodwill - note 3.19.1 and note 14 (viii) Estimate of recoverable amount of investment in associated companies - note 3.5.2 and note 15 (Ix) Provision for taxation - note 3.2 and note 32 (x) Provision for doubtful debts - note 3.15 and note 20 (xi) Provision for slow moving inventories note 3.6, note 3.7, note 18 and note 19 2.5 Measurement of fair values
A number of the Company’s accounting policies and disclosures require the measurement of fair value, both for financial and non-financial assets and liabilities.
The Company has an established control framework with respect to the measurement of fair values.
Management has overall responsibility for overseeing all significant fair value measurements, including Level 3 fair values.
Management regularly reviews significant unobservable inputs and valuation adjustments. If third party
information, such as broker quotes or pricing services, is used to measure fair values, then the management assesses the evidence obtained from the third parties to support the conclusion that these valuations meet the requirements of the approved accounting standards as applicable in Pakistan, including the level in the fair value hierarchy in which the valuations should be classified.
Notes to the Financial StatementsFor the Year Ended December 31, 2018
208 Financial Statements
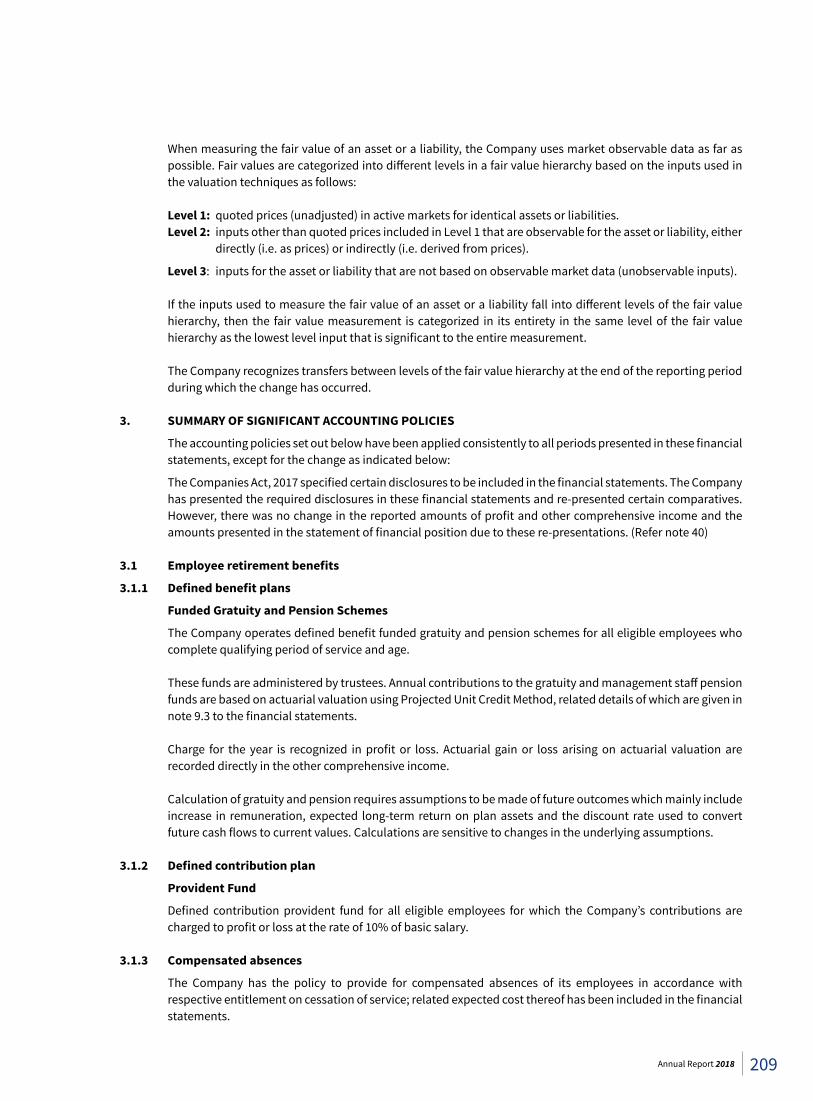
When measuring the fair value of an asset or a liability, the Company uses market observable data as far as possible. Fair values are categorized into different levels in a fair value hierarchy based on the inputs used in the valuation techniques as follows:
Level 1: quoted prices (unadjusted) in active markets for identical assets or liabilities.
Level 2: inputs other than quoted prices included in Level 1 that are observable for the asset or liability, either directly (i.e. as prices) or indirectly (i.e. derived from prices).
Level 3: inputs for the asset or liability that are not based on observable market data (unobservable inputs).
If the inputs used to measure the fair value of an asset or a liability fall into different levels of the fair value hierarchy, then the fair value measurement is categorized in its entirety in the same level of the fair value hierarchy as the lowest level input that is significant to the entire measurement.
The Company recognizes transfers between levels of the fair value hierarchy at the end of the reporting period
during which the change has occurred. 3. SUMMARY OF SIGNIFICANT ACCOUNTING POLICIES
The accounting policies set out below have been applied consistently to all periods presented in these financial statements, except for the change as indicated below:
The Companies Act, 2017 specified certain disclosures to be included in the financial statements. The Company has presented the required disclosures in these financial statements and re-presented certain comparatives. However, there was no change in the reported amounts of profit and other comprehensive income and the amounts presented in the statement of financial position due to these re-presentations. (Refer note 40)
3.1 Employeeretirementbenefits
3.1.1 Definedbenefitplans
Funded Gratuity and Pension Schemes
The Company operates defined benefit funded gratuity and pension schemes for all eligible employees who complete qualifying period of service and age.
These funds are administered by trustees. Annual contributions to the gratuity and management staff pension
funds are based on actuarial valuation using Projected Unit Credit Method, related details of which are given in note 9.3 to the financial statements.
Charge for the year is recognized in profit or loss. Actuarial gain or loss arising on actuarial valuation are
recorded directly in the other comprehensive income. Calculation of gratuity and pension requires assumptions to be made of future outcomes which mainly include
increase in remuneration, expected long-term return on plan assets and the discount rate used to convert future cash flows to current values. Calculations are sensitive to changes in the underlying assumptions.
3.1.2 Definedcontributionplan
Provident Fund
Defined contribution provident fund for all eligible employees for which the Company’s contributions are charged to profit or loss at the rate of 10% of basic salary.
3.1.3 Compensated absences
The Company has the policy to provide for compensated absences of its employees in accordance with respective entitlement on cessation of service; related expected cost thereof has been included in the financial statements.
209Annual Report 2018
3.2 Taxation
Income tax expense comprises current and deferred tax.
Current tax
Provision for current taxation is based on taxable income at the applicable rates of taxation after taking into account tax credits and tax rebates, if any. Income tax expense is recognized in profit or loss except to the extent that it relates to items recognized directly in equity or in other comprehensive income.
Deferred tax
Deferred tax is recognized in respect of temporary differences arising from differences between the carrying amount of assets and liabilities in the financial statements and the corresponding tax bases used in the computation of taxable profit. Deferred tax liabilities are recognized for all taxable temporary differences and deferred tax assets are recognized to the extent that it is probable that taxable profits will be available against which the deductible temporary differences, unused tax losses and tax credits can be utilized. Deferred tax assets are reviewed at each reporting date and are reduced to the extent that it is no longer probable that the related tax benefit will be realized. Deferred tax is not recognized on temporary differences arising from the initial recognition of assets or liabilities in a transaction that is not a business combination and that affects neither accounting nor taxable profit or loss, and differences arising on the initial recognition of goodwill.
Deferred tax is calculated at the rates that are expected to apply to the period when the differences reverse,
based on tax rates that have been enacted. Deferred tax assets and liabilities are offset if there is a legally enforceable right to offset current tax liabilities and assets, and they relate to income taxes levied by the same tax authority on the same taxable entity, or on different taxable entities, but they intend to settle current tax liabilities and assets on a net basis or their tax assets and liabilities will be realized simultaneously.
The Company takes into account the current income tax law and decisions taken by the taxation authorities.
Instances where the Company’s views differ from the income tax department at the assessment stage and where the Company considers that its view on items of material nature is in accordance with law, the amounts are shown as contingent liabilities.
3.3 Property, plant and equipment and capital work in progress
Property, plant and equipment are stated at cost less accumulated depreciation and any impairment losses, except freehold land and capital work in progress, which are stated at cost less impairment losses, if any. Cost comprises acquisition and other directly attributable costs.
Depreciation is provided on a straight-line basis and charged to profit or loss to write off the depreciable
amount of each asset over its estimated useful life at the rates specified in note 13. Depreciation on addition in property, plant and equipment is charged from the date when the asset becomes available for use upto the date of its disposal.
The cost of replacing part of an item of property, plant and equipment is recognized in the carrying amount of the item if it is probable that the future economic benefits embodied within the part will flow to the Company and its cost can be measured reliably. The carrying amount of the replaced part is derecognized, if any. The costs of the day-to-day servicing of property, plant and equipment are recognized in profit or loss as incurred.
Gains and losses on disposal of an item of property, plant and equipment are determined by comparing the
proceeds from disposal with the carrying amount of property, plant and equipment, and are recognized net within other income in profit or loss.
The Company reviews the useful life and residual value of property, plant and equipment on a regular basis.
Any change in estimates in future years might affect the carrying amounts of the respective items of property, plant and equipment with a corresponding effect on depreciation charge and impairment.
Notes to the Financial StatementsFor the Year Ended December 31, 2018
210 Financial Statements
3.4 Impairment
3.4.1 Non-financialassets
The carrying amounts of non-financial assets other than inventories, are reviewed at each reporting date to determine whether there is any indication of impairment. If any such indication exists, then the asset’s recoverable amount is estimated. The recoverable amount of an asset or cash-generating unit is the greater of its value in use and its fair value less costs to sell. In assessing value in use, the estimated future cash flows are discounted to their present value using a pre-tax discount rate that reflects current market assessment of the time value of money and the risks specific to the asset. For the purpose of impairment testing, assets that cannot be tested individually are grouped together into the smallest group of assets that generates cash inflows from continuing use that are largely independent of the cash inflows of other assets or groups of assets (the “cash-generating unit, or CGU”).
The Company’s corporate assets do not generate separate cash inflows. If there is an indication that a corporate asset may be impaired, then the recoverable amount is determined for the CGU to which the corporate asset belongs. An impairment loss is recognized if the carrying amount of an asset or its CGU exceeds its estimated recoverable amount. Impairment losses are recognized in profit or loss.
Impairment loss recognized in prior periods are assessed at each reporting date for any indications that the loss
has decreased or no longer exists. An impairment loss is reversed if there has been a change in the estimates used to determine the recoverable amount. An impairment loss is reversed only to the extent that the asset’s carrying amount does not exceed the carrying amount that would have been determined, net of depreciation or amortization, if no impairment loss had been recognized.
3.4.2 Financial assets
Financial assets are assessed at each reporting date to determine whether there is objective evidence that they are impaired. A financial asset is impaired if objective evidence indicates that a loss event has occurred after the initial recognition of the asset, and that the loss event had a negative effect on the estimated future cash flows of that asset that can be estimated reliably. Objective evidence that financial assets are impaired may include default or delinquency by a debtor, indications that a debtor or issuer will enter bankruptcy.
All individually significant assets are assessed for specific impairment. All individually significant assets found not to be specifically impaired are then collectively assessed for any impairment that has been incurred but not yet identified. Assets that are not individually significant are collectively assessed for impairment by grouping together assets with similar risk characteristics.
An impairment loss in respect of a financial asset measured at amortized cost is calculated as the difference
between its carrying amount and the present value of the estimated future cash flows discounted at the asset’s original effective interest rate. Losses are recognized in profit or loss and reflected in an allowance account. Interest on the impaired asset continues to be recognized through the unwinding of the discount. When a subsequent event causes the amount of impairment loss to decrease, the decrease in impairment loss is reversed through profit or loss.
3.5 Investments
3.5.1 Investment in subsidiary entities
Investment in subsidiary is initially recognized at cost. At subsequent reporting date, recoverable amounts are estimated to determine the extent of impairment loss, if any, and carrying amount of investment is adjusted accordingly. Impairment losses are recognized as an expense in profit or loss. Where impairment loss subsequently reverses, the carrying amount of investment is increased to its revised recoverable amount but limited to the extent of initial cost of investment. Reversal of impairment losses are recognized in the profit or loss.
211Annual Report 2018
The profits and losses of subsidiaries are carried forward in their financial statements and not dealt within these financial statements except to the extent of dividend declared by the subsidiaries which are recognized in other income. Gains and losses on disposal of investment is included in other income. When the disposal of investment in subsidiary results in loss of control such that it becomes an associate, the retained investment is carried at cost.
3.5.2 Investment in associated and jointly controlled entities
Investments in associates and jointly controlled entities are initially recognized at cost. At subsequent reporting date, the recoverable amounts are estimated to determine the extent of impairment losses, if any, and carrying amounts of investments are adjusted accordingly. Impairment losses are recognized as expense in the profit or loss. Where impairment losses subsequently reverse, the carrying amounts of the investments are increased to the revised recoverable amounts but limited to the extent of initial cost of investments. A reversal of impairment loss is recognized in the profit or loss.
The profits and losses of associates and jointly controlled entities are carried forward in their financial
statements and not dealt within these financial statements except to the extent of dividend declared by the associates and jointly controlled entities which are recognized in other income. Gains and losses on disposal of investment is included in other income.
3.5.3 Investments available for sale
These are initially measured at their fair value plus directly attributable transaction cost and at subsequent reporting dates measured at fair values and gains or losses from changes in fair values other than impairment loss are recognized in other comprehensive income until disposal at which time these are recycled to profit or loss. Impairment loss on investments available for sale is recognized in the profit or loss.
3.5.4 Investmentsatfairvaluethroughprofitorloss
Investments which are acquired principally for the purpose of selling in the near term or the investments that are part of a portfolio of financial instruments exhibiting short term profit taking, are classified as fair value through profit or loss and designated as such upon initial recognition. These are stated at fair values with any resulting gains or losses recognized directly in profit or loss.
The Company recognizes the regular way purchase or sale of financial assets using settlement date
accounting. 3.5.5 Loans and receivables
Investments are classified as loans and receivables which have fixed or determinable payments and are not quoted in an active market. These investments are initially measured at fair values plus directly attributable transaction costs. Subsequent to initial recognition, these are stated at their amortized cost using the effective interest method, less any impairment losses.
3.6 Stores, spares and loose tools
Stores, spares and loose tools are valued at lower of weighted average cost and net realizable value. For items which are slow moving and / or identified as surplus to the Company’s requirements, adequate
provision is made for any excess book value over estimated net realizable value. The Company reviews the carrying amount of stores, spare parts and loose tools on a regular basis and provision is made for obsolescence.
Net realizable value is the estimated selling price in the ordinary course of business, less the estimated costs of
completion and estimated costs necessary to make the sale.
Notes to the Financial StatementsFor the Year Ended December 31, 2018
212 Financial Statements
The Company reviews the carrying amount of stores, spares and loose tools on a regular basis and as appropriate, these are written down to its net realizable value or provision is made for obsolescence if there is any change in usage pattern and / or physical form of related inventory.
3.7 Stock in trade
Stocks are valued at the lower of cost and net realizable value. Cost is determined as follows:
Raw materials at weighted average purchase cost Work in process and finished goods at weighted average cost of purchase, raw materials and applicable
manufacturing expenses
Cost of raw material, work in process and finished goods comprises of direct materials, labor and appropriate manufacturing overheads. Net realizable value signifies the estimated selling price in the ordinary course of business less the estimated costs of completion and the estimated costs necessary to make the sale.
The Company reviews the carrying amount of stock in trade on a regular basis and as appropriate, these are
written down to its net realizable value or provision is made for obsolescence if there is any change in usage pattern and / or physical form of related inventory.
3.8 Foreign currency transaction and translation
Transactions in foreign currency are accounted for at the exchange rates prevailing on the date of transactions. Monetary assets and liabilities denominated in foreign currencies at the year end are translated in Pakistan Rupees at exchange rates ruling at the reporting date. Non monetary items that are measured in terms of historical cost in a foreign currency are translated using exchange rate at the date of transaction. Exchange differences are included in profit or loss for the year.
3.9 Turnover
Turnover from the sale of goods in the course of ordinary activities is measured at the fair value of the consideration received or receivable, net of returns, trade discounts and volume rebates. Turnover is recognized when significant risk and rewards of ownership have been transferred to the customers, recovery of the consideration is probable, the associated costs and possible return of the goods can be estimated reliably, there is no continuing management involvement with the goods, and the amount of turnover can be measured reliably. Scrap sales and miscellaneous receipts are recognized on realized amounts.
Government subsidy on sale of fertilizer is recognised when the right to receive such subsidy has been
established and the underlying conditions are met. Government subsidy is recognised in other income. 3.10 Borrowing costs
Borrowing costs which are directly attributable to the acquisition, construction or production of a qualifying asset are capitalized as part of the cost of that asset. Borrowing cost includes exchange differences arising from foreign currency borrowings to the extent these are regarded as an adjustment to borrowing costs. All other borrowing costs are charged to profit or loss.
3.11 Research and development costs
Research and development costs are charged to profit or loss as and when incurred. 3.12 Provisions
A provision is recognized in the statement of financial position when the Company has a legal or constructive obligation as a result of a past event, and it is probable that an outflow of economic benefits will be required to settle the obligation and a reliable estimate can be made of the amount of obligation. Provisions are
213Annual Report 2018
determined by discounting the expected future cash flows at a pre tax discount rate that reflects current market assessment of time value of money and risk specific to the liability.
Provisions are reviewed at each reporting date and adjusted to reflect current best estimate. 3.13 Basis of allocation of common expenses
Distribution cost is allocated to Fauji Fertilizer Bin Qasim Limited (FFBL), in proportion to the sales volume handled on its behalf under the Inter Company Services Agreement.
3.14 Share capital and dividend
Dividend is recognized as a liability in the period in which it is declared. Movement in reserves is recognized in the year in which it is approved.
3.15 Financial instruments
Non-derivativefinancialassets
These are initially recognized on the date that they are originated i.e. trade date which is the date that the Company becomes a party to the contractual provisions of the instrument.
A financial asset is derecognized when the contractual rights to the cash flows from the asset expire, or when
the Company transfers the rights to receive the contractual cash flows in a transaction in which substantially all the risks and rewards of ownership of the financial asset are transferred. Any interest in such transferred financial assets that is created or retained by the Company is recognized as a separate asset or liability.
The Company classifies non-derivative financial assets as available for sale, held for trading, loans and other
receivables. Loans and receivables comprise investments classified as loans and receivables, cash and cash equivalents and trade and other receivables.
Tradedebts,otherreceivablesandotherfinancialassets
Trade debts and other receivables are initially recognized at fair value plus any directly attributable transaction cost. Subsequent to initial recognition, these are measured at amortized cost using effective interest method, less any impairment losses. Known bad debts are written off, when identified.
Cash and cash equivalents
Cash and cash equivalents comprise cash in hand, cash with banks on current, saving and deposit accounts, short term borrowings and other short term highly liquid investments that are readily convertible to known amounts of cash and which are subject to insignificant risk of change in value.
Non-derivativefinancialliabilities
The Company initially recognizes non derivative financial liabilities on the date that they are originated or the date that the Company becomes a party to the contractual provisions of the instrument. The Company derecognizes a financial liability when its contractual obligations are discharged, cancelled or expired.
These financial liabilities are recognized initially at fair value less any directly attributable transaction
costs. Subsequent to initial recognition, these financial liabilities are measured at amortized cost using the effective interest method. Non-derivative financial liabilities comprise mark-up bearing borrowings including obligations under finance lease, bank overdrafts and trade and other payables.
Offsettingoffinancialassetsandfinancialliabilities
Financial assets and financial liabilities are offset and the net amount is reported in the statement of financial position if the Company has a legally enforceable right to setoff the recognized amounts and intends either to settle on a net basis or to realize the assets and settle the liabilities simultaneously.
Notes to the Financial StatementsFor the Year Ended December 31, 2018
214 Financial Statements
3.16 Earnings per share
The Company presents basic and diluted earnings per share (EPS) data for its ordinary shares. Basic EPS is calculated by dividing the profit or loss attributable to ordinary shareholders of the Company by the weighted average number of ordinary shares outstanding during the year. Diluted EPS is determined by adjusting the profit or loss attributable to ordinary shareholders and the weighted average number of ordinary shares outstanding, adjusted for the effects of all dilutive potential ordinary shares.
3.17 Financeincomeandfinancecosts
Finance income comprises interest income on funds invested (including available-for-sale financial assets), dividend income, gain on disposal of available-for-sale financial assets, commission income and changes in fair value of investments held for trading. Interest income is recognized as it accrues in profit or loss, using effective interest method. Dividend income is recognized in profit or loss on the date that the Company’s right to receive payment is established.
Finance costs comprise interest expense on borrowings, changes in fair value of investment carried at fair
value through profit or loss and impairment losses recognized on financial assets. Borrowing costs that are not directly attributable to the acquisition, construction or production of a qualifying asset are recognized in profit or loss using effective interest method.
Foreign currency gains and losses are reported on a net basis. 3.18 Leases
Operating leases
Rentals payable under operating leases are charged to profit or loss on a straight line basis over the term of the relevant lease.
3.19 Intangible assets
3.19.1 Goodwill
Goodwill arises on the acquisition of subsidiaries or businesses and represents the excess of the consideration transferred, the amount of any non-controlling interest in the acquiree and the acquisition-date fair value of any previous equity interest in the acquiree over the fair value of the identifiable net assets acquired. If the total of consideration transferred, non-controlling interest recognized and previously held interest measured at fair value is less than the fair value of the net assets of the subsidiary acquired, the difference is recognized directly in the profit or loss.
For the purpose of impairment testing, goodwill acquired in a business combination is allocated to each of
the cash generating units (CGUs), or groups of CGUs, that is expected to benefit from the synergies of the combination. Each unit or group of units to which the goodwill is allocated represents the lowest level within the entity at which the goodwill is monitored for internal management purposes. Goodwill is monitored at the operating segment level.
Goodwill impairment reviews are undertaken annually or more frequently if events or changes in circumstances
indicate a potential impairment. The carrying value of the CGU containing the goodwill is compared to the recoverable amount, which is the higher of value in use and the fair value less costs of disposal. Any impairment is recognized immediately as an expense in profit or loss and is not subsequently reversed.
3.19.2 Withfiniteusefullife
Intangibles are stated at the cash price equivalent of the consideration given less accumulated amortization and impairment loss, if any. Intangibles with finite useful lives are amortized over the period of their useful lives. Rates for amortization are disclosed in Note 14.1. Amortization is charged on a straight line basis over the estimated useful life and is included in the profit or loss.
215Annual Report 2018
3.20 Contingent liabilities
A contingent liability is disclosed when the Company has a possible obligation as a result of past events, whose existence will be confirmed only by the occurrence or non-occurrence, of one or more uncertain future events not wholly within the control of the Company; or the Company has a present legal or constructive obligation that arises from past events, but it is not probable that an outflow of resources embodying economic benefits will be required to settle the obligation, or the amount of the obligation cannot be measured with sufficient reliability.
3.21 Newaccountingstandards,amendmentsandIFRICinterpretationsthatarenotyeteffective
The following International Financial Reporting Standards (IFRS Standards) as notified under the Companies Act, 2017 and the amendments and interpretations thereto will be effective for accounting periods beginning on or after January 1, 2019:
– IFRIC 23 ‘Uncertainty over Income Tax Treatments’ (effective for annual periods beginning on or after
January 1, 2019) clarifies the accounting for income tax when there is uncertainty over income tax treatments under IAS 12. The interpretation requires the uncertainty over tax treatment be reflected in the measurement of current and deferred tax. The application of interpretation is not likely to have an impact on Company’s financial statements.
– IFRS 15 ‘Revenue from contracts with customers’ (effective for annual periods beginning on or after July 1, 2018). IFRS 15 establishes a comprehensive framework for determining whether, how much and when revenue is recognized. It replaces existing revenue recognition guidance, including IAS 18 ‘Revenue’, IAS 11 ‘Construction Contracts’ and IFRIC 13 ‘Customer Loyalty Programmes’. The Company is currently in the process of analyzing the potential impact of changes required in revenue recognition policies on adoption of the standard.
– IFRS 9 ‘Financial Instruments’ and amendment – Prepayment Features with Negative Compensation (effective for annual periods beginning on or after July 1, 2018 and January 1, 2019 respectively). IFRS 9 replaces the existing guidance in IAS 39 Financial Instruments: Recognition and Measurement. IFRS 9 includes revised guidance on the classification and measurement of financial instruments, a new expected credit loss model for calculating impairment on financial assets, and new general hedge accounting requirements. It also carries forward the guidance on recognition and derecognition of financial instruments from IAS 39. The Company is currently in the process of analysing the potential impact of changes required in classification and measurement of financial instruments and the impact of expected loss model on adoption of the standard.
– IFRS 16 ‘Leases’ (effective for annual period beginning on or after January 1, 2019). IFRS 16 replaces
existing leasing guidance, including IAS 17 ‘Leases’, IFRIC 4 ‘Determining whether an Arrangement contains a Lease’, SIC-15 ‘Operating Leases - Incentives’ and SIC-27 ‘Evaluating the Substance of Transactions Involving the Legal Form of a Lease’. IFRS 16 introduces a single, on-balance sheet lease accounting model for lessees. A lessee recognizes a right-of-use asset representing its right to use the underlying asset and a lease liability representing its obligation to make lease payments. There are recognition exemptions for short-term leases and leases of low-value items. Lessor accounting remains similar to the current standard i.e. lessors continue to classify leases as finance or operating leases. The Company is currently in the process of analyzing the potential impact of its lease arrangements that will result in recognition of right to use assets and liabilities on adoption of the standard.
– Amendment to IAS 28 ‘Investments in Associates and Joint Ventures’ - Long Term Interests in
Associates and Joint Ventures (effective for annual period beginning on or after January 1, 2019). The amendment will affect companies that finance such entities with preference shares or with loans for
Notes to the Financial StatementsFor the Year Ended December 31, 2018
216 Financial Statements
which repayment is not expected in the foreseeable future (referred to as long-term interests or ‘LTI’). The amendment and accompanying example state that LTI are in the scope of both IFRS 9 and IAS 28 and explain the annual sequence in which both standards are to be applied. The amendments are not likely to have an impact on Company’s financial statements.
– Amendments to IAS 19 ‘Employee Benefits’- Plan Amendment, Curtailment or Settlement (effective for annual periods beginning on or after January 1, 2019). The amendments clarify that on amendment, curtailment or settlement of a defined benefit plan, a company now uses updated actuarial assumptions to determine its current service cost and net interest for the period; and the effect of the asset ceiling is disregarded when calculating the gain or loss on any settlement of the plan and is dealt with separately in other comprehensive income. The application of amendments is not likely to have an impact on Company’s financial statements.
– Amendment to IFRS 3 ‘Business Combinations’ – Definition of a Business (effective for business
combinations for which the acquisition date is on or after the beginning of annual period beginning on or after January 1, 2020). The IASB has issued amendments aiming to resolve the difficulties that arise when an entity determines whether it has acquired a business or a group of assets. The amendments clarify that to be considered a business, an acquired set of activities and assets must include, at a minimum, an input and a substantive process that together significantly contribute to the ability to create outputs. The amendments include an election to use a concentration test. The standard is effective for transactions in the future and therefore would not have an impact on past financial statements.
– Amendments to IAS 1 Presentation of Financial Statements and IAS 8 Accounting Policies, Changes in
Accounting Estimates and Errors (effective for annual periods beginning on or after January 1, 2020). The amendments are intended to make the definition of material in IAS 1 easier to understand and are not intended to alter the underlying concept of materiality in IFRS Standards. In addition, the IASB has also issued guidance on how to make materiality judgements when preparing their general purpose financial statements in accordance with IFRS Standards.
Annual Improvements to IFRS Standards 2015–2017 Cycle - the improvements address amendments to following approved accounting standards: – IFRS 3 Business Combinations and IFRS 11 Joint Arrangement - the amendment aims to clarify the
accounting treatment when a company increases its interest in a joint operation that meets the definition of a business. A company remeasures its previously held interest in a joint operation when it obtains control of the business. A company does not remeasure its previously held interest in a joint operation when it obtains joint control of the business.
– IAS 12 Income Taxes - the amendment clarifies that all income tax consequences of dividends
(including payments on financial instruments classified as equity) are recognized consistently with the transaction that generates the distributable profits.
– IAS 23 Borrowing Costs - the amendment clarifies that a company treats as part of general borrowings
any borrowing originally made to develop an asset when the asset is ready for its intended use or sale.
The above amendments are effective from annual period beginning on or after January 1, 2019 and are not
likely to have an impact on Company’s financial statements.
217Annual Report 2018
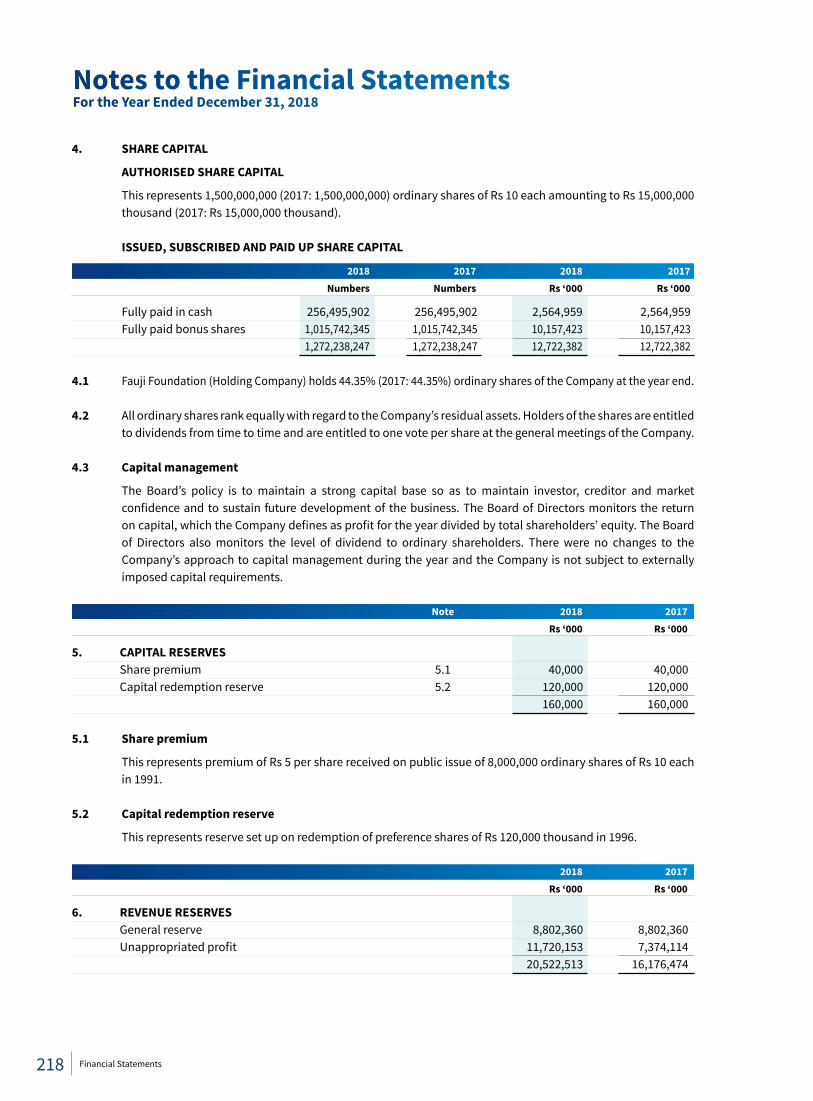
4. SHARE CAPITAL
AUTHORISED SHARE CAPITAL
This represents 1,500,000,000 (2017: 1,500,000,000) ordinary shares of Rs 10 each amounting to Rs 15,000,000 thousand (2017: Rs 15,000,000 thousand).
ISSUED, SUBSCRIBED AND PAID UP SHARE CAPITAL
2018 2017 2018 2017 Numbers Numbers Rs ‘000 Rs ‘000
Fully paid in cash 256,495,902 256,495,902 2,564,959 2,564,959 Fully paid bonus shares 1,015,742,345 1,015,742,345 10,157,423 10,157,423 1,272,238,247 1,272,238,247 12,722,382 12,722,382 4.1 Fauji Foundation (Holding Company) holds 44.35% (2017: 44.35%) ordinary shares of the Company at the year end.
4.2 All ordinary shares rank equally with regard to the Company’s residual assets. Holders of the shares are entitled to dividends from time to time and are entitled to one vote per share at the general meetings of the Company.
4.3 Capital management
The Board’s policy is to maintain a strong capital base so as to maintain investor, creditor and market confidence and to sustain future development of the business. The Board of Directors monitors the return on capital, which the Company defines as profit for the year divided by total shareholders’ equity. The Board of Directors also monitors the level of dividend to ordinary shareholders. There were no changes to the Company’s approach to capital management during the year and the Company is not subject to externally imposed capital requirements.
Note 2018 2017 Rs ‘000 Rs ‘000
5. CAPITAL RESERVES Share premium 5.1 40,000 40,000 Capital redemption reserve 5.2 120,000 120,000 160,000 160,000
5.1 Share premium
This represents premium of Rs 5 per share received on public issue of 8,000,000 ordinary shares of Rs 10 each in 1991.
5.2 Capital redemption reserve
This represents reserve set up on redemption of preference shares of Rs 120,000 thousand in 1996.
2018 2017 Rs ‘000 Rs ‘000
6. REVENUE RESERVES General reserve 8,802,360 8,802,360 Unappropriated profit 11,720,153 7,374,114 20,522,513 16,176,474
Notes to the Financial StatementsFor the Year Ended December 31, 2018
218 Financial Statements
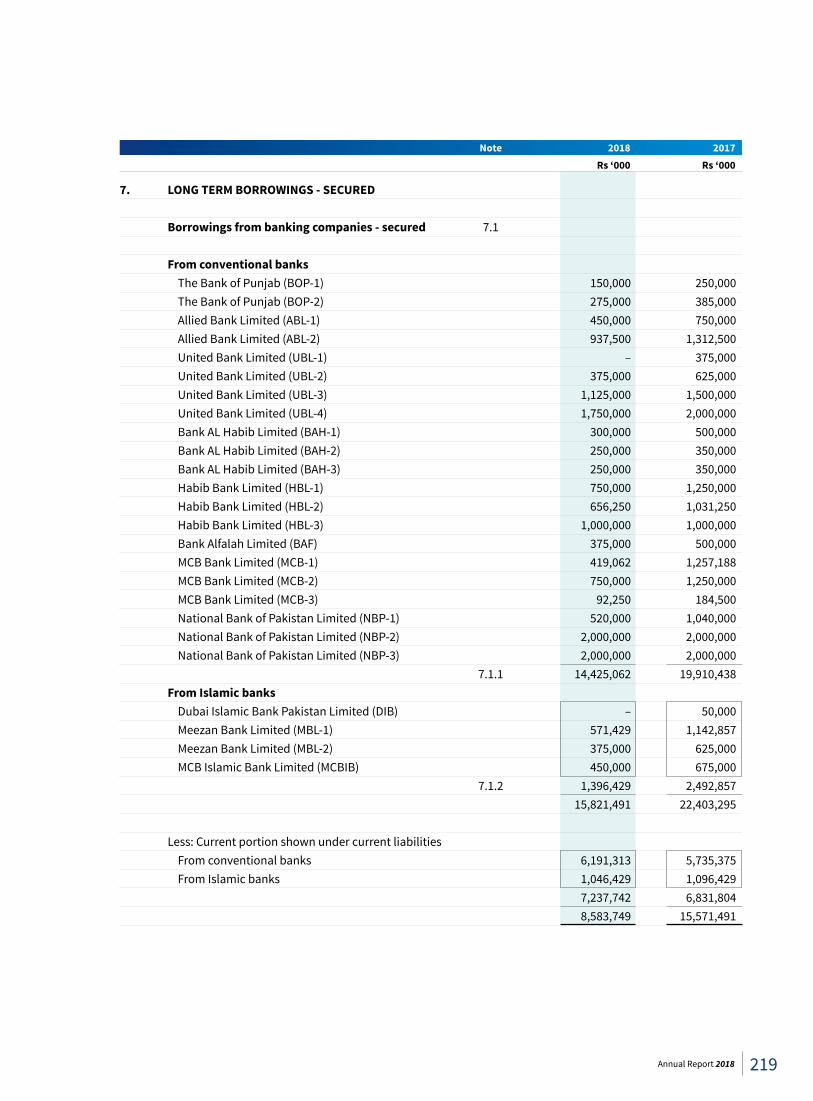
Note 2018 2017 Rs ‘000 Rs ‘000
7. LONG TERM BORROWINGS - SECURED Borrowings from banking companies - secured 7.1 From conventional banks The Bank of Punjab (BOP-1) 150,000 250,000 The Bank of Punjab (BOP-2) 275,000 385,000 Allied Bank Limited (ABL-1) 450,000 750,000 Allied Bank Limited (ABL-2) 937,500 1,312,500 United Bank Limited (UBL-1) – 375,000 United Bank Limited (UBL-2) 375,000 625,000 United Bank Limited (UBL-3) 1,125,000 1,500,000 United Bank Limited (UBL-4) 1,750,000 2,000,000 Bank AL Habib Limited (BAH-1) 300,000 500,000 Bank AL Habib Limited (BAH-2) 250,000 350,000 Bank AL Habib Limited (BAH-3) 250,000 350,000 Habib Bank Limited (HBL-1) 750,000 1,250,000 Habib Bank Limited (HBL-2) 656,250 1,031,250 Habib Bank Limited (HBL-3) 1,000,000 1,000,000 Bank Alfalah Limited (BAF) 375,000 500,000 MCB Bank Limited (MCB-1) 419,062 1,257,188 MCB Bank Limited (MCB-2) 750,000 1,250,000 MCB Bank Limited (MCB-3) 92,250 184,500 National Bank of Pakistan Limited (NBP-1) 520,000 1,040,000 National Bank of Pakistan Limited (NBP-2) 2,000,000 2,000,000 National Bank of Pakistan Limited (NBP-3) 2,000,000 2,000,000 7.1.1 14,425,062 19,910,438 From Islamic banks Dubai Islamic Bank Pakistan Limited (DIB) – 50,000 Meezan Bank Limited (MBL-1) 571,429 1,142,857 Meezan Bank Limited (MBL-2) 375,000 625,000 MCB Islamic Bank Limited (MCBIB) 450,000 675,000 7.1.2 1,396,429 2,492,857 15,821,491 22,403,295 Less: Current portion shown under current liabilities From conventional banks 6,191,313 5,735,375 From Islamic banks 1,046,429 1,096,429 7,237,742 6,831,804 8,583,749 15,571,491
219Annual Report 2018
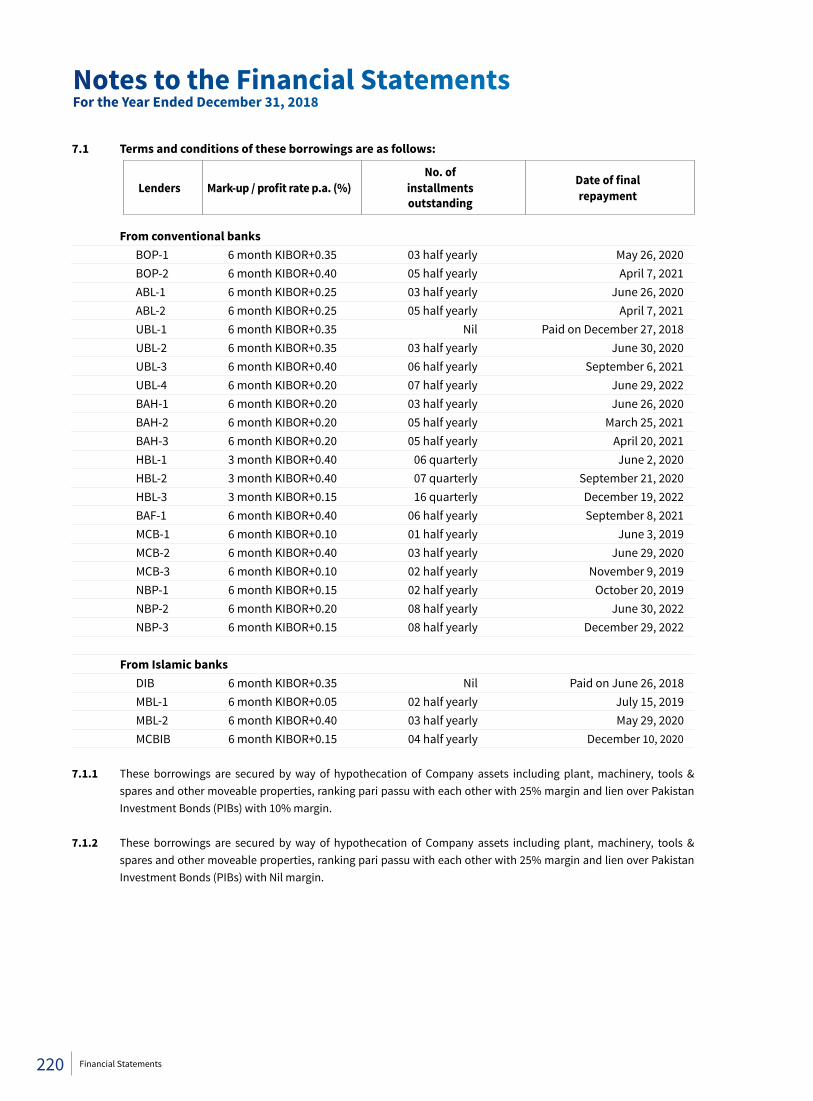
7.1 Terms and conditions of these borrowings are as follows:
No. of Dateoffinal Lenders Mark-up/profitratep.a.(%) installments repayment outstanding
From conventional banks BOP-1 6 month KIBOR+0.35 03 half yearly May 26, 2020 BOP-2 6 month KIBOR+0.40 05 half yearly April 7, 2021 ABL-1 6 month KIBOR+0.25 03 half yearly June 26, 2020 ABL-2 6 month KIBOR+0.25 05 half yearly April 7, 2021 UBL-1 6 month KIBOR+0.35 Nil Paid on December 27, 2018 UBL-2 6 month KIBOR+0.35 03 half yearly June 30, 2020 UBL-3 6 month KIBOR+0.40 06 half yearly September 6, 2021 UBL-4 6 month KIBOR+0.20 07 half yearly June 29, 2022 BAH-1 6 month KIBOR+0.20 03 half yearly June 26, 2020 BAH-2 6 month KIBOR+0.20 05 half yearly March 25, 2021 BAH-3 6 month KIBOR+0.20 05 half yearly April 20, 2021 HBL-1 3 month KIBOR+0.40 06 quarterly June 2, 2020 HBL-2 3 month KIBOR+0.40 07 quarterly September 21, 2020 HBL-3 3 month KIBOR+0.15 16 quarterly December 19, 2022 BAF-1 6 month KIBOR+0.40 06 half yearly September 8, 2021 MCB-1 6 month KIBOR+0.10 01 half yearly June 3, 2019 MCB-2 6 month KIBOR+0.40 03 half yearly June 29, 2020 MCB-3 6 month KIBOR+0.10 02 half yearly November 9, 2019 NBP-1 6 month KIBOR+0.15 02 half yearly October 20, 2019 NBP-2 6 month KIBOR+0.20 08 half yearly June 30, 2022 NBP-3 6 month KIBOR+0.15 08 half yearly December 29, 2022 From Islamic banks DIB 6 month KIBOR+0.35 Nil Paid on June 26, 2018 MBL-1 6 month KIBOR+0.05 02 half yearly July 15, 2019 MBL-2 6 month KIBOR+0.40 03 half yearly May 29, 2020 MCBIB 6 month KIBOR+0.15 04 half yearly December 10, 2020 7.1.1 These borrowings are secured by way of hypothecation of Company assets including plant, machinery, tools &
spares and other moveable properties, ranking pari passu with each other with 25% margin and lien over Pakistan Investment Bonds (PIBs) with 10% margin.
7.1.2 These borrowings are secured by way of hypothecation of Company assets including plant, machinery, tools & spares and other moveable properties, ranking pari passu with each other with 25% margin and lien over Pakistan Investment Bonds (PIBs) with Nil margin.
Notes to the Financial StatementsFor the Year Ended December 31, 2018
220 Financial Statements
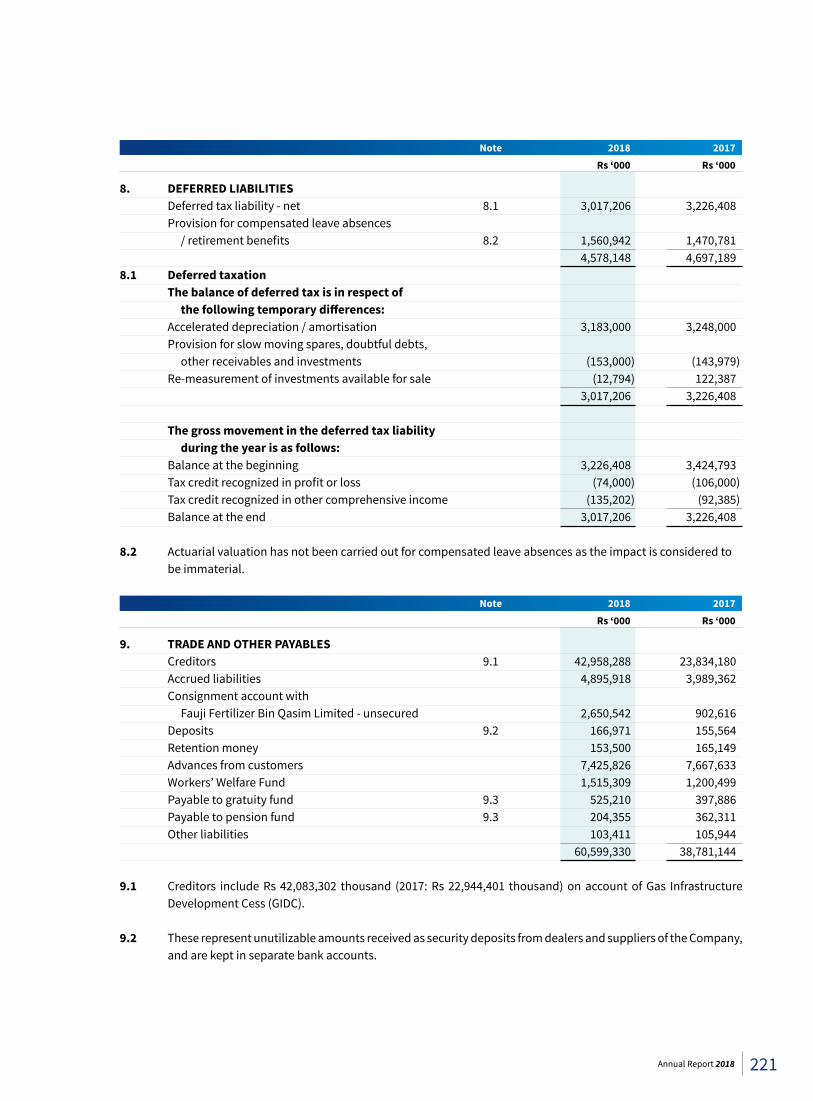
Note 2018 2017 Rs ‘000 Rs ‘000
8. DEFERRED LIABILITIES Deferred tax liability - net 8.1 3,017,206 3,226,408 Provision for compensated leave absences / retirement benefits 8.2 1,560,942 1,470,781 4,578,148 4,697,189 8.1 Deferred taxation The balance of deferred tax is in respect of thefollowingtemporarydifferences: Accelerated depreciation / amortisation 3,183,000 3,248,000 Provision for slow moving spares, doubtful debts, other receivables and investments (153,000) (143,979) Re-measurement of investments available for sale (12,794) 122,387 3,017,206 3,226,408 The gross movement in the deferred tax liability during the year is as follows: Balance at the beginning 3,226,408 3,424,793 Tax credit recognized in profit or loss (74,000) (106,000) Tax credit recognized in other comprehensive income (135,202) (92,385) Balance at the end 3,017,206 3,226,408 8.2 Actuarial valuation has not been carried out for compensated leave absences as the impact is considered to
be immaterial. Note 2018 2017 Rs ‘000 Rs ‘000
9. TRADE AND OTHER PAYABLES Creditors 9.1 42,958,288 23,834,180 Accrued liabilities 4,895,918 3,989,362 Consignment account with Fauji Fertilizer Bin Qasim Limited - unsecured 2,650,542 902,616 Deposits 9.2 166,971 155,564 Retention money 153,500 165,149 Advances from customers 7,425,826 7,667,633 Workers’ Welfare Fund 1,515,309 1,200,499 Payable to gratuity fund 9.3 525,210 397,886 Payable to pension fund 9.3 204,355 362,311 Other liabilities 103,411 105,944 60,599,330 38,781,144 9.1 Creditors include Rs 42,083,302 thousand (2017: Rs 22,944,401 thousand) on account of Gas Infrastructure
Development Cess (GIDC). 9.2 These represent unutilizable amounts received as security deposits from dealers and suppliers of the Company,
and are kept in separate bank accounts.
221Annual Report 2018
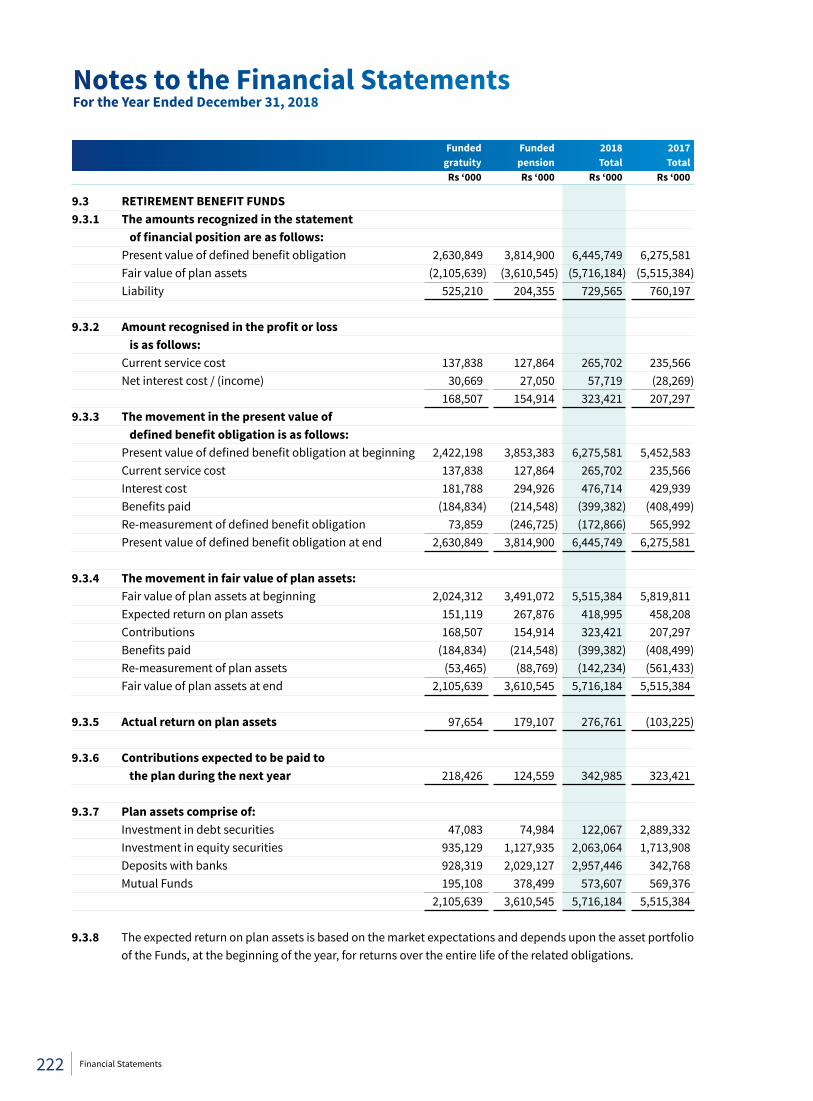
Funded Funded 2018 2017 gratuity pension Total Total Rs ‘000 Rs ‘000 Rs ‘000 Rs ‘000
9.3 RETIREMENT BENEFIT FUNDS 9.3.1 The amounts recognized in the statement offinancialpositionareasfollows: Present value of defined benefit obligation 2,630,849 3,814,900 6,445,749 6,275,581 Fair value of plan assets (2,105,639) (3,610,545) (5,716,184) (5,515,384) Liability 525,210 204,355 729,565 760,197 9.3.2 Amountrecognisedintheprofitorloss is as follows: Current service cost 137,838 127,864 265,702 235,566 Net interest cost / (income) 30,669 27,050 57,719 (28,269) 168,507 154,914 323,421 207,297 9.3.3 The movement in the present value of definedbenefitobligationisasfollows: Present value of defined benefit obligation at beginning 2,422,198 3,853,383 6,275,581 5,452,583 Current service cost 137,838 127,864 265,702 235,566 Interest cost 181,788 294,926 476,714 429,939 Benefits paid (184,834) (214,548) (399,382) (408,499) Re-measurement of defined benefit obligation 73,859 (246,725) (172,866) 565,992 Present value of defined benefit obligation at end 2,630,849 3,814,900 6,445,749 6,275,581 9.3.4 The movement in fair value of plan assets: Fair value of plan assets at beginning 2,024,312 3,491,072 5,515,384 5,819,811 Expected return on plan assets 151,119 267,876 418,995 458,208 Contributions 168,507 154,914 323,421 207,297 Benefits paid (184,834) (214,548) (399,382) (408,499) Re-measurement of plan assets (53,465) (88,769) (142,234) (561,433) Fair value of plan assets at end 2,105,639 3,610,545 5,716,184 5,515,384 9.3.5 Actual return on plan assets 97,654 179,107 276,761 (103,225) 9.3.6 Contributions expected to be paid to the plan during the next year 218,426 124,559 342,985 323,421 9.3.7 Plan assets comprise of: Investment in debt securities 47,083 74,984 122,067 2,889,332 Investment in equity securities 935,129 1,127,935 2,063,064 1,713,908 Deposits with banks 928,319 2,029,127 2,957,446 342,768 Mutual Funds 195,108 378,499 573,607 569,376 2,105,639 3,610,545 5,716,184 5,515,384 9.3.8 The expected return on plan assets is based on the market expectations and depends upon the asset portfolio
of the Funds, at the beginning of the year, for returns over the entire life of the related obligations.
Notes to the Financial StatementsFor the Year Ended December 31, 2018
222 Financial Statements
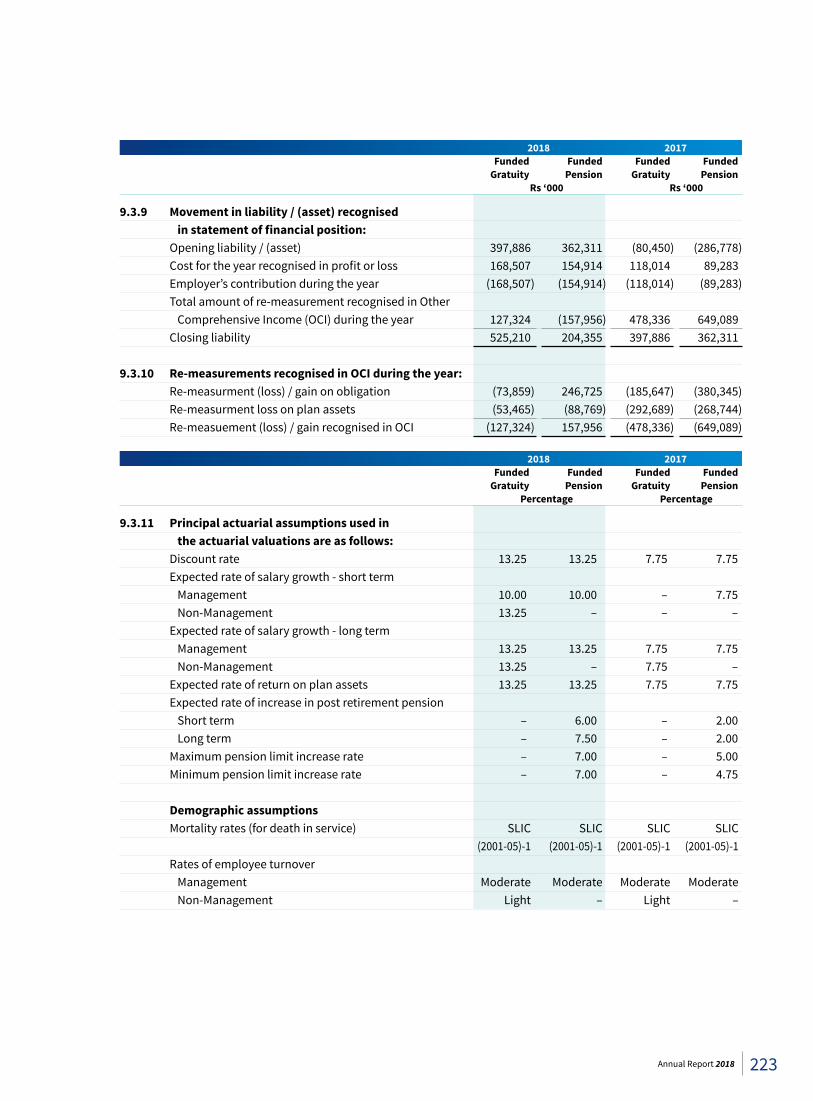
2018 2017 Funded Funded Funded Funded Gratuity Pension Gratuity Pension Rs ‘000 Rs ‘000
9.3.9 Movement in liability / (asset) recognised instatementoffinancialposition: Opening liability / (asset) 397,886 362,311 (80,450) (286,778) Cost for the year recognised in profit or loss 168,507 154,914 118,014 89,283 Employer’s contribution during the year (168,507) (154,914) (118,014) (89,283) Total amount of re-measurement recognised in Other Comprehensive Income (OCI) during the year 127,324 (157,956) 478,336 649,089 Closing liability 525,210 204,355 397,886 362,311 9.3.10 Re-measurements recognised in OCI during the year: Re-measurment (loss) / gain on obligation (73,859) 246,725 (185,647) (380,345) Re-measurment loss on plan assets (53,465) (88,769) (292,689) (268,744) Re-measuement (loss) / gain recognised in OCI (127,324) 157,956 (478,336) (649,089)
2018 2017 Funded Funded Funded Funded Gratuity Pension Gratuity Pension Percentage Percentage
9.3.11 Principal actuarial assumptions used in the actuarial valuations are as follows: Discount rate 13.25 13.25 7.75 7.75 Expected rate of salary growth - short term Management 10.00 10.00 – 7.75 Non-Management 13.25 – – – Expected rate of salary growth - long term Management 13.25 13.25 7.75 7.75 Non-Management 13.25 – 7.75 – Expected rate of return on plan assets 13.25 13.25 7.75 7.75 Expected rate of increase in post retirement pension Short term – 6.00 – 2.00 Long term – 7.50 – 2.00 Maximum pension limit increase rate – 7.00 – 5.00 Minimum pension limit increase rate – 7.00 – 4.75 Demographic assumptions Mortality rates (for death in service) SLIC SLIC SLIC SLIC (2001-05)-1 (2001-05)-1 (2001-05)-1 (2001-05)-1 Rates of employee turnover Management Moderate Moderate Moderate Moderate Non-Management Light – Light –
223Annual Report 2018
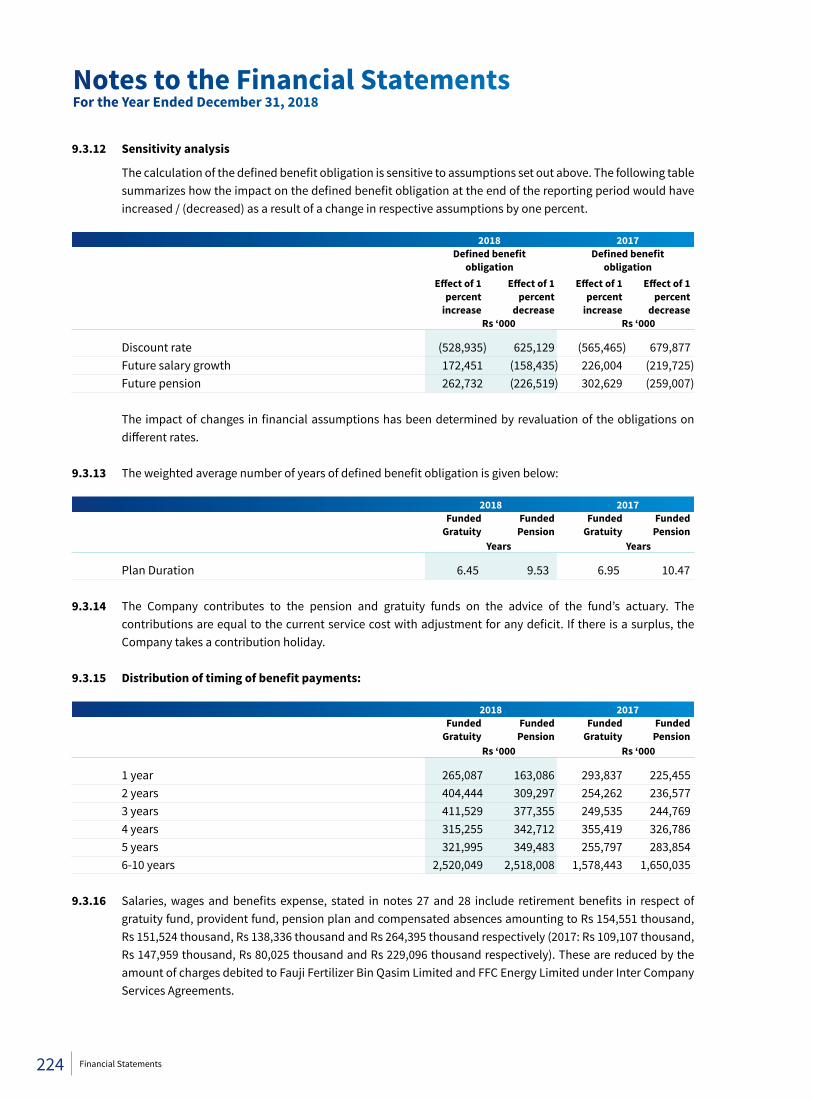
9.3.12 Sensitivity analysis
The calculation of the defined benefit obligation is sensitive to assumptions set out above. The following table summarizes how the impact on the defined benefit obligation at the end of the reporting period would have increased / (decreased) as a result of a change in respective assumptions by one percent.
2018 2017 Definedbenefit Definedbenefit obligation obligation Effectof1 Effectof1 Effectof1 Effectof1 percent percent percent percent increase decrease increase decrease Rs ‘000 Rs ‘000
Discount rate (528,935) 625,129 (565,465) 679,877 Future salary growth 172,451 (158,435) 226,004 (219,725) Future pension 262,732 (226,519) 302,629 (259,007) The impact of changes in financial assumptions has been determined by revaluation of the obligations on
different rates. 9.3.13 The weighted average number of years of defined benefit obligation is given below: 2018 2017 Funded Funded Funded Funded Gratuity Pension Gratuity Pension Years Years
Plan Duration 6.45 9.53 6.95 10.47 9.3.14 The Company contributes to the pension and gratuity funds on the advice of the fund’s actuary. The
contributions are equal to the current service cost with adjustment for any deficit. If there is a surplus, the Company takes a contribution holiday.
9.3.15 Distributionoftimingofbenefitpayments:
2018 2017 Funded Funded Funded Funded Gratuity Pension Gratuity Pension Rs ‘000 Rs ‘000
1 year 265,087 163,086 293,837 225,455 2 years 404,444 309,297 254,262 236,577 3 years 411,529 377,355 249,535 244,769 4 years 315,255 342,712 355,419 326,786 5 years 321,995 349,483 255,797 283,854 6-10 years 2,520,049 2,518,008 1,578,443 1,650,035 9.3.16 Salaries, wages and benefits expense, stated in notes 27 and 28 include retirement benefits in respect of
gratuity fund, provident fund, pension plan and compensated absences amounting to Rs 154,551 thousand, Rs 151,524 thousand, Rs 138,336 thousand and Rs 264,395 thousand respectively (2017: Rs 109,107 thousand, Rs 147,959 thousand, Rs 80,025 thousand and Rs 229,096 thousand respectively). These are reduced by the amount of charges debited to Fauji Fertilizer Bin Qasim Limited and FFC Energy Limited under Inter Company Services Agreements.
Notes to the Financial StatementsFor the Year Ended December 31, 2018
224 Financial Statements
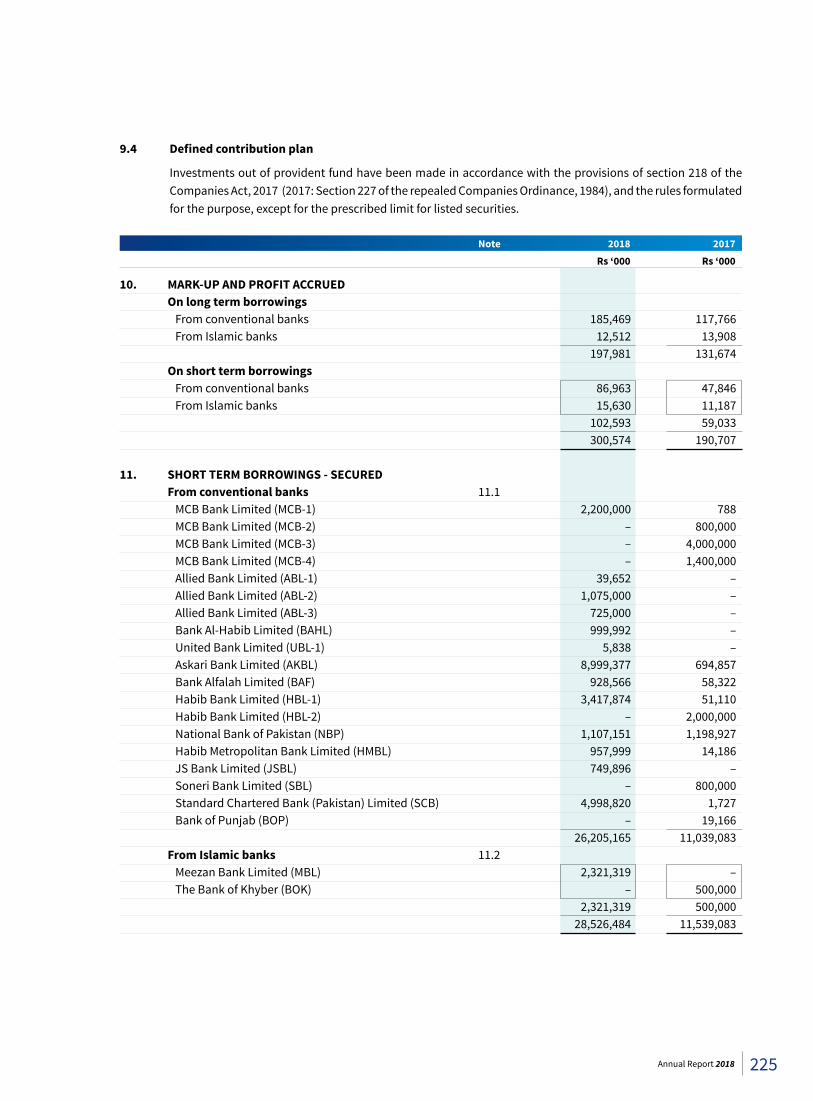
9.4 Definedcontributionplan
Investments out of provident fund have been made in accordance with the provisions of section 218 of the Companies Act, 2017 (2017: Section 227 of the repealed Companies Ordinance, 1984), and the rules formulated for the purpose, except for the prescribed limit for listed securities.
Note 2018 2017 Rs ‘000 Rs ‘000
10. MARK-UP AND PROFIT ACCRUED On long term borrowings From conventional banks 185,469 117,766 From Islamic banks 12,512 13,908 197,981 131,674 On short term borrowings From conventional banks 86,963 47,846 From Islamic banks 15,630 11,187 102,593 59,033 300,574 190,707 11. SHORT TERM BORROWINGS - SECURED From conventional banks 11.1 MCB Bank Limited (MCB-1) 2,200,000 788 MCB Bank Limited (MCB-2) – 800,000 MCB Bank Limited (MCB-3) – 4,000,000 MCB Bank Limited (MCB-4) – 1,400,000 Allied Bank Limited (ABL-1) 39,652 – Allied Bank Limited (ABL-2) 1,075,000 – Allied Bank Limited (ABL-3) 725,000 – Bank Al-Habib Limited (BAHL) 999,992 – United Bank Limited (UBL-1) 5,838 – Askari Bank Limited (AKBL) 8,999,377 694,857 Bank Alfalah Limited (BAF) 928,566 58,322 Habib Bank Limited (HBL-1) 3,417,874 51,110 Habib Bank Limited (HBL-2) – 2,000,000 National Bank of Pakistan (NBP) 1,107,151 1,198,927 Habib Metropolitan Bank Limited (HMBL) 957,999 14,186 JS Bank Limited (JSBL) 749,896 – Soneri Bank Limited (SBL) – 800,000 Standard Chartered Bank (Pakistan) Limited (SCB) 4,998,820 1,727 Bank of Punjab (BOP) – 19,166 26,205,165 11,039,083 From Islamic banks 11.2 Meezan Bank Limited (MBL) 2,321,319 – The Bank of Khyber (BOK) – 500,000 2,321,319 500,000 28,526,484 11,539,083
225Annual Report 2018
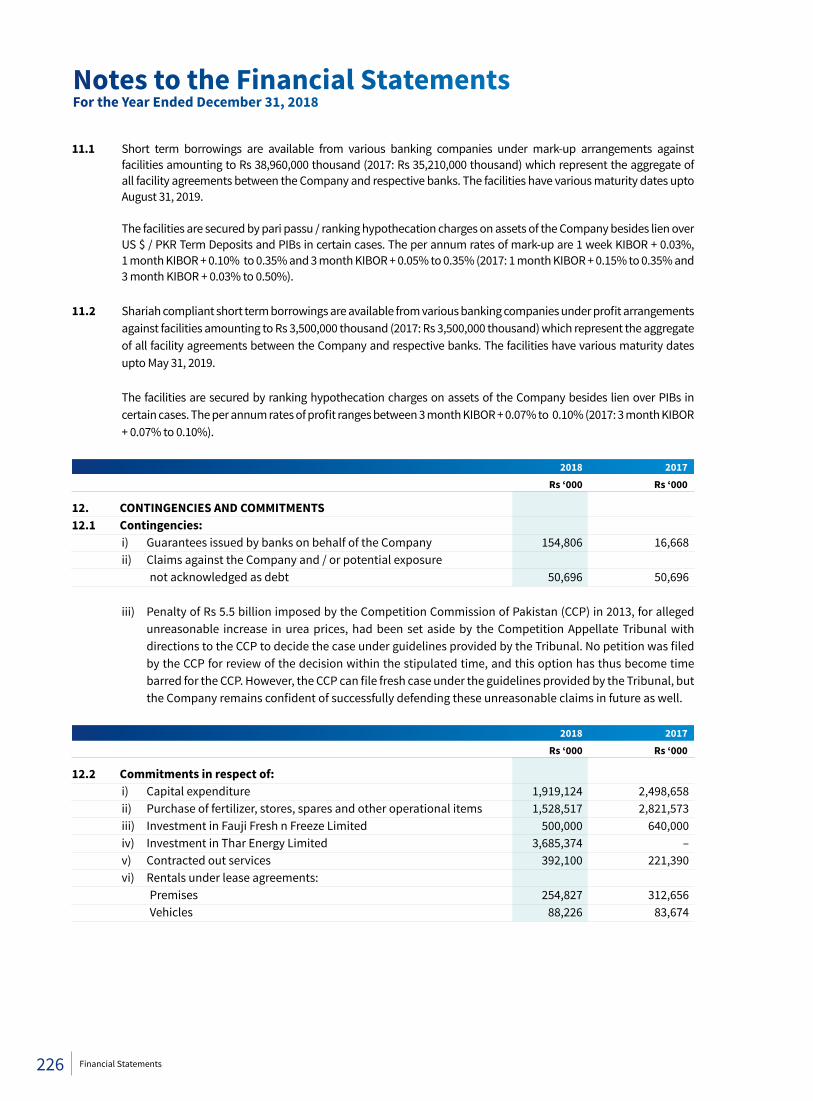
11.1 Short term borrowings are available from various banking companies under mark-up arrangements against facilities amounting to Rs 38,960,000 thousand (2017: Rs 35,210,000 thousand) which represent the aggregate of all facility agreements between the Company and respective banks. The facilities have various maturity dates upto August 31, 2019.
The facilities are secured by pari passu / ranking hypothecation charges on assets of the Company besides lien over
US $ / PKR Term Deposits and PIBs in certain cases. The per annum rates of mark-up are 1 week KIBOR + 0.03%, 1 month KIBOR + 0.10% to 0.35% and 3 month KIBOR + 0.05% to 0.35% (2017: 1 month KIBOR + 0.15% to 0.35% and 3 month KIBOR + 0.03% to 0.50%).
11.2 Shariah compliant short term borrowings are available from various banking companies under profit arrangements
against facilities amounting to Rs 3,500,000 thousand (2017: Rs 3,500,000 thousand) which represent the aggregate of all facility agreements between the Company and respective banks. The facilities have various maturity dates upto May 31, 2019.
The facilities are secured by ranking hypothecation charges on assets of the Company besides lien over PIBs in certain cases. The per annum rates of profit ranges between 3 month KIBOR + 0.07% to 0.10% (2017: 3 month KIBOR + 0.07% to 0.10%).
2018 2017 Rs ‘000 Rs ‘000
12. CONTINGENCIES AND COMMITMENTS 12.1 Contingencies: i) Guarantees issued by banks on behalf of the Company 154,806 16,668 ii) Claims against the Company and / or potential exposure not acknowledged as debt 50,696 50,696 iii) Penalty of Rs 5.5 billion imposed by the Competition Commission of Pakistan (CCP) in 2013, for alleged
unreasonable increase in urea prices, had been set aside by the Competition Appellate Tribunal with directions to the CCP to decide the case under guidelines provided by the Tribunal. No petition was filed by the CCP for review of the decision within the stipulated time, and this option has thus become time barred for the CCP. However, the CCP can file fresh case under the guidelines provided by the Tribunal, but the Company remains confident of successfully defending these unreasonable claims in future as well.
2018 2017 Rs ‘000 Rs ‘000
12.2 Commitments in respect of: i) Capital expenditure 1,919,124 2,498,658 ii) Purchase of fertilizer, stores, spares and other operational items 1,528,517 2,821,573 iii) Investment in Fauji Fresh n Freeze Limited 500,000 640,000 iv) Investment in Thar Energy Limited 3,685,374 – v) Contracted out services 392,100 221,390 vi) Rentals under lease agreements: Premises 254,827 312,656 Vehicles 88,226 83,674
Notes to the Financial StatementsFor the Year Ended December 31, 2018
226 Financial Statements
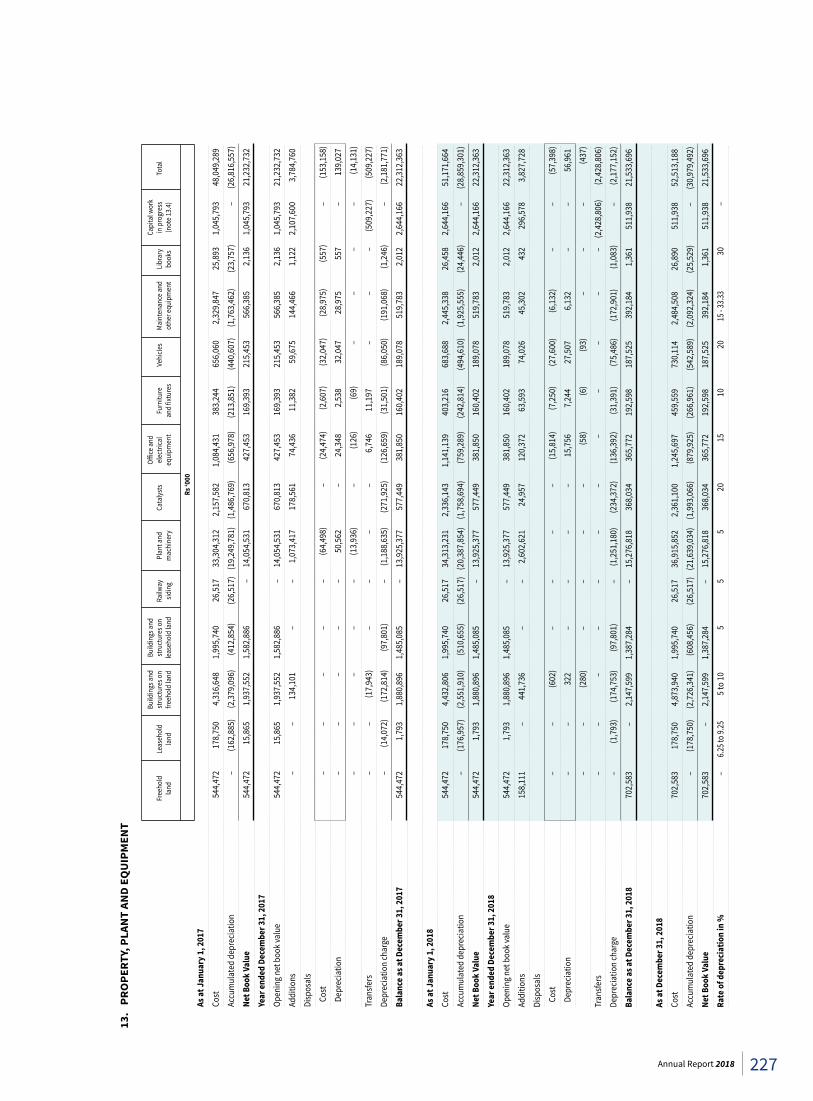
13.
PRO
PERT
Y, P
LAN
T AN
D E
QU
IPM
ENT
As a
t Jan
uary
1, 2
017
Cost
544,
472
178,
750
4,31
6,64
8 1,
995,
740
26,5
17
33,3
04,3
12
2,15
7,58
2 1,
084,
431
383,
244
656,
060
2,32
9,84
7 25
,893
1,
045,
793
48,0
49,2
89
Accu
mul
ated
dep
recia
tion
–
(162
,885
) (2
,379
,096
) (4
12,8
54)
(26,
517)
(1
9,24
9,78
1)
(1,4
86,7
69)
(656
,978
) (2
13,8
51)
(440
,607
) (1
,763
,462
) (2
3,75
7)
–
(26,
816,
557)
Net B
ook
Valu
e 54
4,47
2 15
,865
1,
937,
552
1,58
2,88
6 –
14
,054
,531
67
0,81
3 42
7,45
3 16
9,39
3 21
5,45
3 56
6,38
5 2,
136
1,04
5,79
3 21
,232
,732
Year
ende
d De
cem
ber 3
1, 2
017
Open
ing n
et b
ook v
alue
54
4,47
2 15
,865
1,
937,
552
1,58
2,88
6 –
14,0
54,5
31
670,
813
427,
453
169,
393
215,
453
566,
385
2,13
6 1,
045,
793
21,2
32,7
32
Addi
tions
–
– 13
4,10
1 –
–
1,07
3,41
7 17
8,56
1 74
,436
11
,382
59
,675
14
4,46
6 1,
122
2,10
7,60
0 3,
784,
760
Disp
osal
s
Cos
t
– –
– –
–
(64,
498)
–
(24,
474)
(2
,607
) (3
2,04
7)
(28,
975)
(5
57)
–
(153
,158
)
Dep
recia
tion
– –
– –
–
50,5
62
– 24
,348
2,
538
32,0
47
28,9
75
557
– 13
9,02
7
– –
– –
–
(13,
936)
–
(1
26)
(69)
–
–
– –
(14,
131)
Tran
sfers
–
– (1
7,94
3)
– –
–
–
6,74
6 11
,197
–
– –
(5
09,2
27)
(509
,227
)
Depr
ecia
tion
char
ge
– (1
4,07
2)
(172
,814
) (9
7,80
1)
–
(1,1
88,6
35)
(271
,925
) (1
26,6
59)
(31,
501)
(8
6,05
0)
(191
,068
) (1
,246
) –
(2
,181
,771
)
Bala
nce a
s at D
ecem
ber 3
1, 2
017
544,
472
1,79
3 1,
880,
896
1,48
5,08
5 –
13,9
25,3
77
577,
449
381,
850
160,
402
189,
078
519,
783
2,01
2 2,
644,
166
22,3
12,3
63
As a
t Jan
uary
1, 2
018
Cost
544,
472
178,
750
4,43
2,80
6 1,
995,
740
26,5
17
34,3
13,2
31
2,33
6,14
3 1,
141,
139
403,
216
683,
688
2,44
5,33
8 26
,458
2,
644,
166
51,1
71,6
64
Accu
mul
ated
dep
recia
tion
– (1
76,9
57)
(2,5
51,9
10)
(510
,655
) (2
6,51
7)
(20,
387,
854)
(1
,758
,694
) (7
59,2
89)
(242
,814
) (4
94,6
10)
(1,9
25,5
55)
(24,
446)
–
(2
8,85
9,30
1)
Net B
ook
Valu
e 54
4,47
2 1,
793
1,88
0,89
6 1,
485,
085
–
13,9
25,3
77
577,
449
381,
850
160,
402
189,
078
519,
783
2,01
2 2,
644,
166
22,3
12,3
63
Year
ende
d De
cem
ber 3
1, 2
018
Open
ing n
et b
ook v
alue
54
4,47
2 1,
793
1,88
0,89
6 1,
485,
085
–
13,9
25,3
77
577,
449
381,
850
160,
402
189,
078
519,
783
2,01
2 2,
644,
166
22,3
12,3
63
Addi
tions
15
8,11
1 –
441,
736
– –
2,60
2,62
1 24
,957
12
0,37
2 63
,593
74
,026
45
,302
43
2 29
6,57
8 3,
827,
728
Disp
osal
s
Cos
t
– –
(6
02)
– –
–
–
(15,
814)
(7
,250
) (2
7,60
0)
(6,1
32)
– –
(57,
398)
Dep
recia
tion
– –
32
2 –
– –
– 15
,756
7,
244
27,5
07
6,13
2 –
– 56
,961
– –
(280
) –
–
– –
(5
8)
(6)
(93)
–
– –
(4
37)
Tran
sfers
–
–
– –
–
– –
– –
–
– –
(2
,428
,806
) (2
,428
,806
)
Depr
ecia
tion
char
ge
– (1
,793
) (1
74,7
53)
(97,
801)
–
(1
,251
,180
) (2
34,3
72)
(136
,392
) (3
1,39
1)
(75,
486)
(1
72,9
01)
(1,0
83)
–
(2,1
77,1
52)
Bala
nce a
s at D
ecem
ber 3
1, 2
018
702,
583
–
2,14
7,59
9 1,
387,
284
–
15,2
76,8
18
368,
034
365,
772
192,
598
187,
525
392,
184
1,36
1 51
1,93
8 21
,533
,696
As a
t Dec
embe
r 31,
201
8 Co
st
70
2,58
3 17
8,75
0 4,
873,
940
1,99
5,74
0 26
,517
36
,915
,852
2,
361,
100
1,24
5,69
7 45
9,55
9 73
0,11
4 2,
484,
508
26,8
90
511,
938
52,5
13,1
88
Accu
mul
ated
dep
recia
tion
–
(178
,750
) (2
,726
,341
) (6
08,4
56)
(26,
517)
(2
1,63
9,03
4)
(1,9
93,0
66)
(879
,925
) (2
66,9
61)
(542
,589
) (2
,092
,324
) (2
5,52
9)
–
(30,
979,
492)
Net B
ook
Valu
e 70
2,58
3 –
2,
147,
599
1,38
7,28
4 –
15
,276
,818
36
8,03
4 36
5,77
2 19
2,59
8 18
7,52
5 39
2,18
4 1,
361
511,
938
21,5
33,6
96
Rateofd
epreciationin%
–
6.2
5 to 9
.25
5 to
10
5 5
5 20
15
10
20
15
- 33.3
3 30
–
Build
ings
and
Bu
ildin
gs a
nd
Off
ice a
nd
Capi
tal w
ork
Free
hold
Le
aseh
old
stru
ctur
es o
n st
ruct
ures
on
Railw
ay
Plan
t and
Ca
taly
sts
elec
trica
l Fu
rnitu
re
Vehi
cles
M
aint
enan
ce a
nd
Libr
ary
in p
rogr
ess
Tota
l
la
nd
land
fre
ehol
d la
nd
leas
ehol
d la
nd
sidin
g m
achi
nery
equi
pmen
t an
d fix
ture
s
othe
r equ
ipm
ent
book
s (n
ote 1
3.4)
Rs ‘0
00
227Annual Report 2018
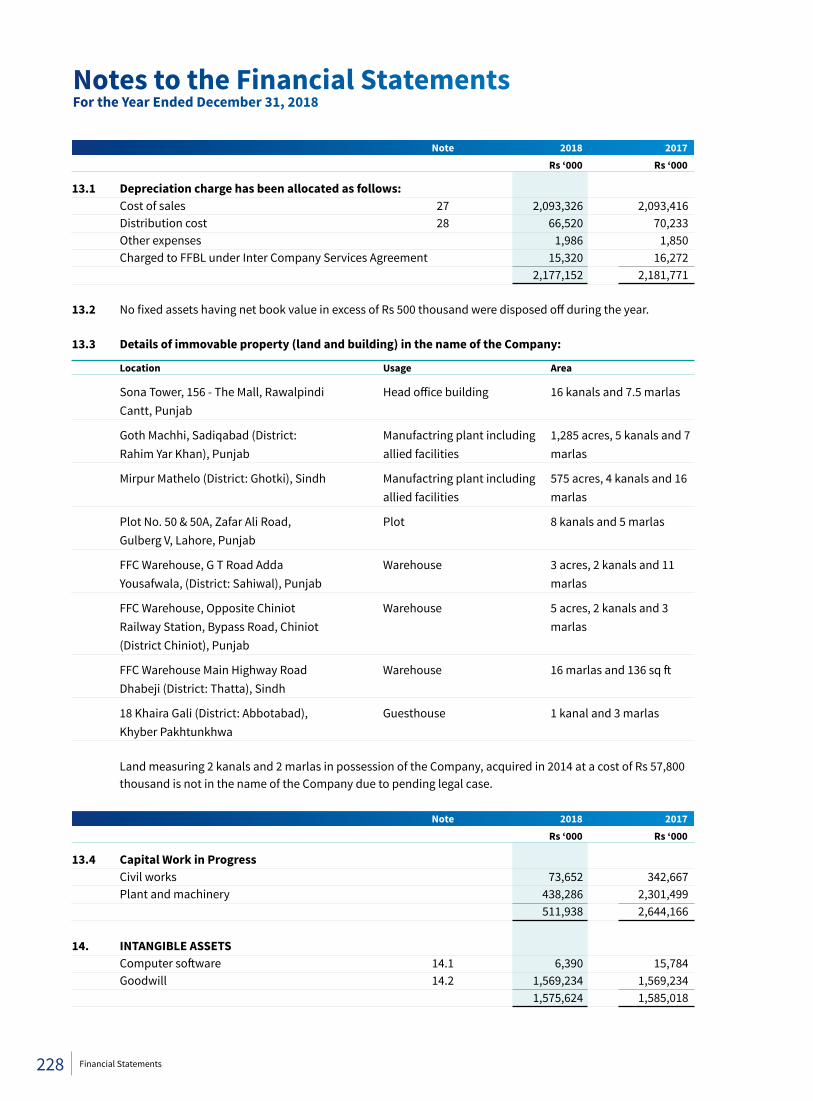
Note 2018 2017 Rs ‘000 Rs ‘000
13.1 Depreciation charge has been allocated as follows: Cost of sales 27 2,093,326 2,093,416 Distribution cost 28 66,520 70,233 Other expenses 1,986 1,850 Charged to FFBL under Inter Company Services Agreement 15,320 16,272 2,177,152 2,181,771 13.2 No fixed assets having net book value in excess of Rs 500 thousand were disposed off during the year. 13.3 Details of immovable property (land and building) in the name of the Company:
Location Usage Area
Sona Tower, 156 - The Mall, Rawalpindi Head office building 16 kanals and 7.5 marlas Cantt, Punjab
Goth Machhi, Sadiqabad (District: Manufactring plant including 1,285 acres, 5 kanals and 7 Rahim Yar Khan), Punjab allied facilities marlas
Mirpur Mathelo (District: Ghotki), Sindh Manufactring plant including 575 acres, 4 kanals and 16 allied facilities marlas
Plot No. 50 & 50A, Zafar Ali Road, Plot 8 kanals and 5 marlas Gulberg V, Lahore, Punjab
FFC Warehouse, G T Road Adda Warehouse 3 acres, 2 kanals and 11 Yousafwala, (District: Sahiwal), Punjab marlas
FFC Warehouse, Opposite Chiniot Warehouse 5 acres, 2 kanals and 3 Railway Station, Bypass Road, Chiniot marlas (District Chiniot), Punjab
FFC Warehouse Main Highway Road Warehouse 16 marlas and 136 sq ft Dhabeji (District: Thatta), Sindh
18 Khaira Gali (District: Abbotabad), Guesthouse 1 kanal and 3 marlas Khyber Pakhtunkhwa
Land measuring 2 kanals and 2 marlas in possession of the Company, acquired in 2014 at a cost of Rs 57,800 thousand is not in the name of the Company due to pending legal case.
Note 2018 2017 Rs ‘000 Rs ‘000
13.4 Capital Work in Progress Civil works 73,652 342,667 Plant and machinery 438,286 2,301,499 511,938 2,644,166
14. INTANGIBLE ASSETS Computer software 14.1 6,390 15,784 Goodwill 14.2 1,569,234 1,569,234 1,575,624 1,585,018
Notes to the Financial StatementsFor the Year Ended December 31, 2018
228 Financial Statements
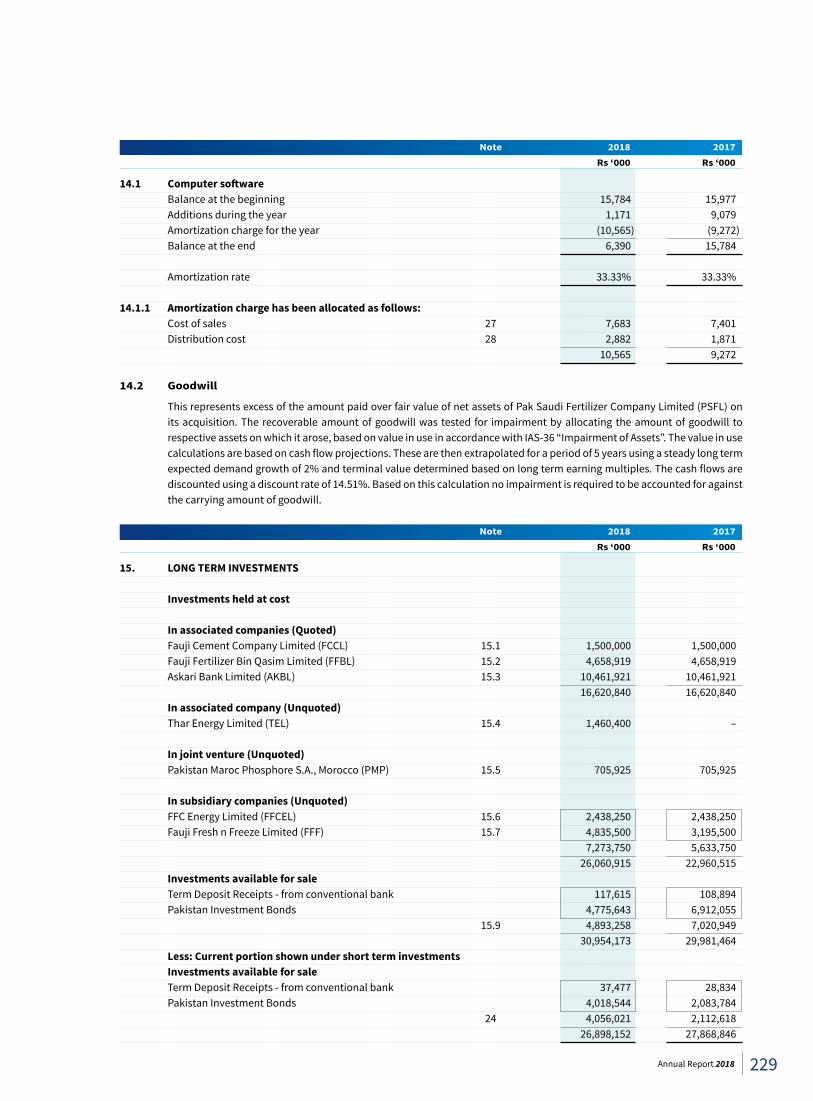
Note 2018 2017 Rs ‘000 Rs ‘000
14.1 Computersoftware Balance at the beginning 15,784 15,977 Additions during the year 1,171 9,079 Amortization charge for the year (10,565) (9,272) Balance at the end 6,390 15,784 Amortization rate 33.33% 33.33% 14.1.1 Amortization charge has been allocated as follows: Cost of sales 27 7,683 7,401 Distribution cost 28 2,882 1,871 10,565 9,272
14.2 Goodwill
This represents excess of the amount paid over fair value of net assets of Pak Saudi Fertilizer Company Limited (PSFL) on its acquisition. The recoverable amount of goodwill was tested for impairment by allocating the amount of goodwill to respective assets on which it arose, based on value in use in accordance with IAS-36 “Impairment of Assets”. The value in use calculations are based on cash flow projections. These are then extrapolated for a period of 5 years using a steady long term expected demand growth of 2% and terminal value determined based on long term earning multiples. The cash flows are discounted using a discount rate of 14.51%. Based on this calculation no impairment is required to be accounted for against the carrying amount of goodwill.
Note 2018 2017 Rs ‘000 Rs ‘000
15. LONG TERM INVESTMENTS Investments held at cost
In associated companies (Quoted) Fauji Cement Company Limited (FCCL) 15.1 1,500,000 1,500,000 Fauji Fertilizer Bin Qasim Limited (FFBL) 15.2 4,658,919 4,658,919 Askari Bank Limited (AKBL) 15.3 10,461,921 10,461,921 16,620,840 16,620,840 In associated company (Unquoted) Thar Energy Limited (TEL) 15.4 1,460,400 –
In joint venture (Unquoted) Pakistan Maroc Phosphore S.A., Morocco (PMP) 15.5 705,925 705,925
In subsidiary companies (Unquoted) FFC Energy Limited (FFCEL) 15.6 2,438,250 2,438,250 Fauji Fresh n Freeze Limited (FFF) 15.7 4,835,500 3,195,500 7,273,750 5,633,750 26,060,915 22,960,515 Investments available for sale Term Deposit Receipts - from conventional bank 117,615 108,894 Pakistan Investment Bonds 4,775,643 6,912,055 15.9 4,893,258 7,020,949 30,954,173 29,981,464 Less: Current portion shown under short term investments Investments available for sale Term Deposit Receipts - from conventional bank 37,477 28,834 Pakistan Investment Bonds 4,018,544 2,083,784 24 4,056,021 2,112,618 26,898,152 27,868,846
229Annual Report 2018
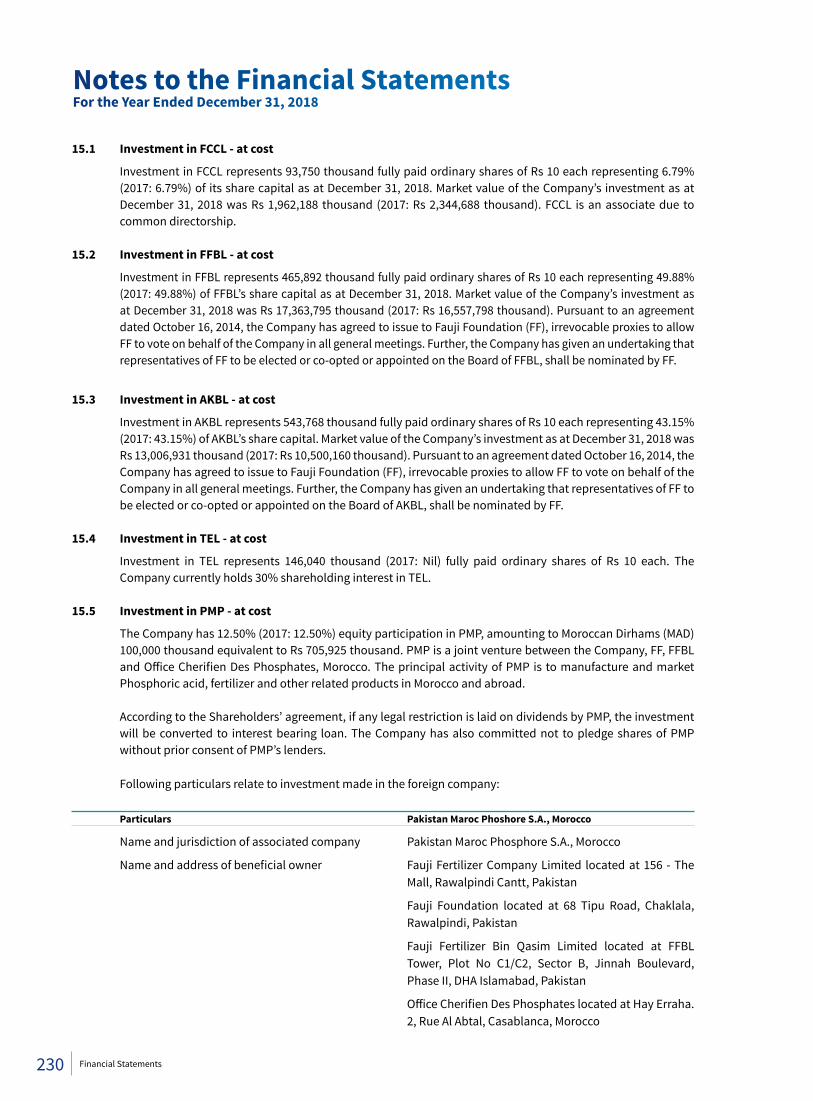
15.1 Investment in FCCL - at cost
Investment in FCCL represents 93,750 thousand fully paid ordinary shares of Rs 10 each representing 6.79% (2017: 6.79%) of its share capital as at December 31, 2018. Market value of the Company’s investment as at December 31, 2018 was Rs 1,962,188 thousand (2017: Rs 2,344,688 thousand). FCCL is an associate due to common directorship.
15.2 Investment in FFBL - at cost
Investment in FFBL represents 465,892 thousand fully paid ordinary shares of Rs 10 each representing 49.88% (2017: 49.88%) of FFBL’s share capital as at December 31, 2018. Market value of the Company’s investment as at December 31, 2018 was Rs 17,363,795 thousand (2017: Rs 16,557,798 thousand). Pursuant to an agreement dated October 16, 2014, the Company has agreed to issue to Fauji Foundation (FF), irrevocable proxies to allow FF to vote on behalf of the Company in all general meetings. Further, the Company has given an undertaking that representatives of FF to be elected or co-opted or appointed on the Board of FFBL, shall be nominated by FF.
15.3 Investment in AKBL - at cost
Investment in AKBL represents 543,768 thousand fully paid ordinary shares of Rs 10 each representing 43.15% (2017: 43.15%) of AKBL’s share capital. Market value of the Company’s investment as at December 31, 2018 was Rs 13,006,931 thousand (2017: Rs 10,500,160 thousand). Pursuant to an agreement dated October 16, 2014, the Company has agreed to issue to Fauji Foundation (FF), irrevocable proxies to allow FF to vote on behalf of the Company in all general meetings. Further, the Company has given an undertaking that representatives of FF to be elected or co-opted or appointed on the Board of AKBL, shall be nominated by FF.
15.4 Investment in TEL - at cost
Investment in TEL represents 146,040 thousand (2017: Nil) fully paid ordinary shares of Rs 10 each. The Company currently holds 30% shareholding interest in TEL.
15.5 Investment in PMP - at cost
The Company has 12.50% (2017: 12.50%) equity participation in PMP, amounting to Moroccan Dirhams (MAD) 100,000 thousand equivalent to Rs 705,925 thousand. PMP is a joint venture between the Company, FF, FFBL and Office Cherifien Des Phosphates, Morocco. The principal activity of PMP is to manufacture and market Phosphoric acid, fertilizer and other related products in Morocco and abroad.
According to the Shareholders’ agreement, if any legal restriction is laid on dividends by PMP, the investment
will be converted to interest bearing loan. The Company has also committed not to pledge shares of PMP without prior consent of PMP’s lenders.
Following particulars relate to investment made in the foreign company:
Particulars Pakistan Maroc Phoshore S.A., Morocco
Name and jurisdiction of associated company Pakistan Maroc Phosphore S.A., Morocco
Name and address of beneficial owner Fauji Fertilizer Company Limited located at 156 - The Mall, Rawalpindi Cantt, Pakistan
Fauji Foundation located at 68 Tipu Road, Chaklala, Rawalpindi, Pakistan
Fauji Fertilizer Bin Qasim Limited located at FFBL Tower, Plot No C1/C2, Sector B, Jinnah Boulevard, Phase II, DHA Islamabad, Pakistan
Office Cherifien Des Phosphates located at Hay Erraha. 2, Rue Al Abtal, Casablanca, Morocco
Notes to the Financial StatementsFor the Year Ended December 31, 2018
230 Financial Statements
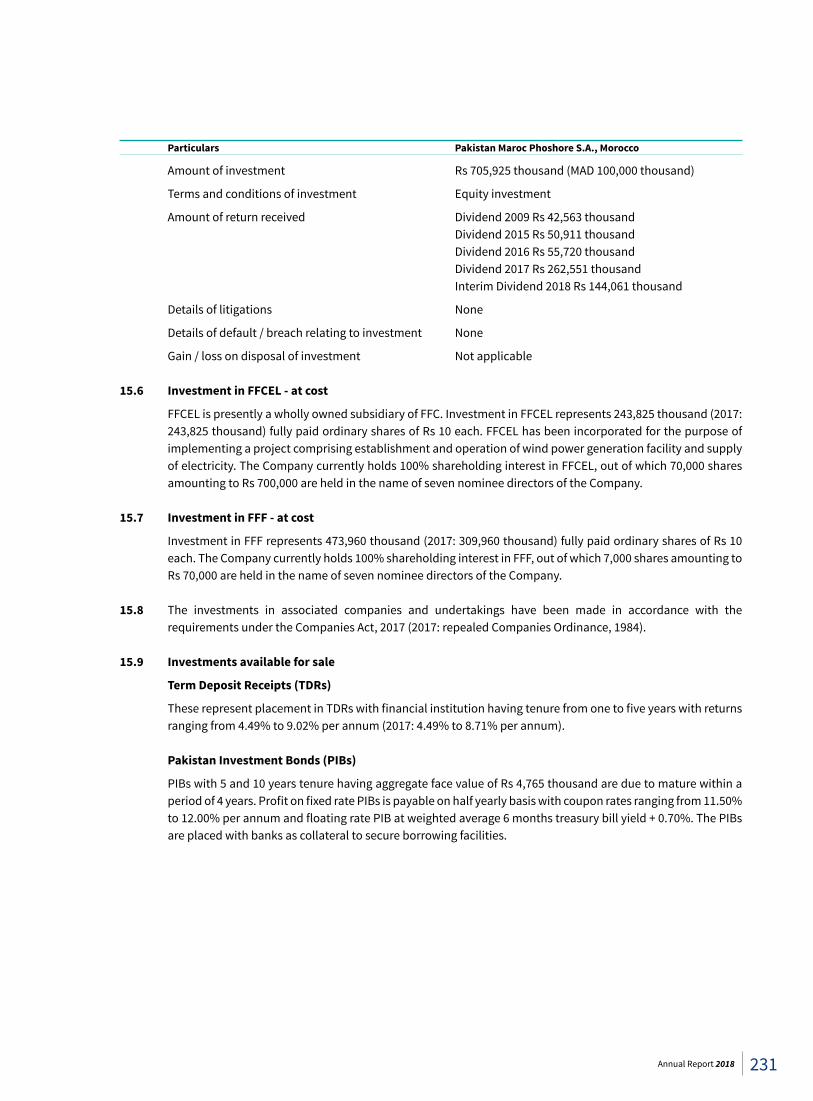
Particulars Pakistan Maroc Phoshore S.A., Morocco
Amount of investment Rs 705,925 thousand (MAD 100,000 thousand)
Terms and conditions of investment Equity investment
Amount of return received Dividend 2009 Rs 42,563 thousand Dividend 2015 Rs 50,911 thousand Dividend 2016 Rs 55,720 thousand Dividend 2017 Rs 262,551 thousand Interim Dividend 2018 Rs 144,061 thousand
Details of litigations None
Details of default / breach relating to investment None
Gain / loss on disposal of investment Not applicable
15.6 Investment in FFCEL - at cost
FFCEL is presently a wholly owned subsidiary of FFC. Investment in FFCEL represents 243,825 thousand (2017: 243,825 thousand) fully paid ordinary shares of Rs 10 each. FFCEL has been incorporated for the purpose of implementing a project comprising establishment and operation of wind power generation facility and supply of electricity. The Company currently holds 100% shareholding interest in FFCEL, out of which 70,000 shares amounting to Rs 700,000 are held in the name of seven nominee directors of the Company.
15.7 Investment in FFF - at cost
Investment in FFF represents 473,960 thousand (2017: 309,960 thousand) fully paid ordinary shares of Rs 10 each. The Company currently holds 100% shareholding interest in FFF, out of which 7,000 shares amounting to Rs 70,000 are held in the name of seven nominee directors of the Company.
15.8 The investments in associated companies and undertakings have been made in accordance with the
requirements under the Companies Act, 2017 (2017: repealed Companies Ordinance, 1984). 15.9 Investments available for sale
Term Deposit Receipts (TDRs)
These represent placement in TDRs with financial institution having tenure from one to five years with returns ranging from 4.49% to 9.02% per annum (2017: 4.49% to 8.71% per annum).
Pakistan Investment Bonds (PIBs)
PIBs with 5 and 10 years tenure having aggregate face value of Rs 4,765 thousand are due to mature within a period of 4 years. Profit on fixed rate PIBs is payable on half yearly basis with coupon rates ranging from 11.50% to 12.00% per annum and floating rate PIB at weighted average 6 months treasury bill yield + 0.70%. The PIBs are placed with banks as collateral to secure borrowing facilities.
231Annual Report 2018
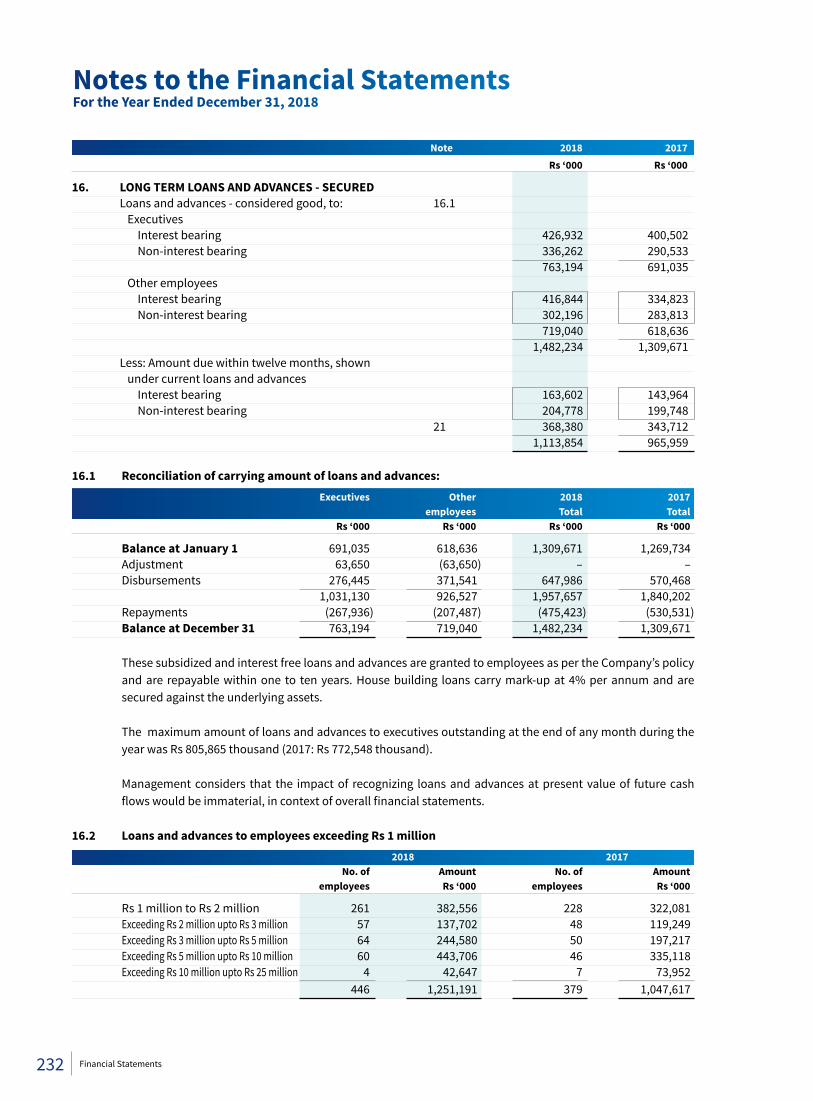
Note 2018 2017 Rs ‘000 Rs ‘000
16. LONG TERM LOANS AND ADVANCES - SECURED Loans and advances - considered good, to: 16.1 Executives Interest bearing 426,932 400,502 Non-interest bearing 336,262 290,533 763,194 691,035 Other employees Interest bearing 416,844 334,823 Non-interest bearing 302,196 283,813 719,040 618,636 1,482,234 1,309,671 Less: Amount due within twelve months, shown under current loans and advances Interest bearing 163,602 143,964 Non-interest bearing 204,778 199,748 21 368,380 343,712 1,113,854 965,959
16.1 Reconciliation of carrying amount of loans and advances: Executives Other 2018 2017 employees Total Total Rs ‘000 Rs ‘000 Rs ‘000 Rs ‘000
Balance at January 1 691,035 618,636 1,309,671 1,269,734 Adjustment 63,650 (63,650) – – Disbursements 276,445 371,541 647,986 570,468 1,031,130 926,527 1,957,657 1,840,202 Repayments (267,936) (207,487) (475,423) (530,531) Balance at December 31 763,194 719,040 1,482,234 1,309,671 These subsidized and interest free loans and advances are granted to employees as per the Company’s policy
and are repayable within one to ten years. House building loans carry mark-up at 4% per annum and are secured against the underlying assets.
The maximum amount of loans and advances to executives outstanding at the end of any month during the year was Rs 805,865 thousand (2017: Rs 772,548 thousand).
Management considers that the impact of recognizing loans and advances at present value of future cash
flows would be immaterial, in context of overall financial statements. 16.2 Loans and advances to employees exceeding Rs 1 million 2018 2017 No. of Amount No. of Amount employees Rs ‘000 employees Rs ‘000
Rs 1 million to Rs 2 million 261 382,556 228 322,081 Exceeding Rs 2 million upto Rs 3 million 57 137,702 48 119,249 Exceeding Rs 3 million upto Rs 5 million 64 244,580 50 197,217 Exceeding Rs 5 million upto Rs 10 million 60 443,706 46 335,118 Exceeding Rs 10 million upto Rs 25 million 4 42,647 7 73,952 446 1,251,191 379 1,047,617
Notes to the Financial StatementsFor the Year Ended December 31, 2018
232 Financial Statements
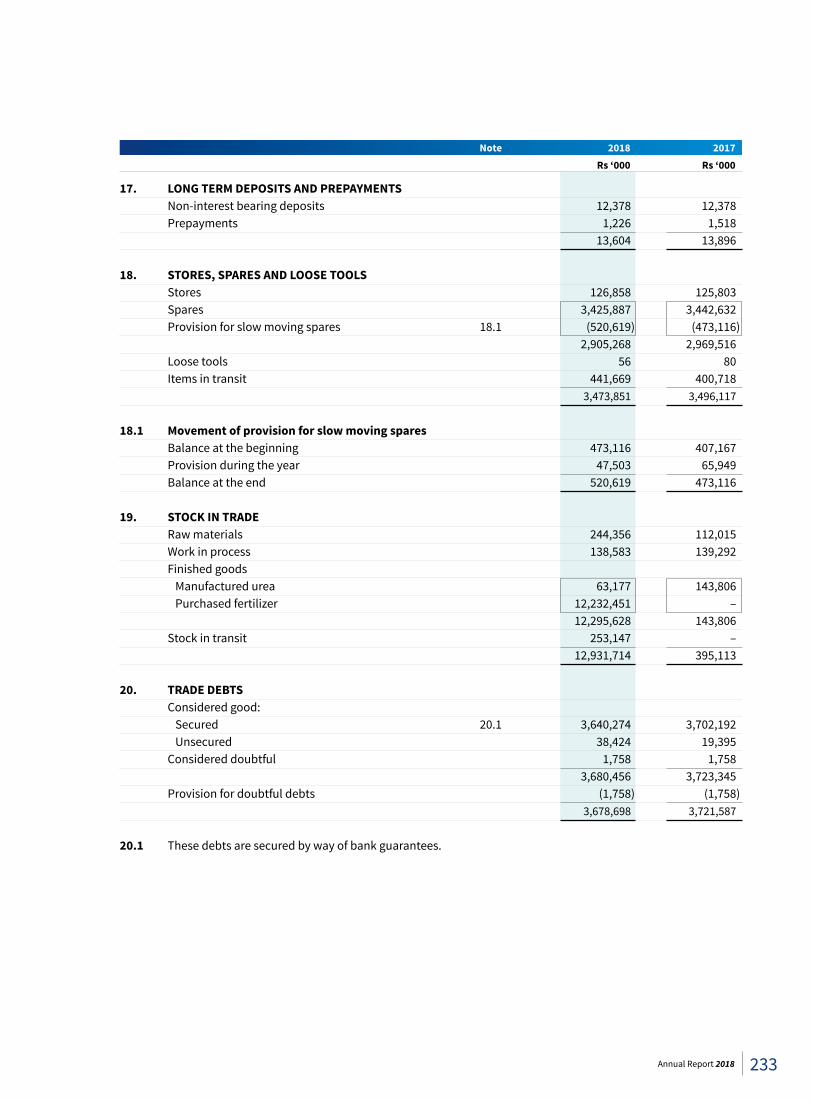
Note 2018 2017 Rs ‘000 Rs ‘000
17. LONG TERM DEPOSITS AND PREPAYMENTS Non-interest bearing deposits 12,378 12,378 Prepayments 1,226 1,518 13,604 13,896
18. STORES, SPARES AND LOOSE TOOLS Stores 126,858 125,803 Spares 3,425,887 3,442,632 Provision for slow moving spares 18.1 (520,619) (473,116) 2,905,268 2,969,516 Loose tools 56 80 Items in transit 441,669 400,718 3,473,851 3,496,117
18.1 Movement of provision for slow moving spares Balance at the beginning 473,116 407,167 Provision during the year 47,503 65,949 Balance at the end 520,619 473,116 19. STOCK IN TRADE Raw materials 244,356 112,015 Work in process 138,583 139,292 Finished goods Manufactured urea 63,177 143,806 Purchased fertilizer 12,232,451 – 12,295,628 143,806 Stock in transit 253,147 – 12,931,714 395,113
20. TRADE DEBTS Considered good: Secured 20.1 3,640,274 3,702,192 Unsecured 38,424 19,395 Considered doubtful 1,758 1,758 3,680,456 3,723,345 Provision for doubtful debts (1,758) (1,758) 3,678,698 3,721,587
20.1 These debts are secured by way of bank guarantees.
233Annual Report 2018
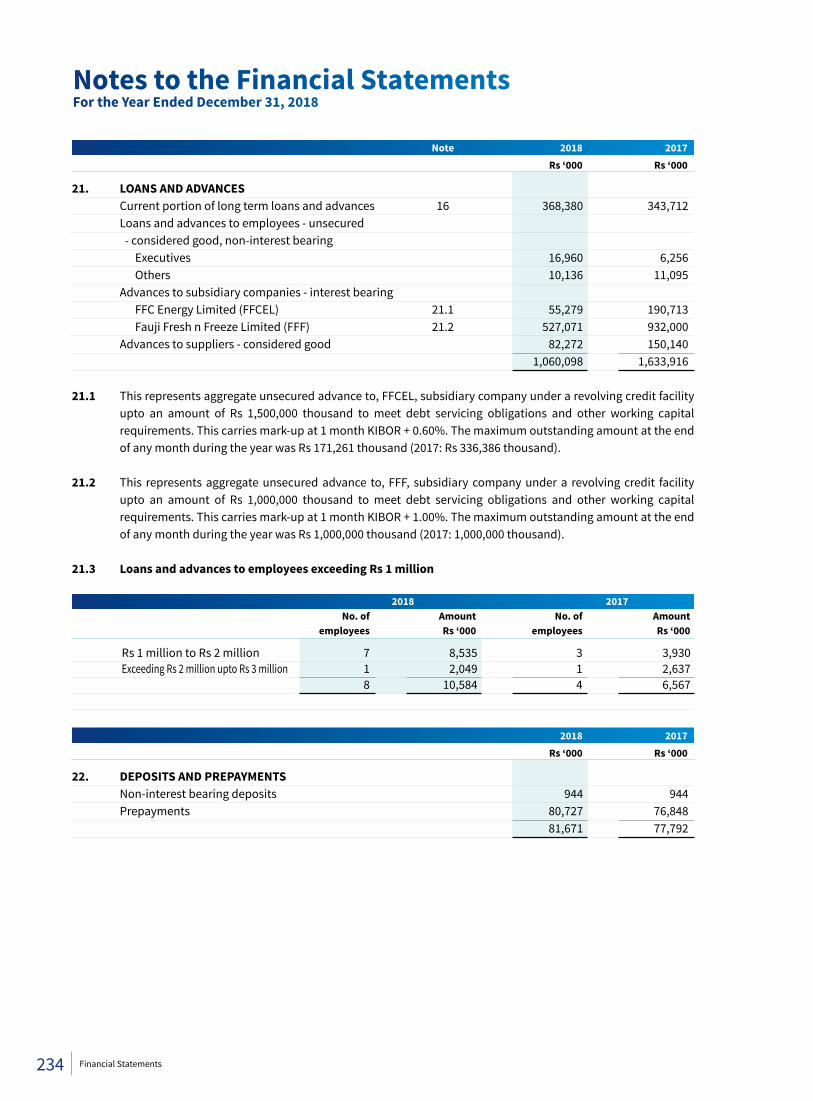
Note 2018 2017 Rs ‘000 Rs ‘000
21. LOANS AND ADVANCES Current portion of long term loans and advances 16 368,380 343,712 Loans and advances to employees - unsecured - considered good, non-interest bearing Executives 16,960 6,256 Others 10,136 11,095 Advances to subsidiary companies - interest bearing FFC Energy Limited (FFCEL) 21.1 55,279 190,713 Fauji Fresh n Freeze Limited (FFF) 21.2 527,071 932,000 Advances to suppliers - considered good 82,272 150,140 1,060,098 1,633,916 21.1 This represents aggregate unsecured advance to, FFCEL, subsidiary company under a revolving credit facility
upto an amount of Rs 1,500,000 thousand to meet debt servicing obligations and other working capital requirements. This carries mark-up at 1 month KIBOR + 0.60%. The maximum outstanding amount at the end of any month during the year was Rs 171,261 thousand (2017: Rs 336,386 thousand).
21.2 This represents aggregate unsecured advance to, FFF, subsidiary company under a revolving credit facility upto an amount of Rs 1,000,000 thousand to meet debt servicing obligations and other working capital requirements. This carries mark-up at 1 month KIBOR + 1.00%. The maximum outstanding amount at the end of any month during the year was Rs 1,000,000 thousand (2017: 1,000,000 thousand).
21.3 Loans and advances to employees exceeding Rs 1 million 2018 2017 No. of Amount No. of Amount employees Rs ‘000 employees Rs ‘000
Rs 1 million to Rs 2 million 7 8,535 3 3,930 Exceeding Rs 2 million upto Rs 3 million 1 2,049 1 2,637 8 10,584 4 6,567
2018 2017 Rs ‘000 Rs ‘000
22. DEPOSITS AND PREPAYMENTS Non-interest bearing deposits 944 944 Prepayments 80,727 76,848 81,671 77,792
Notes to the Financial StatementsFor the Year Ended December 31, 2018
234 Financial Statements
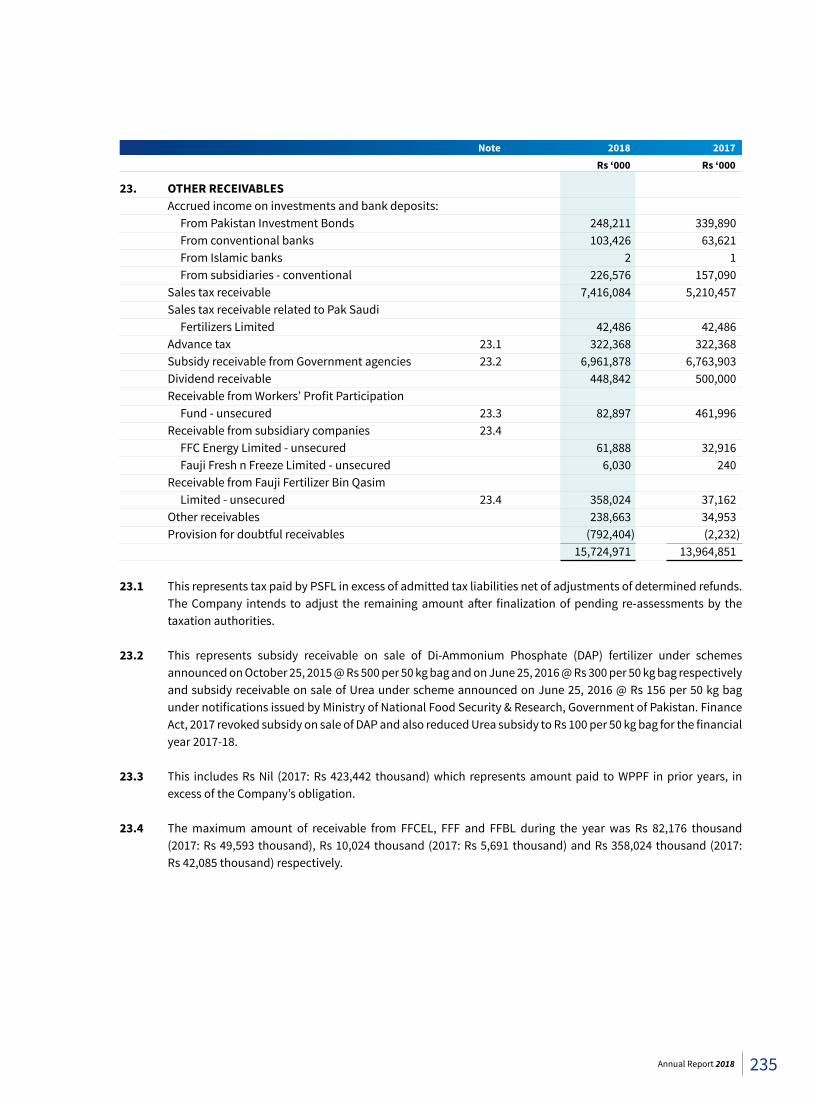
Note 2018 2017 Rs ‘000 Rs ‘000
23. OTHER RECEIVABLES Accrued income on investments and bank deposits: From Pakistan Investment Bonds 248,211 339,890 From conventional banks 103,426 63,621 From Islamic banks 2 1 From subsidiaries - conventional 226,576 157,090 Sales tax receivable 7,416,084 5,210,457 Sales tax receivable related to Pak Saudi Fertilizers Limited 42,486 42,486 Advance tax 23.1 322,368 322,368 Subsidy receivable from Government agencies 23.2 6,961,878 6,763,903 Dividend receivable 448,842 500,000 Receivable from Workers’ Profit Participation Fund - unsecured 23.3 82,897 461,996 Receivable from subsidiary companies 23.4 FFC Energy Limited - unsecured 61,888 32,916 Fauji Fresh n Freeze Limited - unsecured 6,030 240 Receivable from Fauji Fertilizer Bin Qasim Limited - unsecured 23.4 358,024 37,162 Other receivables 238,663 34,953 Provision for doubtful receivables (792,404) (2,232) 15,724,971 13,964,851 23.1 This represents tax paid by PSFL in excess of admitted tax liabilities net of adjustments of determined refunds.
The Company intends to adjust the remaining amount after finalization of pending re-assessments by the taxation authorities.
23.2 This represents subsidy receivable on sale of Di-Ammonium Phosphate (DAP) fertilizer under schemes
announced on October 25, 2015 @ Rs 500 per 50 kg bag and on June 25, 2016 @ Rs 300 per 50 kg bag respectively and subsidy receivable on sale of Urea under scheme announced on June 25, 2016 @ Rs 156 per 50 kg bag under notifications issued by Ministry of National Food Security & Research, Government of Pakistan. Finance Act, 2017 revoked subsidy on sale of DAP and also reduced Urea subsidy to Rs 100 per 50 kg bag for the financial year 2017-18.
23.3 This includes Rs Nil (2017: Rs 423,442 thousand) which represents amount paid to WPPF in prior years, in excess of the Company’s obligation.
23.4 The maximum amount of receivable from FFCEL, FFF and FFBL during the year was Rs 82,176 thousand
(2017: Rs 49,593 thousand), Rs 10,024 thousand (2017: Rs 5,691 thousand) and Rs 358,024 thousand (2017: Rs 42,085 thousand) respectively.
235Annual Report 2018
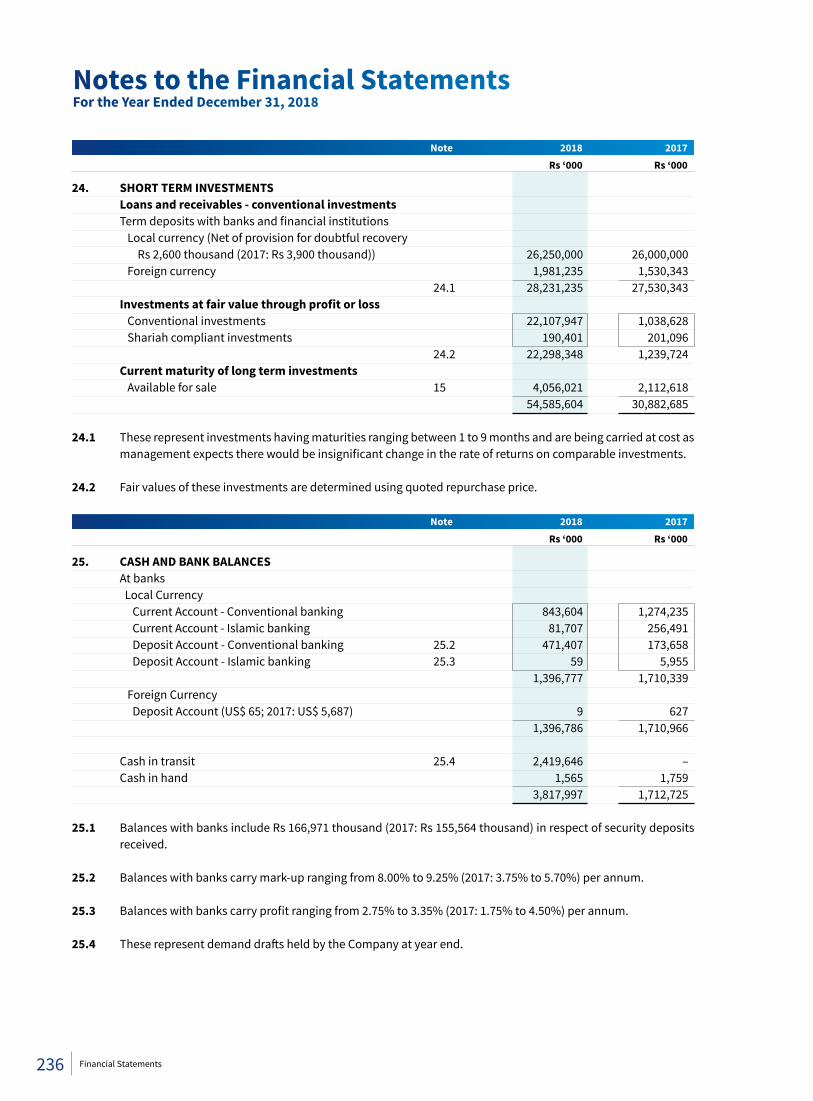
Note 2018 2017 Rs ‘000 Rs ‘000
24. SHORT TERM INVESTMENTS Loans and receivables - conventional investments Term deposits with banks and financial institutions Local currency (Net of provision for doubtful recovery Rs 2,600 thousand (2017: Rs 3,900 thousand)) 26,250,000 26,000,000 Foreign currency 1,981,235 1,530,343 24.1 28,231,235 27,530,343 Investmentsatfairvaluethroughprofitorloss Conventional investments 22,107,947 1,038,628 Shariah compliant investments 190,401 201,096 24.2 22,298,348 1,239,724 Current maturity of long term investments Available for sale 15 4,056,021 2,112,618 54,585,604 30,882,685 24.1 These represent investments having maturities ranging between 1 to 9 months and are being carried at cost as
management expects there would be insignificant change in the rate of returns on comparable investments. 24.2 Fair values of these investments are determined using quoted repurchase price. Note 2018 2017 Rs ‘000 Rs ‘000
25. CASH AND BANK BALANCES At banks Local Currency Current Account - Conventional banking 843,604 1,274,235 Current Account - Islamic banking 81,707 256,491 Deposit Account - Conventional banking 25.2 471,407 173,658 Deposit Account - Islamic banking 25.3 59 5,955 1,396,777 1,710,339 Foreign Currency Deposit Account (US$ 65; 2017: US$ 5,687) 9 627 1,396,786 1,710,966 Cash in transit 25.4 2,419,646 – Cash in hand 1,565 1,759 3,817,997 1,712,725 25.1 Balances with banks include Rs 166,971 thousand (2017: Rs 155,564 thousand) in respect of security deposits
received. 25.2 Balances with banks carry mark-up ranging from 8.00% to 9.25% (2017: 3.75% to 5.70%) per annum. 25.3 Balances with banks carry profit ranging from 2.75% to 3.35% (2017: 1.75% to 4.50%) per annum. 25.4 These represent demand drafts held by the Company at year end.
Notes to the Financial StatementsFor the Year Ended December 31, 2018
236 Financial Statements
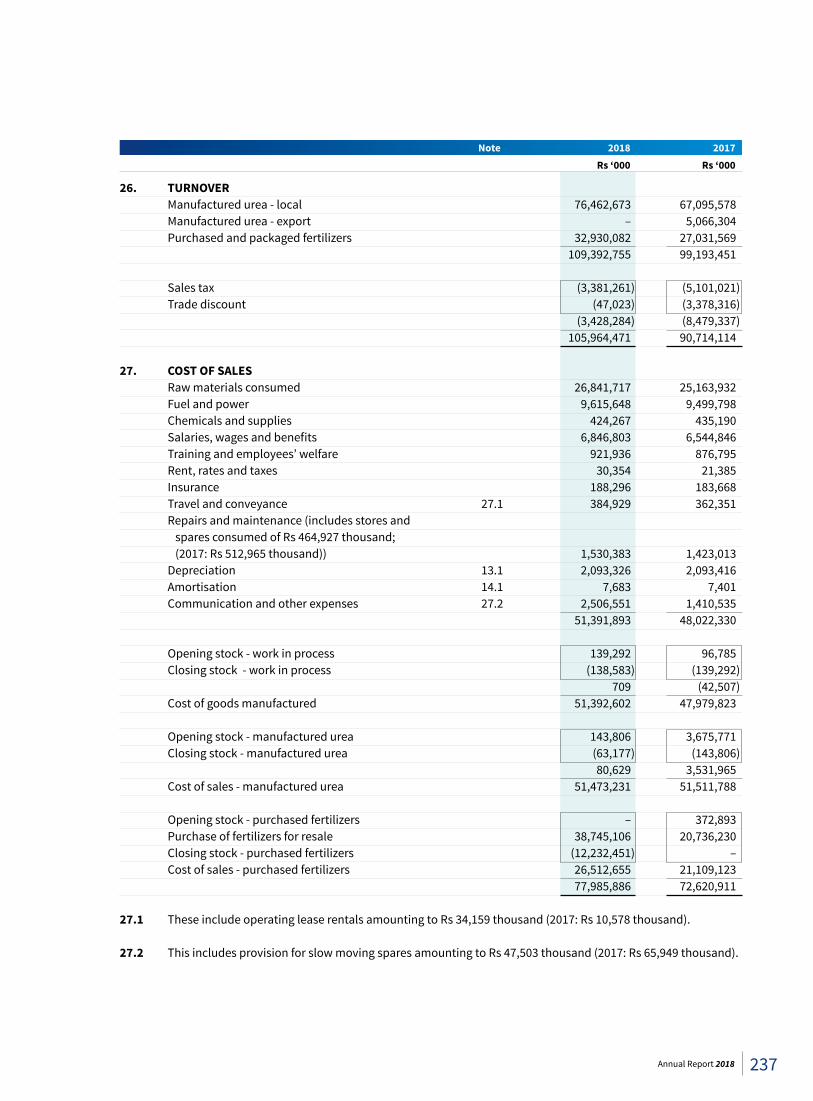
Note 2018 2017 Rs ‘000 Rs ‘000
26. TURNOVER Manufactured urea - local 76,462,673 67,095,578 Manufactured urea - export – 5,066,304 Purchased and packaged fertilizers 32,930,082 27,031,569 109,392,755 99,193,451 Sales tax (3,381,261) (5,101,021) Trade discount (47,023) (3,378,316) (3,428,284) (8,479,337) 105,964,471 90,714,114 27. COST OF SALES Raw materials consumed 26,841,717 25,163,932 Fuel and power 9,615,648 9,499,798 Chemicals and supplies 424,267 435,190 Salaries, wages and benefits 6,846,803 6,544,846 Training and employees’ welfare 921,936 876,795 Rent, rates and taxes 30,354 21,385 Insurance 188,296 183,668 Travel and conveyance 27.1 384,929 362,351 Repairs and maintenance (includes stores and spares consumed of Rs 464,927 thousand; (2017: Rs 512,965 thousand)) 1,530,383 1,423,013 Depreciation 13.1 2,093,326 2,093,416 Amortisation 14.1 7,683 7,401 Communication and other expenses 27.2 2,506,551 1,410,535 51,391,893 48,022,330 Opening stock - work in process 139,292 96,785 Closing stock - work in process (138,583) (139,292) 709 (42,507) Cost of goods manufactured 51,392,602 47,979,823 Opening stock - manufactured urea 143,806 3,675,771 Closing stock - manufactured urea (63,177) (143,806) 80,629 3,531,965 Cost of sales - manufactured urea 51,473,231 51,511,788 Opening stock - purchased fertilizers – 372,893 Purchase of fertilizers for resale 38,745,106 20,736,230 Closing stock - purchased fertilizers (12,232,451) – Cost of sales - purchased fertilizers 26,512,655 21,109,123 77,985,886 72,620,911 27.1 These include operating lease rentals amounting to Rs 34,159 thousand (2017: Rs 10,578 thousand). 27.2 This includes provision for slow moving spares amounting to Rs 47,503 thousand (2017: Rs 65,949 thousand).
237Annual Report 2018
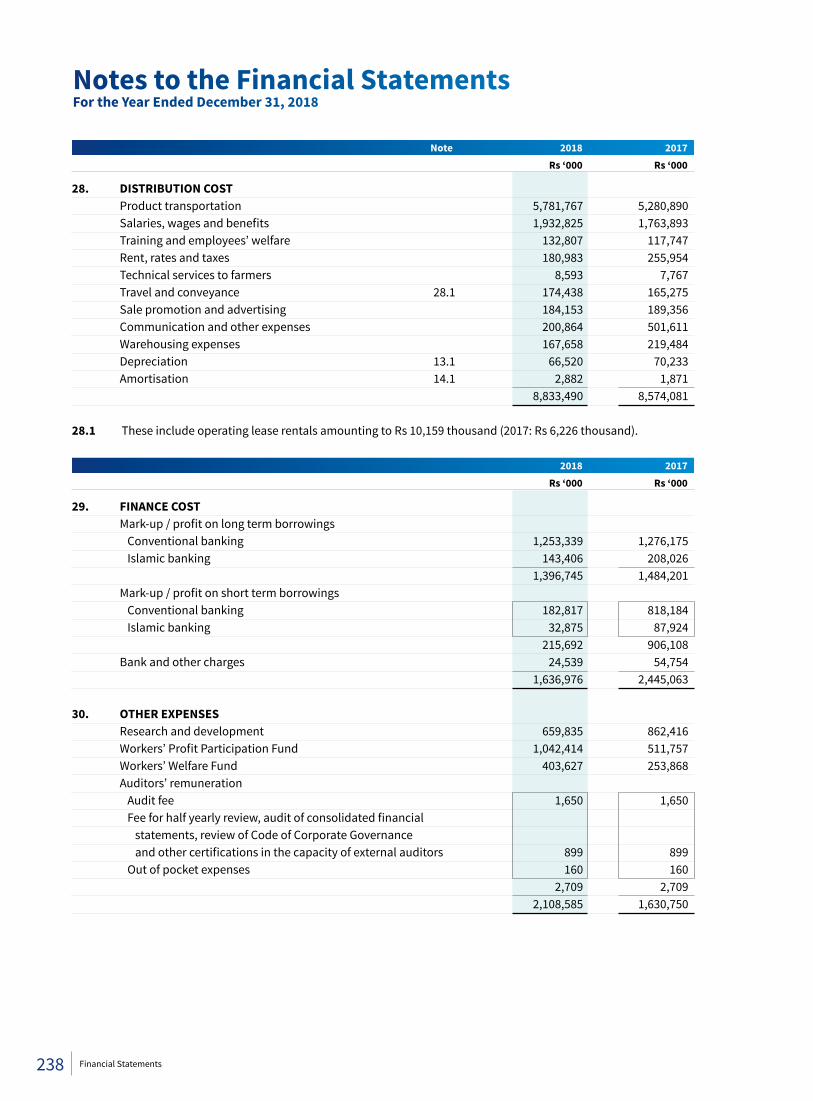
Note 2018 2017 Rs ‘000 Rs ‘000
28. DISTRIBUTION COST Product transportation 5,781,767 5,280,890 Salaries, wages and benefits 1,932,825 1,763,893 Training and employees’ welfare 132,807 117,747 Rent, rates and taxes 180,983 255,954 Technical services to farmers 8,593 7,767 Travel and conveyance 28.1 174,438 165,275 Sale promotion and advertising 184,153 189,356 Communication and other expenses 200,864 501,611 Warehousing expenses 167,658 219,484 Depreciation 13.1 66,520 70,233 Amortisation 14.1 2,882 1,871 8,833,490 8,574,081 28.1 These include operating lease rentals amounting to Rs 10,159 thousand (2017: Rs 6,226 thousand). 2018 2017 Rs ‘000 Rs ‘000
29. FINANCE COST Mark-up / profit on long term borrowings Conventional banking 1,253,339 1,276,175 Islamic banking 143,406 208,026 1,396,745 1,484,201 Mark-up / profit on short term borrowings Conventional banking 182,817 818,184 Islamic banking 32,875 87,924 215,692 906,108 Bank and other charges 24,539 54,754 1,636,976 2,445,063 30. OTHER EXPENSES Research and development 659,835 862,416 Workers’ Profit Participation Fund 1,042,414 511,757 Workers’ Welfare Fund 403,627 253,868 Auditors’ remuneration Audit fee 1,650 1,650 Fee for half yearly review, audit of consolidated financial statements, review of Code of Corporate Governance and other certifications in the capacity of external auditors 899 899 Out of pocket expenses 160 160 2,709 2,709 2,108,585 1,630,750
Notes to the Financial StatementsFor the Year Ended December 31, 2018
238 Financial Statements
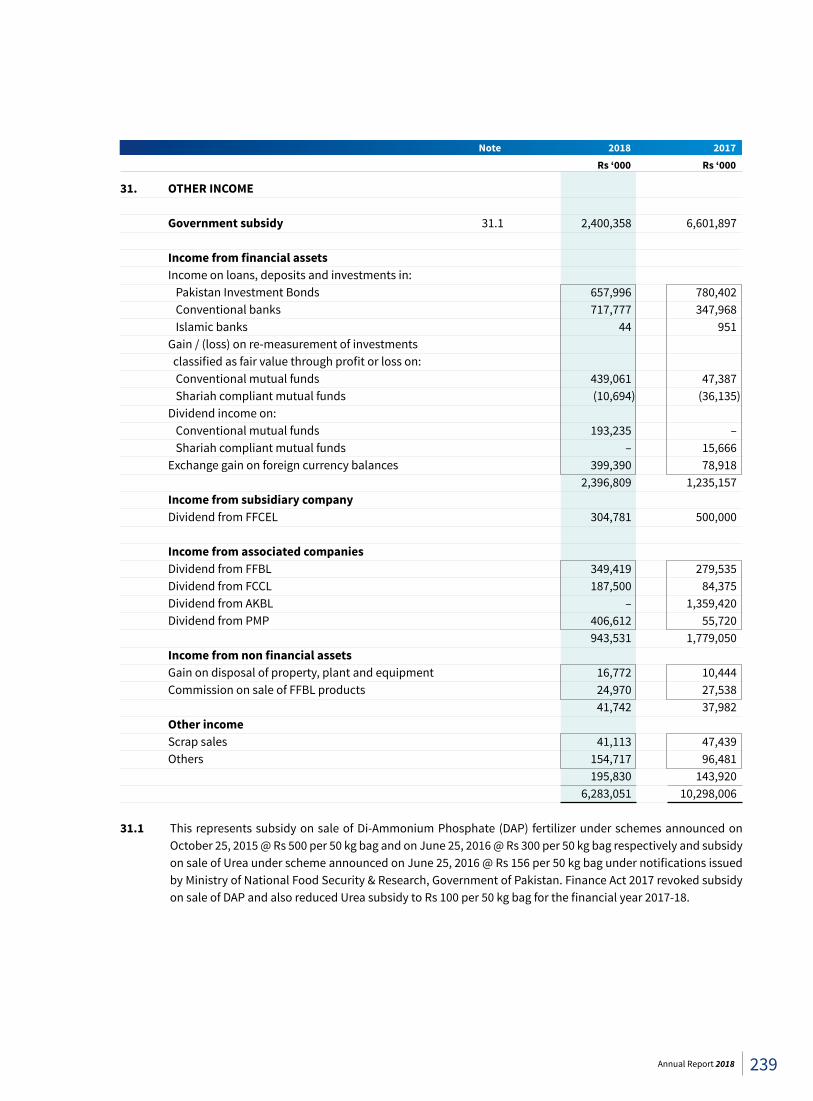
Note 2018 2017 Rs ‘000 Rs ‘000
31. OTHER INCOME
Government subsidy 31.1 2,400,358 6,601,897
Incomefromfinancialassets Income on loans, deposits and investments in: Pakistan Investment Bonds 657,996 780,402 Conventional banks 717,777 347,968 Islamic banks 44 951 Gain / (loss) on re-measurement of investments classified as fair value through profit or loss on: Conventional mutual funds 439,061 47,387 Shariah compliant mutual funds (10,694) (36,135) Dividend income on: Conventional mutual funds 193,235 – Shariah compliant mutual funds – 15,666 Exchange gain on foreign currency balances 399,390 78,918 2,396,809 1,235,157 Income from subsidiary company Dividend from FFCEL 304,781 500,000 Income from associated companies Dividend from FFBL 349,419 279,535 Dividend from FCCL 187,500 84,375 Dividend from AKBL – 1,359,420 Dividend from PMP 406,612 55,720 943,531 1,779,050 Incomefromnonfinancialassets Gain on disposal of property, plant and equipment 16,772 10,444 Commission on sale of FFBL products 24,970 27,538 41,742 37,982 Other income Scrap sales 41,113 47,439 Others 154,717 96,481 195,830 143,920 6,283,051 10,298,006 31.1 This represents subsidy on sale of Di-Ammonium Phosphate (DAP) fertilizer under schemes announced on
October 25, 2015 @ Rs 500 per 50 kg bag and on June 25, 2016 @ Rs 300 per 50 kg bag respectively and subsidy on sale of Urea under scheme announced on June 25, 2016 @ Rs 156 per 50 kg bag under notifications issued by Ministry of National Food Security & Research, Government of Pakistan. Finance Act 2017 revoked subsidy on sale of DAP and also reduced Urea subsidy to Rs 100 per 50 kg bag for the financial year 2017-18.
239Annual Report 2018
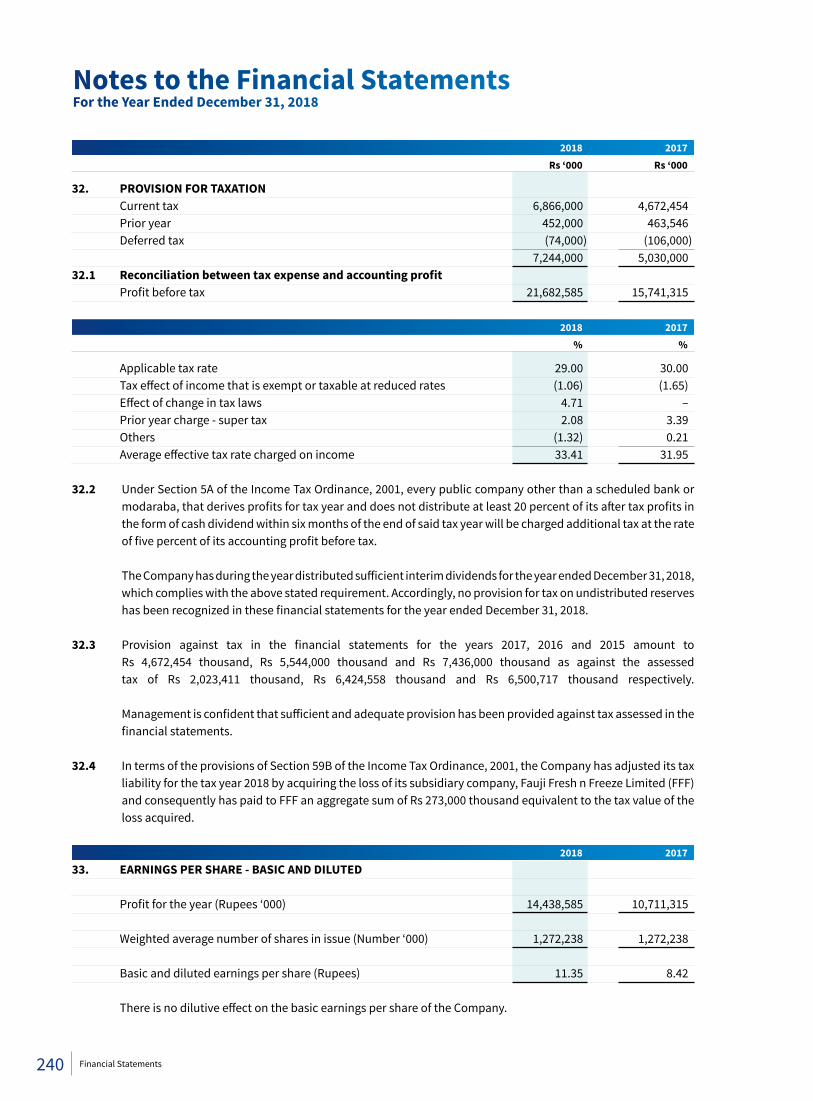
2018 2017 Rs ‘000 Rs ‘000
32. PROVISION FOR TAXATION Current tax 6,866,000 4,672,454 Prior year 452,000 463,546 Deferred tax (74,000) (106,000) 7,244,000 5,030,000 32.1 Reconciliationbetweentaxexpenseandaccountingprofit Profit before tax 21,682,585 15,741,315
2018 2017 % %
Applicable tax rate 29.00 30.00 Tax effect of income that is exempt or taxable at reduced rates (1.06) (1.65) Effect of change in tax laws 4.71 – Prior year charge - super tax 2.08 3.39 Others (1.32) 0.21 Average effective tax rate charged on income 33.41 31.95 32.2 Under Section 5A of the Income Tax Ordinance, 2001, every public company other than a scheduled bank or
modaraba, that derives profits for tax year and does not distribute at least 20 percent of its after tax profits in the form of cash dividend within six months of the end of said tax year will be charged additional tax at the rate of five percent of its accounting profit before tax.
The Company has during the year distributed sufficient interim dividends for the year ended December 31, 2018,
which complies with the above stated requirement. Accordingly, no provision for tax on undistributed reserves has been recognized in these financial statements for the year ended December 31, 2018.
32.3 Provision against tax in the financial statements for the years 2017, 2016 and 2015 amount to
Rs 4,672,454 thousand, Rs 5,544,000 thousand and Rs 7,436,000 thousand as against the assessed tax of Rs 2,023,411 thousand, Rs 6,424,558 thousand and Rs 6,500,717 thousand respectively. Management is confident that sufficient and adequate provision has been provided against tax assessed in the financial statements.
32.4 In terms of the provisions of Section 59B of the Income Tax Ordinance, 2001, the Company has adjusted its tax liability for the tax year 2018 by acquiring the loss of its subsidiary company, Fauji Fresh n Freeze Limited (FFF) and consequently has paid to FFF an aggregate sum of Rs 273,000 thousand equivalent to the tax value of the loss acquired.
2018 201733. EARNINGS PER SHARE - BASIC AND DILUTED Profit for the year (Rupees ‘000) 14,438,585 10,711,315 Weighted average number of shares in issue (Number ‘000) 1,272,238 1,272,238 Basic and diluted earnings per share (Rupees) 11.35 8.42 There is no dilutive effect on the basic earnings per share of the Company.
Notes to the Financial StatementsFor the Year Ended December 31, 2018
240 Financial Statements
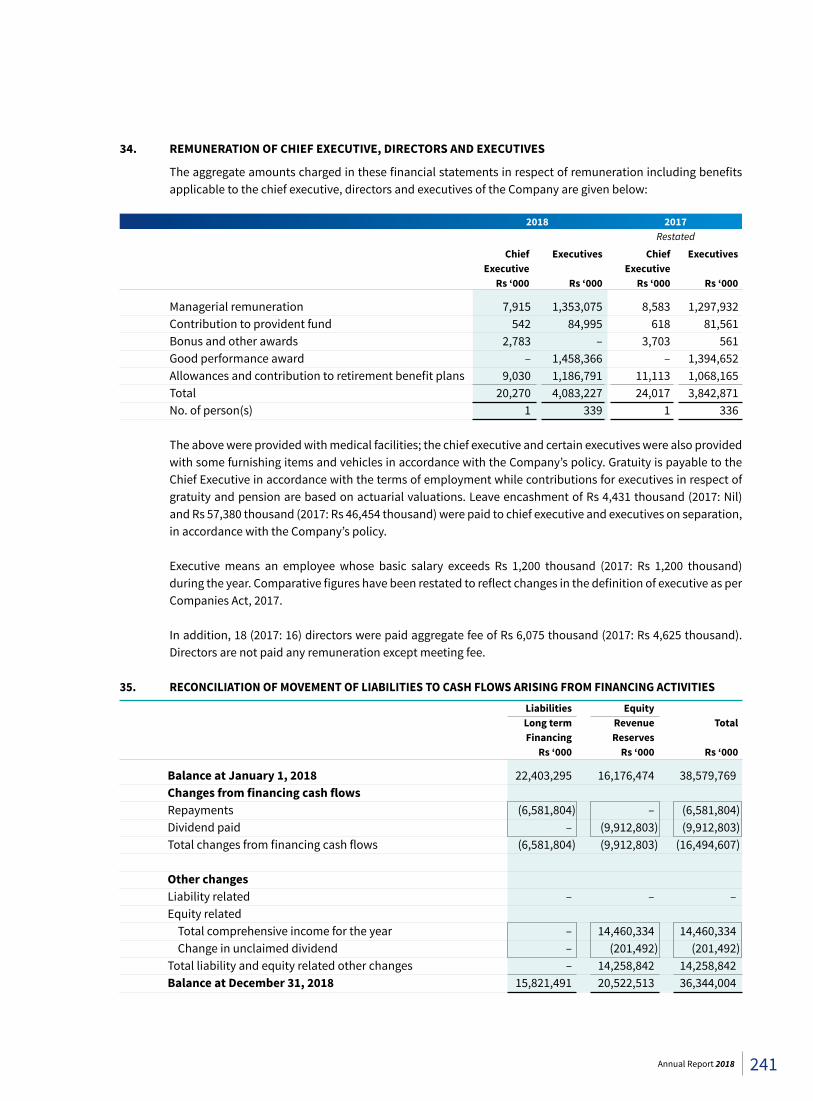
34. REMUNERATION OF CHIEF EXECUTIVE, DIRECTORS AND EXECUTIVES
The aggregate amounts charged in these financial statements in respect of remuneration including benefits applicable to the chief executive, directors and executives of the Company are given below:
2018 2017 Restated
Chief Executives Chief Executives Executive Executive Rs ‘000 Rs ‘000 Rs ‘000 Rs ‘000
Managerial remuneration 7,915 1,353,075 8,583 1,297,932 Contribution to provident fund 542 84,995 618 81,561 Bonus and other awards 2,783 – 3,703 561 Good performance award – 1,458,366 – 1,394,652 Allowances and contribution to retirement benefit plans 9,030 1,186,791 11,113 1,068,165 Total 20,270 4,083,227 24,017 3,842,871 No. of person(s) 1 339 1 336 The above were provided with medical facilities; the chief executive and certain executives were also provided
with some furnishing items and vehicles in accordance with the Company’s policy. Gratuity is payable to the Chief Executive in accordance with the terms of employment while contributions for executives in respect of gratuity and pension are based on actuarial valuations. Leave encashment of Rs 4,431 thousand (2017: Nil) and Rs 57,380 thousand (2017: Rs 46,454 thousand) were paid to chief executive and executives on separation, in accordance with the Company’s policy.
Executive means an employee whose basic salary exceeds Rs 1,200 thousand (2017: Rs 1,200 thousand) during the year. Comparative figures have been restated to reflect changes in the definition of executive as per Companies Act, 2017.
In addition, 18 (2017: 16) directors were paid aggregate fee of Rs 6,075 thousand (2017: Rs 4,625 thousand). Directors are not paid any remuneration except meeting fee.
35. RECONCILIATION OF MOVEMENT OF LIABILITIES TO CASH FLOWS ARISING FROM FINANCING ACTIVITIES Liabilities Equity Long term Revenue Total Financing Reserves Rs ‘000 Rs ‘000 Rs ‘000
Balance at January 1, 2018 22,403,295 16,176,474 38,579,769 Changesfromfinancingcashflows Repayments (6,581,804) – (6,581,804) Dividend paid – (9,912,803) (9,912,803) Total changes from financing cash flows (6,581,804) (9,912,803) (16,494,607) Other changes Liability related – – – Equity related Total comprehensive income for the year – 14,460,334 14,460,334 Change in unclaimed dividend – (201,492) (201,492) Total liability and equity related other changes – 14,258,842 14,258,842 Balance at December 31, 2018 15,821,491 20,522,513 36,344,004
241Annual Report 2018
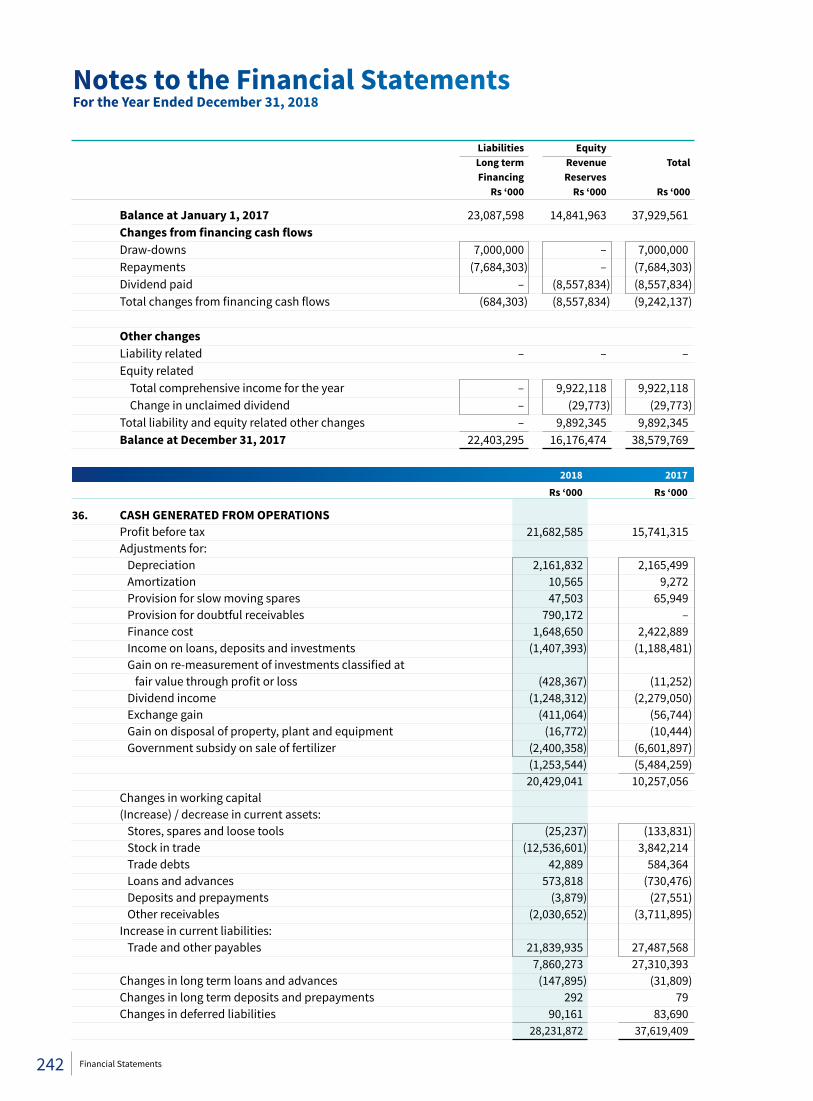
Liabilities Equity Long term Revenue Total Financing Reserves Rs ‘000 Rs ‘000 Rs ‘000
Balance at January 1, 2017 23,087,598 14,841,963 37,929,561 Changesfromfinancingcashflows Draw-downs 7,000,000 – 7,000,000 Repayments (7,684,303) – (7,684,303) Dividend paid – (8,557,834) (8,557,834) Total changes from financing cash flows (684,303) (8,557,834) (9,242,137) Other changes Liability related – – – Equity related Total comprehensive income for the year – 9,922,118 9,922,118 Change in unclaimed dividend – (29,773) (29,773) Total liability and equity related other changes – 9,892,345 9,892,345 Balance at December 31, 2017 22,403,295 16,176,474 38,579,769
2018 2017 Rs ‘000 Rs ‘000
36. CASH GENERATED FROM OPERATIONS Profit before tax 21,682,585 15,741,315 Adjustments for: Depreciation 2,161,832 2,165,499 Amortization 10,565 9,272 Provision for slow moving spares 47,503 65,949 Provision for doubtful receivables 790,172 – Finance cost 1,648,650 2,422,889 Income on loans, deposits and investments (1,407,393) (1,188,481) Gain on re-measurement of investments classified at fair value through profit or loss (428,367) (11,252) Dividend income (1,248,312) (2,279,050) Exchange gain (411,064) (56,744) Gain on disposal of property, plant and equipment (16,772) (10,444) Government subsidy on sale of fertilizer (2,400,358) (6,601,897) (1,253,544) (5,484,259) 20,429,041 10,257,056 Changes in working capital (Increase) / decrease in current assets: Stores, spares and loose tools (25,237) (133,831) Stock in trade (12,536,601) 3,842,214 Trade debts 42,889 584,364 Loans and advances 573,818 (730,476) Deposits and prepayments (3,879) (27,551) Other receivables (2,030,652) (3,711,895) Increase in current liabilities: Trade and other payables 21,839,935 27,487,568 7,860,273 27,310,393 Changes in long term loans and advances (147,895) (31,809) Changes in long term deposits and prepayments 292 79 Changes in deferred liabilities 90,161 83,690 28,231,872 37,619,409
Notes to the Financial StatementsFor the Year Ended December 31, 2018
242 Financial Statements
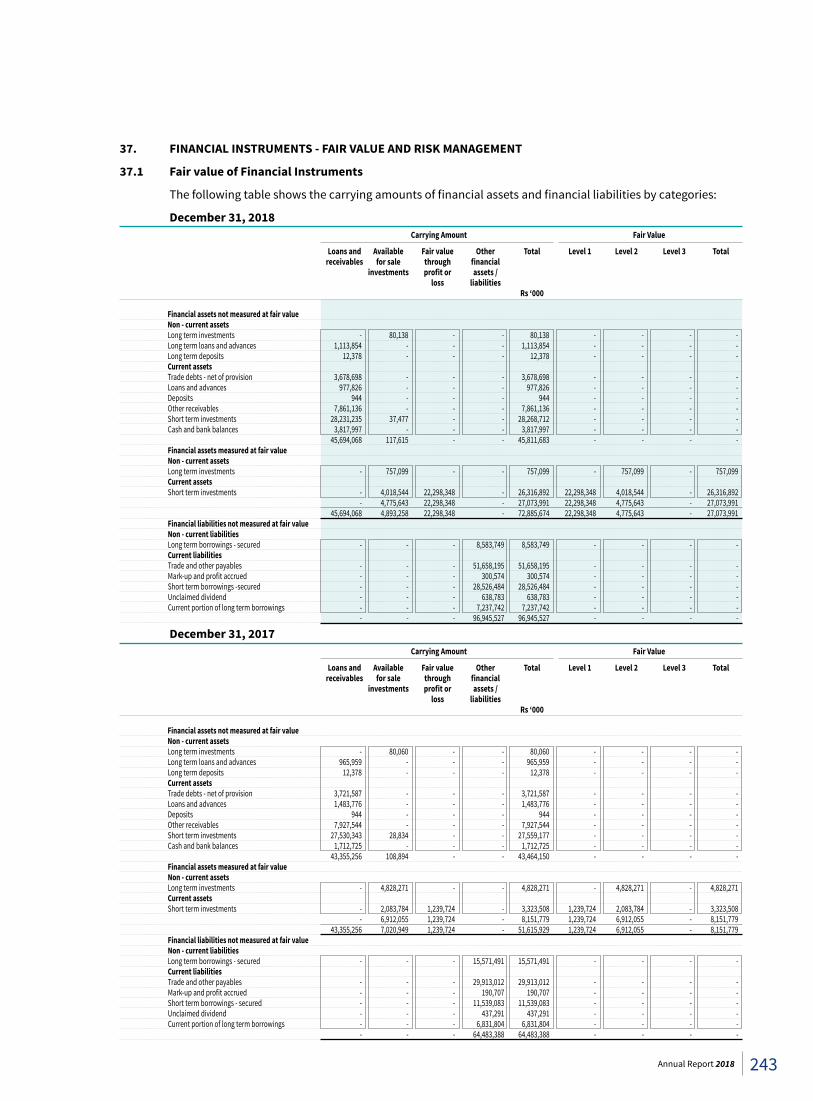
37. FINANCIAL INSTRUMENTS - FAIR VALUE AND RISK MANAGEMENT
37.1 Fair value of Financial Instruments
The following table shows the carrying amounts of financial assets and financial liabilities by categories:
December 31, 2018 Carrying Amount Fair Value
Loans and Available Fair value Other Total Level 1 Level 2 Level 3 Total receivables forsale through financial investments profitor assets/ loss liabilities Rs ‘000 Financial assets not measured at fair value Non - current assets Long term investments - 80,138 - - 80,138 - - - - Long term loans and advances 1,113,854 - - - 1,113,854 - - - - Long term deposits 12,378 - - - 12,378 - - - - Current assets Trade debts - net of provision 3,678,698 - - - 3,678,698 - - - - Loans and advances 977,826 - - - 977,826 - - - - Deposits 944 - - - 944 - - - - Other receivables 7,861,136 - - - 7,861,136 - - - - Short term investments 28,231,235 37,477 - - 28,268,712 - - - - Cash and bank balances 3,817,997 - - - 3,817,997 - - - - 45,694,068 117,615 - - 45,811,683 - - - - Financial assets measured at fair value Non - current assets Long term investments - 757,099 - - 757,099 - 757,099 - 757,099 Current assets Short term investments - 4,018,544 22,298,348 - 26,316,892 22,298,348 4,018,544 - 26,316,892 - 4,775,643 22,298,348 - 27,073,991 22,298,348 4,775,643 - 27,073,991 45,694,068 4,893,258 22,298,348 - 72,885,674 22,298,348 4,775,643 - 27,073,991 Financial liabilities not measured at fair value Non - current liabilities Long term borrowings - secured - - - 8,583,749 8,583,749 - - - - Current liabilities Trade and other payables - - - 51,658,195 51,658,195 - - - - Mark-up and profit accrued - - - 300,574 300,574 - - - - Short term borrowings -secured - - - 28,526,484 28,526,484 - - - - Unclaimed dividend - - - 638,783 638,783 - - - - Current portion of long term borrowings - - - 7,237,742 7,237,742 - - - - - - - 96,945,527 96,945,527 - - - -
December 31, 2017 Carrying Amount Fair Value
Loans and Available Fair value Other Total Level 1 Level 2 Level 3 Total receivables forsale through financial investments profitor assets/ loss liabilities Rs ‘000 Financial assets not measured at fair value Non - current assets Long term investments - 80,060 - - 80,060 - - - - Long term loans and advances 965,959 - - - 965,959 - - - - Long term deposits 12,378 - - - 12,378 - - - - Current assets Trade debts - net of provision 3,721,587 - - - 3,721,587 - - - - Loans and advances 1,483,776 - - - 1,483,776 - - - - Deposits 944 - - - 944 - - - - Other receivables 7,927,544 - - - 7,927,544 - - - - Short term investments 27,530,343 28,834 - - 27,559,177 - - - - Cash and bank balances 1,712,725 - - - 1,712,725 - - - - 43,355,256 108,894 - - 43,464,150 - - - - Financial assets measured at fair value Non - current assets Long term investments - 4,828,271 - - 4,828,271 - 4,828,271 - 4,828,271 Current assets Short term investments - 2,083,784 1,239,724 - 3,323,508 1,239,724 2,083,784 - 3,323,508 - 6,912,055 1,239,724 - 8,151,779 1,239,724 6,912,055 - 8,151,779 43,355,256 7,020,949 1,239,724 - 51,615,929 1,239,724 6,912,055 - 8,151,779 Financial liabilities not measured at fair value Non - current liabilities Long term borrowings - secured - - - 15,571,491 15,571,491 - - - - Current liabilities Trade and other payables - - - 29,913,012 29,913,012 - - - - Mark-up and profit accrued - - - 190,707 190,707 - - - - Short term borrowings - secured - - - 11,539,083 11,539,083 - - - - Unclaimed dividend - - - 437,291 437,291 - - - - Current portion of long term borrowings - - - 6,831,804 6,831,804 - - - - - - - 64,483,388 64,483,388 - - - -
243Annual Report 2018
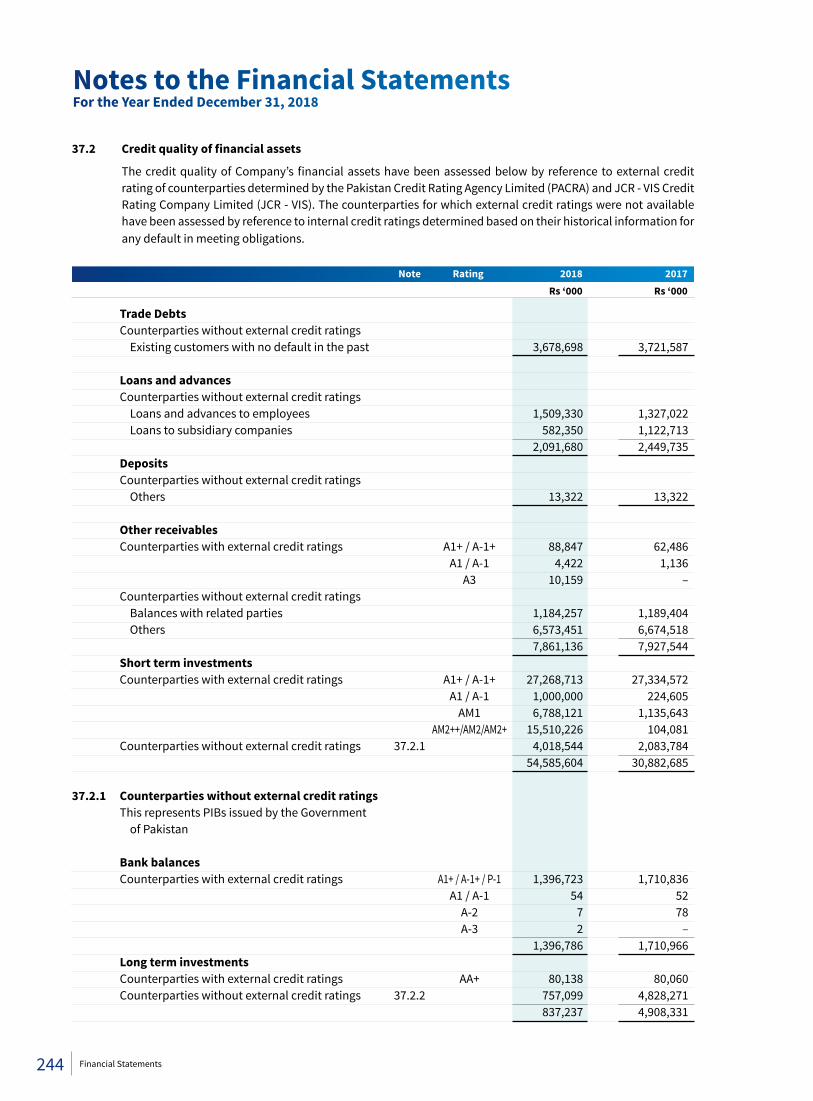
37.2 Creditqualityoffinancialassets
The credit quality of Company’s financial assets have been assessed below by reference to external credit rating of counterparties determined by the Pakistan Credit Rating Agency Limited (PACRA) and JCR - VIS Credit Rating Company Limited (JCR - VIS). The counterparties for which external credit ratings were not available have been assessed by reference to internal credit ratings determined based on their historical information for any default in meeting obligations.
Note Rating 2018 2017 Rs ‘000 Rs ‘000
Trade Debts Counterparties without external credit ratings Existing customers with no default in the past 3,678,698 3,721,587 Loans and advances Counterparties without external credit ratings Loans and advances to employees 1,509,330 1,327,022 Loans to subsidiary companies 582,350 1,122,713 2,091,680 2,449,735 Deposits Counterparties without external credit ratings Others 13,322 13,322 Other receivables Counterparties with external credit ratings A1+ / A-1+ 88,847 62,486 A1 / A-1 4,422 1,136 A3 10,159 – Counterparties without external credit ratings Balances with related parties 1,184,257 1,189,404 Others 6,573,451 6,674,518 7,861,136 7,927,544 Short term investments Counterparties with external credit ratings A1+ / A-1+ 27,268,713 27,334,572 A1 / A-1 1,000,000 224,605 AM1 6,788,121 1,135,643 AM2++/AM2/AM2+ 15,510,226 104,081 Counterparties without external credit ratings 37.2.1 4,018,544 2,083,784 54,585,604 30,882,685
37.2.1 Counterparties without external credit ratings This represents PIBs issued by the Government of Pakistan Bank balances Counterparties with external credit ratings A1+ / A-1+ / P-1 1,396,723 1,710,836 A1 / A-1 54 52 A-2 7 78 A-3 2 – 1,396,786 1,710,966 Long term investments Counterparties with external credit ratings AA+ 80,138 80,060 Counterparties without external credit ratings 37.2.2 757,099 4,828,271 837,237 4,908,331
Notes to the Financial StatementsFor the Year Ended December 31, 2018
244 Financial Statements
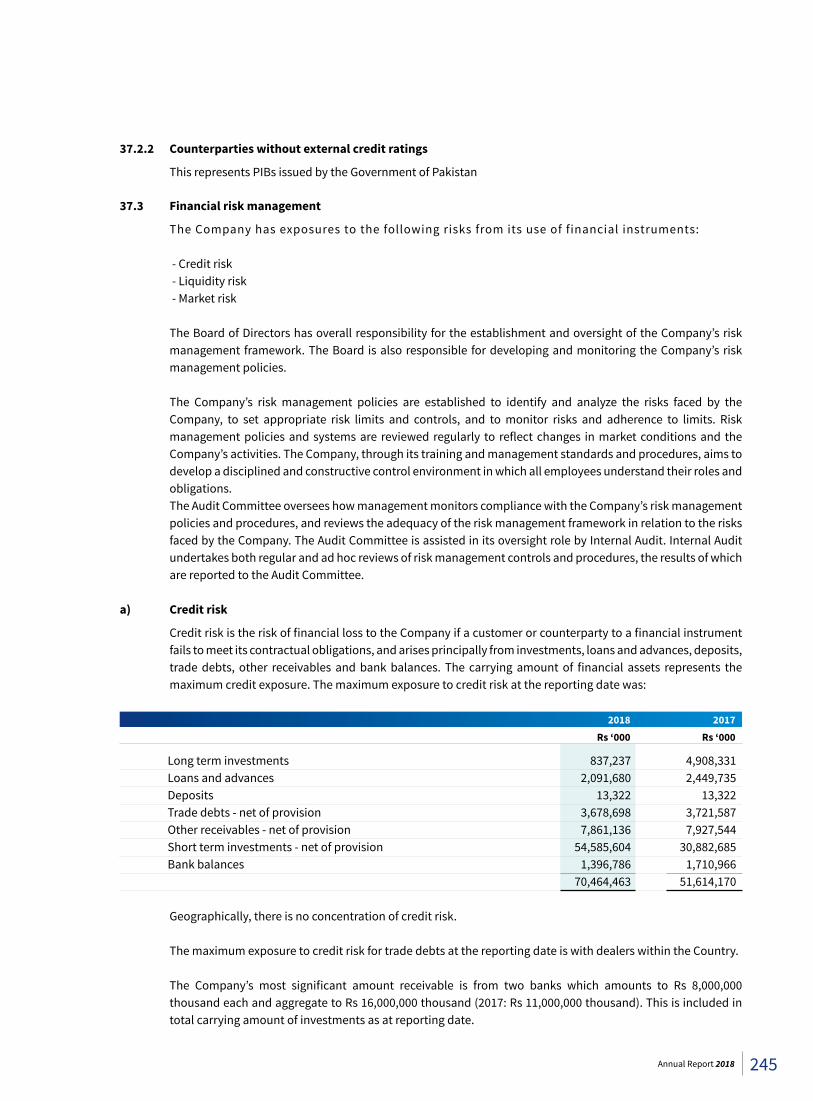
37.2.2 Counterparties without external credit ratings
This represents PIBs issued by the Government of Pakistan 37.3 Financial risk management
The Company has exposures to the following risks from its use of financial instruments:
- Credit risk - Liquidity risk - Market risk The Board of Directors has overall responsibility for the establishment and oversight of the Company’s risk
management framework. The Board is also responsible for developing and monitoring the Company’s risk management policies.
The Company’s risk management policies are established to identify and analyze the risks faced by the
Company, to set appropriate risk limits and controls, and to monitor risks and adherence to limits. Risk management policies and systems are reviewed regularly to reflect changes in market conditions and the Company’s activities. The Company, through its training and management standards and procedures, aims to develop a disciplined and constructive control environment in which all employees understand their roles and obligations.
The Audit Committee oversees how management monitors compliance with the Company’s risk management policies and procedures, and reviews the adequacy of the risk management framework in relation to the risks faced by the Company. The Audit Committee is assisted in its oversight role by Internal Audit. Internal Audit undertakes both regular and ad hoc reviews of risk management controls and procedures, the results of which are reported to the Audit Committee.
a) Credit risk
Credit risk is the risk of financial loss to the Company if a customer or counterparty to a financial instrument fails to meet its contractual obligations, and arises principally from investments, loans and advances, deposits, trade debts, other receivables and bank balances. The carrying amount of financial assets represents the maximum credit exposure. The maximum exposure to credit risk at the reporting date was:
2018 2017 Rs ‘000 Rs ‘000
Long term investments 837,237 4,908,331 Loans and advances 2,091,680 2,449,735 Deposits 13,322 13,322 Trade debts - net of provision 3,678,698 3,721,587 Other receivables - net of provision 7,861,136 7,927,544 Short term investments - net of provision 54,585,604 30,882,685 Bank balances 1,396,786 1,710,966 70,464,463 51,614,170 Geographically, there is no concentration of credit risk. The maximum exposure to credit risk for trade debts at the reporting date is with dealers within the Country.
The Company’s most significant amount receivable is from two banks which amounts to Rs 8,000,000 thousand each and aggregate to Rs 16,000,000 thousand (2017: Rs 11,000,000 thousand). This is included in total carrying amount of investments as at reporting date.
245Annual Report 2018
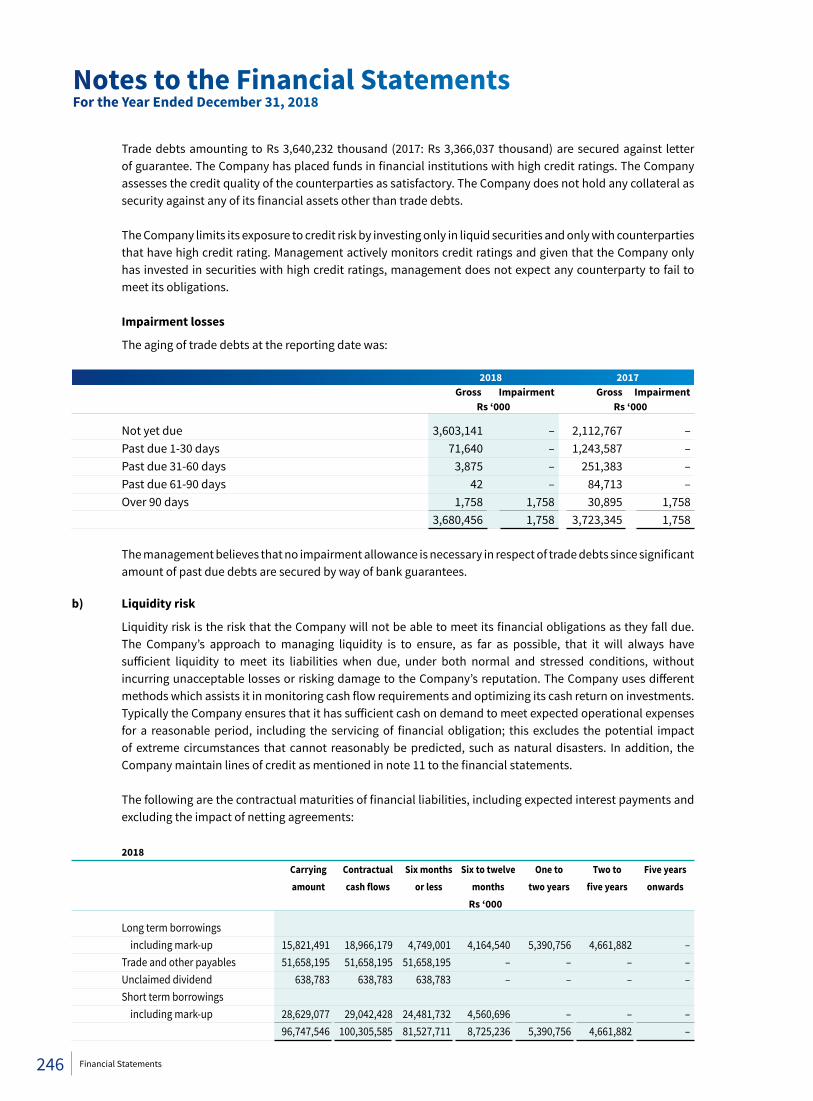
Trade debts amounting to Rs 3,640,232 thousand (2017: Rs 3,366,037 thousand) are secured against letter of guarantee. The Company has placed funds in financial institutions with high credit ratings. The Company assesses the credit quality of the counterparties as satisfactory. The Company does not hold any collateral as security against any of its financial assets other than trade debts.
The Company limits its exposure to credit risk by investing only in liquid securities and only with counterparties
that have high credit rating. Management actively monitors credit ratings and given that the Company only has invested in securities with high credit ratings, management does not expect any counterparty to fail to meet its obligations.
Impairment losses
The aging of trade debts at the reporting date was: 2018 2017 Gross Impairment Gross Impairment Rs ‘000 Rs ‘000
Not yet due 3,603,141 – 2,112,767 – Past due 1-30 days 71,640 – 1,243,587 – Past due 31-60 days 3,875 – 251,383 – Past due 61-90 days 42 – 84,713 – Over 90 days 1,758 1,758 30,895 1,758 3,680,456 1,758 3,723,345 1,758 The management believes that no impairment allowance is necessary in respect of trade debts since significant
amount of past due debts are secured by way of bank guarantees.
b) Liquidity risk
Liquidity risk is the risk that the Company will not be able to meet its financial obligations as they fall due. The Company’s approach to managing liquidity is to ensure, as far as possible, that it will always have sufficient liquidity to meet its liabilities when due, under both normal and stressed conditions, without incurring unacceptable losses or risking damage to the Company’s reputation. The Company uses different methods which assists it in monitoring cash flow requirements and optimizing its cash return on investments. Typically the Company ensures that it has sufficient cash on demand to meet expected operational expenses for a reasonable period, including the servicing of financial obligation; this excludes the potential impact of extreme circumstances that cannot reasonably be predicted, such as natural disasters. In addition, the Company maintain lines of credit as mentioned in note 11 to the financial statements.
The following are the contractual maturities of financial liabilities, including expected interest payments and excluding the impact of netting agreements:
2018 Carrying Contractual Six months Six to twelve One to Two to Five years amount cashflows orless months twoyears fiveyears onwards Rs ‘000
Long term borrowings including mark-up 15,821,491 18,966,179 4,749,001 4,164,540 5,390,756 4,661,882 – Trade and other payables 51,658,195 51,658,195 51,658,195 – – – – Unclaimed dividend 638,783 638,783 638,783 – – – – Short term borrowings including mark-up 28,629,077 29,042,428 24,481,732 4,560,696 – – – 96,747,546 100,305,585 81,527,711 8,725,236 5,390,756 4,661,882 –
Notes to the Financial StatementsFor the Year Ended December 31, 2018
246 Financial Statements
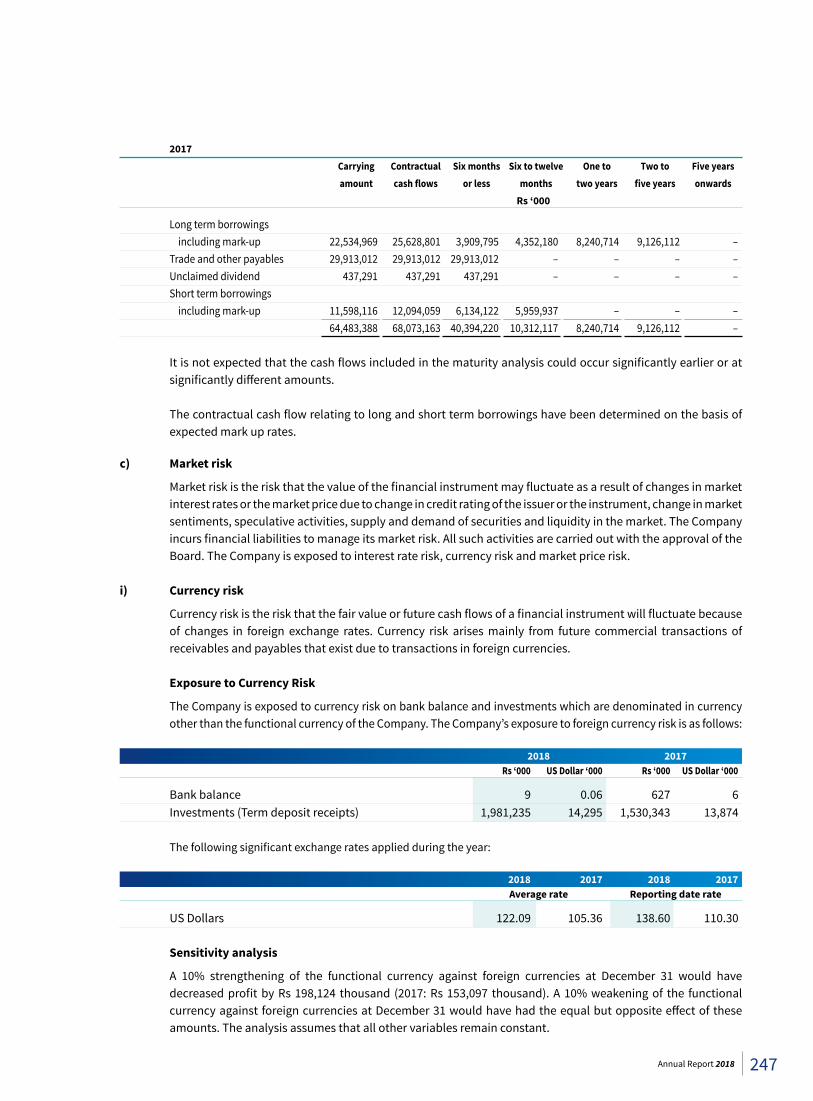
2017 Carrying Contractual Six months Six to twelve One to Two to Five years amount cashflows orless months twoyears fiveyears onwards Rs ‘000
Long term borrowings including mark-up 22,534,969 25,628,801 3,909,795 4,352,180 8,240,714 9,126,112 – Trade and other payables 29,913,012 29,913,012 29,913,012 – – – – Unclaimed dividend 437,291 437,291 437,291 – – – – Short term borrowings including mark-up 11,598,116 12,094,059 6,134,122 5,959,937 – – – 64,483,388 68,073,163 40,394,220 10,312,117 8,240,714 9,126,112 – It is not expected that the cash flows included in the maturity analysis could occur significantly earlier or at
significantly different amounts.
The contractual cash flow relating to long and short term borrowings have been determined on the basis of expected mark up rates.
c) Market risk
Market risk is the risk that the value of the financial instrument may fluctuate as a result of changes in market interest rates or the market price due to change in credit rating of the issuer or the instrument, change in market sentiments, speculative activities, supply and demand of securities and liquidity in the market. The Company incurs financial liabilities to manage its market risk. All such activities are carried out with the approval of the Board. The Company is exposed to interest rate risk, currency risk and market price risk.
i) Currency risk
Currency risk is the risk that the fair value or future cash flows of a financial instrument will fluctuate because of changes in foreign exchange rates. Currency risk arises mainly from future commercial transactions of receivables and payables that exist due to transactions in foreign currencies.
Exposure to Currency Risk
The Company is exposed to currency risk on bank balance and investments which are denominated in currency other than the functional currency of the Company. The Company’s exposure to foreign currency risk is as follows:
2018 2017 Rs ‘000 US Dollar ‘000 Rs ‘000 US Dollar ‘000
Bank balance 9 0.06 627 6 Investments (Term deposit receipts) 1,981,235 14,295 1,530,343 13,874 The following significant exchange rates applied during the year: 2018 2017 2018 2017 Average rate Reporting date rate
US Dollars 122.09 105.36 138.60 110.30 Sensitivity analysis
A 10% strengthening of the functional currency against foreign currencies at December 31 would have decreased profit by Rs 198,124 thousand (2017: Rs 153,097 thousand). A 10% weakening of the functional currency against foreign currencies at December 31 would have had the equal but opposite effect of these amounts. The analysis assumes that all other variables remain constant.
247Annual Report 2018
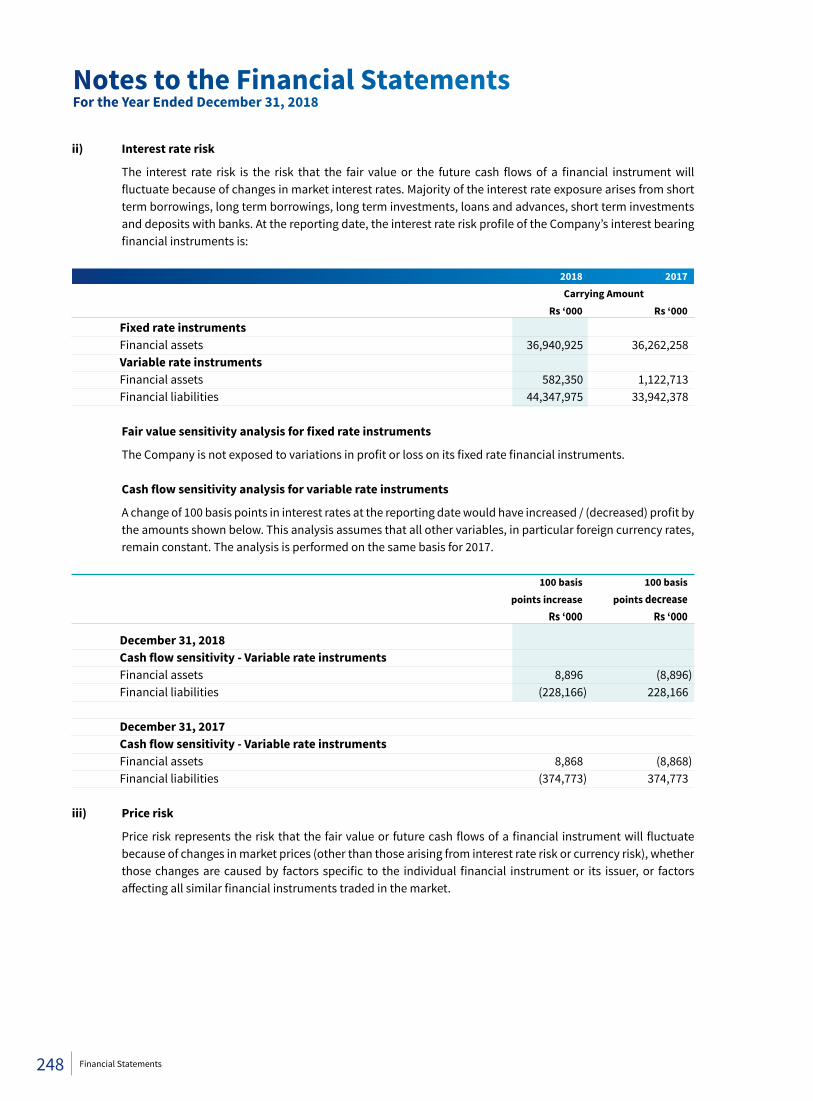
ii) Interest rate risk
The interest rate risk is the risk that the fair value or the future cash flows of a financial instrument will fluctuate because of changes in market interest rates. Majority of the interest rate exposure arises from short term borrowings, long term borrowings, long term investments, loans and advances, short term investments and deposits with banks. At the reporting date, the interest rate risk profile of the Company’s interest bearing financial instruments is:
2018 2017 Carrying Amount Rs ‘000 Rs ‘000 Fixed rate instruments Financial assets 36,940,925 36,262,258 Variable rate instruments Financial assets 582,350 1,122,713 Financial liabilities 44,347,975 33,942,378 Fairvaluesensitivityanalysisforfixedrateinstruments
The Company is not exposed to variations in profit or loss on its fixed rate financial instruments. Cashflowsensitivityanalysisforvariablerateinstruments
A change of 100 basis points in interest rates at the reporting date would have increased / (decreased) profit by the amounts shown below. This analysis assumes that all other variables, in particular foreign currency rates, remain constant. The analysis is performed on the same basis for 2017.
100 basis 100 basis points increase points decrease Rs ‘000 Rs ‘000
December 31, 2018 Cashflowsensitivity-Variablerateinstruments Financial assets 8,896 (8,896) Financial liabilities (228,166) 228,166 December 31, 2017 Cashflowsensitivity-Variablerateinstruments Financial assets 8,868 (8,868) Financial liabilities (374,773) 374,773 iii) Price risk
Price risk represents the risk that the fair value or future cash flows of a financial instrument will fluctuate because of changes in market prices (other than those arising from interest rate risk or currency risk), whether those changes are caused by factors specific to the individual financial instrument or its issuer, or factors affecting all similar financial instruments traded in the market.
Notes to the Financial StatementsFor the Year Ended December 31, 2018
248 Financial Statements
Sensitivity analysis – price risk
For quoted investments classified as available for sale, a 1 percent increase in market price at reporting date would have increased equity by Rs 47,756 thousand after tax (2017: Rs 48,384 thousand); an equal change in the opposite direction would have decreased equity after tax by the same amount. For investments classified as fair value through profit or loss, the impact on profit would have been an increase or decrease by Rs 189,536 thousand after tax (2017: Rs 9,094 thousand). The analysis is performed on the same basis for 2017 and assumes that all other variables remain the same.
37.4 Interest rates used for determining fair value
The interest rates used to discount estimated cash flows, when applicable, are based on the government yield curve at the reporting date plus an adequate credit spread. For instruments carried at amortized cost, since the majority of the interest bearing investments are variable rate based instruments, there is no difference in carrying amount and the fair value. Further, for fixed rate instruments, since there is no significant difference in market rate and the rate of instrument and therefore most of the fixed rate instruments are short term in nature, fair value significantly approximates to carrying value.
37.5 Determination of fair values
A number of the Company’s accounting policies and disclosures require the determination of fair value, for both financial and non-financial assets and liabilities. Fair values have been determined for measurement and / or disclosure purposes based on the following methods:
Investmentatfairvaluethroughprofitorloss
The fair value of held for trading investment is determined by reference to their quoted closing repurchase price at the reporting date.
Available for sale investments
The fair value of available for sale investment is determined by reference to their quoted closing repurchase price at the reporting date and where applicable it is estimated as the present value of future cash flows, discounted at the market rate of interest at the reporting date.
Investment in associated and subsidiary companies
The fair value of investment in listed associate and subsidiary is determined by reference to their quoted closing bid price at the reporting date. The fair value is determined for disclosure purposes.
Non-derivativefinancialassets
The fair value of non-derivative financial assets is estimated as the present value of future cash flows, discounted at the market rate of interest at the reporting date. This fair value is determined for disclosure purposes.
Non-derivativefinancialliabilities
Fair value, which is determined for disclosure purposes, is calculated based on the present value of future principal and interest cash flows, discounted at the market rate of interest at the reporting date.
249Annual Report 2018
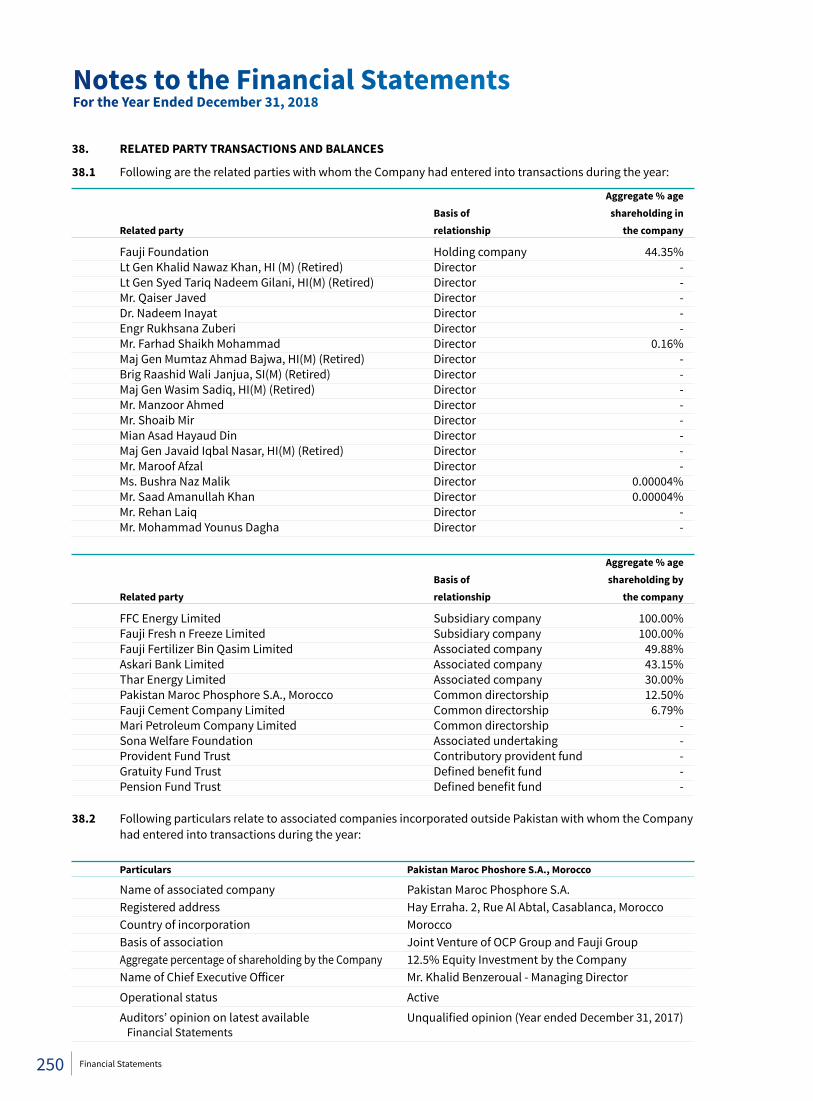
38. RELATED PARTY TRANSACTIONS AND BALANCES
38.1 Following are the related parties with whom the Company had entered into transactions during the year:
Aggregate%age Basis of shareholding in Related party relationship the company
Fauji Foundation Holding company 44.35% Lt Gen Khalid Nawaz Khan, HI (M) (Retired) Director - Lt Gen Syed Tariq Nadeem Gilani, HI(M) (Retired) Director - Mr. Qaiser Javed Director - Dr. Nadeem Inayat Director - Engr Rukhsana Zuberi Director - Mr. Farhad Shaikh Mohammad Director 0.16% Maj Gen Mumtaz Ahmad Bajwa, HI(M) (Retired) Director - Brig Raashid Wali Janjua, SI(M) (Retired) Director - Maj Gen Wasim Sadiq, HI(M) (Retired) Director - Mr. Manzoor Ahmed Director - Mr. Shoaib Mir Director - Mian Asad Hayaud Din Director - Maj Gen Javaid Iqbal Nasar, HI(M) (Retired) Director - Mr. Maroof Afzal Director - Ms. Bushra Naz Malik Director 0.00004% Mr. Saad Amanullah Khan Director 0.00004% Mr. Rehan Laiq Director - Mr. Mohammad Younus Dagha Director -
Aggregate%age Basis of shareholding by Related party relationship the company
FFC Energy Limited Subsidiary company 100.00% Fauji Fresh n Freeze Limited Subsidiary company 100.00% Fauji Fertilizer Bin Qasim Limited Associated company 49.88% Askari Bank Limited Associated company 43.15% Thar Energy Limited Associated company 30.00% Pakistan Maroc Phosphore S.A., Morocco Common directorship 12.50% Fauji Cement Company Limited Common directorship 6.79% Mari Petroleum Company Limited Common directorship - Sona Welfare Foundation Associated undertaking - Provident Fund Trust Contributory provident fund - Gratuity Fund Trust Defined benefit fund - Pension Fund Trust Defined benefit fund - 38.2 Following particulars relate to associated companies incorporated outside Pakistan with whom the Company
had entered into transactions during the year:
Particulars Pakistan Maroc Phoshore S.A., Morocco
Name of associated company Pakistan Maroc Phosphore S.A. Registered address Hay Erraha. 2, Rue Al Abtal, Casablanca, Morocco Country of incorporation Morocco Basis of association Joint Venture of OCP Group and Fauji Group Aggregate percentage of shareholding by the Company 12.5% Equity Investment by the Company Name of Chief Executive Officer Mr. Khalid Benzeroual - Managing Director
Operational status Active
Auditors’ opinion on latest available Unqualified opinion (Year ended December 31, 2017) Financial Statements
Notes to the Financial StatementsFor the Year Ended December 31, 2018
250 Financial Statements
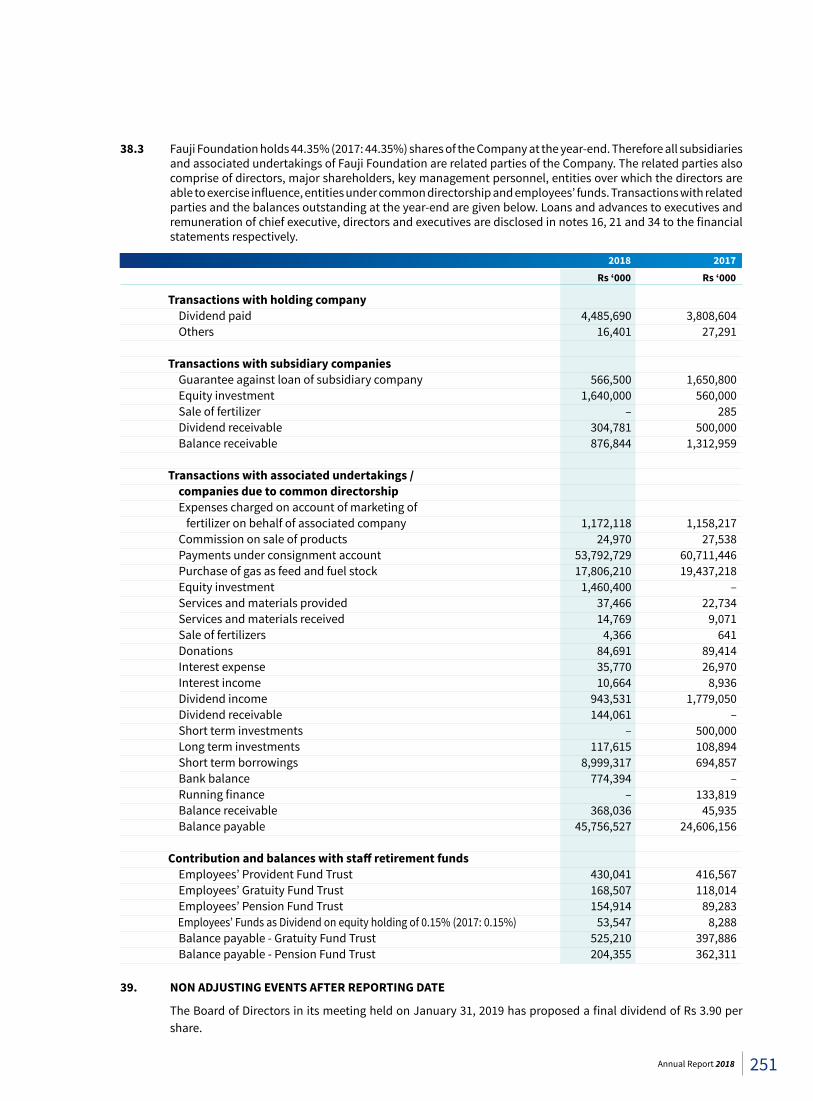
38.3 Fauji Foundation holds 44.35% (2017: 44.35%) shares of the Company at the year-end. Therefore all subsidiaries and associated undertakings of Fauji Foundation are related parties of the Company. The related parties also comprise of directors, major shareholders, key management personnel, entities over which the directors are able to exercise influence, entities under common directorship and employees’ funds. Transactions with related parties and the balances outstanding at the year-end are given below. Loans and advances to executives and remuneration of chief executive, directors and executives are disclosed in notes 16, 21 and 34 to the financial statements respectively.
2018 2017 Rs ‘000 Rs ‘000
Transactions with holding company Dividend paid 4,485,690 3,808,604 Others 16,401 27,291 Transactions with subsidiary companies Guarantee against loan of subsidiary company 566,500 1,650,800 Equity investment 1,640,000 560,000 Sale of fertilizer – 285 Dividend receivable 304,781 500,000 Balance receivable 876,844 1,312,959 Transactions with associated undertakings / companies due to common directorship Expenses charged on account of marketing of fertilizer on behalf of associated company 1,172,118 1,158,217 Commission on sale of products 24,970 27,538 Payments under consignment account 53,792,729 60,711,446 Purchase of gas as feed and fuel stock 17,806,210 19,437,218 Equity investment 1,460,400 – Services and materials provided 37,466 22,734 Services and materials received 14,769 9,071 Sale of fertilizers 4,366 641 Donations 84,691 89,414 Interest expense 35,770 26,970 Interest income 10,664 8,936 Dividend income 943,531 1,779,050 Dividend receivable 144,061 – Short term investments – 500,000 Long term investments 117,615 108,894 Short term borrowings 8,999,317 694,857 Bank balance 774,394 – Running finance – 133,819 Balance receivable 368,036 45,935 Balance payable 45,756,527 24,606,156 Contributionandbalanceswithstaffretirementfunds Employees’ Provident Fund Trust 430,041 416,567 Employees’ Gratuity Fund Trust 168,507 118,014 Employees’ Pension Fund Trust 154,914 89,283 Employees’ Funds as Dividend on equity holding of 0.15% (2017: 0.15%) 53,547 8,288 Balance payable - Gratuity Fund Trust 525,210 397,886 Balance payable - Pension Fund Trust 204,355 362,311
39. NON ADJUSTING EVENTS AFTER REPORTING DATE
The Board of Directors in its meeting held on January 31, 2019 has proposed a final dividend of Rs 3.90 per share.
251Annual Report 2018
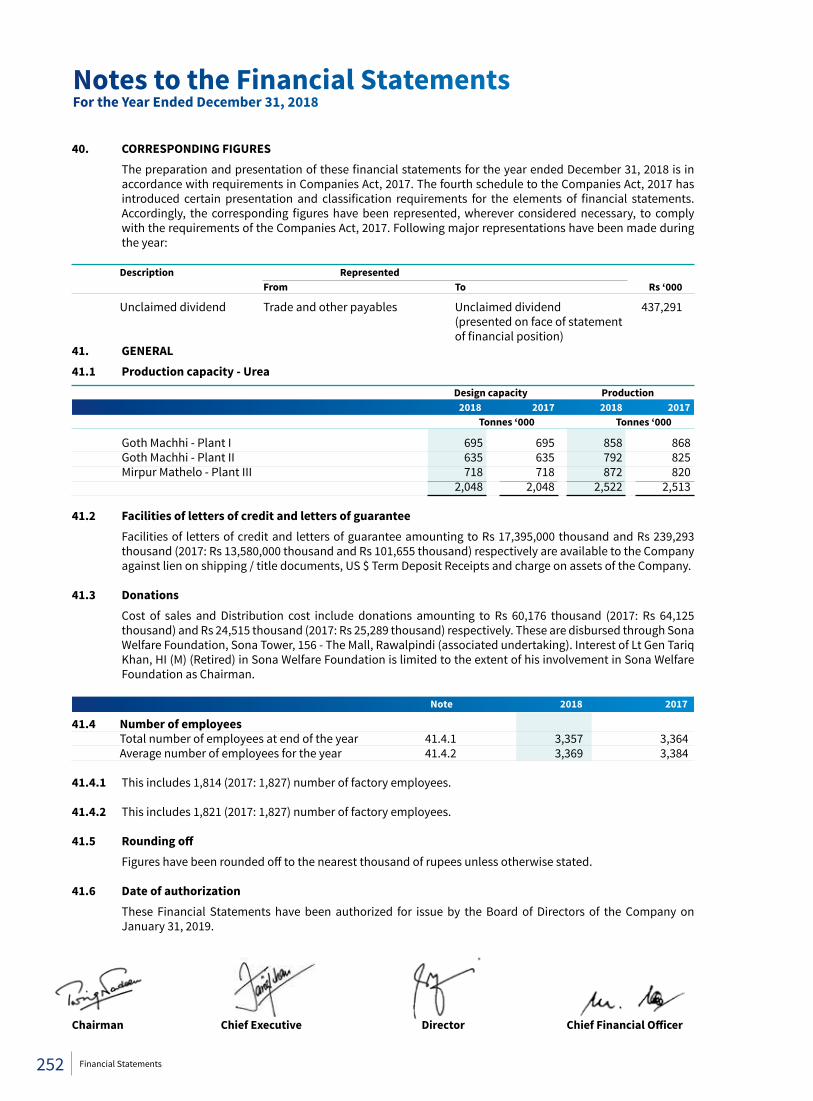
40. CORRESPONDING FIGURES
The preparation and presentation of these financial statements for the year ended December 31, 2018 is in accordance with requirements in Companies Act, 2017. The fourth schedule to the Companies Act, 2017 has introduced certain presentation and classification requirements for the elements of financial statements. Accordingly, the corresponding figures have been represented, wherever considered necessary, to comply with the requirements of the Companies Act, 2017. Following major representations have been made during the year:
Description Represented From To Rs ‘000
Unclaimed dividend Trade and other payables Unclaimed dividend 437,291 (presented on face of statement of financial position)41. GENERAL41.1 Production capacity - Urea Design capacity Production 2018 2017 2018 2017 Tonnes ‘000 Tonnes ‘000
Goth Machhi - Plant I 695 695 858 868 Goth Machhi - Plant II 635 635 792 825 Mirpur Mathelo - Plant III 718 718 872 820 2,048 2,048 2,522 2,513 41.2 Facilities of letters of credit and letters of guarantee Facilities of letters of credit and letters of guarantee amounting to Rs 17,395,000 thousand and Rs 239,293
thousand (2017: Rs 13,580,000 thousand and Rs 101,655 thousand) respectively are available to the Company against lien on shipping / title documents, US $ Term Deposit Receipts and charge on assets of the Company.
41.3 Donations
Cost of sales and Distribution cost include donations amounting to Rs 60,176 thousand (2017: Rs 64,125 thousand) and Rs 24,515 thousand (2017: Rs 25,289 thousand) respectively. These are disbursed through Sona Welfare Foundation, Sona Tower, 156 - The Mall, Rawalpindi (associated undertaking). Interest of Lt Gen Tariq Khan, HI (M) (Retired) in Sona Welfare Foundation is limited to the extent of his involvement in Sona Welfare Foundation as Chairman.
Note 2018 2017
41.4 Number of employees Total number of employees at end of the year 41.4.1 3,357 3,364 Average number of employees for the year 41.4.2 3,369 3,384 41.4.1 This includes 1,814 (2017: 1,827) number of factory employees. 41.4.2 This includes 1,821 (2017: 1,827) number of factory employees. 41.5 Roundingoff Figures have been rounded off to the nearest thousand of rupees unless otherwise stated.
41.6 Date of authorization These Financial Statements have been authorized for issue by the Board of Directors of the Company on
January 31, 2019.
Chairman ChiefExecutive Director ChiefFinancialOfficer
Notes to the Financial StatementsFor the Year Ended December 31, 2018
252 Financial Statements
Financial StatementsConsolidated
Fauji Fertilizer Company Limited
Dear Shareholders,
During the year 2018, the Group achieved a new benchmark of highest ever sales revenue (including subsidy) of Rs 111.83 billion, depicting an increase of 12% over the last year owing to strong performance of FFC, besides growth in revenues of the two subsidiaries including FFC Energy Limited (FFCEL) and Fauji Fresh n Freeze Limited (FFF).
FFC’s wholly owned wind power project - FFCEL, recorded a 30% growth in net profit mainly due to increase in revenue by Rs 112.12 million besides 18% savings in finance cost. As a testament of the technical expertise of our workforce, FFCEL has taken over its operations and maintenance from O&M contractors on expiry of the contract, leading to significant cost savings. During 2018, FFCEL also declared dividend of Rs 305 million which is the second dividend declaration of FFCEL since its inception.
The food venture of the Group – FFF, reported increase in sales revenue by 107% primarily due to higher sales of OPA french fries.
Our associated company, FFBL improved its gross profit by around 36% to Rs 8.18 billion primarily due to improvement in fertilizer market. Consequently, net profit of FFBL increased by 43% to Rs 1.44 billion as compared to last year. Although Askari Bank Limited witnessed around 15% increase in net mark-up / interest income by Rs 1.79 billion during the nine months ended September 30, 2018, a provision of Rs 524 million against loans and advances resulted in decline in net profit which stood at Rs 3.62 billion compared to Rs 4.22 billion last year.
The Group net profit significantly increased by 43% and stood at Rs 16.44 billion against Rs 11.50 billion recorded last year.
Despite the persistent pricing pressure, continuity of unfavorable taxation regime and discriminatory levy of GIDC, the Group has demonstrated a resilient performance with marked improvement in profitability during the year. The Group has diversified its investment portfolio in energy, financial and food sectors to ensure sustained returns for the shareholders. The Group has also invested in offshore joint venture to secure the raw material supply for its phosphate business.
FFC’s Board of Directors has proposed final dividend of Rs 3.90 per share, which is in addition to interim distribution of Rs 4.95 per share.
The respective Boards of Directors of Group companies have focus on instigating a culture of transparency and good governance, resilience against challenging business environment and strategic placement of their investment portfolio to maximize wealth and long term attractive returns for the shareholders besides remaining socially responsible to ensure wellbeing of the neighboring communities.
Lt Gen Syed Tariq Nadeem GilaniHI (M), (Retired)
ChairmanRawalpindi
January 31, 2019
Chairman’s Reviewon the Consolidated Financial Statements
254 Consolidated Financial Statements
255Annual Report 2018
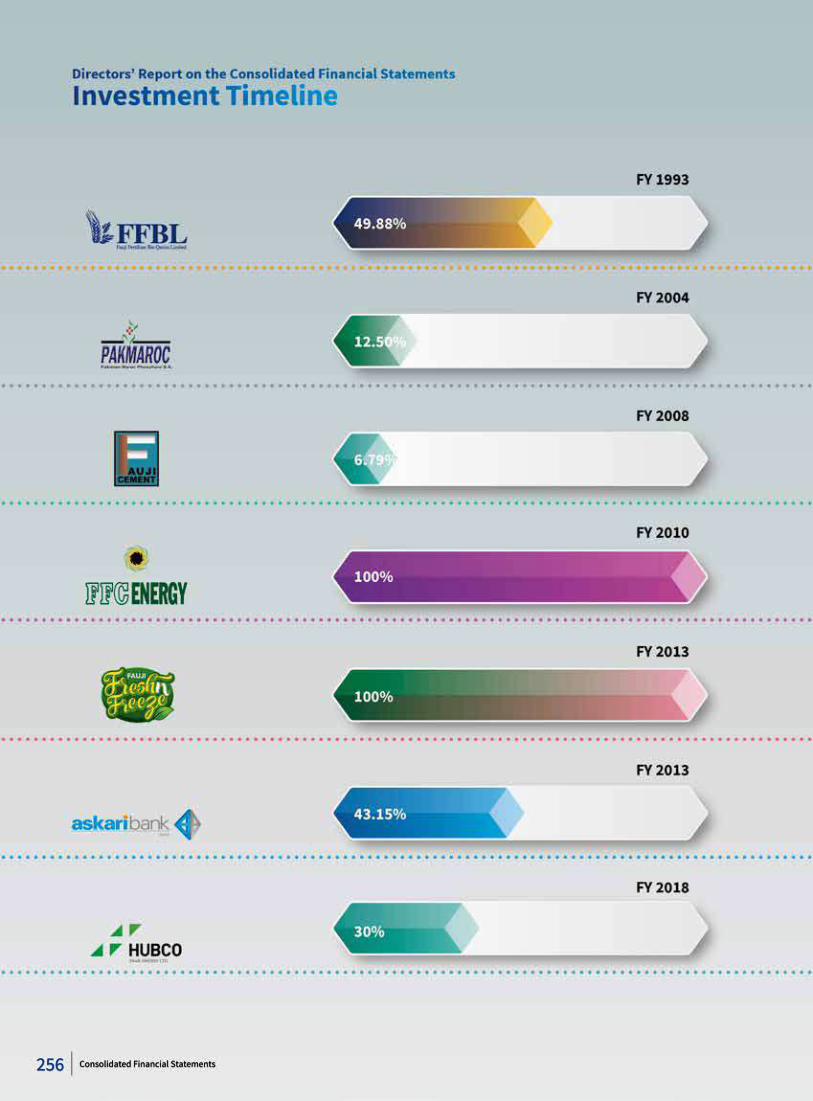
256 Consolidated Financial Statements
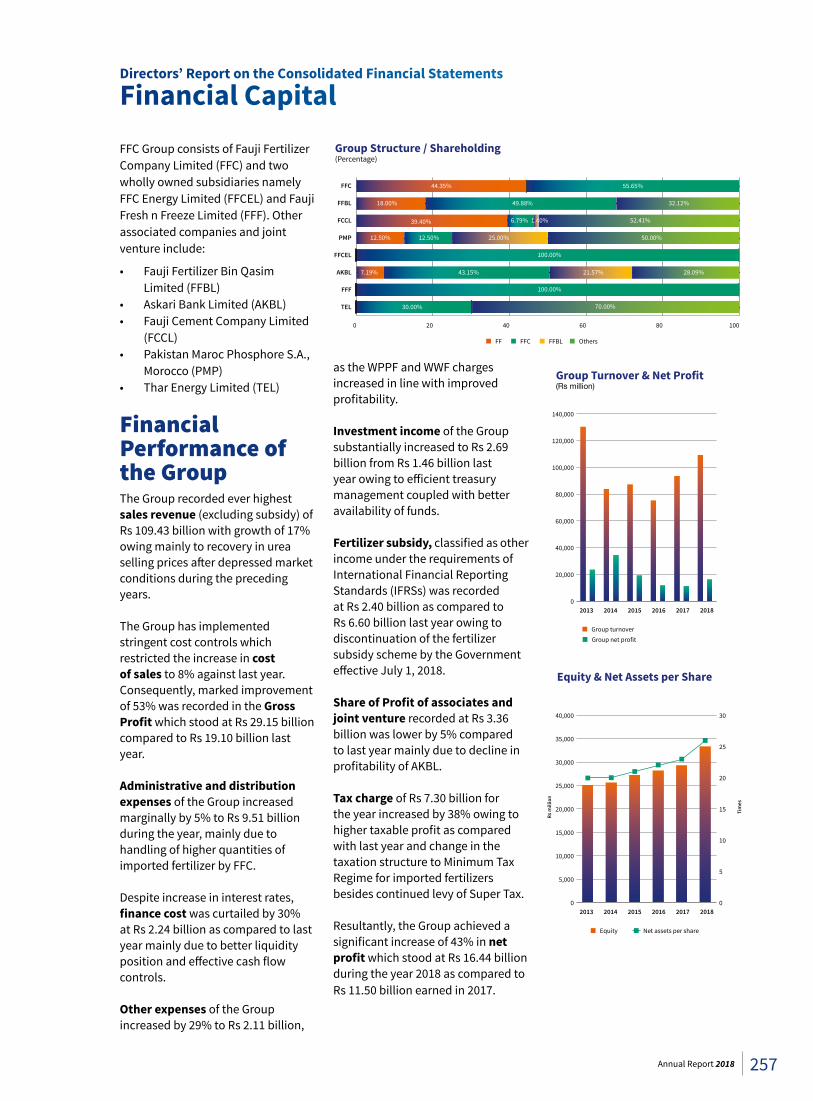
FFC Group consists of Fauji Fertilizer Company Limited (FFC) and two wholly owned subsidiaries namely FFC Energy Limited (FFCEL) and Fauji Fresh n Freeze Limited (FFF). Other associated companies and joint venture include:
• Fauji Fertilizer Bin Qasim Limited (FFBL)
• Askari Bank Limited (AKBL)• Fauji Cement Company Limited
(FCCL)• Pakistan Maroc Phosphore S.A.,
Morocco (PMP)• Thar Energy Limited (TEL)
Financial Performance of the GroupThe Group recorded ever highest sales revenue (excluding subsidy) of Rs 109.43 billion with growth of 17% owing mainly to recovery in urea selling prices after depressed market conditions during the preceding years.
The Group has implemented stringent cost controls which restricted the increase in cost of sales to 8% against last year. Consequently, marked improvement of 53% was recorded in the Gross Profit which stood at Rs 29.15 billion compared to Rs 19.10 billion last year.
Administrative and distribution expenses of the Group increased marginally by 5% to Rs 9.51 billion during the year, mainly due to handling of higher quantities of imported fertilizer by FFC. Despite increase in interest rates, financecost was curtailed by 30% at Rs 2.24 billion as compared to last year mainly due to better liquidity position and effective cash flow controls.
Other expenses of the Group increased by 29% to Rs 2.11 billion,
as the WPPF and WWF charges increased in line with improved profitability.
Investment income of the Group substantially increased to Rs 2.69 billion from Rs 1.46 billion last year owing to efficient treasury management coupled with better availability of funds.
Fertilizer subsidy, classified as other income under the requirements of International Financial Reporting Standards (IFRSs) was recorded at Rs 2.40 billion as compared to Rs 6.60 billion last year owing to discontinuation of the fertilizer subsidy scheme by the Government effective July 1, 2018.
ShareofProfitofassociatesandjoint venture recorded at Rs 3.36 billion was lower by 5% compared to last year mainly due to decline in profitability of AKBL.
Tax charge of Rs 7.30 billion for the year increased by 38% owing to higher taxable profit as compared with last year and change in the taxation structure to Minimum Tax Regime for imported fertilizers besides continued levy of Super Tax.
Resultantly, the Group achieved a significant increase of 43% in net profit which stood at Rs 16.44 billion during the year 2018 as compared to Rs 11.50 billion earned in 2017.
Directors’ Report on the Consolidated Financial Statements
Financial Capital
2017 20182013 2014 2015 2016
Group turnoverGroup net profit
Group Turnover & Net Profit(Rs million)
0
20,000
40,000
60,000
80,000
100,000
120,000
140,000
2017 20182013 2014 2015 20160
5,000
10,000
15,000
20,000
25,000
30,000
35,000
40,000
0
5
10
15
20
25
30
Equity & Net Assets per Share
Rs m
illio
n
Tim
es
Equity Net assets per share
Group Structure / Shareholding(Percentage)
FF FFC FFBL Others
FFC
FFBL
FCCL
PMP
FFCEL
AKBL
FFF
TEL
0 20 40 60 80 100
44.35%
18.00% 49.88% 32.12%
52.41%6.79%39.40%
12.50% 12.50% 25.00% 50.00%
100.00%
30.00% 70.00%
100.00%
7.19% 43.15% 21.57% 28.09%
1.40%
55.65%
257Annual Report 2018
Associated CompaniesFauji Fertilizer Bin Qasim Limited (FFBL)FFBL, a public listed company incorporated in Pakistan, is sole manufacturer of granular urea and Di-Ammonium Phosphate (DAP) in the Country. It was incorporated as FFC Jordan Fertilizer Company in 1993 and subsequently restructured as Fauji Fertilizer Bin Qasim Limited (FFBL) in 2003. Besides having its manufacturing facilities located at Bin Qasim, FFBL also has interests in Banking, Food and Energy sectors.
During the year, FFBL sold 687 thousand tonnes of Sona DAP and 562 thousand tonnes of Sona Urea (Granular) and recorded a sales revenue of Rs 61.51 billion registering growth of 17% over last year owing to improved selling prices. Net profit for the year stood at Rs 1.44 billion, translating into earnings per share of Rs 1.54 reflecting an improvement of 43% over last year.
FFC owns 49.88% of FFBL’s equity represented by an investment of Rs 4.66 billion. During the year, FFC received aggregate dividend of Rs 349 million compared to Rs 280 million last year.
CONSOLIDATED OPERATIONS OF FFBL:The consolidated financial statements of FFBL depicted a decline of 16% in its profitability from Rs 925 million in 2017 to Rs 778 million in 2018.
Askari Bank Limited (AKBL)AKBL was incorporated in 1991 as a public limited company. It is principally engaged in the business of banking and operates throughout Pakistan with a branch network of 517 branches, including 94 Islamic banking branches, a Wholesale Bank
Branch in the Kingdom of Bahrain and a representative office in People’s Republic of China.
FFC’s holding in AKBL amounts to Rs 10.46 billion representing an equity stake of 43.15%.
Net interest income for the nine months ended September 30, 2018 was recorded at Rs 13.81 billion, showing an improvement of 15% compared to last year. Net profit for the period was Rs 3.62 billion, translating into earnings of Rs 2.88 per share. Customer deposits recorded at Rs 568 billion, registered a growth of 8%, whereas gross advances were reported at Rs 344 billion depicting an increase of 21%. Consequently, the Bank’s advances to deposits ratio also improved from 54.1% to 60.6% at September 30, 2018. The Bank maintained its long-term entity rating of AA+ and short term rating of A1+, reflecting high credit worthiness of the Bank.
No dividend was received from Askari Bank Limited during the year.
Fauji Cement Company Limited (FCCL)FCCL is a public limited company incorporated in 1992 and is listed on the Pakistan Stock Exchange. Principal activity of the company is manufacturing and sale of different types of cement through its two production lines having an annual production capacity of 3.50 million tonnes. With an investment of Rs 1.50 billion, FFC holds 6.79% equity stake in the company.
During the first quarter of FCCL’s fiscal year ended September 30, 2018, sales revenue was recorded at Rs 5.34 billion registering a growth of 11% over last year while net earnings were Rs 801 million as compared to Rs 444 million, attributable mainly to the revival of Line 2 Silo, which had collapsed last year.
The Company received aggregate dividend of Rs 187.50 million during 2018 from FCCL, higher by 122% compared to last year.
Pakistan Maroc Phosphore S.A., (PMP) – MoroccoPMP was incorporated in Morocco in 2004 as a joint venture between FFC (shareholding of 12.5%), Fauji Foundation (12.5%), FFBL (25%) and the Moroccan state owned organization Officie Cherifien Des Phosphates (50%). The company started its activities in 2008 and is engaged in manufacturing and marketing of phosphoric acid, fertilizer and other related products.
PMP’s plant is located in Jorf Lasfar, Morocco, having a production capacity of 375 thousand tonnes of industrial phosphoric acid, which is primarily supplied to FFBL as raw material for production of DAP fertilizer and any excess acid is sold in the international market.
FFC has invested Rs 706 million in the company with a return of over Rs 558 million to date in the form of dividends including Rs 407 million recorded during 2018.
Thar Energy Limited (TEL)TEL was incorporated as a public limited company in 2016 to develop, own, operate and maintain a 330MW mine-mouth coal fired power plant to be established in Block II, Thar Coal Mine, Sindh.
During the year, Shareholders’ Agreement was signed by the local and International project partners including FFC, HUB Power Company Limited (HUBCO) and China Machinery Engineering Corporation (CMEC). FFC has injected Rs 1.46 billion during the year and holds 30% equity stake in the company.
Directors’ Report on the Consolidated Financial Statements
Financial Capital
258 Consolidated Financial Statements
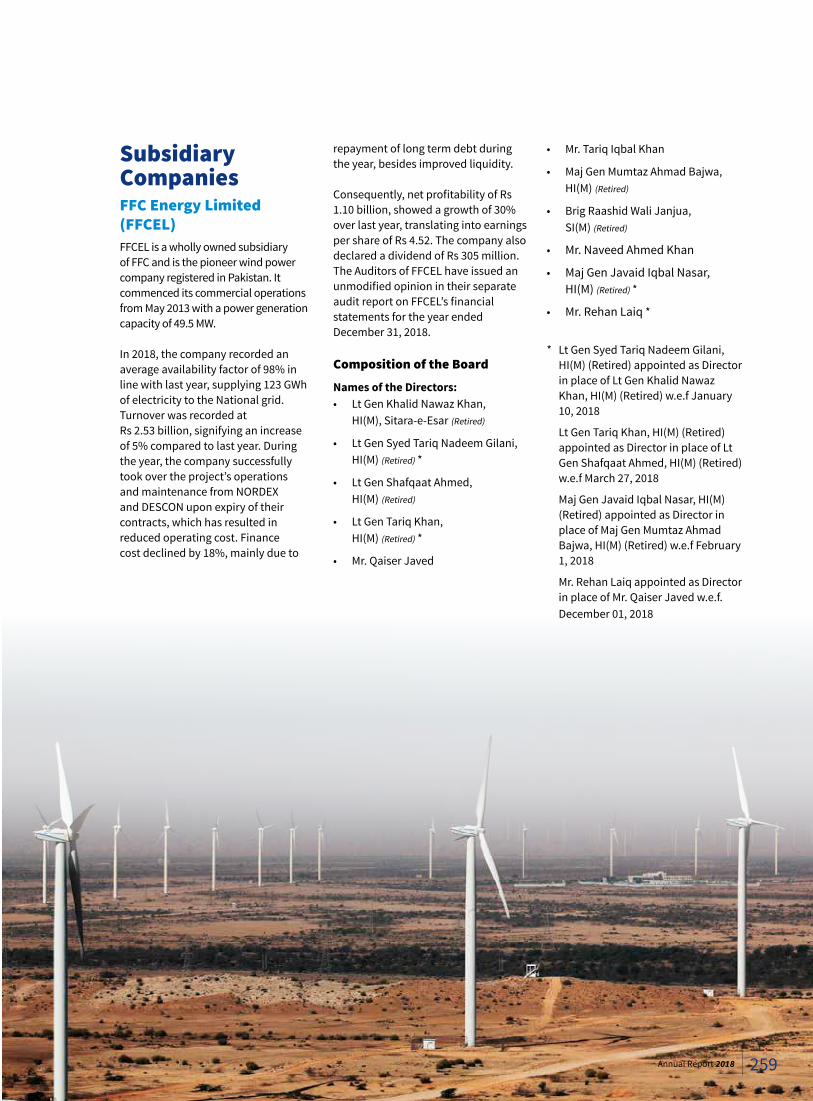
Subsidiary CompaniesFFC Energy Limited (FFCEL)FFCEL is a wholly owned subsidiary of FFC and is the pioneer wind power company registered in Pakistan. It commenced its commercial operations from May 2013 with a power generation capacity of 49.5 MW.
In 2018, the company recorded an average availability factor of 98% in line with last year, supplying 123 GWh of electricity to the National grid. Turnover was recorded at Rs 2.53 billion, signifying an increase of 5% compared to last year. During the year, the company successfully took over the project’s operations and maintenance from NORDEX and DESCON upon expiry of their contracts, which has resulted in reduced operating cost. Finance cost declined by 18%, mainly due to
repayment of long term debt during the year, besides improved liquidity.
Consequently, net profitability of Rs 1.10 billion, showed a growth of 30% over last year, translating into earnings per share of Rs 4.52. The company also declared a dividend of Rs 305 million.The Auditors of FFCEL have issued an unmodified opinion in their separate audit report on FFCEL’s financial statements for the year ended December 31, 2018.
Composition of the Board
Names of the Directors:• Lt Gen Khalid Nawaz Khan, HI(M), Sitara-e-Esar (Retired)
• Lt Gen Syed Tariq Nadeem Gilani, HI(M) (Retired) *
• Lt Gen Shafqaat Ahmed, HI(M) (Retired)
• Lt Gen Tariq Khan, HI(M) (Retired) *
• Mr. Qaiser Javed
• Mr. Tariq Iqbal Khan
• Maj Gen Mumtaz Ahmad Bajwa, HI(M) (Retired)
• Brig Raashid Wali Janjua, SI(M) (Retired)
• Mr. Naveed Ahmed Khan
• Maj Gen Javaid Iqbal Nasar, HI(M) (Retired) *
• Mr. Rehan Laiq *
* Lt Gen Syed Tariq Nadeem Gilani, HI(M) (Retired) appointed as Director in place of Lt Gen Khalid Nawaz Khan, HI(M) (Retired) w.e.f January 10, 2018
Lt Gen Tariq Khan, HI(M) (Retired) appointed as Director in place of Lt Gen Shafqaat Ahmed, HI(M) (Retired) w.e.f March 27, 2018
Maj Gen Javaid Iqbal Nasar, HI(M) (Retired) appointed as Director in place of Maj Gen Mumtaz Ahmad Bajwa, HI(M) (Retired) w.e.f February 1, 2018
Mr. Rehan Laiq appointed as Director in place of Mr. Qaiser Javed w.e.f. December 01, 2018
259Annual Report 2018
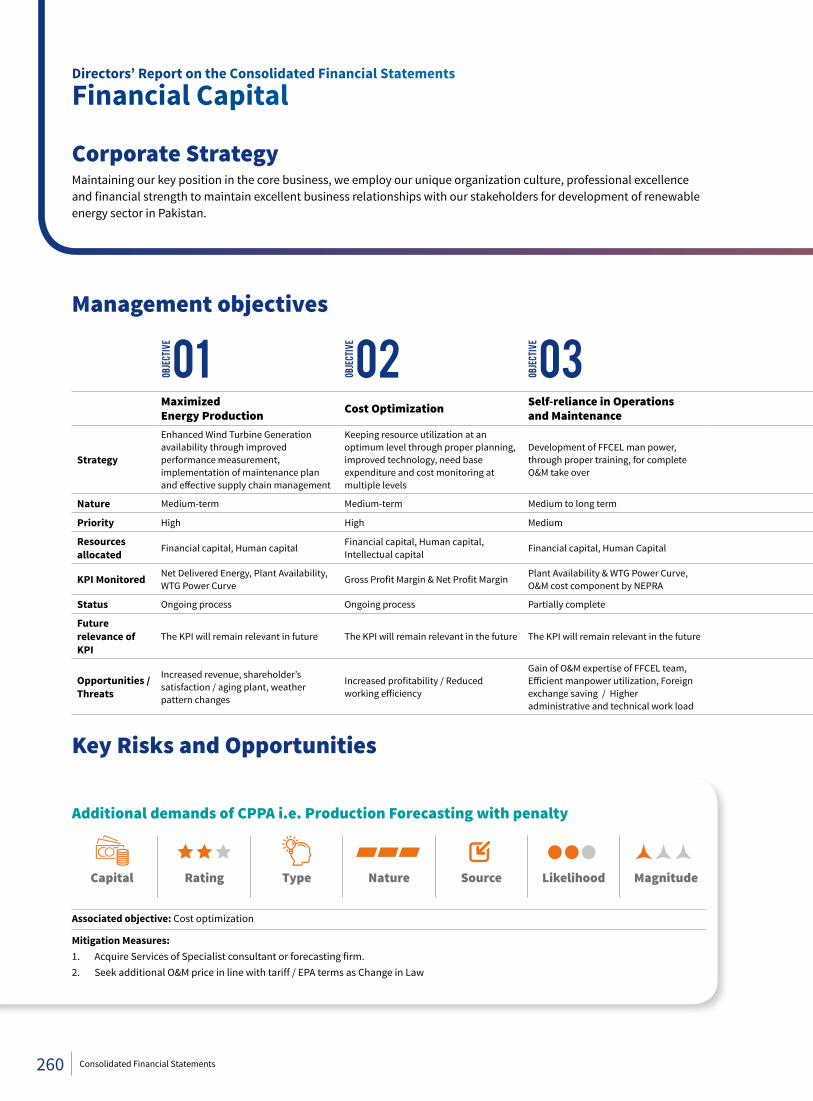
Management objectives
MaximizedEnergy Production Cost Optimization Self-reliance in Operations
and MaintenanceCreate / enter new lines of business to augment profitability
Communitydevelopment
Strategy
Enhanced Wind Turbine Generation availability through improved performance measurement, implementation of maintenance plan and effective supply chain management
Keeping resource utilization at an optimum level through proper planning, improved technology, need base expenditure and cost monitoring at multiple levels
Development of FFCEL man power, through proper training, for complete O&M take over
Development of team to provide services to external wind farm / solar power industry including technical trainings. Partnership with academia for R&D.
Assessment of neighbouring community needs through consultation and providing possible support in health, education and utility.
Nature Medium-term Medium-term Medium to long term Long-term Medium-term
Priority High High Medium Medium High
Resources allocated Financial capital, Human capital Financial capital, Human capital,
Intellectual capital Financial capital, Human Capital Human capital, Intellectual capital, Financial Capital Financial capital, human capital
KPI Monitored Net Delivered Energy, Plant Availability, WTG Power Curve Gross Profit Margin & Net Profit Margin Plant Availability & WTG Power Curve,
O&M cost component by NEPRA Revenue generated from services CSR budget, Feedback from community
Status Ongoing process Ongoing process Partially complete Ongoing process. Ongoing process
Future relevance of KPI
The KPI will remain relevant in future The KPI will remain relevant in the future The KPI will remain relevant in the future The KPI will remain relevant in the future The KPI will remain relevant in the future
Opportunities /Threats
Increased revenue, shareholder’s satisfaction / aging plant, weather pattern changes
Increased profitability / Reduced working efficiency
Gain of O&M expertise of FFCEL team, Efficient manpower utilization, Foreign exchange saving / Higher administrative and technical work load
Business diversification / new business risks CSR objectives meet / Increase in expectations and demands from community
Key Risks and Opportunities
Additional demands of CPPA i.e. Production Forecasting with penalty
Associated objective: Cost optimization
Mitigation Measures:1. Acquire Services of Specialist consultant or forecasting firm.2. Seek additional O&M price in line with tariff / EPA terms as Change in Law
Directors’ Report on the Consolidated Financial Statements
Financial Capital
Corporate StrategyMaintaining our key position in the core business, we employ our unique organization culture, professional excellence and financial strength to maintain excellent business relationships with our stakeholders for development of renewable energy sector in Pakistan.
Capital Rating Nature Source Likelihood MagnitudeType
01OBJECT
IVE
02OBJECT
IVE
03OBJECT
IVE
260 Consolidated Financial Statements
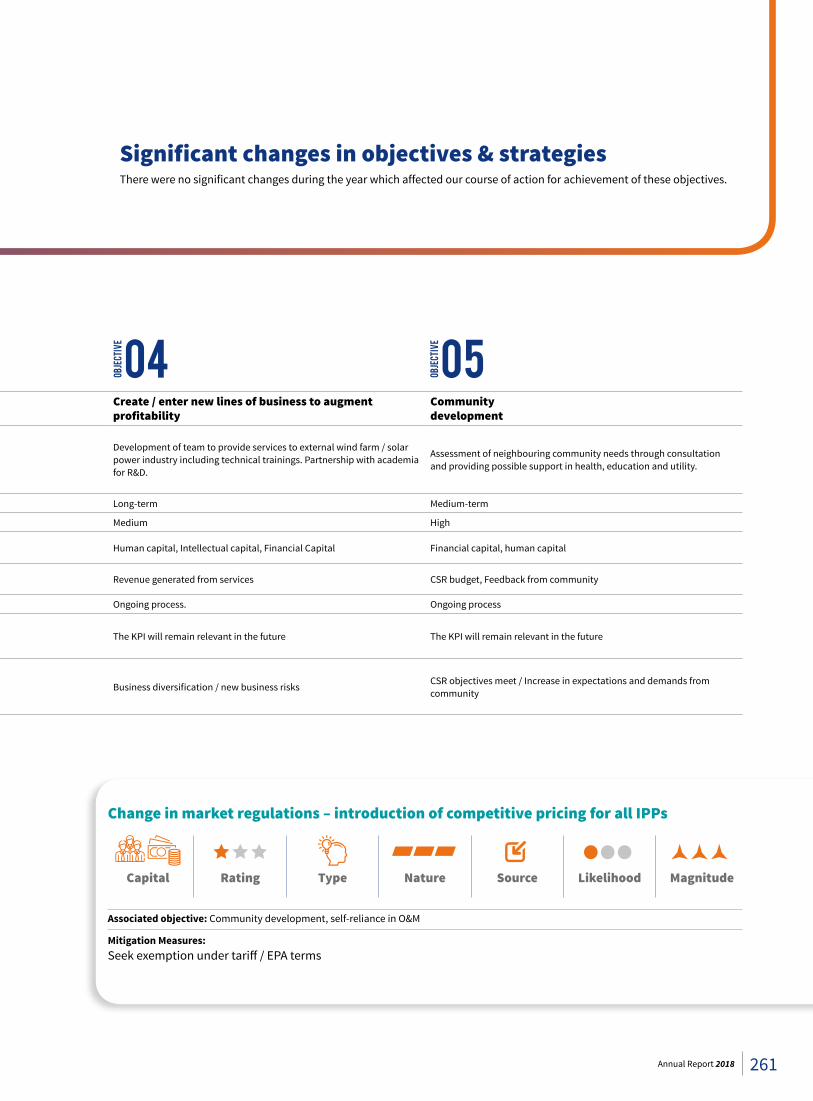
MaximizedEnergy Production Cost Optimization Self-reliance in Operations
and MaintenanceCreate / enter new lines of business to augment profitability
Communitydevelopment
Strategy
Enhanced Wind Turbine Generation availability through improved performance measurement, implementation of maintenance plan and effective supply chain management
Keeping resource utilization at an optimum level through proper planning, improved technology, need base expenditure and cost monitoring at multiple levels
Development of FFCEL man power, through proper training, for complete O&M take over
Development of team to provide services to external wind farm / solar power industry including technical trainings. Partnership with academia for R&D.
Assessment of neighbouring community needs through consultation and providing possible support in health, education and utility.
Nature Medium-term Medium-term Medium to long term Long-term Medium-term
Priority High High Medium Medium High
Resources allocated Financial capital, Human capital Financial capital, Human capital,
Intellectual capital Financial capital, Human Capital Human capital, Intellectual capital, Financial Capital Financial capital, human capital
KPI Monitored Net Delivered Energy, Plant Availability, WTG Power Curve Gross Profit Margin & Net Profit Margin Plant Availability & WTG Power Curve,
O&M cost component by NEPRA Revenue generated from services CSR budget, Feedback from community
Status Ongoing process Ongoing process Partially complete Ongoing process. Ongoing process
Future relevance of KPI
The KPI will remain relevant in future The KPI will remain relevant in the future The KPI will remain relevant in the future The KPI will remain relevant in the future The KPI will remain relevant in the future
Opportunities /Threats
Increased revenue, shareholder’s satisfaction / aging plant, weather pattern changes
Increased profitability / Reduced working efficiency
Gain of O&M expertise of FFCEL team, Efficient manpower utilization, Foreign exchange saving / Higher administrative and technical work load
Business diversification / new business risks CSR objectives meet / Increase in expectations and demands from community
Change in market regulations – introduction of competitive pricing for all IPPs
Associated objective: Community development, self-reliance in O&M
Mitigation Measures:Seek exemption under tariff / EPA terms
Significant changes in objectives & strategiesThere were no significant changes during the year which affected our course of action for achievement of these objectives.
Rating Type Nature Source Likelihood MagnitudeCapital
04OBJECT
IVE
05OBJECT
IVE
261Annual Report 2018
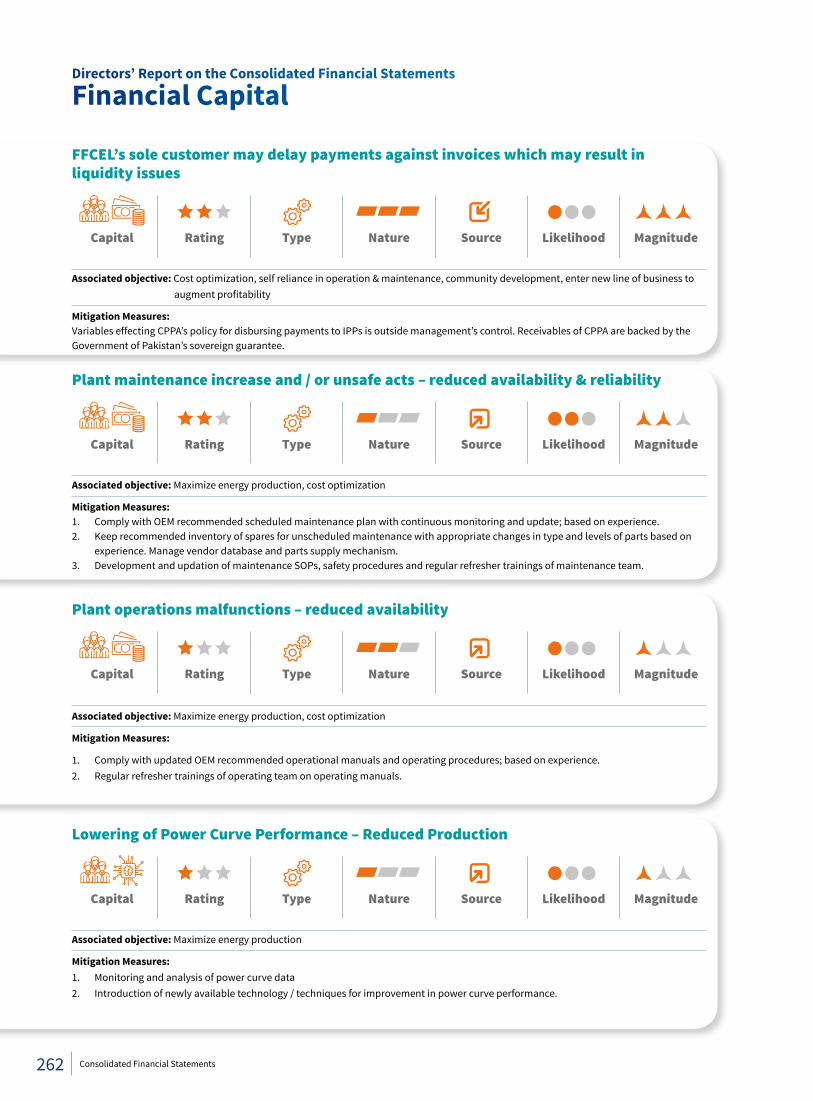
FFCEL’s sole customer may delay payments against invoices which may result in liquidity issues
Associated objective: Cost optimization, self reliance in operation & maintenance, community development, enter new line of business to augment profitability
Mitigation Measures:Variables effecting CPPA’s policy for disbursing payments to IPPs is outside management’s control. Receivables of CPPA are backed by the Government of Pakistan’s sovereign guarantee.
Plant maintenance increase and / or unsafe acts – reduced availability & reliability
Associated objective: Maximize energy production, cost optimization
Mitigation Measures:1. Comply with OEM recommended scheduled maintenance plan with continuous monitoring and update; based on experience.2. Keep recommended inventory of spares for unscheduled maintenance with appropriate changes in type and levels of parts based on
experience. Manage vendor database and parts supply mechanism.3. Development and updation of maintenance SOPs, safety procedures and regular refresher trainings of maintenance team.
Rating Nature Likelihood MagnitudeType
Plant operations malfunctions – reduced availability
Associated objective: Maximize energy production, cost optimization
Mitigation Measures:
1. Comply with updated OEM recommended operational manuals and operating procedures; based on experience.2. Regular refresher trainings of operating team on operating manuals.
Rating Nature Likelihood MagnitudeSource
Source
Type
Type
Directors’ Report on the Consolidated Financial Statements
Financial Capital
Lowering of Power Curve Performance – Reduced Production
Associated objective: Maximize energy production
Mitigation Measures:1. Monitoring and analysis of power curve data2. Introduction of newly available technology / techniques for improvement in power curve performance.
Rating Nature Likelihood Magnitude
Nature Source Likelihood MagnitudeRatingCapital Type
Capital
Capital
Source
Capital
262 Consolidated Financial Statements
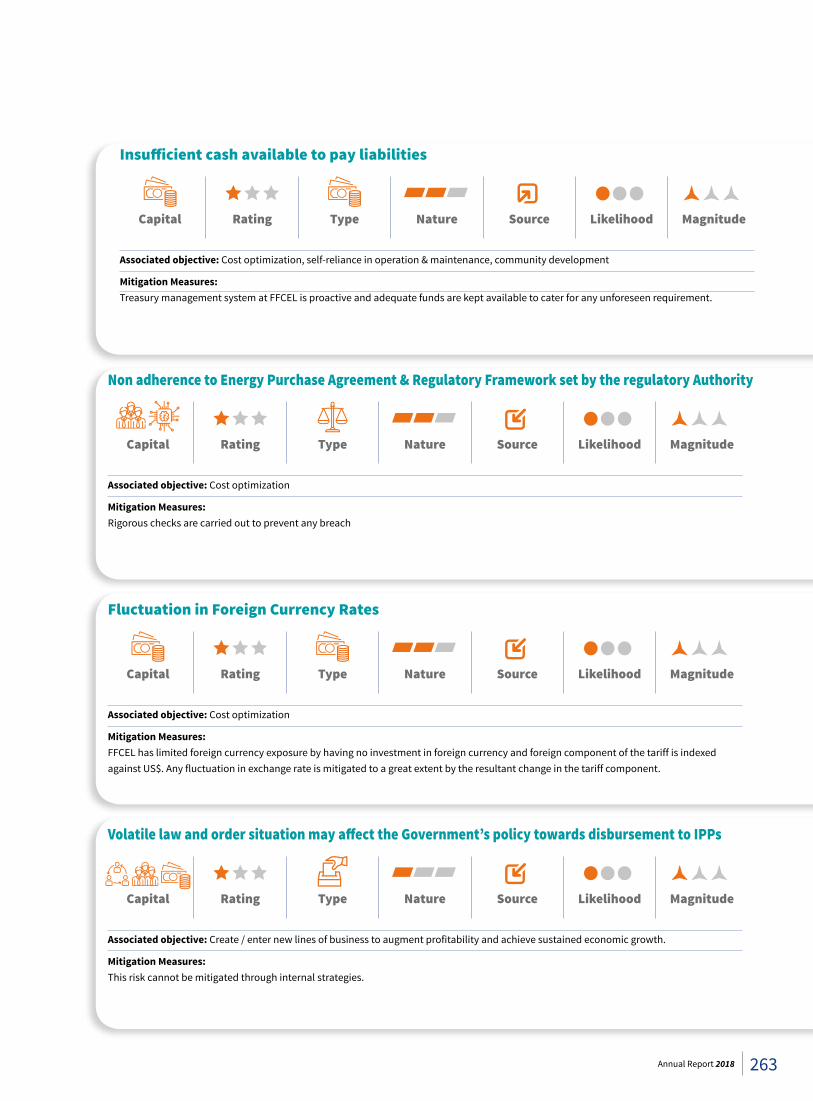
Non adherence to Energy Purchase Agreement & Regulatory Framework set by the regulatory Authority
Associated objective: Cost optimization
Mitigation Measures:Rigorous checks are carried out to prevent any breach
Rating Type Nature Source
Source
Likelihood Magnitude
Fluctuation in Foreign Currency Rates
Associated objective: Cost optimization
Mitigation Measures:FFCEL has limited foreign currency exposure by having no investment in foreign currency and foreign component of the tariff is indexed against US$. Any fluctuation in exchange rate is mitigated to a great extent by the resultant change in the tariff component.
Capital Rating Type Nature Likelihood Magnitude
Volatile law and order situation may affect the Government’s policy towards disbursement to IPPs
Associated objective: Create / enter new lines of business to augment profitability and achieve sustained economic growth.
Mitigation Measures:This risk cannot be mitigated through internal strategies.
Capital Rating Nature Likelihood Magnitude
Insufficient cash available to pay liabilities
Associated objective: Cost optimization, self-reliance in operation & maintenance, community development
Mitigation Measures:Treasury management system at FFCEL is proactive and adequate funds are kept available to cater for any unforeseen requirement.
Capital Rating Type Nature Likelihood Magnitude
Capital
Source
Type Source
263Annual Report 2018
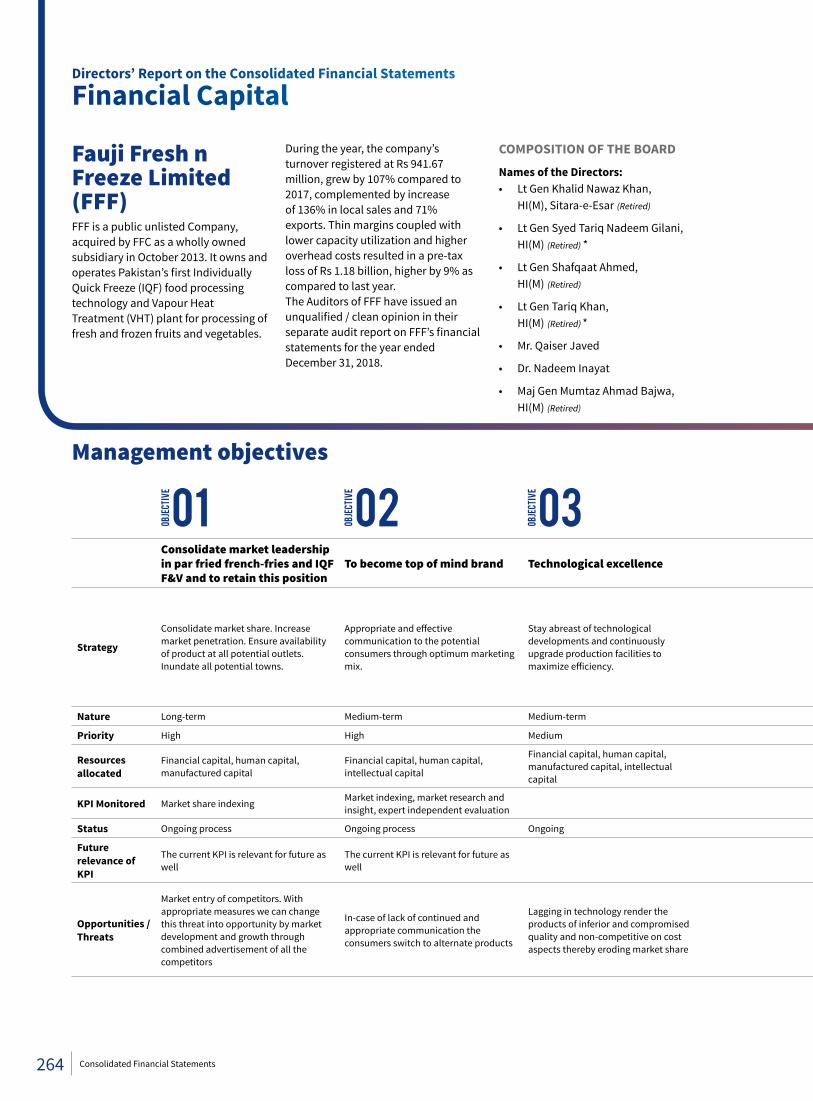
Directors’ Report on the Consolidated Financial Statements
Financial Capital
Fauji Fresh n Freeze Limited (FFF)FFF is a public unlisted Company, acquired by FFC as a wholly owned subsidiary in October 2013. It owns and operates Pakistan’s first Individually Quick Freeze (IQF) food processing technology and Vapour Heat Treatment (VHT) plant for processing of fresh and frozen fruits and vegetables.
During the year, the company’s turnover registered at Rs 941.67 million, grew by 107% compared to 2017, complemented by increase of 136% in local sales and 71% exports. Thin margins coupled with lower capacity utilization and higher overhead costs resulted in a pre-tax loss of Rs 1.18 billion, higher by 9% as compared to last year.The Auditors of FFF have issued an unqualified / clean opinion in their separate audit report on FFF’s financial statements for the year ended December 31, 2018.
COMPOSITION OF THE BOARD
Names of the Directors:• Lt Gen Khalid Nawaz Khan, HI(M), Sitara-e-Esar (Retired)
• Lt Gen Syed Tariq Nadeem Gilani, HI(M) (Retired) *
• Lt Gen Shafqaat Ahmed, HI(M) (Retired)
• Lt Gen Tariq Khan, HI(M) (Retired) *
• Mr. Qaiser Javed
• Dr. Nadeem Inayat
• Maj Gen Mumtaz Ahmad Bajwa, HI(M) (Retired)
Management objectives
Consolidate market leadership in par fried french-fries and IQF F&V and to retain this position
To become top of mind brand Technological excellence To offer best quality products to the consumers, consumer centricity End to end cost effective operations Financial health and sustainable
operations
Strategy
Consolidate market share. Increase market penetration. Ensure availability of product at all potential outlets. Inundate all potential towns.
Appropriate and effective communication to the potential consumers through optimum marketing mix.
Stay abreast of technological developments and continuously upgrade production facilities to maximize efficiency.
Empowered quality assurance function. Continuous efforts in improving product specifications. Agricultural research and development in appropriate varieties of potato giving longer profile fries with higher dry matter content.
Continuous effort on laying off extra fats from the operations. Market intelligence and continued focus on sourcing at optimal prices. Vigilance of all the business partners and distributors to ensure sustainable partnership. Controlling production losses and maximising cost plough-back thereby reducing product cost. Controlling peeling wastes by improved technological solutions.
Availability of resources at optimal prices is the back-bone for sustained growth and attaining continued market leadership.
Nature Long-term Medium-term Medium-term Medium-term Short-term
Priority High High Medium High High High
Resources allocated
Financial capital, human capital, manufactured capital
Financial capital, human capital, intellectual capital
Financial capital, human capital, manufactured capital, intellectual capital
Financial capital, human capital, manufactured capital, intellectual capital Intellectual capital Intellectual capital, financial capital
KPI Monitored Market share indexing Market indexing, market research and insight, expert independent evaluation
Monthly cost accounts and management accounts
Monthly cost accounts, management accounts reporting, cash-flow planning and monitoring.
Status Ongoing process Ongoing process Ongoing Ongoing Ongoing Ongoing
Future relevance of KPI
The current KPI is relevant for future as well
The current KPI is relevant for future as well The KPI is relevant for future as well. The KPI is relevant for future as well.
Opportunities /Threats
Market entry of competitors. With appropriate measures we can change this threat into opportunity by market development and growth through combined advertisement of all the competitors
In-case of lack of continued and appropriate communication the consumers switch to alternate products
Lagging in technology render the products of inferior and compromised quality and non-competitive on cost aspects thereby eroding market share
Products of inferior and compromised quality are non-competitive and eroding market share
Lack of cost control erode margins and render the products un-competitive
May face liquidity risk due to growth phase. Financial indictors may not be very attractive. The company may face difficulty in borrowing funds from the financial institutions. The financial muscle and the market repute of the parent company will support the company in pulling through the challenging situation
01OBJECT
IVE
02OBJECT
IVE
03OBJECT
IVE
264 Consolidated Financial Statements
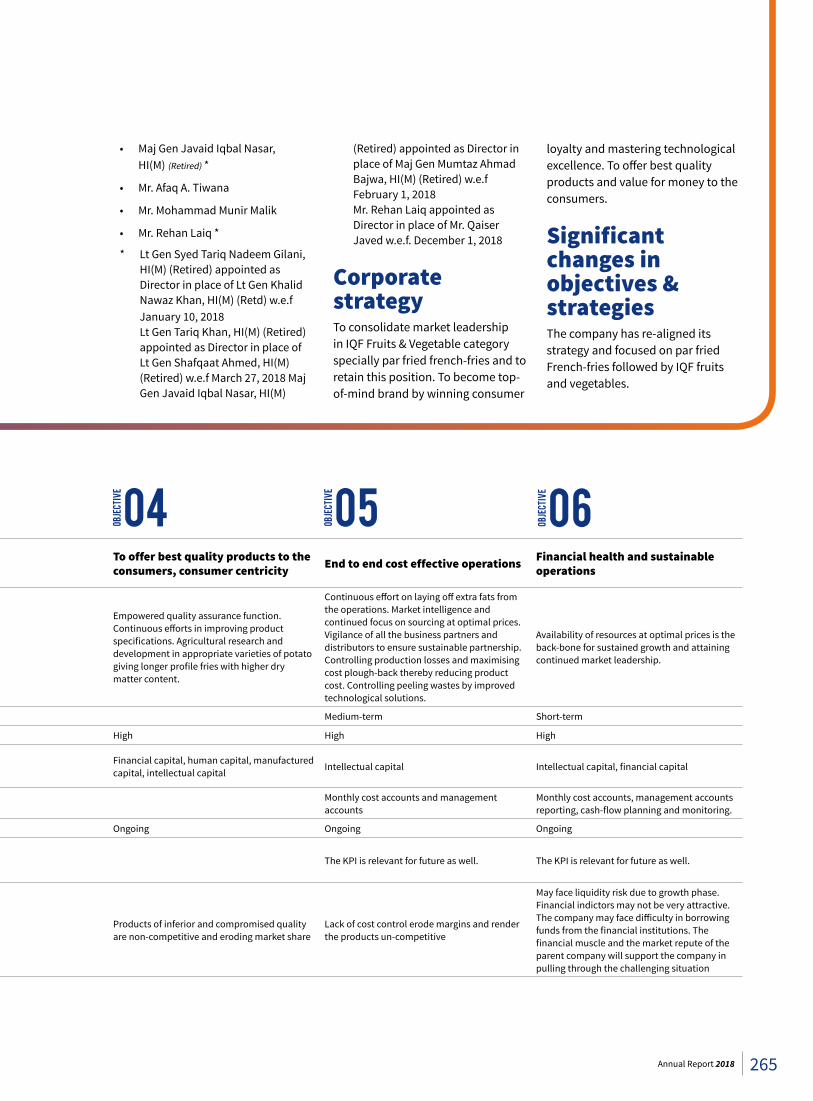
Consolidate market leadership in par fried french-fries and IQF F&V and to retain this position
To become top of mind brand Technological excellence To offer best quality products to the consumers, consumer centricity End to end cost effective operations Financial health and sustainable
operations
Strategy
Consolidate market share. Increase market penetration. Ensure availability of product at all potential outlets. Inundate all potential towns.
Appropriate and effective communication to the potential consumers through optimum marketing mix.
Stay abreast of technological developments and continuously upgrade production facilities to maximize efficiency.
Empowered quality assurance function. Continuous efforts in improving product specifications. Agricultural research and development in appropriate varieties of potato giving longer profile fries with higher dry matter content.
Continuous effort on laying off extra fats from the operations. Market intelligence and continued focus on sourcing at optimal prices. Vigilance of all the business partners and distributors to ensure sustainable partnership. Controlling production losses and maximising cost plough-back thereby reducing product cost. Controlling peeling wastes by improved technological solutions.
Availability of resources at optimal prices is the back-bone for sustained growth and attaining continued market leadership.
Nature Long-term Medium-term Medium-term Medium-term Short-term
Priority High High Medium High High High
Resources allocated
Financial capital, human capital, manufactured capital
Financial capital, human capital, intellectual capital
Financial capital, human capital, manufactured capital, intellectual capital
Financial capital, human capital, manufactured capital, intellectual capital Intellectual capital Intellectual capital, financial capital
KPI Monitored Market share indexing Market indexing, market research and insight, expert independent evaluation
Monthly cost accounts and management accounts
Monthly cost accounts, management accounts reporting, cash-flow planning and monitoring.
Status Ongoing process Ongoing process Ongoing Ongoing Ongoing Ongoing
Future relevance of KPI
The current KPI is relevant for future as well
The current KPI is relevant for future as well The KPI is relevant for future as well. The KPI is relevant for future as well.
Opportunities /Threats
Market entry of competitors. With appropriate measures we can change this threat into opportunity by market development and growth through combined advertisement of all the competitors
In-case of lack of continued and appropriate communication the consumers switch to alternate products
Lagging in technology render the products of inferior and compromised quality and non-competitive on cost aspects thereby eroding market share
Products of inferior and compromised quality are non-competitive and eroding market share
Lack of cost control erode margins and render the products un-competitive
May face liquidity risk due to growth phase. Financial indictors may not be very attractive. The company may face difficulty in borrowing funds from the financial institutions. The financial muscle and the market repute of the parent company will support the company in pulling through the challenging situation
• Maj Gen Javaid Iqbal Nasar, HI(M) (Retired) *
• Mr. Afaq A. Tiwana
• Mr. Mohammad Munir Malik
• Mr. Rehan Laiq *
* Lt Gen Syed Tariq Nadeem Gilani, HI(M) (Retired) appointed as Director in place of Lt Gen Khalid Nawaz Khan, HI(M) (Retd) w.e.f January 10, 2018
Lt Gen Tariq Khan, HI(M) (Retired) appointed as Director in place of Lt Gen Shafqaat Ahmed, HI(M) (Retired) w.e.f March 27, 2018 Maj Gen Javaid Iqbal Nasar, HI(M)
(Retired) appointed as Director in place of Maj Gen Mumtaz Ahmad Bajwa, HI(M) (Retired) w.e.f February 1, 2018
Mr. Rehan Laiq appointed as Director in place of Mr. Qaiser Javed w.e.f. December 1, 2018
Corporate strategyTo consolidate market leadership in IQF Fruits & Vegetable category specially par fried french-fries and to retain this position. To become top-of-mind brand by winning consumer
loyalty and mastering technological excellence. To offer best quality products and value for money to the consumers.
Significant changes in objectives & strategiesThe company has re-aligned its strategy and focused on par fried French-fries followed by IQF fruits and vegetables.
04OBJECT
IVE
05OBJECT
IVE
06OBJECT
IVE
265Annual Report 2018
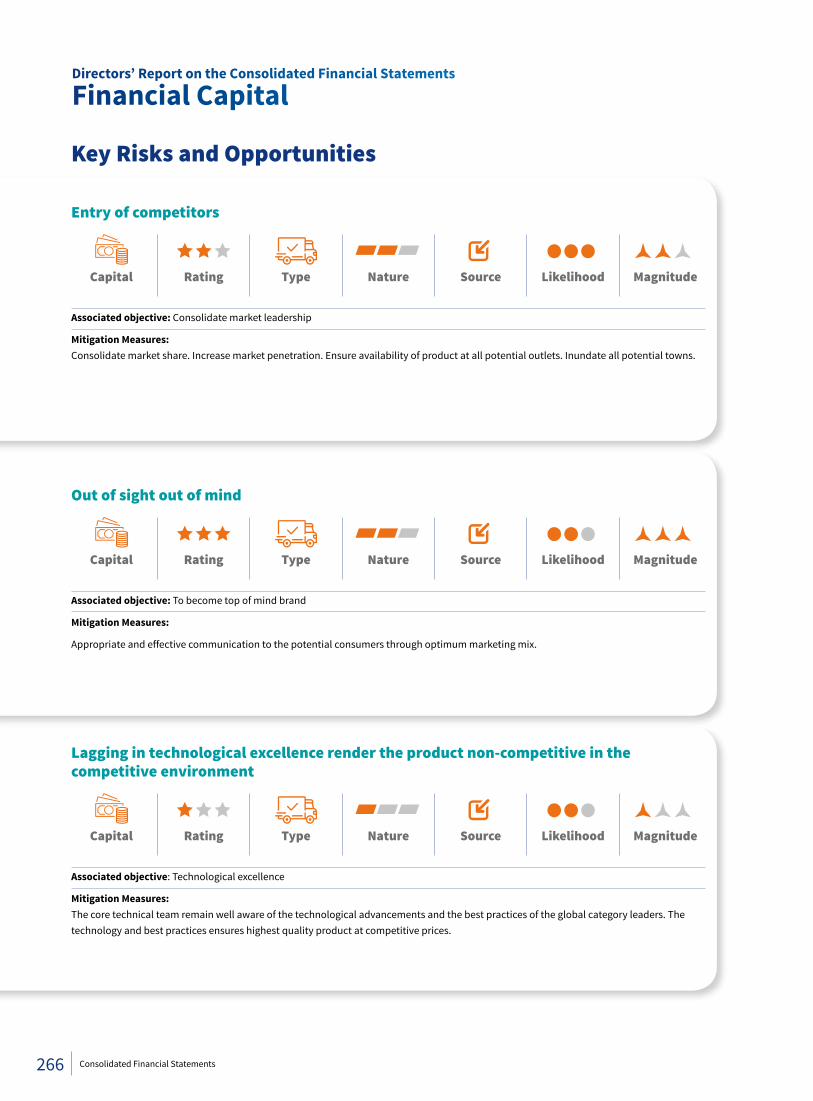
Entry of competitors
Associated objective: Consolidate market leadership
Mitigation Measures:Consolidate market share. Increase market penetration. Ensure availability of product at all potential outlets. Inundate all potential towns.
Capital Rating Nature Source Likelihood Magnitude
Out of sight out of mind
Associated objective: To become top of mind brand
Mitigation Measures:
Appropriate and effective communication to the potential consumers through optimum marketing mix.
Capital Rating Nature Likelihood MagnitudeSource
Source
Lagging in technological excellence render the product non-competitive in the competitive environment
Associated objective: Technological excellence
Mitigation Measures:The core technical team remain well aware of the technological advancements and the best practices of the global category leaders. The technology and best practices ensures highest quality product at competitive prices.
Capital Rating Nature Likelihood Magnitude
Key Risks and Opportunities
Directors’ Report on the Consolidated Financial Statements
Financial Capital
Type
Type
Type
266 Consolidated Financial Statements
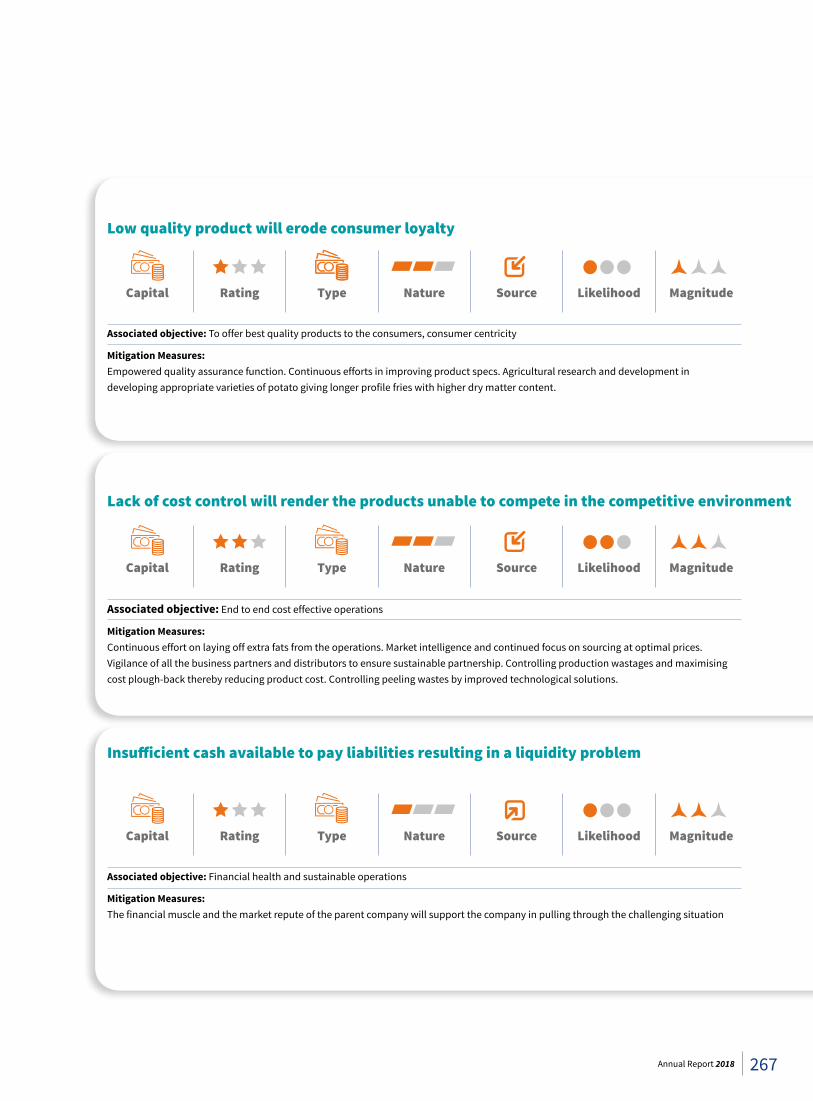
Low quality product will erode consumer loyalty
Associated objective: To offer best quality products to the consumers, consumer centricity
Mitigation Measures:Empowered quality assurance function. Continuous efforts in improving product specs. Agricultural research and development in developing appropriate varieties of potato giving longer profile fries with higher dry matter content.
Capital Rating Nature Source Likelihood Magnitude
Lack of cost control will render the products unable to compete in the competitive environment
Associated objective: End to end cost effective operations
Mitigation Measures:Continuous effort on laying off extra fats from the operations. Market intelligence and continued focus on sourcing at optimal prices. Vigilance of all the business partners and distributors to ensure sustainable partnership. Controlling production wastages and maximising cost plough-back thereby reducing product cost. Controlling peeling wastes by improved technological solutions.
Rating Nature Source Likelihood MagnitudeCapital
Capital
Insufficient cash available to pay liabilities resulting in a liquidity problem
Associated objective: Financial health and sustainable operations
Mitigation Measures:The financial muscle and the market repute of the parent company will support the company in pulling through the challenging situation
Rating Nature Source Likelihood Magnitude
Type
Type
Type
267Annual Report 2018
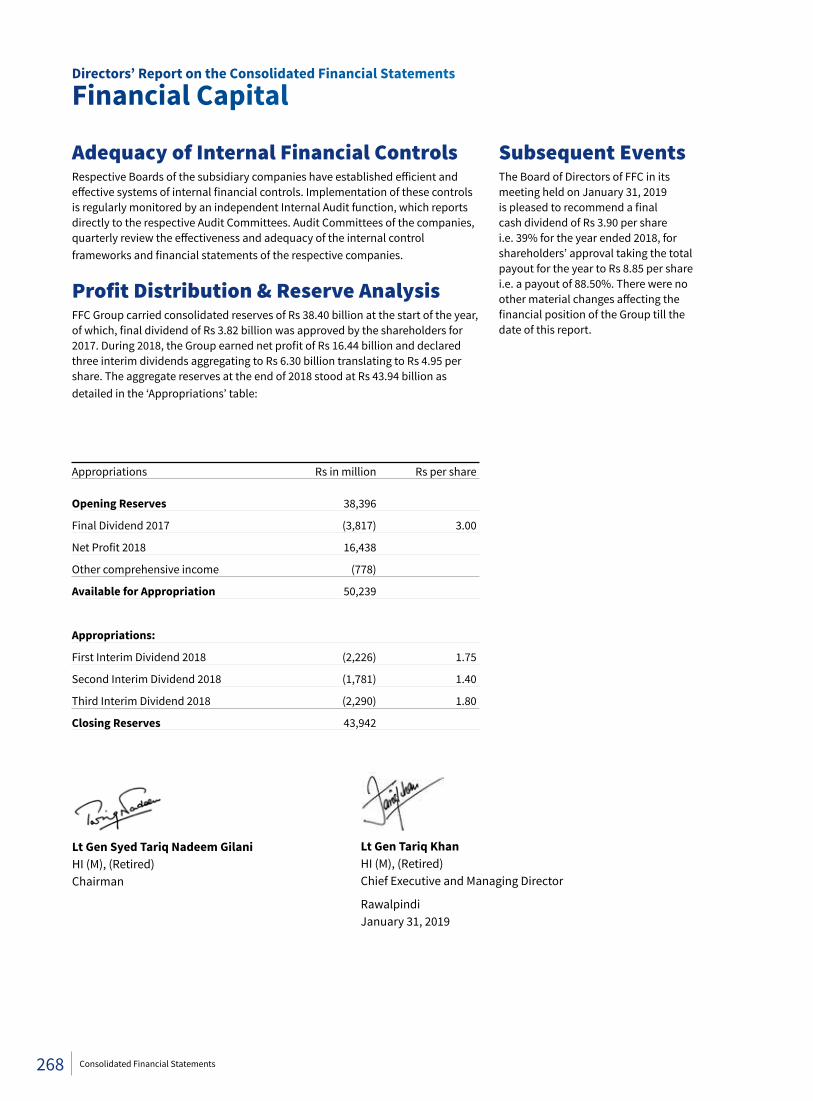
Directors’ Report on the Consolidated Financial Statements
Financial Capital
Adequacy of Internal Financial ControlsRespective Boards of the subsidiary companies have established efficient and effective systems of internal financial controls. Implementation of these controls is regularly monitored by an independent Internal Audit function, which reports directly to the respective Audit Committees. Audit Committees of the companies, quarterly review the effectiveness and adequacy of the internal control frameworks and financial statements of the respective companies.
Profit Distribution & Reserve AnalysisFFC Group carried consolidated reserves of Rs 38.40 billion at the start of the year, of which, final dividend of Rs 3.82 billion was approved by the shareholders for 2017. During 2018, the Group earned net profit of Rs 16.44 billion and declared three interim dividends aggregating to Rs 6.30 billion translating to Rs 4.95 per share. The aggregate reserves at the end of 2018 stood at Rs 43.94 billion as detailed in the ‘Appropriations’ table:
Appropriations Rs in million Rs per share
Opening Reserves 38,396
Final Dividend 2017 (3,817) 3.00
Net Profit 2018 16,438
Other comprehensive income (778)
Available for Appropriation 50,239
Appropriations:
First Interim Dividend 2018 (2,226) 1.75
Second Interim Dividend 2018 (1,781) 1.40
Third Interim Dividend 2018 (2,290) 1.80
Closing Reserves 43,942
Subsequent EventsThe Board of Directors of FFC in its meeting held on January 31, 2019 is pleased to recommend a final cash dividend of Rs 3.90 per share i.e. 39% for the year ended 2018, for shareholders’ approval taking the total payout for the year to Rs 8.85 per share i.e. a payout of 88.50%. There were no other material changes affecting the financial position of the Group till the date of this report.
Lt Gen Syed Tariq Nadeem Gilani HI (M), (Retired)Chairman
Lt Gen Tariq KhanHI (M), (Retired)Chief Executive and Managing Director
RawalpindiJanuary 31, 2019
268 Consolidated Financial Statements
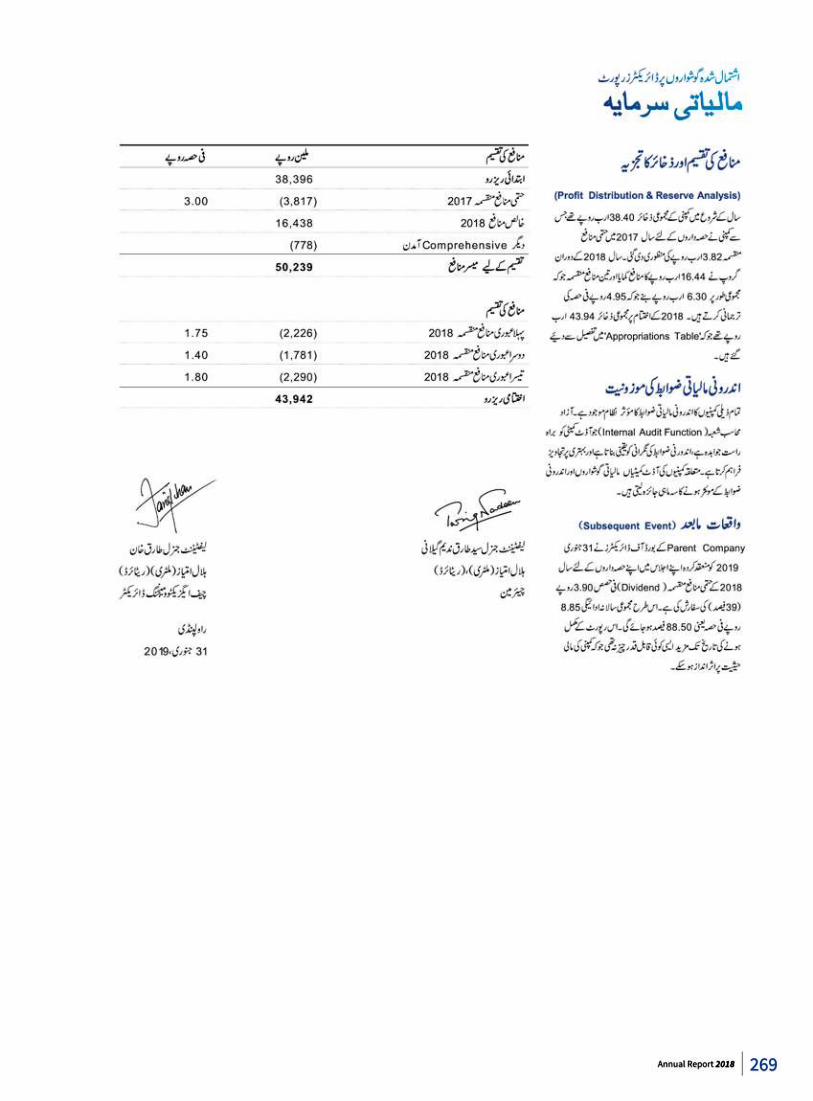
269Annual Report 2018
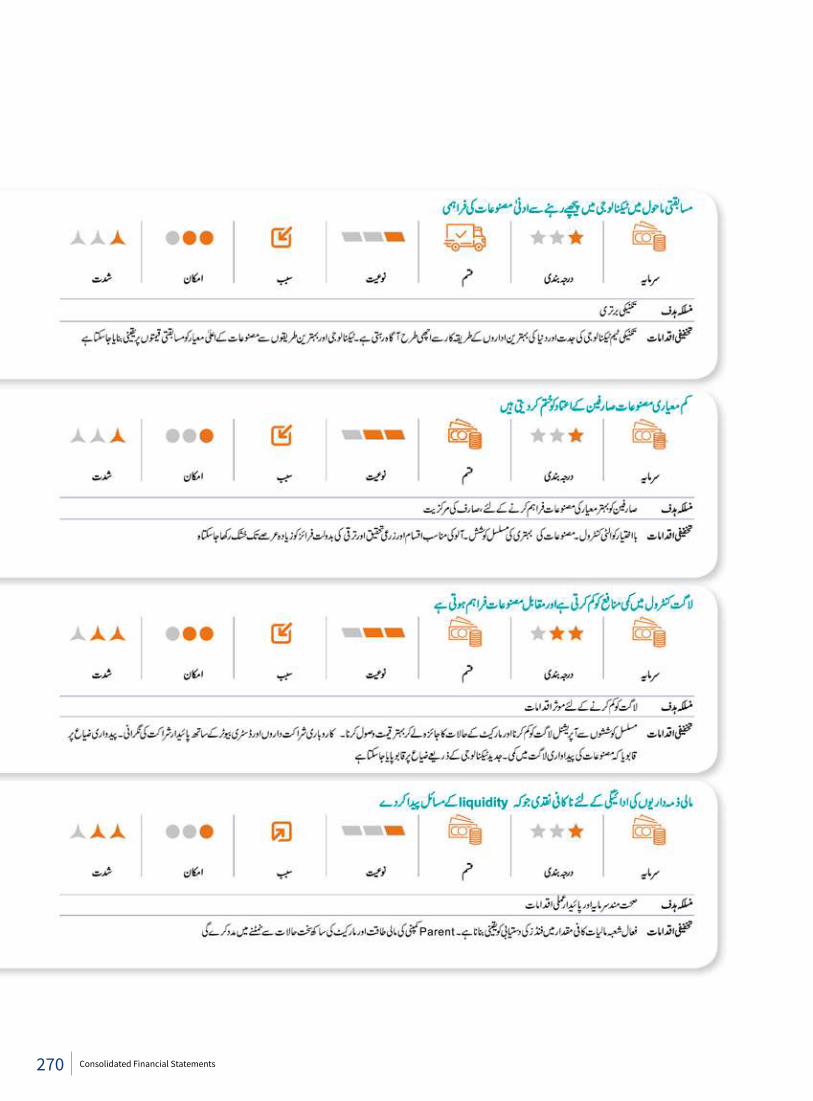
270 Consolidated Financial Statements
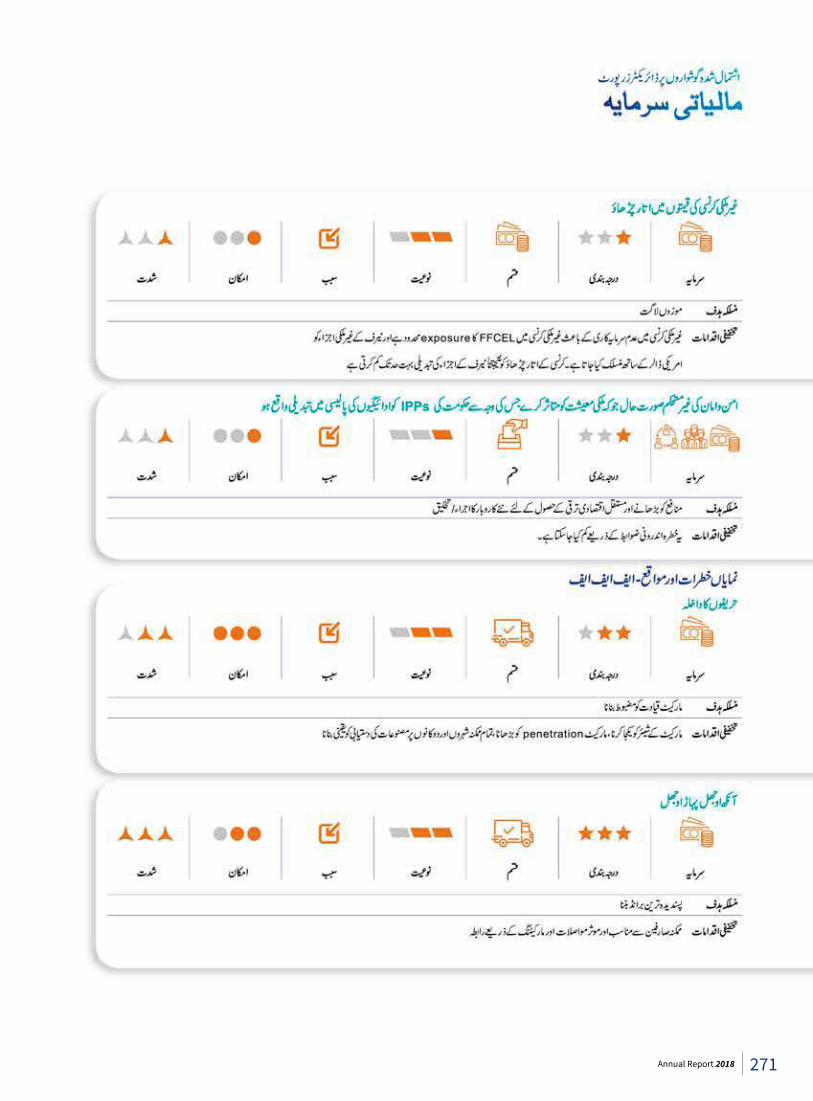
271Annual Report 2018
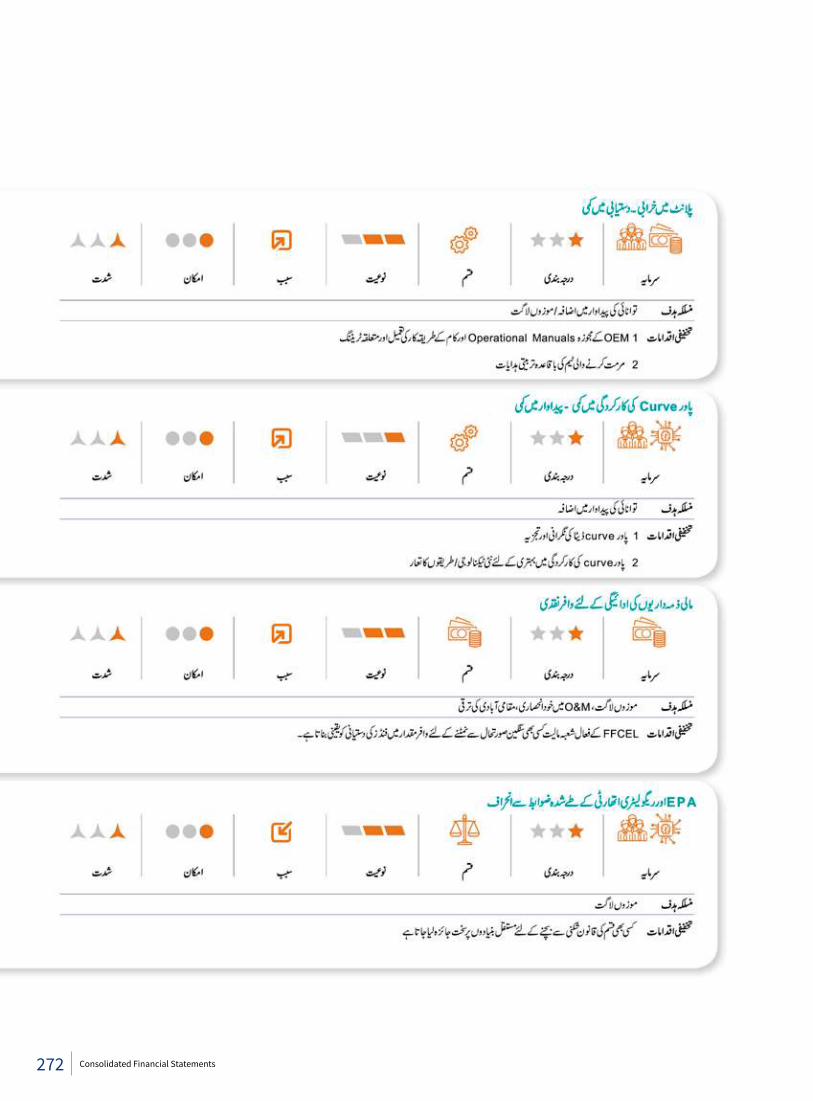
272 Consolidated Financial Statements
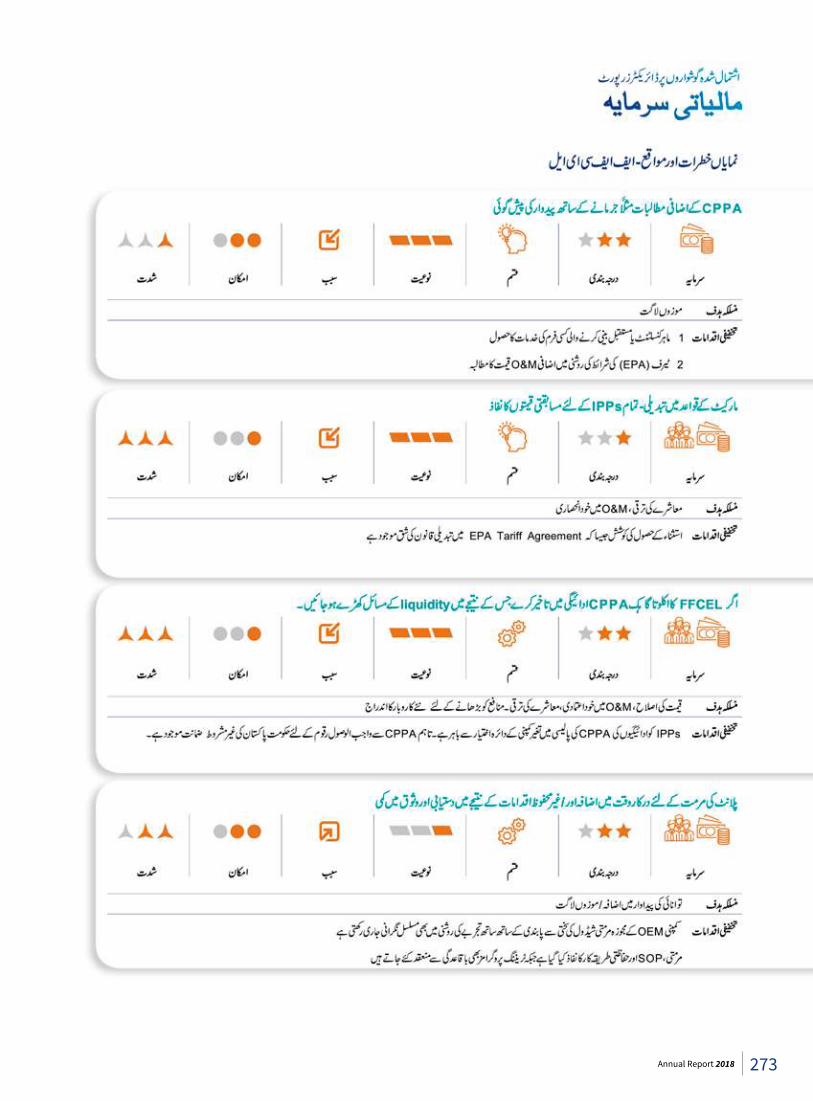
273Annual Report 2018
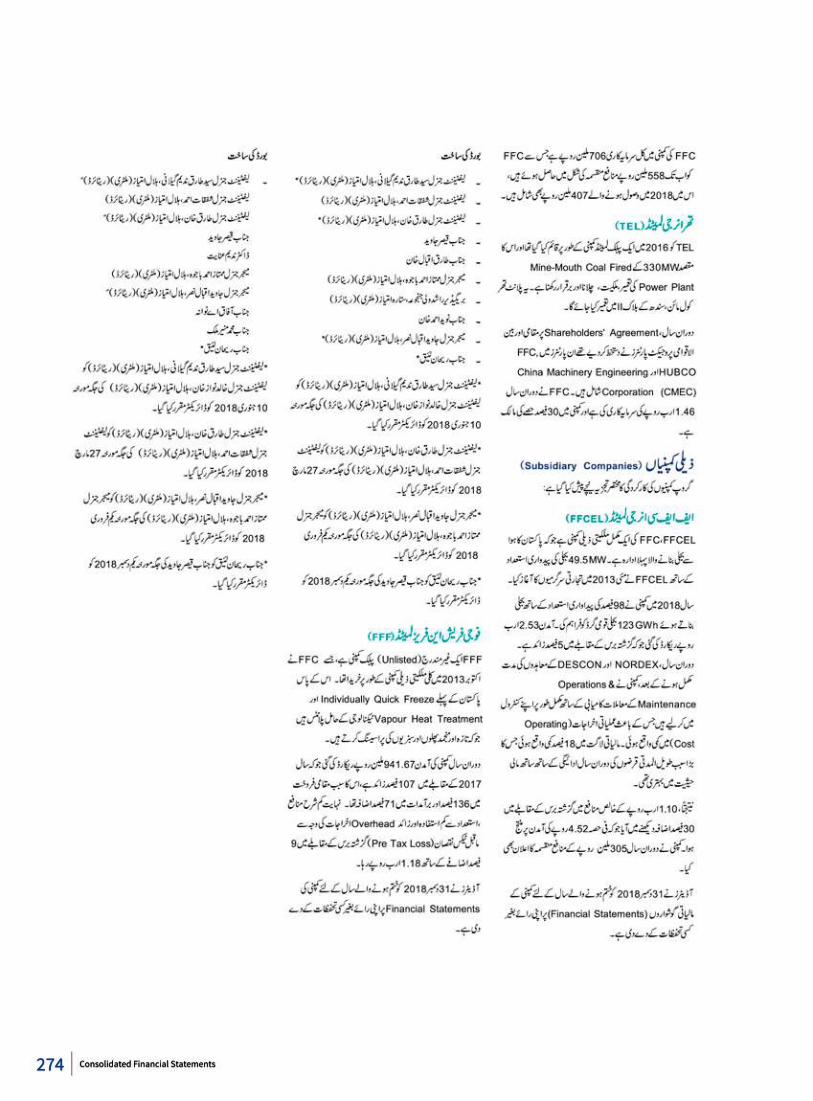
274 Consolidated Financial Statements
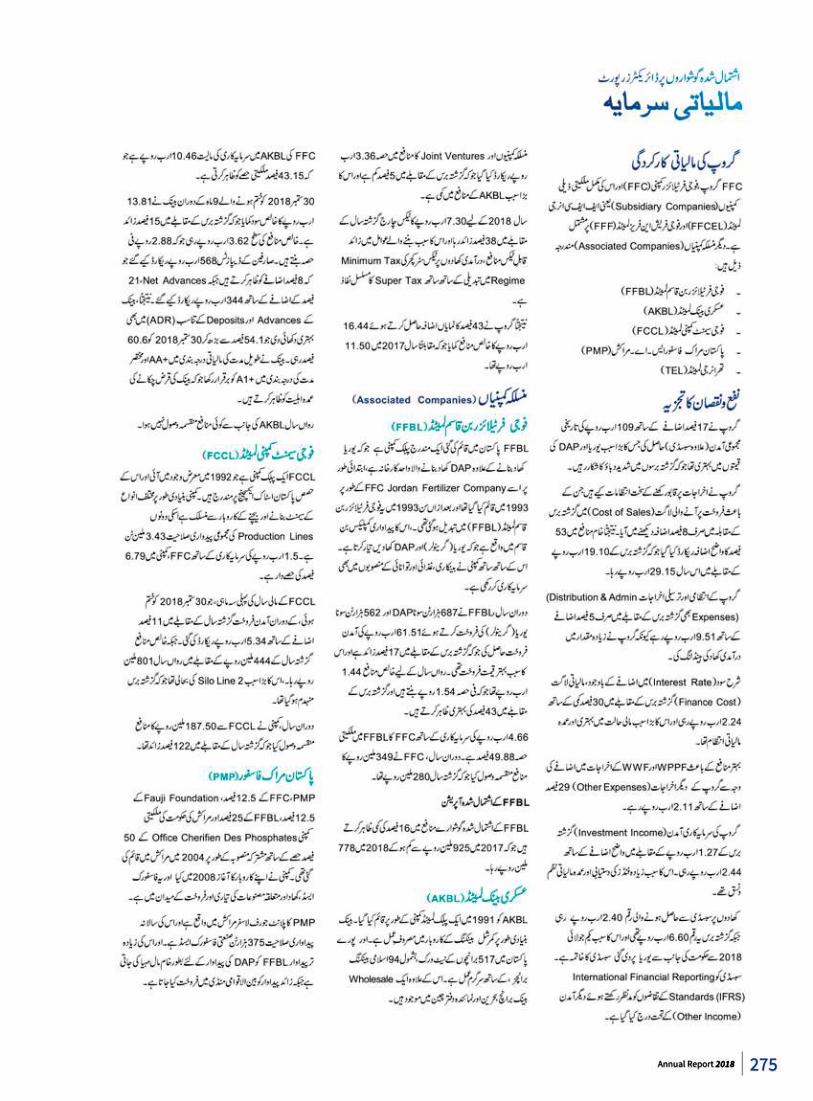
275Annual Report 2018
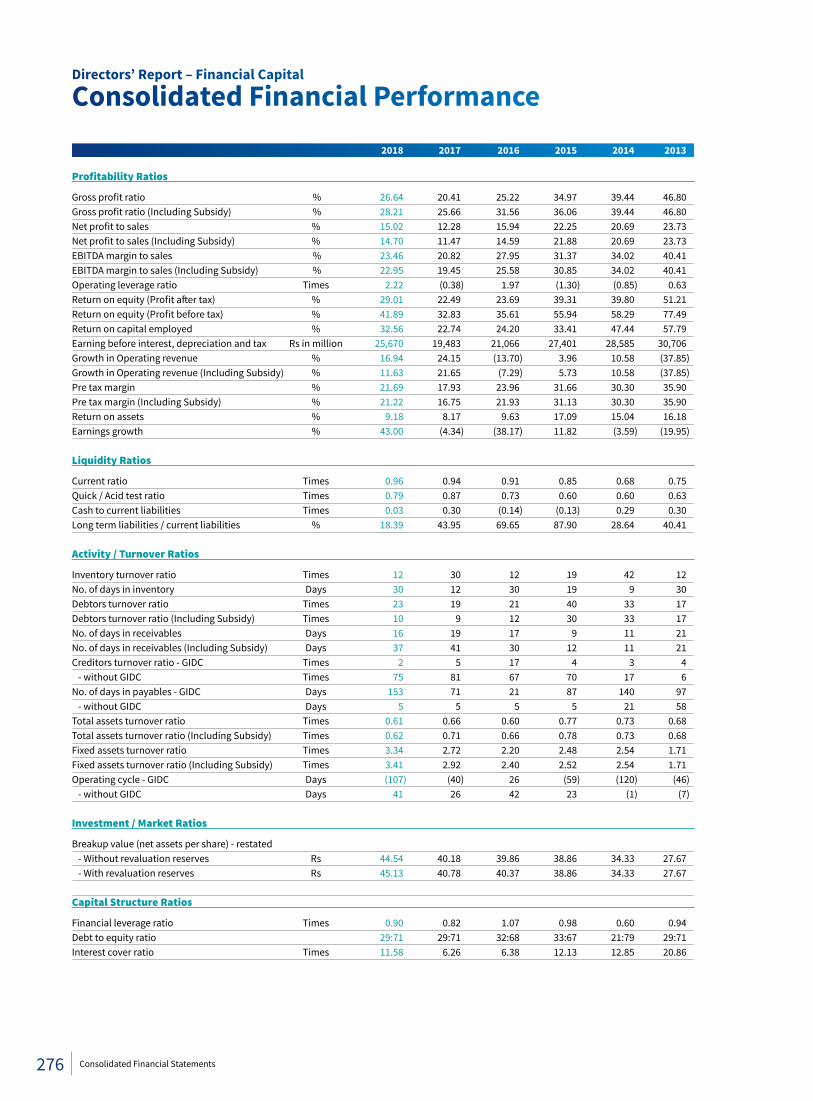
Directors’ Report – Financial Capital
Consolidated Financial Performance 2018 2017 2016 2015 2014 2013
Profitability Ratios
Gross profit ratio % 26.64 20.41 25.22 34.97 39.44 46.80 Gross profit ratio (Including Subsidy) % 28.21 25.66 31.56 36.06 39.44 46.80 Net profit to sales % 15.02 12.28 15.94 22.25 20.69 23.73 Net profit to sales (Including Subsidy) % 14.70 11.47 14.59 21.88 20.69 23.73 EBITDA margin to sales % 23.46 20.82 27.95 31.37 34.02 40.41 EBITDA margin to sales (Including Subsidy) % 22.95 19.45 25.58 30.85 34.02 40.41 Operating leverage ratio Times 2.22 (0.38) 1.97 (1.30) (0.85) 0.63 Return on equity (Profit after tax) % 29.01 22.49 23.69 39.31 39.80 51.21 Return on equity (Profit before tax) % 41.89 32.83 35.61 55.94 58.29 77.49 Return on capital employed % 32.56 22.74 24.20 33.41 47.44 57.79 Earning before interest, depreciation and tax Rs in million 25,670 19,483 21,066 27,401 28,585 30,706 Growth in Operating revenue % 16.94 24.15 (13.70) 3.96 10.58 (37.85)Growth in Operating revenue (Including Subsidy) % 11.63 21.65 (7.29) 5.73 10.58 (37.85)Pre tax margin % 21.69 17.93 23.96 31.66 30.30 35.90 Pre tax margin (Including Subsidy) % 21.22 16.75 21.93 31.13 30.30 35.90 Return on assets % 9.18 8.17 9.63 17.09 15.04 16.18 Earnings growth % 43.00 (4.34) (38.17) 11.82 (3.59) (19.95) Liquidity Ratios
Current ratio Times 0.96 0.94 0.91 0.85 0.68 0.75 Quick / Acid test ratio Times 0.79 0.87 0.73 0.60 0.60 0.63 Cash to current liabilities Times 0.03 0.30 (0.14) (0.13) 0.29 0.30 Long term liabilities / current liabilities % 18.39 43.95 69.65 87.90 28.64 40.41 Activity / Turnover Ratios
Inventory turnover ratio Times 12 30 12 19 42 12 No. of days in inventory Days 30 12 30 19 9 30 Debtors turnover ratio Times 23 19 21 40 33 17 Debtors turnover ratio (Including Subsidy) Times 10 9 12 30 33 17 No. of days in receivables Days 16 19 17 9 11 21 No. of days in receivables (Including Subsidy) Days 37 41 30 12 11 21 Creditors turnover ratio - GIDC Times 2 5 17 4 3 4 - without GIDC Times 75 81 67 70 17 6 No. of days in payables - GIDC Days 153 71 21 87 140 97 - without GIDC Days 5 5 5 5 21 58 Total assets turnover ratio Times 0.61 0.66 0.60 0.77 0.73 0.68 Total assets turnover ratio (Including Subsidy) Times 0.62 0.71 0.66 0.78 0.73 0.68 Fixed assets turnover ratio Times 3.34 2.72 2.20 2.48 2.54 1.71 Fixed assets turnover ratio (Including Subsidy) Times 3.41 2.92 2.40 2.52 2.54 1.71 Operating cycle - GIDC Days (107) (40) 26 (59) (120) (46) - without GIDC Days 41 26 42 23 (1) (7) Investment / Market Ratios
Breakup value (net assets per share) - restated - Without revaluation reserves Rs 44.54 40.18 39.86 38.86 34.33 27.67 - With revaluation reserves Rs 45.13 40.78 40.37 38.86 34.33 27.67 Capital Structure Ratios
Financial leverage ratio Times 0.90 0.82 1.07 0.98 0.60 0.94 Debt to equity ratio 29:71 29:71 32:68 33:67 21:79 29:71 Interest cover ratio Times 11.58 6.26 6.38 12.13 12.85 20.86
276 Consolidated Financial Statements
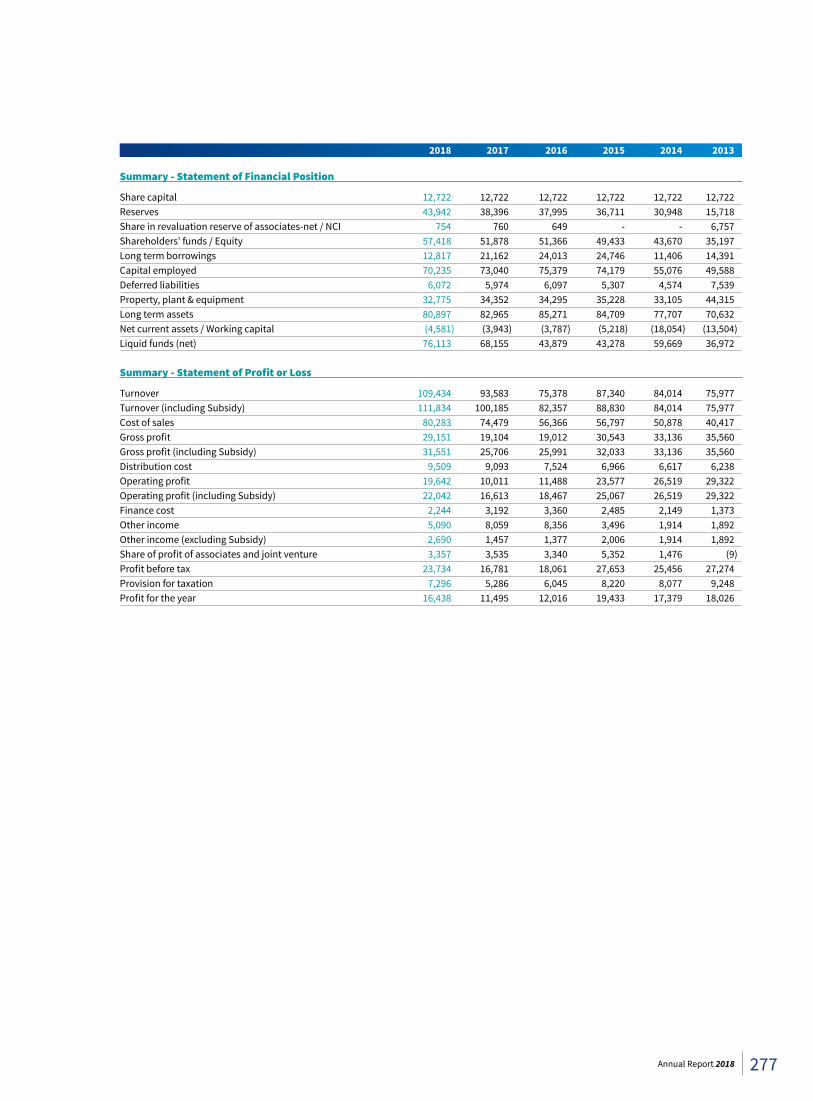
2018 2017 2016 2015 2014 2013
Summary - Statement of Financial Position
Share capital 12,722 12,722 12,722 12,722 12,722 12,722 Reserves 43,942 38,396 37,995 36,711 30,948 15,718 Share in revaluation reserve of associates-net / NCI 754 760 649 - - 6,757 Shareholders’ funds / Equity 57,418 51,878 51,366 49,433 43,670 35,197 Long term borrowings 12,817 21,162 24,013 24,746 11,406 14,391 Capital employed 70,235 73,040 75,379 74,179 55,076 49,588 Deferred liabilities 6,072 5,974 6,097 5,307 4,574 7,539 Property, plant & equipment 32,775 34,352 34,295 35,228 33,105 44,315 Long term assets 80,897 82,965 85,271 84,709 77,707 70,632 Net current assets / Working capital (4,581) (3,943) (3,787) (5,218) (18,054) (13,504)Liquid funds (net) 76,113 68,155 43,879 43,278 59,669 36,972 Summary - Statement of Profit or Loss
Turnover 109,434 93,583 75,378 87,340 84,014 75,977 Turnover (including Subsidy) 111,834 100,185 82,357 88,830 84,014 75,977 Cost of sales 80,283 74,479 56,366 56,797 50,878 40,417 Gross profit 29,151 19,104 19,012 30,543 33,136 35,560 Gross profit (including Subsidy) 31,551 25,706 25,991 32,033 33,136 35,560 Distribution cost 9,509 9,093 7,524 6,966 6,617 6,238 Operating profit 19,642 10,011 11,488 23,577 26,519 29,322 Operating profit (including Subsidy) 22,042 16,613 18,467 25,067 26,519 29,322 Finance cost 2,244 3,192 3,360 2,485 2,149 1,373 Other income 5,090 8,059 8,356 3,496 1,914 1,892 Other income (excluding Subsidy) 2,690 1,457 1,377 2,006 1,914 1,892 Share of profit of associates and joint venture 3,357 3,535 3,340 5,352 1,476 (9)Profit before tax 23,734 16,781 18,061 27,653 25,456 27,274 Provision for taxation 7,296 5,286 6,045 8,220 8,077 9,248 Profit for the year 16,438 11,495 12,016 19,433 17,379 18,026
277Annual Report 2018
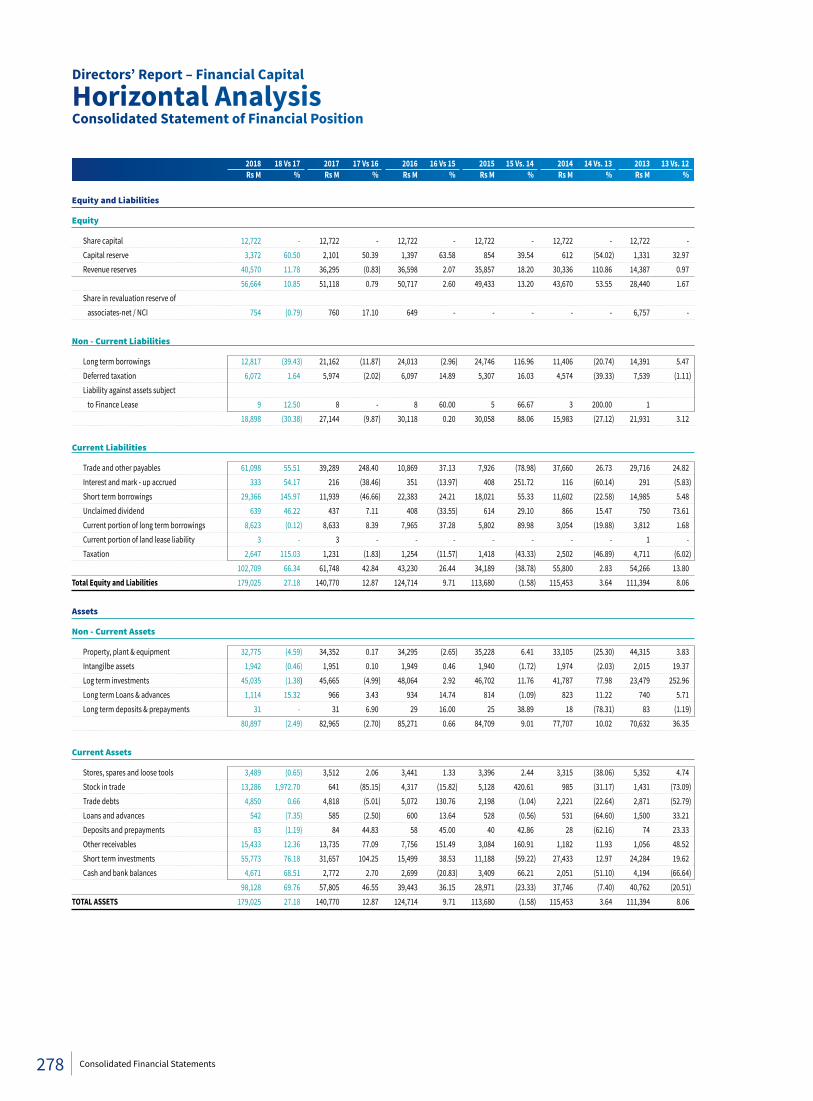
Directors’ Report – Financial Capital
Horizontal AnalysisConsolidated Statement of Financial Position
2018 18 Vs 17 2017 17 Vs 16 2016 16 Vs 15 2015 15 Vs. 14 2014 14 Vs. 13 2013 13 Vs. 12 RsM % RsM % RsM % RsM % RsM % RsM %
Equity and Liabilities
Equity
Share capital 12,722 - 12,722 - 12,722 - 12,722 - 12,722 - 12,722 - Capital reserve 3,372 60.50 2,101 50.39 1,397 63.58 854 39.54 612 (54.02) 1,331 32.97 Revenue reserves 40,570 11.78 36,295 (0.83) 36,598 2.07 35,857 18.20 30,336 110.86 14,387 0.97 56,664 10.85 51,118 0.79 50,717 2.60 49,433 13.20 43,670 53.55 28,440 1.67 Share in revaluation reserve of associates-net / NCI 754 (0.79) 760 17.10 649 - - - - - 6,757 - Non - Current Liabilities
Long term borrowings 12,817 (39.43) 21,162 (11.87) 24,013 (2.96) 24,746 116.96 11,406 (20.74) 14,391 5.47 Deferred taxation 6,072 1.64 5,974 (2.02) 6,097 14.89 5,307 16.03 4,574 (39.33) 7,539 (1.11) Liability against assets subject to Finance Lease 9 12.50 8 - 8 60.00 5 66.67 3 200.00 1 18,898 (30.38) 27,144 (9.87) 30,118 0.20 30,058 88.06 15,983 (27.12) 21,931 3.12 Current Liabilities
Trade and other payables 61,098 55.51 39,289 248.40 10,869 37.13 7,926 (78.98) 37,660 26.73 29,716 24.82 Interest and mark - up accrued 333 54.17 216 (38.46) 351 (13.97) 408 251.72 116 (60.14) 291 (5.83) Short term borrowings 29,366 145.97 11,939 (46.66) 22,383 24.21 18,021 55.33 11,602 (22.58) 14,985 5.48 Unclaimed dividend 639 46.22 437 7.11 408 (33.55) 614 29.10 866 15.47 750 73.61 Current portion of long term borrowings 8,623 (0.12) 8,633 8.39 7,965 37.28 5,802 89.98 3,054 (19.88) 3,812 1.68 Current portion of land lease liability 3 - 3 - - - - - - - 1 - Taxation 2,647 115.03 1,231 (1.83) 1,254 (11.57) 1,418 (43.33) 2,502 (46.89) 4,711 (6.02) 102,709 66.34 61,748 42.84 43,230 26.44 34,189 (38.78) 55,800 2.83 54,266 13.80 Total Equity and Liabilities 179,025 27.18 140,770 12.87 124,714 9.71 113,680 (1.58) 115,453 3.64 111,394 8.06
Assets
Non - Current Assets
Property, plant & equipment 32,775 (4.59) 34,352 0.17 34,295 (2.65) 35,228 6.41 33,105 (25.30) 44,315 3.83 Intangilbe assets 1,942 (0.46) 1,951 0.10 1,949 0.46 1,940 (1.72) 1,974 (2.03) 2,015 19.37 Log term investments 45,035 (1.38) 45,665 (4.99) 48,064 2.92 46,702 11.76 41,787 77.98 23,479 252.96 Long term Loans & advances 1,114 15.32 966 3.43 934 14.74 814 (1.09) 823 11.22 740 5.71 Long term deposits & prepayments 31 - 31 6.90 29 16.00 25 38.89 18 (78.31) 83 (1.19) 80,897 (2.49) 82,965 (2.70) 85,271 0.66 84,709 9.01 77,707 10.02 70,632 36.35
Current Assets
Stores, spares and loose tools 3,489 (0.65) 3,512 2.06 3,441 1.33 3,396 2.44 3,315 (38.06) 5,352 4.74 Stock in trade 13,286 1,972.70 641 (85.15) 4,317 (15.82) 5,128 420.61 985 (31.17) 1,431 (73.09) Trade debts 4,850 0.66 4,818 (5.01) 5,072 130.76 2,198 (1.04) 2,221 (22.64) 2,871 (52.79) Loans and advances 542 (7.35) 585 (2.50) 600 13.64 528 (0.56) 531 (64.60) 1,500 33.21 Deposits and prepayments 83 (1.19) 84 44.83 58 45.00 40 42.86 28 (62.16) 74 23.33 Other receivables 15,433 12.36 13,735 77.09 7,756 151.49 3,084 160.91 1,182 11.93 1,056 48.52 Short term investments 55,773 76.18 31,657 104.25 15,499 38.53 11,188 (59.22) 27,433 12.97 24,284 19.62 Cash and bank balances 4,671 68.51 2,772 2.70 2,699 (20.83) 3,409 66.21 2,051 (51.10) 4,194 (66.64) 98,128 69.76 57,805 46.55 39,443 36.15 28,971 (23.33) 37,746 (7.40) 40,762 (20.51) TOTAL ASSETS 179,025 27.18 140,770 12.87 124,714 9.71 113,680 (1.58) 115,453 3.64 111,394 8.06
278 Consolidated Financial Statements
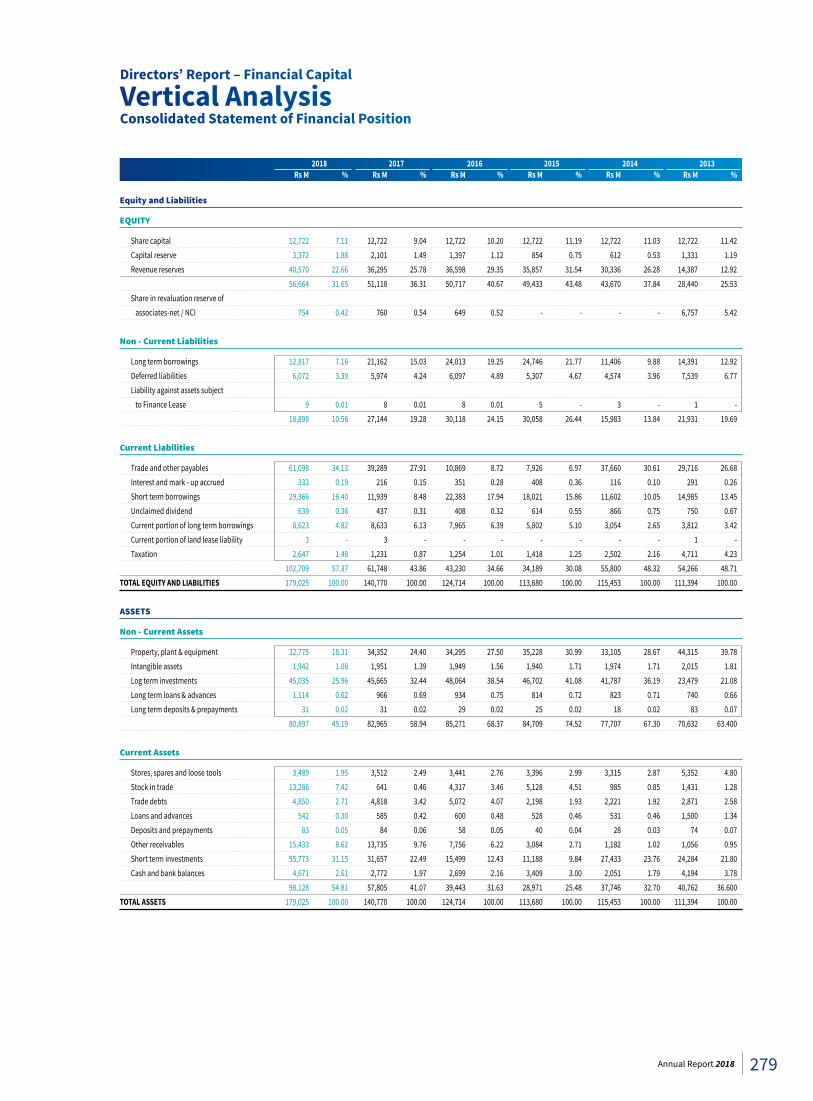
Directors’ Report – Financial Capital
Vertical AnalysisConsolidated Statement of Financial Position
2018 2017 2016 2015 2014 2013 RsM % RsM % RsM % RsM % RsM % RsM %
Equity and Liabilities
EQUITY
Share capital 12,722 7.11 12,722 9.04 12,722 10.20 12,722 11.19 12,722 11.03 12,722 11.42 Capital reserve 3,372 1.88 2,101 1.49 1,397 1.12 854 0.75 612 0.53 1,331 1.19 Revenue reserves 40,570 22.66 36,295 25.78 36,598 29.35 35,857 31.54 30,336 26.28 14,387 12.92 56,664 31.65 51,118 36.31 50,717 40.67 49,433 43.48 43,670 37.84 28,440 25.53 Share in revaluation reserve of associates-net / NCI 754 0.42 760 0.54 649 0.52 - - - - 6,757 5.42
Non - Current Liabilities
Long term borrowings 12,817 7.16 21,162 15.03 24,013 19.25 24,746 21.77 11,406 9.88 14,391 12.92 Deferred liabilities 6,072 3.39 5,974 4.24 6,097 4.89 5,307 4.67 4,574 3.96 7,539 6.77 Liability against assets subject to Finance Lease 9 0.01 8 0.01 8 0.01 5 - 3 - 1 - 18,898 10.56 27,144 19.28 30,118 24.15 30,058 26.44 15,983 13.84 21,931 19.69 Current Liabilities
Trade and other payables 61,098 34.13 39,289 27.91 10,869 8.72 7,926 6.97 37,660 30.61 29,716 26.68 Interest and mark - up accrued 333 0.19 216 0.15 351 0.28 408 0.36 116 0.10 291 0.26 Short term borrowings 29,366 16.40 11,939 8.48 22,383 17.94 18,021 15.86 11,602 10.05 14,985 13.45 Unclaimed dividend 639 0.36 437 0.31 408 0.32 614 0.55 866 0.75 750 0.67 Current portion of long term borrowings 8,623 4.82 8,633 6.13 7,965 6.39 5,802 5.10 3,054 2.65 3,812 3.42 Current portion of land lease liability 3 - 3 - - - - - - - 1 - Taxation 2,647 1.48 1,231 0.87 1,254 1.01 1,418 1.25 2,502 2.16 4,711 4.23 102,709 57.37 61,748 43.86 43,230 34.66 34,189 30.08 55,800 48.32 54,266 48.71 TOTAL EQUITY AND LIABILITIES 179,025 100.00 140,770 100.00 124,714 100.00 113,680 100.00 115,453 100.00 111,394 100.00
ASSETS
Non - Current Assets
Property, plant & equipment 32,775 18.31 34,352 24.40 34,295 27.50 35,228 30.99 33,105 28.67 44,315 39.78 Intangible assets 1,942 1.08 1,951 1.39 1,949 1.56 1,940 1.71 1,974 1.71 2,015 1.81 Log term investments 45,035 25.96 45,665 32.44 48,064 38.54 46,702 41.08 41,787 36.19 23,479 21.08 Long term loans & advances 1,114 0.62 966 0.69 934 0.75 814 0.72 823 0.71 740 0.66 Long term deposits & prepayments 31 0.02 31 0.02 29 0.02 25 0.02 18 0.02 83 0.07 80,897 45.19 82,965 58.94 85,271 68.37 84,709 74.52 77,707 67.30 70,632 63.400
Current Assets
Stores, spares and loose tools 3,489 1.95 3,512 2.49 3,441 2.76 3,396 2.99 3,315 2.87 5,352 4.80 Stock in trade 13,286 7.42 641 0.46 4,317 3.46 5,128 4.51 985 0.85 1,431 1.28 Trade debts 4,850 2.71 4,818 3.42 5,072 4.07 2,198 1.93 2,221 1.92 2,871 2.58 Loans and advances 542 0.30 585 0.42 600 0.48 528 0.46 531 0.46 1,500 1.34 Deposits and prepayments 83 0.05 84 0.06 58 0.05 40 0.04 28 0.03 74 0.07 Other receivables 15,433 8.62 13,735 9.76 7,756 6.22 3,084 2.71 1,182 1.02 1,056 0.95 Short term investments 55,773 31.15 31,657 22.49 15,499 12.43 11,188 9.84 27,433 23.76 24,284 21.80 Cash and bank balances 4,671 2.61 2,772 1.97 2,699 2.16 3,409 3.00 2,051 1.79 4,194 3.78 98,128 54.81 57,805 41.07 39,443 31.63 28,971 25.48 37,746 32.70 40,762 36.600 TOTAL ASSETS 179,025 100.00 140,770 100.00 124,714 100.00 113,680 100.00 115,453 100.00 111,394 100.00
279Annual Report 2018
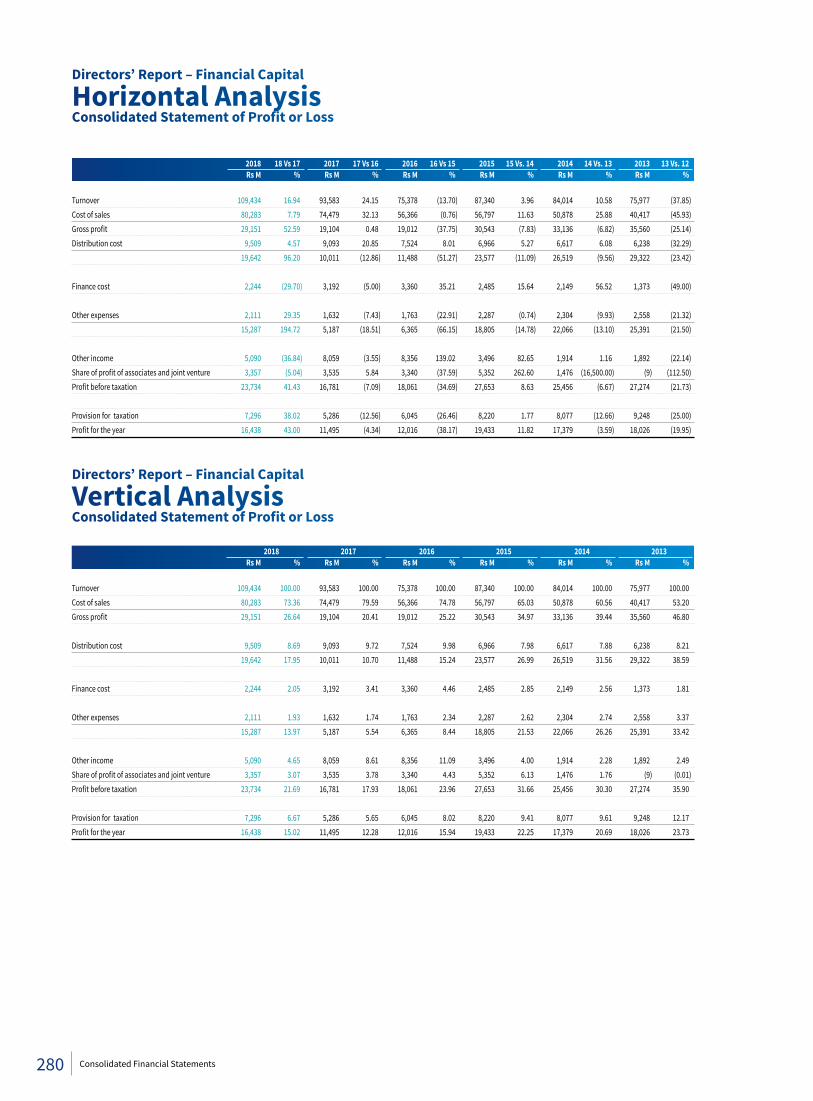
Directors’ Report – Financial Capital
Horizontal AnalysisConsolidatedStatementofProfitorLoss
Directors’ Report – Financial Capital
Vertical AnalysisConsolidatedStatementofProfitorLoss
2018 18 Vs 17 2017 17 Vs 16 2016 16 Vs 15 2015 15 Vs. 14 2014 14 Vs. 13 2013 13 Vs. 12 RsM % RsM % RsM % RsM % RsM % RsM %
Turnover 109,434 16.94 93,583 24.15 75,378 (13.70) 87,340 3.96 84,014 10.58 75,977 (37.85)Cost of sales 80,283 7.79 74,479 32.13 56,366 (0.76) 56,797 11.63 50,878 25.88 40,417 (45.93)Gross profit 29,151 52.59 19,104 0.48 19,012 (37.75) 30,543 (7.83) 33,136 (6.82) 35,560 (25.14)Distribution cost 9,509 4.57 9,093 20.85 7,524 8.01 6,966 5.27 6,617 6.08 6,238 (32.29) 19,642 96.20 10,011 (12.86) 11,488 (51.27) 23,577 (11.09) 26,519 (9.56) 29,322 (23.42) Finance cost 2,244 (29.70) 3,192 (5.00) 3,360 35.21 2,485 15.64 2,149 56.52 1,373 (49.00) Other expenses 2,111 29.35 1,632 (7.43) 1,763 (22.91) 2,287 (0.74) 2,304 (9.93) 2,558 (21.32) 15,287 194.72 5,187 (18.51) 6,365 (66.15) 18,805 (14.78) 22,066 (13.10) 25,391 (21.50) Other income 5,090 (36.84) 8,059 (3.55) 8,356 139.02 3,496 82.65 1,914 1.16 1,892 (22.14)Share of profit of associates and joint venture 3,357 (5.04) 3,535 5.84 3,340 (37.59) 5,352 262.60 1,476 (16,500.00) (9) (112.50)Profit before taxation 23,734 41.43 16,781 (7.09) 18,061 (34.69) 27,653 8.63 25,456 (6.67) 27,274 (21.73) Provision for taxation 7,296 38.02 5,286 (12.56) 6,045 (26.46) 8,220 1.77 8,077 (12.66) 9,248 (25.00)Profit for the year 16,438 43.00 11,495 (4.34) 12,016 (38.17) 19,433 11.82 17,379 (3.59) 18,026 (19.95)
2018 2017 2016 2015 2014 2013 RsM % RsM % RsM % RsM % RsM % RsM %
Turnover 109,434 100.00 93,583 100.00 75,378 100.00 87,340 100.00 84,014 100.00 75,977 100.00 Cost of sales 80,283 73.36 74,479 79.59 56,366 74.78 56,797 65.03 50,878 60.56 40,417 53.20 Gross profit 29,151 26.64 19,104 20.41 19,012 25.22 30,543 34.97 33,136 39.44 35,560 46.80
Distribution cost 9,509 8.69 9,093 9.72 7,524 9.98 6,966 7.98 6,617 7.88 6,238 8.21 19,642 17.95 10,011 10.70 11,488 15.24 23,577 26.99 26,519 31.56 29,322 38.59 Finance cost 2,244 2.05 3,192 3.41 3,360 4.46 2,485 2.85 2,149 2.56 1,373 1.81 Other expenses 2,111 1.93 1,632 1.74 1,763 2.34 2,287 2.62 2,304 2.74 2,558 3.37 15,287 13.97 5,187 5.54 6,365 8.44 18,805 21.53 22,066 26.26 25,391 33.42 Other income 5,090 4.65 8,059 8.61 8,356 11.09 3,496 4.00 1,914 2.28 1,892 2.49 Share of profit of associates and joint venture 3,357 3.07 3,535 3.78 3,340 4.43 5,352 6.13 1,476 1.76 (9) (0.01)Profit before taxation 23,734 21.69 16,781 17.93 18,061 23.96 27,653 31.66 25,456 30.30 27,274 35.90 Provision for taxation 7,296 6.67 5,286 5.65 6,045 8.02 8,220 9.41 8,077 9.61 9,248 12.17 Profit for the year 16,438 15.02 11,495 12.28 12,016 15.94 19,433 22.25 17,379 20.69 18,026 23.73
280 Consolidated Financial Statements
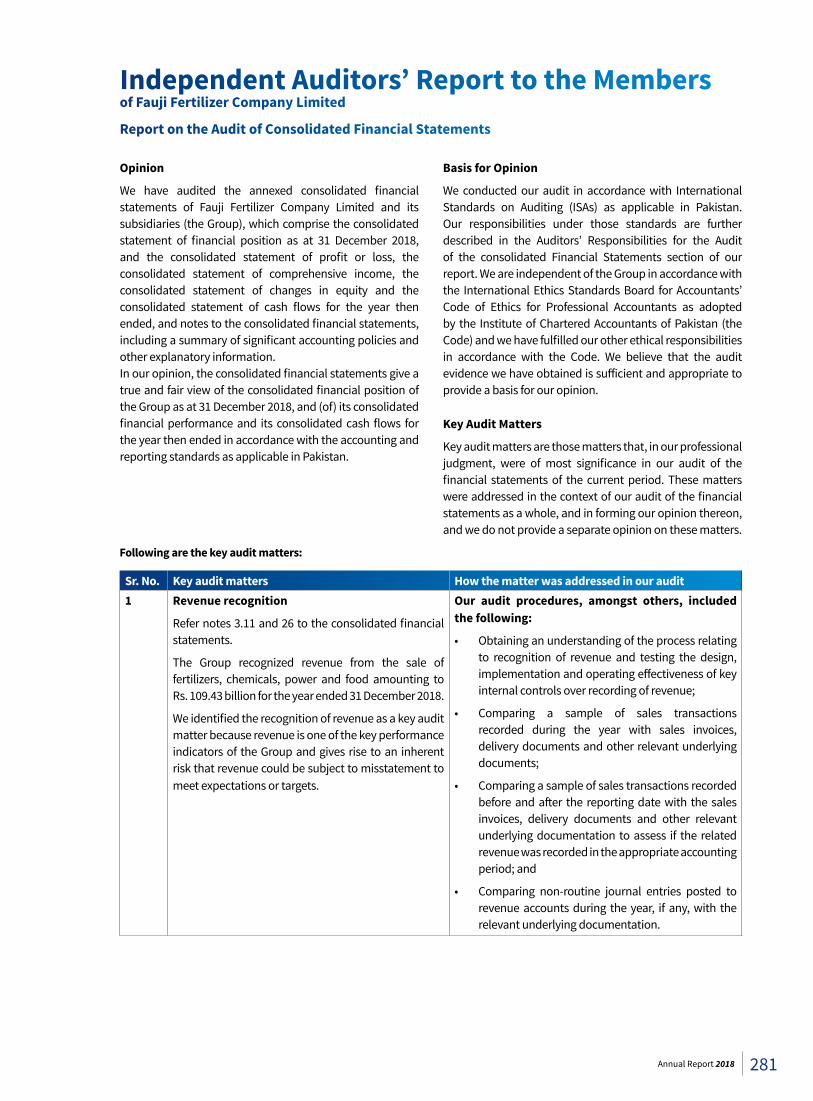
Opinion
We have audited the annexed consolidated financial statements of Fauji Fertilizer Company Limited and its subsidiaries (the Group), which comprise the consolidated statement of financial position as at 31 December 2018, and the consolidated statement of profit or loss, the consolidated statement of comprehensive income, the consolidated statement of changes in equity and the consolidated statement of cash flows for the year then ended, and notes to the consolidated financial statements, including a summary of significant accounting policies and other explanatory information.In our opinion, the consolidated financial statements give a true and fair view of the consolidated financial position of the Group as at 31 December 2018, and (of) its consolidated financial performance and its consolidated cash flows for the year then ended in accordance with the accounting and reporting standards as applicable in Pakistan.
Following are the key audit matters:
Sr. No. Key audit matters How the matter was addressed in our audit1 Revenue recognition
Refer notes 3.11 and 26 to the consolidated financial statements.
The Group recognized revenue from the sale of fertilizers, chemicals, power and food amounting to Rs. 109.43 billion for the year ended 31 December 2018.
We identified the recognition of revenue as a key audit matter because revenue is one of the key performance indicators of the Group and gives rise to an inherent risk that revenue could be subject to misstatement to meet expectations or targets.
Our audit procedures, amongst others, included the following:
• Obtaining an understanding of the process relating to recognition of revenue and testing the design, implementation and operating effectiveness of key internal controls over recording of revenue;
• Comparing a sample of sales transactions recorded during the year with sales invoices, delivery documents and other relevant underlying documents;
• Comparing a sample of sales transactions recorded before and after the reporting date with the sales invoices, delivery documents and other relevant underlying documentation to assess if the related revenue was recorded in the appropriate accounting period; and
• Comparing non-routine journal entries posted to revenue accounts during the year, if any, with the relevant underlying documentation.
Basis for Opinion
We conducted our audit in accordance with International Standards on Auditing (ISAs) as applicable in Pakistan. Our responsibilities under those standards are further described in the Auditors’ Responsibilities for the Audit of the consolidated Financial Statements section of our report. We are independent of the Group in accordance with the International Ethics Standards Board for Accountants’ Code of Ethics for Professional Accountants as adopted by the Institute of Chartered Accountants of Pakistan (the Code) and we have fulfilled our other ethical responsibilities in accordance with the Code. We believe that the audit evidence we have obtained is sufficient and appropriate to provide a basis for our opinion.
Key Audit Matters
Key audit matters are those matters that, in our professional judgment, were of most significance in our audit of the financial statements of the current period. These matters were addressed in the context of our audit of the financial statements as a whole, and in forming our opinion thereon, and we do not provide a separate opinion on these matters.
Independent Auditors’ Report to the Membersof Fauji Fertilizer Company Limited
Report on the Audit of Consolidated Financial Statements
281Annual Report 2018
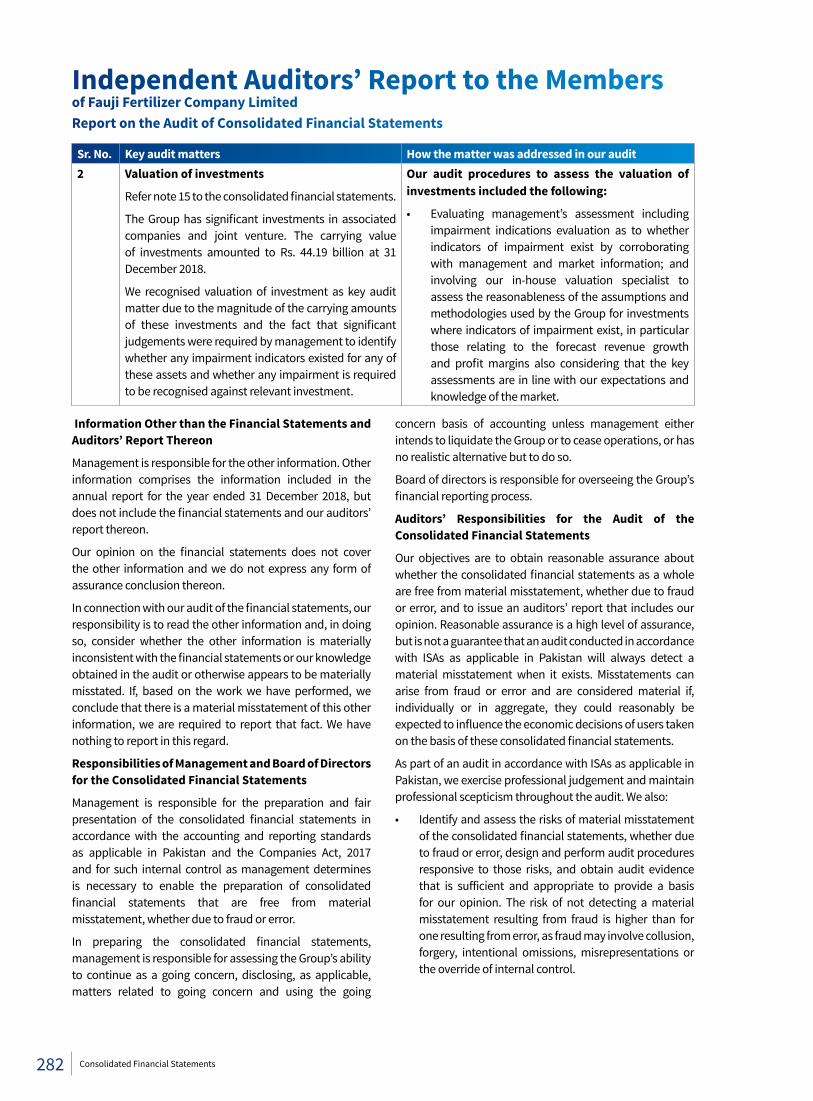
Sr. No. Key audit matters How the matter was addressed in our audit2 Valuation of investments
Refer note 15 to the consolidated financial statements.
The Group has significant investments in associated companies and joint venture. The carrying value of investments amounted to Rs. 44.19 billion at 31 December 2018.
We recognised valuation of investment as key audit matter due to the magnitude of the carrying amounts of these investments and the fact that significant judgements were required by management to identify whether any impairment indicators existed for any of these assets and whether any impairment is required to be recognised against relevant investment.
Our audit procedures to assess the valuation of investments included the following:
• Evaluating management’s assessment including impairment indications evaluation as to whether indicators of impairment exist by corroborating with management and market information; and involving our in-house valuation specialist to assess the reasonableness of the assumptions and methodologies used by the Group for investments where indicators of impairment exist, in particular those relating to the forecast revenue growth and profit margins also considering that the key assessments are in line with our expectations and knowledge of the market.
Information Other than the Financial Statements and Auditors’ Report Thereon
Management is responsible for the other information. Other information comprises the information included in the annual report for the year ended 31 December 2018, but does not include the financial statements and our auditors’ report thereon.
Our opinion on the financial statements does not cover the other information and we do not express any form of assurance conclusion thereon.
In connection with our audit of the financial statements, our responsibility is to read the other information and, in doing so, consider whether the other information is materially inconsistent with the financial statements or our knowledge obtained in the audit or otherwise appears to be materially misstated. If, based on the work we have performed, we conclude that there is a material misstatement of this other information, we are required to report that fact. We have nothing to report in this regard.
Responsibilities of Management and Board of Directors for the Consolidated Financial Statements
Management is responsible for the preparation and fair presentation of the consolidated financial statements in accordance with the accounting and reporting standards as applicable in Pakistan and the Companies Act, 2017 and for such internal control as management determines is necessary to enable the preparation of consolidated financial statements that are free from material misstatement, whether due to fraud or error.
In preparing the consolidated financial statements, management is responsible for assessing the Group’s ability to continue as a going concern, disclosing, as applicable, matters related to going concern and using the going
concern basis of accounting unless management either intends to liquidate the Group or to cease operations, or has no realistic alternative but to do so.
Board of directors is responsible for overseeing the Group’s financial reporting process.
Auditors’ Responsibilities for the Audit of the Consolidated Financial Statements
Our objectives are to obtain reasonable assurance about whether the consolidated financial statements as a whole are free from material misstatement, whether due to fraud or error, and to issue an auditors’ report that includes our opinion. Reasonable assurance is a high level of assurance, but is not a guarantee that an audit conducted in accordance with ISAs as applicable in Pakistan will always detect a material misstatement when it exists. Misstatements can arise from fraud or error and are considered material if, individually or in aggregate, they could reasonably be expected to influence the economic decisions of users taken on the basis of these consolidated financial statements.
As part of an audit in accordance with ISAs as applicable in Pakistan, we exercise professional judgement and maintain professional scepticism throughout the audit. We also:
• Identify and assess the risks of material misstatement of the consolidated financial statements, whether due to fraud or error, design and perform audit procedures responsive to those risks, and obtain audit evidence that is sufficient and appropriate to provide a basis for our opinion. The risk of not detecting a material misstatement resulting from fraud is higher than for one resulting from error, as fraud may involve collusion, forgery, intentional omissions, misrepresentations or the override of internal control.
Independent Auditors’ Report to the Membersof Fauji Fertilizer Company LimitedReport on the Audit of Consolidated Financial Statements
282 Consolidated Financial Statements
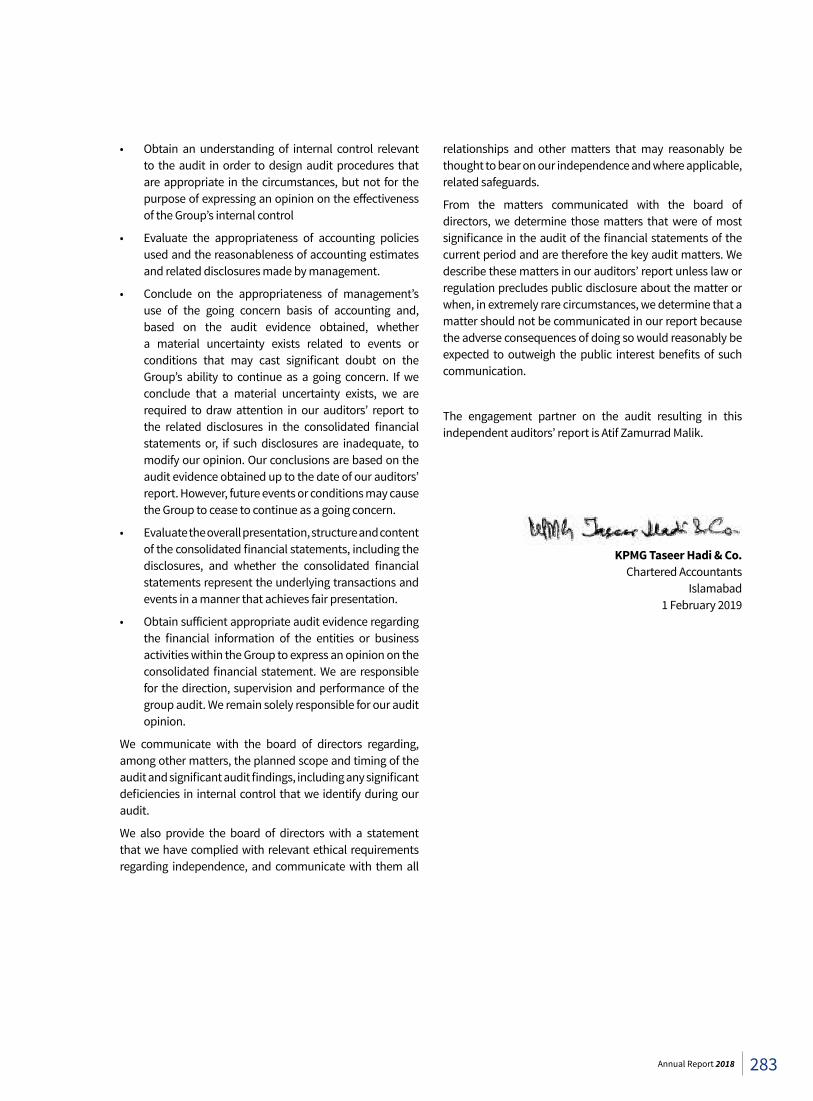
• Obtain an understanding of internal control relevant to the audit in order to design audit procedures that are appropriate in the circumstances, but not for the purpose of expressing an opinion on the effectiveness of the Group’s internal control
• Evaluate the appropriateness of accounting policies used and the reasonableness of accounting estimates and related disclosures made by management.
• Conclude on the appropriateness of management’s use of the going concern basis of accounting and, based on the audit evidence obtained, whether a material uncertainty exists related to events or conditions that may cast significant doubt on the Group’s ability to continue as a going concern. If we conclude that a material uncertainty exists, we are required to draw attention in our auditors’ report to the related disclosures in the consolidated financial statements or, if such disclosures are inadequate, to modify our opinion. Our conclusions are based on the audit evidence obtained up to the date of our auditors’ report. However, future events or conditions may cause the Group to cease to continue as a going concern.
• Evaluate the overall presentation, structure and content of the consolidated financial statements, including the disclosures, and whether the consolidated financial statements represent the underlying transactions and events in a manner that achieves fair presentation.
• Obtain sufficient appropriate audit evidence regarding the financial information of the entities or business activities within the Group to express an opinion on the consolidated financial statement. We are responsible for the direction, supervision and performance of the group audit. We remain solely responsible for our audit opinion.
We communicate with the board of directors regarding, among other matters, the planned scope and timing of the audit and significant audit findings, including any significant deficiencies in internal control that we identify during our audit.
We also provide the board of directors with a statement that we have complied with relevant ethical requirements regarding independence, and communicate with them all
relationships and other matters that may reasonably be thought to bear on our independence and where applicable, related safeguards.
From the matters communicated with the board of directors, we determine those matters that were of most significance in the audit of the financial statements of the current period and are therefore the key audit matters. We describe these matters in our auditors’ report unless law or regulation precludes public disclosure about the matter or when, in extremely rare circumstances, we determine that a matter should not be communicated in our report because the adverse consequences of doing so would reasonably be expected to outweigh the public interest benefits of such communication.
The engagement partner on the audit resulting in this independent auditors’ report is Atif Zamurrad Malik.
KPMG Taseer Hadi & Co. Chartered Accountants Islamabad 1 February 2019
283Annual Report 2018
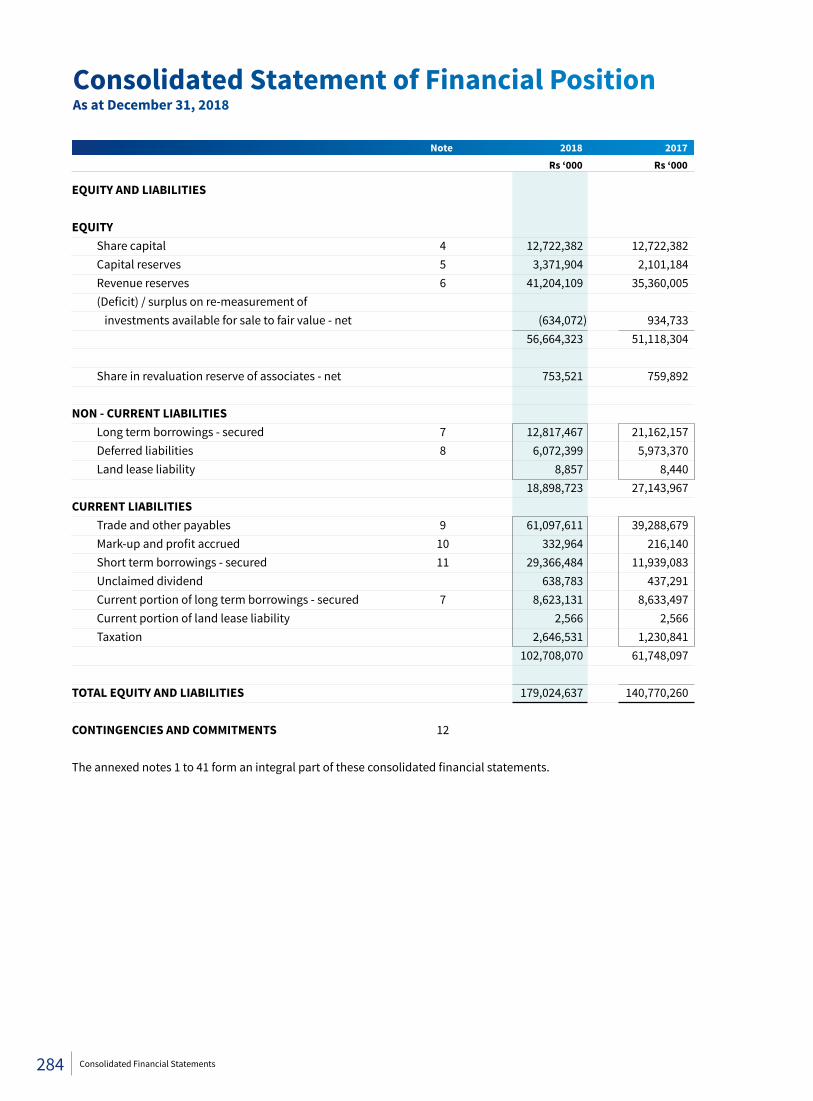
Note 2018 2017 Rs ‘000 Rs ‘000
EQUITY AND LIABILITIES EQUITY Share capital 4 12,722,382 12,722,382 Capital reserves 5 3,371,904 2,101,184 Revenue reserves 6 41,204,109 35,360,005 (Deficit) / surplus on re-measurement of investments available for sale to fair value - net (634,072) 934,733 56,664,323 51,118,304
Share in revaluation reserve of associates - net 753,521 759,892 NON - CURRENT LIABILITIES Long term borrowings - secured 7 12,817,467 21,162,157 Deferred liabilities 8 6,072,399 5,973,370 Land lease liability 8,857 8,440 18,898,723 27,143,967 CURRENT LIABILITIES Trade and other payables 9 61,097,611 39,288,679 Mark-up and profit accrued 10 332,964 216,140 Short term borrowings - secured 11 29,366,484 11,939,083 Unclaimed dividend 638,783 437,291 Current portion of long term borrowings - secured 7 8,623,131 8,633,497 Current portion of land lease liability 2,566 2,566 Taxation 2,646,531 1,230,841 102,708,070 61,748,097 TOTAL EQUITY AND LIABILITIES 179,024,637 140,770,260 CONTINGENCIES AND COMMITMENTS 12 The annexed notes 1 to 41 form an integral part of these consolidated financial statements.
Consolidated Statement of Financial PositionAs at December 31, 2018
284 Consolidated Financial Statements
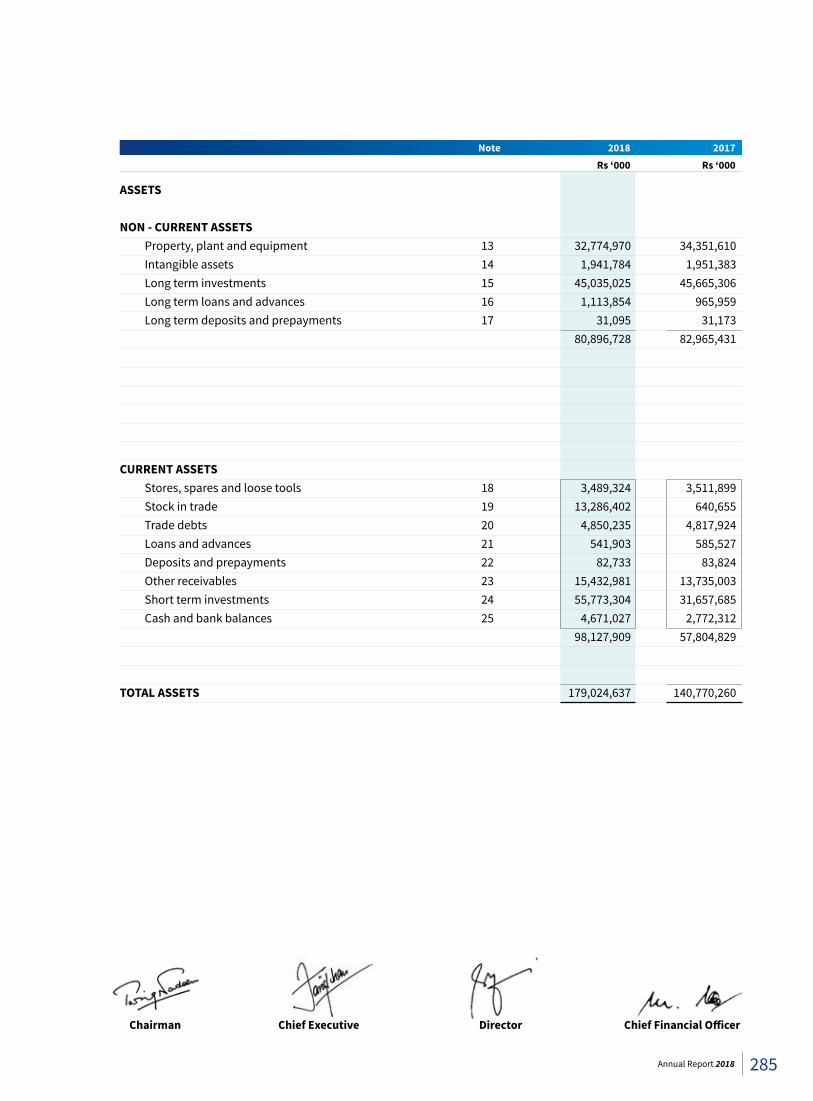
Note 2018 2017 Rs ‘000 Rs ‘000
ASSETS NON - CURRENT ASSETS Property, plant and equipment 13 32,774,970 34,351,610 Intangible assets 14 1,941,784 1,951,383 Long term investments 15 45,035,025 45,665,306 Long term loans and advances 16 1,113,854 965,959 Long term deposits and prepayments 17 31,095 31,173 80,896,728 82,965,431
CURRENT ASSETS Stores, spares and loose tools 18 3,489,324 3,511,899 Stock in trade 19 13,286,402 640,655 Trade debts 20 4,850,235 4,817,924 Loans and advances 21 541,903 585,527 Deposits and prepayments 22 82,733 83,824 Other receivables 23 15,432,981 13,735,003 Short term investments 24 55,773,304 31,657,685 Cash and bank balances 25 4,671,027 2,772,312 98,127,909 57,804,829 TOTAL ASSETS 179,024,637 140,770,260
Chairman ChiefExecutive Director ChiefFinancialOfficer
285Annual Report 2018
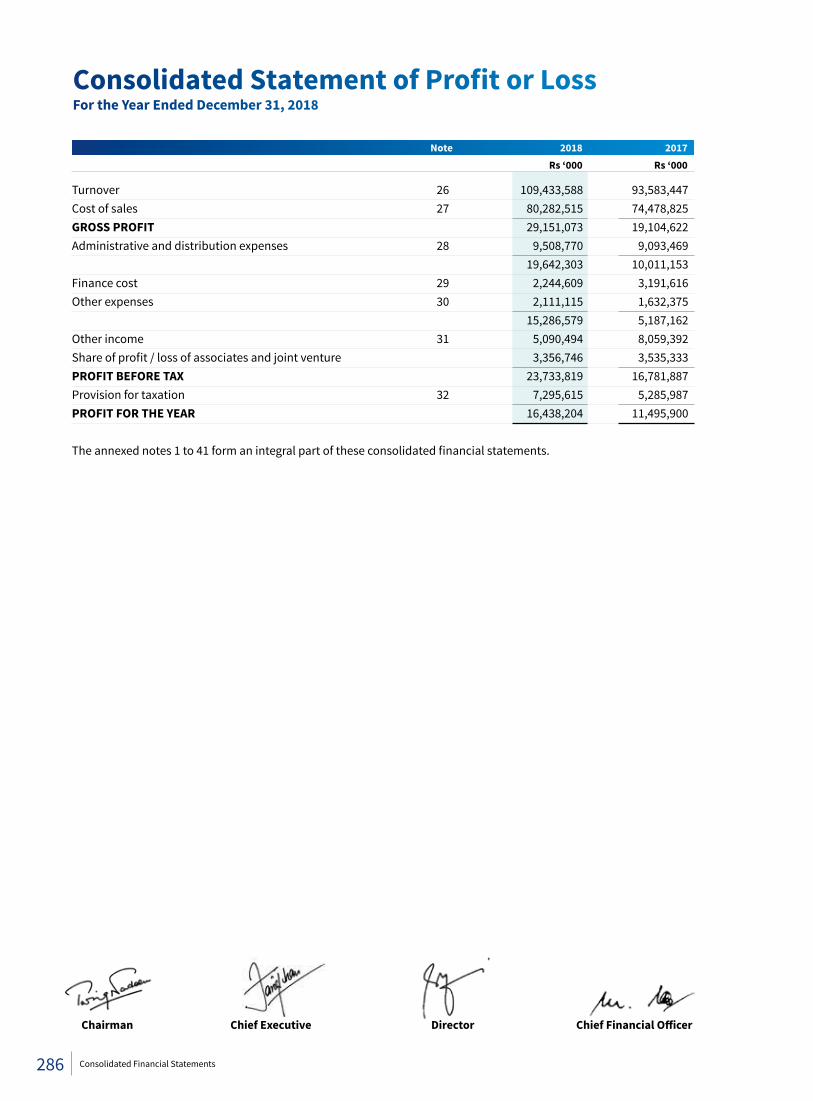
Note 2018 2017 Rs ‘000 Rs ‘000
Turnover 26 109,433,588 93,583,447 Cost of sales 27 80,282,515 74,478,825 GROSS PROFIT 29,151,073 19,104,622 Administrative and distribution expenses 28 9,508,770 9,093,469 19,642,303 10,011,153 Finance cost 29 2,244,609 3,191,616 Other expenses 30 2,111,115 1,632,375 15,286,579 5,187,162 Other income 31 5,090,494 8,059,392 Share of profit / loss of associates and joint venture 3,356,746 3,535,333 PROFIT BEFORE TAX 23,733,819 16,781,887 Provision for taxation 32 7,295,615 5,285,987 PROFIT FOR THE YEAR 16,438,204 11,495,900 The annexed notes 1 to 41 form an integral part of these consolidated financial statements.
Chairman ChiefExecutive Director ChiefFinancialOfficer
ConsolidatedStatementofProfitorLossFor the Year Ended December 31, 2018
286 Consolidated Financial Statements
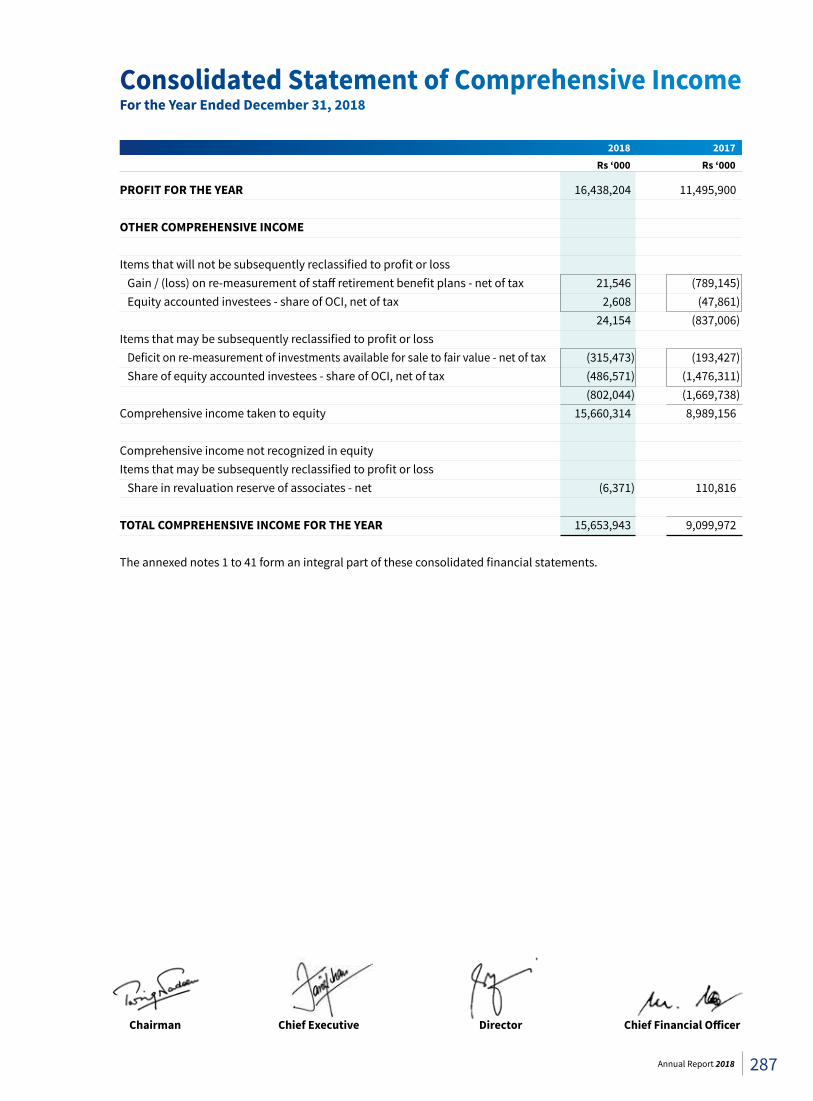
Consolidated Statement of Comprehensive IncomeFor the Year Ended December 31, 2018
2018 2017 Rs ‘000 Rs ‘000
PROFIT FOR THE YEAR 16,438,204 11,495,900 OTHER COMPREHENSIVE INCOME Items that will not be subsequently reclassified to profit or loss Gain / (loss) on re-measurement of staff retirement benefit plans - net of tax 21,546 (789,145) Equity accounted investees - share of OCI, net of tax 2,608 (47,861) 24,154 (837,006)Items that may be subsequently reclassified to profit or loss Deficit on re-measurement of investments available for sale to fair value - net of tax (315,473) (193,427) Share of equity accounted investees - share of OCI, net of tax (486,571) (1,476,311) (802,044) (1,669,738)Comprehensive income taken to equity 15,660,314 8,989,156 Comprehensive income not recognized in equity Items that may be subsequently reclassified to profit or loss Share in revaluation reserve of associates - net (6,371) 110,816 TOTAL COMPREHENSIVE INCOME FOR THE YEAR 15,653,943 9,099,972 The annexed notes 1 to 41 form an integral part of these consolidated financial statements.
Chairman ChiefExecutive Director ChiefFinancialOfficer
287Annual Report 2018
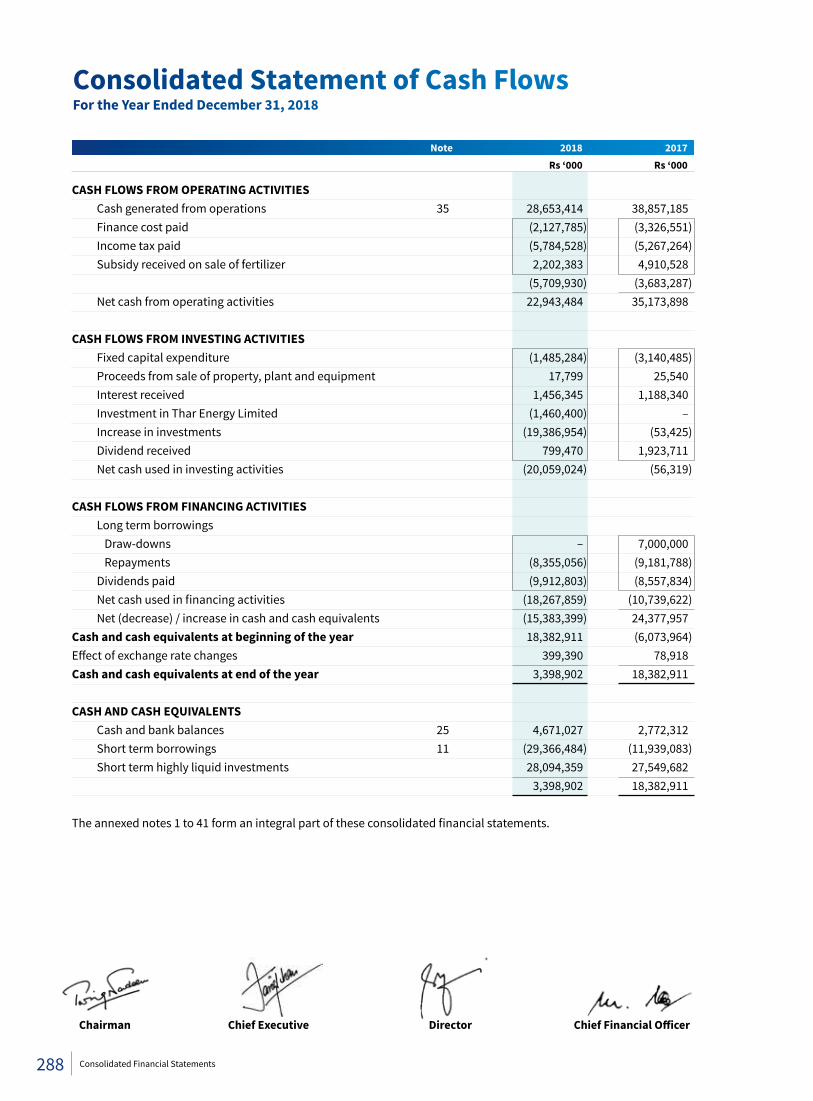
Note 2018 2017 Rs ‘000 Rs ‘000
CASH FLOWS FROM OPERATING ACTIVITIES Cash generated from operations 35 28,653,414 38,857,185 Finance cost paid (2,127,785) (3,326,551) Income tax paid (5,784,528) (5,267,264) Subsidy received on sale of fertilizer 2,202,383 4,910,528 (5,709,930) (3,683,287) Net cash from operating activities 22,943,484 35,173,898 CASH FLOWS FROM INVESTING ACTIVITIES Fixed capital expenditure (1,485,284) (3,140,485) Proceeds from sale of property, plant and equipment 17,799 25,540 Interest received 1,456,345 1,188,340 Investment in Thar Energy Limited (1,460,400) – Increase in investments (19,386,954) (53,425) Dividend received 799,470 1,923,711 Net cash used in investing activities (20,059,024) (56,319) CASH FLOWS FROM FINANCING ACTIVITIES Long term borrowings Draw-downs – 7,000,000 Repayments (8,355,056) (9,181,788) Dividends paid (9,912,803) (8,557,834) Net cash used in financing activities (18,267,859) (10,739,622) Net (decrease) / increase in cash and cash equivalents (15,383,399) 24,377,957 Cash and cash equivalents at beginning of the year 18,382,911 (6,073,964)Effect of exchange rate changes 399,390 78,918 Cash and cash equivalents at end of the year 3,398,902 18,382,911 CASH AND CASH EQUIVALENTS Cash and bank balances 25 4,671,027 2,772,312 Short term borrowings 11 (29,366,484) (11,939,083) Short term highly liquid investments 28,094,359 27,549,682 3,398,902 18,382,911
The annexed notes 1 to 41 form an integral part of these consolidated financial statements.
Chairman ChiefExecutive Director ChiefFinancialOfficer
Consolidated Statement of Cash FlowsFor the Year Ended December 31, 2018
288 Consolidated Financial Statements
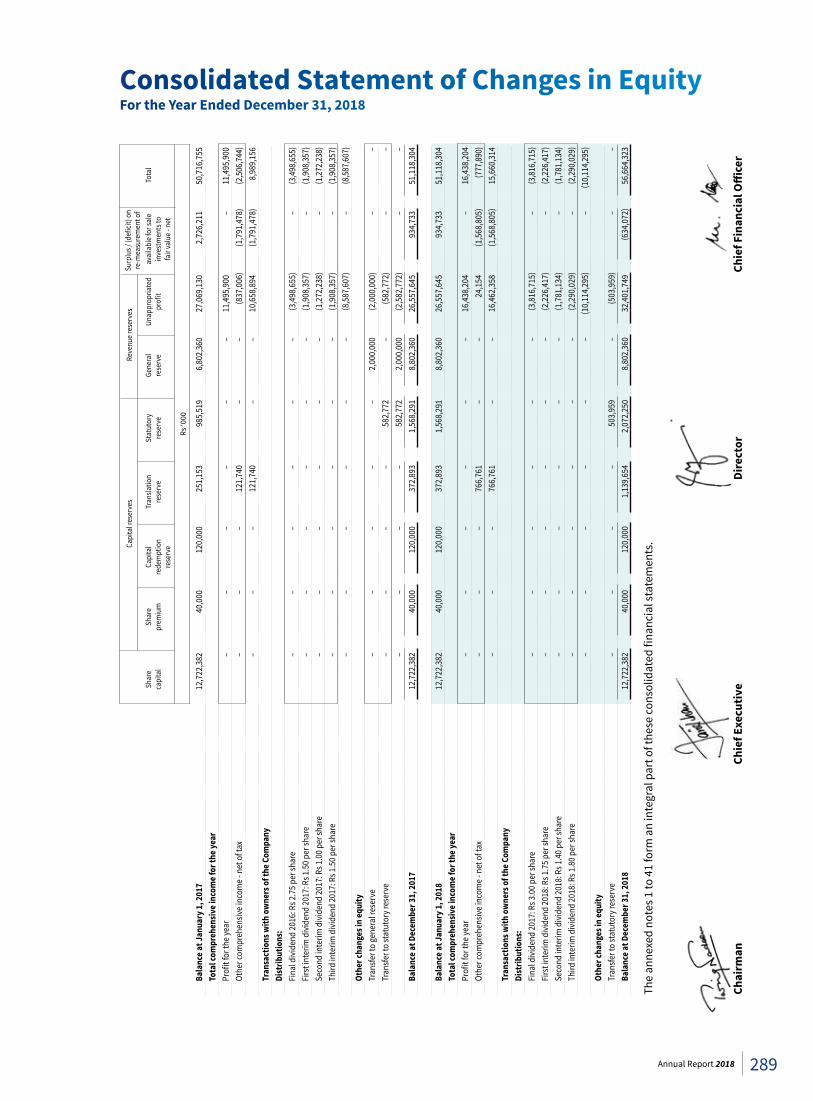
Ca
pita
l res
erve
s Re
venu
e res
erve
s
re-m
easu
rem
ent o
f
Shar
e Sh
are
Capi
tal
Tran
slatio
n
Stat
utor
y Ge
nera
l Un
appr
opria
ted
avai
labl
e for
sale
To
tal
capi
tal
prem
ium
re
dem
ptio
n re
serv
e re
serv
e re
serv
e pr
ofit
inve
stm
ents
to
rese
rve
fair
valu
e - n
et
Rs
‘000
Ba
lanc
e at J
anua
ry 1,
2017
12,7
22,3
82
40,0
00
120,
000
251,
153
985,
519
6,80
2,36
0 27
,069
,130
2,
726,
211
50,7
16,7
55
To
tal c
ompr
ehen
sive i
ncom
e for
the y
ear
Profi
t for
the y
ear
–
–
–
–
–
–
11
,495
,900
–
11
,495
,900
Othe
r com
preh
ensiv
e inc
ome -
net
of t
ax
–
–
–
12
1,74
0 –
–
(8
37,0
06)
(1,7
91,4
78)
(2,5
06,7
44)
–
–
–
12
1,74
0 –
–
10
,658
,894
(1
,791
,478
) 8,
989,
156
Tr
ansa
ctio
ns w
ith o
wne
rs o
f the
Com
pany
Di
strib
utio
ns:
Fina
l divi
dend
2016
: Rs 2
.75 p
er sh
are
–
–
–
–
–
–
(3
,498
,655
) –
(3,4
98,6
55)
Fi
rst i
nter
im d
ivide
nd 20
17: R
s 1.5
0 per
shar
e
–
–
–
–
–
–
(1,9
08,3
57)
– (1
,908
,357
)
Seco
nd in
terim
divi
dend
2017
: Rs 1
.00 p
er sh
are
–
–
–
–
–
–
(1
,272
,238
) –
(1,2
72,2
38)
Th
ird in
terim
divi
dend
2017
: Rs 1
.50 p
er sh
are
–
–
–
–
–
–
(1
,908
,357
) –
(1
,908
,357
)
–
–
–
–
–
–
(8,5
87,6
07)
– (8
,587
,607
)
Othe
r cha
nges
in eq
uity
Tr
ansfe
r to
gene
ral r
eser
ve
–
–
–
–
–
2,00
0,00
0 (2
,000
,000
) –
–
Tr
ansfe
r to
stat
utor
y res
erve
–
–
–
–
582,
772
–
(582
,772
) –
–
–
–
–
–
58
2,77
2 2,
000,
000
(2,5
82,7
72)
–
–
Bala
nce a
t Dec
embe
r 31,
2017
12,7
22,3
82
40,0
00
120,
000
372,
893
1,56
8,29
1 8,
802,
360
26,5
57,6
45
934,
733
51,1
18,3
04
Ba
lanc
e at J
anua
ry 1,
2018
12,7
22,3
82
40,0
00
120,
000
372,
893
1,56
8,29
1 8,
802,
360
26,5
57,6
45
934,
733
51,1
18,3
04
To
tal c
ompr
ehen
sive i
ncom
e for
the y
ear
Profi
t for
the y
ear
–
–
–
–
–
–
16
,438
,204
–
16
,438
,204
Othe
r com
preh
ensiv
e inc
ome -
net
of t
ax
–
–
–
76
6,76
1 –
–
24
,154
(1
,568
,805
) (7
77,8
90)
–
–
–
76
6,76
1 –
–
16
,462
,358
(1
,568
,805
) 15
,660
,314
Tran
sact
ions
with
ow
ners
of t
he C
ompa
ny
Dist
ribut
ions
:
Fi
nal d
ivide
nd 20
17: R
s 3.0
0 per
shar
e
–
–
–
–
–
–
(3,8
16,7
15)
–
(3,8
16,7
15)
Fi
rst i
nter
im d
ivide
nd 20
18: R
s 1.7
5 per
shar
e
–
–
–
–
–
–
(2,2
26,4
17)
– (2
,226
,417
)
Seco
nd in
terim
divi
dend
2018
: Rs 1
.40 p
er sh
are
–
–
–
–
–
–
(1
,781
,134
) –
(1,7
81,1
34)
Th
ird in
terim
divi
dend
2018
: Rs 1
.80 p
er sh
are
–
–
–
–
–
–
(2
,290
,029
) –
(2,2
90,0
29)
–
–
–
–
–
–
(1
0,11
4,29
5)
– (1
0,11
4,29
5)
Othe
r cha
nges
in eq
uity
Tr
ansfe
r to
stat
utor
y res
erve
–
–
–
–
503,
959
–
(503
,959
) –
–
Bala
nce a
t Dec
embe
r 31,
2018
12,7
22,3
82
40,0
00
120,
000
1,13
9,65
4 2,
072,
250
8,80
2,36
0 32
,401
,749
(6
34,0
72)
56,6
64,3
23
The
anne
xed
note
s 1 to
41
form
an
inte
gral
par
t of t
hese
cons
olid
ated
fina
ncia
l sta
tem
ents
.
Chairm
an
ChiefE
xecu
tive
Director
Ch
iefF
inan
cialOffice
r
Surp
lus /
(defi
cit) o
n
Consolidated Statement of Changes in EquityFor the Year Ended December 31, 2018
289Annual Report 2018
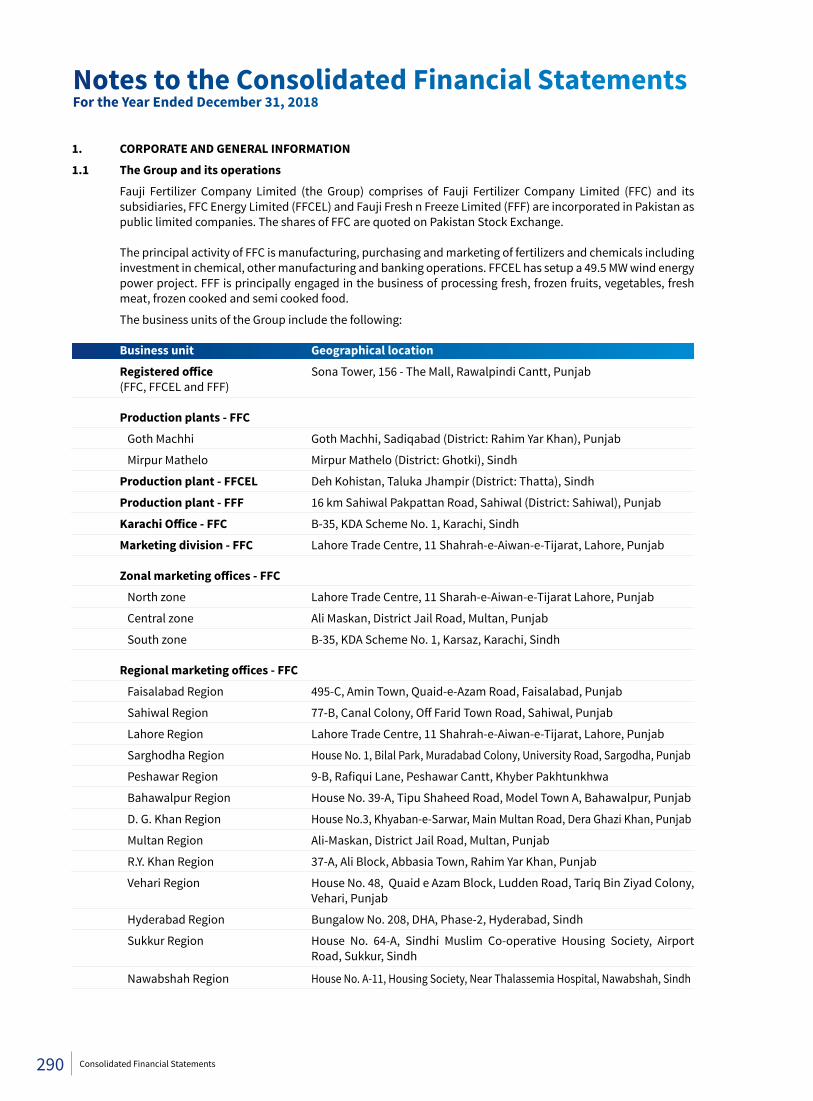
1. CORPORATE AND GENERAL INFORMATION
1.1 The Group and its operations
Fauji Fertilizer Company Limited (the Group) comprises of Fauji Fertilizer Company Limited (FFC) and its subsidiaries, FFC Energy Limited (FFCEL) and Fauji Fresh n Freeze Limited (FFF) are incorporated in Pakistan as public limited companies. The shares of FFC are quoted on Pakistan Stock Exchange.
The principal activity of FFC is manufacturing, purchasing and marketing of fertilizers and chemicals including
investment in chemical, other manufacturing and banking operations. FFCEL has setup a 49.5 MW wind energy power project. FFF is principally engaged in the business of processing fresh, frozen fruits, vegetables, fresh meat, frozen cooked and semi cooked food.
The business units of the Group include the following:
Business unit Geographical location
Registeredoffice Sona Tower, 156 - The Mall, Rawalpindi Cantt, Punjab (FFC, FFCEL and FFF) Production plants - FFC
Goth Machhi Goth Machhi, Sadiqabad (District: Rahim Yar Khan), Punjab
Mirpur Mathelo Mirpur Mathelo (District: Ghotki), Sindh
Production plant - FFCEL Deh Kohistan, Taluka Jhampir (District: Thatta), Sindh
Production plant - FFF 16 km Sahiwal Pakpattan Road, Sahiwal (District: Sahiwal), Punjab
KarachiOffice - FFC B-35, KDA Scheme No. 1, Karachi, Sindh
Marketing division - FFC Lahore Trade Centre, 11 Shahrah-e-Aiwan-e-Tijarat, Lahore, Punjab Zonalmarketingoffices-FFC
North zone Lahore Trade Centre, 11 Sharah-e-Aiwan-e-Tijarat Lahore, Punjab
Central zone Ali Maskan, District Jail Road, Multan, Punjab
South zone B-35, KDA Scheme No. 1, Karsaz, Karachi, Sindh Regionalmarketingoffices-FFC
Faisalabad Region 495-C, Amin Town, Quaid-e-Azam Road, Faisalabad, Punjab
Sahiwal Region 77-B, Canal Colony, Off Farid Town Road, Sahiwal, Punjab
Lahore Region Lahore Trade Centre, 11 Shahrah-e-Aiwan-e-Tijarat, Lahore, Punjab
Sarghodha Region House No. 1, Bilal Park, Muradabad Colony, University Road, Sargodha, Punjab
Peshawar Region 9-B, Rafiqui Lane, Peshawar Cantt, Khyber Pakhtunkhwa
Bahawalpur Region House No. 39-A, Tipu Shaheed Road, Model Town A, Bahawalpur, Punjab
D. G. Khan Region House No.3, Khyaban-e-Sarwar, Main Multan Road, Dera Ghazi Khan, Punjab
Multan Region Ali-Maskan, District Jail Road, Multan, Punjab
R.Y. Khan Region 37-A, Ali Block, Abbasia Town, Rahim Yar Khan, Punjab
Vehari Region House No. 48, Quaid e Azam Block, Ludden Road, Tariq Bin Ziyad Colony, Vehari, Punjab
Hyderabad Region Bungalow No. 208, DHA, Phase-2, Hyderabad, Sindh
Sukkur Region House No. 64-A, Sindhi Muslim Co-operative Housing Society, Airport Road, Sukkur, Sindh
Nawabshah Region House No. A-11, Housing Society, Near Thalassemia Hospital, Nawabshah, Sindh
Notes to the Consolidated Financial StatementsFor the Year Ended December 31, 2018
290 Consolidated Financial Statements
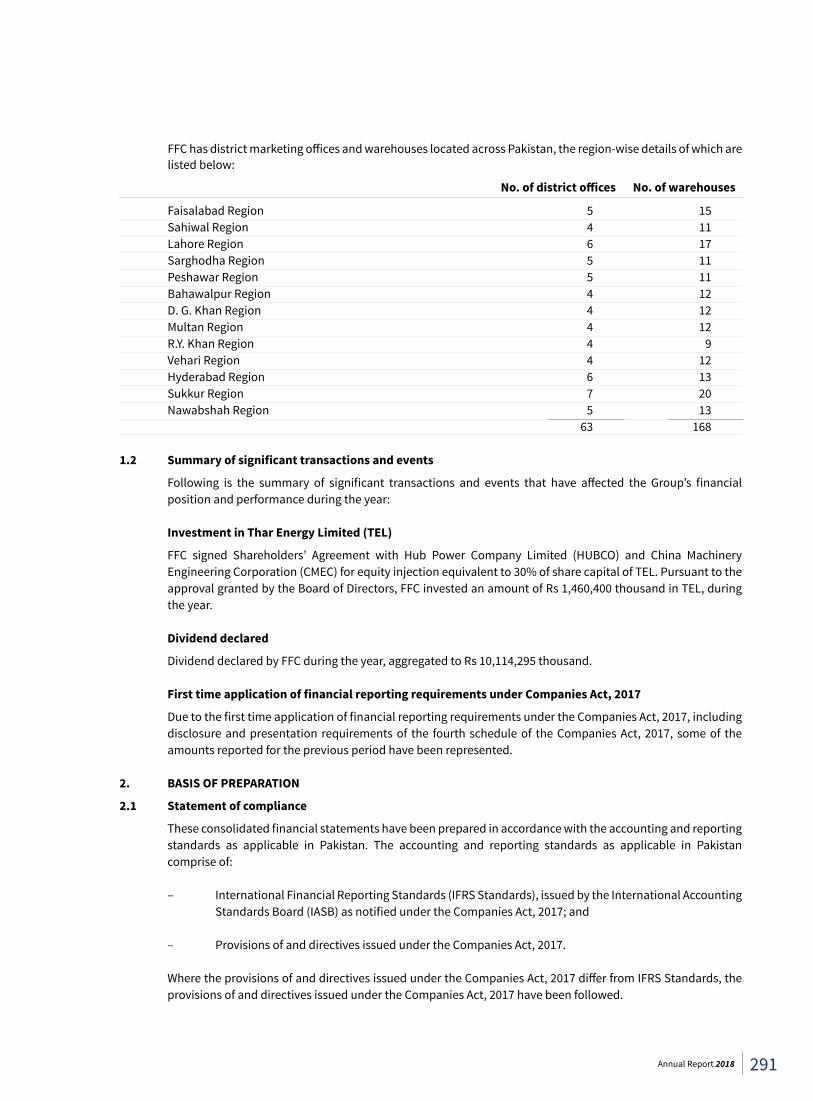
FFC has district marketing offices and warehouses located across Pakistan, the region-wise details of which are listed below:
No.ofdistrictoffices No.ofwarehouses
Faisalabad Region 5 15 Sahiwal Region 4 11 Lahore Region 6 17 Sarghodha Region 5 11 Peshawar Region 5 11 Bahawalpur Region 4 12 D. G. Khan Region 4 12 Multan Region 4 12 R.Y. Khan Region 4 9 Vehari Region 4 12 Hyderabad Region 6 13 Sukkur Region 7 20 Nawabshah Region 5 13 63 168 1.2 Summaryofsignificanttransactionsandevents
Following is the summary of significant transactions and events that have affected the Group’s financial position and performance during the year:
Investment in Thar Energy Limited (TEL)
FFC signed Shareholders’ Agreement with Hub Power Company Limited (HUBCO) and China Machinery Engineering Corporation (CMEC) for equity injection equivalent to 30% of share capital of TEL. Pursuant to the approval granted by the Board of Directors, FFC invested an amount of Rs 1,460,400 thousand in TEL, during the year.
Dividend declared
Dividend declared by FFC during the year, aggregated to Rs 10,114,295 thousand. FirsttimeapplicationoffinancialreportingrequirementsunderCompaniesAct,2017
Due to the first time application of financial reporting requirements under the Companies Act, 2017, including disclosure and presentation requirements of the fourth schedule of the Companies Act, 2017, some of the amounts reported for the previous period have been represented.
2. BASIS OF PREPARATION
2.1 Statement of compliance
These consolidated financial statements have been prepared in accordance with the accounting and reporting standards as applicable in Pakistan. The accounting and reporting standards as applicable in Pakistan comprise of:
– International Financial Reporting Standards (IFRS Standards), issued by the International Accounting Standards Board (IASB) as notified under the Companies Act, 2017; and
– Provisions of and directives issued under the Companies Act, 2017.
Where the provisions of and directives issued under the Companies Act, 2017 differ from IFRS Standards, the provisions of and directives issued under the Companies Act, 2017 have been followed.
291Annual Report 2018
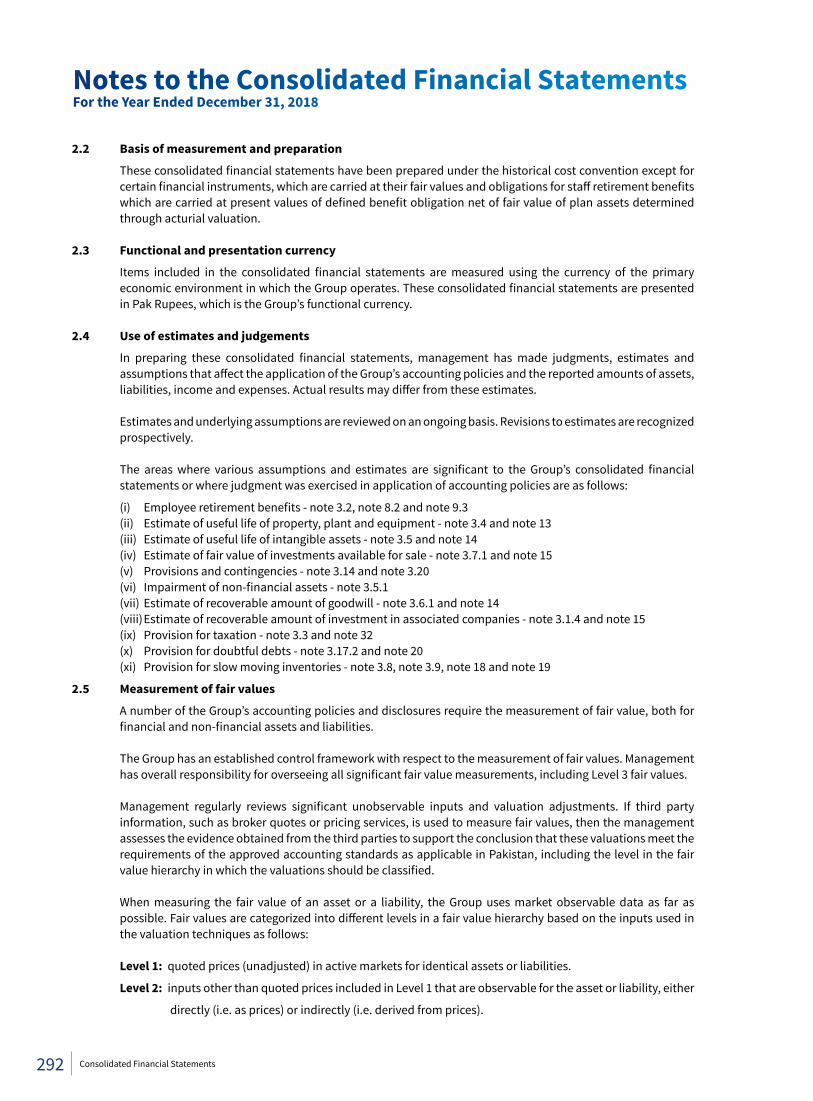
2.2 Basis of measurement and preparation
These consolidated financial statements have been prepared under the historical cost convention except for certain financial instruments, which are carried at their fair values and obligations for staff retirement benefits which are carried at present values of defined benefit obligation net of fair value of plan assets determined through acturial valuation.
2.3 Functional and presentation currency
Items included in the consolidated financial statements are measured using the currency of the primary economic environment in which the Group operates. These consolidated financial statements are presented in Pak Rupees, which is the Group’s functional currency.
2.4 Use of estimates and judgements
In preparing these consolidated financial statements, management has made judgments, estimates and assumptions that affect the application of the Group’s accounting policies and the reported amounts of assets, liabilities, income and expenses. Actual results may differ from these estimates.
Estimates and underlying assumptions are reviewed on an ongoing basis. Revisions to estimates are recognized prospectively.
The areas where various assumptions and estimates are significant to the Group’s consolidated financial statements or where judgment was exercised in application of accounting policies are as follows:
(i) Employee retirement benefits - note 3.2, note 8.2 and note 9.3 (ii) Estimate of useful life of property, plant and equipment - note 3.4 and note 13 (iii) Estimate of useful life of intangible assets - note 3.5 and note 14 (iv) Estimate of fair value of investments available for sale - note 3.7.1 and note 15 (v) Provisions and contingencies - note 3.14 and note 3.20 (vi) Impairment of non-financial assets - note 3.5.1 (vii) Estimate of recoverable amount of goodwill - note 3.6.1 and note 14 (viii) Estimate of recoverable amount of investment in associated companies - note 3.1.4 and note 15 (ix) Provision for taxation - note 3.3 and note 32 (x) Provision for doubtful debts - note 3.17.2 and note 20 (xi) Provision for slow moving inventories - note 3.8, note 3.9, note 18 and note 19
2.5 Measurement of fair values
A number of the Group’s accounting policies and disclosures require the measurement of fair value, both for financial and non-financial assets and liabilities.
The Group has an established control framework with respect to the measurement of fair values. Management
has overall responsibility for overseeing all significant fair value measurements, including Level 3 fair values. Management regularly reviews significant unobservable inputs and valuation adjustments. If third party
information, such as broker quotes or pricing services, is used to measure fair values, then the management assesses the evidence obtained from the third parties to support the conclusion that these valuations meet the requirements of the approved accounting standards as applicable in Pakistan, including the level in the fair value hierarchy in which the valuations should be classified.
When measuring the fair value of an asset or a liability, the Group uses market observable data as far as
possible. Fair values are categorized into different levels in a fair value hierarchy based on the inputs used in the valuation techniques as follows:
Level 1: quoted prices (unadjusted) in active markets for identical assets or liabilities.
Level 2: inputs other than quoted prices included in Level 1 that are observable for the asset or liability, either
directly (i.e. as prices) or indirectly (i.e. derived from prices).
Notes to the Consolidated Financial StatementsFor the Year Ended December 31, 2018
292 Consolidated Financial Statements
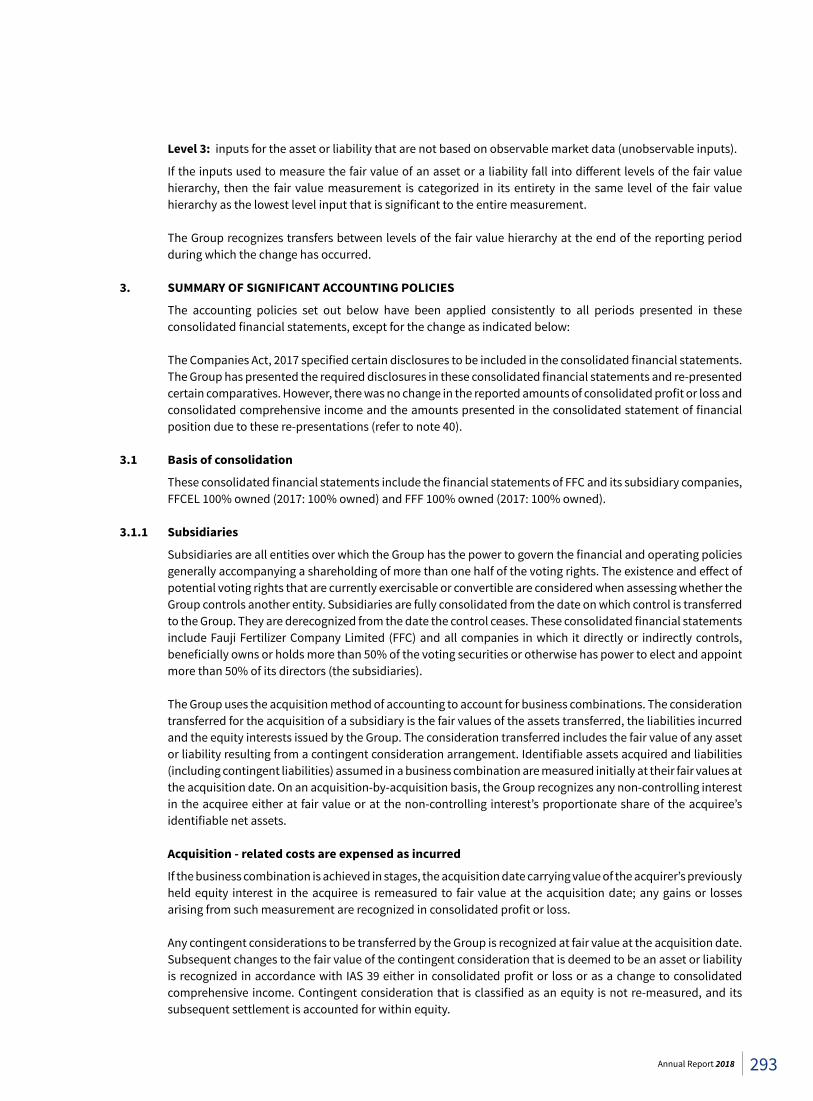
Level 3: inputs for the asset or liability that are not based on observable market data (unobservable inputs).
If the inputs used to measure the fair value of an asset or a liability fall into different levels of the fair value hierarchy, then the fair value measurement is categorized in its entirety in the same level of the fair value hierarchy as the lowest level input that is significant to the entire measurement.
The Group recognizes transfers between levels of the fair value hierarchy at the end of the reporting period
during which the change has occurred. 3. SUMMARY OF SIGNIFICANT ACCOUNTING POLICIES
The accounting policies set out below have been applied consistently to all periods presented in these consolidated financial statements, except for the change as indicated below:
The Companies Act, 2017 specified certain disclosures to be included in the consolidated financial statements.
The Group has presented the required disclosures in these consolidated financial statements and re-presented certain comparatives. However, there was no change in the reported amounts of consolidated profit or loss and consolidated comprehensive income and the amounts presented in the consolidated statement of financial position due to these re-presentations (refer to note 40).
3.1 Basis of consolidation
These consolidated financial statements include the financial statements of FFC and its subsidiary companies, FFCEL 100% owned (2017: 100% owned) and FFF 100% owned (2017: 100% owned).
3.1.1 Subsidiaries
Subsidiaries are all entities over which the Group has the power to govern the financial and operating policies generally accompanying a shareholding of more than one half of the voting rights. The existence and effect of potential voting rights that are currently exercisable or convertible are considered when assessing whether the Group controls another entity. Subsidiaries are fully consolidated from the date on which control is transferred to the Group. They are derecognized from the date the control ceases. These consolidated financial statements include Fauji Fertilizer Company Limited (FFC) and all companies in which it directly or indirectly controls, beneficially owns or holds more than 50% of the voting securities or otherwise has power to elect and appoint more than 50% of its directors (the subsidiaries).
The Group uses the acquisition method of accounting to account for business combinations. The consideration transferred for the acquisition of a subsidiary is the fair values of the assets transferred, the liabilities incurred and the equity interests issued by the Group. The consideration transferred includes the fair value of any asset or liability resulting from a contingent consideration arrangement. Identifiable assets acquired and liabilities (including contingent liabilities) assumed in a business combination are measured initially at their fair values at the acquisition date. On an acquisition-by-acquisition basis, the Group recognizes any non-controlling interest in the acquiree either at fair value or at the non-controlling interest’s proportionate share of the acquiree’s identifiable net assets.
Acquisition - related costs are expensed as incurred
If the business combination is achieved in stages, the acquisition date carrying value of the acquirer’s previously held equity interest in the acquiree is remeasured to fair value at the acquisition date; any gains or losses arising from such measurement are recognized in consolidated profit or loss.
Any contingent considerations to be transferred by the Group is recognized at fair value at the acquisition date.
Subsequent changes to the fair value of the contingent consideration that is deemed to be an asset or liability is recognized in accordance with IAS 39 either in consolidated profit or loss or as a change to consolidated comprehensive income. Contingent consideration that is classified as an equity is not re-measured, and its subsequent settlement is accounted for within equity.
293Annual Report 2018
Inter-company transactions, balances and unrealized gains on transactions between Group companies are eliminated. Unrealized losses are also eliminated. When necessary, amounts reported by subsidiaries have been adjusted to conform with the Group’s accounting policies.
3.1.2 Changes in ownership interests in subsidiaries without change of control
Transactions with non-controlling interests that do not result in loss of control are accounted for as equity transactions, that is, as transactions with the owners in their capacity as owners. The difference between fair value of any consideration paid and the relevant share acquired of the carrying value of net assets of the subsidiary is recorded in equity. Gains or losses on disposals to non-controlling interests are also recorded in equity.
3.1.3 Disposal of subsidiaries
When the Group ceases to have control or significant influence, any retained interest in the entity is premeasured to its fair value, with the change in carrying amount recognized in consolidated profit or loss. The fair value is the initial carrying amount for the purposes of subsequently accounting for the retained interest as an associate, joint venture or financial asset. In addition, any amounts previously recognized in consolidated comprehensive income in respect of that entity are accounted for as if the Group had directly disposed off the related assets or liabilities. This means that amounts previously recognized in consolidated comprehensive income are reclassified to consolidated profit or loss.
3.1.4 Investments in associated and jointly control entities (equity accounted investees)
Associates are those entities in which the Group has significant influence, but not control, over the financial and operating policies. Joint ventures are those entities over whose activities the Group has joint control, where by the Group has right to the net assets of the arrangement, rather than right to its assets and obligations for its liabilities, established by contractual agreement and requiring unanimous consent for strategic financial and operating decisions.
Interests in associates and the joint venture are accounted for using the equity method. They are initially
recognized at cost, which includes transaction costs. Subsequent to initial recognition, the consolidated financial statements include the Group’s share of the consolidated profit or loss and consolidated comprehensive income of equity accounted investees, until the date on which significant influence or joint control ceases.
Unrealized gains arising from transactions with equity accounted investees are eliminated against the
investment to the extent of the Group’s interest in the investee. Unrealized losses are eliminated in the same way as unrealized gains, but only to the extent that there is no evidence of impairment.
3.2 Employeeretirementbenefits
3.2.1 Definedbenefitplans
Funded Gratuity and Pension Schemes
The Group operates defined benefit funded gratuity and pension schemes for all eligible employees who complete qualifying period of service and age.
These funds are administered by trustees. Annual contributions to the gratuity and management staff pension
funds are based on actuarial valuation using Projected Unit Credit Method, related details of which are given in note 9.3 to these consolidated financial statements.
Charge for the year is recognized in consolidated profit or loss. Actuarial gain or loss arising on actuarial
valuation are recorded directly in the consolidated comprehensive income.
Calculation of gratuity and pension requires assumptions to be made of future outcomes which mainly include increase in remuneration, expected long-term return on plan assets and the discount rate used to convert future cash flows to current values. Calculations are sensitive to changes in the underlying assumptions.
Notes to the Consolidated Financial StatementsFor the Year Ended December 31, 2018
294 Consolidated Financial Statements
3.2.2 Definedcontributionplan
Provident Fund
Defined contribution provident fund for all eligible employees for which the Group’s contributions are charged to consolidated profit or loss at the rate of 10% of basic salary.
3.2.3 Compensated absences
The Group has the policy to provide for compensated absences of its employees in accordance with respective entitlement on cessation of service; related expected cost thereof has been included in the consolidated financial statements.
3.3 Taxation
Income tax expense comprises current and deferred tax. Current tax
Provision for current taxation is based on taxable income at the applicable rates of taxation after taking into account tax credits and tax rebates, if any. Income tax expense is recognized in consolidated profit or loss except to the extent that it relates to items recognized directly in equity or in consolidated comprehensive income.
Deferred tax
Deferred tax is accounted for using the balance sheet liability method in respect of temporary differences arising from differences between the carrying amount of assets and liabilities in the consolidated financial statements and the corresponding tax bases used in the computation of taxable profit. Deferred tax liabilities are recognized for all taxable temporary differences and deferred tax assets are recognized to the extent that it is probable that taxable profits will be available against which the deductible temporary differences, unused tax losses and tax credits can be utilized. Deferred tax assets are reviewed at each reporting date and are reduced to the extent that it is no longer probable that the related tax benefit will be realized. Deferred tax is not recognized on temporary differences arising from the initial recognition of assets or liabilities in a transaction that is not a business combination and that affects neither accounting nor taxable profit or loss, and differences arising on the initial recognition of goodwill.
Deferred tax is not recognized on temporary differences arising from the initial recognition of assets or liabilities
in a transaction that is not a business combination and that affects neither accounting nor taxable profit or loss, and differences relating to investment in jointly controlled entities to the extent that it is probable that they will not reverse in a foreseeable future. In addition, deferred tax is not recognized for taxable temporary differences arising on the initial recognition of goodwill.
Deferred tax is calculated at the rates that are expected to apply to the period when the differences reverse,
based on tax rates that have been enacted. Deferred tax assets and liabilities are offset if there is a legally enforceable right to offset current tax liabilities and assets, and they relate to income taxes levied by the same tax authority on the same taxable entity, or on different tax entities, but they intend to settle current tax liabilities and assets on a net basis or their tax assets and liabilities will be realized simultaneously.
The Group companies take into account the current income tax law and decisions taken by the taxation
authorities. Instances where the Group companies view differ from the income tax department at the assessment stage and where the Group companies consider that their view on items of material nature is in accordance with law, the amounts are shown as contingent liabilities.
3.4 Property, plant and equipment and capital work in progress
Property, plant and equipment are stated at cost less accumulated depreciation and any impairment loss, except for freehold land and capital work in progress, which are stated at cost less impairment, if any. Cost comprises acquisition and other directly attributable costs.
295Annual Report 2018
Depreciation is provided on the straight-line basis and charged to consolidated profit or loss to write off the depreciable amount of each asset over its estimated useful life at the rates specified in note 13. Depreciation on addition in property, plant and equipment is charged from the date when the asset becomes available for use upto the date of its disposal.
The cost of replacing part of an item of property, plant and equipment is recognized in the carrying amount
of the item if it is probable that the future economic benefits embodied within the part will flow to the Group companies and its cost can be measured reliably. The carrying amount of the replaced part is derecognized. The costs of the day-to-day servicing of property, plant and equipment are recognized in consolidated profit or loss as incurred.
Gains and losses on disposal of an item of property, plant and equipment are determined by comparing the proceeds from disposal with the carrying amount of property, plant and equipment, and are recognized net within “other income” in consolidated profit or loss.
The Group companies review the useful life and residual value of property, plant and equipment on a regular
basis. Any change in estimates in future years might affect the carrying amounts of the respective items of property, plant and equipment with a corresponding effect on the depreciation charge and impairment.
3.5 Impairment
3.5.1 Non-financialassets
The carrying amounts of non-financial assets other than inventories and deferred tax asset, are reviewed at each reporting date to determine whether there is any indication of impairment. If any such indication exists, then the asset’s recoverable amount is estimated. The recoverable amount of an asset or cash-generating unit is the greater of its value in use and its fair value less cost to sell. In assessing value in use, the estimated future cash flows are discounted to their present value using a pre-tax discount rate that reflects current market assessment of the time value of money and the risks specific to the asset. For the purpose of impairment testing, assets that cannot be tested individually are grouped together into the smallest group of assets that generates cash inflows from continuing use that are largely independent of the cash inflows of other assets or groups of assets (the “cash-generating unit, or CGU”).
The Group’s corporate assets do not generate separate cash inflows. If there is an indication that a corporate
asset may be impaired, then the recoverable amount is determined for the CGU to which the corporate asset belongs. An impairment loss is recognized if the carrying amount of an asset or its CGU exceeds its estimated recoverable amount. Impairment losses are recognized in consolidated profit or loss.
Impairment loss recognized in prior periods are assessed at each reporting date for any indications that the loss
has decreased or no longer exists. An impairment loss is reversed if there has been a change in the estimates used to determine the recoverable amount. An impairment loss is reversed only to the extent that the asset’s carrying amount does not exceed the carrying amount that would have been determined, net of depreciation or amortization, if no impairment loss had been recognized.
3.5.2 Financial assets
Financial assets are assessed at each reporting date to determine whether there is objective evidence that they are impaired. A financial asset is impaired if objective evidence indicates that a loss event has occurred after the initial recognition of the asset, and that the loss event had a negative effect on the estimated future cash flows of that asset that can be estimated reliably. Objective evidence that financial assets are impaired may include default or delinquency by a debtor, indications that a debtor or issuer will enter bankruptcy.
All individually significant assets are assessed for specific impairment. All individually significant assets found
not to be specifically impaired are then collectively assessed for any impairment that has been incurred but not yet identified. Assets that are not individually significant are collectively assessed for impairment by grouping together assets with similar risk characteristics.
Notes to the Consolidated Financial StatementsFor the Year Ended December 31, 2018
296 Consolidated Financial Statements
An impairment loss in respect of a financial asset measured at amortized cost is calculated as the difference between its carrying amount and the present value of the estimated future cash flows discounted at the asset’s original effective interest rate. Losses are recognized in consolidated profit or loss and reflected in an allowance account. Interest on the impaired asset continues to be recognized through the unwinding of the discount. When a subsequent event causes the amount of impairment loss to decrease, the decrease in impairment loss is reversed through consolidated profit or loss.
3.6 Intangible assets
3.6.1 Goodwill
Goodwill arises on the acquisition of subsidiaries or businesses and represents the excess of the consideration transferred, the amount of any non-controlling interest in the acquiree and the acquisition-date fair value of any previous equity interest in the acquiree over the fair value of the identifiable net assets acquired. If the total of consideration transferred, non-controlling interest recognized and previously held interest measured at fair value is less than the fair value of the net assets of the subsidiary acquired, in the case of a bargain purchase, the difference is recognized directly in the consolidated profit or loss.
For the purpose of impairment testing, goodwill acquired in a business combination is allocated to each of the cash generating units (CGUs), or groups of CGUs, that is expected to benefit from the synergies of the combination. Each unit or group of units to which the goodwill is allocated represents the lowest level within the entity at which the goodwill is monitored for internal management purposes. Goodwill is monitored at the operating segment level.
Goodwill impairment reviews are undertaken annually or more frequently if events or changes in circumstances indicate a potential impairment. The carrying value of the CGU containing the goodwill is compared to the recoverable amount, which is the higher of value in use and the fair value less cost of disposal. Any impairment is recognized immediately as an expense and is not subsequently reversed.
3.6.2 Computersoftware
These are stated at the cash price equivalent of the consideration given i.e., cash and cash equivalent paid less accumulated amortization and impairment loss, if any. These are amortized over the period of their useful lives. Amortization is charged on a straight line basis over the estimated useful life and is included in the consolidated profit or loss.
3.6.3 Others
Other intangibles are stated at the cash price equivalent of the consideration given, i.e., cash and cash equivalent paid less accumulated amortization and impairment loss, if any. Intangibles with finite useful lives are amortized over the period of their useful lives. Amortization is charged on a straight line basis over the estimated useful life and is included in the consolidated profit or loss.
3.7 Investments
3.7.1 Investments available for sale
These are initially recognized at fair value plus any directly attributable transaction cost. Subsequent to initial recognition they are measured at fair value and changes there in other then impairment loss and foreign currency difference on debt instrument, are recognized in consolidated comprehensive income and accumulated in fair value reserve. When these are derecognized the gain or loss accumulated is reclassified to consolidated profit or loss.
3.7.2 Investmentsatfairvaluethroughprofitorloss
Investments which are acquired principally for the purpose of selling in the near term or the investments that are part of a portfolio of financial instruments exhibiting short term profit taking, are classified as held for
297Annual Report 2018
trading and designated as such upon initial recognition. These are stated at fair values with any resulting gains or losses recognized directly in the consolidated profit or loss.
The Group companies recognize the regular way purchase or sale of financial assets using settlement date
accounting.
3.7.3 Loans and receivables
Investments are classified as loans and receivables which have fixed or determinable payments and are not quoted in an active market. These investments are initially measured at fair values plus directly attributable transaction costs. Subsequent to initial recognition, these are stated at their amortized cost using the effective interest method, less any impairment losses.
3.8 Stores, spares and loose tools
Stores, spares and loose tools are valued at lower of weighted average cost and net realizable value. For items which are slow moving and / or identified as surplus to the Group’s requirements, adequate provision
is made for any excess book value over estimated net realizable value. The Group reviews the carrying amount of stores, spares and loose tools on a regular basis and provision is made for obsolescence.
Net realizable value is the estimated selling price in the ordinary course of business, less the estimated costs of
completion and estimated costs necessary to make the sale. The Group companies review the carrying amount of stores, spares and loose tools on a regular basis and as
appropriate, these are written down to their net realizable value or provision is made for obsolescence if there is any change in usage pattern and physical form of related stores, spares and loose tools.
3.9 Stock in trade
Stocks are valued at the lower of cost and net realizable value. Cost is determined as follows:
Raw materials at weighted average purchase cost and directly attributable expenses
Work in process and finished goods at weighted average cost of purchase, raw materials and related manufacturing expenses
Net realizable value signifies the estimated selling price in the ordinary course of business less the estimated
costs of completion and the estimated costs necessary to make the sale. The Group companies review the carrying amount of stock in trade on a regular basis and as appropriate, it is
written down to its net realizable value or provision is made for obsolescence if there is any change in usage pattern and physical form of related stock in trade.
3.10 Foreign currency transaction and translation
Transactions in foreign currencies are recorded in the books at the rates of exchange ruling on the date of the transaction. Assets and liabilities in foreign currencies at the year end are translated into rupees at the rates prevailing on the reporting date. Exchange differences are included in the consolidated profit or loss for the year.
Investment in foreign joint venture
The results and financial position of joint venture that have a functional currency different from Pak Rupees are translated into Pak Rupees as follows:
– assets and liabilities for each consolidated statement of financial position presented are translated
at the closing rate at the date of the consolidated statement of financial position.
Notes to the Consolidated Financial StatementsFor the Year Ended December 31, 2018
298 Consolidated Financial Statements
– income and expense are translated at the average exchange rates for the period.
– share capital is translated at historical exchange rate.
All resulting exchange differences are recognized in consolidated comprehensive income within consolidated statement of comprehensive income. The Group companies have been recognizing such differences in translation reserve over the years. When a foreign investment is sold, in part or in full, the relevant amount in the translation reserve is transferred to consolidated profit or loss as part of the profit or loss on sale.
3.11 Turnover
Turnover from the sale of goods in the course of ordinary activities is measured at the fair value of the consideration received or receivable, net of returns, trade discounts and volume rebates. Turnover is recognized when significant risk and rewards of ownership have been transferred to the customers, recovery of the consideration is probable, the associated costs and possible return of the goods can be estimated reliably, there is no continuing management involvement with the goods, and the amount of turnover can be measured reliably. Scrap sales and miscellaneous receipts are recognized on realized amounts.
Government subsidy on sale of fertilizer is recognized when the right to receive such subsidy has been established and the underlying conditions are met. Government subsidy is recognized in other income.
3.12 Borrowing costs
Borrowing costs which are directly attributable to the acquisition, construction or production of a qualifying asset are capitalized as part of the cost of that asset. Borrowing cost includes exchange differences arising from foreign currency borrowings to the extent these are regarded as an adjustment to borrowing costs. All other borrowing costs are charged to consolidated profit or loss.
3.13 Research and development costs
Research and development costs are charged to consolidated profit or loss as and when incurred. 3.14 Provisions
Provisions are recognized when the Group companies have present legal or constructive obligations as a result of past events, it is probable that an outflow of resources embodying economic benefits will be required to settle the obligation and a reliable estimate can be made of the amount of obligation. Provisions are determined by discounting the expected future cash flows at a pre-tax rate that reflects current market assessments of the time value of money and the risks specific to the liability.
Provisions are reviewed at each reporting date and adjusted to reflect current best estimate.
3.15 Share capital and dividend
Dividend is recognized as a liability in the period in which it is declared. Movement in reserves is recognized in the year in which it is approved.
3.16 Cash and cash equivalents
Cash and cash equivalents comprise cash in hand, cash with banks on current, saving and deposit accounts, short term running finances and other short term highly liquid investments that are readily convertible to known amounts of cash which are subject to insignificant risk of change in value.
3.17 Financial instruments
3.17.1 Non-derivativefinancialassets
Those other than available for sale and those held at fair value through consolidated profit or loss are initially recognized on the date that they are originated i.e. trade date which is the date that the Group becomes a party to the contractual provisions of the instrument.
299Annual Report 2018
A financial asset is derecognized when the contractual rights to the cash flows from the asset expire, or when the Group transfers the rights to receive the contractual cash flows in a transaction in which substantially all the risks and rewards of ownership of the financial asset are transferred. Any interest in such transferred financial assets that is created or retained by the Group is recognized as a separate asset or liability.
The Group classifies non-derivative financial assets as available for sale, held for trading, loans and other receivables. Loans and receivables comprise investments classified as loans and receivables, cash and cash equivalents and trade and other receivables.
3.17.2 Tradedebts,otherreceivablesandotherfinancialassets
Trade debts and other receivables are initially recognized at fair value plus any directly attributable transaction cost. Subsequent to initial recognition, these are measured at amortized cost using effective interest method, less any impairment losses. Known bad debts are written off, when identified.
3.17.3 Non-derivativefinancialliabilities
The Group initially recognizes non derivative financial liabilities on the date that they are originated or the date that the Group becomes a party to the contractual provisions of the instrument. The Group derecognizes a financial liability when its contractual obligations are discharged, cancelled or expired.
These financial liabilities are recognized initially at fair value less any directly attributable transaction
costs. Subsequent to initial recognition, these financial liabilities are measured at amortized cost using the effective interest method. Non-derivative financial liabilities comprise mark-up bearing borrowings including obligations under finance lease, bank overdrafts and trade and other payables.
3.17.4 Offsettingoffinancialassetsandfinancialliabilities
Financial assets and financial liabilities are offset and the net amount is reported in the consolidated statement of financial position if the Group has a legally enforceable right to set off the recognized amounts and intends either to settle on a net basis or to realize the assets and settle the liabilities simultaneously.
3.18 Financeincomeandfinancecosts
Finance income comprises interest income on funds invested (including available-for-sale financial assets), dividend income, gains on disposal of available-for-sale financial assets and changes in the fair value of investments held for trading. Interest income is recognized as it accrues in consolidated profit or loss, using the effective interest method. Dividend income is recognized in consolidated profit or loss on the date that the Group company’s right to receive payment is established, which in the case of quoted securities is the ex-dividend date.
Finance costs comprise interest expense on borrowings, changes in the fair value of held for trading investments
and impairment losses recognized on financial assets. Borrowing costs that are not directly attributable to the acquisition, construction or production of a qualifying asset are recognized in consolidated profit or loss using the effective interest method.
Foreign currency gains and losses are reported on a net basis. 3.19 Leases
Operating leases
Rentals payable under operating leases are charged to consolidated profit or loss on a straight line basis over the term of the relevant lease.
3.20 Contingent liabilities
A contingent liability is disclosed when the Group has a possible obligation as a result of past events, whose existence will be confirmed only by the occurrence or non-occurrence, of one or more uncertain future events not
Notes to the Consolidated Financial StatementsFor the Year Ended December 31, 2018
300 Consolidated Financial Statements
wholly within the control of the Group; or the Group has a present legal or constructive obligation that arises from past events, but it is not probable that an outflow of resources embodying economic benefits will be required to settle the obligation, or the amount of the obligation cannot be measured with sufficient reliability.
3.21 Segment reporting
Segment reporting is based on the operating (business) segments of the Group. An operating segment is a component of the Group that engages in business activities from which it may earn revenues and incur expenses, including revenues and expenses that relate to transactions with any of the Group’s other components. An operating segment’s operating results are reviewed regularly by the Chief Executive to make decisions about resources to be allocated to the segment and assess its performance, and for which discrete financial information is available. Segment results that are reported to the Chief Executive include items directly attributable to a segment as well as those that can be allocated on a reasonable basis.
The business segments are engaged in providing products or services which are subject to risks and rewards
which differ from the risk and rewards of other segments. Segments reported are fertilizer, power and food. 3.22 Share in revaluation reserve of associates
This represents the Group’s share in surplus on revaluation of non banking assets acquired in satisfaction of claims by the banking associate. The assets have been carried at revalued amounts pursuant to the requirements of “Regulations for Debt Property Swap” issued by the State Bank of Pakistan vide BPRD Circular No. 1 of 2016 dated January 01, 2016.
3.23 Newaccountingstandards,amendmentsandIFRICinterpretationsthatarenotyeteffective
The following International Financial Reporting Standards (IFRS Standards) as notified under the Companies Act, 2017 and the amendments and interpretations thereto will be effective for accounting periods beginning on or after January 1, 2019:
– IFRIC 23 ‘Uncertainty over Income Tax Treatments’ (effective for annual periods beginning on or after January 1, 2019) clarifies the accounting for income tax when there is uncertainty over income tax treatments under IAS 12. The interpretation requires the uncertainty over tax treatment be reflected in the measurement of current and deferred tax. The application of interpretation is not likely to have an impact on Group’s consolidated financial statements.
– IFRS 15 ‘Revenue from contracts with customers’ (effective for annual periods beginning on or after July 1, 2018). IFRS 15 establishes a comprehensive framework for determining whether, how much and when revenue is recognized. It replaces existing revenue recognition guidance, including IAS 18 ‘Revenue’, IAS 11 ‘Construction Contracts’ and IFRIC 13 ‘Customer Loyalty Programmes’. The Group is currently in the process of analysing the potential impact of changes required in revenue recognition policies on adoption of the standard.
– IFRS 9 ‘Financial Instruments’ and amendment – Prepayment Features with Negative Compensation
(effective for annual periods beginning on or after July 1, 2018 and January 1, 2019 respectively). IFRS 9 replaces the existing guidance in IAS 39 Financial Instruments: Recognition and Measurement. IFRS 9 includes revised guidance on the classification and measurement of financial instruments, a new expected credit loss model for calculating impairment on financial assets, and new general hedge accounting requirements. It also carries forward the guidance on recognition and derecognition of financial instruments from IAS 39. The Group is currently in the process of analysing the potential impact of changes required in classification and measurement of financial instruments and the impact of expected loss model on adoption of the standard.
– IFRS 16 ‘Leases’ (effective for annual period beginning on or after January 1, 2019). IFRS 16 replaces
existing leasing guidance, including IAS 17 ‘Leases’, IFRIC 4 ‘Determining whether an Arrangement contains a Lease’, SIC-15 ‘Operating Leases - Incentives’ and SIC-27 ‘Evaluating the Substance of
301Annual Report 2018
Transactions Involving the Legal Form of a Lease’. IFRS 16 introduces a single, on-balance sheet lease accounting model for lessees. A lessee recognizes a right-of-use asset representing its right to use the underlying asset and a lease liability representing its obligation to make lease payments. There are recognition exemptions for short-term leases and leases of low-value items. Lessor accounting remains similar to the current standard i.e. lessors continue to classify leases as finance or operating leases. The Group is currently in the process of analyzing the potential impact of its lease arrangements that will result in recognition of right to use assets and liabilities on adoption of the standard.
– Amendment to IAS 28 ‘Investments in Associates and Joint Ventures’ - Long Term Interests in Associates and Joint Ventures (effective for annual period beginning on or after January 1, 2019). The amendment will affect companies that finance such entities with preference shares or with loans for which repayment is not expected in the foreseeable future (referred to as long-term interests or ‘LTI’). The amendment and accompanying example state that LTI are in the scope of both IFRS 9 and IAS 28 and explain the annual sequence in which both standards are to be applied. The amendments are not likely to have an impact on Group’s consolidated financial statements.
– Amendments to IAS 19 ‘Employee Benefits’- Plan Amendment, Curtailment or Settlement (effective for annual periods beginning on or after January 1, 2019). The amendments clarify that on amendment, curtailment or settlement of a defined benefit plan, a company now uses updated actuarial assumptions to determine its current service cost and net interest for the period; and the effect of the asset ceiling is disregarded when calculating the gain or loss on any settlement of the plan and is dealt with separately in consolidated comprehensive income. The application of amendments is not likely to have an impact on Group’s consolidated financial statements.
– IFRS 9 ‘Financial Instruments’ and amendment – Prepayment Features with Negative Compensation (effective for annual periods beginning on or after July 1, 2018 and January 1, 2019 respectively). IFRS 9 replaces the existing guidance in IAS 39 Financial Instruments: Recognition and Measurement. IFRS 9 includes revised guidance on the classification and measurement of financial instruments, a new expected credit loss model for calculating impairment on financial assets, and new general hedge accounting requirements. It also carries forward the guidance on recognition and derecognition of financial instruments from IAS 39. The Group is currently in the process of analyzing the potential impact of changes required in classification and measurement of financial instruments and the impact of expected loss model on adoption of the standard. Management is in the process of assessing the impact of adoption of this standard on the consolidated financial statements.
Annual Improvements to IFRS Standards 2015–2017 Cycle - the improvements address amendments to following approved accounting standards:
– IFRS 3 Business Combinations and IFRS 11 Joint Arrangement - the amendment aims to clarify the accounting treatment when a company increases its interest in a joint operation that meets the definition of a business. A company remeasures its previously held interest in a joint operation when it obtains control of the business. A company does not remeasure its previously held interest in a joint operation when it obtains joint control of the business.
– IAS 12 Income Taxes - the amendment clarifies that all income tax consequences of dividends (including payments on financial instruments classified as equity) are recognized consistently with the transaction that generates the distributable profits.
– IAS 23 Borrowing Costs - the amendment clarifies that a company treats as part of general borrowings any borrowing originally made to develop an asset when the asset is ready for its intended use or sale.
The above amendments are effective from annual period beginning on or after January 1, 2019 and are not
likely to have an impact on Group’s consolidated financial statements.
Notes to the Consolidated Financial StatementsFor the Year Ended December 31, 2018
302 Consolidated Financial Statements
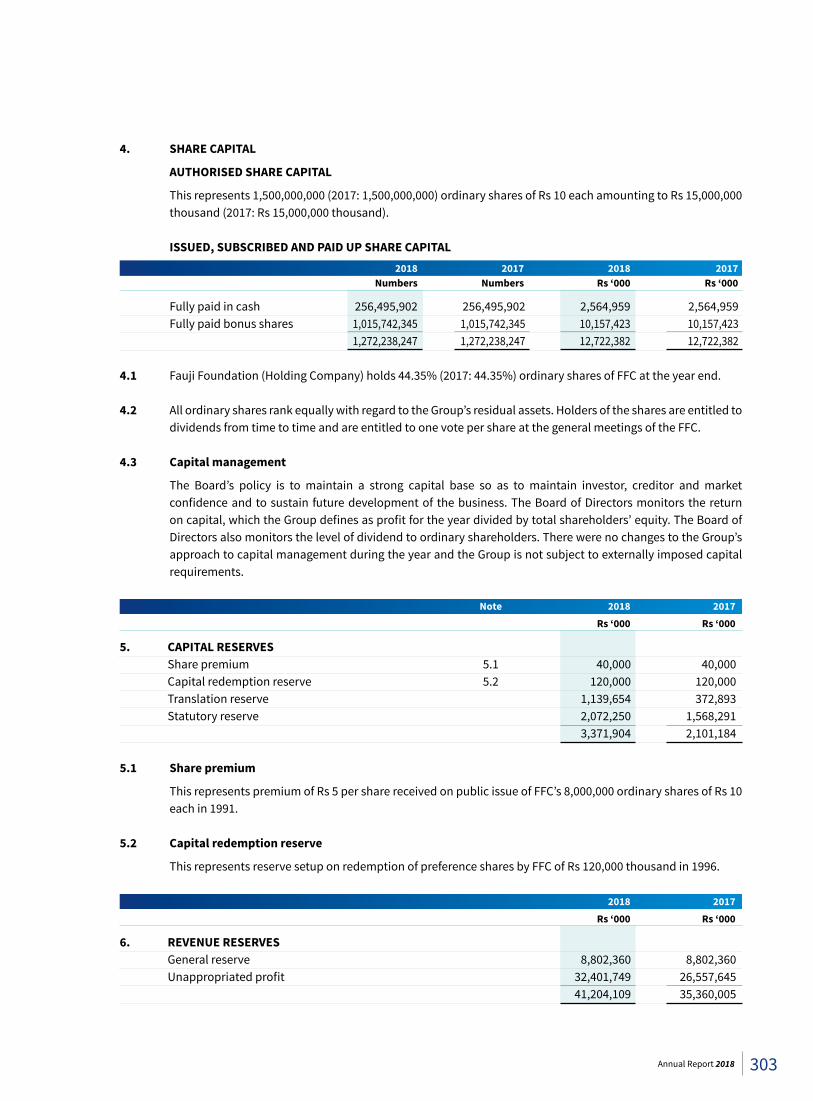
4. SHARE CAPITAL
AUTHORISED SHARE CAPITAL
This represents 1,500,000,000 (2017: 1,500,000,000) ordinary shares of Rs 10 each amounting to Rs 15,000,000 thousand (2017: Rs 15,000,000 thousand).
ISSUED, SUBSCRIBED AND PAID UP SHARE CAPITAL 2018 2017 2018 2017 Numbers Numbers Rs ‘000 Rs ‘000
Fully paid in cash 256,495,902 256,495,902 2,564,959 2,564,959 Fully paid bonus shares 1,015,742,345 1,015,742,345 10,157,423 10,157,423 1,272,238,247 1,272,238,247 12,722,382 12,722,382 4.1 Fauji Foundation (Holding Company) holds 44.35% (2017: 44.35%) ordinary shares of FFC at the year end.
4.2 All ordinary shares rank equally with regard to the Group’s residual assets. Holders of the shares are entitled to dividends from time to time and are entitled to one vote per share at the general meetings of the FFC.
4.3 Capital management
The Board’s policy is to maintain a strong capital base so as to maintain investor, creditor and market confidence and to sustain future development of the business. The Board of Directors monitors the return on capital, which the Group defines as profit for the year divided by total shareholders’ equity. The Board of Directors also monitors the level of dividend to ordinary shareholders. There were no changes to the Group’s approach to capital management during the year and the Group is not subject to externally imposed capital requirements.
Note 2018 2017 Rs ‘000 Rs ‘000
5. CAPITAL RESERVES Share premium 5.1 40,000 40,000 Capital redemption reserve 5.2 120,000 120,000 Translation reserve 1,139,654 372,893 Statutory reserve 2,072,250 1,568,291 3,371,904 2,101,184 5.1 Share premium
This represents premium of Rs 5 per share received on public issue of FFC’s 8,000,000 ordinary shares of Rs 10 each in 1991.
5.2 Capital redemption reserve
This represents reserve setup on redemption of preference shares by FFC of Rs 120,000 thousand in 1996.
2018 2017 Rs ‘000 Rs ‘000
6. REVENUE RESERVES General reserve 8,802,360 8,802,360 Unappropriated profit 32,401,749 26,557,645 41,204,109 35,360,005
303Annual Report 2018
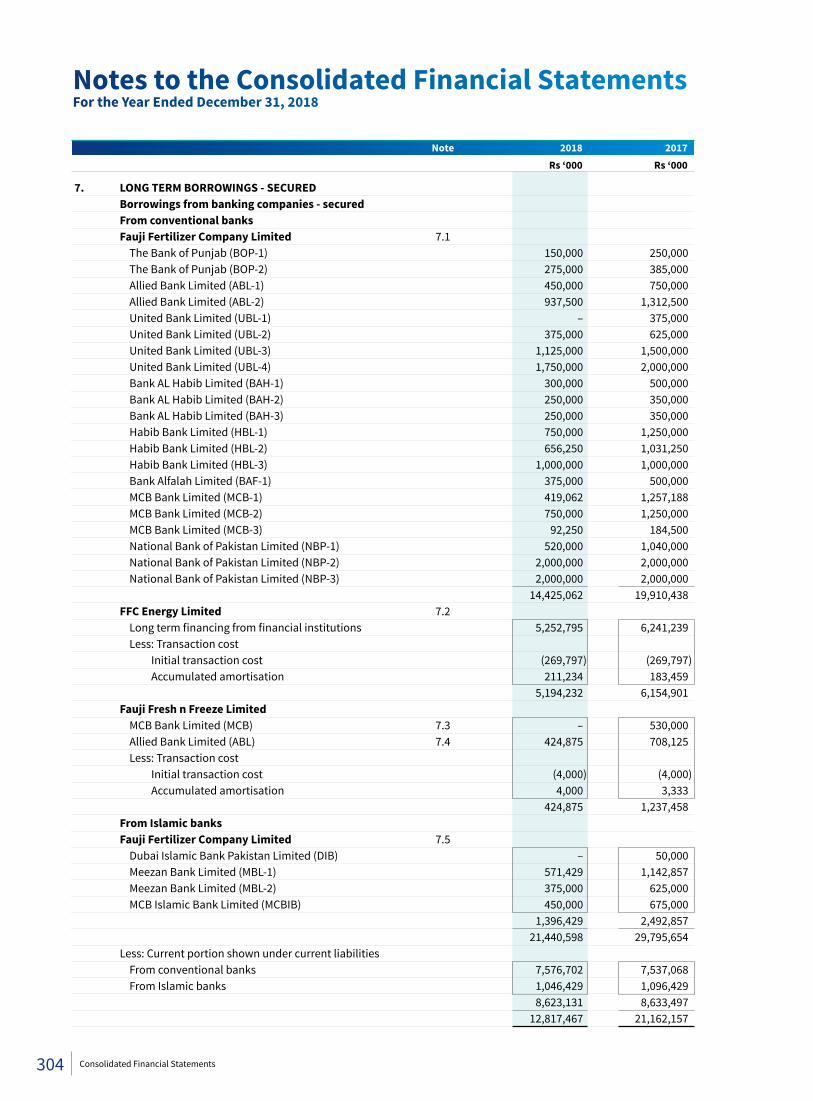
Note 2018 2017 Rs ‘000 Rs ‘000
7. LONG TERM BORROWINGS - SECURED Borrowings from banking companies - secured From conventional banks Fauji Fertilizer Company Limited 7.1 The Bank of Punjab (BOP-1) 150,000 250,000 The Bank of Punjab (BOP-2) 275,000 385,000 Allied Bank Limited (ABL-1) 450,000 750,000 Allied Bank Limited (ABL-2) 937,500 1,312,500 United Bank Limited (UBL-1) – 375,000 United Bank Limited (UBL-2) 375,000 625,000 United Bank Limited (UBL-3) 1,125,000 1,500,000 United Bank Limited (UBL-4) 1,750,000 2,000,000 Bank AL Habib Limited (BAH-1) 300,000 500,000 Bank AL Habib Limited (BAH-2) 250,000 350,000 Bank AL Habib Limited (BAH-3) 250,000 350,000 Habib Bank Limited (HBL-1) 750,000 1,250,000 Habib Bank Limited (HBL-2) 656,250 1,031,250 Habib Bank Limited (HBL-3) 1,000,000 1,000,000 Bank Alfalah Limited (BAF-1) 375,000 500,000 MCB Bank Limited (MCB-1) 419,062 1,257,188 MCB Bank Limited (MCB-2) 750,000 1,250,000 MCB Bank Limited (MCB-3) 92,250 184,500 National Bank of Pakistan Limited (NBP-1) 520,000 1,040,000 National Bank of Pakistan Limited (NBP-2) 2,000,000 2,000,000 National Bank of Pakistan Limited (NBP-3) 2,000,000 2,000,000 14,425,062 19,910,438 FFC Energy Limited 7.2 Long term financing from financial institutions 5,252,795 6,241,239 Less: Transaction cost Initial transaction cost (269,797) (269,797) Accumulated amortisation 211,234 183,459 5,194,232 6,154,901 Fauji Fresh n Freeze Limited MCB Bank Limited (MCB) 7.3 – 530,000 Allied Bank Limited (ABL) 7.4 424,875 708,125 Less: Transaction cost Initial transaction cost (4,000) (4,000) Accumulated amortisation 4,000 3,333 424,875 1,237,458 From Islamic banks Fauji Fertilizer Company Limited 7.5 Dubai Islamic Bank Pakistan Limited (DIB) – 50,000 Meezan Bank Limited (MBL-1) 571,429 1,142,857 Meezan Bank Limited (MBL-2) 375,000 625,000 MCB Islamic Bank Limited (MCBIB) 450,000 675,000 1,396,429 2,492,857 21,440,598 29,795,654 Less: Current portion shown under current liabilities From conventional banks 7,576,702 7,537,068 From Islamic banks 1,046,429 1,096,429 8,623,131 8,633,497 12,817,467 21,162,157
Notes to the Consolidated Financial StatementsFor the Year Ended December 31, 2018
304 Consolidated Financial Statements
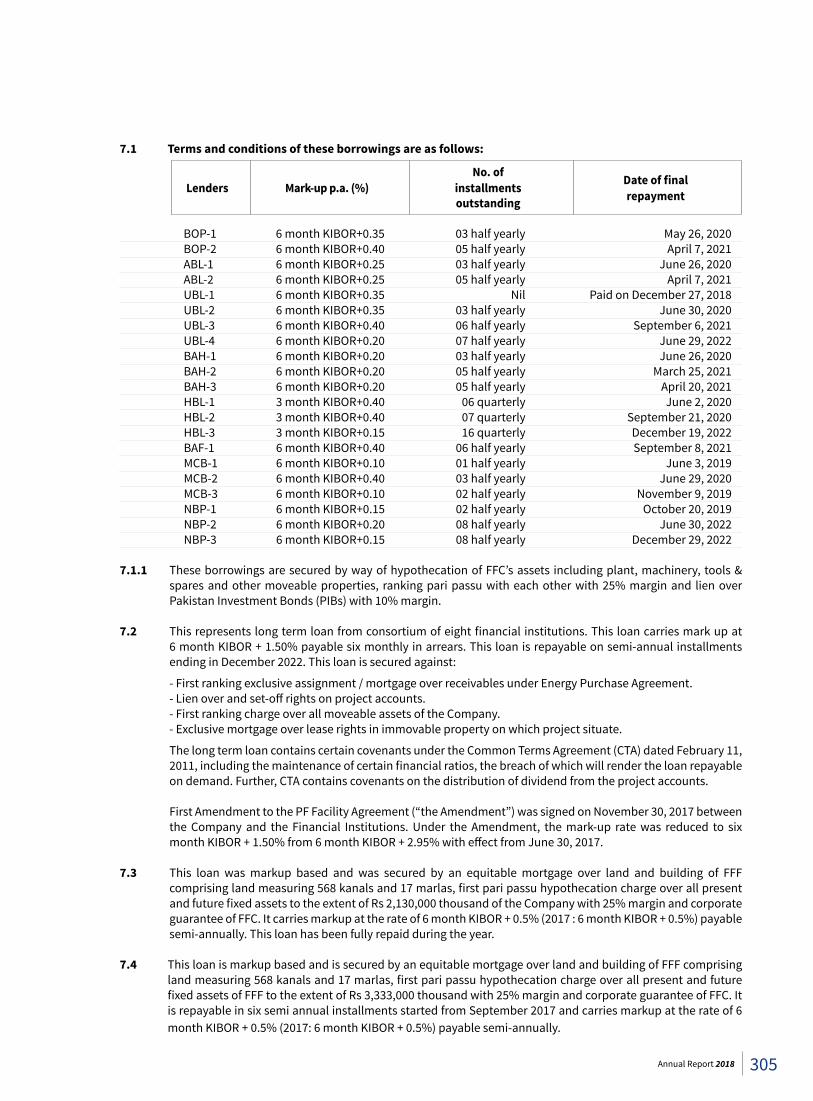
7.1 Terms and conditions of these borrowings are as follows:
No. of Dateoffinal Lenders Mark-upp.a.(%) installments repayment outstanding
BOP-1 6 month KIBOR+0.35 03 half yearly May 26, 2020 BOP-2 6 month KIBOR+0.40 05 half yearly April 7, 2021 ABL-1 6 month KIBOR+0.25 03 half yearly June 26, 2020 ABL-2 6 month KIBOR+0.25 05 half yearly April 7, 2021 UBL-1 6 month KIBOR+0.35 Nil Paid on December 27, 2018 UBL-2 6 month KIBOR+0.35 03 half yearly June 30, 2020 UBL-3 6 month KIBOR+0.40 06 half yearly September 6, 2021 UBL-4 6 month KIBOR+0.20 07 half yearly June 29, 2022 BAH-1 6 month KIBOR+0.20 03 half yearly June 26, 2020 BAH-2 6 month KIBOR+0.20 05 half yearly March 25, 2021 BAH-3 6 month KIBOR+0.20 05 half yearly April 20, 2021 HBL-1 3 month KIBOR+0.40 06 quarterly June 2, 2020 HBL-2 3 month KIBOR+0.40 07 quarterly September 21, 2020 HBL-3 3 month KIBOR+0.15 16 quarterly December 19, 2022 BAF-1 6 month KIBOR+0.40 06 half yearly September 8, 2021 MCB-1 6 month KIBOR+0.10 01 half yearly June 3, 2019 MCB-2 6 month KIBOR+0.40 03 half yearly June 29, 2020 MCB-3 6 month KIBOR+0.10 02 half yearly November 9, 2019 NBP-1 6 month KIBOR+0.15 02 half yearly October 20, 2019 NBP-2 6 month KIBOR+0.20 08 half yearly June 30, 2022 NBP-3 6 month KIBOR+0.15 08 half yearly December 29, 2022 7.1.1 These borrowings are secured by way of hypothecation of FFC’s assets including plant, machinery, tools &
spares and other moveable properties, ranking pari passu with each other with 25% margin and lien over Pakistan Investment Bonds (PIBs) with 10% margin.
7.2 This represents long term loan from consortium of eight financial institutions. This loan carries mark up at 6 month KIBOR + 1.50% payable six monthly in arrears. This loan is repayable on semi-annual installments ending in December 2022. This loan is secured against:
- First ranking exclusive assignment / mortgage over receivables under Energy Purchase Agreement. - Lien over and set-off rights on project accounts. - First ranking charge over all moveable assets of the Company. - Exclusive mortgage over lease rights in immovable property on which project situate.
The long term loan contains certain covenants under the Common Terms Agreement (CTA) dated February 11, 2011, including the maintenance of certain financial ratios, the breach of which will render the loan repayable on demand. Further, CTA contains covenants on the distribution of dividend from the project accounts.
First Amendment to the PF Facility Agreement (“the Amendment”) was signed on November 30, 2017 between
the Company and the Financial Institutions. Under the Amendment, the mark-up rate was reduced to six month KIBOR + 1.50% from 6 month KIBOR + 2.95% with effect from June 30, 2017.
7.3 This loan was markup based and was secured by an equitable mortgage over land and building of FFF
comprising land measuring 568 kanals and 17 marlas, first pari passu hypothecation charge over all present and future fixed assets to the extent of Rs 2,130,000 thousand of the Company with 25% margin and corporate guarantee of FFC. It carries markup at the rate of 6 month KIBOR + 0.5% (2017 : 6 month KIBOR + 0.5%) payable semi-annually. This loan has been fully repaid during the year.
7.4 This loan is markup based and is secured by an equitable mortgage over land and building of FFF comprising land measuring 568 kanals and 17 marlas, first pari passu hypothecation charge over all present and future fixed assets of FFF to the extent of Rs 3,333,000 thousand with 25% margin and corporate guarantee of FFC. It is repayable in six semi annual installments started from September 2017 and carries markup at the rate of 6 month KIBOR + 0.5% (2017: 6 month KIBOR + 0.5%) payable semi-annually.
305Annual Report 2018
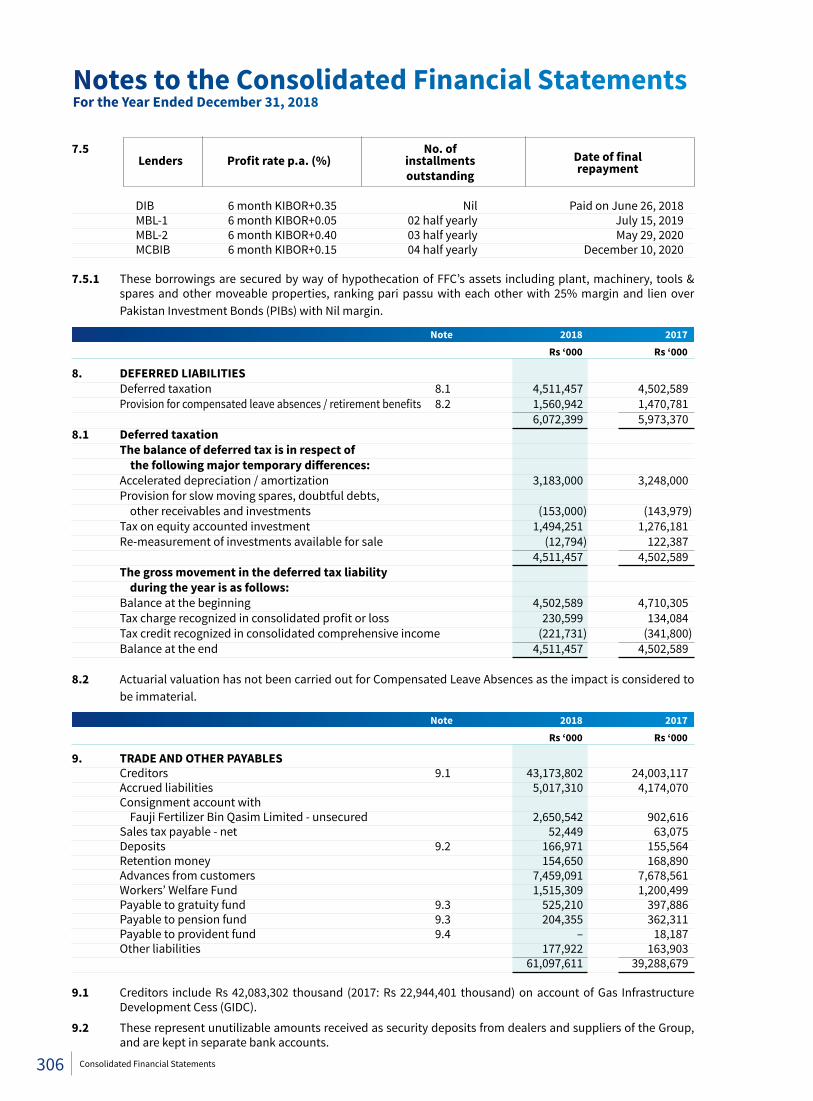
7.5 No. of Dateoffinal Lenders Profitratep.a.(%) installments repayment outstanding
DIB 6 month KIBOR+0.35 Nil Paid on June 26, 2018 MBL-1 6 month KIBOR+0.05 02 half yearly July 15, 2019 MBL-2 6 month KIBOR+0.40 03 half yearly May 29, 2020 MCBIB 6 month KIBOR+0.15 04 half yearly December 10, 2020 7.5.1 These borrowings are secured by way of hypothecation of FFC’s assets including plant, machinery, tools &
spares and other moveable properties, ranking pari passu with each other with 25% margin and lien over Pakistan Investment Bonds (PIBs) with Nil margin.
Note 2018 2017 Rs ‘000 Rs ‘000
8. DEFERRED LIABILITIES Deferred taxation 8.1 4,511,457 4,502,589 Provision for compensated leave absences / retirement benefits 8.2 1,560,942 1,470,781 6,072,399 5,973,370 8.1 Deferred taxation The balance of deferred tax is in respect of thefollowingmajortemporarydifferences: Accelerated depreciation / amortization 3,183,000 3,248,000 Provision for slow moving spares, doubtful debts, other receivables and investments (153,000) (143,979) Tax on equity accounted investment 1,494,251 1,276,181 Re-measurement of investments available for sale (12,794) 122,387 4,511,457 4,502,589 The gross movement in the deferred tax liability during the year is as follows: Balance at the beginning 4,502,589 4,710,305 Tax charge recognized in consolidated profit or loss 230,599 134,084 Tax credit recognized in consolidated comprehensive income (221,731) (341,800) Balance at the end 4,511,457 4,502,589 8.2 Actuarial valuation has not been carried out for Compensated Leave Absences as the impact is considered to
be immaterial.
Note 2018 2017 Rs ‘000 Rs ‘000
9. TRADE AND OTHER PAYABLES Creditors 9.1 43,173,802 24,003,117 Accrued liabilities 5,017,310 4,174,070 Consignment account with Fauji Fertilizer Bin Qasim Limited - unsecured 2,650,542 902,616 Sales tax payable - net 52,449 63,075 Deposits 9.2 166,971 155,564 Retention money 154,650 168,890 Advances from customers 7,459,091 7,678,561 Workers’ Welfare Fund 1,515,309 1,200,499 Payable to gratuity fund 9.3 525,210 397,886 Payable to pension fund 9.3 204,355 362,311 Payable to provident fund 9.4 – 18,187 Other liabilities 177,922 163,903 61,097,611 39,288,679 9.1 Creditors include Rs 42,083,302 thousand (2017: Rs 22,944,401 thousand) on account of Gas Infrastructure
Development Cess (GIDC).
9.2 These represent unutilizable amounts received as security deposits from dealers and suppliers of the Group, and are kept in separate bank accounts.
Notes to the Consolidated Financial StatementsFor the Year Ended December 31, 2018
306 Consolidated Financial Statements
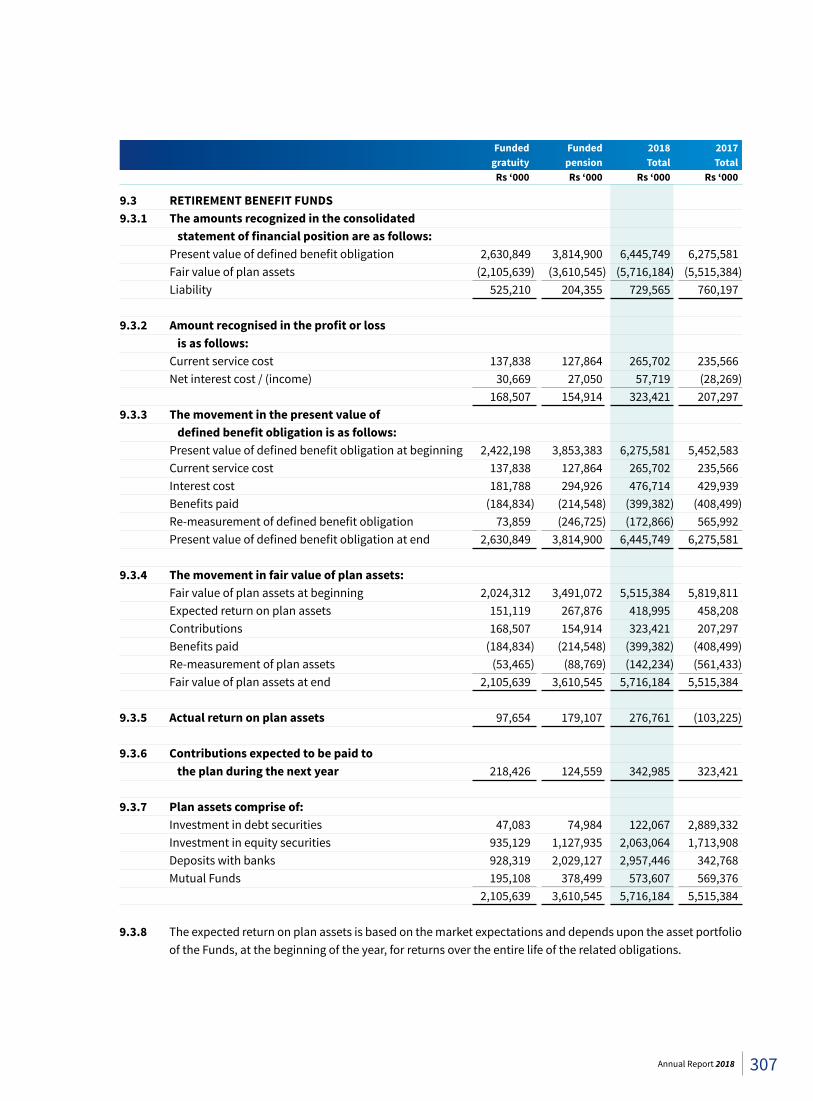
Funded Funded 2018 2017 gratuity pension Total Total Rs ‘000 Rs ‘000 Rs ‘000 Rs ‘000
9.3 RETIREMENT BENEFIT FUNDS9.3.1 The amounts recognized in the consolidated statementoffinancialpositionareasfollows: Present value of defined benefit obligation 2,630,849 3,814,900 6,445,749 6,275,581 Fair value of plan assets (2,105,639) (3,610,545) (5,716,184) (5,515,384) Liability 525,210 204,355 729,565 760,197 9.3.2 Amountrecognisedintheprofitorloss is as follows: Current service cost 137,838 127,864 265,702 235,566 Net interest cost / (income) 30,669 27,050 57,719 (28,269) 168,507 154,914 323,421 207,297 9.3.3 The movement in the present value of definedbenefitobligationisasfollows: Present value of defined benefit obligation at beginning 2,422,198 3,853,383 6,275,581 5,452,583 Current service cost 137,838 127,864 265,702 235,566 Interest cost 181,788 294,926 476,714 429,939 Benefits paid (184,834) (214,548) (399,382) (408,499) Re-measurement of defined benefit obligation 73,859 (246,725) (172,866) 565,992 Present value of defined benefit obligation at end 2,630,849 3,814,900 6,445,749 6,275,581 9.3.4 The movement in fair value of plan assets: Fair value of plan assets at beginning 2,024,312 3,491,072 5,515,384 5,819,811 Expected return on plan assets 151,119 267,876 418,995 458,208 Contributions 168,507 154,914 323,421 207,297 Benefits paid (184,834) (214,548) (399,382) (408,499) Re-measurement of plan assets (53,465) (88,769) (142,234) (561,433) Fair value of plan assets at end 2,105,639 3,610,545 5,716,184 5,515,384 9.3.5 Actual return on plan assets 97,654 179,107 276,761 (103,225) 9.3.6 Contributions expected to be paid to the plan during the next year 218,426 124,559 342,985 323,421 9.3.7 Plan assets comprise of: Investment in debt securities 47,083 74,984 122,067 2,889,332 Investment in equity securities 935,129 1,127,935 2,063,064 1,713,908 Deposits with banks 928,319 2,029,127 2,957,446 342,768 Mutual Funds 195,108 378,499 573,607 569,376 2,105,639 3,610,545 5,716,184 5,515,384 9.3.8 The expected return on plan assets is based on the market expectations and depends upon the asset portfolio
of the Funds, at the beginning of the year, for returns over the entire life of the related obligations.
307Annual Report 2018
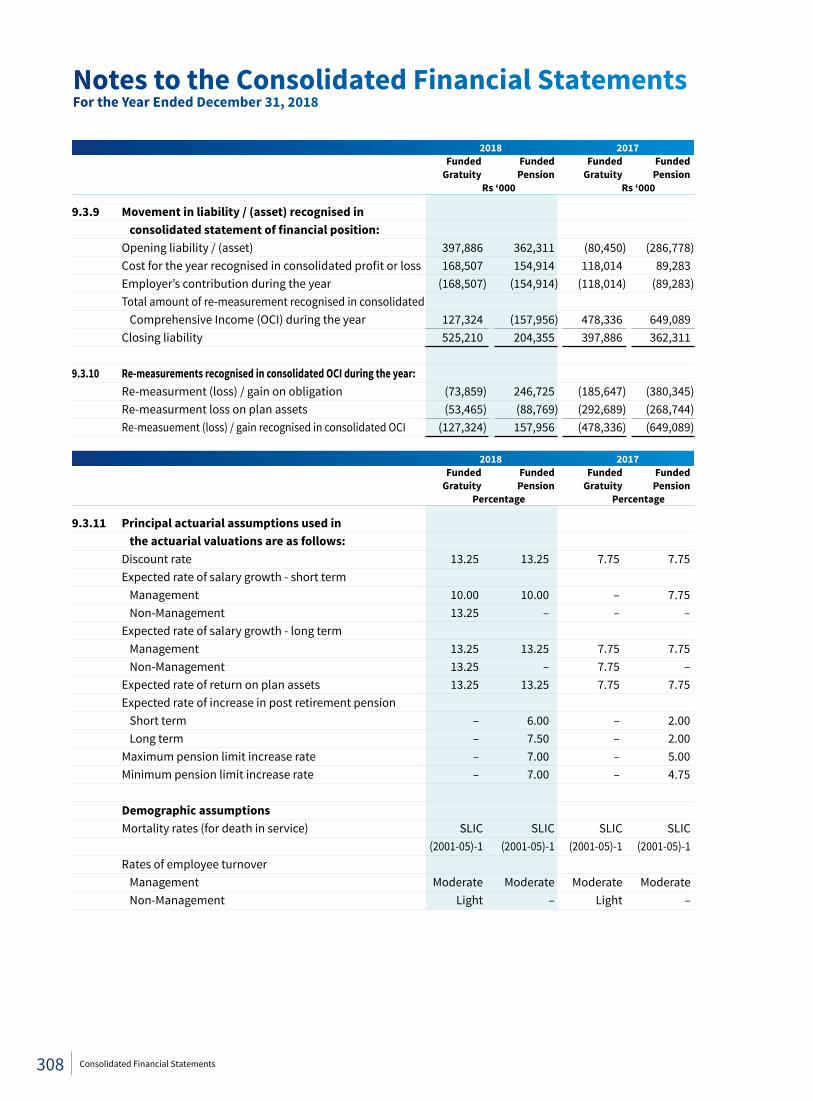
2018 2017 Funded Funded Funded Funded Gratuity Pension Gratuity Pension Rs ‘000 Rs ‘000
9.3.9 Movement in liability / (asset) recognised in consolidatedstatementoffinancialposition: Opening liability / (asset) 397,886 362,311 (80,450) (286,778) Cost for the year recognised in consolidated profit or loss 168,507 154,914 118,014 89,283 Employer’s contribution during the year (168,507) (154,914) (118,014) (89,283) Total amount of re-measurement recognised in consolidated Comprehensive Income (OCI) during the year 127,324 (157,956) 478,336 649,089 Closing liability 525,210 204,355 397,886 362,311 9.3.10 Re-measurements recognised in consolidated OCI during the year: Re-measurment (loss) / gain on obligation (73,859) 246,725 (185,647) (380,345) Re-measurment loss on plan assets (53,465) (88,769) (292,689) (268,744) Re-measuement (loss) / gain recognised in consolidated OCI (127,324) 157,956 (478,336) (649,089)
2018 2017 Funded Funded Funded Funded Gratuity Pension Gratuity Pension Percentage Percentage
9.3.11 Principal actuarial assumptions used in the actuarial valuations are as follows: Discount rate 13.25 13.25 7.75 7.75 Expected rate of salary growth - short term Management 10.00 10.00 – 7.75 Non-Management 13.25 – – – Expected rate of salary growth - long term Management 13.25 13.25 7.75 7.75 Non-Management 13.25 – 7.75 – Expected rate of return on plan assets 13.25 13.25 7.75 7.75 Expected rate of increase in post retirement pension Short term – 6.00 – 2.00 Long term – 7.50 – 2.00 Maximum pension limit increase rate – 7.00 – 5.00 Minimum pension limit increase rate – 7.00 – 4.75 Demographic assumptions Mortality rates (for death in service) SLIC SLIC SLIC SLIC (2001-05)-1 (2001-05)-1 (2001-05)-1 (2001-05)-1 Rates of employee turnover Management Moderate Moderate Moderate Moderate Non-Management Light – Light –
Notes to the Consolidated Financial StatementsFor the Year Ended December 31, 2018
308 Consolidated Financial Statements
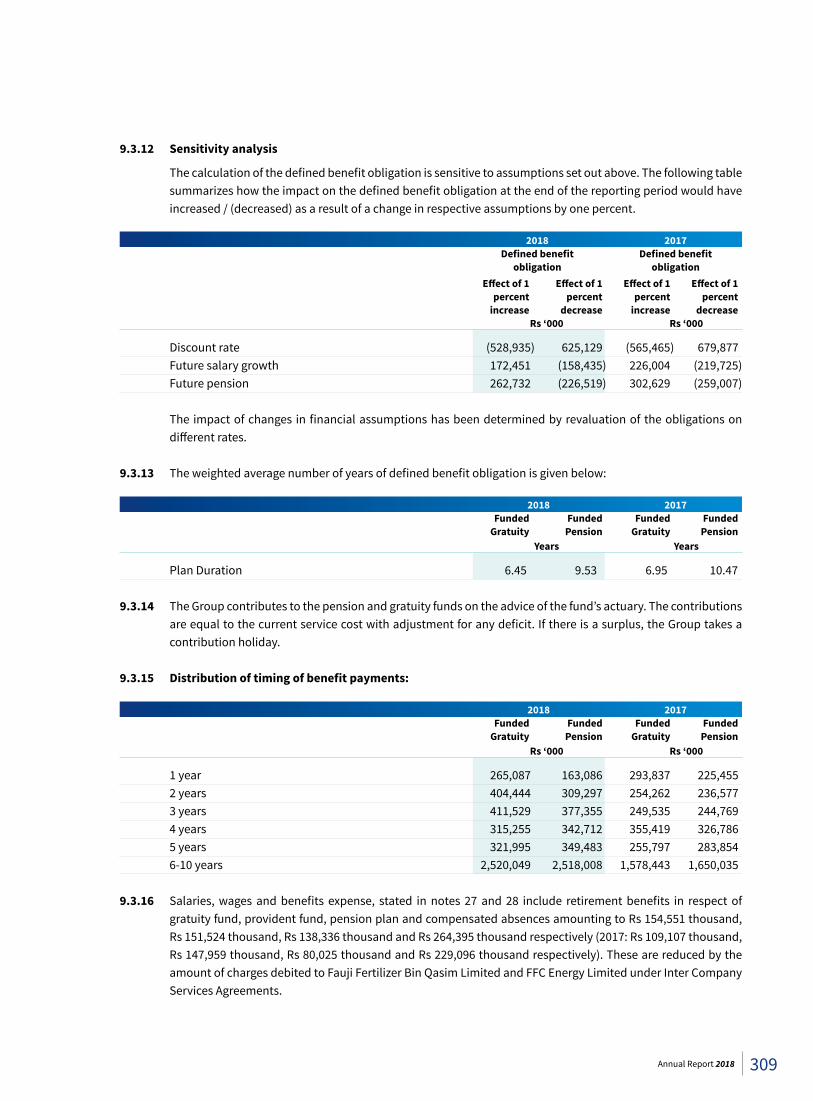
9.3.12 Sensitivity analysis
The calculation of the defined benefit obligation is sensitive to assumptions set out above. The following table summarizes how the impact on the defined benefit obligation at the end of the reporting period would have increased / (decreased) as a result of a change in respective assumptions by one percent.
2018 2017 Definedbenefit Definedbenefit obligation obligation Effectof1 Effectof1 Effectof1 Effectof1 percent percent percent percent increase decrease increase decrease Rs ‘000 Rs ‘000
Discount rate (528,935) 625,129 (565,465) 679,877 Future salary growth 172,451 (158,435) 226,004 (219,725) Future pension 262,732 (226,519) 302,629 (259,007) The impact of changes in financial assumptions has been determined by revaluation of the obligations on
different rates. 9.3.13 The weighted average number of years of defined benefit obligation is given below: 2018 2017 Funded Funded Funded Funded Gratuity Pension Gratuity Pension Years Years
Plan Duration 6.45 9.53 6.95 10.47 9.3.14 The Group contributes to the pension and gratuity funds on the advice of the fund’s actuary. The contributions
are equal to the current service cost with adjustment for any deficit. If there is a surplus, the Group takes a contribution holiday.
9.3.15 Distributionoftimingofbenefitpayments:
2018 2017 Funded Funded Funded Funded Gratuity Pension Gratuity Pension Rs ‘000 Rs ‘000
1 year 265,087 163,086 293,837 225,455 2 years 404,444 309,297 254,262 236,577 3 years 411,529 377,355 249,535 244,769 4 years 315,255 342,712 355,419 326,786 5 years 321,995 349,483 255,797 283,854 6-10 years 2,520,049 2,518,008 1,578,443 1,650,035 9.3.16 Salaries, wages and benefits expense, stated in notes 27 and 28 include retirement benefits in respect of
gratuity fund, provident fund, pension plan and compensated absences amounting to Rs 154,551 thousand, Rs 151,524 thousand, Rs 138,336 thousand and Rs 264,395 thousand respectively (2017: Rs 109,107 thousand, Rs 147,959 thousand, Rs 80,025 thousand and Rs 229,096 thousand respectively). These are reduced by the amount of charges debited to Fauji Fertilizer Bin Qasim Limited and FFC Energy Limited under Inter Company Services Agreements.
309Annual Report 2018
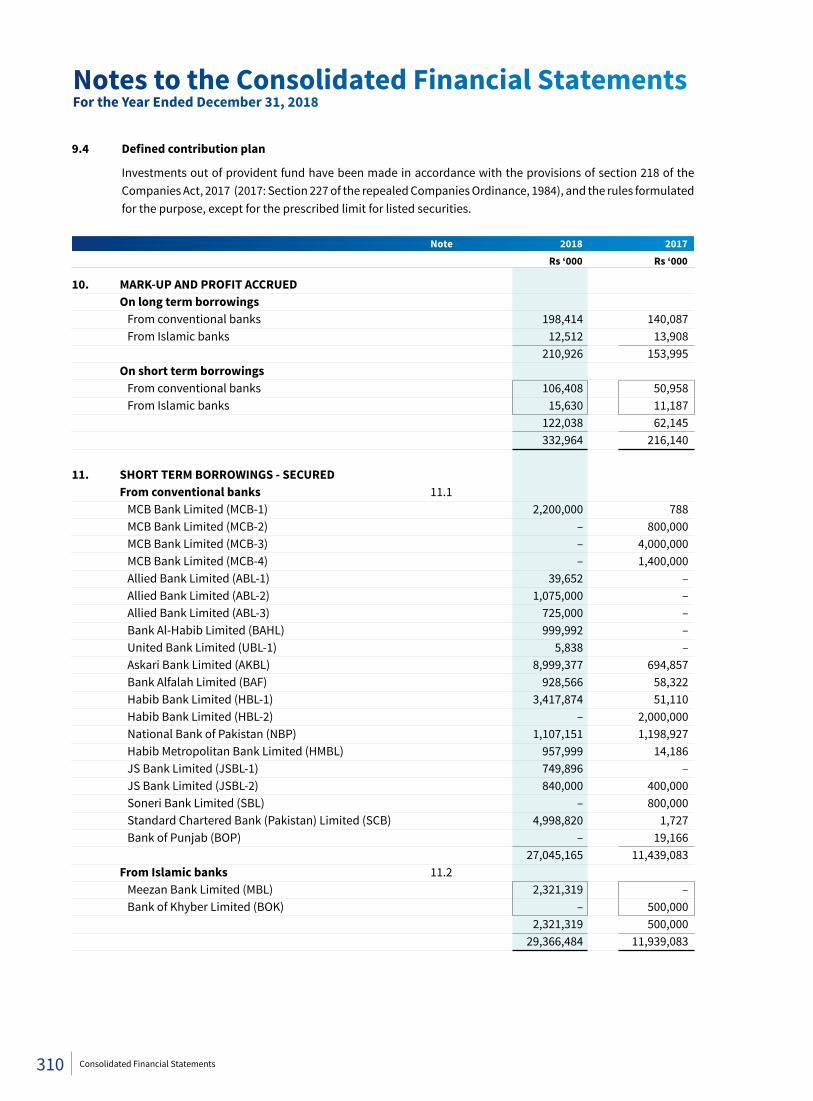
9.4 Definedcontributionplan
Investments out of provident fund have been made in accordance with the provisions of section 218 of the Companies Act, 2017 (2017: Section 227 of the repealed Companies Ordinance, 1984), and the rules formulated for the purpose, except for the prescribed limit for listed securities.
Note 2018 2017 Rs ‘000 Rs ‘000
10. MARK-UP AND PROFIT ACCRUED On long term borrowings From conventional banks 198,414 140,087 From Islamic banks 12,512 13,908 210,926 153,995 On short term borrowings From conventional banks 106,408 50,958 From Islamic banks 15,630 11,187 122,038 62,145 332,964 216,140 11. SHORT TERM BORROWINGS - SECURED From conventional banks 11.1 MCB Bank Limited (MCB-1) 2,200,000 788 MCB Bank Limited (MCB-2) – 800,000 MCB Bank Limited (MCB-3) – 4,000,000 MCB Bank Limited (MCB-4) – 1,400,000 Allied Bank Limited (ABL-1) 39,652 – Allied Bank Limited (ABL-2) 1,075,000 – Allied Bank Limited (ABL-3) 725,000 – Bank Al-Habib Limited (BAHL) 999,992 – United Bank Limited (UBL-1) 5,838 – Askari Bank Limited (AKBL) 8,999,377 694,857 Bank Alfalah Limited (BAF) 928,566 58,322 Habib Bank Limited (HBL-1) 3,417,874 51,110 Habib Bank Limited (HBL-2) – 2,000,000 National Bank of Pakistan (NBP) 1,107,151 1,198,927 Habib Metropolitan Bank Limited (HMBL) 957,999 14,186 JS Bank Limited (JSBL-1) 749,896 – JS Bank Limited (JSBL-2) 840,000 400,000 Soneri Bank Limited (SBL) – 800,000 Standard Chartered Bank (Pakistan) Limited (SCB) 4,998,820 1,727 Bank of Punjab (BOP) – 19,166 27,045,165 11,439,083 From Islamic banks 11.2 Meezan Bank Limited (MBL) 2,321,319 – Bank of Khyber Limited (BOK) – 500,000 2,321,319 500,000 29,366,484 11,939,083
Notes to the Consolidated Financial StatementsFor the Year Ended December 31, 2018
310 Consolidated Financial Statements
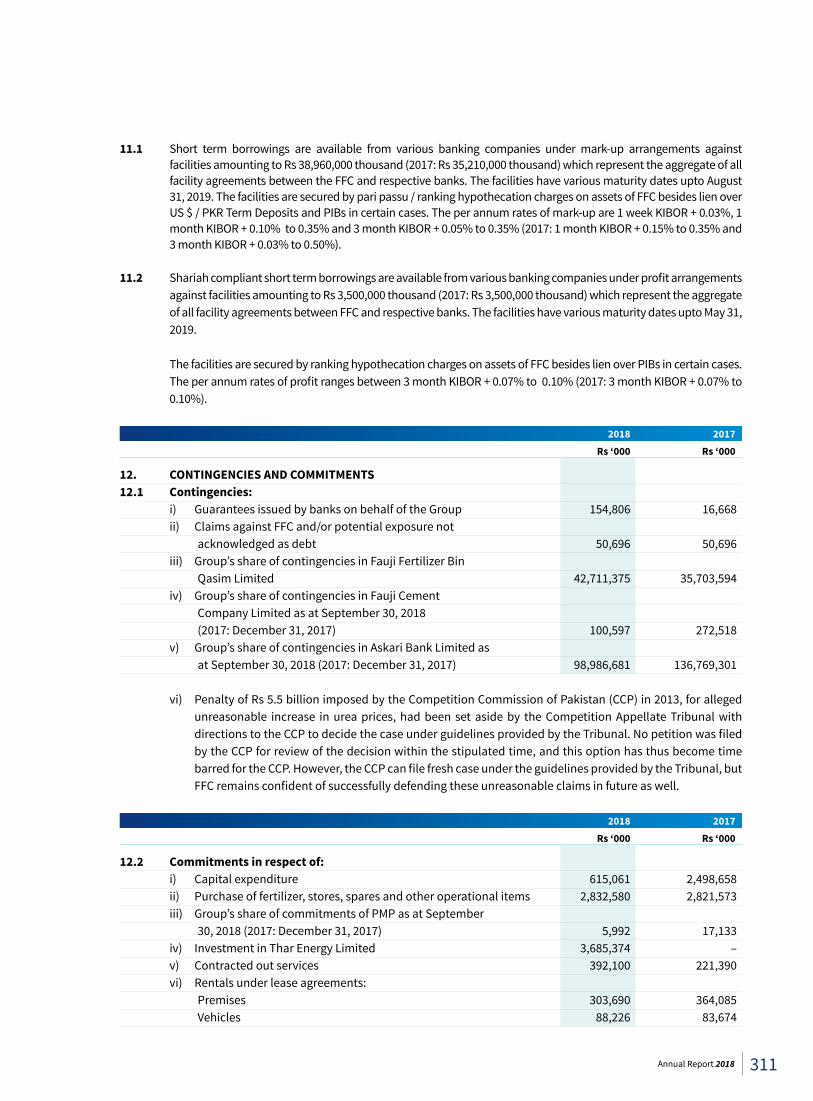
11.1 Short term borrowings are available from various banking companies under mark-up arrangements against facilities amounting to Rs 38,960,000 thousand (2017: Rs 35,210,000 thousand) which represent the aggregate of all facility agreements between the FFC and respective banks. The facilities have various maturity dates upto August 31, 2019. The facilities are secured by pari passu / ranking hypothecation charges on assets of FFC besides lien over US $ / PKR Term Deposits and PIBs in certain cases. The per annum rates of mark-up are 1 week KIBOR + 0.03%, 1 month KIBOR + 0.10% to 0.35% and 3 month KIBOR + 0.05% to 0.35% (2017: 1 month KIBOR + 0.15% to 0.35% and 3 month KIBOR + 0.03% to 0.50%).
11.2 Shariah compliant short term borrowings are available from various banking companies under profit arrangements
against facilities amounting to Rs 3,500,000 thousand (2017: Rs 3,500,000 thousand) which represent the aggregate of all facility agreements between FFC and respective banks. The facilities have various maturity dates upto May 31, 2019.
The facilities are secured by ranking hypothecation charges on assets of FFC besides lien over PIBs in certain cases. The per annum rates of profit ranges between 3 month KIBOR + 0.07% to 0.10% (2017: 3 month KIBOR + 0.07% to 0.10%).
2018 2017 Rs ‘000 Rs ‘000
12. CONTINGENCIES AND COMMITMENTS 12.1 Contingencies: i) Guarantees issued by banks on behalf of the Group 154,806 16,668 ii) Claims against FFC and/or potential exposure not acknowledged as debt 50,696 50,696 iii) Group’s share of contingencies in Fauji Fertilizer Bin Qasim Limited 42,711,375 35,703,594 iv) Group’s share of contingencies in Fauji Cement Company Limited as at September 30, 2018 (2017: December 31, 2017) 100,597 272,518 v) Group’s share of contingencies in Askari Bank Limited as at September 30, 2018 (2017: December 31, 2017) 98,986,681 136,769,301 vi) Penalty of Rs 5.5 billion imposed by the Competition Commission of Pakistan (CCP) in 2013, for alleged
unreasonable increase in urea prices, had been set aside by the Competition Appellate Tribunal with directions to the CCP to decide the case under guidelines provided by the Tribunal. No petition was filed by the CCP for review of the decision within the stipulated time, and this option has thus become time barred for the CCP. However, the CCP can file fresh case under the guidelines provided by the Tribunal, but FFC remains confident of successfully defending these unreasonable claims in future as well.
2018 2017 Rs ‘000 Rs ‘000
12.2 Commitments in respect of: i) Capital expenditure 615,061 2,498,658 ii) Purchase of fertilizer, stores, spares and other operational items 2,832,580 2,821,573 iii) Group’s share of commitments of PMP as at September 30, 2018 (2017: December 31, 2017) 5,992 17,133 iv) Investment in Thar Energy Limited 3,685,374 – v) Contracted out services 392,100 221,390 vi) Rentals under lease agreements: Premises 303,690 364,085 Vehicles 88,226 83,674
311Annual Report 2018
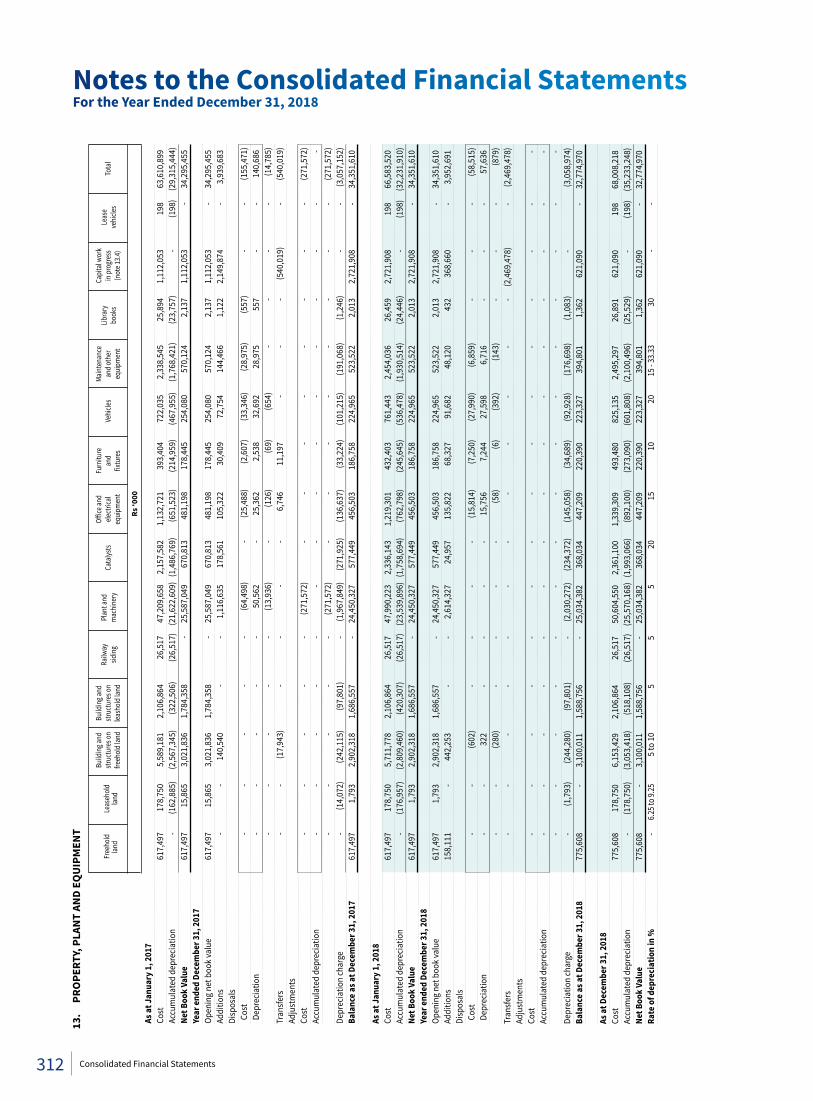
As a
t Jan
uary
1, 2
017
Cost
617
,497
1
78,7
50
5,5
89,1
81
2,1
06,8
64
26,
517
4
7,20
9,65
8
2,1
57,5
82
1,1
32,7
21
393
,404
7
22,0
35
2,3
38,5
45
25,
894
1
,112
,053
1
98
63,
610,
899
Accu
mul
ated
dep
reci
atio
n -
(1
62,8
85)
(2,5
67,3
45)
(322
,506
) (2
6,51
7)
(21,
622,
609)
(1,
486,
769)
(6
51,5
23)
(214
,959
) (4
67,9
55)
(1,7
68,4
21)
(23,
757)
-
(1
98)
(29,
315,
444)
Net B
ook
Valu
e 6
17,4
97
15,
865
3
,021
,836
1
,784
,358
-
2
5,58
7,04
9
670
,813
4
81,1
98
178
,445
2
54,0
80
570
,124
2
,137
1
,112
,053
-
3
4,29
5,45
5 Ye
ar e
nded
Dec
embe
r 31,
201
7 Op
enin
g ne
t boo
k va
lue
617
,497
1
5,86
5
3,0
21,8
36
1,7
84,3
58
-
25,
587,
049
6
70,8
13
481
,198
1
78,4
45
254
,080
5
70,1
24
2,1
37
1,1
12,0
53
-
34,
295,
455
Addi
tions
-
-
1
40,5
40
-
-
1,1
16,6
35
178
,561
1
05,3
22
30,
409
7
2,75
4
144
,466
1
,122
2
,149
,874
-
3
,939
,683
Di
spos
als
Cos
t
-
-
-
-
-
(64,
498)
-
(2
5,48
8)
(2,6
07)
(33,
346)
(2
8,97
5)
(557
) -
-
(1
55,4
71)
Dep
reci
atio
n -
-
-
-
-
5
0,56
2
-
25,
362
2
,538
3
2,69
2
28,
975
5
57
-
-
140
,686
-
-
-
-
-
(1
3,93
6)
-
(126
) (6
9)
(654
) -
-
-
-
(1
4,78
5)Tr
ansf
ers
-
-
(17,
943)
-
-
-
-
6
,746
1
1,19
7
-
-
-
(540
,019
) -
(5
40,0
19)
Adju
stm
ents
Co
st
-
-
-
-
-
(2
71,5
72)
-
-
-
-
-
-
-
-
(271
,572
)Ac
cum
ulat
ed d
epre
ciat
ion
-
-
-
-
-
-
-
-
-
-
-
-
-
-
-
-
-
-
-
-
(271
,572
) -
-
-
-
-
-
-
-
(2
71,5
72)
Depr
ecia
tion
char
ge
-
(14,
072)
(2
42,1
15)
(97,
801)
-
(1
,967
,849
) (2
71,9
25)
(136
,637
) (3
3,22
4)
(101
,215
) (1
91,0
68)
(1,2
46)
-
-
(3,0
57,1
52)
Bala
nce
as a
t Dec
embe
r 31,
201
7 6
17,4
97
1,7
93
2,9
02,3
18
1,6
86,5
57
-
24,
450,
327
5
77,4
49
456
,503
1
86,7
58
224
,965
5
23,5
22
2,0
13
2,7
21,9
08
-
34,
351,
610
As a
t Jan
uary
1, 2
018
Cost
617
,497
1
78,7
50
5,7
11,7
78
2,1
06,8
64
26,
517
4
7,99
0,22
3
2,3
36,1
43
1,2
19,3
01
432
,403
7
61,4
43
2,4
54,0
36
26,
459
2
,721
,908
1
98
66,
583,
520
Accu
mul
ated
dep
reci
atio
n -
(1
76,9
57)
(2,8
09,4
60)
(420
,307
) (2
6,51
7)
(23,
539,
896)
(1,
758,
694)
(7
62,7
98)
(245
,645
) (5
36,4
78)
(1,9
30,5
14)
(24,
446)
-
(1
98)
(32,
231,
910)
Net B
ook
Valu
e 6
17,4
97
1,7
93
2,9
02,3
18
1,6
86,5
57
-
24,
450,
327
5
77,4
49
456
,503
1
86,7
58
224
,965
5
23,5
22
2,0
13
2,7
21,9
08
-
34,
351,
610
Year
end
ed D
ecem
ber 3
1, 2
018
Open
ing
net b
ook
valu
e 6
17,4
97
1,7
93
2,9
02,3
18
1,6
86,5
57
-
24,
450,
327
5
77,4
49
456
,503
1
86,7
58
224
,965
5
23,5
22
2,0
13
2,7
21,9
08
-
34,
351,
610
Addi
tions
1
58,1
11
-
442
,253
-
-
2
,614
,327
2
4,95
7
135
,822
6
8,32
7
91,
682
4
8,12
0
432
3
68,6
60
- 3
,952
,691
Di
spos
als
Cos
t
-
-
(602
) -
-
-
-
(1
5,81
4)
(7,2
50)
(27,
990)
(6
,859
) -
-
-
(5
8,51
5) D
epre
ciat
ion
-
-
322
-
-
-
-
1
5,75
6
7,2
44
27,
598
6
,716
-
-
-
5
7,63
6
-
-
(2
80)
-
-
-
-
(58)
(6
) (3
92)
(143
) -
-
-
(8
79)
Tran
sfer
s -
-
-
-
-
-
-
-
-
-
-
-
(2
,469
,478
) -
(2,4
69,4
78)
Adju
stm
ents
Co
st
-
-
-
-
-
-
-
-
-
-
-
-
-
-
-
Ac
cum
ulat
ed d
epre
ciat
ion
-
-
-
-
-
-
-
-
-
-
-
-
-
-
-
-
-
-
-
-
-
-
-
-
-
-
-
-
-
-
Depr
ecia
tion
char
ge
-
(1,7
93)
(244
,280
) (9
7,80
1)
-
(2,0
30,2
72)
(234
,372
) (1
45,0
58)
(34,
689)
(9
2,92
8)
(176
,698
) (1
,083
) -
(3,0
58,9
74)
Bala
nce
as a
t Dec
embe
r 31,
201
8 7
75,6
08
-
3,1
00,0
11
1,5
88,7
56
-
25,
034,
382
3
68,0
34
447
,209
2
20,3
90
223
,327
3
94,8
01
1,3
62
621
,090
-
3
2,77
4,97
0 As
at D
ecem
ber 3
1, 2
018
Cost
775
,608
1
78,7
50
6,1
53,4
29
2,1
06,8
64
26,
517
5
0,60
4,55
0
2,3
61,1
00
1,3
39,3
09
493
,480
8
25,1
35
2,4
95,2
97
26,
891
6
21,0
90
198
6
8,00
8,21
8 Ac
cum
ulat
ed d
epre
ciat
ion
-
(178
,750
) (3
,053
,418
) (5
18,1
08)
(26,
517)
(2
5,57
0,16
8) (
1,99
3,06
6)
(892
,100
) (2
73,0
90)
(601
,808
) (2
,100
,496
) (2
5,52
9)
-
(198
) (3
5,23
3,24
8)Ne
t Boo
k Va
lue
775
,608
-
3
,100
,011
1
,588
,756
-
2
5,03
4,38
2
368
,034
4
47,2
09
220
,390
2
23,3
27
394
,801
1
,362
6
21,0
90
-
32,
774,
970
Rateofd
epreciationin%
-
6.2
5 to 9
.25
5 to
10
5 5
5 20
15
10
20
15
- 33.3
3 30
-
-
Free
hold
Le
aseh
old
Build
ing a
nd
Build
ing a
nd
Railw
ay
Plan
t and
Ca
talys
ts Off
ice an
d Fu
rnitu
re
Vehi
cles
Main
tena
nce
Libra
ry
Capi
tal w
ork
Leas
e To
tal
land
land
struc
ture
s on
struc
ture
s on
sidin
g m
achi
nery
elect
rical
and
an
d oth
er
book
s in
prog
ress
ve
hicle
s
fre
ehol
d lan
d lea
shol
d lan
d
equi
pmen
t fix
ture
s
equi
pmen
t
(not
e 13.4
)
Rs
‘000
13.
PRO
PERT
Y, P
LAN
T AN
D EQ
UIP
MEN
TNotes to the Consolidated Financial StatementsFor the Year Ended December 31, 2018
312 Consolidated Financial Statements
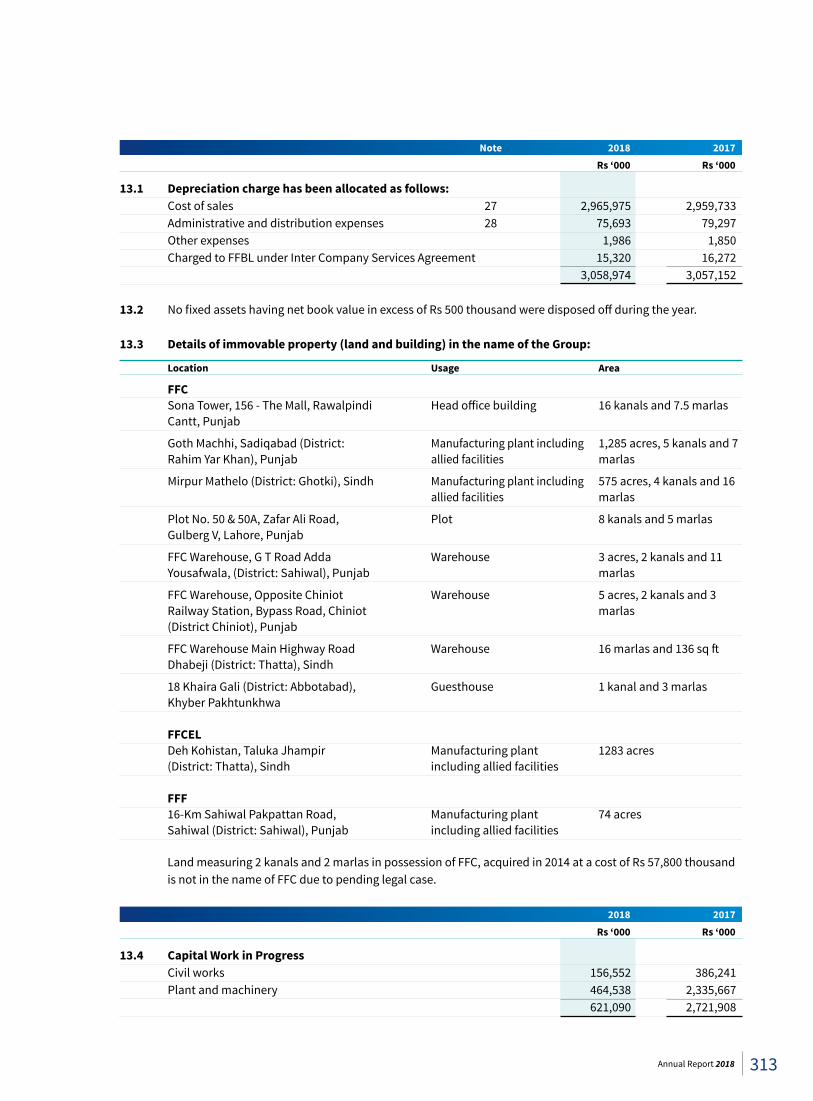
Note 2018 2017 Rs ‘000 Rs ‘000
13.1 Depreciation charge has been allocated as follows: Cost of sales 27 2,965,975 2,959,733 Administrative and distribution expenses 28 75,693 79,297 Other expenses 1,986 1,850 Charged to FFBL under Inter Company Services Agreement 15,320 16,272 3,058,974 3,057,152 13.2 No fixed assets having net book value in excess of Rs 500 thousand were disposed off during the year. 13.3 Details of immovable property (land and building) in the name of the Group:
Location Usage Area
FFC Sona Tower, 156 - The Mall, Rawalpindi Head office building 16 kanals and 7.5 marlas Cantt, Punjab
Goth Machhi, Sadiqabad (District: Manufacturing plant including 1,285 acres, 5 kanals and 7 Rahim Yar Khan), Punjab allied facilities marlas
Mirpur Mathelo (District: Ghotki), Sindh Manufacturing plant including 575 acres, 4 kanals and 16 allied facilities marlas
Plot No. 50 & 50A, Zafar Ali Road, Plot 8 kanals and 5 marlas Gulberg V, Lahore, Punjab
FFC Warehouse, G T Road Adda Warehouse 3 acres, 2 kanals and 11 Yousafwala, (District: Sahiwal), Punjab marlas
FFC Warehouse, Opposite Chiniot Warehouse 5 acres, 2 kanals and 3 Railway Station, Bypass Road, Chiniot marlas (District Chiniot), Punjab
FFC Warehouse Main Highway Road Warehouse 16 marlas and 136 sq ft Dhabeji (District: Thatta), Sindh
18 Khaira Gali (District: Abbotabad), Guesthouse 1 kanal and 3 marlas Khyber Pakhtunkhwa
FFCEL Deh Kohistan, Taluka Jhampir Manufacturing plant 1283 acres (District: Thatta), Sindh including allied facilities
FFF 16-Km Sahiwal Pakpattan Road, Manufacturing plant 74 acres Sahiwal (District: Sahiwal), Punjab including allied facilities
Land measuring 2 kanals and 2 marlas in possession of FFC, acquired in 2014 at a cost of Rs 57,800 thousand is not in the name of FFC due to pending legal case.
2018 2017 Rs ‘000 Rs ‘000
13.4 Capital Work in Progress Civil works 156,552 386,241 Plant and machinery 464,538 2,335,667 621,090 2,721,908
313Annual Report 2018
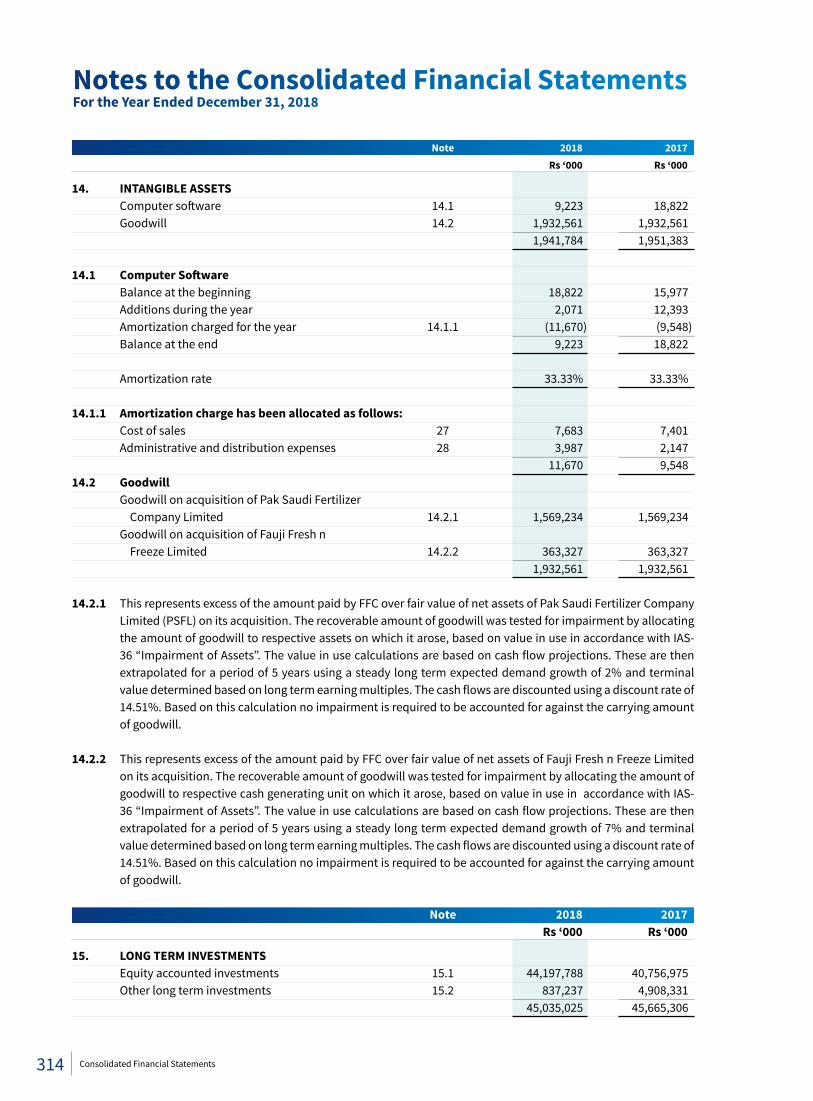
Note 2018 2017 Rs ‘000 Rs ‘000
14. INTANGIBLE ASSETS Computer software 14.1 9,223 18,822 Goodwill 14.2 1,932,561 1,932,561 1,941,784 1,951,383
14.1 ComputerSoftware Balance at the beginning 18,822 15,977 Additions during the year 2,071 12,393 Amortization charged for the year 14.1.1 (11,670) (9,548) Balance at the end 9,223 18,822 Amortization rate 33.33% 33.33% 14.1.1 Amortization charge has been allocated as follows: Cost of sales 27 7,683 7,401 Administrative and distribution expenses 28 3,987 2,147 11,670 9,548 14.2 Goodwill Goodwill on acquisition of Pak Saudi Fertilizer Company Limited 14.2.1 1,569,234 1,569,234 Goodwill on acquisition of Fauji Fresh n Freeze Limited 14.2.2 363,327 363,327 1,932,561 1,932,561 14.2.1 This represents excess of the amount paid by FFC over fair value of net assets of Pak Saudi Fertilizer Company
Limited (PSFL) on its acquisition. The recoverable amount of goodwill was tested for impairment by allocating the amount of goodwill to respective assets on which it arose, based on value in use in accordance with IAS-36 “Impairment of Assets”. The value in use calculations are based on cash flow projections. These are then extrapolated for a period of 5 years using a steady long term expected demand growth of 2% and terminal value determined based on long term earning multiples. The cash flows are discounted using a discount rate of 14.51%. Based on this calculation no impairment is required to be accounted for against the carrying amount of goodwill.
14.2.2 This represents excess of the amount paid by FFC over fair value of net assets of Fauji Fresh n Freeze Limited on its acquisition. The recoverable amount of goodwill was tested for impairment by allocating the amount of goodwill to respective cash generating unit on which it arose, based on value in use in accordance with IAS-36 “Impairment of Assets”. The value in use calculations are based on cash flow projections. These are then extrapolated for a period of 5 years using a steady long term expected demand growth of 7% and terminal value determined based on long term earning multiples. The cash flows are discounted using a discount rate of 14.51%. Based on this calculation no impairment is required to be accounted for against the carrying amount of goodwill.
Note 2018 2017 Rs ‘000 Rs ‘000
15. LONG TERM INVESTMENTS Equity accounted investments 15.1 44,197,788 40,756,975 Other long term investments 15.2 837,237 4,908,331 45,035,025 45,665,306
Notes to the Consolidated Financial StatementsFor the Year Ended December 31, 2018
314 Consolidated Financial Statements
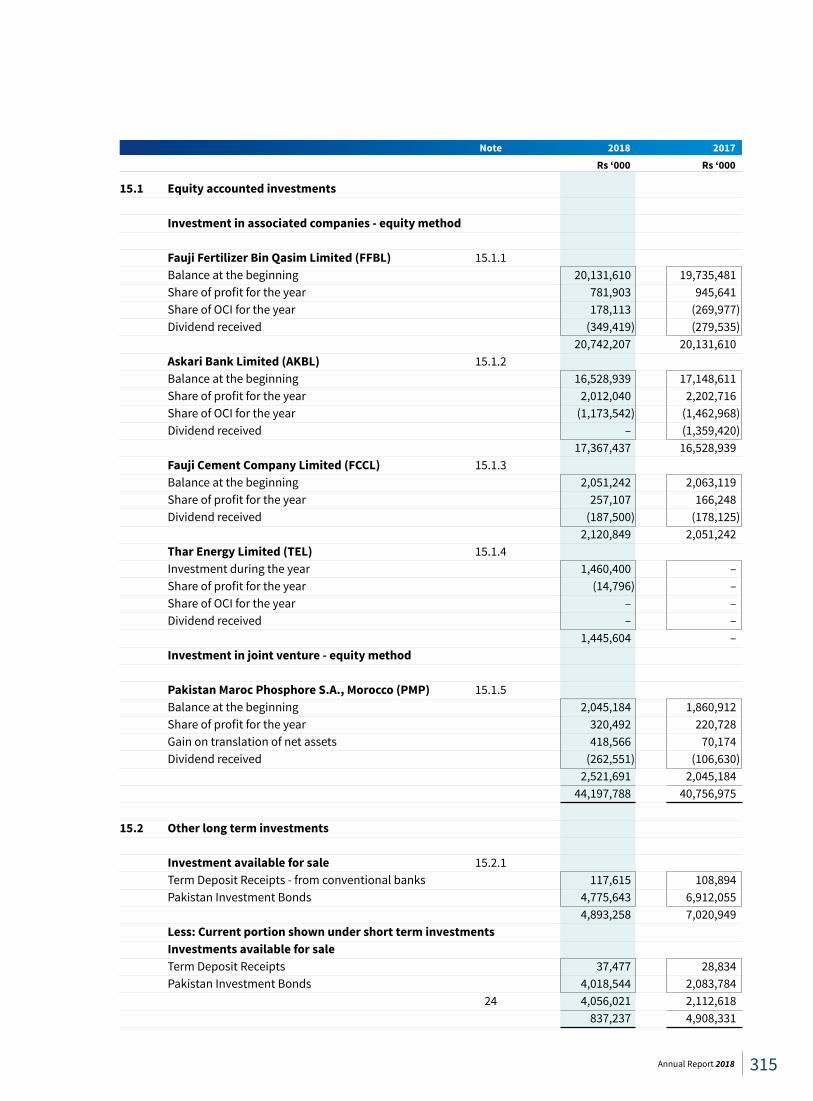
Note 2018 2017 Rs ‘000 Rs ‘000
15.1 Equity accounted investments Investment in associated companies - equity method Fauji Fertilizer Bin Qasim Limited (FFBL) 15.1.1 Balance at the beginning 20,131,610 19,735,481 Share of profit for the year 781,903 945,641 Share of OCI for the year 178,113 (269,977) Dividend received (349,419) (279,535) 20,742,207 20,131,610 Askari Bank Limited (AKBL) 15.1.2 Balance at the beginning 16,528,939 17,148,611 Share of profit for the year 2,012,040 2,202,716 Share of OCI for the year (1,173,542) (1,462,968) Dividend received – (1,359,420) 17,367,437 16,528,939 Fauji Cement Company Limited (FCCL) 15.1.3 Balance at the beginning 2,051,242 2,063,119 Share of profit for the year 257,107 166,248 Dividend received (187,500) (178,125) 2,120,849 2,051,242 Thar Energy Limited (TEL) 15.1.4 Investment during the year 1,460,400 – Share of profit for the year (14,796) – Share of OCI for the year – – Dividend received – – 1,445,604 – Investment in joint venture - equity method Pakistan Maroc Phosphore S.A., Morocco (PMP) 15.1.5 Balance at the beginning 2,045,184 1,860,912 Share of profit for the year 320,492 220,728 Gain on translation of net assets 418,566 70,174 Dividend received (262,551) (106,630) 2,521,691 2,045,184 44,197,788 40,756,975
15.2 Other long term investments Investment available for sale 15.2.1 Term Deposit Receipts - from conventional banks 117,615 108,894 Pakistan Investment Bonds 4,775,643 6,912,055 4,893,258 7,020,949 Less: Current portion shown under short term investments Investments available for sale Term Deposit Receipts 37,477 28,834 Pakistan Investment Bonds 4,018,544 2,083,784 24 4,056,021 2,112,618 837,237 4,908,331
315Annual Report 2018
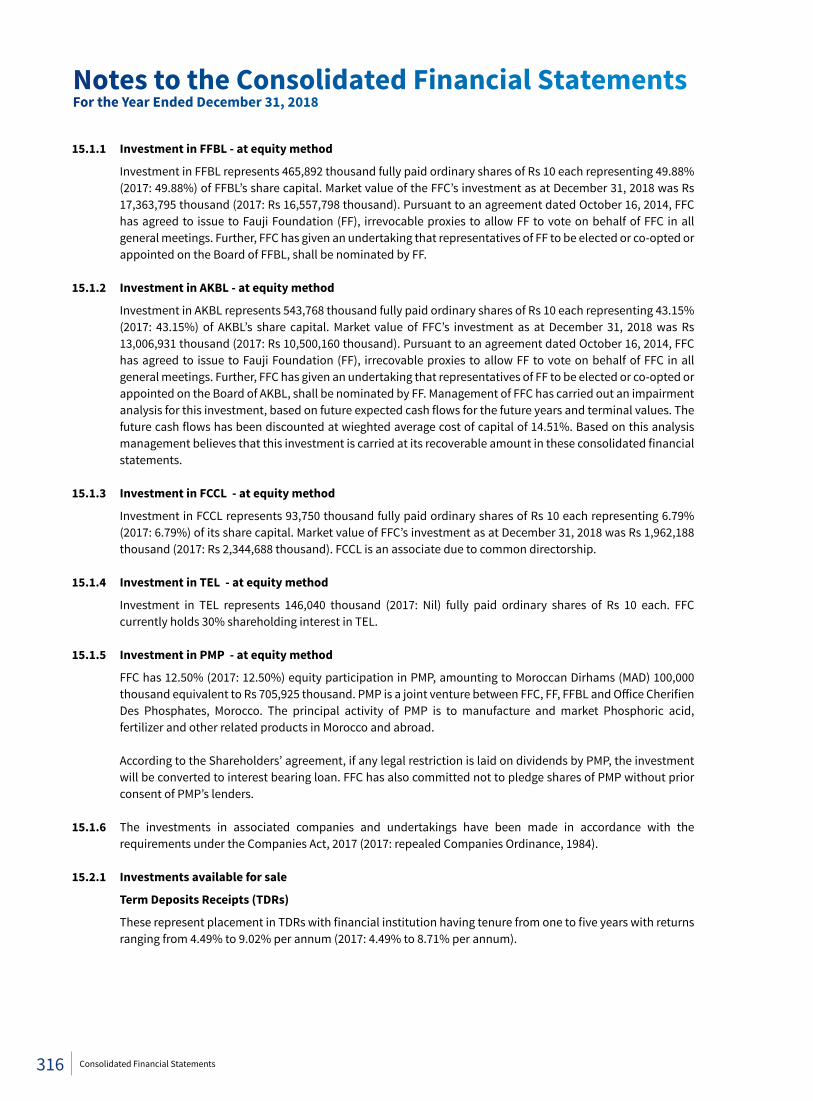
15.1.1 Investment in FFBL - at equity method
Investment in FFBL represents 465,892 thousand fully paid ordinary shares of Rs 10 each representing 49.88% (2017: 49.88%) of FFBL’s share capital. Market value of the FFC’s investment as at December 31, 2018 was Rs 17,363,795 thousand (2017: Rs 16,557,798 thousand). Pursuant to an agreement dated October 16, 2014, FFC has agreed to issue to Fauji Foundation (FF), irrevocable proxies to allow FF to vote on behalf of FFC in all general meetings. Further, FFC has given an undertaking that representatives of FF to be elected or co-opted or appointed on the Board of FFBL, shall be nominated by FF.
15.1.2 Investment in AKBL - at equity method
Investment in AKBL represents 543,768 thousand fully paid ordinary shares of Rs 10 each representing 43.15% (2017: 43.15%) of AKBL’s share capital. Market value of FFC’s investment as at December 31, 2018 was Rs 13,006,931 thousand (2017: Rs 10,500,160 thousand). Pursuant to an agreement dated October 16, 2014, FFC has agreed to issue to Fauji Foundation (FF), irrecovable proxies to allow FF to vote on behalf of FFC in all general meetings. Further, FFC has given an undertaking that representatives of FF to be elected or co-opted or appointed on the Board of AKBL, shall be nominated by FF. Management of FFC has carried out an impairment analysis for this investment, based on future expected cash flows for the future years and terminal values. The future cash flows has been discounted at wieghted average cost of capital of 14.51%. Based on this analysis management believes that this investment is carried at its recoverable amount in these consolidated financial statements.
15.1.3 Investment in FCCL - at equity method
Investment in FCCL represents 93,750 thousand fully paid ordinary shares of Rs 10 each representing 6.79% (2017: 6.79%) of its share capital. Market value of FFC’s investment as at December 31, 2018 was Rs 1,962,188 thousand (2017: Rs 2,344,688 thousand). FCCL is an associate due to common directorship.
15.1.4 Investment in TEL - at equity method
Investment in TEL represents 146,040 thousand (2017: Nil) fully paid ordinary shares of Rs 10 each. FFC currently holds 30% shareholding interest in TEL.
15.1.5 Investment in PMP - at equity method
FFC has 12.50% (2017: 12.50%) equity participation in PMP, amounting to Moroccan Dirhams (MAD) 100,000 thousand equivalent to Rs 705,925 thousand. PMP is a joint venture between FFC, FF, FFBL and Office Cherifien Des Phosphates, Morocco. The principal activity of PMP is to manufacture and market Phosphoric acid, fertilizer and other related products in Morocco and abroad.
According to the Shareholders’ agreement, if any legal restriction is laid on dividends by PMP, the investment will be converted to interest bearing loan. FFC has also committed not to pledge shares of PMP without prior consent of PMP’s lenders.
15.1.6 The investments in associated companies and undertakings have been made in accordance with the
requirements under the Companies Act, 2017 (2017: repealed Companies Ordinance, 1984). 15.2.1 Investments available for sale
Term Deposits Receipts (TDRs)
These represent placement in TDRs with financial institution having tenure from one to five years with returns ranging from 4.49% to 9.02% per annum (2017: 4.49% to 8.71% per annum).
Notes to the Consolidated Financial StatementsFor the Year Ended December 31, 2018
316 Consolidated Financial Statements
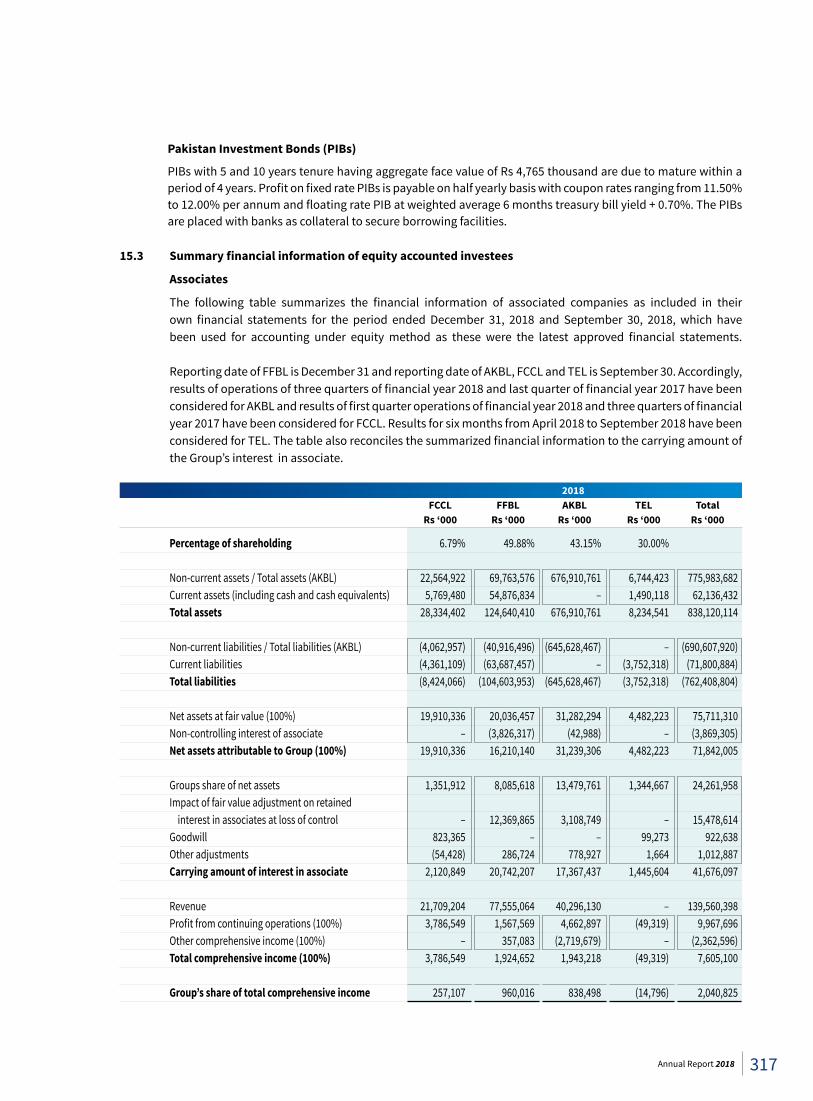
Pakistan Investment Bonds (PIBs)
PIBs with 5 and 10 years tenure having aggregate face value of Rs 4,765 thousand are due to mature within a period of 4 years. Profit on fixed rate PIBs is payable on half yearly basis with coupon rates ranging from 11.50% to 12.00% per annum and floating rate PIB at weighted average 6 months treasury bill yield + 0.70%. The PIBs are placed with banks as collateral to secure borrowing facilities.
15.3 Summaryfinancialinformationofequityaccountedinvestees
Associates
The following table summarizes the financial information of associated companies as included in their own financial statements for the period ended December 31, 2018 and September 30, 2018, which have been used for accounting under equity method as these were the latest approved financial statements. Reporting date of FFBL is December 31 and reporting date of AKBL, FCCL and TEL is September 30. Accordingly, results of operations of three quarters of financial year 2018 and last quarter of financial year 2017 have been considered for AKBL and results of first quarter operations of financial year 2018 and three quarters of financial year 2017 have been considered for FCCL. Results for six months from April 2018 to September 2018 have been considered for TEL. The table also reconciles the summarized financial information to the carrying amount of the Group’s interest in associate.
2018 FCCL FFBL AKBL TEL Total Rs ‘000 Rs ‘000 Rs ‘000 Rs ‘000 Rs ‘000
Percentage of shareholding 6.79% 49.88% 43.15% 30.00% Non-current assets / Total assets (AKBL) 22,564,922 69,763,576 676,910,761 6,744,423 775,983,682 Current assets (including cash and cash equivalents) 5,769,480 54,876,834 – 1,490,118 62,136,432 Total assets 28,334,402 124,640,410 676,910,761 8,234,541 838,120,114 Non-current liabilities / Total liabilities (AKBL) (4,062,957) (40,916,496) (645,628,467) – (690,607,920) Current liabilities (4,361,109) (63,687,457) – (3,752,318) (71,800,884) Total liabilities (8,424,066) (104,603,953) (645,628,467) (3,752,318) (762,408,804) Net assets at fair value (100%) 19,910,336 20,036,457 31,282,294 4,482,223 75,711,310 Non-controlling interest of associate – (3,826,317) (42,988) – (3,869,305) NetassetsattributabletoGroup(100%) 19,910,336 16,210,140 31,239,306 4,482,223 71,842,005 Groups share of net assets 1,351,912 8,085,618 13,479,761 1,344,667 24,261,958 Impact of fair value adjustment on retained interest in associates at loss of control – 12,369,865 3,108,749 – 15,478,614 Goodwill 823,365 – – 99,273 922,638 Other adjustments (54,428) 286,724 778,927 1,664 1,012,887 Carrying amount of interest in associate 2,120,849 20,742,207 17,367,437 1,445,604 41,676,097 Revenue 21,709,204 77,555,064 40,296,130 – 139,560,398 Profit from continuing operations (100%) 3,786,549 1,567,569 4,662,897 (49,319) 9,967,696 Other comprehensive income (100%) – 357,083 (2,719,679) – (2,362,596) Totalcomprehensiveincome(100%) 3,786,549 1,924,652 1,943,218 (49,319) 7,605,100 Group’s share of total comprehensive income 257,107 960,016 838,498 (14,796) 2,040,825
317Annual Report 2018
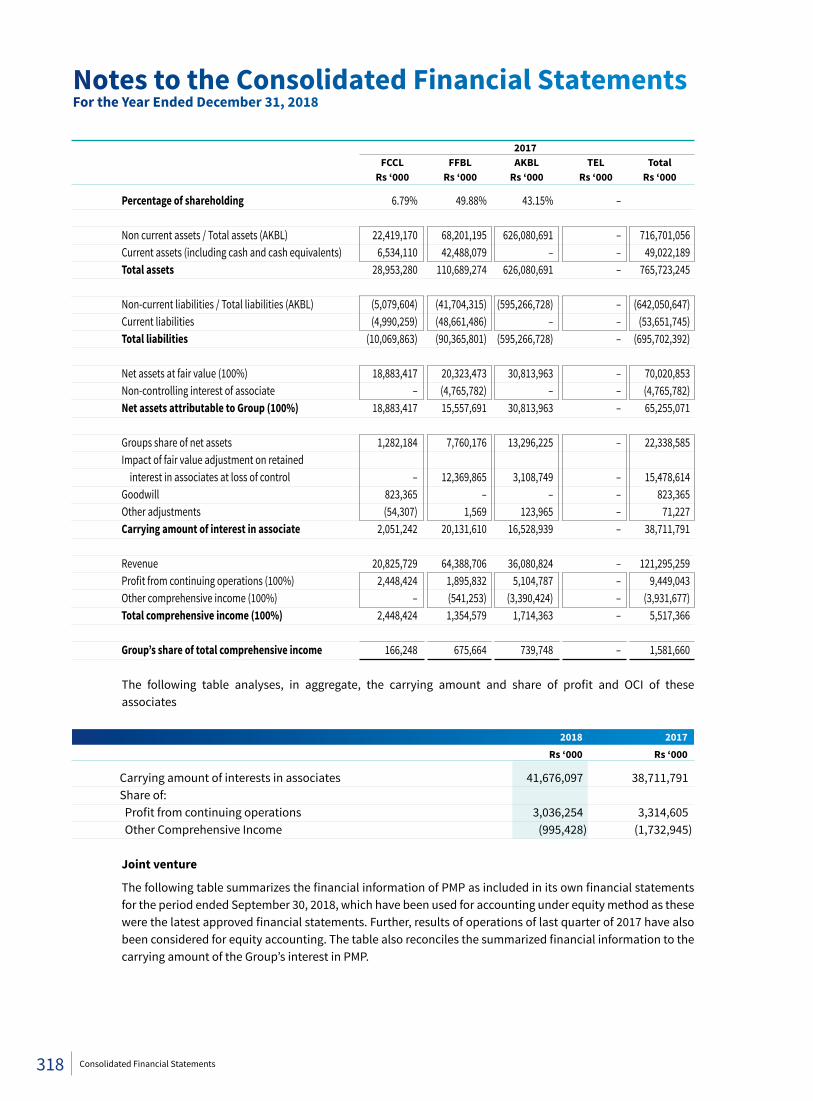
2017 FCCL FFBL AKBL TEL Total Rs ‘000 Rs ‘000 Rs ‘000 Rs ‘000 Rs ‘000
Percentage of shareholding 6.79% 49.88% 43.15% – Non current assets / Total assets (AKBL) 22,419,170 68,201,195 626,080,691 – 716,701,056 Current assets (including cash and cash equivalents) 6,534,110 42,488,079 – – 49,022,189 Total assets 28,953,280 110,689,274 626,080,691 – 765,723,245 Non-current liabilities / Total liabilities (AKBL) (5,079,604) (41,704,315) (595,266,728) – (642,050,647) Current liabilities (4,990,259) (48,661,486) – – (53,651,745) Total liabilities (10,069,863) (90,365,801) (595,266,728) – (695,702,392) Net assets at fair value (100%) 18,883,417 20,323,473 30,813,963 – 70,020,853 Non-controlling interest of associate – (4,765,782) – – (4,765,782) NetassetsattributabletoGroup(100%) 18,883,417 15,557,691 30,813,963 – 65,255,071 Groups share of net assets 1,282,184 7,760,176 13,296,225 – 22,338,585 Impact of fair value adjustment on retained interest in associates at loss of control – 12,369,865 3,108,749 – 15,478,614 Goodwill 823,365 – – – 823,365 Other adjustments (54,307) 1,569 123,965 – 71,227 Carrying amount of interest in associate 2,051,242 20,131,610 16,528,939 – 38,711,791 Revenue 20,825,729 64,388,706 36,080,824 – 121,295,259 Profit from continuing operations (100%) 2,448,424 1,895,832 5,104,787 – 9,449,043 Other comprehensive income (100%) – (541,253) (3,390,424) – (3,931,677) Totalcomprehensiveincome(100%) 2,448,424 1,354,579 1,714,363 – 5,517,366 Group’s share of total comprehensive income 166,248 675,664 739,748 – 1,581,660
The following table analyses, in aggregate, the carrying amount and share of profit and OCI of these associates
2018 2017 Rs ‘000 Rs ‘000
Carrying amount of interests in associates 41,676,097 38,711,791 Share of: Profit from continuing operations 3,036,254 3,314,605 Other Comprehensive Income (995,428) (1,732,945) Joint venture
The following table summarizes the financial information of PMP as included in its own financial statements for the period ended September 30, 2018, which have been used for accounting under equity method as these were the latest approved financial statements. Further, results of operations of last quarter of 2017 have also been considered for equity accounting. The table also reconciles the summarized financial information to the carrying amount of the Group’s interest in PMP.
Notes to the Consolidated Financial StatementsFor the Year Ended December 31, 2018
318 Consolidated Financial Statements
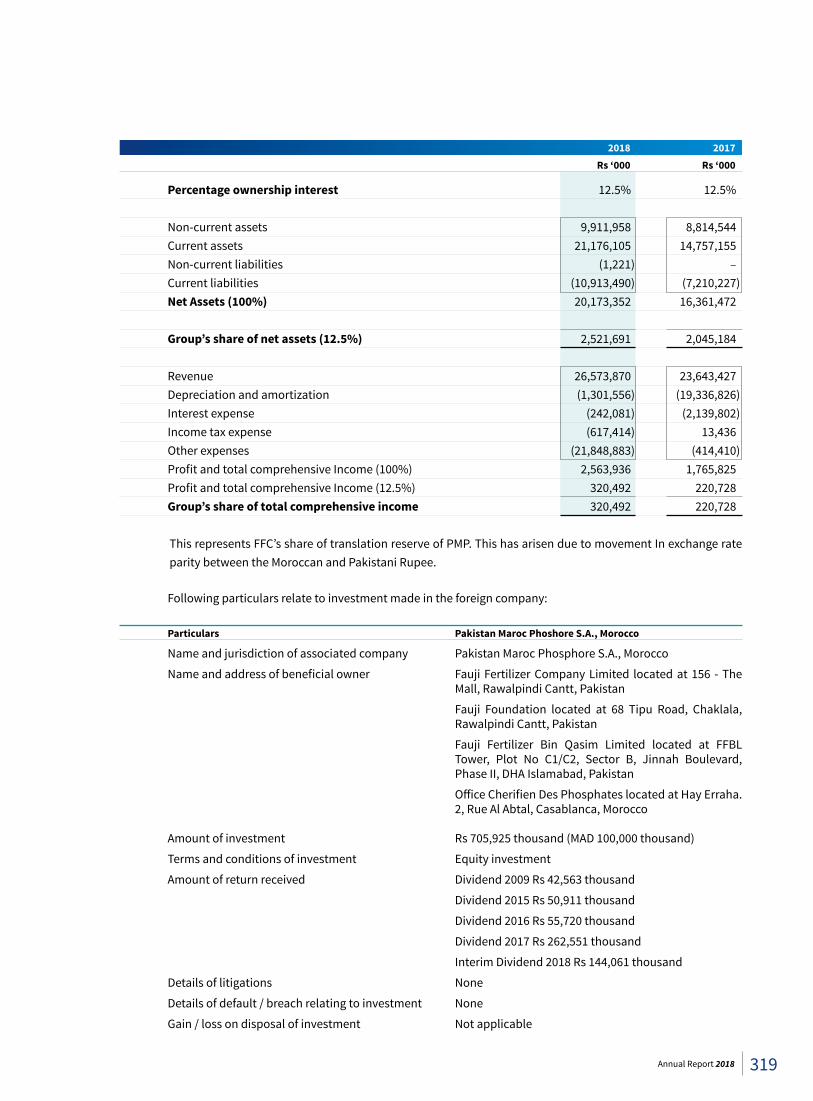
2018 2017 Rs ‘000 Rs ‘000
Percentage ownership interest 12.5% 12.5%
Non-current assets 9,911,958 8,814,544 Current assets 21,176,105 14,757,155 Non-current liabilities (1,221) – Current liabilities (10,913,490) (7,210,227) NetAssets(100%) 20,173,352 16,361,472 Group’sshareofnetassets(12.5%) 2,521,691 2,045,184 Revenue 26,573,870 23,643,427 Depreciation and amortization (1,301,556) (19,336,826) Interest expense (242,081) (2,139,802) Income tax expense (617,414) 13,436 Other expenses (21,848,883) (414,410) Profit and total comprehensive Income (100%) 2,563,936 1,765,825 Profit and total comprehensive Income (12.5%) 320,492 220,728 Group’s share of total comprehensive income 320,492 220,728 This represents FFC’s share of translation reserve of PMP. This has arisen due to movement In exchange rate
parity between the Moroccan and Pakistani Rupee.
Following particulars relate to investment made in the foreign company:
Particulars Pakistan Maroc Phoshore S.A., Morocco
Name and jurisdiction of associated company Pakistan Maroc Phosphore S.A., Morocco
Name and address of beneficial owner Fauji Fertilizer Company Limited located at 156 - The Mall, Rawalpindi Cantt, Pakistan
Fauji Foundation located at 68 Tipu Road, Chaklala, Rawalpindi Cantt, Pakistan
Fauji Fertilizer Bin Qasim Limited located at FFBL Tower, Plot No C1/C2, Sector B, Jinnah Boulevard, Phase II, DHA Islamabad, Pakistan
Office Cherifien Des Phosphates located at Hay Erraha. 2, Rue Al Abtal, Casablanca, Morocco
Amount of investment Rs 705,925 thousand (MAD 100,000 thousand)
Terms and conditions of investment Equity investment
Amount of return received Dividend 2009 Rs 42,563 thousand
Dividend 2015 Rs 50,911 thousand
Dividend 2016 Rs 55,720 thousand
Dividend 2017 Rs 262,551 thousand
Interim Dividend 2018 Rs 144,061 thousand
Details of litigations None
Details of default / breach relating to investment None
Gain / loss on disposal of investment Not applicable
319Annual Report 2018
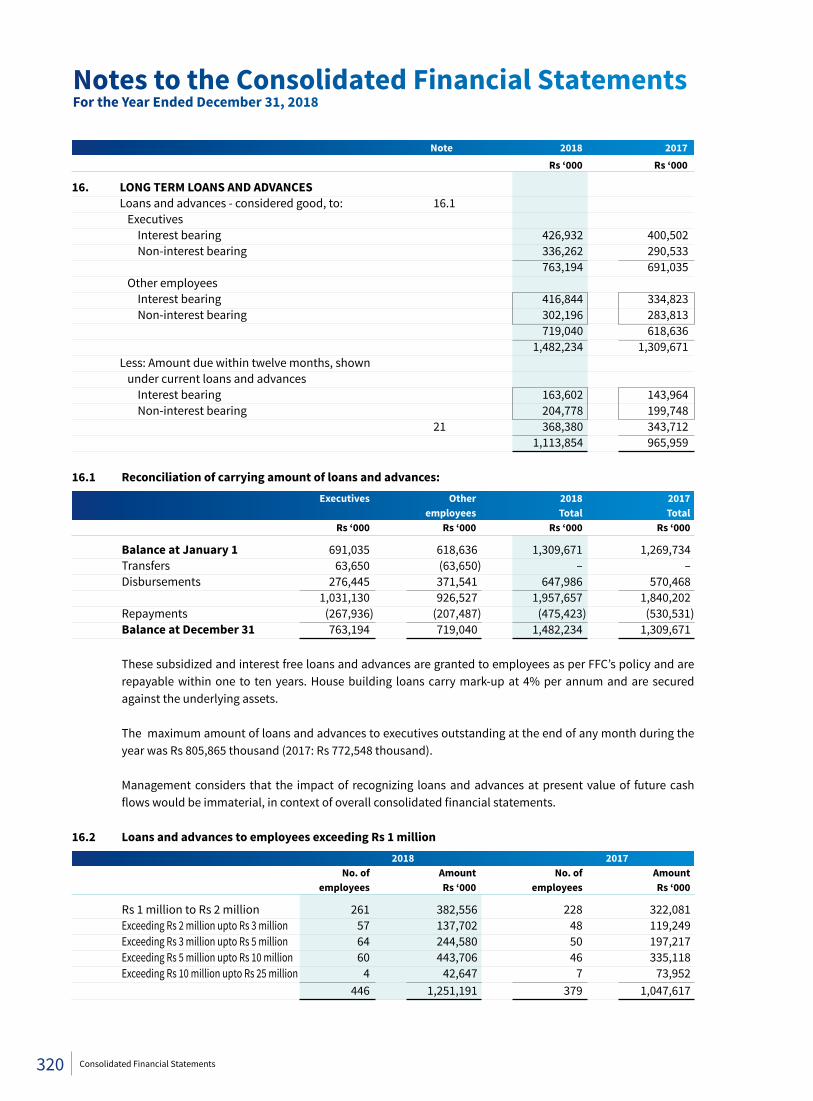
Note 2018 2017 Rs ‘000 Rs ‘000
16. LONG TERM LOANS AND ADVANCES Loans and advances - considered good, to: 16.1 Executives Interest bearing 426,932 400,502 Non-interest bearing 336,262 290,533 763,194 691,035 Other employees Interest bearing 416,844 334,823 Non-interest bearing 302,196 283,813 719,040 618,636 1,482,234 1,309,671 Less: Amount due within twelve months, shown under current loans and advances Interest bearing 163,602 143,964 Non-interest bearing 204,778 199,748 21 368,380 343,712 1,113,854 965,959 16.1 Reconciliation of carrying amount of loans and advances: Executives Other 2018 2017 employees Total Total Rs ‘000 Rs ‘000 Rs ‘000 Rs ‘000
Balance at January 1 691,035 618,636 1,309,671 1,269,734 Transfers 63,650 (63,650) – – Disbursements 276,445 371,541 647,986 570,468 1,031,130 926,527 1,957,657 1,840,202 Repayments (267,936) (207,487) (475,423) (530,531) Balance at December 31 763,194 719,040 1,482,234 1,309,671 These subsidized and interest free loans and advances are granted to employees as per FFC’s policy and are
repayable within one to ten years. House building loans carry mark-up at 4% per annum and are secured against the underlying assets.
The maximum amount of loans and advances to executives outstanding at the end of any month during the year was Rs 805,865 thousand (2017: Rs 772,548 thousand).
Management considers that the impact of recognizing loans and advances at present value of future cash
flows would be immaterial, in context of overall consolidated financial statements. 16.2 Loans and advances to employees exceeding Rs 1 million 2018 2017 No. of Amount No. of Amount employees Rs ‘000 employees Rs ‘000
Rs 1 million to Rs 2 million 261 382,556 228 322,081 Exceeding Rs 2 million upto Rs 3 million 57 137,702 48 119,249 Exceeding Rs 3 million upto Rs 5 million 64 244,580 50 197,217 Exceeding Rs 5 million upto Rs 10 million 60 443,706 46 335,118 Exceeding Rs 10 million upto Rs 25 million 4 42,647 7 73,952 446 1,251,191 379 1,047,617
Notes to the Consolidated Financial StatementsFor the Year Ended December 31, 2018
320 Consolidated Financial Statements
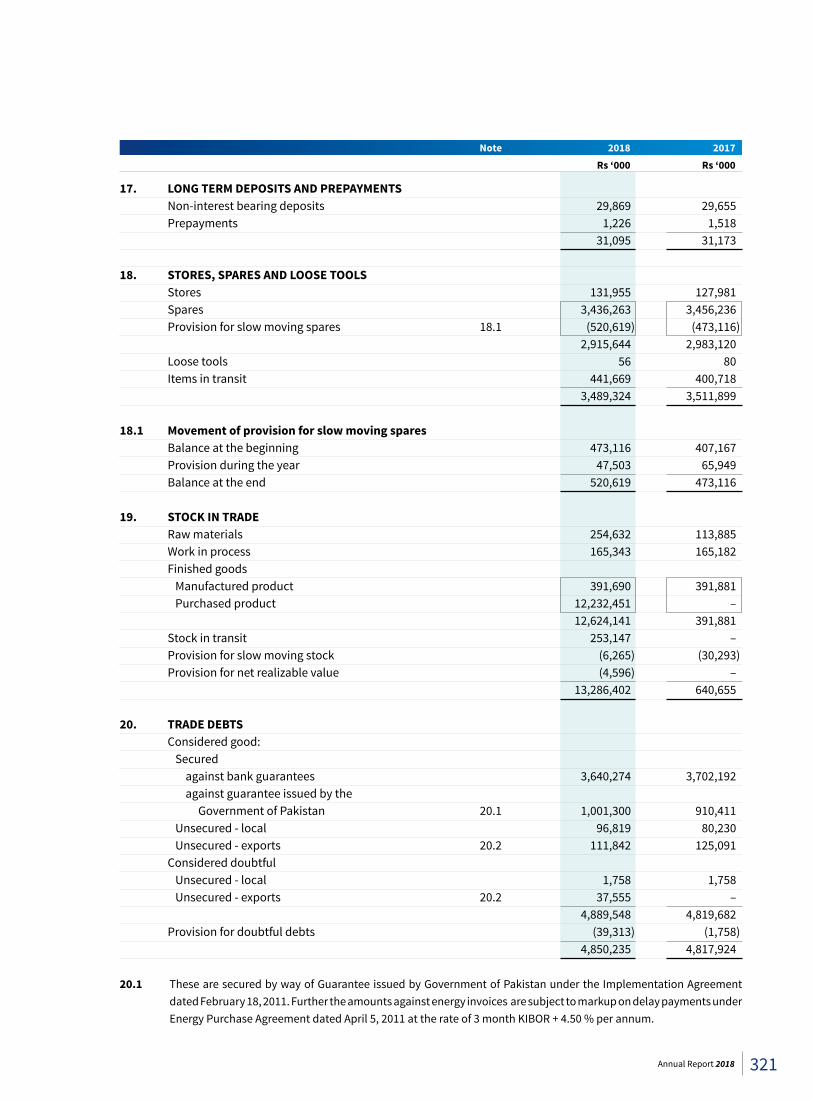
Note 2018 2017 Rs ‘000 Rs ‘000
17. LONG TERM DEPOSITS AND PREPAYMENTS Non-interest bearing deposits 29,869 29,655 Prepayments 1,226 1,518 31,095 31,173 18. STORES, SPARES AND LOOSE TOOLS Stores 131,955 127,981 Spares 3,436,263 3,456,236 Provision for slow moving spares 18.1 (520,619) (473,116) 2,915,644 2,983,120 Loose tools 56 80 Items in transit 441,669 400,718 3,489,324 3,511,899 18.1 Movement of provision for slow moving spares Balance at the beginning 473,116 407,167 Provision during the year 47,503 65,949 Balance at the end 520,619 473,116 19. STOCK IN TRADE Raw materials 254,632 113,885 Work in process 165,343 165,182 Finished goods Manufactured product 391,690 391,881 Purchased product 12,232,451 – 12,624,141 391,881 Stock in transit 253,147 – Provision for slow moving stock (6,265) (30,293) Provision for net realizable value (4,596) – 13,286,402 640,655
20. TRADE DEBTS Considered good: Secured against bank guarantees 3,640,274 3,702,192 against guarantee issued by the Government of Pakistan 20.1 1,001,300 910,411 Unsecured - local 96,819 80,230 Unsecured - exports 20.2 111,842 125,091 Considered doubtful Unsecured - local 1,758 1,758 Unsecured - exports 20.2 37,555 – 4,889,548 4,819,682 Provision for doubtful debts (39,313) (1,758) 4,850,235 4,817,924 20.1 These are secured by way of Guarantee issued by Government of Pakistan under the Implementation Agreement
dated February 18, 2011. Further the amounts against energy invoices are subject to markup on delay payments under Energy Purchase Agreement dated April 5, 2011 at the rate of 3 month KIBOR + 4.50 % per annum.
321Annual Report 2018
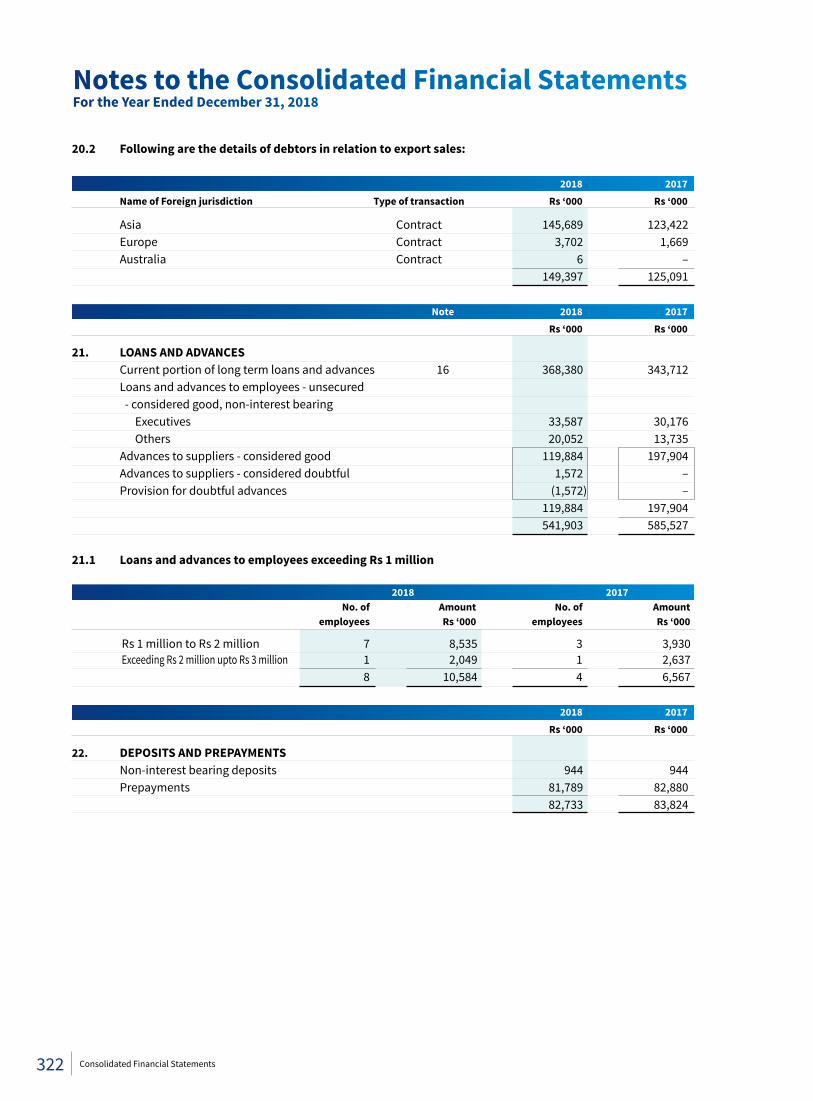
20.2 Following are the details of debtors in relation to export sales:
2018 2017 Name of Foreign jurisdiction Type of transaction Rs ‘000 Rs ‘000
Asia Contract 145,689 123,422 Europe Contract 3,702 1,669 Australia Contract 6 – 149,397 125,091
Note 2018 2017 Rs ‘000 Rs ‘000
21. LOANS AND ADVANCES Current portion of long term loans and advances 16 368,380 343,712 Loans and advances to employees - unsecured - considered good, non-interest bearing Executives 33,587 30,176 Others 20,052 13,735 Advances to suppliers - considered good 119,884 197,904 Advances to suppliers - considered doubtful 1,572 – Provision for doubtful advances (1,572) – 119,884 197,904 541,903 585,527 21.1 Loans and advances to employees exceeding Rs 1 million 2018 2017 No. of Amount No. of Amount employees Rs ‘000 employees Rs ‘000
Rs 1 million to Rs 2 million 7 8,535 3 3,930 Exceeding Rs 2 million upto Rs 3 million 1 2,049 1 2,637 8 10,584 4 6,567 2018 2017 Rs ‘000 Rs ‘000
22. DEPOSITS AND PREPAYMENTS Non-interest bearing deposits 944 944 Prepayments 81,789 82,880 82,733 83,824
Notes to the Consolidated Financial StatementsFor the Year Ended December 31, 2018
322 Consolidated Financial Statements
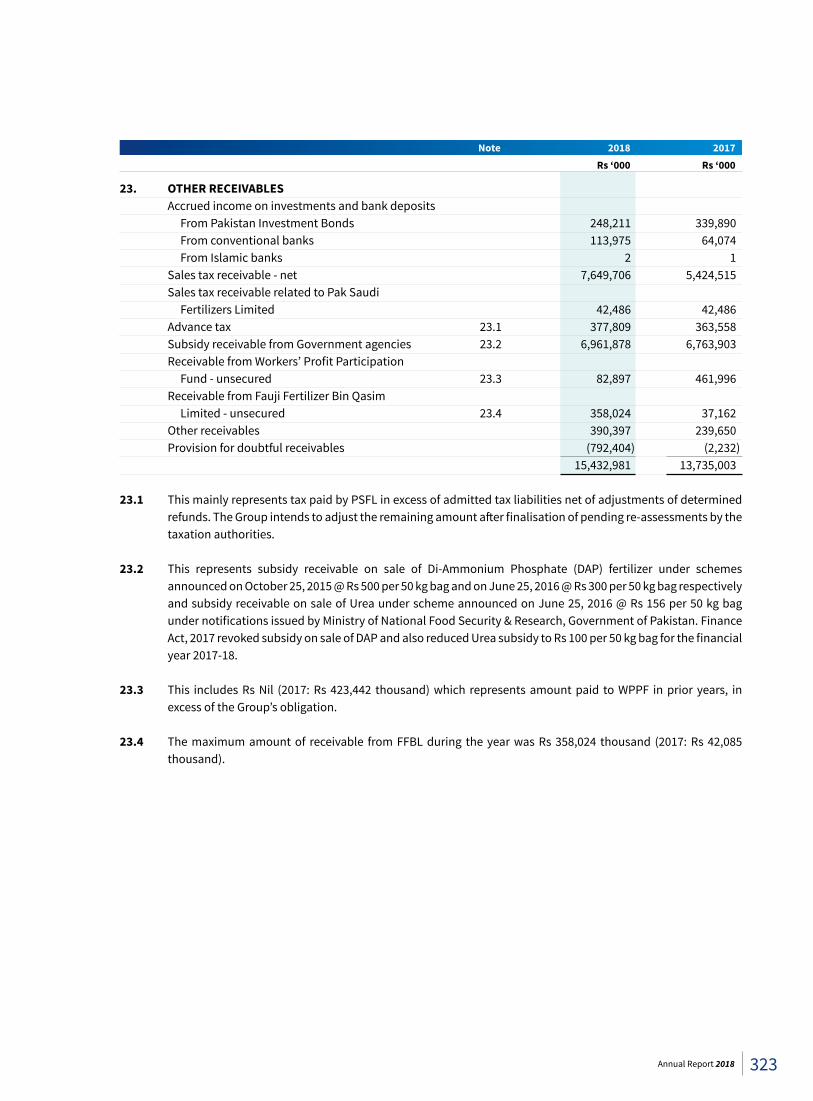
Note 2018 2017 Rs ‘000 Rs ‘000
23. OTHER RECEIVABLES Accrued income on investments and bank deposits From Pakistan Investment Bonds 248,211 339,890 From conventional banks 113,975 64,074 From Islamic banks 2 1 Sales tax receivable - net 7,649,706 5,424,515 Sales tax receivable related to Pak Saudi Fertilizers Limited 42,486 42,486 Advance tax 23.1 377,809 363,558 Subsidy receivable from Government agencies 23.2 6,961,878 6,763,903 Receivable from Workers’ Profit Participation Fund - unsecured 23.3 82,897 461,996 Receivable from Fauji Fertilizer Bin Qasim Limited - unsecured 23.4 358,024 37,162 Other receivables 390,397 239,650 Provision for doubtful receivables (792,404) (2,232) 15,432,981 13,735,003 23.1 This mainly represents tax paid by PSFL in excess of admitted tax liabilities net of adjustments of determined
refunds. The Group intends to adjust the remaining amount after finalisation of pending re-assessments by the taxation authorities.
23.2 This represents subsidy receivable on sale of Di-Ammonium Phosphate (DAP) fertilizer under schemes announced on October 25, 2015 @ Rs 500 per 50 kg bag and on June 25, 2016 @ Rs 300 per 50 kg bag respectively and subsidy receivable on sale of Urea under scheme announced on June 25, 2016 @ Rs 156 per 50 kg bag under notifications issued by Ministry of National Food Security & Research, Government of Pakistan. Finance Act, 2017 revoked subsidy on sale of DAP and also reduced Urea subsidy to Rs 100 per 50 kg bag for the financial year 2017-18.
23.3 This includes Rs Nil (2017: Rs 423,442 thousand) which represents amount paid to WPPF in prior years, in
excess of the Group’s obligation. 23.4 The maximum amount of receivable from FFBL during the year was Rs 358,024 thousand (2017: Rs 42,085
thousand).
323Annual Report 2018
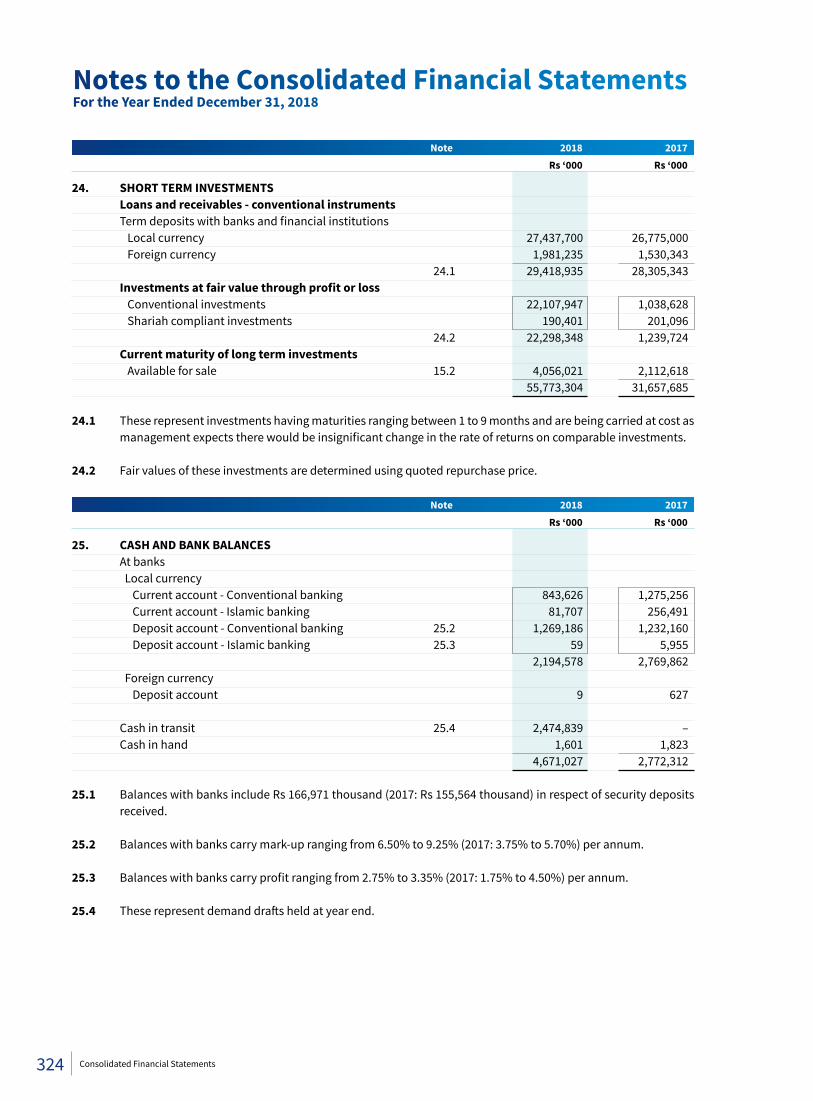
Note 2018 2017 Rs ‘000 Rs ‘000
24. SHORT TERM INVESTMENTS Loans and receivables - conventional instruments Term deposits with banks and financial institutions Local currency 27,437,700 26,775,000 Foreign currency 1,981,235 1,530,343 24.1 29,418,935 28,305,343 Investmentsatfairvaluethroughprofitorloss Conventional investments 22,107,947 1,038,628 Shariah compliant investments 190,401 201,096 24.2 22,298,348 1,239,724 Current maturity of long term investments Available for sale 15.2 4,056,021 2,112,618 55,773,304 31,657,685 24.1 These represent investments having maturities ranging between 1 to 9 months and are being carried at cost as
management expects there would be insignificant change in the rate of returns on comparable investments. 24.2 Fair values of these investments are determined using quoted repurchase price. Note 2018 2017 Rs ‘000 Rs ‘000
25. CASH AND BANK BALANCES At banks Local currency Current account - Conventional banking 843,626 1,275,256 Current account - Islamic banking 81,707 256,491 Deposit account - Conventional banking 25.2 1,269,186 1,232,160 Deposit account - Islamic banking 25.3 59 5,955 2,194,578 2,769,862 Foreign currency Deposit account 9 627 Cash in transit 25.4 2,474,839 – Cash in hand 1,601 1,823 4,671,027 2,772,312 25.1 Balances with banks include Rs 166,971 thousand (2017: Rs 155,564 thousand) in respect of security deposits
received. 25.2 Balances with banks carry mark-up ranging from 6.50% to 9.25% (2017: 3.75% to 5.70%) per annum. 25.3 Balances with banks carry profit ranging from 2.75% to 3.35% (2017: 1.75% to 4.50%) per annum.
25.4 These represent demand drafts held at year end.
Notes to the Consolidated Financial StatementsFor the Year Ended December 31, 2018
324 Consolidated Financial Statements
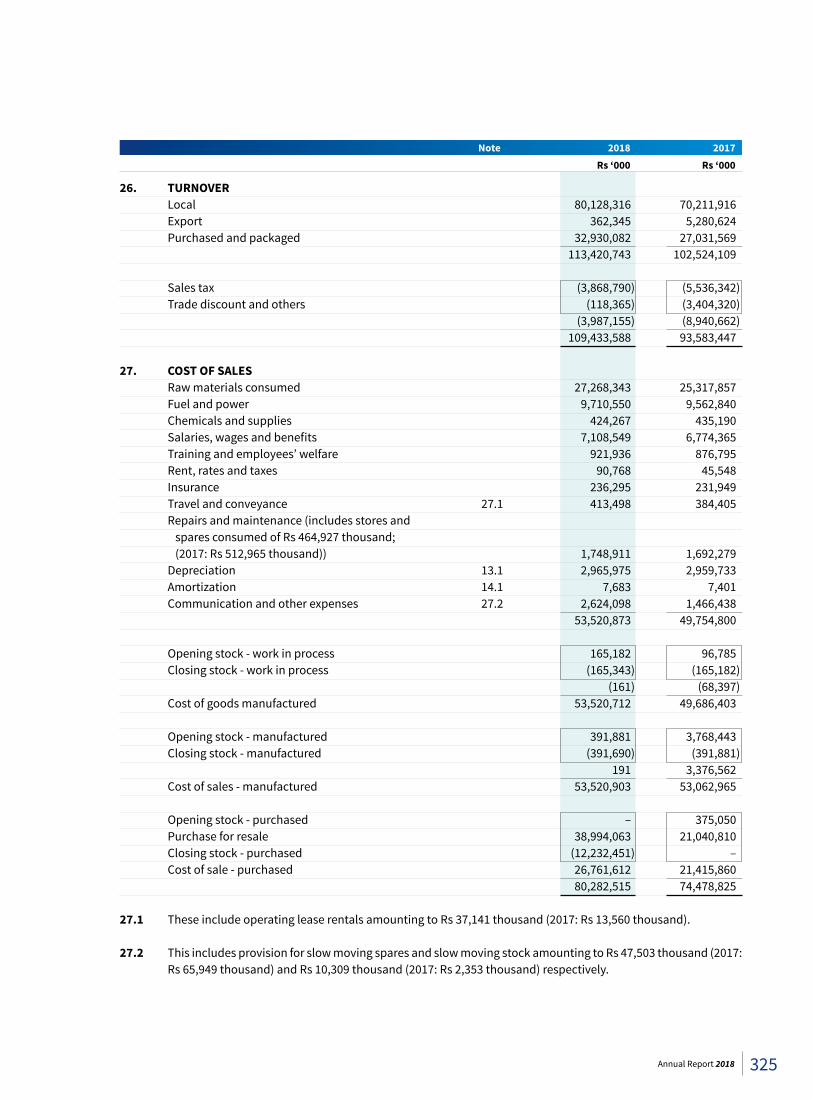
Note 2018 2017 Rs ‘000 Rs ‘000
26. TURNOVER Local 80,128,316 70,211,916 Export 362,345 5,280,624 Purchased and packaged 32,930,082 27,031,569 113,420,743 102,524,109 Sales tax (3,868,790) (5,536,342) Trade discount and others (118,365) (3,404,320) (3,987,155) (8,940,662) 109,433,588 93,583,447 27. COST OF SALES Raw materials consumed 27,268,343 25,317,857 Fuel and power 9,710,550 9,562,840 Chemicals and supplies 424,267 435,190 Salaries, wages and benefits 7,108,549 6,774,365 Training and employees’ welfare 921,936 876,795 Rent, rates and taxes 90,768 45,548 Insurance 236,295 231,949 Travel and conveyance 27.1 413,498 384,405 Repairs and maintenance (includes stores and spares consumed of Rs 464,927 thousand; (2017: Rs 512,965 thousand)) 1,748,911 1,692,279 Depreciation 13.1 2,965,975 2,959,733 Amortization 14.1 7,683 7,401 Communication and other expenses 27.2 2,624,098 1,466,438 53,520,873 49,754,800 Opening stock - work in process 165,182 96,785 Closing stock - work in process (165,343) (165,182) (161) (68,397) Cost of goods manufactured 53,520,712 49,686,403 Opening stock - manufactured 391,881 3,768,443 Closing stock - manufactured (391,690) (391,881) 191 3,376,562 Cost of sales - manufactured 53,520,903 53,062,965 Opening stock - purchased – 375,050 Purchase for resale 38,994,063 21,040,810 Closing stock - purchased (12,232,451) – Cost of sale - purchased 26,761,612 21,415,860 80,282,515 74,478,825 27.1 These include operating lease rentals amounting to Rs 37,141 thousand (2017: Rs 13,560 thousand). 27.2 This includes provision for slow moving spares and slow moving stock amounting to Rs 47,503 thousand (2017:
Rs 65,949 thousand) and Rs 10,309 thousand (2017: Rs 2,353 thousand) respectively.
325Annual Report 2018
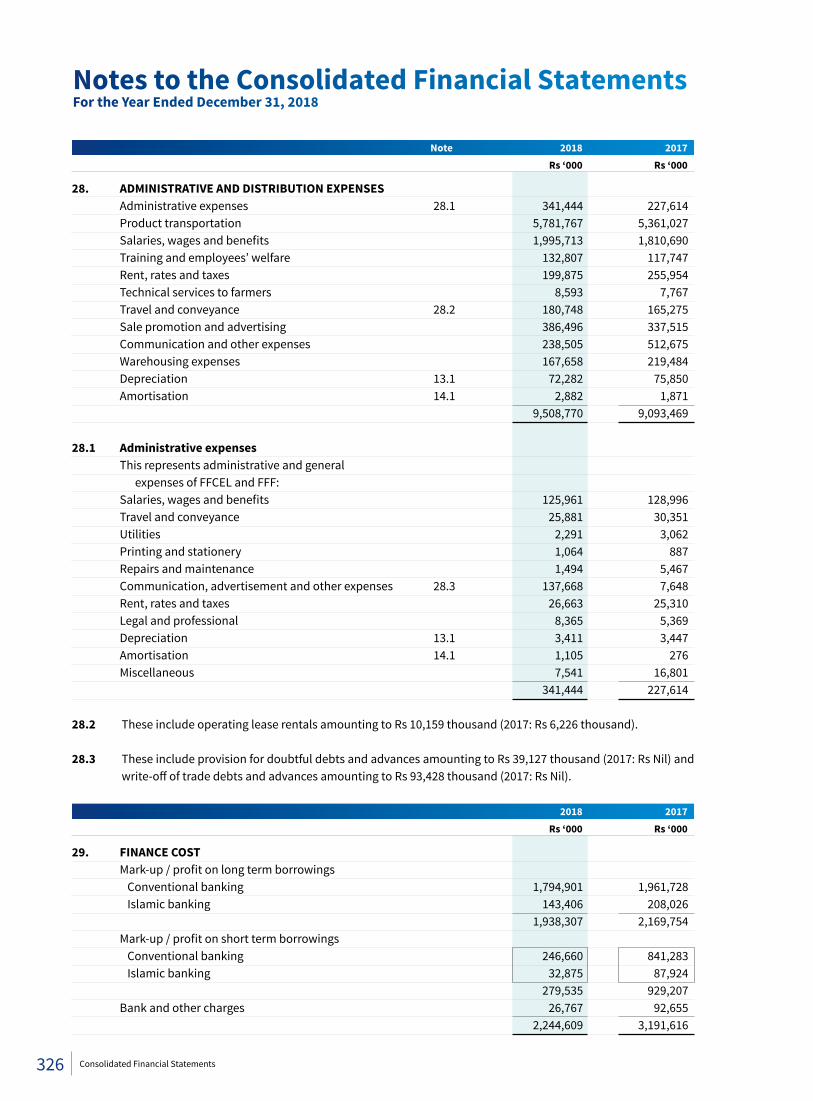
Note 2018 2017 Rs ‘000 Rs ‘000
28. ADMINISTRATIVE AND DISTRIBUTION EXPENSES Administrative expenses 28.1 341,444 227,614 Product transportation 5,781,767 5,361,027 Salaries, wages and benefits 1,995,713 1,810,690 Training and employees’ welfare 132,807 117,747 Rent, rates and taxes 199,875 255,954 Technical services to farmers 8,593 7,767 Travel and conveyance 28.2 180,748 165,275 Sale promotion and advertising 386,496 337,515 Communication and other expenses 238,505 512,675 Warehousing expenses 167,658 219,484 Depreciation 13.1 72,282 75,850 Amortisation 14.1 2,882 1,871 9,508,770 9,093,469 28.1 Administrative expenses This represents administrative and general expenses of FFCEL and FFF: Salaries, wages and benefits 125,961 128,996 Travel and conveyance 25,881 30,351 Utilities 2,291 3,062 Printing and stationery 1,064 887 Repairs and maintenance 1,494 5,467 Communication, advertisement and other expenses 28.3 137,668 7,648 Rent, rates and taxes 26,663 25,310 Legal and professional 8,365 5,369 Depreciation 13.1 3,411 3,447 Amortisation 14.1 1,105 276 Miscellaneous 7,541 16,801 341,444 227,614 28.2 These include operating lease rentals amounting to Rs 10,159 thousand (2017: Rs 6,226 thousand). 28.3 These include provision for doubtful debts and advances amounting to Rs 39,127 thousand (2017: Rs Nil) and
write-off of trade debts and advances amounting to Rs 93,428 thousand (2017: Rs Nil). 2018 2017 Rs ‘000 Rs ‘000
29. FINANCE COST Mark-up / profit on long term borrowings Conventional banking 1,794,901 1,961,728 Islamic banking 143,406 208,026 1,938,307 2,169,754 Mark-up / profit on short term borrowings Conventional banking 246,660 841,283 Islamic banking 32,875 87,924 279,535 929,207 Bank and other charges 26,767 92,655 2,244,609 3,191,616
Notes to the Consolidated Financial StatementsFor the Year Ended December 31, 2018
326 Consolidated Financial Statements
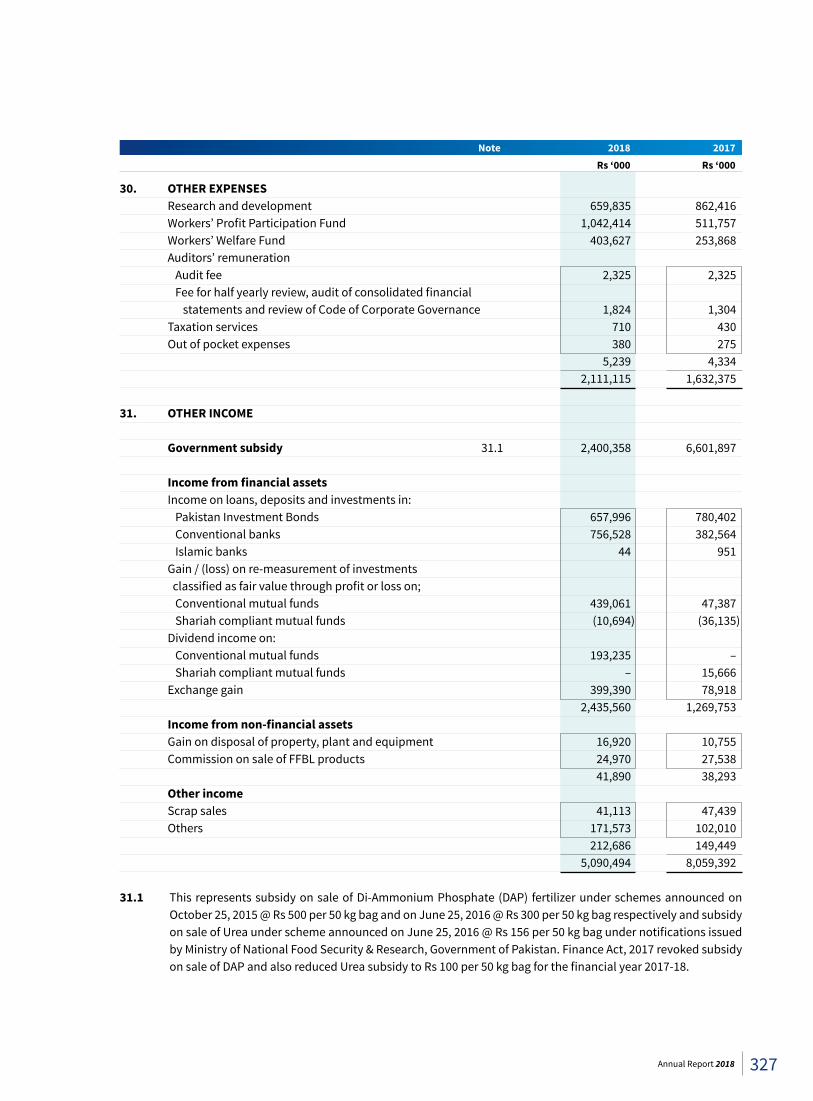
Note 2018 2017 Rs ‘000 Rs ‘000
30. OTHER EXPENSES Research and development 659,835 862,416 Workers’ Profit Participation Fund 1,042,414 511,757 Workers’ Welfare Fund 403,627 253,868 Auditors’ remuneration Audit fee 2,325 2,325 Fee for half yearly review, audit of consolidated financial statements and review of Code of Corporate Governance 1,824 1,304 Taxation services 710 430 Out of pocket expenses 380 275 5,239 4,334 2,111,115 1,632,375
31. OTHER INCOME
Government subsidy 31.1 2,400,358 6,601,897
Incomefromfinancialassets Income on loans, deposits and investments in: Pakistan Investment Bonds 657,996 780,402 Conventional banks 756,528 382,564 Islamic banks 44 951 Gain / (loss) on re-measurement of investments classified as fair value through profit or loss on; Conventional mutual funds 439,061 47,387 Shariah compliant mutual funds (10,694) (36,135) Dividend income on: Conventional mutual funds 193,235 – Shariah compliant mutual funds – 15,666 Exchange gain 399,390 78,918 2,435,560 1,269,753 Incomefromnon-financialassets Gain on disposal of property, plant and equipment 16,920 10,755 Commission on sale of FFBL products 24,970 27,538 41,890 38,293 Other income Scrap sales 41,113 47,439 Others 171,573 102,010 212,686 149,449 5,090,494 8,059,392 31.1 This represents subsidy on sale of Di-Ammonium Phosphate (DAP) fertilizer under schemes announced on
October 25, 2015 @ Rs 500 per 50 kg bag and on June 25, 2016 @ Rs 300 per 50 kg bag respectively and subsidy on sale of Urea under scheme announced on June 25, 2016 @ Rs 156 per 50 kg bag under notifications issued by Ministry of National Food Security & Research, Government of Pakistan. Finance Act, 2017 revoked subsidy on sale of DAP and also reduced Urea subsidy to Rs 100 per 50 kg bag for the financial year 2017-18.
327Annual Report 2018
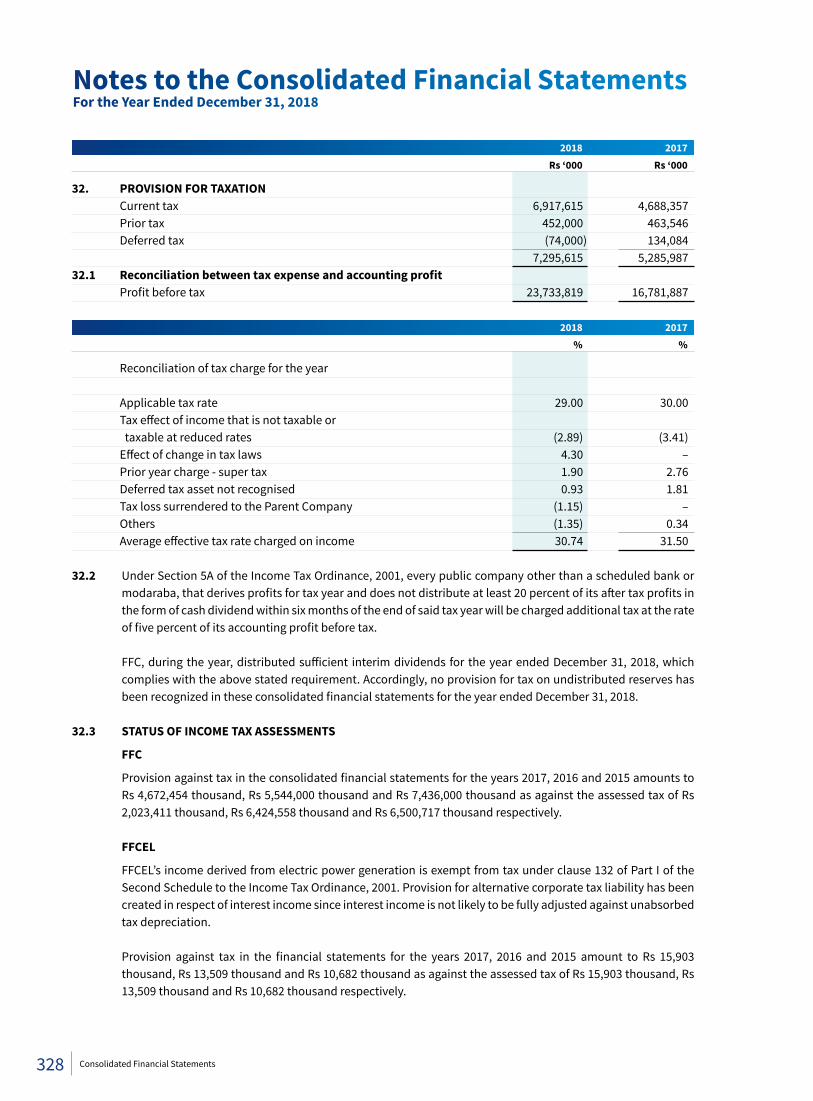
2018 2017 Rs ‘000 Rs ‘000
32. PROVISION FOR TAXATION Current tax 6,917,615 4,688,357 Prior tax 452,000 463,546 Deferred tax (74,000) 134,084 7,295,615 5,285,987 32.1 Reconciliationbetweentaxexpenseandaccountingprofit Profit before tax 23,733,819 16,781,887
2018 2017 % %
Reconciliation of tax charge for the year Applicable tax rate 29.00 30.00 Tax effect of income that is not taxable or taxable at reduced rates (2.89) (3.41) Effect of change in tax laws 4.30 – Prior year charge - super tax 1.90 2.76 Deferred tax asset not recognised 0.93 1.81 Tax loss surrendered to the Parent Company (1.15) – Others (1.35) 0.34 Average effective tax rate charged on income 30.74 31.50 32.2 Under Section 5A of the Income Tax Ordinance, 2001, every public company other than a scheduled bank or
modaraba, that derives profits for tax year and does not distribute at least 20 percent of its after tax profits in the form of cash dividend within six months of the end of said tax year will be charged additional tax at the rate of five percent of its accounting profit before tax.
FFC, during the year, distributed sufficient interim dividends for the year ended December 31, 2018, which
complies with the above stated requirement. Accordingly, no provision for tax on undistributed reserves has been recognized in these consolidated financial statements for the year ended December 31, 2018.
32.3 STATUS OF INCOME TAX ASSESSMENTS
FFC
Provision against tax in the consolidated financial statements for the years 2017, 2016 and 2015 amounts to Rs 4,672,454 thousand, Rs 5,544,000 thousand and Rs 7,436,000 thousand as against the assessed tax of Rs 2,023,411 thousand, Rs 6,424,558 thousand and Rs 6,500,717 thousand respectively.
FFCEL
FFCEL’s income derived from electric power generation is exempt from tax under clause 132 of Part I of the Second Schedule to the Income Tax Ordinance, 2001. Provision for alternative corporate tax liability has been created in respect of interest income since interest income is not likely to be fully adjusted against unabsorbed tax depreciation.
Provision against tax in the financial statements for the years 2017, 2016 and 2015 amount to Rs 15,903 thousand, Rs 13,509 thousand and Rs 10,682 thousand as against the assessed tax of Rs 15,903 thousand, Rs 13,509 thousand and Rs 10,682 thousand respectively.
Notes to the Consolidated Financial StatementsFor the Year Ended December 31, 2018
328 Consolidated Financial Statements
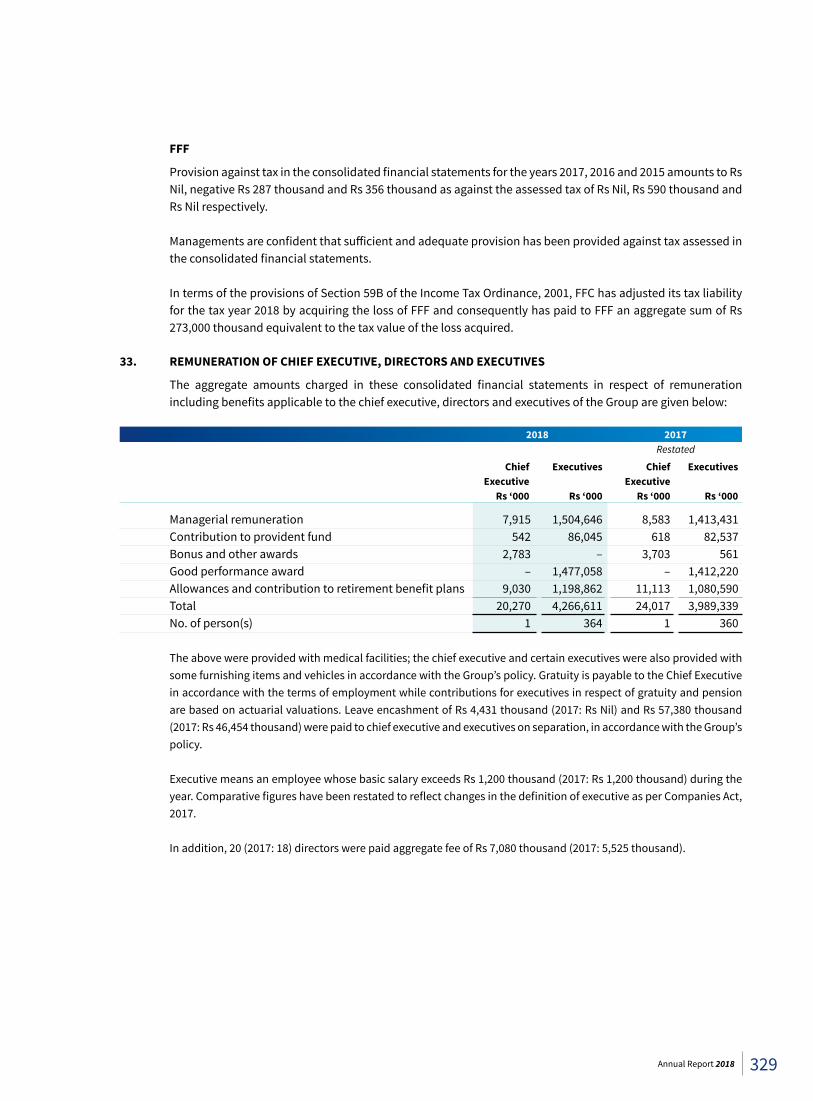
FFF
Provision against tax in the consolidated financial statements for the years 2017, 2016 and 2015 amounts to Rs Nil, negative Rs 287 thousand and Rs 356 thousand as against the assessed tax of Rs Nil, Rs 590 thousand and Rs Nil respectively.
Managements are confident that sufficient and adequate provision has been provided against tax assessed in
the consolidated financial statements. In terms of the provisions of Section 59B of the Income Tax Ordinance, 2001, FFC has adjusted its tax liability
for the tax year 2018 by acquiring the loss of FFF and consequently has paid to FFF an aggregate sum of Rs 273,000 thousand equivalent to the tax value of the loss acquired.
33. REMUNERATION OF CHIEF EXECUTIVE, DIRECTORS AND EXECUTIVES
The aggregate amounts charged in these consolidated financial statements in respect of remuneration including benefits applicable to the chief executive, directors and executives of the Group are given below:
2018 2017 Restated
Chief Executives Chief Executives Executive Executive Rs ‘000 Rs ‘000 Rs ‘000 Rs ‘000
Managerial remuneration 7,915 1,504,646 8,583 1,413,431 Contribution to provident fund 542 86,045 618 82,537 Bonus and other awards 2,783 – 3,703 561 Good performance award – 1,477,058 – 1,412,220 Allowances and contribution to retirement benefit plans 9,030 1,198,862 11,113 1,080,590 Total 20,270 4,266,611 24,017 3,989,339 No. of person(s) 1 364 1 360 The above were provided with medical facilities; the chief executive and certain executives were also provided with
some furnishing items and vehicles in accordance with the Group’s policy. Gratuity is payable to the Chief Executive in accordance with the terms of employment while contributions for executives in respect of gratuity and pension are based on actuarial valuations. Leave encashment of Rs 4,431 thousand (2017: Rs Nil) and Rs 57,380 thousand (2017: Rs 46,454 thousand) were paid to chief executive and executives on separation, in accordance with the Group’s policy.
Executive means an employee whose basic salary exceeds Rs 1,200 thousand (2017: Rs 1,200 thousand) during the year. Comparative figures have been restated to reflect changes in the definition of executive as per Companies Act, 2017.
In addition, 20 (2017: 18) directors were paid aggregate fee of Rs 7,080 thousand (2017: 5,525 thousand).
329Annual Report 2018
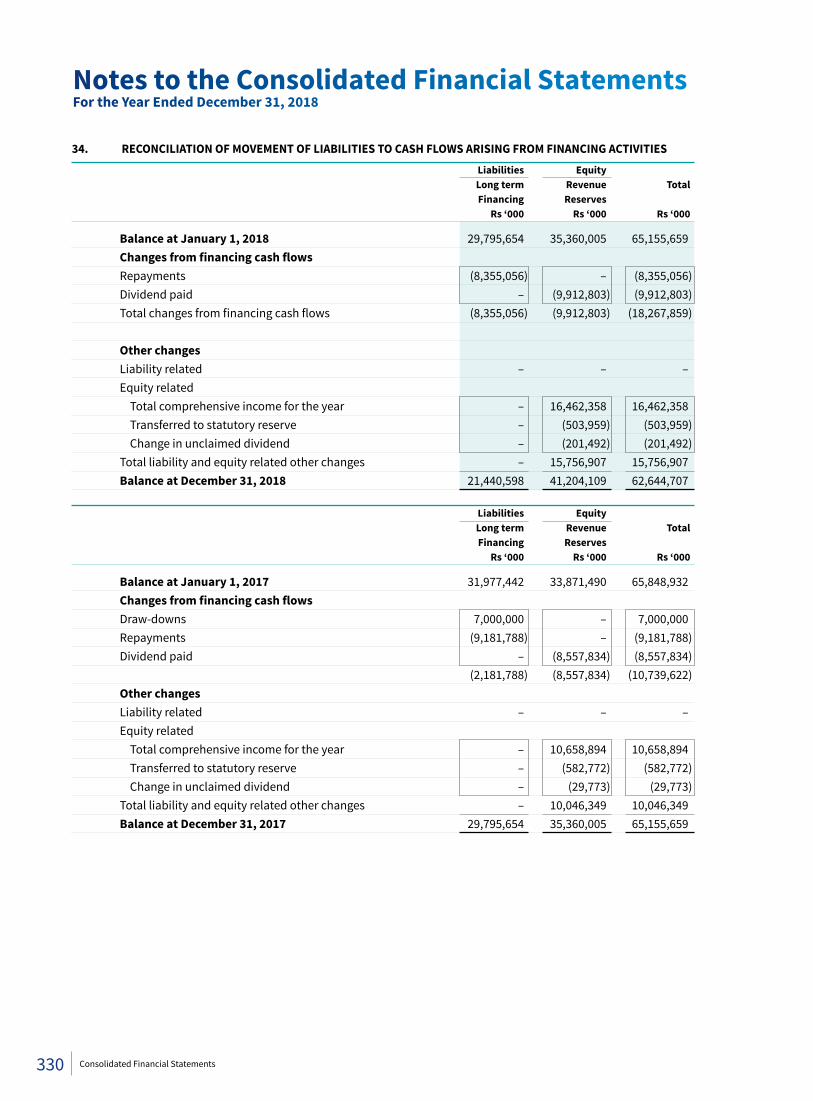
34. RECONCILIATION OF MOVEMENT OF LIABILITIES TO CASH FLOWS ARISING FROM FINANCING ACTIVITIES Liabilities Equity Long term Revenue Total Financing Reserves Rs ‘000 Rs ‘000 Rs ‘000
Balance at January 1, 2018 29,795,654 35,360,005 65,155,659 Changesfromfinancingcashflows Repayments (8,355,056) – (8,355,056) Dividend paid – (9,912,803) (9,912,803) Total changes from financing cash flows (8,355,056) (9,912,803) (18,267,859) Other changes Liability related – – – Equity related Total comprehensive income for the year – 16,462,358 16,462,358 Transferred to statutory reserve – (503,959) (503,959) Change in unclaimed dividend – (201,492) (201,492) Total liability and equity related other changes – 15,756,907 15,756,907 Balance at December 31, 2018 21,440,598 41,204,109 62,644,707 Liabilities Equity Long term Revenue Total Financing Reserves Rs ‘000 Rs ‘000 Rs ‘000
Balance at January 1, 2017 31,977,442 33,871,490 65,848,932 Changesfromfinancingcashflows Draw-downs 7,000,000 – 7,000,000 Repayments (9,181,788) – (9,181,788) Dividend paid – (8,557,834) (8,557,834) (2,181,788) (8,557,834) (10,739,622) Other changes Liability related – – – Equity related Total comprehensive income for the year – 10,658,894 10,658,894 Transferred to statutory reserve – (582,772) (582,772) Change in unclaimed dividend – (29,773) (29,773) Total liability and equity related other changes – 10,046,349 10,046,349 Balance at December 31, 2017 29,795,654 35,360,005 65,155,659
Notes to the Consolidated Financial StatementsFor the Year Ended December 31, 2018
330 Consolidated Financial Statements
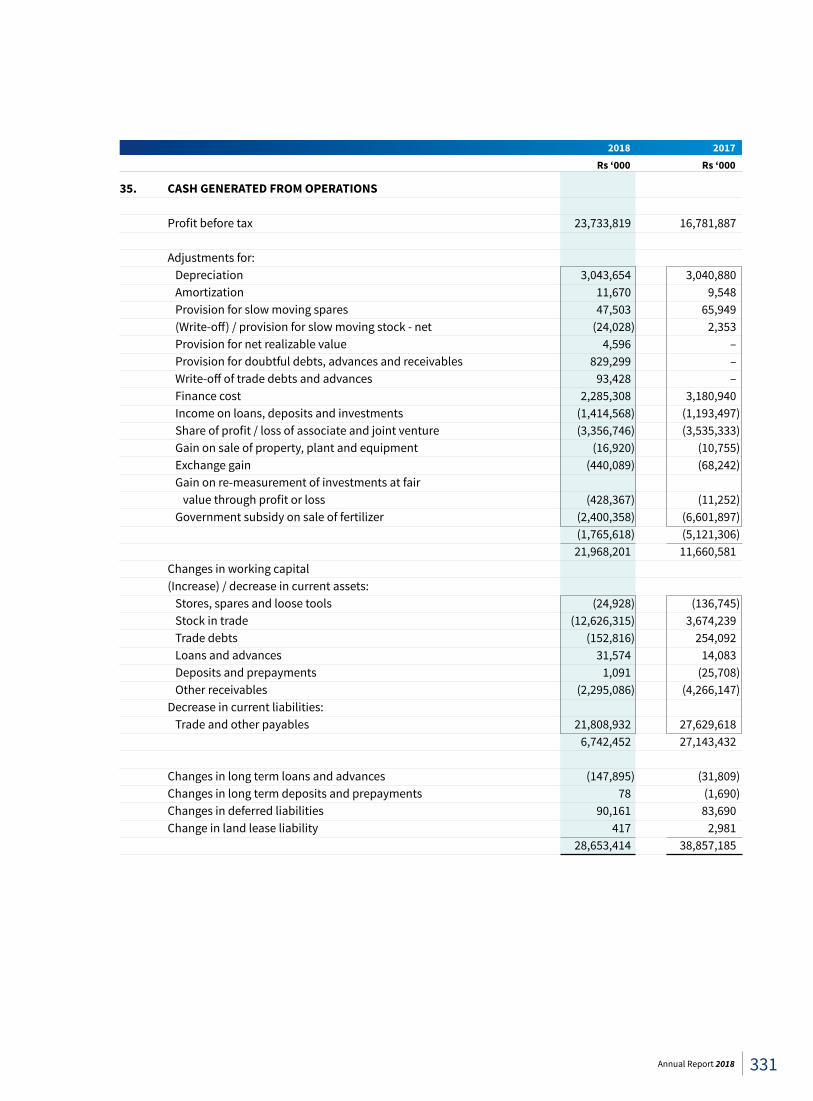
2018 2017 Rs ‘000 Rs ‘000
35. CASH GENERATED FROM OPERATIONS Profit before tax 23,733,819 16,781,887 Adjustments for: Depreciation 3,043,654 3,040,880 Amortization 11,670 9,548 Provision for slow moving spares 47,503 65,949 (Write-off) / provision for slow moving stock - net (24,028) 2,353 Provision for net realizable value 4,596 – Provision for doubtful debts, advances and receivables 829,299 – Write-off of trade debts and advances 93,428 – Finance cost 2,285,308 3,180,940 Income on loans, deposits and investments (1,414,568) (1,193,497) Share of profit / loss of associate and joint venture (3,356,746) (3,535,333) Gain on sale of property, plant and equipment (16,920) (10,755) Exchange gain (440,089) (68,242) Gain on re-measurement of investments at fair value through profit or loss (428,367) (11,252) Government subsidy on sale of fertilizer (2,400,358) (6,601,897) (1,765,618) (5,121,306) 21,968,201 11,660,581 Changes in working capital (Increase) / decrease in current assets: Stores, spares and loose tools (24,928) (136,745) Stock in trade (12,626,315) 3,674,239 Trade debts (152,816) 254,092 Loans and advances 31,574 14,083 Deposits and prepayments 1,091 (25,708) Other receivables (2,295,086) (4,266,147) Decrease in current liabilities: Trade and other payables 21,808,932 27,629,618 6,742,452 27,143,432 Changes in long term loans and advances (147,895) (31,809) Changes in long term deposits and prepayments 78 (1,690) Changes in deferred liabilities 90,161 83,690 Change in land lease liability 417 2,981 28,653,414 38,857,185
331Annual Report 2018
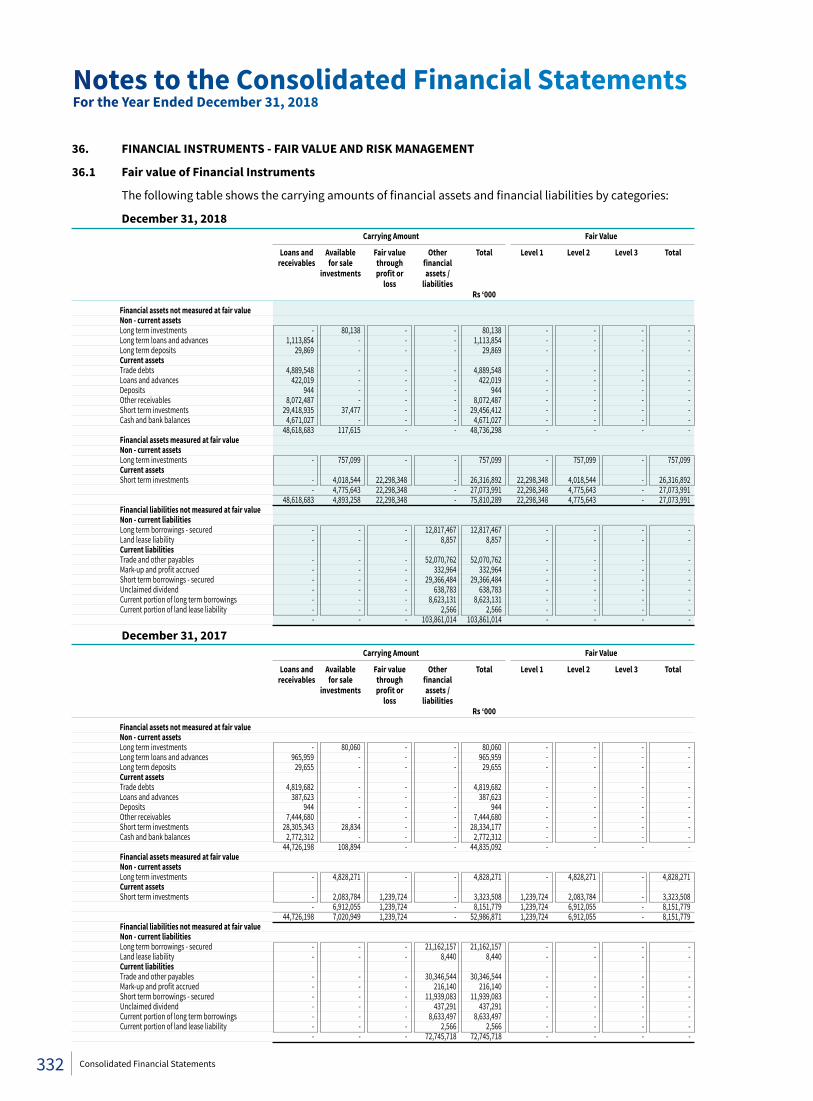
36. FINANCIAL INSTRUMENTS - FAIR VALUE AND RISK MANAGEMENT
36.1 Fair value of Financial Instruments
The following table shows the carrying amounts of financial assets and financial liabilities by categories:
December 31, 2018 Carrying Amount Fair Value
Loans and Available Fair value Other Total Level 1 Level 2 Level 3 Total receivables forsale through financial investments profitor assets/ loss liabilities Rs ‘000
Financial assets not measured at fair value Non - current assets Long term investments - 80,138 - - 80,138 - - - - Long term loans and advances 1,113,854 - - - 1,113,854 - - - - Long term deposits 29,869 - - - 29,869 - - - - Current assets Trade debts 4,889,548 - - - 4,889,548 - - - - Loans and advances 422,019 - - - 422,019 - - - - Deposits 944 - - - 944 - - - - Other receivables 8,072,487 - - - 8,072,487 - - - - Short term investments 29,418,935 37,477 - - 29,456,412 - - - - Cash and bank balances 4,671,027 - - - 4,671,027 - - - - 48,618,683 117,615 - - 48,736,298 - - - - Financial assets measured at fair value Non - current assets Long term investments - 757,099 - - 757,099 - 757,099 - 757,099 Current assets Short term investments - 4,018,544 22,298,348 - 26,316,892 22,298,348 4,018,544 - 26,316,892 - 4,775,643 22,298,348 - 27,073,991 22,298,348 4,775,643 - 27,073,991 48,618,683 4,893,258 22,298,348 - 75,810,289 22,298,348 4,775,643 - 27,073,991 Financial liabilities not measured at fair value Non - current liabilities Long term borrowings - secured - - - 12,817,467 12,817,467 - - - - Land lease liability - - - 8,857 8,857 - - - - Current liabilities Trade and other payables - - - 52,070,762 52,070,762 - - - - Mark-up and profit accrued - - - 332,964 332,964 - - - - Short term borrowings - secured - - - 29,366,484 29,366,484 - - - - Unclaimed dividend - - - 638,783 638,783 - - - - Current portion of long term borrowings - - - 8,623,131 8,623,131 - - - - Current portion of land lease liability - - - 2,566 2,566 - - - - - - - 103,861,014 103,861,014 - - - -
December 31, 2017 Carrying Amount Fair Value
Loans and Available Fair value Other Total Level 1 Level 2 Level 3 Total receivables forsale through financial investments profitor assets/ loss liabilities Rs ‘000
Financial assets not measured at fair value Non - current assets Long term investments - 80,060 - - 80,060 - - - - Long term loans and advances 965,959 - - - 965,959 - - - - Long term deposits 29,655 - - - 29,655 - - - - Current assets Trade debts 4,819,682 - - - 4,819,682 - - - - Loans and advances 387,623 - - - 387,623 - - - - Deposits 944 - - - 944 - - - - Other receivables 7,444,680 - - - 7,444,680 - - - - Short term investments 28,305,343 28,834 - - 28,334,177 - - - - Cash and bank balances 2,772,312 - - - 2,772,312 - - - - 44,726,198 108,894 - - 44,835,092 - - - - Financial assets measured at fair value Non - current assets Long term investments - 4,828,271 - - 4,828,271 - 4,828,271 - 4,828,271 Current assets Short term investments - 2,083,784 1,239,724 - 3,323,508 1,239,724 2,083,784 - 3,323,508 - 6,912,055 1,239,724 - 8,151,779 1,239,724 6,912,055 - 8,151,779 44,726,198 7,020,949 1,239,724 - 52,986,871 1,239,724 6,912,055 - 8,151,779 Financial liabilities not measured at fair value Non - current liabilities Long term borrowings - secured - - - 21,162,157 21,162,157 - - - - Land lease liability - - - 8,440 8,440 - - - - Current liabilities Trade and other payables - - - 30,346,544 30,346,544 - - - - Mark-up and profit accrued - - - 216,140 216,140 - - - - Short term borrowings - secured - - - 11,939,083 11,939,083 - - - - Unclaimed dividend - - - 437,291 437,291 - - - - Current portion of long term borrowings - - - 8,633,497 8,633,497 - - - - Current portion of land lease liability - - - 2,566 2,566 - - - - - - - 72,745,718 72,745,718 - - - -
Notes to the Consolidated Financial StatementsFor the Year Ended December 31, 2018
332 Consolidated Financial Statements
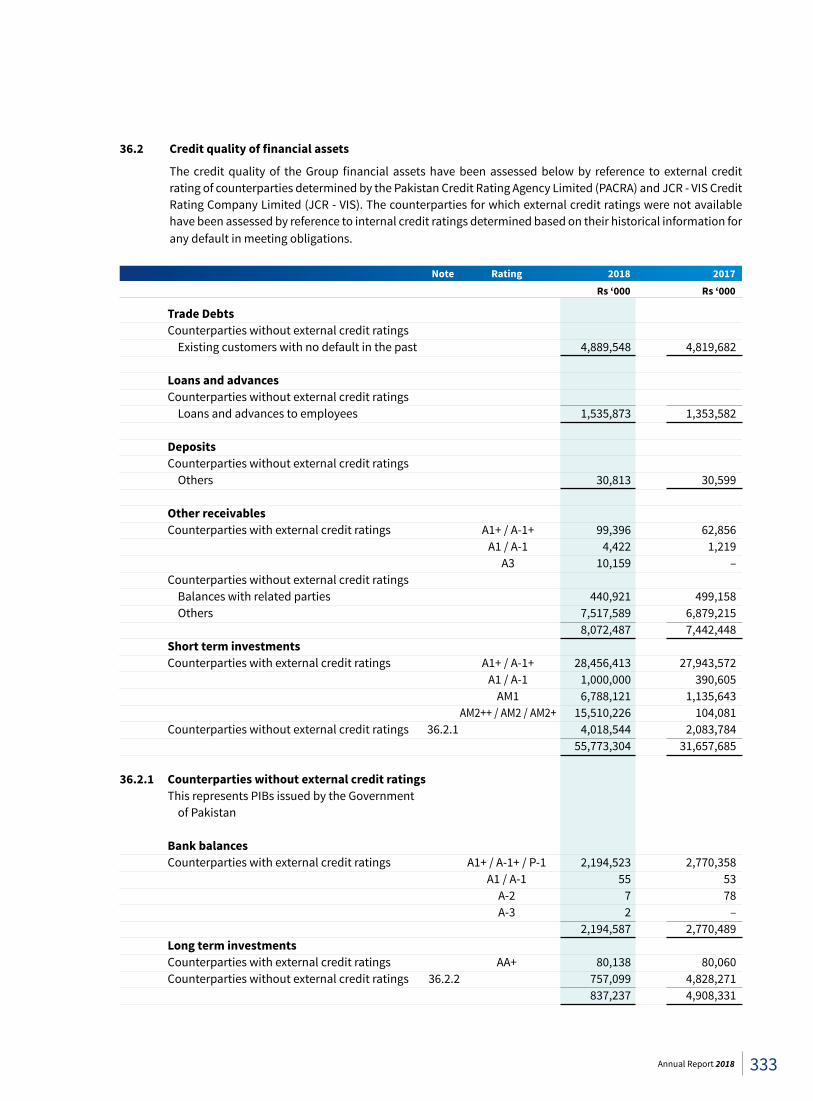
36.2 Creditqualityoffinancialassets
The credit quality of the Group financial assets have been assessed below by reference to external credit rating of counterparties determined by the Pakistan Credit Rating Agency Limited (PACRA) and JCR - VIS Credit Rating Company Limited (JCR - VIS). The counterparties for which external credit ratings were not available have been assessed by reference to internal credit ratings determined based on their historical information for any default in meeting obligations.
Note Rating 2018 2017 Rs ‘000 Rs ‘000
Trade Debts Counterparties without external credit ratings Existing customers with no default in the past 4,889,548 4,819,682 Loans and advances Counterparties without external credit ratings Loans and advances to employees 1,535,873 1,353,582 Deposits Counterparties without external credit ratings Others 30,813 30,599 Other receivables Counterparties with external credit ratings A1+ / A-1+ 99,396 62,856 A1 / A-1 4,422 1,219 A3 10,159 – Counterparties without external credit ratings Balances with related parties 440,921 499,158 Others 7,517,589 6,879,215 8,072,487 7,442,448 Short term investments Counterparties with external credit ratings A1+ / A-1+ 28,456,413 27,943,572 A1 / A-1 1,000,000 390,605 AM1 6,788,121 1,135,643 AM2++ / AM2 / AM2+ 15,510,226 104,081 Counterparties without external credit ratings 36.2.1 4,018,544 2,083,784 55,773,304 31,657,685 36.2.1 Counterparties without external credit ratings This represents PIBs issued by the Government of Pakistan Bank balances Counterparties with external credit ratings A1+ / A-1+ / P-1 2,194,523 2,770,358 A1 / A-1 55 53 A-2 7 78 A-3 2 – 2,194,587 2,770,489 Long term investments Counterparties with external credit ratings AA+ 80,138 80,060 Counterparties without external credit ratings 36.2.2 757,099 4,828,271 837,237 4,908,331
333Annual Report 2018
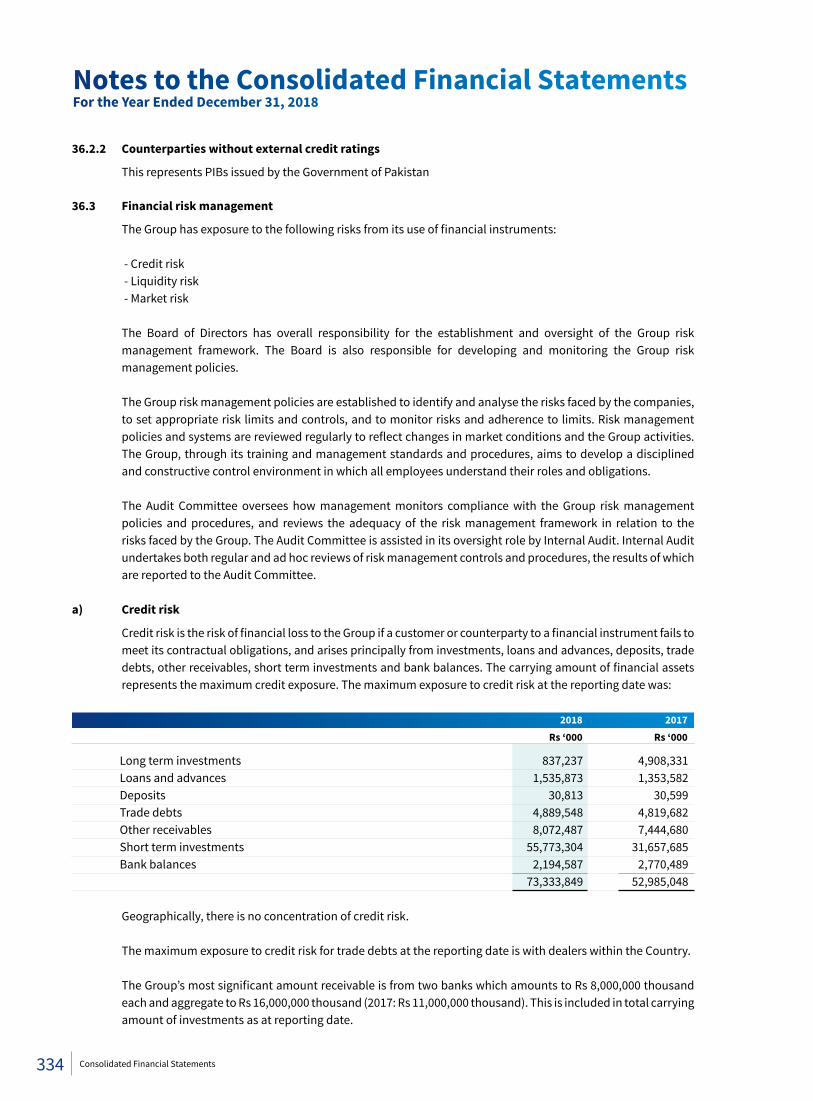
36.2.2 Counterparties without external credit ratings
This represents PIBs issued by the Government of Pakistan 36.3 Financial risk management
The Group has exposure to the following risks from its use of financial instruments: - Credit risk - Liquidity risk - Market risk The Board of Directors has overall responsibility for the establishment and oversight of the Group risk
management framework. The Board is also responsible for developing and monitoring the Group risk management policies.
The Group risk management policies are established to identify and analyse the risks faced by the companies,
to set appropriate risk limits and controls, and to monitor risks and adherence to limits. Risk management policies and systems are reviewed regularly to reflect changes in market conditions and the Group activities. The Group, through its training and management standards and procedures, aims to develop a disciplined and constructive control environment in which all employees understand their roles and obligations.
The Audit Committee oversees how management monitors compliance with the Group risk management policies and procedures, and reviews the adequacy of the risk management framework in relation to the risks faced by the Group. The Audit Committee is assisted in its oversight role by Internal Audit. Internal Audit undertakes both regular and ad hoc reviews of risk management controls and procedures, the results of which are reported to the Audit Committee.
a) Credit risk
Credit risk is the risk of financial loss to the Group if a customer or counterparty to a financial instrument fails to meet its contractual obligations, and arises principally from investments, loans and advances, deposits, trade debts, other receivables, short term investments and bank balances. The carrying amount of financial assets represents the maximum credit exposure. The maximum exposure to credit risk at the reporting date was:
2018 2017 Rs ‘000 Rs ‘000
Long term investments 837,237 4,908,331 Loans and advances 1,535,873 1,353,582 Deposits 30,813 30,599 Trade debts 4,889,548 4,819,682 Other receivables 8,072,487 7,444,680 Short term investments 55,773,304 31,657,685 Bank balances 2,194,587 2,770,489 73,333,849 52,985,048
Geographically, there is no concentration of credit risk. The maximum exposure to credit risk for trade debts at the reporting date is with dealers within the Country.
The Group’s most significant amount receivable is from two banks which amounts to Rs 8,000,000 thousand each and aggregate to Rs 16,000,000 thousand (2017: Rs 11,000,000 thousand). This is included in total carrying amount of investments as at reporting date.
Notes to the Consolidated Financial StatementsFor the Year Ended December 31, 2018
334 Consolidated Financial Statements
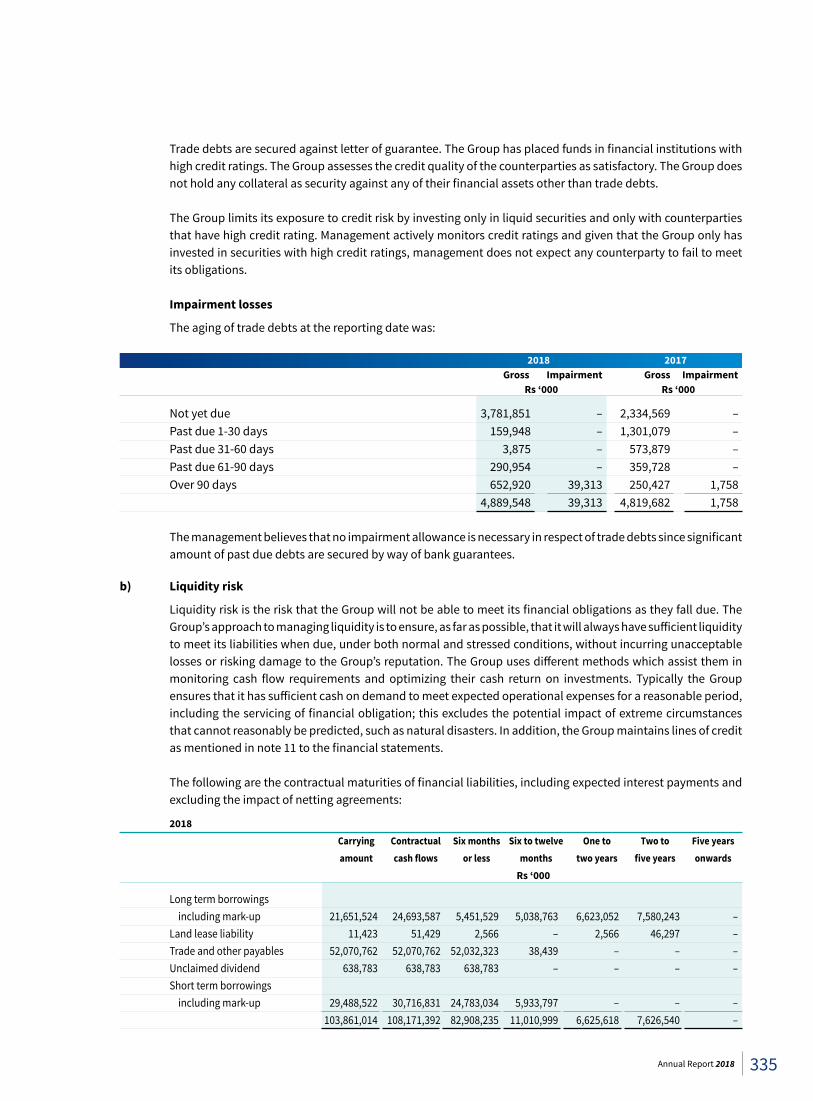
Trade debts are secured against letter of guarantee. The Group has placed funds in financial institutions with high credit ratings. The Group assesses the credit quality of the counterparties as satisfactory. The Group does not hold any collateral as security against any of their financial assets other than trade debts.
The Group limits its exposure to credit risk by investing only in liquid securities and only with counterparties that have high credit rating. Management actively monitors credit ratings and given that the Group only has invested in securities with high credit ratings, management does not expect any counterparty to fail to meet its obligations.
Impairment losses
The aging of trade debts at the reporting date was: 2018 2017 Gross Impairment Gross Impairment Rs ‘000 Rs ‘000
Not yet due 3,781,851 – 2,334,569 – Past due 1-30 days 159,948 – 1,301,079 – Past due 31-60 days 3,875 – 573,879 – Past due 61-90 days 290,954 – 359,728 – Over 90 days 652,920 39,313 250,427 1,758 4,889,548 39,313 4,819,682 1,758 The management believes that no impairment allowance is necessary in respect of trade debts since significant
amount of past due debts are secured by way of bank guarantees.
b) Liquidity risk
Liquidity risk is the risk that the Group will not be able to meet its financial obligations as they fall due. The Group’s approach to managing liquidity is to ensure, as far as possible, that it will always have sufficient liquidity to meet its liabilities when due, under both normal and stressed conditions, without incurring unacceptable losses or risking damage to the Group’s reputation. The Group uses different methods which assist them in monitoring cash flow requirements and optimizing their cash return on investments. Typically the Group ensures that it has sufficient cash on demand to meet expected operational expenses for a reasonable period, including the servicing of financial obligation; this excludes the potential impact of extreme circumstances that cannot reasonably be predicted, such as natural disasters. In addition, the Group maintains lines of credit as mentioned in note 11 to the financial statements.
The following are the contractual maturities of financial liabilities, including expected interest payments and excluding the impact of netting agreements:
2018 Carrying Contractual Six months Six to twelve One to Two to Five years amount cashflows orless months twoyears fiveyears onwards Rs ‘000
Long term borrowings including mark-up 21,651,524 24,693,587 5,451,529 5,038,763 6,623,052 7,580,243 – Land lease liability 11,423 51,429 2,566 – 2,566 46,297 – Trade and other payables 52,070,762 52,070,762 52,032,323 38,439 – – – Unclaimed dividend 638,783 638,783 638,783 – – – – Short term borrowings including mark-up 29,488,522 30,716,831 24,783,034 5,933,797 – – – 103,861,014 108,171,392 82,908,235 11,010,999 6,625,618 7,626,540 –
335Annual Report 2018
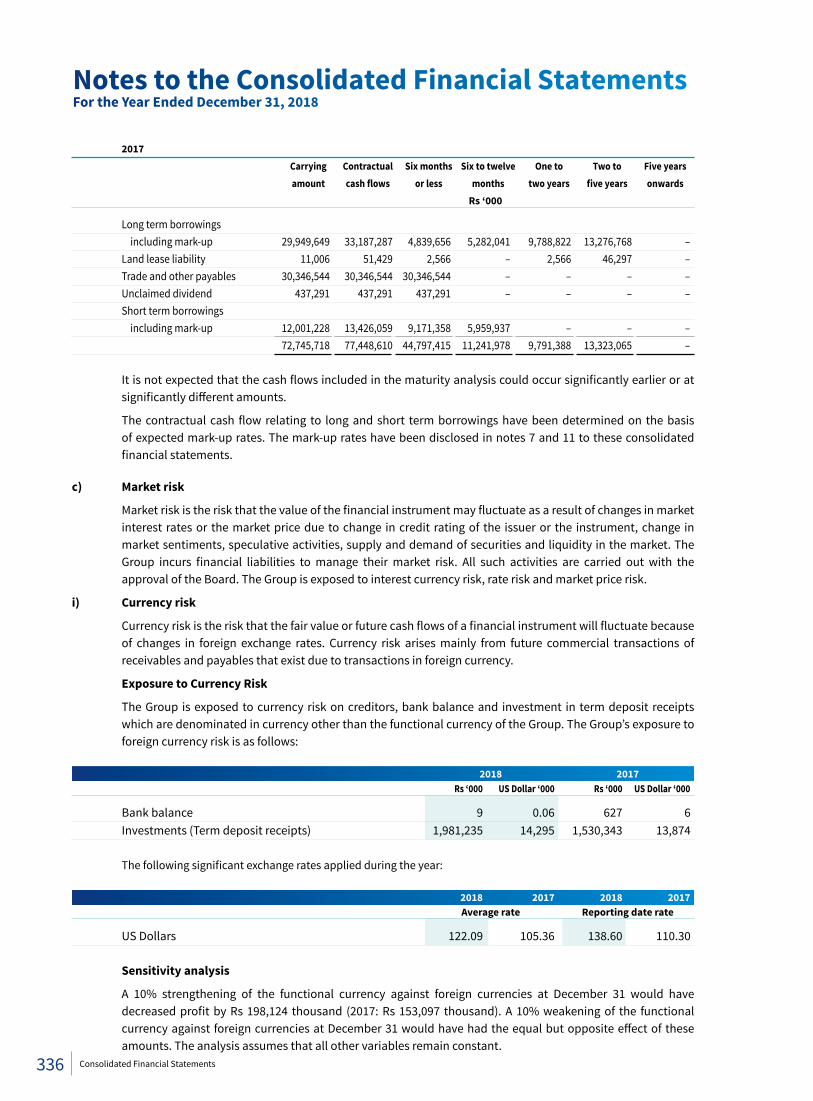
2017 Carrying Contractual Six months Six to twelve One to Two to Five years amount cashflows orless months twoyears fiveyears onwards Rs ‘000
Long term borrowings including mark-up 29,949,649 33,187,287 4,839,656 5,282,041 9,788,822 13,276,768 – Land lease liability 11,006 51,429 2,566 – 2,566 46,297 – Trade and other payables 30,346,544 30,346,544 30,346,544 – – – – Unclaimed dividend 437,291 437,291 437,291 – – – – Short term borrowings including mark-up 12,001,228 13,426,059 9,171,358 5,959,937 – – – 72,745,718 77,448,610 44,797,415 11,241,978 9,791,388 13,323,065 – It is not expected that the cash flows included in the maturity analysis could occur significantly earlier or at
significantly different amounts.
The contractual cash flow relating to long and short term borrowings have been determined on the basis of expected mark-up rates. The mark-up rates have been disclosed in notes 7 and 11 to these consolidated financial statements.
c) Market risk
Market risk is the risk that the value of the financial instrument may fluctuate as a result of changes in market interest rates or the market price due to change in credit rating of the issuer or the instrument, change in market sentiments, speculative activities, supply and demand of securities and liquidity in the market. The Group incurs financial liabilities to manage their market risk. All such activities are carried out with the approval of the Board. The Group is exposed to interest currency risk, rate risk and market price risk.
i) Currency risk
Currency risk is the risk that the fair value or future cash flows of a financial instrument will fluctuate because of changes in foreign exchange rates. Currency risk arises mainly from future commercial transactions of receivables and payables that exist due to transactions in foreign currency.
Exposure to Currency Risk
The Group is exposed to currency risk on creditors, bank balance and investment in term deposit receipts which are denominated in currency other than the functional currency of the Group. The Group’s exposure to foreign currency risk is as follows:
2018 2017 Rs ‘000 US Dollar ‘000 Rs ‘000 US Dollar ‘000
Bank balance 9 0.06 627 6 Investments (Term deposit receipts) 1,981,235 14,295 1,530,343 13,874 The following significant exchange rates applied during the year: 2018 2017 2018 2017 Average rate Reporting date rate
US Dollars 122.09 105.36 138.60 110.30 Sensitivity analysis
A 10% strengthening of the functional currency against foreign currencies at December 31 would have decreased profit by Rs 198,124 thousand (2017: Rs 153,097 thousand). A 10% weakening of the functional currency against foreign currencies at December 31 would have had the equal but opposite effect of these amounts. The analysis assumes that all other variables remain constant.
Notes to the Consolidated Financial StatementsFor the Year Ended December 31, 2018
336 Consolidated Financial Statements
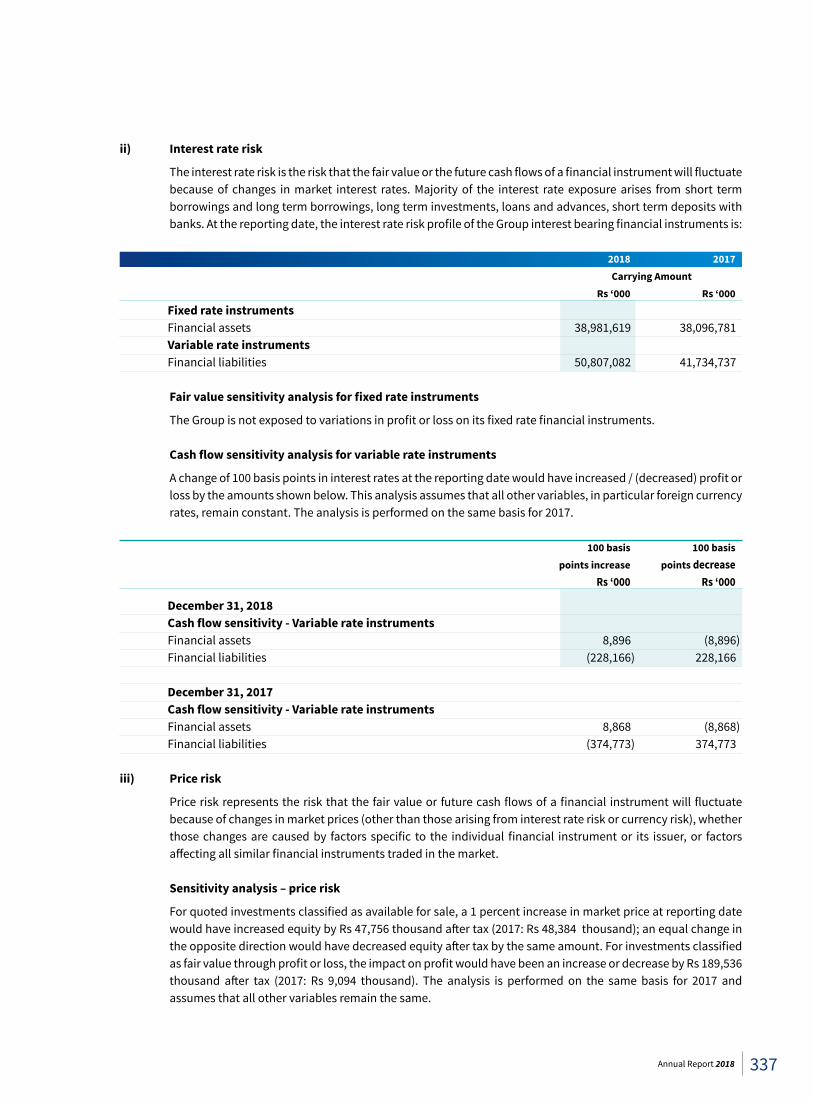
ii) Interest rate risk
The interest rate risk is the risk that the fair value or the future cash flows of a financial instrument will fluctuate because of changes in market interest rates. Majority of the interest rate exposure arises from short term borrowings and long term borrowings, long term investments, loans and advances, short term deposits with banks. At the reporting date, the interest rate risk profile of the Group interest bearing financial instruments is:
2018 2017 Carrying Amount Rs ‘000 Rs ‘000 Fixed rate instruments Financial assets 38,981,619 38,096,781 Variable rate instruments Financial liabilities 50,807,082 41,734,737 Fairvaluesensitivityanalysisforfixedrateinstruments
The Group is not exposed to variations in profit or loss on its fixed rate financial instruments. Cashflowsensitivityanalysisforvariablerateinstruments
A change of 100 basis points in interest rates at the reporting date would have increased / (decreased) profit or loss by the amounts shown below. This analysis assumes that all other variables, in particular foreign currency rates, remain constant. The analysis is performed on the same basis for 2017.
100 basis 100 basis points increase points decrease Rs ‘000 Rs ‘000
December 31, 2018 Cashflowsensitivity-Variablerateinstruments Financial assets 8,896 (8,896) Financial liabilities (228,166) 228,166 December 31, 2017 Cashflowsensitivity-Variablerateinstruments Financial assets 8,868 (8,868) Financial liabilities (374,773) 374,773 iii) Price risk
Price risk represents the risk that the fair value or future cash flows of a financial instrument will fluctuate because of changes in market prices (other than those arising from interest rate risk or currency risk), whether those changes are caused by factors specific to the individual financial instrument or its issuer, or factors affecting all similar financial instruments traded in the market.
Sensitivity analysis – price risk
For quoted investments classified as available for sale, a 1 percent increase in market price at reporting date would have increased equity by Rs 47,756 thousand after tax (2017: Rs 48,384 thousand); an equal change in the opposite direction would have decreased equity after tax by the same amount. For investments classified as fair value through profit or loss, the impact on profit would have been an increase or decrease by Rs 189,536 thousand after tax (2017: Rs 9,094 thousand). The analysis is performed on the same basis for 2017 and assumes that all other variables remain the same.
337Annual Report 2018
36.4 Interest rates used for determining fair value
The interest rates used to discount estimated cash flows, when applicable, are based on the government yield curve at the reporting date plus an adequate credit spread. For instruments carried at amortized cost, since the majority of the interest bearing investments are variable rate based instruments, there is no difference in carrying amount and the fair value. Further, for fixed rate instruments, since there is no significant difference in market rate and the rate of instrument and therefore most of the fixed rate instruments are short term in nature, fair value significantly approximates to carrying value.
36.5 Determination of fair values
A number of Group accounting policies and disclosures require the determination of fair value, for both financial and non-financial assets and liabilities. Fair values have been determined for measurement and / or disclosure purposes based on the following methods:
Investmentatfairvaluethroughprofitorloss
The fair value of investment at fair value through profit or loss is determined by reference to their quoted closing repurchase price at the reporting date.
Available for sale investments
The fair value of available for sale investments is determined by reference to their quoted closing repurchase price at the reporting date and where applicable it is estimated as the present value of future cash flows, discounted at current PKRV rates applicable to similar instruments having similar maturities.
Investment in associated and subsidiary companies
The fair value of investment in listed associate is determined by reference to their quoted closing bid price at the reporting date and accordingly are at level 1 in fair value hierarchy. The fair value is determined for disclosure purposes.
Non-derivativefinancialassets
The fair value of non-derivative financial assets is estimated as the present value of future cash flows, discounted at the market rate of interest at the reporting date. This fair value is determined for disclosure purposes.
Non-derivativefinancialliabilities
Fair value, which is determined for disclosure purposes, is calculated based on the present value of future principal and interest cash flows, discounted at the market rate of interest at the reporting date.
Notes to the Consolidated Financial StatementsFor the Year Ended December 31, 2018
338 Consolidated Financial Statements
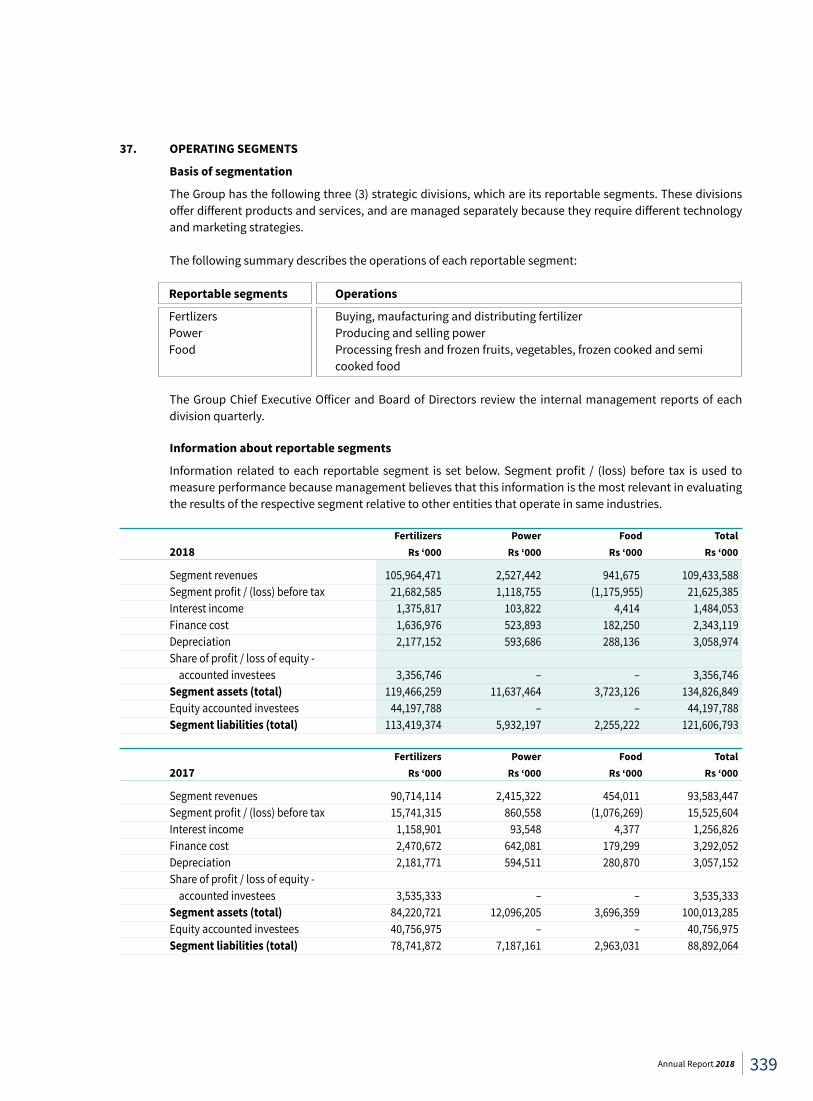
37. OPERATING SEGMENTS
Basis of segmentation
The Group has the following three (3) strategic divisions, which are its reportable segments. These divisions offer different products and services, and are managed separately because they require different technology and marketing strategies.
The following summary describes the operations of each reportable segment:
Reportable segments Operations
Fertlizers Buying, maufacturing and distributing fertilizer Power Producing and selling power Food Processing fresh and frozen fruits, vegetables, frozen cooked and semi cooked food
The Group Chief Executive Officer and Board of Directors review the internal management reports of each
division quarterly. Information about reportable segments
Information related to each reportable segment is set below. Segment profit / (loss) before tax is used to measure performance because management believes that this information is the most relevant in evaluating the results of the respective segment relative to other entities that operate in same industries.
Fertilizers Power Food Total 2018 Rs ‘000 Rs ‘000 Rs ‘000 Rs ‘000
Segment revenues 105,964,471 2,527,442 941,675 109,433,588 Segment profit / (loss) before tax 21,682,585 1,118,755 (1,175,955) 21,625,385 Interest income 1,375,817 103,822 4,414 1,484,053 Finance cost 1,636,976 523,893 182,250 2,343,119 Depreciation 2,177,152 593,686 288,136 3,058,974 Share of profit / loss of equity - accounted investees 3,356,746 – – 3,356,746 Segment assets (total) 119,466,259 11,637,464 3,723,126 134,826,849 Equity accounted investees 44,197,788 – – 44,197,788 Segment liabilities (total) 113,419,374 5,932,197 2,255,222 121,606,793 Fertilizers Power Food Total 2017 Rs ‘000 Rs ‘000 Rs ‘000 Rs ‘000
Segment revenues 90,714,114 2,415,322 454,011 93,583,447 Segment profit / (loss) before tax 15,741,315 860,558 (1,076,269) 15,525,604 Interest income 1,158,901 93,548 4,377 1,256,826 Finance cost 2,470,672 642,081 179,299 3,292,052 Depreciation 2,181,771 594,511 280,870 3,057,152 Share of profit / loss of equity - accounted investees 3,535,333 – – 3,535,333 Segment assets (total) 84,220,721 12,096,205 3,696,359 100,013,285 Equity accounted investees 40,756,975 – – 40,756,975 Segment liabilities (total) 78,741,872 7,187,161 2,963,031 88,892,064
339Annual Report 2018
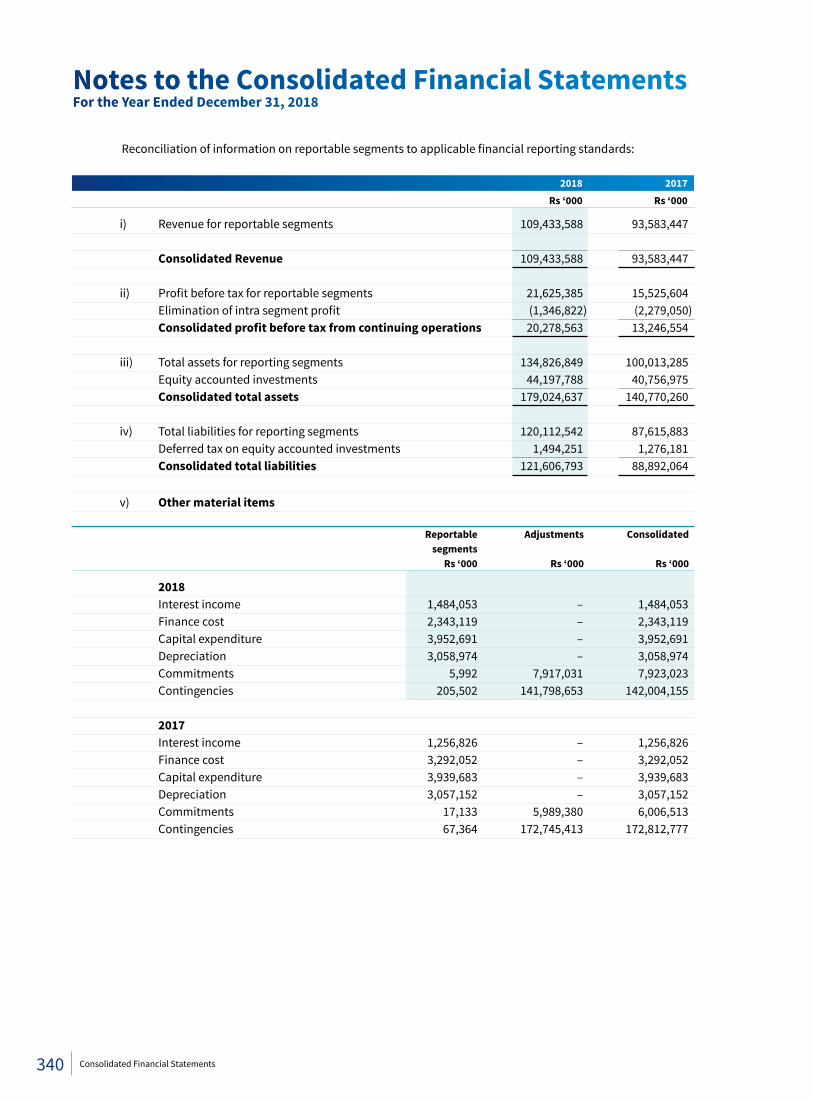
Reconciliation of information on reportable segments to applicable financial reporting standards: 2018 2017 Rs ‘000 Rs ‘000
i) Revenue for reportable segments 109,433,588 93,583,447
Consolidated Revenue 109,433,588 93,583,447 ii) Profit before tax for reportable segments 21,625,385 15,525,604 Elimination of intra segment profit (1,346,822) (2,279,050) Consolidatedprofitbeforetaxfromcontinuingoperations 20,278,563 13,246,554 iii) Total assets for reporting segments 134,826,849 100,013,285 Equity accounted investments 44,197,788 40,756,975 Consolidated total assets 179,024,637 140,770,260 iv) Total liabilities for reporting segments 120,112,542 87,615,883 Deferred tax on equity accounted investments 1,494,251 1,276,181 Consolidated total liabilities 121,606,793 88,892,064 v) Other material items
Reportable Adjustments Consolidated segments Rs ‘000 Rs ‘000 Rs ‘000
2018 Interest income 1,484,053 – 1,484,053 Finance cost 2,343,119 – 2,343,119 Capital expenditure 3,952,691 – 3,952,691 Depreciation 3,058,974 – 3,058,974 Commitments 5,992 7,917,031 7,923,023 Contingencies 205,502 141,798,653 142,004,155
2017 Interest income 1,256,826 – 1,256,826 Finance cost 3,292,052 – 3,292,052 Capital expenditure 3,939,683 – 3,939,683 Depreciation 3,057,152 – 3,057,152 Commitments 17,133 5,989,380 6,006,513 Contingencies 67,364 172,745,413 172,812,777
Notes to the Consolidated Financial StatementsFor the Year Ended December 31, 2018
340 Consolidated Financial Statements
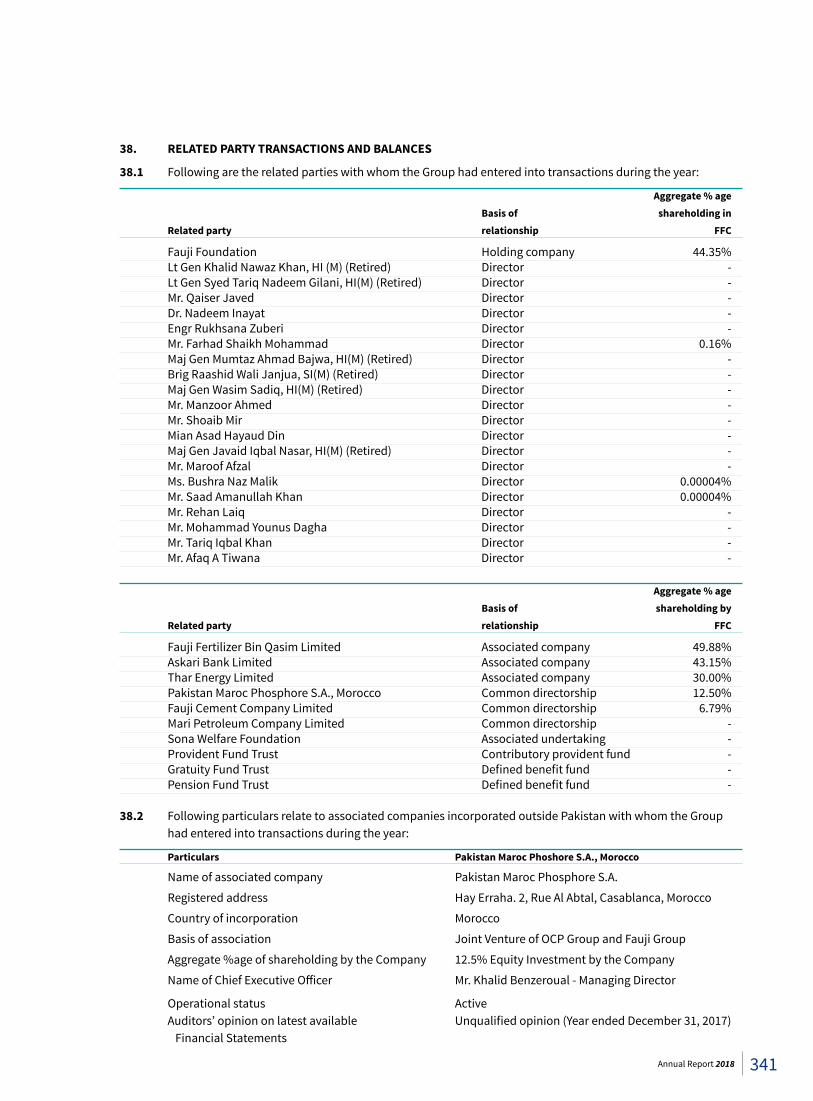
38. RELATED PARTY TRANSACTIONS AND BALANCES
38.1 Following are the related parties with whom the Group had entered into transactions during the year:
Aggregate%age Basis of shareholding in Related party relationship FFC
Fauji Foundation Holding company 44.35% Lt Gen Khalid Nawaz Khan, HI (M) (Retired) Director - Lt Gen Syed Tariq Nadeem Gilani, HI(M) (Retired) Director - Mr. Qaiser Javed Director - Dr. Nadeem Inayat Director - Engr Rukhsana Zuberi Director - Mr. Farhad Shaikh Mohammad Director 0.16% Maj Gen Mumtaz Ahmad Bajwa, HI(M) (Retired) Director - Brig Raashid Wali Janjua, SI(M) (Retired) Director - Maj Gen Wasim Sadiq, HI(M) (Retired) Director - Mr. Manzoor Ahmed Director - Mr. Shoaib Mir Director - Mian Asad Hayaud Din Director - Maj Gen Javaid Iqbal Nasar, HI(M) (Retired) Director - Mr. Maroof Afzal Director - Ms. Bushra Naz Malik Director 0.00004% Mr. Saad Amanullah Khan Director 0.00004% Mr. Rehan Laiq Director - Mr. Mohammad Younus Dagha Director - Mr. Tariq Iqbal Khan Director - Mr. Afaq A Tiwana Director -
Aggregate%age Basis of shareholding by Related party relationship FFC
Fauji Fertilizer Bin Qasim Limited Associated company 49.88% Askari Bank Limited Associated company 43.15% Thar Energy Limited Associated company 30.00% Pakistan Maroc Phosphore S.A., Morocco Common directorship 12.50% Fauji Cement Company Limited Common directorship 6.79% Mari Petroleum Company Limited Common directorship - Sona Welfare Foundation Associated undertaking - Provident Fund Trust Contributory provident fund - Gratuity Fund Trust Defined benefit fund - Pension Fund Trust Defined benefit fund -
38.2 Following particulars relate to associated companies incorporated outside Pakistan with whom the Group had entered into transactions during the year:
Particulars Pakistan Maroc Phoshore S.A., Morocco
Name of associated company Pakistan Maroc Phosphore S.A.
Registered address Hay Erraha. 2, Rue Al Abtal, Casablanca, Morocco
Country of incorporation Morocco
Basis of association Joint Venture of OCP Group and Fauji Group
Aggregate %age of shareholding by the Company 12.5% Equity Investment by the Company
Name of Chief Executive Officer Mr. Khalid Benzeroual - Managing Director
Operational status Active Auditors’ opinion on latest available Unqualified opinion (Year ended December 31, 2017)
Financial Statements
341Annual Report 2018
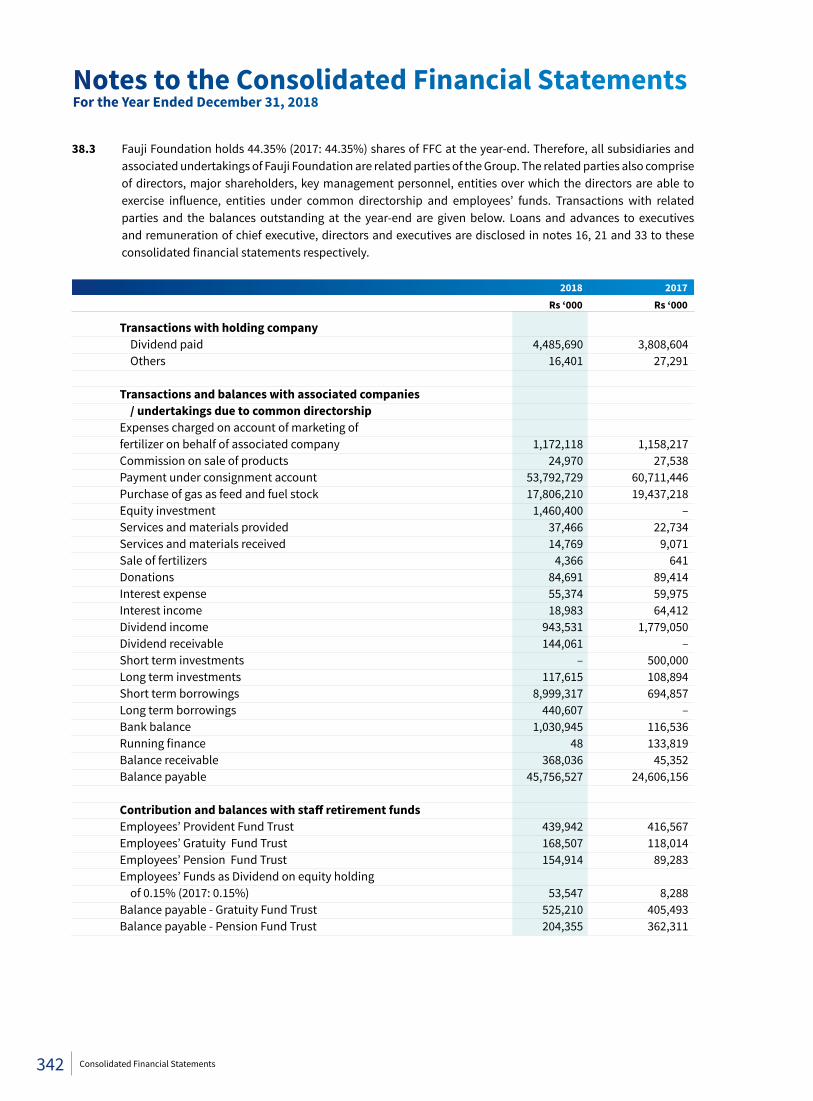
38.3 Fauji Foundation holds 44.35% (2017: 44.35%) shares of FFC at the year-end. Therefore, all subsidiaries and associated undertakings of Fauji Foundation are related parties of the Group. The related parties also comprise of directors, major shareholders, key management personnel, entities over which the directors are able to exercise influence, entities under common directorship and employees’ funds. Transactions with related parties and the balances outstanding at the year-end are given below. Loans and advances to executives and remuneration of chief executive, directors and executives are disclosed in notes 16, 21 and 33 to these consolidated financial statements respectively.
2018 2017 Rs ‘000 Rs ‘000
Transactions with holding company Dividend paid 4,485,690 3,808,604 Others 16,401 27,291 Transactions and balances with associated companies / undertakings due to common directorship Expenses charged on account of marketing of fertilizer on behalf of associated company 1,172,118 1,158,217 Commission on sale of products 24,970 27,538 Payment under consignment account 53,792,729 60,711,446 Purchase of gas as feed and fuel stock 17,806,210 19,437,218 Equity investment 1,460,400 – Services and materials provided 37,466 22,734 Services and materials received 14,769 9,071 Sale of fertilizers 4,366 641 Donations 84,691 89,414 Interest expense 55,374 59,975 Interest income 18,983 64,412 Dividend income 943,531 1,779,050 Dividend receivable 144,061 – Short term investments – 500,000 Long term investments 117,615 108,894 Short term borrowings 8,999,317 694,857 Long term borrowings 440,607 – Bank balance 1,030,945 116,536 Running finance 48 133,819 Balance receivable 368,036 45,352 Balance payable 45,756,527 24,606,156 Contributionandbalanceswithstaffretirementfunds Employees’ Provident Fund Trust 439,942 416,567 Employees’ Gratuity Fund Trust 168,507 118,014 Employees’ Pension Fund Trust 154,914 89,283 Employees’ Funds as Dividend on equity holding of 0.15% (2017: 0.15%) 53,547 8,288 Balance payable - Gratuity Fund Trust 525,210 405,493 Balance payable - Pension Fund Trust 204,355 362,311
Notes to the Consolidated Financial StatementsFor the Year Ended December 31, 2018
342 Consolidated Financial Statements
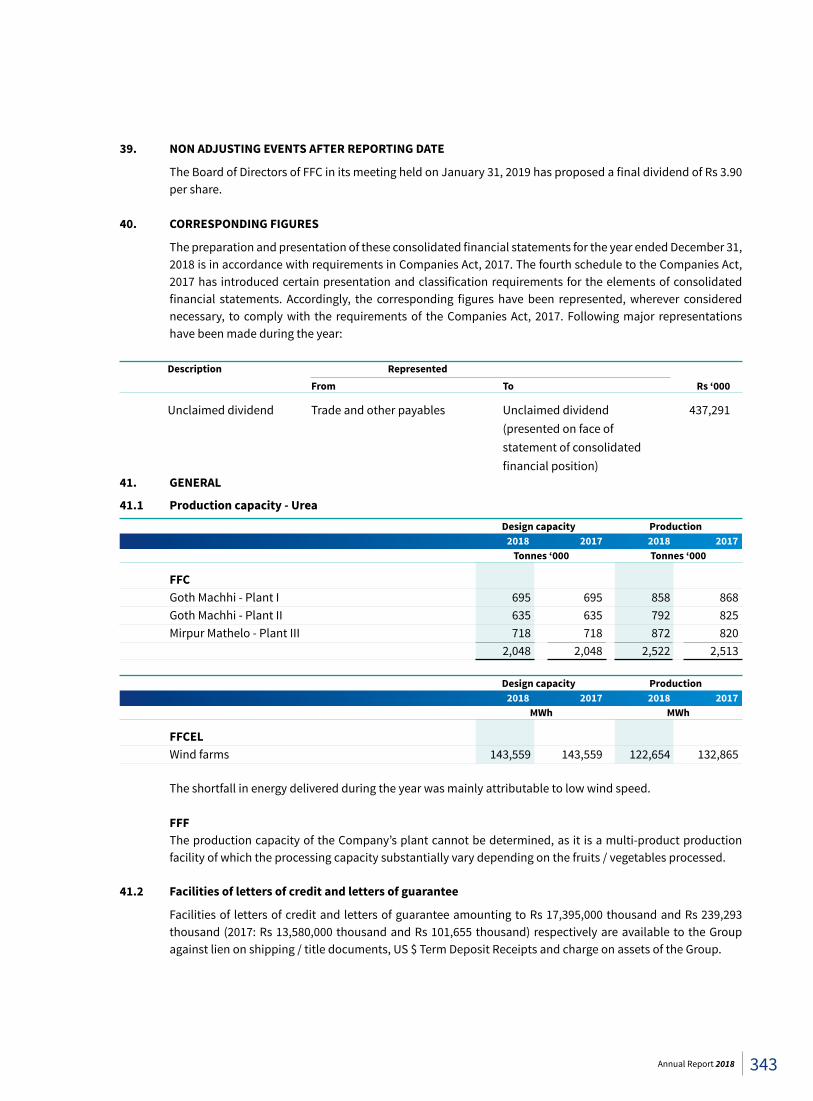
39. NON ADJUSTING EVENTS AFTER REPORTING DATE
The Board of Directors of FFC in its meeting held on January 31, 2019 has proposed a final dividend of Rs 3.90 per share.
40. CORRESPONDING FIGURES
The preparation and presentation of these consolidated financial statements for the year ended December 31, 2018 is in accordance with requirements in Companies Act, 2017. The fourth schedule to the Companies Act, 2017 has introduced certain presentation and classification requirements for the elements of consolidated financial statements. Accordingly, the corresponding figures have been represented, wherever considered necessary, to comply with the requirements of the Companies Act, 2017. Following major representations have been made during the year:
Description Represented From To Rs ‘000
Unclaimed dividend Trade and other payables Unclaimed dividend 437,291 (presented on face of statement of consolidated financial position)41. GENERAL
41.1 Production capacity - Urea Design capacity Production 2018 2017 2018 2017 Tonnes ‘000 Tonnes ‘000
FFC Goth Machhi - Plant I 695 695 858 868 Goth Machhi - Plant II 635 635 792 825 Mirpur Mathelo - Plant III 718 718 872 820 2,048 2,048 2,522 2,513 Design capacity Production 2018 2017 2018 2017 MWh MWh
FFCEL Wind farms 143,559 143,559 122,654 132,865
The shortfall in energy delivered during the year was mainly attributable to low wind speed.
FFF The production capacity of the Company’s plant cannot be determined, as it is a multi-product production
facility of which the processing capacity substantially vary depending on the fruits / vegetables processed.
41.2 Facilities of letters of credit and letters of guarantee
Facilities of letters of credit and letters of guarantee amounting to Rs 17,395,000 thousand and Rs 239,293 thousand (2017: Rs 13,580,000 thousand and Rs 101,655 thousand) respectively are available to the Group against lien on shipping / title documents, US $ Term Deposit Receipts and charge on assets of the Group.
343Annual Report 2018
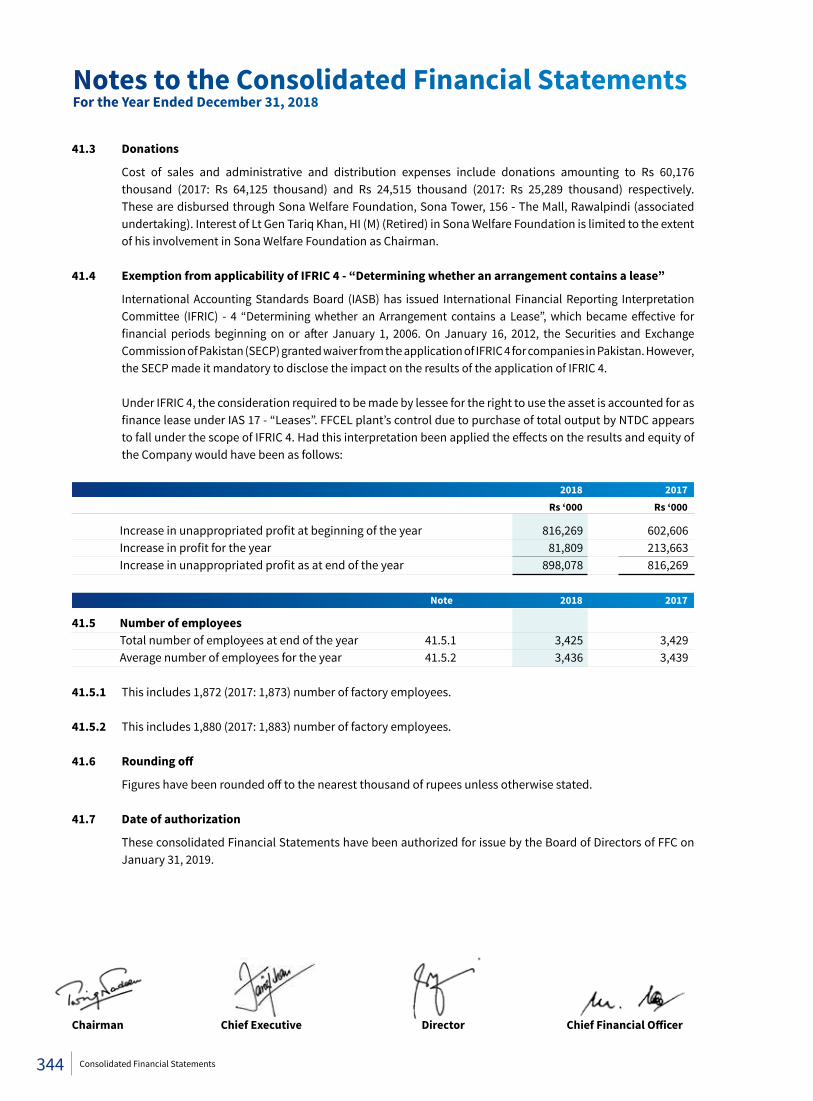
41.3 Donations
Cost of sales and administrative and distribution expenses include donations amounting to Rs 60,176 thousand (2017: Rs 64,125 thousand) and Rs 24,515 thousand (2017: Rs 25,289 thousand) respectively. These are disbursed through Sona Welfare Foundation, Sona Tower, 156 - The Mall, Rawalpindi (associated undertaking). Interest of Lt Gen Tariq Khan, HI (M) (Retired) in Sona Welfare Foundation is limited to the extent of his involvement in Sona Welfare Foundation as Chairman.
41.4 Exemption from applicability of IFRIC 4 - “Determining whether an arrangement contains a lease”
International Accounting Standards Board (IASB) has issued International Financial Reporting Interpretation Committee (IFRIC) - 4 “Determining whether an Arrangement contains a Lease”, which became effective for financial periods beginning on or after January 1, 2006. On January 16, 2012, the Securities and Exchange Commission of Pakistan (SECP) granted waiver from the application of IFRIC 4 for companies in Pakistan. However, the SECP made it mandatory to disclose the impact on the results of the application of IFRIC 4.
Under IFRIC 4, the consideration required to be made by lessee for the right to use the asset is accounted for as
finance lease under IAS 17 - “Leases”. FFCEL plant’s control due to purchase of total output by NTDC appears to fall under the scope of IFRIC 4. Had this interpretation been applied the effects on the results and equity of the Company would have been as follows:
2018 2017 Rs ‘000 Rs ‘000
Increase in unappropriated profit at beginning of the year 816,269 602,606 Increase in profit for the year 81,809 213,663 Increase in unappropriated profit as at end of the year 898,078 816,269 Note 2018 2017
41.5 Number of employees Total number of employees at end of the year 41.5.1 3,425 3,429 Average number of employees for the year 41.5.2 3,436 3,439 41.5.1 This includes 1,872 (2017: 1,873) number of factory employees. 41.5.2 This includes 1,880 (2017: 1,883) number of factory employees. 41.6 Roundingoff
Figures have been rounded off to the nearest thousand of rupees unless otherwise stated. 41.7 Date of authorization
These consolidated Financial Statements have been authorized for issue by the Board of Directors of FFC on January 31, 2019.
Chairman ChiefExecutive Director ChiefFinancialOfficer
Notes to the Consolidated Financial StatementsFor the Year Ended December 31, 2018
344 Consolidated Financial Statements
Shareholders’ Information
Fauji Fertilizer Company Limited
345Annual Report 2018
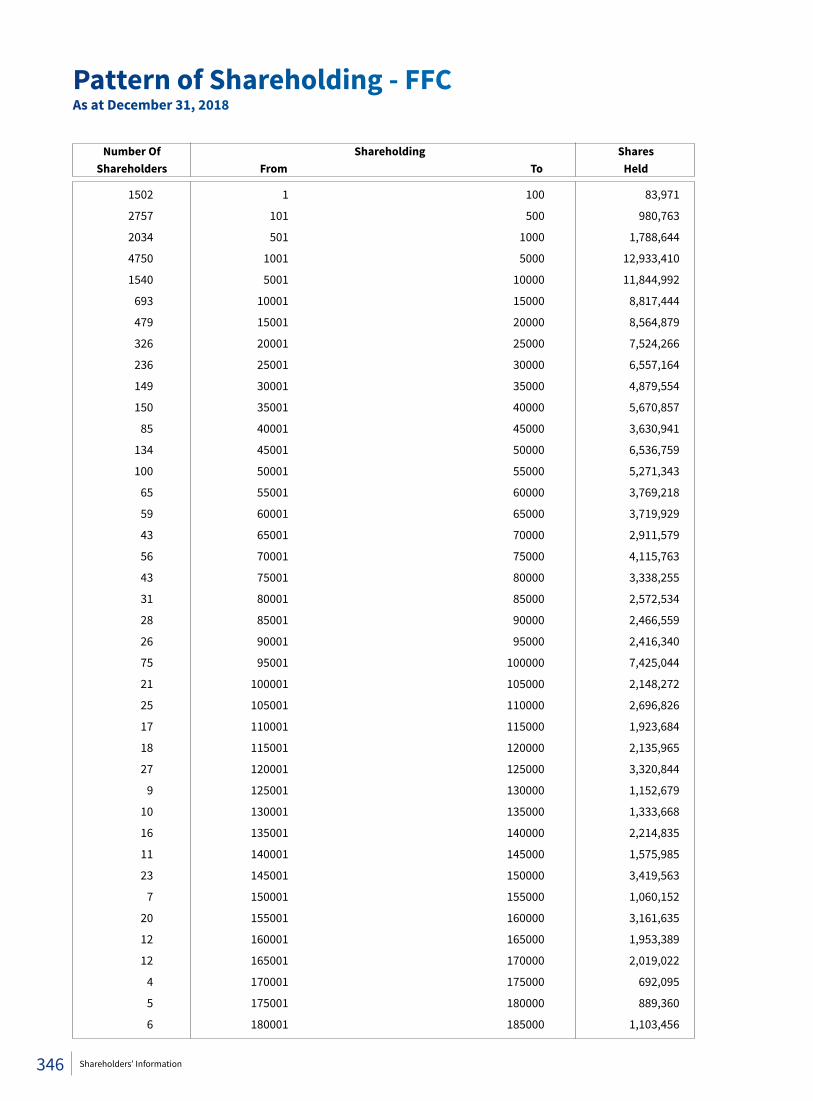
1502 1 100 83,971
2757 101 500 980,763
2034 501 1000 1,788,644
4750 1001 5000 12,933,410
1540 5001 10000 11,844,992
693 10001 15000 8,817,444
479 15001 20000 8,564,879
326 20001 25000 7,524,266
236 25001 30000 6,557,164
149 30001 35000 4,879,554
150 35001 40000 5,670,857
85 40001 45000 3,630,941
134 45001 50000 6,536,759
100 50001 55000 5,271,343
65 55001 60000 3,769,218
59 60001 65000 3,719,929
43 65001 70000 2,911,579
56 70001 75000 4,115,763
43 75001 80000 3,338,255
31 80001 85000 2,572,534
28 85001 90000 2,466,559
26 90001 95000 2,416,340
75 95001 100000 7,425,044
21 100001 105000 2,148,272
25 105001 110000 2,696,826
17 110001 115000 1,923,684
18 115001 120000 2,135,965
27 120001 125000 3,320,844
9 125001 130000 1,152,679
10 130001 135000 1,333,668
16 135001 140000 2,214,835
11 140001 145000 1,575,985
23 145001 150000 3,419,563
7 150001 155000 1,060,152
20 155001 160000 3,161,635
12 160001 165000 1,953,389
12 165001 170000 2,019,022
4 170001 175000 692,095
5 175001 180000 889,360
6 180001 185000 1,103,456
Number Of Shareholding
Shares Shareholders From To Held
Pattern of Shareholding - FFCAs at December 31, 2018
346 Shareholders’ Information
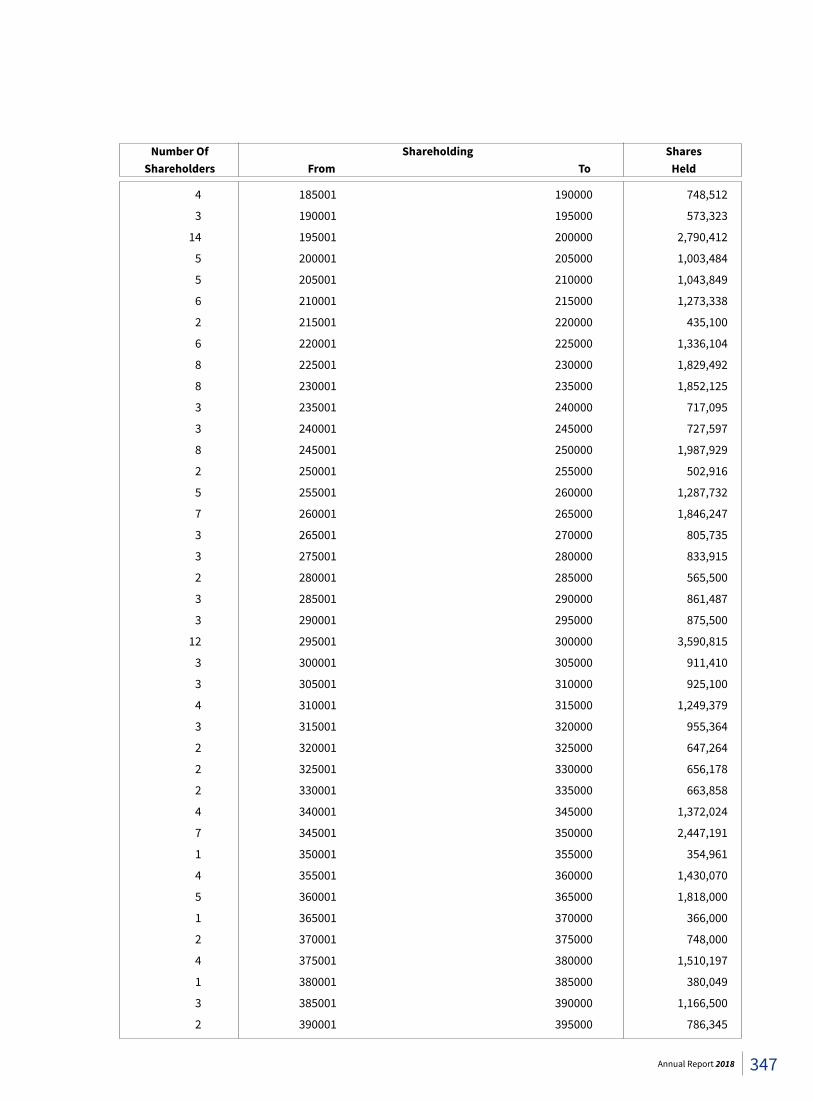
4 185001 190000 748,512
3 190001 195000 573,323
14 195001 200000 2,790,412
5 200001 205000 1,003,484
5 205001 210000 1,043,849
6 210001 215000 1,273,338
2 215001 220000 435,100
6 220001 225000 1,336,104
8 225001 230000 1,829,492
8 230001 235000 1,852,125
3 235001 240000 717,095
3 240001 245000 727,597
8 245001 250000 1,987,929
2 250001 255000 502,916
5 255001 260000 1,287,732
7 260001 265000 1,846,247
3 265001 270000 805,735
3 275001 280000 833,915
2 280001 285000 565,500
3 285001 290000 861,487
3 290001 295000 875,500
12 295001 300000 3,590,815
3 300001 305000 911,410
3 305001 310000 925,100
4 310001 315000 1,249,379
3 315001 320000 955,364
2 320001 325000 647,264
2 325001 330000 656,178
2 330001 335000 663,858
4 340001 345000 1,372,024
7 345001 350000 2,447,191
1 350001 355000 354,961
4 355001 360000 1,430,070
5 360001 365000 1,818,000
1 365001 370000 366,000
2 370001 375000 748,000
4 375001 380000 1,510,197
1 380001 385000 380,049
3 385001 390000 1,166,500
2 390001 395000 786,345
Number Of Shareholding
Shares Shareholders From To Held
347Annual Report 2018
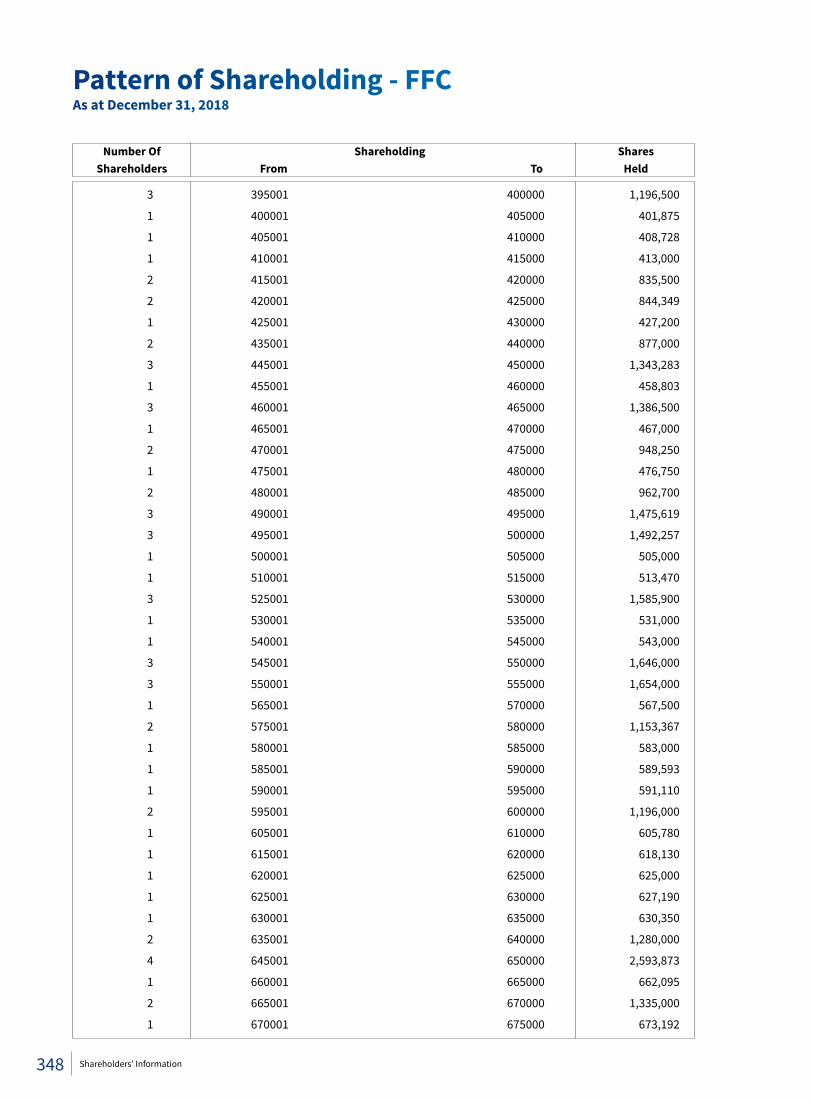
3 395001 400000 1,196,500
1 400001 405000 401,875
1 405001 410000 408,728
1 410001 415000 413,000
2 415001 420000 835,500
2 420001 425000 844,349
1 425001 430000 427,200
2 435001 440000 877,000
3 445001 450000 1,343,283
1 455001 460000 458,803
3 460001 465000 1,386,500
1 465001 470000 467,000
2 470001 475000 948,250
1 475001 480000 476,750
2 480001 485000 962,700
3 490001 495000 1,475,619
3 495001 500000 1,492,257
1 500001 505000 505,000
1 510001 515000 513,470
3 525001 530000 1,585,900
1 530001 535000 531,000
1 540001 545000 543,000
3 545001 550000 1,646,000
3 550001 555000 1,654,000
1 565001 570000 567,500
2 575001 580000 1,153,367
1 580001 585000 583,000
1 585001 590000 589,593
1 590001 595000 591,110
2 595001 600000 1,196,000
1 605001 610000 605,780
1 615001 620000 618,130
1 620001 625000 625,000
1 625001 630000 627,190
1 630001 635000 630,350
2 635001 640000 1,280,000
4 645001 650000 2,593,873
1 660001 665000 662,095
2 665001 670000 1,335,000
1 670001 675000 673,192
Number Of Shareholding
Shares Shareholders From To Held
Pattern of Shareholding - FFCAs at December 31, 2018
348 Shareholders’ Information
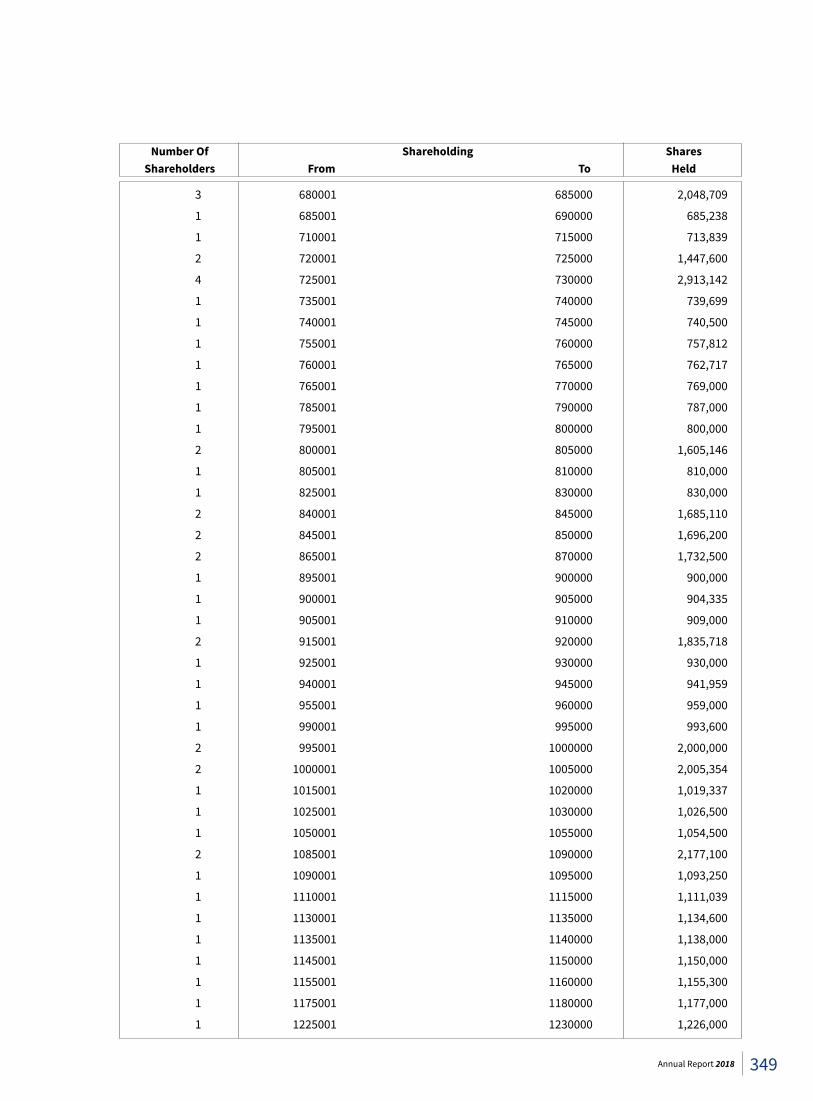
3 680001 685000 2,048,709
1 685001 690000 685,238
1 710001 715000 713,839
2 720001 725000 1,447,600
4 725001 730000 2,913,142
1 735001 740000 739,699
1 740001 745000 740,500
1 755001 760000 757,812
1 760001 765000 762,717
1 765001 770000 769,000
1 785001 790000 787,000
1 795001 800000 800,000
2 800001 805000 1,605,146
1 805001 810000 810,000
1 825001 830000 830,000
2 840001 845000 1,685,110
2 845001 850000 1,696,200
2 865001 870000 1,732,500
1 895001 900000 900,000
1 900001 905000 904,335
1 905001 910000 909,000
2 915001 920000 1,835,718
1 925001 930000 930,000
1 940001 945000 941,959
1 955001 960000 959,000
1 990001 995000 993,600
2 995001 1000000 2,000,000
2 1000001 1005000 2,005,354
1 1015001 1020000 1,019,337
1 1025001 1030000 1,026,500
1 1050001 1055000 1,054,500
2 1085001 1090000 2,177,100
1 1090001 1095000 1,093,250
1 1110001 1115000 1,111,039
1 1130001 1135000 1,134,600
1 1135001 1140000 1,138,000
1 1145001 1150000 1,150,000
1 1155001 1160000 1,155,300
1 1175001 1180000 1,177,000
1 1225001 1230000 1,226,000
Number Of Shareholding
Shares Shareholders From To Held
349Annual Report 2018

1 1270001 1275000 1,270,800
1 1275001 1280000 1,275,700
1 1290001 1295000 1,291,000
1 1315001 1320000 1,316,000
2 1370001 1375000 2,744,614
1 1380001 1385000 1,381,690
1 1445001 1450000 1,449,630
1 1455001 1460000 1,459,500
1 1465001 1470000 1,468,409
1 1510001 1515000 1,511,025
1 1515001 1520000 1,519,407
1 1540001 1545000 1,540,700
1 1545001 1550000 1,546,304
2 1555001 1560000 3,114,500
1 1660001 1665000 1,661,643
1 1665001 1670000 1,669,198
1 1670001 1675000 1,673,125
1 1695001 1700000 1,700,000
1 1710001 1715000 1,713,800
1 1715001 1720000 1,718,231
1 1780001 1785000 1,784,878
4 1795001 1800000 7,200,000
1 1815001 1820000 1,819,000
1 1895001 1900000 1,899,000
2 1995001 2000000 4,000,000
1 2055001 2060000 2,055,500
1 2115001 2120000 2,120,000
1 2135001 2140000 2,136,229
2 2195001 2200000 4,400,000
1 2255001 2260000 2,258,787
1 2305001 2310000 2,309,100
1 2310001 2315000 2,313,501
1 2445001 2450000 2,447,000
1 2635001 2640000 2,639,500
1 2660001 2665000 2,661,496
1 3060001 3065000 3,060,500
1 3505001 3510000 3,510,000
1 3555001 3560000 3,558,000
1 3775001 3780000 3,775,700
1 3925001 3930000 3,930,000
Number Of Shareholding
Shares Shareholders From To Held
Pattern of Shareholding - FFCAs at December 31, 2018
350 Shareholders’ Information
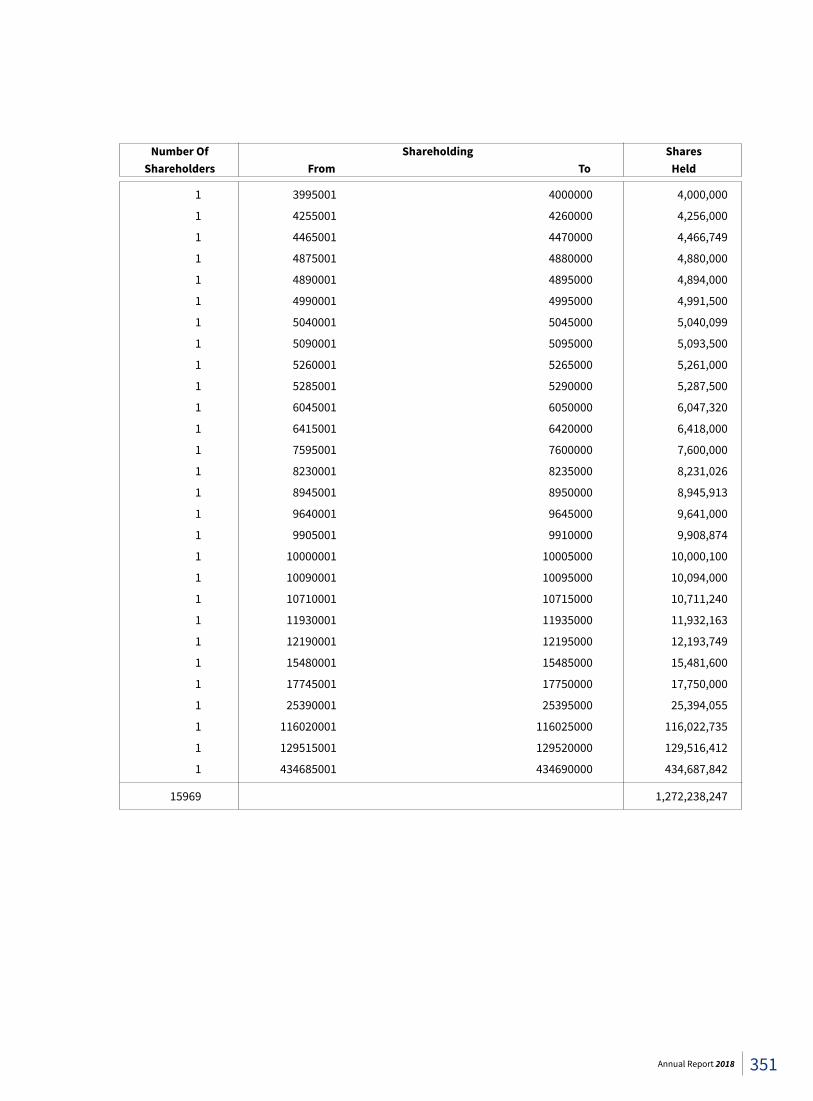
1 3995001 4000000 4,000,000
1 4255001 4260000 4,256,000
1 4465001 4470000 4,466,749
1 4875001 4880000 4,880,000
1 4890001 4895000 4,894,000
1 4990001 4995000 4,991,500
1 5040001 5045000 5,040,099
1 5090001 5095000 5,093,500
1 5260001 5265000 5,261,000
1 5285001 5290000 5,287,500
1 6045001 6050000 6,047,320
1 6415001 6420000 6,418,000
1 7595001 7600000 7,600,000
1 8230001 8235000 8,231,026
1 8945001 8950000 8,945,913
1 9640001 9645000 9,641,000
1 9905001 9910000 9,908,874
1 10000001 10005000 10,000,100
1 10090001 10095000 10,094,000
1 10710001 10715000 10,711,240
1 11930001 11935000 11,932,163
1 12190001 12195000 12,193,749
1 15480001 15485000 15,481,600
1 17745001 17750000 17,750,000
1 25390001 25395000 25,394,055
1 116020001 116025000 116,022,735
1 129515001 129520000 129,516,412
1 434685001 434690000 434,687,842
15969 1,272,238,247
Number Of Shareholding
Shares Shareholders From To Held
351Annual Report 2018
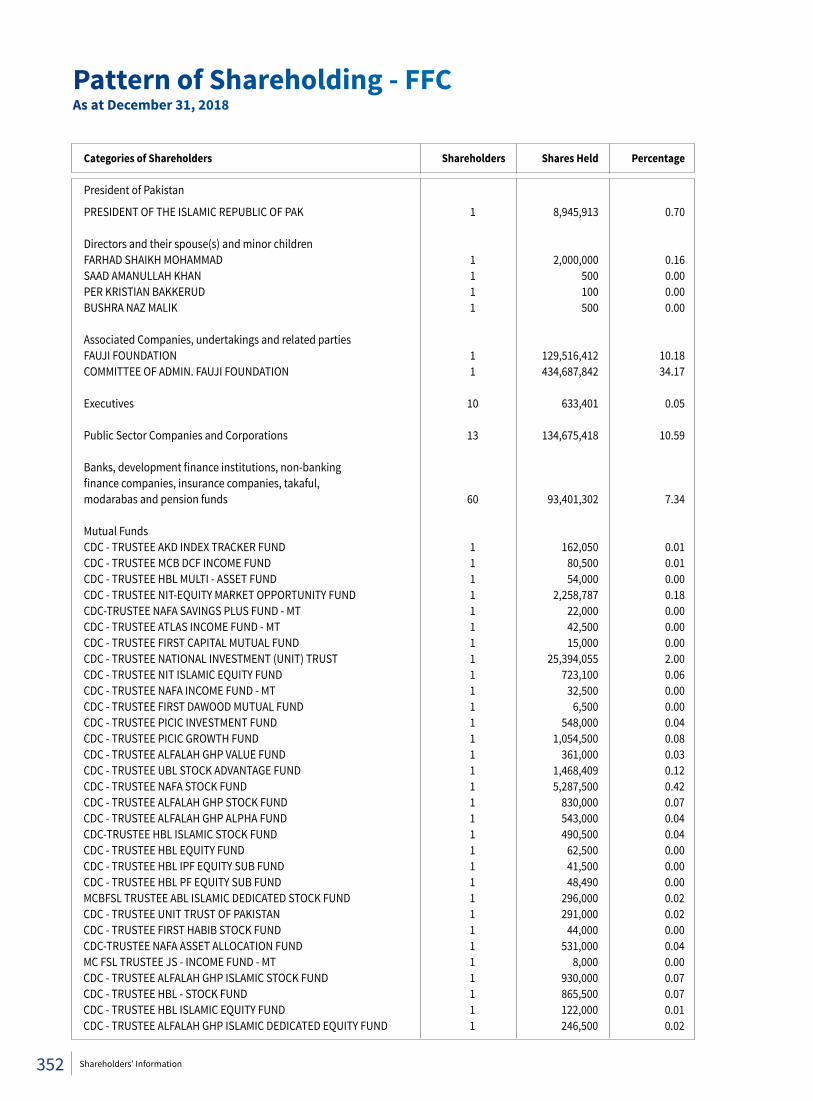
Categories of Shareholders Shareholders Shares Held Percentage
President of Pakistan
PRESIDENT OF THE ISLAMIC REPUBLIC OF PAK 1 8,945,913 0.70 Directors and their spouse(s) and minor children FARHAD SHAIKH MOHAMMAD 1 2,000,000 0.16 SAAD AMANULLAH KHAN 1 500 0.00 PER KRISTIAN BAKKERUD 1 100 0.00 BUSHRA NAZ MALIK 1 500 0.00 Associated Companies, undertakings and related parties FAUJI FOUNDATION 1 129,516,412 10.18 COMMITTEE OF ADMIN. FAUJI FOUNDATION 1 434,687,842 34.17 Executives 10 633,401 0.05 Public Sector Companies and Corporations 13 134,675,418 10.59 Banks, development finance institutions, non-banking finance companies, insurance companies, takaful, modarabas and pension funds 60 93,401,302 7.34 Mutual Funds CDC - TRUSTEE AKD INDEX TRACKER FUND 1 162,050 0.01 CDC - TRUSTEE MCB DCF INCOME FUND 1 80,500 0.01 CDC - TRUSTEE HBL MULTI - ASSET FUND 1 54,000 0.00 CDC - TRUSTEE NIT-EQUITY MARKET OPPORTUNITY FUND 1 2,258,787 0.18 CDC-TRUSTEE NAFA SAVINGS PLUS FUND - MT 1 22,000 0.00 CDC - TRUSTEE ATLAS INCOME FUND - MT 1 42,500 0.00 CDC - TRUSTEE FIRST CAPITAL MUTUAL FUND 1 15,000 0.00 CDC - TRUSTEE NATIONAL INVESTMENT (UNIT) TRUST 1 25,394,055 2.00 CDC - TRUSTEE NIT ISLAMIC EQUITY FUND 1 723,100 0.06 CDC - TRUSTEE NAFA INCOME FUND - MT 1 32,500 0.00 CDC - TRUSTEE FIRST DAWOOD MUTUAL FUND 1 6,500 0.00 CDC - TRUSTEE PICIC INVESTMENT FUND 1 548,000 0.04 CDC - TRUSTEE PICIC GROWTH FUND 1 1,054,500 0.08 CDC - TRUSTEE ALFALAH GHP VALUE FUND 1 361,000 0.03 CDC - TRUSTEE UBL STOCK ADVANTAGE FUND 1 1,468,409 0.12 CDC - TRUSTEE NAFA STOCK FUND 1 5,287,500 0.42 CDC - TRUSTEE ALFALAH GHP STOCK FUND 1 830,000 0.07 CDC - TRUSTEE ALFALAH GHP ALPHA FUND 1 543,000 0.04 CDC-TRUSTEE HBL ISLAMIC STOCK FUND 1 490,500 0.04 CDC - TRUSTEE HBL EQUITY FUND 1 62,500 0.00 CDC - TRUSTEE HBL IPF EQUITY SUB FUND 1 41,500 0.00 CDC - TRUSTEE HBL PF EQUITY SUB FUND 1 48,490 0.00 MCBFSL TRUSTEE ABL ISLAMIC DEDICATED STOCK FUND 1 296,000 0.02 CDC - TRUSTEE UNIT TRUST OF PAKISTAN 1 291,000 0.02 CDC - TRUSTEE FIRST HABIB STOCK FUND 1 44,000 0.00 CDC-TRUSTEE NAFA ASSET ALLOCATION FUND 1 531,000 0.04 MC FSL TRUSTEE JS - INCOME FUND - MT 1 8,000 0.00 CDC - TRUSTEE ALFALAH GHP ISLAMIC STOCK FUND 1 930,000 0.07 CDC - TRUSTEE HBL - STOCK FUND 1 865,500 0.07 CDC - TRUSTEE HBL ISLAMIC EQUITY FUND 1 122,000 0.01 CDC - TRUSTEE ALFALAH GHP ISLAMIC DEDICATED EQUITY FUND 1 246,500 0.02
Pattern of Shareholding - FFCAs at December 31, 2018
352 Shareholders’ Information
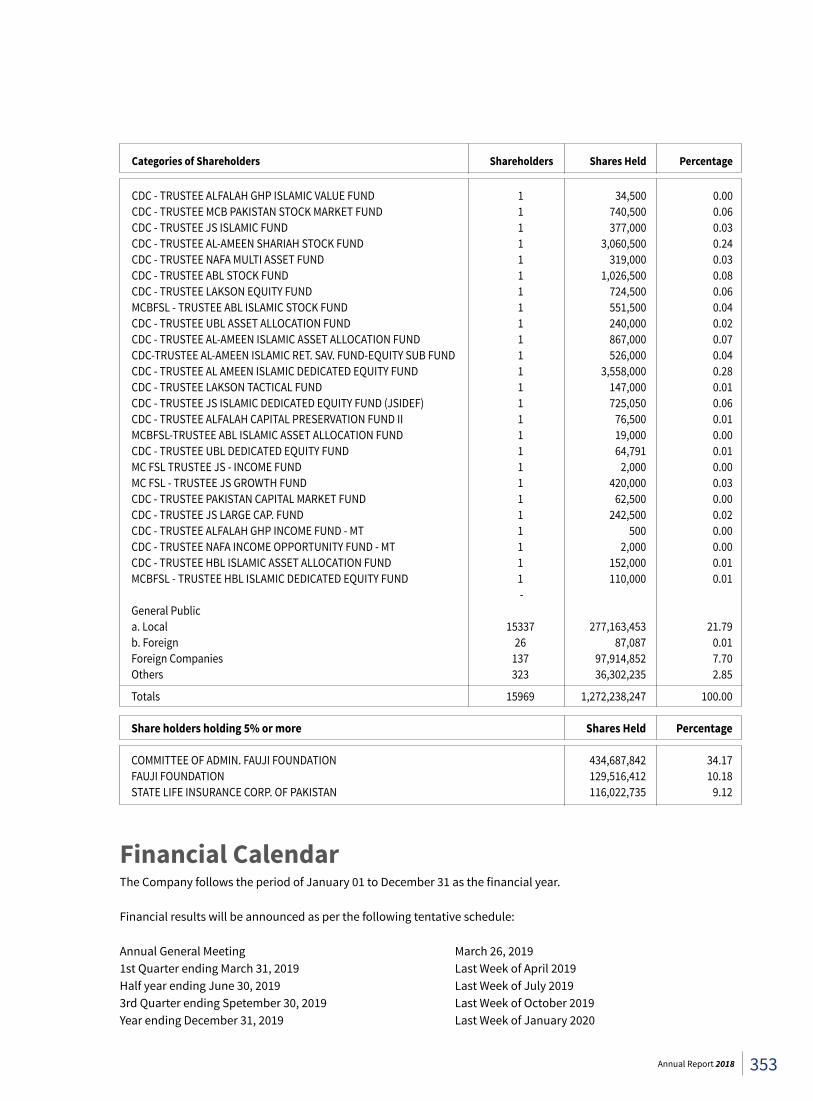
Categories of Shareholders Shareholders Shares Held Percentage
CDC - TRUSTEE ALFALAH GHP ISLAMIC VALUE FUND 1 34,500 0.00 CDC - TRUSTEE MCB PAKISTAN STOCK MARKET FUND 1 740,500 0.06 CDC - TRUSTEE JS ISLAMIC FUND 1 377,000 0.03 CDC - TRUSTEE AL-AMEEN SHARIAH STOCK FUND 1 3,060,500 0.24 CDC - TRUSTEE NAFA MULTI ASSET FUND 1 319,000 0.03 CDC - TRUSTEE ABL STOCK FUND 1 1,026,500 0.08 CDC - TRUSTEE LAKSON EQUITY FUND 1 724,500 0.06 MCBFSL - TRUSTEE ABL ISLAMIC STOCK FUND 1 551,500 0.04 CDC - TRUSTEE UBL ASSET ALLOCATION FUND 1 240,000 0.02 CDC - TRUSTEE AL-AMEEN ISLAMIC ASSET ALLOCATION FUND 1 867,000 0.07 CDC-TRUSTEE AL-AMEEN ISLAMIC RET. SAV. FUND-EQUITY SUB FUND 1 526,000 0.04 CDC - TRUSTEE AL AMEEN ISLAMIC DEDICATED EQUITY FUND 1 3,558,000 0.28 CDC - TRUSTEE LAKSON TACTICAL FUND 1 147,000 0.01 CDC - TRUSTEE JS ISLAMIC DEDICATED EQUITY FUND (JSIDEF) 1 725,050 0.06 CDC - TRUSTEE ALFALAH CAPITAL PRESERVATION FUND II 1 76,500 0.01 MCBFSL-TRUSTEE ABL ISLAMIC ASSET ALLOCATION FUND 1 19,000 0.00 CDC - TRUSTEE UBL DEDICATED EQUITY FUND 1 64,791 0.01 MC FSL TRUSTEE JS - INCOME FUND 1 2,000 0.00 MC FSL - TRUSTEE JS GROWTH FUND 1 420,000 0.03 CDC - TRUSTEE PAKISTAN CAPITAL MARKET FUND 1 62,500 0.00 CDC - TRUSTEE JS LARGE CAP. FUND 1 242,500 0.02 CDC - TRUSTEE ALFALAH GHP INCOME FUND - MT 1 500 0.00 CDC - TRUSTEE NAFA INCOME OPPORTUNITY FUND - MT 1 2,000 0.00 CDC - TRUSTEE HBL ISLAMIC ASSET ALLOCATION FUND 1 152,000 0.01 MCBFSL - TRUSTEE HBL ISLAMIC DEDICATED EQUITY FUND 1 110,000 0.01 - General Public a. Local 15337 277,163,453 21.79 b. Foreign 26 87,087 0.01 Foreign Companies 137 97,914,852 7.70 Others 323 36,302,235 2.85
Totals 15969 1,272,238,247 100.00
Shareholdersholding5%ormore SharesHeld Percentage COMMITTEE OF ADMIN. FAUJI FOUNDATION 434,687,842 34.17 FAUJI FOUNDATION 129,516,412 10.18 STATE LIFE INSURANCE CORP. OF PAKISTAN 116,022,735 9.12
Financial CalendarThe Company follows the period of January 01 to December 31 as the financial year.
Financial results will be announced as per the following tentative schedule:
Annual General Meeting March 26, 2019 1st Quarter ending March 31, 2019 Last Week of April 2019 Half year ending June 30, 2019 Last Week of July 2019 3rd Quarter ending Spetember 30, 2019 Last Week of October 2019 Year ending December 31, 2019 Last Week of January 2020
353Annual Report 2018
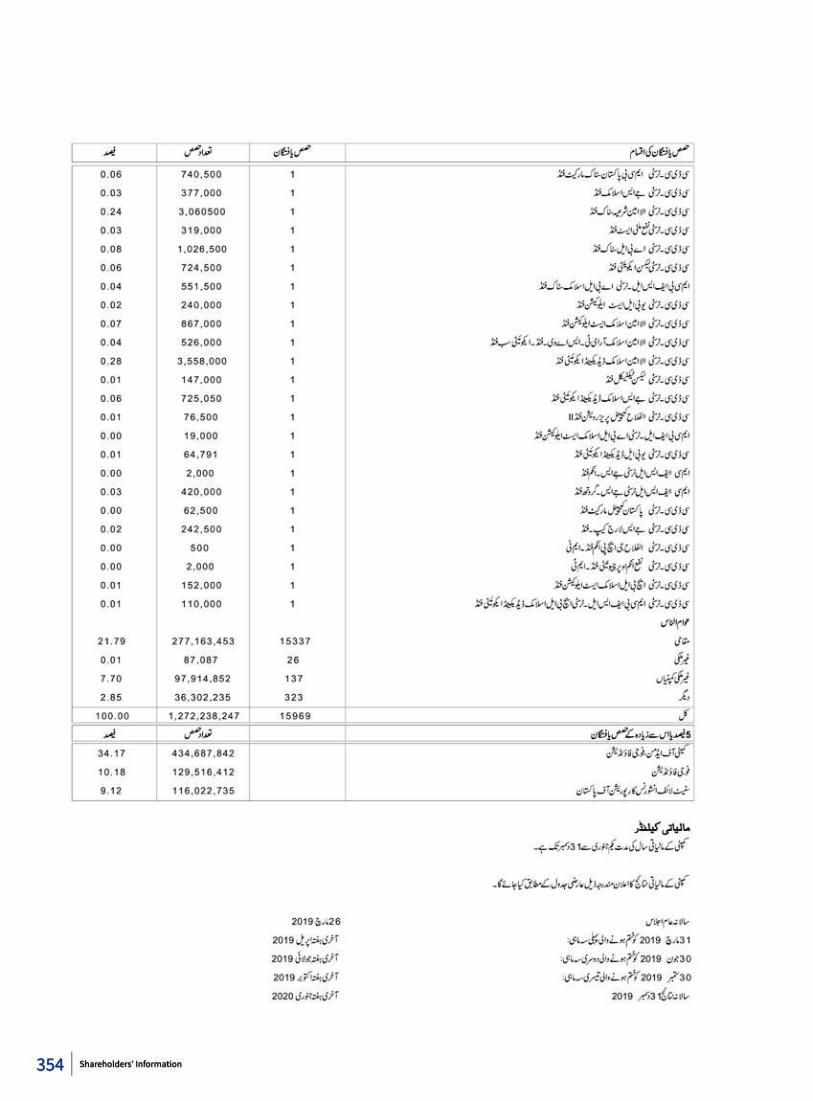
354 Shareholders’ Information
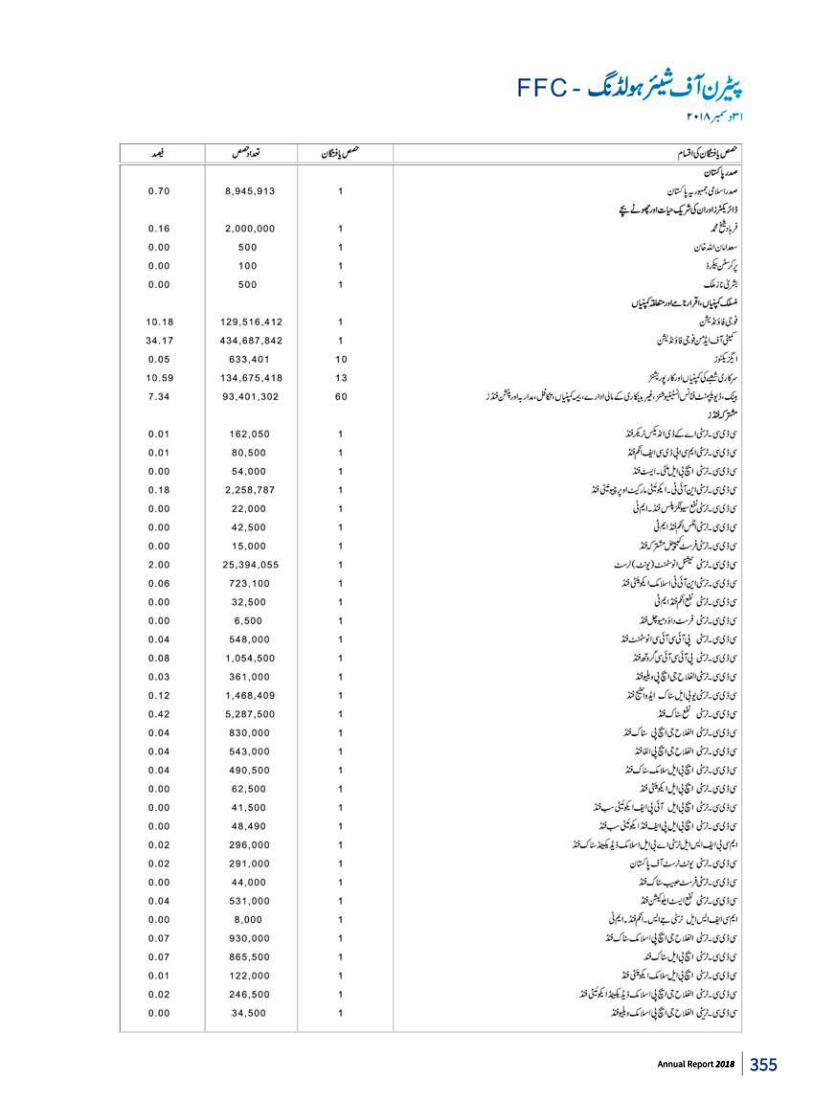
355Annual Report 2018
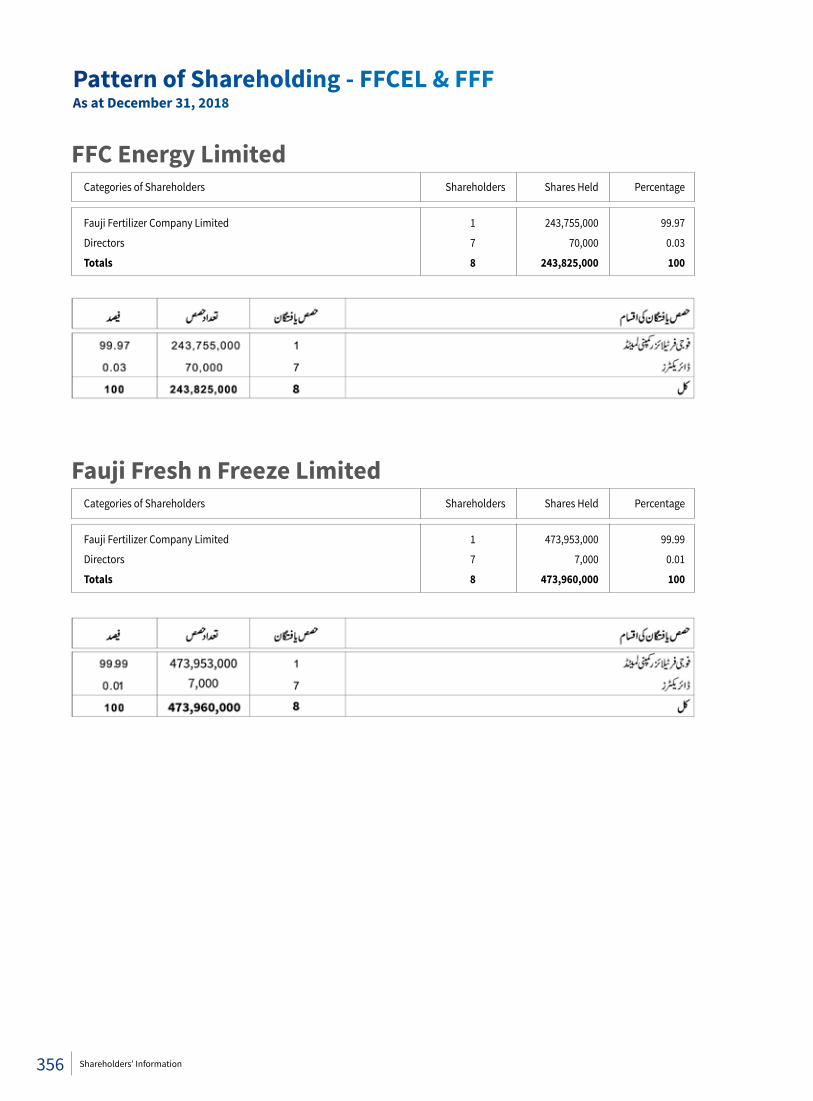
Pattern of Shareholding - FFCEL & FFFAs at December 31, 2018
Fauji Fresh n Freeze Limited
Categories of Shareholders Shareholders Shares Held Percentage
Fauji Fertilizer Company Limited 1 243,755,000 99.97
Directors 7 70,000 0.03
Totals 8 243,825,000 100
Categories of Shareholders Shareholders Shares Held Percentage
Fauji Fertilizer Company Limited 1 473,953,000 99.99
Directors 7 7,000 0.01
Totals 8 473,960,000 100
FFC Energy Limited
356 Shareholders’ Information
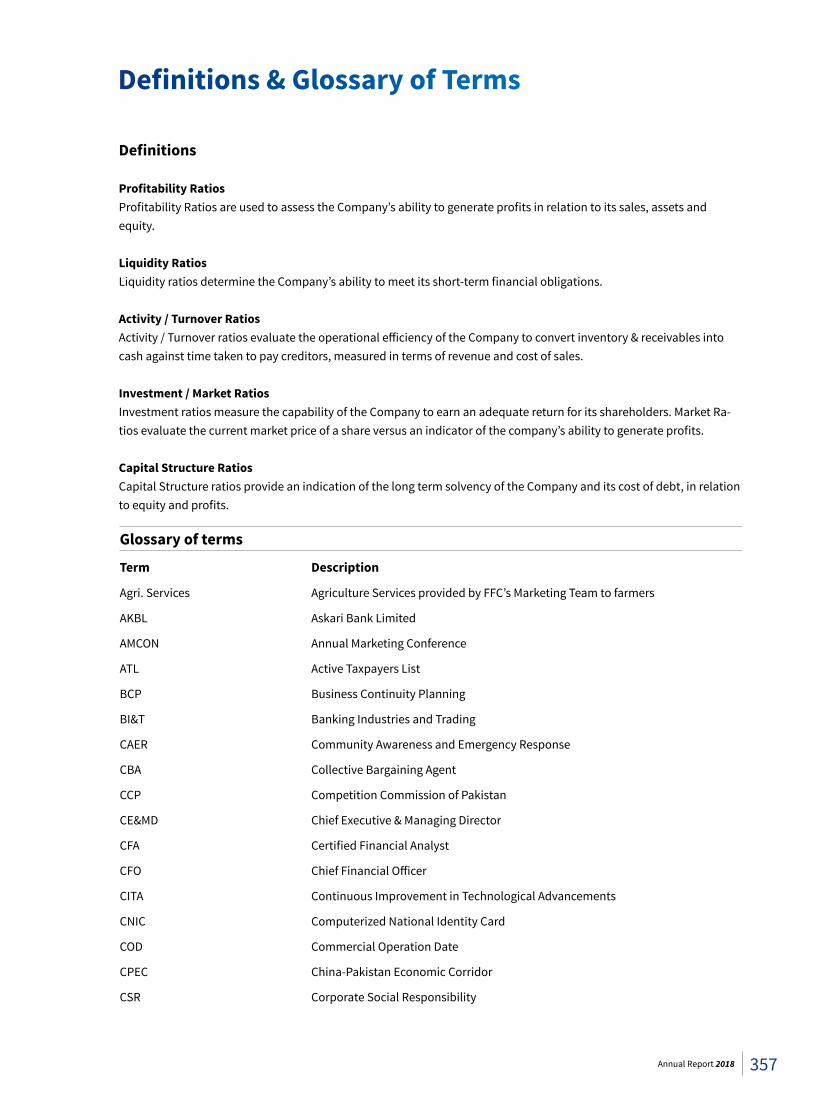
Glossary of terms
Term Description
Agri. Services Agriculture Services provided by FFC’s Marketing Team to farmers
AKBL Askari Bank Limited
AMCON Annual Marketing Conference
ATL Active Taxpayers List
BCP Business Continuity Planning
BI&T Banking Industries and Trading
CAER Community Awareness and Emergency Response
CBA Collective Bargaining Agent
CCP Competition Commission of Pakistan
CE&MD Chief Executive & Managing Director
CFA Certified Financial Analyst
CFO Chief Financial Officer
CITA Continuous Improvement in Technological Advancements
CNIC Computerized National Identity Card
COD Commercial Operation Date
CPEC China-Pakistan Economic Corridor
CSR Corporate Social Responsibility
Definitions
ProfitabilityRatiosProfitability Ratios are used to assess the Company’s ability to generate profits in relation to its sales, assets and equity.
Liquidity RatiosLiquidity ratios determine the Company’s ability to meet its short-term financial obligations.
Activity / Turnover RatiosActivity / Turnover ratios evaluate the operational efficiency of the Company to convert inventory & receivables into cash against time taken to pay creditors, measured in terms of revenue and cost of sales.
Investment / Market RatiosInvestment ratios measure the capability of the Company to earn an adequate return for its shareholders. Market Ra-tios evaluate the current market price of a share versus an indicator of the company’s ability to generate profits.
Capital Structure RatiosCapital Structure ratios provide an indication of the long term solvency of the Company and its cost of debt, in relation to equity and profits.
Definitions&GlossaryofTerms
357Annual Report 2018
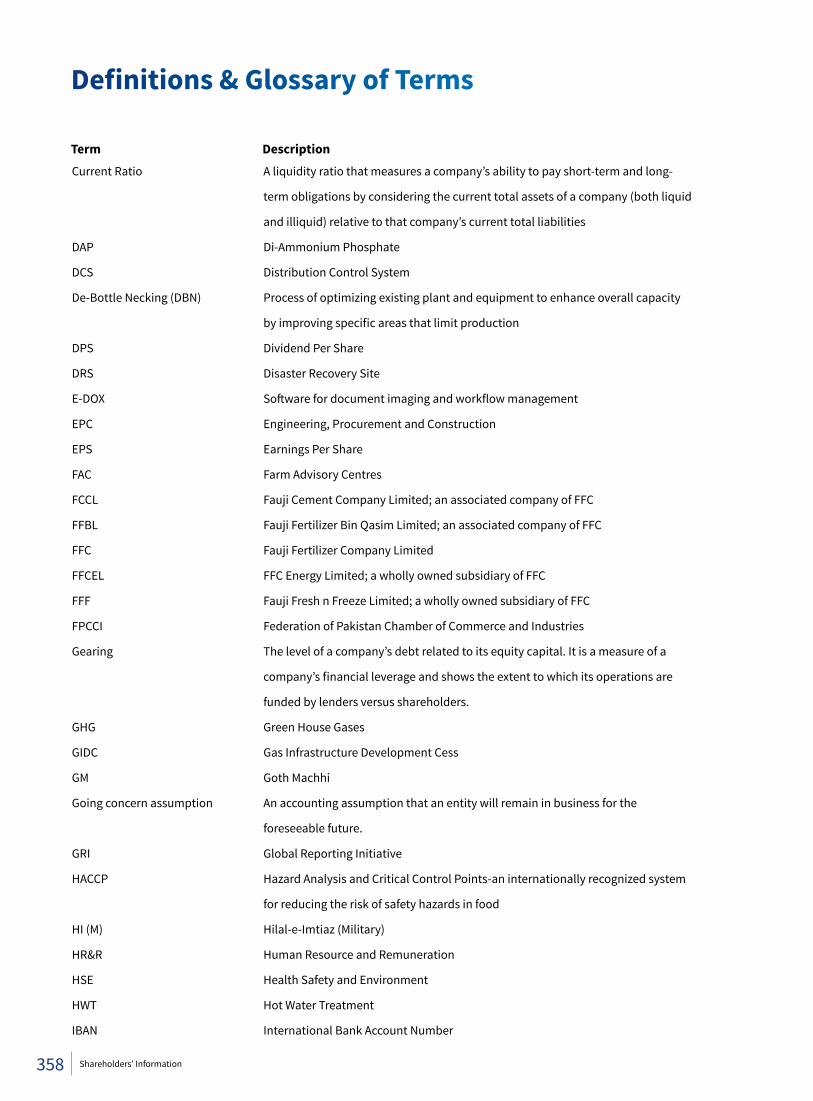
Term Description
Current Ratio A liquidity ratio that measures a company’s ability to pay short-term and long-
term obligations by considering the current total assets of a company (both liquid
and illiquid) relative to that company’s current total liabilities
DAP Di-Ammonium Phosphate
DCS Distribution Control System
De-Bottle Necking (DBN) Process of optimizing existing plant and equipment to enhance overall capacity
by improving specific areas that limit production
DPS Dividend Per Share
DRS Disaster Recovery Site
E-DOX Software for document imaging and workflow management
EPC Engineering, Procurement and Construction
EPS Earnings Per Share
FAC Farm Advisory Centres
FCCL Fauji Cement Company Limited; an associated company of FFC
FFBL Fauji Fertilizer Bin Qasim Limited; an associated company of FFC
FFC Fauji Fertilizer Company Limited
FFCEL FFC Energy Limited; a wholly owned subsidiary of FFC
FFF Fauji Fresh n Freeze Limited; a wholly owned subsidiary of FFC
FPCCI Federation of Pakistan Chamber of Commerce and Industries
Gearing The level of a company’s debt related to its equity capital. It is a measure of a
company’s financial leverage and shows the extent to which its operations are
funded by lenders versus shareholders.
GHG Green House Gases
GIDC Gas Infrastructure Development Cess
GM Goth Machhi
Going concern assumption An accounting assumption that an entity will remain in business for the
foreseeable future.
GRI Global Reporting Initiative
HACCP Hazard Analysis and Critical Control Points-an internationally recognized system
for reducing the risk of safety hazards in food
HI (M) Hilal-e-Imtiaz (Military)
HR&R Human Resource and Remuneration
HSE Health Safety and Environment
HWT Hot Water Treatment
IBAN International Bank Account Number
Definitions&GlossaryofTerms
358 Shareholders’ Information
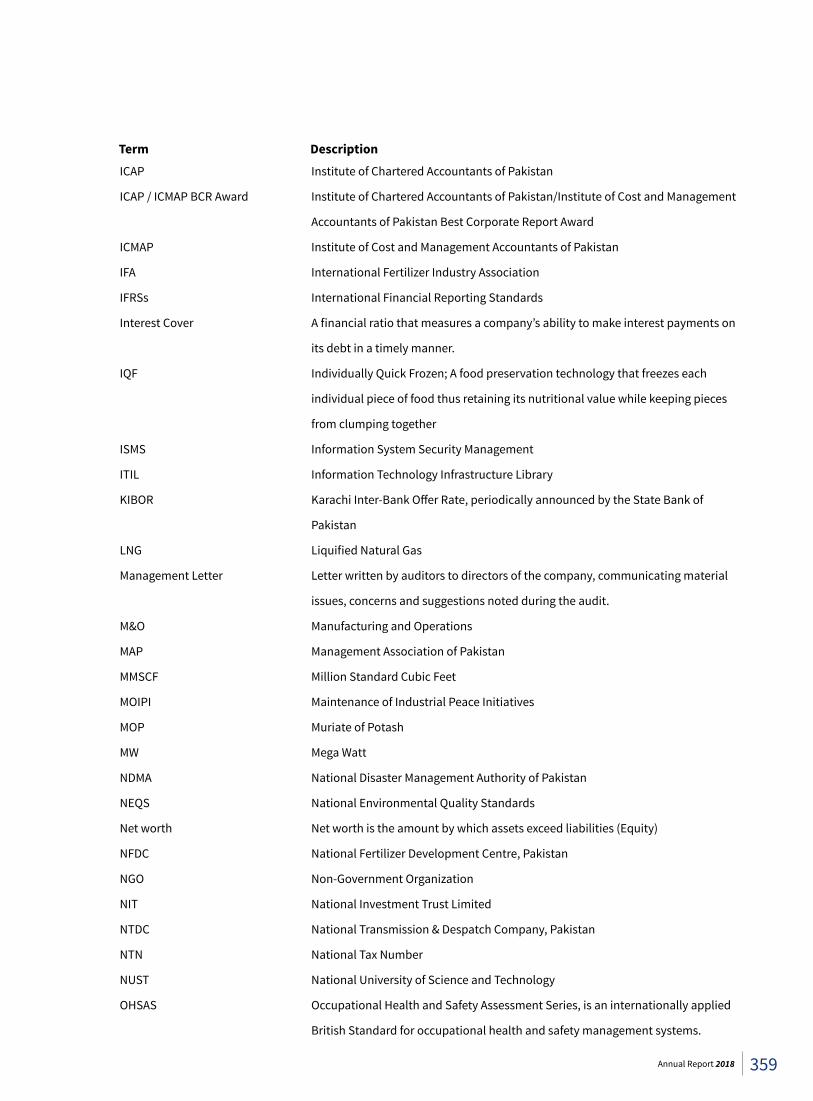
Term Description
ICAP Institute of Chartered Accountants of Pakistan
ICAP / ICMAP BCR Award Institute of Chartered Accountants of Pakistan/Institute of Cost and Management
Accountants of Pakistan Best Corporate Report Award
ICMAP Institute of Cost and Management Accountants of Pakistan
IFA International Fertilizer Industry Association
IFRSs International Financial Reporting Standards
Interest Cover A financial ratio that measures a company’s ability to make interest payments on
its debt in a timely manner.
IQF Individually Quick Frozen; A food preservation technology that freezes each
individual piece of food thus retaining its nutritional value while keeping pieces
from clumping together
ISMS Information System Security Management
ITIL Information Technology Infrastructure Library
KIBOR Karachi Inter-Bank Offer Rate, periodically announced by the State Bank of
Pakistan
LNG Liquified Natural Gas
Management Letter Letter written by auditors to directors of the company, communicating material
issues, concerns and suggestions noted during the audit.
M&O Manufacturing and Operations
MAP Management Association of Pakistan
MMSCF Million Standard Cubic Feet
MOIPI Maintenance of Industrial Peace Initiatives
MOP Muriate of Potash
MW Mega Watt
NDMA National Disaster Management Authority of Pakistan
NEQS National Environmental Quality Standards
Net worth Net worth is the amount by which assets exceed liabilities (Equity)
NFDC National Fertilizer Development Centre, Pakistan
NGO Non-Government Organization
NIT National Investment Trust Limited
NTDC National Transmission & Despatch Company, Pakistan
NTN National Tax Number
NUST National University of Science and Technology
OHSAS Occupational Health and Safety Assessment Series, is an internationally applied
British Standard for occupational health and safety management systems.
359Annual Report 2018
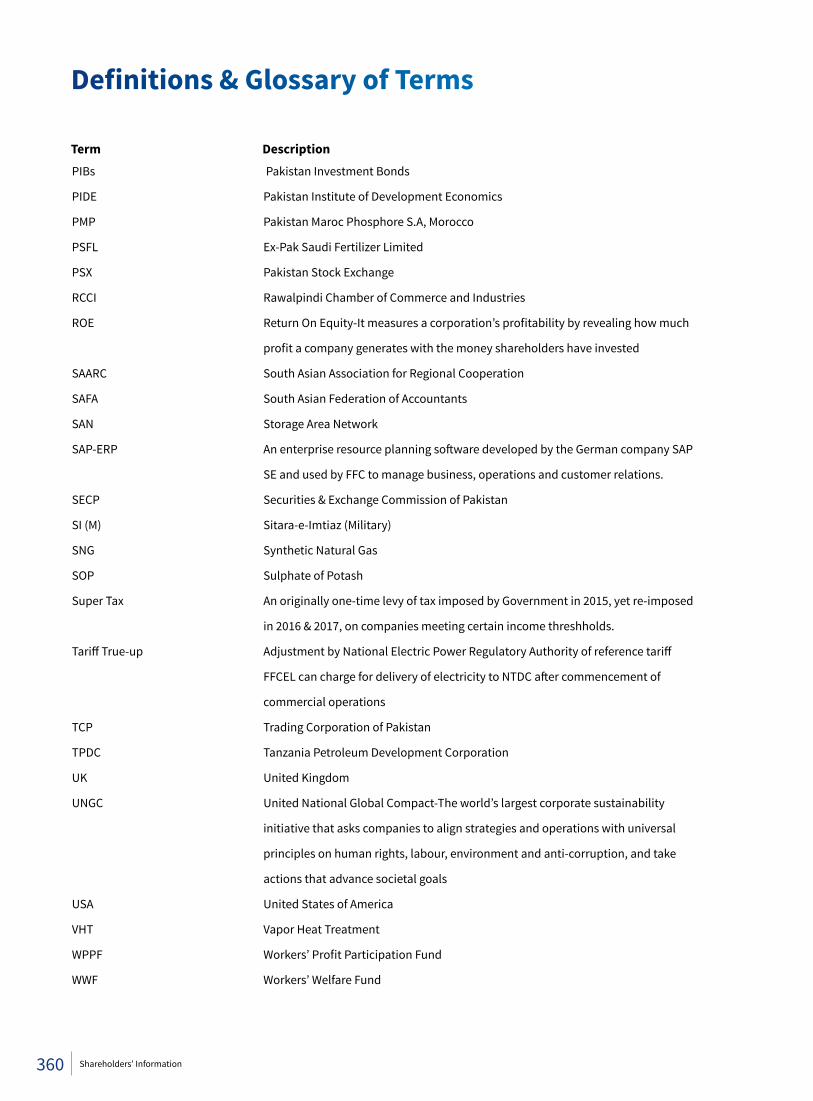
PIBs Pakistan Investment Bonds
PIDE Pakistan Institute of Development Economics
PMP Pakistan Maroc Phosphore S.A, Morocco
PSFL Ex-Pak Saudi Fertilizer Limited
PSX Pakistan Stock Exchange
RCCI Rawalpindi Chamber of Commerce and Industries
ROE Return On Equity-It measures a corporation’s profitability by revealing how much
profit a company generates with the money shareholders have invested
SAARC South Asian Association for Regional Cooperation
SAFA South Asian Federation of Accountants
SAN Storage Area Network
SAP-ERP An enterprise resource planning software developed by the German company SAP
SE and used by FFC to manage business, operations and customer relations.
SECP Securities & Exchange Commission of Pakistan
SI (M) Sitara-e-Imtiaz (Military)
SNG Synthetic Natural Gas
SOP Sulphate of Potash
Super Tax An originally one-time levy of tax imposed by Government in 2015, yet re-imposed
in 2016 & 2017, on companies meeting certain income threshholds.
Tariff True-up Adjustment by National Electric Power Regulatory Authority of reference tariff
FFCEL can charge for delivery of electricity to NTDC after commencement of
commercial operations
TCP Trading Corporation of Pakistan
TPDC Tanzania Petroleum Development Corporation
UK United Kingdom
UNGC United National Global Compact-The world’s largest corporate sustainability
initiative that asks companies to align strategies and operations with universal
principles on human rights, labour, environment and anti-corruption, and take
actions that advance societal goals
USA United States of America
VHT Vapor Heat Treatment
WPPF Workers’ Profit Participation Fund
WWF Workers’ Welfare Fund
Term Description
Definitions&GlossaryofTerms
360 Shareholders’ Information
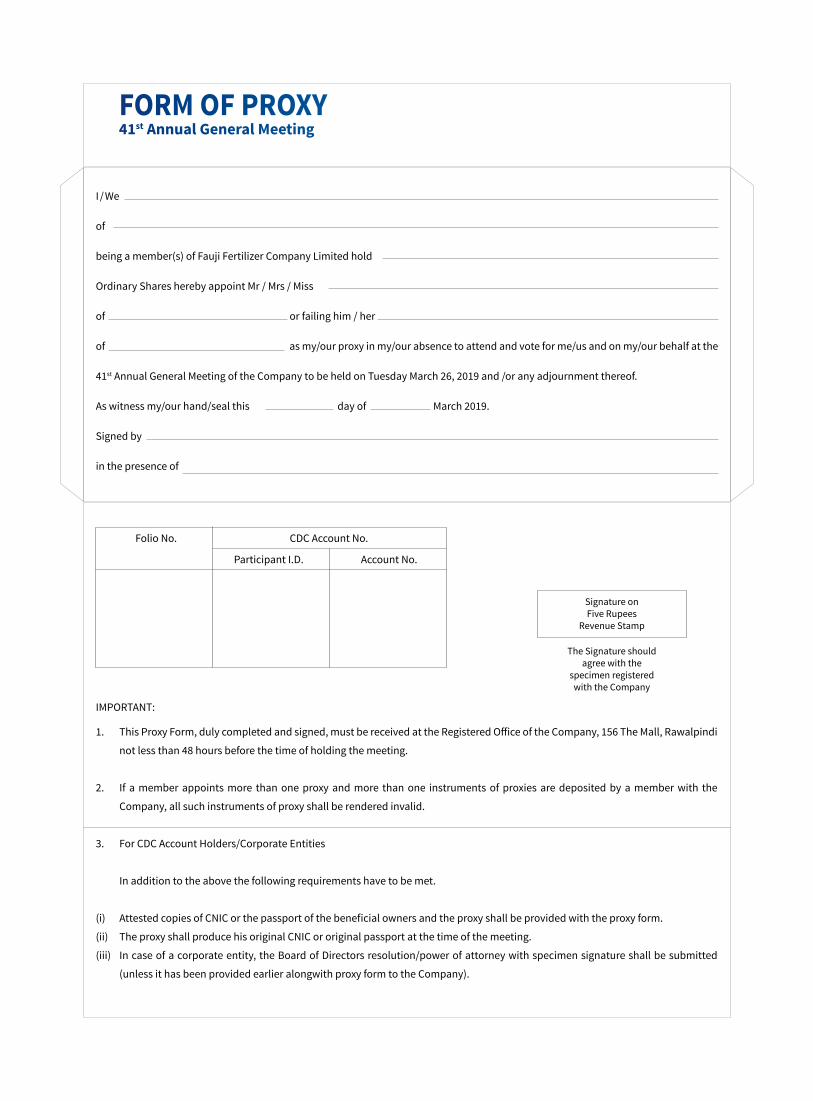
Folio No. CDC Account No.
Participant I.D. Account No.
I/We
of
being a member(s) of Fauji Fertilizer Company Limited hold
Ordinary Shares hereby appoint Mr / Mrs / Miss
of or failing him / her
of as my/our proxy in my/our absence to attend and vote for me/us and on my/our behalf at the
41st Annual General Meeting of the Company to be held on Tuesday March 26, 2019 and /or any adjournment thereof.
As witness my/our hand/seal this day of March 2019.
Signed by
in the presence of
Signature onFive Rupees
Revenue Stamp
The Signature shouldagree with the
specimen registeredwith the Company
IMPORTANT:
1. This Proxy Form, duly completed and signed, must be received at the Registered Office of the Company, 156 The Mall, Rawalpindi
not less than 48 hours before the time of holding the meeting.
2. If a member appoints more than one proxy and more than one instruments of proxies are deposited by a member with the
Company, all such instruments of proxy shall be rendered invalid.
3. For CDC Account Holders/Corporate Entities
In addition to the above the following requirements have to be met.
(i) Attested copies of CNIC or the passport of the beneficial owners and the proxy shall be provided with the proxy form.
(ii) The proxy shall produce his original CNIC or original passport at the time of the meeting.
(iii) In case of a corporate entity, the Board of Directors resolution/power of attorney with specimen signature shall be submitted
(unless it has been provided earlier alongwith proxy form to the Company).
FORM OF PROXY41st Annual General Meeting

AFFIXCORRECTPOSTAGE
Company SecretaryFAUJI FERTILIZER COMPANY LIMITED156 The Mall, Rawalpindi CanttWebsite: www.ffc.com.pkTel No. +92-51-111-332-111, 8450001
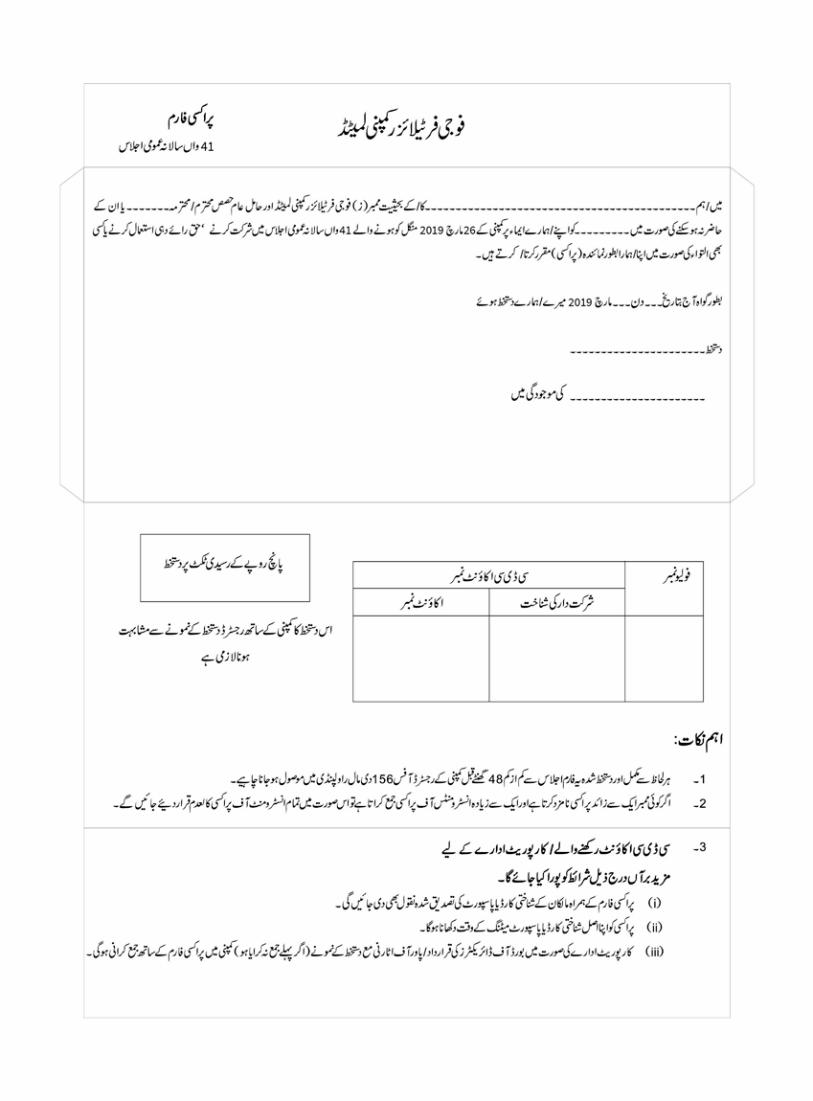

AFFIXCORRECTPOSTAGE
Company SecretaryFAUJI FERTILIZER COMPANY LIMITED156 The Mall, Rawalpindi CanttWebsite: www.ffc.com.pkTel No. +92-51-111-332-111, 8450001