Embed Size (px)
Citation preview

Food Security Sample Proposal for a Conservation Farming Project Page 1
COVER LETTER FOR FOOD SECURITY SAMPLE PROPOSAL November 23, 2011
The following document is a food security sample proposal developed by the Foodgrains Bank to help implementing partners design proposals using the format presented in the Foodgrains Bank Guidelines for Preparing Proposals and Reports. Observations and comments from the Introduction to the Guidelines workshops held with CFGB member staff and implementing partners resulted in the development of the following recommendations to strengthen proposals.
1. The description of the core problem affecting food insecurity under the project rationale section should focus on the specific issues causing food insecurity at the project implementation level, rather than on a more general food insecurity assessment at the national level.
2. More emphasis must be placed on clearly articulating the criteria and methods for beneficiary selection.
3. The project description section (Sections 5.1 to 5.5) must include more information about the outcomes and indicators rather than simply repeating what is presented in the Logic Model.
4. A better understanding around the difference between a needs assessment and a baseline survey is needed.
5. The linkages between the Logic Model, Performance Measurement Framework and Indicator Tracking Table Plan need to be understood more clearly as these are the critical documents for developing and implementing the monitoring and evaluation plan.
The following sample proposal was written with these recommendations in mind and to provide an approach to design a food security project focused on conservation agriculture. Important to remember is that this sample proposal is not prescriptive. Each implementing partner must develop their own food security proposal designed to the local context and needs.
We hope you find this document useful and look forward to receiving feedback via your CFGB member.
Regards,
Alden Braul [email protected] Capacity Development and Food Security Coordinator Canadian Foodgrains Bank

Food Security Sample Proposal for a Conservation Farming Project Page 2
1. PROPOSAL COVER PAGE
FOOD SECURITY SAMPLE PROPOSAL
CONSERVATION FARMING FOR FOOD SECURITY
FOR SUBMISSION TO CANADIAN FOODGRAINS BANK
COMMUNITY DEVELOPMENT SERVICES
CONTACT PERSON: XXXXXXXXXXXXXXX ADDRESS: XXXXXXXXXXXXXXX TELEPHONE: XXXXXXXXXXXX
FAX: XXXXXXXXXXXXXX E-MAIL: XXXXXXXXXXXXXX

Food Security Sample Proposal for a Conservation Farming Project Page 3
2. PROPOSAL SUMMARY SHEET Date of Proposal Submission: January 1, 20XX
Country: Country D
Specific Areas (e.g.: state/province, county, town, etc): Wards 1-6 in District C of Province Y. 10 villages will be selected in each ward.
Total Budget: XXXXXXXXXXXX
Program Start Date: June 1, 20XX
Program End Date: May 31, 20XY
Expected Number of Participants: Year 1-3: 600 Households
Brief Description of Participants: Smallholder subsistence farmers who seldom produce enough food to meet annual consumption needs.
Narrative Summary of the Project Including Rationale and Planned Activities: (quarter page or less, please)
The conventional farming system of tilling soil using animal traction and applying fertilizer is not well adapted to the cycle of reoccurring droughts, declining soil fertility and lack of oxen and inputs in the C district of Country D. The result of these problems is a chronic shortfall in food production at the household level as families are forced to become more dependent on food relief.
Conservation farming (CF) is a minimum tillage farming system adapted to smallholder maize based farming systems that emphasizes mulching, using locally available manure and digging planting stations rather than ploughing fields. Experience from other projects indicates that even in most seasons with lower than average rainfall, households can meet annual household cereal needs by producing maize with CF practices on a ¼ ha (50m x 50m) plot.
This 3-year project will increase household food security through the introduction and adoption of CF by 600 households. An additional 1,200 households will be indirect beneficiaries as they will be mentored by the 600 beneficiary households. In addition, the project will introduce suitable open pollinated variety (OPV) maize seed and cowpeas, and form community seed banks to introduce a sustainable and quality seed source for crop production. To reduce dependency and enhance project ownership, project beneficiaries will “pass on the seed gift” by donating high quality maize and cowpea seed the following year to a community seed bank.
Material Resources Requested
Seed (specify units): OPV maize seed – 3,600 kg and cowpeas – 2,400 kg (These seed inputs will only be provided during year one, after which no free inputs will be provided as local production will meet needs.)

Food Security Sample Proposal for a Conservation Farming Project Page 4
3. Project Overview
3.1 Implementing Partner Information
Community Development Services (CDS) is a church-based development organization formed in 1974 in Country D to assist rural people struggling to feed their families. Initially CDS primarily focused on food aid, but with time began to implement agriculture development projects.
CDS seeks to share God’s love by walking with communities and families to overcome poverty, to improve the quality of life of vulnerable groups and to help people build a healthy relationship with God and one another.
CDS has operated agriculture development programs since 2001. This shift from food aid to agriculture development came with the realization that longer-term solutions were needed to fight hunger. Conservation farming emerged as a farming system which was very resilient and robust in a wide range of climatic conditions in the country. During the last four years, CDS has implemented a CF program in District N of Province Y which borders District C, the targeted area for this project. The previous CF program was very well received by communities in District N because it generated significant increases in production and food security, as well as spontaneous uptake by other members of the communities.
CDS is well positioned to implement the project. The organization has trained staff and institutional experience which will give strong leadership to the program and avoid the mistakes made when the program was initially launched. CDS also has trained CF farmers who will be used for farmer-to-farmer exchanges to promote CF. Through the experience of the previous project, CDS has learned the importance of closely monitoring the adoption of the key CF practices in the initial stages of introducing the farming system, in particular the use of mulch. The relationships CDS has in the targeted communities will increase the likelihood of success of the project because of the knowledge of the region and experience working in the area. Lastly, CDS has developed an excellent rapport with the government agriculture extension officers that live in each ward and who support CF. They will be a valuable instrument to promote and enhance the adoption of CF, as happened in the previous CF project.
An audited financial statement has been sent as an attachment to the email with this proposal.
3.2 Project Location Background
The project will be implemented in 60 villages located in 6 wards (10 villages per ward) in District C of Country D. Households will volunteer to be part of the program and limited to 10 households per village. The map below identifies where the wards are.
Brief history of organization
Organization’s mission
Organization’s experience in
similar programs
Reasons why the
organization is well positioned to implement the project
Project location Location of wards 1-6

Food Security Sample Proposal for a Conservation Farming Project Page 5
During the past two years, CDS has implemented two food aid programs in District C which covered 12 wards that included the 6 wards targeted for this CF project. These food aid interventions covered 75% of the targeted ward’s population and ran from November to March. Similar food aid programs in the remaining wards in District C were implemented by WFP. This area is very food insecure.
UNICEF is currently running a nutrition program for pregnant and lactating mothers that include all the communities in District C. In the neighbouring District X, German Agro Action is implementing CF programs in four wards.
The area was chosen for several reasons. CDS has a long-standing relationship with the communities where the project will be implemented. There have been strong requests from community leaders that the root cause of food insecurity be targeted, namely declining crop yields. Lastly, the climatic conditions and crop production challenges in the area match the situation where CF can be effective in increasing yields.
The cropping season generally begins with the first rains in November. Farmers traditionally use oxen to till the land and plant the crop after the first rains. Maize is the dominant crop with some small plots of groundnuts and beans also produced. If rains are consistent, farmers will generally harvest in March or April, depending when the crop was seeded. Planting is usually delayed for many farmers, especially if they are resource poor, because they have to wait to use their neighbour’s oxen and often work for their neighbours in order to use the oxen. If a prolonged dry period occurs shortly after planting, the crops are sometimes reseeded which often results in a significant drop in yield. During the dry winter months that run from May to October, no field crops are grown. Families that have access to wells will often grow vegetables including tomatoes and kale on small plots during this time period.
3.3 Project Rationale
Problem Overview
The central problem causing food insecurity in the region is declining crop yields which are reducing the number of months that families can feed themselves. The problem of declining crop yields and its impact on household food reserves is best explained by a combination of factors.
The first factor reducing crop yields is declining soil fertility. Specific farm management factors that reduce soil fertility include burning crop residue prior to planting, increasing soil erosion by ploughing, applying insufficient manure and fertilizer to replace lost soil nutrients and failing to adopt a legume rotation. Farmers often say that the soils are “tired” and “don’t produce as before”. Less than 10% of the farmers can afford inorganic fertilizers, and farmers do not understand how leguminous plants can be used as green manures and cover crops to improve the soil fertility.
The second factor affecting crop yields is prolonged drought and erratic rainfall. During a needs assessment conducted by CDS in June 20101, farmers were asked to identify the principal causes of food insecurity which resulted in household food stock shortfalls. 85% of respondents indicated that prolonged drought and erratic rainfall were the main reasons why they were not able to produce enough food to feed their families. Only 10% of respondents indicated that limited land availability reduced their production. According to statistics from the National Meteorological Office, total rainfall for the past two cropping seasons was 65% and 40% below normal, respectively, for District C.
The third factor affecting crop yields is the HIV/AIDs epidemic. 20% of the households interviewed were child-headed whose parents had died from HIV/AIDs. These households had cropped an average of 0.5 ha of land compared to the 2 ha needed to achieve food security in 1 A needs assessment survey was conducted in 10 of the 60 communities. 2 communities per ward were randomly selected and 10 households in each selected community were randomly selected for the interview.
Past and current
interventions
Reasons for targeting this geographic area
targeting
Overview of problems affecting
food security

Food Security Sample Proposal for a Conservation Farming Project Page 6
most years. The total maize production average from child-headed households was 150 kg/household compared to the average of 300 kg/household for non-HIV/AIDs affected households. This observation matches with WFP national food security assessments which indicate that HIV affected households are significantly more vulnerable because of lower household crop production.
The fourth factor affecting crop yields is low quality maize seed. During the last 15 years, farmers gradually shifted over to hybrid seed. This change was promoted by government agriculture extension officers and NGOs through the donation and subsidy of hybrid seed. Over the last 5 years, a down-turn in the economy and successive droughts prevented smallholder farmers from purchasing hybrid seed. As a result, farmers are using seed stocks from previous hybrid seed that lack vigour and germination which results in significant yield reductions.
Effect on Population
Declining crop yields have affected the population in a number of ways. The most immediate effect is a reduction in household food reserves and a subsequent increase in the “hunger gap”, the time period when households have insufficient food to meet dietary demands. A recent National Needs Assessment conducted by FAO and the Ministry of Agriculture (website reference) in April 2011 found that 80% of households in District C only have enough food in their reserves to last 4 months, a shortfall of 8 months.
Another effect of declining food resources are high malnutrition rates. Data from the health clinics in Wards 2 and 5 indicate that 1 in 5 children under 5 are moderately malnourished. This change, according to UNICEF (reference) is in part related to reduced food availability and consumption at the household level. Conversations with health care providers in these clinics indicated an increase in the number of people visiting clinics over the past 2 years.
Coping Strategies
The coping strategies the communities in the targeted area were using at the beginning of the lean season last year were examined using a baseline survey for the CDS food aid project. 25% of households indicated that at least one member of their family had left the community in search of work to buy food. 80% of the households were eating less than 2 meals per day. 30% of households sold productive households assets (i.e.: hoes, ploughs and oxen) during the last month to purchase food. Food rationing at meal times was practiced by 75% of the households.
4. Beneficiary Selection The beneficiaries in this project will be 600 smallholder families who primarily depend on subsistence farming for their livelihood. They live and farm in the six wards of District C which suffer from chronic food insecurity. Each ward has 10 communities, and all the communities were selected in each ward to introduce and promotte CF into the area.
Based on previous projects, approximately 25% of the beneficiary households will be headed by women because their husbands have died (likely of HIV/AIDS) or are working outside of the country. Approximately 10% will be child-headed households who have lost both parents.
Individual beneficiary selection in each ward will take place at CF introductory meetings held at the ward level (two meetings/ward). The purpose of these meetings is to introduce the CF program. After learning about CF, the villagers will be invited to participate. From those that express interest, the criteria for program participation depends on the participant’s commitment to the following activities:
a) establishment of a ¼ ha CF plot (50m x 50m) b) regular participation in CF trainings
Effect on Population
Coping Strategies

Food Security Sample Proposal for a Conservation Farming Project Page 7
c) promote CF to 2 households not part of the program through at least 4 visits/year/household to provide informal CF training
d) participation in monthly meetings e) donate 6 kg of OPV maize seed and 4 kg of cowpea seed from the first year’s CF production to
the community seed bank. This seed will be given to others in the community using a similar “passing on the gift” approach so that others in the community will benefit from the program and increase the use of high quality OPV maize seed and cowpea seed.
A limit of 10 households is accepted in the program per village. If there are more than 10 households who volunteer and meet the above criteria, the community must select which households will participate based on need. Households that live in close proximity to each other will be favoured in order to increase mutual learning and support. This usually happens given the layout of the village. The self-selection of the households usually results in the more resource poor joining the program because they are attracted to a farming system which doesn’t rely on animals to till land.
The beneficiary households will be named CF Village Promoters (CFVPs). The total number of CFVPs will be 10 households/village x 10 villages/ward x 6 wards = 600 CFVPs. From the group of 10 households representing a village, a Lead CFVP will be elected by the group. In addition to the above criteria, the Lead CFVP household is expected to liaison with CDS, conduct trainings in their community and attend CDS trainings. The Lead CFVP is a volunteer position and farmers elected for this position will receive specialized training that other members in their community will not receive. Given the importance of the Lead CFVP, the group of CFVPs must carefully select a Lead CFVP that is capable and willing to serve others. The Lead CFVP track record in being a “first adopter” of promising technologies will also be considered. If a Lead CFVP does not fulfill their commitment to lead trainings for the other CFVPs, they will be replaced. Given the simplicity of the CF technology, Lead CFVPs generally have few difficulties in training others in their village.
Ideally a husband-wife team (considered as one household) will be selected to be the CFVPs, although in some situations, depending on who is at home and household make-up, only one member of the household will be the designated representative. Based on previous programs, over 50% of the volunteers have been women representing their households, reflecting their willingness to try new ideas. The purpose of designating a husband-wife team to be the CFVPs is to promote gender equality.
The willingness of the CFVPs to promote CF to two additional households not part of the program will be strongly emphasized. If this is done effectively, an additional 1,200 households (indirect beneficiaries) will learn about CF. During the final evaluation after the program has run 3 years, the total uptake of CF in the community will be measured which will capture the spread of CF to indirect beneficiaries and spontaneous adopters.
5. Project Description The Project Rationale (Section 3.3) of this proposal identified drought, declining soil fertility, HIV Aids and poor seed quality as major factors causing food insecurity. Based on lessons learned from similar programs implemented by CDS, the adoption of CF by smallholder farmers and the development of community OPV maize seed banks are the most effective responses to deal with the root causes of hunger in these rural areas. The table below describes how the strategic intervention of promoting CF and OPV maize seeds responds to the identified problem.
Problem Project Response
Declining soil fertility The introduction of CF increases soil fertility through the addition of mulch and the subsequent reduction of soil erosion. Part of CF is promoting a rotation with legumes which will also enhance soil fertility.
Drought & erratic rainfall The introduction of CF will improve the ability of crops to withstand drought by

Food Security Sample Proposal for a Conservation Farming Project Page 8
reducing soil moisture loss with a mulch cover, increase moisture holding capacity of soils with increased organic matter and allow farmers to plant earlier based on the planting station system which eliminates the need to plough.
HIV/AIDS HIV affected households often have reduced labour. By adopting CF, households will harvest more food with a lower labour input per unit of food produced.
Poor seed quality The introduction of OPV maize seed and the organization of community seed banks will respond directly to the problem of poor seed quality.
The inputs, activities, outputs and outcomes described below are focused on enhancing the adoption of CF practices and development of community OPV maize seed banks to improve household food security.
5.1 Ultimate Outcome
Improved food security in 6 wards of District C.
5.2 Intermediate Outcomes
Intermediate Outcome 1.1: Increased food production
The main factors causing food insecurity in the targeted wards is declining food production. Most farmers produce maize using conventional farming methods on 1-2 ha of land. During the past two growing seasons, the drought was severe leaving many families with very poor crops. Average total maize production per household during the last growing season based on the FAO/Ministry of Agriculture survey was 300 kg. If food production can be sustainably increased, household food security will improve, meaning that families should have additional months of food stocks and reduce rationing of food. The method to increase food production will be promoting the adoption and practice of CF to increase maize and cowpea yields and total production.
The indicators to measure increased food production will be based on average production per household for each year using the following indicators:
Indicator 1.1.1: Kilograms of CF cereal production per household. A representative sample of CFVPs will be surveyed at the end of the harvest period each year to determine how much they harvested from their CF plot. The dominant crop is maize and is measured in bags by farmers which will be converted into kg. The target maize production for year 1, 2 and 3 from a 50m x50m plot (0.25 ha) will be 200 kg, 400 kg and 600 kg, respectively, for the CFVPs. Past experience shows that as soils improve and farmers gain more understanding on CF practices, yields continue to increase. As CF has not been introduced in these wards yet, the baseline production from CF is 0 kg of maize.
Indicator 1.1.2: Kilograms of conventional cereal production per household. Farmers continue to use conventional farming systems to produce maize and sometimes sorghum as they learn the CF system. In previous CF projects, it was observed that the amount of land under conventional production decreases after 2-3 years using the CF system. The reason for measuring conventional cereal production of maize is to determine the total cereal production (CF + conventional) on an annual basis. This will help understand the food security situation related to cereal availability.
Indicator 1.1.3: Kilograms of CF legume production per household. Legume production per CFVP is only tracked for CF. Legumes are not widely grown in the area, and need to be part of
Intermediate outcomes are longer-term results that will be achieved during the life of the project

Food Security Sample Proposal for a Conservation Farming Project Page 9
the CF rotation to improve sustainability and soil quality. The legumes will be used for home consumption and sale.
It should be noted that households size varies from 1 person (widow) to over 10 people (family taking care of orphans). Not surprisingly, the total household production for both crops (maize and cowpeas) varies considerably between households, and therefore will be averaged to determine if targets are met.
Intermediate Outcome 1.2: Increased number of months that crop production meets annual household cereal food needs
An increase in the number of months that crop production meets annual household cereal food needs is an essential outcome to improve food security for this 3 year food security program. If families can increase production of cereal crops (maize, sorghum and millet), they will cover a greater proportion of their annual cereal food needs. This is a good indicator of improved food security. It is expected that the production of annual household cereal food needs will be reached by all participants by the 3rd year. Only cereals are used in this intermediate outcome to simplify calculations, even though legumes are also produced with CF.
According to a government survey in the district, the average number of months that households can feed themselves based on this year’s maize harvest is 4 months. Average family size is 6 members. Approximately 12.5 kg of maize/month is required by each family member. Therefore a household with 6 members needs 75 kg of maize per month, or 900 kg per year. The current average production per household is 300 kg of maize according to the government, which corresponds to the 4 months of food available for consumption.
Unique about this outcome is that it is specific to a household’s food needs, and therefore reflects the annual cereal food needs based on the number of members in each household. The following indicator will be used:
Indicator 1.2.1: Average number of months that own cereal production meets household cereal food needs. Each household interviewed will estimate the number of months that their cereal food production will meet their annual household food requirements. A crop production survey conducted by the Ministry of Agriculture determined that household food production during the last cropping cycle will supply enough cereal to meet household cereal needs for 4 months in the district. A baseline survey of the project participants will be conducted to confirm the number of months last year’s cereal production will meet household food requirements as this may vary from the government survey.
Intermediate Outcome 1.3: Improved accessibility of locally produced high quality OPV maize seed
As mentioned in Section 3.3 (Problem Rationale), the maize seed used by smallholder farmers is often of very low quality and contributes to reduced maize yields and ultimately, reduced food security. One method of overcoming the issue of seed quality and the need to purchase hybrid seed each year is by improving access to locally produced OPV maize seed. This will be done through an OPV maize seed multiplication program and community seed bank which is explained in more detail in Section 5.6.1 (Field Activities).
Improved community accessibility to locally produced OPV maize seed will be measured using the following indicators:
Indicator 1.3.1: Kilograms of OPV maize seed produced by CFVPs. Each CFVP will be trained on how to produce high quality OPV maize seed, and the production from their plot will be measured after harvest. This maize will be carefully selected as taught in the seed selection trainings.

Food Security Sample Proposal for a Conservation Farming Project Page 10
Indicator 1.3.2: Kilograms of OPV maize seed distributed by community seed banks. Each ward will establish two community seed banks, each serving 5 villages. After harvest, CFVPs will donate to the seed bank from their OPV maize seed multiplication plots. At the start of the next cropping season, this OPV maize seed will be distributed to others in the community who have not yet received OPV maize seed. CFVPs are required to donate 6 kg of OPV maize seed to their local community seed bank which would result in an overall total of 3,600 kg of OPV maize seed in community seed banks. In addition, project participants are required to donate 4 kg of cowpea seed to the seed bank, but this will not be measured in the project M&E system. The primary focus is on improving access to OPV maize seed.
5.3 Immediate Outcomes
Immediate Outcome 2.1: Increased adoption of CF practices
The immediate outcome of increased adoption of CF practices should result from the training workshops and follow-up, and contribute to the intermediate outcomes of increased food production and food security at the household level. The indicators are as follows:
Indicator 2.1.1: Percent of CFVPs that use 75 cm (between rows) x 60 cm (in-row) maize planting station spacing. This is the recommended maize planting station spacing for the region and is taught in the training workshop.
Indicator 2.1.2: Percent of CFVPs that apply 100% mulch cover at a minimum depth of 5 cm. This component of the CF system is key to increased production, but most difficult to adopt because of the labour investment required to source and apply mulch. However, farmers recognize the benefits of mulch almost immediately by the improved crop growth and reduced symptoms of moisture stress, especially during dry years. During years of high rainfall, the mulch also has a significant positive impact on yields by diminishing soil erosion and reducing nutrient leaching.
Indicator 2.1.3: Percent of CFVPs that include a rotation with a legume on at least 25% of the CF plot. In order to improve soil fertility and break disease cycles, legumes must be included in the rotation on the CF plot. If a legume is maintained in rotation on 25% of the CF plot, the rotation will be 3 years of corn followed by 1 year of beans. Ideally, a much more frequent bean rotation should be the goal, but until a market is developed for beans and other legumes, this 1 in 4 year bean rotation will be promoted. Cowpea seed will be provided to CFVPs only for the first year. Thereafter, CFVPs will use their own production for the remaining 2 years of the project.
Indicator 2.1.4: Average land area under CF by CFVPs. CFVPs will be given enough OPV maize and bean seed for a 0.25 ha plot. It is not expected that all the principles of CF will be initially adopted on the 0.25 ha plot, especially the mulching, until farmers witness the impact this system has on increasing crop yield. Farmer exchange visits to neighbouring wards where CF is being practiced will likely inspire the farmers in the targeted wards to maintain the 0.25 ha plot.
Indicator 2.1.5: Percent non-direct CF beneficiaries practicing mulching (100% cover) and permanent planting stations. As mentioned in Section 4 (Beneficiary Selection), each CFVP household is expected to train two other households in their village on CF. These are referred to as “indirect beneficiaries”. An important measure of the impact and perceived relevancy of CF in improving household food security is the amount of CF adoption by indirect beneficiaries and spontaneous adopters2. This will be measured in year 2 and 3 of the program using cross-sectional village walks/interviews to determine uptake of CF beyond the direct beneficiaries. The criteria for CF adoption are practicing mulching and permanent planting stations, two critical practices of CF.
2 Spontaneous adopters are those who take up CF by observing and asking questions about CF from their neighbours

Food Security Sample Proposal for a Conservation Farming Project Page 11
Immediate Outcome 2.2: Increased establishment of OPV maize seed multiplication plots
The immediate outcome of increased establishment of OPV maize seed multiplication plots will result from the training workshops, and contribute to the intermediate outcome of improved access to high quality OPV maize seed. The method used to set up seed multiplication plots is explained in Section 5.5 (Activities). The training on the establishment of seed multiplication plots is to show farmers how they can produce high quality OPV maize seed for their next year’s production, as well as establish and manage a community seed bank. The indicator for this immediate outcome is as follows:
Indicator 2.2.1: Percentage of CFVPs that established an OPV maize seed multiplication plot with time (2 week) and/or space (200 m) isolation. These recommended standards are based on crop isolation requirements as taught in workshops.
Immediate Outcome 2.3: CF Community Extension Design Functioning
The transfer of knowledge to the CFVPs depends on the commitment and skill of Lead CFVPs to conduct the village based training for the 9 other CFVPs that form their village group. CDS will be carefully monitoring and providing support to the Lead CFVPs to assure the village training is completed. The indicator is:
Indicator 2.3.1: Annual number of workshops facilitated by Lead CFVPs. Each Lead CFVP is expected to facilitate 4 workshops in their community for the rest of the CFVPs. The total number of workshops will be 4 workshops/community x 60 communities = 240 workshops.
Indicator 2.3.2: Average number of CFVP households attending each workshop led by Lead CFVPs in their communities. Attendance at the workshops led by the Lead CFVPs will reflect the level of participation and interest by project beneficiaries. If all CFVPs attend, there should be 9 beneficiary households represented at each workshop.
5.4 Outputs
Output 3.1: CF introduction meetings completed
CF introduction meetings with villages, traditional leadership, local governments and regional governments are the first step in introducing the program, answering questions and understanding the local context. The indicator is:
Indicator 3.1.1: Number of introduction meetings. The target will be 21 CF introduction meetings as described below.
• 12 village meetings (2 meetings/ward (5 villages in each meeting) x 6 wards) • 6 meetings with traditional leadership (1 meeting/ward) • 1 meeting with local district government • 1 meeting with regional government • 1 meeting with Ministry of Agriculture District Representative
Output 3.2: CFVPs selected and registered
The selection and registration of CFVPs will happen during the village meetings. The selection process is covered in Section 4 (Beneficiary Selection). The indicator is:
Indicator 3.2.1: Number of CFVPs registered: 600 CFVPs will be registered and will continue in the project as CFVPs for the entire 3 years. If CFVPs choose to withdraw from the project, the community will select replacements.

Food Security Sample Proposal for a Conservation Farming Project Page 12
Output 3.3: Inputs procured and distributed
Maize and cowpea seed will be procured and distributed. The indicators are:
Indicator 3.3.1: kg of OPV maize seed distributed
Indicator 3.3.2: kg of cow peas distributed
Specific information on the calculation of the quantities is in Section 5.5 (Inputs).
Output 3.4: Training workshops completed
Training workshops for farmers will be organized throughout the project cycle on specific themes as described in Section 5.6.1 (Activities). The indicator is:
Indicator 3.4.1: Annual number of workshops facilitated for Lead CFVPs. Section 5.6.1 describes the various themes presented in the workshops. . There will be a series of 4 workshops presented annually at the ward level for all Lead CFVPs. Total number of workshops will be 4 workshops/ward x 6 wards = 24 workshops on an annual basis. Each project assistant will be responsible for their 2 wards for a total of 8 workshops during the year.
Indicator 3.4.2: Average number of Lead CFVPs that attend training workshops. CDS PAs will facilitate the training of trainers’ workshops for Lead CFVPs. Each year there will be 4 workshops presented in each ward for the Lead CFVPs. It is expected that 10 Lead CFVPs will be present at each of these workshops.
Output 3.5: Field visits completed
Field visits are essential to make sure that the project is on course and track the progress in meeting the outputs and outcomes. The indicator is:
Indicator 3.5.1: Annual number of field visits. Four times/year a project assistant will visit the lead CFVP and 2 randomly selected CFVPs from the community to observe adherence to CF farming principles and discuss challenges with CF. This will be considered as one field visit as it is expected that all three visits will be done the same day. The approximate times when these visits will occur is as follows:
• Field Preparation Stage – October • Early Plant Growth Stage – December • Pre-Harvest Stage – February • Post-Harvest Stage – April
Since each village will receive four visits/year x 60 villages, the total number of field visits will be 240. The work load per PA will 80 field visits per year.
Output 3.6: Field days organized
Field days allow for knowledge sharing and promotion of CF within the ward. The indicator is:
Indicator 3.6.1: Annual number of field days. One field day will be organized in each ward for a total of 6 field days per year.
Indicator 3.6.2: Average number of farmers that attended each field day. This indicator will help to measure the level of interest in CF in the community. In previous projects the field day was an important method to expose more farmers to CF.

Food Security Sample Proposal for a Conservation Farming Project Page 13
5.5 Inputs
Personnel
Six personnel are required to manage the project – Field Teams Coordinator (10% of full-time), Program Officer (100%), three Project Assistants (100%) and a Finance Officer (10% of full-time). The Field Teams Coordinator has the following responsibilities:
Coordinate the consolidation and review of program proposals Consolidate annual plans and budgets for the region Ensure timely production of regional finance reports Supervise regional office staff and review staff performance
The Program Officer (PO) is based in the field and is the head of field staff. Their responsibility includes:
Project implementation, monitoring and evaluation Writing monthly, interim, annual and end of project reports Review financial reporting Coordinate with other partners in the district Supervise field project staff
The 3 Project Assistants (PAs) are based in the field and have the following responsibilities: Oversee day to day running of the program Coordinate program meetings between program staff, the community and other stakeholders
at the grassroots level Organize and present workshops Carry out monitoring and evaluation data collection in the assigned wards (2 per PA)
The Finance Officer’s primary responsibilities include: Management of all the day to day financial issues Compiling and presenting financial reports to PO and Regional Manager Paying project expenses and salaries
Transport
CDS currently has dedicated one vehicle (4x4 Hylux – 2009 model) and three motorcycles to the project. Each Project Assistant will have one motorcycle to conduct their activities. The vehicle fleet is maintained through budgeting and billing by km run, taking into account fuel, maintenance, and vehicle replacement expenses.
Seed
The program will provide OPV maize cowpea seed to all CFVPs. The total size of the CF plot will be 50m x 50m. 50m x 40m will be dedicated to OPV maize production and the remainder, 50m x 10m, will be for cowpeas. The following table summarizes the seed requirements for the first year of the project. It is expected that after this initial “seed money” is given, the communities will be self-sufficient in seed production.
Seed Type No. of Beneficiaries
Seeding Rate (kg/ha) Field Size Seed per
Beneficiary Total Seed
Requirements OPV maize 600 30 40m x 50m (0.2
ha) 6 kg 3,600 kg OPV maize
Cowpea 600 80 10m x 50m (0.05 ha) 4 kg 2,400 kg
cowpeas
Key personnel required to
run the project

Food Security Sample Proposal for a Conservation Farming Project Page 14
5.6 Activities
5.6.1 Field Activities
The following field activities, except the CF introduction meetings, will be repeated each year for this three year project. Experience has shown that this follow-up is required to assure that CF is firmly established with farmers adopting all the key practices associated with CF.
Coordination
Consultation and coordination with villages, local leadership, local and regional government, and other NGOs plays a central role in the implementation of this project. Given the success that CF has already had in other wards within the district, there is strong support for the program, and this will facilitate coordination. The District Rural Council3 also plays a key role in determining where NGOs like CDS work. Regular monthly meetings with this council are necessary to inform other NGOs of the program implementation progress and any other challenges. Some coordination has happened in the past with ICRISAT who is working with CF experimental plots on farmer fields. Engagement with this research organization helps keep up to date with recent information on CF. Coordination with the Ministry of Agriculture extension officers based in the district capital and some wards is a key component of the project. These officers will participate in the organization and often facilitate the CF trainings, as well as provide more intense follow-up with farmers that CDS staff are not able to accomplish because of time restrictions.
An ongoing challenge with CF promotion is coordinating with other NGOs, many of which also promote CF but emphasize the use of chemical fertilizers and animal traction equipment for zero tillage. Continued conversation with NGOs is important to work towards reaching a common understanding of the most sustainable way to improve food security for the most vulnerable households who are resource poor.
Conservation Farming Introduction Meetings
In order to secure permission to work in the designated areas, a Memorandum of Understanding will be signed as part of the negotiation process with local and regional governments as well as traditional leadership. Then, community mobilization meetings will be organized to explain the project and its objectives to the communities. An important part of these meetings is to listen to what people identify to be the greatest challenges affecting their food security. CDS will also invite a farmer from another region to relate a personal account of CF during these meetings. After the process of participant selection and registration is complete, farmers will sign contracts to ensure their commitment to the program.
Conservation Farming Description and Workshops
CF is a minimum tillage system adapted to smallholder farming systems that emphasizes mulching, using locally available manure and digging planting stations rather than ploughing fields. This technology has already transformed many farmers’ livelihoods in the neighbouring N District. Once food aid beneficiaries, these farmers now produce enough cereal to cover their
3 Council made up of directors from Social Welfare, Education, Food Security and Development Ministries including representation from the District Administrator’s Office.
List of the key activities that are part
of the program
Brief description
of the technology

Food Security Sample Proposal for a Conservation Farming Project Page 15
annual needs, and some even produce an excess for sale.
Lead CFVPs learn a series of farm practices which are essential to implementing CF. Four CF workshops for the 10 Lead CFVPs in each ward will be organized and facilitated by CDS staff and, when possible, government extension workers on an annual basis. Each year these will be repeated to assure that the correct methodologies are being used. The themes for each workshop are as follows:
a) Field Preparation (July)
The field preparation workshop will be done in July. It is important to conduct this workshop as early as possible to give farmers time to organize and prepare their fields. The following practices and concepts will be presented during the two-day field preparation workshops:
Advantages of CF – improved moisture conservation and fertility management, timely seeding, labour opportunities in off-season, and reduced reliance on animals and/or tractors
Marking of CF plots using a 60 cm x 75 cm grid system Establishment of planting stations Manure and mulch application Seeding Effective methods to train other CFVP and record keeping on CF community adoption Introduction to OPV seed multiplication plots Introduction to the operation of community seed banks
b) Crop Management (November/December) Two day crop management workshops will be conducted in December and focus on thinning and weed control, as well as reviewing themes from the previous workshop.
c) Crop Management Overview (January)
A one-day workshop overview of CF crop management will provide a forum to review CF practices focusing on activities which require reinforcement. Reports from field staff, government extension workers and Lead CFVPs will be used to obtain information on activities that will require attention and technical support. Special attention will be focused on analyzing the uptake of CF by other CFVPs.
d) Harvest Principles (February)
One day workshops will be organized in February to teach participants how to calculate yield, properly store maize, select high quality OPV maize seed for next cropping season and give participants an opportunity to exchange experiences. Specific attention will be given to the organization and management of the community OPV maize seed bank.
The next critical step in the extension process is the training of the rest of the CFVPs in CF by the Lead CFVPs. During the workshops mentioned above, Lead CFVPs will be given opportunities to develop their skills in training others on CF. Fortunately the CF technology is very simple to teach. Experience in other CF projects has shown how quickly farmers can learn how to do CF when they begin on a small plot. After the Lead CFVPs receive training from CDS, they will convene a similar workshop in their community to share what they learned with the other CFVPs. Initially the CDS PAs will accompany the Lead CFVPs to help them conduct their training until CF is being taught appropriately.

Food Security Sample Proposal for a Conservation Farming Project Page 16
OPV Community Seed Banks
Two OPV maize community seed banks will be organized per ward for a total of 12 OPV maize community seed banks for the project. The contract signed by the CFVPs includes a payment of 6 kg of high quality OPV maize seed and 4 kg of cowpea seed to the community seed bank after the first year’s harvest. Assuming all the 600 CFVPs donate these quantities of seed, the total amount of OPV maize and cowpea seed collected by the project will be 3,600 kg and 2,400 kg, respectively. Based on previous projects, CFVPs often gave beyond the required contribution as stipulated in the CFVP contract. Beneficiaries for the seed distribution from the community seed banks for the second and third year will be selected based on criteria developed by the community seed bank committee in conjunction with CDS staff. Preference will be given to community members experimenting with CF based on training from CFVPs. The community seed bank’s purpose is mainly to increase the availability of high quality OPV maize seed in the community. Whether the seed bank will continue after the project terminates depends on the needs identified by the community seed bank committee.
Special training and follow-up is required to assure the community seed banks function effectively. Each community selects one of their CFVPs to be their community representative on the community seed bank committee. A special training is organized for the community seed bank committees during the workshops in February which includes topics of organization, pest management and administration.
Field Visits
Each Lead CFVP will receive a field visit by CDS staff 4 times during the cropping season to monitor adherence to CF standards, help participants fill out their farmer record books, answer questions and provide encouragement. These visits will be recorded in the CDS staff logbook for reference. These field visits will also be used for monitoring and evaluation purposes, and will be explained in more detail in Section 6 (Monitoring and Evaluation).
Field Days
Field days will be held in March each year. One field day will be organized in each ward consisting of 10 villages. Field days will be located at the farm of the Champion CFVP which will be identified by CDS staff and local leaders from each ward. The field days are an opportunity to promote CF to the larger community who are not yet aware of CF.
5.6.2 Seed Procurement Seed procurement of maize and cowpeas is based on the three quotations attached to the email with this proposal. Three seed companies were contacted and presented CDS with quotations for the 3,600 kg OPV maize seed and 2,400 kg of cowpea seed. Upon project approval, a tender for the seed will be sent to each of the seed companies. A committee at CDS will review the tenders and select the supplier based on price, quality and track record of the supplier. The indicative quotations were used in the development of the budget. Seed will be delivered to the project site.
5.6.3 Annual Timeline
The following timeline will be used for year 1, 2 and 3, except the items which are noted as “YR 1”. On the 3rd year, the annual report will be an end of project report summarizing the project outcomes to year 1.

Food Security Sample Proposal for a Conservation Farming Project Page 17
ACTIVITY Year - XXXX Year - XXXX
Jun Jul Sept Oct Nov Dec Jan Feb Mar Apr May
Memorandum of Agreement (YR 1) X
Staff recruitment (YR 1) X
Coordination meetings X X X X X X X X X X X
CF introduction meetings (YR 1) X X
CFVP selection X X
Baseline survey (YR 1) X
Seed procurement (YR 1) X
Workshop #1 – Field Preparation X
Workshop #2 – Crop Management X X
Workshop #3 – Crop Management X
Workshop #4 – Harvest Principles X
Field visits/M&E visits X X X X X X X
Mid-season survey X
Interim Report Submission X X
Field days X
Impact survey X
Annual report X
5.7 Risks and Mitigation Strategy
Risk #1: Reputational risk. Since CF is such a new concept for farmers who have been ploughing fields for a lifetime, there may be stigma attached to participating or adopting the technology of mulching and minimum tillage which are key to CF. To mitigate these effects, CF farmers will be organized into clusters, often in village groups, to provide mutual moral and technical support as they experiment with CF.
Risk #2: Excessive activity by termites. Based on experience from other regions, some CF plots have extremely high populations of termites which removed all the mulch material within a week. Given the importance of the mulch layer for moisture retention and soil fertility, participant households will need to investigate mulch materials which are not as desirable for the termites. At present the only mitigation strategy is to closely monitor fields and replace the mulch if it is removed by termites.
Risk #3: Drought: Experience from other projects has shown that the CF management system almost always increases crop yields over the conventional system. However, during a severe drought, even CF will not produce a crop and therefore a severe drought is considered a threat. The mitigation strategy will be carefully monitoring the adoption of key CF principles (i.e.: mulch and minimum tillage) which improve moisture conservation.
5.8 Logic Model
* See Annex A.

Food Security Sample Proposal for a Conservation Farming Project Page 18
6. Monitoring and Evaluation
6.1 Monitoring and Evaluation Plan
The monitoring and evaluation plan for this program will focus on using the agreed upon indicators to measure whether the outputs and outcomes have been achieved. The Performance Measurement Framework (PMF) found in Annex B summarizes the indicators, data sources, collection methodology, frequency of data collection, population covered and the position responsible for completing this task. Some information about each of the indicators has already been provided in Section 5 (Project Description).
Some important points to highlight about this M&E Plan include the following:
• A baseline survey (Annex C) will be conducted at the beginning of the project. Section 6.2 provides more detail.
• The mid-season survey (Annex D) of the immediate outcomes will provide information regarding the adoption rate of CF practices and the establishment of OPV maize seed multiplication plots. This information will highlight where emphasis needs to be placed in the Crop Management Overview Workshop in January. Issues that need additional attention in subsequent years will be noted.
• The intermediate outcome, “increased number of months that crop production meets annual household cereal food needs” will be measured by asking the CFVPs how many months their own cereal production meets their household cereal food needs. This indicator is key to measuring whether food security has improved with the introduction of CF. Careful attention will be placed to cross-reference the information learned from this outcome with actual food production increases measured by indicators of conventional and CF maize production.
• A trans-sectional walk/household interview will be conducted in years 2 and 3 to determine adoption of CF practices by indirect beneficiaries and spontaneous adopters. This data collection will be replicated in 3 randomly selected villages in each ward visiting a minimum of 20 households per village.
6.2 Baseline Survey
The baseline survey at the beginning of the program will identify the current pre-project cereal and legume production levels and the food security situation of the project beneficiaries. This information is necessary to show in the future that there has actually been an increase in food production and food security. The questions for the baseline study are adapted directly from the indicators for intermediate outcomes 1.1 and 1.2. Refer to Annex C for a copy of the proposed baseline survey. As noted in the PMF, the sample size will be 222 households.
6.3 Indicator Tracking Table Plan
The ITTP is found in Annex E. As this is a 3 year program, each year usually has different targets for the intermediate and immediate outcomes because the CFVPs will grow in their understanding of CF over time, and improve their application of the crop management system. The ITTP is the main monitoring tool that will be used over the life of the project to measure the progress in meeting the targets.
6.4 Project Evaluations
At the end of each annual cycle of CF, an evaluation of selected outcomes will be carried out using the Annual Impact Survey (see Annex F). This tool will gather information from randomly selected CFVPs. In addition, there will be focus group discussions and review of field staff record books (Outputs).
Monitoring relates to
using indicators to
measure activities and
outputs. Evaluation measures outcomes.

Food Security Sample Proposal for a Conservation Farming Project Page 19
A final End-of Project Evaluation will be conducted after the project is complete to confirm overall project impact and make recommendations for future programming. Terms of reference for this evaluation will be designed by CDS with input from the CFGB member and CFGB Monitoring and Evaluation Coordinator.
7. Cross-Cutting Themes and Principles
7.1 Gender
Women play a critical role in crop production. We learned from previous CF programs that if only one representative per household was invited to the workshop, usually just the male household heads attended the event. We have adjusted the workshop participant list to include two members from each household as the CFVP unit to increase the number of women who will receive the training.
Based on focus group discussions in neighbouring District N where a CF project was recently completed, women found CF to be less work than conventional production systems to reach household food security. Some of the reasons cited for this labour reduction included reduced time spent weeding and less travel time for agriculture production due to the close proximity of the CF plot to the house. This labour savings by women is a significant advantage of this program since women are often left with the majority of the labour tasks related to food production. It is also an important reason why CDS is strongly promoting CF.
7.2 Participant Involvement
One of the reasons why CDS decided to work in the six wards of District C is because community leaders observed changes in food security from CF in the neighbouring district where CF had been promoted, and approached CDS about the possibility of implementing a similar CF project in wards 1-6 of District C. This interest in the design of a specific CF project highlights a high level of beneficiary involvement.
Participants of this project will be involved in the capacity building to enhance CF adoption. Lead CFVPs will be responsible to train others in their village. In turn, all CFVPs are required to train at least an additional 2 households in their village as a form of promoting CF.
During the M&E phases of the program, a Lead CFVP from a neighbouring village will accompany the CDS staff in the monitoring/evaluation of the program in a village. At the end of the year, the CFVPs will gather with CDS staff to discuss how the project was implemented and what can be improved for the next year. This information will be included in the annual report.
7.3 Environment
Conservation farming is a farming system designed to protect the environment by efficiently managing water, soil fertility and biological resources. Instead of water running off of fields causing erosion, the water is retained in the field by the mulch and percolates into the soil for the crop to use. Soil fertility and biological activity is enhanced as nutrient cycling breaks down the mulch and incorporates this organic residue into the soil for the crop to use.
The only possible negative environmental impact could be the cutting down of trees to protect the CF plots. However, the overall impact of this will be very small as most farmers use thorns and brush that are normally burned. CDS will promote stewardship of the environment in their workshops, and begin investigating the use of living fences to protect CF plots.
7.4 Capacity Building
The capacity building plan will focus around building a better understanding of the challenges of CF and how to make community seed banks successful. The following activities will be undertaken with these goals in mind:

Food Security Sample Proposal for a Conservation Farming Project Page 20
• CF Training of Trainers Workshop – Two of the CDS project staff will attend a CFGB organized “Trainer of Trainers” workshop. In this workshop, the participants will practice their CF presenting skills and be evaluated/coached by the facilitator and participants from other organizations.
• Monitoring and Evaluation Workshop – The Project Officer will participate in a M&E workshop to strengthen their skills in monitoring and evaluating the project.
• Investigation of Community Seed Bank Organization – Community seed banks have been tried numerous times, with limited success. Literature will be reviewed and other organizations consulted to determine what are the key aspects to consider in the formation and management of community seed banks.
• Monitoring and Evaluation – Strengthening CDS’s M&E system is vital to assure that the project meets its intended outcomes. A staff person will participate in an M&E course offered by a local capacity building organization and apply lessons learned to the project.
7.5 Sustainability
The sustainability of this CF project will be determined by the CF adoption level by CFVPs over the three year period of the project. However, even more important in terms of sustainability is the measurement of the uptake of CF by indirect beneficiaries (households trained by CFVPs) and households who spontaneously adopt CF practices without any input incentives or training. Based on the experience of the previous CF project, approximately half of the households in the villages were practicing CF by the end of the three year project. Only 15% of the households were trained.
Sustainability will also be measured in the short term by the increased food production over the three year period. If farmers can increase their food production in a sustainable way without relying on expensive external inputs such as inorganic fertilizers and hybrid seeds, it is assumed that the sustainability of their crop production system has improved.
The region where this project will be implemented has limited market access for the sale of excess crop production. CDS realizes that if farmers can sell their surplus production, their income will be increased and this will likely improve food security and the project sustainability. During the course of the project, CDS will investigate how to improve the market access for farmers in order to sell surplus production.
8. Budget See Annex G for 3 year budget summary and Annex H for first year budget.
The following banking information is necessary for wiring of funds:
Organization Name: Community Development Services Organization Address: XXXXXXXXXXX Bank Name: XXXXXXXXXXXXXXX Bank Street Address: XXXXXXXXXXXXXXXX Account Number: XXXXXXXXXXXXXXXXX

Food Security Sample Proposal for a Conservation Farming Project Page 21
ANNEX A: LOGIC MODEL
INPUTS Human and
physical resources
ACTIVITIES The things you “do” with your
inputs – the actions
OUTPUTS Product or service stemming from a
completed group of activities
IMMEDIATE OUTCOMES
Short-term results emerging from the outputs that often
represent a change in knowledge or skill
INTERMEDIATE OUTCOMES
Medium-term results emerging from immediate outcomes that usually
represent a change in behavior or practice
ULTIMATE OUTCOME
Longer-term results emerging from the
intermediate outcomes that the project is working
towards, but which you alone cannot achieve
• Seeds
• Funds
• Personnel
• Vehicles
• Program equipment
• Offices
• Land
• CF introduction meetings with communities, local governments and regional governments
• CFVP selection and registration
• Procurement and distribution of inputs
• Training workshops on CF, OPV maize seed multiplication and community seed banks
• Project monitoring
• Organization of field days
3.1 CF introduction meetings completed
3.2 CFVPs selected and registered
3.3 Inputs procured and distributed
3.4 Training workshops completed
3.5 Project monitoring completed
3.6 Field days organized
2.1 Increased adoption of CF practices
2.2 Increased establishment of OPV maize seed multiplication plots
2.3 CF community extension design functioning
1.1 Increased food production 1.2 Increased number of months that crop
production meets annual household cereal food needs
1.3 Improved accessibility of locally produced high quality OPV maize seed
• Improved food security for households in 6 wards of District C

Food Security Sample Proposal for a Conservation Farming Project Page 22
ANNEX B: PERFORMANCE MEASUREMENT FRAMEWORK
4 These baseline estimations will be confirmed in the baseline survey. 5 Sample size percentages depend on target population size. To calculate the sample size, use a sample size calculator (i.e.: http://www.raosoft.com/samplesize.html ) with an error margin of 5% and confidence level of 95%. 6 Focus group discussions will be done in addition to HH surveys to confirm this outcome 7 It is not possible to do this for the first year because this information is not available before the annual report is due.
Expected Results
Indicator Baseline Data
Target (3rd year)
Data Sources
Data Collection Methodology
Frequency of Data
Collection Population
covered Who is
Responsible
Ultimate Outcome: Improved food security in 6 wards of District C. 1. Intermediate Outcomes (Medium term)
1.1 Increased food production 1.1.1 Kg of CF cereal production per household
1.1.2 Kg of conventional cereal production per household
1.1.3 Kg of CF legume production per household
O kg (estimated)4 300 kg (estimated) 50 kg (estimated)
600 kg 300 kg 100 kg
CFVP Households
Post-harvest survey of 222 HH representing 37%5 of CFVP households randomly selected
Once, after harvest 600 households Project Officer
1.2 Increased number of months that crop production meets annual household cereal food needs
1.2.1 Average number of months that own cereal production meets household cereal food needs
4 months (estimated) 12 months
CFVP Households
Post-harvest survey of 222 HH representing 37% of CFVP households randomly selected
Once, after harvest 600 households Project Officer
Focus Group
Discussions6
Two FGDs will be organized in each ward with 10 CFVPs randomly selected
Once, after harvest 600 households
Project Officer
1.3 Improved accessibility of locally produced high quality OPV maize seed
1.3.1 Kg of OPV maize seed produced by CFVPs
0 kg
10,000 kg
CFVP Households
Post-harvest survey of 222 HH representing 37% of CFVP households randomly selected
Once, after harvest 600 households Project Officer
1.3.2 Kg of OPV maize seed distributed by community seed banks
0 kg 3,600 kg Community seed bank
records
Review of community seed bank records
Once, beginning in year 2 during the mid-season data collection.7
600 households
Project Officer

Food Security Sample Proposal for a Conservation Farming Project Page 23
Expected Results
Indicator Baseline Data
Target (3rd year)
Data Sources
Data Collection Methodology
Frequency of Data
Collection Population
covered Who is
Responsible
2. Immediate Outcomes (Short term) 2.1 Increased adoption of CF
practices Percent of CFVPs that apply the following CF practices: 2.1.1 75 cm x 60 cm maize planting
station spacing 2.1.2 100% mulch cover 5 cm depth 2.1.3 Rotation with a legume on at
least 25% of the CF plot
0% 0% 0% (estimated)
80% 70% 80%
CFVP Households
Mid-season survey of 222 HH representing 37% of CFVP households
Once, mid-season 600 households
Project Officer
2.1.4 Average land area under CF by CFVPs.
0 ha (estimated) 0.25 ha
2.1.5 Percent non-direct CF beneficiaries practicing mulching (100% cover) and permanent planting stations
0% (estimated)
50% Indirect CF beneficiaries
and spontaneous CF adopter
HH
Trans-sectional village walk/HH interview in 3 villages/ward of at least 20 HH/village. Total sample size is 60 HH/ward x 6 wards = 260 households
Second and third year of project during mid-season survey
Population of 6 wards estimated at 6,000 households
Project Officer
2.2 Increased establishment of OPV maize seed multiplication plots
2.2.1 Percent of CFVPs that established an OPV maize seed multiplication plot with time (2 week minimum) and/or space (200 m) isolation.
0%
80%
CFVP Households
Mid-season survey of 222 HH representing 37% of CFVP households randomly selected
Once, mid-season 600 households Project Officer
2.3 CF community extension design functioning
2.3.1 Annual number of workshops facilitated by Lead CFVPs
2.3.2 Average number of CFVP households attending each workshop led by Lead CFVPs in their communities.
n/a n/a
240 workshops 9 CFVP households
Field staff record books
Review record books Once per year 600 households

Food Security Sample Proposal for a Conservation Farming Project Page 24
Expected Results
Indicator Baseline Data
Target (3rd year)
Data Sources
Data Collection Methodology
Frequency of Data
Collection Population
covered Who is
Responsible
3. Outputs 3.1 CF introduction meetings
completed 3.1.1 Number of introduction meetings
N/A 21
Field staff record books
Review of field staff record books One time 600
households Project Officer
3.2 CFVPs selected and registered
3.2.1 Number of CFVPs selected and registered
N/A 600
3.3 Inputs procured and distributed
3.3.1 Kg of OPV maize seed distributed
3.3.2 Kg of cow pea seed distributed
N/A N/A
3,600 kg 2,400 kg
3.4 Training workshops completed
3.4.1 Annual number of workshops for Lead CFVPs completed
3.4.2 Average number of Lead CFVPs that attend training workshops
N/A N/A
24 10
3.5 Field visits completed 3.5.1 Annual number of field visits N/A 240
3.6 Field days organized 3.6.1 Annual number of field days held
3.6.2 Average number of farmers that attended each field day
N/A N/A
6 200
Food Security Sample Proposal for a Conservation Farming Project Page 25
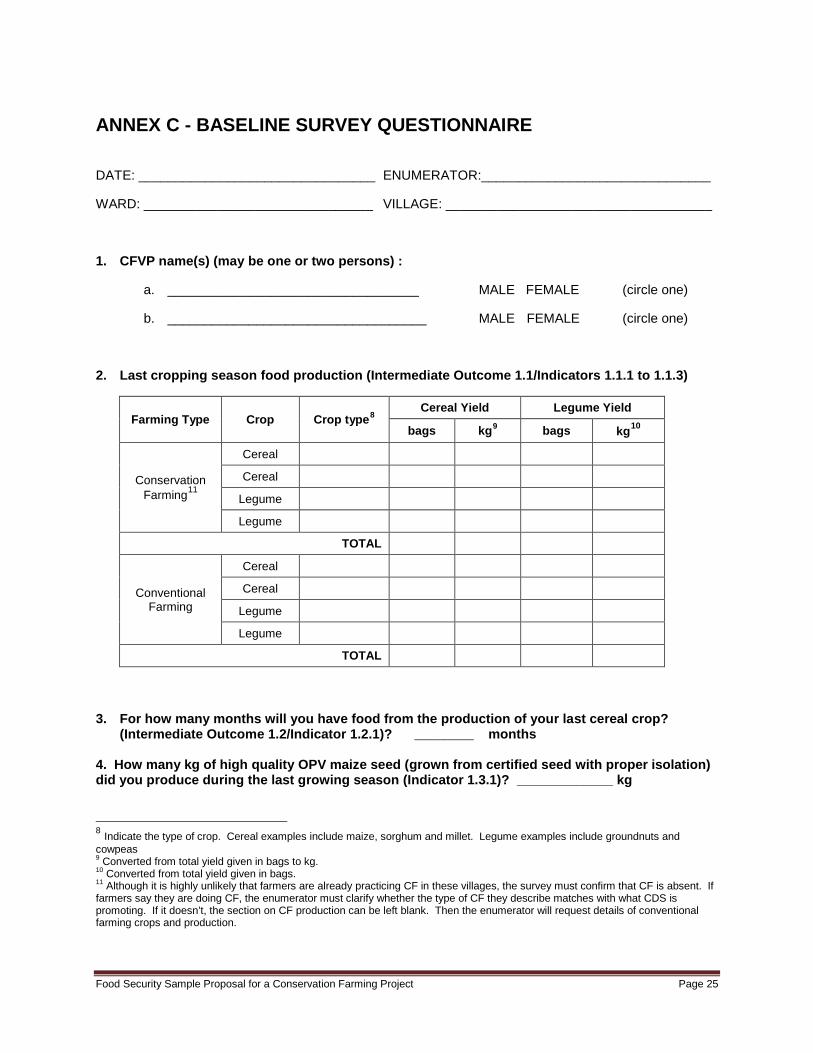
ANNEX C - BASELINE SURVEY QUESTIONNAIRE
DATE: ________________________________ ENUMERATOR:_______________________________
WARD: _______________________________ VILLAGE: ____________________________________
1. CFVP name(s) (may be one or two persons) :
a. __________________________________ MALE FEMALE (circle one)
b. ___________________________________ MALE FEMALE (circle one)
2. Last cropping season food production (Intermediate Outcome 1.1/Indicators 1.1.1 to 1.1.3)
Farming Type Crop Crop type8 Cereal Yield Legume Yield
bags kg9 bags kg10
Conservation Farming11
Cereal
Cereal
Legume
Legume
TOTAL
Conventional Farming
Cereal
Cereal
Legume
Legume
TOTAL
3. For how many months will you have food from the production of your last cereal crop?
(Intermediate Outcome 1.2/Indicator 1.2.1)? ________ months
4. How many kg of high quality OPV maize seed (grown from certified seed with proper isolation) did you produce during the last growing season (Indicator 1.3.1)? _____________ kg
8 Indicate the type of crop. Cereal examples include maize, sorghum and millet. Legume examples include groundnuts and cowpeas 9 Converted from total yield given in bags to kg. 10 Converted from total yield given in bags. 11 Although it is highly unlikely that farmers are already practicing CF in these villages, the survey must confirm that CF is absent. If farmers say they are doing CF, the enumerator must clarify whether the type of CF they describe matches with what CDS is promoting. If it doesn’t, the section on CF production can be left blank. Then the enumerator will request details of conventional farming crops and production.

Food Security Sample Proposal for a Conservation Farming Project Page 26
ANNEX D – MID-SEASON SURVEY QUESTIONNAIRE12
DATE: ________________________________ ENUMERATOR:_______________________________
WARD: _______________________________ VILLAGE: ____________________________________
1. CFVP name(s) (may be one or two persons) :
a. __________________________________ MALE FEMALE (circle one)
b. ___________________________________ MALE FEMALE (circle one)
2. Conservation farming adoption monitoring (Immediate Outcome 2.1)
Indicator 2.1.1 Was the CF plot established using 75 cm (between rows) and 60 cm (in-row) spacing? Yes No
Indicator 2.1.2 Does the CF plot have 100% mulch cover to a depth of 5 cm? Yes No
Indicator 2.1.3 Has a legume been included in the CF plot occupying an area at least 10m x 50m? Yes No
Indicator 2.1.4 What is the total area this household has in CF? (if possible, calculate in square meters)
Dimension: __________
Sq. Meters:__________
3. OPV maize seed multiplication plot establishment monitoring (Immediate Outcome 2.2)
Indicator 2.2.1 Does this household have a seed multiplication plot with proper isolation? Yes No
12 222 randomly selected households will participate in this survey.

Food Security Sample Proposal for a Conservation Farming Project Page 27
ANNEX E: INDICATOR TRACKING TABLE PLAN
Ultimate Outcome: Improved food security in 6 wards of District C.
Bas
elin
e va
lue
and
date
(all
estim
ated
)
Year
1 ta
rget
Year
1 a
chie
ved
Cum
ulat
ive
Year
2
targ
et
Year
2 a
chie
ved
Cum
ulat
ive
Year
3
targ
et
Year
3 a
chie
ved
Explanations of significant target variances
1. Intermediate Outcomes Indicator ---- ---- ---- ---- ---- ---- ---- ----
1.1 Increased food production
1.1.1 Kg of CF cereal production per household 0 200 400 600
1.1.2 Kg of conventional cereal production per household 300 300 300 300
1.1.3 Kg of CF legume production per household 50 50 75 100
1.2 Increased number of months that crop production meets annual household cereal food needs
1.2.1 Average number of months that own cereal production meets household cereal food needs 4 6.7 9.3 12
1.3 Improved accessibility of locally produced high quality OPV maize seed
1.3.1 Kg of OPV maize seed produced by CFVPs 1.3.2 Kg of OPV maize seed distributed by community
seed banks
N/A 10,000 3,600
10,000 3,600
10,000 3,600
2. Immediate Outcomes Indicator ---- ---- ---- ---- ---- ---- ---- ----
2.1 Increased adoption of CF practices
Percent of CFVPs that apply the following CF practices: 2.1.1 75 cm x 60 cm maize planting station spacing 2.1.2 100% mulch cover 5 cm depth 2.1.3 Rotation with a legume on at least 25% of CF plot
0% 0% 0%
80% 50% 80%
80% 60% 80%
80% 70% 80%
2.1.4 Average land area (ha) under CF production by CFVPs 0 0.25 0.25 0.25
2.1.5 Percent non-direct CF beneficiaries practicing mulching (100% cover) and permanent planting stations
n/a 10% 40%
2.2 Increased establishment of OPV maize seed multiplication plots
2.2.1 Percentage of CFVPs that established an OPV maize seed multiplication plot with time (2 week) and/or space (200m) isolation
0% 80% 80% 90%
2.3 CF community extension design functioning
2.3.1 Annual number of workshops facilitated by Lead CFVPs
2.3.2 Average number of CFVP households attending each workshop led by Lead CFVPs in their communities.
n/a n/a
180 6
200 8
240 9

Food Security Sample Proposal for a Conservation Farming Project Page 28
Bas
elin
e va
lue
and
date
Year
1 ta
rget
Year
1 a
chie
ved
Year
2 t
arge
t
Year
2 a
chie
ved
Year
3 ta
rget
Year
3 a
chie
ved
Explanations of significant target variances
3. Outputs Indicator ---- ---- ---- ---- ---- ---- ---- ----
3.1 CF introduction meetings completed 3.1.1 Number of CF introduction meetings N/A 21 N/A N/A
3.2 CFVPs selected and registered 3.2.1 Number of CFVP selected and registered N/A 600 600 600
3.3 Inputs procured and distributed 3.3.1 Kg of OPV maize seed distributed 3.3.2 Kg of cowpea seed distributed
N/A 3600 2400
N/A N/A
3.4 Training workshops completed 3.4.1 Annual number of workshops for Lead CFVPs completed
3.4.2 Average number of Lead CFVPs that attend each training workshop
N/A 24 10
24 10
24 10
3.5 Field visits completed 3.5.1 Annual number of field visits N/A 240 240 240
3.6 Field days organized 3.6.1 Annual number of field days held 3.6.2 Average number of farmers that attended each
field day
N/A 6 100
6 150
6 200

Food Security Sample Proposal for a Conservation Farming Project Page 29
ANNEX F – ANNUAL IMPACT SURVEY QUESTIONNAIRE
DATE: ________________________________ ENUMERATOR:_______________________________
WARD: _______________________________ VILLAGE: ____________________________________
1. CFVP name(s) (may be one or two persons) :
a. __________________________________ MALE FEMALE (circle one)
b. ___________________________________ MALE FEMALE (circle one)
2. Last cropping season food production (Intermediate Outcome 1.1/Indicators 1.1.1 to 1.1.3)
Farming Type Crop Crop type13 Cereal Yield Legume Yield
bags kg14 bags kg
Conservation Farming
Cereal
Cereal
Legume
Legume
TOTAL
Conventional Farming
Cereal
Cereal
Legume
Legume
TOTAL
3. How many months of food did you produce from your last cereal crop? (Intermediate Outcome 1.2/Indicator 1.2.1)? ________ months
4. How many kg of high quality OPV maize seed (grown from certified seed with proper isolation
barriers) did you produce during the last growing season (Intermediate Outcome 1.3/Indicator 1.3.1)? ________ kg
5. How many CF trainings were facilitated in your community by the village Lead CFVP this past
year (Immediate Indicator 2.3/Indicator 2.3.1)? __________trainings
13 Indicate the type of crop. Cereal examples include maize, sorghum and millet. Legume examples include groundnuts and cowpeas 14 Converted from total yield given in bags to kg.

Food Security Sample Proposal for a Conservation Farming Project Page 30
ANNEX G – YEAR 1-3 SUMMARY BUDGET EXPENDITURES
Description Unit Quantity Cost/Unit Budget Total
Year 1 Year 2 Year 3 1. Seed Inputs 1.1 Maize seed MT 3.6 XX XX XX 1.2 Cow peas MT 2.4 XX XX XX Subtotal Seed Inputs XX XX XX XX 2. Workshops 2.1 CFVP Training Workshops workshops 24 XX XX XX XX XX Subtotal Workshops XX XX XX XX 3. Monitoring and Evaluation 3.1 Baseline survey 3.1.1 Training training 1 XX XX XX
3.1.2 Enumerator allowance and accommodation (3 days) enumerator 4 XX XX XX
3.1.3 Transportation Km 800 XX XX XX 3.2 Annual impact survey 3.1.1 Training training 1 XX XX XX XX XX
3.1.2 Enumerator allowance and accommodation (3 days) enumerator 4 XX XX XX XX XX
3.1.3 Transportation Km 800 XX XX XX XX XX Subtotal M&E XX XX XX XX 4. Salary 4.1 Regional Manager (10%) month 12 XX XX XX XX XX 4.2 Project Officer (100%) month 12 XX XX XX XX XX 4.3 Project Assist. x 3 (100%) month 12 XX XX XX XX XX 4.3 Finance Officer (10%) month 12 XX XX XX XX XX Subtotal Salary XX XX XX XX 5. Transportation XX XX 5.1 Vehicle 1 km 4,000 XX XX XX XX XX 5.2 Motorcycle x 3 Km 7,500 XX XX XX XX XX Subtotal Transport XX XX XX XX 6. Administration XX XX 6.1 Office supplies month 12 XX XX XX XX XX 6.2 Field office rental month 12 XX XX XX XX XX 6.3 Base camp rental month 12 XX XX XX XX XX Subtotal Administration XX XX XX XX 7. Capacity Building 7.1 ToT Workshop (2 staff) Workshop 1 XX XX XX XX XX
7.2 M&E Training (Project Officer) Workshop 1 XX XX XX XX XX
Subtotal Capacity Building XX XX XX XX TOTAL XX XX XX XX

Food Security Sample Proposal for a Conservation Farming Project Page 31
ANNEX H – YEAR 1 BUDGET RECEIPTS:
Advance No. Date Amount Exchange Rate Total
Total received from CFGB
EXPENDITURES: Description Unit Quant. Cost
per unit Budget Actual Variance (US$)
Variance (%)
1. Seed Inputs 1.1 Maize seed MT 3.6 XX XX 1.2 Cow peas MT 2.4 XX XX Subtotal Seed Inputs XX 2. Workshops 2.1 CFVP Training Workshops workshops 24 XX XX Subtotal Workshops XX 3. Monitoring and Evaluation 3.1 Baseline survey 3.1.1 Training training 1 XX XX
3.1.2 Enumerator allowance and accommodation (3 days) enumerator 4 XX XX
3.1.3 Transportation Km 800 XX XX 3.2 Annual impact survey 3.1.1 Training training 1 XX XX
3.1.2 Enumerator allowance and accommodation (3 days) enumerator 4 XX XX
3.1.3 Transportation Km 800 XX XX Subtotal M&E XX 4. Salary 4.1 Regional Manager (10%) month 12 XX XX 4.2 Project Officer (100%) month 12 XX XX 4.3 Project Assist. x 3 (100%) month 12 XX XX 4.3 Finance Officer (10%) month 12 XX XX Subtotal Salary XX 5. Transportation 5.1 Vehicle 1 km 4,000 XX XX 5.2 Motorcycle x 3 Km 7,500 XX XX Subtotal Transport XX 6. Administration 6.1 Office supplies month 12 XX XX 6.2 Field office rental month 12 XX XX 6.3 Base camp rental month 12 XX XX Subtotal Administration XX 7. Capacity Building 7.1 ToT Workshop (2 staff) Workshop 1 XX XX 7.2 M&E Training (Project Officer) Workshop 1 XX XX Subtotal Capacity Building XX TOTAL XX
Amount Owed (Expenditures less receipts)


![SAMPLE RFP COVER LETTER - New York Web viewSAMPLE REQUEST FOR PROPOSAL (RFP) COVER LETTER. Last Updated: 5/13/2010. PRINT LETTER ON ORGANIZATION LETTERHEAD [Date] [Consultant First](https://img.pdfslide.net/doc/110x75/5a7355bb7f8b9aa7538e7030/sample-rfp-cover-letter-new-york-city-doc-file-web-viewsample-request.jpg)


![SAMPLE RFP COVER LETTER - Welcome to NYC.gov … · Web viewSAMPLE REQUEST FOR PROPOSAL (RFP) COVER LETTER Last Updated: 7/23/2008 PRINT LETTER ON ORGANIZATION LETTERHEAD [Date] [Consultant](https://img.pdfslide.net/doc/110x75/5ad4d3227f8b9a48398cd5a9/sample-rfp-cover-letter-welcome-to-nycgov-viewsample-request-for-proposal.jpg)