Embed Size (px)
Citation preview
Cover option 1: Insert a cover picture and align grouped text freely on page, (28pt)Place, xx. Month 2013 (16pt)
Capital MarketsStory
June 2017
Sustainable access to energy for everyday modern life

| OMV Petrom │ Capital Markets Story │ June 20172
This page is left blank intentionally

| OMV Petrom │ Capital Markets Story │ June 2017
Legal DisclaimerThis presentation does not, and is not intended to, constitute or form part of,and should not be construed as, constituting or forming part of, any actualoffer to sell or issue, or any solicitation of any offer to purchase or subscribefor, any shares issued by the Company or any of its subsidiaries in anyjurisdiction or any inducement to enter into investment activity; nor shall thisdocument or any part of it, or the fact of it being made available, form thebasis of, or be relied on in any way whatsoever. No part of this presentation,nor the fact of its distribution, shall form part of or be relied on in connectionwith any contract or investment decision relating thereto; nor does itconstitute a recommendation regarding the securities issued by theCompany. The information and opinions contained in this presentation andany other information discussed in this presentation are provided as at thedate of this presentation and are therefore of a preliminary nature, have notbeen independently verified and may be subject to updating, revision,amendment or change without notice. Where this presentation quotes anyinformation or statistics from any external source, it should not be interpretedthat the Company has adopted or endorsed such information or statistics asbeing accurate.
No reliance may be placed for any purpose whatsoever on the informationcontained in this presentation, or any other material discussed verbally. Norepresentation or warranty, express or implied, is given as to the accuracy,fairness or currentness of the information or the opinions contained in thisdocument or on its completeness and no liability is accepted for any suchinformation, for any loss howsoever arising, directly or indirectly, from anyuse of this presentation or any of its content or otherwise arising inconnection therewith.
3
This presentation may contain forward-looking statements. These statementsreflect the Company’s current knowledge and its expectations and projectionsabout future events and may be identified by the context of such statementsor words such as “anticipate,” “believe”, “estimate”, “expect”, “intend”, “plan”,“project”, “target”, “may”, “will”, “would”, “could” or “should” or similarterminology. By their nature, forward-looking statements are subject to anumber of risks and uncertainties, many of which are beyond the Company’scontrol that could cause the Company’s actual results and performance todiffer materially from any expected future results or performance expressedor implied by any forward-looking statements.
None of the future projections, expectations, estimates or prospects in thispresentation should in particular be taken as forecasts or promises nor shouldthey be taken as implying any indication, assurance or guarantee that theassumptions on which such future projections, expectations, estimates orprospects have been prepared or the information and statements containedherein are accurate or complete. As a result of these risks, uncertainties andassumptions, you should in particular not place reliance on these forward-looking statements as a prediction of actual results or otherwise. Thispresentation does not purport to contain all information that may benecessary in respect of the Company or its shares and in any event eachperson receiving this presentation needs to make an independentassessment.
The Company undertakes no obligation publicly to release the results of anyrevisions to any forward-looking statements in this presentation that mayoccur due to any change in its expectations or to reflect events orcircumstances after the date of this presentation.
This presentation and its contents are proprietary to the Company and neitherthis document nor any part of it may be reproduced or redistributed to anyother person.
| OMV Petrom │ Capital Markets Story │ June 2017
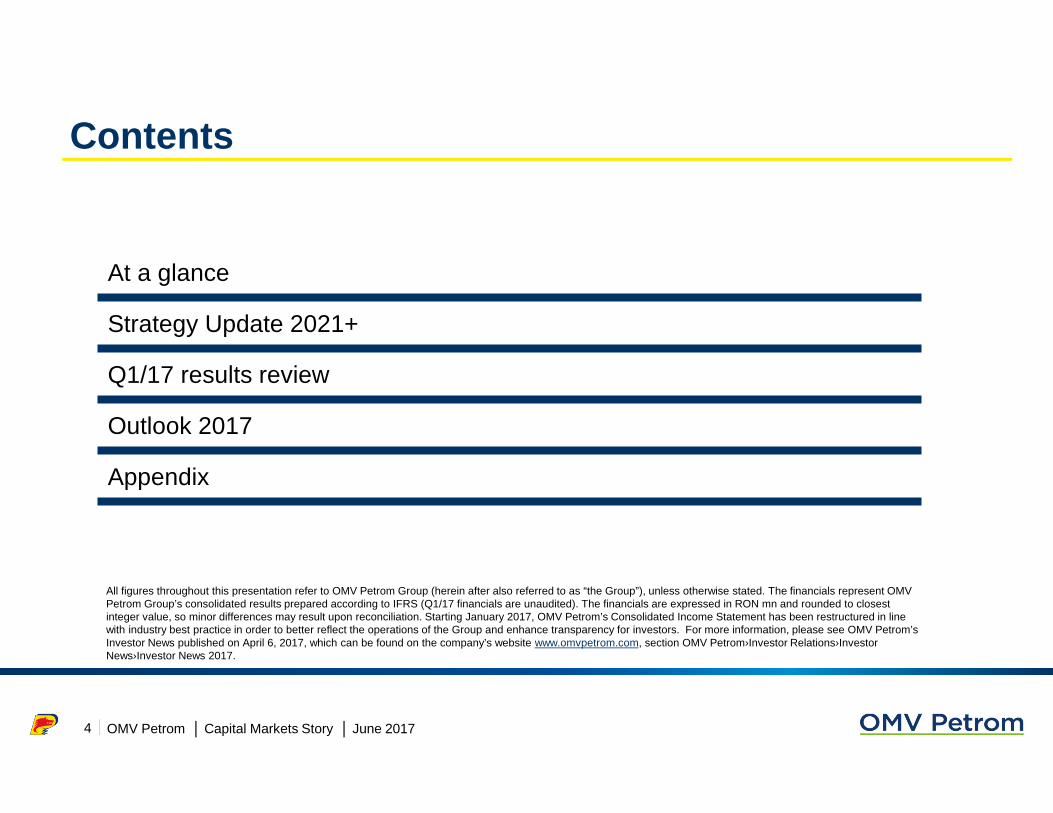
Contents
At a glance
Strategy Update 2021+
Q1/17 results review
Outlook 2017
Appendix
4
All figures throughout this presentation refer to OMV Petrom Group (herein after also referred to as “the Group”), unless otherwise stated. The financials represent OMV Petrom Group’s consolidated results prepared according to IFRS (Q1/17 financials are unaudited). The financials are expressed in RON mn and rounded to closest integer value, so minor differences may result upon reconciliation. Starting January 2017, OMV Petrom’s Consolidated Income Statement has been restructured in line with industry best practice in order to better reflect the operations of the Group and enhance transparency for investors. For more information, please see OMV Petrom’sInvestor News published on April 6, 2017, which can be found on the company’s website www.omvpetrom.com, section OMV Petrom›Investor Relations›InvestorNews›Investor News 2017.

Chapter divider slide: Design must be alike to chosen cover style (28pt)At a glance
At a glance

| OMV Petrom │ Capital Markets Story │ June 2017
We are the leading industrial company in Romania
One of the largest private employers
c.15,000 direct employees and more than 45,000 indirect jobs1
#1 energy supplier
Accounts for ~40% of oil, gas and fuel supply, and can cover up to 10% of power generation in Romania
Substantial investor
Over EUR 1bn Capex spent per year since privatization
Largest contributor to state budget
EUR 2.2 bn2
€
All data refers to 2016
1 Source: internal data and analysis; 2 Includes: profit tax, royalties, employer social contributions, excises incl. custom duties, VAT, employee related taxes, other direct and indirect taxes paid to Romanian State
6

| OMV Petrom │ Capital Markets Story │ June 2017
Operating in the integrated oil and gas sector
Romania
� 3.66 mn toe/yr crude oil and NGL
� 5.25 bcm/yr gas
� 582 mn boe proven reserves (~10 yrs of current production)
Kazakhstan
� 0.36 mn toe/yr crude oil and NGL
� 0.05 bcm/yr gas
� 24 mn boe proven reserves
� Petrobrazi refinery, 4.5 mn t/yr capacity
� 783 filling stations, operated via 2 brands: Petrom (479, Romania, Moldova) and OMV (304, Romania, Bulgaria, Serbia)
� 2.6 mn t retail sales
Upstream Downstream Oil
Downstream Gas
All data refers to 2016
� Gas sales 4.6 bcm/yr, meeting up to ~40% of Romania's demand
� Brazi gas-fired power plant (860 MW)
7
| OMV Petrom │ Capital Markets Story │ June 2017
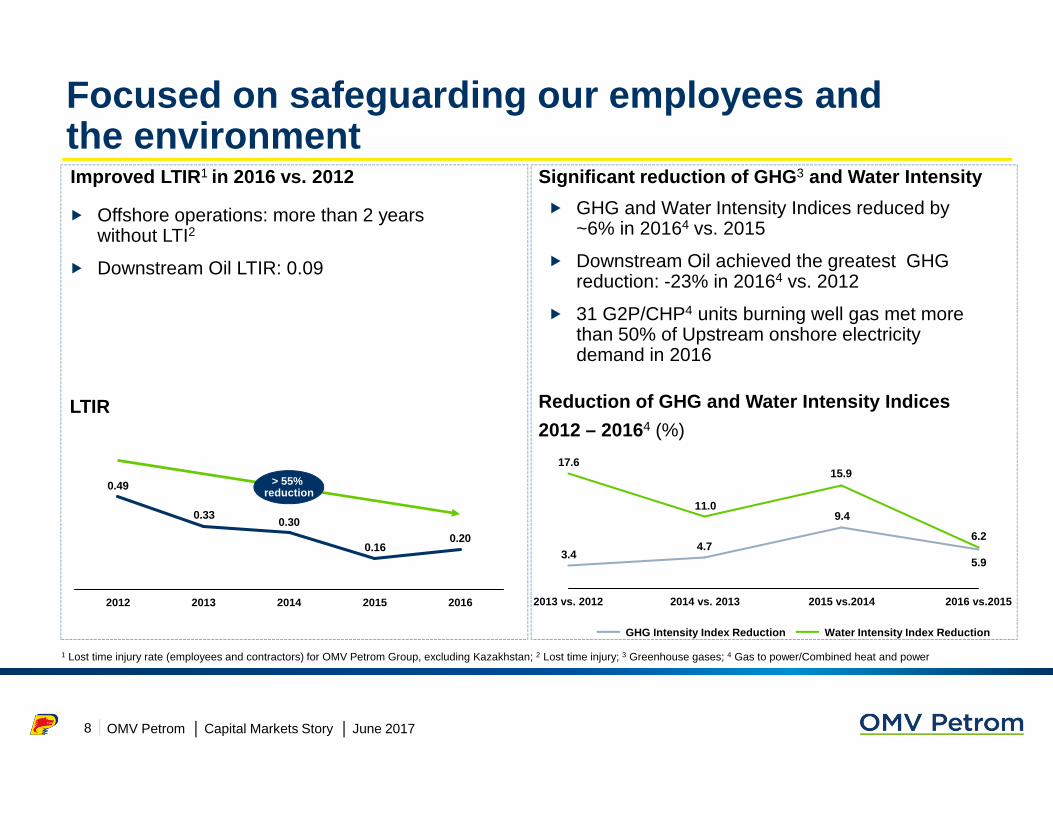
Focused on safeguarding our employees and the environment
� Offshore operations: more than 2 years without LTI2
� Downstream Oil LTIR: 0.09
Significant reduction of GHG 3 and Water Intensity
1 Lost time injury rate (employees and contractors) for OMV Petrom Group, excluding Kazakhstan; 2 Lost time injury; 3 Greenhouse gases; 4 Gas to power/Combined heat and power
� GHG and Water Intensity Indices reduced by ~6% in 20164 vs. 2015
� Downstream Oil achieved the greatest GHG reduction: -23% in 20164 vs. 2012
� 31 G2P/CHP4 units burning well gas met more than 50% of Upstream onshore electricity demand in 2016
Reduction of GHG and Water Intensity Indices
2012 – 20164 (%)LTIR
Improved LTIR 1 in 2016 vs. 2012
~60%reduction
0.33
0.49
0.200.16
0.30
> 55% reduction
20162015201420132012
8
5.9
9.4
4.73.4
6.2
15.9
11.0
17.6
2013 vs. 2012 2016 vs.20152015 vs.20142014 vs. 2013
GHG Intensity Index Reduction Water Intensity Index Reduction

| OMV Petrom │ Capital Markets Story │ June 2017
Proving resilience in a challenging marketClean CCS EBIT 2014 - 2016
(RON mn)
Oil and Gas Price evolution (2012 - 2016)
Indicative Refining Margins (2012 - 2016)1
(USD/bbl)
2015
1 Mediterranean region
654
434
575919
-52%
-33%
2016
1.694
1.112
-4
11
2015
2.522
1.315
-145
2014
5.202
4.667
-56 -63
Upstream
Downstream Oil
Co&O and Consolidation
Downstream Gas
0
10
20
30
40
50
0
40
80
120
160
Jan-12 Jul-12 Jan-13 Jul-13 Jan-14 Jul-14 Jan-15 Jul-15 Jan -16 Jul-16
Brent (USD/bbl) - left axis CEGH (EUR/MWh) - right axis
-4
-2
0
2
4
6
8
Jan-12 Jul-12 Jan-13 Jul-13 Jan-14 Jul-14 Jan-15 Jul-15 Jan -16 Jul-16
9

| OMV Petrom │ Capital Markets Story │ June 2017
Strong execution of efficiency plans
10
2015
11.85
-10%
2016
13.16
CAPEX
RON bn
FCF1
RON bn
Operating cost savings
RON mn
2.6
3.9
2015
-34%
2016
1.6
0.3
+1.2
20162015
-500
20162015
Corporate
Downstream Gas
Downstream Oil
Upstream
1 FCF before repayment of loans and dividend payments
Upstream
OPEX in USD/boe

| OMV Petrom │ Capital Markets Story │ June 2017
2016 Strong financial resilience
+ +
11
Profitability impacted by ongoing market backdrop
Strengthened balance sheet
1 Using a share price of RON 0.3365 as at 19 May 2016 (cum – divi date)
Restoration of dividend distributions
� RON 1.7 bn Clean CCS EBIT, -33% yoy
� RON 4.5 bn operating cash flow, -16% yoy
� Clean CCS EBIT margins decline partly mitigated by cost savings
� Switched from RON 1.3 bn net debt at end 2015 to RON 0.2 bnnet cash at end 2016
� FCF after dividends improved to RON 1.6 bn in 2016 vs. RON (0.3) bn in 2015
� Equity ratio up 2pp to 64%
� 2016 dividend: RON 0.015/share
� Dividend yield1: 4.5%
� 2016 FCF coverage of dividends: 1.8x

| OMV Petrom │ Capital Markets Story │ June 2017
Turning efficiency savings into cash flow…
8.0
2012
7.2
2016
4.5
2015
5.3
2014
6.8
2013
5
3
1
7
2012 2013 2014 2015 20162012 2013 2014 2015 2016
146152
136
109
173
2012 2013 2014 2015 2016
11.8
17.3
13.2
15.4 15.5
12
Operating cash flow (RON bn) Lowered OPEX (USD/bbl)
Operating cash flows / Capex (%) Gearing ratio (%)

| OMV Petrom │ Capital Markets Story │ June 2017
…and cash flow into returns to shareholders
OMV Petrom is committed to deliver a competitive shareholder return through the business cycle, including
paying an attractive dividend, subject always to maintaining a strong balance sheet that will enable the Company
to finance its investment needs and to the shareholders’ approval.
ROACE %EUR ~900 mn
returned to shareholders 2012-2015
2016 dividendEUR 189 mn
Dividend Policy
13
Average 2012-2016ROACE
16.519.0
7.6
-2.2
4.1
9.0
20162015201420132012

| OMV Petrom │ Capital Markets Story │ June 2017
Bucharest Stock Exchange Symbol SNP
Ordinary shares outstanding 56,644,108,335
London Stock Exchange Symbol PETB (GDR)
Initial GDRs 6 issued 2,492,328
GDRs outstanding as at end-April 2017 1,423,203
Shareholder structure and capital market environment
OMV Petrom S.A. shareholder structure 1 (%)
Share informationShare price evolution 5
Index Jan 2012 = 100
1 As of May 2017; 2 Shareholder since December 2004; 3 As of April 30, 2017; 4 Premium tier on the Bucharest Stock Exchange and main market on the London Stock Exchange; 5 Rebased quotations on Bucharest Stock Exchange; 6 1 GDR = 150 ordinary shares
51.01%
12.57%
20.64%
15.79%
Fondul Proprietatea : listed fund with ~82% of AUM invested3 in the energy sector
OMV2: Austria’s leading integrated international oil and gas company
Romanian State , no special rights attached
Free float 4: 15.79%
14
0
50
100
150
200
Jan
-12
Ap
r-1
2
Jul-
12
Oct
-12
Jan
-13
Ap
r-1
3
Jul-
13
Oct
-13
Jan
-14
Ap
r-1
4
Jul-
14
Oct
-14
Jan
-15
Ap
r-1
5
Jul-
15
Oct
-15
Jan
-16
Ap
r-1
6
Jul-
16
Oct
-16
Jan
-17
Ap
r-1
7
SNP BET BET NG
Chapter divider slide: Design must be alike to chosen cover style (28pt)At a glance
Strategy Update 2021+

| OMV Petrom │ Capital Markets Story │ June 2017
Our vision
Committed to enhance customer experience
Regional growth leveraging Romanian expertise
Sustainable access to energy for everyday modern li fe
Leading integrated regional player
16
| OMV Petrom │ Capital Markets Story │ June 2017
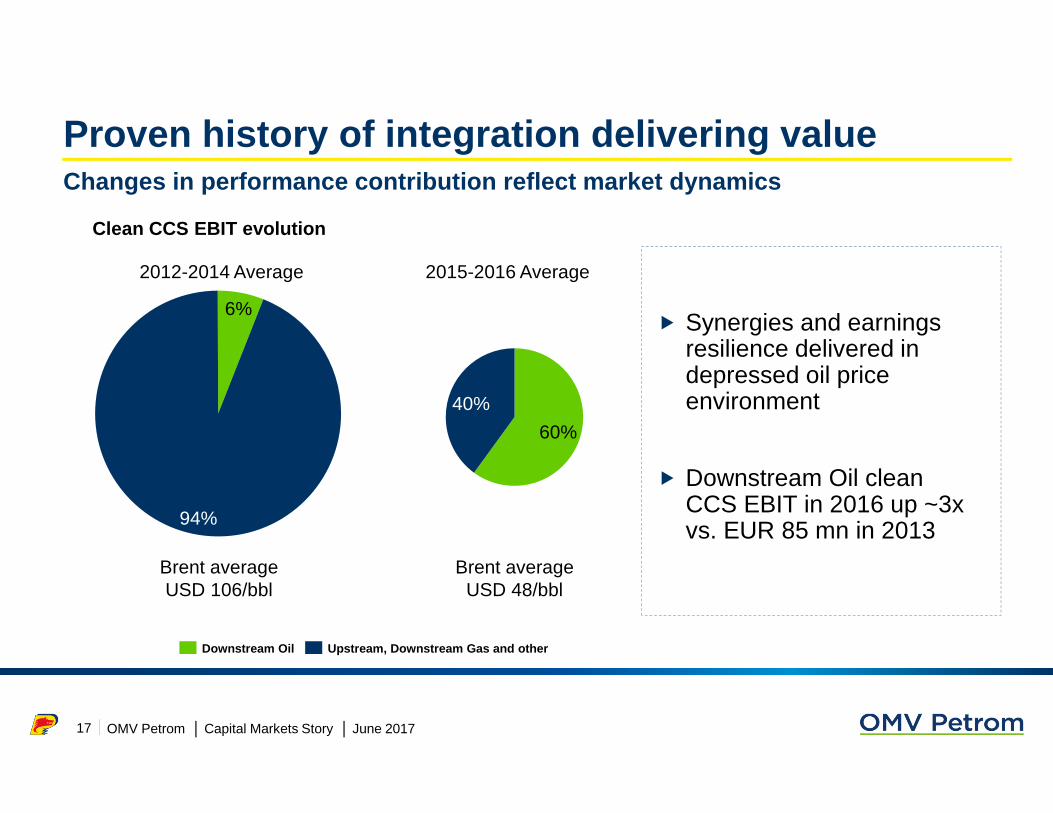
Proven history of integration delivering value
Clean CCS EBIT evolution
� Synergies and earnings resilience delivered in depressed oil price environment
� Downstream Oil clean CCS EBIT in 2016 up ~3x vs. EUR 85 mn in 2013
2012-2014 Average 2015-2016 Average
Changes in performance contribution reflect market dynamics
94%
6%
17
Brent average USD 106/bbl
Brent average USD 48/bbl
40%
60%
Upstream, Downstream Gas and otherDownstream Oil
| OMV Petrom │ Capital Markets Story │ June 2017
Performance 2012 - 2016
FCF3 average for the period of
EUR 375 mn
Gearing maintained below 10%
Strong track record of capital management
UPSTREAM DOWNSTREAM
OPEX reduced from USD 15/boe to USD 12/boe
Refinery utilization rate increased from 73% to 89%
Limited production decline to ~4.7%1
while CAPEX reduced by 45%1 Indicative refinery margins improved
from USD -1.4/bbl to USD 7.0/bbl2
Totea DeepNeptun block exploration
Modernization of Petrobrazi refinery
860MW Brazi power plant on stream
Impr
oved
ope
ratio
nal
effic
ienc
yD
eliv
ered
on
sign
ifica
nt p
roje
cts
1 2016 vs. 2012; 2 Of which modernization of Petrobrazi refinery contributed USD ~5.0/bbl; 3 Free Cash Flow
18

| OMV Petrom │ Capital Markets Story │ June 2017
2021+ Centered around three key pillars
Enhancing competitiveness in the existing portfolio
Regional expansion
Developing growth options
Commitment to deliver attractive shareholder returns
19

| OMV Petrom │ Capital Markets Story │ June 2017
Oil and Gas recovery rates
28%
25%50%
55%
Current 2016 recovery rates
Ultimate recovery rates3
20
Maximize economic recovery
� Mature contingent resources through:
� infill drilling campaigns
� selected field redevelopment programs
� Adding ~150 mn boe1 reserves from existing fields
� Leading to improved ultimate recovery rates
� Key contributor to RRR2 target
Streamline portfolio
� Simplify footprint and reduce complexity
� Expect production loss of up to 6 kboe/day from 2018
1 Life of field; 2 Reserves Replacement Rate; 3 Life of field including strategic ambitions
Oil Gas
Additional production expected from economic recovery offsets loss from streamlining portfolio
20262021
Streamline portfolio
Economic recovery net ~+3 kboe/day
net ~+25 kboe/day
Exploiting potential in existing upstream field portfolio
Current 2016 recovery rates
Ultimate recovery rates3

| OMV Petrom │ Capital Markets Story │ June 2017
Relentless pursuit of operating efficiencies
Upstream
� Focus on the most profitable barrels
� Commitment to operational excellence
� Further reduction of unit costs
� Modernization and simplification of installations and facilities
Downstream
� Capturing of highest integrated operational value� Maximization of availability and utilization of downstream plants� Further improvement of the refinery operations to international benchmarks� Increase in throughput per filling station
Group
� Focus on value over volume
� Ongoing corporate SG&A1 savings
� Agile and efficient organization
� Technology driven initiatives
21
1 Selling, General and Administration Expenses

| OMV Petrom │ Capital Markets Story │ June 2017
Clear operational targets set
1 Mean time between failures; 2 Total number of facilities modernized by 2016
7.0%
7.6%
8.2%
8.8%
9.4%
70%
80%
90%
100%
2016 2017 2018 2019 2020 2021
750
555
20212016
20212016
Increase MTBF 1 (days)
Modernize facilities(no. of modernized facilities)
22
Utilization Fuels & Losses
2021
50
2016
50
Gas-fired power plants
Wholesalers
End customers
Stable gas sales with greater contribution from end customers (TWh)
Refinery - maintain high utilization and reduce fuels & losses
Dow
nstr
eam
Ups
trea
m
Utilization Fuels & Losses
~300
~400
2

| OMV Petrom │ Capital Markets Story │ June 2017
Upstream� Digital Oil Field – well automation and online condition monitoring
� Drones used for aerial photogrammetry, imaging or videos Automated processes and optimized predictive
maintenance
Downstream
� Predictive Analytics – electronic coordination and management of themaintenance and operations processes
� Smart Aps and Price & Portfolio Optimisation – automated self-service interface for customers and partners
Automated dataprocessing
Group � Digitalized and automated processesEfficient and agile
organization
23
Technology enabling efficiency progression

| OMV Petrom │ Capital Markets Story │ June 2017
Mature Neptun Deep opportunity
24
� OMV Petrom (50%), ExxonMobil (50%, Operator)
� First exploration drilling campaign in 2011 – 2012
� Domino-1 well gas discovery: a play opener
� Two seismic acquisition campaigns: 2009; 2012 – 2013
� Second exploration drilling campaign 2014 - 2016
� Seven wells drilled; most of them encountered gas
� Successful well test of Domino structure
� Committed to assess commercial viability based on encouraging results
� Key contributor to RRR1 target2
1 Reserves Replacement Rate; 2 If commercially viable

| OMV Petrom │ Capital Markets Story │ June 2017
Rejuvenated exploration portfolio in Romania
25
� Continue to unlock deep onshore opportunities in existing licenses
� Participate in new licensing rounds
� Contribution to RRR2 target depending on timing and results of the new licensing rounds
1 Risked production; 2 Reserves Replacement Rate
Estimated production contribution 1
~10 kboe/day
Existing commitments Targeted exploration options
2021

| OMV Petrom │ Capital Markets Story │ June 2017
E Videle850m
Blejesti1150m
Padina2650m
Usurei1600m
Iepuresti550m
Sierra2200m
SE Vulcana2500m
ToteaS4400m
BaicoiDeep 5850m
Ulmu3360m
Traian N1600m
Mamu W4250m
Barbatesti4800m
Mamu S4200m
Banesti4800m
D Batran4800m
Marina N2250m
Balteni4400m
Mamu N4200m
Mamu E4300m
Blejesti E1100m
BulbuceniS4000m
Prospect
Target depth <3000m
Lead
NFOProspectLead
NFO Target depth >3000m
Legend1
26
Strong near-field and exploration opportunities in existing portfolio onshore and shallow offshore
2017 2018 2019 2021+
1 Lead = A possible trap, data being not sufficient to fully map it; Prospect = A specific trap that has been identified and mapped but has not been drilled yet; NFO = near-field opportunity
Readiness to drill
| OMV Petrom │ Capital Markets Story │ June 2017
Capture downstream opportunities
Explore value-adding opportunities for gas
Explore technological opportunities capitalizing on skills and assets
Increase integrated value through refining and retail investments
� Polyfuel project to upgrade production mix (operative 2019)20
� Invest in new retail stations in high traffic areas
Conclude modernization of fuel storage network
� Finalise last depot modernization in 2018
27

| OMV Petrom │ Capital Markets Story │ June 2017
Enhance offer and customer experienceIncrease throughput per filling station in Romania
(mn l)
Value for money
Innovation and partnerships to strengthen Petrom and OMV brand positioning
Dow
nstr
eam
O
il D
owns
trea
m
Gas
High quality leader
28
20212016
4.6> 5
Develop partnerships Expanding domestic reach
Product innovation

| OMV Petrom │ Capital Markets Story │ June 2017
Regional expansion to complement portfolio
� Capture synergies with existing operations
� ~80 mn boe reserves targeted from near-term acquisitions
� Prioritise Caspian and Western Black Sea
Downstream Gas
� Diversify sales channels for current production (subject to interconnectors development)
� Grow regionally with Neptun1 volumes monetization
Upstream
Leverage our local know-how
29
Transport capacities
planned
existing
1 If commercially viable

| OMV Petrom │ Capital Markets Story │ June 2017
Portfolio investmentsEUR ~5 bn cumulative Capex anticipated over 2017 - 20 21
Cumulative Capex allocation Upstream portfolio
� Maximize value of current mature field portfolio
� Secure improved recovery from contingent resources
� Deliver further growth in Romania
� Drive regional expansion
Downstream portfolio
� Continue operational efficiency programs
� Build new filling stations
� Perform planned turnarounds
� Secure long term growth
30
20%
40%
60%
80%
100%
2017 - 2021
Downstream Upstream

| OMV Petrom │ Capital Markets Story │ June 2017
Success built on three core strategic enablers
People and Organizational CultureWe are the energy
SustainabilityRespect the future
Technology and InnovationInnovate for the future
31

| OMV Petrom │ Capital Markets Story │ June 2017
Generate positive outcomes for shareholders
Enhanced profitability
Strong balance sheet
Attractive shareholder returns
+ +
32

| OMV Petrom │ Capital Markets Story │ June 201733
2021 Clear, robust targets
RRR1
100% by 2021
CAPEX
EUR ~1 bn p.a.
FCF2 after dividends
Positive for majority of period
Clean CCS ROACE 3
> 10% by 2021
Gearing
Maintain a strong balance sheet
Dividend
Attractive returns
1 Reserves Replacement Rate; 2 Free Cash Flow; 3 Clean Current Cost of Supply Return on Average Capital Employed
| OMV Petrom │ Capital Markets Story │ June 2017
EUR ~900 mn returned to shareholders over 2012-2015
Confidence on 2021+ plan allows improved visibility toward shareholder returns
Considerations 2016 DPS2: RON 0.015
Commitment to deliver a competitive shareholder ret urn by paying an attractive dividend
Earnings
Oil & Gas prices
CAPEX
FCF and Balance sheet
� Stress tested forecasts under various pricing points and FX assumptions
� Upcoming CAPEX
� FCF1 generation, cash buffer
� Debt structure, potential acquisitions
34
189
347
FCF Dividend
55%
Dividend considerations
1 Free Cash Flow; 2 Dividend per share
EUR mn
| OMV Petrom │ Capital Markets Story │ June 201735
Solid Foundation
� Integrated business model delivers value through the cycle
� Strong track record of capital management
� Strong cash generation
Vision
� Provider of sustainable access to energy for everyday modern life
� Capitalizing on OMV Petrom’s existing assets and skills
Defined Execution Plan
� Sustainability of reserves base
� Operational efficiency
� Value chain
� Customer experience
Enabled by:
� People and Organizational Culture
� Sustainability
� Technology and Innovation
Clear Strategy
� Enhance competitiveness of existing portfolio
� Develop growth options
� Expand the regional footprint
Deliver Sustainable Value
Creation
� Attractive shareholder returns
� Improved profitability
� Strong balance sheet
� Readiness for new world of energy
Our path to long -term success
| OMV Petrom │ Capital Markets Story │ June 201736
This page is left blank intentionally
Chapter divider slide: Design must be alike to chosen cover style (28pt)At a glance
Q1/17 Results review

| OMV Petrom │ Capital Markets Story │ June 2017
Continued to deliver a strong free cash flow of RON 646 mn
Clean CCS Operating Result at RON 767 mn; more than half contribution from Upstream
Clean CCS EPS up 77% yoy
Q1/17 LTIR1 at 0.17 (2016: 0.20)
Key messages Q1/17
1 Lost time injury rate (employees and contractors) for OMV Petrom Group excluding Kazakhstan
Upstream: production 170 kboe/d; OPEX 10.5 USD/boe
38
Downstream Oil: retail sales +4% yoy; refinery utilization rate at 95%
Downstream Gas: gas sales +11% yoy; net electrical output +77% yoy
| OMV Petrom │ Capital Markets Story │ June 2017
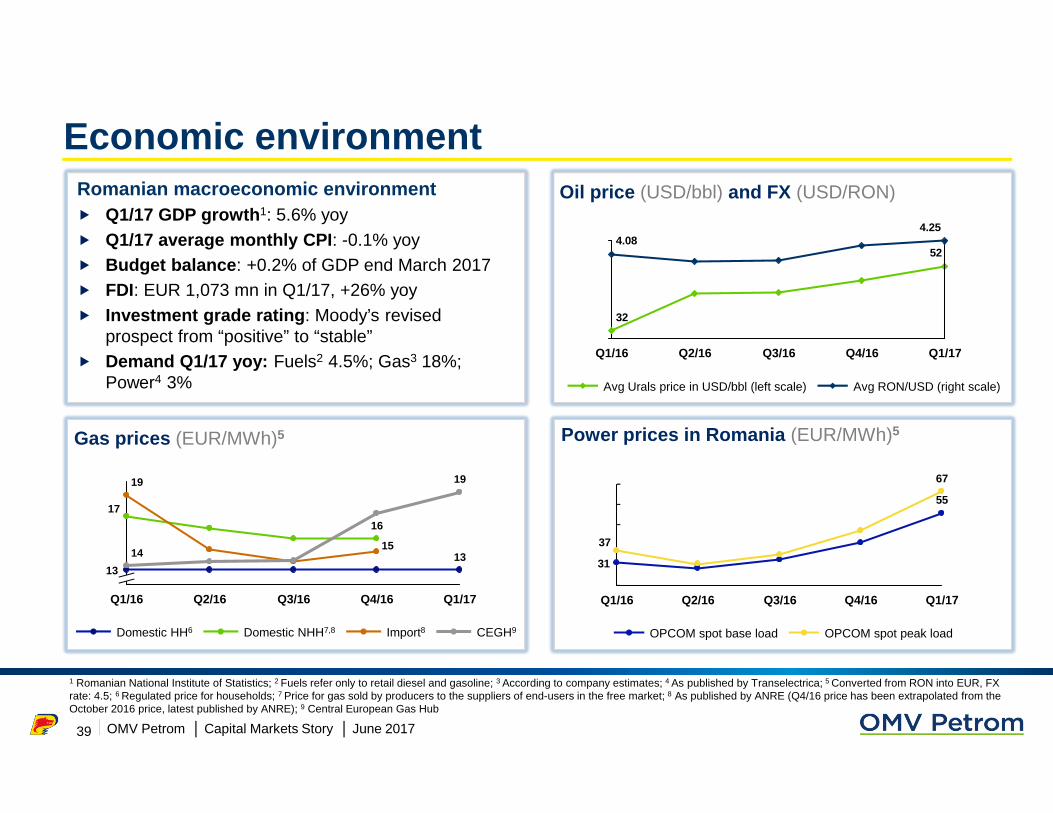
Economic environmentOil price (USD/bbl) and FX (USD/RON)
52
32
4.254.08
Q1/17Q4/16Q3/16Q2/16Q1/16
Avg RON/USD (right scale)Avg Urals price in USD/bbl (left scale)
39
Romanian macroeconomic environment� Q1/17 GDP growth 1: 5.6% yoy� Q1/17 average monthly CPI : -0.1% yoy� Budget balance : +0.2% of GDP end March 2017� FDI: EUR 1,073 mn in Q1/17, +26% yoy� Investment grade rating : Moody’s revised
prospect from “positive” to “stable” � Demand Q1/17 yoy: Fuels2 4.5%; Gas3 18%;
Power4 3%
1 Romanian National Institute of Statistics; 2 Fuels refer only to retail diesel and gasoline; 3 According to company estimates; 4 As published by Transelectrica; 5 Converted from RON into EUR, FX rate: 4.5; 6 Regulated price for households; 7 Price for gas sold by producers to the suppliers of end-users in the free market; 8 As published by ANRE (Q4/16 price has been extrapolated from the October 2016 price, latest published by ANRE); 9 Central European Gas Hub
Gas prices (EUR/MWh)5 Power prices in Romania (EUR/MWh)5
55
31
67
37
Q1/17Q4/16Q3/16Q2/16Q1/16
OPCOM spot peak loadOPCOM spot base load
Q1/17
19
13
Q4/16
15
16
Q3/16Q2/16Q1/16
14
19
17
13
CEGH9Import8Domestic NHH7,8Domestic HH6
| OMV Petrom │ Capital Markets Story │ June 2017
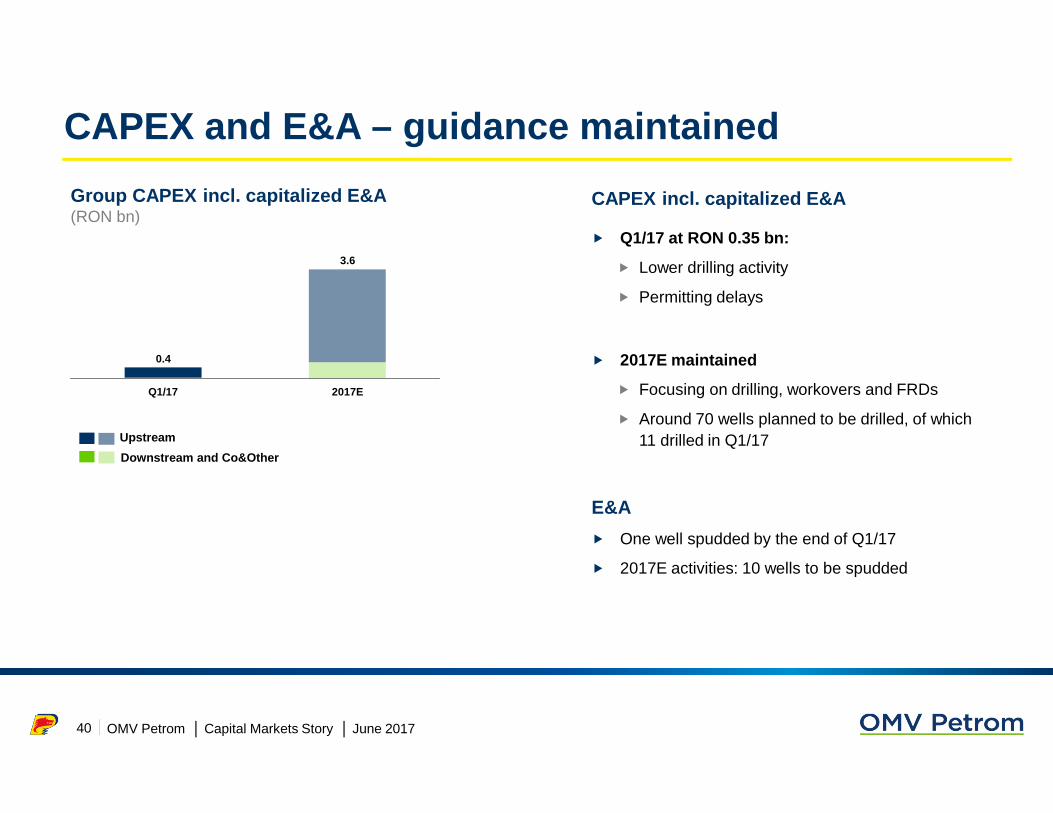
CAPEX incl. capitalized E&A
� Q1/17 at RON 0.35 bn:
� Lower drilling activity
� Permitting delays
� 2017E maintained
� Focusing on drilling, workovers and FRDs
� Around 70 wells planned to be drilled, of which 11 drilled in Q1/17
CAPEX and E&A – guidance maintained
40
2017E
3.6
Q1/17
0.4
Upstream
Downstream and Co&Other
E&A
� One well spudded by the end of Q1/17
� 2017E activities: 10 wells to be spudded
Group CAPEX incl. capitalized E&A(RON bn)

| OMV Petrom │ Capital Markets Story │ June 2017
OPEX1
(USD/boe)
Upstream KPIs – improved OPEX/boe
41
94 96 95 92 94
81 81 79 78 76
-3%
Q1/17
170
Q4/16
170
Q3/16
174
Q2/16
177
Q1/16
175
Hydrocarbon production (kboe/d)
GasOil and NGL
10.511.611.1
12.012.1
-13%
Q1/17Q4/16Q3/16Q2/16Q1/16
Key drivers Q1/17 vs. Q1/16
� Improved OPEX, in USD/boe terms, -13%:
� elimination of tax on special constructions
� MTBF 595 days; lower personnel, services and materials costs
� favorable FX evolution
� Total Upstream production -3%, due to:
� natural decline
� adverse weather
� partially compensated by Lebada East NAG
1 OMV Petrom aligned the production cost definition with its industry peers. Administrative expenses and selling and distribution costs are excluded from 2017 onwards. 2016 OPEX figures were re-calculated accordingly.

| OMV Petrom │ Capital Markets Story │ June 2017
OMV Petrom Indicator refining margin (USD/bbl)
Downstream Oil KPIs – retail sales volumes up
Retail sales volumes(mn t)
0.570.65
0.730.63
0.55
Q1/16 Q2/16 Q3/16 Q4/16
+4%
Q1/17
7.587.14
5.96
6.82
8.06
Q1/16 Q2/16 Q3/16 Q4/16 Q1/17
42
Key drivers Q1/17 vs. Q1/16
� Refining utilization rate at 95%
� Growth in retail sales of +4% yoy
� Strong refining margin, though slightly lower

| OMV Petrom │ Capital Markets Story │ June 2017
Gas sales volumes (TWh)
Downstream Gas KPIs – higher gas & power volumes
Net electrical output(TWh)
43
15.514.2
11.410.7
14.0
+11%
Q1/17Q4/16Q3/16Q2/16Q1/16
0.750.82
1.20
0.480.42
+77%
Q1/17Q4/16Q3/16Q2/16Q1/16
Key drivers Q1/17 vs. Q1/16
� Higher gas sales volumes due to colder weather and increased offtake by the Brazipower plant
� Higher net electrical output on the back of stronger forward position
� Half of the Brazi power plant capacity unavailable

| OMV Petrom │ Capital Markets Story │ June 2017
Strong FCF generation in Q1/17
Q1/17 vs. Q1/16
� Q1/17 operating cash flow up 42% due to:
► higher revenues and operating profits on improved oil prices, higher gas and power volumes
► continued cost savings
► partly offset by unfavorable NWC developments
� Cash flow from investments down 39%, mainly due to Neptun Deep and completion of FRD projects in 2016
� FCF turned positive at RON 646 mn
� Net cash position increased to RON 872 mn
44
RON mn Q1/16 Q4/16 Q1/17
Cash flow from operating activities (CFO) 888 1,070 1,262
Thereof, Depreciation, amortization and impairments including write-ups
830 866 792
Change in net working capital (NWC) (54) (191) (176)
Cash flow from investing activities (CFI) (1,007) (638) (616)
Cash flow from financing activities (CFF) (41) (239) 9
Cash and equivalents at end of period 653 1,996 2,651
Free cash flow (118) 432 646

| OMV Petrom │ Capital Markets Story │ June 2017
Results summary – Net income more than double
RON mn Q1/16 Q4/16 Q1/17
Sales 3,649 4,694 4,653
Clean CCS Operating Result 412 453 767
Thereof Upstream (73) 246 460
Downstream Oil 255 288 280
Downstream Gas 47 5 32
Corporate and Other (14) (25) (21)
Consolidation 196 (60) 17
Operating Result 346 335 798
Financial result (3) (102) (56)
Taxes (55) (73) (124)
Net income 1 291 162 619
Clean CCS net income 1 330 263 586
Q1/17 vs. Q1/16
� Improved Clean CCS Operating Result by 86%
� Elimination of construction tax: favorable effect of RON 63 mn
� Upstream result supported by Urals up 62% and lower OPEX
� Downstream Oil result improved following strict cost management and higher sales
� Downstream Gas: overall improved operational performance offset by provisions for receivables
� Consolidation: much lower positive effect following increase of crude oil quotations
45
1 Attributable to stockholders of the parent
Income Statement
| OMV Petrom │ Capital Markets Story │ June 2017
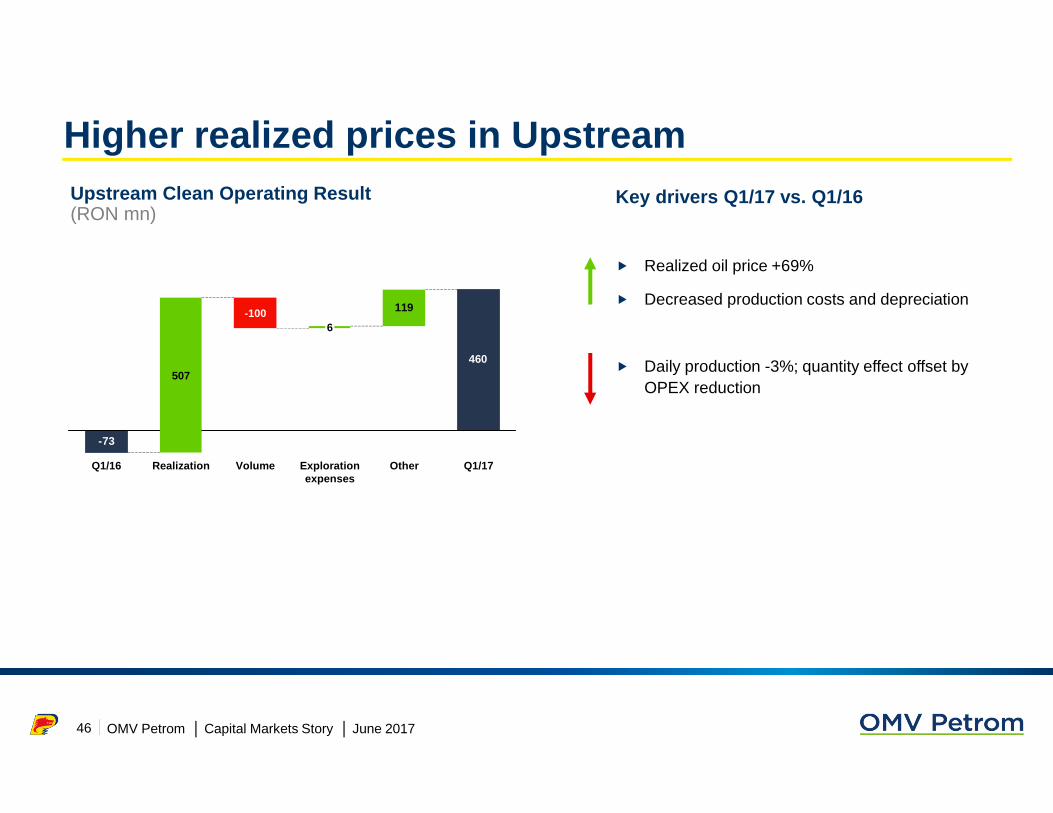
Higher realized prices in UpstreamKey drivers Q1/17 vs. Q1/16
� Realized oil price +69%
� Decreased production costs and depreciation
� Daily production -3%; quantity effect offset by OPEX reduction
46
460
-73
119-100
Q1/16
6
VolumeRealization
507
OtherExploration expenses
Q1/17
Upstream Clean Operating Result (RON mn)

| OMV Petrom │ Capital Markets Story │ June 2017
Downstream Clean CCS Operating Result (RON mn)
Increased Downstream Clean CCS Operating ResultKey drivers Q1/17 vs. Q1/16
� Improved Oil result on the basis of Retail and tight cost control
� Higher segment sales in Downstream Gas
� Refining margins -6%, impacted by higher cost of crude offsetting better product spreads
� Unfavorable development of provisions in Downstream Gas
47
3247
255 280
Q1/17
311-1625
Q1/16
302
Downstream GasDownstream Oil

| OMV Petrom │ Capital Markets Story │ June 201748
This page is left blank intentionally

Chapter divider slide: Design must be alike to chosen cover style (28pt)At a glance
Outlook 2017

| OMV Petrom │ Capital Markets Story │ June 2017
Business Diagram Slide for PowerPoint
Assumptions Targets
Outlook 2017
� Production decline up to 3% yoy
� CAPEX budget increased to EUR 0.8 bn(~85% in Upstream)
� Positive FCF after dividends
� Strong balance sheet maintained
� Attractive dividend
� Brent at USD 55/bbl
� Refining margins downward trend for the rest of the year
� Fuel demand on an upward trend
� Gas demand broadly flat; high competition and margin pressure
� Power demand relatively stable; positive average spark spreads
50

| OMV Petrom │ Capital Markets Story │ June 2017
Sensitivities in 2017
OMV Petrom Group main sensitivities Operating Result impact
Brent oil price
OMV Petrom indicator refining margin
Exchange rates (EUR/USD)
�EUR +20 mn
51
�USD +1/bbl
�USD appreciation by 5 USD cents
�USD +1/bbl
�EUR +46 mn
�EUR +25 mn

| OMV Petrom │ Capital Markets Story │ June 201752
This page is left blank intentionally
Chapter divider slide: Design must be alike to chosen cover style (28pt)At a glance
Appendix

| OMV Petrom │ Capital Markets Story │ June 2017
Romanian oil market overview in 2016
1 Only crude oil processed (other feedstock not included). Data source: National Institute of Statistics (INS) and OMV Petrom calculations. 2015 data.
Rompetrol (Petromidia, Vega) LukOil (Petrotel)
IMPORTS: various PRODUCTION
TRANSPORTATION: Conpet
67%
Refineries (combined nameplate capacity ~12 mn tpa) proces sed crude oil ~11.1 1
mn tpa (of which ~7.5 mn t from import)30%
Petrobrazi
70%
, , Rompetrol, Lukoil, Mol, others (ENI, GAZPROM NIS, SOCAR, independent retailers)
33%
Sup
ply
Ref
iner
ies
Dis
tri-
butio
n
54
PetroleumProductsImports

| OMV Petrom │ Capital Markets Story │ June 2017
Our operating region 1Our operating region 1 RomaniaRomania
55
Downstream Oil market environment in 2016
� Declining refining margins throughout 2016
� Higher oil product demand vs. 2015
� Persistent overcapacity
� Competitive fuel prices
� Long on both diesel and gasoline
� Increased oil product demand vs. 2015
� Strong market competition
� Long on both diesel and gasoline
� Higher crude oil imports
� Compulsory stock obligation maintained
1 Romania, Bulgaria, Serbia and Moldova

| OMV Petrom │ Capital Markets Story │ June 2017
OMV Petrom Group fuel retail sales (mn l) in 2016
Republic of Moldova
153 401
61
90
78
Romania
Serbia
Black SeaBulgaria
105
188140
159163
20161514132012
2016
2,573
15
2,444
14
2,308
13
2,405
2012
2,405
172181184195219
20161514132012
342348337350331
20161514132012
56
| OMV Petrom │ Capital Markets Story │ June 2017
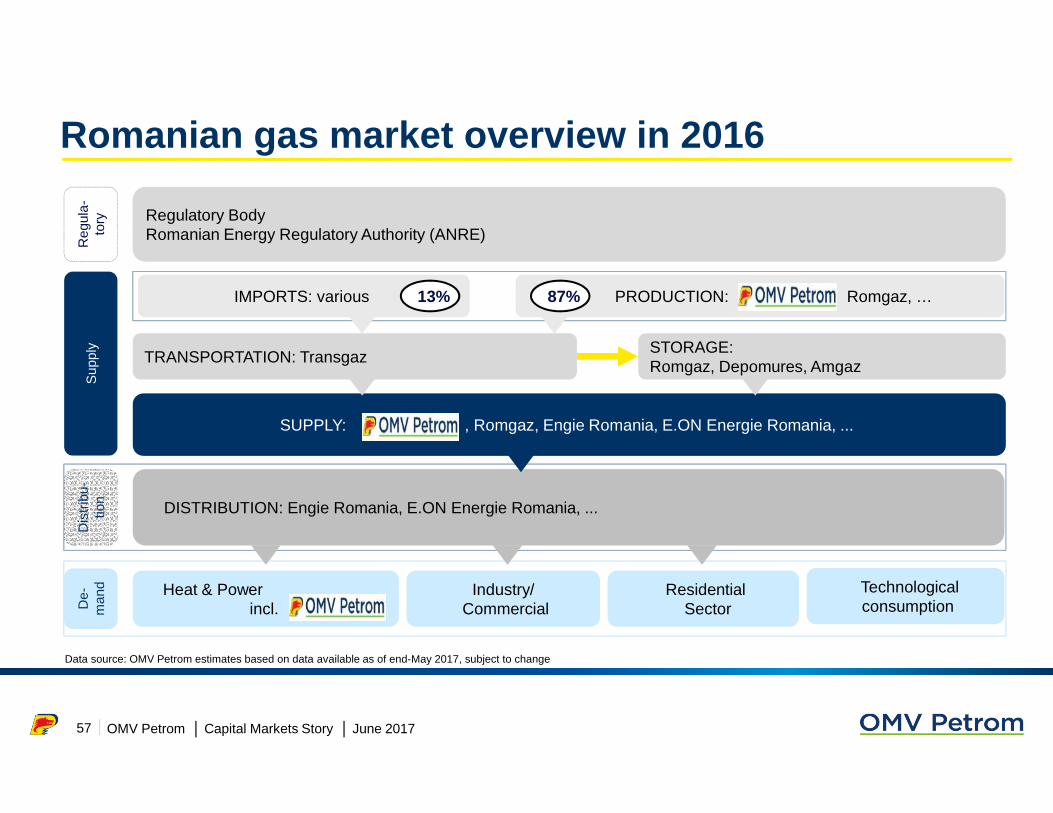
Romanian gas market overview in 2016
Heat & Power incl.
Industry/ Commercial
ResidentialSector
DISTRIBUTION: Engie Romania, E.ON Energie Romania, ...
Regulatory BodyRomanian Energy Regulatory Authority (ANRE)
TRANSPORTATION: TransgazSTORAGE:Romgaz, Depomures, Amgaz
De-
man
d
IMPORTS: various PRODUCTION: , Romgaz, …13% 87%
SUPPLY: , Romgaz, Engie Romania, E.ON Energie Romania, ...
Reg
ula-
tory
Dis
trib
u-tio
nS
uppl
y
Data source: OMV Petrom estimates based on data available as of end-May 2017, subject to change
Technologicalconsumption
57

| OMV Petrom │ Capital Markets Story │ June 2017
Romanian gas market liberalization
� Prices for non-households liberalized since January 2015
� Producer price for households liberalized since April 2017; end-price for households still regulated
� Gas producers and suppliers must sell/buy certain gas quantities via centralized market, which lacks liquidity
� On the Romanian centralized market, the price of natural gas from domestic production varied between RON 61/MWh (EUR 14/MWh) and RON 90/MWh (EUR 20/MWh)1,4 for gas delivered in Q1-Q2/17
� 60% tax on net5 additional revenues resulting from domestic gas price liberalization in place until end-2017
Gas prices in Romania (EUR/MWh1)
1 Converted from RON into EUR, FX rate: 4.52 Chart shows the regulated price for non-households until Q4/14 and, subsequently, the average price for gas sold by
producers to the suppliers of end-users in the free market as published by ANRE; Q4/16 price is the extrapolation of Oct/16 price (latest published by ANRE)
3 Final prices published by ANRE; Q4/16 price is the extrapolation of Oct/16 price (latest published by ANRE)4 Prices could include storage related tariffs in connection with the gas volumes sold/extracted from storage5 Net of incremental royalties and upstream investments (the latter capped at 30% of the additional revenues) and considering
realized gas price (with a floor of RON 72/MWh for gas volumes sold to the free sector of the market other than via centralized markets until March 31, 2017)
58
161616
1718
1718
20202016151412
1113131313131313
12121212121111111010
15
192021
26
3128
252426272727
29
20
0
40
14
Q4/
15
Q1/
16
Q1/
15
Q2/
15
Q3/
15
17 15
Q2/
16
Q1/
17
Q3/
16
Q4/
16
Q4/
14
Q2/
14
Q3/
14
Q1/
14
Q4/
13
Q3/
13
Q2/
13
Q1/
13
Import gas price 3
Domestic gas price for regulated households
Domestic gas price for non-households 2

| OMV Petrom │ Capital Markets Story │ June 2017
Romanian power market overview in 2016
Regulatory BodyRomanian Energy Regulatory Authority (ANRE)
Mid/long term fwd market(s) (OPCOM)
Day ahead market (OPCOM)Ancillary services & Balancing market (TSO&DSO)
Cross border market
ImportsProduction Hydro28%
Thermal37%
Nuclear17%
Renewables14%
Mar
ket(
s)
ExportInternal market consumption
Distribution Operators (DOs)
Reg
ulat
ory
Sup
ply
Dem
and
Transport & Distribution System Operator (TSO&DSO)
59
Data source: Transelectrica
88% 12%
96% 4%

| OMV Petrom │ Capital Markets Story │ June 2017
Romanian gas and power markets overview in 2016
Data sources: ANRE, OPCOM, Transelectrica1 OMV Petrom estimates for 2016 (ANRE reports available only for Jan-Oct 2016)
118 119 109
16
2016
125
2015
1223
2014
12810
Domestic gas
Import gas
11 11 10
19 17 18
22 22 21
8
2016
61
3
9
2015
62
3
10
2014
61
1
Power demand
Nuclear
Hydro
CCPP Brazi
Thermal
Renewables
Gas demand 1 (TWh) Power production and demand (TWh)
Gas market in 2016:
► Demand 1: +3% yoy
► Prices under pressure
► ~5x higher import volumes yoy
► Slightly improved liquidity on centralized market
Power market in 2016:
► Demand: +1% yoy; production : -2% yoy
► Lower net exports yoy
► OPCOM baseload prices: -8% yoy
► Improved clean spark spreads
60

| OMV Petrom │ Capital Markets Story │ June 2017
Key financial indicators (consolidated)
1 Specific Upstream taxes in Romania for the year 2016 amounted to RON 1,092 mn, representing 15.9% of total Upstream hydrocarbon revenues, and include royalties (RON 551 mn),supplementary oil and gas taxation (RON 329 mn) and construction tax (RON 212 mn); 2 Include assets held for sale
61
in RON mn 2008 2009 2010 2011 2012 2013 2014 2015 2016
Sales 20,127 16,090 18,616 22,614 26,258 24,185 21,541 18,145 16,247
EBIT 1
1,205 1,620 2,986 4,936 5,662 5,958 3,338 -530 1,469
EBITD 3,875 4,109 5,797 7,766 8,514 9,313 8,145 6,231 4,933
Net income (loss) 896 833 2,190 3,759 3,946 4,824 2,100 -690 1,038
Net income (loss) attributable to stockholders 978 860 2,201 3,757 3,953 4,821 2,103 -676 1,043
Cash flow from operating activities 4,297 2,726 4,630 6,442 7,185 8,048 6,830 5,283 4,454
Non-current assets 23,320 25,940 28,459 31,022 32,777 34,560 37,243 36,020 35,129
Current assets 2
5,597 4,586 6,306 5,467 5,368 5,487 5,882 5,098 6,285
Total liabilities 12,928 14,336 16,306 15,412 14,739 13,405 16,119 15,430 14,708
Total equity 15,990 16,191 18,459 21,077 23,405 26,642 27,005 25,688 26,706
Net debt / (cash) 1,253 2,614 2,299 1,955 1,711 332 890 1,286 -237
Gearing ratio 7.8 16.2 12.4 9.3 7.3 1.2 3.3 5.0 n.m.
EPS (RON) 0.0173 0.0152 0.0389 0.0663 0.0698 0.0851 0.0371 (0.0119) 0.0184
Payout ratio - - 46% 47% 40% 36% 30% - 81%
Dividend per share (gross, RON) - - 0.0177 0.0310 0.0280 0.0308 0.0112 - 0.0150
EBITD /CAPEX 0.57 0.97 1.19 1.62 1.73 1.75 1.31 1.60 1.92
NBR rates 2008 2009 2010 2011 2012 2013 2014 2015 2016
EUR/RON average 3.680 4.238 4.211 4.238 4.457 4.419 4.444 4.445 4.490
USD/RON average 2.515 3.047 3.180 3.048 3.470 3.328 3.349 4.006 4.057
EUR/RON closing 3.986 4.228 4.285 4.320 4.429 4.485 4.482 4.525 4.541
USD/RON closing 2.805 2.936 3.205 3.339 3.358 3.255 3.687 4.148 4.303

| OMV Petrom │ Capital Markets Story │ June 2017
Key financial indicators (consolidated) – restated 1
1 Restated to reflect the new Income Statement structure; 2 Specific Upstream taxes in Romania for the year Q1/17 amounted to RON 247 mn, representing 12.7% of total Upstream hydrocarbon revenues, and include royalties (RON 146 mn) and supplementary oil and gas taxation (RON 101 mn); 3 Include assets held for sale
62
in RON mn 2016 Q1/16 Q2/16 Q3/16 Q4/16 Q1/17
Sales 16,647 3,649 3,733 4,571 4,694 4,653
Operating Result 2
1,476 346 220 575 335 798
Operating result before depreciation 4,940 1,176 1,137 1,425 1,202 1,590
Net income (loss) 1,038 288 117 473 160 618
Net income (loss) attributable to stockholders 1,043 291 118 473 162 619
Cash flow from operating activities 4,454 888 883 1,613 1,070 1,262
Non-current assets 35,129 35,758 35,698 35,378 35,129 34,700
Current assets 3
6,285 5,088 4,904 6,029 6,285 6,900
Total liabilities 14,708 14,866 14,516 14,849 14,708 14,271
Total equity 26,706 25,980 26,085 26,558 26,706 27,329
Net debt / (cash) -237 1,366 1,261 124 -237 -872
Gearing ratio n.m. 5% 5% 0% n.m. n.m.
EPS (RON) 0.0184 0.0051 0.0021 0.0084 0.0029 0.0109
Payout ratio 81%
Dividend per share (gross, RON) 0.0150
Operating result before depreciation /CAPEX 1.92 1.53 2.00 2.98 1.58 4.51
NBR rates 2016 Q1/16 Q2/16 Q3/16 Q4/16 Q1/17
EUR/RON average 4.490 4.491 4.498 4.465 4.507 4.522
USD/RON average 4.057 4.073 3.984 3.999 4.175 4.246
EUR/RON closing 4.541 4.474 4.521 4.452 4.541 4.551
USD/RON closing 4.303 3.935 4.062 3.982 4.303 4.262

| OMV Petrom │ Capital Markets Story │ June 2017
Key operational indicators – Upstream
63
Hydrocarbon production (kboe/d) OPEX (USD/boe)
11.913.2
15.515.417.3
20132012 2014 20162015
89 88 85 83 80
9595969594
183
2012
183 174
2015
179
2014
180
2013 2016
GasOil and NGL

| OMV Petrom │ Capital Markets Story │ June 2017
Key operational indicators – Downstream
64
Refinery utilization rate (%) Refined product sales volumes (mn t)
Gas sales volumes (TWh) Net electrical output (TWh)
2012 2013
89% 88%
2014
89%
2015 2016
73%
90%
20132012 2016
4.93
2015
5.03
2014
4.815.00 5.22
50.451.447.7
52.752.2
20162014 201520132012
2.932.65
1.32
2.86
1.68
2014 2015 201620132012
| OMV Petrom │ Capital Markets Story │ June 2017
Contact Investor Relations
65
Tel: +40 372 161 930
E-mail: [email protected]
Homepage: www.omvpetrom.com
August 10: Q2 and HY 2017 results
November 9: Q3 2017 results
OMV Petrom Investor Relations
2017 Financial Calendar