Embed Size (px)
Citation preview
This version is made available in accordance with publisher policies. Please, cite only the publisher version using the citation below:
Javier Santiago, Ana Agüera, María del Mar Gómez-Ra mos, Amadeo R. Fernández Alba, Eloy García-Calvo, Robert o Rosal, Oxidation by-products and ecotoxicity assess ment during the photodegradation of fenofibric acid in aqueous solution with UV and UV/H2O2, Journal of Hazardous Materials, Volume 194, 30 October 2011, P ages 30-41, ISSN 0304-3894, 10.1016/j.jhazmat.2011.07.07 5.
Link to official URL:
http://www.sciencedirect.com/science/article/pii/S0 304389411009563
COVER PAGE
Oxidation by-products and
ecotoxicity assessment
during the
photodegradation of
fenofibric acid in aqueous
solution with UV and
UV/H2O2 J. Hazard. Mater., 194, 30-41, 2011
J. Hazard. Matter, 194, 30-41, 2011
Oxidation by-products and ecotoxicity assessment during the photodegradation of fenofibric acid in aqueous solution with UV and UV/H2O2
Javier Santiago1, Ana Agüera2, María del Mar Gómez2, Amadeo R. Fernández Alba2,3, E. García-Calvo1,3, Roberto Rosal1,3,* 1 Department of Chemical Engineering, University of Alcalá, E-28771 Alcalá de Henares, Spain. 2 Department of Analytical Chemistry, University of Almería, E-04010 Almería, Spain. 3 Advanced Study Institute of Madrid, IMDEA-Agua, Parque Científico Tecnológico, E-28805, Alcalá de Henares,
Madrid, Spain * Corresponding author: [email protected]
Abstract
The degradation of an aqueous solution of fenofibric acid was investigated using ultraviolet (UV) photolysis and UV/H2O2 with a low-pressure mercury lamp. We obtained quantum yields at different temperatures and the rate constant for the reaction of fenofibric acid with hydroxyl radicals. The maximum radical exposure per fluence ratio obtained was 1.4 x 10⁻¹⁰ M L-1 mW-1. Several reaction intermediates were detected by means of exact mass measurements performed by liquid chromatography coupled to quadrupole-time-of-flight mass spectrometry (LC-ESI-QTOF-MS). UV and UV/H2O2 pathways involve the decarboxylation of fenofibric acid to 4-chloro-4'-(1-hydroxy-1-methylethyl)benzophenone and other minor products, predominantly chlorinated aromatics. We detected several intermediates from reactions with hydroxyl radicals and some lower molecular weight products from the scission of the carbonyl carbon-to-aromatic-carbon bond. We recorded high toxicity in UV irradiated samples for the growth of Pseudokirchneriella subcapitata even after the total depletion of fenofibric acid; this was probably due to the presence of chlorinated aromatics. A degree of toxicity reappeared in highly irradiated UV/H2O2 samples, probably because of the formation of ring-opening products. The degree of mineralization was closely related to that of dechlorination and reached values of over 50% after 3-4 min before stabilizing thereafter.
Keywords: Fenofibric acid; UV photolysis; UV/H2O2; toxic by-products; liquid chromatography; mass spectrometry.
1. Introduction
Fenofibric acid, 2-[4-(4-Chlorobenzoyl)phenoxy]-2-methylpropanoic acid, is the active form of fenofibrate, a drug prescribed to reduce plasma triglycerides. Although its use is not widespread, it has often been encountered in wastewater treatment plants (WWTP). Rosal et al. [1] reported very low removal efficiency for fenofibric acid in a conventional WWTP located in Madrid with an average annual concentration of 79 ng/L. Stump et al. [2] obtained concentrations of up to 500 ng/L in the influent of several Brazilian WWTP and calculated a removal efficiency of 45% for conventional activated sludge treatment. Ternes et al. [3] reported the occurrence of 130 ng/L of fenofibric acid in the effluent of a German WWTP. Acero et al. [4] found 180 ng/L in the effluent of a WWTP located in Madrid. Fenofibric acid attracts particular attention due to its high toxicity for several aquatic microorganisms [5]. An additional reason for concern is that fenofibric acid and other pharmaceuticals are released in increasing quantities in complex mixtures. Recently, Rodea-Palomares et al. [6] and Rosal et al. [7] used the combination index-isobologram method and reported a synergistic behaviour for fenofibric acid in mixtures involving wastewater.
Advanced oxidation processes (AOP) are effective technologies for the removal of organic pollutants in wastewater. UV-based AOP have the advantage of using
a fully commercialized technology due to the widespread use of UV systems for disinfection [8]. A drawback of these processes is the formation of oxidation by-products [9]. Over the last few years, it has been shown that the formation of by-products with enhanced toxicity for non-target organisms usually takes place at least under conditions of moderate carbon removal [10, 11]. The identification of unknown transformation products is not an easy task. Liquid chromatography-mass spectrometry (LC-MS) combined with a new generation of high sensitivity MS systems provides abundant structural information for the elucidation of chemical structures. The objective of this work was to study the removal of fenofibric acid using UV and UV/H2O2 photolysis. We identified oxidation intermediates in order to propose a reaction pathway for the early oxidation stages. We also measured the ecotoxicity of partially oxidized mixtures.
2. Materials and methods
2.1. Reagents
Fenofibric acid was produced from fenofibrate (Sigma Aldrich, +99% purity) as indicated elsewhere [5]. The product’s purity was over 97%, as evaluated by high-performance liquid chromatography (HPLC). Pure water was obtained from a Milipore Mili-Q system with a resistivity of at least 18 MΩ cm at 298 K and a Millipore 0.22 micron Millipak Express filter (Billerica, MA).
J. Hazard. Matter, 194, 30-41, 2011
Hydrogen peroxide, sodium phosphate monobasic dihydrate and sodium hydrogen phosphate, sodium hydroxide and hydrochloric acid were analytical grade reagents used as received. p-chlorobenzoic acid (pCBA), atrazine and 2,9-dimethyl-1,10-phenanthroline (DMP) were purchased from Sigma Aldrich (+99% purity).
2.2. Analytical methods
Total organic carbon (TOC) was determined using a Shimadzu TOC-VCSH analyzer. Chlorine was determined using a Dionex DX120 Ion Chromatograph with a conductivity detector and an IonPac AS9-HC 4 mm × 250 mm analytical column with ASRS-Ultra suppressor. The eluent was 9.0mM Na2CO3 flowing at 1.0mL/min. The determination of extinction coefficients and colorimetric analyses was performed in a Shimadzu UV-1800 spectrophotometer. The analyses of fenofibric acid, pCBA and atrazine were performed by HPLC using an Agilent 1200 apparatus equipped with a a reversed phase Kromasil 5u 100A C18 analytical column. The mobile phase (flow rate 1 mL/min) was a mixture of water containing 4 mL/L of orthophosphoric acid and 50 mL/L of methanol and acetonitrile in a proportion of 40:60 for pCBA separation and 50:50 for atrazine and fenofibric acid. UV detection was carried out at 280 nm and 228 nm for fenofibric acid, and atrazine and pCBA respectively. The volume injected was 50 µL in all cases. Hydrogen peroxide was measured using the colorimetric methods of Eisenberg [12] and Baga et al. [13].
A liquid chromatography-electrospray ionization-quadrupole-time-of-flight mass spectrometry (LC-ESI-QTOF-MS) system, in positive and negative mode, was used to identify the transformation products in the samples. Samples collected at different irradiation times during the experiments were directly analyzed in the LC-TOF-MS system, without previous pre-concentration. The analytes were separated using a HPLC system (vacuum degasser, autosampler and a binary pump Agilent Series 1200, Agilent Technologies) equipped with a reversed-phase XDB-C18 analytical column of 4.6 x 50 mm, 1.8 µm particle size (Agilent Technologies). 0.1% formic acid and 5% MiliQ water in acetonitrile was used as mobile phase A and 0.1% formic acid in water (pH 3.5) as mobile phase B. The elution gradient went from 10% A (3 min) to 100% A in 22 min, and was kept at 100% A for 3 min. The flow rate was 0.5 mL/min and the injection volume 20 µL. The HPLC system was connected to a quadrupole-time-of-flight mass spectrometer (Agilent 6530 Q-TOF MS, Agilent Technologies, Santa Clara, CA). The instrument was operated in the 4GHz High Resolution Mode. Ions were generated using an electrospray ion source with Agilent Jet Stream Technology. The operation conditions were: superheated nitrogen sheath gas temperature (400ºC) at flow rate (12 L/min), nozzle voltage (0 V), capillary, 4000 V; nebulizer, 60 psi; drying gas, 5 L/min; gas temperature, 250 ºC; skimmer voltage, 65 V; octapoleRFPeak, 750 V; fragmentor (in source CID fragmentation), 90V. The mass axis was calibrated using
the mixture provided by the manufacturer over the m/z 40-3200 range. A second sprayer with a reference solution was used for continuous calibration in positive ion using the following reference masses: 121.0509 and 922.0098 m/z (resolution: 21700 ± 500 at 922.0098 m/z), and in negative ion using the reference masses: 112.9856 and 966.0007. MS/MS spectra were acquired over the m/z 40-950 range at a scan rate of 0.5 second per spectrum. The collision energy was optimized to obtain the highest number of fragments. The full mass spectra data recorded were processed with Agilent MassHunter Workstation Software (version B.02.00).
2.3. Toxicity test and data analysis
The toxicities of fenofibric acid degradations by UV and UV/H2O2 treatments were evaluated in accordance with the algal growth inhibition test described in OECD TG 201 and using the Pseudokirchneriella subcapitata open system. Prior to the test, hydrogen peroxide was removed using 4 µL of catalase solution 5000 mg/L (3691 U/mg bovine liver from Sigma-Aldrich) per 1 mL of sample. Cultures were made in OECD growth medium at pH 8.0 ± 0.2. Algal cells were first cultured in 25 mL agitated flasks, in which growth was evaluated by cell counting. The prescribed amount of cells were then transferred to 96-well clear disposable microplates and exposed to pollutants during the logarithmic growth phase. The total volume occupied was 200 µL, each well containing 100 µL of sample and 100 µL of OECD growth medium. The microplates were placed in an algal growth chamber under continuous fluorescent illumination (approximately 100 µE m2 s-1), and incubated at 22 ± 1 °C. The cell density was measured using an electronic particle counter (Coulter Counter Z2). The settings were: upper size limit, 8.0 µm; lower size limit, 2.5 µm; metered volume, 0.5 mL; aperture size, 50 µm. The tests were carried out with duplicate samples for each day of measurement and samples were taken at 24-hour intervals over 72 hours. Specific growth rates were calculated for each sample and treatment in order to obtain the inhibition percentage. EC50 value and 95% confidence limits for fenofibric acid were calculated using the concentration – inhibition relationship established by the logistic equation.
2.4. Experimental setup and procedure
Irradiation experiments were performed in a Heraeus 700 mL reactor equipped with a 15W Heraeus Noblelight TNN 15/32 low-pressure mercury vapour lamp emitting at 254 nm with a secondary peak at 185 nm. The inner and outer radiuses were 2.4 and 4.5 cm respectively and the height of irradiated solution was 17 cm. The reactor was covered with black paper to avoid any reflection and in order to maintain a constant temperature; the lamp was fitted in a quartz cooling tube refrigerated by means of a Huber Polystat cc2 thermostatic regulator. pH was kept constant using a 4 mM phosphate buffer; pH was monitored periodically to ensure a constant value within ±0.1 units. The experiments were carried out in batch
J. Hazard. Matter, 194, 30-41, 2011
mode and samples were withdrawn for analysis at set intervals.
Hydrogen peroxide actinometry experiments were performed to determine fluence rate. With respect to the annular geometry of the photoreactor, we assumed a linear source with emission in planes parallel to the lamp axis (LSPP). In this model the lamp is viewed as a consecutive line of points, each emitting radiation radially in all directions. The equation for the fluence rate is:
( ) ( )'
' or Ro oE RE r e
r− −= µ (1)
where µ is the attenuation coefficient, Ro the radius of the
internal wall of the photoreactor and 'oE the fluence rate
at Ro expressed in mW cm-2. By applying the LSPP model to the UV photolysis of hydrogen peroxide at high concentration, the exponent becomes negligible and the rate of hydrogen peroxide photolysis allows the fluence rate to be determined at the internal wall of the
photoreactor, 'oE :
2 2
2 2
'2H O o oH O
d c R L E
d t V− = Φ π
(2)
The total hydrogen peroxide quantum yield, 2 2H OΦ , was
considered to be 1 mol E-1 at 254 nm [14]. Using 0.05 M of H2O2, we determined that the fluence rate was 18.73 ± 0.23 mW cm-2. For a low attenuation coefficient, the photolytic decomposition of hydrogen peroxide follows a first order rate equation where
2 2H Oε is the molar
extinction coefficient of hydrogen peroxide at 254 nm:
( )2 2 2 2
2 2
'
1
22.303H O o o H O
o H O
d c R L ER R c
d t V− = −
π ε (3)
From experiments at 10-4 M of H2O2, we obtained an effective path of radiation through the reactor of 2.37 ± 0.07 cm, essentially coincident with the physical value of R1 – Ro. More details concerning equations and experimental procedure can be found elsewhere [15].
3. Results and discussion
3.1. UV photolysis
The molar extinction coefficient of fenofibric acid at pH 6.5 and 254 nm was 9199 ± 150 M-1 cm-1, a value that we did not find elsewhere. As for hydrogen peroxide, atrazine and pCBA, we measured 19.3 ± 0.3, 3768 ± 55 and 2760 ± 94 M-1cm-1 respectively, in agreement with previously reported extinction coefficients [8, 16, 17]. The photolysis rate of a single target compound at an arbitrary concentration level is given by:
( )1
'21 oR Ro oA
A
R L Ed ce
d t V− − − = Φ −
µπ (4)
At high concentrations of the absorbing compound, the integration of the former equation yields the following zero order kinetics:
( )'2 o o
A Ao A
R L Ec t c t
V= − Φ π
(5)
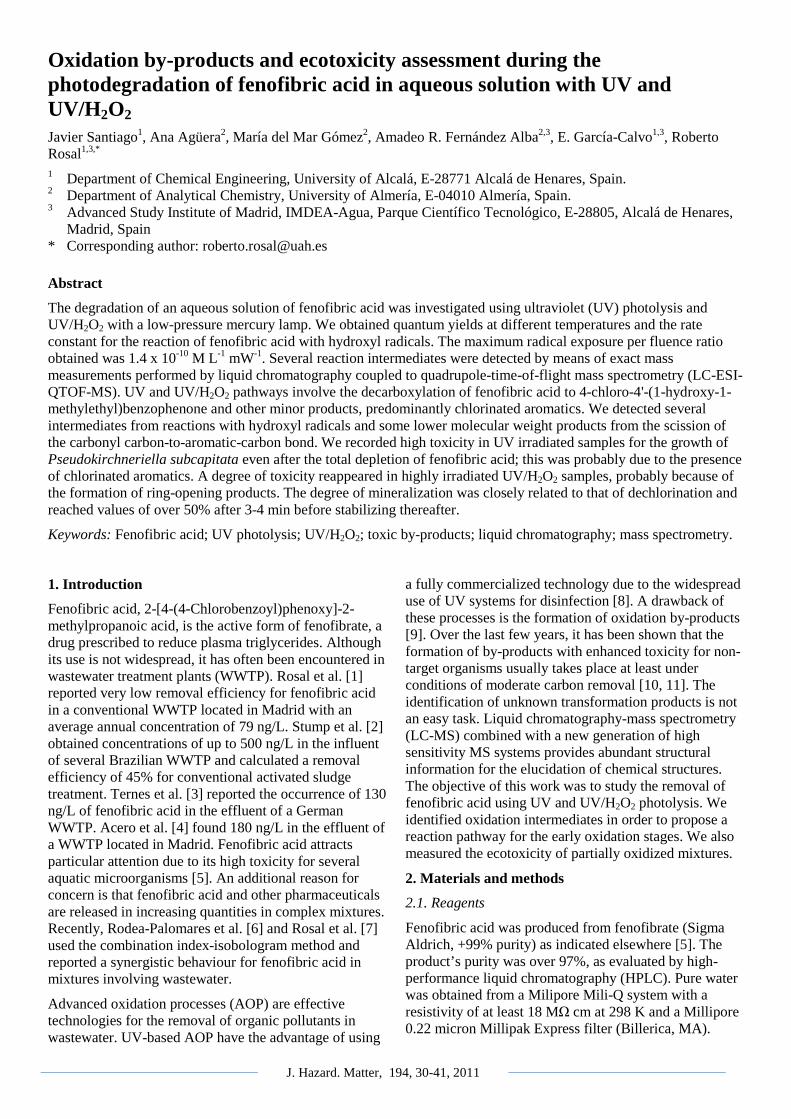
Fig. 1 shows the data corresponding to a photolytic decomposition of fenofibric acid. The inset represents a plot of Eq. 5 during the period in which 2.303 εA cA (R1 - Ro) > 2, which is its conventional validity condition. We obtained quantum yields for fenofibric acid at 15ºC (0.039 ± 0.003 mol E-1), 25ºC (0.065 ± 0.003 mol E-1) and 35ºC (0.088 ± 0.002 mol E-1). These data correspond to an activation energy for the photolysis rate of 21.5 ± 8.6 kJ mol-1. The same values for the photolysis of atrazine were 0.040 ± 0.003 mol E-1 at 15ºC, 0.053 ± 0.002 mol E-1 at 25ºC and 0.055 ± 0.001 mol E-1 at 35ºC with an activation energy of 11.9 ± 4.7 kJ mol-1. The values found for atrazine were in good agreement with previously reported data [18]. However, the only value found for the quantum yield of fenofibric acid, reported by Miranda et al. [19], is considerably higher, ~ 0.6 mol E-1, a discrepancy that may be attributed to the different wavelength used (355 nm).
3.2. Kinetics of UV/H2O2 process
The radical exposure per fluence ratio due to the irradiation, ROH,UV, and the stationary-state concentration of HO radicals was determined according to the method proposed by Rosenfeldt and Linden [20]:
, '
t
HOoOH UV
o
C dtR
E t
•
= ∫ (6)
Following Rosenfeldt et al. [21], we used pCBA as the radical probe compound for determining HO exposure. The rate of depletion of pCBA by the UV/H2O2 process is given by the following equation in which FpCBA is the fraction of total radiation absorbed by pCBA:
( ), ,pCBA
pCBA d pCBA HO pCBA HO pCBA
dcF k k c c
d t • •− = +
(7)
Integrating Eq. 7 gives the following expression:
,,ln pCBA o
pCBA d pCBA HOpCBA
cF k t c dt
c •= + ∫ (8)
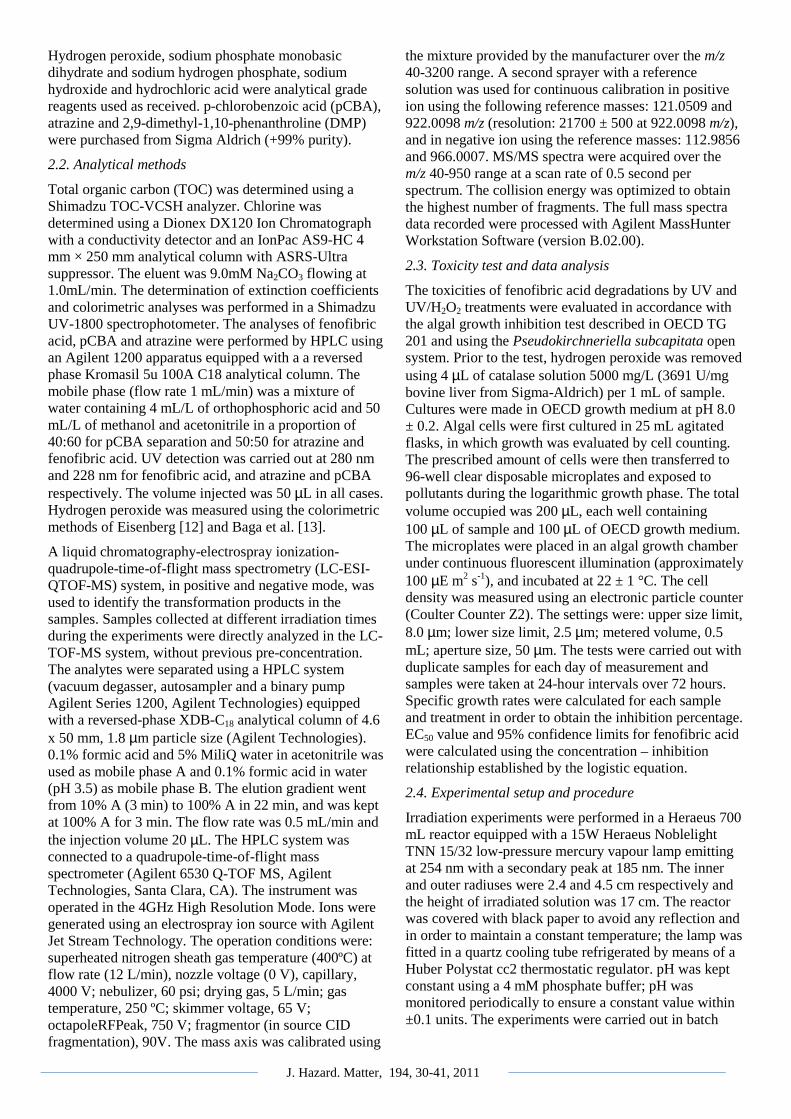
The combination of Eqs. 6-8 allowed ROH,UV to be calculated under different reaction conditions. The results, shown in Fig. 2, indicated that ROH,UV was strongly dependent on the presence of hydrogen peroxide, with values of up to 6 x 10-13 M cm2 mW-1 at a plateau reached at about 50 mg/L H2O2. These values bear comparison with those for HO radical availability obtained by Rosenfeld et al. [21] during the irradiation of water from several Swiss lakes; that is to say, volume-based ROH,UV in the 1-4 x 10-13 M L-1 mW-1 range for 10
J. Hazard. Matter, 194, 30-41, 2011
mg/L H2O2 under low-pressure mercury vapour irradiation. In our work, we measured 5.7 x 10⁻¹¹ M L-1 mW-1 which dropped to 1.8 x 10⁻¹¹ M L-1 mW-1 in the presence of 10 mg/L of fenofibric acid. This difference reflects the presence of radical scavengers and UV absorbers in natural water. The inset in Fig. 2 shows the oxidation profiles of pCBA without H2O2 and in the presence of 10, 50 and 100 mg/L H2O2. Above 200 mg/L, the radical exposure per fluence ratio starts to decline as a consequence of the well-known effect of overdosing hydrogen peroxide, which reacts with HO to form hydroperoxyl radicals.
The photolysis rate given by Eq. 3 also holds when two or more compounds are simultaneously photodegraded [17]. In this case, the rate expressions for a given couple of solutes can be written in the form of competitive kinetics:
( ) ( ), ,,
, ,,
ln lnA o B oHO AA d A B d B
A HO B B
c ckF k t F k t
c t k c t•
•
− = −
(9)
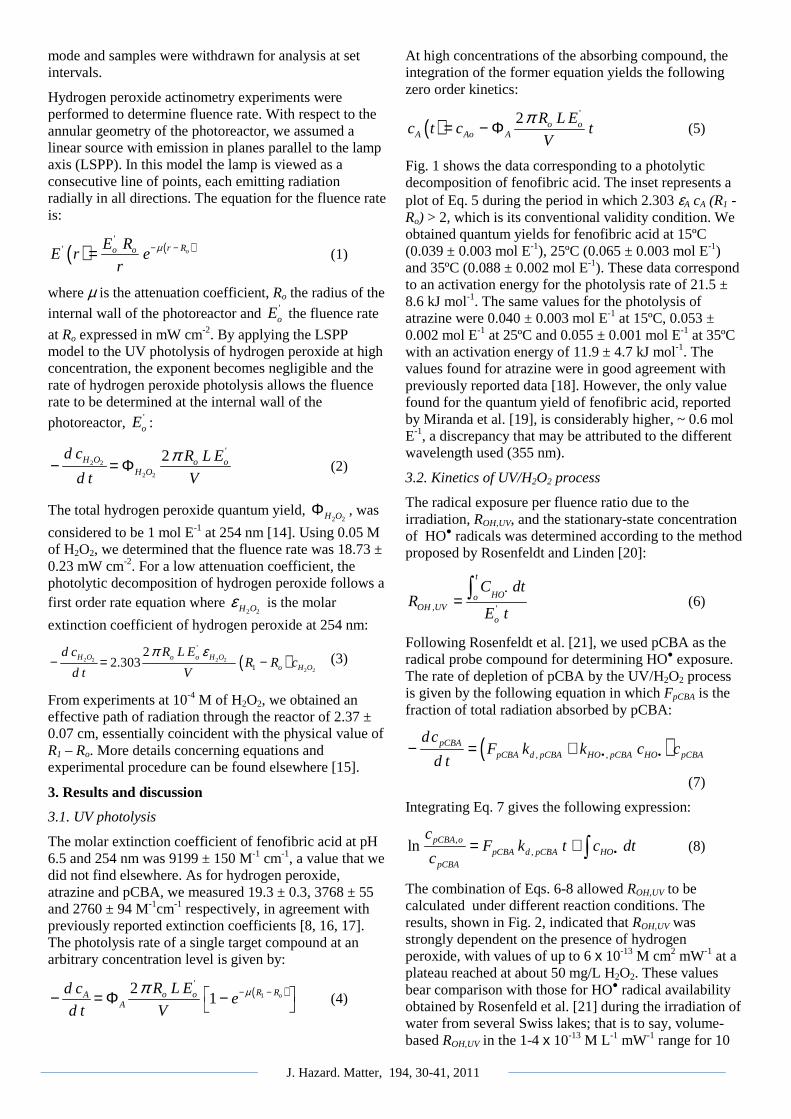
The data plotted in Fig.3 correspond to the irradiation of a mixture of fenofibric acid and atrazine using 50, 100 and 200 mg/L H2O2. The reason for using atrazine instead of pCBA is that the latter is also a product of the photodegradation of fenofibric acid, as indicated below. The slope of the plot shown in Fig. 3 allowed the second order rate constant for the reaction of fenofibric acid with hydroxyl radicals to be determined. To do so, we used the value of Balci et al. [22] for the rate constant of atrazine with hydroxyl radicals, which is the only value available that indicates uncertainty. The rate constant for the oxidation of fenofibric acid with HO was (5.56 ± 0.22) x 109 M-1 s-1, a value close to that obtained before in ozonation runs [23]. By performing runs at different pH in the 5.5-7.5 interval, we could also determine that the rate constant for the oxidation of fenofibric acid did not depend on pH, with deviations from the mean not exceeding 5%, while there was almost complete overlapping of confidence intervals. In UV/H2O2 runs performed at free pH in the absence of any buffer we noted a continuous trend towards acidification, while in UV photolytic experiments pH increased slightly during the first 2-4 min of irradiation before decreasing thereafter. This behaviour was attributed to the formation of acidic compounds due to the oxidation of intermediates by hydroxyl radicals or other oxidizing species formed during the process.
3.3. Identification of reaction intermediates and reaction pathway
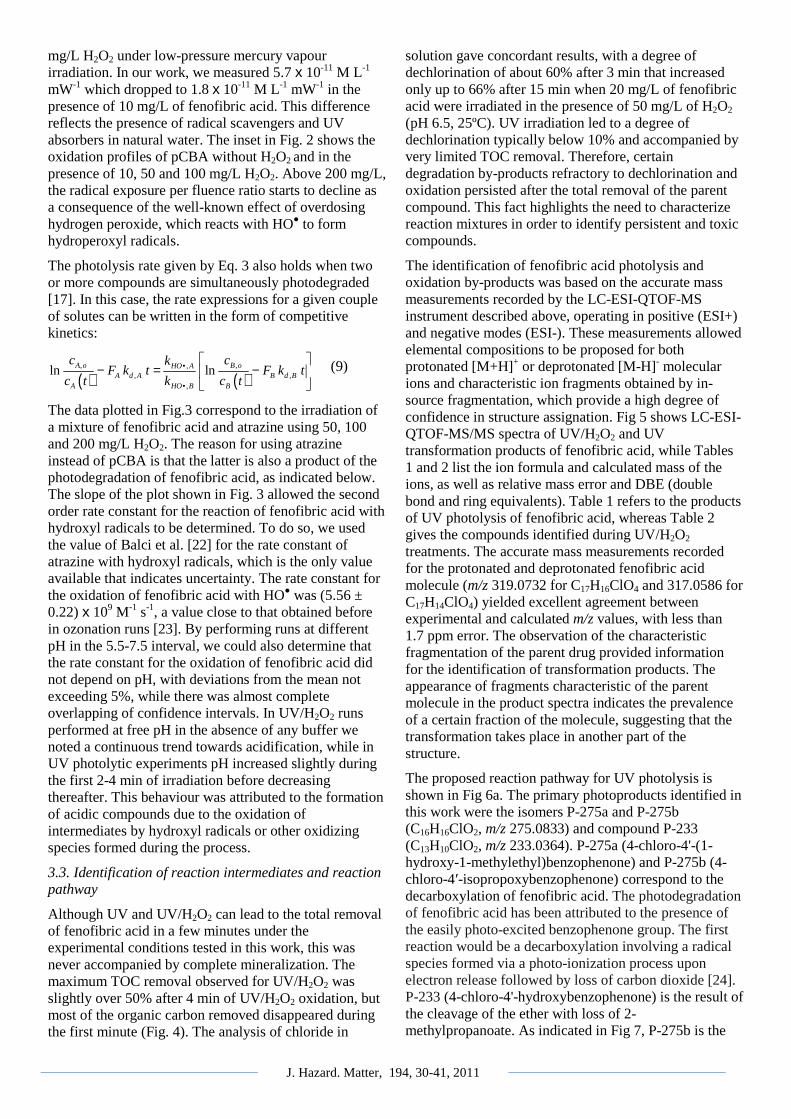
Although UV and UV/H2O2 can lead to the total removal of fenofibric acid in a few minutes under the experimental conditions tested in this work, this was never accompanied by complete mineralization. The maximum TOC removal observed for UV/H2O2 was slightly over 50% after 4 min of UV/H2O2 oxidation, but most of the organic carbon removed disappeared during the first minute (Fig. 4). The analysis of chloride in
solution gave concordant results, with a degree of dechlorination of about 60% after 3 min that increased only up to 66% after 15 min when 20 mg/L of fenofibric acid were irradiated in the presence of 50 mg/L of H2O2 (pH 6.5, 25ºC). UV irradiation led to a degree of dechlorination typically below 10% and accompanied by very limited TOC removal. Therefore, certain degradation by-products refractory to dechlorination and oxidation persisted after the total removal of the parent compound. This fact highlights the need to characterize reaction mixtures in order to identify persistent and toxic compounds.
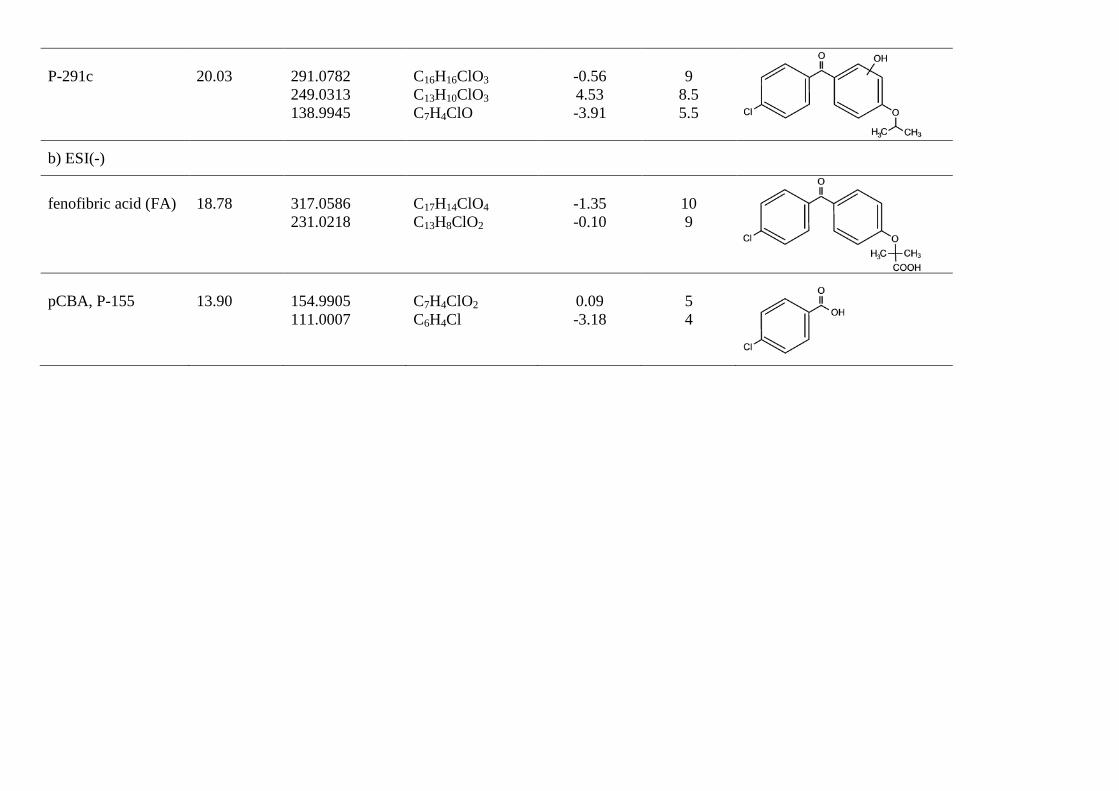
The identification of fenofibric acid photolysis and oxidation by-products was based on the accurate mass measurements recorded by the LC-ESI-QTOF-MS instrument described above, operating in positive (ESI+) and negative modes (ESI-). These measurements allowed elemental compositions to be proposed for both protonated [M+H]+ or deprotonated [M-H]- molecular ions and characteristic ion fragments obtained by in-source fragmentation, which provide a high degree of confidence in structure assignation. Fig 5 shows LC-ESI-QTOF-MS/MS spectra of UV/H2O2 and UV transformation products of fenofibric acid, while Tables 1 and 2 list the ion formula and calculated mass of the ions, as well as relative mass error and DBE (double bond and ring equivalents). Table 1 refers to the products of UV photolysis of fenofibric acid, whereas Table 2 gives the compounds identified during UV/H2O2 treatments. The accurate mass measurements recorded for the protonated and deprotonated fenofibric acid molecule (m/z 319.0732 for C17H16ClO4 and 317.0586 for C17H14ClO4) yielded excellent agreement between experimental and calculated m/z values, with less than 1.7 ppm error. The observation of the characteristic fragmentation of the parent drug provided information for the identification of transformation products. The appearance of fragments characteristic of the parent molecule in the product spectra indicates the prevalence of a certain fraction of the molecule, suggesting that the transformation takes place in another part of the structure.
The proposed reaction pathway for UV photolysis is shown in Fig 6a. The primary photoproducts identified in this work were the isomers P-275a and P-275b (C16H16ClO2, m/z 275.0833) and compound P-233 (C13H10ClO2, m/z 233.0364). P-275a (4-chloro-4'-(1-hydroxy-1-methylethyl)benzophenone) and P-275b (4-chloro-4′-isopropoxybenzophenone) correspond to the decarboxylation of fenofibric acid. The photodegradation of fenofibric acid has been attributed to the presence of the easily photo-excited benzophenone group. The first reaction would be a decarboxylation involving a radical species formed via a photo-ionization process upon electron release followed by loss of carbon dioxide [24]. P-233 (4-chloro-4'-hydroxybenzophenone) is the result of the cleavage of the ether with loss of 2-methylpropanoate. As indicated in Fig 7, P-275b is the
J. Hazard. Matter, 194, 30-41, 2011
major identified photoproduct in irradiated mixtures, with minor amounts of P-233 and P-291a. These primary photoproducts agree with those found previously by Cosa [25], who reported that the excitation of the carboxylate form of fenofibric acid in aqueous buffer at pH 7.4 generates an excited state that decarboxylates to produce a transient biradical intermediate (BRI in Fig. 6). This intermediate undergoes intersystem crossing and protonation to yield two products, also identified in this work as P-275a and P-275b. Boscá and Miranda [26] used laser flash photolysis at 355 nm to study the photodegradation of fenofibric acid. They found the same photoproducts, with similar concentrations of both isomers (P-275a and P-275b). They also encountered P-233, which was attributed to oxygen trapping by an excited state of fenofibric acid or BRI, the later being the option displayed in Fig. 6a. In agitated runs under air, the concentration of dissolved oxygen was typically in the 7-8 mg/L range at 25ºC. We also detected P-291a, which is probably the consequence of the uptake of oxygen by BRI.
In this work we were also able to detect several reaction products derived from fenofibric acid or its primary products with hydroxyl radicals. The most significant was pCBA (P-155), detected in negative ESI ionization mode (C7H4ClO2, m/z 154.9905), whose ion fragment C6H4Cl (m/z 111.0007) revealed a non-substituted aromatic moiety. pCBA could be a product of the reaction of HO radicals with fenofibric acid and also with photoproducts P-291a, P-291c, P-275a, P-275b or P-233. For the sake of clarity and to stress the fact that we did not find hydroxylated forms of pCBA, we have only included the first possibility in Fig. 6a. The presence of intermediates giving evidence of the hydroxylation of aromatic rings can be explained by the vacuum ultraviolet (VUV) irradiation of low-pressure mercury lamps at 185 nm (about 5% of the total power for the lamp used in this work). The greater effectiveness of VUV irradiation is a consequence of the formation of hydroxyl radicals via the photolysis of water at 185 nm [27]. It is well-known that 185 nm VUV may also produce ozone from dissolved oxygen. We detected small amounts of dissolved ozone but we did not find any reaction product that could be associated with ozone such as ring-opening by ozone cycloaddition [10].
Fig. 6b shows the proposed pathway for the UV/H2O2 oxidation of fenofibric acid. The details concerning the identification and structure proposal are given in Table 2. The intermediates observed during the photolytic experiments were also identified in UV/H2O2 samples. These are compounds P291a, P275a, P275b and P-233, coincident with those indicated before, and two additional intermediates derived from fenofibric acid, P-335 (C17H16ClO5, m/z 335.0681) and P-351 (C17H16ClO6, m/z 351.0630), the elemental composition of which, containing one and two HO groups more than fenofibric acid and without alteration of DBE, corresponded to hydroxylated derivatives. No exact position for hydroxyl
groups can be proposed from the fragmentation pattern (Table 2). A similar couple of hydroxylation derivatives could be attributed to HO attack on P-233, namely P-249a and P249b. In this case, the fragmentation allowed the hydroxylated ring to be identified. The hydroxylation products from P275b also coincided with those encountered in photolytic runs plus compound P-257 (C16H17O3, m/z 257.1172), the only one identified with the loss of the original chlorine atom. Similar reasoning was applied to the identification of P-307 (C16H16ClO4, m/z 307.0732), a product of HO attack on P-291a. In ESI-, we detected four additional intermediates, the most abundant of which was pCBA. In this case, we were able to detect the other fragment from the scission of the carbonyl carbon to aromatic carbon bond, P-195 (C10H11O4, m/z 195.0663) and the symmetric product P-223 (C11H11O5, m/z 223.0612). Another minor product, P-213 (C9H6ClO4, m/z 212.9960), was probably the consequence of the hydroxyl attack and ring opening of fenofibric acid, but it could also be a product of any of the chlorine-containing compound with two aromatic rings listed in Table 2.
3.4. Toxicity of partially oxidized mixtures
Fig. 7 shows the growth inhibition of Pseudokirchneriella subcapitata when exposed to fenofibric acid and partially irradiated or oxidized mixtures as a function of the duration of treatment. The median effect value for the toxicity of fenofibric acid was 7.90 ± 1.61 mg/L, where the boundaries represent 95% confidence intervals. The value was obtained by fitting dose-response data to a logistic function. The results showed that toxicity decreased slightly during the first minute under UV and UV/H2O2, but reached a plateau for UV runs with a maximum at about six minutes. Besides, growth inhibition remained in the 20-40% range after the first minute and throughout the run. UV/H2O2 oxidation, on the other hand, allowed toxicity to be eliminated completely at about 4 min. After that, we observed a new increase in toxicity with a relative maximum somewhat in advance of that found in irradiation runs. The bars represent standard deviations for four replicated runs. This behaviour was attributed to a balance between the disappearance of the relatively toxic parent compound and the formation of toxic products. Cosa [25] used molecular a priori analysis based on excited-state lifetimes and singlet oxygen sensitization to predict that the phototoxicity of irradiation products from fenofibric acid should be attributed to P-275a. We found, however, that P-275a was a very minor compound in all reaction mixtures, P-275b being the most abundant intermediate product in all cases. Fig 7 shows the chromatographic areas corresponding to the compounds identified in Tables 1 and 2 by lumping certain minor products into a pseudo-component A. The data show that the toxicity of irradiated samples and the recovery of toxicity at higher reaction times in the case of UV/H2O2 runs cannot be attributed to the formation or accumulation of a single compound, but are most probably the result of the
J. Hazard. Matter, 194, 30-41, 2011
production of several compounds with a similar chemical structure and toxicity. Is it noteworthy that most intermediates from both UV and UV/H2O2 processes retained the chlorine atom and that the reduction of dissolved organic carbon was closely related to the extent of dechlorination. The higher toxicity of the UV irradiated mixtures was most probably the consequence of the presence of a higher concentration of chlorinated aromatics. The increase of toxicity observed in UV/H2O2 runs at high irradiation times was probably the consequence of the formation of ring-opening products, a kind of compound previously associated with high toxicity in partially oxidized mixtures [10].
4. Conclusions
The degradation of an aqueous solution of fenofibric acid using UV photolysis and UV/H2O2 led to the complete depletion of fenofibric acid for volume-based UV doses typically below 1 J cm-3. Quantum yields for fenofibric acid ranged from 0.039 ± 0.003 mol E-1 (15ºC) to 0.088 ± 0.002 mol E-1 (35ºC) with a photolytic activation energy of 21.5 ± 8.6 kJ mol-1. The radical exposure per fluence ratio, ROH,UV, was measured using pCBA as probe compound and reached a plateau of about 6 x 10-13 M cm2 L mW-1 at about 50 mg/L H2O2, before declining thereafter due to the hydroxyl radical scavenger role played by H2O2 at high concentration. The presence of fenofibric acid, a compound with intense UV absorption, decreased ROH,UV considerably. Using competitive kinetics with atrazine, we obtained a second order rate constant of (5.56 ± 0.22) x 109 M-1 s-1 for the reaction of fenofibric acid with hydroxyl radicals.
UV photolysis led to a low extent of dechlorination and mineralization reactions, typically below 10%. The maximum TOC removal observed for UV/H2O2 was slightly over 50% after 4 min of reaction with most of the organic carbon being removed during the first minute. The absence of complete mineralization resulted in the accumulation of oxidation by-products identified using LC-ESI-QTOF-MS. Exact mass measurements allowed reaction pathways to be proposed for UV and UV/H2O2 that start with the decarboxylation of fenofibric acid before yielding 4-chloro-4'-(1-hydroxy-1-methylethyl)benzophenone and other minor products, predominantly chlorinated. We were also able to detect several intermediates from the reactions of primary products with hydroxyl radicals which, in the case of UV photolysis, were produced by the 185 nm ozone-forming emission of low-pressure mercury lamp. Some additional minor products were detected in ESI negative mode and corresponded to the scission of the carbonyl carbon to the aromatic carbon bond, the most abundant of which was pCBA.
We determined that the toxicity of UV irradiated samples for the 72 h growth of Pseudokirchneriella subcapitata was high even after the total depletion of fenofibric acid. This was attributed to the chlorinated aromatic products that dominated reaction mixtures at intermediate reaction
times. There were low values for the toxicity of UV/H2O2 treated samples in which fenofibric acid was completely depleted. However, a degree of toxicity reappeared in highly irradiated mixtures, probably as a consequence of chlorinated reaction products.
Acknowledgements
This work has been financed by Spain's Ministry of Education (CSD2006-00044 and CTM2005-03080/TECNO) and the Dirección General de Universidades e Investigación de la Comunidad de Madrid, Research network 0505/AMB-0395. One of the authors, J.S., thanks the Spanish Ministry of Education for the award of an FPU grant.
References [1] R. Rosal, A. Rodríguez, J.A. Perdigón-Melón, A. Petre,
E. García-Calvo, M.J. Gómez, A. Agüera, A.R. Fernández-Alba, Occurrence of emerging pollutants in urban wastewater and their removal through biological treatment followed by ozonation, Water Res. 44 (2010) 578–588.
[2] M. Stumpf, T.A. Ternes, R.D. Wilken, S.V. Rodrigues, W. Baumann, Polar drug residues in sewage and natural waters in the state of Rio de Janeiro, Brazil, Sci. Total Environ. 225 (1999) 135–141.
[3] T.A. Ternes, J. Stüber, N. Herrmann, D. McDowell, A. Ried, M. Kampmann, B. Teiser, Ozonation: a tool for removal of pharmaceuticals, contrast media and musk fragrances from wastewater? Water Res. 37 (2003) 1976–1982.
[4] J.L. Acero, F.J. Benitez, A.I. Leal, F.J. Real, F. Teva, Membrane filtration technologies applied to municipal secondary effluents for potential reuse, J. Hazard. Mater. 177 (2010) 390–398.
[5] R. Rosal, I. Rodea-Palomares K. Boltes, F. Fernández-Piñas, F. Leganés, S. Gonzalo, A. Petre, Ecotoxicity assessment of lipid regulators in water and biologically treated wastewater using three aquatic organisms, Environ. Sci. Pollut. Res. 17 (2010) 135−144.
[6] I. Rodea-Palomares, A. Petre, K. Boltes, F. Leganés, J.A. Perdigón-Melón, R. Rosal, F. Fernández-Piñas, Application of the combination index (CI)–isobologram equation to study the toxicological interactions of lipid regulators in two aquatic bioluminescent organisms. Water Res. 44 (2010) 427–438.
[7] R. Rosal, I. Rodea-Palomares1, K. Boltes, F. Fernández-Piñas, F. Leganés, A. Petre, Ecotoxicological assessment of surfactants in the aquatic environment: combined toxicity of docusate sodium with chlorinated pollutants, Chemosphere 81(2010) 288–193.
[8] M.I. Litter, Introduction to photochemical advanced oxidation processes for water treatment, in: P. Boule, D.W. Bahnemann, P.K.J. Robertson (Ed.), The Handbook of Environmental Chemistry, Vol. 2, Part M, Environmental Photochemistry Part II, Springer-Verlag, Berlin Heidelberg, 2005, pp. 325–366.
[9] B. Legube, Formation of ozonation by-products, in: A. Nikolay (Ed.) The Handbook of Environmental Chemistry, vol. 5, Part G, Haloforms and Related Compounds in Drinking Water, Springer: Berlin 2003, pp. 95–116.
J. Hazard. Matter, 194, 30-41, 2011
[10] R. Rosal, M.S. Gonzalo, K. Boltes, P. Letón, J.J. Vaquero, E. García-Calvo, Identification of intermediates and ecotoxicity assessment of the oxidation products generated during the ozonation of clofibric acid, J. Hazard. Mater. 172 (2009) 1061–1068.
[11] J.J. López, M. Sánchez-Polo, C.V. Gómez-Pacheco, J. Rivera-Utrilla, Photodegradation of tetracyclines in aqueous solution by using UV and UV/H2O2 oxidation processes, J. Chem. Tech. Biotechnol. 85 (2010) 1325–1333.
[12] G. Eisenberg, Colorimetric determination of hydrogen peroxide, Ind. Eng. Chem. Anal. Ed. 15 (1943) 327–328.
[13] A.N. Baga, G.R.A. Johnson, N.B. Nazhat, R.A. Saadalla-Nazhat, A Simple Spectrophotometric Determination of Hydrogen Peroxide at Low Concentrations in Aqueous Solution, Anal. Chim. Acta 204 (1988) 349–353.
[14] I. Nicole, J. de Laat, M. Dore, J.P. Duguet, C. Bonnel, Use of UV radiation in water treatment: measurement of photonic flux by hydrogen peroxide actinometry, Water Res. 24 (1990) 157–168.
[15] F.J. Beltrán, M. González, F.J. Rivas, J. Jaramillo, Application of photochemical reactor models to UV irradiation of trichloroethylene in water, Chemosphere 31 (1995) 2873–2885.
[16] J.R. Bolton, M.I. Stefan, Fundamental photochemical approach to the concepts of fluence (UV dose) and electrical energy efficiency in photochemical degradation reactions, Res. Chem. Intermed. 28 (2002) 857–870.
[17] F.J. Benítez, J.L. Acero, F.J. Real, C. Maya, Modeling of photooxidation of acetamide herbicides in natural waters by UV radiation and the combinations UV/H2O2 and UV/O3, J. Chem. Technol. Biotechnol. 79 (2004) 987–997.
[18] F.J. Beltrán, G. Ovejero, B. Acedo, Oxidation of atrazine in water by ultraviolet radiation combined with hydrogen peroxide, Water Res. 27 (1993) 1013–1021.
[19] M.A. Miranda, F. Bosca, F. Vargas, N. Canudas, Unusual (1, 2) Wittig rearrangement of a carbanion generated in neutral aqueous-medium by photodecarboxylation of a phenoxyacetic acid analogue. J. Photochem. Photobiol. A Chem. 78 (1994) 149–151.
[20] E.J. Rosenfeldt, K.G. Linden, The ROH,UV concept to characterize and model UV/H2O2 processes in natural waters. IUVA 2005: Third International Congress on Ultraviolet Technologies, Whistler, British Columbia, May 24–27, 2005.
[21] E.J. Rosenfeldt, K.G. Linden, S. Canonica, U. von Gunten, Comparison of the efficiency of OH radical formation during ozonation and the advanced oxidation processes O3/H2O2 and UV/H2O2, Water Res. 40 (2006) 3695–3704.
[22] B. Balci, N. Oturan, R. Cherrier, M.A. Oturan, Degradation of atrazine in aqueous medium by electrocatalytically generated hydroxyl radicals. A kinetic and mechanistic study, Water Res. 43 (2009) 1924–1934.
[23] R. Rosal, M.S. Gonzalo, A. Rodríguez, E. García-Calvo, Catalytic ozonation of fenofibric acid over alumina-supported manganese oxide, J. Hazard. Mater. 183 (2010) 271–278.
[24] M. Cermola, M. DellaGreca, M.R. Iesce, L. Previtera, M. Rubino, F. Temussi, M. Brigante, Phototransformation of fibrate drugs in aqueous media, Environ. Chem. Lett. 3 (2005) 43–47.
[25] G. Cosa, Photodegradation and photosensitization in pharmaceutical products: Assessing drug phototoxicity, Pure Appl. Chem. 76 (2004) 263–275.
[26] F. Boscá, M.A. Miranda, A laser photolysis study on fenofibric acid, Photochem. Photobiol. 70 (1999) 853–857.
[27] J. Thomson, F. Roddick, M. Drikas, Natural organic matter removal by enhanced photo-oxidation using low-pressure mercury vapour lamps. Water. Sci. Technol. 2 (2002) 435–443.
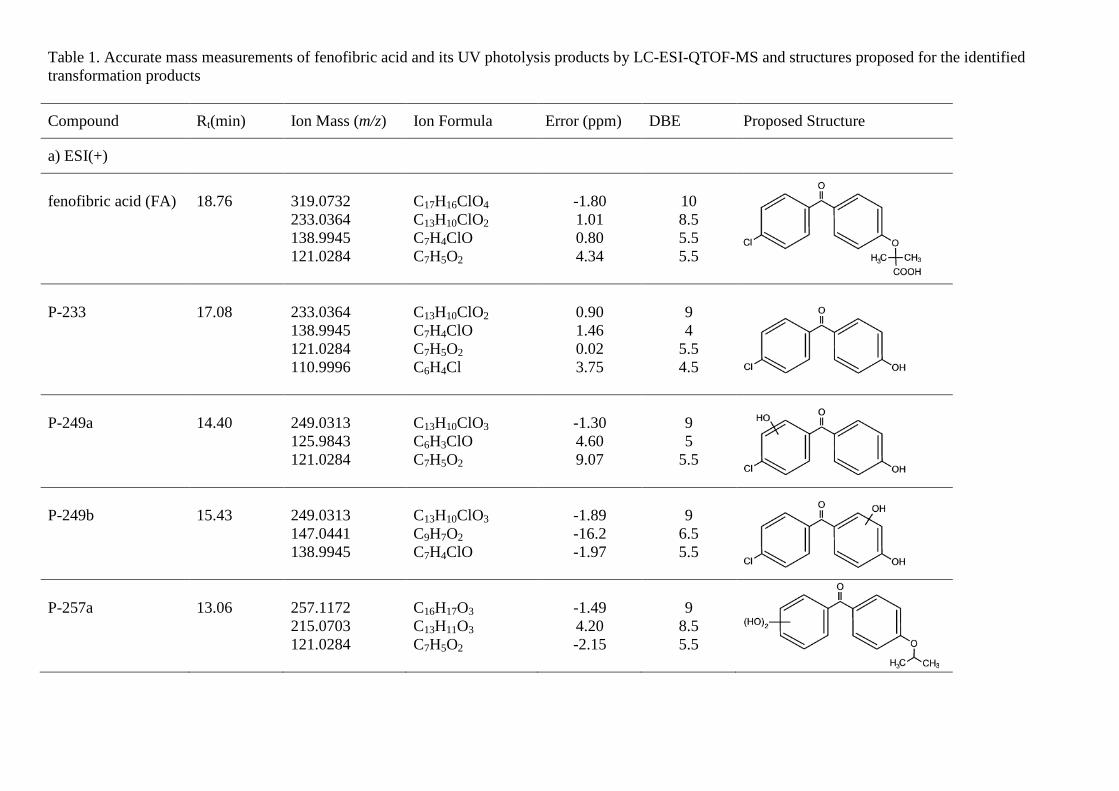
Table 1. Accurate mass measurements of fenofibric acid and its UV photolysis products by LC-ESI-QTOF-MS and structures proposed for the identified transformation products
Compound Rt(min) Ion Mass (m/z) Ion Formula Error (ppm) DBE Proposed Structure
a) ESI(+)
fenofibric acid (FA)
18.76
319.0732 233.0364 138.9945 121.0284
C17H16ClO4 C13H10ClO2 C7H4ClO C7H5O2
-1.80 1.01 0.80 4.34
10 8.5 5.5 5.5
P-233
17.08
233.0364 138.9945 121.0284 110.9996
C13H10ClO2 C7H4ClO C7H5O2 C6H4Cl
0.90 1.46 0.02 3.75
9 4
5.5 4.5
P-249a
14.40
249.0313 125.9843 121.0284
C13H10ClO3 C6H3ClO C7H5O2
-1.30 4.60 9.07
9 5
5.5
P-249b
15.43
249.0313 147.0441 138.9945
C13H10ClO3 C9H7O2 C7H4ClO
-1.89 -16.2 -1.97
9
6.5 5.5
P-257a
13.06
257.1172 215.0703 121.0284
C16H17O3 C13H11O3 C7H5O2
-1.49 4.20 -2.15
9
8.5 5.5
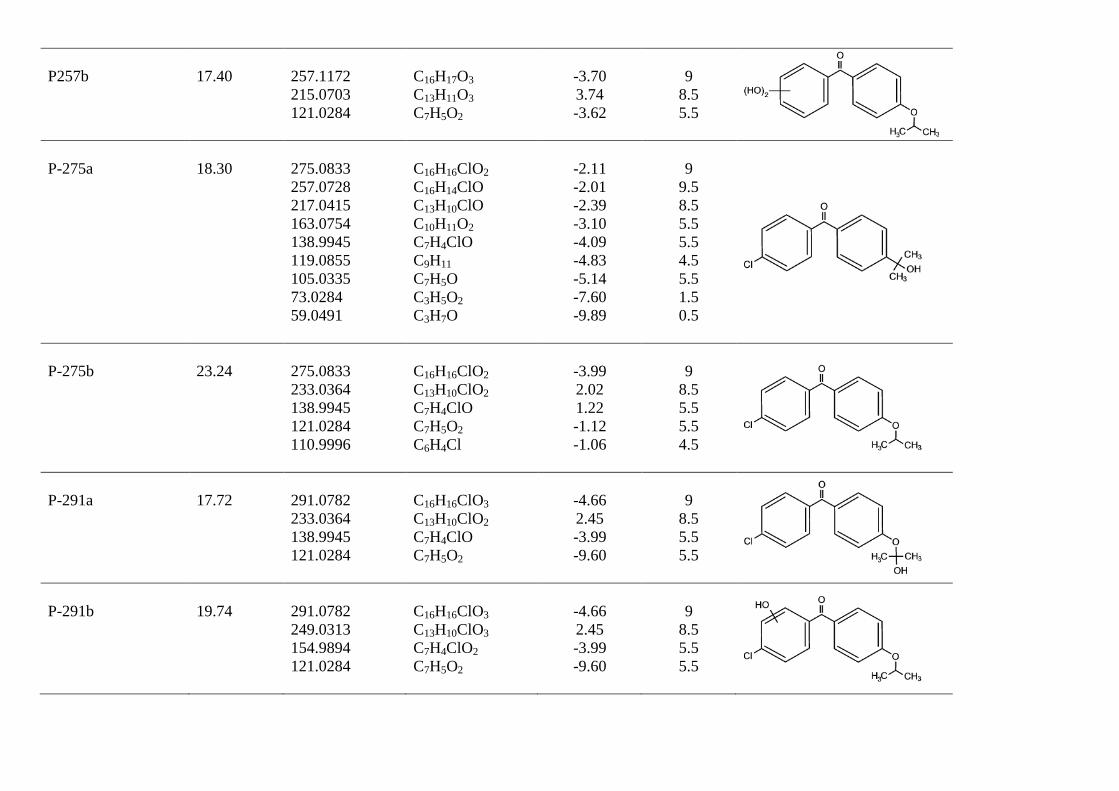
P257b
17.40
257.1172 215.0703 121.0284
C16H17O3 C13H11O3 C7H5O2
-3.70 3.74 -3.62
9
8.5 5.5
P-275a
18.30
275.0833 257.0728 217.0415 163.0754 138.9945 119.0855 105.0335 73.0284 59.0491
C16H16ClO2 C16H14ClO C13H10ClO C10H11O2 C7H4ClO C9H11 C7H5O C3H5O2 C3H7O
-2.11 -2.01 -2.39 -3.10 -4.09 -4.83 -5.14 -7.60 -9.89
9
9.5 8.5 5.5 5.5 4.5 5.5 1.5 0.5
P-275b
23.24
275.0833 233.0364 138.9945 121.0284 110.9996
C16H16ClO2 C13H10ClO2 C7H4ClO C7H5O2 C6H4Cl
-3.99 2.02 1.22 -1.12 -1.06
9
8.5 5.5 5.5 4.5
P-291a
17.72
291.0782 233.0364 138.9945 121.0284
C16H16ClO3
C13H10ClO2
C7H4ClO C7H5O2
-4.66 2.45 -3.99 -9.60
9
8.5 5.5 5.5
P-291b
19.74
291.0782 249.0313 154.9894 121.0284
C16H16ClO3 C13H10ClO3 C7H4ClO2 C7H5O2
-4.66 2.45 -3.99 -9.60
9
8.5 5.5 5.5
P-291c
20.03
291.0782 249.0313 138.9945
C16H16ClO3 C13H10ClO3 C7H4ClO
-0.56 4.53 -3.91
9
8.5 5.5
b) ESI(-)
fenofibric acid (FA)
18.78
317.0586 231.0218
C17H14ClO4
C13H8ClO2
-1.35 -0.10
10 9
pCBA, P-155
13.90
154.9905 111.0007
C7H4ClO2
C6H4Cl
0.09 -3.18
5 4
Table 2. Accurate mass measurements of fenofibric acid and its UV/H2O2 products by LC-ESI-QTOF-MS and structures proposed for the identified transformation products
Compound Rt(min) Ion Mass (m/z) Ion Formula Error (ppm) DBE Proposed Structure
a) ESI(+)
fenofibric acid (FA) 18.76 319.0732 233.0364 138.9945 121.0284
C17H16ClO4 C13H10ClO2 C7H4ClO C7H5O2
-1.65 1.49 -1.19 -9.21
10 8.5 5.5 5.5
P-233 17.15 233.0364
138.9945 121.0284 110.9996
C13H10ClO2 C7H4ClO C7H5O2 C6H4Cl
2.75 4.00 5.84 4.72
9 4
5.5 4.5
P-249a 14.44 249.0313 125.9843 121.0284
C13H10ClO3 C6H3ClO C7H5O2
-1.20 3.20 16.1
9 5
5.5
P-249b 15.43 249.0313 147.0441 138.9945 125.9867
C13H10ClO3 C9H7O2 C7H4ClO C6H3ClO
4.43 -14.2 -1.87 4.80
9 6.5 5.5 5
P-257 17.44 257.1172 215.0703 121.0284
C16H17O3 C6H3ClO C7H5O2
9.43 4.43 -4.25
9 8.5 5.5
P-275a 18.50 275.0833
138.9945 110.9996 59.0491
C16H16ClO2 C7H4ClO C6H4Cl C3H7O
-2.12 -4.09 -4.98 -9.99
9 5.5 4.5 0.5
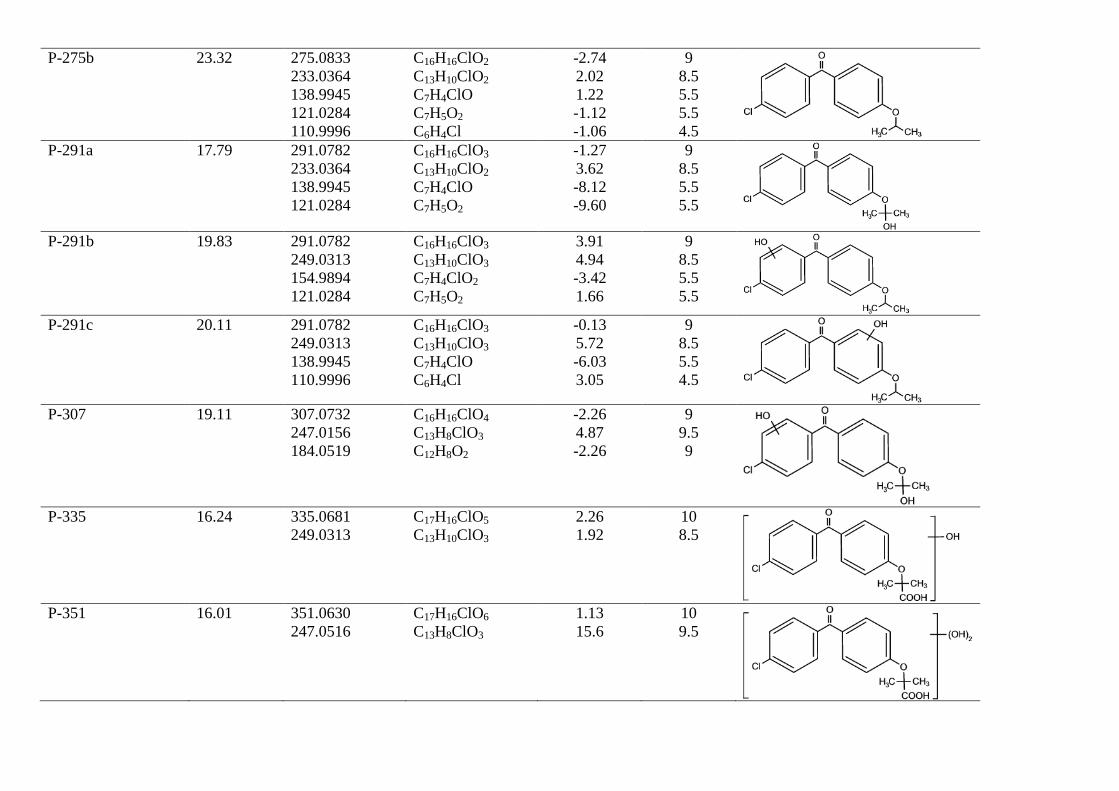
P-275b 23.32 275.0833 233.0364 138.9945 121.0284 110.9996
C16H16ClO2 C13H10ClO2 C7H4ClO C7H5O2 C6H4Cl
-2.74 2.02 1.22 -1.12 -1.06
9 8.5 5.5 5.5 4.5
P-291a 17.79 291.0782 233.0364 138.9945 121.0284
C16H16ClO3 C13H10ClO2 C7H4ClO C7H5O2
-1.27 3.62 -8.12 -9.60
9 8.5 5.5 5.5
P-291b 19.83 291.0782
249.0313 154.9894 121.0284
C16H16ClO3 C13H10ClO3 C7H4ClO2 C7H5O2
3.91 4.94 -3.42 1.66
9 8.5 5.5 5.5
P-291c 20.11 291.0782
249.0313 138.9945 110.9996
C16H16ClO3 C13H10ClO3 C7H4ClO C6H4Cl
-0.13 5.72 -6.03 3.05
9 8.5 5.5 4.5
P-307 19.11 307.0732
247.0156 184.0519
C16H16ClO4
C13H8ClO3
C12H8O2
-2.26 4.87 -2.26
9 9.5 9
P-335 16.24 335.0681
249.0313 C17H16ClO5
C13H10ClO3
2.26 1.92
10 8.5
P-351 16.01 351.0630
247.0516
C17H16ClO6
C13H8ClO3
1.13 15.6
10 9.5
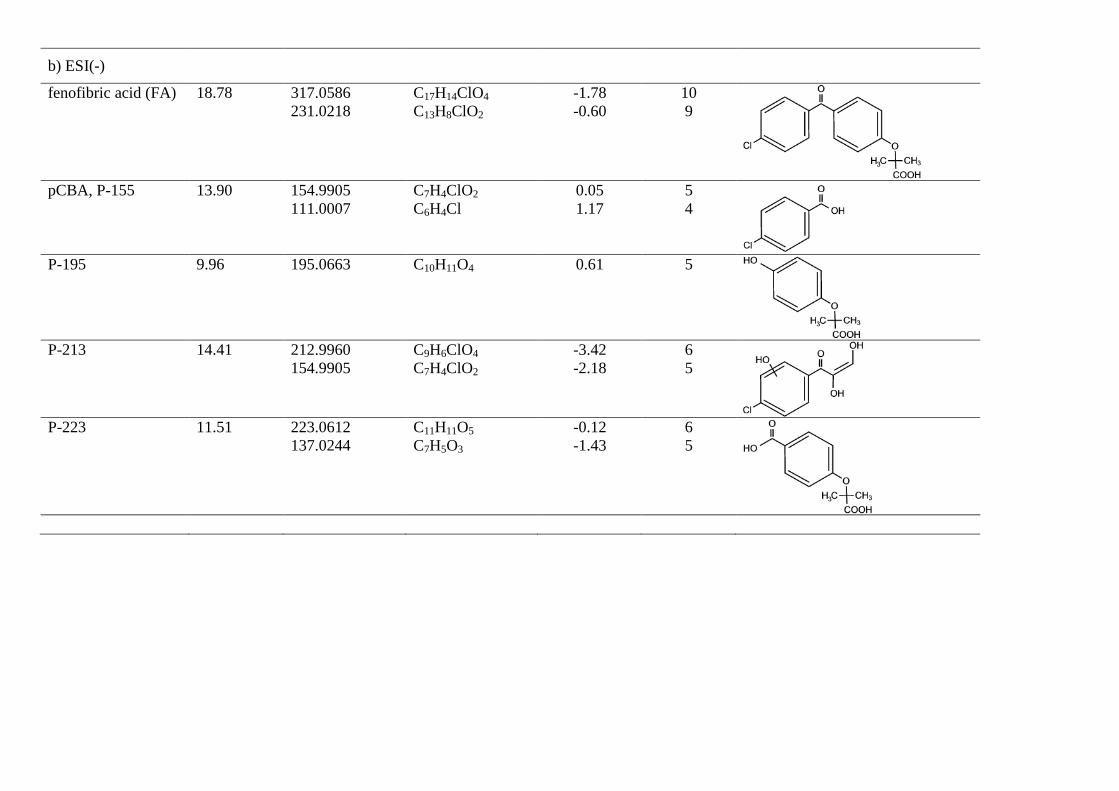
b) ESI(-)
fenofibric acid (FA) 18.78 317.0586 231.0218
C17H14ClO4
C13H8ClO2
-1.78 -0.60
10 9
pCBA, P-155 13.90 154.9905
111.0007 C7H4ClO2
C6H4Cl 0.05 1.17
5 4
P-195 9.96 195.0663 C10H11O4
0.61 5
P-213 14.41 212.9960
154.9905 C9H6ClO4
C7H4ClO2
-3.42 -2.18
6 5
P-223 11.51 223.0612
137.0244 C11H11O5
C7H5O3
-0.12 -1.43
6 5
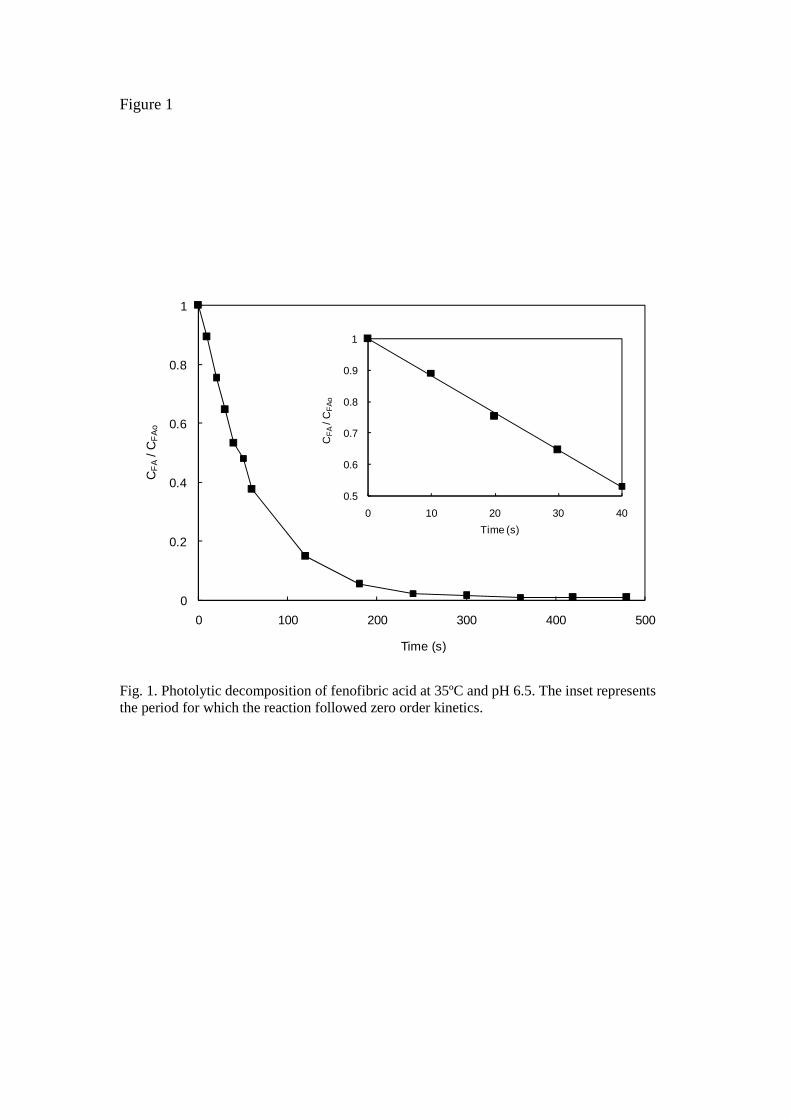
Figure 1
0
0.2
0.4
0.6
0.8
1
0 100 200 300 400 500
CF
A/ C
FA
o
Time (s)
0.5
0.6
0.7
0.8
0.9
1
0 10 20 30 40
CF
A/ C
FA
o
Time (s)
Fig. 1. Photolytic decomposition of fenofibric acid at 35ºC and pH 6.5. The inset represents the period for which the reaction followed zero order kinetics.
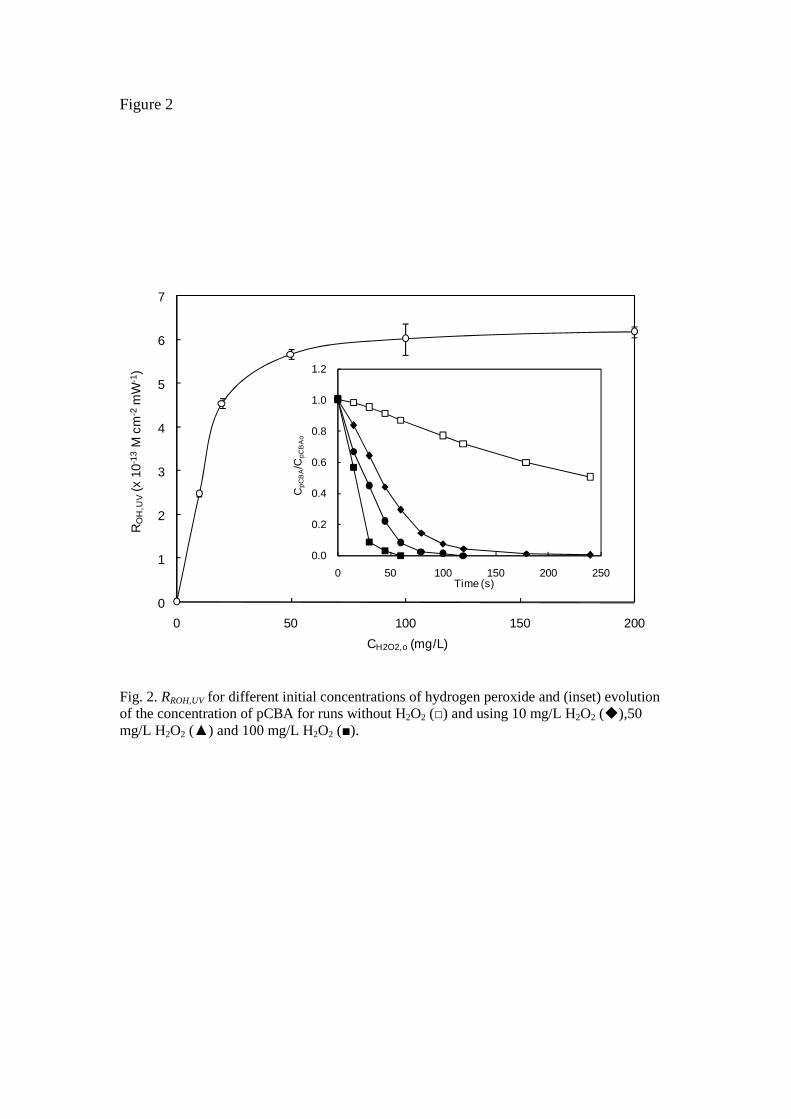
Figure 2
0
1
2
3
4
5
6
7
0 50 100 150 200
RO
H,U
V(x
10-
13M
cm
-2 m
W-1
)
CH2O2,o (mg/L)
0.0
0.2
0.4
0.6
0.8
1.0
1.2
0 50 100 150 200 250
Cp
CB
A/C
pCB
Ao
Time (s)
Fig. 2. RROH,UV for different initial concentrations of hydrogen peroxide and (inset) evolution of the concentration of pCBA for runs without H2O2 () and using 10 mg/L H2O2 (),50 mg/L H2O2 () and 100 mg/L H2O2 ().
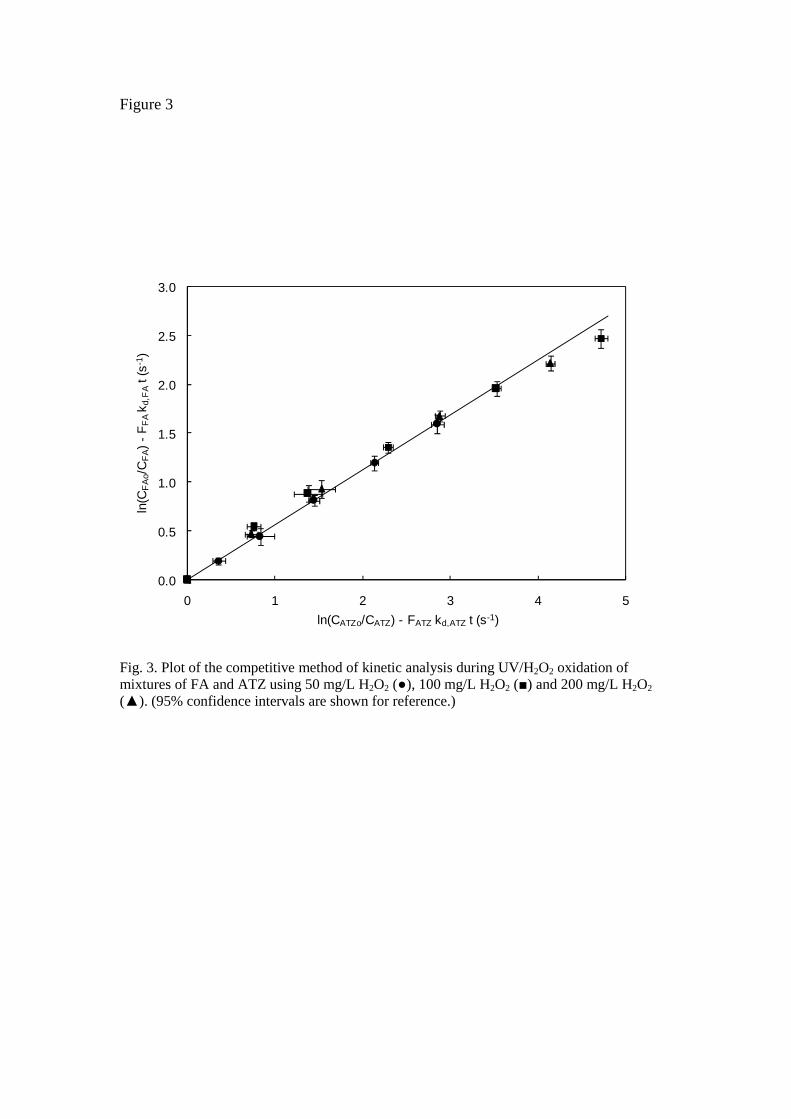
Figure 3
0.0
0.5
1.0
1.5
2.0
2.5
3.0
0 1 2 3 4 5
ln(C
FA
o/C
FA)
-F
FA
kd,
FA
t (s-
1 )
ln(CATZo/CATZ) - FATZ kd,ATZ t (s-1)
Fig. 3. Plot of the competitive method of kinetic analysis during UV/H2O2 oxidation of mixtures of FA and ATZ using 50 mg/L H2O2 (), 100 mg/L H2O2 () and 200 mg/L H2O2 (). (95% confidence intervals are shown for reference.)
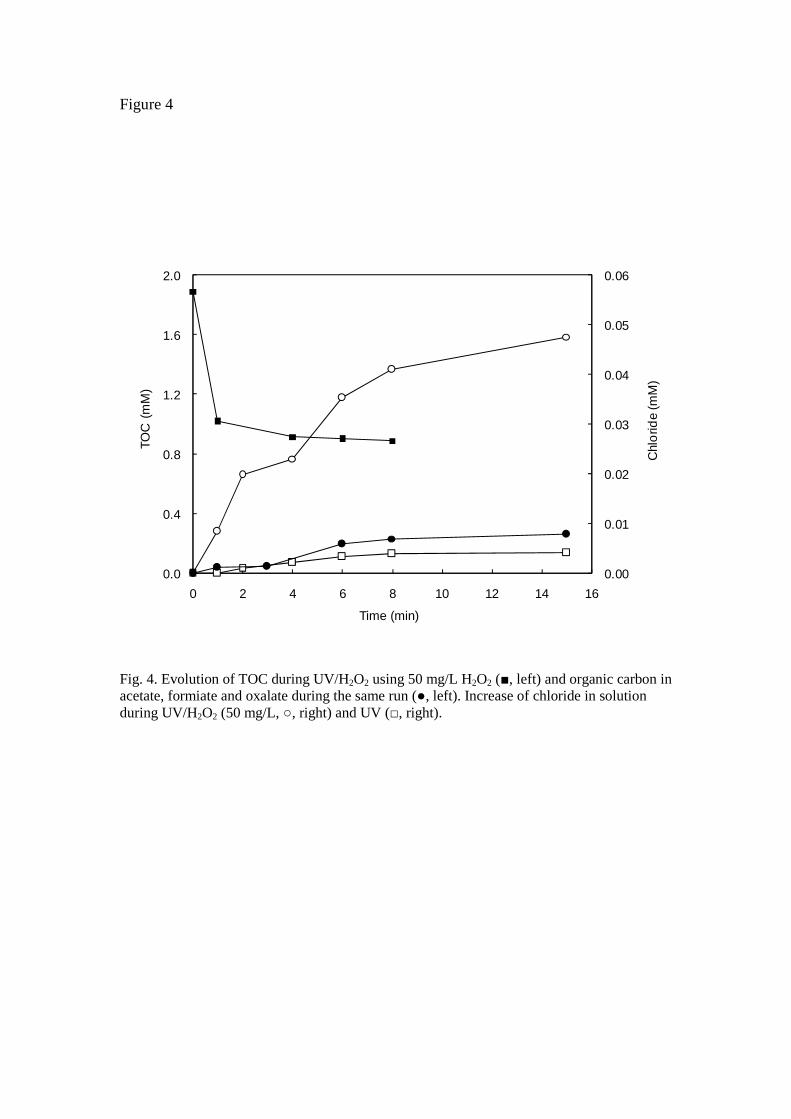
Figure 4
0.00
0.01
0.02
0.03
0.04
0.05
0.06
0.0
0.4
0.8
1.2
1.6
2.0
0 2 4 6 8 10 12 14 16
Chl
orid
e (m
M)
TOC
(m
M)
Time (min)
Fig. 4. Evolution of TOC during UV/H2O2 using 50 mg/L H2O2 (, left) and organic carbon in acetate, formiate and oxalate during the same run (, left). Increase of chloride in solution during UV/H2O2 (50 mg/L, , right) and UV (, right).
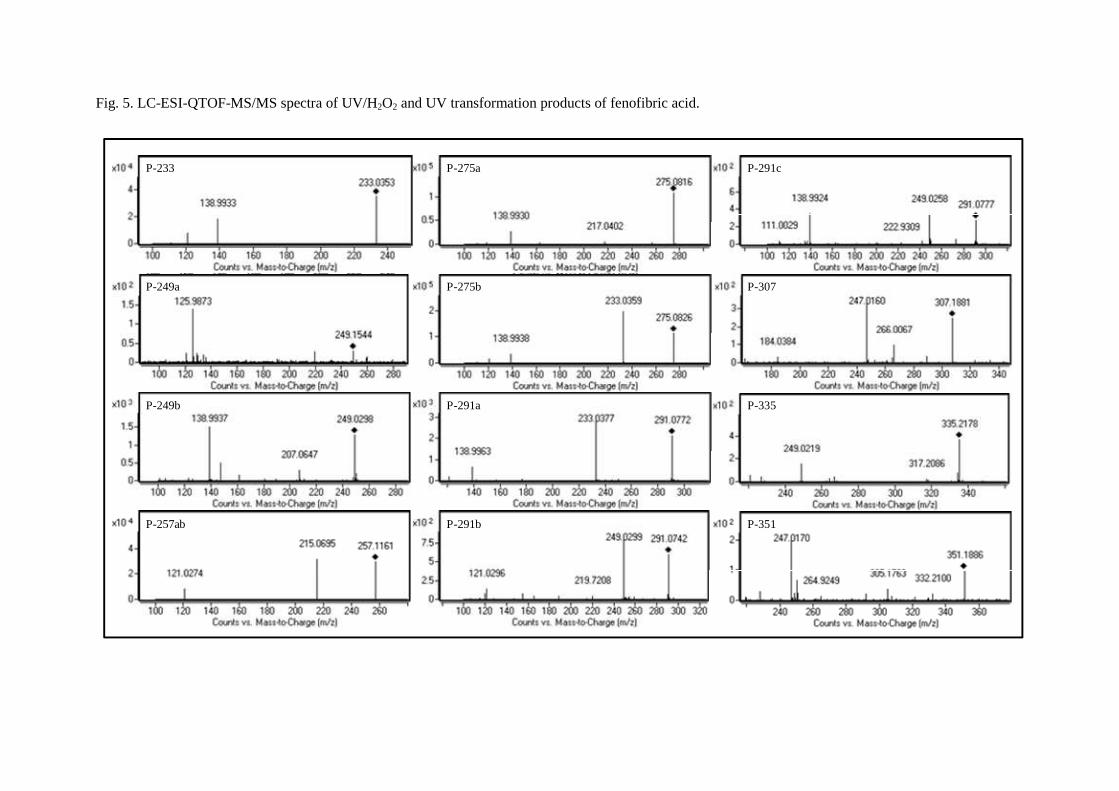
Fig. 5. LC-ESI-QTOF-MS/MS spectra of UV/H2O2 and UV transformation products of fenofibric acid.
P-233
P-249a
P-249b
P-257ab
P-275a
P-275b
P-291a
P-291b
P-291c
P-307
P-335
P-351
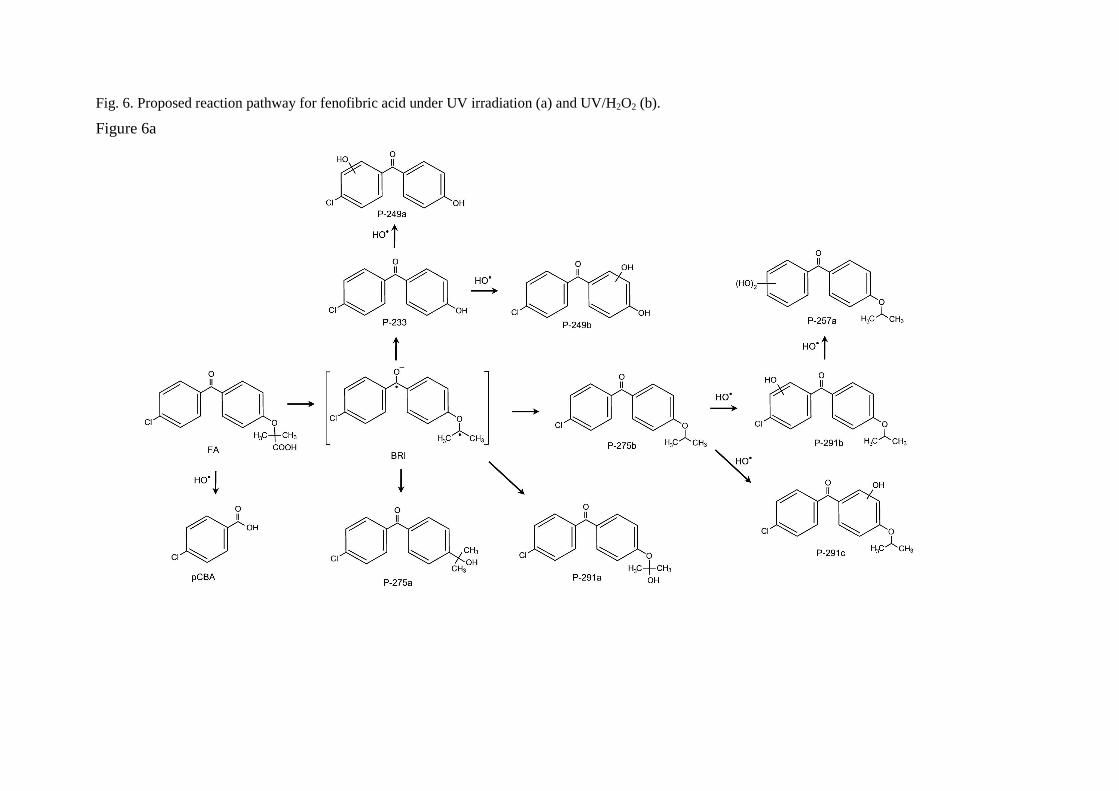
Fig. 6. Proposed reaction pathway for fenofibric acid under UV irradiation (a) and UV/H2O2 (b).
Figure 6a
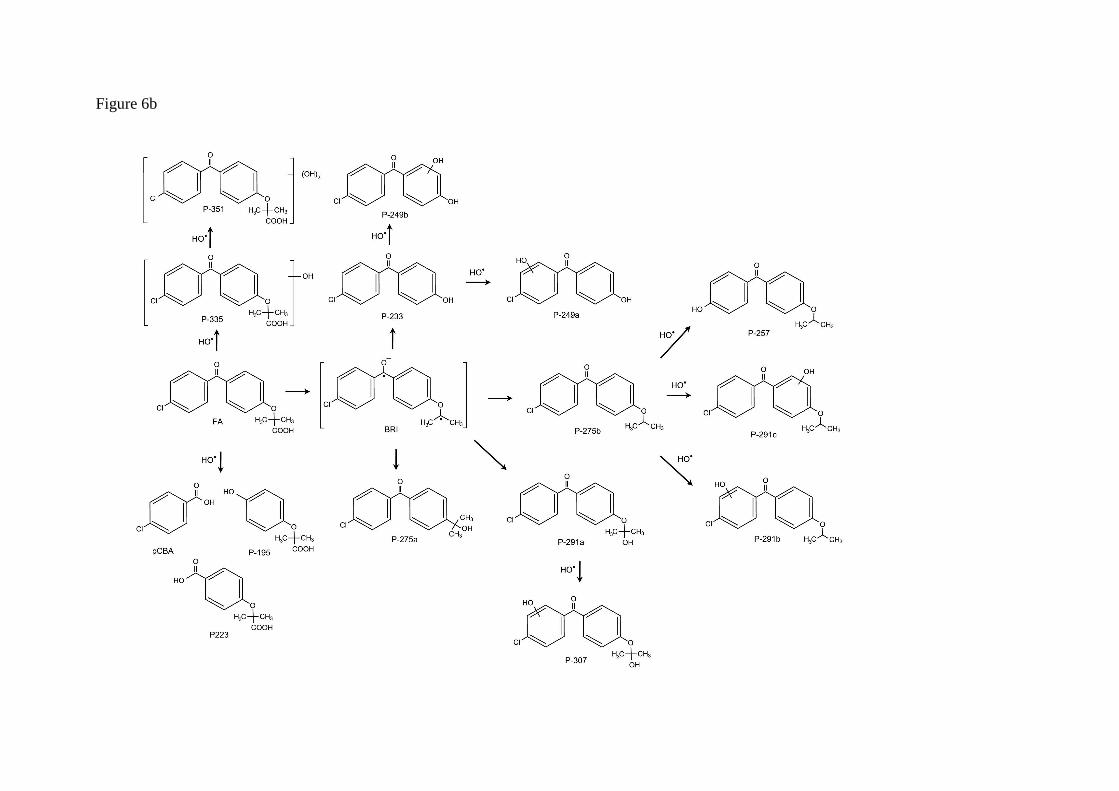
Figure 6b
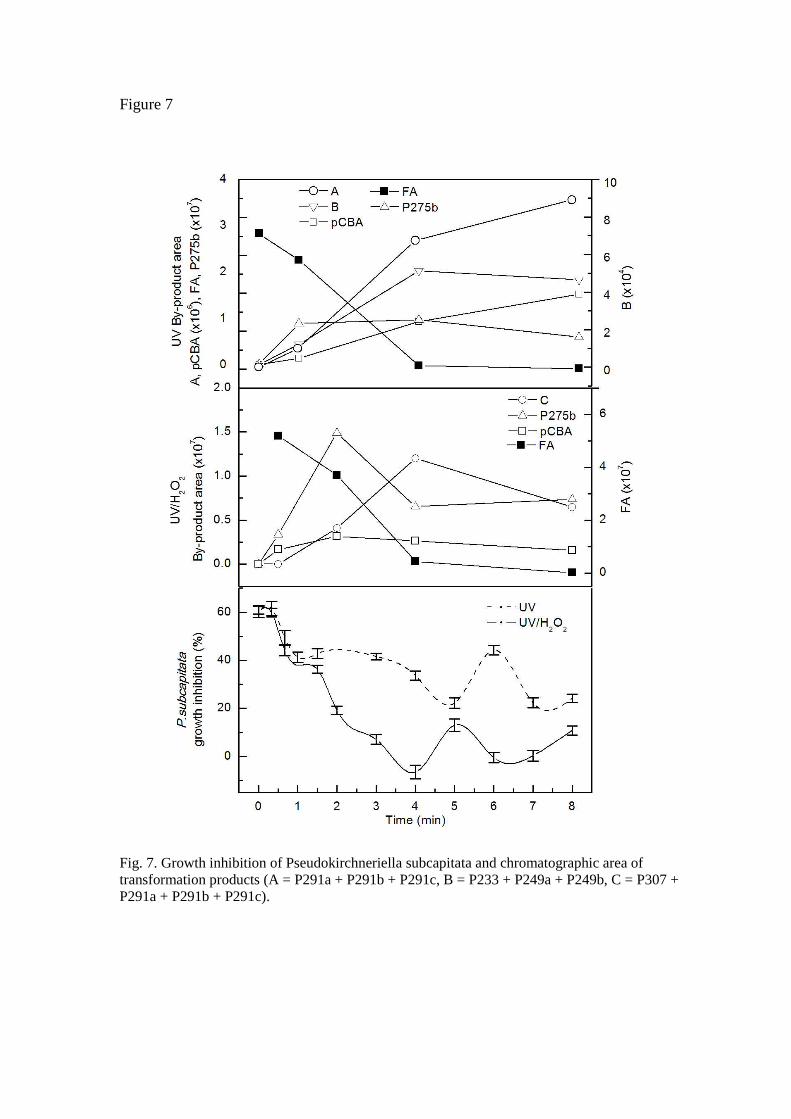
Figure 7
Fig. 7. Growth inhibition of Pseudokirchneriella subcapitata and chromatographic area of transformation products (A = P291a + P291b + P291c, B = P233 + P249a + P249b, C = P307 + P291a + P291b + P291c).