Embed Size (px)
Citation preview
EPC Board
September 18, 2014
Cover Photo to be added

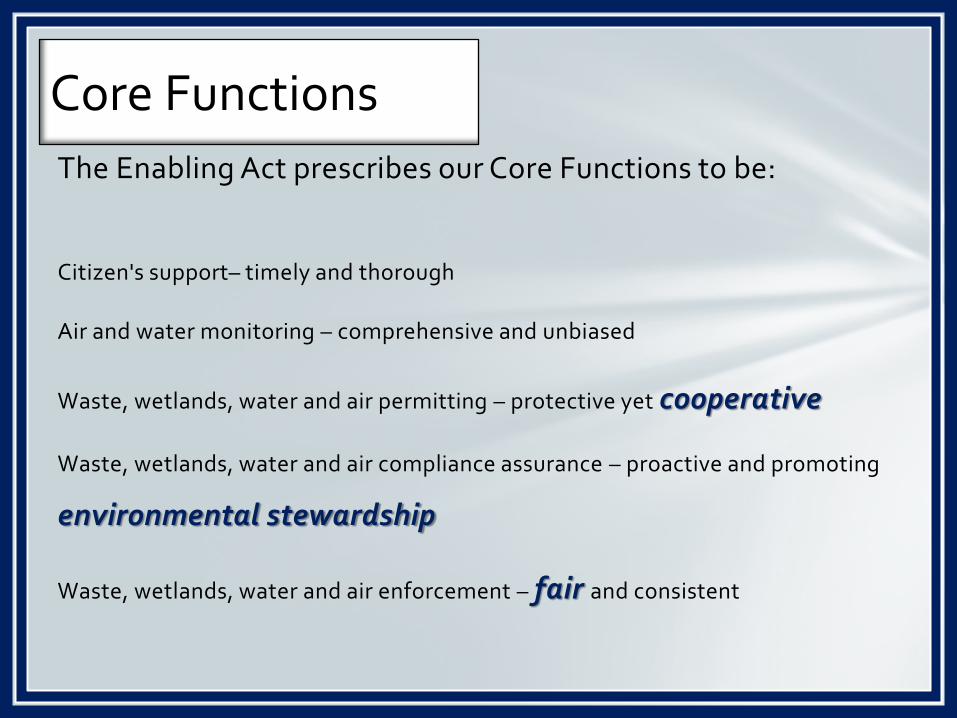
The Enabling Act prescribes our Core Functions to be:
Citizen's support– timely and thorough
Air and water monitoring – comprehensive and unbiased
Waste, wetlands, water and air permitting – protective yet cooperative
Waste, wetlands, water and air compliance assurance – proactive and promoting
environmental stewardship
Waste, wetlands, water and air enforcement – fair and consistent
Core Functions
EPC Building Partnerships & Ensuring Protection of Our Natural Resources

Worked with Arkema, Florida Department of Agriculture & Consumer Services and the Florida Strawberry Growers Association to improve the practices associated with applying fumigants
Partnering with Agriculture (Paladin)
• Arkema retrained the applicators
• FDACS required improved tarps
• EPC is co-hosting a community meeting

• Worked with the Port Tampa Bay to improve their environmental programs by offering compliance assistance.
• EPC participated in workshops with Port operators
Partnering with the Port

Worked with Neighborhood Relations Department and numerous Homeowner Associations to offer mini-grants and educate citizens to be better environment stewards
Partnering with the Community
Partnering with Economic Development
0
2
5
6
13 13
15
20 20
23
0 0 0
1
2
3
4
5 5 5
0
5
10
15
20
25
2004 2005 2006 2007 2008 2009 2010 2011 2012 2013
Brownfields Redevelopment Activities
Cumulative Brownfield Site Rehabilitation Agreements Executed Cumulative Site Rehabilitation Orders Approved
Waterworks Ulele Springs
Negotiated with molten sulfur industry in the port to improve product handling to minimize fires and spills
Partnering with Industry
• Improved tank integrity at a cost of >$2M on repairs and improvements
• Agreed to more frequent and thorough inspections
Partnering with Other Agencies to Improve Permitting in Wetland Areas • TPA/FDEP/USACoE: Improve process + Rule
modifications + Enabling Act modifications + Mapping Riparian Lines
• Active Participation in Comprehensive Plans and Land Development Code Re-writes
• Pro-active Approach with County’s Key Economic Spaces + Priority Development Areas

Participated in school activities such as Nature’s Classrooms, Great American Teach-in and the Science Fair. Hosted an environmentally-themed photos contest as part of our Clean Air Month celebration
Partnering with Our Schools

Worked with the Florida Sterling Council and some dozen employee committees to complete the Sterling Challenge Application and to identify seven opportunities for improvement
Partnering with the Florida Sterling Council
• Integrate innovation into the Agency
• Develop long-term goals
• Establish employee complaint system
• Provide employees a recognition program
• Enhance outreach
• Benchmark the Agency’s metrics
• Evaluate employee health and safety procedures

Joined forces with the Patel College of Global Sustainability and Tampa Electric to form the Tampa Bay Clean Cities Coalition and received official designation from the US Department of Energy.
Partnering with Patel School of Sustainability
Update on Environmental Trends and Programs
Tampa Bay1974 - 2014
Year
1974
1975
1976
1977
1978
1979
1980
1981
1982
1983
1984
1985
1986
1987
1988
1989
1990
1991
1992
1993
1994
1995
1996
1997
1998
1999
2000
2001
2002
2003
2004
2005
2006
2007
2008
2009
2010
2011
2012
2013
2014
Wate
r Q
uali
ty I
nd
ex
0
10
20
30
40
50
60
70
80
90
100
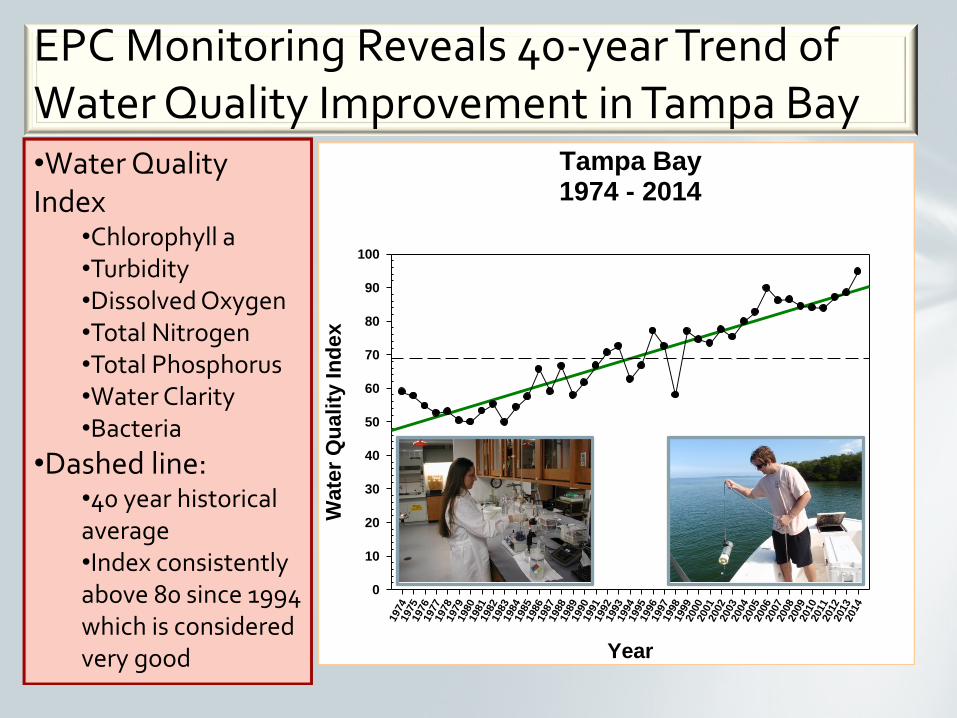
•Water Quality Index
•Chlorophyll a •Turbidity •Dissolved Oxygen •Total Nitrogen •Total Phosphorus •Water Clarity •Bacteria
•Dashed line: •40 year historical average •Index consistently above 80 since 1994 which is considered very good
EPC Monitoring Reveals 40-year Trend of Water Quality Improvement in Tampa Bay

Species Richness Tampa Bay Benthic Index
Health of Tampa Bay Benthic Monitoring
Tampa Bay1993-2012
Year
1993
1994
1995
1996
1997
1998
1999
2000
2001
2002
2003
2004
2005
2006
2007
2008
2009
2010
2011
2012
Nu
mb
er
of
Ta
xa
0
5
10
15
20
25
30
35
40
45
50
55
60
Tampa Bay1993-2012
Year
1993
1994
1995
1996
1997
1998
1999
2000
2001
2002
2003
2004
2005
2006
2007
2008
2009
2010
2011
2012
Tam
pa B
ay B
en
thic
In
dex
60
65
70
75
80
85
90
95
100
Healthy > 87Poor <73
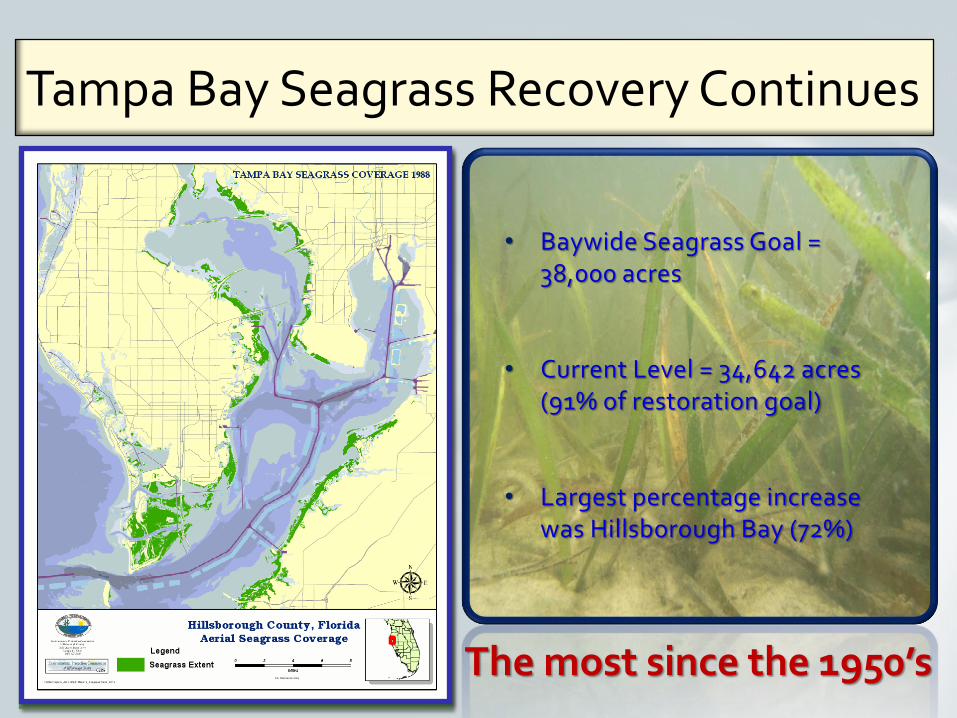
Tampa Bay Seagrass Recovery Continues
• Baywide Seagrass Goal = 38,000 acres
• Current Level = 34,642 acres (91% of restoration goal)
• Largest percentage increase was Hillsborough Bay (72%)
The most since the 1950’s

2
7
14 14
18
24
29
37
41
47
51
54
58 60
66
0
10
20
30
40
50
60
70
1999 2000 2001 2002 2003 2004 2005 2006 2007 2008 2009 2010 2011 2012 2013
Redevelopment Activities
Management of Our Old Landfills
Cumulative Projects Completed
Varela Old Landfill Redevelopment
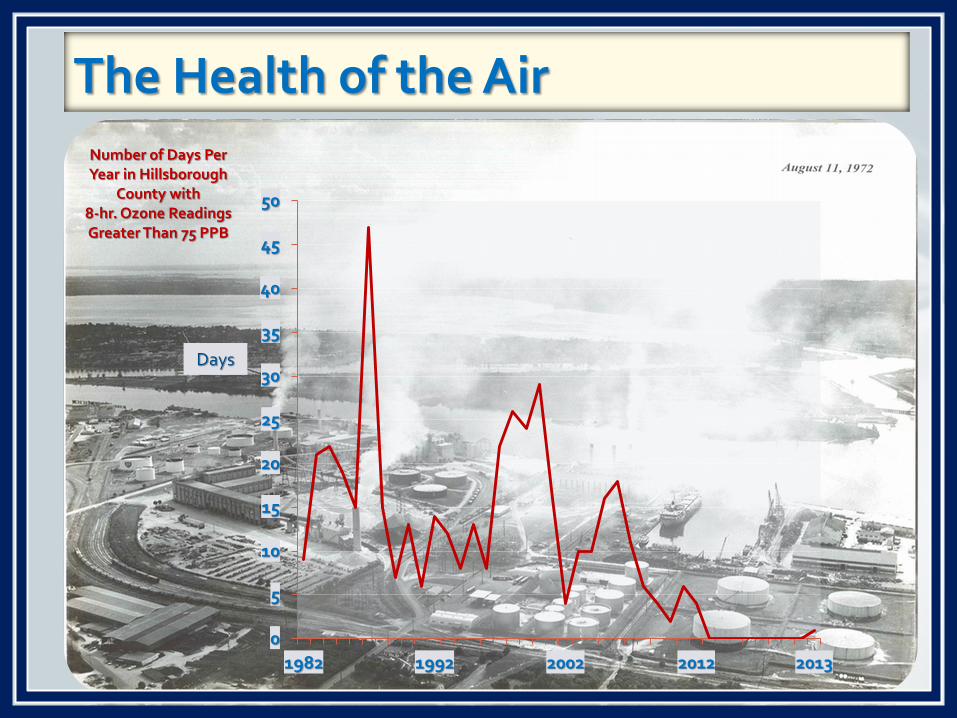
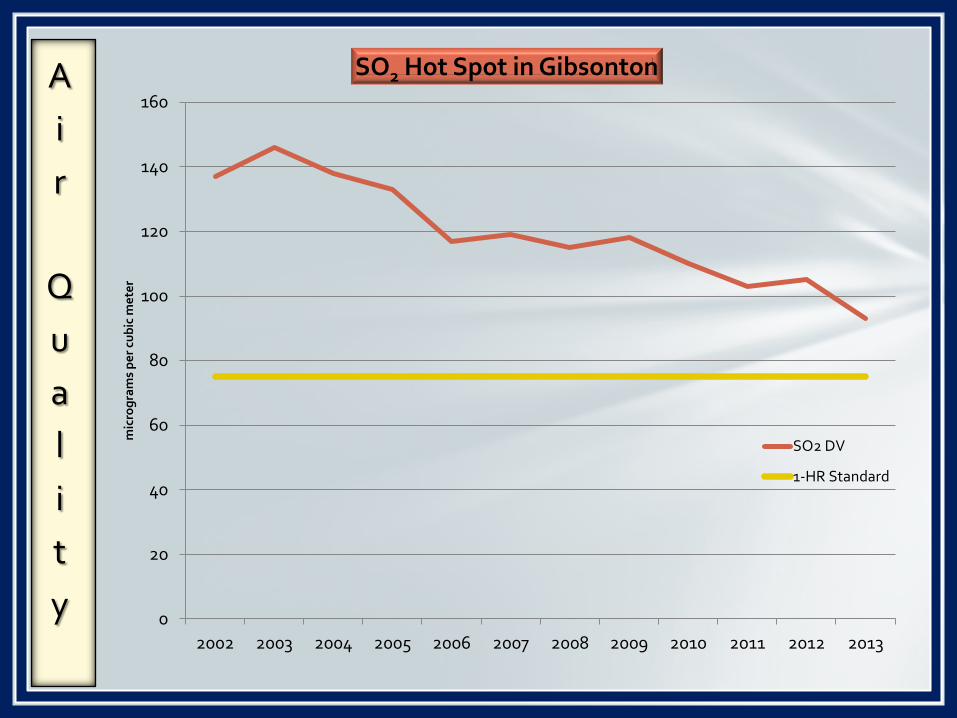
The Health of the Air
0
5
10
15
20
25
30
35
40
45
50
1982 1992 2002 2012 2013
Number of Days Per Year in Hillsborough
County with 8-hr. Ozone Readings Greater Than 75 PPB
Days
A
i
r
Q
u
a
l
i
t
y
0
20
40
60
80
100
120
140
160
2002 2003 2004 2005 2006 2007 2008 2009 2010 2011 2012 2013
mic
rog
ram
s p
er
cub
ic m
ete
r
SO2 Hot Spot in Gibsonton
SO2 DV
1-HR Standard

A
i
r
Q
u
a
l
i
t
y
0.00
0.20
0.40
0.60
0.80
1.00
1.20
1.40
1.60
1.80
2.00
Jan-04 Jan-05 Jan-06 Jan-07 Jan-08 Jan-09 Jan-10 Jan-11 Jan-12 Jan-13 Jan-14
mic
rogr
ams
per
cu
bic
met
er
Lead Hot Spot in East Tampa
Series1
Linear Trendline1.5 ug/m3
0.15 ug/m3
Linear Trendline
EPA Standard
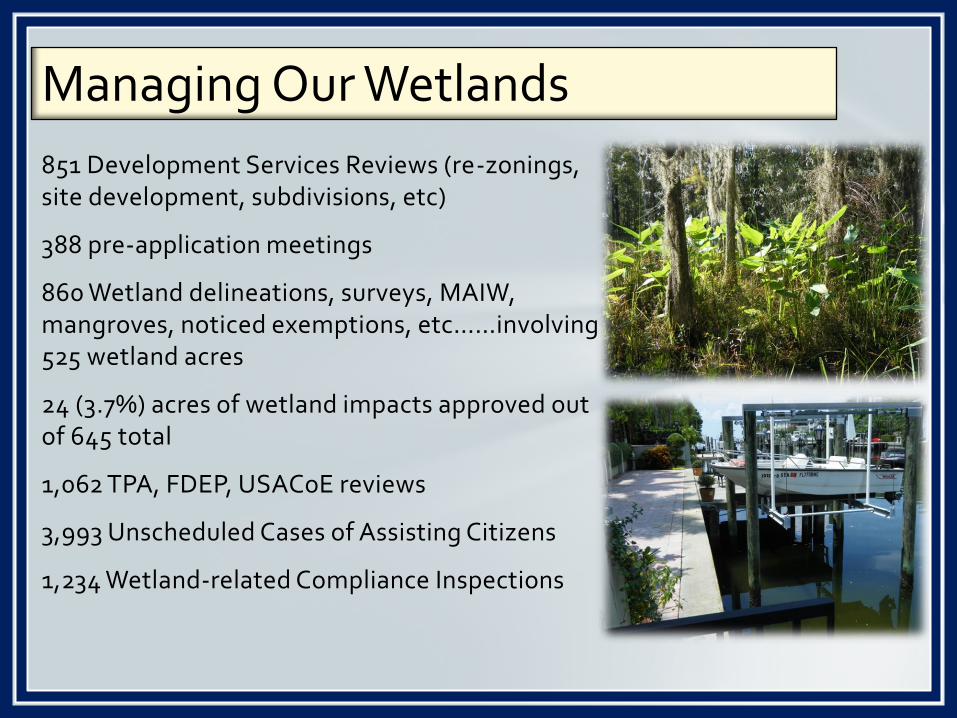
Managing Our Wetlands
851 Development Services Reviews (re-zonings, site development, subdivisions, etc)
388 pre-application meetings
860 Wetland delineations, surveys, MAIW, mangroves, noticed exemptions, etc……involving 525 wetland acres
24 (3.7%) acres of wetland impacts approved out of 645 total
1,062 TPA, FDEP, USACoE reviews
3,993 Unscheduled Cases of Assisting Citizens
1,234 Wetland-related Compliance Inspections
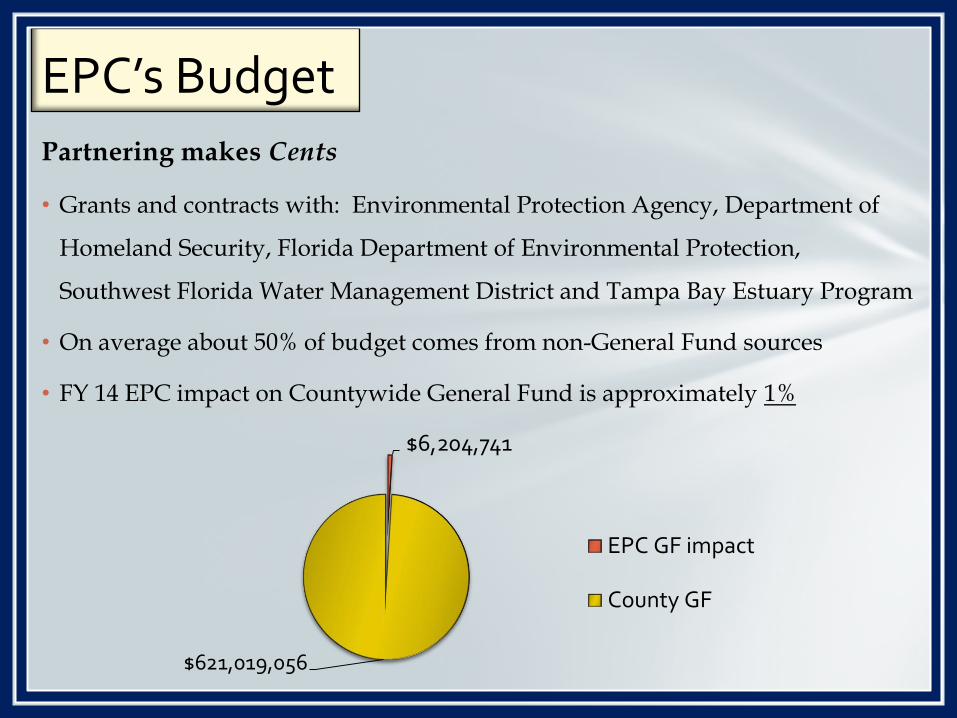
EPC’s Budget
Partnering makes Cents
• Grants and contracts with: Environmental Protection Agency, Department of
Homeland Security, Florida Department of Environmental Protection,
Southwest Florida Water Management District and Tampa Bay Estuary Program
• On average about 50% of budget comes from non-General Fund sources
• FY 14 EPC impact on Countywide General Fund is approximately 1%
$6,204,741
$621,019,056
EPC GF impact
County GF
$0
$2,000,000
$4,000,000
$6,000,000
$8,000,000
$10,000,000
$12,000,000
$14,000,000
$16,000,000
$18,000,000
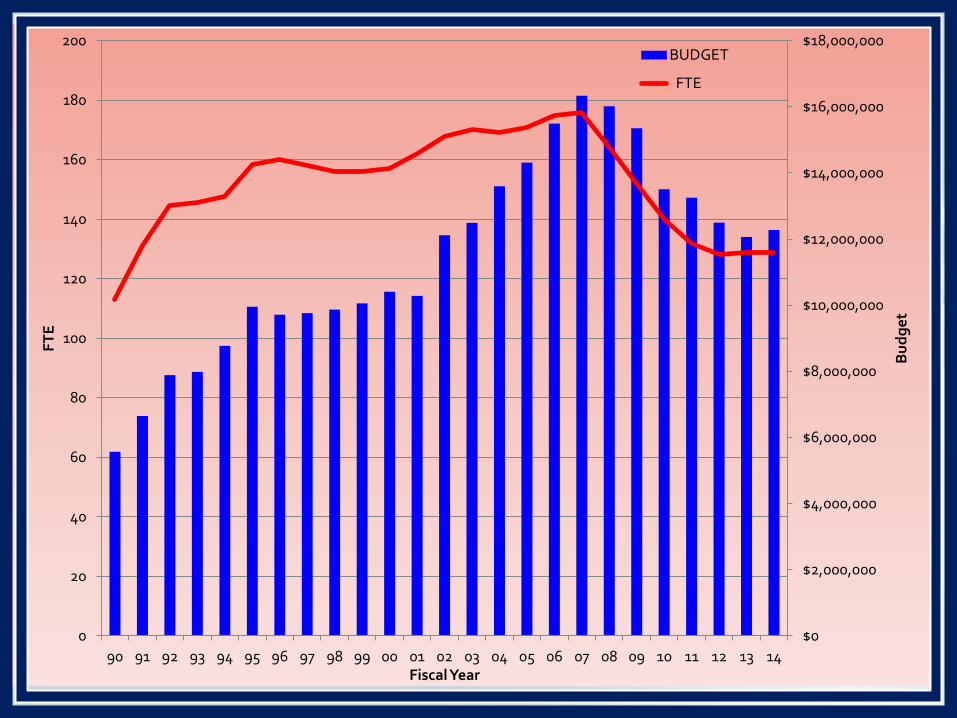
0
20
40
60
80
100
120
140
160
180
200
90 91 92 93 94 95 96 97 98 99 00 01 02 03 04 05 06 07 08 09 10 11 12 13 14
Bu
dg
et
FT
E
Fiscal Year
BUDGET
FTE
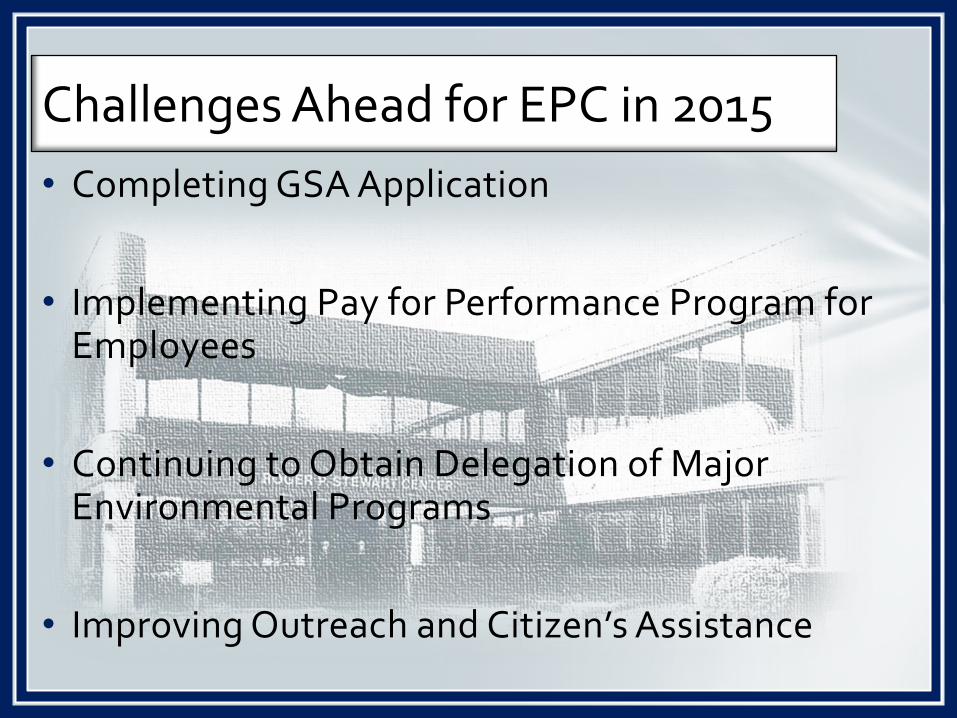
• Completing GSA Application
• Implementing Pay for Performance Program for Employees
• Continuing to Obtain Delegation of Major Environmental Programs
• Improving Outreach and Citizen’s Assistance
Challenges Ahead for EPC in 2015
Thank You!