Embed Size (px)
Citation preview


1
COVER SHEET
A S 0 9 6 - 0 0 5 5 5 5
S.E.C. Registration Number
P H I L I P P I N E N A T I O N A L B A N K
Company’s Full Name)
8 t h F l o o r P N B F i n a n c i a l C e n t e r
M a c a p a g a l B l v d . , P a s a y C i t y
(Business Address: No. Street City/Town/ Province)
JAMES PATRICK Q. BONUS 891-60-40
Contact Person Company Telephone Number
1 2 3 1 17 - AMonth Day FORM TYPE Month Day
Fiscal Year Annual Meeting
Secondary License Type, If Applicable
Dept. Requiring this Doc. Amended Articles Number/Section
Total amount of Borrowings
Total No. of Stockholders Domestic Foreign-------------------------------------------------------------------------------------------------------------------------- ---------------------------------
To be accomplished by SEC Personnel concerned
File Number LCU
Document I.D. Cashier
S T A M P S
Remarks = pls. use black ink for scanning purposes
2
SEC Number AS096-005555File Number
PHILIPPINE NATIONAL BANKAND SUBSIDIARIES
(Company’s Full Name)
Pres. Diosdado P. Macapagal Boulevard, Pasay City
(Company’s Full Address)
891-6040 to 70
(Telephone Number)
(Calendar Year Ended)
SEC FORM 17-A REPORT
Form Type
(Amendment Designation (if applicable)
December 31, 2016
Period Ended Date
LISTED(Secondary License Type and File Number)

3
SECURITIES AND EXCHANGE COMMISSIONSEC FORM 17-A
ANNUAL REPORT PURSUANT TO SECTION 17 OF THE SECURITIES REGULATIONCODE AND SECTION 141 OF CORPORATION CODE OF THE PHILIPPINES
1. For the fiscal year ended December 31, 2016
2. SEC ID No. AS096-005555 3. BIR Tax Identification No. 000-188-209
4. Exact name of issuer as specified in its charter: Philippine National Bank
5. Philippines 6. (SEC Use Only)Province, Country or other jurisdiction of Industry Classification Code:
Incorporation or organization
7. PNB Financial Center, Pres. Diosdado P. Macapagal Blvd, Pasay City 1300Address of principal office Postal Code
8. (632)/891-60-40 up to 70 _Issuer’s telephone number, including area code
9. N/A .Former name, former address, and former fiscal year, if changed since last report
10. Securities registered pursuant to Sections 8 and 12 of the SRC or Sections 4 and 8 of the RSA
Title of Each Class Number of Shares IssuedCommon Stock, P40 par value 1,249,139,678 shares
11. Are any or all of these securities listed on a Stock Exchange.Yes [ ] No [ ]
If yes, state the name of such stock exchange and the classes of securities listed therein:Philippine Stock Exchange Common Stock
12. Check whether the issuer:
(a) has filed all reports required to be filed by Section 17 of the SRC and SRC Rule 17.1thereunder or Section 11 of the RSA and RSA Rule 11 (a) – 1 thereunder, and Sections 26and 141 of The Corporation Code of the Philippines during the preceding twelve (12)months (or for such shorter period that the registrant was required to file such report)
Yes [ ] No [ ]
(b) has been subject to such filing requirements for the past ninety (90) daysYes [ ] No [ ]
13. Aggregate market value of the voting stock held by non-affiliates: P68,203,026,418.80*
*1,249,139,678 common shares @ P54.60 trading price of PNB shares as of December 31, 2016

4
Table of Contents
PART I – BUSINESS AND GENERAL INFORMATION
Item 1 – Business 5Item 2 – Properties 34Item 3 – Legal Proceedings 34Item 4 – Submission of Matters to a Vote of Security Holders 35
PART II – OPERATIONAL AND FINANCIAL INFORMATION
Item 5 – Market for Issuer’s Common Equity and Related Stockholder Matters 36Item 6 – Management’s Discussion and Analysis 38Item 7 – Financial Statements 52Item 8 – Information on Independent Accountant and Changes in/disagreements with 52
Accountants on Accounting / Financial Disclosure
PART III – CONTROL AND COMPENSATION INFORMATION
Item 9 – Directors and Executive Officers 57Item 10 – Executive Compensation 87Item 10A – Remuneration Policy 88Item 11 – Security Ownership 89Item 12 – Certain Relationships and Related Transactions 96
PART IV – EXHIBITS AND REPORTS UNDER SEC 17 - C
Item 13 – Exhibits and Reports on SEC Form 17C 97

5
PART I - BUSINESS AND GENERAL INFORMATION
Item 1. Business
A. Business Development
The Philippine National Bank (PNB or the “Bank”), the country’s first universal bank, is thefourth largest private local commercial bank in terms of assets. Last July 22, 2016, PNBcelebrated its Centennial Year with the theme, “A Century of Excellence”, signifying ameaningful milestone for an institution that has served generations of Filipinos here and abroad.For 100 years, PNB stands proud as an institution of stability and security for many Filipinos.With its century of banking history and experience, PNB is poised to move forward tobecoming a more dynamic, innovative and service-focused bank, providing service excellenceto Filipinos all over the world.
The Bank was established as a government-owned banking institution on July 22, 1916. As aninstrument of economic development, the Bank led the industry through the years with itsagricultural modernization program and trade finance support for the country’s agriculturalexports, pioneering efforts in the Overseas Filipino Workers (OFW) remittance business, aswell as the introduction of many innovations such as Bank on Wheels, computerized banking,ATM banking, mobile money changing, domestic traveler’s checks, and electronic filing andpayment system for large taxpayers. PNB has the widest overseas office network and one of thelargest domestic branch networks among local banks.
On February 9, 2013, the Bank concluded its planned merger with Allied Banking Corporation(ABC) as approved and confirmed by the Board of Directors of the Bank and of ABC onJanuary 22 and January 23, 2013, respectively. The respective shareholders of the Bank andABC, representing at least two-thirds of the outstanding capital stock of both banks, approvedthe amended terms of the Plan of Merger of the two banks on March 6, 2012. The original Planof Merger was approved on June 24, 2008 by the affirmative vote of ABC and the Bank’srespective shareholders, representing at least two-thirds of the outstanding capital stock of bothbanks.
In February 2014, the Bank successfully completed its Stock Rights Offering (Offer) of162,931,262 common shares (Rights Shares) with a par value of P40.00 per share at a price ofP71.00 each. The Rights Shares were offered to all eligible shareholders of the Bank at theproportion of fifteen (15) Rights Shares for every one hundred (100) common shares as of therecord date of January 16, 2014. The offer period was from January 27, 2014 to February 3,2014. A total of 33,218,348 Rights Shares were sourced from the existing authorized butunissued capital stock of the Bank. The remaining 129,712,914 Rights Shares were sourcedfrom an increase in the authorized capital stock of the Bank. The Offer was oversubscribed andraised gross proceeds of P11.6 billion. The Offer strengthened the Bank’s capital position underthe Basel III standards, which took effect on January 1, 2014.
PNB successfully closed and signed a USD 150 million 3-year syndicated term loan facilitywith a large group of international and regional banks in April 2015. The facility was launchedat USD 150 million and attracted total commitments of USD 220 million at close of syndication,representing an oversubscription of about 1.5 times with lending commitments received from10 regional and international banks. This marks PNB’s return to the syndicated loan market

6
after more than a decade, the last being in 1998. The diversity of the syndicate of lenders is anaffirmation of the growing international market appetite for assets from the Philippines. Thesuccess of the transaction is a strong acknowledgment of the capital market’s confidence in thecredit strength of the Bank.
In December 2015, Allianz SE (Allianz) and PNB reached an agreement to enter into a 15-yearexclusive distribution partnership and for Allianz to acquire 51 percent of PNB Life InsuranceInc., the life insurance subsidiary of PNB. An important part of the joint venture betweenAllianz and PNB is a 15-year bancassurance agreement, which will provide Allianz exclusiveaccess to PNB’s 675 branches located nationwide, and four million customers. On June 6,2016, 12,750 common shares of stock representing 51% of the total issued andoutstanding capital stock of PNB Life was sold to Allianz. This acquisition marks Allianz’sentry into the fast-growing insurance market with an established distribution network,and enhances the Parent Company’s position in Asia Pacific. The joint venture companyoperates under the name of “Allianz PNB Life Insurance, Inc” as approved by the Securitiesand Exchange Commission on September 21, 2016.
On June 16, 2016, PNB exercised its Call Option to redeem its P6.5 billion Lower Tier2 Unsecured Subordinated Notes with an interest rate of 6.75%. The said Notes wereissued last June 15, 2011.
The Board of Directors of PNB approved a cash dividend declaration of P1.00 per share for anaggregate payout of P1.25 billion taken out of the Bank’s unrestricted Retained Earnings as ofMarch 31, 2016. The cash dividend was paid to all stockholders of record as of August 19,2016 on September 15, 2016. This marks the first dividend declaration of the Bank after its fullprivatization in 2007.
Following the approval from Bangko Sentral ng Pilipinas to issue up to P20.0 billion ofLTNCDs in tenors of 5.5 to 10 years in multiple tranches over a period of one year, PNBlaunched the initial tranche of Long Term Negotiable Certificates of Time Deposit onNovember 14, 2016. The initial offering was set at P3.0 billion but was oversubscribed at P5.38billion. The offer has a tenor of 5 years and 6 months and a coupon of 3.25% per annum. PNBis offering the LTNCDs to extend the maturity profile of the Bank’s liabilities as part ofoverall liability management and to raise long-term funds for general corporate purposes.
Reflecting the consistent improvement in its credit profile, Fitch Ratings upgraded PNB’s creditrating to one notch below investment grade in July 2016. The upgrade was based onexpectation that the Bank will maintain broadly steady asset quality, adequate capital buffers,and stable funding and liquidity profiles as it grows and potentially gains market share amidstcontinued economic improvement and pro-active regulatory oversight. The rating agencyraised PNB’s LongTerm Issuer Default Rating from BB to BB+ and its Viability Rating from'bb' to 'bb+' and maintained its stable outlook. In October 2016, Moody’s Investors Servicemaintained the investment grade rating of PNB. PNB’s long-term and short-term depositratings are Baa3/P-2 with a stable outlook.
Likewise, in affirmation of the Bank’s well-managed operations, PNB received awards fromthe Bangko Sentral ng Pilipinas (BSP) and other international award-giving bodies. In the 2014BSP Stakeholders’ Ceremony, the Bank was recognized as the Outstanding PhilPass REMITParticipant. In recognition of PNB’s innovative products, the Bank together with PNB Life wasalso accorded the Excellence in Business Model Innovation Award during the 2014 RetailBanker International Asian Trailblazer Awards for its Healthy KaPinoy Emergency Card which

7
was launched in 2013 in the market. PNB was also awarded by the Asian Banking and FinanceAwards as the “Best Website for 2015 Philippines” in honor of the Bank’s concerted efforts toaddress the ever-evolving needs of its clients. BancNet on its 25th Anniversary also awardedPNB as the “Top Inter-Bank Fund Transfer (IBFT) Transferee.” Last October 2, 2015, PNBwas awarded the Excellence in Retail Financial Services award under the “Best RemittanceBusiness in the Philippines” category by The Asian Banker. This is in recognition of thevalue-added differentiation that the Bank provides to the overseas Filipinos beyond remittanceto include financial services such as Own-a-Philippine Home Loan, Pangarap Loan andOverseas Bills Payable System as well as other innovative products like HealthyKaPinoy medical card and ATM Safe insurance.
As a clear demonstration of the Bank’s commitment in offering competitive financingstructures to clients while contributing to economic development and nation building, PNBand its wholly-owned subsidiary PNB Capital and Investment Corporation wererecognized internationally last October 30, 2015 when they won four awards from TheAsset Triple A Asia Infrastructure Awards in Hong Kong. The awards were given forthe following deals: a) Best Project Finance Deal of the Year and Best Transport Deal, both forthe P31 billion project finance syndicated term loan facility for Metro Manila Skyway Stage 3Project; b) Best Transport Deal, Highly Commended for the P23.3 billion financing facilityfor GMR Megawide Cebu Airport Corporation Project; and c) Best Power Deal for the P33.3billion financing facility for Pagbilao Energy Corporation Project.
Last February 26, 2016, PNB was honored with a Silver Anvil for its 2014 Annual Reportduring the Public Relations Society of the Philippines’ (PRSP) Gabi ng Parangal 51st AnvilAwards held at the Makati Shangri-La Hotel with the theme, “Exemplifying Filipino BankingExcellence.” The 2014 Annual Report showcased the improved business and financial resultsbrought about by an enhanced customer focus, improved profitability, higher asset quality, anda strengthened synergy between PNB and the former Allied Banking Corporation in its secondyear of merger.
PNB’s Bank on Wheels was likewise recognized by three (3) international award-giving bodies:a) the Most Innovative Banking Service - Philippines 2016 award from the Global BusinessOutlook Awards; b) the Most Innovative Bank, Philippines 2016 award from InternationalFinance Magazine (IFM) Awards; and c) the Most Innovative Banking Product Philippines2016 from the Global Banking and Finance Review Awards. PNB relaunched the Bank onWheels in December 2015 to meet the evolving needs of its customers and provide them withbanking services when and where they need it most.
Last July 20, 2016, PNB received the “New Consumer Lending Product of the Year Award” forits SSS Pension Loan Program in the Asian Banking and Finance Retail Banking Awards 2016,held in Singapore.
During the SSS Balikat ng Bayan Award Ceremonies last Sept 2, 2016, PNB was awarded asBest OFW Collecting Partner. At the same time, PNB Savings Bank was awarded as BestCollecting Partner in the thrift bank category. The Best Collection Partner distinction isawarded to financial institutions that are consistently among the top with the highest collections;have the biggest volume of transactions and widest coverage.

8
B. Business Description
Products and Services
PNB, through its Head Office and 675 domestic branches/offices and 73 overseas branches,representative offices, remittance centers and subsidiaries, provides a full range of bankingand financial services to large corporate, middle-market, small and medium enterprises(SMEs) and retail customers, including OFWs, as well as to the Philippine NationalGovernment, national government agencies (NGAs), local government units (LGUs) andGovernment Owned and Controlled Corporations (GOCCs) in the Philippines. PNB’sprincipal commercial banking activities include deposit-taking, lending, trade financing,foreign exchange dealings, bills discounting, fund transfers/remittance servicing, assetmanagement, treasury operations, comprehensive trust services, retail banking and otherrelated financial services.
Its banking activities are undertaken through the following groups within the Bank, namely:
Institutional Banking SectorThe Bank’s Institutional Banking Sector (IBS) is responsible for credit relationships withlarge corporate, middle-market and SME customers as well as with Government andGovernment Owned & Controlled Corporation (GOCC) and financial institutions.
Retail Banking SectorThe Retail Banking Group (RBS) principally focuses on retail deposit products (i.e., currentaccounts, savings accounts and High Cost accounts) and services. While the focal point is thegeneration of low cost funding for the Bank’s operations, the RBS also concentrates on thecross- selling of consumer finance products, trust products, fixed income products, creditcards and bancassurance products to existing customers and referred customers bytransforming its domestic branch distribution channels into a sales-focused organization.
Consumer FinanceThe Bank’s consumer financing business is seen to be a major contributor to its revenuestream in the medium term. PNB Savings Bank (PNBSB) serves as the consumer arm ofPNB. Strategic initiatives have been undertaken to put in place the proper infrastructure tosupport PNBSB’s business growth. To further propel consumer loans growth, a number ofmarketing campaigns, aimed at generating business and increasing product awareness, wereinitiated.
Treasury SectorThe Treasury Sector primarily manages the liquidity and regulatory reserves of the Bank andrisk positions on interest rates and foreign exchange borne out from the daily inherentoperations in deposit taking and lending and from proprietary trading. This includes anoversight on risk positions of its foreign branches and subsidiaries.
Global Filipino Banking GroupThe Global Filipino Banking Group covers the Bank’s overseas offices which essentiallyprovide convenient and safe remittance services to numerous OFWs abroad and full bankingservices in selected jurisdictions. It also provides consumer financing through the PangarapLoan and Own a Philippine Home Loan which are available to OFWs.

9
Trust Banking GroupThe Bank, through its Trust Banking arm provides a full range of Trust, Agency, andFiduciary products and services designed to serve a broad spectrum of market segments. Itspersonal trust products and services include personal management trust, investmentmanagement, estate planning, guardianship, and life insurance trust. Corporate trust servicesand products include corporate trusteeship, securitization, portfolio management,administration of employee benefit plans, pension and retirement plans, and trust indentureservices. Trust agency services include such roles as bond registrar, collecting and payingagent, loan facility agent, escrow agent, share transfer agent, and receiving bank.
2. Competition
In the Philippines, the Bank faces competition in all its principal areas of business,from both Philippine (private and government-owned) and foreign banks, as well asfinance companies, mutual funds and investment banks. The competition that the Bankfaces from both domestic and foreign banks was in part a result of the liberalization of thebanking industry with the entry of foreign banks under Republic Act (R.A.) 7721 in 1994and R.A. 10641 in 2014, as well as, the recent mergers and consolidations in thebanking industry. As of the latest available data from the BSP, there were 42universal and commercial banks, of which 17 are private domestic banks, 3 aregovernment banks and 22 are branches or subsidiaries of foreign banks. Some competitorbanks have greater financial resources, wider networks and greater market share than PNB.Said banks also offer a wider range of commercial banking services and products; havelarger lending limits; and stronger balance sheets than PNB. To maintain its marketposition in the industry, the Bank offers diverse products and services, invests intechnology, leverages on the synergies within the Lucio Tan Group of Companies and withits Government customers, as well as builds on relationships with the Bank’s otherkey customers.
The Bank also faces competition in its operations overseas. In particular, the Bank’sstronghold in the remittance business in 16 countries in North America, Europe, theMiddle East and Asia is being challenged by competitor banks and non-banks. As ofDecember 31, 2016, the Bank has a distribution network of 675 branches and offices and1,051 ATMs nationwide. The Bank is the fourth largest local private commercial bank inthe Philippines in terms of local branches and the fourth largest in terms of consolidatedtotal assets, net loans and receivables, capital and deposits. In addition, it has the widestinternational footprint among Philippine banks spanning Asia, Europe, the Middle Eastand North America with its overseas branches, representative offices, remittance centersand subsidiaries.

10
3. Revenue Derived from Foreign Operations
The Bank and its subsidiaries (the Group) offer a wide range of financial services in thePhilippines. The percentage contributions of the Group’s offices in Asia, the Canada andUSA, United Kingdom and Other European Union Countries to the Group’s revenue, for theyears 2016, 2015, 2014 are as follows:
2016 2015 2014Asia (excluding the Philippines)/
Middle East4% 5% 4%
Canada and USA 2% 2% 2%United Kingdom & Other
European Union Countries1% 1% 1%
Please refer to Note 6 of the Audited Financial Statements.
4. New Products and Services
The Bank launched the following products and services in 2016:
Corporate Bills PaymentCorporate Bills Payment is a collection service wherein corporate billers/merchants outsourcethe administrative task of collecting payments from their corporate payors/customers to theBank. Through Auto Debit Arrangement (ADA), business entities, as the enrolledAccountholder/s (payors), are able to settle or pay, among others, bills/premiums/service feesand charges/membership dues (payables) by authorizing the Bank to charge the amountthereof against their enrolled current/savings account/s maintained with the Bank.
ATM Switch MigrationAll PNB ATMs consolidated under one ATM switch, providing a more robust and highercapacity machine for customers, resulting to faster processing time and less downtime.
PNB-Meralco ADA FacilityPNB launched in April 2016, Meralco Automatic Debit Arrangement (ADA) Bills Payment,an automated payment facility that allows PNB customers to settle their monthly Meralcobills by authorizing PNB to charge the said amount against their enrolled depositaccount.
One-Time Password (OTP) for online credit card transactionsPNB has implemented a OneTime Password (OTP) authentication for all PNB MasterCardand Visa cardholders effective April 27, 2016 to strengthen the security for its online creditcard transactions.
Use of Lendr for SSS Loan ApplicationsIn partnership with PLDT, PNB launched the country’s first digital and mobile lendingfacility for SSS pensioners in May 2016. The new facility is powered by a platform calledLendr. This allows SSS pensioners to apply for SSS Pension Loans via mobile and onlineapplications.

11
UITF ATM FacilityUITF ATM facility is now available in all PNB branches. A first and only one of its kindin the Philippines, the UITF ATM Facility offers investments in UITFs via the ATMchannel. It effectively expands the accessibility of PNB UITF products and enhances PNB’scompetitive position vis-a-vis other banks. The launch was marked by social media postingsand a print ad break on June 7 and 8, respectively.
PNB Mobile Banking AppThe PNB Mobile App was released to the Apple and Google app stores in October 2016.Mobile apps are increasingly becoming a standard offering of banking and financialinstitutions, and a service expected by customers to be part of their daily bankingrequirements. With the PNB Mobile Banking App, it is expected that it will position the Bankinto the digital age while providing a flexible and robust platform that allows the Bank torespond swiftly to the ever changing expectations of its clients. The app allows clients to dotheir banking transactions such as account balance and transaction inquiry, funds transfers,pay bills and order checkbooks. It also provides services that leverage on the everyday powerof the mobile phone, including Touch ID verification, personalization, and integration oflocation based services for clients to find PNB ATMs and branches.
Collection Solution for Electric CooperativesPNB aims to enhance the collections efficiency of Electric Cooperatives by deploying amobile application to increase the number of collection agents.
EMV UpgradeThe Bank has completed its systems upgrade to be able to support the new EMV standardsfor debit and credit card payment systems. EMV chip based payments is a global standard formore secure alternatives to traditional magnetic stripe payment cards. All elements of theBank’s payment system – ATM and POS terminals, debit cards and credit cards are now fullycertified to be compliant to the EMV standard.
5. Related Party Transactions (Please refer to Item 12. Certain Relationships and RelatedTransactions)
6. Patents, Trademarks, Licenses, Franchises, Concessions and Royalty Agreements
The Bank’s operations are not dependent on any patents, trademarks, copyrights, franchises,concessions, and royalty agreements.
7. Government Approval of Principal Products or Services
Generally, electronic banking (e-banking) products and services require BSP approval. Newdeposit products require notification to the BSP. The Bank has complied with theaforementioned BSP requirements.
8. Estimate of Amount Spent for Research and Development Activities
The Bank provides adequate budget for the development of new products and services whichincludes hardware and system development, continuous education and market research.Estimated amount spent for 2016, 2015 and 2014 totaled P428.5 million, P372.7 million andP373.4 million, respectively.

12
9. Number of Employees
The total employees of the Bank as of December 31, 2016 is 8,357 wherein 3,921 wereclassified as Bank officers and 4,436 as rank and file employees broken down as follows:
TotalOfficers:
Vice President and up 144Senior Assistant Vice President to Assistant Manager 3,777Sub-total 3,921
Rank and File 4,436Total 8,357
The Bank shall continue to pursue selective and purposive hiring strictly based on businessrequirements. The Bank has embarked on a number of initiatives to improve operationalefficiency. Foremost among these initiatives are the upgrade of its Systematics core bankingsystem and the new branch banking system which are expected to bring about a gradualreduction in the number of employees in the support group upon full implementation.
With regard to the Collective Bargaining Agreement (CBA), the Bank’s regular rank and fileemployees are represented by two (2) existing unions under the merged bank, namely: AlliedEmployee Union (ABEU) and Philnabank Employees Association (PEMA).
The Bank has not suffered any strikes, and the Management of the Bank considers itsrelations with its employees and the Union as harmonious and mutually beneficial.
10. Risk Management
PNB’s Board of Directors have the ultimately responsibility and play a pivotal role in bankgovernance through their focus on two (2) factors that will ultimately determine the successof the bank: responsibility for the bank’s strategic objectives and assurance that such will beexecuted by choice of talents. A sound, robust and effective enterprise risk managementsystem coupled with global best practices were recognized as a necessity and are the primeresponsibility of the Board and senior management. The approach to risk is founded onstrong corporate governance practices that are intended to strengthen the enterprise riskmanagement of PNB, while positioning PNB Group to manage the changing regulatoryenvironment in an effective and efficient manner.
Strong independent oversight has been established at all levels within the group. The bank’sBoard of Directors has delegated specific responsibilities to various board committees whichare integral to the PNB’s risk governance framework and allow executive management,through management committees, to evaluate the risks inherent in the business and to managethem effectively.

13
The approach to managing risk is outlined in the bank’s Enterprise Risk Management (ERM)Framework which creates the context for setting policies and standards, and establishing the rightpractices throughout the PNB Group. It defines the risk management processes and sets out theactivities, tools, and organizational structure to ensure material risks are identified, measured,monitored and managed.
Since 2006 the ERM Framework, with regular reviews and updates, has served PNB well and hasbeen resilient through economic cycles. The organization has placed a strong reliance on this riskgovernance framework and the three lines-of-defense model (see Figure), which are fundamental toPNB’s aspiration to be world-class at managing risk.
While the first line of defense in risk management lies primarily on the bank’s risk taking units aswell as the bank’s support units, the Risk Management Group is primarily responsible for themonitoring of risk management functions to ensure that a robust risk-oriented organization ismaintained.
The risk management framework of the Bank is under the direct oversight of the Chief Risk Officer(CRO) who reports directly to the Risk Oversight Committee. The CRO is supported by DivisionHeads with specialized risk management functions to ensure that a robust organization ismaintained. The Risk Management Group is independent from the business lines and organized intothe following divisions: Credit Risk Division, BASEL and ICAAP Implementation Division,

14
Market & ALM Division, Operational Risk Division, Information Security / Technology RiskManagement, Trust and Fiduciary Risk Division and Business Intelligence & Warehouse Division.Each division monitors the implementation of the processes and procedures that support the policiesfor risk management applicable to the organization. These board approved policies, clearly definethe kinds of risks to be managed, set forth the organizational structure and provide appropriatetraining necessary to manage and control risks.
The bank’s governance policies also provide for the validation, audits & compliance testing, tomeasure the effectiveness and suitability of the risk management structure. RMG also functions asthe Secretariat to the Risk Oversight Committee which meets monthly to discuss the immediateprevious month’s total risk profile according to the material risks defined by the bank in its ICAAPdocument.
Further, each risk division engages with all levels of the organization among its business andsupport groups. This ensures that the risk management and monitoring is embedded at the momentof origination.
The risk management system and the directors’ criteria for assessing its effectiveness are revisitedon an annual basis and limit settings are discussed with the Business Units and presented to theRisk Oversight Committee for endorsement for final Board Approval.
In line with the integration of the BSP required ICAAP (internal capital adequacy assessmentprocess) and risk management processes, PNB currently monitors 9 Material Risks (three for Pillar1 and six for Pillar 2). These material risks are as follows:
Pillar 1 Risks:1. Credit Risk (includes Counterparty and Country Risks)2. Market Risk3. Operational Risk
Pillar 2 Risks:4. Credit Concentration Risk5. Interest Rate Risk in Banking Book (IRRBB)6. Liquidity Risk7. Reputational / Customer Franchise Risk8. Strategic Business Risk9. Cyber Security Risk
Pillar 1 Risk Weighted Assets are computed based on the guidelines set forth in BSP Circular No.538 using the Standard Approach for Credit and Market Risks and Basic Indicator Approach forOperational Risks. Discussions that follow below are for Pillar 1 Risks with specific discussionsrelating to Pillar 2 risks mentioned above:

15
Risk Categories and DefinitionsWe broadly classify and define risks into the following categories, and manage the risks accordingto their characteristics. These are monitored accordingly under the enterprise ICAAP 2016 program:
RiskCategory
Risk Definition Risk Monitoring Process Risk ManagementTools
Credit Risk(includingCreditConcentration Risks andCounterpartyRisks)
Credit risk is the risk toearnings or capital that arisesfrom an obligor/s, customer/sor counterparty’s failure toperform and meet the terms ofits contract.Credit Concentration Risk ispart of credit risk thatmeasures the riskconcentration to any singlecustomer or group of closely-related customers with thepotential threat of losseswhich are substantial enoughto affect the financialsoundness of a financialinstitution (BSP Circular 414)
Loan Portfolio Analysis Credit Dashboards Credit Review Credit Model Validation
Trend Analysis(Portfolio / PastDue and NPLLevels
Regulatory andInternal Limits
Stress Testing Rapid Portfolio
Review CRR Migration Movement of
Portfolio Concentrations
and DemographicsReview
Large ExposureReport
CounterpartyLimits Monitoring
Adequacy of LoanLoss ReservesReview Specialized Credit
Monitoring(Power, RealEstate)
Market Risk Market risk is the risk toearnings or capital arisingfrom adverse movements infactors that affect the marketvalue of financial instruments,products and transactions inan institution’s overallportfolio, both on or offbalance sheet and contingentfinancial contracts. Marketrisk arises from market-making, dealing and positiontaking in interest rate, foreignexchange, equity, andcommodities market.
Value at RiskUtilization
Results of Marking toMarket
RisksSensitivity/DurationReport
Exposure toDerivative/StructuredProducts
VAR Limits Stop Loss Limits Management
Triggers Duration Report ROP Exposure
Limit Limit to Structured
Products 30-day AFS
Holding Period Exception Report
on Traders’ Limit Exception Report
on Rate Tolerance

16
RiskCategory
Risk Definition Risk Monitoring Process Risk ManagementTools
LiquidityRisk
Liquidity risk is generallydefined as the current andprospective risk to earnings orcapital arising from an FI’sinability to meet itsobligations when they comedue.
Funding Liquidity Plan Liquidity Ratios Large Fund Providers MCO Liquid Gap Analysis
MCO Limits Liquid Assets
Monitoring Stress testing Large Fund
Provider Analysis Contingency
PlanningInterest RateRisk in theBankingBooks(IRBB)
Interest rate risk is the currentand prospective risk toearnings or capital arisingfrom movements in interestrates. The amount at risk is afunction of the magnitude anddirection of interest ratechanges and the size andmaturity structure of themismatch position. (BSP Circ510, dated 03 Feb 2006)
Interest Rate GapAnalysis
Earnings at RiskMeasurement
Duration basedEconomic Value ofEquity
EAR Limits Balance Sheet
Profiling Repricing Gap
Analysis Duration based
Economic Value ofEquity Stress Testing
OperationalRisk
Operational Risk refers to therisk of loss resulting frominadequate or failed internalprocesses, people andsystems; or from externalevents. This definitionincludes Legal Risk, butexcludes Strategic andReputational Risk.Operational Risk is inherent inall activities, products andservices, and cuts acrossmultiple activities andbusiness lines within thefinancial institution and acrossthe different entities in abanking group orconglomerate where thefinancial institution belongs.(BSP Circular 900)
Risk Identification Risk Measurement Risk Evaluation (i.e.
Analysis of Risk) Risk Management ( i.e.
Monitor, Control orMitigate Risk)
Monitoring of Pillar IIRisks fall under thepurview of OperationalRisk Management:
1. Risk Identification – RiskMaps
2. Risk Measurement andAnalysis – ICAAP RiskAssessment
Internal Control Board Approved
Operating Policiesand ProceduresManuals
Board ApprovedProduct Manuals
Loss EventsReport (LER)
Risk and ControlSelf-Assessment(RCSA)
Key RiskIndicators (KRI)
BusinessContinuityManagement(BCM)
Statistical Analysis
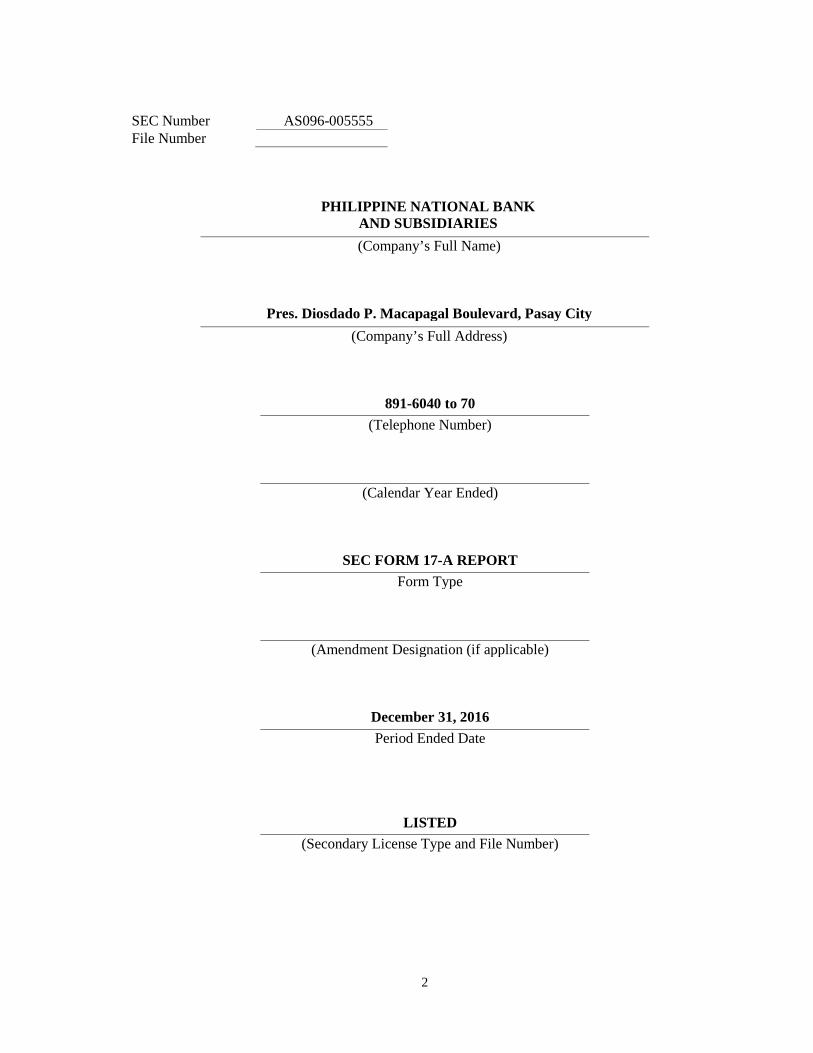
Included in the Operational Risks:ReputationalRisk(CustomerFranchiseRisk)
Reputational risk is thecurrent and prospectiveimpact on earnings or capitalarising from negative publicopinion.Customer franchise risk isdefined as the failure to find,
Risk Identification Risk Measurement Risk Measurement Risk Evaluation (i.e.
Analysis of Risk) Risk Management
( i.e. Monitor, Control
Account ClosuresReport Service Desk
Customer IssuesReport/CustomerComplaintsMonitoring Report
17
attract, and win new clients,nurture and retain those theBank already has, and enticeformer clients back into thefold as well as the failure tomeet client’s expectation indelivering the Bank’s productsand services.
or Mitigate Risk)Monitoring of Pillar IIRisks fall under thepurview of OperationalRisk Management: Risk Identification –
Risk Maps Risk Measurement
and Analysis –ICAAP RiskAssessment
Major Factors considered: Products Technology People Policies and Processes Stakeholders
(including customerand regulators)
MysteryCaller/Shopper Evaluation/ Risk
Mitigation ofnegative mediacoverage Public Relations
Campaign Review of Stock
Price performance Fraud
ManagementProgram
StrategicBusinessRisks
Strategic business risk is thecurrent and prospectiveimpact on earnings or capitalarising from adverse businessdecisions, improperimplementation of decisions,or lack of responsiveness toindustry changes.
ManagementProfitabilityReports – Budgetsvs Actuals
Benchmarking vis-a-vis Industry,Peers
EconomicForecasting
Annual StrategicPlanning Exercise
CyberSecurityRisk
Cyber Risk is the current andprospective impact onearnings, reputation,customer franchise, and/orcapital arising frominformation security threatsof attack on the bank’s digitalfootprint through (not limitedto) the following: Breaches in data security Sabotage on online (web-
based) activities(Ransomware, DDOS,etc)
Common threats (spam,phishing, malware,spoofing viruses,spoofing, etc)
Scams and Frauds (Socialengineering, identifythefts, email scams, etc)
Risk AssetRegister
Incident ReportingManagement
InformationSecurity PolicyFormulation
Risk Assessment Information
SecurityManagementSystemImplementation
Continuousinfosec / cyber riskawarenesscampaigns
Network SecurityProtection
Limits on AccessPrivileges
Scanning ofoutbound andinbound digitaltraffic

18
Regulatory Capital Requirements under BASEL II – Pillar 1
The bank’s Capital Adequacy Ratio as of end of December 2016 stands at 16.65% on aconsolidated basis while the bank’s Risk Weighted Assets (RWA) as of end 2016 amounted toP504,101million composed of P461,275 million (Credit Risk Weighted Assets-CRWA), P2,753million (Market Risk Weighted Assets-MRWA) and ), P40,073 million (Operational RiskWeighted Assets-ORWA).
The Bank's total regulatory requirements for the four (4) quarters for 2016 are as follows:
Consolidated Weighted Exposures (Quarters 2016)
(Amounts in Php million) As of Dec 31 As of Sept 30 As of June 30 As of Mar 31
CRWA 461,274.99 447,846.23 450,360.19 423,718.80
MRWA 2,752.61 1,833.28 4,759.11 2,587.81
ORWA 40,073.47 40,073.47 40,073.47 40,073.47
Total Risk-Weighted Asset 504,101.07 489,752.98 495,192.77 466,380.08
Common Equity Tier 1Ratio
15.80% 16.65 16.50 16.91
Capital Conservation Buffer 9.80% 10.65 10.500 10.91
Tier 1 Capital Ratio 15.80% 16.65 16.50 16.91
Total Capital AdequacyRatio
16.65% 17.53% 17.34% 17.77%

19
Credit Risk-Weighted Assets as of December 31, 2016 (In Million Pesos)The Bank adopts the standardized approach in quantifying the risk-weighted assets. Credit riskexposures are risk weighted based on third party credit assessments of Fitch, Moody’s, Standard &Poor’s and PhilRatings agencies. The ratings of these agencies are mapped in accordance with theBSP’s standards. The following are the consolidated credit exposures of the Bank and thecorresponding risk weights:
P In Millions
Exposure,Net of
SpecificProvision
Exposurescovered by
CreditRisk
Mitigants*
NetExposure 0% 20% 50% 75% 100% 150%
Cash & CashItems
11,770 11,770 11,504 266
Due from BSP 127,397 127,397 127,397
Due from OtherBanks
25,897 25,897 16,421 7,848 1,628
Financial Assetat FVPL
33 33 33
Available forSale
68,384 11,232 57,153 11,134 9,349 18,259 18,410
Held to Maturity(HTM)
24,516 6,290 18,226 6,811 11,150 265
Unquoted DebtSecurities
3,277 3,277 2,731 546
Loans &Receivables
414,784 21,636 393,148 2,749 41,376 9,650 25,016 313,005 1,352
Loans andReceivablesArising fromRepurchaseAgreements,SecuritiesLending andBorrowingTransactions
2,742 2,742 2,742
Sales ContractsReceivable
5,748 5,748 5,103 645
Real & OtherPropertiesAcquired
9,921 9,921 9,921
Other Assets 32,171 32,171 32,171
Total On-Balance SheetAsset
726,640 39,158 687,482 162,337 67,412 49,638 25,016 371,161 11,918
Total RiskWeighted Asset -On-BalanceSheet
- 13,482 24,819 18,762 371,161 17,877

20
P In Millions
Exposure,Net of
SpecificProvision
Exposurescovered by
CreditRisk
Mitigants*
NetExposure 0% 20% 50% 75% 100% 150%
Total RiskWeighted Asset -Off-BalanceSheet Asset
0 0 32 173 12,848 0
CounterpartyRisk WeightedAsset in BankingBook
0 305 1,317 0 0 0
CounterpartyRisk WeightedAsset in TradingBook
0 31 246 0 221 0
* Credit Risk Mitigants used are cash, guarantees and warrants.
Market Risk-Weighted Assets as of December 31, 2016The Bank’s regulatory capital requirements for market risks of the trading portfolio are determinedusing the standardized approach (“TSA”). Under this approach, interest rate exposures are chargedboth for specific risks and general market risk. The general market risk charge for trading portfoliois calculated based on the instrument’s coupon and remaining maturity with risk weights rangingfrom 0% for items with very low market risk (i.e., tenor of less than 30 days) to a high of 12.5% forhigh risk-items (i.e., tenor greater than 20 years) while capital requirements for specific risk are alsocalculated for exposures with risk weights ranging from 0% to 8% depending on the issuer’s creditrating. On the other hand, equities portfolio are charged 8% for both specific and general marketrisk while FX exposures are charged 8% for general market risks only.
Capital Requirements by Market Risk Type under Standardized ApproachAmount inMillions
CapitalCharge
(a)
Adjusted Capital Chargeb= a*125% 1/
(b)
Market Risk WeightedExposuresc= b*10 2/
(c)
Interest RateExposures
128.085 160.107 1,601.068
Specific Risk 30.709 38.386 383.860
General MarketRisk
97.376 121.72 1,217.28
Equity Exposures 4.351 5.439 54.387Foreign ExchangeExposures
87.772 109.715 1,097.151
Total 220.208 275.261 2,752.606Notes:1/ Capital charge is multiplied by 125% to be consistent with BSP required minimum CAR of 10%,which is 25% higher than the Basel minimum of 8%.2/ Adjusted capital charge is multiplied by 10 (i.e. the reciprocal of the minimum capital ratio of10%)
21
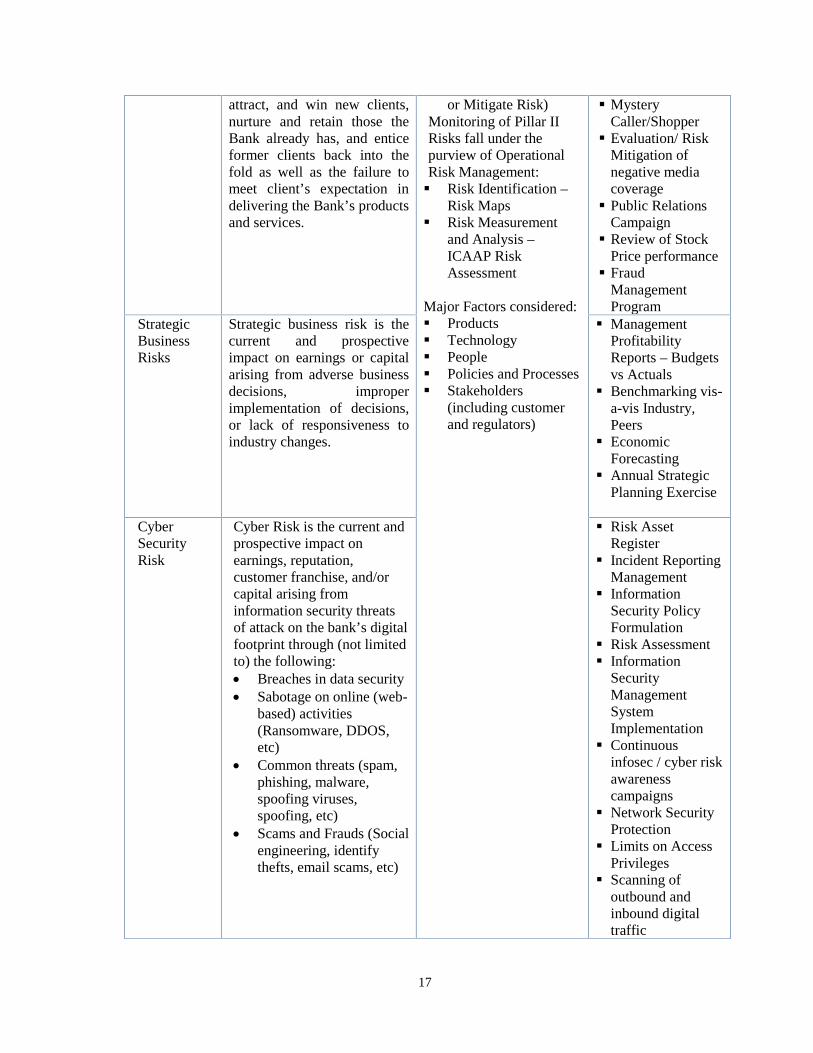
The following are the Bank’s exposure with assigned market risk capital charge.
Interest Rate Exposures consist of specific risk and general market risk.
Specific RiskSpecific Risk which reflects the type of issuer of the held for trading (HFT) portfolio isP30.709million, of 71% is contributed by the securities with 1.6% risk weight issued by Republicof the Philippines (ROP) with tenor over 2 years while 29% is attributable to securities rated belowBBB- and unrated securities with 8% riskweight.
ROPs compose 84% of the portfolio with applicable risk weight ranging from 0.25% and 1.6%depending on the tenor of the securities. On the other hand, the Bank’s holdings in Pesodenominated government securities which is estimated at 8% of the portfolio have zero risk weight.The remaining portfolio with applicable 8% risk weight consists of all other debtsecurities/derivatives that are issued by other entities and rated between AAA and BBB- (1%) aswell as those rated below BBB- and unrated securities (7%)
Part IV.1aINTEREST RATE EXPOSURES – SPECIFIC RISK
(Amounts in Php million) Positions Risk Weight0.00% 0.25% 1.0% 1.60% 8.00% Total
PHP-denominated debt securities issued by the PhilippineNational Government (NG) and BSP
Long 62.190Short 62.190
FCY-denominated debt securities issued by the PhilippineNG/BSP
Long 1,247.145 1,308.327
Short 40.435Debt securities/derivatives with credit rating of AAA toBBB-issued by other entities
Long 8.285
ShortAll other debt securities/derivatives that are below BBB- andunrated
LongShort 112.418
Subtotal Long 62.190 1,247.145 1,316.612 112.418Short 62.190 0.0 40.435
Risk Weighted Exposures [Sum of long and short positionstimes the risk weight]
0.0 0.003 0.0 21.713 8.993 30.709
Specific Risk Capital Charge for Credit-Linked Notes andSimilar ProductsSpecific Risk Capital Charge for Credit Default Swaps andTotal Return SwapsSPECIFIC RISK CAPITAL CHARGE FOR DEBTSECURITIES AND DEBT DERIVATIVES
0.0 0.003 0.0 21.713 8.993 30.709

22
General Market Risk – PesoThe Bank's total General Market Risk of its Peso debt securities and interest rate derivativeexposure is P4.462million. In terms of weighted positions, the greater portion (57%) of the Bank’scapital charge comes from the Over 1month to 3 months bucket at P2.508million as well as Over7years to 10 years bucket (32%) at P1.419million or a combined capital charge of P3.927million.The remaining weighted positions (10%) are sparsely distributed over the remaining buckets.
Currency: PESOPART IV.1d GENERAL MARKET RISK (Amounts in Php million)Zone Times Bands Debt Securities & Debt
Derivatives/Interest RateDerivatives Risk
Weight
Weighted Positions
Coupon 3% or more Coupon less than 3% Total Individual PositionsLong Short Long Short
1 1 month or less 1 month or less 11,222.445 1,248.400 0.00% - -Over 1 month to 3months
Over 1 month to 3months 1,254.127 -
0.20%2.508 -
Over 3 months to 6months
Over 3 months to 6months 2.981 2.981
0.40%0.012 0.012
Over 6 months to 12months
Over 6 months to 12months 1.019 0.491
0.70%0.007 0.003
2 Over 1 year to 2years
Over 1.0 year to 1.9years 2.100 -
1.25%0.026 -
Over 2 years to 3years
Over 1.9 years to 2.8years 2.732 -
1.75%0.048 -
Over 3 years to 4years
Over 2.8 years to 3.6years - -
2.25%- -
3 Over 4 years to 5years
Over 3.6 years to 4.3years 3.014 -
2.75%0.083 -
Over 5 years to 7years
Over 4.3 years to 5.7years 0.817 0.817
3.25%0.027 0.027
Over 7 years to 10years
Over 5.7 years to 7.3years 37.844 -
3.75% 1.419-
Over 10 years to 15years
Over 7.3 years to 9.3years 5.137 -
4.50%0.231 -
Over 15 years to 20years
Over 9.3 years to 10.6years
13.715 13.715
5.25%
0.720 0.720Over 20 years Over 10.6 years to 12
years 1.117 -6.00%
0.067 -Over 12 years to 20years - -
8.00%- -
Over 20 years 1.117 1.117 12.50% - -Total 12,547.047 1,266.404 5.148 0.762
Overall Net Open Position 4.386Vertical Disallowance .076Horizontal Disallowance -TOTAL GENERAL MARKET RISK CAPITAL CHARGE 4.462

23
General Market Risk – US DollarThe capital charge on the Bank's General Market Risk from dollar-denominated exposures isP89.188million. The exposure is concentrated under the Over 7 to 10 years buckets with risk weightof 3.75% and corresponding capital charge of at P45.184million. The balance is distributed acrossthe other time buckets up to Over 20 years with capital charge ranging from P0.532million toP2.783million.
Currency: USDPART IV.1d GENERAL MARKET RISK (Amounts in Php million)Zone Times Bands Debt Securities & Debt
Derivatives/Interest RateDerivatives Risk
Weight
Weighted Positions
Coupon 3% or more Coupon less than 3% Total Individual PositionsLong Short Long Short
1 1 month or less 1 month or less10,624.459 11649.22 0.00% - -
Over 1 month to 3months
Over 1 month to 3months 9,841.445 10627.111 0.20% 19.683 21.254
Over 3 months to 6months
Over 3 months to 6months 695.864 0 0.40% 2.783 -
Over 6 months to 12months
Over 6 months to 12months 76.054 0 0.70% 0.532 -
2 Over 1 year to 2 years Over 1.0 year to 1.9years - 0 1.25% - -
Over 2 years to 3years
Over 1.9 years to 2.8years 32.931 0 1.75% 0.576 -
Over 3 years to 4years
Over 2.8 years to 3.6years 2,778.848 2739.5942 2.25% 62.524 61.641
3 Over 4 years to 5years
Over 3.6 years to 4.3years - 0 2.75% - -
Over 5 years to 7years
Over 4.3 years to 5.7years - 0 3.25% - -
Over 7 years to 10years
Over 5.7 years to 7.3years 1,204.917 0 3.75% 45.184 -
Over 10 years to 15years
Over 7.3 years to 9.3years 6,485.441 6447.5734 4.50% 291.845 290.141
Over 15 years to 20years
Over 9.3 years to 10.6years - 0 5.25% - -
Over 20 years Over 10.6 years to 12years 33.330 12.574468 6.00% 2.000 0.754Over 12 years to 20years - 0 8.00% - -Over 20 years - 0 12.50% - -
Total 31,773.290 31,476.073 425.1 373.8Overall Net Open Position 51.338
Vertical Disallowance37.222
Horizontal Disallowance 0.629TOTAL GENERAL MARKET RISK CAPITALCHARGE 89.188

24
General Market Risk – Third currenciesThe Bank is likewise exposed to various third currencies contracts most of them are in less than 30days thus carries a 0% risk weight. The combined general market risk charge for contracts inSingapore Dollar (SGD) and Hongkong Dollar (HK) is P3.725million with risk weight rangingfrom 0.20% and 0.40%.
PART IV.1d GENERAL MARKET RISK (Amounts in Php million)
Currency Time Bands Total Debt Securities& DebtDerivatives/InterestRate Derivatives
Weighted PositionsOverall NetOpenPosition
Vertical disallowance
Horizontaldisallowancewithin
TotalGeneralMarket riskcapitalcharge
Long Short RiskWeight
Long Short
SGD 1 month orless
- 17.178 0.00% - -
- -
Over 1 monthsto 3 months
- 173.9800.20%
- 0.348
- -
TOTAL - 191.158 0.348
- - 0.348
HKD 1 month orless 373.435 1,907.951 0.00% - -Over 1 monthsto 3 months
- 297.826 0.20% - 0.596Over 3 monthsto 6 months
- 695.428 0.40% - 2.782Over 6 monthsto 12 months
0.70%
-
373.435 2,901.205 3.377- -
3.377
Total 3.725

25
Equity Exposures
The Bank’s holdings are in the form of common stocks traded in the Philippine Stock Exchange,with 8% risk weight both for specific and general market risk. The Bank’s capital charge forequity weighted positions is P4.351million or total risk-weighted equity exposures ofP54.387million.
Item Nature of Item Positions Stock MarketsPhilippines(Amounts in Phpmillion)
A.1 Common Stocks Long 27.194
ShortA.10 TOTAL Long 27.194
Short -B. Gross (long plus short) positions (A.10) 27.194C. Risk Weights 8%D. Specific risk capital (B. times C.) 2.175
E. Net long or short positions 27.194F. Risk Weights 8%G. General market risk capital charges (E. times F.) 2.175H. Total Capital Charge For Equity Exposures (sum of D. and G.) 4.351I. Adjusted Capital Charge For Equity Exposures (H. times 125%) 5.439J. TOTAL RISK-WEIGHTED EQUITY EXPOSURES (I. X 10) 54.387

26
Foreign Exchange Exposures
The Bank's exposure to Foreign Exchange (FX) Risk carries a capital charge of P1,097.251 million.This includes P370million arising from exposure in Non-Deliverable Forwards (NDF)s) whichcarries a 4% risk weight while P724.251million is from Foreign Exchange Exposures with 8% riskweight in FX assets and FX liabilities in USD, and third currencies not limited to JPY, CHF, GBP,EUR, CAD, AUD, SGD and other minor currencies.
Part IV. 3 FOREIGN EXCHANGE EXPOSURES (as of Dec 31, 2016)Closing Rate USD/PHP: 47.118
Nature of Item Currency In Million USD Equivalent In MillionPesos
Net Long/(Short) Position(excluding options)
Net Delta-WeightedPositions ofFX Options
Total NetLong/(Short)Positions
Total NetLong/(Short)PositionBanks Subsidiaries
/Affiliates1 2 3 4=1+2+3 5
A. CurrencyA.1 U.S. Dollar USD (14.266) 0.271 (13.995) -695.822A.2 Japanese Yen JPY 0.233 - 0.233 11.605A.3 Swiss Franc CHF 0.144 - 0.144 7.166A.4 Pound Sterling GBP (0.572) - (0.572) -28.429A.5 Euro EUR 0.822 - 0.822 40.866A.6 Canadian Dollar CAD 0.079 - 0.079 3.917A.7 Australian Dollar AUD 0.091 - 0.091 4.510A. 8 Singapore Dollar SGD 0.093 - 0.093 4.641A. 9 Foreign currencies not separately specified above 0.628 - 0.628A. 10 Sum of net long positions 103.912A.11 Sum of net short positions 724.251B. Overall net open positions 1/ 724.251C. Risk Weight 8%D. Total Capital Charge for Foreign Exchange Exposures (B. times C.) 57.940E. Adjusted Capital Charge for Foreign Exchange Exposures (D. times 125%) 72.425F. Total Risk-Weighted Foreign Exchange Exposures, Excluding Incremental Risk-Weighted Foreign Exchange
Exposures Arising From NDF Transactions (E. times 10)724.251
G. Incremental Risk-Weighted Foreign Exchange Exposures Arising From NDF Transactions (Part IV.3a, Item F) 372.90H. Total Risk-Weighted Foreign Exchange Exposures (Sum of F. and G.) 1,097.251
1/ Overall net open position shall be the greater of the absolute value of the sum of the net long position or the sum of net shortposition.

27
Operational Risk – Weighted AssetsThe Bank uses the Basic Indicator Approach in quantifying the risk-weighted assets for OperationalRisk. Under the Basic Indicator Approach, the Bank is required to hold capital for operational riskequal to the average over the previous three years of a fixed percentage (15% for this approach) ofpositive annual gross income (figures in respect of any year in which annual gross income wasnegative or zero are excluded).
(Amounts in Php Million)Consolidated as of Dec 31, 2016
Gross Income Capital Requirement(15% x Gross Income)
2013 (Year 3) 18,172 2,726
2014 (Year 2) 22,061 3,309
2015 (last year) 23,884 3,583
Average for 3 years 3,206
Adjusted Capital Charge Average x 125% 4,007
Total Operational Risk weighted Asset 40,073
The following represent the Bank’s significant subsidiaries:
Domestic Subsidiaries:
PNB Savings Bank (PNBSB) is a wholly-owned subsidiary of PNB as a result of the merger ofPNB and Allied Banking Corporation (ABC). PNBSB traces its roots from First MalayanDevelopment Bank which Allied Banking Corporation (ABC) bought in 1986 to reinforce itspresence in the countryside. In 17 January 1996, it was renamed First Allied Savings Bankfollowing the grant of license to operate as a savings bank. It was in the same year that theMonetary Board of the BSP granted a foreign currency deposit license. In 1998, First AlliedSavings Bank changed its name to Allied Savings Bank to further establish its association withthe parent ABC. With the merger of PNB and ABC in 2013, Allied Savings Bank became awholly owned subsidiary of PNB. In November 2014, Securities and Exchange Commissionapproved the change of name of Allied Savings Bank to PNB Savings Bank.
PNBSB closed the year 2016 with total resources of P 37.6 billion, up 66% from the previousyear of P 22.7 billion. Total deposits closed the year with P 24.2 billion, the bulk of which84% were in high cost funds maintained in Angat Savings, Regular Time Deposits and PowerEarner 5+1, a special savings account and a short and long term deposits, respectively. Thisproduct continues to attract new customers and fresh funds given its competitive pricing versusother banks’ equivalent product lines. Regular time deposits had P 9.9 billion, Power Earner5+1 with P 7.4 billion and Angat Savings had P3.0 billion in deposit portfolio. Other depositproducts are regular savings, demand deposit, checks plus and NOW accounts. Cash Card waspositioned for those segments of the market demanding a no maintaining balance accountrequired for payroll, transfer of funds for allowances, and even remittances.

28
Total loan portfolio registered P30.5 billion by the end of 2016, up 60% from the previous yearof P19.1 billion. Of the total loan portfolio, 93% comprised of consumer loans which is thethrust of the bank as the lending arms of PNB, parent bank, for the consumer loans.
PNBSB posted a net income of P335.3 million in 2016, double the previous year of P167.2million. Its net interest income of P1.4 billion was up by 43% year-on-year while pre-tax profitsimproved by 84% to close at P465.8 million. Return-on-equity stood at 2.95% higher thanprevious year. Its Capital Adequacy Ratio (CAR) reached 37.21% and is well above theminimum required by the BSP. PNBSB ended the year with a network of 45 branchesstrategically located across Metro Manila, Southern & Northern Tagalog Regions, Bicol,Western Visayas and Northern Mindanao.
PNB General Insurers Co., Inc. (PNBGen) is a subsidiary of the Bank established in 1991. Itis a non-life insurance company that offers coverage for Fire and allied perils, Marine, MotorCar, Aviation, Surety, Engineering, Accident insurance and other specialized lines. PNBGen isa dynamic company providing and continuously developing a complete range of highlyinnovative products that will provide total protection to its customers at competitive terms. Itstarted operations with an initial paid-up capital of P13 million. As of 31 December 2016,PNBGen’s paid-up capital was P912.60 million, one of the highest in the industry. Total Assetsreached P6.88 billion with a total Net Worth of P659.30 million.
For the year ended December 31, 2016, the company recorded a Net Income of P109.48 million(unaudited) from a Net Loss of P490.50 million in 2015.
Allianz PNB Life Insurance, Inc. traces its roots to New York Life Insurance Philippines, Inc.(NYLIP), the Philippine subsidiary of US-based New York Life International, LLC. NYLIPcommenced operations in the Philippines in August 2001.
In February 2003, Allied Banking Corporation acquired a minority interest in NYLIP andstarted bancassurance operations in its branches nationwide.
In June 2007, New York Life International, LLC because of its Asian strategy divested all itsinterests in NYLIP in favor of Allied Bank and its principals, making the company a majority-owned subsidiary of Allied Bank.
In May 2008, NYLIP changed its corporate name to PNB Life Insurance Inc. to reflect thechange in ownership and in anticipation of the merger of Allied Bank and Philippine NationalBank.This change in branding demonstrates the new owners’ commitment to the PhilippineLife Insurance market niche, its dynamism and growth prospects.
In October 2009, the Philippine National Bank acquired a minority stake in PNB Life pavingthe way for the expansion of bancassurance operations of PNB Life to PNB branchesnationwide.
In February 2013, the merger of ABC and PNB, with PNB as the surviving entity furtherstrengthened the bancassurance partnership with PNB Life which benefited from the resultingsynergy and increased operational efficiency. This positive development set the stage for theintroduction to the bank clients of competitive investment-linked Insurance products, designedto meet changing client needs for complete financial solutions.
29
As PNB Life expands its reach to more Filipino families, the company has set up RegionalBusiness Centers (RBCs) in San Fernando City, La Union to cover Northern Luzon; SanFernando City, Pampanga to serve Central Luzon; Naga City to serve Southern Luzon;Zamboanga City to cater Western Mindanao; Davao City to cover Eastern Mindanao; CebuCity to serve Eastern Visayas; Iloilo City to accommodate Western Visayas. In Metro Manila, ithas business centers in Binondo in the City of Manila for West Metro Manila, while the officesin Quezon City Circle and Cubao seek to serve North and East Metro Manila, respectively.
In December 2015, an agreement to enter into an exclusive distribution partnership was reachedwith global insurance firm Allianz SE. Under the terms of the agreement, Allianz will acquire51% of PNB Life. An important aspect of the joint venture is a 15-year bancassuranceagreement. On June 6, 2016, 12,750 common shares of stock representing 51% of thetotal issued and outstanding capital stock of PNB Life was sold to Allianz. The change ofthe company’s name to “Allianz PNB Life Insurance, Inc” was approved by the Securities andExchange Commission in September 21, 2016.
PNB Capital and Investment Corporation (PNB Capital), a wholly-owned subsidiary of theBank, is licensed by the SEC to operate as an investment house with a non-quasi-bankinglicense. It was incorporated on 30 June 1997 and commenced operations on 8 October 1997.
As of December 31, 2016, PNB Capital had an authorized and paid-up capital of P350 millionor 3,500,000 shares at P100.00 par value. Its principal business is to provide investmentbanking services which include debt and equity underwriting, private placement, loanarrangement, loan syndication, project financing and general financial advisory services, amongothers. The company is authorized to buy and sell, for its own account, securities issued byprivate corporations and the Philippine Government. PNB Capital distributes its structured andpackaged debt and equity securities by tapping banks, trust companies, insurance companies,retail investors, brokerage houses, funds and other entities that invest in such securities.
Investment banking is a highly regulated industry. Regulatory agencies overseeing PNB Capitalinclude the BSP, SEC, BIR, as well as several affiliates, support units and regulatorycommissions of these entities.
The primary risks of the company include underwriting, reputational and liability risks. First,underwriting risk pertains to the risk of market’s non-acceptance of securities being offered andunderwritten by PNB Capital. In such scenario, the company would have to purchase theoffered for its own account. Second, reputational risk arises from the possibility that thecompany may not be able to close mandated deals as committed. Third, liability risk refers tothe risk being held liable for any losses incurred by the client due to non-performance ofcommitted duties or gross negligence by the company. These primary risks are addressed by:
- ensuring that the staff is well-trained and capable, at the functional and technical level, toprovide the services offered;
- understanding the clients’ specific needs and goals;- clarifying and documenting all goals, methodologies, deliverables, timetables and fees
before commencing on a project or engagement and including several indemnity clauses toprotect PNB Capital from being held liable for actions and situations beyond its control.These indemnity clauses are revised and improved upon after each engagement, as and whennew protection clauses are identified; and
- all transactions are properly documented and approved by the Investment Committee and/orBoard of Directors.

30
PNB-IBJL Leasing and Finance Corporation (formerly Japan-PNB Leasing and FinanceCorporation), was incorporated on April 24, 1996 under the auspices of the Provident Fund ofthe Bank as PF Leasing and Finance Corporation. It was largely inactive until it was used as thevehicle for the joint venture between the Bank (60%), IBJ Leasing Co Ltd., Tokyo (35%), andIndustrial Bank of Japan, now called Mizuho Corporate Bank (5%). The corporate name waschanged to Japan-PNB Leasing and Finance Corporation and the joint venture companycommenced operations as such in February 1998.
On January 31, 2011, PNB increased its equity interest in JPNB Leasing from 60% to 90%.The Bank’s additional holdings were acquired from minority partners, IBJ Leasing Co., Ltd.(IBJL) and Mizuho Corporate Bank, which divested their 25% and 5% equity interests,respectively. IBJL remains as an active joint venture partner with a 10% equity interest.
PNB-IBJL Leasing and Finance Corporation operates as a financing company under RepublicAct No. 8556 (the amended Finance Company Act). Its major activities are financial lease(direct lease, sale-leaseback, lease-sublease and foreign currency leasing), operating lease(through wholly-owned subsidiary, PNB-IBJL Equipment Rentals Corporation), term loans (forproductive capital expenditures secured by chattel mortgage), receivable discounting (purchaseof short-term trade receivables and installment papers) and Floor Stock Financing (short-termloan against assignment of inventories, e.g., motor vehicles).
Majority of the principal products or services are in peso leases and loans. Foreign currency(US dollar and Japanese yen) leases and loans are mostly funded by IBJL.
On April 3, 2014, the PNB-IBJL Leasing and Finance Corporation's Board and stockholdersapproved the increase of the company’s authorized capital from P150 million to P1.0 billion,representing 10,000,000 shares with par value of P100 per share, in preparation for thedeclaration of stock dividends. On June 27, 2014, PNB-IBJL Leasing and FinanceCorporation’s Board approved the declaration of 2 shares to 1 share stock dividends tostockholders of record as of June 30, 2014.
On November 28, 2014, PNB and IBJL entered into a Share Sale and Purchase Agreementcovering the buy back by IBJL from PNB of 15% equity ownership in Japan-PNB Leasing witha closing date of January 30, 2015.
On January 13, 2015, the Securities and Exchange Commission approved the increase in itsauthorized capital stock from P150.0 million (1.5 million shares) to P1.0 billion (10.0 millionshares). Subsequently, the stock dividends declaration was implemented with the issuance of300,000 new shares on January 23, 2015.
On January 30, 2015, the buyback of the 15% equity of Japan-PNB Leasing by IBJL from PNBwas consummated, resulting to an equity ownership as follows: PNB - 75% and IBJL - 25%.
On March 27, 2015, the Securities and Exchange Commission approved the change of name ofJapan-PNB Leasing and Finance Corporation to PNB-IBJL Leasing and Finance Corporation.
As of December 31, 2016, PNB-IBJL Leasing and Finance Corporation’s consolidated totalassets and total equity stood at P6.7 billion and P623.4 million, respectively. Its consolidatednet loss for the year ended December 2016 was P125 million.

31
PNB-IBJL Equipment Rentals Corporation (formerly Japan-PNB Equipment RentalsCorporation) is a wholly-owned subsidiary of PNB-IBJL Leasing and Finance Corporation. Itwas incorporated in the Philippines on July 3, 2008 as a rental company and started commercialoperations on the same date. It is engaged in the business of renting all kinds of real andpersonal properties.
On March 11, 2015, the Securities and Exchange Commission approved the change of namefrom Japan-PNB Equipment Rentals Corporation to PNB-IBJL Equipment RentalsCorporation.
As of December 31, 2016, it had a paid-up capital of P40.0 million and total capital of P69.7million. Its total assets and net income for the year ended December 31, 2016 were P555.1million and P16.6 million, respectively.
Allied Leasing and Finance Corporation (“ALFC”) became a majority-owned (57.21%)subsidiary of PNB by virtue of the merger between PNB and Allied Bank In February 9, 2013.It was incorporated on 10 December 1978. The company is authorized by the SEC to operate asa financing company in accordance with the provisions of Republic Act No. 5980, as amendedby R.A. 8856, otherwise known as the Financing Company Act. It started operations on 25 June1980. On October 16, 1996, the authorized capital was increased to P500 million divided into 5million shares with P100.00 par value per share. The company’s Board of Directors andStockholders approved on December 17, 2014 and November 25, 2015, respectively, to shortenthe corporate life of ALFC until December 31, 2015 and a Certificate of Retirement of Businesshas been issued on February 23, 2016 by the Makati City Treasurer’s Office. As of 31December 2016, ALFC’s paid-up capital amounted to P152.50 million.
PNB Holdings Corporation (PHC), a wholly-owned subsidiary of the Bank, was establishedon May 20, 1920 as Philippine Exchange Co., Inc. The Securities and Exchange Commission(SEC) approved the extension of the corporate life of PNB Holdings for another fifty (50) yearseffective May 20, 1970. In 1991, it was converted into a holding company and was used as avehicle for the Bank to engage into the insurance business.
As of 31 December 2016, PHC had an authorized capital of P500.0 million or 5,000,000 sharesat P100 par value per share. As of December 31, 2016, total paid-up capital of PHC was P255.1million while additional paid-in capital was P3.6 million, while total assets and total capitalwere P337.6 million and P336.8 million, respectively, and net loss was P1.1 million. PNBHoldings owns 34.25% of PNB General Insurer’s Co. Inc.
PNB Securities, Inc. (PNBSec) was incorporated in January 18, 1991 and is a member of thePhilippine Stock Exchange, Inc. As a securities dealer, it is engaged in the buying and selling ofsecurities listed in the Philippine Stock Exchange, Inc. either for its own account as Dealer orfor account of its customers as Broker. It is a wholly-owned subsidiary of PNB and ranked41st among 131 active members in the Philippine Stock Exchange, Inc. with 0.22% marketshare in terms of value turn-over as of December 31, 2016.
a.As of December 31, 2016, it has a total paid-up capital of P100.0 million with total assetsand total capital of P242.3 million and P175.6 million, respectively. It ended year 2016with a net income of P 0.80 million.
b.The PNBSI has no bankruptcy, receivership, or similar proceedings in the past three (3)years.

32
c. There are no material reclassification, merger, consolidation, or purchase/sale of asignificant asset not in the ordinary course of business.
Relative to its competitors, the company’s strength lies in the fact that it is backed up by PNB, auniversal bank and considered one of the top commercial banks in the country today.
Inherent to all engaged in the stockbrokerage business, the company is exposed to risks likeOperational Risk, Position Risk, Counterparty Risk and Large Exposure Risk. To address,identify, assess and manage the risks involved, the company submits monthly to the SEC therequired Risk Based Capital Adequacy (RBCA) Report which essentially measures the broker’snet liquid capital considering said risks. Further, the parent’s bank Risk Management Group isoverseeing/ monitoring the Company’s risk management / exposures.
PNB Forex, Inc. (PFI), a wholly-owned subsidiary of the Bank which was incorporated on 13October 1994 as a trading company, was engaged in the buying and selling of foreigncurrencies in the spot market for its own account and on behalf of others. The companytemporarily ceased its operations in foreign currency trading as of January 1, 2006. It derives100% of its revenues from interest income earned from the cash/funds held by the corporation.On December 16, 2013, the PFI’s Board of Directors approved the dissolution of the company.Last March 17, 2014, the Office of the City Treasurer of Pasay City approved the company'sapplication for retirement of business. The company is now applying for tax clearance with theBureau of Internal Revenue.
As of December 31, 2016, audited total assets and total equity of PFI is at P57.5 million andP56.8 million, respectively. For the year ended December 31, 2016, audited net loss is P7,574.
Bulawan Mining Corporation, a wholly-owned subsidiary of the Bank, was incorporated inthe Philippines on March 12, 1985. It is authorized to explore and develop land for miningclaims and sell and dispose such mining claims.
PNB Management and Development Corporation, a wholly-owned subsidiary of the Bank,was incorporated in the Philippines on February 6, 1989 primarily to own, acquire, hold,purchase, receive, sell, lease, exchange, mortgage, dispose of, manage, develop, improve,subdivide, or otherwise deal in real estate property, of any type and/or kind of an interesttherein, as well as build, erect, construct, alter, maintain, or operate any subdivisions, buildingsand/or improvements. It is also authorized to explore and develop land mining claims and tosell/dispose such mining claims.
Foreign Subsidiaries:
Allied Commercial Bank (ACB), a 99.04% owned subsidiary of the Philippine National Bankand formerly known as Xiamen Commercial Bank, was established in Xiamen in September1993 as a foreign owned bank. It obtained its commercial banking license in July 1993 andopened for business in October 1993.
ACB maintains its head office in Xiamen, in Fujian Province, a southeastern commercial city ofChina. In 2003, ACB opened a branch in the southwestern city of Chongqing.
In April 2016, China’s banking regulator, the China Banking Regulatory Commission (CBRC)approved ACB’s application to engage in foreign currency-denominated business for all typesof clients and in CNY-denominated business for all clients except citizens within the territory

33
of China. This means after compliance with a number of administrative processes, ACB shallbe allowed to service the CNY denominated banking requirements of foreign nationals, foreignand Sino entities, in addition to the full foreign currency service license for all marketsectors/segments. The last requirement prior to offering CNY denominated services formallywould be the updating of the business license with the Fujian Administration for Industry andCommerce (FAIC). On January 16, 2017, the Fujian Administration for Industry andCommerce (FAIC) issued a Business License to Allied Commercial Bank to engage in foreigncurrency-denominated business servicing all types of clients and in CNY-denominated businessservicing all clients except Chinese resident citizens
Allied Banking Corporation (Hong Kong) Limited (ABCHKL) is a private limited companyincorporated in Hong Kong in 1978 and is licensed as a restricted license bank under the HongKong Banking Ordinance. By virtue of the merger between PNB and Allied Bank in February2013, PNB now owns 51% of ABCHK. The registered office address is 1402 World-WideHouse, 19 Des Voeux Road Central HK SAR.
It provides a full range of commercial banking services predominantly in Hong Kong, whichinclude lending and trade financing, documentary credits, participation in loans syndicationsand other risks, deposit taking, money market and foreign exchange operations, moneyexchange, investment and general corporate services.
ABCHKL has one branch license and a wholly owned subsidiary (“ABCHKL Group”). Thesubsidiary, ACR Nominees Limited, is a private limited company incorporated in Hong Kongwhich provides non-banking general services to its customers.
There were no significant changes in the nature of the ABCHKL Group’s principal activitiesduring the year.
PNB International Investment Corporation (PNB IIC), formerly Century Bank HoldingCorporation, a wholly-owned subsidiary of the Bank, is a U.S. non-bank holding companyincorporated in California on December 21, 1979. It changed its name to PNB InternationalInvestment Corporation on December 1, 1999.
PNB IIC owns PNB Remittance Centers, Inc. (PNB RCI) which was incorporated in Californiaon 19 October 1990. PNB RCI is a company engaged in the business of transmitting money tothe Philippines. As of December 31, 2016, PNB RCI has 17 branches in 5 states. PNB RCIowns PNB RCI Holding Company, Ltd. which was incorporated in California on August 18,1999 and PNB Remittance Company, Nevada (PNB RCN) which was incorporated in Nevadaon June 12, 2009. PNB RCN is engaged in the business of transmitting money to thePhilippines. PNB RCN has 1 branch located in Las Vegas. PNB RCI Holding Company, Ltd. isthe holding company for PNB Remittance Company Canada (PNB RCC). PNB RCC is also amoney transfer company incorporated in Canada on April 26, 2000. PNB RCC has 7 branchesin Canada as of year-end 2016.
PNB RCI is regulated by the U.S. Internal Revenue Service and the Department of FinancialInstitutions of the State of California and other state regulators of financial institutions whilePNBRCN is regulated by the Nevada Department of Business and Industry – Division ofFinancial Institutions. PNB RCC is regulated by the Office of the Superintendent of FinancialInstitutions of Canada and Financial Transactions and Reports Analysis Centre of Canada.
PNB IIC does not actively compete for business, being only a holding company. PNB RCI,

34
PNB RCN and PNB RCC have numerous competitors from local U.S. banks, Philippine bankaffiliates doing business in North America, as well as other money transfer companies likeWestern Union, Money Gram, Lucky Money and LBC.
Philippine National Bank (Europe) Plc (PNB Europe) was originally set up as a PNBLondon Branch in 1976. In 1997, it was converted as wholly-owned subsidiary bank of PNB,incorporated in the United Kingdom with a full banking license. It is also authorized to providecross-border services to 19 member states of European Economic Area (EEA). In 2007, PNBEurope opened its branch in Paris, France, where it is engaged in remittance services. PNBEurope is regulated by the Financial Conduct Authority and authorized and regulated by thePrudential Regulation Authority. PNB Europe Paris branch is governed by the Banque deFrance.
In April 2014, Allied Bank Phils (UK). was merged with PNBE Plc.
PNB Global Remittance & Financial Company (HK) Limited (PNB Global),a wholly-owned subsidiary of the Bank, is registered with the Registrar of Companies in Hong Kong.On July 1, 2010, PNB Global took the remittance business of PNB Remittance Center, Ltd.with the former as the surviving entity. It now operates as a money lender and remittancecompany. As of December 31, 2016, it maintains seven (7) offices in Hong Kong. Itsremittance business is regulated by the Customs and Excise Department of Hong Kong.
Effective August 2012, PNB Global launched its tie-up arrangement with Western Unionstrengthening its cash pick-up services throughout the Philippines. This tie-up was mutuallyterminated on June 15, 2016.
Item 2. Properties
PNB’s corporate headquarters, the PNB Financial Center, is housed in an eleven (11)-storeybuilding located at a well-developed reclaimed area of 99,999 square meters of land on thesouthwest side of Roxas Boulevard, Pasay City, Metro Manila, bounded on the west side by thePres. Diosdado P. Macapagal Boulevard and on the north side by the World Trade Centerbuilding. It also houses some of PNB’s domestic subsidiaries. Some office spaces are presentlyleased to various companies/private offices. The said property is in good condition and has noliens and encumbrances.
Disclosed in Exhibit I is the list of Bank-owned properties as of December 31, 2016.
The Bank leases the premises occupied by some of its branches. Lease contracts are generallyfor periods ranging from one year up to 30 years based on original tenor and are renewableupon mutual agreement of both parties under certain terms and conditions.
Disclosed in Exhibit II is the list of Bank’s branches that are under lease as of December 31,2016.
The Bank does not have any current plans to acquire any property within the next twelve (12)months.
Information related to Property and Equipment is shown under Note 11 of the AuditedFinancial Statements of the Bank and Subsidiaries.

35
Item 3. Legal Proceedings
The Bank is a party to various legal proceedings which arise in the ordinary course of itsoperations. The Bank and its legal counsel believe that any losses arising from thesecontingencies, which are not specifically provided for, will not have a material adverse effecton its Financial Statements.
Item 4. Submission of Matters to a Vote of Security Holders
There was no matter submitted to a vote of the security holders during the fourth (4th) quarter ofthe year covered by this report.

36
PART II – OPERATIONAL AND FINANCIAL INFORMATION
Item 5. Market for Issuer’s Common Equity and Related Stockholder Matters
A. Market Price of and Dividends on Registrant’s Common Equity and Related StockholdersMatters:
1. Market Information
All issued PNB common shares are listed and traded on the Philippine Stock Exchange, Inc.The high and low sales prices of PNB shares for each quarter for the last two (2) fiscalyears are:
2014 2015 2016
High Low High Low High LowJan – Mar P87.20 P75.56 P87.50 P76.70 P53.90 P43.00Apr – Jun 94.95 81.50 79.00 62.00 59.85 46.45Jul - Sep 91.50 85.95 68.90 49.50 64.75 56.35Oct - Dec 88.30 76.50 54.50 49.60 58.90 54.15
The trading price of each PNB common share as of February 10, 2017 was P59.20.
2. Holders
There are 29,853 shareholders as of December 31, 2016. The top twenty (20) holders ofcommon shares, the number of shares held, and the percentage to total shares outstandingheld by each are as follows:
No. StockholdersCommonShares1/
Percentage To TotalOutstanding
Capital Stock
1 PCD Nominee Corporation (Non-Filipino) 111,091,751 8.89346107222 Key Landmark Investments, Ltd. 109,115,864 8.73528124373 PCD Nominee Corporation 105,985,781 8.48470214074 Caravan Holdings Corporation 67,148,224 5.37555768845 Solar Holdings Corporation 67,148,224 5.37555768846 True Success Profits Ltd. 67,148,224 5.37555768847 Prima Equities & Investments Corporation 58,754,696 4.70361297748 Leadway Holdings, Inc. 53,470,262 4.28056709289 Infinity Equities, Inc. 50,361,168 4.0316682663
10 Pioneer Holdings Equities, Inc. 28,044,239 2.245084316311 Multiple Star Holdings Corporation 25,214,730 2.018567694612 Donfar Management Ltd. 25,173,588 2.015274067713 Uttermost Success, Ltd. 24,752,272 1.981545573814 Mavelstone Int'l Ltd. 24,213,463 1.938411166215 Kenrock Holdings Corporation 21,301,405 1.705286076116 Fil-Care Holdings, Inc. 20,836,937 1.668103044617 Fairlink Holdings Corporation 20,637,854 1.652165435418 Purple Crystal Holdings, Inc. 19,980,373 1.599530729219 Kentron Holdings & Equities Corporation 19,944,760 1.596679727020 Fragile Touch Investment, Ltd. 18,581,537 1.4875467754
1/ This includes the 423,962,500 common shares issued to the stockholders of Allied Banking Corporation (ABC) relative tothe merger of PNB and ABC as approved by the Securities and Exchange Commission (SEC) on January 17, 2013.

37
3. Dividends
The Bank’s ability to pay dividends is contingent on its ability to set aside unrestrictedretained earnings for dividend distribution. In addition, the Bank’s declaration of dividends,including computation of unrestricted retained earnings, is subject to compliance withcertain rules and regulations prescribed by the Bangko Sentral ng Pilipinas (BSP) asprovided under the Manual of Regulations for Banks (MORB) and subject to compliancewith such financial regulatory requirements as may be applicable to the Bank at the time ofsuch declaration.
PNB has adopted the following general policy on the declaration of dividends:
"Dividends shall be declared and paid out of the surplus profits of the Bankat such times and in such amounts as the Board of Directors may determinein accordance with the provisions of law and the regulations of the BangkoSentral ng Pilipinas (BSP) and the Securities and Exchange Commission(SEC), subject to compliance with such financial regulatory requirementsas may be applicable to the Bank.”
In 2016, the Bank declared a cash dividend of P1.00 per share or a total ofP1,249,139,678.00, taken out of its unrestricted Retained Earnings as of March 31, 2016, toall stockholders of record as of August 19, 2016.
4. Recent Sales of Unregistered or Exempt Securities, including Recent Issuance ofSecurities Constituting an Exempt Transaction
On August 4, 2015, the Securities and Exchange Commission (“SEC”) issued theCertificate of Permit to Offer Securities for Sale authorizing the sale of 423,962,500common shares of the Bank with a par value of P40.00 per share. The Certificate covers theshares to be issued to the shareholders of Allied Banking Corporation (“ABC”) pursuant tothe merger of the Bank and ABC which was approved by the SEC on January 17, 2013.The application for listing of the said Shares was already filed with the Philippine StockExchange.
2. Computation of Public Ownership
As of December 31, 2016, PNB’s Public Ownership Level is 21.03%, which is above theminimum percentage of ten percent (10%) public ownership requirement for a listedcompany, in compliance with the requirement of the Philippine Stock Exchange (PSE).
3. Description of PNB’s Securities
As of December 31, 2016, PNB’s authorized capital stock amounted toP70,000,000,040.00 divided into 1,750,000,001 common shares having a par value ofP40.00 per share.
The total number of common shares outstanding as of December 31, 2016 is1,249,139,678. This includes the 423,962,500 common shares issued relative to themerger of PNB and Allied Banking Corporation subject of the Registration Statementapproved by the Securities and Exchange Commission and the application for listingfiled with the Philippine Stock Exchange.

38
As of December 31, 2016, a total of 1,131,961,525 common shares (or 90.62%) are heldby Filipino-Private Stockholders while the remaining 117,178,153 common shares (or9.38%) are held by Foreign-Private Stockholders. PNB has a total ofP49,965,587,120.00 subscribed capital.
The Bank’s stockholders have no pre-emptive right to subscribe to any new or additionalissuance of shares by the Bank, regardless of the class of shares, whether the same areissued from the Bank’s unissued capital stock or in support of an increase in capital.(Article Seven of PNB’s Amended Articles of Incorporation)
At each meeting of the stockholders, every stockholder entitled to vote on a particularquestion involved shall be entitled to one (1) vote for each share of stock standing in hisname in the books of the Bank at the time of the closing of the transfer books for suchmeeting or on the record date fixed by the Board of Directors. (Section 4.9 of PNB’sAmended By-Laws)
Section 24 of the Corporation Code of the Philippines provides that “x x x everystockholder entitled to vote shall have the right to vote in person or by proxy the numberof shares of stock standing, at the time fixed by the by-laws, in his own name on thestock books of the corporation x x x and said stockholder may vote such number ofshares for as many persons as there are directors to be elected or he may cumulate saidshares and give one candidate as many votes as the number of directors to be electedmultiplied by the number of his shares shall equal x x x.”
Item 6. Management’s Discussion and Analysis
Management’s Discussion and Analysis
The financial statements have been prepared in accordance with Philippine Financial ReportingStandards (PFRS).
2016 vs. 2015
The Group’s consolidated assets reached at P753.8 billion as of December 31, 2016,10.9% or P74.1 billion higher compared to P679.7 billion reported as of December 31,2015. Changes (more than 5%) in assets were registered in the following accounts:
Due from Bangko Sentral ng Pilipinas, Due from Other Banks and Interbank LoansReceivable also registered increases as of December 31, 2016, by P45.9 billion, P4.4billion and P2.0 billion, respectively from P81.4 billion, P18.3 billion and P5.8 billion,respectively as of December 31, 2015. On the other hand, Cash and Other Cash Itemsdecreased by P4.2 billion from P15.2 as of December 31, 2015.
Loans and Receivables registered an increase at P428.0 billion or P62.3 billion higherthan the P365.7 billion as of December 31, 2015 level mainly due to loan releases inthe current year to various corporate borrowers.

39
Financial Assets at Fair Value Through Profit or Loss at P1.9 billion as of December 31,2016 was lower by 57.8% or P2.6 billion from P4.5 billion in 2015 attributed mainlydue to the sale of various investment securities.
Securities Held Under Agreements to Resell as of December 31, 2016 of P2.0 billionwhich represents lending transactions of the Bank with the BSP is lower by P12.6billion compared to the P14.6 billion as of December 31, 2015.
Investment Properties increased by P3.1 billion from P13.2 billion as of December 31,2015 to P16.3 billion as of December 31, 2016 due to the following transactions:
- reclassification of P3.2 billion Allied Bank Center from Property andEquipment
- reclassification of P2.0 billion of other bank properties- disposal of P1.8 billion worth of foreclosed properties.- reclassification of P0.6 billion to Loans and Receivables
Property and Equipment decreased by P4.0 billion from P22.1 billion as of December31, 2015 to P18.1 billion as of December 31, 2016 mainly due to the reclassification ofcertain properties to Investment Properties as discussed in previous paragraph.
Asset held for distribution
On December 21, 2015, the Parent Company entered into a 15-year exclusivepartnership with Allianz SE under the following arrangements:
- Allianz SE will acquire 12,750 shares representing 51.00% stockholdings ofPNB Life Insurance Inc. (PNB LII) and will have management control over thenew joint venture company;
- The new joint venture company will operate under the name of “Allianz PNBLife Insurance, Inc.”;
- A 15-year distribution agreement which will provide Allianz – an exclusiveaccess to the branch network of the Parent Company and PNB SB.
This required the reclassification of the accounts of PNB Life in the December 31,2015 Financial Statement as assets for distribution. The necessary regulatoryapprovals have been obtained and the above sale agreement was implemented on June6, 2016.
The P2.5 billion Equity Investments pertains to the remaining investment of the Bank inAllianz PNB Life Insurance, Inc. now accounted for as an Investment in Associate as ofDecember 31, 2016.
Intangible Assets , Deferred Tax Assets and Other Assets were higher by P0.2 billion,P0.3 billion and P0.3 billion from P2.4 billion to P2.6 billion, P1.2 billion to P1.5 billionand P6.8 billion to P7.1 billion, respectively.

40
Consolidated liabilities went up by 12.0% or P68.9 billion from P574.9 billion as ofDecember 31, 2015 to P643.8 billion as of December 31, 2016. Major changes in liabilityaccounts were as follows:
Deposit liabilities totaled P570.5 billion, P84.6 billion higher compared to its year-end2015 level of P485.9 billion. Increases were registered in Demand, Savings and Timeby P7.3 billion, P53.4 billion and by P23.8 billion, respectively.
Bills and Acceptances Payable increased by P10.1 billion, from P25.8 billion to P35.9billion, mainly accounted for by various borrowings from other banks.
Financial liabilities at Fair value through profit or loss was higher at P0.2 billion as ofDecember 31, 2016 from last year’s P0.1 billion.
Other Liabilities increased by P2.9 billion from P25.7 billion to P28.6 billion.
Accrued Expenses decreased by P1.0 billion from P5.9 billion as of December 31,2015 to P4.9 billion as of December 31, 2016.
Subordinated Debt decreased from P10.0 billion as of December 31, 2015 to P3.5billion as of December 31, 2016. On June 16, 2016, PNB exercised its Call Option onits P6.5 billion 6.75% Lower Tier 2 Unsecured Subordinated Notes.
Decrease in Liabilities Held for Distribution was also attributed to sale of 51% equityin PNB Life as explained above under Assets Held for Distribution account.
Total equity accounts stood at P109.9 billion from P104.8 billion as of December 31, 2015,or higher by P5.1 billion attributed to current year’s net income of P7.2 billion andincrease in Net Unrealized Loss on Available for Sale Investments of P0.5 billion, P0.3billion in Accumulated Translation Adjustment partly offset by the declaration of P1.3billion cash dividends in September 2016, decrease of P0.4 billion in remeasurement losseson retirement plan, decrease of P0.6 billion in Reserves of a Disposal Group Held forDistribution and decrease in Non-controlling interest by P0.4 billion
2015 vs. 2014
The Group’s consolidated assets stood at P679.7 billion as of December 31, 2015, 8.7%or P54.3 billion higher compared to P625.4 billion total assets reported as of December31, 2014. Changes (more than 5%) in assets were registered in the following accounts:
Due from Other Banks registered an increase of P2.7 billion from P15.6 billion as ofDecember 31, 2014. On the other hand, Due from Bangko Sentral ng Pilipinasdecreased by P24.5 billion from P105.8 billion as of December31, 2014 due to lowerSpecial Deposit Account placement in 2015. Interbank Loans Receivable alsodecreased by P1.9 billion from P7.7 billion as of December 31, 2014.

41
Financial Assets at Fair Value Through Profit or Loss (FAFVPL) were lower at P4.5billion, from P17.4 billion as of December 31, 2014, mainly due to reclassification ofthe P13.8 billion “Segregated Fund Assets” of PNB Life from FAFVPL to “Assets ofDisposal Group Classified as Held for Sale” in line with the requirements of PFRS 5,Non-current Assets Held for Sale and Discontinued Operations. This arose followingan agreement entered into between the Bank and Allianz last December 2015 forAllianz SE to acquire 51% ownership in PNB Life Insurance. PFRS 5 requires assetsand liabilities of PNB Life, together with the results of operations of a disposal group,to be classified separately from continuing operations.
Securities Held Under Agreements to Resell as of December 31, 2015 of P14.6 billionrepresents lending transactions of the Bank with the BSP.
Available for Sale Investments and Held to Maturity Investment were higher at P68.3billion and P23.2 billion as of December 31, 2015, respectively, from their P63.1billion and P23.0 billion levels as of December 31, 2014, an improvement of P5.2billion and P0.2 billion, respectively, due mainly to acquisition of various investmentssecurities.
Loans and Receivables reached P365.7 billion, posting a significant growth of 15.6%or P49.4 billion compared to the P316.3 billion December 2014 level mainly due toloan releases implemented in the current year to various corporate borrowers.
Investment Properties decreased by P7.0 billion from P20.2 billion as of December 31,2014 to P13.2 billion as of December 31, 2015, due to the following transactions:
- sale of P1.0 billion Heritage Park lots- reclassification of P2.0 billion foreclosed properties to Bank Premises- reclassification of P1.2 billion properties entered into contractual agreements
with real estate developers, and- disposal of P2.8 billion worth of foreclosed properties.
Property and Equipment increased by P2.5 billion from P19.6 billion as of December31, 2014 to P22.1 billion as of December 31, 2015 mainly due to the reclassification ofcertain foreclosed properties as discussed in previous paragraph which shall be used asbank premises.
Intangible assets grew by P0.1 billion from P2.3 billion as of December 31, 2014 toP2.4 billion as of December 31, 2015 mainly due to the recording of costs incurred inthe ongoing upgrading of the core banking system of the Bank which is targeted forcompletion in 2017.
Deferred Tax Assets was lower by P0.3 billion from P1.5 billion as of December 31,2014 to P1.2 billion as of December 31, 2015.
“Assets of Disposal Group Classified as Held for Sale” amounting to P23.5 billionpertains to assets of PNB Life which was presented under a separate line item in thefinancial statements in view of the sale agreement entered into between the Bank andAllianz last December 2015 as earlier discussed.

42
Other assets was higher at P6.8 billion, or by P1.6 billion from last year’s level mainlydue to reclassification of P1.2 billion properties entered into contractual agreementswith real estate developers from Investment Properties to Other Assets.
Consolidated liabilities went up by P48.5 billion or 9.2% from its P526.4 billion level as ofDecember 31, 2014 to P574.9 billion as of December 31, 2015. Major changes in liabilityaccounts were as follows:
Financial liabilities at Fair value through profit or loss declined from P10.9 billion as ofDecember 31, 2014 to P0.1 billion this year mainly due to reclassification of the P10.8billion “Segregated Fund Liabilities” of PNB Life from FLFVPL to “Liabilities ofDisposal Group Classified as Held for Sale” in line with the sale agreement withAllianz.
Deposit liabilities totaled P485.9 billion, P38.3 billion higher compared to its year-end2014 level of P447.6 billion. Increases were registered in Demand by P8.4 billion,Savings by P22.2 billion and Time deposits by P7.7 billion.
Bills and Acceptances Payable increased by P6.7 billion, from P19.1 billion to P25.8billion, mainly accounted for by various borrowings from other banks. AccruedExpenses Payable also increased from P5.4 billion to P5.9 billion as of December 31,2015.
“Liabilities of Disposal Group Classified as Held for Sale” amounting to P21.5 billionpertains to liabilities of PNB Life which was presented under a separate liability lineitem also in view of the sale agreement with Allianz SE.
Income Tax Payable increased by P49.2 million from P85.5 million to P134.7 million.
Reduction of P7.7 billion in other liabilities was also attributed to reclassification ofcertain other liability accounts of PNB Life under a separate line item in the balancesheet as held for sale.
Total equity accounts now stood at P104.8 billion from P99.1 billion as of December 31, 2014,or an improvement of P5.7 billion mainly attributed to the following:
- current year’s net income of P6.3 billion- additional translation gain pertaining to equity investments in foreign
subsidiaries of P0.7 billion- P0.1 billion reserves of a disposal group held for sale pertaining to other
comprehensive income of PNB Life presented under a separate line item inequity
These were partly offset by additional unrealized losses on mark to market of Available for saleinvestments of P0.7 billion.

43
2014 vs. 2013
The Group’s consolidated assets reached P625.4 billion as of December 31, 2014, higher byP9.1 billion compared to P616.3 billion total assets reported by the Bank as of December 31,2013. Changes (more than 5%) in assets were registered in the following accounts:
- Loans and Receivables (L&R) expanded to P316.3 billion in December 2014, P42.0billion or 15.3% higher as compared to its December 2013 level of P274.3 billionmainly due to loan releases implemented in the current year to various corporateborrowers.
- Financial Assets at Fair Value Through Profit or Loss at P17.4 billion grew by 48.7%or P5.7 billion from P11.7 billion attributed mainly to purchases of various investmentsecurities and increase in segregated fund assets.
- Interbank Loans Receivable was at P7.7 billion as of December 31, 2014, a decreaseof P0.7 billion from P8.4 billion as of December 31, 2013 due mainly to maturinginterbank lending transactions to various banks.
- Available for Sale Investments went down to P63.1 billion as of December 31, 2014,P17.2 billion lower than the P80.3 billion level as of December 31, 2013 attributablemainly to the reclassification of P18.3 billion investment securities to Held to MaturityInvestments two years after the sale of a significant amount of Held to MaturitySecurities in October 2011. Held to Maturity Investments now stood at P23.0 billion.
- Due from BSP decreased by P47.4 billion from P153.2 billion to P105.8 billionaccounted for by Special Deposit Accounts which dropped by P51.5 billion to fundvarious loan releases. Cash and Other Cash Items increased by P2.8 billion from P11.8billion to P14.6 billion. Due from Other Banks went up by P0.7 billion from P14.9billion to P15.6 billion.
- Investment Properties decreased by P1.2 billion from P21.5 billion to P20.3 billiondue to disposal of foreclosed properties
- Intangible assets were lower at P2.3 billion in view of the amortization of merger-related core deposits and customer relations intangibles.
- Other assets and Deferred Tax Assets were higher by P1.8 billion and P0.2 billion fromP3.4 billion to P5.2 billion and from P1.3 billion to P1.5 billion, respectively.
Consolidated liabilities decreased by P7.5 billion from P533.9 billion as of December 31, 2013to P526.4 billion as of December 31, 2014. Major changes in liability accounts were as follows:
- Deposit Liabilities was lower by P14.8 billion from P462.4 billion to P447.6 billion.Demand deposits declined by P23.8 billion. The decline in deposits was due to a shiftof funds by depositors to the stock rights offer of the Bank in the 1st quarter of thisyear. P6.75 billion LTNCD were redeemed in March and October 2014.
- Financial liabilities at Fair value through profit or loss was higher at P10.9 billion fromlast year’s P8.1 billion attributed to the increase in segregated fund liabilities of PNBLife.

44
- Bills and Acceptances Payable increased by P5.9 billion from P13.2 billion to P19.1billion accounted for by interbank borrowings under repurchase agreement with foreignbanks. Income Tax Payable increased by P38 million from P48 million to P86 million
Total equity accounts improved by P16.8 billion, from P82.3 billion as of December 31, 2013to a high of P99.1 billion as of December 31, 2014 on account of significant increasesattributed to the following:- P11.6 billion proceeds from the issuance of 162.9 million common shares in line with
the stock rights offering in February 2014- P5.5 billion net income for the twelve months period ended December 31, 2014- P1.2 billion increase in net unrealized gain/(loss) on AFS adjustments and P0.2 billion
increase in non-controlling interests.
Offset by the P1.0 billion downward adjustment in remeasurement losses on Retirement Plan,P0.4 billion decline in FX translation.
Results of Operations
2016 vs 2015
For the year ended December 31, 2016, the Bank’s consolidated net income stood atP7.2 billion, P0.9 billion higher compared to the P6.3 billion net income for the sameperiod last year.
Net interest income totaled P19.6 billion, higher by 10.7% or P1.9 billion compared tothe net interest income for the same period last year mainly due to expansion in the loanportfolio and investment securities which accounted for P2.6 billion and P0.3 billionincrease in interest income, respectively, partly offset by the decline in income fromdeposits with banks by P0.2 billion. Total interest income was up by P2.6 billion fromP21.7 billion to P24.3 billion. Total interest expense however, was also higher at P4.8billion or by P0.8 billion from P4.0 billion last year.
Other income significantly increased to P8.6 billion from P5.1 billion compared to sameperiod last year mainly due to the P0.9 billion gains from sale of foreclosed assets andfrom P0.8 billion, P0.3 billion and P1.5 billion increases in the Trading and InvestmentSecurities gains, Foreign exchange gains and Miscellaneous Income, respectively.Increase in Miscellaneous income was due to the P1.6 billion gain on sale of the Bank’s51% interest in PNB Life to Allianz, one of the largest global insurance companies.
Net service fees and commission income and net insurance premium were at P2.7billion and P0.3 billion, respectively, for the year ended December 31, 2016.
Administrative and other operating expenses amounted to P23.1 billion for the yearended December 31, 2016, P4.2 billion higher compared to the same period last year.Increases were registered in provision for impairment, credit and other losses of P2.6billion mainly due to reversal of P1.0 billion in 2015 of provision for possible liabilityin view of court ruling favorable to the Bank and increases and additional P1.6 billion inprovision for impairment and credit losses. Compensation and fringe benefits, Taxesand Licenses and Miscellaneous Expenses also increased by P1.6 billion.

45
Income from discontinued operations in the current year pertains to the net incomerealized from the sale of 51% interest in PNB Life implemented in June 2016.
Total Comprehensive Income for the year ended December 31, 2016 amounted to P6.7billion, P0.5 billion higher compared to the P6.2 billion for the same period last yearmainly due to the increase in net income of P0.9 billion, net unrealized gain onAvailable for Sale Securities of P0.4 billion partly offset by decreases in remeasurementgains on retirement plan of P0.5 billion, translation adjustment by P0.4 billion, and P0.1billion in non-controlling interests.
2015 vs 2014
For the year ended December 31, 2015, the Bank recorded a net income of P6.3 billion,P0.8 billion higher compared to the P5.5 billion net income for the same period last year.
Net interest income totaled P17.7 billion, higher by P1.2 billion compared to the netinterest income for the same period last year mainly due to expansion in the loanportfolio which accounted for P1.9 billion increase in interest income partly offset bythe decline in income from deposits with banks by P1.1 billion. Total interest incomewas up by P1.6 billion from P20.1 billion to P21.7 billion. Total interest expensehowever, was slightly higher at P4.0 billion or by P0.4 billion from P3.6 billion last year,resulting to improvement in Net Interest Margin.
Other income this year declined to P5.1 billion from P6.2 billion last year mainly due tothe P0.7 billion trading gains recognized last year on the sale of a minority equityholdings and the continued reduction in treasury related income in the current year. Thedecline in other income was partly offset by growth in gains from sale of foreclosedassets of P0.1 billion in the current year.
Net service fees and commission income and net insurance premium were at P3.6billion and P0.1 billion, respectively, for the year ended December 31, 2015.
Administrative and other operating expenses was slightly lower this year at P18.9billion compared to P19.2 billion last year. The reduction was attributed to lowerprovisions this year of P0.6 billion compared to P2.3 billion in 2014 mainly due to areversal this year of provision on the NSC case (refer to 34 AFS). Compensation andFringe Benefits was higher by P0.8 billion. Miscellaneous expense increased by P0.6billion in 2015.
Provision for income tax this year was higher at P1.6 billion compared to P1.4 billionlast year in view of higher taxable income in the current year
Net Income from Discontinuing Operations of P0.4 billion pertains to net income ofPNB Life which was presented under a separate line item in the FS in line with the saleagreement with Allianz.
Total Comprehensive Income for December 31, 2015 amounted to P6.2 billion, P0.8billion higher compared to the P5.4 billion for the same period last year. Improvementin OCI mainly came from higher net income and accumulated translation adjustments inthe current year partly offset by unrealized losses on AFS investments.

46
2014 vs. 2013
Consolidated net income reached P5.5 billion for the twelve months ended December31, 2014, an improvement of P0.3 billion compared with the P5.2 billion net incomereported for the same period last year.
Net interest income for the year ended 2014 at P16.5 billion went up significantly byP3.0 billion compared to P13.5 billion in 2013 as interest income posted an increase ofP1.9 billion at P20.1 billion vs P18.2 billion primarily accounted for by interest on loansand receivables which increased by P2.1 billion, driven by significant expansion in theloan portfolio. On the other hand, interest expense which amounted to P4.7 billion lastyear dropped by P1.1 billion to P3.6 billion as the Bank continued to undertake itsliability management exercise by raising long term deposits at lower interest rates. InMarch 2014, PNB redeemed P3.25 billion worth of LTNCDs with a coupon rate of6.50% and in October 2014 likewise redeemed P3.5 billion worth of LTNCDs with acoupon rate of 7% issued by the ABC. These funds were replaced with an issuance ofP7.0 billion worth of LTNCDs with a coupon rate of 4.125% which will mature in June2020. Furthermore, interest on borrowings also declined as a result of the redemptionof unsecured subordinated debts totaling P10.5 billion in 2013 (P4.5 billion, 7.13%redeemed in March 2013 and P6.0 billion, 8.5% redeemed in June 2013).
Fee-based and other income decreased by P1.6 billion to P6.2 billion from P7.8 billionfor the same period last year. The decrease was attributed to lower gains from Tradingand Investment Securities which declined by P3.3 billion, partly offset by the P0.1billion, P0.9 billion and P0.7 billion increases in Foreign Exchange Gains, Net gain onsale or exchange of assets and Miscellaneous Income, respectively.
Net service fees and commission income and net insurance premium were at P2.9billion and P0.3 billion, respectively, for the period ended December 31, 2014.
Administrative and other operating expenses totaled P19.2 billion for the year endedDecember 31, 2014, P2.3 billion more than last year's P16.9 billion. Increases wereregistered in Compensation and Fringe Benefits by P1.5 billion partly due toimplementation of the 2014 Collective Bargaining Agreement effective July 2014.Provision for impairment and credit losses also increased by P1.5 billion to P2.3 billionfrom P0.8 billion last year. Partly offset by P0.2 billion decreases in depreciation andamortization and P0.5 billion miscellaneous expenses.
Total Comprehensive Income for the twelve months period ended December 31, 2014amounted to P5.4 billion, P3.8 billion higher compared to the P1.6 billion for the sameperiod last year. Current year’s comprehensive income came mainly from the netincome totaling P5.5 billion and net unrealized gain on available-for-sale securities byP1.2 billion, offset by P0.4 billion in accumulated translation adjustments, P1.0 billionre-measurement losses on retirement plan taken up in the current year.

47
Key Performance Indicators
Capital Adequacy/Capital Management
The Parent Company’s Capital Management (Sub-Committee of the Asset/LiabilityCommittee) has been created to specifically handle policies and procedures pertaining to thecapital planning and assessment as well as possible equity investments of the Bank.
The Sub-Committee shall be responsible for the following:
- Determine the appropriate level of capital that will support the attainment of the Bank’sstrategic objectives, meet the minimum regulatory requirements and cover all materialrisks that the Bank may encounter in the course of its business
- Periodically monitor and assess the capital ratios of the Bank. Monitoring shall includecapital ratios with and without the regulatory stress test prescribed by the regulators, basedon both the consolidated and solo financial statements of the bank.
- Report to the ALCO the Bank’s capital ratio and position based the consolidated and solofinancial statements on a monthly basis and to the Board ICAAP Steering Committee on aquarterly basis.
- Inform the ALCO/ Board ICAAP Steering Committee on possible breach of ICAAP capitalthresholds, particularly during period of stress and activating the Bank’s capitalcontingency plan, if needed. The Sub-Committee will evaluate and endorse to the Board the options to improve theBank’s capital adequacy as provided for in the Capital Contingency Plan In case of capital sourcing, the Sub-Committee shall endorse to the Board ICAAPSteering Committee / Board the manner, the amount and time period for capital raising.
- Ensure that the capital ratios resulting from the three-year strategic business plan under theBank’s ICAAP shall meet the minimum regulatory requirement as well as the Bank’sinternal thresholds. The Sub-Committee shall determine the Bank’s internal thresholds and shall endorsesame to the Board ICAAP Steering Committee / Board.
- Undertake the optimal allocation of the capital to the different business groups inaccordance with the portfolio diversification policy and subject to the sustainability ofearnings, risk weights of assets, among others.
The Bank and its individual regulatory operations have complied with all externallyimposed capital requirements throughout the period.
Regulatory Qualifying CapitalUnder existing BSP regulations, the determination of the Parent Company’s compliancewith regulatory requirements and ratios is based on the amount of the Parent Company’s“unimpaired capital” (regulatory net worth) reported to the BSP, which is determined onthe basis of regulatory policies, which differ from PFRS in some respects.
As required under BSP Circular 781, the risk-based capital ratio of a bank, expressed as apercentage of qualifying capital to risk-weighted assets, should not be less than 10.00% for

48
both solo basis (head office and branches) and consolidated basis (parent bank andsubsidiaries engaged in financial allied undertakings but excluding insurance companies).Other minimum ratios include Common Equity Tier (CET) 1 ratio and Tier 1 capital ratiosof 6.0% and 7.5%, respectively. A conservation buffer of 2.5%, comprised of CET 1capital is likewise imposed.
Banks and their subsidiaries are subject to the following risk-based capital adequacy ratios(CARs):
a. Common Equity Tier 1 – must be at least 6.0% of risk weighted assets at all time;b. Tier 1 capital must be at least 7.5% of risk weighted assets at all times; andc. Qualifying capital (Tier 1 Capital plus Tier 2 Capital) must be at least 10.0% of
risk weighted assets at all times.
Qualifying capital consists of the sum of the following elements, net of required deductions:a. Common equity Tier 1 capital consists of 1) Paid up common stock that meet the
eligibility criteria, b) Common stock dividends distributable, additional paid incapital resulting from the issuance of common stock included in CET1 capital,Deposits for common stock subscription, Retained earnings, Undivided profits, othercomprehensive income (net unrealized gains or losses on AFS and cumulativeforeign currency translation), and minority interest on subsidiary banks which areless than wholly-owned
b. Additional Tier 1 capital consists of instruments issued by the bank that are notincluded in CET 1 capital that meet the criteria for inclusion in additional tier 1capital, meet the required loss absorbency features for instrument classified asliabilities and loss absorbency feature at point of non-viability as defined in the BSPguidelines.
c. Tier 2 capital is composed of 1) instruments issued by the Bank (and are not includedin AT1 capital) that meet criteria for inclusion in Tier 2 and meet the required lossabsorbency feature at point of non-viability as defined in the guidelines, 2) Depositsfor subscription of T2 capital, 3) appraisal increment reserves on bank premises asauthorized by the Monetary Board, 4) general loan loss provision, limited to amaximum of 1.00% of credit risk weighted asset, and minority interest in subsidiarieswhich are less than wholly owned as defined in the guidelines.
A capital conservation buffer of 2.5% of risk weighted assets, comprised of CET 1 capital,shall be required. This buffer is meant to promote the conservation of capital and build-upof adequate cushion that can be drawn down to absorb losses during period of financial andeconomic stress.
The Group’s consolidated capital adequacy ratio for combined credit, market andoperational risks computed based on BSP Circular No. 781 (for 2014) and BSP CircularNo. 538 (for 2013 and 2012) were 16.65%, 19.24% and 20.60% as of December 31, 2016,2015 and 2014, respectively, above the minimum 10% required by BSP. The followingtable sets the regulatory capital as reported to BSP as at December 31, 2016, 2015 and2014:

49
CAPITAL ADEQUACY RATIO(Amounts in Million) CONSOLIDATED PARENT
2016 2015 2014 2016 2015 2014
A. Tier 1 Capital 104,103.597 97,272.252 93,899.128 101,545.136 94,044.294 90,782.607
A.1 Common Equity Tier 1 (CET1) Capital 104,103.597 97,272.252 93,899.128 101,545.136 94,044.294 90,782.607
Paid-up common stock 49,965.587 49,965.587 49,965.587 49,965.587 49,965.587 49,965.587
Common stock dividends distributable 0.000 0.000 0.000 0.000 0.000 0.000
Additional paid-in capital 1/ 31,331.251 31,331.251 31,331.251 31,331.251 31,331.251 31,331.251
Deposit for common stock subscription 0.000 0.000 0.000 0.000 0.000 0.000
Retained earnings 24,866.360 18,277.578 13,368.528 25,215.142 17,799.075 12,689.560
Undivided profits 2/ 0.000 0.000 0.000 0.000 0.000 0.000
Other comprehensive income (4,634.165) (4,720.666) (3,469.641) (4,966.844) (5,051.619) (3,203.791)
Minority interest in subsidiary banks w hich are less than w holly-ow ned 2,574.564 2,418.502 2,703.403 0.000 0.000 0.000
A.2 Regulatory Adjustments to CET1 Capital 24,454.278 22,978.468 22,391.624 49,874.807 47,596.437 45,931.470
Total outstanding unsecured credit accommodations, both direct andindirect, to directors, off icers, stockholders and their related interests(DOSRI) 2.583 1.515 1.906 2.583 1.515 1.906
Total outstanding unsecured loans, other credit accommodations andguarantees granted to subsidiaries 2,014.333 1,958.667 1,575.000 2,014.333 1,878.667 1,575.000
Deferred tax assets 9/ 4,350.895 3,478.712 3,810.979 4,006.138 3,257.313 3,567.215
Goodw ill 10/ 13,515.765 13,515.765 13,515.765 13,515.765 13,515.765 13,515.765
Other intangible assets 11/ 1,424.055 1,670.277 2,033.313 1,333.201 1,573.764 1,938.996
Investments in equity of unconsolidated subsidiary banks and quasi-banks,and other f inancial allied undertakings (excluding subsidiary securitiesdealers/brokers and insurance companies), after deducting relatedgoodw ill, if any (for solo basis only and as applicable) 13/ 0.000 0.000 0.000 25,678.974 25,141.007 24,066.287
Investments in equity of unconsolidated subsidiary securitiesdealers/brokers and insurance companies after deducting related goodw ill,if any (for both solo and consolidated bases and as applicable) 13/ 281.443 2,351.483 1,452.612 458.609 2,226.357 1,264.252 Signif icant minority investments (10%-50% of of voting stock) in securitiesdealers/brokers and insurance companies, after deducting related goodw ill,if any (for both solo and consolidated bases) 13/ 2,863.271 0.000 0.000 2,863.271 0.000 0.000
Other equity investments in non-financial allied undertakings and non-alliedundertakings 1.933 1.933 1.933 1.933 1.933 1.933
Reciprocal investments in common stock of other banks/quasi-banks andfinancial allied undertakings including securities dealers/brokers andinsurance companies, after deducting related goodw ill, if any (for both soloand consolidated bases) 0.000 0.116 0.116 0.000 0.116 0.116
A.3 TOTAL COMMON EQUITY TIER 1 CAPITAL (A.1 minus A.2) 79,649.319 74,293.784 71,507.504 51,670.329 46,447.857 44,851.137
A.4 Additional Tier 1 (AT1) 0.000 0.000 0.000 0.000 0.000 0.000
A.5 Regulatory Adjustments to Additional Tier 1 (AT1) Capital 0.000 0.000 0.000 0.000 0.000 0.000
A.6 TOTAL ADDITIONAL TIER 1 CAPITAL (A.4 minus A.5) 0.000 0.000 0.000 0.000 0.000 0.000
A.7 TOTAL TIER 1 CAPITAL (Sum of A.3 and A.6) 79,649.319 74,293.784 71,507.504 51,670.329 46,447.857 44,851.137
B. Tier 2 (T2) Capital
B.1 Tier 2 (T2) Capital 4,308.027 13,763.244 13,040.320 3,866.446 13,417.009 12,833.101
Instruments issued by the bank that are eligible as Tier 2 capital(Unsecured Subordinated Debt - Eligible until 31 December 2015 asper BSP Memorandum No. M2013-008 dated 05 March 2013) 0.000 9,986.427 9,970.136 0.000 9,986.427 9,969.498
Appraisal Increment Reserve, Bank Premises auth. By MB 291.725 291.725 291.725 291.725 291.725 291.725
General loan loss provision (limited to 1.00% of credit risk-w eighted assetscomputed per Part III, Item B.) 4,016.302 3,485.092 2,778.459 3,574.721 3,138.857 2,571.878
B.2 Regulatory Adjustments to Tier 2 capital 0.000 0.000 0.000 0.000 0.000 0.000
B.3 TOTAL TIER 2 CAPITAL 4,308.027 13,763.244 13,040.320 3,866.446 13,417.009 12,833.101
TOTAL QUALIFYING CAPITAL 83,957.346 88,057.028 84,547.824 55,536.775 59,864.866 57,684.238
The risk-weighted assets of the Group and Parent Company as of Year Ending 2016, 2015, and 2014 are as follows:
Risk-weighted on Balance sheet assets: 446,101.620 405,219.194 359,881.507 397,730.498 366,857.832 329,029.139
20% 13,482.401 7,358.947 3,948.319 11,676.125 6,677.082 3,845.662
50% 24,819.389 16,841.447 15,558.027 22,328.759 15,459.492 13,799.102
75% 18,761.908 16,119.608 14,282.083 18,039.059 14,063.362 13,705.209
100% 371,161.410 345,521.954 297,726.532 330,044.869 312,532.594 270,610.938
150% 17,876.512 19,377.239 28,366.547 15,641.686 18,125.303 27,068.228
Off-Balance sheet assets: 13,052.998 7,669.446 5,914.306 12,953.775 7,554.533 5,750.879
20% 0.000 127.791 64.024 0.000 127.791 64.024
50% 31.543 4,577.949 1,671.841 31.543 4,577.949 1,671.841
75% 173.496 344.806 442.532 173.496 344.807 442.532
100% 12,847.959 2,618.900 3,735.909 12,748.736 2,503.986 3,572.482
150% 0.000 0.000 0.000 0.000 0.000 0.000
1,622.161 1,304.542 1,497.381 1,622.161 1,304.541 1,497.381
498.213 499.469 275.678 471.136 471.965 254.248
0.000 0.000 0.000 0.000 0.000 0.000
0.000 0.000 0.000 0.000 0.000 0.000
0.000 0.000 0.000 0.000 0.000 0.000
Total Credit Risk Weighted Assets 461,274.992 414,692.651 367,568.872 412,777.570 376,188.871 336,531.647
Market Risk Weighted Assets 2,752.606 3,428.025 4,532.456 2,703.429 3,067.984 4,233.579
Operational Risk-Weighted Assets 40,073.477 39,541.943 38,234.751 35,831.511 35,791.717 34,261.055
Total Risk Weighted Assets 504,101.075 457,662.619 410,336.079 451,312.510 415,048.571 375,026.281
Capital RatiosCommon Equity Tier 1 Ratio 15.80% 16.23% 17.43% 11.45% 11.19% 11.96%
Capital Conservation Buffer 9.80% 10.23% 11.43% 5.45% 5.19% 5.96%
Tier 1 Capital Ratio 15.80% 16.23% 17.43% 11.45% 11.19% 11.96%
Total Capital Adequacy Ratio 16.65% 19.24% 20.60% 12.31% 14.42% 15.38%
Total Risk-Weighted Securitization Exposures
General loan loss provision [in excess of the amount permitted to be included in UpperTier 2]
Total Counterparty Risk-Weighted Assets in the Banking Book (Derivatives and Repo-
Total Counterparty Risk-Weighted Assets in the Trading Book (Derivatives and Repo-style Transactions)
Total Risk-Weighted Amount of Credit Linked Notes in the Banking Book

50
Asset Quality
The Group’s non-performing loans (gross of allowance for impairment losses) decreased toP8.8 billion as of December 31, 2016 compared to P9.0 billion as of December 31, 2015.NPL ratios of the Bank based on BSP guidelines, net of valuation reserves is better thanindustry average at 0.18% as at December 31, 2016, compared to 0.25% at end of 2015.Gross NPL ratio is at 2.31% at end of 2016 and 2.61% at end of 2015.
ProfitabilityYear Ended
12/31/16 12/31/15
Return on equity (ROE)1/ 6.8% 6.4%Return on assets(ROA)2/ 1.0% 1.0%Net interest margin(NIM)3/ 3.2% 3.2%
1/Net income divided by average total equity for the period indicated
2/Net income divided by average total assets for the period indicated3/Net interest income divided by average interest-earning assets
Liquidity
The ratio of liquid assets to total assets as of December 31, 2016 was 31.8% compared to30.6% as of December 31, 2015. Ratio of current assets to current liabilities was at 60.2% asof 31 December 2016 compared to 64.1% as of December 31, 2015.
Cost Efficiency
The ratio of total operating expenses (excluding provision for impairment, credit and otherlosses) to total operating income resulted to 63.8% for the year ended December 2016compared to 69.3% for the same period last year.
Known trends, demands, commitments, events and uncertainties
The Bank presently has more than adequate liquid assets to meet known funding requirementsand there are no known trends, demands, commitments, events or uncertainties that will have amaterial impact on the Bank’s liquidity.
Events that will trigger direct or contingent financial obligation
In the normal course of business, the Group makes various commitments and incurs certaincontingent liabilities that are not presented in the financial statements, including several suitsand claims which remain unsettled. No specific disclosures on such unsettled assets and claimsare made because any such disclosures would prejudice the Group’s position with the otherparties with whom it is in dispute. Such exemption from disclosures is allowed under PAS 37,Provisions, Contingent Liabilities and Contingent Assets. The Group and its legal counselbelieve that any losses arising from these contingencies which are not specifically provided forwill not have a material adverse effect on the financial statements.

51
Material off-balance sheet transactions, arrangement or obligation
The following is a summary of various commitments and contingent liabilities of the Group asof December 31, 2016 and 2015 at their equivalent peso contractual amounts:
12/31/2016 12/31/2015(In Thousand Pesos)
Trust department accounts P=75,238,152 P=78,708,656Derivative forwards 40,000,448 32,378,255Interest rate swaps 33,610,720 9,317,880Standby letters of credit 26,232,306 22,031,604Deficiency claims receivable 22,337,807 21,562,415Unutilized credit card lines 27,018,318 15,725,684Derivative spots 2,358,455 5,526,044Inward bills for collection 1,001,375 356,152Outward bills for collection 282,212 320,428Confirmed export letters of credit 100,461 88,409Unused commercial letters of credit 50,062 48,957Shipping guarantees issued 13,716 10,033Items held as collateral 1,237 42Other credit commitments – 974,377Other contingent accounts 2,073,225 298,336
Capital Expenditures
The Bank has committed on investing in the upgrade plan of its Systematics core bankingsystem running on the IBM z-series mainframe, as well as on a new branch banking system.This ongoing top priority enterprise-wide project is expected to be completed in 2017 andrequires major capital expenditures. For this project and other medium scale projects requiringinformation technology solutions, expected sources of funds will come from the sale ofacquired assets and funds generated from the Bank's operations.
Significant Elements of Income or Loss
Significant elements of the Bank’s revenues consist mainly of net interest margin, service fees,net trading gains and gains from disposal of reacquired properties while the Bank’s expensesconsist mainly of staff cost, depreciation and amortization of assets and provisions for probablelosses. Please refer to the discussions on the results of operations for further details.
Seasonal Aspects
There was no seasonal aspect that had material effect on the Bank’s financial condition orresults of operations.

52
Item 7. Financial Statements
The Audited Financial Statements (AFS) of the Bank and its Subsidiaries, which comprise theStatements of Financial Position as at December 31, 2016 and 2015 and January 1, 2015, andthe Statements of Income, Statements of Comprehensive Income, Statements of Changes inEquity and Statements of Cash Flows for each of the three (3) years in the period endedDecember 31, 2016 and a Summary of Significant Accounting Policies and other explanatoryinformation, Notes to Financial Statements, Independent Auditors’ Report and the Statement ofManagement’s Responsibility are filed as part of this SEC 17-A report for the year endedDecember 31, 2016.
Item 8. Information on Independent Accountant and Changes in/disagreements withAccountants on Accounting/Financial Disclosure
A. Independent Public Accountants
SyCip Gorres Velayo & Co., CPAs (SGV) is the current external auditor of the Bank andits domestic subsidiaries for the calendar year 2016. Representatives of SGV are expectedto be present at the stockholders meeting. They will have the opportunity to make astatement if they desire to do so and will be available to respond to appropriate questions.Ms. Vicky Lee Salas is the engagement partner of the Bank for the year 2016.
The Board Audit and Compliance Committee (BACC) has sole authority to select, evaluate,appoint, dismiss, replace and reappoint the Bank's external auditors, subject to the approvalof the Board of Directors and ratification of Stockholders, based on fair and transparentcriteria such as (i)core values, culture and high regard for excellence in audit quality; (ii)technical competence and expertise of auditing staff; (iii) independence; (iv) effectivenessof the audit process; and (v) reliability and relevance of the external auditor's reports. TheBank intends to retain SGV & Co. as its external auditor for the year 2017 subject to BACCendorsement, BOD approval and Stockholders ratification.
For the years reported, there were no changes in and disagreements with the Bank's externalauditors on accounting and financial disclosure.
B. Audit and other related fees
The following are the engagement fees billed and paid for each of the last two fiscal yearsfor the professional services rendered by the Bank’s external auditor, SyCip Gorres Velayoand Co.:
2016Audit
P14.174 million engagement fee for the audit of the Bank’s Financial Statements as ofDecember 31, 2016 (inclusive of out-of-pocket expenses (OPE) but excluding Value AddedTax (VAT).

53
P7.022 million engagement fee for the review of Financial Statements as of June 30,2016 and engagement fee for the issuance of Comfort Letter related to the offering of PNBLTNCD Long Term Negotiable Certificates of Time Deposit (LTNCD) in June 2016.
P3.524 million engagement fee for the audit of the Bank’s Financial Statements as ofMarch 31, 2016 (inclusive of out-of-pocket expenses (OPE) but excluding Value AddedTax (VAT).
Other Related Fees
P5.240 million engagement fee for PFRS 9 Diagnostics, Gap Analysis and KnowledgeTransfer on the New Impairment Model.
2015Audit
P14.582 million engagement fee for the audit of the Bank’s Financial Statements as ofDecember 31, 2015 (inclusive of out-of-pocket expenses (OPE) but excluding Value AddedTax (VAT).
2014Audit
P12.802 million engagement fee for the audit of the Bank’s Financial Statements as ofDecember 31, 2014 (inclusive of out-of-pocket expenses (OPE) but excluding Value AddedTax (VAT).
P6.350 million engagement fee for the review of Financial Statements as of June 30,2014 and engagement fee for the issuance of Comfort Letter related to the offering of PNBLTNCD Long Term Negotiable Certificates of Time Deposit (LTNCD) in June 2014.
There are no fees billed for the last three (3) years for tax accounting performed by theBank’s external auditor.
The approval of audit engagement fees is based on the Bank’s existing Manual of SigningAuthority.
C. Changes in Accounting Policies and Disclosures
The accounting policies adopted are consistent with those of the previous year except forthe following amendments and improvements to Philippine Financial Reporting Standards(PFRS) which are effective beginning on or after January 1, 2016. Except as otherwiseindicated, the changes in the accounting policies that did not have any significant impact onthe financial position or performance of the Group follow:
PFRS 10, PFRS 12 and PAS 28, Investment Entities: Applying the ConsolidationException (Amendments)
PFRS 11, Accounting for Acquisitions of Interests in Joint Operations(Amendments) PFRS 14, Regulatory Deferral Accounts Philippine Accounting Standards (PAS) 1, Disclosure Initiative (Amendments)

54
PAS 16 and PAS 38, Clarification of Acceptable Methods of Depreciation andAmortization (Amendments)
PAS 16 and PAS 41, Agriculture: Bearer Plants (Amendments)
Annual Improvements to PFRSs (2012-2014 cycle) PFRS 5, Non-current Assets Held-for-Sale and Discontinued Operations – Changes in
Methods of Disposal (Amendments) PFRS 7, Financial Instruments: Disclosures – Servicing Contracts(Amendments) PFRS 7, Applicability of the Amendments to PFRS to Condensed Interim Financial
Statements (Amendments) PAS 19, Employee Benefits – regional market issue regarding discount rate
(Amendments) PAS 34, Interim Financial Reporting – disclosure of information elsewhere in the
interim financial report (Amendments)
In 2016, the Parent Company adopted the amendments to PAS 27, Separate FinancialStatements, Equity Method in Separate Financial Statements, following the guidelines providedby the BSP. The amendments allow entities to use the equity method to account forinvestments in subsidiaries, joint ventures, and associates in their separate financial statements.These amendments do not have any impact on the Group’s consolidated financial statements.
Additional statement of financial position as at January 1, 2015 is presented in the separatefinancial statements due to retrospective application of the change in accounting policy.The effects of retrospective restatement of items in the financial statements are detailed below:
December 31, 2015As previously
reportedEffect of
restatement As restatedStatement of Financial PositionInvestments in subsidiaries and an
associate P=23,821,982 P=2,675,750 P=26,497,732Deferred tax assets 1,031,948 (95,456) 936,492Assets of a disposal group classified as
held for sale 846,015 326,948 1,172,963Surplus 22,219,098 2,580,260 24,799,358Net unrealized loss on available-for-sale
investments (3,022,853) (7,735) (3,030,588)Remeasurement losses on retirement plan (2,326,283) (37,932) (2,364,215)Accumulated translation adjustment 154,713 457,755 612,468Reserves of a disposal group classified as
held for sale − (85,106) (85,106)

55
For the year ended December 31, 2015As previously
reportedEffect of
restatement As restatedStatement of Comprehensive IncomeStatement of incomeMiscellaneous income P=1,759,155 (P=259,482) P=1,499,673Equity in net earnings of subsidiaries and
an associate − 69,307 69,307Provision for income tax 1,014,865 95,456 1,110,321Net income from discontinued operations − 182,545 182,545Other comprehensive incomeShare in changes in net unrealized gains
on available-for-sale investments ofsubsidiaires and an associate − 51,906 51,906
Share in changes in accumulatedtranslation adjustment of subsidiariesand an associate − 586,212 586,212
Share in changes in remeasurement gainson retirement plan of subsidiaries andan associate − 5,071 5,071
January 1, 2015As previously
reportedEffect of
restatement As restatedStatement of Financial PositionInvestments in subsidiaries and an
associate P=24,102,612 P=2,452,245 P=26,554,857Surplus 16,019,048 2,683,346 18,702,394Net unrealized loss on available-for-sale
investments (2,276,501) (59,641) (2,336,142)Remeasurement losses on retirement plan (2,249,830) (43,003) (2,292,833)Accumulated translation adjustment 68,603 (128,457) (59,854)

56
For the year ended December 31, 2014As previously
reportedEffect of
restatement As restatedStatement of Comprehensive IncomeStatement of incomeMiscellaneous income P=1,419,591 (P=67,794) P=1,351,797Equity in net earnings of subsidiaries and
an associate − 1,007,198 1,007,198Other comprehensive incomeShare in changes in net unrealized gains
on available-for-sale investments ofsubsidiaires and an associate − 121,295 121,295
Share in changes in accumulatedtranslation adjustment of subsidiariesand an associate − (194,234) (194,234)
Share in changes in remeasurement gainson retirement plan of subsidiaries andan associate − (27,530) (27,530)
D. Disagreements with Accountants
The Bank and its subsidiaries had no disagreement with its auditors on any matter ofaccounting principles or practices, financial statements disclosure, or auditing scopeprocedure.
In compliance with SEC Rule 68, as amended, and BSP Circular 660, Series of 2009, wereport no change to the appointed external auditor of the Bank for 2017, subject to BACCendorsement, BOD approval and Stockholders ratification. Ms. Vicky Lee-Salas, SGV’sMarket Group 5 Lead and one of the more experienced audit partners in the bankingindustry, was the lead audit partner for the year 2016.

57
PART III - CONTROL AND COMPENSATION INFORMATION
Item 9. Directors and Executive Officers
A. Name, position, age, date of assumption and citizenship of Directors and ExecutiveOfficers as of December 31, 2016
Board of Directors1/
Name Position AgeDate lastElected
Datefirst
ElectedCitizens
hip
Florencia G. Tarriela Independent Director and Chairperson of theBoard of Directors
Chairman of the Corporate GovernanceCommittee
Member of the Board and Audit ComplianceCommittee and Board IT GovernanceCommittee
Non-voting Member of the Executive Committee
70 5/31/2016 5/29/2001 Filipino
Felix Enrico R.Alfiler
Independent Director and Vice Chairman of theBoard
Chairman of the Risk Oversight CommitteeMember of the Corporate Governance Committee
and Board Audit and Compliance CommitteeNon-voting Member of the Executive Committee
67 5/31/2016 1/1/2012 Filipino
Florido P. Casuela DirectorChairman of the Executive CommitteeMember of the Risk Oversight Committee,Board Oversight Committee – Domestic andForeign Offices/Subsidiaries and Board ITGovernance Committee
75 5/31/2016 5/30/2006 Filipino
Leonilo G. Coronel DirectorChairman of the Board IT GovernanceCommitteeMember of the Executive Committee and TrustCommittee
70 5/31/2016 5/28/2013 Filipino
Edgar A. Cua Independent DirectorChairman of the Board Audit and ComplianceCommitteeMember of the Risk Oversight Committee andBoard Oversight RPT Committee
61 5/31/2016 5/31/2016 Filipino
Reynaldo A.Maclang
DirectorMember of the Corporate GovernanceCommittee, Executive Committee and TrustCommittee
78 5/31/2016 2/9/2013 Filipino
/ The directors are elected either by the stockholders (under section 5.3 of the PNB By-Laws) or by the Board of Directors (under Section 5.7 of thesaid By-Laws).3/ Independent Director – As used in Section 38 of the Securities Regulation Code, an Independent Director means a person who, apart from his fees
and shareholdings, is independent of management and free from any business or other relationship which could, or could reasonably beperceived to, materially interfere with his exercise of independent judgment in carrying out his responsibilities as a director in any coveredcompany.

58
Name Position AgeDate lastElected
Datefirst
ElectedCitizens
hip
Estelito P. Mendoza Director 87 5/31/2016 1/1/2009 Filipino
Christopher J. Nelson DirectorChairman of Board Oversight Committee –Domestic and Foreign Offices/ SubsidiariesMember of the Executive Committee, TrustCommittee and Board IT Governance Committee
57 5/31/2016 5/24/2014 British
Federico C. Pascual Independent DirectorChairman of the Board Oversight RPTCommittee and Trust CommitteeMember of the Corporate Governance CommitteeNon-voting Member of the Executive Committee
74 5/31/2016 5/27/2014 Filipino
Cecilio K. Pedro Independent DirectorMember of the Board Oversight RPT CommitteeMember of the Corporate Governance Committee
63 5/31/2016 2/28/2014 Filipino
Washington Z. Sycip Director 95 5/31/2016 12/8/1999 FilipinoAmerican
Carmen K. Tan Director 75 5/31/2016 5/31/2016 Filipino
Lucio C. Tan Director 82 5/31/2015 12/8/1999 Filipino
Lucio K. Tan, Jr. DirectorMember of the Executive Committee and Board
IT Governance Committee
50 5/31/2015 9/28/2007 Filipino
Michael G. Tan DirectorMember of the Executive Committee and Board
Oversight Committee – Domestic and ForeignOffices/ Subsidiaries
50 5/31/2016 2/9/2013 Filipino
None of the above-mentioned Directors is an appointed official or employee of any agency of the Government of the Philippines.
Name Position Age Date Appointed Citizenship
Maria Katrina y.Ilarde
Corporate Secretary 33 6/26/2015 Filipino
Ruth Pamela E.Tanghal
Assistant Corporate Secretary 48 6/29/2015 Filipino
Joseph T. Chua Board Advisor 59 5/26/2015 Filipino
Manuel T. Gonzales Board Advisor 79 10/01/2013 Filipino
William T. Lim Board Advisor 76 1/25/2013 Filipino
Harry C. Tan Board Advisor 70 5/31/2016 Filipino

59
Executive Officers
Name Position AgeDate of
Assumption Citizenship
Reynaldo A. Maclang President 78 5/31/2016 Filipino
Cenon C. Audencial, Jr. Executive Vice PresidentHead of the Institutional Banking Sector
58 8/5/2013 Filipino
Horacio E. Cebrero III Executive Vice PresidentHead of the Treasury Sector
54 7/19/2010 Filipino
Nelson C. Reyes Executive Vice PresidentChief Financial Officer and Head of the FinancialManagement and Controllership Sector
52 1/1/2015 Filipino
Bernardo H. Tocmo Executive Vice PresidentHead of the Retail Banking Sector
55 10/1/2015 Filipino
Yolanda M. Albano First Senior Vice PresidentHead of the Commercial Banking Group
66 2/9/2013 Filipino
Alice Z. Cordero First Senior Vice PresidentChief Compliance Officer, Corporate GovernanceExecutive and Head of the Global Compliance Group
59 6/16/2010 Filipino
Socorro D. Corpus First Senior Vice PresidentHead of the Human Resource Group
65 2/9/2013 Filipino
Miguel Angel G.Gonzalez
First Senior Vice PresidentChief Credit Officer and Head of the Credit
Management Group
58 3/3/2010 Filipino
John Howard D. Medina First Senior Vice PresidentHead of the Global Operations Group
47 2/11/2013 Filipino
Benjamin J. Oliva First Senior Vice PresidentHead of the Global Filipino Banking Group
64 9/10/2012 Filipino
Aida M. Padilla First Senior Vice PresidentHead of the Remedial Management Group
67 4/26/2009 Filipino
Carmela Leticia A. Pama First Senior Vice PresidentChief Risk Officer and Head of the Risk ManagementGroup
60 10/9/2006 Filipino
Emmanuel German V.Plan II
First Senior Vice PresidentHead of the Enterprise Sector andSpecial Asset Management Group
64 6/8/2009 Filipino
Manuel C. Bahena, Jr. Chief Legal CounselSenior Vice President
55 2/11/2013 Filipino
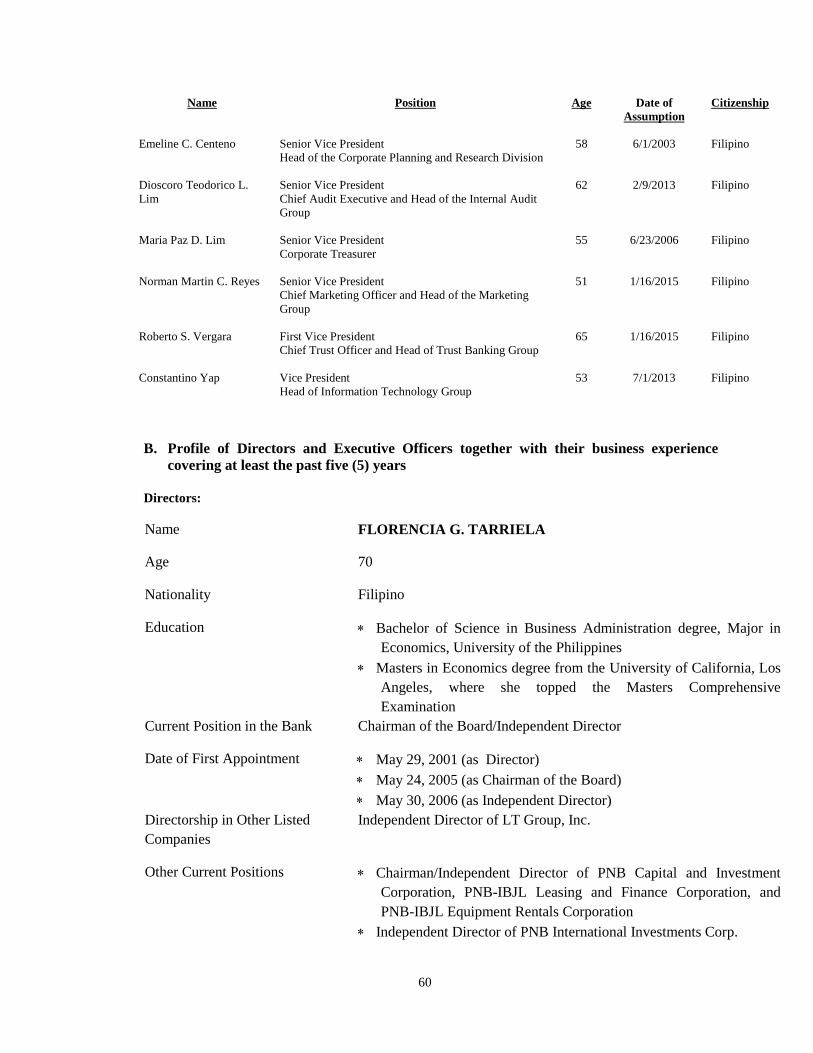
60
Name Position Age Date ofAssumption
Citizenship
Emeline C. Centeno Senior Vice PresidentHead of the Corporate Planning and Research Division
58 6/1/2003 Filipino
Dioscoro Teodorico L.Lim
Senior Vice PresidentChief Audit Executive and Head of the Internal AuditGroup
62 2/9/2013 Filipino
Maria Paz D. Lim Senior Vice PresidentCorporate Treasurer
55 6/23/2006 Filipino
Norman Martin C. Reyes Senior Vice PresidentChief Marketing Officer and Head of the MarketingGroup
51 1/16/2015 Filipino
Roberto S. Vergara First Vice PresidentChief Trust Officer and Head of Trust Banking Group
65 1/16/2015 Filipino
Constantino Yap Vice PresidentHead of Information Technology Group
53 7/1/2013 Filipino
B. Profile of Directors and Executive Officers together with their business experiencecovering at least the past five (5) years
Directors:
Name FLORENCIA G. TARRIELA
Age 70
Nationality Filipino
Education Bachelor of Science in Business Administration degree, Major inEconomics, University of the Philippines
Masters in Economics degree from the University of California, LosAngeles, where she topped the Masters ComprehensiveExamination
Current Position in the Bank Chairman of the Board/Independent Director
Date of First Appointment May 29, 2001 (as Director) May 24, 2005 (as Chairman of the Board) May 30, 2006 (as Independent Director)
Directorship in Other ListedCompanies
Independent Director of LT Group, Inc.
Other Current Positions Chairman/Independent Director of PNB Capital and InvestmentCorporation, PNB-IBJL Leasing and Finance Corporation, andPNB-IBJL Equipment Rentals Corporation
Independent Director of PNB International Investments Corp.

61
Columnist for “Business Options” of the Manila Bulletin and“FINEX Folio” of Business World
Director/Vice President of Tarriela Management Company andDirector/Vice President/ Assistant Treasurer of GozonDevelopment Corporation
Life Sustaining Member of the Bankers Institute of the Philippinesand FINEX, where she is also a Director
Trustee of TSPI Development Corporation, TSPI MBA, andFoundation for Filipino Entrepreneurship, Inc.
Co-author of several inspirational books - “Coincidence or Miracle?Books I, II, III (“Blessings in Disguise”), IV (“Against All Odds”),and V (“Beyond All Barriers”), and gardening books - “Oops-Don’tThrow Those Weeds Away!” and “The Secret is in the Soil”
Environmentalist and practices natural ways of gardeningOther Previous Positions Independent Director of PNB Life Insurance, Inc.
Undersecretary of Finance Alternate Monetary Board Member of the Bangko Sentral ng
Pilipinas, Land Bank of the Philippines and the Philippine DepositInsurance Corporation
Deputy Country Head, Managing Partner and the first Filipina VicePresident of Citibank N. A.
President, Bank Administration Institute of the PhilippinesAwards/Citations 2014 Most Outstanding Citibank Philippines Alumni awardee for
community involvement
Name FELIX ENRICO R. ALFILER
Age 67
Nationality Filipino
Education Bachelor of Science and Masters in Statistics from the Universityof the Philippines
Current Position in theBank
Vice Chairman/Independent Director
Date of First Appointment January 1, 2012
Directorship in OtherListed Companies
None
Other Current Positions Chairman/Independent Director of PNB General Insurers Co.,Inc. and PNB RCI Holdings Co., Ltd.

62
Independent Director of PNB Savings Bank and PNBInternational Investments Corp.
Other Previous Positions Independent Director of PNB-IBJL Leasing and FinanceCorporation
Senior Advisor to the World Bank Group Executive Board inWashington, D.C.
Special Assistant to the Philippine Secretary of Finance forInternational Operations and Privatization
Director of the Bangko Sentral ng Pilipinas Assistant to the Governor of the Central Bank of the Philippines Senior Advisor to the Executive Director at the International
Monetary Fund Associate Director at the Central Bank Head of the Technical Group of the CB Open Market
Committee Monetary Policy Expert in the Economics Sub-Committee of the
1985-1986 Philippine Debt Negotiating Team which negotiatedwith over 400 private international creditors for therescheduling of the Philippines’ medium- and long-term foreigndebts
Advisor at Lazaro Bernardo Tiu and Associates, Inc. President of Pilgrims (Asia Pacific) Advisors, Ltd. President of the Cement Manufacturers Association of the
Philippines (CeMAP) Board Member of the Federation of Philippine Industries (FPI) Vice President of the Philippine Product Safety and Quality
Foundation, Inc. Convenor for Fair Trade Alliance.
Name FLORIDO P. CASUELA
Age 75
Nationality Filipino
Education Bachelor of Science in Business Administration, Major inAccounting from the University of the Philippines
Masters in Business Administration from the University of thePhilippines
Advanced Management Program for Overseas Bankers from thePhiladelphia National Bank in conjunction with WhartonSchool of the University of Pennsylvania

63
Government CivilService Eligibilities
Certified Public Accountant, Economist, Commercial Attaché
Current Position in theBank
Director
Date of FirstAppointment
May 30, 2006
Directorship in OtherListed Companies
None
Other Current Positions Chairman of PNB Securities, Inc. Director of PNB Savings Bank, PNB International Investments
Corporation, PNB RCI Holdings Co., Ltd., and Surigao MicroCredit Corporation
Senior Adviser of the Bank of Makati, Inc.Other Previous Positions Director of PNB Life Insurance, Inc.
President of Maybank Philippines, Inc., Land Bank of thePhilippines, and Surigao Micro Credit Corporation
Vice-Chairman of Land Bank of the Philippines and MaybankPhilippines, Inc.
Director, Meralco Trustee of Land Bank of the Philippines Countryside
Development Foundation, Inc. Director of Sagittarius Mines, Inc. Senior Adviser in the Bangko Sentral ng Pilipinas. Senior Executive Vice President of United Overseas Bank
(Westmont Bank) Executive Vice President of PDCP (Producers Bank) Senior Vice President of Philippine National Bank Special Assistant to the Chairman of the National Power
Corporation First Vice President of Bank of Commerce Vice President of Metropolitan Bank & Trust Co. Staff Officer, Bangko Sentral ng Pilipinas Audit Staff of Joaquin Cunanan, CPAs
Awards/Citations One of the ten (10) awardees of the 2001 Distinguished AlumniAward of the UP College of Business Administration
Most Outstanding Surigaonon in the field of Banking andFinance, awarded by the Rotary Club – Surigao Chapter

64
Name LEONILO G. CORONEL
Age 70
Nationality Filipino
Education Bachelor of Arts degree, Major in Economics from the Ateneode Manila University
Advance Management Program of the University of Hawaii
Current Position in theBank
Director
Date of FirstAppointment
May 28, 2013
Directorship in OtherListed Companies
Independent Director of Megawide Construction Corporation
Other Current Positions Independent Director of DBP-Daiwa Capital Markets Phil. Director of Software Ventures International
Other Previous Positions Chairman of PNB-IBJL Leasing and Finance Corporation andPNB-IBJL Equipment Rentals Corporation
Executive Director of the Bankers Association of thePhilippines and RBB Micro Finance Foundation
Director/Treasurer of Philippine Depository and TrustCorporation
Director of the Philippine Clearing House Corporation, thePhilippine Dealing System and the Capital MarketsDevelopment Council
Managing Director of BAP-Credit Bureau President of Cebu Bankers Association Consultant of Land Bank of the Philippines, Arthur Young, U.S.
Aid, Bankers Association of the Philippines and EconomicDevelopment Corporation
Worked with Citibank, Manila for twenty (20) years, occupyingvarious positions.
Awards/Citations Fellow of the Australian Institute of Company Directors in 2002

65
Name EDGAR A. CUA
Age 61
Nationality Filipino
Education * Bachelor of Arts in Economics degree (Honors Program) fromthe Ateneo de Manila University
* Masters of Arts in Economics degree from the University ofSouthern California
* Masters of Planning Urban and Regional Environment degreefrom the University of Southern California
* Advanced Chinese from the Beijing Language and CultureUniversity
* Sustainable Development Training Program, CambridgeUniversity
Current Position in theBank
* Independent Director
Date of FirstAppointment
* May 31, 2016
Other Current Positions * Independent Director of PNB Capital and InvestmentCorporation and Allied Commercial Bank
* Director of Davao Unicar Corporation
Previous Positions Held various managerial and staff positions at the AsianDevelopment Bank (ADB) during a 30-year professional career.Retired in 2015 as Senior Advisor, East Asia Department of theAsian Development Bank (ADB), based in ADB's ResidentMission in Beijing, People's Republic of China(PRC). Othermanagerial positions in ADB included Deputy Director General,East Asia Department, Country Director, ADB Resident Missionin Indonesia and Deputy Country Director, ADB ResidentMission in PRC.
Staff Consultant, SGV & Co.

66
Name REYNALDO A. MACLANG
Age 78
Nationality Filipino
Education Bachelor of Laws from the Ateneo de Manila University
Current Position in theBank
President of the Bank
Date of FirstAppointment
February 9, 2013 (as Director) May 27, 2014 (as President)
Directorship in OtherListed Companies
None
Other Current Positions Chairman of PNB (Europe) Plc. Director of Allied Leasing & Finance Corporation, PNB Global
Remittance and Financial Co., HK, Ltd., Bulawan MiningCorporation, PNB Management & Development Corporationand PNB Forex, Inc.
Director of the Bankers Association of the Philippines, AsianBankers Association, LGU Guarantee Corporation andBancnet, Inc., where he is also a Treasurer.
Other Previous Positions Director of PNB Savings Bank President of Allied Savings Bank from 1986 to 2001 President of Allied Banking Corporation (ABC) from 2001 to
2009 Director of ABC, PNB Life Insurance, Inc., PNB Italy SpA,
PNB International Investments Corporation, PNB HoldingsCorporation, PNB Securities, Inc., PNB Forex, Inc., and EtonProperties Philippines, Inc.
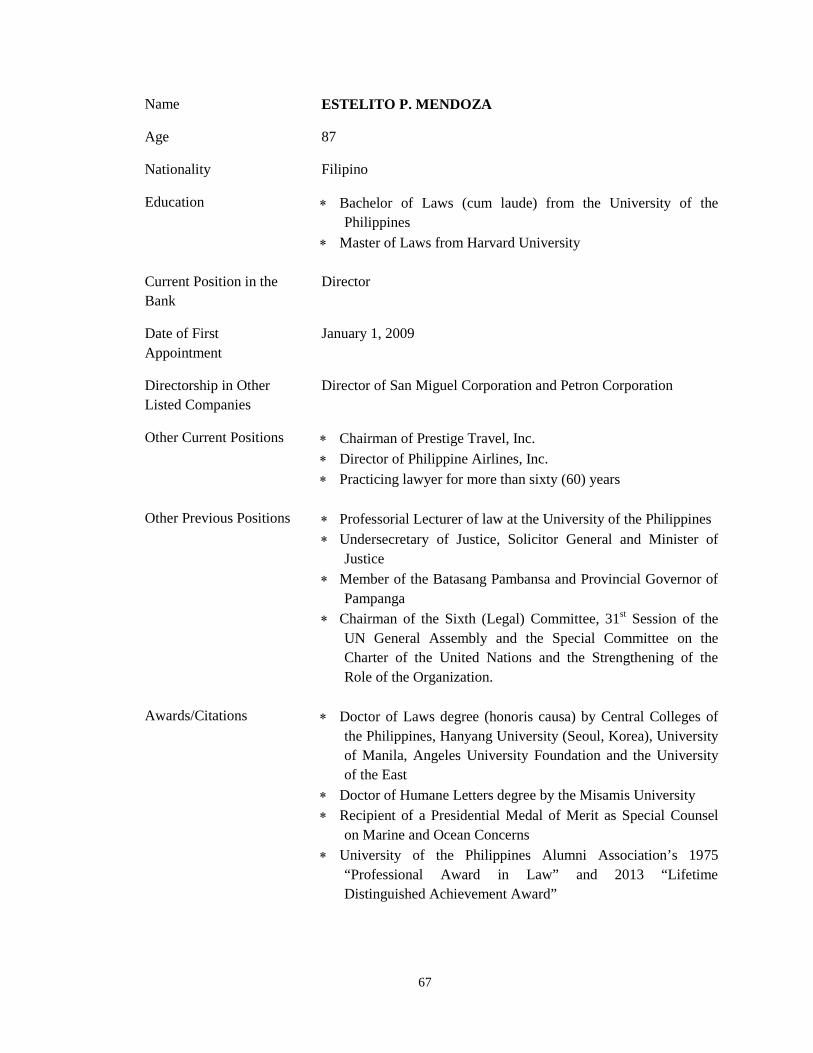
67
Name ESTELITO P. MENDOZA
Age 87
Nationality Filipino
Education Bachelor of Laws (cum laude) from the University of thePhilippines
Master of Laws from Harvard University
Current Position in theBank
Director
Date of FirstAppointment
January 1, 2009
Directorship in OtherListed Companies
Director of San Miguel Corporation and Petron Corporation
Other Current Positions Chairman of Prestige Travel, Inc. Director of Philippine Airlines, Inc. Practicing lawyer for more than sixty (60) years
Other Previous Positions Professorial Lecturer of law at the University of the Philippines Undersecretary of Justice, Solicitor General and Minister of
Justice Member of the Batasang Pambansa and Provincial Governor of
Pampanga Chairman of the Sixth (Legal) Committee, 31st Session of the
UN General Assembly and the Special Committee on theCharter of the United Nations and the Strengthening of theRole of the Organization.
Awards/Citations Doctor of Laws degree (honoris causa) by Central Colleges ofthe Philippines, Hanyang University (Seoul, Korea), Universityof Manila, Angeles University Foundation and the Universityof the East
Doctor of Humane Letters degree by the Misamis University Recipient of a Presidential Medal of Merit as Special Counsel
on Marine and Ocean Concerns University of the Philippines Alumni Association’s 1975
“Professional Award in Law” and 2013 “LifetimeDistinguished Achievement Award”

68
Name CHRISTOPHER J. NELSON
Age 57
Nationality British
Education Bachelor of Arts and Masters of Arts in History fromEmmanuel College, Cambridge University, U.K.
Diploma in Marketing from the Institute of Marketing,Cranfield, U.K.
Current Position in theBank
Director
Date of FirstAppointment
March 21, 2013 (Director)May 27, 2014 (Board Advisor)May 26, 2015 (Director)
Directorship in OtherListed Companies
None
Other CurrentPositions
Chairman of Lux Et Sal Corporation Director of the Philippine Band of Mercy, the Federation of
Philippine Industries, Bellagio 3 Condominium Association,Inc., and Greenlands Community
Member of the Board of Trustees of the American ChamberFoundation Philippines, Inc., and British Chamber ofCommerce of the Philippines, where he is also the ExecutiveChairman
Member of the Society of Fellows of the Institute of CorporateDirectors
Other PreviousPositions
Director of PNB Holdings Corporation Trustee of Tan Yan Kee Foundation Director of the American Chamber of Commerce of the
Philippines, Inc. President of Philip Morris Philippines Manufacturing, Inc., a
position he held for 10 years Various management positions with Philip Morris International
for 25 years including Area Director for Saudi Arabia, Kuwait,Gulf Cooperation Council, Yemen, and Horn of Africa

69
Name FEDERICO C. PASCUAL
Age 74
Nationality Filipino
Education Bachelor of Arts, Ateneo de Manila University Bachelor of Laws (Member, Law Honors Society), University
of the Philippines Master of Laws, Columbia University
Current Position in theBank
Independent Director
Date of FirstAppointment
May 27, 2014
Directorship in OtherListed Companies
None
Other Current Positions Independent Director of Allianz PNB Life Insurance, Inc.,PNB-IBJL Leasing and Finance Corporation, PNBInternational Investments Corporation and PNB HoldingsCorporation
President/Director of Tala Properties, Inc. and WoldinghamRealty, Inc.
Chairman of San Antonio Resources Incorporated Director of Global Energy Growth System and Apo Reef
World Resort Proprietor of Green Grower Farm Partner of the University of Nueva Caceres Bataan Branch
Other Previous Positions Chairman/Independent Director of PNB General Insurers Co.,Inc.
President and General Manager of Government ServiceInsurance System
President and CEO of Allied Banking Corporation and PNOCAlternative Fuels Corporation
Various positions with PNB for twenty (20) years in variouspositions, including Acting President, CEO and ViceChairman
President and Director of Philippine Chamber of Commerceand Industry
Chairman of National Reinsurance Corporation Co-Chairman of the Industry Development Council of the

70
Department of Trade and Industry Treasurer of BAP-Credit Guarantee Director of San Miguel Corporation, Philippine Stock
Exchange, Manila Hotel Corporation, Cultural Center of thePhilippines, CITEM, Bankers Association of the Philippines,Philippine National Construction Corporation, Allied CapResources HK, Oceanic Bank SF, USA, AIDSISA Sugar Mill,PDCP Bank, Equitable PCIB, Bankard, PhilippineInternational Trading Corporation, Philippine National OilCorporation and Certified Data Centre Professional
Name CECILIO K. PEDRO
Age 63
Nationality Filipino
Education Bachelor of Science in Business Management from the Ateneode Manila University
Honorary Doctorate of Philosophy in TechnologicalManagement from the Technological University of thePhilippines
Current Position in theBank
Independent Director
Date of FirstAppointment
February 28, 2014
Other Current Positions Independent Director of PNB Savings Bank Chief Executive Officer (CEO)/President of Lamoiyan
Corporation Chairman and CEO of Pneumatic Equipment Corporation and
Action Container, Inc. Director of CATS Motors, Manila Doctors Hospital and
Philippine Business for Social Progress Chairman of the Deaf Evangelistic Alliance Foundation, Inc. Vice President of the Federation of Filipino-Chinese Chambers
of Commerce and Industry, Inc. Chairman of Asian Theological Seminary
Other PreviousPositions
CEO/President of Aluminum Container, Inc. Director of DBS Philippines, Inc. (formerly Bank of Southeast
Asia, Inc.)

71
Awards/Citations Recipient of the Ten Outstanding Young Men in the field ofBusiness Entrepreneurship, Aurelio Periquet Award onBusiness Leadership, Ateneo Sports Hall of Fame, CEO ExcelAward, Ozanam Award for Service, Entrepreneur of the Yearfor Social Responsibility, Ten Outstanding Manileños, andPLDT SME Nation and Go Negosyo’s Grand MVP BossingAward
Recognized by the House of Representatives for his ExemplaryAccomplishment in the Promotion of the Welfare of the DeafCommunity on October 16, 2012
Name WASHINGTON Z. SYCIP
Age 95
Nationality Filipino-American
Education Bachelor of Science in Commerce from the University ofSto. Tomas
Masters in Commerce from the University of Sto. Tomasand Columbia University
Current Position in theBank
Director
Date of FirstAppointment
December 8, 1999
Directorship in OtherListed Companies
Chairman of Cityland Development Corporation Independent Director of Belle Corporation, First Philippine
Holdings Corporation Lopez Holdings Corporation, and Metro Pacific Investments
Corporation Director of LT Group, Inc. and MacroAsia Corporation
Other Current Positions Founder of SGV Group One of the founders and Chairman Emeritus of the Asian
Institute of Management Member of the Board of Overseers of the Graduate School
of Business at Columbia University Honorary Chairman of the Euro-Asia Centre of INSEAD in
Fontainebleau, France Honorary Life Trustee of The Asia Society Member of the Board of Directors of a number of other
major corporations in the Philippines and other parts of theworld
Other Previous Positions President of the International Federation of Accountants Member of the International Advisory Board of the Council

72
on Foreign Relations Vice Chairman of the Board of Trustees of The Conference
Board Chairman of the Asia Pacific Advisory Committee of the
New York Stock Exchange Served in the international boards of the American
International Group, AT&T, Australia & New ZealandBank, Caterpillar, Chase Manhattan Bank, Owens-Illinois,Pacific Dunlop and United Technologies Corporation,among others.
Board of Trustees of the Ramon Magsaysay AwardFoundation and Eisenhower Exchange Fellowship
Awards/Citations Most Outstanding Professional in the field of Accountancygiven by the Professional Regulation Commission on June2015
Arangkada Lifetime Achievement Award conferred by theJoint Foreign Chambers of the Philippines on March 3,2015
Lifetime Achievement Award given by Asia Society, NewYork on November 8, 2012
Ramon V. del Rosario Award for Nation Building conferredby Junior Chamber of International Philippines Manila andthe Asian Institute of Management’s Ramon V. delRosario, Sr. Center for Corporate Social Responsibility onMay 2012
Order of Lakandula, Rank of Grand Cross, conferred byPhilippine President Benigno S. Aquino, III on June 30,2011
Lifetime Achievement Award given by Columbia BusinessSchool
Ramon Magsaysay Award for International Understanding Management Man of the Year given by the Management
Association of the Philippines Botwonick Prize fir Ethical Practice in the Professions Doctor of Laws, Honorary Degree conferred by the
University of Melbourne Officer’s Cross of the Order of Merit given by the Federal
Republic of Germany Star of the Order of Merit Conferred by the Republic of
Australia Officer First Class of the Royal Order of the Polar Star
awarded by H.M. the King of Sweden

73
Name CARMEN K. TAN
Age 75
Nationality Filipino
Current Position in theBank
Director
Date of FirstAppointment
May 31, 2016
Directorship in OtherListed Companies
* Director of MacroAsia Corporation, LT Group, Inc., and PALHoldings, Inc.
Other CurrentPositions
* Director: Asia Brewery, Tanduay Distillers, Inc., The CharterHouse, Inc., Dominium Realty and Construction Corporation,Eton City, Inc., Foremost Farms, Inc., Philippine Airlines,Inc., PAL Express, Fortune Tobacco Corporation, HimmelIndustries, Inc., Lucky Travel Corporation, ManufacturingServices & Trade Corp., Progressive Farms, Inc., PMFTC,Inc., Shareholdings Inc., Sipalay Trading Corp., TrustmarkHoldings Corp., Zuma Holdings and Management Corp.,Tangent Holdings Corp., Cosmic Holdings Corp., GrandspanDevelopment Corp., Basic Holdings Corp., Saturn Holdings,Inc., Paramount Land Equities, Inc., Interbev Philippines,Inc., Waterich Resources Corp., REM Development Corp.,Fortune Tobacco International Corp. and Buona SorteHoldings, Inc.
Major Affiliations * Director of Tan Yan Kee Foundation* Member of Tzu Chi Foundation
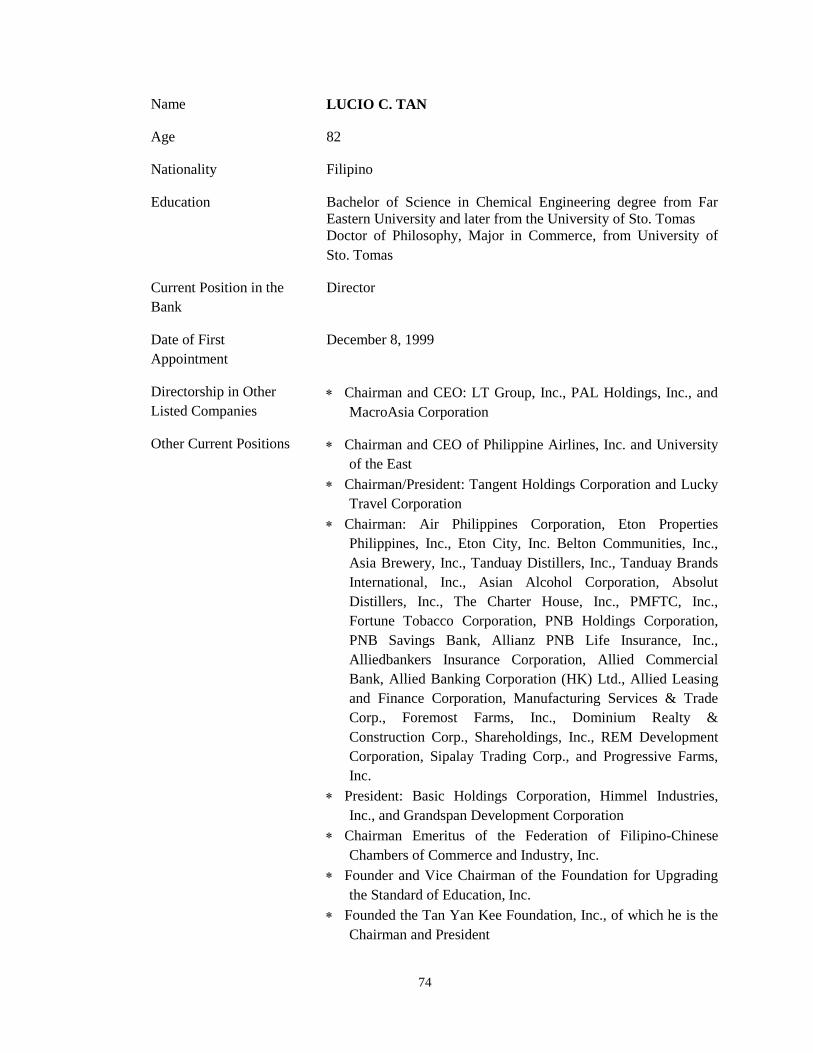
74
Name LUCIO C. TAN
Age 82
Nationality Filipino
Education Bachelor of Science in Chemical Engineering degree from FarEastern University and later from the University of Sto. TomasDoctor of Philosophy, Major in Commerce, from University ofSto. Tomas
Current Position in theBank
Director
Date of FirstAppointment
December 8, 1999
Directorship in OtherListed Companies
Chairman and CEO: LT Group, Inc., PAL Holdings, Inc., andMacroAsia Corporation
Other Current Positions Chairman and CEO of Philippine Airlines, Inc. and Universityof the East
Chairman/President: Tangent Holdings Corporation and LuckyTravel Corporation
Chairman: Air Philippines Corporation, Eton PropertiesPhilippines, Inc., Eton City, Inc. Belton Communities, Inc.,Asia Brewery, Inc., Tanduay Distillers, Inc., Tanduay BrandsInternational, Inc., Asian Alcohol Corporation, AbsolutDistillers, Inc., The Charter House, Inc., PMFTC, Inc.,Fortune Tobacco Corporation, PNB Holdings Corporation,PNB Savings Bank, Allianz PNB Life Insurance, Inc.,Alliedbankers Insurance Corporation, Allied CommercialBank, Allied Banking Corporation (HK) Ltd., Allied Leasingand Finance Corporation, Manufacturing Services & TradeCorp., Foremost Farms, Inc., Dominium Realty &Construction Corp., Shareholdings, Inc., REM DevelopmentCorporation, Sipalay Trading Corp., and Progressive Farms,Inc.
President: Basic Holdings Corporation, Himmel Industries,Inc., and Grandspan Development Corporation
Chairman Emeritus of the Federation of Filipino-ChineseChambers of Commerce and Industry, Inc.
Founder and Vice Chairman of the Foundation for Upgradingthe Standard of Education, Inc.
Founded the Tan Yan Kee Foundation, Inc., of which he is theChairman and President

75
Other Previous Positions Chairman: Allied Banking Corporation
Awards/Citations Various honorary degrees for his outstanding achievements andleadership in the Philippines and other parts of the world
Name LUCIO K. TAN, JR.
Age 50
Nationality Filipino
Education Bachelor of Science degree in Civil Engineering (Minors inclassical Chinese Mandarin and Mathematics), University ofCalifornia Davis, U.S.A.
Executive Masters in Business Administration, Hong KongUniversity of Science and Technology (Business School) andJ.L. Kellogg School of Management of NorthwesternUniversity, Hong Kong
Courses in Basic and Intermediate Japanese Language,Languages International, Makati and Asia Center for ForeignLanguages, Ortigas
Current Position in theBank
Director
Date of FirstAppointment
September 28, 2007
Directorship in OtherListed Companies
* Director of MacroAsia Corporation, LT Group, Inc., PALHoldings, Inc. and Victorias Milling Company
Other Current Positions President/Director of Tanduay Distillers, Inc. and EtonProperties Philippines, Inc.
Director of Bulawan Mining Corporation, PNB Capital andInvestment Corporation, PNB Forex, Inc., PNB Managementand Development Corporation, PNB Savings Bank, AlliedCommercial Bank, Allied Leasing and Finance Corporation,PNB Global Remittance and Financial Company (HK) Ltd.,and Allied Banking Corporation (HK) Limited
Director of PMFTC, Inc., Philippine Airlines, Inc., AirPhilippines Corporation, Allied Bankers Insurance Corporation,Foremost Farms, Inc., Manufacturing Services & Trade Corp.,Grandspan Development Corporation, Absolut Distillers, Inc.,Asia Brewery, Inc., Eton City, Inc., Asian Alcohol Corporation,

76
Lucky Travel Corporation, Progressive Farms, Inc., TanduayBrands International, Inc., The Charter House, Incorporated,Himmel Industries, Incorporated
EVP and Director of Fortune Tobacco Corporation
Other Previous Positions President and Chief Executive Officer of MacroAsiaCorporation
Director of Tanduay Distillers, Inc. Executive Vice President of Fortune Tobacco Corporation
Name MICHAEL G. TAN
Age 50
Nationality Filipino
Education Bachelor of Applied Science in Civil Engineering, Major inStructural Engineering, from the University of British Columbia,Canada
Current Position in theBank
Director
Date of FirstAppointment
February 9, 2013
Directorship in OtherListed Companies
Director and President of LT Group, Inc. Director of PAL Holdings, Inc. and Victorias Milling
CorporationOther Current Positions Chairman of PNB Management and Development Corporation
Director of PNB Forex, Inc., Bulawan Mining Corporation,PNB Savings Bank, Allied Commercial Bank, PNB GlobalRemittance and Financial Company (HK) Ltd. and AlliedBanking Corp. (Hong Kong) Limited
Chief Operating Officer of Asia Brewery, Inc. Director of the following companies: Philippine Airlines
Foundation, Inc., Air Philippines Corp., Philippine Airlines,Inc., Absolut Distillers, Inc., Eton Properties Phils., Inc.,Grandway Konstruct, Inc., Shareholdings, Inc., Lucky TravelCorporation, Eton City, Inc., Abacus Distribution SystemsPhilippines, Inc., PMFTC, Inc., Tangent Holdings Corporation,and Alliedbankers Insurance Corporation

77
Other Previous Positions Chairman of PNB Holdings Corporation Director of Allied Banking Corporation (ABC) from January
30, 2008 until the ABC’s merger with PNB on February 9,2013
Name JOSEPH T. CHUA
Age 60
Nationality Filipino
Education Bachelor of Arts in Economics and Bachelor of Science inBusiness Management from the De La Salle University
Masters in International Finance from the University ofSouthern California
Current Position in theBank
Board Advisor
Date of FirstAppointment
May 26, 2015
Current Positions Chairman of Watergy Business Solutions, Inc. Chairman of Cavite Business Resources, Inc. Chairman of J.F. Rubber Philippines President of Goodwind Development Corporation President of MacroAsia Mining Corporation President of MacroAsia Corporation Director of PNB General Insurers Co., Inc. Director of Bulawan Mining Corporation Director of PNB Management and Development Corp. Director of Philippine Airlines Director of Eton Properties Philippines, Inc. Member of the Management Association of the Philippines,
Philippine Chamber of Commerce and Industry, Chamberof Mines of the Philippines, German Philippine Chamberof Commerce and Rubber Association of the Philippines
Other PreviousPositions
Chairman of MacroAsia Mining Corporation Director of Philippine National Bank Director/Chief Operating Officer of MacroAsia
Corporation Managing Director of Goodwind Development Corporation

78
Name MANUEL T. GONZALES
Age 79
Nationality Filipino
Education Bachelor of Science in Commerce from the De La SalleUniversity
Masters of Arts in Economics from Ateneo De ManilaUniversity
Current Position in theBank
Board Advisor
Date of FirstAppointment
October 1, 2013
Current Positions Director of PNB Securities, Inc. Director of PNB-IBJL Leasing and Finance Corporation Director of PNB-IBJL Equipment Rentals Corporation Director of Allied Leasing and Finance Corporation Director of Alliedbankers Insurance Corporation
Other Previous Positions Director of Allied Banking Corporation Member, Management Association of the Philippines
(MAP) Member, Financial Executives of the Philippines (FINEX) Member, European Chamber of Commerce of the
Philippines (ECCP) Member, Bankers Institute of the Philippines
Name WILLIAM T. LIM
Age 76
Nationality Filipino
Education Bachelor of Science in Chemistry from AdamsonUniversity
Current Position in theBank
Board Advisor
Date of FirstAppointment
January 25, 2013
Current Positions Director of PNB Holdings Corporation

79
Previous Positions Director of PNB Life Insurance, Inc. Consultant of Allied Banking Corporation Director of Corporate Apparel, Inc. Director of Concept Clothing Director of Freeman Management and Development
Corporation President of Jas Lordan, Inc. Worked with Equitable Banking Corporation for 30 years,
occupying various positions, including as VP & Head ofthe Foreign Department
Name HARRY C. TAN
Age 70
Nationality Filipino
Education Bachelor of Science in Chemical Engineering, Mapua Instituteof Technology
Current Position in theBank
Board Advisor
Date of FirstAppointment
May 31, 2016
Directorship in OtherListed Companies
Director of LT Group, Inc.
Other Current Positions Chairman of Bulawan Mining Corporation, PNBManagement Development Corporation, and PNB GlobalRemittance and Financial Company (HK) Limited
Director of PNB Savings Bank Chairman for the Tobacco Board of Fortune Tobacco
International Corporation President of Landcom Realty Corporation and Century
Park Hotel Vice Chairman of Lucky Travel Corporation, Eton
Properties Philippines, Inc., Belton Communities, Inc., andEton City, Inc.
Managing Director/Vice Chairman of The Charter HouseInc.
Director of various private firms which include AsiaBrewery, Inc., Dominium Realty and ConstructionCorporation, Progressive Farms, Inc., Shareholdings Inc.,

80
Himmel Industries, Inc., Basic Holdings Corporation,Asian Alcohol Corporation, Pan Asia Securities Inc.,Tanduay Distillers, Inc., Manufacturing Services andTrade Corporation, Foremost Farms, Inc., GrandspanDevelopment Corporation, Absolut Distillers, Inc.,MacroAsia Corporation, Tanduay Brands InternationalInc., Allied Bankers Insurance Corp., Allied BankingCorporation (Hong Kong) Limited, PMFTC, Inc., andAllied Commercial Bank
Other PreviousPositions
Director of Philippine National Bank Director of Allied Banking Corporation Director of Philippine Airlines Director of MacroAsia Corporation
Executive Officers:
CENON C. AUDENCIAL, JR., 58, Filipino, Executive Vice President, is the Head of theInstitutional Banking Sector. Before joining the Bank in 2009, he headed the Institutional andCorporate Bank of ANZ, prior to which he was a Senior Relationship Manager of CorporateBanking and Unit Head of Global Relationship Banking for Citibank N.A. He previouslyserved as a Vice President and Unit Head of Standard Chartered Bank’s RelationshipManagement Group, and was a Relationship Manager in Citytrust Banking Corporation. Beforehis 20-year stint as a Relationship Manager, he was a Credit Analyst for Saudi French Bank andAEA Development Corporation. Mr. Audencial obtained his Bachelor of Arts degree inEconomics from the Ateneo de Manila University.
HORACIO E. CEBRERO III, 54, Filipino, Executive Vice President, is the Head of theTreasury Group. He obtained his Bachelor of Science degree in Commerce, Major inMarketing, from the De La Salle University. Prior to joining PNB, he was an Executive VicePresident and the Treasurer of EastWest Banking Corporation. He also held the post of SeniorVice President and Deputy Treasurer of Rizal Commercial Banking Corporation, VicePresident/Head of the Foreign Exchange Desk of Citibank Manila and Vice President/ChiefDealer of the Treasury Group of Asian Bank Corporation. He brings with him 34 years ofexperience in the banking industry starting from Loans and Credit, Branch Banking, FixedIncome Sales, Trust Banking, Foreign Exchange and Fixed Income Trading, PortfolioManagement and other Treasury-related activities.

81
NELSON C. REYES, 52, Filipino, Executive Vice President, joined the Bank on January 1,2015 as the Chief Financial Officer. Prior to joining the Bank, he was the Chief FinancialOfficer of the Hongkong and Shanghai Banking Corporation (HSBC), Ltd., Philippine Branch,a position he held since 2004. He was also a Director for HSBC Savings Bank Philippines, Inc.and HSBC Insurance Brokers Philippines, Inc. His banking career with HSBC spanned 28years and covered the areas of Credit Operations, Corporate Banking, Treasury Operations andFinance. He gained international banking exposure working in HSBC offices in Australia,Thailand and Hong Kong. Mr. Reyes graduated from De La Salle University with a Bachelorof Science degree in Commerce, Major in Accounting, and is a Certified Public Accountant.
BERNARDO H. TOCMO, 55, Filipino, Executive Vice-President, is the Head of RetailBanking Sector who manages the Branch Banking Group, Global Filipino Banking Group,Cards Banking Solutions Group and Pinnacle Priority Banking Division of the Bank. Mr.Tocmo obtained his Masters in Business Economics from the University of Asia and the Pacificand likewise finished the Strategic Business Economics Program of said university. Hegraduated with a Bachelor of Science in AgriBusiness, major in Management from the VisayasState University. He joined Philippine National Bank in October 2015. Mr. Tocmo is aseasoned banker with over three decades of work experience with the country’s top and mid-tier commercial banks. He started his career with United Coconut Planters Bank in 1982. Hefurther honed his skills at Union Bank of the Philippines where he assumed key managerialpositions in 1990 to 1996. He left Union Bank as a Senior Manager and joined Security BankCorporation in 1996 as Assistant Vice President until his promotion to First Vice President in2005 as Area Business Manager. Subsequently, he joined Metropolitan Bank & Trust Companyin September 2005 as Vice President and was appointed Head of National Branch BankingSector with the rank of Executive Vice President. He was also a Director of Metrobank CardCorporation from 2012 to 2015.
YOLANDA M. ALBANO, 66, Filipino, First Senior Vice President, is the Head of the Bank'sCommercial Banking Group. She was previously the First Senior Vice President and Head ofABC Institutional Banking Group, comprised of the Account Management Division and theMerchant Banking Division. She joined ABC in 1977, starting off as an Account Officer at theBusiness Development Division and moving on as the Head of the Credit and ResearchDepartment, concurrent Head of the Corporate Affairs Department, Head of the AccountManagement Division, and ultimately, Head of the Institutional Banking Group. At present, sheis a member of the Financial Executives Institute of the Philippines (FINEX). She is a pastPresident of the Bank Marketing Association of the Philippines (BMAP) and the CreditManagement Association of the Philippines (CMAP). She is also a past President of theCollege of the Holy Spirit Alumnae Foundation. Ms. Albano completed her Bachelor of Artsdegree in Economics in three (3) years with a Dean's Award for Academic Excellence from theUniversity of the Philippines.

82
ALICE Z. CORDERO, 59, Filipino, First Senior Vice President, was appointed the ChiefCompliance Officer of the Bank on June 16, 2010 with oversight on the Bank, including allsubsidiaries, affiliates and foreign branches. She is concurrently the Corporate GovernanceExecutive of the Bank. She obtained Bachelor of Science degree in Business Economics fromthe University of the Philippines. She has earned units in Masters in Business Administrationat the Ateneo Graduate School of Business. Prior to joining the Bank, she was the ChiefCompliance Officer of ABC (2007-2010). She worked with Citibank N.A - Manila Branch(1988-2007) for nineteen (19) years and held various senior positions in the Consumer BankingGroup, including Compliance and Control Director (1999-2005) and concurrent RegionalCompliance and Control Director for Philippines and Guam (2004). Her 37 years of bankingexperience include working for ABC (1979-1983; 2007-2010), First National Bank of Chicago- Manila Branch (1983-1986), Far East Bank and Trust Company (1986-1988) and CitibankN.A. - Manila Branch (1988-2007), where she held department head positions in Credit Policy,Credit & Research Management, Financial Control, Corporate Regulatory Reporting, AssetStrategy, Business Development, Risk Management and Compliance.
SOCORRO D. CORPUS, 65, Filipino, First Senior Vice President, is the Head of the HumanResource Group. She is a graduate of Assumption College with a Bachelor of Arts degree,Major in Psychology, and an Associate in Commercial Science degree. She has been an HRpractitioner for over 35 years. She started her career with China Banking Corporation in 1973as an HR specialist prior to joining the ABC in 1977 as an Assistant Manager. Herprofessional affiliations include the following: founding member and a board member of theOrganization Development Professional Network (ODPN), past President and member of theBankers’ Council for People Management, member of the Personnel Management Associationof the Philippines, and the regular bank representative to the Banking Industry TripartiteCouncil.
MIGUEL ANGEL G. GONZALEZ, 58, Filipino, First Senior Vice President, is the ChiefCredit Officer and Head of the Credit Management Group. He entered the Bank in March 2010as Senior Vice President for Commercial Banking Group. He obtained his Bachelor of Sciencedegree in Industrial Engineering from the University of the Philippines and Masters inBusiness Management degree from Asian Institute of Management. He started his bankingcareer with Citibank NA in 1984. He later headed the Branch Banking Group of Land Bank ofthe Philippines in 1989 then joined Union Bank of the Philippines in 1994 where he was SeniorVice President and head of Credit and Market Risk Group. In 2007, he became the CountryManager for Genpact Services LLC.

83
JOHN HOWARD D. MEDINA, 47, Filipino, First Senior Vice President, is the Head of theOperations and Technology Support Sector which is composed of the Operations Group,Information Technology Group and Credit Management Group. The Sector is responsible fordelivering end-to-end technology, credit and operating services across the Bank. Mr. Medinahas a Bachelor of Science degree in Industrial Engineering from the University of thePhilippines and Masters in Business Administration from the Shidler College of Business at theUniversity of Hawai’i at Manoa. He was an East-West Center Degree Fellow and the recipientof a full scholarship while at the University of Hawai’i. He also attended the HandelshøjskolenI Århus (the Aarhus School of Business), Pacific Asian Management Institute and theEuropean Summer School for Advanced Management for additional graduate studies. Prior tojoining PNB in 2004, he was a pioneer in the process and technology banking practice in thenineties when he helped transform the Asian operations of one of the largest multinationalbanks. He subsequently established a private consulting practice in the United States, helpingset up operations and technology initiatives of large financial institutions.
BENJAMIN S. OLIVA, 64, Filipino, First Senior Vice President, is the Head of the GlobalFilipino Banking Group (GFBG) which manages PNB’s overseas network of branches andremittance subsidiaries in Asia, Europe, the Middle East, and North America, and a Director ofPNB (Europe) Plc. Mr. Oliva obtained his Bachelor of Science degree in Commerce, Major inAccounting (Cum Laude), from the De La Salle University. He started his career with FNCBFinance, Inc. where he held various junior managerial positions from 1973-1978. He moved toJardine Manila Finance in 1978 as Vice President of the Metro Manila Auto Finance. In 1980,Mr. Oliva started his career as a banker at the State Investment Bank where he was Head ofCorporate Sales Lending Division. In 1981, he moved to PCI Bank when he handled CorporateBanking. He joined Citibank, NA in 1988, where he exhibited his expertise in sales andheaded different sales divisions (Loans, Cards and Citiphone Banking). He became a Directorfor various divisions such as Country Asset Sales, Credit Cards Business, BusinessDevelopment and Personal Loans from November 1999 to January 2006. In January 2006, hewas hired by Citibank Savings, Inc. as the Director for Personal Loans and moved back toCitibank, NA as Business Development Director in February 2007. He was rehired by CitibankSavings, Inc. as its President in December 2007. From June 2009 to July 2011, he heldconcurrent positions as Commercial Banking Director of Citibank NA and board member ofCitibank Savings, Inc. In September 2011, he has been a designate Consultant for ConsumerBanking of United Coconut Planters Bank. Mr. Oliva joined PNB on September 10, 2012.
AIDA M. PADILLA, 67, Filipino, is First Senior Vice President and the Head of theRemedial Management Division. She is the chief strategist for problem and distressedaccounts. A seasoned professional, she rose from the branch banking ranks at the PhilippineBanking Corporation to become Vice President for Marketing of its Corporate Banking Group.She obtained her Bachelor of Science degree in Commerce, Major in Accounting, from St.Theresa’s College.

84
CARMELA LETICIA A. PAMA, 60, Filipino, First Senior Vice President, is the Bank’sChief Risk Officer (CRO). She reports to the Bank’s board-level Risk Oversight Committee toassist in the effective oversight of the various risks faced by the Bank. A Certified PublicAccountant, she obtained her Bachelor of Science in Business Administration andAccountancy from the University of the Philippines and Master in Business Administrationfrom the Stern School of Business, New York University. She started her banking career withCitibank N.A. (Phils.) where she held various positions in the areas of Treasury Trading andMarketing, and Operations and Quality Development. She moved back to Citibank, N.A.(Phils.) in 1996 to head various support units, after a brief stint with Banco Santander, Phils. toopen its Philippine operations. Prior to joining PNB, she was a Consulting Services PracticeManager at Oracle Corporation (Phils.) from 1999 to 2005 with project implementationexperience at the Asian Development Bank. Her stint as CRO of the Bank, since October 2006,has developed her proficiency in all facets of banking operations and has rounded off her skillsin enterprise risk management. Task to lead and/or co-lead various new enterprise supportactivities, she works to institutionalize the Bank’s implementation of the following (amongothers) – merger with Allied Bank, compliance to the Bank’s submission of variousinstitutional Basel II & III reports, as well as compliance to new regulatory circulars asmandated. With more than 30 years of corporate experience, she provides a well-roundedexpertise in the operations, technology and risk management areas of the Bank.
EMMANUEL GERMAN V. PLAN II, 64, Filipino, First Senior Vice President, is the Headof the Enterprise Sector and concurrently Head Special Assets Management Group. He holds aBachelor of Science degree in Commerce, Major in Accounting, from the University of SantoTomas and took up masteral studies at the Letran College. Prior to joining the Bank, he wasSenior Vice President of the Special Assets Group of ABC. He concurrently held the positionof Senior Vice President of State Investment Trust and State Properties Corporation. He alsoacted as Managing Director of Bear Stearns State Asia and Northeast Land DevelopmentCorporation. He has exposure in investment banking, account management, and credit andcollection. He has been involved in acquired assets management and in real estate developmentsince 1997. Mr. Plan is also into social, religious and charitable undertakings through his activeinvolvement in different educational and religious foundations like Sambayan EducationalFoundation, Inc., LSQC Scholarship Foundation, UST-EHSGAA and Magis Deo, to name afew.
MANUEL C. BAHENA, JR., 55, Filipino, Senior Vice President, is the Chief Legal Counselof the Bank. He joined PNB in 2003 and was appointed as Head of Documentation andResearch Division of the Legal Group in 2009. Before joining PNB, he was the CorporateSecretary and Vice President of the Legal Department of Multinational InvestmentBancorporation. He also formerly served as Corporate Secretary and Legal Counsel of variouscorporations, among which are the Corporate Partnership for Management in Business, Inc.;Orioxy Investment Corporation; Philippine Islands Corporation for Tourism and Development;Cencorp (Trade, Travel and Tours), Inc.; and Central Bancorporation General Merchants, Inc.He obtained his Bachelor of Science degree in Business Administration from Lyceum of thePhilippines in 1981 and his Bachelor of Laws degree from Arellano University in 1987.

85
EMELINE C. CENTENO, 58, Filipino, Senior Vice President, is the Head of the CorporatePlanning and Research Division. She obtained her Bachelor of Science degree in Statistics(Dean’s Lister) and completed the coursework in Masters of Arts in Economics (on scholarship)from the University of the Philippines. She joined PNB in 1983, rose from the ranks and heldvarious positions at the Department of Economics and Research, Product Development,Monitoring and Implementation Division and the Corporate Planning Division before assumingher present position as Head of the merged Corporate Planning and Research Division. Ms.Centeno was awarded as one of the Ten Outstanding Employees of the Bank in 1987.
DIOSCORO TEODORICO L. LIM, 62, Filipino, Senior Vice President, is the Chief AuditExecutive (CAE) of the Bank. A Certified Public Accountant, he holds a Bachelor of Sciencedegree in Commerce, Major in Accounting, from the University of San Carlos-Cebu. He startedhis career in 1976 with SGV as a Staff Auditor and, after a year, was Field in Charge until 1978.He joined ABC in 1979 as a Junior Auditor. He rose from the ranks to become an Audit Officerin 1986, and was designated as Head of the Internal Audit Division in 2000, until hisappointment as CAE of PNB on February 9, 2013. He also served as Compliance Officer ofAllied Savings Bank (seconded officer) from August 2001 to August 2006. He served as amember of the Board of Directors of Rosehills Memorial Management (Philippines), Inc. in2011 and 2013. He is a member of the Institute of Internal Auditors Philippines, Association ofCertified Fraud Examiners-Philippines and Philippine Institute of Certified Public Accountants.
MARIA PAZ D. LIM, 55, Filipino, Senior Vice President, is the Corporate Treasurer. She isalso concurrently the Treasurer of PNB Capital and Investment Corporation. She obtained herBachelor of Science degree in Business Administration, Major in Finance and Marketing, fromthe University of the Philippines, and Masters in Business Administration from the Ateneo deManila University. She joined PNB on June 23, 1981, rose from the ranks and occupied variousofficer positions at the Department of Economics & Research, Budget Office and CorporateDisbursing Office prior to her present position.
NORMAN MARTIN C. REYES, 51, Filipino, Senior Vice President, is the Bank’s ChiefMarketing Officer and Head of the Marketing Group. He obtained his Bachelor of Arts degree,Major in Economics at the University of the Philippines and Masters in Business Managementat the Asian Institute of Management. He has over 20 years of management experience in thefield of product development, sales and marketing and process management, and has directlymanaged an extensive list of corporate and consumer services. He started his banking career in1993, holding various positions at Citibank, Union Bank and Royal Bank of Scotland. Prior tojoining PNB, he was Senior Vice President at United Coconut Planters Bank.
ROBERTO S. VERGARA, 65, Filipino, First Vice President, is the Chief Trust Officer andHead of the Trust Banking Group. He obtained his Bachelor of Arts degree, Major inEconomics from Ateneo de Manila University. He began his career in 1973 and held variouspositions in Trust Banking, Treasury, Investment Banking and Global Banking/OverseasRemittances in various banks, including Solidbank and HSBC, among others. Prior to joiningPNB, he was the Chief Trust Officer, then Treasury Group Head and lastly GlobalBanking/Overseas Remittance Group Head of the Land Bank of the Philippines. He is also aholder of Government Civil Service Career Executive Service Officer and Career Service

86
Executive eligibility, and is a qualified Independent Director/Fellow under the Institute ofCorporate Directors (ICD).
CONSTANTINO T. YAP, 53, Filipino, Vice President, is the Head of the InformationTechnology Group. He was hired by ABC on October 1, 2007 as Assistant Vice President forthe Special Projects Section of the IT Division. Prior to joining ABC, he was the Dean of theCollege of Engineering and College of Computer Studies and Systems at the University of theEast (Manila campus) from May 2005 to May 2007, and was the Assistant Dean of the Collegeof Computer Studies at Lyceum of the Philippines from May 2004 to May 2005. He worked asan IT Consultant for various call centers and business-to-business firms from August 2002 toMay 2004. He was the Technical Consultant for the horse racing totalizator project of ManilaJockey Club and a Vice President for Betting Operations of the Philippine Racing Club from1996 to 2000. From 1994 to 1996, he helped manage his family's construction business. Whileliving in the US from 1988 to 1994, he was a computer telephony programmer and systemsanalyst that provided promotions and marketing services running on interactive voice responsesystems (IVRS) for Phoneworks, Inc., American Network Exchange Inc., and InteractiveTelephone Inc. He obtained his Bachelor of Engineering degree in Electrical from PrattInstitute in Brooklyn, New York, USA, in 1984 and earned his Master of Science in ElectricalEngineering at Purdue University in West Lafayette, Indiana, USA, in 1986.
C. Independent Directors
In carrying out their responsibilities, the directors must act prudently and exercise independentjudgment while encouraging transparency and accountability. The Bank has five (5)independent directors representing 33% of the members of the Board, beyond the 20%requirement of the SEC. The appointment of the 5 independent directors composed of theBoard Chairman Florencia G. Tarriela, and Messrs. Felix Enrico R. Alfiler, Edgar A. Cua,Federico C. Pascual and Cecilio K. Pedro, were approved and confirmed by the appropriateregulatory bodies.
The independent directors act as Chairman of the Board, CorporateGovernance/Nomination/Remuneration Committee, Board Oversight Committee – Domesticand Foreign Subsidiaries/Affiliates, Board Audit and Compliance Committee and BoardOversight Related Party Transaction (RPT) Committee. The independent directors are alsomembers of four other board committees such as the Board ICAAP Steering Committee, TrustCommittee, Board IT Governance Committee and the Risk Oversight Committee. The latterboard committee Chairman is a non-executive director and former president of a governmentbank with universal banking license.
D. Identify Significant Employees
There is no person who is not an executive officer who is expected to make a significantcontribution to the business.

87
E. Family Relationship
Directors Lucio C. Tan and Carmen K. Tan are spouses. Directors Lucio K. Tan, Jr. andMichael G. Tan are sons of Director Lucio C. Tan. Board Advisor Harry C. Tan is the brotherof Director Lucio C. Tan, while Board Advisor Joseph T. Chua is the son-in-law of DirectorLucio C. Tan.
F. Involvement in Certain Proceedings
Neither the directors nor any of the executive officers have, for a period covering the past five(5) years, reported:
i. any petition for bankruptcy filed by or against a business with which they are relatedas a general partner or executive officer;
ii. any criminal conviction by final judgment or being subject to a pending criminalproceeding, domestic or foreign;
iii. being subject to any order, judgment, or decree, of a competent court, domestic orforeign, permanently or temporarily enjoining, barring, suspending or limiting theirinvolvement in any type of business, securities, commodities or banking activities; or
iv. being found by a domestic or foreign court of competent jurisdiction (in a civilaction), the Commission or comparable foreign body, or a domestic or foreignExchange or other organized trading market or self regulatory organization, to haveviolated a securities or commodities law or regulation, and the judgment has not beenreversed, suspended, or vacated.
G. Brief Description of Any Material Pending Legal Proceedings to which the Registrantor any of its Subsidiaries is a Party
The Bank and some of its subsidiaries are parties to various legal proceedings which arose inthe ordinary course of their operations. None of such legal proceedings, either individually orin the aggregate, are expected to have a material adverse effect on the Bank and itssubsidiaries or their financial condition.
Item No. 10 – Executive Compensation
A. Executive Compensation
The annual compensation of executive officers consists of a 16-month guaranteed cashemolument. There are no other arrangements concerning compensation for services renderedby Directors or executive officers to the Bank and its subsidiaries.
B. Compensation of Directors
The Directors receive a reasonable per diem for each attendance at a Board meeting or anymeeting of the Board Committees. Total per diem given to the Board of Directors of the Bankamounted to P43.2 million in 2016 from P41.95 million in 2015.

88
C. Summary of Compensation TableAnnual Compensation (In Pesos)
Name andPrincipal Position
Year Salary Bonus Others Total
Reynaldo A. MaclangPresident
Four most highly compensated executiveofficers other than the CEO
1. Audencial, Cenon Jr. C.Executive Vice President
2. Cebrero, Horacio III E,Executive Vice President
3. Reyes, Nelson C.Executive Vice President
4. Tocmo, Bernardo H.Executive Vice President
CEO and Four (4) Most HighlyCompensated Executive Officers
Actual 2015 58,902,884 19,601,169 - 78,504,053Actual 2016 64,766,296 21,873,148 - 86,639,444
Projected 2017 72,540,000 24,500,000 - 97,040,000All other officers and directors (as agroup unnamed)
Actual 2015 3,280,311,093 952,903,245 - 4,233,214,338Actual 2016 3,498,087,977 998,343,329 - 4,496,431,306
Projected 2017 3,917,860,000 1,118,150,000 - 5,036,010,000
D. Employment Contracts and Termination of Employment and Change-in-ControlArrangements
The annual compensation of executive officers are covered by the Bank’s standardemployment contract which guarantees annual compensation on a 16-month schedule ofpayment. In accordance with the Bank’s Amended By-Laws, Article VI, Sec. 6.1, all officerswith the rank of Vice President and up hold office and serve at the pleasure of the Board ofDirectors.
E. Warrants and Options Outstanding: Repricing
No warrants or options on the Bank’s shares of stock have been issued or given to theDirectors or executive officers as a form of compensation for services rendered.
Item No. 10A – Remuneration Policy
PNB’s remuneration policy manifests the Bank’s belief that the quality of its human resourceis a key competitive edge in the industry. As such, the Bank maintains remuneration andbenefits program that attracts, motivates, and retains talents and develops their potentials. TheBank’s remuneration and benefits program aims to 1) ensure compliance with requirementsof labor and other regulatory laws; 2) establish competitiveness with peer groups in theindustry; and c) strengthen alignment with and accomplishment of the Bank’s businessstrategies.

89
The following are the features of the Bank’s remuneration policy for Directors and Officers:
I. Emolument and Fringe Benefits of the Board of Directors- Cash Emolument in the form of Per Diem for every Board and Board Committeemeeting- Non-Cash Benefit in the form of Healthcare Plan, Group Life Insurance, and Group
Accident Insurance
II. Officers’ Compensation and Benefits
1. Monetary Emoluments- Monthly compensation in the form of monthly basic pay which is reviewed annually and
subject to the adjustment thru merit increase effective July 1 based on Officer’sperformance and achievements- Bonuses equivalent to four (4) months Basic Salary per year- Allowances to cover business-related expenses, official travel, social and recreational
activities (i.e., summer outing/Christmas party) and relocation expenses- Service Incentive in the form of cash award upon reaching milestones in length of
service (i.e., 10th, 15th, 20th, 25th, 30th, 35th and 40th year of service)
2. Non-Cash Benefits- Healthcare Plan in the form of hospitalization, consultation and other medical benefits
for the Officer and two (2) of his/her primary dependents- Group Life Insurance coverage in amounts based on the Officer’s rank- Group Accident Insurance coverage in amounts based on the officer’s rank- Leave Privileges in the form of leave with pay benefits for the following purposes: a)
vacation; b) sick; c) maternity; d) paternity; e) birthday; f) bereavement; g) solo parent;h) emergency; i) special leave for female employees; j) special leave privilege forvictims under the “Anti-Violence Against Women and their Children Act”.- Car Plan in the form of car cost-sharing scheme based on the officer’s rank
3. Fringe Benefits- Loan Facilities available for the following purposes: a) housing; b) car financing; c)
general purpose d) motorcycle loan and e) computer loan
4. Retirement Benefits- Retirement benefits equivalent to applicable monthly pay per year of service for those
who attained the required age or minimum length of service under the Plan.

90
Item 11 – Security Ownership
Security Ownership of Certain Record and Beneficial Owners (more than 5%of any class of voting securities as of December 31, 2016)
Name & Address ofRecord Owner andRelationship with
Issuer
Name ofBeneficial
Owner andRelationshipwith Record
Owner
Citizenship No. ofCommon Shares
Held
Percentage ofOwnership
All Seasons RealtyCorporation
- Makati City -8,191,895 shares
Shareholder
Owned andControlled by
LT Group, Inc.
Filipino 747,326,928 59.8273308551%
Allmark HoldingsCorporation
- Quezon City –16,967,394 shares
Shareholder
Filipino
Caravan HoldingsCorporation
- Marikina City -67,148,224 shares
Shareholder
Filipino
DonfarManagement Ltd.- Makati City –
25,173,588 shares
Shareholder
Filipino
DunmoreDevelopment Corp.
(X-496)- Makati City -
12,395,850 shares
Shareholder
Filipino

91
DynaworldHoldings, Inc.- Pasig City -
9,323,108 shares
Shareholder
Filipino
Fast ReturnEnterprises, Ltd.- Makati City -
14,865,453 shares
Shareholder
Filipino
Fil-CareHoldings, Inc.
- Quezon City -20,836,937 shares
Shareholder
Filipino
Fragile TouchInvestment Ltd.- Makati City -
18,581,537 shares
Shareholder
Filipino
Ivory Holdings, Inc.- Makati City -
16,997,821 shares
Shareholder
Filipino
Kenrock HoldingsCorporation
- Quezon City –21,301,405 shares
Shareholder
Filipino
KentwoodDevelopment Corp.
- Pasig City -14,112,105 shares
Shareholder
Filipino

92
Key LandmarkInvestments, Ltd.- British Virgin
Islands -109,115,864 shares
Shareholder
Filipino
La VidaDevelopment Corp.
- Quezon City -16,052,705 shares
Shareholder
Filipino
LeadwayHoldings, Inc.
- Quezon City –53,470,262 shares
Shareholder
Filipino
MavelstoneInternational Ltd.
- Makati City -24,213,463 shares
Shareholder
Filipino
Merit Holdings andEquities Corporation
- Quezon City –14,233,686 shares
Shareholder
Filipino
Multiple StarHoldings
Corporation- Quezon City –
25,214,730 shares
Shareholder
Filipino
Pioneer HoldingsEquities, Inc.- Pasig City -
28,044,239 shares
Shareholder
Filipino

93
Profound Holdings,Inc.
- Mandaluyong City -14,935,099 shares
Shareholder
Filipino
Purple CrystalHoldings, Inc.
- Mandaluyong City -19,980,373 shares
Shareholder
Filipino
Safeway Holdings &Equities, Inc.
- Quezon City -9,864,499 shares
Shareholder
Filipino
Society HoldingsCorporation
- Quezon City -14,162,708 shares
Shareholder
Filipino
Solar HoldingsCorporation- Pasig City -
67,148,224 shares
Shareholder
Filipino
Total HoldingsCorporation- Pasig City -
13,095,263 shares
Shareholder
Filipino
True SuccessProfits, Ltd.
- British VirginIslands -
67,148,224 shares
Shareholder
Filipino

94
UttermostSuccess, Ltd.
- Makati City -24,752,272 shares
Shareholder
Filipino
Security Ownership of Management (Individual Directors and Executive Officers asof 31 December 2016)
Name of BeneficialOwner
Amount ofCommon Shares
and Nature ofBeneficial
Ownership
CitizenshipPercentage of
Ownership
Florencia G. TarrielaChairmanIndependent Director
2 sharesP80.00
(R)
Filipino 0.0000001601
Felix Enrico R. AlfilerIndependent Director
10,215 sharesP408,600.00
(R)
Filipino 0.0008177628
Florido P. CasuelaDirector
133 sharesP5,320.00
(R)
Filipino 0.0000106473
Leonilo G. CoronelDirector
1 shareP40.00
(R)
Filipino 0.0000000801
Edgar A. CuaIndependent Director
100 sharesP4,000.00
(R)
Filipino 0.0000080055
Reynaldo A. MaclangDirector
155 sharesP6,200.00
(R)
Filipino 0.0000124085
Estelito P. MendozaDirector
1,150 sharesP46,000.00
(R)
Filipino 0.0000920634
Christopher J. NelsonDirector
100 sharesP4,000.00
(R)
British 0.0000080055

95
Federico C. PascualIndependent Director
39 sharesP1,560.00
(R)
Filipino 0.0000031221
Cecilio K. PedroIndependent Director
5,000 sharesP200,000.00
(R)
Filipino 0.0004002755
Washington Z. SyCipDirector
39,111 sharesP1,564,440.00
(R)
Filipino-American
0.0031310350
Carmen K. TanDirector
5,000 sharesP200,000.00
(R)
Filipino 0.0004002755
Lucio C. TanDirector
14,843,119 sharesP593,724,760.00
(R)
Filipino 1.1882673540
Lucio K. Tan, Jr.Director
2,300 sharesP92,000.00
(R)
Filipino 0.0001841267
Michael G. TanDirector
250 sharesP10,000.00
(R)
Filipino 0.0000200138
Sub-total 14,906,675 sharesP596,267,000.00
(R)
1.1933553359
All Directors & ExecutiveOfficers as a Group
14,928,214 sharesP597,128,560.00
(R)
1.1950796426
4. Voting Trust Holders of 5% or More
There are no voting trust holders of 5% or more PNB shares.
D. Changes in Control
There has been no change in control in the bank for the year 2016.

96
Item 12. Certain Relationships and Related Transactions
In the ordinary course of business, the Parent Company has loans and other transactions withits subsidiaries and affiliates, and with certain directors, officers, stockholders and relatedinterests (DOSRI). Under the Parent Company’s policy, these loans and other transactionsare made substantially on the same terms as with other individuals and businesses ofcomparable risks. The amount of direct credit accommodations to each of the ParentCompany’s DOSRI, 70.00% of which must be secured, should not exceed the amount of theirrespective deposits and book value of their respective investments in the Parent Company.
In the aggregate, DOSRI loans generally should not exceed the Parent Company’s equity or15% of the Parent Company’s total loan portfolio, whichever is lower. As of December 31,2016 and 2015, the Group and Parent Company were in compliance with such regulations.
Parties are considered to be related if one party has the ability, directly or indirectly, tocontrol the other party or exercise significant influence over the other party in makingfinancial and operating decisions. The Group’s related parties include:
key management personnel, close family members of key management personnel andentities which are controlled, significantly influenced by or for which significant votingpower is held by key management personnel or their close family members;
significant investors; subsidiaries, joint ventures and associates and their respective subsidiaries; and post-employment benefit plans for the benefit of the Group’s employees.
For proper monitoring of related party transactions (RPT) and to assist the Board inperforming its oversight functions in monitoring and managing potential conflicts of interestof management, board members and shareholders, the Bank created the Board OversightRPT Committee (BORC). The BORC is composed of at least five (5) regular memberswhich include three (3) independent directors and 2 non-voting members (the Chief AuditExecutive and the Chief Compliance Officer). The Chairman of the committee is anindependent director and appointed by the Board.
Information related to transactions with related parties and with certain directors, officers,stockholders and related interests (DOSRI) is shown under Note 34 of the Audited FinancialStatements of the Bank and Subsidiaries and Exhibit IV of the Supplementary SchedulesRequired by SRC Rule 68 Annex E.

97
PART IV - EXHIBITS AND SCHEDULES
Item 13. Exhibits and Reports on SEC Form 17-C
A. Exhibits
Exhibit I List of Bank Owned Properties as of December 31, 2016Exhibit II List of Branches under Lease as of December 31, 2016Exhibit III Statement of Management’s Responsibility, Report of Independent
Auditors and Audited Financial Statements of Philippine National Bankand its Subsidiaries as of December 31, 2016 and 2015 and January 1,2015 and for each of the three years ended December 31, 2016, 2015 and2014 and Notes to Financial Statements.
Exhibit IV Supplementary Schedules Required by SRC Rule 68 Annex ESchedule of Retained Earnings Available for Dividend DeclarationMap showing relationships between and among parent, subsidiaries, anassociate, and joint ventureSchedule of all effective standards and interpretations under PFRSFinancial Ratios
B. Reports on SEC Form 17-C
LIST OF SEC FORM 17-C REPORTS FOR THE YEAR 2016
DATE PARTICULARS
February 1, 2016 Board approvals of the following:
1. Renaming of the Board Credit and Policy Committee (BCPC) as Board PolicyCommittee (BPC) and the amendment of its Charter;
2. Dissolution of the Board ICAAP Steering Committee;3. Amendment of the Executive Committee (Excom) Charter;4. Election of the following directors as members of the committees opposite their
names:
Name CommitteeLeonilo G. Coronel BPCChristopher J. Nelson Voting member of ExcomFlorencia G. Tarriela Non-voting member of ExcomFelix Enrico R. Alfiler Non-voting member of ExcomFederico C. Pascual Non-voting member of ExcomDeogracias N. Vistan Non-voting member of Excom
5. Election of Ms. Florencia G. Tarriela as Chairman of the Risk OversightCommittee;
6. Confirmation of the terms and conditions of the sale of 51% equity in PNB LifeInsurance, Inc. to Allianz SE, and agreements in relation thereto; and
7. Resignation of Mr. Jovencio DB. Hernandez, Executive Vice President of theBank, effective on February 8, 2016. He will be directly hired by PNB SavingsBank as its President.

98
DATE PARTICULARS
March 2, 2016 Board approvals on the Notice/Agenda of the 2016 Annual Stockholders’ Meeting andAmendment of the Amended By-Laws of the Bank
March 11, 2016 Press Release – PNB Reports P6.3 Billion Net Income in 2015March 17, 2016 Press Release – PNB Savings Bank 2015 Operating ResultsApril 14, 2016 Board approvals of the following:
1. Nominees to the Board of Directors of the Philippine National Bank for the year2016-2017
2. Nomination of independent directors
April 18, 2016 Monetary Board Approval of PNB’s exercise of its Call Option on its P6.5 Billion 6.75%Lower Tier 2 Unsecured Subordinated Notes
May 5, 2016 Press Release – PNB doubles Net Income for the First Quarter 2016May 10, 2016 Press Release – PNB Savings Bank’s Net Income in First Quarter 2016 up 29%June 1, 2016 Results of the 2016 Annual Stockholders’ Meeting and Organizational Meeting of the
Board of DirectorsJune 3, 2016 Updates in the Annual Corporate Governance ReportJune 7, 2016 Press Release – Allianz Completes 51% Acquisition of PNB Life; Appoints Olaf Kliesow
as CEO of New EntityJune 24, 2016 Board approvals of the following:
1. Additional capital infusion of P500.0 Million in PNB Capital and InvestmentCorporation (PNB Capital), subject to regulatory approvals, as may be necessary;
2. Revisions in the Charters of the following Board Committees of the Bank:
Name of Board Committee Revisions
a. Executive Committee To incorporate the functions of the former BoardPolicy Committee and Board ICAAP SteeringCommittee
b. Corporate Governance/Nomination/Remuneration Committee
To amend the section on Composition of theCommittee
c. Risk Oversight Committee To amend the section on Composition of theCommittee
d. Board Audit and Compliance Committee To amend the section on Membership
e. Board IT and Governance Committee To amend the section on Composition of theCommittee
f. Board Oversight Committee – Domesticand Foreign Offices/Subsidiaries
To amend the section on Composition of theCommittee
g. Board Oversight RPT Committee To amend the section on Composition of theCommittee
h. Trust Committee To amend the section on Composition of theCommittee
3. Promotion of Ms. Teresita U. Sebastian as Senior Vice President of the Bank andthe change in rank of Ms. Ma. Adela A. Joson to Senior Vice President, effectiveJuly 1, 2016.

99
DATE PARTICULARS
July 25, 2016 Board approvals of the following:
1. Issuance of up to P20.0 Billion Peso-denominated Long Term NegotiableCertificates of Time Deposit (LTNCD) in one or more tranches, subject to theapproval of the Bangko Sentral ng Pilipinas (BSP). The proceeds will be used toextend the maturity profile of the Bank’s liabilities as part of overall liabilitymanagement and raise long-term-funds for general corporate purposes;
2. Cash dividend declaration of P1.00 per share or a total of P1,249,139,678.00, to betaken out of the unrestricted Retained Earnings of the Bank as of March 31, 2016,to all stockholders of record as of August 19, 2016, payable on or beforeSeptember 15, 2016, subject to regulatory approvals, as may be necessary;
3. Changes in the board committee memberships, as follows:
Name of Board Committee FROM TO
I. Corporate GovernanceCommittee
1. Florencia G. Tarriela* -Chairman
2. Reynaldo A. Maclang -Member
3. Christopher J. Nelson -Member
4. Florido P. Casuela -Member
5. Michael G. Tan -Member
1. Florencia G. Tarriela* -Chairman
2. Reynaldo A. Maclang -Member
3. Felix Enrico R. Alfiler* -Member
4. Federico C. Pascual* -Member
5. Cecilio K. Pedro* -Member
II. Trust Committee 1. Federico C. Pascual* -Chairman
2. Leonilo G. Coronel -Member
3. Cecilio K. Pedro* -Member
4. Reynaldo A. Maclang -Member
(Ex-Officio)
5. Roberto S. Vergara -Member
(Ex-Officio)
1. Federico C. Pascual* -Chairman
2. Leonilo G. Coronel -Member
3. Christopher J. Nelson -Member
4. Reynaldo A. Maclang -Member
(Ex-Officio)
5. Roberto S. Vergara -Member
(Ex-Officio)
III. Board Oversight Committee –Domestic and ForeignOffices/ Subsidiaries
1. Christopher J. Nelson -Chairman
2. Felix Enrico R. Alfiler* -Member
3. Federico C. Pascual* -Member
1. Christopher J. Nelson -Chairman
2. Florido P. Casuela -Member
3. Michael G. Tan -Member
August 15, 2016 Press Release - PNB net income registers 20% increase for the 1st half of 2016August 22, 2016 Press Release - PNBSB 2016 first half net income surges to P183 million, up 156% year-
on-year

100
DATE PARTICULARS
August 26 ,2016 Board approvals of the following:
1. Revised Corporate Governance Manual of the Bank to align with BSP CircularNo. 914 and Annual Corporate Governance Report guidelines; and
2. The grant of a centennial anniversary bonus in the form of PNB shares of stock toall members and advisors of the PNB Board of Directors, PNB regular officersand employees, and PNB officers under management contracts.
August 30, 2016 Monetary Board Approval on the Declaration of Cash DividendsSeptember 26, 2016 Board approvals of the following:
1. Recall of Ms. Modette Ines V. Carino, First Vice President, from PNB SavingsBank, and her appointment as Acting President/Director of PNB-IBJL Leasing andFinance Corporation, vice Mr. Edgardo T. Nallas, First Senior Vice President,whose early retirement will take effect on September 30, 2016; and
2. Purchase of PNB shares at market value in the aggregate amount of up to P320Min relation to the one-time grant of centennial anniversary bonus, and the authorityof the President to sign and execute documents, and to perform acts necessary toeffect the said purchase and grant of PNB shares, subject to the necessaryapprovals, if any.
November 3, 2016 Approvals on the following:
1. Appointment of Mr. Edgar A. Cua, Independent Director of the Bank, asChairman of the Board Audit and Compliance Committee (BACC), vice Mr. FelixEnrico R. Alfiler; and
2. End of the Management Contract of Mr. Christopher C. Dobles, Executive VicePresident of the Bank, effective at the close of the business hours of October 31,2016
November 11, 2016 Press Release – PNB net income in first nine months of 2016 up 21% to P5.7 billionNovember 14, 2016 Press Release – PNB to Issue Long-Term Negotiable Certificates of Time Deposit; and
Newspaper advertisement for the LTNCD issuanceNovember 25, 2016 Board approvals of the following:
1. Infusion of P200 Million Contingency Surplus in PNB General Insurers Co., Inc.subject to necessary regulatory approvals;
2. Setting up of a trust account for the purchase of PNB shares pursuant to thedisclosure dated September 23, 2016; and
3. Appointment of Mr. Emmanuel German Plan II, First Senior Vice President, asSector Head of the Enterprise Service Sector
November 25, 2016 Appointment of Mr. Emmanuel German Plan II, First Senior Vice President, as SectorHead of the Enterprise Service Sector
November 28, 2016 BSP approval of the Bank’s authority to issue Long-Term Negotiable Certificate of TimeDeposit (LTNCDs) in the aggregate amount of up to Php 20 Billion

101
DATE PARTICULARS
December 29, 2016 SEC approval of the amendment of Section 4.2, Article IV of the Amended By-Laws of theBank, to change the date of the Annual Stockholders’ Meeting from the last Tuesday ofMay to the last Tuesday of April of each year


*SGVFS021357*
C O V E R S H E E Tfor
AUDITED FINANCIAL STATEMENTS
SEC Registration Number
A S 0 9 6 - 0 0 5 5 5 5
C O M P A N Y N A M E
P H I L I P P I N E N A T I O N A L B A N K A N D S
U B S I D I A R I E S
PRINCIPAL OFFICE( No. / Street / Barangay / City / Town / Province )
P N B F i n a n c i a l C e n t e r , P r e s i d e n
t D i o s d a d o M a c a p a g a l B o u l e v a r d
, P a s a y C i t y
Form Type Department requiring the report Secondary License Type, If Applicable
A A F S
C O M P A N Y I N F O R M A T I O N
Company’s Email Address Company’s Telephone Number Mobile Number
No. of Stockholders Annual Meeting (Month / Day) Fiscal Year (Month / Day)
04/25 12/31
CONTACT PERSON INFORMATION
The designated contact person MUST be an Officer of the Corporation
Name of Contact Person Email Address Telephone Number/s Mobile Number
Mr. Nelson C. Reyes 891-6040 to 70
CONTACT PERSON’s ADDRESS
NOTE 1 : In case of death, resignation or cessation of office of the officer designated as contact person, such incident shall be reported to the Commissionwithin thirty (30) calendar days from the occurrence thereof with information and complete contact details of the new contact person designated.
2 : All Boxes must be properly and completely filled-up. Failure to do so shall cause the delay in updating the corporation’s records withthe Commission and/or non-receipt of Notice of Deficiencies. Further, non-receipt of Notice of Deficiencies shall not excuse the corporation from liability for itsdeficiencies.

*SGVFS021357*
INDEPENDENT AUDITOR’S REPORT
The Stockholders and the Board of DirectorsPhilippine National BankPNB Financial CenterPresident Diosdado Macapagal BoulevardPasay City, Metro Manila
Report on the Consolidated and Parent Company Financial Statements
Opinion
We have audited the consolidated financial statements of Philippine National Bank and Subsidiaries (theGroup) and the parent company financial statements of Philippine National Bank (the Parent Company),which comprise the consolidated and parent company statements of financial position as at December 31,2016 and 2015 and the consolidated and parent company statements of income, consolidated and parentcompany statements of comprehensive income, consolidated and parent company statements of changesin equity and consolidated and parent company statements of cash flows for each of the three years in theperiod ended December 31, 2016, and notes to the consolidated and parent company financial statements,including a summary of significant accounting policies.
In our opinion, the accompanying consolidated and parent company financial statements present fairly, inall material respects, the financial position of the Group and the Parent Company as at December 31,2016 and 2015, and their financial performance and their cash flows for each of the three years in theperiod ended December 31, 2016 in accordance with Philippine Financial Reporting Standards (PFRSs).
Basis for Opinion
We conducted our audits in accordance with Philippine Standards on Auditing (PSAs). Ourresponsibilities under those standards are further described in the Auditor’s Responsibilities for the Auditof the Consolidated and Parent Company Financial Statements section of our report. We are independentof the Group and the Parent Company in accordance with the Code of Ethics for Professional Accountantsin the Philippines (Code of Ethics) together with the ethical requirements that are relevant to our audit ofthe consolidated and parent company financial statements in the Philippines, and we have fulfilled ourother ethical responsibilities in accordance with these requirements and the Code of Ethics. We believethat the audit evidence we have obtained is sufficient and appropriate to provide a basis for our opinion.
Key Audit Matters
Key audit matters are those matters that, in our professional judgment, were of most significance in ouraudit of the consolidated and parent company financial statements of the current period. These matterswere addressed in the context of our audit of the consolidated and parent company financial statements asa whole, and in forming our opinion thereon, and we do not provide a separate opinion on these matters.For each matter below, our description of how our audit addressed the matter is provided in that context.
SyCip Gorres Velayo & Co.6760 Ayala Avenue1226 Makati CityPhilippines
Tel: (632) 891 0307Fax: (632) 819 0872ey.com/ph
BOA/PRC Reg. No. 0001, December 14, 2015, valid until December 31, 2018SEC Accreditation No. 0012-FR-4 (Group A), November 10, 2015, valid until November 9, 2018
A member firm of Ernst & Young Global Limited

*SGVFS021357*
- 2 -
We have fulfilled the responsibilities described in the Auditor’s Responsibilities for the Audit of theConsolidated and Parent Company Financial Statements section of our report, including in relation tothese matters. Accordingly, our audit included the performance of procedures designed to respond to ourassessment of the risks of material misstatement of the consolidated and parent company financialstatements. The results of our audit procedures, including the procedures performed to address thematters below, provide the basis for our audit opinion on the accompanying consolidated and parentcompany financial statements.
Applicable to the Audit of the Consolidated and Parent Company Financial Statements
Adequacy of allowance for credit losses on loans and receivables
The Group and the Parent Company’s loans and receivables are significant as they represent 56.79% and53.15% of the total assets of the Group and the Parent Company, respectively. The Group determines theallowance for credit losses on individual basis for individually significant loans and receivables, andcollectively, for loans and receivables that are not individually significant such as consumer loans andcredit card receivables. We considered the impairment of loans and receivables as a key audit matterbecause it involves significant management judgment in determining the allowance for credit losses. Thedetermination of the recoverable amount of loans receivables involves various assumptions and factorsincluding the financial condition of the borrower, timing of expected future cash flows, probability ofcollections, observable market prices and expected net selling prices of the collateral. The disclosuresrelated to allowance for credit losses on loans and receivables are included in Notes 3 and 16 of thefinancial statements.
Audit response
We obtained an understanding of the specific and collective impairment process and tested the relatedcontrols over impairment data and calculations. For loans and receivables subjected to specificimpairment, we obtained an understanding of the basis for measuring the impairment. We selectedsamples of individually impaired loans and inquired of the latest developments about the borrowers. Wetested the key inputs to the impairment calculation by assessing whether the forecasted cash flows arebased on the borrower’s current financial condition, inspecting recent appraisal reports to determine thefair value of collateral held and checking whether the discount rates used are based on the originaleffective interest rate or the last repriced rate. For loans and receivables subjected to collectiveimpairment, we tested inputs in the historical loss and net flow rate models such as, for consumer loans,agreeing the past due aging reports per consumer loan product type while for business loans, agreeing thegroupings of business loans based on their internal credit risk ratings to the Group’s records andsubsidiary ledgers. We examined whether the assumptions and parameters in the collective impairmentcalculation, such as historical losses of default and recovery rate, are based on historical data. We alsoreperformed the calculation of historical loss rates.
A member firm of Ernst & Young Global Limited

*SGVFS021357*
- 3 -
Assessment of goodwill
As at December 31, 2016, the Group and the Parent Company has goodwill amounting to P=13.4 billionand P=13.5 billion, respectively, as a result of its merger with Allied Banking Corporation (ABC) in 2013.Under PFRS, the Group is required to annually test the amount of goodwill for impairment. Goodwill hasbeen allocated to three cash generating units (CGUs) namely retail banking, corporate banking andtreasury. The Group performed the impairment testing using the value in use calculation. The annualimpairment test was significant to our audit because significant judgment and estimates are involved inthe determination of the value in use of the CGUs. The assumptions used in the calculation of the value inuse are sensitive to estimates of future cash flows from business, interest margin, discount rate and long-term growth rate used to project cash flows. The disclosures related to goodwill impairment are includedin Notes 3 and 14 of the financial statements.
Audit response
We obtained an understanding of the Group’s impairment assessment process and related controls. Weinvolved our internal specialist to assist in evaluating the assumptions and methodology used by theGroup, in particular those relating to long-term growth rate of the future cash flows and the discount rateused in determining the present value of the future cash flows. We compared the interest margin andlong-term growth rate of the future cash flows to the historical performance of the CGUs. We alsocompared long-term growth rate of the future cash flows to economic and industry forecasts. Weassessed the discount rate applied in determining the value in use whether these represent current marketassessment of risk associated with the future cash flows.
Valuation of retirement benefit liability
As at December 31, 2016, the present value of pension obligation of the Group and the Parent Companyamounted to P=7.5 billion and P=7.3 billion, respectively, while the fair value of plan assets amounted toP=4.4 billion and P=4.3 billion, respectively. Accumulated remeasurement losses amounted to P=2.8 billionwhich accounts for 2.57% and 2.63% of the Group and Parent Company’s total equity, respectively, as atDecember 31, 2016. The Parent Company also provides certain post-employee benefit through aguarantee of a specified return on contributions in its employee investment plan. The valuation of theretirement benefit liability involves significant management judgment in the use of assumptions. Thevaluation also requires the assistance of an external actuary whose calculation depends on certainassumptions such as prospective salary and employee turnover rate, as well as discount rate, which couldhave a material impact on the results. Thus, we considered this as a key audit matter. The disclosuresrelated to retirement liability are included in Note 29 of the financial statements.
Audit response
We involved our internal specialist in the review of the scope, bases, methodology and results of the workby the Group’s external actuary. We also considered the internal specialist’s professional qualificationsand objectivity. We evaluated the key assumptions used by comparing the employee demographics andattrition rate against the Group’s human resources data, and the discount rate and mortality rate againstavailable market data. We inquired from management about the basis of the salary rate increase andcompared it against the Group’s forecast and available market data. We compared the fair value of theretirement plan assets to market price information.
A member firm of Ernst & Young Global Limited

*SGVFS021357*
- 4 -
Accounting for the disposal of Allianz-PNB Life Insurance, Inc. (APLII) and the remaining interest inAPLII
In 2016, the Parent Company completed the sale of its 51.00% ownership interest in APLII for aconsideration amounting to USD66.0 million (P=3.1 billion). Pursuant to the sale of APLII, the ParentCompany also entered into a distribution agreement with APLII where the Parent Company will allowAPLII to have exclusive access to the distribution network of the Parent Company and its subsidiary,PNB Savings Bank, for over a period of 15 years (the Exclusive Distribution Rights). Both the sharepurchase agreement and distribution agreement have provisions referring to one another; making thedistribution agreement an integral component of the sale transaction. Accordingly, the purchaseconsideration of USD66.0 million was allocated between the 51.00% ownership interest in APLII and theExclusive Distribution Rights. The sale of the 51.00% ownership interest in APLII resulted in the loss ofcontrol of the Parent Company. Under PFRS, the Parent Company is required to remeasure the remaininginterest in APLII to its fair value at date of disposal. The accounting for the disposal of 51.00%ownership interest in APLII and the remaining interest in APLII is significant to our audit because of theamount involved in the transaction and the significant judgment of the management for the valuation ofthe 51.00% interest in APLII, the Exclusive Distribution Rights and the remaining interest in APLII. TheParent Company engaged a third party valuer in determining the fair values of the shares of APLII and theExclusive Distribution Rights. The disclosures related to the disposal of APLII are included in Notes 12and 37 of the financial statements.
Audit response
We read the key agreements related to the disposal of APLII such as the share purchase and distributionagreement. Likewise, we also reviewed the accounting for the consideration received and the allocationmade between the 51.00% interest in APLII and the Exclusive Distribution Rights. We considered thecompetence, capabilities and objectivity of the valuer engaged by the Parent Company to perform thevaluation. We performed an understanding of the valuation techniques used by the valuer. We involvedour internal specialist to assist us in evaluating the valuation methodology and the data and valuationmultiples used by the third party valuer. For key assumptions related to the valuation of the 51.00%ownership interest in APLII, we compared the data and the valuation multiples used to available marketor industry data. We also compared the discount rate and growth rate used on future cash flows topublicly available data on market participants that are comparable to the business of APLII. For keyassumptions related to the valuation of the Exclusive Distribution Rights, we compared the data andvaluation multiples (i.e., number of customers and number of branches) used in the valuation to availablemarket or industry data and to the internal data of the Parent Company.
Other Information
Management is responsible for the other information. The other information comprises the informationincluded in the SEC Form 20-IS (Definitive Information Statement), SEC Form 17-A and Annual Reportfor the year ended December 31, 2016, but does not include the consolidated and parent companyfinancial statements and our auditor’s report thereon. The SEC Form 20-IS (Definitive InformationStatement), SEC Form 17-A and Annual Report for the year ended December 31, 2016 are expected to bemade available to us after the date of this auditor's report.
Our opinion on the consolidated and parent company financial statements does not cover the otherinformation and we will not express any form of assurance conclusion thereon.
A member firm of Ernst & Young Global Limited

*SGVFS021357*
- 5 -
In connection with our audits of the consolidated and parent company financial statements, ourresponsibility is to read the other information identified above when it becomes available and, in doing so,consider whether the other information is materially inconsistent with the consolidated and parentcompany financial statements or our knowledge obtained in the audits, or otherwise appears to bematerially misstated.
Responsibilities of Management and Those Charged with Governance for the Consolidated andParent Company Financial Statements
Management is responsible for the preparation and fair presentation of the consolidated and parentcompany financial statements in accordance with PFRSs, and for such internal control as managementdetermines is necessary to enable the preparation of consolidated and parent company financialstatements that are free from material misstatement, whether due to fraud or error.
In preparing the consolidated and parent company financial statements, management is responsible forassessing the Group’s and Parent Company’s ability to continue as a going concern, disclosing, asapplicable, matters related to going concern and using the going concern basis of accounting unlessmanagement either intends to liquidate the Group and the Parent Company or to cease operations, or hasno realistic alternative but to do so.
Those charged with governance are responsible for overseeing the Group’s and Parent Company’sfinancial reporting process.
Auditor’s Responsibilities for the Audit of the Consolidated and Parent Company FinancialStatements
Our objectives are to obtain reasonable assurance about whether the consolidated and parent companyfinancial statements as a whole are free from material misstatement, whether due to fraud or error, and toissue an auditor’s report that includes our opinion. Reasonable assurance is a high level of assurance, butis not a guarantee that an audit conducted in accordance with PSAs will always detect a materialmisstatement when it exists. Misstatements can arise from fraud or error and are considered material if,individually or in the aggregate, they could reasonably be expected to influence the economic decisions ofusers taken on the basis of these consolidated and parent company financial statements.
As part of an audit in accordance with PSAs, we exercise professional judgment and maintainprofessional skepticism throughout the audit. We also:
∂ Identify and assess the risks of material misstatement of the consolidated and parent companyfinancial statements, whether due to fraud or error, design and perform audit procedures responsiveto those risks, and obtain audit evidence that is sufficient and appropriate to provide a basis for ouropinion. The risk of not detecting a material misstatement resulting from fraud is higher than forone resulting from error, as fraud may involve collusion, forgery, intentional omissions,misrepresentations, or the override of internal control.
∂ Obtain an understanding of internal control relevant to the audit in order to design audit proceduresthat are appropriate in the circumstances, but not for the purpose of expressing an opinion on theeffectiveness of the Group’s and Parent Company’s internal control.
A member firm of Ernst & Young Global Limited
*SGVFS021357*
- 6 -
∂ Evaluate the appropriateness of accounting policies used and the reasonableness of accountingestimates and related disclosures made by management.
∂ Conclude on the appropriateness of management’s use of the going concern basis of accounting and,based on the audit evidence obtained, whether a material uncertainty exists related to events orconditions that may cast significant doubt on the Group’s and Parent Company’s ability to continueas a going concern. If we conclude that a material uncertainty exists, we are required to drawattention in our auditor’s report to the related disclosures in the consolidated and parent companyfinancial statements or, if such disclosures are inadequate, to modify our opinion. Our conclusionsare based on the audit evidence obtained up to the date of our auditor’s report. However, futureevents or conditions may cause the Group and the Parent Company to cease to continue as a goingconcern.
∂ Evaluate the overall presentation, structure and content of the consolidated and parent companyfinancial statements, including the disclosures, and whether the consolidated and parent companyfinancial statements represent the underlying transactions and events in a manner that achieves fairpresentation.
∂ Obtain sufficient appropriate audit evidence regarding the financial information of the entities orbusiness activities within the Group to express an opinion on the consolidated financial statements.We are responsible for the direction, supervision and performance of the audit. We remain solelyresponsible for our audit opinion.
We communicate with those charged with governance regarding, among other matters, the planned scopeand timing of the audit and significant audit findings, including any significant deficiencies in internalcontrol that we identify during our audit.
We also provide those charged with governance with a statement that we have complied with relevantethical requirements regarding independence, and to communicate with them all relationships and othermatters that may reasonably be thought to bear on our independence, and where applicable, relatedsafeguards.
From the matters communicated with those charged with governance, we determine those matters thatwere of most significance in the audit of the consolidated and parent company financial statements of thecurrent period and are therefore the key audit matters. We describe these matters in our auditor’s reportunless law or regulation precludes public disclosure about the matter or when, in extremely rarecircumstances, we determine that a matter should not be communicated in our report because the adverseconsequences of doing so would reasonably be expected to outweigh the public interest benefits of suchcommunication.
Report on the Supplementary Information Required Under Revenue Regulations 15-2010
Our audits were conducted for the purpose of forming an opinion on the basic financial statements takenas a whole. The supplementary information required under Revenue Regulations 15-2010 in Note 40 tothe financial statements is presented for purposes of filing with the Bureau of Internal Revenue and is nota required part of the basic financial statements. Such information is the responsibility of themanagement of Philippine National Bank. The information has been subjected to the auditing proceduresapplied in our audit of the basic financial statements. In our opinion, the information is fairly stated, in allmaterial respects, in relation to the basic financial statements taken as a whole.
A member firm of Ernst & Young Global Limited

*SGVFS021357*
- 7 -
The engagement partner on the audit resulting in this independent auditor’s report is Vicky Lee Salas.
SYCIP GORRES VELAYO & CO.
Vicky Lee SalasPartnerCPA Certificate No. 86838SEC Accreditation No. 0115-AR-4 (Group A), May 1, 2016, valid until May 1, 2019Tax Identification No. 129-434-735BIR Accreditation No. 08-001998-53-2015, March 17, 2015, valid until March 16, 2018PTR No. 5908709, January 3, 2017, Makati City
February 24, 2017
A member firm of Ernst & Young Global Limited

*SGVFS021357*
PHILIPPINE NATIONAL BANK AND SUBSIDIARIESSTATEMENTS OF FINANCIAL POSITION(In Thousands)
Consolidated Parent CompanyDecember 31 January 1
2016 2015 2016
2015(As Restated -
Note 2)
2015(As Restated -
Note 2)
ASSETSCash and Other Cash Items P=11,014,663 P=15,220,536 P=10,626,525 P=12,598,715 P=13,865,078Due from Bangko Sentral ng Pilipinas (Notes 7 and 17) 127,337,861 81,363,444 123,799,952 79,203,948 95,415,467Due from Other Banks (Note 34) 22,709,805 18,287,308 12,831,514 11,450,573 5,013,357Interbank Loans Receivable (Notes 8 and 34) 7,791,108 5,800,383 7,907,366 5,958,526 7,671,437Securities Held Under Agreements to Resell (Note 8) 1,972,310 14,550,000 1,972,310 14,550,000 –Financial Assets at Fair Value Through Profit or Loss (Note 9) 1,913,864 4,510,545 1,880,071 4,492,864 6,695,950Available-for-Sale Investments (Note 9) 67,340,739 68,341,024 65,819,735 66,734,752 55,411,588Held-to-Maturity Investments (Note 9) 24,174,479 23,231,997 24,074,898 23,137,643 21,559,631Loans and Receivables (Notes 10 and 34) 428,027,471 365,725,146 378,198,738 328,300,238 289,021,394Property and Equipment (Note 11) 18,097,355 22,128,464 16,505,047 19,144,198 18,683,415Investments in Subsidiaries and an Associate (Note 12) 2,532,755 – 28,359,871 26,497,732 26,554,857Investment Properties (Notes 13 and 35) 16,341,252 13,230,005 15,975,130 14,666,831 19,752,903Deferred Tax Assets (Note 31) 1,482,214 1,173,575 1,014,308 936,492 1,029,423Intangible Assets (Note 14) 2,562,369 2,442,878 2,471,451 2,346,246 2,200,102Goodwill (Note 14) 13,375,407 13,375,407 13,515,765 13,515,765 13,515,765Assets of Disposal Group Classified as Held for Sale (Note 37) – 23,526,757 – 1,172,963 –Other Assets (Note 15) 7,091,458 6,780,268 6,552,874 5,417,287 4,178,455TOTAL ASSETS P=753,765,110 P=679,687,737 P=711,505,555 P=630,124,773 P=580,568,822
LIABILITIES AND EQUITYLIABILITIESDeposit Liabilities (Notes 17 and 34)Demand P=117,329,019 P=110,029,680 P=115,391,610 P=108,667,550 P=100,322,249Savings 368,798,751 315,355,056 364,067,427 311,090,518 284,837,113Time 84,375,617 60,552,445 62,731,586 50,736,320 47,287,301
570,503,387 485,937,181 542,190,623 470,494,388 432,446,663Financial Liabilities at Fair Value Through Profit or Loss
(Note 18) 232,832 135,193 231,977 135,009 44,264Bills and Acceptances Payable (Notes 19, 34 and 36) 35,885,948 25,752,222 33,986,698 24,629,887 18,526,044Accrued Taxes, Interest and Other Expenses (Note 20) 4,943,626 5,875,228 4,231,615 5,371,733 5,035,156Subordinated Debt (Note 21) 3,497,798 9,986,427 3,497,798 9,986,427 9,969,498Income Tax Payable 195,240 134,720 60,898 55,180 70,001Liabilities of Disposal Group Classified as Held for Sale
(Note 37) – 21,452,621 – – –Other Liabilities (Note 22) 28,565,373 25,658,284 20,027,960 17,669,131 18,629,173
643,824,204 574,931,876 604,227,569 528,341,755 484,720,799EQUITY ATTRIBUTABLE TO EQUITY HOLDERS OF
THE PARENT COMPANYCapital Stock (Note 25) 49,965,587 49,965,587 49,965,587 49,965,587 49,965,587Capital Paid in Excess of Par Value (Note 25) 31,331,251 31,331,251 31,331,251 31,331,251 31,331,251Surplus Reserves (Notes 25 and 33) 573,658 554,263 573,658 554,263 537,620Surplus (Note 25) 30,678,189 24,799,259 30,678,390 24,799,358 18,702,394Net Unrealized Loss on Available-for-Sale Investments (Note 9) (3,469,939) (3,030,588) (3,469,939) (3,030,588) (2,336,142)Remeasurement Losses on Retirement Plan (Note 29) (2,821,853) (2,364,215) (2,821,853) (2,364,215) (2,292,833)Accumulated Translation Adjustment (Note 25) 915,222 612,468 915,222 612,468 (59,854)Other Equity Reserves (Note 25) 105,670 – 105,670 – –Other Equity Adjustment (Note 12) 13,959 13,959 – – –Reserves of a Disposal Group Classified as Held for Sale
(Notes 12 and 37) – (133,500) – (85,106) –Parent Company Shares Held by a Subsidiary (Note 25) – (9,945) – – –
107,291,744 101,738,539 107,277,986 101,783,018 95,848,023NON-CONTROLLING INTERESTS (Note 12) 2,649,162 3,017,322 – – –
109,940,906 104,755,861 107,277,986 101,783,018 95,848,023TOTAL LIABILITIES AND EQUITY P=753,765,110 P=679,687,737 P=711,505,555 P=630,124,773 P=580,568,822
See accompanying Notes to Financial Statements.

*SGVFS021357*
PHILIPPINE NATIONAL BANK AND SUBSIDIARIESSTATEMENTS OF INCOME(In Thousands, Except Earnings per Share)
Consolidated Parent CompanyYears Ended December 31
2016 2015 2014 2016
2015(As Restated -
Note 2)
2014(As Restated -
Note 2)
INTEREST INCOME ONLoans and receivables (Notes 10 and 34) P=19,686,409 P=17,137,657 P=15,172,464 P=16,923,864 P=15,151,263 P=13,994,793Trading and investment securities (Note 9) 4,026,594 3,742,036 2,992,864 3,975,682 3,705,138 2,938,727Deposits with banks and others
(Notes 7 and 34) 597,500 785,414 1,919,443 440,664 596,592 1,616,415Interbank loans receivable (Note 8) 33,862 36,746 19,218 34,174 36,316 19,219
24,344,365 21,701,853 20,103,989 21,374,384 19,489,309 18,569,154
INTEREST EXPENSE ONDeposit liabilities (Notes 17 and 34) 3,780,242 2,980,019 2,788,400 3,356,866 2,773,720 2,614,956Bills payable and other borrowings
(Notes 19, 21 and 34) 997,621 1,029,995 856,927 959,609 1,003,173 801,1144,777,863 4,010,014 3,645,327 4,316,475 3,776,893 3,416,070
NET INTEREST INCOME 19,566,502 17,691,839 16,458,662 17,057,909 15,712,416 15,153,084
Service fees and commission income(Notes 26 and 34) 3,569,958 4,312,898 3,546,449 2,731,258 3,355,972 2,872,162
Service fees and commission expense (Note 34) 914,527 716,849 670,033 480,549 292,724 351,287
NET SERVICE FEES AND COMMISSIONINCOME 2,655,431 3,596,049 2,876,416 2,250,709 3,063,248 2,520,875
Net insurance premium (Note 27) 629,826 540,464 408,273 – – –Net insurance benefits and claims (Note 27) 255,698 436,887 96,138 – – –
NET INSURANCE PREMIUM 374,128 103,577 312,135 – – –
OTHER INCOMENet gains on sale or exchange of assets
(Note 13) 2,510,361 1,595,518 1,453,047 2,517,861 1,581,385 1,435,726Gain on remeasurement of a previously held interest
(Note 12) 1,644,339 – – 1,644,339 – –Foreign exchange gains - net (Note 23) 1,487,740 1,207,840 1,295,318 926,529 973,680 1,007,476Trading and investment securities gains net
(Note 9) 1,378,321 574,321 1,267,706 1,369,514 569,778 1,234,347Equity in net earnings of subsidiaries and an
associate (Note 12) 49,325 – – 255,292 251,852 1,007,198Miscellaneous (Note 28) 1,542,367 1,719,759 2,141,415 1,194,947 1,499,673 1,351,797
TOTAL OPERATING INCOME 31,208,514 26,488,903 25,804,699 27,217,100 23,652,032 23,710,503
OPERATING EXPENSESCompensation and fringe benefits (Notes 29
and 34) 8,569,994 8,234,957 7,429,876 7,370,977 7,173,327 6,582,719Provision for impairment, credit and other losses
(Note 16) 3,212,694 568,180 2,264,615 1,707,494 94,435 2,155,199Taxes and licenses 2,172,042 1,910,735 1,826,963 1,952,291 1,723,421 1,693,907Depreciation and amortization (Note 11) 1,554,645 1,452,221 1,481,931 1,343,583 1,305,779 1,342,210Occupancy and equipment-related costs (Note 30) 1,473,342 1,430,048 1,462,540 1,262,952 1,219,156 1,257,625Miscellaneous (Note 28) 6,142,744 5,319,544 4,740,602 5,604,188 4,911,986 3,950,882
TOTAL OPERATING EXPENSES 23,125,461 18,915,685 19,206,527 19,241,485 16,428,104 16,982,542
INCOME BEFORE INCOME TAX 8,083,053 7,573,218 6,598,172 7,975,615 7,223,928 6,727,961
PROVISION FOR INCOME TAX(Note 31) 1,517,030 1,619,554 1,367,288 1,228,372 1,110,321 1,369,207
NET INCOME FROM CONTINUINGOPERATIONS 6,566,023 5,953,664 5,230,884 6,747,243 6,113,607 5,358,754
NET INCOME FROM DISCONTINUEDOPERATIONS NET OF TAX (Notes 12and 37) 619,563 357,931 264,161 400,323 – –
NET INCOME P=7,185,586 P=6,311,595 P=5,495,045 P=7,147,566 P=6,113,607 P=5,358,754
(Forward)

*SGVFS021357*
- 2 -
Consolidated Parent CompanyYears Ended December 31
2016 2015 2014 2016
2015(As Restated -
Note 2)
2014(As Restated -
Note 2)
ATTRIBUTABLE TO:Equity Holders of the Parent Company P=7,147,464 P=6,113,508 P=5,358,669Non-controlling Interests 38,122 198,087 136,376
P=7,185,586 P=6,311,595 P=5,495,045
Basic/Diluted Earnings Per ShareAttributable to Equity Holders of theParent Company (Note 32) P=5.72 P=4.89 P=4.60
Basic/Diluted Earnings Per ShareAttributable to Equity Holders of theParent Company from ContinuingOperations (Note 32) P=5.24 P=4.67 P=4.42
See accompanying Notes to Financial Statements.

*SGVFS021357*
PHILIPPINE NATIONAL BANK AND SUBSIDIARIESSTATEMENTS OF COMPREHENSIVE INCOME(In Thousands)
Consolidated Parent CompanyYears Ended December 31
2016 2015 2014 2016
2015(As Restated -
Note 2)
2014(As Restated -
Note 2)
NET INCOME P=7,185,586 P=6,311,595 P=5,495,045 P=7,147,566 P=6,113,607 P=5,358,754
OTHER COMPREHENSIVE INCOME(LOSS)
Items that recycle to profit or loss insubsequent periods:Net change in unrealized gain (loss) on
available-for-sale investments(Note 9) (193,484) (824,011) 1,257,552 (185,603) (822,826) 1,115,369
Income tax effect (Note 31) 286 2,887 9,059 − 2,887 9,059Share in changes in net unrealized gains
(losses) on available for saleinvestments of subsidiaries and anassociate (Note 12) (245,867) − − (253,748) 51,906 121,295
(439,065) (821,124) 1,266,611 (439,351) (768,033) 1,245,723Accumulated translation adjustment 420,381 823,525 (368,697) 282,601 86,110 (156,991)Share in changes in accumulated
translation adjustment of subsidiariesand an associate (Note 12) − − − 20,153 586,212 (194,234)
(18,684) 2,401 897,914 (136,597) (95,711) 894,498Items that do not recycle to profit or loss in
subsequent periods:Remeasurement losses on retirement plan
(Note 29) (458,740) (94,267) (1,024,067) (464,207) (90,249) (996,265)Income tax effect (Note 31) 2,204 2,277 9,334 − 2,277 9,334Share in changes in remeasurement gains
(losses) of subsidiaries and anassociate (Note 12) 1,208 − − 6,569 5,071 (27,530)
(455,328) (91,990) (1,014,733) (457,638) (82,901) (1,014,461)
OTHER COMPREHENSIVE LOSS,NET OF TAX (474,012) (89,589) (116,819) (594,235) (178,612) (119,963)
TOTAL COMPREHENSIVE INCOME P=6,711,574 P=6,222,006 P=5,378,226 P=6,553,331 P=5,934,995 P=5,238,791
ATTRIBUTABLE TO:Equity holders of the Parent Company P=6,553,229 P=5,886,502 P=5,238,706Non-controlling interests 158,345 335,504 139,520
P=6,711,574 P=6,222,006 P=5,378,226
See accompanying Notes to Financial Statements.

*SGVFS021357*
PHILIPPINE NATIONAL BANK AND SUBSIDIARIESSTATEMENTS OF CHANGES IN EQUITY(In Thousands)
ConsolidatedAttributable to Equity Holders of the Parent Company
Capital Stock(Note 25)
Capital Paid in Excess of
Par Value(Note 25)
SurplusReserves(Notes 25
and 33)Surplus(Note 25)
Net Unrealized Loss on
Available- for-Sale
Investments(Note 9)
RemeasurementLosses on
RetirementPlan
(Note 29)
Accumulated Translation Adjustment
(Note 25)
Other EquityReserves(Note 25)
Reserves of aDisposal
GroupClassified as
Held for Sale(Note 37)
Other EquityAdjustment
(Note 12)
Parent Company
SharesHeld by a
Subsidiary(Note 25) Total
Non-controlling
Interest(Note 12)
TotalEquity
Balance at January 1, 2016 P=49,965,587 P=31,331,251 P=554,263 P=24,799,259 (P=3,030,588) (P=2,364,215) P=612,468 P=− (P=133,500) P=13,959 (P=9,945) P=101,738,539 P=3,017,322 P=104,755,861Total comprehensive income (loss) for the year – – – 7,147,464 (439,351) (457,638) 302,754 − − – – 6,553,229 158,345 6,711,574Sale of direct interest in a subsidiary (Note 12) – – – – – – – − 133,500 – – 133,500 (483,296) (349,796)Disposal of Parent Company shares by a
subsidiary – – – – – – – − – – 9,945 9,945 − 9,945Cash dividends declared (Note 25) − − − (1,249,139) − − − − − − − (1,249,139) − (1,249,139)Other equity reserves (Note 25) − − − − − − − 105,670 − − − 105,670 − 105,670Declaration of dividends by subsidiaries to non-
controlling interests – – – – – – – − – – – – (43,209) (43,209)Transfer to surplus reserves (Note 33) – – 19,395 (19,395) – – – − – – – – – –Balance at December 31, 2016 P=49,965,587 P=31,331,251 P=573,658 P=30,678,189 (P=3,469,939) (P=2,821,853) P=915,222 P=105,670 P=− P=13,959 P=− P=107,291,744 P=2,649,162 P=109,940,906
Balance at January 1, 2015 P=49,965,587 P=31,331,251 P=537,620 P=18,702,394 (P=2,336,142) (P=2,292,833) (P=59,854) P=− P=– P=– P=– P=95,848,023 P=3,212,859 P=99,060,882Total comprehensive income (loss) for the year – – – 6,113,508 (809,876) (89,452) 672,322 − – – – 5,886,502 335,504 6,222,006Sale of direct interest in a subsidiary (Note 12) – – – – – – – − – (543) – (543) 103,166 102,623Acquisition of non-controlling interest (Note 12) – – – – – – – − – 14,502 – 14,502 (616,274) (601,772)Acquisition of Parent Company Shares by a
subsidiary – – – – – – – − – – (9,945) (9,945) – (9,945)Reserves of a disposal group classified as held
for sale – – – – 115,430 18,070 – − (133,500) – – – – –Declaration of dividends by subsidiaries to non-
controlling interests – – – – – – – − – – – – (17,933) (17,933)Transfer to surplus reserves (Note 33) – – 16,643 (16,643) – – – − – – – – – –Balance at December 31, 2015 P=49,965,587 P=31,331,251 P=554,263 P=24,799,259 (P=3,030,588) (P=2,364,215) P=612,468 P=− (P=133,500) P=13,959 (P=9,945) P=101,738,539 P=3,017,322 P=104,755,861
Balance at January 1, 2014 P=43,448,337 P=26,499,909 P=524,003 P=13,357,342 (P=3,581,865) (P=1,278,372) P=291,371 P=− P=– P=– P=– P=79,260,725 P=3,078,228 P=82,338,953Total comprehensive income (loss) for the year – – – 5,358,669 1,245,723 (1,014,461) (351,225) − – – – 5,238,706 139,520 5,378,226Issuance of capital stock (Note 25) 6,517,250 5,050,869 – – – – – − – – – 11,568,119 – 11,568,119Transaction costs of shares issuance – (219,527) – – – – – − – – – (219,527) – (219,527)Declaration of dividends by subsidiaries to non-
controlling interests – – – – – – – − – – – – (4,889) (4,889)Transfer to surplus reserves (Note 33) – – 13,617 (13,617) – – – − – – – – – –Balance at December 31, 2014 P=49,965,587 P=31,331,251 P=537,620 P=18,702,394 (P=2,336,142) (P=2,292,833) (P=59,854) P=− P=– P=– P=– P=95,848,023 P=3,212,859 P=99,060,882

*SGVFS021357*
- 2 -
Parent Company
CapitalStock
(Note 25)
Capital Paidin Excess of
Par Value(Note 25)
SurplusReserves
(Notes 25 and 33)Surplus(Note 25)
Reserves of aDisposal Group
Classified asHeld for Sale
(Notes 12 and 37)
Other EquityReserves(Note 25)
Net UnrealizedLoss on AFSInvestments
(Note 9)
Remeasurement Losses on
Retirement Plan(Note 29)
AccumulatedTranslationAdjustment
(Note 25)Total
Equity
Balance at January 1, 2016, as previously reported P=49,965,587 P=31,331,251 P=554,263 P=22,219,098 P=− P=− (P=3,022,853) (P=2,326,283) P=154,713 P=98,875,776Effect of retroactive application of PAS 27 (Amendment) (Note 2) − − − 2,580,260 (85,106) − (7,735) (37,932) 457,755 2,907,242Balance at January 1, 2016, as restated 49,965,587 31,331,251 554,263 24,799,358 (85,106) − (3,030,588) (2,364,215) 612,468 101,783,018Total comprehensive income (loss) for the year – – – 7,147,566 − − (439,351) (457,638) 302,754 6,553,331Declaration of Cash Dividends − − − (1,249,139) − − − − − (1,249,139)Sale of direct interest in a subsidiary (Note 37) − − − − 85,106 − − − − 85,106Other equity reserves (Note 25) − − − − − 105,670 − − − 105,670Transfer to surplus reserves (Note 33) – – 19,395 (19,395) − − – – – −Balance at December 31, 2016 P=49,965,587 P=31,331,251 P=573,658 P=30,678,390 P=− P=105,670 (P=3,469,939) (P=2,821,853) P=915,222 P=107,277,986
Balance at January 1, 2015, as previously reported P=49,965,587 P=31,331,251 P=537,620 P=16,019,048 P=− P=− (P=2,276,501) (P=2,249,830) P=68,603 P=93,395,778Effect of retroactive application of PAS 27 (Amendment) (Note 2) − − − 2,683,346 − − (59,641) (43,003) (128,457) 2,452,245Balance at January 1, 2015, as restated 49,965,587 31,331,251 537,620 18,702,394 − − (2,336,142) (2,292,833) (59,854) 95,848,023Total comprehensive income (loss) for the year – – – 6,113,607 – – (768,033) (82,901) 672,322 5,934,995Reserves of a disposal group classified as held for sale (Note 37) – – – – (85,106) – 73,587 11,519 – –Transfer to surplus reserves (Note 33) – – 16,643 (16,643) – – – – – –Balance at December 31, 2015 P=49,965,587 P=31,331,251 P=554,263 P=24,799,358 (P=85,106) P=– (P=3,030,588) (P=2,364,215) P=612,468 P=101,783,018
Balance at January 1, 2014, as previously reported P=43,448,337 P=26,499,909 P=524,003 P=11,613,316 P=− P=− (P=3,400,929) (P=1,262,899) P=225,594 P=77,647,331Effect of retroactive application of PAS 27 (Amendment) (Note 2) − − − 1,743,941 − − (180,936) (15,473) 65,777 1,613,309Balance at January 1, 2014, as restated 43,448,337 26,499,909 524,003 13,357,257 − − (3,581,865) (1,278,372) 291,371 79,260,640Total comprehensive income (loss) for the year – – – 5,358,754 − − 1,245,723 (1,014,461) (351,225) 5,238,791Issuance of capital stock (Note 25) 6,517,250 5,050,869 – – − − – – – 11,568,119Transaction costs on shares issuance – (219,527) – – − − – – – (219,527)Transfer to surplus reserves (Note 33) – – 13,617 (13,617) − − – – – –Balance at December 31, 2014 P=49,965,587 P=31,331,251 P=537,620 P=18,702,394 P=− P=− (P=2,336,142) (P=2,292,833) (P=59,854) P=95,848,023See accompanying Notes to Financial Statements.

*SGVFS021357*
PHILIPPINE NATIONAL BANK AND SUBSIDIARIESSTATEMENTS OF CASH FLOWS(In Thousands)
Consolidated Parent CompanyYears Ended December 31
2016 2015 2014 2016
2015(As Restated -
Note 2)
2014(As Restated -
Note 2)CASH FLOWS FROM OPERATING
ACTIVITIESIncome before income tax from continuing
operations P=8,083,053 P=7,573,218 P=6,598,172 P=7,975,615 P=7,223,928 P=6,727,961Income before income tax from discontinued
operations (Note 37) 826,061 402,236 307,333 681,228 – –Income before income tax 8,909,114 7,975,454 6,905,505 8,656,843 7,223,928 6,727,961Adjustments for:
Provision for impairment, credit and otherlosses (Notes 16 and 37) 3,212,694 600,945 2,264,615 1,707,494 94,435 2,155,199
Net gain on sale or exchange of assets(Note 13) (2,510,361) (1,595,518) (1,453,047) (2,517,861) (1,581,385) (1,435,726)
Gain on remeasurement of a previously heldinterest (Note 12) (1,644,339) − − (1,644,339) − −
Depreciation and amortization (Notes 11and 37) 1,554,645 1,462,925 1,495,970 1,343,583 1,305,779 1,342,210
Realized trading gain on available-for-saleinvestments (Notes 9 and 37) (1,362,477) (782,065) (1,174,153) (1,350,468) (756,777) (1,128,511)
Amortization of premium (discount) oninvestment securities 1,144,317 (911,967) (694,846) 1,137,513 (872,123) 1,099,979
Loss (gain) on mark-to-market of derivatives(Note 23) 698,071 583,375 (105,244) 698,071 583,358 (105,087)
Loss (gain) from sale of previously heldinterest (Note 12) (681,228) − − (681,228) 13,247 (1,917)
Recoveries on receivable from special purposevehicle (Note 28) (500,000) (353,000) (27,000) (500,000) (353,000) (27,000)
Amortization of fair values of HTMreclassified to AFS (Note 9) 145,727 139,372 124,145 140,332 126,531 102,615
Loss on mark-to-market of held for tradingsecurities (Note 9) 88,436 314,836 233,439 88,436 314,846 233,506
Equity in net earnings of subsidiaries and anassociate (Note 12) (49,325) – – (255,292) (251,852) (1,007,198)
Amortization of transaction costs (Note 17) 36,640 33,836 38,600 36,640 33,836 38,600Amortization of fair value adjustments 21,137 63,519 222,245 21,137 63,519 222,245Gain on mark-to-market of financial assets and
liabilities designated at fair value throughprofit or loss (Notes 9 and 18) 3,202 (210) (1,751) − − −
Loss on write-off of software cost (Note 14) 894 – 2,648 − − 852Changes in operating assets and liabilities:
Decrease (increase) in amounts of:Interbank loan receivable (Note 8) (547,222) 178,898 (178,898) (508,224) 132,596 (178,898)Financial assets at fair value through
profit or loss 1,904,611 (1,691,607) (5,768,722) 1,923,254 1,304,882 (2,978,696)Loans and receivables (66,333,237) (49,881,768) (44,553,319) (52,436,762) (38,729,690) (35,839,430)Other assets (1,643,070) 238,353 (3,022,695) (743,644) 666,991 (2,357,544)
Increase (decrease) in amounts of:Financial liabilities at fair value through
profit or loss − 2,998,489 2,787,130 − 90,745 (118,819)Deposit liabilities 84,510,588 38,196,138 (14,994,164) 71,640,617 37,950,439 (16,258,325)Accrued taxes, interest and other
expenses 729,486 595,696 (82,174) 520,970 336,577 25,993Other liabilities 1,204,703 538,654 (2,565,604) 651,404 (294,584) (3,314,173)Net cash generated from (used in)
operations 28,893,006 (1,295,645) (60,547,320) 27,928,476 7,402,298 (52,802,164)Income taxes paid (784,682) (718,496) (899,599) (715,203) (516,503) (696,006)Net cash provided by (used in) operating
activities 28,108,324 (2,014,141) (61,446,919) 27,213,273 6,885,795 (53,498,170)
(Forward)

*SGVFS021357*
- 2 -
Consolidated Parent CompanyYears Ended December 31
2016 2015 2014 2016
2015(As Restated -
Note 2)
2014(As Restated -
Note 2)CASH FLOWS FROM INVESTING
ACTIVITIESProceeds from sale of:
Available-for-sale investments P=83,143,335 P=66,348,222 P=63,379,326 P=81,843,119 P=60,096,798 P=56,615,134Investment properties 2,387,170 4,050,406 2,849,775 2,255,377 3,918,919 2,830,358Property and equipment (Note 11) 142,129 499,529 451,212 418,869 432,469 457,352
Disposal group classified as held forsale/Investment in shares of a subsidiary(Notes 12 and 37) 3,230,966 – – 3,230,966 102,623 –
Proceeds from maturities of :Available-for-sale investments − 21,848,096 368,050 − 21,848,096 –Held-to-maturity investments − 115,397 40,000 – – –
Collection of receivables from special purposevehicle 500,000 353,000 27,000 500,000 353,000 27,000
Share in dividends from subsidiaries (Note 12) – – – 66,125 180,000 67,793Acquisitions of:
Available-for-sale investments (83,486,942) (100,599,843) (65,706,781) (82,272,241) (92,903,772) (59,016,667)Property and equipment (Note 11) (2,028,339) (1,907,386) (981,458) (1,740,338) (1,577,147) (835,152)Software cost (Note 14) (406,053) (571,768) (384,951) (404,837) (558,372) (380,474)Held-to-maturity investments − (976,403) (571,602) – (892,200) (571,602)
Additional investments in subsidiaries(Note 12) – – – (292,416) (601,772) (10,600,000)
Closure of subsidiaries (Note 12) – – – – – 2,035Net cash provided by(used in) investing activities 3,482,266 (10,840,750) (529,429) 3,604,624 (9,601,358) (11,404,223)CASH FLOWS FROM FINANCING
ACTIVITIESProceeds from issuances of:
Bills and acceptances payable 180,747,610 116,889,829 42,300,489 175,375,030 112,249,710 39,296,399Capital stock − − 11,568,119 – – 11,568,119
Proceeds from sale of non-controlling interest insubsidiaries (Note 12) − 102,623 – – – –
Settlement of: Bills and acceptances payable (169,839,126) (111,139,760) (36,442,592) (165,576,107) (107,605,128) (34,286,795) Subordinated debt (6,500,000) − − (6,500,000) − −Cash dividends declared and paid (1,249,139) − − (1,249,139) − −Acquisition of non-controlling interest in
subsidiaries (Note 12) (292,416) (601,772) – – – –Dividends paid to non-controlling interest (43,209) (17,933) (4,889) − − –Payments for transaction cost of issuance of
shares − – (219,527) – – (219,527)Net cash provided by (used in) financing
activities 2,823,720 5,232,987 17,201,600 2,049,784 4,644,582 16,358,196NET INCREASE (DECREASE) IN CASH
AND CASH EQUIVALENTS 34,414,310 (7,621,904) (44,774,748) 32,867,681 1,929,019 (48,544,197)CASH AND CASH EQUIVALENTS AT
BEGINNING OF YEARCash and other cash items 15,863,080 14,628,489 11,804,746 12,598,715 13,865,078 9,700,005Due from Bangko Sentral ng Pilipinas 81,363,444 105,773,685 153,169,330 79,203,948 95,415,467 146,079,249Due from other banks 18,287,308 15,591,406 14,881,541 11,450,573 5,013,357 6,146,134Interbank loans receivable 5,800,383 7,492,539 8,405,250 5,912,224 7,492,539 8,405,250Securities held under agreements to resell 14,550,000 – – 14,550,000 – –
135,864,215 143,486,119 188,260,867 123,715,460 121,786,441 170,330,638CASH AND CASH EQUIVALENTS AT END
OF YEARCash and other cash items 11,014,663 15,863,080 14,628,489 10,626,525 12,598,715 13,865,078Due from Bangko Sentral ng Pilipinas 127,337,861 81,363,444 105,773,685 123,799,952 79,203,948 95,415,467Due from other banks 22,709,805 18,287,308 15,591,406 12,831,514 11,450,573 5,013,357Interbank loans receivable (Note 8) 7,243,886 5,800,383 7,492,539 7,352,840 5,912,224 7,492,539Securities held under agreements to resell 1,972,310 14,550,000 – 1,972,310 14,550,000 –
P=170,278,525 P=135,864,215 P=143,486,119 P=156,583,141 P=123,715,460 P=121,786,441OPERATIONAL CASH FLOWS FROM
INTEREST AND DIVIDENDSInterest paid P=4,620,623 P=3,881,864 P=3,387,941 P=4,254,991 P=3,628,149 P=3,150,615Interest received 23,544,207 20,208,489 22,270,498 20,653,077 17,952,107 22,147,995Dividends received 17,593 22,190 2,409 80,841 198,338 79,744
See accompanying Notes to Financial Statements.
*SGVFS021357*
PHILIPPINE NATIONAL BANK AND SUBSIDIARIESNOTES TO FINANCIAL STATEMENTS(Amounts in Thousand Pesos except When Otherwise Indicated)
1. Corporate Information
Philippine National Bank (the Parent Company) was established in the Philippines in 1916 andstarted commercial operations that same year. On May 27, 1996, the Parent Company wasregistered with the Philippine Securities and Exchange Commission (SEC) with a corporate termof 50 years. Its principal place of business is at PNB Financial Center, President DiosdadoMacapagal Boulevard, Pasay City, Metro Manila. As of December 31, 2016 and 2015, the LTGroup, Inc. (LTG) held indirect ownership of 59.83% of the Parent Company’s shares throughvarious holding companies, while 17.38% of the Parent Company’s shares were held by PhilippineCentral Depository (PCD) Nominee Corporation. The remaining 22.79% of the Parent Company’sshares were held by other stockholders holding less than 10.00% each of the Parent Company'sshares.
The Parent Company’s immediate parent company, LTG, and ultimate parent company, TangentHoldings Corporation, are incorporated in the Philippines.
The Parent Company provides a full range of banking and other financial services to corporate,middle-market and retail customers, the National Government (NG), local government units(LGUs) and government-owned and controlled corporations (GOCCs) and various governmentagencies. The Parent Company’s principal commercial banking activities include deposit-taking,lending, bills discounting, foreign exchange dealing, investment banking, fund transfers/remittance servicing and a full range of retail banking and trust services through its 675 and 665domestic branches as of December 31, 2016 and 2015, respectively.
The Parent Company has the largest overseas network among Philippine banks with 73 and 75branches, representative offices, remittance centers and subsidiaries as of December 31, 2016 and2015, respectively, in 16 locations in the United States, Canada, Europe, the Middle East and Asia.
The subsidiaries of the Parent Company are engaged in a number of diversified financial andrelated businesses such as remittance, life and nonlife insurance, banking, leasing, stockbrokerage, foreign exchange trading and/or related services.
The Parent Company previously operated under a rehabilitation program pursuant to thememorandum of agreement signed by the Republic of the Philippines, the Philippine DepositInsurance Corporation (PDIC) and the LTG on May 3, 2002. In May 2007, the Parent Companyconcluded its 5-year Rehabilitation Plan as approved by the Bangko Sentral ng Pilipinas (BSP).
Merger with Allied Banking CorporationThe respective shareholders of the Parent Company and Allied Banking Corporation (ABC),representing at least two-thirds of the outstanding capital stock of both banks, approved theamended terms of the Plan of Merger of the two banks on March 6, 2012. The original plan of themerger, which involved a share-for-share exchange, was approved by the affirmative vote of ABCand the Parent Company’s respective shareholders, representing at least two-thirds of theoutstanding capital stock of both banks, on June 24, 2008. Under the approved amended terms,the Parent Company will be the surviving entity. It will issue to ABC shareholders 130 ParentCompany common shares for every ABC common share and 22.763 Parent Company common

- 2 -
*SGVFS021357*
shares for every ABC preferred share. Merger and business combination are terms usedinterchangeably within the accompanying financial statements and have the same meaning.
On February 9, 2013, the Parent Company concluded its planned merger with ABC as approvedand confirmed by the Board of Directors (BOD) of the Parent Company and of ABC onJanuary 22 and 23, 2013, respectively. The purchase consideration as of February 9, 2013, theacquisition date, amounted toP=41.5 billion which represents 423,962,500 common shares at thefair value of P=97.90 per share in exchange for the 100.00% voting interest in ABC at the shareswap ratio of 130 Parent Company common shares for one ABC share and 22.763 ParentCompany common shares for one ABC preferred share (Note 14). The fair value of the shares isthe published price of the shares of the Parent Company as of February 9, 2013. There are nocontingent considerations arrangements as part of the merger.
The merger of the Parent Company and ABC enabled the two banks to advance their long-termstrategic business interests as they capitalized on their individual strengths and markets.
On April 26, 2013, the Group filed a request for a ruling from the BIR seeking confirmation thatthe statutory merger of PNB and ABC is a tax-free merger under Section 40(C)(2) of the NationalInternal Revenue Code of 1997 as amended (Tax Code). As of December 31, 2016, the rulingrequest is still pending with the Law Division of the BIR. The Group believes that the BIR willissue such confirmation on the basis of BIR Preliminary Ruling No. 01-2008 (datedSeptember 28, 2008) whereby the BIR held that the statutory merger of PNB and ABC complieswith Revenue Memorandum Ruling (RMR) No. 1-2001, subject to the submission of the mergerdocuments and documents pertaining to the assets and liabilities transferred. RMR No. 1-2001provides the fact pattern that should be present in order to secure BIR confirmation for a tax-freeSection 40(C)(2) transaction.
2. Summary of Significant Accounting Policies
Basis of PreparationThe accompanying financial statements of the Parent Company and its subsidiaries (the Group)have been prepared on a historical cost basis except for financial assets and liabilities at fair valuethrough profit or loss (FVPL) and available-for-sale (AFS) investments that are measured at fairvalue. Amounts in the financial statements are presented to the nearest thousand pesos (P=000)unless otherwise stated.
The financial statements of the Parent Company and PNB Savings Bank (PNBSB) reflect theaccounts maintained in the Regular Banking Unit (RBU) and Foreign Currency Deposit Unit(FCDU).
The functional currency of RBU and FCDU is Philippine pesos (Php) and United States Dollar(USD), respectively. For financial reporting purposes, FCDU accounts and foreign currency-denominated accounts in the RBU are translated into their equivalents in Philippine pesos (seeaccounting policy on Foreign Currency Translation). The financial statements individuallyprepared for these units are combined and inter-unit accounts and transactions are eliminated.
Each entity in the Group determines its own functional currency and items included in thefinancial statements of each entity are measured using that functional currency. The respectivefunctional currencies of the subsidiaries are presented in Note 12.

- 3 -
*SGVFS021357*
Statement of ComplianceThe financial statements have been prepared in accordance with Philippine Financial ReportingStandards (PFRS).
Presentation of Financial StatementsThe statements of financial position of the Group and of the Parent Company are presented inorder of liquidity. An analysis regarding recovery or settlement within 12 months after thereporting date (current) and more than 12 months after the reporting date (non-current) ispresented in Note 24.
Financial assets and financial liabilities are offset and the net amount is reported in the statementsof financial position only when there is a legal enforceable right to offset the recognized amountsand there is an intention to settle on a net basis or to realize the assets and settle the liabilitiessimultaneously. Income and expense are not offset in the statements of income unless required orpermitted by any accounting standard or interpretation and as specifically disclosed in theaccounting policies. This is not generally the case with master netting agreements, where therelated assets and liabilities are presented gross amounts in the statement of financial position.
Basis of ConsolidationThe consolidated financial statements comprise the financial statements of the Parent Companyand its subsidiaries (Note 12).
Subsidiaries are fully consolidated from the date on which control is transferred to the Group.Control is achieved when the Group is exposed, or has rights, to variable return from itsinvolvement with an investee and has the ability to affect those returns through its power over theinvestee. The Group controls an investee if and only if, the Group has:
∂ Power over the investee (i.e., existing rights that give it the current ability to direct therelevant activities of the investee)
∂ Exposure or rights to variable returns from its involvement with the investee∂ The ability to use its power over the investee to affect its returns
Generally, there is a presumption that a majority of voting rights result in control. To support thispresumption, and when the Group has less than a majority of the voting or similar rights of aninvestee, the Group considers all relevant facts and circumstances in assessing whether it haspower over an investee, including:
∂ Contractual arrangement with the other voting shareholders of the investee∂ Rights arising from other contractual arrangements∂ The Group’s voting rights and potential voting rights
The Group re-assesses whether or not it controls an investee if facts and circumstances indicatethat there are changes to one or more of the three elements of control. Consolidation of asubsidiary begins when the Group obtains control over the subsidiary and ceases when the Grouploses control of the subsidiary. Assets, liabilities, income, expenses and other comprehensiveincome (OCI) of a subsidiary acquired or disposed of during the year are included in theconsolidated financial statements from the date the Group gains control until the date the Groupceases to control the subsidiary.
Profit or loss and each component of OCI are attributed to the equity holders of the ParentCompany and to the non-controlling interests, even if this results in deficit balances of non-controlling interests. The financial statements of the subsidiaries are prepared on the same

- 4 -
*SGVFS021357*
reporting period as the Parent Company using consistent accounting policies. All significant intra-group balances, transactions, income and expenses and profits and losses resulting from intra-group transactions are eliminated in full in the consolidation.
Changes in the Group and the Parent Company’s ownership interest in a subsidiary that do notresult in a loss of control are accounted for within equity as ‘Other equity adjustment’. In suchcircumstances, the carrying amounts of the controlling and NCI are adjusted by the Group toreflect the changes in its relative interests in the subsidiary. Any difference between the amountby which the non-controlling interests are adjusted and the fair value of the consideration paid orreceived is recognized directly in equity and attributed to the owners of the Parent Company.
When a change in ownership interest in a subsidiary occurs which results in a loss of control overthe subsidiary, the Parent Company:
∂ Derecognizes the assets (including goodwill) and liabilities of the subsidiary∂ Derecognizes the carrying amount of any non-controlling interest∂ Recognizes the fair value of the consideration received∂ Recognizes the fair value of any investment retained∂ Recognizes any surplus or deficit in profit or loss∂ Reclassifies the parent’s share of components previously recognized in OCI to profit or loss or
surplus, as appropriate, as would be required if the Group had directly disposed of the relatedassets and liabilities
Non-controlling InterestsNon-controlling interests represent the portion of profit or loss and the net assets not held by theGroup and are presented separately in the consolidated statement of income, consolidatedstatement of comprehensive income and within equity in the consolidated statement of financialposition, separately from equity attributable to the Parent Company. Subsequent to acquisition(See Accounting Policy on Business Combinations and Goodwill), non-controlling interestsconsist of the amount attributed to such interest at initial recognition and the non-controllinginterests’ share of changes in equity since the date of business combination.
Changes in Accounting Policies and Disclosures
The accounting policies adopted are consistent with those of the previous year except for thefollowing amendments and improvements to PFRS which are effective beginning on or afterJanuary 1, 2016. Except as otherwise indicated, the changes in the accounting policies that did nothave any significant impact on the financial position or performance of the Group follow:
∂ PFRS 10, PFRS 12 and PAS 28, Investment Entities: Applying the Consolidation Exception(Amendments)
∂ PFRS 11, Accounting for Acquisitions of Interests in Joint Operations (Amendments)∂ PFRS 14, Regulatory Deferral Accounts∂ Philippine Accounting Standards (PAS) 1, Disclosure Initiative (Amendments)∂ PAS 16 and PAS 38, Clarification of Acceptable Methods of Depreciation and Amortization
(Amendments)∂ PAS 16 and PAS 41, Agriculture: Bearer Plants (Amendments)

- 5 -
*SGVFS021357*
Annual Improvements to PFRSs (2012-2014 cycle)∂ PFRS 5, Non-current Assets Held-for-Sale and Discontinued Operations - Changes in
Methods of Disposal (Amendments)∂ PFRS 7, Financial Instruments: Disclosures - Servicing Contracts(Amendments)∂ PFRS 7, Applicability of the Amendments to PFRS to Condensed Interim Financial Statements
(Amendments)∂ PAS 19, Employee Benefits - regional market issue regarding discount rate (Amendments)∂ PAS 34, Interim Financial Reporting - disclosure of information elsewhere in the interim
financial report (Amendments)
In 2016, the Parent Company adopted the amendments to PAS 27, Separate Financial Statements,Equity Method in Separate Financial Statements, following the guidelines provided by the BSP.The amendments allow entities to use the equity method to account for investments insubsidiaries, joint ventures, and associates in their separate financial statements. The ParentCompany elected to use the equity method in its separate financial statements. These amendmentsdo not have any impact on the Group’s consolidated financial statements.
Additional statement of financial position as at January 1, 2015 is presented in the separatefinancial statements due to retrospective application of the change in accounting policy.The effects of retrospective restatement of items in the financial statements are detailed below:
December 31, 2015As previously
reportedEffect of
restatement As restatedStatement of Financial PositionInvestments in subsidiaries and an
associate P=23,821,982 P=2,675,750 P=26,497,732Deferred tax assets 1,031,948 (95,456) 936,492Assets of a disposal group classified as
held for sale 846,015 326,948 1,172,963Surplus 22,219,098 2,580,260 24,799,358Net unrealized loss on available-for-sale
investments (3,022,853) (7,735) (3,030,588)Remeasurement losses on retirement plan (2,326,283) (37,932) (2,364,215)Accumulated translation adjustment 154,713 457,755 612,468Reserves of a disposal group classified as
held for sale − (85,106) (85,106)
For the year ended December 31, 2015As previously
reportedEffect of
restatement As restatedStatement of Comprehensive IncomeStatement of incomeMiscellaneous income P=1,759,155 (P=259,482) P=1,499,673Equity in net earnings of subsidiaries and
an associate − 69,307 69,307Provision for income tax 1,014,865 95,456 1,110,321Net income from discontinued operations − 182,545 182,545
(Forward)

- 6 -
*SGVFS021357*
For the year ended December 31, 2015As previously
reportedEffect of
restatement As restatedOther comprehensive incomeShare in changes in net unrealized gains
on available-for-sale investments ofsubsidiaries and an associate P=− P=51,906 P=51,906
Share in changes in accumulatedtranslation adjustment of subsidiariesand an associate − 586,212 586,212
Share in changes in remeasurement gainson retirement plan of subsidiaries andan associate − 5,071 5,071
January 1, 2015As previously
reportedEffect of
restatement As restatedStatement of Financial PositionInvestments in subsidiaries and an
associate P=24,102,612 P=2,452,245 P=26,554,857Surplus 16,019,048 2,683,346 18,702,394Net unrealized loss on available-for-sale
investments (2,276,501) (59,641) (2,336,142)Remeasurement losses on retirement plan (2,249,830) (43,003) (2,292,833)Accumulated translation adjustment 68,603 (128,457) (59,854)
For the year ended December 31, 2014As previously
reportedEffect of
restatement As restatedStatement of Comprehensive IncomeStatement of incomeMiscellaneous income P=1,419,591 (P=67,794) P=1,351,797Equity in net earnings of subsidiaries and
an associate − 1,007,198 1,007,198Other comprehensive incomeShare in changes in net unrealized gains
on available-for-sale investments ofsubsidiaries and an associate − 121,295 121,295
Share in changes in accumulatedtranslation adjustment of subsidiariesand an associate − (194,234) (194,234)
Share in changes in remeasurement gainson retirement plan of subsidiaries andan associate − (27,530) (27,530)

- 7 -
*SGVFS021357*
Significant Accounting Policies
Business Combinations and GoodwillBusiness combinations are accounted for using the acquisition method. The cost of an acquisition ismeasured as the aggregate of the consideration transferred at acquisition date fair value and theamount of any non-controlling interest in the acquiree. For each business combination, the Groupelects whether to measure the non-controlling interest in the acquiree at fair value or at theproportionate share of the acquiree’s identifiable net assets. Acquisition-related costs are expensedas incurred and included in administrative expenses.
When the Group acquires a business, it assesses the financial assets and liabilities assumed forappropriate classification and designation in accordance with the contractual terms, economiccircumstances and pertinent conditions as at the acquisition date. This includes the separation ofembedded derivatives in host contracts by the acquiree.
If the initial accounting for a business combination is incomplete by the end of the reporting periodin which the combination occurs, the Group, as an acquirer, shall report in its financial statementsprovisional amounts for the items for which the accounting is incomplete. During the measurementperiod, the Group as an acquirer shall retrospectively adjust the provisional amounts recognized atthe acquisition date to reflect new information obtained about facts and circumstances that existed asof the acquisition date and, if known, would have affected the measurement of the amountsrecognized as of that date. During the measurement period, the Group as an acquirer shall alsorecognize additional assets or liabilities if new information is obtained about facts and circumstancesthat existed as of the acquisition date and, if known, would have resulted in the recognition of thoseassets and liabilities as of that date. The measurement period ends as soon as the Group as anacquirer receives the information it was seeking about facts and circumstances that existed as of theacquisition date or learns that more information is not obtainable. However, the measurement periodshall not exceed one year from the acquisition date.
If the business combination is achieved in stages, the previously held equity interest is remeasured atits acquisition date fair value and any resulting gain or loss is recognized in the consolidatedstatement of income. Any contingent consideration to be transferred by the acquirer will berecognized at fair value at the acquisition date. Contingent consideration classified as an asset orliability that is a financial instrument and within the scope of PAS 39, Financial Instruments:Recognition and Measurement, is measured at fair value with changes in fair value recognizedeither in the consolidated statement of income or as a change to OCI. If the contingent considerationis not within the scope of PAS 39, it is measured in accordance with the appropriate PFRS.Contingent consideration that is classified as equity is not remeasured and subsequent settlement isaccounted for within equity. Goodwill is initially measured at cost, being the excess of the aggregateof the consideration transferred and the amount recognized for non-controlling interest over the netidentifiable assets acquired and liabilities assumed. If the fair value of the net assets acquired is inexcess of the aggregate consideration transferred, the gain is recognized in the consolidatedstatement of income.
After initial recognition, goodwill is measured at cost less any accumulated impairment losses.For the purpose of impairment testing, goodwill acquired in a business combination is, from theacquisition date, allocated to each of the Group’s CGUs that are expected to benefit from thecombination, irrespective of whether other assets or liabilities of the acquiree are assigned to thoseunits. Where goodwill has been allocated to a CGU and part of the operation within that unit isdisposed of, the goodwill associated with the disposed operation is included in the carrying amountof the operation when determining the gain or loss on disposal. Goodwill disposed in this

- 8 -
*SGVFS021357*
circumstance is measured based on the relative values of the disposed operation and the portion ofthe CGU retained.
Where there are business combinations in which all the combining entities within the Group areultimately controlled by the same ultimate parent before and after the business combination and thatthe control is not transitory (“business combinations under common control”), the Group accountssuch business combinations under the purchase method of accounting, if the transaction was deemedto have substance from the perspective of the reporting entity. In determining whether the businesscombination has substance, factors such as the underlying purpose of the business combination andthe involvement of parties other than the combining entities such as the non-controlling interest,shall be considered.
In cases where the business combination has no substance, the Group shall account for thetransaction similar to a pooling of interests. The assets and liabilities of the acquired entities and thatof the Group are reflected at their carrying values. The difference in the amount recognized and thefair value of the consideration given, is accounted for as an equity transaction, i.e., as either acontribution or distribution of equity. Further, when a subsidiary is disposed in a common controltransaction, the difference in the amount recognized and the fair value consideration received, is alsoaccounted for as an equity transaction.
Non-current Assets and Disposal Group Held for Sale and Discontinued OperationsThe Group classifies non-current assets and disposal group as held for sale if their carrying amountswill be recovered principally through a sale transaction. As such non-current assets and disposalgroups are measured at the lower of their carrying amount and fair value less costs to sell. Costs tosell are the incremental costs directly attributable to the sale, excluding the finance costs and incometax expense.
The criteria for held for sale classification is regarded as met only when the sale is highly probableand the asset or disposal group is available for immediate sale in its present condition. Actionsrequired to complete the sale should indicate that it is unlikely that significant changes to the salewill be made or that the decision to sell will be withdrawn. Management must be committed to thesale expected within one year from the date of the classification.
Assets and liabilities of disposal group classified as held for sale are presented separately in thestatements of financial position.
A disposal group qualifies as discontinued operation if it is a component of an entity that either hasbeen disposed of, or is classified as held for sale, and:• Represents a separate major line of business or geographical area of operations• Is part of a single coordinated plan to dispose of a separate major line of business or
geographical area of operations, or• Is a subsidiary acquired exclusively with a view to resale
Discontinued operations are excluded from the results of continuing operations and are presented asa single amount as profit or loss after tax from discontinued operations in the statement of income.
Refer to Note 37 for the detailed disclosure on discontinued operations. All other notes to thefinancial statements include amounts for continuing operations, unless otherwise mentioned.

- 9 -
*SGVFS021357*
Foreign Currency TranslationThe financial statements are presented in Php, which is also the Parent Company’s functionalcurrency. The books of accounts of the RBU are maintained in Php while those of the FCDU aremaintained in USD. Each entity in the Group determines its own functional currency and itemsincluded in the consolidated financial statements of each entity are measured using that functionalcurrency.
Transactions and balancesAs at reporting date, foreign currency-denominated monetary assets and liabilities in the RBU aretranslated in Philippine peso based on the Philippine Dealing System (PDS) closing rate prevailingat end of year, and for foreign currency-denominated income and expenses at the exchange ratesprevailing at transaction dates. Foreign exchange differences arising from revaluation of foreigncurrency-denominated monetary assets and liabilities of the entities are credited to or chargedagainst operations in the period in which foreign exchange rates change.
Non-monetary items that are measured in terms of historical cost in a foreign currency aretranslated using the exchange rates as at the dates of the initial transactions. Non-monetary assetsmeasured at fair value in a foreign currency are translated using the exchange rate at the date whenthe fair value is determined.
FCDU and overseas subsidiariesAs at the reporting date, the assets and liabilities of the FCDU and overseas subsidiaries aretranslated into the Parent Company’s presentation currency (the Philippine peso) at the closingrate prevailing at the reporting date, and their income and expenses are translated at the averageexchange rate for the year. Exchange differences arising on translation are taken directly to OCIunder ‘Accumulated Translation Adjustment’. Upon disposal of a foreign entity or upon actualremittance of FCDU profits to RBU, the deferred cumulative amount recognized in OCI relatingto the particular foreign operation is recognized in the statement of income.
Insurance Product ClassificationInsurance contracts are those contracts where the Group (the insurer) has accepted significantinsurance risk from another party (the policyholders) by agreeing to compensate the policyholdersif a specified uncertain future event (the insured event) adversely affects the policyholders. As ageneral guideline, the Group determines whether it has significant insurance risk, by comparingbenefits paid with benefits payable if the insured event did not occur. Insurance contracts can alsotransfer financial risk.
Financial risk is the risk of a possible future change in one or more of a specified interest rate,security price, commodity price, foreign exchange rate, index of price or rates, a credit rating orcredit index or other variable. Investment contracts mainly transfer financial risk but can alsotransfer insignificant insurance risk.
Once a contract has been classified as an insurance contract, it remains an insurance contract forthe remainder of its lifetime, even if the insurance risk reduces significantly during this period,unless all rights and obligations are extinguished or has expired. Investment contracts, however,can be reclassified to insurance contracts after inception if the insurance risk becomes significant.
For financial options and guarantees which are not closely related to the host insurance contract,bifurcation is required to measure these embedded financial derivatives separately as financialassets or liabilities at fair value through profit or loss (FVPL). Bifurcation is not required if theembedded derivative is itself an insurance contract or when the host insurance contract itself ismeasured as financial assets or liabilities at FVPL. The options and guarantees within the
- 10 -
*SGVFS021357*
insurance contracts issued by the Group are treated as derivative financial instruments which areclosely related to the host insurance and therefore not bifurcated subsequently. As such, theGroup does not separately measure options to surrender insurance contracts for a fixed amount(or an amount based on a fixed amount and an interest rate). Likewise, the embedded derivative inunit-linked insurance contracts linking the payment on the contract to units of internal investmentfunds meets the definition of an insurance contract and is therefore not accounted for separatelyfrom the host insurance contract.
Based on the Group guidelines, all products in its portfolio meet the definition of insurancecontracts, including unit-linked products, which contain features that make use of fundsspecifically segregated for the benefit of unit-linked policyholders.
Cash and Cash EquivalentsFor purposes of reporting cash flows, cash and cash equivalents include cash and other cash items(COCI), amounts due from BSP and other banks, interbank loans receivable and securities heldunder agreements to resell that are convertible to known amounts of cash, with original maturitiesof three months or less from dates of placements and that are subject to an insignificant risk ofchanges in fair value. Due from BSP includes statutory reserves required by the BSP, which theGroup considers as cash equivalents wherein drawings can be made to meet cash requirements.
Fair Value MeasurementThe Group measures financial instruments such as financial assets and liabilities at FVPL andAFS investments at fair value at each reporting date. Also, fair values of financial instrumentsmeasured at amortized cost and investment properties are disclosed in Note 5.
Fair value is the price that would be received to sell an asset or paid to transfer a liability in anorderly transaction between market participants at the measurement date. The fair valuemeasurement is based on the presumption that the transaction to sell the asset or transfer theliability takes place either:
∂ in the principal market for the asset or liability, or∂ in the absence of a principal market, in the most advantageous market for the asset or liability.
The principal or the most advantageous market must be accessible to the Group. The fair value ofan asset or a liability is measured using the assumptions that market participants would use whenpricing the asset or liability, assuming that market participants act in their economic best interest.
If an asset or a liability measured at fair value has a bid price and ask price, the price within thebid-ask spread is the most representative of fair value in the circumstance shall be used to measurefair value regardless of where the input is categorized within the fair value hierarchy. A fair valuemeasurement of a nonfinancial asset takes into account a market participant's ability to generateeconomic benefits by using the asset in its highest and best use or by selling it to another marketparticipant that would use the asset in its highest and best use.
The Group uses valuation techniques that are appropriate in the circumstances and for whichsufficient data are available to measure fair value, maximizing the use of relevant observableinputs and minimizing the use of unobservable inputs.
All assets and liabilities for which fair value is measured or disclosed in the financial statementsare categorized within the fair value hierarchy, described in Note 5, based on the lowest levelinput that is significant to the fair value measurement as a whole.

- 11 -
*SGVFS021357*
For assets and liabilities that are recognized in the financial statements on a recurring basis, theGroup determines whether transfers have occurred between levels in the hierarchy by re-assessingcategorization (based on the lowest level input that is significant to the fair value measurement asa whole) at the end of each reporting period.
Financial Instruments - Initial Recognition and Subsequent MeasurementDate of recognitionPurchases or sales of financial assets that require delivery of assets within the time frameestablished by regulation or convention in the marketplace are recognized on settlement date, thedate that an asset is delivered to or by the Group. Derivatives are recognized on trade date basis(i.e., the date that the Group commits to purchase or sell). Deposits, amounts due to banks andcustomers and loans are recognized when cash is received by the Group or advanced to theborrowers.
Initial recognition of financial instrumentsAll financial instruments are initially recognized at fair value. Except for financial instruments atFVPL, the initial measurement of financial instruments includes transaction costs. The Groupclassifies its financial assets in the following categories: financial assets at FVPL, held-to-maturity(HTM) investments, AFS investments, and loans and receivables. The classification depends onthe purpose for which the investments were acquired and whether they are quoted in an activemarket. Management determines the classification of its investments at initial recognition and,where allowed and appropriate, re-evaluates such designation at every reporting date. Financialliabilities are classified into financial liabilities at FVPL and other financial liabilities at amortizedcost.
Derivatives recorded at FVPLThe Parent Company and some of its subsidiaries are counterparties to derivative contracts, suchas currency forwards, currency swaps, interest rate swaps and warrants. These contracts areentered into as a service to customers and as a means of reducing or managing their respectiveforeign exchange and interest rate exposures, as well as for trading purposes. Such derivativefinancial instruments are initially recorded at fair value on the date at which the derivative contractis entered into and are subsequently remeasured at fair value. Any gains or losses arising fromchanges in fair values of derivatives are taken directly to the statement of income and are includedin ‘Trading and investment securities gains - net’ except for currency forwards and currencyswaps, where fair value changes are included under ‘Foreign exchange gains - net’. Derivativesare carried as assets when the fair value is positive and as liabilities when the fair value isnegative.
Financial assets or financial liabilities held-for-tradingFinancial assets or financial liabilities held for trading (classified as ‘Financial Assets at FVPL’ or‘Financial Liabilities at FVPL’) are recorded in the statement of financial position at fair value.Changes in fair value relating to the held-for-trading (HFT) positions are recognized in ‘Tradingand investment securities gains - net’. Interest earned or incurred is recorded in ‘Interest income’or ‘Interest expense’, respectively, while dividend income is recorded in ‘Miscellaneous income’when the right to receive payment has been established.
Included in this classification are debt and equity securities which have been acquired principallyfor the purpose of selling or repurchasing in the near term.

- 12 -
*SGVFS021357*
Designated financial assets or financial liabilities at FVPLFinancial assets or financial liabilities classified in this category are designated by management oninitial recognition when any of the following criteria are met:
∂ the designation eliminates or significantly reduces the inconsistent treatment that wouldotherwise arise from measuring the assets or liabilities or recognizing gains or losses on themon a different basis; or
∂ the assets and liabilities are part of a group of financial assets, financial liabilities or bothwhich are managed and their performance evaluated on a fair value basis, in accordance with adocumented risk management or investment strategy; or
∂ the financial instrument contains an embedded derivative, unless the embedded derivativedoes not significantly modify the cash flows or it is clear, with little or no analysis, that itwould not be separately recorded.
Designated financial assets and financial liabilities at FVPL are recorded in the statement offinancial position at fair value. Changes in fair value are recorded in ‘Trading and investmentsecurities gains - net’. Interest earned or incurred is recorded in ‘Interest income’ or ‘Interestexpense’, respectively, while dividend income is recorded in ‘Miscellaneous income’ according tothe terms of the contract, or when the right of payment has been established.
HTM investmentsHTM investments are quoted, non-derivative financial assets with fixed or determinable paymentsand fixed maturities for which the Group has the positive intention and ability to hold to maturity.Where the Group sells or reclassifies other than an insignificant amount of HTM investmentsbefore maturity (other than in certain specific circumstances), the entire category would be taintedand reclassified as AFS investments. Once tainted, the Group is prohibited from classifyinginvestments under HTM for at least the following two financial years.
After initial measurement, these investments are subsequently measured at amortized cost usingthe effective interest method, less impairment losses, if any. Amortized cost is calculated bytaking into account any discount or premium on acquisition and fees that are an integral part of theeffective interest rate (EIR). Gains and losses are recognized in the statement of income when theHTM investments are derecognized and impaired, as well as through the amortization process.Losses arising from impairment of such investments are recognized in the statement of incomeunder ‘Provision for impairment, credit and other losses’. The effects of revaluation on foreigncurrency-denominated HTM investments are recognized as ‘Foreign exchange gains-net’ in theconsolidated statement of income.
Loans and receivablesSignificant accounts falling under this category are ‘Loans and Receivables’, ‘Due from BSP’,‘Due from Other Banks’, ‘Interbank Loans Receivable’ and ‘Securities Held Under Agreements toResell’.
These are non-derivative financial assets with fixed or determinable payments and fixed maturitiesand are not quoted in an active market. They are not entered into with the intention of immediateor short-term resale and are not classified as financial assets at FVPL or designated as AFSinvestments.
‘Loans and Receivables’ also include receivables arising from transactions on credit cards issueddirectly by the Parent Company. Furthermore, ‘Loans and Receivables’ include the aggregaterental on finance lease transactions and notes receivables financed by PNB-IBJL Leasing andFinance Corporation (PILFC) and Allied Leasing and Finance Corporation (ALFC). Unearned

- 13 -
*SGVFS021357*
income on finance lease transactions is shown as a deduction from ‘Loans and Receivables’(included in ‘Unearned and other deferred income’).
After initial measurement, loans and receivables are subsequently measured at amortized costusing the effective interest method, less allowance for credit losses. Amortized cost is calculatedby taking into account any discount or premium on acquisition and fees that are an integral part ofthe EIR. The amortization is included in ‘Interest income’ in the statement of income. Lossesarising from impairment are recognized in ‘Provision for impairment, credit and other losses’ inthe statement of income.
AFS investmentsAFS investments are those which are designated as such or do not qualify to be classified as‘Financial Assets at FVPL’, ‘HTM Investments’ or ‘Loans and Receivables’. They are purchasedand held indefinitely, and may be sold in response to liquidity requirements or changes in marketconditions. They include debt and equity instruments.
After initial measurement, AFS investments are subsequently measured at fair value. Theeffective yield component of AFS debt securities, as well as the impact of restatement on foreigncurrency-denominated AFS debt securities, is reported in the statement of income. The unrealizedgains and losses arising from the fair valuation of AFS investments are excluded, net of tax, fromreported income and are reported as ‘Net change in unrealized gain (loss) on AFS investments’ inthe statement of comprehensive income.
When the security is disposed of, the cumulative gain or loss previously recognized in OCI isrecognized as ‘Trading and investment securities gains - net’ in the statement of income. Interestearned on holding AFS debt investments are reported as ‘Interest income’ using the effectiveinterest method. Dividends earned on holding AFS equity investments are recognized in thestatement of income as ‘Miscellaneous income’ when the right of payment has been established.Losses arising from impairment of such investments are recognized as ‘Provision for impairment,credit and other losses’ in the statement of income.
Other financial liabilitiesIssued financial instruments or their components, which are not designated at FVPL, are classifiedas ‘Deposit Liabilities’, ‘Bills and Acceptances Payable’, ‘Subordinated Debt’ and otherappropriate financial liability accounts, where the substance of the contractual arrangement resultsin the Group having an obligation either to deliver cash or another financial asset to the holder, orto satisfy the obligation other than by the exchange of a fixed amount of cash or another financialasset for a fixed number of own equity shares. The components of issued financial instrumentsthat contain both liability and equity elements are accounted for separately, with the equitycomponent being assigned the residual amount after deducting from the instrument as a whole theamount separately determined as the fair value of the liability component on the date of issue.
After initial measurement, other financial liabilities not qualified as and not designated at FVPLare subsequently measured at amortized cost using the effective interest method. Amortized costis calculated by taking into account any discount or premium on the issue and fees that are anintegral part of the EIR.
Reclassification of financial assetsThe Group may choose to reclassify a non-derivative trading financial asset out of the held-for-trading category if the financial asset is no longer held for purposes of selling it in the near termand only in rare circumstances arising from a single event that is unusual and highly unlikely torecur in the near term. In addition, the Group may choose to reclassify financial assets that would

- 14 -
*SGVFS021357*
meet the definition of loans and receivables out of the AFS investments category if the Group hasthe intention and ability to hold these financial assets for the foreseeable future or until maturity atthe date of reclassification.
The Group may also reclassify certain AFS investments to HTM investments when there is achange of intention and the Group has the ability to hold the financial instruments to maturity.
For reclassifications from AFS, the fair value carrying amount at the date of reclassificationbecomes the new amortized cost and any previous gain or loss that has been recognized in equityis amortized to profit or loss over the remaining life of the investment using the effective interestmethod.
Derecognition of Financial Assets and LiabilitiesFinancial assetA financial asset (or, where applicable, a part of a financial asset or part of a group of financialassets) is derecognized when:
∂ the rights to receive cash flows from the asset have expired;∂ the Group retains the right to receive cash flows from the asset, but has assumed an obligation
to pay them in full without material delay to a third party under a ‘pass-through’ arrangement;or
∂ the Group has transferred its rights to receive cash flows from the asset and either (a) hastransferred substantially all the risks and rewards of the asset, or (b) has neither transferred norretained the risk and rewards of the asset but has transferred control over the asset.
Where the Group has transferred its rights to receive cash flows from an asset or has entered into apass-through arrangement, and has neither transferred nor retained substantially all the risks andrewards of the asset nor transferred control over the asset, the asset is recognized to the extent ofthe Group’s continuing involvement in the asset. Continuing involvement that takes the form of aguarantee over the transferred asset is measured at the lower of original carrying amount of theasset and the maximum amount of consideration that the Group could be required to repay.
Financial liabilityA financial liability is derecognized when the obligation under the liability is discharged orcancelled or has expired. Where an existing financial liability is replaced by another from thesame lender on substantially different terms, or the terms of an existing liability are substantiallymodified, such an exchange or modification is treated as a derecognition of the original liabilityand the recognition of a new liability, and the difference in the respective carrying amounts isrecognized in the statement of income.
Repurchase and Reverse Repurchase AgreementsSecurities sold under agreements to repurchase at a specified future date (‘repos’) are notderecognized from the statement of financial position. The corresponding cash received,including accrued interest, is recognized in the statement of financial position as a loan to theGroup, reflecting the economic substance of such transaction.
Conversely, securities purchased under agreements to resell at a specified future date (‘reverserepos’) are not recognized in the statement of financial position. The Group is not permitted tosell or repledge the securities in the absence of default by the owner of the collateral. Thecorresponding cash paid, including accrued interest, is recognized on the statement of financialposition as ‘Securities Held Under Agreements to Resell’, and is considered a loan to the

- 15 -
*SGVFS021357*
counterparty. The difference between the purchase price and resale price is treated as interestincome and is accrued over the life of the agreement using the effective interest method.
Impairment of Financial AssetsThe Group assesses at each reporting date whether there is objective evidence that a financial assetor group of financial assets is impaired. A financial asset or a group of financial assets is deemedto be impaired if, and only if, there is objective evidence of impairment as a result of one or moreevents that has occurred after the initial recognition of the asset (an incurred ‘loss event’) and thatloss event (or events) has an impact on the estimated future cash flows of the financial asset or thegroup of financial assets that can be reliably estimated. Evidence of impairment may includeindications that the borrower or a group of borrowers is experiencing significant financialdifficulty, default or delinquency in interest or principal payments, the probability that they willenter bankruptcy or other financial reorganization, and where observable data indicate that there ismeasurable decrease in the estimated future cash flows, such as changes in arrears or economicconditions that correlate with defaults.
Financial assets at amortized costFor financial assets carried at amortized costs such as ‘Loans and Receivables’, ‘HTMInvestments’, ‘Due from BSP’, ‘Due from Other Banks’, ‘Interbank Loans Receivable’ and‘Securities Held under Agreements to Resell’, the Group first assesses whether objective evidenceof impairment exists individually for financial assets that are individually significant, orcollectively for financial assets that are not individually significant.
If there is objective evidence that an impairment loss has been incurred, the amount of the loss ismeasured as the difference between the asset’s carrying amount and the present value of theestimated future cash flows (excluding future credit losses that have not been incurred). Thepresent value of the estimated future cash flows is discounted at the financial asset’s original EIR.If a loan has a variable interest rate, the discount rate for measuring any impairment loss is thecurrent EIR, adjusted for the original credit risk premium. The calculation of the present value ofthe estimated future cash flows of a collateralized financial asset reflects the cash flows that mayresult from foreclosure less costs for obtaining and selling the collateral, whether or notforeclosure is probable.
If the Group determines that no objective evidence of impairment exists for an individuallyassessed financial asset, whether significant or not, it includes the asset in a group of financialassets with similar credit risk characteristics and collectively assesses for impairment. Thosecharacteristics are relevant to the estimation of future cash flows for groups of such assets bybeing indicative of the debtors’ ability to pay all amounts due according to the contractual terms ofthe assets being evaluated. Assets that are individually assessed for impairment and for which animpairment loss is, or continues to be recognized, are not included in a collective assessment forimpairment.
For the purpose of a collective evaluation of impairment, financial assets are grouped on the basisof credit risk characteristics such as internal credit risk rating, collateral type, past-due status andterm. Future cash flows in a group of financial assets that are collectively evaluated forimpairment are estimated on the basis of historical loss experience for assets with credit riskcharacteristics similar to those in the Group. Historical loss experience is adjusted on the basis ofcurrent observable data to reflect the effects of current conditions that did not affect the period onwhich the historical loss experience is based and to remove the effects of conditions in thehistorical period that do not exist currently. Estimates of changes in future cash flows reflect, andare directionally consistent with changes in related observable data from period to period (such aschanges in property prices, payment status, or other factors that are indicative of incurred losses in

- 16 -
*SGVFS021357*
the Group and their magnitude). The methodology and assumptions used for estimating futurecash flows are reviewed regularly by the Group to reduce any differences between loss estimatesand actual loss experience.
The carrying amount of the asset is reduced through the use of an allowance account and theamount of loss is charged to the statement of income. Interest income continues to be recognizedbased on the original EIR of the asset. Loans and receivables, together with the associatedallowance accounts, are written off when there is no realistic prospect of future recovery and allcollateral has been realized. If subsequently, the amount of the estimated impairment lossdecreases because of an event occurring after the impairment was recognized, the previouslyrecognized impairment loss is reduced by adjusting the allowance account. If a future write-off islater recovered, any amounts formerly charged are credited to ‘Recoveries’ under ‘Miscellaneousincome’ in the statement of income.
The consumer loans and credit card receivables of the Group are assessed for impairmentcollectively because these receivables are not individually significant. The carrying amount ofthese receivables is reduced for impairment through the use of an allowance account and theamount of loss is recognized under ‘Provision for impairment, credit and other losses’ in thestatement of income. Consumer loans and credit card receivables, together with the associatedallowance accounts, are written off if the accounts are 360 days past due and 180 days past due,respectively. If a write-off is later recovered, any amounts formerly charged to allowance forcredit losses are credited to ‘Recoveries’ under ‘Miscellaneous income’ in the statement ofincome. Past due accounts include accounts with no payments or with payments less than theminimum amount due on or before the due dates.
The allowance for credit losses of consumer loans and credit card receivables are determinedbased on the net flow rate methodology. Net flow tables are derived from account-levelmonitoring of monthly movements between different stage buckets, from 1-day past due to 180-days past due. The net flow rate methodology relies on the last 60 months for consumer loans and24 months for credit card receivables of net flow tables to establish a percentage (net flow rate) ofreceivables that are current or in any state of delinquency (i.e., 30, 60, 90, 120, 150 and 180 dayspast due) as of the reporting date that will eventually result in write-off. The gross provision isthen computed based on the outstanding balances of the receivables as of the reporting date andthe net flow rates determined for the current and each delinquency bucket.
Restructured loansWhere possible, the Group seeks to restructure loans rather than to take possession of collateral.This may involve extending the payment arrangements and the agreement of new loan conditions.Once the terms have been renegotiated, the loan is no longer considered past due. Managementcontinuously reviews restructured loans to ensure that all criteria are met and that future paymentsare likely to occur. The loans continue to be subject to an individual or collective impairmentassessment, calculated using the loan’s original EIR. The difference between the recorded valueof the original loan and the present value of the restructured cash flows, discounted at the originalEIR, is recognized in ‘Provision for impairment, credit and other losses’ in the statement ofincome.
AFS investmentsFor AFS investments, the Group assesses at each reporting date whether there is objectiveevidence that a financial asset or group of financial assets is impaired.

- 17 -
*SGVFS021357*
In the case of equity investments classified as AFS investments, this would include a significant orprolonged decline in the fair value of the investments below its cost. The Group treats‘significant’ generally as 20.00% or more and ‘prolonged’ greater than 12 months. In addition,the Group evaluates other factors, including normal volatility in share price for quoted equitysecurities and the future cash flows and the discount factors for unquoted equity securities. Wherethere is evidence of impairment, the cumulative loss - measured as the difference between theacquisition cost and the current fair value, less any impairment loss on that financial assetpreviously recognized in the statement of income - is removed from equity and recognized in thestatement of income. Impairment losses on equity investments are not reversed through thestatement of income. Increases in fair value after impairment are recognized directly in OCI.
In the case of debt instruments classified as AFS investments, impairment is assessed based on thesame criteria as financial assets carried at amortized cost. However, the amount recorded forimpairment is the cumulative loss measured as the difference between the amortized cost and thecurrent fair value, less any impairment loss on that investment previously recognized in profit orloss. Future interest income is based on the reduced carrying amount and is accrued based on therate of interest used to discount future cash flows for the purpose of measuring impairment loss.Such accrual is recorded as part of ‘Interest income’ in the statement of income. If subsequently,the fair value of a debt instrument increased and the increase can be objectively related to an eventoccurring after the impairment loss was recognized in the statement of income, the impairmentloss is reversed through the statement of income.
Reinsurance assetsAn impairment review is performed at each reporting period date or more frequently when anindication of impairment arises during the reporting year. Impairment occurs when objectiveevidence exists that the Group may not recover outstanding amounts under the terms of thecontract and when the impact on the amounts that the Group will receive from the reinsurer can bemeasured reliably. The impairment loss is charged against the consolidated statement of income.
Financial GuaranteesIn the ordinary course of business, the Group gives financial guarantees consisting of letters ofcredit, letters of guarantees, and acceptances. Financial guarantees on trade receivables areinitially recognized in the financial statements at fair value under ‘Bills and Acceptances Payable’or ‘Other Liabilities’. Subsequent to initial recognition, the Group’s liabilities under suchguarantees are each measured at the higher of the initial fair value less, when appropriate,cumulative amortization calculated to recognize the fee in the statement of income in ‘Service feesand commission income’, over the term of the guarantee, and the best estimate of the expenditurerequired to settle any financial obligation arising as a result of the guarantee.
Any increase in the liability relating to financial guarantees is taken to the statement of income in‘Miscellaneous expenses’. Any financial guarantee liability remaining is recognized in thestatement of income in ‘Service fees and commission income’, when the guarantee is discharged,cancelled or has expired.
Nonlife Insurance Contract LiabilitiesProvision for unearned premiumsThe proportion of written premiums, gross of commissions payable to intermediaries, attributableto subsequent periods or to risks that have not yet expired is deferred as provision for unearnedpremiums. Premiums from short-duration insurance contracts are recognized as revenue over theperiod of the contracts using the 24th method except for marine cargo where the provision forunearned premiums pertains to the premiums for the last two months of the year. The portion ofthe premiums written that relate to the unexpired periods of the policies at the end of reporting

- 18 -
*SGVFS021357*
period are accounted for as provision for unearned premiums and presented as part of ‘Insurancecontract liabilities’ in the ‘Other Liabilities’ section of the consolidated statement of financialposition. The change in the provision for unearned premiums is taken to the consolidatedstatement of income in the order that revenue is recognized over the period of risk. Furtherprovisions are made to cover claims under unexpired insurance contracts which may exceed theunearned premiums and the premiums due in respect of these contracts.
Claims provision and IBNR lossesOutstanding claims provisions are based on the estimated ultimate cost to all claims incurred butnot settled at the reporting date, whether reported or not, together with the related claims handlingcosts and reduction for the expected value of salvage and other recoveries. Delays can beexperienced in the notification and settlement of certain types of claims, therefore the ultimate costof which cannot be known with certainty at the reporting date. The liability is not discounted forthe time value of money and includes provision for IBNR. No provision for equalization orcatastrophic reserves is recognized. The liability is derecognized when the contract is dischargedor cancelled or has expired.
Liability Adequacy TestLiability adequacy tests on life insurance contracts are performed annually to ensure the adequacyof the insurance contract liabilities. In performing these tests, current best estimates of futurecontractual cash flows, claims handling and policy administration expenses are used. Anydeficiency is immediately charged against profit or loss initially by establishing a provision forlosses arising from the liability adequacy tests. The adequacy of the liability on insurancecontracts is tested based on the pricing assumptions set out at the inception of the contract. Whenthe liability adequacy test requires the adoption of a new set of revised best estimate assumptions,such assumptions are used for the subsequent measurement of these liabilities.
For nonlife insurance contracts, liability adequacy tests are performed at the end of each reportingdate to ensure the adequacy of insurance contract liabilities, net of related Deferred AcquisitionCost (DAC). Changes in expected claims that have occurred, but which have not been settled, arereflected by adjusting the liability for claims and future benefits. Any inadequacy is immediatelycharged to the statement of income by establishing an unexpired risk provision for losses arisingfrom the liability adequacy tests. The provision for unearned premiums is increased to the extentthat the future claims and expenses in respect of current insurance contracts exceed futurepremiums plus the current provision for unearned premiums.
Investments in SubsidiariesSubsidiaries pertain to entities over which the Group has control. The existence and effect ofpotential voting rights that are currently exercisable or convertible and qualitative criteria areconsidered when assessing whether the Group controls another entity (see Basis of Consolidation).In the Parent Company separate financial statements, investments in subsidiaries are accounted forunder equity method of accounting.
Investments in an Associate and Joint VenturesAssociates pertain to all entities over which the Group has significant influence. Significantinfluence is the power to participate in the financial and operating policy decisions of the investee,but is not control or joint control over those policies. Investment in an associate are accounted forunder equity method of accounting.
Under the equity method, the investments in an associate and joint ventures are carried in thestatement of financial position at cost plus post-acquisition changes in the share in the net assets ofthe associates and joint ventures. The statement of comprehensive income reflects the share of the

- 19 -
*SGVFS021357*
results of operations of the associates and joint ventures. When there has been a changerecognized in the investee’s other comprehensive income, the Group recognizes its share of anychanges and discloses this, when applicable, in the other comprehensive income in the statementof comprehensive income. Profits and losses arising from transactions between the Group and theassociates are eliminated to the extent of the interest in the associates and joint ventures.
Upon loss of significant influence over the associate, the Group measures and recognizes anyretained investment at its fair value. Any difference between the carrying amount of the associateupon loss of significant influence and the fair value of the retained investment and proceeds fromdisposal is recognized in the statement of income.
Revenue RecognitionRevenue is recognized to the extent that it is probable that economic benefits will flow to theGroup and the revenue can be reliably measured. The Group assesses its revenue arrangementsagainst specific criteria in order to determine if it is acting as principal or agent. The Group hasconcluded that it is acting as a principal in all of its revenue arrangements except for brokeragetransactions. The following specific recognition criteria must also be met before revenue isrecognized:
Interest incomeFor all financial instruments measured at amortized cost and interest-bearing financial instrumentsclassified as FVPL and AFS investments, interest income is recorded using the EIR, which is therate that exactly discounts estimated future cash payments or receipts through the expected life ofthe financial instrument or a shorter period, where appropriate, to the net carrying amount of thefinancial asset or financial liability. The calculation takes into account all contractual terms of thefinancial instrument (for example, prepayment options), includes any fees or incremental coststhat are directly attributable to the instrument and are an integral part of the EIR, but not futurecredit losses. The adjusted carrying amount is calculated based on the original EIR. The changein carrying amount is recorded as ‘Interest income’. Once the recorded value of a financial assetor group of similar financial assets has been reduced due to an impairment loss, interest incomecontinues to be recognized using the original EIR applied to the new carrying amount.
Service fees and commission incomeThe Group earns fee and commission income from diverse range of services it provides to itscustomers. Fee income can be divided into the following two categories:
a) Fee income earned from services that are provided over a certain period of timeFees earned for the provision of services over a period of time are accrued over that period.These fees include investment fund fees, custodian fees, fiduciary fees, credit-related fees,trust fees, portfolio and other management fees, and advisory fees. However, commitmentfees for loans that are likely to be drawn down are deferred (together with any incrementalcosts) and recognized as an adjustment to the EIR of the loan.
b) Bancassurance feesNon-refundable access fees are recognized on a straight-line basis over the term of the periodof the provision of the access.
Milestone fees or variable and fixed earn-out fees are recognized in reference to the stage ofachievement of the milestones.

- 20 -
*SGVFS021357*
c) Fee income from providing transaction servicesFees arising from negotiating or participating in the negotiation of a transaction for a thirdparty - such as the arrangement of the acquisition of shares or other securities or the purchaseor sale of businesses - are recognized on completion of the underlying transaction.
Fees or components of fees that are linked to a certain performance are recognized afterfulfilling the corresponding criteria. These fees include underwriting fees, corporate financefees, remittance fees, brokerage fees, commissions, deposit-related and other credit-relatedfees. Loan syndication fees are recognized in the statement of income when the syndicationhas been completed and the Group retains no part of the loans for itself or retains part at thesame EIR as the other participants.
Interchange fee and revenue from rewards redeemed‘Interchange fees’ are taken up as income under ‘Service fees and commission income’ uponreceipt from member establishments of charges arising from credit availments by the Group’scardholders. These discounts are computed based on certain agreed rates and are deducted fromamounts remitted to the member establishments.
The Group operates a loyalty points program which allows customers to accumulate points whenthey purchase from member establishments using the issued card of the Group. The points canthen be redeemed for free products subject to a minimum number of points being redeemed.Consideration received is allocated between the discounts earned, interchange fee and the pointsearned, with the consideration allocated to the points equal to its fair value. The fair value isdetermined by applying statistical analysis. The fair value of the points issued is deferred andrecognized as revenue when the points are redeemed. The deferred balance is included under‘Other Liabilities’ in the statement of financial position.
Commissions earned on credit cardsCommissions earned are taken up as income upon receipt from member establishments of chargesarising from credit availments by credit cardholders. These commissions are computed based oncertain agreed rates and are deducted from amounts remittable to member establishments.
Purchases by the credit cardholders, collectible on installment basis, are recorded at the cost of theitems purchased plus certain percentage of cost. The excess over cost is credited to ‘Unearned andother deferred income’ and is shown as a deduction from ‘Loans and Receivables’ in the statementof financial position. The unearned and other deferred income is taken up to income over theinstallment terms and is computed using the effective interest method.
Commission earned on reinsuranceReinsurance commissions are recognized as revenue over the period of the contracts using the 24th
method except for marine cargo where the provision for unearned premiums pertain to thepremiums for the last months of the year. The portion of the commissions that relates to theunexpired periods of the policies at the end of the reporting period is accounted for as ‘Insurancecontract liabilities.’
Dividend incomeDividend income is recognized when the Group’s right to receive payment is established.
Trading and investment securities gains - net‘Trading and investment securities gains - net’ includes results arising from trading activities, allgains and losses from changes in fair value of financial assets and financial liabilities at FVPL andgains and losses from disposal of AFS investments.

- 21 -
*SGVFS021357*
Rental incomeRental income arising on leased properties is accounted for on a straight-line basis over the leaseterms of ongoing leases and is recorded in the statement of income under ‘Miscellaneous income’.
Income on direct financing leases and receivables financedIncome of the Group on loans and receivables financed is recognized using the effective interestmethod.
Unearned discounts included under ‘Unearned and other deferred income’ which are amortizedover the term of the note or lease using the effective interest method consist of:
∂ transaction and finance fees on finance leases and loans and receivables financed with long-term maturities; and
∂ excess of the aggregate lease rentals plus the estimated residual value of the leased equipmentover its cost.
Premiums revenueGross insurance written premiums comprise the total premiums receivable for the whole period ofcover provided by contracts entered into during the accounting period. Premiums include anyadjustments arising in the accounting period for premiums receivable in respect of businesswritten in prior periods. Premiums from short-duration insurance contracts are recognized asrevenue over the period of the contracts using the 24th method except for marine cargo where theprovision for unearned premiums pertains to the premiums for the last two months of the year.The portion of the premiums written that relate to the unexpired periods of the policies at end ofreporting period are accounted for as provision for unearned premiums and presented as part of‘Other Liabilities’ in the consolidated statement of financial position. The related reinsurancepremiums ceded that pertain to the unexpired periods at the end of the reporting periods areaccounted for as deferred reinsurance premiums shown as part of ‘Other Assets’ in theconsolidated statement of financial position. The net changes in these accounts between ends ofthe reporting periods are credited to or charged against the consolidated statement of income forthe period.
Other incomeIncome from sale of services is recognized upon rendition of the service. Income from sale ofproperties is recognized upon completion of the earning process and when the collectability of thesales price is reasonably assured.
ExpensesExpenses encompass losses as well as those expenses that arise in the course of the ordinaryactivities of the Group. Expenses are recognized when incurred.
Taxes and licensesThis includes all other taxes, local and national, including gross receipts taxes (GRT),documentary stamp taxes, real estate taxes, licenses and permit fees that are recognized whenincurred.
Policy LoansPolicy loans included under loans and receivables are carried at their unpaid balances plus accruedinterest and are fully secured by the policy values on which the loans are made.

- 22 -
*SGVFS021357*
ReinsuranceThe Group cedes insurance risk in the normal course of business. Reinsurance assets representbalances due from reinsurance companies. Recoverable amounts are estimated in a mannerconsistent with the outstanding claims provision and are in accordance with the reinsurancecontract. When claims are paid, such reinsurance assets are reclassified to ‘Accounts receivable’.
Ceded reinsurance arrangements do not relieve the Group from its obligations to policyholders.
The Group also assumes reinsurance risk in the normal course of business for insurance contracts.Premiums and claims on assumed reinsurance are recognized as income and expenses in the samemanner as they would be if the reinsurance were considered direct business, taking into accountthe product classification of the reinsured business. Reinsurance liabilities represent balances dueto ceding companies. Amounts payable are estimated in a manner consistent with the associatedreinsurance contract.
Premiums and claims are presented on a gross basis for both ceded and assumed reinsurance.
Reinsurance assets or liabilities are derecognized when the contractual rights are extinguished orexpired or when the contract is transferred to another party.
When the Group enters into a proportional treaty reinsurance agreement for ceding out itsinsurance business, the Group initially recognizes a liability at transaction price. Subsequent toinitial recognition, the portion of the amount initially recognized as a liability which is presentedas ‘Other Liabilities’ in the consolidated statement of financial position will be withheld andrecognized as Funds held for reinsurers and included as part of the ‘Other Liabilities’ in theconsolidated statement of financial position. The amount withheld is generally released after ayear.
Deferred Acquisition CostCommission and other acquisition costs incurred during the financial period that vary with and arerelated to securing new insurance contracts and/or renewing existing insurance contracts, butwhich relates to subsequent financial periods, are deferred to the extent that they are recoverableout of future revenue margins. All other acquisition costs are recognized as an expense whenincurred.
Subsequent to initial recognition, these costs are amortized using the 24thmethod except for marinecargo where the DAC pertains to the commissions for the last two months of the year.Amortization is charged to ‘Service fees and commission expense’ in the consolidated statementof income. The unamortized acquisition costs are shown as ‘Deferred acquisition costs’ in theassets section of the consolidated statement of financial position.
An impairment review is performed at each end of the reporting period or more frequently whenan indication of impairment arises. The carrying value is written down to the recoverable amountand the impairment loss is charged to the consolidated statement of income. The DAC is alsoconsidered in the liability adequacy test for each reporting period.
Property and EquipmentLand is stated at cost less any impairment in value and depreciable properties such as buildings,long-term leasehold land, leasehold improvements, and furniture, fixture and equipment are statedat cost less accumulated depreciation and amortization and any impairment in value.

- 23 -
*SGVFS021357*
The initial cost of property and equipment consists of its purchase price, including import duties,taxes and any directly attributable costs of bringing the asset to its working condition and locationfor its intended use.
Expenditures incurred after items of property and equipment have been put into operation, such asrepairs and maintenance are normally charged against operations in the period in which the costsare incurred. In situations where it can be clearly demonstrated that the expenditures have resultedin an increase in the future economic benefits expected to be obtained from the use of an item ofproperty and equipment beyond its originally assessed standard of performance, the expendituresare capitalized as an additional cost of property and equipment.
Depreciation is computed using the straight-line method over the estimated useful lives of therespective assets. Long-term leasehold land is amortized over the term of the lease. Leaseholdimprovements are amortized over lease term and the shorter of the terms of the covering leasesand the estimated useful lives of the improvements.
The estimated useful lives follow:
YearsBuildings 25 - 50Furniture, fixtures and equipment 5Long-term leasehold land 46 - 50Leasehold improvements 10 or the lease term,
whichever is shorter
The useful life and the depreciation and amortization method are reviewed periodically to ensurethat the period and the method of depreciation and amortization are consistent with the expectedpattern of economic benefits from items of property and equipment.
An item of property and equipment is derecognized upon disposal or when no future economicbenefits are expected from its use or disposal. Any gain or loss arising from derecognition of theasset (calculated as the difference between the net disposal proceeds and the carrying amount ofthe asset) is included in the statement of income in the period the asset is derecognized.
Investment PropertiesInvestment properties are measured initially at cost, including transaction costs. An investmentproperty acquired through an exchange transaction is measured at fair value of the asset acquiredunless the fair value of such an asset cannot be reliably measured in which case the investmentproperty acquired is measured at the carrying amount of asset given up. Any gain or loss onexchange is recognized in the statement of income under ‘Net gain on sale or exchange of assets’.
Foreclosed properties are classified under ‘Investment Properties’ upon:
a. entry of judgment in case of judicial foreclosure;b. execution of the Sheriff’s Certificate of Sale in case of extra-judicial foreclosure; orc. notarization of the Deed of Dacion in case of payment in kind (dacion en pago).
Subsequent to initial recognition, investment properties are carried at cost less accumulateddepreciation (for depreciable investment properties) and any impairment in value.

- 24 -
*SGVFS021357*
Depreciation is calculated on a straight-line basis using the remaining useful lives from the time ofacquisition of the depreciable investment properties ranging from 10 to 25 years.
Investment properties are derecognized when they have either been disposed of or when theinvestment property is permanently withdrawn from use and no future benefit is expected from itsdisposal. Any gains or losses on the retirement or disposal of an investment property arerecognized in the statement of income under ‘Net gain on sale or exchange of assets’ in the periodof retirement or disposal.
Expenditures incurred after the investment properties have been put into operations, such asrepairs and maintenance costs, are normally charged against income in the period in which thecosts are incurred.
Transfers are made to investment properties when, and only when, there is a change in useevidenced by ending of owner occupation, commencement of an operating lease to another partyor ending of construction or development. Transfers are made from investment properties when,and only when, there is a change in use evidenced by commencement of owner occupation orcommencement of development with a view to sale.
Other Properties AcquiredOther properties acquired include chattel mortgage properties acquired in settlement of loanreceivables. These are carried at cost, which is the fair value at recognition date, less accumulateddepreciation and any impairment in value.
The Group applies the cost model in accounting for other properties acquired. Depreciation iscomputed on a straight-line basis over the estimated useful life of five years. The estimated usefullife and the depreciation method are reviewed periodically to ensure that the period and themethod of depreciation are consistent with the expected pattern of economic benefits from itemsof other properties acquired.
The carrying values of other properties acquired are reviewed for impairment when events orchanges in circumstances indicate that the carrying value may not be recoverable. If any suchindication exists and where the carrying values exceed the estimated recoverable amount, theassets are written down to their recoverable amounts (see accounting policy on Impairment ofNonfinancial Assets).
Intangible AssetsIntangible assets acquired separately are measured on initial recognition at cost. The cost ofintangible assets acquired in a business combination is their fair value at the date of acquisition.Following initial recognition, intangible assets are carried at cost less any accumulatedamortization and accumulated impairment losses. Internally generated intangibles, excludingcapitalized development costs, are not capitalized and the related expenditure is reflected in profitor loss in the period in which the expenditure is incurred.
The useful lives of intangible assets are assessed as either finite or indefinite.
Intangible assets with finite lives are amortized over the respective useful lives and assessed forimpairment whenever there is an indication that the intangible asset may be impaired.
The amortization period and the amortization method for an intangible asset with a finite usefullife are reviewed at least at the end of each reporting period. Changes in the expected useful lifeor the expected pattern of consumption of future economic benefits embodied in the asset are

- 25 -
*SGVFS021357*
considered to modify the amortization period or method, as appropriate, and are treated as changesin accounting estimates. The amortization expense on intangible assets with finite lives isrecognized in the statement of income as the expense category that is consistent with the functionof the intangible assets.
Intangible assets with indefinite useful lives are not amortized, but are tested for impairmentannually, either individually or at the CGU level. The assessment of indefinite life is reviewedannually to determine whether the indefinite life continues to be supportable. If not, the change inuseful life from indefinite to finite is made on a prospective basis.
Gains or losses arising from derecognition of an intangible asset are measured as the differencebetween the net disposal proceeds and the carrying amount of the asset and are recognized in thestatement of income when the asset is derecognized.
Software costsSoftware costs, included in ‘Intangible Assets’, are capitalized on the basis of the cost incurred toacquire and bring to use the specific software. These costs are amortized over five years on astraight-line basis. The estimated useful life and the amortization method are reviewedperiodically to ensure that the period and the method of amortization are consistent with theexpected pattern of economic benefits from the software. Costs associated with maintaining thecomputer software programs are recognized as expense when incurred.
Customer relationship and core deposit intangiblesCustomer relationship intangibles (CRI) and core deposit intangibles (CDI) are the intangibleassets acquired by the Group through business combination. These intangible assets are initiallymeasured at their fair value at the date of acquisition. The fair value of these intangible assetsreflects expectations about the probability that the expected future economic benefits embodied inthe asset will flow to the Group.
Following initial recognition, customer relationship and core deposit are measured at cost lessaccumulated amortization and any accumulated impairment losses. Customer relationship relatedto the commercial loans business is amortized on a straight-line basis over its useful life of 3 yearswhile core deposit is amortized on a straight-line basis over its useful life of 10 years.
Impairment of Nonfinancial AssetsProperty and equipment, investment properties, intangible assets and other properties acquiredAt each reporting date, the Group assesses whether there is any indication that its property andequipment, investment properties, intangibles and other properties acquired with finite useful livesmay be impaired. When an indicator of impairment exists or when an annual impairment testingfor an asset is required, the Group makes a formal estimate of recoverable amount. Recoverableamount is the higher of an asset’s fair value less costs to sell and its value in use and is determinedfor an individual asset, unless the asset does not generate cash inflows that are largely independentof those from other assets or groups of assets, in which case the recoverable amount is assessed aspart of the CGU to which it belongs.
Where the carrying amount of an asset exceeds its recoverable amount, the asset is consideredimpaired and is written down to its recoverable amount. In assessing value in use, the estimatedfuture cash flows are discounted to their present value using a pre-tax discount rate that reflectscurrent market assessments of the time value of money and the risks specific to the asset.

- 26 -
*SGVFS021357*
An impairment loss is charged against operations in the period in which it arises. An assessmentis made at each reporting date as to whether there is any indication that previously recognizedimpairment losses may no longer exist or may have decreased. If such indication exists, therecoverable amount is estimated. A previously recognized impairment loss is reversed only ifthere has been a change in the estimates used to determine the asset’s recoverable amount sincethe last impairment loss was recognized. If that is the case, the carrying amount of the asset isincreased to its recoverable amount. That increased amount cannot exceed the carrying amountthat would have been determined, net of depreciation and amortization, had no impairment lossbeen recognized for the asset in prior years. Such reversal is recognized in the statement ofincome. After such reversal, the depreciation and amortization expense is adjusted in futureperiod to allocate the asset’s revised carrying amount, less any residual value, on a systematicbasis over its remaining life.
Investments in subsidiaries and an associateThe Parent Company assesses at each reporting date whether there is any indication that itsinvestments in subsidiaries and an associate may be impaired. If any impairment indication exists,the Parent Company estimates the asset’s recoverable amount. An asset’s recoverable amount isthe higher of an asset’s or CGU’s fair value less costs to sell and its value in use. Where thecarrying amount of an asset or CGU exceeds its recoverable amount, the asset is consideredimpaired and is written down to its recoverable amount.
GoodwillGoodwill is reviewed for impairment, annually or more frequently if events or changes incircumstances indicate that the carrying value may be impaired.
Impairment is determined for goodwill by assessing the recoverable amount of the CGU (or groupof CGUs) to which the goodwill relates. Where the recoverable amount of the CGU (or group ofCGUs) is less than the carrying amount of the CGU (or group of CGUs) to which goodwill hasbeen allocated (or to the aggregate carrying amount of a group of CGUs to which the goodwillrelates but cannot be allocated), an impairment loss is recognized immediately in the statement ofincome. Impairment losses relating to goodwill cannot be reversed for subsequent increases in itsrecoverable amount in future periods. The Group performs its annual impairment test of goodwillevery fourth quarter, or more frequently if events or changes in circumstances indicate that thecarrying value may be impaired.
LeasesThe determination of whether an arrangement is, or contains a lease is based on the substance ofthe arrangement and requires an assessment of whether the fulfillment of the arrangement isdependent on the use of a specific asset or assets and the arrangement conveys a right to use theasset. A reassessment is made after inception of the lease only if one of the following applies:
a. there is a change in contractual terms, other than a renewal or extension of the arrangement;b. a renewal option is exercised or extension granted, unless that term of the renewal or
extension was initially included in the lease term;c. there is a change in the determination of whether fulfillment is dependent on a specified asset;
ord. there is a substantial change to the asset.
Where a reassessment is made, lease accounting shall commence or cease from the date when thechange in circumstances gave rise to the reassessment for scenarios a, c or d above, and at the dateof renewal or extension period for scenario b.

- 27 -
*SGVFS021357*
Group as lesseeFinance leases, which transfer to the Group substantially all the risks and benefits incidental toownership of the leased item, are capitalized at the inception of the lease at the fair value of theleased property or, if lower, at the present value of the minimum lease payments and included in‘Property and Equipment’ account with the corresponding liability to the lessor included in ‘OtherLiabilities’ account. Lease payments are apportioned between the finance charges and reductionof the lease liability so as to achieve a constant rate of interest on the remaining balance of theliability. Finance charges are charged directly to ‘Interest expense’.
Capitalized leased assets are depreciated over the shorter of the estimated useful lives of the assetsor the respective lease terms, if there is no reasonable certainty that the Group will obtainownership by the end of the lease term.
Leases where the lessor retains substantially all the risks and benefits of ownership of the asset areclassified as operating leases. Operating lease payments are recognized as an expense in thestatement of income on a straight-line basis over the lease term.
Group as lessorFinance leases, where the Group transfers substantially all the risks and benefits incidental toownership of the leased item to the lessee, are included in the statement of financial position under‘Loans and Receivables’ account. A lease receivable is recognized at an amount equivalent to thenet investment (asset cost) in the lease. All income resulting from the receivable is included in‘Interest income’ in the statement of income.
Leases where the Group does not transfer substantially all the risks and benefits of ownership ofthe assets are classified as operating leases. Lease payments received are recognized as an incomein the statement of income on a straight line basis over the lease term. Initial direct costs incurredin negotiating operating leases are added to the carrying amount of the leased asset and recognizedover the lease term on the same basis as the rental income. Contingent rents are recognized asrevenue in the period in which they are earned.
Residual Value of Leased Assets and Deposits on Finance LeasesThe residual value of leased assets, which approximates the amount of guaranty deposit paid bythe lessee at the inception of the lease, is the estimated proceeds from the sale of the leased asset atthe end of the lease term. At the end of the lease term, the residual value of the leased asset isgenerally applied against the guaranty deposit of the lessee when the lessee decides to buy theleased asset.
Retirement BenefitsDefined benefit planThe net defined benefit liability or asset is the aggregate of the present value of the defined benefitobligation at the end of the reporting period reduced by the fair value of plan assets and adjustedfor any effect of limiting a net defined benefit asset to the asset ceiling, if any. The asset ceiling isthe present value of any economic benefits available in the form of refunds from the plan orreductions in future contributions to the plan.
The cost of providing benefits under the defined benefit plans is actuarially determined using theprojected unit credit method.

- 28 -
*SGVFS021357*
Defined benefit costs comprise the following:
a. service cost;b. net interest on the net defined benefit liability or asset; andc. remeasurements of net defined benefit liability or asset.
Service costs which include current service costs, past service costs and gains or losses on non-routine settlements are recognized as expense in profit or loss. Past service costs are recognizedwhen plan amendment or curtailment occurs. These amounts are calculated periodically byindependent qualified actuaries.
Net interest on the net defined benefit liability or asset is the change during the period in the netdefined benefit liability or asset that arises from the passage of time which is determined byapplying the discount rate based on government bonds to the net defined benefit liability or asset.Net interest on the net defined benefit liability or asset is recognized as expense or income in thestatement of income.
Remeasurements comprising actuarial gains and losses, return on plan assets and any change inthe effect of the asset ceiling (excluding net interest on defined benefit liability) are recognizedimmediately in OCI in the period in which they arise. Remeasurements are not reclassified toprofit or loss in subsequent periods. Plan assets are assets that are held by a long-term employeebenefit fund or qualifying insurance policies. Plan assets are not available to the creditors of theGroup, nor can they be paid directly to the Group. Fair value of plan assets is based on marketprice information. When no market price is available, the fair value of plan assets is estimated bydiscounting expected future cash flows using a discount rate that reflects both the risk associatedwith the plan assets and the maturity or expected disposal date of those assets (or, if they have nomaturity, the expected period until the settlement of the related obligations).
The Group’s right to be reimbursed of some or all of the expenditure required to settle a definedbenefit obligation is recognized as a separate asset at fair value when and only whenreimbursement is virtually certain.
Employee leave entitlementEmployee entitlements to annual leave are recognized as a liability when they are accrued to theemployees. The undiscounted liability for leave expected to be settled wholly before twelvemonths after the end of the annual reporting period is recognized for services rendered byemployees up to the end of the reporting period. For leave entitlements expected to be settled formore than twelve months after the reporting date, the estimated liability is actuarially determinedand reported under ‘Accrued Taxes, Interest and Other Expenses’ in the statement of financialposition.
ProvisionsProvisions are recognized when the Group has a present obligation (legal or constructive) as aresult of a past event and it is probable that an outflow of assets embodying economic benefits willbe required to settle the obligation and a reliable estimate can be made of the amount of theobligation. When the Group expects some or all of a provision to be reimbursed, for example,under an insurance contract, the reimbursement is recognized as a separate asset but only when thereimbursement is virtually certain. The expense relating to any provision is presented in thestatement of income, net of any reimbursement. If the effect of the time value of money ismaterial, provisions are determined by discounting the expected future cash flows at a pre-tax ratethat reflects current market assessments of the time value of money and, where appropriate, therisks specific to the liability.

- 29 -
*SGVFS021357*
When discounting is used, the increase in the provision due to the passage of time is recognized asan interest expense.
Contingent Liabilities and Contingent AssetsContingent liabilities are not recognized in the financial statements but are disclosed unless thepossibility of an outflow of assets embodying economic benefits is remote. Contingent assets arenot recognized but are disclosed in the financial statements when an inflow of economic benefitsis probable.
Income TaxesIncome tax on profit and loss for the year comprises current and deferred tax. Income tax isdetermined in accordance with tax laws and is recognized in the statement of income, except to theextent that it relates to items directly recognized in OCI.
Current taxCurrent tax assets and liabilities for the current periods are measured at the amount expected to berecovered from or paid to the taxation authorities. The tax rates and tax laws used to compute theamount are those that are enacted or substantively enacted at the reporting date.
Deferred taxDeferred tax is provided, using the balance sheet liability method, on all temporary differences atthe reporting date between the tax bases of assets and liabilities and their carrying amounts forfinancial reporting purposes.
Deferred tax liabilities are recognized for all taxable temporary differences, including assetrevaluations. Deferred tax assets are recognized for all deductible temporary differences,carryforward of unused tax credits from the excess of minimum corporate income tax (MCIT)over the regular corporate income tax (RCIT), and unused net operating loss carryover (NOLCO),to the extent that it is probable that sufficient taxable income will be available against which thedeductible temporary differences and carryforward of unused tax credits from MCIT and unusedNOLCO can be utilized. Deferred tax, however, is not recognized on temporary differences thatarise from the initial recognition of an asset or liability in a transaction that is not a businesscombination and, at the time of the transaction, affects neither the accounting income nor taxableincome.
Deferred tax liabilities are not provided on non-taxable temporary differences associated withinvestments in domestic subsidiaries and an associate. With respect to investments in foreignsubsidiaries and associates, deferred tax liabilities are recognized except where the timing of thereversal of the temporary difference can be controlled and it is probable that the temporarydifference will not reverse in the foreseeable future.
The carrying amount of deferred tax assets is reviewed at each reporting date and reduced to theextent that it is no longer probable that sufficient future taxable income will be available to allowall or part of the deferred income tax asset to be utilized. Unrecognized deferred tax assets arereassessed at each reporting date and are recognized to the extent that it has become probable thatfuture taxable income will allow the deferred tax asset to be recovered.
Deferred tax assets and liabilities are measured at the tax rates that are applicable to the periodwhen the asset is realized or the liability is settled, based on tax rates (and tax laws) that have beenenacted or substantively enacted at the reporting date.

- 30 -
*SGVFS021357*
Current tax and deferred tax relating to items recognized directly in OCI are also recognized inOCI and not in the statement of income.
In the consolidated financial statements, deferred tax assets and liabilities are offset if a legallyenforceable right exists to set off current tax assets against current tax liabilities and deferred taxesrelated to the same taxable entity and the same taxation authority.
Parent Company Shares Held by a SubsidiaryOwn equity instruments which are acquired by subsidiaries (treasury shares) are deducted fromequity and accounted for at weighted average cost. No gain or loss is recognized in theconsolidated statement of income on the purchase, sale, issue or cancellation of the ParentCompany’s own equity instruments.
Earnings per ShareBasic earnings per share (EPS) is computed by dividing net income for the period attributable tocommon shareholders by the weighted average number of common shares outstanding during theperiod after giving retroactive effect to stock dividends declared and stock rights exercised duringthe period, if any. Diluted EPS is calculated by dividing the aggregate of net income attributableto common shareholders by the weighted average number of common shares outstanding duringthe period adjusted for the effects of any dilutive shares.
DividendsDividends on common shares are recognized as a liability and deducted from equity whenapproved by the respective BOD of the Parent Company and subsidiaries. Dividends for theperiod that are approved after the reporting date are dealt with as an event after the reporting date.
Share-based PaymentEmployees of the Parent Company receive remuneration in the form of share-based payments,where employees render services as consideration for equity instruments. The cost of equity-settled transactions is determined by the fair value at the date when the grant is made. That cost isrecognized in “Compensation and fringe benefits”, together with a corresponding increase inequity (other capital reserves), over the period in which the service is fulfilled. The cumulativeexpense recognized for equity settled transactions at each reporting date until the vesting datereflects to the extent to which the vesting period has expired and the Parent Company’s bestestimate of the number of equity instruments that will ultimately vest. The expense or credit in thestatement of income for a period represents the movement in the cumulative expense recognizedas at the beginning and end of the period.
Debt Issue CostsIssuance, underwriting and other related expenses incurred in connection with the issuance of debtinstruments (other than debt instruments designated at FVPL) are deferred and amortized over theterms of the instruments using the effective interest method. Unamortized debt issuance costs areincluded in the measurement of the related carrying value of the debt instruments in the statementof financial position.
Borrowing CostsBorrowing costs are recognized as expense in the year in which these costs are incurred.Borrowing costs consist of interest expense calculated using the effective interest methodcalculated in accordance with PAS 39 that the Group incurs in connection with borrowing offunds.

- 31 -
*SGVFS021357*
Events after the Reporting DateAny post-year-end event that provides additional information about the Group’s position at thereporting date (adjusting event) is reflected in the financial statements. Post-year-end events thatare not adjusting events, if any, are disclosed when material to the financial statements.
Segment ReportingThe Group’s operating businesses are organized and managed separately according to the natureof the products and services provided, with each segment representing a strategic business unitthat offers different products and serves different markets. Refer to Note 6 for the detaileddisclosure on segment information.
Fiduciary ActivitiesAssets and income arising from fiduciary activities together with related undertakings to returnsuch assets to customers are excluded from the financial statements where the Parent Companyacts in a fiduciary capacity such as nominee, trustee or agent.
EquityCapital stock is measured at par value for all shares issued and outstanding. When the shares aresold at a premium, the difference between the proceeds and the par value is credited to ‘CapitalPaid in Excess of Par Value’ account. Direct costs incurred related to equity issuance, such asunderwriting, accounting and legal fees, printing costs and taxes are chargeable to ‘Capital Paid inExcess of Par Value’ account. If the ‘Capital Paid in Excess of Par Value’ is not sufficient, theexcess is charged against the ‘Surplus’.
‘Surplus’ represents accumulated earnings (losses) of the Group less dividends declared.
Equity ReservesThe reserves recorded in equity in the statement of financial position include:
‘Remeasurement Losses on Retirement Plan’ which pertains to remeasurement comprisingactuarial losses on the present value of the retirement obligation, net of return on plan assets.
‘Accumulated Translation Adjustment’ which is used to record exchange differences arising fromthe translation of the FCDU accounts and foreign operations (i.e. overseas branches andsubsidiaries) to Philippine peso.
‘Net Unrealized Gain (Loss) on Available-for-Sale Investments’ reserve which comprises changesin fair value of AFS investments.
Future Changes in Accounting Policies
Standards issued but not yet effective up to the date of issuance of the Group’s financialstatements are listed below. This listing consists of standards and interpretations issued, which theGroup reasonably expects to be applicable at a future date. The Group intends to adopt thesestandards when they become effective.

- 32 -
*SGVFS021357*
Effective beginning on or after January 1, 2017
PFRS 12, Clarification of the Scope of the Standard (Part of Annual Improvements to PFRSs 2014- 2016 Cycle) (Amendments)The amendments clarify that the disclosure requirements in PFRS 12, other than those relating tosummarized financial information, apply to an entity’s interest in a subsidiary, a joint venture oran associate (or a portion of its interest in a joint venture or an associate) that is classified (orincluded in a disposal group that is classified) as held for sale.
The amendments do not have any impact on the Group’s financial position and results ofoperation. The Group will include the required disclosures in its 2017 consolidated financialstatements.
PAS 7, Statement of Cash Flows, Disclosure Initiative (Amendments)The amendments to PAS 7 require an entity to provide disclosures that enable users of financialstatements to evaluate changes in liabilities arising from financing activities, including bothchanges arising from cash flows and non-cash changes (such as foreign exchange gains or losses).On initial application of the amendments, entities are not required to provide comparativeinformation for preceding periods. Early application of the amendments is permitted.
Application of amendments will result in additional disclosures in the 2017 consolidated financialstatements of the Group.
PAS 12, Income Taxes, Recognition of Deferred Tax Assets for Unrealized Losses (Amendments)The amendments clarify that an entity needs to consider whether tax law restricts the sources oftaxable profits against which it may make deductions on the reversal of that deductible temporarydifference. Furthermore, the amendments provide guidance on how an entity should determinefuture taxable profits and explain the circumstances in which taxable profit may include therecovery of some assets for more than their carrying amount.
Entities are required to apply the amendments retrospectively. However, on initial application ofthe amendments, the change in the opening equity of the earliest comparative period may berecognized in opening retained earnings (or in another component of equity, as appropriate),without allocating the change between opening retained earnings and other components of equity.Entities applying this relief must disclose that fact. Early application of the amendments ispermitted.
These amendments are not expected to have any impact on the Group.
Effective beginning on or after January 1, 2018
PFRS 2, Share-based Payment, Classification and Measurement of Share-based PaymentTransactions (Amendments)The amendments to PFRS 2 address three main areas: the effects of vesting conditions on themeasurement of a cash-settled share-based payment transaction; the classification of a share-basedpayment transaction with net settlement features for withholding tax obligations; and theaccounting where a modification to the terms and conditions of a share-based payment transactionchanges its classification from cash settled to equity settled.

- 33 -
*SGVFS021357*
On adoption, entities are required to apply the amendments without restating prior periods, butretrospective application is permitted if elected for all three amendments and if other criteria aremet. Early application of the amendments is permitted.
The Group is assessing the potential effect of the amendments on its consolidated financialstatements.
PFRS 4, Insurance Contracts, Applying PFRS 9, Financial Instruments, with PFRS 4(Amendments)The amendments address concerns arising from implementing PFRS 9, the new financialinstruments standard before implementing the forthcoming insurance contracts standard. Theyallow entities to choose between the overlay approach and the deferral approach to deal with thetransitional challenges. The overlay approach gives all entities that issue insurance contracts theoption to recognize in other comprehensive income, rather than profit or loss, the volatility thatcould arise when PFRS 9 is applied before the new insurance contracts standard is issued. On theother hand, the deferral approach gives entities whose activities are predominantly connected withinsurance an optional temporary exemption from applying PFRS 9 until the earlier of applicationof the forthcoming insurance contracts standard or January 1, 2021.
The overlay approach and the deferral approach will only be available to an entity if it has notpreviously applied PFRS 9.
The Group is assessing which approach it will use and the potential impact of the chosen approachin its consolidated financial statements.
PFRS 9, Financial InstrumentsPFRS 9 reflects all phases of the financial instruments project and replaces PAS 39, FinancialInstruments: Recognition and Measurement, and all previous versions of PFRS 9. The standardintroduces new requirements for classification and measurement, impairment, and hedgeaccounting. PFRS 9 is effective for annual periods beginning on or after January 1, 2018, withearly application permitted. Retrospective application is required, but providing comparativeinformation is not compulsory. For hedge accounting, the requirements are generally appliedprospectively, with some limited exceptions.
The adoption of PFRS 9 will have an effect on the classification and measurement of the Group’sfinancial assets and impairment methodology for financial assets, but will have no impact on theclassification and measurement of the Group’s financial liabilities. The adoption will also have aneffect on the Group’s application of hedge accounting and on the amount of its credit losses. TheGroup is currently assessing the impact of adopting this standard.
PFRS 15, Revenue from Contracts with CustomersPFRS 15 establishes a new five-step model that will apply to revenue arising from contracts withcustomers. Under PFRS 15, revenue is recognized at an amount that reflects the consideration towhich an entity expects to be entitled in exchange for transferring goods or services to a customer.The principles in PFRS 15 provide a more structured approach to measuring and recognizingrevenue.
The new revenue standard is applicable to all entities and will supersede all current revenuerecognition requirements under PFRSs. Either a full or modified retrospective application isrequired for annual periods beginning on or after January 1, 2018.
The Group is currently assessing the impact of adopting this standard.

- 34 -
*SGVFS021357*
PAS 28, Measuring an Associate or Joint Venture at Fair Value (Part of Annual Improvements toPFRSs 2014 - 2016 Cycle) (Amendments)The amendments clarify that an entity that is a venture capital organization, or other qualifyingentity, may elect, at initial recognition on an investment-by-investment basis, to measure itsinvestments in associates and joint ventures at fair value through profit or loss. They also clarifythat if an entity that is not itself an investment entity has an interest in an associate or joint venturethat is an investment entity, the entity may, when applying the equity method, elect to retain thefair value measurement applied by that investment entity associate or joint venture to theinvestment entity associate’s or joint venture’s interests in subsidiaries. This election is madeseparately for each investment entity associate or joint venture, at the later of the date on which (a)the investment entity associate or joint venture is initially recognized; (b) the associate or jointventure becomes an investment entity; and (c) the investment entity associate or joint venture firstbecomes a parent. The amendments should be applied retrospectively, with earlier applicationpermitted.
PAS 40, Investment Property, Transfers of Investment Property (Amendments)The amendments clarify when an entity should transfer property, including property underconstruction or development into, or out of investment property. The amendments state that achange in use occurs when the property meets, or ceases to meet, the definition of investmentproperty and there is evidence of the change in use. A mere change in management’s intentions forthe use of a property does not provide evidence of a change in use. The amendments should beapplied prospectively to changes in use that occur on or after the beginning of the annual reportingperiod in which the entity first applies the amendments. Retrospective application is onlypermitted if this is possible without the use of hindsight.
Philippine Interpretation IFRIC-22, Foreign Currency Transactions and Advance ConsiderationThe interpretation clarifies that in determining the spot exchange rate to use on initial recognitionof the related asset, expense or income (or part of it) on the derecognition of a non-monetary assetor non-monetary liability relating to advance consideration, the date of the transaction is the dateon which an entity initially recognizes the nonmonetary asset or non-monetary liability arisingfrom the advance consideration. If there are multiple payments or receipts in advance, then theentity must determine a date of the transactions for each payment or receipt of advanceconsideration. The interpretation may be applied on a fully retrospective basis. Entities may applythe interpretation prospectively to all assets, expenses and income in its scope that are initiallyrecognized on or after the beginning of the reporting period in which the entity first applies theinterpretation or the beginning of a prior reporting period presented as comparative information inthe financial statements of the reporting period in which the entity first applies the interpretation.
Effective beginning on or after January 1, 2019
PFRS 16, LeasesUnder the new standard, lessees will no longer classify their leases as either operating or financeleases in accordance with PAS 17, Leases. Rather, lessees will apply the single-asset model. Underthis model, lessees will recognize the assets and related liabilities for most leases on their balancesheets, and subsequently, will depreciate the lease assets and recognize interest on the leaseliabilities in their profit or loss. Leases with a term of 12 months or less or for which theunderlying asset is of low value are exempted from these requirements.
The accounting by lessors is substantially unchanged as the new standard carries forward theprinciples of lessor accounting under PAS 17. Lessors, however, will be required to disclose moreinformation in their financial statements, particularly on the risk exposure to residual value.

- 35 -
*SGVFS021357*
Entities may early adopt PFRS 16 but only if they have also adopted PFRS 15. When adoptingPFRS 16, an entity is permitted to use either a full retrospective or a modified retrospectiveapproach, with options to use certain transition reliefs.
The Group is currently assessing the impact of adopting PFRS 16.
Deferred effectivity
PFRS 10 and PAS 28, Sale or Contribution of Assets between an Investor and its Associate orJoint Venture (Amendments)The amendments address the conflict between PFRS 10 and PAS 28 in dealing with the loss ofcontrol of a subsidiary that is sold or contributed to an associate or joint venture. The amendmentsclarify that a full gain or loss is recognized when a transfer to an associate or joint ventureinvolves a business as defined in PFRS 3, Business Combinations. Any gain or loss resulting fromthe sale or contribution of assets that does not constitute a business, however, is recognized only tothe extent of unrelated investors’ interests in the associate or joint venture
On January 13, 2016, the Financial Reporting Standards Council postponed the original effectivedate of January 1, 2016 of the said amendments until the International Accounting StandardsBoard has completed its broader review of the research project on equity accounting that mayresult in the simplification of accounting for such transactions and of other aspects of accountingfor associates and joint ventures.
3. Significant Accounting Judgments and Estimates
The preparation of the financial statements in compliance with PFRS requires the Group to makejudgments and estimates that affect the reported amounts of assets, liabilities, income andexpenses and disclosure of contingent assets and contingent liabilities. Future events may occurwhich will cause the assumptions used in arriving at the estimates to change. The effects of anychange in estimates are reflected in the financial statements as they become reasonablydeterminable.
Judgments and estimates are continually evaluated and are based on historical experience andother factors, including expectations of future events that are believed to be reasonable under thecircumstances.
Judgments(a) Leases
Operating leasesGroup as lesseeThe Group has entered into lease on premises it uses for its operations. The Group hasdetermined, based on the evaluation of the terms and conditions of the lease agreement(i.e., the lease does not transfer ownership of the asset to the lessee by the end of the leaseterm and lease term is not for the major part of the asset’s economic life), that the lessorretains all the significant risks and rewards of ownership of these properties.
Finance leasesGroup as lessorThe Group, as lessor, has entered into lease arrangements on real estate, various machineriesand other types of equipment. The Group has determined that it transfers all the significantrisks and rewards of ownership of these properties and so accounts for these leases as financelease.

- 36 -
*SGVFS021357*
(b) Fair value of financial instrumentsWhere the fair values of financial assets and financial liabilities recorded in the statement offinancial position cannot be derived from active markets, they are determined using valuationtechniques that include the use of mathematical models (Note 5). The input to these models istaken from observable markets where possible, but where this is not feasible, a degree ofjudgment is required in establishing fair values. The judgments include considerations ofliquidity and model inputs such as correlation and volatility for longer dated derivatives.
(c) ContingenciesThe Group is currently involved in legal proceedings. The estimate of the probable cost forthe resolution of claims has been developed in consultation with the aid of the outside legalcounsels handling the Group’s defense in these matters and is based upon an analysis ofpotential results. Management does not believe that the outcome of these matters will affectthe results of operations. It is probable, however, that future results of operations could bematerially affected by changes in the estimates or in the effectiveness of the strategies relatingto the proceedings (Note 35).
(d) Functional currencyPAS 21 requires management to use its judgment to determine the entity’s functional currencysuch that it most faithfully represents the economic effects of the underlying transactions,events and conditions that are relevant to the entity.
In making this judgment, the Group considers the following:
∂ the currency that mainly influences prices for financial instruments and services (this willoften be the currency in which prices for its financial instruments and services aredenominated and settled);
∂ the currency in which funds from financing activities are generated; and∂ the currency in which receipts from operating activities are usually retained.
(e) Assessment of control over entities for consolidationWhere the Parent Company does not have majority of the voting interest over an investee, itconsiders all relevant facts and circumstances in assessing whether it has control over theinvestee. This may include a contractual arrangement with the other voting shareholders ofthe investee or rights arising from other contractual arrangements which give power to theParent Company over the investee to affect its returns.
The Parent Company determined that it controls Oceanic Holding (BVI) Ltd. (OHBVI)through its combined voting rights of 70.56% which arises from its direct ownership of27.78% and voting rights of 42.78% assigned by certain stockholders of OHBVI to the ParentCompany through a voting trust agreement.
(f) Assessment of joint controlThe Parent Company has certain joint arrangements with real estate companies for thedevelopment of its investment properties into residential/condominium units. In assessingjoint control over these investees, the Parent Company assesses whether all the partiescollectively control the arrangement. Further, the Parent Company determines the relevantactivities of the arrangement and whether decisions around relevant activities requireunanimous consent. The Parent Company also considers the scope of decision-makingauthority of the real estate companies in accordance with their respective contractualarrangements.

- 37 -
*SGVFS021357*
The Parent Company determined that it has joint control over these joint arrangements on thebasis that even though the real estate companies are the designated operators of the jointarrangement, they are still bound by the contract that establishes joint control of theundertaking and they can only act in accordance with the authorities granted to them under thejoint venture agreement.
(g) Sale of Allianz-PNB Life Insurance, Inc.(APLII)Pursuant to the sale of APLII under a share purchase agreement, the Parent Company alsoentered into a distribution agreement with APLII where the Parent Company will allow APLIIto have exclusive access to the distribution network of the Parent Company and its subsidiary,PNB Savings Bank, over a period of 15 years.
The Group has determined based on its evaluation that the share purchase agreement anddistribution agreement have provisions referring to one another; making the distributionagreement an integral component of the sale transaction. Accordingly, the considerationreceived by the Parent Company was allocated between the sale of its ownership interest inAPLII and the Exclusive Distribution Right (see Note 12).
Estimates(a) Credit losses on loans and receivables
The Group reviews its impaired loans and receivables on a quarterly basis to assess whetheradditional provision for credit losses should be recorded in the consolidated statement ofincome. In particular, judgment by management is required in the estimation of the amountand timing of future cash flows when determining the level of required allowance. Suchestimates are based on assumptions about a number of factors and actual results may differ,resulting in future changes to the allowance. Estimated future cash flows of a collateralizedloan reflects the cash flows that may result from foreclosure less costs for obtaining andselling the collateral, whether or not foreclosure is probable. The Group takes into account thelatest available information of the borrower’s financial condition, industry risk and markettrends.
The present value of the estimated future cash flows is discounted at the financial asset’soriginal EIR. If a loan has a variable interest rate, the discount rate for measuring anyimpairment loss is the current EIR, adjusted for the original credit risk premium.
In addition to specific allowance against individually significant loans and receivables, theGroup also makes a collective impairment allowance against exposures which, although notspecifically identified as requiring a specific allowance, have a greater risk of default thanwhen originally granted. For the purpose of a collective impairment, loans and receivables aregrouped on the basis of their credit risk characteristics such as internal credit risk rating,collateral type, past-due status and term. Future cash flows in a group of financial assets thatare collectively evaluated for impairment are estimated on the basis of historical lossexperience for assets with credit risk characteristics similar to those in the Group.
Refer to Notes 10 and 15 for the carrying values of loans and receivables and receivable fromSPVs, respectively.
(b) Recognition of deferred tax assetsDeferred tax assets are recognized for all unused tax losses and temporary differences to theextent that it is probable that future taxable profit will be available against which the lossescan be utilized. Significant management judgment is required to determine the amount of

- 38 -
*SGVFS021357*
deferred tax assets that can be recognized, based upon the likely timing and level of futuretaxable income together with future tax planning strategies.
The Group and Parent Company’s estimates of future taxable income indicate that certaintemporary differences will be realized in the future. The amounts of recognized andunrecognized deferred tax assets are disclosed in Note 31.
(c) Present value of retirement obligationThe cost of defined benefit pension plan and other post-employment benefits is determinedusing actuarial valuations. The actuarial valuation involves making assumptions aboutdiscount rates, future salary increases, mortality rates and employee turnover. Due to thelong-term nature of these plans, such estimates are subject to significant uncertainty. Allassumptions are reviewed at each reporting date. The discount rate is based on zero-couponyield of government bonds with remaining maturity approximating the estimated averageduration of benefit payment. Future salary increases was based on the Group’s policy takinginto account the prevailing inflation rate. The mortality rate used is based on publiclyavailable mortality table modified accordingly with estimates of mortality improvements. Theemployee turnover is based on the Group’s most recent experience.
The fair value of plan assets is based on market price information. When no market price isavailable, the fair value of plan assets is estimated by discounting expected future cash flowsusing a discount rate that reflects both the risk associated with the plan assets and the maturityor expected disposal date of those assets.
The present value of retirement obligation and fair value of plan assets are disclosed inNote 29.
(d) Impairment of nonfinancial assets - property and equipment, investments in subsidiaries andan associate, investment properties, other properties acquired and intangiblesThe Parent Company assesses impairment on its investments in subsidiaries and an associatewhenever events or changes in circumstances indicate that the carrying amount of the assetmay not be recoverable. Among others, the factors that the Parent Company considersimportant which could trigger an impairment review on its investments in subsidiaries andassociate include the following:
∂ deteriorating or poor financial condition;∂ recurring net losses; and∂ significant changes on the technological, market, economic, or legal environment which
had an adverse effect on the subsidiary or associate during the period or in the near future,in which the subsidiary or associate operates.
The Group also assesses impairment on its nonfinancial assets (e.g., investment properties,property and equipment, other acquired properties and intangibles) and considers thefollowing impairment indicators:
∂ significant underperformance relative to expected historical or projected future operatingresults;
∂ significant changes in the manner of use of the acquired assets or the strategy for overallbusiness; and
∂ significant negative industry or economic trends.
- 39 -
*SGVFS021357*
An impairment loss is recognized whenever the carrying amount of an asset exceeds itsrecoverable amount. Except for investment properties and land and building whererecoverable amount is determined based on fair value less cost to sell, the recoverable amountof all other nonfinancial assets is determined based on the asset’s value in use computationwhich considers the present value of estimated future cash flows expected to be generatedfrom the continued use of the asset or group of assets. The Group is required to makeestimates and assumptions that can materially affect the carrying amount of the asset or groupof assets being assessed.
The carrying values of the Group’s property and equipment, investments in subsidiaries andan associate, investment properties, goodwill and intangible assets and other nonfinancialassets are disclosed in Notes 11, 12, 13, 14 and 15.
(e) Impairment of goodwillThe Group conducts an annual review for any impairment in the value of goodwill. Goodwillis written down for impairment where the recoverable amount is insufficient to support theircarrying value. The Group estimates the discount rate used for the computation of the netpresent value by reference to industry cost of capital. Future cash flows from the business areestimated based on the theoretical annual income of the relevant CGUs. Average growth rateis derived from the long-term Philippine growth rate. The recoverable amount of the CGU isdetermined based on a value-in-use calculation using cash flow projections from financialbudgets approved by senior management and BOD of the Parent Company covering athree-year period. The assumptions used in the calculation of value-in-use are sensitive toestimates of future cash flows from business, interest margin, discount rate and long-termgrowth rate used to project cash flows.
The carrying values of the Group’s goodwill and key assumptions used in determiningvalue-in-use are disclosed in Note 14.
(f) Valuation of insurance contractsEstimates have to be made both for the expected ultimate cost of claims reported and for theexpected ultimate cost of IBNR at the reporting date. It can take a significant period of timebefore the ultimate claim costs can be established with certainty.
Nonlife insurance contract liabilities are not discounted for the time value of money.The main assumption underlying the estimation of the claims provision is that a company’spast claims development experience can be used to project future claims development andhence ultimate claims costs. Historical claims development is mainly analyzed by accidentyears as well as by significant business lines and claim types. Large claims are usuallyseparately addressed, either by being reserved at the face value of loss adjuster estimates orseparately projected in order to reflect their future development.
The carrying values of total provisions for claims reported and claims IBNR are included inthe ‘Insurance contract liabilities’ disclosed in Note 22.
(g) Determination of fair value of shares of APLII and Exclusive Distribution Rights (EDR)The Group determined the fair value of the shares of APLII using a combination of theIncome Approach and the Market Approach. The Income Approach was based on the presentvalue of the future cash flows over a three-year period, adjusted for the control premium andthe lack of marketability discount. Significant management judgment is required to determinethe expected future cash flows. The valuation under the Income Approach is most sensitive todiscount rate and growth rate used to project cash flows.

- 40 -
*SGVFS021357*
The Market Approach involved determining the price to book value of selected publiclytraded companies that have been identified to be comparable to PLII such as those withsimilar business activities and product offerings. The price to book value are then subjected toa control premium and lack of marketability discount.
The fair value of the Exclusive Distribution Right was determined using the Market Approachwhere it involved identifying recent bancassurance agreements with upfront payments frompublicly available data of comparable companies. Using the amount of upfront payment fee,the number of branches and customers, a value per branch and value per customer multiplewere determined.
4. Financial Risk Management Objectives and Policies
IntroductionThe Parent Company’s BOD has overall responsibility for the establishment and oversight of theGroup’s risk management framework. As delegated by the BOD, the Risk Oversight Committee(ROC) is mandated to set risk appetite, approve frameworks, policies and processes for managingrisk, and accept risks beyond the approval discretion provided to management. The ROC adviseson the overall current and future risk appetite and strategy and assists in overseeing theimplementation of those strategies and business plans by senior management. Details of theParent Company’s risk framework are discussed under the Risk Management Disclosure Sectionof the Parent Company’s annual report.
The Group’s activities are principally related to the development, delivery, servicing and use offinancial instruments. Risk is inherent in these activities but it is managed through a process ofongoing identification, measurement and monitoring, subject to risk limits and other controls.This process of risk management is critical to the Group’s continuing profitability.
The Group defines material risks (at group level) as those risks from any business activity largeenough to threaten the Parent Company’s capital position to drop below its desired level resultingin either an P=8.0 billion increase in risk weighted assets or a P=1.0 billion reduction in earningsand/or qualifying capital which translate into a reduction in CAR by 20 bps.
Resulting from the assessments based on the premise identified above, the Parent Company agreesand reviews on a regular basis the material risks that need particular focus from all three lines ofdefense. For the assessment period 2017-2019, these are based on the following nine (9) materialrisks, which are grouped under Pillar 1 and Pillar 2 risks, and shall be covered in the ICAAPDocument and required for monitoring.
Types and definition of each of these risks are discussed hereunder:
Pillar 1 Risks:1. Credit Risk (includes Counterparty and Country Risks)2. Market Risk3. Operational Risk
Pillar 2 Risks:4. Credit Concentration Risk5. Interest Rate Risk in Banking Book (IRRBB)6. Liquidity Risk7. Reputational / Customer Franchise Risk

- 41 -
*SGVFS021357*
8. Strategic Business Risk9. Cyber Security Risk
The Risk Management Group (RMG) provides the legwork for the ROC in its role of formulatingthe risk management strategy, the development and maintenance of the internal risk managementframework, and the definition of the governing risk management principles. The RMG providesassistance to the Assets and Liabilities Committee (ALCO) on capital management and the BoardPolicy Committee on the management of regulatory capital.
The mandate of the RMG involves:
∂ Implementing the risk management framework of identifying, measuring, controlling andmonitoring the various risk taking activities of the Group, inherent in all financial institutions;
∂ Providing services to the risk-taking units and personnel in the implementation of riskmitigation strategies; and
∂ Establishing recommended limits based on the results of its analysis of exposures.
Credit RiskCredit risk is the non-recovery of credit exposures (on-and-off balance sheet exposures).Managing credit risk also involves monitoring of migration risk, concentration risk, country riskand settlement risk. The Group manages its credit risk at various levels (i.e., strategic level,portfolio level down to individual transaction).
The credit risk management of the entire loan portfolio is under the direct oversight of the ROCand Executive Committee. Credit risk assessment of individual borrower is performed by thebusiness sector and remedial sector. Risk management is embedded in the entire credit process,i.e., from credit origination to remedial management (if needed).
Among the tools used by the Parent Company in identifying, assessing and managing credit riskinclude:
∂ Documented credit policies and procedures: sound credit granting process, risk assetacceptance criteria, target market and approving authorities;
∂ System for administration and monitoring of exposure;∂ Pre-approval review of loan proposals;∂ Post approval review of implemented loans;∂ Work out system for managing problem credits;∂ Regular review of the sufficiency of valuation reserves;∂ Monitoring of the adequacy of capital for credit risk via the Capital Adequacy Ratio (CAR)
report;∂ Monitoring of breaches in regulatory and internal limits;∂ Credit Risk Management Dashboard;∂ Diversification;∂ Internal Risk Rating System for corporate accounts;∂ Credit Scoring for retail accounts; and∂ Active loan portfolio management undertaken to determine the quality of the loan portfolio
and identify the following:a. portfolio growthb. movement of loan portfolio (cash releases and cash collection for the month)c. loss rated. recovery rate

- 42 -
*SGVFS021357*
e. trend of nonperforming loans (NPLs)f. concentration risk (per classified account, per industry, clean exposure, large exposure,
contingent exposure, currency, security, facility, demographic, etc.)
The Parent Company collects data on risk rating of loan borrowers with an asset size ofP=15.0 million and above as initial requirement in the Parent Company’s model for internalProbability of Default (PD) and Loss Given Default (LGD).
The Group follows the BOD approved policy on the generic classification of loans based on thetype of borrowers and the purpose of the loan.
Credit-related commitmentsThe exposures represent guarantees, standby letters of credit (LCs) issued by the Parent Companyand documentary/commercial LCs which are written undertakings by the Parent Company.
To mitigate this risk the Parent Company requires hard collaterals, as discussed under Collateraland other credit enhancement, for standby LCs lines while commercial LCs are collateralized bythe underlying shipments of goods to which they relate.
Derivative financial instrumentsCredit risk arising from derivative financial instruments is, at any time, limited to those withpositive fair values, as recorded in the statement of financial position.
Unit-linked financial assetsThe Group issues unit-linked insurance policies. In the unit-linked business, the policy holderbears the investment risk in the assets held in the unit-linked funds as the policy benefits aredirectly linked to the values of the assets in the fund. Therefore, the Group has no material creditrisk on unit-linked financial assets.
Collateral and other credit enhancementAs a general rule, character is the single most important consideration in granting loans.However, collaterals are requested to mitigate risk. The loan value and type of collateral requireddepend on the assessment of the credit risk of the borrower or counterparty. The Group followsguidelines on the acceptability of types of collateral and valuation parameters.
The main types of collateral obtained are as follows:
∂ For corporate accounts - deposit hold outs, guarantees, securities, physical collaterals (e.g.,real estate, chattels, inventory, etc.); as a general rule, commercial, industrial and residentiallots are preferred
∂ For retail lending - mortgages on residential properties and vehicles financed∂ For securities lending and reverse repurchase transactions - cash or securities
The disposal of the foreclosed properties is handled by the Asset Management Sector whichadheres to the general policy of disposing assets at the highest possible market value.
Management regularly monitors the market value of the collateral and requests additionalcollateral in accordance with the underlying agreement. The existing market value of thecollateral is considered during the review of the adequacy of the allowance for credit losses.Generally, collateral is not held over loans and advances to banks except for reverse repurchaseagreements. The Group is not permitted to sell or repledge the collateral held over loans andadvances to counterparty banks and BSP in the absence of default by the owner of the collateral.

- 43 -
*SGVFS021357*
Maximum exposure to credit risk after collateral held or other credit enhancementsAn analysis of the maximum exposure to credit risk after taking into account any collateral held orother credit enhancements for the Group and the Parent Company is shown below:
Consolidated2016
GrossMaximumExposure
Fair Value ofCollateral
NetExposure
FinancialEffect of
CollateralSecurities held under repurchase agreement P=1,972,310 P=1,968,603 P=3,707 P=1,968,603Loans and receivables: Receivable from customers*: Business loans 345,154,387 275,990,051 276,724,626 68,429,761 Consumers 41,224,688 24,791,559 28,463,760 12,760,928 GOCCs and National Government
Agencies (NGAs) 19,897,037 25,594,651 3,089,179 16,807,858 LGUs 7,335,499 1,053,132 6,806,185 529,314 Fringe benefits 588,092 743,271 291,754 296,338 Unquoted debt securities 6,972,710 2,789,063 4,125,801 2,789,063 Other receivable 21,039,980 10,745,528 15,156,530 5,883,450
P=444,184,703 P=343,675,858 P=334,661,542 P=109,465,315*Receivables from customers exclude residual value of the leased asset (Note 10).
Consolidated2015
GrossMaximumExposure
Fair Value ofCollateral
NetExposure
FinancialEffect of
CollateralSecurities held under repurchase agreement P=14,550,000 P=14,516,223 P=33,777 P=14,516,223Loans and receivables: Receivable from customers*: Business loans 290,095,409 251,693,476 232,049,711 58,045,698 Consumers 33,615,950 46,755,806 15,652,016 17,963,934 GOCCs and NGAs 23,037,919 27,561,404 3,941,304 19,096,615 LGUs 7,792,655 1,430,738 7,050,998 741,657 Fringe benefits 552,079 829,780 246,613 305,466 Unquoted debt securities 4,245,069 3,434,914 810,155 3,434,914 Other receivable 19,101,758 8,553,573 14,856,651 4,245,107
P=392,990,839 P=354,775,914 P=274,641,225 P=118,349,614*Receivables from customers exclude residual value of the leased asset (Note 10).
Parent Company2016
GrossMaximumExposure
Fair Value ofCollateral
NetExposure
FinancialEffect of
CollateralSecurities held under repurchase agreement P=1,972,310 P=1,968,603 P=3,707 P=1,968,603Loans and receivables: Receivable from customers: Business loans 332,783,948 255,205,029 273,830,642 58,953,306 Consumers 9,988,258 3,059,479 8,357,123 1,631,135 GOCCs and NGAs 19,897,036 25,594,651 3,089,179 16,807,857 LGUs 7,335,499 1,053,132 6,806,185 529,314 Fringe benefits 560,828 734,575 283,164 277,664 Unquoted debt securities 6,914,864 2,789,063 4,125,801 2,789,063 Other receivable 14,750,427 10,743,494 9,124,573 5,625,854
P=394,203,170 P=301,148,026 P=305,620,374 P=88,582,796

- 44 -
*SGVFS021357*
Parent Company2015
GrossMaximumExposure
Fair Value ofCollateral
NetExposure
FinancialEffect of
CollateralSecurities held under repurchase agreement P=14,550,000 P=14,516,223 P=33,777 P=14,516,223Loans and receivables: Receivable from customers Business loans 277,692,524 231,128,278 232,161,031 45,531,493 Consumers 14,033,577 25,514,598 6,384,992 7,648,585 GOCCs and NGAs 23,037,919 27,561,404 3,941,304 19,096,615 LGUs 7,792,655 1,430,738 7,050,998 741,657 Fringe benefits 538,887 820,321 242,878 296,009 Unquoted debt securities 4,245,069 3,434,914 810,155 3,434,914 Other receivable 13,820,335 8,544,352 9,584,448 4,235,887
P=355,710,966 P=312,950,828 P=260,209,583 P=95,501,383
The maximum credit risk, without taking into account the fair value of any collateral and nettingagreements, is limited to the amounts on the statement of financial position plus commitments tocustomers such as unused commercial letters of credit, outstanding guarantees and others asdisclosed in Note 35 to the financial statements.
Excessive risk concentrationCredit risk concentrations can arise whenever a significant number of borrowers have similarcharacteristics. The Parent Company analyzes the credit risk concentration to an individualborrower, related group of accounts, industry, geographic, internal rating buckets, currency, termand security. For risk concentration monitoring purposes, the financial assets are broadlycategorized into (1) loans and receivables and (2) trading and financial investment securities.To mitigate risk concentration, the Parent Company constantly checks for breaches in regulatoryand internal limits. Clear escalation process and override procedures are in place, whereby anyexcess in limits are covered by appropriate approving authority to regularize and monitor breachesin limits.
a. Limit per Client or CounterpartyFor loans and receivables, the Parent Company sets an internal limit for group exposureswhich is equivalent to 100.00% of the single borrower’s limit (SBL) for loan accounts withcredit risk rating (CRR) 1 to CRR 5 or 50.00% of SBL if rated below CRR 5.
For trading and investment securities, the Group limits investments to government issues andsecurities issued by entities with high-quality investment ratings.
b. Geographic ConcentrationThe table below shows the credit risk exposures, before taking into account any collateral heldor other credit enhancements, categorized by geographic location:
Consolidated2016
Loans andreceivables*
Trading andinvestment
securities
Otherfinancialassets** Total
Philippines P=388,503,018 P=78,723,534 P=131,622,446 P=598,848,998Asia (excluding the Philippines) 18,430,743 12,716,017 18,211,900 49,358,660USA and Canada 15,315,893 202,939 4,302,151 19,820,983
(Forward)

- 45 -
*SGVFS021357*
Consolidated2016
Loans andreceivables*
Trading andinvestment
securities
Otherfinancialassets** Total
Other European Union Countries P=1,425,522 P=942,855 P=4,643,448 P=7,011,825Oceania 3,594,610 − − 3,594,610United Kingdom 42,086 843,737 1,568,364 2,454,187Middle East 7,707 − 31,042 38,749
P=427,319,579 P=93,429,082 P=160,379,351 P=681,128,012* Loans and receivables exclude residual value of the leased asset (Note 10).** Other financial assets include the following financial assets: ‘Due from BSP’, ‘Due from other banks’, ‘Interbank loans
receivable’, ‘Securities held under agreements to resell’, and other financial assets booked under ‘Other assets’ (Note 15).
Consolidated2015
Loans andreceivables*
Trading andinvestment
securities
Otherfinancialassets** Total
Philippines P=346,480,786 P=76,378,062 P=98,334,288 P=521,193,136Asia (excluding the Philippines) 17,732,943 12,884,161 14,081,917 44,699,021USA and Canada 776,838 957,062 5,079,342 6,813,242Other European Union Countries – 5,725,103 1,640,140 7,365,243United Kingdom 20,893 139,178 1,156,311 1,316,382Middle East 1,365 – 12,108 13,473
P=365,012,825 P=96,083,566 P=120,304,106 P=581,400,497* Loans and receivables exclude residual value of the leased asset (Note 10).** Other financial assets include the following financial assets: ‘Due from BSP’, ‘Due from other banks’, ‘Interbank loans
receivable’, ‘Securities held under agreements to resell’, and other financial assets booked under ‘Other assets’ (Note 15).
Parent Company2016
Loans andreceivables
Trading andinvestment
securities
Otherfinancial
assets* TotalPhilippines P=366,510,639 P=77,371,752 P=127,423,155 P=571,305,547Asia (excluding the Philippines) 11,011,491 12,715,714 10,154,230 33,881,435USA and Canada − 843,276 4,053,526 4,896,802Oceania 668,901 − 4,135,016 4,803,917Other European Union Countries − 843,737 1,244,950 2,088,687Middle East 7,707 − 31,042 38,749United Kingdom 225 − 225
P=378,198,738 P=91,774,704 P=147,041,919 P=617,015,362* Other financial assets include the following financial assets: ‘Due from BSP’, ‘Due from other banks’, ‘Interbank loans
receivable’, ‘Securities held under agreements to resell’, and other financial assets booked under ‘Other assets’ (Note 15).
Parent Company2015
Loans andreceivables
Trading andinvestment
securities
Otherfinancial
assets* TotalPhilippines P=319,220,646 P=74,835,244 P=94,995,277 P=489,051,167Asia (excluding the Philippines) 8,509,086 12,883,954 9,035,854 30,428,894USA and Canada 569,141 862,708 4,801,070 6,232,919Other European Union Countries – 5,725,103 1,639,322 7,364,425Middle East 1,365 – 12,108 13,473United Kingdom – 58,250 814,433 872,683
P=328,300,238 P=94,365,259 P=111,298,064 P=533,963,561* Other financial assets include the following financial assets: ‘Due from BSP’, ‘Due from other banks’, ‘Interbank loans
receivable’, ‘Securities held under agreements to resell’, and other financial assets booked under ‘Other assets’ (Note 15).
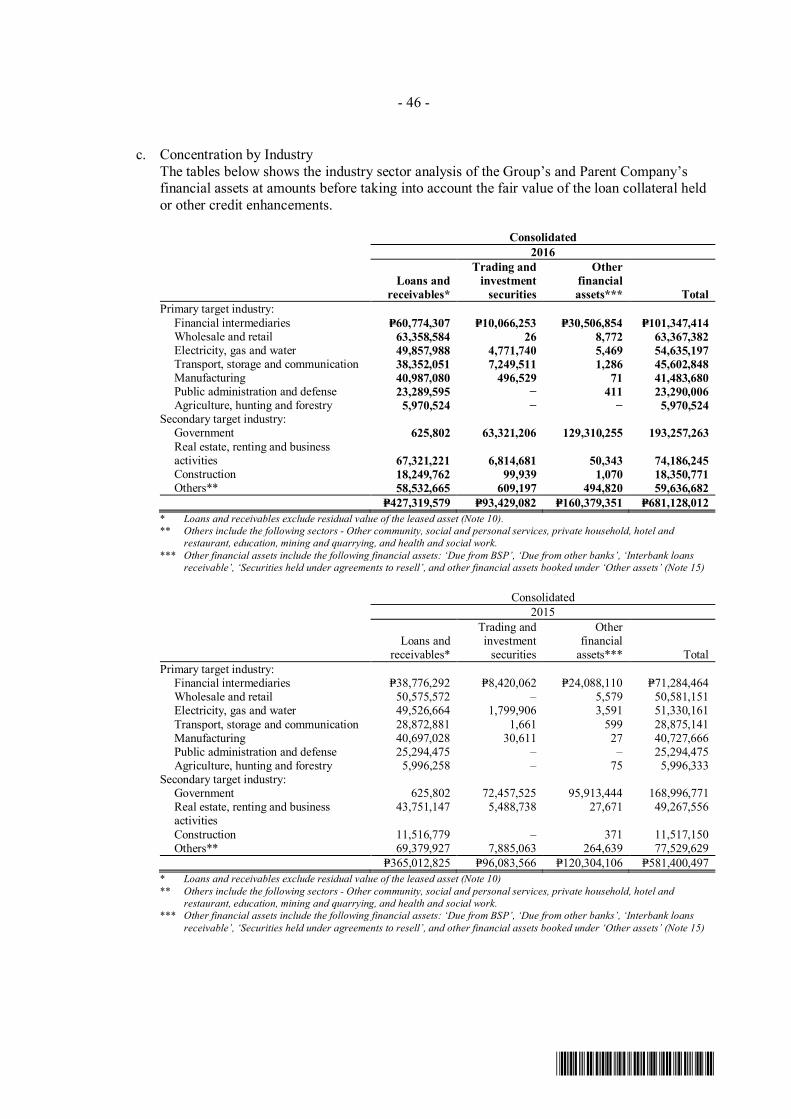
- 46 -
*SGVFS021357*
c. Concentration by IndustryThe tables below shows the industry sector analysis of the Group’s and Parent Company’sfinancial assets at amounts before taking into account the fair value of the loan collateral heldor other credit enhancements.
Consolidated2016
Loans andreceivables*
Trading andinvestment
securities
Otherfinancialassets*** Total
Primary target industry: Financial intermediaries P=60,774,307 P=10,066,253 P=30,506,854 P=101,347,414 Wholesale and retail 63,358,584 26 8,772 63,367,382 Electricity, gas and water 49,857,988 4,771,740 5,469 54,635,197 Transport, storage and communication 38,352,051 7,249,511 1,286 45,602,848 Manufacturing 40,987,080 496,529 71 41,483,680 Public administration and defense 23,289,595 − 411 23,290,006 Agriculture, hunting and forestry 5,970,524 − − 5,970,524Secondary target industry: Government 625,802 63,321,206 129,310,255 193,257,263 Real estate, renting and business
activities 67,321,221 6,814,681 50,343 74,186,245 Construction 18,249,762 99,939 1,070 18,350,771 Others** 58,532,665 609,197 494,820 59,636,682
P=427,319,579 P=93,429,082 P=160,379,351 P=681,128,012* Loans and receivables exclude residual value of the leased asset (Note 10).** Others include the following sectors - Other community, social and personal services, private household, hotel and
restaurant, education, mining and quarrying, and health and social work.*** Other financial assets include the following financial assets: ‘Due from BSP’, ‘Due from other banks’, ‘Interbank loans
receivable’, ‘Securities held under agreements to resell’, and other financial assets booked under ‘Other assets’ (Note 15)
Consolidated2015
Loans andreceivables*
Trading andinvestment
securities
Otherfinancial
assets*** TotalPrimary target industry: Financial intermediaries P=38,776,292 P=8,420,062 P=24,088,110 P=71,284,464 Wholesale and retail 50,575,572 – 5,579 50,581,151 Electricity, gas and water 49,526,664 1,799,906 3,591 51,330,161 Transport, storage and communication 28,872,881 1,661 599 28,875,141 Manufacturing 40,697,028 30,611 27 40,727,666 Public administration and defense 25,294,475 – – 25,294,475 Agriculture, hunting and forestry 5,996,258 – 75 5,996,333Secondary target industry: Government 625,802 72,457,525 95,913,444 168,996,771 Real estate, renting and business
activities43,751,147 5,488,738 27,671 49,267,556
Construction 11,516,779 – 371 11,517,150 Others** 69,379,927 7,885,063 264,639 77,529,629
P=365,012,825 P=96,083,566 P=120,304,106 P=581,400,497* Loans and receivables exclude residual value of the leased asset (Note 10)** Others include the following sectors - Other community, social and personal services, private household, hotel and
restaurant, education, mining and quarrying, and health and social work.*** Other financial assets include the following financial assets: ‘Due from BSP’, ‘Due from other banks’, ‘Interbank loans
receivable’, ‘Securities held under agreements to resell’, and other financial assets booked under ‘Other assets’ (Note 15)

- 47 -
*SGVFS021357*
Parent Company2016
Loans andreceivables
Trading andinvestment
securities
Otherfinancialassets** Total
Primary target industry: Financial intermediaries P=59,963,399 P=9,976,639 P=20,744,821 P=90,684,859 Wholesale and retail 56,592,495 26 8,772 54,403,614 Electricity, gas and water 49,626,635 4,771,510 5,469 56,601,293 Transport, storage and communication 34,052,933 7,150,623 1,286 41,204,842 Manufacturing 35,104,381 496,529 71 35,600,981 Public administration and defense 23,915,397 − 411 23,915,808 Agriculture, hunting and forestry 4,922,200 − − 4,922,200Secondary target industry: Government – 62,372,155 125,772,346 188,144,501 Real estate, renting and business
activities 51,294,655 6,721,508 50,343 58,066,506 Construction 14,488,232 99,939 1,070 14,589,241 Others* 48,238,411 185,775 457,830 48,882,016
P=378,198,738 P=91,774,704 P=147,042,419 P=617,015,861* Others include the following sectors - Other community, social and personal services, private household, hotel and
restaurant, education, mining and quarrying, and health and social work.** Other financial assets include the following financial assets: ‘Due from BSP’, ‘Due from other banks’, ‘Interbank loans
receivable’, ‘Securities held under agreements to resell’, and other financial assets booked under ‘Other assets’ (Note 15).
Parent Company2015
Loans andreceivables
Trading andinvestment
securities
Otherfinancialassets** Total
Primary target industry: Financial intermediaries P=38,440,318 P=8,173,172 P=17,409,518 P=64,023,008 Wholesale and retail 46,788,392 – 5,579 46,793,971 Electricity, gas and water 49,463,182 1,799,906 3,591 51,266,679 Transport, storage and communication 27,034,887 1,661 599 27,037,147 Manufacturing 37,203,799 30,611 27 37,234,437 Public administration and defense 25,294,475 – – 25,294,475 Agriculture, hunting and forestry 5,519,770 – 75 5,519,845Secondary target industry: Government 625,802 71,244,398 93,753,948 165,624,148 Real estate, renting and business
activities36,160,266 5,488,738 27,671 41,676,675
Construction 9,793,549 – 371 9,793,920 Others* 51,975,798 7,626,773 216,319 59,818,890
P=328,300,238 P=94,365,259 P=111,417,698 P=534,083,195* Others include the following sectors - Other community, social and personal services, private household, hotel and
restaurant, education, mining and quarrying, and health and social work.** Other financial assets include the following financial assets: ‘Due from BSP’, ‘Due from other banks’, ‘Interbank loans
receivable’, ‘Securities held under agreements to resell’, and other financial assets booked under ‘Other assets’ (Note 15).
The internal limit of the Parent Company based on the Philippine Standard Industry Classification(PSIC) sub-industry is 12.00% for priority industry, 8.00% for regular industry and 30.00% forpower industry versus total loan portfolio.
Credit quality per class of financial assetsThe credit quality of financial assets is assessed and managed using external and internal ratings.For receivable from customers classified as business loans, the credit quality is generallymonitored using the 14-grade CRR System which is integrated in the credit process particularly inloan pricing and allocation of valuation reserves. The model on risk ratings is assessed andupdated regularly.
- 48 -
*SGVFS021357*
Validation of the individual internal risk rating is conducted by the Credit Management Divisionto maintain accurate and consistent risk ratings across the credit portfolio. The rating system hastwo parts, namely, the borrower’s rating and the facility rating. It is supported by a variety offinancial analytics, combined with an assessment of management and market information such asindustry outlook and market competition to provide the main inputs for the measurement of creditor counterparty risk.
Loans and ReceivablesThe CRRs of the Parent Company’s Receivables from customers (applied to loans with asset sizeof P=15.0 million and above) are defined below:
CRR 1 - ExcellentLoans receivables rated as excellent include borrowers which are significant in size, with long andsuccessful history of operations, an industry leader, with ready access to all equity and debtmarkets and have proven its strong debt service capacity.
CRR 2 - Super PrimeLoans receivables rated as super prime include borrowers whose ability to service all debt andmeet financial obligations remains unquestioned.
CRR 3 - PrimeUnder normal economic conditions, borrowers in this rating have good access to public market toraise funds and face no major uncertainties which could impair repayment.
CRR 4 - Very GoodLoans receivables rated as very good include borrowers whose ability to service all debts and meetfinancial obligations remain unquestioned, but current adverse economic conditions or changingcircumstances have minimal impact on payment of obligations.
CRR 5 - GoodLoans receivables rated as good include borrowers with good operating history and solidmanagement, but payment capacity could be vulnerable to adverse business, financial or economicconditions.
CRR 6 - SatisfactoryThese are loans receivables to borrowers whose ability to service all debt and meet financialobligations remains unquestioned, but with somewhat lesser capacity than in CRR 5 accounts.
CRR 7 - AverageThese are loans receivables to borrowers having ability to repay the loan in the normal course ofbusiness activity, although may not be strong enough to sustain a major setback.
CRR 8 - FairThese are loans receivables to borrowers possessing the characteristics of borrowers rated asCRR7 with slightly lesser quality in financial strength, earnings, performance and/or outlook.
CRR 9 - MarginalThese are performing loans receivables from borrowers not qualified as CRRs 1-8. The borroweris able to withstand normal business cycles, although any prolonged unfavorable economic and/ormarket period would create an immediate deterioration beyond acceptable levels.

- 49 -
*SGVFS021357*
CRR 10 - WatchlistThis rating includes borrower where the credit exposure is not at risk of loss at the moment but theperformance of the borrower has weakened and, unless present trends are reversed, couldeventually lead to losses.
CRR 11 - Special MentionThese are loans that have potential weaknesses that deserve management’s close attention. Thesepotential weaknesses, if left uncorrected, may affect the repayment of the loan and thus increasecredit risk to the Parent Company.
CRR 12 - SubstandardThese are loans or portions thereof which appear to involve a substantial and unreasonable degreeof risk to the Parent Company because of unfavorable record or unsatisfactory characteristics.
CRR 13 - DoubtfulThese are loans or portions thereof which have the weaknesses inherent in those classified asCRR 12 with the added characteristics that existing facts, conditions and values make collection orliquidation in full highly improbable and in which substantial loss is probable.
CRR 14 - LossThese are loans or portions thereof which are considered uncollectible or worthless.
The Parent Company uses credit scoring for evaluating borrowers with assets size belowP=15.0 million. Credit scoring details the financial capability of the borrower to pay for any futureobligation.
GOCCs and LGUs are rated using the “means and purpose” test whereby borrowers have to passthe two major parameters, namely:
∂ “Means” test - the borrower must have resources or revenues of its own sufficient to serviceits debt obligations.
∂ “Purpose” test - the loan must be obtained for a purpose consistent with the borrower’sgeneral business.
LGU loans are backed-up by assignment of Internal Revenue Allotment. Consumer loans arecovered by mortgages in residential properties and vehicles financed and guarantees from HomeGuaranty Corporation. Fringe benefit loans are repaid through automatic salary deductions andexposure is secured by mortgage on house or vehicles financed.
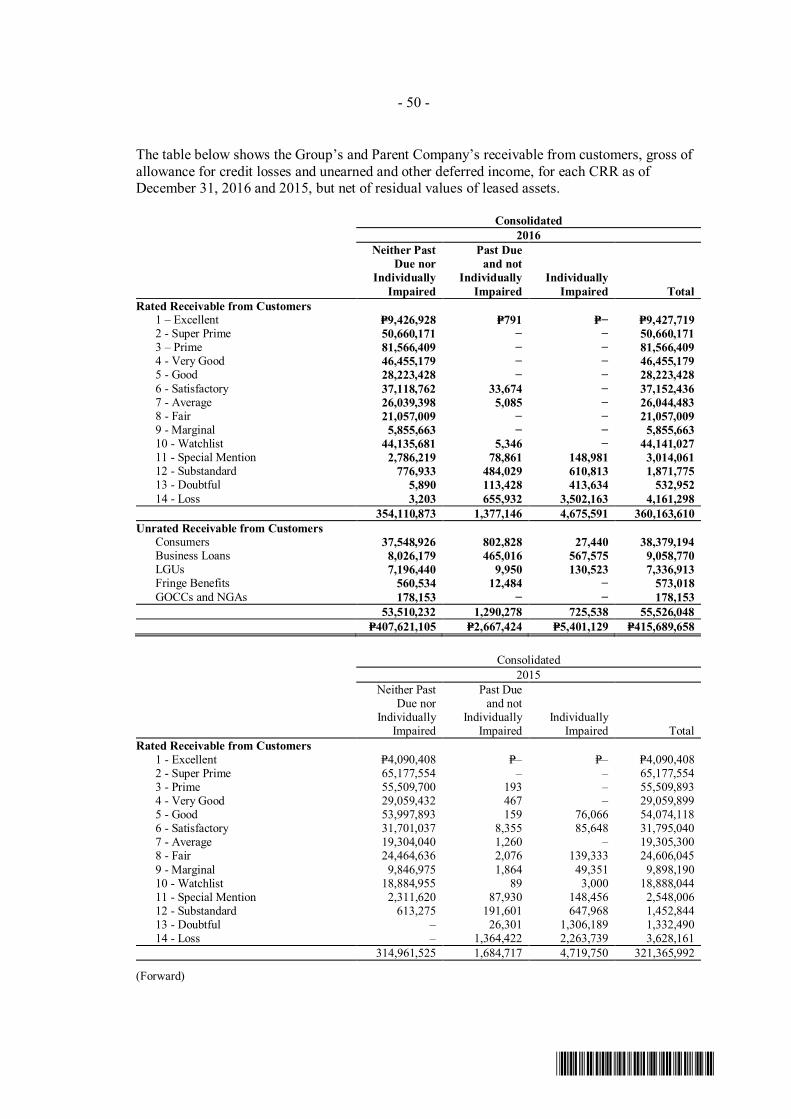
- 50 -
*SGVFS021357*
The table below shows the Group’s and Parent Company’s receivable from customers, gross ofallowance for credit losses and unearned and other deferred income, for each CRR as ofDecember 31, 2016 and 2015, but net of residual values of leased assets.
Consolidated2016
Neither PastDue nor
IndividuallyImpaired
Past Dueand not
IndividuallyImpaired
IndividuallyImpaired Total
Rated Receivable from Customers 1 – Excellent P=9,426,928 P=791 P=− P=9,427,719 2 - Super Prime 50,660,171 − − 50,660,171 3 – Prime 81,566,409 − − 81,566,409 4 - Very Good 46,455,179 − − 46,455,179 5 - Good 28,223,428 − − 28,223,428 6 - Satisfactory 37,118,762 33,674 − 37,152,436 7 - Average 26,039,398 5,085 − 26,044,483 8 - Fair 21,057,009 − − 21,057,009 9 - Marginal 5,855,663 − − 5,855,663 10 - Watchlist 44,135,681 5,346 − 44,141,027 11 - Special Mention 2,786,219 78,861 148,981 3,014,061 12 - Substandard 776,933 484,029 610,813 1,871,775 13 - Doubtful 5,890 113,428 413,634 532,952 14 - Loss 3,203 655,932 3,502,163 4,161,298
354,110,873 1,377,146 4,675,591 360,163,610Unrated Receivable from Customers Consumers 37,548,926 802,828 27,440 38,379,194 Business Loans 8,026,179 465,016 567,575 9,058,770 LGUs 7,196,440 9,950 130,523 7,336,913 Fringe Benefits 560,534 12,484 − 573,018 GOCCs and NGAs 178,153 − − 178,153
53,510,232 1,290,278 725,538 55,526,048P=407,621,105 P=2,667,424 P=5,401,129 P=415,689,658
Consolidated2015
Neither PastDue nor
IndividuallyImpaired
Past Dueand not
IndividuallyImpaired
IndividuallyImpaired Total
Rated Receivable from Customers 1 - Excellent P=4,090,408 P=– P=– P=4,090,408 2 - Super Prime 65,177,554 – – 65,177,554 3 - Prime 55,509,700 193 – 55,509,893 4 - Very Good 29,059,432 467 – 29,059,899 5 - Good 53,997,893 159 76,066 54,074,118 6 - Satisfactory 31,701,037 8,355 85,648 31,795,040 7 - Average 19,304,040 1,260 – 19,305,300 8 - Fair 24,464,636 2,076 139,333 24,606,045 9 - Marginal 9,846,975 1,864 49,351 9,898,190 10 - Watchlist 18,884,955 89 3,000 18,888,044 11 - Special Mention 2,311,620 87,930 148,456 2,548,006 12 - Substandard 613,275 191,601 647,968 1,452,844 13 - Doubtful – 26,301 1,306,189 1,332,490 14 - Loss – 1,364,422 2,263,739 3,628,161
314,961,525 1,684,717 4,719,750 321,365,992
(Forward)

- 51 -
*SGVFS021357*
Consolidated2015
Neither PastDue nor
IndividuallyImpaired
Past Dueand not
IndividuallyImpaired
IndividuallyImpaired Total
Unrated Receivable from Customers Consumers P=7,943,525 P=1,398,624 P=32,199 P=9,374,348 Business Loans 15,144,231 150,695 46,282 15,341,208 GOCCs and NGAs 2,455,069 – 47,060 2,502,129 Fringe Benefits 518,923 10,725 25,994 555,642 LGUs 7,697,189 26,597 65,424 7,789,210
33,758,937 1,586,641 216,959 35,562,537P=348,720,462 P=3,271,358 P=4,936,709 P=356,928,529
Parent Company2016
Neither PastDue nor
IndividuallyImpaired
Past Dueand not
IndividuallyImpaired
IndividuallyImpaired Total
Rated Receivable from Customers 1 - Excellent ₱9,356,313 ₱791 ₱− P=9,357,104 2 - Super Prime 49,664,931 − − 49,664,931 3 - Prime 80,281,186 − − 80,281,186 4 - Very Good 44,936,909 − − 44,936,909 5 - Good 27,370,130 − − 27,370,130 6 - Satisfactory 28,790,669 − − 28,790,669 7 - Average 25,168,489 5,085 − 25,173,574 8 - Fair 20,879,402 − − 20,879,402 9 - Marginal 5,549,401 − − 5,549,401 10 - Watchlist 44,111,934 − − 44,111,934 11 - Special Mention 2,695,185 78,861 − 2,774,046 12 - Substandard 716,596 93,764 96,465 906,825 13 - Doubtful − 8,821 379,665 388,486 14 - Loss − 605,299 3,369,191 3,974,490
339,521,145 792,621 3,845,321 344,159,087Unrated Receivable from Customers Business Loans 9,186,145 403,791 567,575 10,157,511 Consumers 8,658,310 631,265 15,503 9,305,078 LGUs 7,196,440 9,950 130,523 7,336,913 Fringe Benefits 533,272 12,484 − 545,756 GOCCs and NGAs 178,153 − − 178,153
25,752,320 1,057,490 713,601 27,523,411P=365,273,465 P=1,850,111 P=4,558,922 P=371,682,498

- 52 -
*SGVFS021357*
Parent Company2015
Neither PastDue nor
IndividuallyImpaired
Past Dueand not
IndividuallyImpaired
IndividuallyImpaired Total
Rated Receivable from Customers 1 - Excellent P=3,944,861 P=– P=– P=3,944,861 2 - Super Prime 64,243,898 – – 64,243,898 3 - Prime 54,377,704 193 – 54,377,897 4 - Very Good 27,568,487 467 – 27,568,954 5 - Good 33,868,924 159 – 33,869,083 6 - Satisfactory 23,798,683 3,019 23,432 23,825,134 7 - Average 18,649,361 1,260 – 18,650,621 8 - Fair 24,060,879 2,076 139,333 24,202,288 9 - Marginal 9,751,289 1,864 49,351 9,802,504 10 - Watchlist 17,897,858 – 3,000 17,900,858 11 - Special Mention 2,262,084 32,004 32,915 2,327,003 12 - Substandard 613,275 159,680 436,856 1,209,811 13 - Doubtful – 15,218 1,025,278 1,040,496 14 - Loss – 1,364,422 2,152,444 3,516,866
281,037,303 1,580,362 3,862,609 286,480,274Unrated Receivable from Customers Business Loans 17,735,218 150,695 46,282 17,932,195 Consumers 7,871,087 1,390,262 19,204 9,280,553 LGUs 7,697,189 26,597 65,424 7,789,210 Fringe Benefits 505,730 10,725 22,520 538,975 GOCCs and NGAs 2,455,069 – 47,060 2,502,129
36,264,293 1,578,279 200,490 38,043,062P=317,301,596 P=3,158,641 P=4,063,099 P=324,523,336
Under PFRS 7, a financial asset is past due when a counterparty has failed to make a paymentwhen contractually due. The tables below show the aging analysis of past due but not individuallyimpaired loans receivables per class.
Consolidated2016
Less than30 days 31 to 90 days 91 to 180 days
More than180 days Total
Business loans P=117,611 P=159,652 P=52,707 P=1,476,010 P=1,805,980Consumers 235,986 20,222 8,505 574,297 839,010Fringe benefits 29 24 721 11,710 12,484LGUs – – – 9,950 9,950Total P=353,626 P=179,898 P=61,933 P=2,071,967 P=2,667,424
Consolidated2015
Less than30 days 31 to 90 days 91 to 180 days
More than180 days Total
Business loans P=59,704 P=10,508 P=26,437 P=1,685,805 P=1,782,454Consumers 172,194 95,601 238,854 944,934 1,451,583Fringe benefits 904 98 1,294 8,428 10,724LGUs – – – 26,597 26,597Total P=232,802 P=106,207 P=266,585 P=2,665,764 P=3,271,358

- 53 -
*SGVFS021357*
Parent Company2016
Less than30 days 31 to 90 days 91 to 180 days
More than180 days Total
Business loans P=56,339 P=159,451 P=47,404 P=930,506 P=1,193,700Consumers 35,830 19,074 6,235 572,838 633,977Fringe benefits 29 24 721 11,710 12,484LGUs – – – 9,950 9,950Total P=92,198 P=178,549 P=54,360 P=1,525,004 P=1,850,111
Parent Company2015
Less than30 days 31 to 90 days 91 to 180 days
More than180 days Total
Business loans P=12,079 P=9,841 P=26,437 P=1,681,269 P=1,729,626Consumers 113,519 95,452 237,789 944,934 1,391,694Fringe benefits 904 98 1,294 8,428 10,724LGUs – – – 26,597 26,597Total P=126,502 P=105,391 P=265,520 P=2,661,228 P=3,158,641
Trading and Investment Securities and Other Financial AssetsIn ensuring quality investment portfolio, the Bank uses the credit risk rating based on the externalratings of eligible external credit rating institutions (i.e. Moody’s Investors Service) as follows:
Aaa to Aa3 - fixed income are judged to be of high quality and are subject to very low credit risk,but their susceptibility to long-term risks appears somewhat greater.
A1 to A3 - fixed income obligations are considered upper-medium grade and are subject to lowcredit risk, but have elements present that suggest a susceptibility to impairment over the longterm.
Baa1 and below - represents those investments which fall under any of the following grade:
∂ Baa1, Baa2, Baa3 - fixed income obligations are subject to moderate credit risk. They areconsidered medium grade and as such protective elements may be lacking or may becharacteristically unreliable.
∂ Ba1, Ba2, Ba3 - obligations are judged to have speculative elements and are subject tosubstantial credit risk.
∂ B1, B2, B3 - obligations are considered speculative and are subject to high credit risk.∂ Caa1, Caa2, Caa3 - are judged to be of poor standing and are subject to very high credit risk.∂ Ca - are highly speculative and are likely in, or very near, default, with some prospect of
recovery of principal and interest.∂ C - are the lowest rated class of bonds and are typically in default, with little prospect for
recovery of principal or interest.

- 54 -
*SGVFS021357*
Below are the financial assets of the Group and the Parent Company, net of allowances, excludingreceivable from customers, which are monitored using external ratings.
Consolidated2016
Rated
Aaa to Aa3 A1 to A3Baa1
and below Subtotal Unrated5/ TotalDue from BSP1/ P=– P=– P=127,337,861 P=127,337,861 P=– P=127,337,861Due from other banks 5,051,163 6,461,719 10,580,175 22,093,057 616,748 22,709,805Interbank loans receivables 4,928,854 1,866,579 995,541 7,790,974 134 7,791,108Securities held under agreements to
resell1,972,310 1,972,310 1,972,310
Financial assets at FVPL: Government securities – – 949,379 949,379 364,021 1,313,400 Derivative assets2/ 43,510 28,097 9,974 81,581 337,541 419,122 Private debt securities – – – – 120,589 120,589 Equity securities – – 27,415 27,415 27,194 54,609 Investment in unit investment trust
funds (UITFs)– – 6,144 6,144 – 6,144
AFS investments: Government securities 1,548,376 – 36,202,024 37,750,400 84,159 37,834,559 Private debt securities 4,299,497 2,880,154 4,964,387 12,144,038 16,697,032 28,841,070 Quoted equity securities – – 54,139 54,139 439,819 493,958 Unquoted equity securities 16,837 – 536 17,373 153,779 171,152HTM investments Government securities 99,580 – 22,842,219 22,941,799 1,232,680 24,174,479Loans and receivables: Unquoted debt securities3/ – – – – 3,285,222 3,285,222 Others4/ – – – – 18,208,225 18,208,2251/ ‘Due from BSP’ is composed of interest-earning short-term placements with the BSP and a demand deposit account to support the regular operations of
the Parent Company.2/ Derivative assets represent the value of credit derivatives embedded in host contracts issued by financial intermediaries and the mark-to-market
valuation of freestanding derivatives (Note 23).3/ Unquoted debt securities represent investments in bonds and notes issued by financial intermediaries, government and private entities that are not
quoted in the market (Note 10).4/ Loans and receivables - Others is composed of Accrued interest receivable, Accounts receivable, Sales contracts receivable and other miscellaneous
receivables (Note 10).5/ As of December 31, 2016 and 2015, financial assets that are unrated are neither past due nor impaired.
Consolidated2015
Rated
Aaa to Aa3 A1 to A3Baa1
and below Subtotal Unrated5/ TotalDue from BSP1/ P=– P=– P=– P=– P=81,363,444 P=81,363,444Due from other banks 5,973,964 3,770,982 7,700,508 17,445,454 841,854 18,287,308Interbank loans receivables 1,814,131 3,525,011 461,192 5,800,334 49 5,800,383Securities held under agreements to
resell– – – – 14,550,000 14,550,000
Financial assets at FVPL: Government securities – – 3,723,377 3,723,377 244,837 3,968,214 Derivative assets2/ 12,391 10,458 35,242 58,091 123,257 181,348 Private debt securities – – 113,196 113,196 30,604 143,800 Equity securities – – 69 69 199,853 199,922 Investment in Unit Investment Trust
Funds (UITFs)– – – – 17,261 17,261
AFS investments: Government securities 1,829,038 – 28,625,851 30,454,889 14,805,508 45,260,397 Private debt securities 3,320,989 397,000 10,938,756 14,656,745 7,596,235 22,252,980 Quoted equity securities – – 203,182 203,182 450,749 653,931 Unquoted equity securities – – 508 508 173,208 173,716HTM investments Government securities 94,354 4,706 23,132,937 23,231,997 – 23,231,997
(Forward)
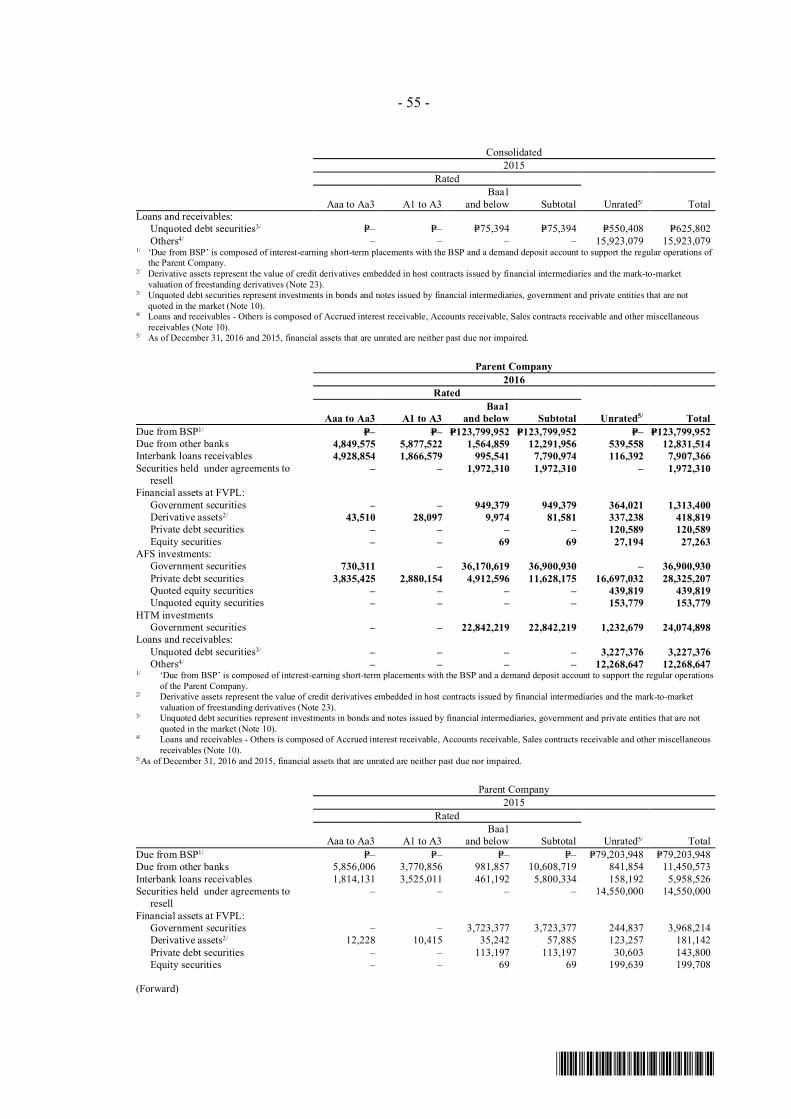
- 55 -
*SGVFS021357*
Consolidated2015
Rated
Aaa to Aa3 A1 to A3Baa1
and below Subtotal Unrated5/ TotalLoans and receivables: Unquoted debt securities3/ P=– P=– P=75,394 P=75,394 P=550,408 P=625,802 Others4/ – – – – 15,923,079 15,923,0791/ ‘Due from BSP’ is composed of interest-earning short-term placements with the BSP and a demand deposit account to support the regular operations of
the Parent Company.2/ Derivative assets represent the value of credit derivatives embedded in host contracts issued by financial intermediaries and the mark-to-market
valuation of freestanding derivatives (Note 23).3/ Unquoted debt securities represent investments in bonds and notes issued by financial intermediaries, government and private entities that are not
quoted in the market (Note 10).4/ Loans and receivables - Others is composed of Accrued interest receivable, Accounts receivable, Sales contracts receivable and other miscellaneous
receivables (Note 10).5/ As of December 31, 2016 and 2015, financial assets that are unrated are neither past due nor impaired.
Parent Company2016
Rated
Aaa to Aa3 A1 to A3Baa1
and below Subtotal Unrated5/ TotalDue from BSP1/ P=– P=– P=123,799,952 P=123,799,952 P=– P=123,799,952Due from other banks 4,849,575 5,877,522 1,564,859 12,291,956 539,558 12,831,514Interbank loans receivables 4,928,854 1,866,579 995,541 7,790,974 116,392 7,907,366Securities held under agreements to resell
– – 1,972,310 1,972,310 – 1,972,310
Financial assets at FVPL: Government securities – – 949,379 949,379 364,021 1,313,400 Derivative assets2/ 43,510 28,097 9,974 81,581 337,238 418,819 Private debt securities – – – – 120,589 120,589 Equity securities – – 69 69 27,194 27,263AFS investments: Government securities 730,311 – 36,170,619 36,900,930 – 36,900,930 Private debt securities 3,835,425 2,880,154 4,912,596 11,628,175 16,697,032 28,325,207 Quoted equity securities – – – – 439,819 439,819 Unquoted equity securities – – – – 153,779 153,779HTM investments Government securities – – 22,842,219 22,842,219 1,232,679 24,074,898Loans and receivables: Unquoted debt securities3/ – – – – 3,227,376 3,227,376 Others4/ – – – – 12,268,647 12,268,6471/ ‘Due from BSP’ is composed of interest-earning short-term placements with the BSP and a demand deposit account to support the regular operations
of the Parent Company.2/ Derivative assets represent the value of credit derivatives embedded in host contracts issued by financial intermediaries and the mark-to-market
valuation of freestanding derivatives (Note 23).3/ Unquoted debt securities represent investments in bonds and notes issued by financial intermediaries, government and private entities that are not
quoted in the market (Note 10).4/ Loans and receivables - Others is composed of Accrued interest receivable, Accounts receivable, Sales contracts receivable and other miscellaneous
receivables (Note 10).5/As of December 31, 2016 and 2015, financial assets that are unrated are neither past due nor impaired.
Parent Company2015
Rated
Aaa to Aa3 A1 to A3Baa1
and below Subtotal Unrated5/ TotalDue from BSP1/ P=– P=– P=– P=– P=79,203,948 P=79,203,948Due from other banks 5,856,006 3,770,856 981,857 10,608,719 841,854 11,450,573Interbank loans receivables 1,814,131 3,525,011 461,192 5,800,334 158,192 5,958,526Securities held under agreements to resell
– – – – 14,550,000 14,550,000
Financial assets at FVPL: Government securities – – 3,723,377 3,723,377 244,837 3,968,214 Derivative assets2/ 12,228 10,415 35,242 57,885 123,257 181,142 Private debt securities – – 113,197 113,197 30,603 143,800 Equity securities – – 69 69 199,639 199,708
(Forward)

- 56 -
*SGVFS021357*
Parent Company2015
Rated
Aaa to Aa3 A1 to A3Baa1
and below Subtotal Unrated5/ TotalAFS investments: Government securities P=727,525 P=– P=28,542,175 P=29,269,700 P=14,805,509 P=44,075,209 Private debt securities 3,222,933 397,000 10,819,417 14,439,350 7,596,235 22,035,585 Quoted equity securities – – – – 450,749 450,749 Unquoted equity securities – – – – 173,209 173,209HTM investments Government securities – 4,706 23,132,937 23,137,643 – 23,137,643Loans and receivables: Unquoted debt securities3/ – – 75,394 75,394 550,408 625,802 Others4/ – – – – 10,943,494 10,943,4941/ ‘Due from BSP’ is composed of interest-earning short-term placements with the BSP and a demand deposit account to support the regular operations
of the Parent Company.2/ Derivative assets represent the value of credit derivatives embedded in host contracts issued by financial intermediaries and the mark-to-market
valuation of freestanding derivatives (Note 23).3/ Unquoted debt securities represent investments in bonds and notes issued by financial intermediaries, government and private entities that are not
quoted in the market (Note 10).4/ Loans and receivables - Others is composed of Accrued interest receivable, Accounts receivable, Sales contracts receivable and other miscellaneous
receivables (Note 10).5/As of December 31, 2016 and 2015, financial assets that are unrated are neither past due nor impaired.
Impairment assessmentThe Group recognizes impairment or credit losses based on the results of specific (individual) andcollective assessment of its credit exposures. A possible impairment has taken place when thereare presence of known difficulties in the payment of obligation by counterparties, a significantcredit rating downgrade takes place, infringement of the original terms of the contract hashappened, or when there is an inability to pay principal or interest overdue beyond a certainthreshold (e.g., 90 days). These and other factors, either singly or in tandem with other factors,constitute observable events and/or data that meet the definition of an objective evidence ofimpairment.
The two methodologies applied by the Group in assessing and measuring impairment or creditlosses include:
a. Specific (individual) assessmentThe Group assesses each individually significant credit exposure or advances for any objectiveevidence of impairment.
Among the items and factors considered by the Group when assessing and measuring specificimpairment/credit allowances are:
∂ the going concern of the borrower’s business;∂ the ability of the borrower to repay its obligations during financial crises;∂ the projected receipts or expected cash flows;∂ the availability of other sources of financial support;∂ the existing realizable value of collateral; and∂ the timing of the expected cash flows.
The impairment or credit allowances, if any, are evaluated every quarter or as the need arise inview of favorable or unfavorable developments.
- 57 -
*SGVFS021357*
b. Collective assessmentLoans and advances that are not individually significant (e.g., credit cards, housing loans, carloans, development incentives loans, fringe benefit loans) and individually significant loansand advances where there is no apparent evidence of individual impairment are collectivelyassessed for impairment. A particular portfolio is reviewed every quarter to determine itscorresponding appropriate allowances.
Impairment losses are estimated by taking into consideration the following information:
∂ historical losses of the portfolio;∂ current adverse economic conditions that have direct impact on the portfolio; and∂ expected receipts and recoveries once impaired.
Refer to Note 16 for the detailed information on the allowance for credit losses on loans andreceivables and other financial assets.
Liquidity Risk and Funding ManagementLiquidity risk is generally defined as the current and prospective risk to earnings or capital arisingfrom the Parent Company’s inability to meet its obligations when they come due without incurringunacceptable losses or costs.
The Parent Company’s liquidity management involves maintaining funding capacity toaccommodate fluctuations in asset and liability levels due to changes in the Parent Company’sbusiness operations or unanticipated events created by customer behavior or capital marketconditions. The Parent Company seeks to ensure liquidity through a combination of activemanagement of liabilities, a liquid asset portfolio composed substantially of deposits in primaryand secondary reserves, and the securing of money market lines and the maintenance ofrepurchase facilities to address any unexpected liquidity situations.
Liquidity risk is monitored and controlled primarily by a gap analysis of maturities of relevantassets and liabilities reflected in the maximum cumulative outflow (MCO) report, as well as ananalysis of available liquid assets. The MCO focuses on a 12-month period wherein the 12-monthcumulative outflow is compared to the acceptable MCO limit set by the BOD. Furthermore, aninternal liquidity ratio has been set to determine sufficiency of liquid assets over deposit liabilities.
Liquidity is monitored by the Parent Company on a daily basis through the Treasury Group.Likewise, the RMG monitors the static liquidity via the MCO under normal and stressedscenarios.

- 58 -
*SGVFS021357*
The table below shows the financial assets and financial liabilities’ liquidity information whichincludes coupon cash flows categorized based on the expected date on which the asset will berealized and the liability will be settled. For other assets, the analysis into maturity grouping isbased on the remaining period from the end of the reporting period to the contractual maturity dateor if earlier, the expected date the assets will be realized.
Consolidated2016
Up to 1Month
More than1 Month to
3 Months
More than3 Months to
6 Months
More than6 Months to
1 YearBeyond
1 year TotalFinancial AssetsCOCI P=11,014,663 P=– P=– P=– P=– P=11,014,663Due from BSP and other banks 150,054,162 − − − − 150,054,162Interbank loans receivable 6,487,756 1,005,602 149,965 150,626 − 7,793,949Securities under agreements to resell 1,972,803 − − − − 1,972,803Financial assets at FVPL: Held-for-trading: Government securities 1,318,421 − − − − 1,318,421 Private debt securities 121,166 − − − − 121,166 Equity securities 54,609 − − − − 54,609 Derivative assets: Gross contractual receivable 23,134,620 602,481 363,065 97,557 945,345 25,143,068 Gross contractual payable (23,027,112) (602,494) (359,977) (81,868) (652,495) (24,723,946)
107,508 (13) 3,088 15,689 292,850 419,122 Designated at FVPL Investment in UITFs 6,144 − − − − 6,144AFS investments: Government securities 445,411 1,360,270 833,280 952,375 44,483,507 48,074,843 Private debt securities 216,349 180,604 311,691 608,101 33,527,569 34,844,314 Equity securities − − − − 665,898 665,898HTM investments: Government securities 186,669 188,619 268,121 638,758 42,326,085 43,608,252Loans and receivables: Receivables from customers 51,281,982 61,017,482 22,991,722 21,982,567 322,823,346 480,097,099 Unquoted debt securities 57,846 2,731,616 2,910 2,904 4,211,082 7,006,358 Other receivables 7,747,353 689,651 1,608,947 329,549 12,234,095 22,609,595Other assets 458,636 1,601 2,512 19,799 85,719 568,267Total financial assets P=231,531,478 P=67,175,432 P=26,172,236 P=24,700,368 P=460,650,151 P=810,229,665Financial LiabilitiesDeposit liabilities: Demand P=117,329,019 P=− P=− P=− P=− P=117,329,019 Savings 291,611,443 31,169,095 12,960,373 18,753,987 15,868,774 370,363,672 Time 23,861,628 17,470,857 8,226,400 6,371,654 33,651,214 89,581,753Financial liabilities at FVPL: Derivative liabilities: Gross contractual payable 4,266,633 1,032,083 338,061 97,308 794,951 6,529,036 Gross contractual receivable (4,258,623) (1,027,751) (336,280) (84,515) (589,035) (6,296,204)
8,010 4,332 1,781 12,793 205,916 232,832Bills and acceptances payable 14,828,488 1,107,665 4,390,454 5,074,742 12,967,428 38,368,777Subordinated debt − 51,406 51,406 102,812 4,425,308 4,630,932Accrued interest payable and accrued
other expenses payable 585,761 232,935 247,614 619,526 − 1,685,836Other liabilities 19,114,919 57,012 58,421 11,756 1,483,085 20,725,193Total financial liabilities P=467,339,268 P=50,093,302 P=25,936,449 P=30,947,270 P=68,601,725 P=642,918,014

- 59 -
*SGVFS021357*
Consolidated2015
Up to 1Month
More than1 Month to
3 Months
More than3 Months to
6 Months
More than6 Months to
1 YearBeyond
1 year TotalFinancial AssetsCOCI P=15,220,536 P=– P=– P=– P=– P=15,220,536Due from BSP and other banks 99,653,689 – – – – 99,653,689Interbank loans receivable 5,384,320 416,335 2 – – 5,800,657Securities held under agreements to
resell 14,583,112 – – – – 14,583,112Financial assets at FVPL: Held-for-trading: Government securities 3,979,182 – – – – 3,979,182 Private debt securities 143,800 – – – – 143,800 Equity securities 199,922 – – – – 199,922 Derivative assets: Gross contractual receivable 16,817,945 2,059,068 28,125 41,474 348,870 19,295,482 Gross contractual payable (16,752,755) (2,040,301) (18,692) (27,122) (275,264) (19,114,134)
65,190 18,767 9,433 14,352 73,606 181,348Designated at FVPL:
Investment in UITFs 17,261 – – – – 17,261AFS investments: Government securities 1,059,295 520,629 951,709 1,001,232 56,959,465 60,492,330 Private debt securities 183,767 534,094 307,439 11,562 27,717,072 28,753,934 Equity securities – – – – 827,647 827,647HTM investments: Government securities 180,144 180,557 258,803 678,216 38,629,314 39,927,034Loans and receivables: Receivables from customers 66,383,185 52,578,247 14,540,326 22,197,081 271,348,146 427,046,985 Unquoted debt securities – 944 7,228 76,792 4,178,634 4,263,598 Other receivables 2,726,391 573,776 1,451,743 346,294 14,761,243 19,859,447Other assets 247,521 2,300 1,405 1,141 50,605 302,972Total financial assets P=210,027,315 P=54,825,649 P=17,528,088 P=24,326,670 P=414,545,732 P=721,253,454Financial LiabilitiesDeposit liabilities: Demand P=110,029,680 P=– P=– P=– P=– P=110,029,680 Savings 260,880,163 25,250,869 11,251,179 5,732,360 13,745,867 316,860,438 Time 14,063,900 9,319,023 6,449,528 3,815,186 27,445,340 61,092,977Financial liabilities at FVPL: Derivative liabilities: Gross contractual payable 5,543,024 2,890,536 255,308 41,235 283,752 9,013,855 Gross contractual receivable (5,500,389) (2,829,870) (246,017) (27,122) (275,264) (8,878,662)
42,635 60,666 9,291 14,113 8,488 135,193Bills and acceptances payable 4,075,366 1,437,194 89,661 538,023 20,204,285 26,344,529Subordinated debt – 161,094 161,094 102,813 10,102,813 10,527,814Accrued interest payable and accrued
other expenses payable 1,019,379 158,692 17,574 23,423 1,564,522 2,783,590Other liabilities 16,994,824 336,090 397,086 126,790 1,432,971 19,287,761Total financial liabilities P=407,105,947 P=36,723,628 P=18,375,413 P=10,352,708 P=74,504,286 P=547,061,982

- 60 -
*SGVFS021357*
Parent Company2016
Up to 1Month
More than1 Month to
3 Months
More than3 Months to
6 Months
More than6 Months to
1 YearBeyond
1year TotalFinancial AssetsCOCI P=10,626,525 P=– P=– P=– P=− P=10,626,525Due from BSP and other banks 136,637,734 − − − − 136,637,734Interbank loans receivable 6,600,278 1,009,362 149,965 150,626 − 7,910,231Securities under agreements to resell 1,972,803 − − − − 1,972,803Financial assets at FVPL: Held-for-trading: Government securities 1,318,421 − − − − 1,318,421 Private debt securities 121,166 − − − − 121,166 Equity securities 27,263 − − − − 27,263 Derivative assets: Gross contractual receivable 23,102,042 552,761 39,862 97,557 945,345 24,737,567 Gross contractual payable (22,994,783) (552,786) (36,817) (81,868) (652,494) (24,318,748)
107,259 (25) 3,045 15,689 292,851 418,819AFS investments: Government securities 361,066 1,359,182 782,328 883,536 43,661,794 47,047,906 Private debt securities 164,558 178,096 309,183 603,085 33,009,976 34,264,898 Equity securities − − − − 593,598 593,598HTM investments: Government securities 186,669 188,578 268,090 638,573 42,226,116 43,508,026Loans and receivables: Receivables from customers 47,135,914 58,812,741 20,970,205 19,158,472 288,318,164 434,395,496 Unquoted debt securities − 2,731,616 2,910 2,904 4,211,082 6,948,512 Other receivables 2,400,902 519,217 1,542,416 183,824 11,661,573 16,307,932Other assets 459,877 1,601 2,512 3,156 64,131 531,277Total financial assets P=208,120,435 P=64,800,368 P=24,030,654 P=21,639,865 P=424,039,285 P=742,630,607Financial LiabilitiesDeposit liabilities: Demand P=115,392,463 P=– P=− P=– P=– 115,392,463 Savings 286,307,746 31,169,095 12,960,373 18,753,987 15,868,774 365,059,975 Time 16,846,800 10,047,816 5,080,280 5,038,937 26,252,632 63,266,465Financial liabilities at FVPL: Derivative liabilities: Gross contractual payable 2,740,229 783,483 39,741 97,308 794,951 4,455,712 Gross contractual receivable (2,732,875) (779,167) (38,143) (84,515) (589,035) (4,223,735)
7,354 4,316 1,598 12,793 205,916 231,977Bills and acceptances payable 10,765,961 1,565,459 4,957,897 4,903,913 12,235,687 34,428,917Subordinated debt − 51,406 51,406 102,812 4,425,308 4,630,932Accrued interest payable and accrued
other expenses payable 414,252 236,725 251,453 630,422 − 1,532,852Other liabilities 12,656,889 − 1,731 − 952,255 13,610,875Total financial liabilities P=442,391,465 P=43,074,817 P=23,304,738 P=29,442,864 P=59,940,572 P=598,154,456

- 61 -
*SGVFS021357*
Parent Company2015
Up to 1Month
More than1 Month to
3 Months
More than3 Months to
6 Months
More than6 Months to
1 YearBeyond
1year TotalFinancial AssetsCOCI P=12,598,715 P=– P=– P=– P=– P=12,598,715Due from BSP and other banks 90,656,132 – – – – 90,656,132Interbank loans receivable 5,508,484 441,255 9,061 – – 5,958,800Securities held under agreements to
resell 14,583,112 – – – – 14,583,112Financial assets at FVPL: Held-for-trading: Government securities 3,979,182 – – – – 3,979,182 Private debt securities 143,800 – – – – 143,800 Equity securities 199,708 – – – – 199,708 Derivative assets: Gross contractual receivable 15,866,204 2,057,068 20,125 41,474 348,870 18,333,741 Gross contractual payable (15,801,188) (2,038,302) (10,723) (27,122) (275,264) (18,152,599)
65,016 18,766 9,402 14,352 73,606 181,142AFS investments: Government securities 909,573 369,261 752,825 620,595 56,246,178 58,898,432 Private debt securities 183,767 534,094 269,017 994 27,546,996 28,534,868 Equity securities – – – – 623,958 623,958HTM investments: Government securities 180,144 180,557 258,803 614,748 38,598,427 39,832,679Loans and receivables: Receivables from customers 63,179,932 50,212,435 13,042,482 19,528,423 244,008,754 389,972,026 Unquoted debt securities – 944 7,228 76,792 4,178,634 4,263,598 Other receivables 1,568,082 425,558 1,345,612 140,576 11,047,327 14,527,155Other assets 215,207 2,300 1,405 1,142 34,597 254,651Total financial assets P=193,970,854 P=52,185,170 P=15,695,835 P=20,997,622 P=382,358,477 P=665,207,958Financial LiabilitiesDeposit liabilities: Demand P=108,667,550 P=– P=– P=– P=– P=108,667,550 Savings 256,194,773 25,250,869 11,251,179 5,732,360 13,745,867 312,175,048 Time 13,863,388 5,855,896 4,550,162 3,557,448 23,433,015 51,259,909Financial liabilities at FVPL: Derivative liabilities: Gross contractual payable 4,710,062 2,655,236 20,008 41,235 283,751 7,710,292 Gross contractual receivable (4,667,535) (2,594,639) (10,723) (27,122) (275,264) (7,575,283)
42,527 60,597 9,285 14,113 8,487 135,009Bills and acceptances payable 3,035,251 1,418,949 84,838 436,855 20,204,285 25,180,178Subordinated debt – 161,094 161,094 102,813 10,102,813 10,527,814Accrued interest payable and accrued
other expenses payable 991,128 156,705 14,717 23,239 1,564,522 2,750,311Other liabilities 11,541,802 423,937 165,079 148,918 662,967 12,942,703Total financial liabilities P=394,336,419 P=33,328,047 P=16,236,354 P=10,015,746 P=69,721,956 P=523,638,522
Market RiskMarket risk is the risk to earnings or capital arising from adverse movements in factors that affectthe market value of instruments, products, and transactions in an institutions’ overall portfolio.Market risk arises from market making, dealing, and position taking in interest rate, foreignexchange and equity markets. The succeeding sections provide discussion on the impact ofmarket risk on the Parent Company’s trading and structural portfolios.
Trading market riskTrading market risk exists in the Parent Company as the values of its trading positions aresensitive to changes in market rates such as interest rates, foreign exchange rates and equity prices.The Parent Company is exposed to trading market risk in the course of market making as well asfrom taking advantage of market opportunities. For internal monitoring of the risks in the tradingportfolio, the Parent Company uses the Value at Risk (VaR) as a primary risk measurement tool.It adopts both the Parametric VaR methodology and Historical Simulation Methodology (with99% confidence level) to measure the Parent Company’s trading market risk. Both the Parametric

- 62 -
*SGVFS021357*
models and Historical Simulation models were validated by an external independent validator.Volatilities used in the parametric are updated on a daily basis and are based on historical data fora rolling 261-day period while yields and prices in the historical VaR approach are also updateddaily. The RMG reports the VaR utilization and breaches to limits to the risk taking personnel ona daily basis and to the ALCO and ROC on a monthly basis. All risk reports discussed in the ROCmeeting are noted by the BOD. The VaR figures are back tested to validate the robustness of theVaR model. Results of backtesting on a rolling one year period are reported also to the ROC.
Objectives and limitations of the VaR methodologyThe VaR models are designed to measure market risk in a normal market environment. Themodels assume that any changes occurring in the risk factors affecting the normal marketenvironment will follow a normal distribution. The use of VaR has limitations because it is basedon historical volatilities in market prices and assumes that future price movements will follow astatistical distribution. Due to the fact that VaR relies heavily on historical data to provideinformation and may not clearly predict the future changes and modifications of the risk factors,the probability of large market moves may be under estimated if changes in risk factors fail toalign with the normal distribution assumption. VaR may also be under- or over- estimated due tothe assumptions placed on risk factors and the relationship between such factors for specificinstruments. Even though positions may change throughout the day, the VaR only represents therisk of the portfolios at the close of each business day, and it does not account for any losses thatmay occur beyond the 99.00% confidence level.
VaR assumptions/parametersVaR estimates the potential loss on the current portfolio assuming a specified time horizon andlevel of confidence at 99.00%. The use of a 99.00% confidence level means that, within a one dayhorizon, losses exceeding the VaR figure should occur, on average, not more than once every onehundred days.
BacktestingThe validity of the assumptions underlying the Parent Company’s VaR models can only bechecked by appropriate backtesting procedures. Backtesting is a formal statistical framework thatconsists of verifying that actual losses are within the projected VaR approximations. The ParentCompany adopts both the clean backtesting and dirty backtesting approaches approach inbacktesting. Clean backtesting, consists of comparing the VaR estimates with some hypotheticalP&L values of the portfolio, having kept its composition unchanged. In this case, the sameportfolio is repriced or marked-to-market at the end of the time interval and the hypothetical P&Lis then compared with the VaR. The other method, called dirty backtesting, consists of comparingthe VaR estimates with the actual P&L values at the end of the time horizon. This method,however, may pose a problem if the portfolio has changed drastically because of trading activitiesbetween the beginning and the end of the time horizon since VaR models assume that the portfoliois "frozen" over the horizon. The Parent Company uses the regulatory 3-zone (green, yellow andred) boundaries in evaluating the backtesting results. For the years 2016 and 2015, the number ofobservations which fell outside the VaR is within the allowable number of exceptions in the greenand yellow zones to conclude that there is no problem with the quality and accuracy of the VaRmodels at 99.00% confidence level. Nonetheless, closer monitoring and regular review of themodel’s parameters and assumptions are being conducted.
Stress TestingTo complement the VaR approximations, the Parent Company conducts stress testing on aquarterly basis, the results of which are being reported to the BOD. Scenarios used in the conductof stress test are event driven and represent the worst one-off event of a specific risk factor.Results of stress testing are analyzed in terms of the impact to earnings and capital.

- 63 -
*SGVFS021357*
VaR limitsSince VaR is an integral part of the Parent Company’s market risk management, VaR limits havebeen established annually for all financial trading activities and exposures. Calculated VaRcompared against the VaR limits are monitored. Limits are based on the tolerable risk appetite ofthe Parent Company. VaR is computed on an undiversified basis; hence, the Parent Companydoes not consider the correlation effects of the three trading portfolios.
The tables below show the trading VaR (in millions):
Trading PortfolioForeign
Exchange*Interest
RateEquities
Price Total VaR**December 29, 2016 P=1.65 P=77.87 P=1.39 P=80.91Average Daily 3.35 161.09 4.73 169.17Highest 12.09 444.55 9.14 465.79Lowest 0.62 34.67 1.33 36.62* FX VaR is the bankwide foreign exchange risk** The high and low for the total portfolio may not equal the sum of the individual components as
the highs and lows of the individual trading portfolios may have occurred on different trading days
Trading PortfolioForeign
Exchange*Interest
RateEquities
Price Total VaR**December 29, 2015 P=1.99 P=296.83 P=8.81 P=307.63Average Daily 3.67 306.33 8.99 318.99Highest 14.52 420.79 10.50 392.93Lowest 0.92 144.96 7.19 170.35* FX VaR is the bankwide foreign exchange risk** The high and low for the total portfolio may not equal the sum of the individual components as
the highs and lows of the individual trading portfolios may have occurred on different trading days
The table below shows the interest rate VaR for AFS investments (in millions):
2016 2015End of year P=1,399.01 P=1,303.05Average Daily 1,261.85 1,249.75Highest 1,575.39 1,444.14Lowest 859.08 797.87
Structural Market Risk
Non-trading Market RiskInterest rate riskThe Parent Company seeks to ensure that exposure to fluctuations in interest rates are kept withinacceptable limits. Interest margins may increase as a result of such changes but may be reduced ormay create losses in the event that unexpected movements arise.
Repricing mismatches will expose the Parent Company to interest rate risk. The Parent Companymeasures the sensitivity of its assets and liabilities to interest rate fluctuations by way of a“repricing gap” analysis using the repricing characteristics of its financial instrument positionstempered with approved assumptions. To evaluate earnings exposure, interest rate sensitiveliabilities in each time band are subtracted from the corresponding interest rate assets to produce a“repricing gap” for that time band. The difference in the amount of assets and liabilities maturingor being repriced over a one year period would then give the Parent Company an indication of theextent to which it is exposed to the risk of potential changes in net interest income. A negativegap occurs when the amount of interest rate sensitive liabilities exceeds the amount of interest rate

- 64 -
*SGVFS021357*
sensitive assets. Vice versa, positive gap occurs when the amount of interest rate sensitive assetsexceeds the amount of interest rate sensitive liabilities.
During a period of rising interest rates, a company with a positive gap is better positioned becausethe company’s assets are refinanced at increasingly higher interest rates increasing the net interestmargin of the company over time. During a period of falling interest rates, a company with apositive gap would show assets repricing at a faster rate than one with a negative gap, which mayrestrain the growth of its net income or result in a decline in net interest income.
For risk management purposes, the loan accounts are assessed based on next repricing date, thusas an example, if a loan account is scheduled to reprice three years from year-end report date,slotting of the account will be based on the date of interest repricing. Deposits with no specificmaturity dates are excluded in the one-year repricing gap except for the portion of volatile regularsavings deposits which are assumed to be withdrawn during the one year period and assumed to bereplaced by a higher deposit rate.
The Parent Company uses the Earnings at Risk (EaR) methodology to measure the likely interestmargin compression in case of adverse change in interest rates given the Parent Company’srepricing gap. The repricing gap covering the one-year period is multiplied by an assumed changein interest rates to yield an approximation of the change in net interest income that would resultfrom such an interest rate movement. The Parent Company’s BOD sets a limit on the level of EaRexposure tolerable to the Parent Company. EaR exposure and compliance to the EaR limit ismonitored monthly by the RMG and subject to a quarterly stress test.
The following table sets forth the repricing gap position of the Group and the Parent Company:
Consolidated2016
Up to 1Month
More than1 Month to
3 Months
More than3 Months to
6 Months
More than6 Months to
1 YearBeyond
1 year TotalFinancial Assets*Due from BSP and other banks P=57,091,542 P=3,963,915 P=1,552,139 P=148,711 P=191,407 P=62,947,714Interbank loans receivable 6,483,431 1,158,517 − 149,160 − 7,791,108Receivable from customers and
other receivables - gross** 112,589,715 69,561,736 13,940,309 3,330,898 66,612,092 266,034,750Total financial assets P=176,164,688 P=74,684,168 P=15,492,448 P=3,628,769 P=66,803,499 P=336,773,572Financial Liabilities*Deposit liabilities: Savings P=87,934,546 P=30,744,080 P=19,341,869 P=26,083,607 P=14,471,705 P=178,575,807 Time 22,628,013 11,627,502 8,195,577 6,214,396 11,327,985 59,993,473Bills and acceptances payable 11,916,653 13,623,760 5,416,933 1,084,673 3,843,929 35,885,948Total financial liabilities P=122,479,212 P=55,995,342 P=32,954,379 P=33,382,676 P=29,643,619 P=274,455,228Repricing gap P=53,685,476 P=18,688,826 (P=17,461,931) (P=29,753,907) P=37,159,880 P=62,318,344Cumulative gap 53,685,476 72,374,302 54,912,371 25,158,464 62,318,344 −*Financial instruments that are not subject to repricing/rollforward were excluded.**Receivable from customers excludes residual value of leased assets (Note 10).

- 65 -
*SGVFS021357*
Consolidated2015
Up to 1Month
More than1 Month to
3 Months
More than3 Months to
6 Months
More than6 Months to
1 YearBeyond
1 year TotalFinancial Assets*Due from BSP and other banks P=23,068,982 P=2,139,755 P=441,737 P=414,746 P=226,955 P=26,292,175Interbank loans receivable 5,251,490 158,192 390,702 – – 5,800,384Receivable from customers and
other receivables - gross** 119,503,109 54,698,330 7,568,053 2,524,222 51,382,112 235,675,826Total financial assets P=147,823,581 P=56,996,277 P=8,400,492 P=2,938,968 P=51,609,067 P=267,768,385Financial Liabilities*Deposit liabilities: Savings P=82,042,319 P=26,460,116 P=18,737,481 P=19,104,851 P=12,364,766 P=158,709,533 Time 19,329,798 8,793,128 6,358,168 3,958,490 3,098,634 41,538,218Bills and acceptances payable 3,850,446 1,080,637 1,006,011 1,140,959 18,674,168 25,752,221Total financial liabilities P=105,222,563 P=36,333,881 P=26,101,660 P=24,204,300 P=34,137,568 P=225,999,972Repricing gap P=42,601,018 P=20,662,396 (P=17,701,168) (P=21,265,332) P=17,471,499 P=41,768,413Cumulative gap 42,601,018 63,263,414 45,562,246 24,296,914 41,768,413 –* Financial instruments that are not subject to repricing/rollforward were excluded.** Receivable from customers excludes residual value of leased assets (Note 10).
Parent Company2016
Up to 1Month
More than1 Month to
3 Months
More than3 Months to
6 Months
More than6 Months to
1 YearBeyond
1 year TotalFinancial Assets*Due from BSP and other banks P=49,531,514 P=− P=− P=− P=− P=49,531,514Interbank loans receivable 6,599,689 1,158,517 − 149,160 − 7,907,366Receivable from customers and
other receivables – gross 112,589,715 69,561,736 13,940,309 3,330,898 66,612,092 266,034,750Total financial assets P=168,720,918 P=70,720,253 P=13,940,309 P=3,480,058 P=66,612,092 P=323,473,630Financial Liabilities*Deposit liabilities: Savings P=84,396,897 P=30,689,495 P=19,260,425 P=25,923,172 P=14,471,705 P=174,741,694 Time 18,593,842 5,798,198 5,112,195 4,903,355 3,941,853 38,349,443
Bills and acceptances payable 15,207,904 13,045,275 4,877,709 152,588 703,222 33,986,698Total financial liabilities P=118,198,643 P=49,532,968 P=29,250,329 P=30,979,115 P=19,116,780 P=247,077,835Repricing gap P=50,522,275 P=21,187,285 (P=15,310,020) (P=27,499,057) P=47,495,312 P=76,395,795Cumulative gap 50,522,275 71,709,560 56,399,540 28,900,483 76,395,795 −*Financial instruments that are not subject to repricing/rollforward were excluded.
Parent Company2015
Up to 1Month
More than1 Month to
3 Months
More than3 Months to
6 Months
More than6 Months to
1 YearBeyond
1 year TotalFinancial Assets*Due from BSP and other banks P=17,271,237 P=– P=– P=24,707 P=– P=17,295,944Interbank loans receivable 5,409,633 158,192 390,702 – – 5,958,527Receivable from customers and
other receivables - gross 119,503,109 54,698,330 7,568,053 2,524,222 51,382,112 235,675,826Total financial assets P=142,183,979 P=54,856,522 P=7,958,755 P=2,548,929 P=51,382,112 P=258,930,297Financial Liabilities*Deposit liabilities: Savings P=78,666,283 P=26,460,116 P=18,737,481 P=19,104,851 P=12,364,766 P=155,333,497 Time 15,232,475 5,339,910 4,446,307 3,721,070 2,982,331 31,722,093
Bills and acceptances payable 3,257,332 351,318 479,587 283,413 20,258,236 24,629,886Total financial liabilities P=97,156,090 P=32,151,344 P=23,663,375 P=23,109,334 P=35,605,333 P=211,685,476Repricing gap P=45,027,889 P=22,705,178 (P=15,704,620) (P=20,560,405) P=15,776,779 P=47,244,821Cumulative gap 45,027,889 67,733,067 52,028,447 31,468,042 47,244,821 –.*Financial instruments that are not subject to repricing/rollforward were excluded.
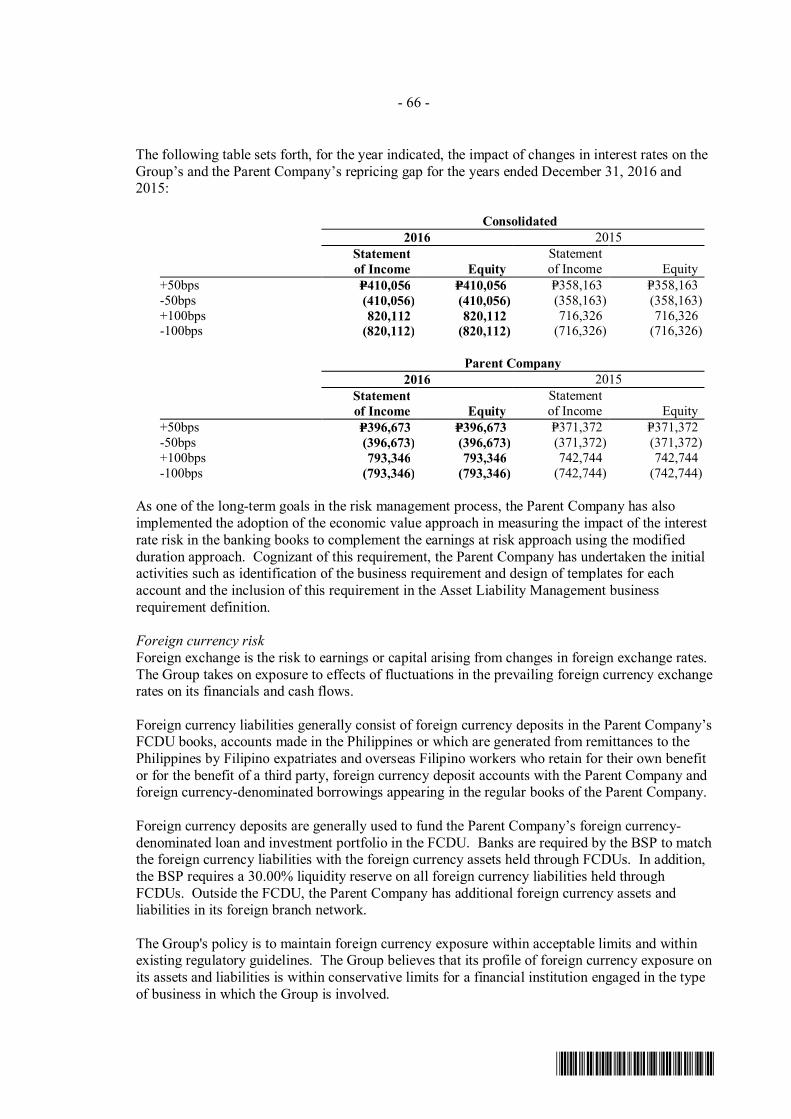
- 66 -
*SGVFS021357*
The following table sets forth, for the year indicated, the impact of changes in interest rates on theGroup’s and the Parent Company’s repricing gap for the years ended December 31, 2016 and2015:
Consolidated2016 2015
Statementof Income Equity
Statementof Income Equity
+50bps P=410,056 P=410,056 P=358,163 P=358,163-50bps (410,056) (410,056) (358,163) (358,163)+100bps 820,112 820,112 716,326 716,326-100bps (820,112) (820,112) (716,326) (716,326)
Parent Company2016 2015
Statementof Income Equity
Statementof Income Equity
+50bps P=396,673 P=396,673 P=371,372 P=371,372-50bps (396,673) (396,673) (371,372) (371,372)+100bps 793,346 793,346 742,744 742,744-100bps (793,346) (793,346) (742,744) (742,744)
As one of the long-term goals in the risk management process, the Parent Company has alsoimplemented the adoption of the economic value approach in measuring the impact of the interestrate risk in the banking books to complement the earnings at risk approach using the modifiedduration approach. Cognizant of this requirement, the Parent Company has undertaken the initialactivities such as identification of the business requirement and design of templates for eachaccount and the inclusion of this requirement in the Asset Liability Management businessrequirement definition.
Foreign currency riskForeign exchange is the risk to earnings or capital arising from changes in foreign exchange rates.The Group takes on exposure to effects of fluctuations in the prevailing foreign currency exchangerates on its financials and cash flows.
Foreign currency liabilities generally consist of foreign currency deposits in the Parent Company’sFCDU books, accounts made in the Philippines or which are generated from remittances to thePhilippines by Filipino expatriates and overseas Filipino workers who retain for their own benefitor for the benefit of a third party, foreign currency deposit accounts with the Parent Company andforeign currency-denominated borrowings appearing in the regular books of the Parent Company.
Foreign currency deposits are generally used to fund the Parent Company’s foreign currency-denominated loan and investment portfolio in the FCDU. Banks are required by the BSP to matchthe foreign currency liabilities with the foreign currency assets held through FCDUs. In addition,the BSP requires a 30.00% liquidity reserve on all foreign currency liabilities held throughFCDUs. Outside the FCDU, the Parent Company has additional foreign currency assets andliabilities in its foreign branch network.
The Group's policy is to maintain foreign currency exposure within acceptable limits and withinexisting regulatory guidelines. The Group believes that its profile of foreign currency exposure onits assets and liabilities is within conservative limits for a financial institution engaged in the typeof business in which the Group is involved.

- 67 -
*SGVFS021357*
The table below summarizes the exposure to foreign exchange rate risk. Included in the table arethe financial assets and liabilities at carrying amounts, categorized by currency (amounts inPhilippine peso equivalent).
Consolidated2016 2015
USD Others* Total USD Others* TotalAssetsCOCI and due from BSP P=2,439,520 P=364,532 P=2,804,052 P=2,442,421 P=367,924 P=2,810,345Due from other banks 6,963,920 12,842,915 19,806,835 8,864,214 8,878,761 17,742,975Interbank loans receivable and securities
held under agreements to resell 2,465,839 1,650,496 4,116,335 2,309,227 1,207,330 3,516,557Loans and receivables 13,443,688 697,144 14,140,832 17,533,276 508,518 18,041,794Financial assets at FVPL − − − 103 31,488 31,591AFS investments 1,876,850 1,958,502 3,835,352 483,785 942,936 1,426,721HTM investments 8,026 – 8,026 3,183 – 3,183Other assets 92,922 82,444 175,366 47,315 49,465 96,780Total assets 27,290,765 17,596,033 44,886,798 31,683,524 11,986,422 43,669,946LiabilitiesDeposit liabilities 9,857,351 3,679,624 13,536,975 9,778,371 3,354,614 13,132,985Derivative liabilities 427 529 956 92 169 261Bills and acceptances payable 4,931,773 225,866 5,157,639 2,968,079 292,304 3,260,383Accrued interest payable 41,222 105,904 147,126 1,591,617 39,457 1,631,074Other liabilities 1,070,134 520,406 1,590,540 677,965 409,194 1,087,159Total liabilities 15,900,907 4,532,329 20,433,236 15,016,124 4,095,738 19,111,862Net Exposure P=11,389,858 P=13,063,704 P=24,453,562 P=16,667,400 P=7,890,684 P=24,558,084* Other currencies include UAE Dirham (AED,) Australia dollar (AUD), Bahrain dollar (BHD), Brunei dollar (BND), Canada dollar
(CAD), Swiss franc (CHF), China Yuan (CNY), Denmark kroner (DKK), Euro (EUR), UK pound (GBP), Hong Kong dollar (HKD),Indonesia rupiah (IDR), Japanese yen (JPY), New Zealand dollar (NZD), PHP, Saudi Arabia riyal (SAR), Sweden kroner (SEK),Singapore dollar (SGD), South Korean won (SKW), Thailand baht (THB) and Taiwan dollar (TWD).
Parent Company2016 2015
USD Others* Total USD Others* TotalAssetsCOCI and due from BSP P=134,521 P=236,225 P=370,746 P=351,524 P=267,197 P=618,721Due from other banks 2,342,535 8,514,773 10,857,308 2,145,720 7,254,596 9,400,316Interbank loans receivable and securities
held under agreements to resell 1,816,463 1,449,239 3,265,702 1,432,622 1,006,287 2,438,909Loans and receivables 11,638,723 452,175 12,090,898 14,306,521 288,917 14,595,438Financial assets at FVPL – – – – 31,427 31,427AFS investments 1,876,314 1,891,150 3,767,464 483,277 862,008 1,345,285HTM investments 8,026 – 8,026 3,183 – 3,183Other assets 92,922 268 93,190 47,212 247 47,459Total assets 17,909,504 12,543,830 30,453,334 18,770,059 9,710,679 28,480,738LiabilitiesDeposit liabilities 1,990,870 3,308,204 5,299,074 2,081,030 2,984,574 5,065,604Derivative liabilities – 529 529 – 169 169Bills and acceptances payable 4,763,163 70,183 4,833,346 2,706,703 143,323 2,850,026Accrued interest payable 34,342 19,023 53,365 1,584,964 17,546 1,602,510Other liabilities 914,852 104,947 1,019,799 663,161 249,935 913,096Total liabilities 7,703,227 3,502,886 11,206,113 7,035,858 3,395,547 10,431,405Net Exposure P=10,206,277 P=9,040,944 P=19,247,221 P=11,734,201 P=6,315,132 P=18,049,333* Other currencies include AED, AUD, BHD, BND, CAD, CHF, CNY, DKK, EUR, GBP, HKD, IDR, JPY, NZD, PHP, SAR, SEK,
SGD, SKW, THB and TWD.
Information relating to the Parent Company’s currency derivatives is contained in Note 23.The Parent Company has outstanding foreign currency spot transactions (in equivalent pesoamounts) of P=1.1 billion (sold) and P=265.7 million (bought) as of December 31, 2016 andP=1.2 billion (sold) and P=3.9 billion (bought) as of December 31, 2015.

- 68 -
*SGVFS021357*
The exchange rates used to convert the Group and the Parent Company’s US dollar-denominatedassets and liabilities into Philippine peso as of December 31, 2016 and 2015follow:
2016 2015US dollar - Philippine peso exchange rate P=49.72 to USD1.00 P=47.06 to USD1.00
The following tables set forth the impact of the range of reasonably possible changes in the USdollar-Philippine peso exchange rate on the Group and the Parent Company’s income beforeincome tax and equity (due to the revaluation of monetary assets and liabilities) for the yearsended December 31, 2016 and 2015:
2016Consolidated Parent Company
Statementof Income Equity
Statementof Income Equity
+1.00% P=95,130 P=113,899 P=83,300 P=102,063-1.00% (95,130) (113,899) (83,300) (102,063)
2015Consolidated Parent Company
Statementof Income Equity
Statementof Income Equity
+1.00% P=161,836 P=166,674 P=112,509 P=117,342-1.00% (161,836) (166,674) (112,509) (117,342)
The Group and the Parent Company do not expect the impact of the volatility on other currenciesto be material.
Capital management and management of insurance and financial risksGovernance frameworkThe Group has established a risk management function with clear terms of reference and with theresponsibility for developing policies on market, credit, liquidity, insurance and operational risks.It also supports the effective implementation of policies at the overall company and individualbusiness unit levels.
The policies define the Group’s identification of risk and its interpretation, limit structure toensure the appropriate quality and diversification of assets, alignment of underwriting andreinsurance strategies to the corporate goals and specific reporting requirements.
Regulatory frameworkRegulators are interested in protecting the rights of the policyholders and maintain close vigil toensure that the Group is satisfactorily managing affairs for their benefit. At the same time, theregulators are also interested in ensuring that the Group maintains appropriate solvency position tomeet liabilities arising from claims and that the risk levels are at acceptable levels.
The Group has an insurance business which is subject to the regulatory requirements of theInsurance Commission (IC). Such regulations not only prescribe approval and monitoring ofactivities but also impose certain restrictive provisions (e.g., fixed capitalization requirements,risk-based capital requirements).

- 69 -
*SGVFS021357*
Capital managementAPLII’s and PNB General Insurers Inc. (PNB Gen’s) capital management framework is alignedwith the statutory requirements imposed by the IC. To ensure compliance with these externallyimposed capital requirements, it is the policy of APLII and PNB Gen to assess its position againstset minimum capital requirements.
Under the requirements of the IC and the Insurance Code, APLII and PNB Gen should meet theminimum levels set for the following capital requirements: Minimum Statutory Net Worth -P=250.0 million, P=550.0 million, P=900.0 million and P=1.3 billion with compliance dates ofJune 30, 2013, December 31, 2016, December 31, 2019 and December 31, 2022, respectively; andRisk-Based Capital (RBC) - 100.00% for both life and nonlife insurance companies.
The required investments in government bonds and securities of at least 25.00% of the MinimumPaid-up Capital, under Section 203 of the Insurance Code, are free from liens and encumbrances.
The Group manages the capital of its subsidiaries in accordance with the capital requirements ofthe relevant regulatory agency, such as the IC, SEC and Philippine Stock Exchange (PSE). APLIIhas fully complied with the relevant capital requirements having an estimated statutory net worthamounting to P=1.5 billion and P=1.4 billion as of December 31, 2016 and 2015, respectively, andRBC ratio of 185.00% and 187.00% as of December 31, 2016 and 2015, respectively. As ofDecember 31, 2016 and 2015, PNB Gen has an estimated statutory net worth amounting toP=484.3 million and P=374.0 million, respectively. PNB Gen’s RBC ratio as of December 31, 2016and 2015 is 72.00% and 21.55%, respectively.
In a letter dated January 11, 2017 addressed to the Parent Company, the BSP approved onDecember 28, 2016 the request of the Parent Company to infuse P=200.0 million in PNB Gensubject to regulatory compliance and reporting conditions, and to be booked by the latter ascontingency surplus in compliance with IC Circular Letter (CL) No. 2015-02-A dated January 13,2015.
Under Section D of IMC No. 7-2006, Mandatory Control Event shall occur if the RBC ratio of thecompany is less than 35.00%. Should this event occur, the Commissioner is required to place thecompany under regulatory control under Section 247 (Title 13, Suspension or Revocation ofAuthority) of the Code. The Mandatory Control Event shall be deemed sufficient grounds for theCommissioner to take action under Section 247 of the Insurance Code.
PNB Gen expects its financial performance to continue to improve in 2017 through strategy ofprofitable growth, effective claims management and more efficient collection of both premiumsreceivable and claims recoverable. These will have positive impact on the RBC ratio, not tomention on the new RBC formula which is presently under consideration.
The final amount of the RBC ratio can be determined only after the accounts of PNB Gen havebeen examined by the IC. Further, the IC has yet to finalize the new RBC computation under theNew Insurance Code.

- 70 -
*SGVFS021357*
5. Fair Value Measurement
The methods and assumptions used by the Group in estimating the fair value of its assets andliabilities follow:
Cash equivalents - Carrying amounts approximate fair values due to the relatively short-termmaturity of these investments.
Debt securities - Fair values are generally based upon quoted market prices. If the market pricesare not readily available, fair values are estimated using adjusted quoted market prices ofcomparable investments or using the discounted cash flow methodology.
Equity securities - Fair values of quoted equity securities are based on quoted market prices.While unquoted equity securities are carried at their original cost less impairment if any, since thefair value could not be reliably determined due to the unpredictable nature of future cash flowsand the lack of suitable methods of arriving at a reliable fair value.
Investments in UITFs classified as financial assets designated as at FVPL - Fair values are basedon Net Asset Value per share (NAVps).
Loans and receivables - For loans with fixed interest rates, fair values are estimated using thediscounted cash flow methodology, using the current incremental lending rates for similar types ofloans. For loans with floating interest rates, with repricing frequencies on a quarterly basis, theGroup assumes that the carrying amount approximates fair value.
Investment properties - The fair values of the Group and the Parent Company’s investmentproperties have been determined by the appraisal method by independent external and in-houseappraisers based on highest and best use of property being appraised. Valuations were derived onthe basis of recent sales of similar properties in the same areas as the land, building and investmentproperties and taking into account the economic conditions prevailing at the time the valuationswere made and comparability of similar properties sold with the property being valued.
Financial liabilities - Except for time deposit liabilities, bills payable with long-term maturity andsubordinated debt, the carrying values approximate fair values due to either the presence of ademand feature or the relatively short-term maturities of these liabilities.
Derivative instruments - Fair values are estimated based on quoted market prices or acceptablevaluation models.
Time deposit liabilities, bills payable with long-term maturity and subordinated debt includingdesignated at FVPL - Fair value is determined using the discounted cash flow methodology. Thediscount rate used in estimating the fair values of the subordinated debt and time deposits rangesfrom 2.70% to 6.75% and from 2.66% to 3.77% as of December 31, 2016 and 2015, respectively.
Fair value hierarchyThe Group has assets and liabilities that are measured at fair value on a recurring basis in thestatement of financial position after initial recognition. Recurring fair value measurements arethose that another PFRS requires or permits to be recognized in the statement of financial positionat the end of each reporting period. These include financial assets and liabilities at FVPL and AFSinvestments.

- 71 -
*SGVFS021357*
The Group uses the following hierarchy for determining and disclosing the fair value of assets andliabilities by valuation technique. These levels are based in the inputs that are used to determinethe fair value and can be summarized in:
∂ Level 1 - quoted (unadjusted) prices in active markets for identical assets or liabilities∂ Level 2 - valuation techniques for which the lowest level input that is significant to their fair
value measurement is directly or indirectly observable∂ Level 3 - valuation techniques for which the lowest level of input that is significant to their
fair value measurement is unobservable
The Group and the Parent Company held the following financial assets and liabilities measured atfair value and at cost but for which fair values are disclosed and their corresponding level in fairvalue hierarchy:
Consolidated2016
Valuation Date
Carrying Value Level 1 Level 2 Level 3 Total
Assets measured at fair value:Financial AssetsFinancial assets at FVPL:
Government securities 12/29/16 P=1,313,400 P=1,300,293 P=13,107 P=– P=1,313,400Derivative assets 12/29/16 419,122 – 357,577 61,545 419,122Private debt securities 12/29/16 120,589 112,605 7,984 – 120,589Equity securities 12/29/16 54,609 54,609 – – 54,609Investments in UITF 12/29/16 6,144 – 6,144 – 6,144
AFS investments:Government securities 12/29/16 37,834,559 34,416,113 3,418,446 – 37,834,559Private debt securities 12/29/16 28,841,070 26,177,419 2,663,651 – 28,841,070Equity securities* 12/29/16 493,958 493,958 – – 493,958
P=69,083,451 P=62,554,997 P=6,466,909 P=61,545 P=69,083,451Liabilities measured at fair value:Financial LiabilitiesFinancial Liabilities at FVPL:
Designated at FVPL:Derivative liabilities 12/29/16 P=232,832 – P=232,832 – P=232,832
Assets for which fair values aredisclosed:
Financial AssetsHTM investments 12/29/16 P=24,174,479 P=21,282,956 P=3,807,936 P=– P=25,090,892Loans and Receivables:**
Receivables from customers 12/29/16 406,534,024 – – 412,236,428 412,236,428Unquoted debt securities 12/29/16 3,285,222 – – 3,305,345 3,305,345
P=433,993,725 P=21,282,956 P=3,807,936 P=415,541,773 P=440,632,665Nonfinancial AssetsInvestment property:***
Land 12/29/16 P=13,309,379 P=– P=– P=19,019,263 P=19,019,263Buildings and improvements 12/29/16 3,031,873 – – 3,963,475 3,963,475
P=16,341,252 P=– P=– P=22,982,738 P=22,982,738Liabilities for which fair values aredisclosed:Financial LiabilitiesFinancial liabilities at amortized cost:
Time deposits 12/29/16 P=84,375,617 P=– P=– P=86,109,334 P=86,109,334Bills payable 12/29/16 34,226,608 – – 38,468,732 38,468,732Subordinated debt 12/29/16 3,497,798 – – 3,551,484 3,551,484
P=122,100,023 P=– P=– P=128,129,550 P=128,129,550* Excludes unquoted available-for-sale securities (Note 9)** Net of allowance for credit losses (Note 10)*** Based on the fair values from appraisal reports which is different from their carrying amounts which are carried at cost (Note 13)

- 72 -
*SGVFS021357*
Consolidated2015
Valuation Date
Carrying Value Level 1 Level 2 Level 3 Total
Assets measured at fair value:Financial AssetsFinancial assets at FVPL:
Government securities 12/29/2015 P=3,968,214 P=2,636,413 P=1,331,801 P=– P=3,968,214Derivative assets 12/29/2015 181,348 – 118,016 63,332 181,348Private debt securities 12/29/2015 143,800 143,800 – – 143,800Equity securities 12/29/2015 199,922 199,752 170 – 199,922Investment in UITFs 12/29/2015 17,261 – 17,261 – 17,261
AFS investments:Government securities 12/29/2015 45,260,397 33,499,835 11,760,562 – 45,260,397Private debt securities 12/29/2015 22,252,980 21,614,280 638,700 – 22,252,980Equity securities* 12/29/2015 653,931 560,272 93,659 – 653,931
Assets of a Disposal GroupClassified as Held for Sale:Financial assets at FVPL:
Segregated fund assets 12/29/2015 13,634,687 7,854,450 – 5,780,237 13,634,687AFS Investments
Government securities 12/29/2015 2,485,902 2,485,902 – – 2,485,902Other debt securities 12/29/2015 3,604,065 3,604,065 – – 3,604,065Equity securities* 12/29/2015 1,378,686 1,378,686 – – 1,378,686
P=93,781,193 P=73,977,455 P=13,960,169 P=5,843,569 P=93,781,193Liabilities measured at fair value:Financial LiabilitiesFinancial Liabilities at FVPL:
Designated at FVPL:Derivative liabilities 12/29/2015 P=135,193 P=– P=135,193 P=– P=135,193
Liabilities of Disposal GroupClassified as Held for SaleFinancial Liabilities at FVPL:
Segregated fund liabilities**** 12/29/2015 13,634,687 7,854,450 – 5,780,237 13,634,687P=13,769,880 P=7,854,450 P=135,193 P=5,780,237 P=13,769,880
Assets for which fair values aredisclosed:
Financial AssetsHTM investments 12/29/2015 P=23,231,997 P=18,729,222 P=5,887,982 P=– P=24,617,204Loans and Receivables:**
Receivables from customers 12/29/2015 349,176,265 – – 360,136,440 360,136,440Unquoted debt securities 12/29/2015 625,802 – – 648,046 648,046
Assets of a Disposal GroupClassified as Held for Sale:
HTM investments 12/29/2015 1,269,398 1,336,814 – – 1,336,814P=374,303,462 P=20,066,036 P=5,887,982 P=360,784,486 P=386,738,504
Nonfinancial AssetsInvestment property:***
Land 2015 P=11,432,653 P=– P=– P=21,012,616 P=21,012,616Buildings and improvements 2015 1,797,352 – – 3,584,585 3,584,585
P=13,230,005 P=– P=– P=24,597,201 P=24,597,201Liabilities for which fair values aredisclosed:Financial LiabilitiesFinancial liabilities at amortized cost:
Time deposits 12/29/2015 P=60,552,445 P=– P=– P=60,762,710 P=60,762,710Bills payable 1229/2015 25,407,406 – – 25,033,940 25,033,940Subordinated debt 12/29/2015 9,986,427 – – 10,241,659 10,241,659
P=95,946,278 P=– P=– P=96,038,309 P=96,038,309* Excludes unquoted available-for-sale securities (Note 9)** Net of allowance for credit losses (Note 10)*** Based on the fair values from appraisal reports which is different from their carrying amounts which are carried at cost (Note 13)**** Excludes cash component

- 73 -
*SGVFS021357*
Parent Company2016
ValuationDate
CarryingValue Level 1 Level 2 Level 3 Total
Assets measured at fair value:Financial AssetsFinancial assets at FVPL:
Government securities 12/29/16 P=1,313,400 P=1,300,293 P=13,107 P=– P=1,313,400Derivative assets 12/29/16 418,819 – 357,274 61,545 418,819Private debt securities 12/29/16 120,589 112,605 7,984 – 120,589Equity securities 12/29/16 27,263 27,263 – – 27,263
AFS investments:Government securities 12/29/16 36,900,930 33,482,484 3,418,446 – 36,900,930Private debt securities 12/29/16 28,325,207 25,661,556 2,663,651 – 28,325,207Equity securities* 12/29/16 439,819 439,819 – – 439,819
P=67,546,027 P=61,024,020 P=6,460,462 P=61,545 P=67,546,027Liabilities measured at fair value:Financial LiabilitiesFinancial Liabilities at FVPL:
Designated at FVPL:Derivative liabilities 12/29/16 P=231,977 – P=231,977 – P=231,977
Assets for which fair values aredisclosed:Financial AssetsHTM investments 12/29/16 P=24,074,898 P=21,183,585 P=3,807,936 – P=24,991,521Loans and Receivables:**
Receivables from customers 12/29/16 362,702,715 – – 368,405,370 368,405,370Unquoted debt securities 12/29/16 3,227,376 – – 3,247,498 3,247,498
P=390,004,989 P=21,183,585 P=3,807,936 P=371,652,868 P=396,644,389Nonfinancial AssetsInvestment property:***
Land 12/29/16 13,341,300 – – 18,800,199 18,800,199Buildings and improvements 12/29/16 2,633,830 – – 3,364,011 3,364,011
P=15,975,130 – – P=22,164,210 P=22,164,210Liabilities for which fair values aredisclosed:Financial LiabilitiesFinancial liabilities at amortized cost:
Time deposits 12/29/16 P=62,731,586 – – P=62,154,985 P=62,154,985Bills payable 12/29/16 32,327,358 – – 32,641,258 32,641,258Subordinated debt 12/29/16 3,497,798 – – 3,551,484 3,551,484
P=98,556,742 – – P=98,347,727 P=98,347,727* Excludes unquoted available-for-sale securities (Note 9)** Net of allowance for credit losses (Note 10)*** Based on the fair values from appraisal reports which is different from their carrying amounts which are carried at cost (Note 13)
Parent Company2015
ValuationDate
CarryingValue Level 1 Level 2 Level 3 Total
Assets measured at fair value:Financial AssetsFinancial assets at FVPL:
Government securities 12/29/2015 P=3,968,214 P=2,636,413 P=1,331,801 P=– P=3,968,214Derivative assets 12/29/2015 181,142 – 117,810 63,332 181,142Private debt securities 12/29/2015 143,800 143,800 – – 143,800Equity securities 12/29/2015 199,708 199,708 – – 199,708
AFS investments:Government securities 12/29/2015 44,075,209 32,314,647 11,760,562 – 44,075,209Private debt securities 12/29/2015 22,035,585 21,396,885 638,700 – 22,035,585Equity securities* 12/29/2015 450,749 357,090 93,659 – 450,749
P=71,054,407 P=57,048,543 P=13,942,532 P=63,332 P=71,054,407Liabilities measured at fair value:Financial Liabilities
Derivative liabilities 12/29/2015 P=135,009 P=– P=135,009 P=– P=135,009
(Forward)

- 74 -
*SGVFS021357*
Parent Company2015
ValuationDate
CarryingValue Level 1 Level 2 Level 3 Total
Assets for which fair values aredisclosed:
Financial AssetsHTM investments 12/29/2015 P=23,137,643 P=18,634,867 P=5,887,982 P=– P=24,522,849Loans and Receivables:**
Receivables from customers 12/29/2015 316,730,942 – – 325,917,837 325,917,837Unquoted debt securities 12/29/2015 625,802 – – 648,046 648,046
P=340,494,387 P=18,634,867 P=5,887,982 P=326,565,883 P=351,088,732Nonfinancial AssetsInvestment properties:***
Land 2015 P=13,045,427 P=– P=– P=21,290,540 P=21,290,540Buildings and improvements 2015 1,621,404 – – 2,912,787 2,912,787
P=14,666,831 P=– P=– P=24,203,327 P=24,203,327Liabilities for which fair values are
disclosed:Financial LiabilitiesFinancial liabilities at amortized cost:
Time deposits 12/29/2015 P=50,736,320 P=– P=– P=50,946,585 P=50,946,585Bills payable 12/29/2015 24,285,071 – – 23,904,966 23,904,966Subordinated debt 12/29/2015 9,986,427 – – 10,241,659 10,241,659
P=85,007,818 P=– P=– P=85,093,210 P=85,093,210* Excludes unquoted available-for-sale securities (Note 9)** Net of allowance for credit losses (Note 10)*** Based on the fair values from appraisal reports which is different from their carrying amounts which are carried at cost (Note 13)
When fair values of listed equity and debt securities, as well as publicly traded derivatives at thereporting date are based on quoted market prices or binding dealer price quotations, without anydeduction for transaction costs, the instruments are included within Level 1 of the hierarchy.
For all other financial instruments, fair value is determined using valuation techniques. Valuationtechniques include net present value techniques, comparison to similar instruments for whichmarket observable prices exist and other revaluation models.
Significant input used in determining fair values of financial instruments under Level 2 comprisesof interpolated market rates of benchmark securities. For investments in UITFs, fair values aredetermined based on published NAVps as of reporting date.
As of December 31, 2016 and 2015, there were no transfers between Level 1 and Level 2 fairvalue measurements, and no transfers into and out of Level 3 fair value measurements.
The following table shows a reconciliation of the beginning and closing amount of Level 3financial assets and liabilities which are recorded at fair value:
Consolidated Parent Company2016 2015 2016 2015
Financial assetsBalance at beginning of year P=5,843,569 P=5,339,628 P=63,332 P=71,160Fair value changes recognized in
profit or loss (1,787) 503,941 (1,787) (7,828)Change arising from sale of direct
interest in a subsidiary (5,780,237) – – −Balance at end of year P=61,545 P=5,843,569 P=61,545 P=63,332
(Forward)

- 75 -
*SGVFS021357*
Consolidated Parent Company2016 2015 2016 2015
Financial liabilitiesBalance at beginning of year P=5,780,237 P=5,268,468 P=– P=–Fair value changes recognized in
profit or loss – 511,769 – –Change arising from sale of direct
interest in a subsidiary (5,780,237) – – –Balance at end of year P=– P=5,780,237 P=– P=–
Equity and/or Credit-Linked Notes are shown as ‘Assets of Disposal Group Classified as Held forSale’ as of December 31, 2015 (Note 37).
The structured Variable Unit-Linked Notes can be decomposed into bond components and optionscomponents. The fair value of structured notes has been computed by counterparties using presentvalue calculations and option pricing models, as applicable. The valuation requires managementto make certain assumptions about the model inputs particularly the credit spread of the Issuer.The model also used certain market observable inputs including the counterparty’s credit defaultswap (CDS), PHP interest rate swap (IRS) rates (for the Peso-denominated issuances) and ROPCDS rates (for the USD-denominated issuances).
Description of valuation techniques follow:
Structured Notes Valuation MethodsSignificant UnobservableInputs
Significant ObservableInputs
Peso-denominated DCF Method / MonteCarlo Simulation
Issuer’s Funding rate /Issuer’s CDS as proxy
PHP IRS
Dollar-denominated DCF Method / MonteCarlo Simulation
Issuer’s Funding rate /Issuer’s CDS as proxy
ROP CDS / USD IRS
The sensitivity analysis of the fair market value of the structured notes as of December 31, 2015 isperformed for the reasonable possible movement in the significant inputs with all other variablesheld constant, showing the impact to profit and loss follows:
Sensitivity of the fair value measurement to changes in unobservable inputs:
2015StructuredInvestments
SignificantUnobservable Input
Range ofInput Sensitivity of the Input to Fair Value*
Peso -denominated
Bank CDS Levels 47.28 - 92.37bps
50 bps increase/(decrease) in change inputs wouldresult in a (decrease) / increase in the market valueof the note by P=65,500,462
Dollar -denominated
Bank CDS Levels 40.179 -76.344 bps
50 bps increase/(decrease) in change inputs wouldresult in a (decrease) / increase in the market valueof the note by P=41,710,217
* The sensitivity analysis is performed only on the fixed income portion of the Note, thus are based on assumptions that if changedmay cause the value to fall out of range

- 76 -
*SGVFS021357*
Sensitivity of the fair value measurement to changes in observable inputs:
2015StructuredInvestments
Significant ObservableInput
Range ofInput Sensitivity of the Input to Fair Value*
Peso - denominated PHP IRS (3Y) 180.25 -355.00 bps
50 bps increase/(decrease) in change inputs wouldresult in a (decrease) / increase in the market valueof the note by P=65,500,462
Dollar-denominated
ROP CDS (5Y) 126.15 -193.33 bps
50 bps increase/(decrease) in change inputs wouldresult in a (decrease) / increase in the market valueof the note by P=28,095,617
* The sensitivity analysis is performed only on the fixed income portion of the Note, thus are based on assumptions that if changedmay cause the value to fall out of range
The fair values of warrants have been determined using price quotes received from a third-partybroker without any pricing adjustments imputed by the Parent Company. The valuation modeland inputs used in the valuation which were developed and determined by the third-party brokerwere not made available to the Parent Company. Under such instance, PFRS 13 no longerrequires an entity to create quantitative information to comply with the related disclosurerequirements.
Description of the valuation techniques and significant unobservable inputs used in the valuation ofthe Group and Parent Company’s investment properties follows:
Valuation TechniquesMarket Data Approach A process of comparing the subject property being appraised to
similar comparable properties recently sold or being offered forsale.
Replacement CostApproach
It is an estimate of the investment required to duplicate the propertyin its present condition. It is reached by estimating the value of thebuilding “as if new” and then deducting the depreciated cost.Fundamental to the Cost Approach is the estimate of theimprovement’s Reproduction Cost New.
Significant Unobservable InputsPrice per square meter Ranges from P=800 to P=100,000
Reproduction Cost New The cost to create a virtual replica of the existing structure,employing the same design and similar building materials.
Size Size of lot in terms of area. Evaluate if the lot size of property orcomparable conforms to the average cut of the lots in the area andestimate the impact of lot size differences on land value.
Shape Particular form or configuration of the lot. A highly irregular shapelimits the usable area whereas an ideal lot configuration maximizesthe usable area of the lot which is associated in designing animprovement which conforms with the highest and best use of theproperty.

- 77 -
*SGVFS021357*
Significant Unobservable InputsLocation Location of comparative properties whether on a main road, or
secondary road. Road width could also be a consideration if data isavailable. As a rule, properties located along a main road aresuperior to properties located along a secondary road.
Time Element “An adjustment for market conditions is made if general propertyvalues have appreciated or depreciated since the transaction datesdue to inflation or deflation or a change in investors’ perceptions ofthe market over time”. In which case, the current data is superior tohistoric data.
Discount Generally, asking prices in ads posted for sale are negotiable.Discount is the amount the seller or developer is willing to deductfrom the posted selling price if the transaction will be in cash orequivalent.
Corner influence Bounded by two (2) roads.
6. Segment Information
Business SegmentsThe Group’s operating businesses are determined and managed separately according to the natureof services provided and the different markets served with each segment representing a strategicbusiness unit. The Group’s business segments follow:
Retail Banking - principally handling individual customer’s deposits, and providing consumertype loans, credit card facilities and fund transfer facilities;
Corporate Banking - principally handling loans and other credit facilities and deposit accounts forcorporate and institutional customers
Treasury - principally providing money market, trading and treasury services, as well as themanagement of the Group’s funding operations by use of T-bills, government securities andplacements and acceptances with other banks, through treasury and wholesale banking; and
Other Segments - include, but not limited to, insurance, leasing, remittances and other supportservices. Other support services of the Group comprise of the operations and financial controlgroups.
Transactions between segments are conducted at estimated market rates on an arm’s length basis.Interest is credited to or charged against business segments based on pool rate which approximatesthe marginal cost of funds.
For management purposes, business segment report is done on a quarterly basis. Businesssegment information provided to the BOD, chief operating decision maker (CODM) is based onthe Regulatory Accounting Principles (RAP) submitted to the BSP in compliance with thereportorial requirements under the Financial Reporting Package for banks, which differ fromPFRS. Significant differences arose from the manner of provisioning for impairment and creditlosses, measurement of investment properties and the fair value measurement of financial

- 78 -
*SGVFS021357*
instruments. The report submitted to CODM represents only the results of operation for each ofthe reportable segment.
Segment assets are those operating assets that are employed by a segment in its operating activitiesand that either are directly attributable to the segment or can be allocated to the segment on areasonable basis.
Segment liabilities are those operating liabilities that result from the operating activities of asegment and that either are directly attributable to the segment or can be allocated to the segmenton a reasonable basis.
Segment revenues pertain to the net interest margin and other operating income earned by asegment in its operating activities and that either are directly attributable to the segment or can beallocated to the segment on a reasonable basis.
The Group has no significant customer which contributes 10.00% or more of the consolidatedrevenue.
Business segment information of the Group follows:
2016
RetailBanking
CorporateBanking Treasury Others
Adjustmentsand
Eliminations* TotalNet interest margin
Third party P=1,136,370 P=15,027,877 P=3,014,495 P=126,606 P=261,154 P=19,566,502Inter-segment 5,345,226 (7,756,129) 2,410,903 – – –
Net interest margin after inter-segment transactions 6,481,596 7,271,748 5,425,398 126,606 261,154 19,566,502
Other income 1,896,868 4,274,575 2,284,097 3,323,121 (136,649) 11,642,012Segment revenue 8,378,464 11,546,323 7,709,495 3,449,727 124,505 31,208,514Other expenses (8,207,826) (3,611,997) (200,330) (3,423,737) 576,949 (14,866,941)Segment result P=170,638 P=7,934,326 P=7,509,165 P=25,990 P=701,454 P=16,341,573Unallocated expenses (8,258,520)Net income before income tax 8,083,053Income tax 1,517,030Net income from continuing
operations 6,566,023Net income from discontinued
operations 619,563Non-controlling interest (38,122)Net income for the year
attributable to equity holdersof the Parent Company P=7,147,464
Other segment informationCapital expenditures P=1,063,897 P=5,723 P=961 P=510,870 P=– P=1,581,451Unallocated capital expenditure 852,941Total capital expenditure P=2,434,392Depreciation and amortization P=493,221 P=22,318 P=2,663 P=644,739 P=– P=1,162,941Unallocated depreciation and
amortization 391,704Total depreciation and
amortization P=1,554,645Provision for (reversal of)
impairment, credit and otherlosses P=360,089 P=2,529,286 P=300 P=4,233 P=319,056 P=3,212,964
* The adjustments and eliminations column mainly represent the RAP to PFRS adjustments

- 79 -
*SGVFS021357*
2015
RetailBanking
CorporateBanking Treasury Others
Adjustmentsand
Eliminations* TotalNet interest margin
Third party P=2,396,903 P=11,614,343 P=3,177,360 P=239,257 P=263,976 P=17,691,839Inter-segment 4,287,196 (4,915,106) 627,910 – – –
Net interest margin after inter-segment transactions 6,684,099 6,699,237 3,805,270 239,257 263,976 17,691,839
Other income 1,413,242 4,103,084 2,195,452 1,693,160 545,862 9,950,800Segment revenue 8,097,341 10,802,321 6,000,722 1,932,417 809,838 27,642,639Other expenses (7,808,713) (935,445) (118,411) (3,061,754) (1,076,767) (13,001,090)Segment result P=288,628 P=9,866,876 P=5,882,311 (P=1,129,337) (P=266,929) 14,641,549Unallocated expenses (7,068,331)Net income before income tax 7,573,218Income tax (1,619,554)Net income from continuing
operations 5,953,664Net income from discontinued
operations 357,931Non-controlling interest (198,087)Net income for the year
attributable to equity holdersof the Parent Company P=6,113,508
Other segment informationCapital expenditures P=925,062 P=10,405 P=1,780 P=121,557 P=250,092 P=1,308,896Unallocated capital expenditure 589,574Total capital expenditure P=1,898,470Depreciation and amortization P=558,046 P=132,559 P=6,440 P=542,347 P=143,101 P=1,382,493Unallocated depreciation and
amortization 69,728Total depreciation and
amortization P=1,452,221Provision for (reversal of)
impairment, credit and otherlosses P=301,499 (P=261,596) (P=11,910) P=220,261 P=319,926 P=568,180
* The adjustments and eliminations column mainly represent the RAP to PFRS adjustments
2014
RetailBanking
CorporateBanking Treasury Others
Adjustmentsand
Eliminations* TotalNet interest margin
Third party P=1,306,979 P=11,521,156 P=2,987,955 P=206,786 P=435,786 P=16,458,662Inter-segment 3,928,385 (3,431,729) (496,656) – – –
Net interest margin after inter-segment transactions 5,235,364 8,089,427 2,491,299 206,786 435,786 16,458,662
Other income 2,026,365 4,062,801 1,122,246 2,946,655 (45,859) 10,112,208Segment revenue 7,261,729 12,152,228 3,613,545 3,153,441 389,927 26,570,870Other expenses (7,131,047) (3,677,796) (217,934) (2,158,368) (628,280) (13,813,425)Segment result P=130,682 P=8,474,432 P=3,395,611 P=995,073 (P=238,353) 12,757,445Unallocated expenses (6,159,273)Net income before income tax 6,598,172Income tax (1,367,288)Net income from continuing
operations 5,230,884Net income from discontinued
operations 264,161Non-controlling interest (136,376)Net income for the year
attributable to equity holdersof the Parent Company P=5,358,669
(Forward)

- 80 -
*SGVFS021357*
2014
RetailBanking
CorporateBanking Treasury Others
Adjustmentsand
Eliminations* TotalOther segment informationCapital expenditures P=744,394 P=25,454 P=1,404 P=291,118 P=32,553 P=1,094,923Unallocated capital expenditure 271,486Total capital expenditure P=1,366,409Depreciation and amortization P=140,607 P=110,966 P=5,562 P=720,041 P=276,170 P=1,253,346Unallocated depreciation and
amortization 228,585Total depreciation and
amortization P=1,481,931Provision for (reversal of)
impairment, credit and otherlosses P=545,281 P=859,782 (P=11,766) P=355,627 P=515,691 P=2,264,615
* The adjustments and eliminations column mainly represent the RAP to PFRS adjustments
As of December 31, 2016
RetailBanking
CorporateBanking Treasury Others
Adjustmentsand
Eliminations* TotalSegment assets P=368,781,391 P=359,553,260 P=212,189,932 P=25,351,620 (P=213,533,306) P=752,342,897Unallocated assets 1,422,213Total assets P=753,765,110Segment liabilities P=528,797,409 P=57,719,741 P=64,033,215 P=37,602,324 (P=213,885,651) P=474,267,038Unallocated liabilities 169,557,166Total liabilities P=643,824,204* The adjustments and eliminations column mainly represent the RAP to PFRS adjustments
As of December 31, 2015
RetailBanking
CorporateBanking Treasury Others
Adjustmentsand
Eliminations* TotalSegment assets P=70,842,231 P=278,330,998 P=192,617,758 P=273,895,363 (P=138,148,929) P=677,537,421Unallocated assets 2,150,316Total assets P=679,687,737Segment liabilities P=328,801,574 P=51,043,083 P=50,222,776 P=189,688,815 (P=137,664,873) P=482,091,375Unallocated liabilities 92,840,501Total liabilities P=574,931,876* The adjustments and eliminations column mainly represent the RAP to PFRS adjustments
Geographical SegmentsAlthough the Group’s businesses are managed on a worldwide basis, the Group operates in five(5) principal geographical areas of the world. The distribution of assets, liabilities, creditcommitments items and revenues by geographic region of the Group follows:
Non-current Assets Liabilities Capital Expenditure2016 2015 2016 2015 2016 2015
Philippines P=310,067,651 P=297,495,756 P=615,084,923 P=550,838,120 P=2,195,996 P=1,879,019Asia (excluding Philippines) 6,225,748 6,063,370 24,392,446 20,378,499 232,949 167USA and Canada 77,790,006 74,359,768 4,245,479 3,661,259 461 19,284United Kingdom 2,649,627 728,454 101,356 53,998 4,986 –
P=396,733,032 P=378,647,348 P=643,824,204 P=574,931,876 P=2,434,392 P=1,898,470* Gross of allowance for impairment and credit losses (Note 16), unearned and other deferred income (Note 10), and accumulated
amortization and depreciation (Notes 11, 13, and 14)

- 81 -
*SGVFS021357*
Credit Commitments External Revenues2016 2015 2016 2015 2014
Philippines P=27,995,354 P=16,083,883 P=29,124,972 P=25,580,852 P=24,650,375Asia (excluding Philippines) 467,830 465,026 1,267,659 1,308,540 1,184,773USA and Canada 4,197 796 668,833 598,662 534,838United Kingdom – – 147,050 154,585 200,884
P=28,467,381 P=16,549,705 P=31,208,514 P=27,642,639 P=26,570,870
The Philippines is the home country of the Parent Company, which is also the main operatingcompany. The Group offers a wide range of financial services as discussed in Note 1.Additionally, most of the remittance services are managed and conducted in Asia, Canada, USAand United Kingdom.
The areas of operations include all the primary business segments.
7. Due from Bangko Sentral ng Pilipinas
As of December 31, 2016 and 2015, 30.11% and 8.69% of the Group’s Due from BSP are placedunder the Term Deposit Facility (TDF) with the BSP. Due from BSP bear annual interest ratesranging from 2.50% to 3.50% in 2016 and 2.00% to 2.50% in 2015 and 2014.
As of December 31, 2016 and 2015, 29.64% and 7.32% of the Parent Company’s Due from BSPare placed under the TDF with the BSP. TDFs bear annual interest rates ranging from 2.50% to3.50% in 2016 and 2.00% to 2.50% in 2015 and 2014.
8. Interbank Loans Receivable and Securities Held Under Agreements to Resell
The Group’s interbank loans receivable include foreign currency-denominated placementsamounting to P=7.8 billion as of December 31, 2016 and P=5.8 billion as of December 31, 2015.The Group’s and the Parent Company’s peso-denominated interbank loans receivables bearinterest ranging from 2.56% to 3.19% in 2015, and from 3.00% to 3.19% in 2014; and from 0.01%to 4.40%, 0.01% to 0.35%, and 0.08% to 0.25% for foreign-currency denominated placements in2016, 2015 and 2014, respectively.
The amount of the Group’s and the Parent Company’s interbank loans receivable considered ascash and cash equivalents follow:
Consolidated Parent Company2016 2015 2016 2015
Interbank loans receivable P=7,791,108 P=5,800,383 P=7,907,366 P=5,958,526Less: Interbank loans receivable not
considered as cash and cashequivalents 547,222 – 554,526 46,302
P=7,243,886 P=5,800,383 P=7,352,840 P=5,912,224
Securities held under agreements to resell are peso-denominated placements with carrying valueof P=2.0 billion and P=14.6 billion as of December 31, 2016 and 2015, respectively. The Group’sand the Parent Company’s peso-denominated securities held under repurchase agreements bearinterest ranging from 3.00% to 4.00% in 2016 and 4.00% in 2015. The fair value of the treasurybills pledged under these agreements as of December 31, 2016 and 2015 amount toP=2.0 billion and P=14.5 billion, respectively.

- 82 -
*SGVFS021357*
9. Trading and Investment Securities
This account consists of:
Consolidated Parent Company2016 2015 2016 2015
Financial assets at FVPL P=1,913,864 P=4,510,545 P=1,880,071 P=4,492,864AFS investments 67,340,739 68,341,024 65,819,735 66,734,752HTM investments 24,174,479 23,231,997 24,074,898 23,137,643
P=93,429,082 P=96,083,566 P=91,774,704 P=94,365,259
Financial Assets at FVPL This account consists of:
Consolidated Parent Company2016 2015 2016 2015
Government securities P=1,313,400 P=3,968,214 P=1,313,400 P=3,968,214Derivative assets (Notes 23 and 36) 419,122 181,348 418,819 181,142Private debt securities 120,589 143,800 120,589 143,800Equity securities 54,609 199,922 27,263 199,708Investment in UITFs 6,144 17,261 – –
P=1,913,864 P=4,510,545 P=1,880,071 P=4,492,864
As of December 31, 2016 and 2015, unrealized loss on government and private debt securitiesrecognized by the Group and the Parent Company amounted to P=66.9 million and P=261.5 million,respectively.
The carrying amount of equity securities includes unrealized loss of P=21.5 million andP=53.3 million as of December 31, 2016 and 2015, respectively, for the Group and unrealized lossof P=32.0 million and P=12.0 million as of December 31, 2016 and 2015, respectively, for the ParentCompany.
In 2016, 2015, and 2014, the nominal interest rates of government securities range from 2.75% to10.63%, 2.13% to 10.63%, and 2.75% to 8.88%, respectively.
In 2016, 2015, and 2014, the nominal interest rates of private debt securities range from 5.50% to7.38%, 4.80% to 7.38%, and 4.25% to 7.38%, respectively.
AFS InvestmentsThis account consists of:
Consolidated Parent Company2016 2015 2016 2015
Government debt securities(Notes 19 and 33) P=37,834,559 P=45,260,397 P=36,900,930 P=44,075,209
Private securities 28,841,070 22,252,980 28,325,207 22,035,585Equity securities - net of allowance
for impairment losses (Note 16)Quoted 493,958 653,931 439,819 450,749Unquoted 171,152 173,716 153,779 173,209
P=67,340,739 P=68,341,024 P=65,819,735 P=66,734,752

- 83 -
*SGVFS021357*
In 2016, the Group and the Parent Company recognized impairment losses on equity securitiesamounting to P=15.9 million and P=15.6 million, respectively. In 2015, the Group and the ParentCompany recognized impairment losses on equity securities amounting to P=0.2 million (Note 16).
The movements in net unrealized loss on AFS investments of the Group are as follows:
2016 2015 2014Parent
Company NCI TotalParent
Company NCI TotalParent
Company NCI TotalBalance at the beginning of
the year (P=3,030,588) P=168,630 (P=2,861,958) (P=2,336,142) P=179,878 (P=2,156,264) (P=3,581,865) P=158,990 (P=3,422,875)Changes in fair values of
AFS investments 1,009,783 – 1,009,783 (171,907) (9,641) (181,548) 2,286,623 19,514 2,306,137Provision for impairment
(Note 16) 15,856 – 15,856 230 – 230 1,423 – 1,423Realized gains (1,364,066) (360) (1,364,426) (777,890) (4,175) (782,065) (1,171,221) (2,932) (1,174,153)Amortization of net
unrealized loss on AFSinvestments reclassified asHTM 144,657 1,079 145,736 136,804 2,568 139,372 119,839 4,306 124,145
Share in net unrealized lossesof an associate (Note 12) (245,867) − (245,867) − − − − − −
Effect of disposal groupclassified as held-for-sale(Note 37) − (169,349) (169,349) 115,430 − 115,430 − − −
(439,637) (168,630) (608,267) (697,333) (11,248) (708,581) 1,236,664 20,888 1,257,552
Income tax effect (Note 31) 286 − 286 2,887 − 2,887 9,059 − 9,059Balance at end of year (P=3,469,939) P=– (P=3,469,939) (P=3,030,588) P=168,630 (P=2,861,958) (P=2,336,142) P=179,878 (P=2,156,264)
The changes in the net unrealized loss in AFS investments of the Parent Company follow:
20162015
(As restated)2014
(As restated)Balance at the beginning of the year (P=3,030,588) (P=2,336,142) (P=3,581,865)Changes in fair values of AFS investments 1,008,908 (192,809) 2,139,842Provision for impairment (Note 16) 15,601 230 1,423Realized gains (1,350,453) (756,777) (1,128,511)Amortization of net unrealized loss on AFS investments
reclassified as HTM 140,341 126,531 102,615Share in net unrealized losses of subsidiaries and an associate
(Note 12) (253,748) 51,906 121,295Effect of disposal group classified as held-for-sale (Note 37) − 73,586 −
(3,469,939) (3,033,475) (2,345,201)Income tax effect (Note 31) − 2,887 9,059Balance at end of year (P=3,469,939) (P=3,030,588) (P=2,336,142)
As of December 31, 2016 and 2015, the fair value of the AFS investments in the form ofgovernment and private bonds pledged to fulfill its collateral requirements with securities soldunder repurchase agreements transactions with counterparties amounted to P=9.8 billion andP=8.5 billion, respectively (Note 19). The counterparties have an obligation to return the securitiesto the Parent Company once the obligations have been settled. In case of default, thecounterparties have the right to hold the securities and sell them as settlement of the repurchaseagreement. There are no other significant terms and conditions associated with the pledgedinvestments.
Included in the Group’s AFS investments are pledged securities for the Surety Bond with facevalue amount of P=800.0 million issued by PNB Gen. As of December 31, 2015, the carrying valueand fair value of these securities amounted to P=873.0 million and P=974.4 million, respectively(Note 35). As of December 31, 2016, a compromise agreement on the settlement of loans hasbeen made and said Surety Bond was no longer renewed by PNB Gen.

- 84 -
*SGVFS021357*
HTM InvestmentsAs of December 31, 2016, HTM investments of the Group and the Parent Company consist ofgovernment securities amounting to P=24.2 billion and P=24.1 billion, respectively.
As of December 31, 2015, HTM investments of the Group and the Parent Company consist ofgovernment securities and private debt securities amounting to P=23.2 billion and P=23.1 billion,respectively.
As of December 31, 2016 and 2015, the fair value of the HTM investments in the form ofRepublic of the Philippines bonds pledged to fulfill its collateral requirements with securities soldunder repurchase agreements transactions with counterparties amounted to P=15.3 billion andP=7.5 billion, respectively (Note 19).
Reclassification of Financial AssetsOn March 3 and 5, 2014, the Group reclassified certain AFS investment securities, which werepreviously classified as HTM investments, with fair values of P=15.9 billion and P=6.8 billion,respectively, back to its original classification as management has established that it continues tohave the positive intention and ability to hold these securities to maturity. The reclassification wasapproved by the BOD on February 28, 2014. The previous fair valuation gains amounting toP=2.7 billion that have been recognized in OCI shall be amortized to profit or loss over theremaining life of the HTM investments using effective interest rates ranging from 3.60% to5.64%.
As of December 31, 2016, the carrying values and fair values of the Group’s and ParentCompany’s reclassified investment securities amounted to P=20.1 billion and P=21.4 billion,respectively. As of December 31, 2015, the carrying values and fair values of the reclassifiedinvestment securities amounted to P=20.3 billion and P=21.8 billion, respectively, for the Group andP=20.2 billion and P=21.7 billion, respectively, for the Parent Company. Had these securities notbeen reclassified as HTM, the additional mark-to-market loss that would have been recognized bythe Group and the Parent Company in the statement of comprehensive income amounts toP=0.3 billion in 2016 and P=0.8 billion in 2015.
Interest Income on Trading and Investment SecuritiesThis account consists of:
Consolidated Parent Company2016 2015 2014 2016 2015 2014
AFS investments P=2,262,857 P=2,443,660 P=1,953,437 P=2,212,466 P=2,407,634 P=1,968,228HTM investments 926,652 925,334 794,541 926,131 924,462 725,613Financial assets at FVPL 837,085 373,042 244,886 837,085 373,042 244,886
P=4,026,594 P=3,742,036 P=2,992,864 P=3,975,682 P=3,705,138 P=2,938,727
Effective interest rates range from 1.31% to 5.93%, 1.03% to 5.62%, and 2.58% to 5.62% in 2016,2015 and 2014, respectively, for peso-denominated AFS investments.
Effective interest rates range from 1.29% to 5.30%, 1.10% to 5.39%, and 2.06% to 5.83% in 2016,2015 and 2014, respectively, for foreign currency-denominated AFS investments.
HTM investments bear effective annual interest rates ranging from 3.60% to 5.64% in 2016, 2015and 2014, respectively.

- 85 -
*SGVFS021357*
Trading and Investment Securities Gains (Losses) - netThis account consists of:
Consolidated Parent Company2016 2015 2014 2016 2015 2014
Financial assets at FVPL: Held-for-trading (P=6,113) (P=175,161) P=197,224 (P=6,113) (P=175,290) P=196,597 Designated at FVPL (3,202) – 1,751 – – –AFS investments 1,362,462 761,191 1,159,492 1,350,453 756,777 1,128,511Derivative financial instruments
(Note 23) 25,174 (11,709) (90,761) 25,174 (11,709) (90,761)P=1,378,321 P=574,321 P=1,267,706 P=1,369,514 P=569,778 P=1,234,347
10. Loans and Receivables
This account consists of:
Consolidated Parent Company2016 2015 2016 2015
Receivable from customers:Loans and discounts P=392,159,433 P=333,910,923 P=350,840,183 P=305,051,911Customers’ liabilities on letters of
credit and trust receipts 8,830,606 10,501,665 8,600,938 10,162,498Credit card receivables 7,102,207 5,363,750 7,102,207 5,363,750Bills purchased (Note 22) 3,596,589 3,832,905 3,379,721 3,498,652Lease contracts receivable
(Note 30) 3,049,375 3,686,791 100,109 101,709Customers’ liabilities on
acceptances (Note 19) 1,659,340 344,816 1,659,340 344,816416,397,550 357,640,850 371,682,498 324,523,336
Less unearned and other deferredincome 1,489,955 1,834,517 1,116,929 1,427,774
414,907,595 355,806,333 370,565,569 323,095,562Unquoted debt securities 6,972,710 4,245,069 6,914,864 4,245,069Other receivables:
Accounts receivable 9,385,522 8,212,190 3,423,593 3,102,573Sales contract receivables 7,449,020 5,491,409 7,397,664 5,487,416Accrued interest receivable 3,703,763 4,968,236 3,485,881 4,829,204Miscellaneous 501,675 429,923 443,289 401,142
21,039,980 19,101,758 14,750,427 13,820,335442,920,285 379,153,160 392,230,860 341,160,966
Less allowance for credit losses(Note 16) 14,892,814 13,428,014 14,032,122 12,860,728
P=428,027,471 P=365,725,146 P=378,198,738 P=328,300,238

- 86 -
*SGVFS021357*
Below is the reconciliation of loans and receivables as to classes:
Consolidated2016
BusinessLoans
GOCCsand NGAs LGUs Consumers
FringeBenefits
UnquotedDebt
Securities Others TotalReceivable from customers:
Loans and discounts P=329,917,238 P=20,117,661 P=7,346,757 P=34,336,857 P=440,920 P=– P=– P=392,159,433Customers’ liabilities on
letters of credit and trustreceipts 8,830,606 – – – – – – 8,830,606
Credit card receivables 66,258 – – 6,888,616 147,333 – – 7,102,207Bills purchased (Note 22) 3,383,938 212,651 – – – – – 3,596,589Lease contracts receivable
(Note 30) 3,049,375 – – – – – – 3,049,375Customers’ liabilities on
acceptances (Note 19) 1,659,340 – – – – – – 1,659,340346,906,755 20,330,312 7,346,757 41,225,473 588,253 – – 416,397,550
Less unearned and otherdeferred income 1,044,476 433,275 11,258 785 161 – – 1,489,955
345,862,279 19,897,037 7,335,499 41,224,688 588,092 – – 414,907,595Unquoted debt securities – – – – – 6,972,710 – 6,972,710Other receivables:
Accounts receivable – – – – – – 9,385,522 9,385,522Sales contract receivables – – – – – – 7,449,020 7,449,020Accrued interest receivable – – – – – – 3,703,763 3,703,763Miscellaneous – – – – – – 501,675 501,675
345,862,279 19,897,037 7,335,499 41,224,688 588,092 6,972,710 21,039,980 442,920,285Less allowance for credit losses
(Note 16) 6,846,958 96,030 170,175 1,241,394 19,014 3,687,488 2,831,755 14,892,814P=339,015,321 P=19,801,007 P=7,165,324 P=39,983,294 P=569,078 P=3,285,222 P=18,208,225 P=428,027,471
Consolidated2015
BusinessLoans
GOCCsand NGAs LGUs Consumers
FringeBenefits
UnquotedDebt
Securities Others TotalReceivable from customers:
Loans and discounts P=274,314,706 P=22,920,494 P=7,804,678 P=28,398,408 P=472,637 P=– P=– P=333,910,923Customers’ liabilities on
letters of credit and trustreceipts 10,501,665 – – – – – – 10,501,665
Credit card receivables 59,732 – – 5,224,371 79,647 – – 5,363,750Bills purchased (Note 22) 3,142,231 690,674 – – – – – 3,832,905Lease contracts receivable
(Note 30) 3,686,791 – – – – – – 3,686,791Customers’ liabilities on
acceptances (Note 19) 344,816 – – – – – – 344,816292,049,941 23,611,168 7,804,678 33,622,779 552,284 – – 357,640,850
Less unearned and otherdeferred income 1,242,211 573,249 12,023 6,829 205 – – 1,834,517
290,807,730 23,037,919 7,792,655 33,615,950 552,079 – – 355,806,333Unquoted debt securities – – – – – 4,245,069 – 4,245,069Other receivables: Accounts receivable – – – – – – 8,212,190 8,212,190 Sales contract receivables – – – – – – 5,491,409 5,491,409 Accrued interest receivable – – – – – – 4,968,236 4,968,236 Miscellaneous – – – – – – 429,923 429,923
290,807,730 23,037,919 7,792,655 33,615,950 552,079 4,245,069 19,101,758 379,153,160Less allowance for credit losses
(Note 16) 5,186,186 159,047 148,602 1,113,167 23,066 3,619,267 3,178,679 13,428,014P=285,621,544 P=22,878,872 P=7,644,053 P=32,502,783 P=529,013 P=625,802 P=15,923,079 P=365,725,146

- 87 -
*SGVFS021357*
Parent Company2016
BusinessLoans
GOCCsand NGAs LGUs Consumers
FringeBenefits
UnquotedDebt
Securities Others TotalReceivable from customers:
Loans and discounts P=319,861,682 P=20,117,661 P=7,346,757 P=3,100,426 P=413,657 – – P=350,840,183Customers’ liabilities on
letters of credit and trustreceipts 8,600,938 – – – – – – 8,600,938
Credit card receivables 66,258 – – 6,888,617 147,332 – – 7,102,207Bills purchased (Note 22) 3,167,071 212,650 – – – – – 3,379,721Lease contracts receivable
(Note 30) 100,109 – – – – – – 100,109Customers’ liabilities on
acceptances (Note 19) 1,659,340 – – – – – – 1,659,340333,455,398 20,330,311 7,346,757 9,989,043 560,989 – – 371,682,498
Less unearned and otherdeferred income 671,450 433,275 11,258 785 161 – – 1,116,929
332,783,948 19,897,036 7,335,499 9,988,258 560,828 – – 370,565,569Unquoted debt securities – – – – – 6,914,864 – 6,914,864Other receivables:
Accounts receivable – – – – – – 3,423,593 3,423,593Sales contract receivables – – – – – – 7,397,664 7,397,664Accrued interest receivable – – – – – – 3,485,881 3,485,881Miscellaneous – – – – – – 443,289 443,289
332,783,948 19,897,036 7,335,499 9,988,258 560,828 6,914,864 14,750,427 392,230,860Less allowance for credit losses
(Note 16) 6,687,544 96,030 170,175 890,093 19,012 3,687,488 2,481,780 14,032,122P=326,096,404 P=19,801,006 P=7,165,324 P=9,098,165 P=541,816 P=3,227,376 P=12,268,647 P=378,198,738
Parent Company 2015
BusinessLoans
GOCCsand NGAs LGUs Consumers
FringeBenefits
UnquotedDebt
Securities Others TotalReceivable from customers:
Loans and discounts P=265,051,259 P=22,920,494 P=7,804,678 P=8,816,035 P=459,445 P=– P=– P=305,051,911Customers’ liabilities on
letters of credit and trustreceipts 10,162,498 – – – – – – 10,162,498
Credit card receivables 59,732 – – 5,224,371 79,647 – – 5,363,750Bills purchased (Note 22) 2,807,978 690,674 – – – – – 3,498,652Lease contracts receivable
(Note 30) 101,709 – – – – – – 101,709Customers’ liabilities on
acceptances (Note 19) 344,816 – – – – – – 344,816278,527,992 23,611,168 7,804,678 14,040,406 539,092 – – 324,523,336
Less unearned and otherdeferred income 835,468 573,249 12,023 6,829 205 – – 1,427,774
277,692,524 23,037,919 7,792,655 14,033,577 538,887 – – 323,095,562Unquoted debt securities – – – – – 4,245,069 – 4,245,069Other receivables:
Accounts receivable – – – – – – 3,102,573 3,102,573Sales contract receivables – – – – – – 5,487,416 5,487,416Accrued interest receivable – – – – – – 4,829,204 4,829,204Miscellaneous – – – – – – 401,142 401,142
277,692,524 23,037,919 7,792,655 14,033,577 538,887 4,245,069 13,820,335 341,160,966Less allowance for credit losses
(Note 16) 5,038,887 159,047 148,602 995,020 23,064 3,619,267 2,876,841 12,860,728P=272,653,637 P=22,878,872 P=7,644,053 P=13,038,557 P=515,823 P=625,802 P=10,943,494 P=328,300,238
On November 27, 1997, Maybank Philippines, Inc. (Maybank) and the Parent Company signed adeed of assignment transferring to the Parent Company certain Maybank assets (included in‘Loans and Receivables’) and liabilities in connection with the sale of the Parent Company’s60.00% equity in Maybank.
As of December 31, 2015, the balance of these receivables amounted to P=3.7 billion (P=1.8 billionis included under ‘Loans and discounts’ and P=1.9 billion is included under ‘Accrued interestreceivable’) while the transferred liabilities amounted to P=3.4 billion (P=1.8 billion is includedunder ‘Bills payable to BSP and local banks’ - Note 19 and P=1.6 billion is included under‘Accrued interest payable’ - Note 20). The excess of the transferred receivables over the

- 88 -
*SGVFS021357*
transferred liabilities is fully covered by an allowance for credit losses amounting to P=0.3 billionas of December 31, 2015.
In 2016, the Group and the Parent Company applied the transferred liabilities against the principaland interest components of the transferred receivables. As of December 31, 2016, the remainingreceivables amounted to P=0.3 billion, which is fully covered by an allowance.
Unquoted debt instrumentsUnquoted debt instruments include the zero-coupon notes received by the Parent Company fromSpecial Purpose Vehicle (SPV) Companies on October 15, 2004, at the principal amount ofP=803.5 million (Tranche A Note) payable in five years and at the principal amount of P=3.4 billion(Tranche B Note) payable in eight years in exchange for the outstanding loans receivable fromNational Steel Corporation (NSC) of P=5.3 billion. The notes are secured by a first rankingmortgage and security interest over the NSC Plant Assets. As of December 31, 2016 and 2015,the notes are carried at their recoverable values.
Lease contract receivablesAn analysis of the Group’s and the Parent Company’s lease contract receivables follows:
Consolidated Parent Company2016 2015 2016 2015
Minimum lease paymentsDue within one year P=1,177,612 P=1,428,529 P=23,509 P=17,909Due beyond one year but not over five years 1,127,371 1,498,041 40,100 35,900Due beyond five years 36,500 47,900 36,500 47,900
2,341,483 2,974,470 100,109 101,709Residual value of leased equipment
Due within one year 249,923 225,590 – –Due beyond one year but not over five years 457,969 486,731 – –
707,892 712,321 – –Gross investment in lease contract receivables (Note 30) P=3,049,375 P=3,686,791 P=100,109 P=101,709
Interest incomeInterest income on loans and receivables consists of:
Consolidated Parent Company2016 2015 2014 2016 2015 2014
Receivable from customers and salescontract receivables P=19,635,249 P=17,074,179 P=14,650,909 P=16,874,365 P=15,092,695 P=13,491,902
Unquoted debt securities 51,160 63,478 521,555 49,499 58,568 502,891P=19,686,409 P=17,137,657 P=15,172,464 P=16,923,864 P=15,151,263 P=13,994,793
As of December 31, 2016 and 2015, 75.24% and 82.84%, respectively, of the total receivablefrom customers of the Group were subject to interest repricing. As of December 31, 2016 and2015, 76.23% and 76.18%, respectively, of the total receivable from customers of the ParentCompany were subject to interest repricing. Remaining receivables carry annual fixed interestrates ranging from 2.30% to 8.75% in 2016, 1.10% to 7.00% in 2015, and 2.51% to 9.00% in 2014for foreign currency-denominated receivables, and from 1.00% to 35.00% in 2016, 0.50% to15.25% in 2015, and 0.03% to 23.04% in 2014 for peso-denominated receivables.
Sales contract receivables bear fixed interest rate per annum ranging from 5.00% to 21.00%,3.30% to 21.00%, and 5.05% to 21.00% in 2016, 2015 and 2014, respectively.
Interest income accrued on impaired loans and receivable of the Group and Parent Companyamounted to P=103.7 million in 2016, P=217.0 million in 2015, and P=274.8 million in 2014.(Note 16).

- 89 -
*SGVFS021357*
BSP ReportingAn industry sector analysis of the Group’s and the Parent Company’s receivable from customersbefore taking into account the unearned and other deferred income and allowance for credit lossesis shown below.
Consolidated Parent Company2016 2015 2016 2015
CarryingAmount %
CarryingAmount %
CarryingAmount %
CarryingAmount %
Primary target industry:Financial intermediaries P=64,806,163 15.56 P=38,910,047 10.88 P=64,415,801 17.33 P=38,565,876 11.88Wholesale and retail 61,414,279 14.75 51,740,591 14.47 57,682,565 15.52 47,900,547 14.76Electricity, gas and water 49,814,968 11.96 49,944,409 13.96 49,687,531 13.37 49,873,733 15.37Manufacturing 39,939,856 9.59 42,115,959 11.78 37,085,522 9.98 38,252,329 11.79Transport, storage and
communication 36,542,499 8.78 29,358,316 8.21 34,276,937 9.22 27,136,991 8.36Public administration and
defense 24,676,655 5.93 26,128,861 7.31 24,601,304 6.62 26,128,860 8.05Agriculture, hunting
and forestry 5,490,920 1.32 6,211,092 1.74 5,044,898 1.36 5,690,508 1.76Secondary target industry:
Real estate, renting andbusiness activities 59,701,406 14.34 45,723,378 12.78 53,719,909 14.45 38,240,191 11.78
Construction 16,819,358 4.04 11,697,215 3.27 14,574,409 3.92 9,898,467 3.05Others 57,191,446 13.73 55,810,982 15.60 30,593,622 8.23 42,835,834 13.20
P=416,397,550 100.00 P=357,640,850 100.00 P=371,682,498 100.00 P=324,523,336 100.00
The information (gross of unearned and other deferred income and allowance for credit losses)relating to receivable from customers as to secured and unsecured and as to collateral follows:
Consolidated Parent Company2016 2015 2016 2015
CarryingAmount %
CarryingAmount %
CarryingAmount %
CarryingAmount %
Secured:Real estate mortgage P=62,257,711 14.95 P=57,028,872 15.94 P=45,697,957 12.30 P=42,625,055 13.13Chattel mortgage 33,531,566 8.05 17,162,402 4.80 25,326,989 6.81 10,723,203 3.30Bank deposit hold-out 14,034,793 3.38 1,924,828 0.54 13,938,107 3.75 1,924,828 0.59Shares of stocks 1,681,531 0.40 889,340 0.25 1,681,531 0.45 694,769 0.22Others 38,699,661 9.29 30,352,753 8.49 35,368,522 9.52 26,431,424 8.15
150,205,262 36.07 107,358,195 30.02 122,013,106 32.83 82,399,279 25.39Unsecured 266,192,288 63.93 250,282,655 69.98 249,669,392 67.17 242,124,057 74.61
P=416,397,550 100.00 P=357,640,850 100.00 P=371,682,498 100.00 P=324,523,336 100.00
The table below reflects the balances of loans and receivables as reported to the BSP. Forpurposes of BSP reporting, the acquired loans and receivables were measured based on theiroriginal amortized cost as at acquisition date instead of their corresponding fair values.
Non-performing Loans (NPL) of the Parent Company as to secured and unsecured follows:
2016 2015Secured P=4,918,225 P=5,888,561Unsecured 3,853,334 3,090,858
P=8,771,559 P=8,979,419

- 90 -
*SGVFS021357*
Generally, NPLs refer to loans whose principal and/or interest is unpaid for thirty (30) days ormore after due date or after they have become past due in accordance with existing BSP rules andregulations. This shall apply to loans payable in lump sum and loans payable in quarterly, semi-annual, or annual installments, in which case, the total outstanding balance thereof shall beconsidered nonperforming
In the case of loans that are payable in monthly installments, the total outstanding balance thereofshall be considered nonperforming when three (3) or more installments are in arrears.
In the case of loans that are payable in daily, weekly, or semi-monthly installments, the totaloutstanding balance thereof shall be considered nonperforming at the same time that they becomepast due in accordance with existing BSP regulations, i.e., the entire outstanding balance of thereceivable shall be considered as past due when the total amount of arrearages reaches ten percent(10.00%) of the total loan balance.
Loans are classified as nonperforming in accordance with BSP regulations, or when, in theopinion of management, collection of interest or principal is doubtful. Loans are not reclassifiedas performing until interest and principal payments are brought current or the loans arerestructured in accordance with existing BSP regulations, and future payments appear assured.
Loans which do not meet the requirements to be treated as performing loans shall also beconsidered as NPLs. Effective January 1, 2013, the exclusion of NPLs classified as loss but arefully covered by allowance was removed by the BSP through Circular No. 772. Previous bankingregulations allow banks that have no unbooked valuation reserves and capital adjustments toexclude from nonperforming classification those loans classified as Loss in the latest examinationof the BSP which are fully covered by allowance for credit losses, provided that interest on saidreceivables shall not be accrued.
As of December 31, 2016 and 2015, based on the revised definition of NPLs under CircularNo. 772, NPLs of P=8.8 billion and P=8.9 billion, respectively which the Parent Company reportedto the BSP are gross of specific allowance amounting to P=8.3 billion and P=8.1 billion,respectively. Most of these loans are secured by real estate or chattel mortgages.
As of December 31, 2016 and 2015, gross and net NPL ratios of the Parent Company were 2.31%and 0.18%, and 2.61% and 0.25%, respectively.
Restructured loans of the Group and the Parent Company as of December 31, 2016 and 2015amounted to P=1.5 billion and P=1.6 billion, respectively.

- 91 -
*SGVFS021357*
11. Property and Equipment
The composition of and movements in property and equipment follow:
Consolidated2016
Land Building
Furniture,Fixtures and
Equipment
Long-termLeasehold
LandConstruction
In-progressLeasehold
Improvements TotalCostBalance at beginning of year P=15,552,766 P=6,894,418 P=4,686,714 P=553,988 P=341,366 P=841,052 P=28,870,304Additions/transfers − 206,910 965,326 – 669,094 187,009 2,028,339Disposals/transfers/others (4,082,341) (1,383,567) (704,936) 13,282 (312,329) 66,556 (6,403,335)Balance at end of year 11,470,425 5,717,761 4,947,104 567,270 698,131 1,094,617 24,495,308Accumulated Depreciation and
AmortizationBalance at beginning of year – 2,641,945 3,105,944 23,595 – 509,279 6,280,763Depreciation and amortization – 235,546 623,153 5,199 – 149,779 1,013,677Disposals/transfers/others – (306,325) (811,426) 4,508 – (11,477) (1,124,720)Balance at end of year – 2,571,166 2,917,671 33,302 – 647,581 6,169,720Allowance for Impairment Losses
(Note 16) 121,033 107,200 – – – – 228,233Net Book Value at End of Year P=11,349,392 P=3,039,395 P=2,029,433 P=533,968 P=698,131 P=447,036 P=18,097,355
Consolidated2015
Land Building
Furniture,Fixtures and
Equipment
Long-termLeasehold
LandConstruction
In-progressLeasehold
Improvements TotalCostBalance at beginning of year P=13,294,729 P=6,716,569 P=4,027,169 P=536,081 P=238,083 P=702,604 P=25,515,235Additions/transfers 2,259,224 217,072 1,082,544 – 431,635 175,953 4,166,428Disposals/transfers/others (1,187) (36,121) (382,562) – (328,352) (24,033) (772,255)Cumulative translation adjustment – (3,102) 1,697 17,907 – 594 17,096Effect of disposal group classified as held
for sale (Note 37) – – (42,134) – – (14,066) (56,200)Balance at end of year 15,552,766 6,894,418 4,686,714 553,988 341,366 841,052 28,870,304Accumulated Depreciation and
AmortizationBalance at beginning of year – 2,362,174 2,925,285 9,456 – 414,431 5,711,346Depreciation and amortization – 234,400 479,662 5,030 – 122,275 841,367Disposals/transfers/others – 49,010 (281,903) – – (17,486) (250,379)Cumulative translation adjustment – (3,639) (537) 9,109 – 150 5,083Effect of disposal group classified as held
for sale (Note 37) – – (16,563) – – (10,091) (26,654)Balance at end of year – 2,641,945 3,105,944 23,595 – 509,279 6,280,763Allowance for Impairment Losses
(Note 16) 351,373 109,704 – – – – 461,077Net Book Value at End of Year P=15,201,393 P=4,142,769 P=1,580,770 P=530,393 P=341,366 P=331,773 P=22,128,464
Parent Company2016
Land Building
Furniture,Fixtures and
EquipmentConstruction
In-progressLeasehold
Improvements TotalCostBalance at beginning of year P=13,380,915 P=6,831,425 P=3,936,183 P=341,366 P=726,223 P=25,216,112Additions/transfers – 206,910 716,982 669,094 147,352 1,740,338Disposals/transfers/others (2,114,746) (1,550,138) (706,311) (312,328) 2,849 (4,680,674)Balance at end of year 11,266,169 5,488,197 3,946,854 698,132 876,424 22,275,776Accumulated Depreciation and
AmortizationBalance at beginning of year – 2,621,673 2,747,940 – 437,600 5,807,213Depreciation and amortization – 234,210 476,638 – 124,619 835,467Disposals/transfers/others – (337,825) (759,246) – (3,113) (1,100,184)Balance at end of year – 2,518,058 2,465,332 – 559,106 5,542,496Allowance for Impairment Losses
(Note 16) 121,033 107,200 − − − 228,233Net Book Value at End of Year P=11,145,136 P=2,862,939 P=1,481,522 P=698,132 P=317,318 P=16,505,047

- 92 -
*SGVFS021357*
Parent Company2015
Land Building
Furniture,Fixtures and
EquipmentConstruction
In-progressLeasehold
Improvements TotalCostBalance at beginning of year P=13,292,296 P=6,653,863 P=3,377,862 P=238,083 P=595,174 P=24,157,278Additions/transfers 89,806 217,072 780,849 431,635 147,591 1,666,953Disposals/transfers/others (1,187) (39,510) (222,528) (328,352) (16,542) (608,119)Balance at end of year 13,380,915 6,831,425 3,936,183 341,366 726,223 25,216,112Accumulated Depreciation and
AmortizationBalance at beginning of year – 2,341,778 2,563,525 – 340,107 5,245,410Depreciation and amortization – 233,174 371,448 – 105,920 710,542Disposals/transfers/others – 46,721 (187,033) – (8,427) (148,739)Balance at end of year – 2,621,673 2,747,940 – 437,600 5,807,213Allowance for Impairment Losses
(Note 16) 154,997 109,704 – – – 264,701Net Book Value at End of Year P=13,225,918 P=4,100,048 P=1,188,243 P=341,366 P=288,623 P=19,144,198
The total recoverable value of certain property and equipment of the Group and the ParentCompany for which impairment loss has been recognized or reversed amounted to P=234.9 millionand P=548.9 million as of December 31, 2016 and 2015, respectively.
Gain on disposal of property and equipment in 2016, 2015 and 2014 amounted to P=1.2 million,P=7.7 million, and P=12.1 million, respectively, for the Group and P=1.5 million, P=3.7 million andP=12.4 million, respectively, for the Parent Company (Note 13).
Depreciation and amortization consists of:
Consolidated Parent Company2016 2015 2014 2016 2015 2014
Continuing operations:Depreciation
Property and equipment P=1,013,677 P=830,663 P=795,065 P=835,467 P=710,542 P=674,965Investment properties (Note 13) 226,545 162,097 190,727 206,472 149,309 183,382Chattel mortgage 22,000 35,285 23,455 22,001 33,748 23,281
Amortization - Intangible assets(Note 14) 292,423 424,176 472,684 279,643 412,180 460,582
1,554,645 1,452,221 1,481,931 1,343,583 1,305,779 1,342,210Discontinued operations:
Property and Equipment(Note 37) 4,707 10,704 14,039 – – –
P=1,559,352 P=1,462,925 P=1,495,970 P=1,343,583 P=1,305,779 P=1,342,210
Certain property and equipment of the Parent Company with carrying amount of P=178.5 millionand P=180.8 million are temporarily idle as of December 31, 2016 and 2015, respectively.
As of December 31, 2016 and 2015, property and equipment of the Parent Company with grosscarrying amounts of P=3.3 billion and P=3.4 billion, respectively, are fully depreciated but are stillbeing used.

- 93 -
*SGVFS021357*
12. Investments in Subsidiaries and an Associate
The consolidated financial statements of the Group include:
Nature of BusinessCountry of
IncorporationFunctionalCurrency
Percentage of Ownership
Subsidiaries2016 2015
Direct Indirect Direct IndirectPNB Savings Bank (PNBSB)* Banking Philippines Php 100.00 – 100.00 –PNB Capital and Investment
Corporation (PNB Capital) Investment - do - Php 100.00 – 100.00 –PNB Forex, Inc. (PNB Forex) FX trading - do - Php 100.00 – 100.00 –PNB Holdings Corporation (PNB
Holdings) Investment - do - Php 100.00 – 100.00 –PNB General Insurers Inc.(PNB Gen) Insurance - do - Php 65.75 34.25 65.75 34.25PNB Securities, Inc. (PNB Securities) Securities Brokerage - do - Php 100.00 – 100.00 –PNB Corporation – Guam Remittance USA USD 100.00 – 100.00 –PNB International Investments
Corporation (PNB IIC) Investment - do - USD 100.00 – 100.00 –PNB Remittance Centers, Inc. (PNB
RCI) (a) Remittance - do - USD – 100.00 – 100.00PNB Remittance Co. (Nevada) (b) Remittance -do- USD – 100.00 – 100.00PNB RCI Holding Co. Ltd. (b) Holding Company - do - USD – 100.00 – 100.00Allied Bank Philippines (UK) Plc
(ABUK)* Banking United Kingdom GBP 100.00 – 100.00 –PNB Europe PLC Banking - do - GBP 100.00 – 100.00 –PNB Remittance Co. (Canada) (c) Remittance Canada CAD – 100.00 – 100.00PNB Global Remittance & Financial
Co. (HK) Ltd. (PNB GRF) Remittance Hong Kong HKD 100.00 – 100.00 –
Allied Commercial Bank (ACB)* (d) Banking
People’sRepublicof China USD 99.04 – 99.04 –
PNB-IBJL Leasing and FinanceCorporation (PILFC)(e) Leasing/Financing Philippines Php 75.00 – 75.00 –
PNB-IBJL Equipment RentalsCorporation(f) Rental - do - Php – 75.00 – 75.00
Allianz-PNB Life Insurance, Inc.(APLII) (formerly PNB LII) *(g) Insurance - do - Php 44.00 – 80.00 –
Allied Leasing and Finance Corporation(ALFC) * Rental - do - Php 57.21 – 57.21 –
Allied Banking Corporation (HongKong) Limited (ABCHKL) * Banking Hong Kong HKD 51.00 – 51.00 –
ACR Nominees Limited * Banking - do - HKD – 51.00 – 51.00
Oceanic Holding (BVI) Ltd.* Holding CompanyBritish Virgin
Islands USD 27.78 – 27.78 –* Subsidiaries acquired as a result of the merger with ABC(a ) Owned through PNB IIC(b) Owned through PNB RCI(c) Owned through PNB RCI Holding Co. Ltd.(d) Purchase of additional shares was approved by BSP and China Banking Regulatory Commission on June 4, 2014 and
November 12, 20015, respectively. On November 27, 2015, the Parent company purchased 8.63% ownership interest fromindividual stockholders.
(e) Formerly Japan-PNB Leasing(f) Formerly Japan-PNB Equipment Rentals Corporation. Owned through PILFC(g) As of December 31, 2015, APLII was classified as a disposal group held for sale and as a discontinued operation. The acquisition
of the shares of APLII by Allianz SE was completed on June 6, 2016. As of December 31, 2016, the Group owns 44.0% interest inAPLII and is presented as investment in an associate in the statement of financial position.

- 94 -
*SGVFS021357*
The details of this account follow:
Consolidated Parent CompanyDecember 31 January 1
2016 2015 20162015
(As restated)2015
(As restated)Investment in Subsidiaries
PNB SB P=− P=− P=10,935,041 P=10,935,041 P=10,935,041ACB − − 6,087,520 6,087,520 5,485,747PNB IIC − − 2,028,202 2,028,202 2,028,202PNB Europe PLC − − 1,006,537 1,006,537 1,006,537ABCHKL − − 947,586 947,586 947,586PNB GRF − − 753,061 753,061 753,061PNB Gen − − 600,000 600,000 600,000PNB Holdings − − 377,876 377,876 377,876PNB Capital − − 350,000 350,000 350,000ABUK − − 320,858 320,858 320,858OHBVI − − 291,841 291,841 291,840PILFC − − 181,942 181,942 218,331ALFC − − 148,400 148,400 148,400PNB Securities − − 62,351 62,351 62,351PNB Forex, Inc. − − 50,000 50,000 50,000APLII − − − 481,068 1,327,083PNB Corporation - Guam − − 7,672 7,672 7,672
− − 24,148,887 24,629,955 24,910,585Investment in an Associate 2,728,089 − 2,728,089 − −Accumulated equity in net earnings
of subsidiaries and anassociate:
Balance at beginning of year − − 1,455,689 1,875,373 935,968Equity in net earnings for the year 49,325 − 255,292 251,852 1,007,198Transfer to ‘Investment in an
associate’ − (347,023) − −Transfer to ‘Assets of a disposal
group held for sale’ − − − (326,948) −Transfer to ‘Reserves of a disposal
group held for sale’ − − − (85,106) −Sale of direct interest in a subsidiary − − − (79,482) −
49,325 − 1,363,958 1,635,689 1,943,166Dividends received for the year − − (66,125) (180,000) (67,793)
49,325 − 1,297,833 1,455,689 1,875,373Accumulated share in:
Net unrealized losses on available-for-sale investments (Note 9) (245,867) − (261,483) (7,735) (59,641)
Remeasurement losses on retirementplan 1,208 − (31,363) (37,932) (43,003)
Accumulated translation adjustments − − 477,908 457,755 (128,457)(244,659) − 185,062 412,088 (231,101)
P=2,532,755 P=− P=28,359,871 P=26,497,732 P=26,554,857
As part of the Group’s rehabilitation program in 2002, the SEC approved on November 7, 2002the application of the accumulated translation adjustment of P=1.6 billion to eliminate the ParentCompany’s remaining deficit of P=1.3 billion as of December 31, 2001, after applying the totalreduction in par value amounting to P=7.6 billion. The SEC approval is subject to the followingconditions: (a) remaining translation adjustment of P=310.7 million as of December 31, 2001(shown as part of ‘Capital paid in excess of par value’ in the statement of financial position) willnot be used to wipe out losses that may be incurred in the future without prior approval of SEC;and (b) for purposes of dividend declaration, any future surplus account of the Parent Companyshall be restricted to the extent of the deficit wiped out by the translation adjustment.

- 95 -
*SGVFS021357*
As of December 31, 2016 and 2015, the acquisition cost of the investments in the ParentCompany’s separate financial statements includes the balance of P=2.1 billion consisting of thetranslation adjustment and accumulated equity in net earnings, net of dividends subsequentlyreceived from the quasi-reorganization date, that were closed to deficit on restructuring date and isnot available for dividend declaration.
Material non-controlling interestsThe financial information as of December 31, 2016 and 2015 of subsidiaries which have materialNCI is provided below.
Proportion of equity interest held by non- controlling interests
Equity interest ofNCI
Accumulated balances ofmaterial NCI
Profit allocated tomaterial NCI
Principal Activities 2016 2015 2016 2015 2016 2015ABCHKL Banking 49.00% 49.00% P=1,427,340 P=1,322,771 P=41,667 P=80,376APLII Insurance − 20.00% − 414,828 − 71,586
The following tables present financial information of subsidiaries with material non-controllinginterests as of December 31, 2016 and 2015:
2016 2015ABCHKL APLII ABCHKL
Statement of Financial PositionCurrent assets P=7,528,024 P=9,973,869 P=6,288,564Non-current assets 3,877,748 13,552,891 4,309,709Current liabilities 8,244,753 9,264,101 7,722,515Non-current liabilities 164,164 12,188,520 176,225Statement of Comprehensive IncomeRevenues 345,376 2,361,982 404,547Expenses 260,342 2,004,051 240,514Net income 85,034 357,931 164,033Total comprehensive income (loss) 134,237 (61,693) 125,354Statement of Cash FlowsNet cash provided by operating activities 116,786 1,210,588 200,843Net cash provided used in investing
activities (69,200) (815,306) (640)Net cash used in financing activities – – 193,904
As of December 31, 2016 and 2015, the non-controlling interests in respect of ALFC, PILFC,ACB and OHBVI is not material to the Group.
Investment in APLIIOn December 21, 2015, the Parent Company entered into a 15-year exclusive partnership withAllianz SE under the following arrangements, subject to regulatory approvals:
∂ Allianz SE will acquire 12,750 shares representing 51.00% stockholdings of APLII and willhave management control over the new joint venture company;
∂ The new joint venture company will operate under the name of “Allianz-PNB Life Insurance,Inc.”;
∂ A 15-year distribution agreement which will provide Allianz an exclusive access to the branchnetwork of the Parent Company and PNB SB.

- 96 -
*SGVFS021357*
As of December 31, 2015, the carrying value of the 51% equity interest in APLII amounting toP=1.2 billion was classified as “Assets of Disposal Group Held for Sale” in the separate statementof financial position.
The sale of APLII was completed on June 6, 2016 for a total consideration of USD66.0 million(P=3.1 billion). Pursuant to the sale of APLII, the Parent Company also entered into a distributionagreement with APLII where the Parent Company will allow APLII to have exclusive access tothe distribution network of the Parent Company and its subsidiary, PNB Savings Bank, over aperiod of 15 years. Both the share purchase agreement and distribution agreement have provisionsreferring to one another; making the distribution agreement an integral component of the saletransaction. Accordingly, the purchase consideration of USD66.0 million was allocated betweenthe sale of the 51.00% interest in APLII and the Exclusive Distribution Rights (EDR) amountingto USD44.9 million (P=2.1 billion) and USD21.1 million (P=1.0 billion), respectively.
The Parent Company will also receive variable annual and fixed bonus earn out payments basedon milestones achieved over the 15-year term of the distribution agreement.
The Parent Company recognized gain on sale of the 51.00% interest in APLII amounting toP=400.3 million, net of taxes and transaction costs amounting to P=276.7 million and P=153.3 million,respectively. The consideration allocated to the EDR was recognized as “Other DeferredRevenue” and will be amortized to income over 15 years from date of sale.
Prior to the sale of shares to Allianz SE, the Parent Company acquired additional 15.00%stockholdings from the minority shareholders for a consideration amounting to P=292.4 millionbetween June 2, 2016 and June 5, 2016.
Consequently, the Parent Company accounted for its remaining 44.00% ownership interest inAPLII as an associate. At the date of loss of control, the Parent Company’s investment in APLIIwas remeasured to P=2.7 billion based on the fair value of its retained equity. The Parent Companyrecognized gain on remeasurement amounting to P=1.6 billion in the statement of income in 2016.
The fair value of the retained equity was based on a combination of the income approach andmarket approach.
On September 21, 2016, the SEC approved the amendment of PNB Life Insurance, Inc.’s article ofincorporation to reflect the change in corporate name to Allianz-PNB Life Insurance, Inc.
Summarized financial information of APLII as of December 31, 2016 are as follows:
Current assets P=14,812,452Noncurrent assets 9,602,162Current liabilities 14,287,861Noncurrent liabilities 7,995,855Equity 2,130,898

- 97 -
*SGVFS021357*
Summarized statement of income of APLII for the seven months ended December 31, 2016follows:
Revenues P=1,164,407Costs and expenses (1,022,543)Income before tax 141,684Provision for income tax (29,762)Net income 112,101Other comprehensive loss (556,042)Total comprehensive income (P=443,941)Group’s share of comprehensive income for the period (P=195,334)
Investment in ACBIn August 2009, the Parent Company acquired 39.41% ownership in ACB in Xiamen China for atotal consideration of CNY394.1 million or USD57.7 million (equivalent to P=2.8 billion).
With its merger with ABC in 2013 (Note 1), the Parent Company’s equity interest in ACBincreased from 39.41% to 90.41%. This resulted in change in accounting for such investmentfrom an associate to a subsidiary. In accordance with PFRS 3, the step-up acquisition ofinvestment in ACB is accounted for as a disposal of the equity investment in ACB and the line byline consolidation of ACB’s assets and liabilities in the Group’s financial statements. The fairvalue of consideration received from the step-up acquisition is equal to the carrying value of thedisposed investment in ACB.
On November 22, 2013, the BOD of the Parent Company approved and confirmed the increase inequity investment of the Parent Company in ACB as a prerequisite to ACB’s application for CNYlicense, by way of purchase of the 9.59% shareholdings of the natural–person investors in ACB inthe amount of USD13.8 million. This was approved by BSP on June 4, 2014. On November 12,2015, the China Banking Regulatory Commission approved the takeover of the Parent Companyof the 51.00% shareholdings held by ABC and the buyout of the 8.63% shareholdings of sixnatural-person investors in ACB resulting in the increase of equity ownership in ACB to 99.04%.The Parent Company paid the natural-person investors on November 27, 2015. This acquisitionwas accounted for as an equity transaction which resulted in an increase of other equity adjustmentamounting to P=14.5 million in the consolidated statement of financial position.
PNB ForexOn August 23, 2013, the Parent Company approved the dissolution of PNB Forex by shorteningits corporate life to December 31, 2013. PNB Forex ceased its business operations onJanuary 1, 2006. As of December 31, 2016, PNB Forex is still in the process of complying withthe requirements of regulatory agencies to effect the dissolution.
PNB SBOn November 28, 2014, the Parent Company infused additional capital to PNB SB amounting toP=10.0 billion which will be used to build and refocus the Group’s consumer lending business. Theinfusion of additional equity to PNB SB was approved by the BSP on February 28, 2014.
PILFCOn November 28, 2014, the BOD of the Parent Company approved the sell back by the ParentCompany to IBJ Leasing (IBJL) of its 15.00% equity ownership in PILFC. Under the terms of thenew and expanded partnership, IBJL increased its stake in PILFC from 10.00% to 25.00%, and theParent Company’s stake decreased from 90.00% to 75.00%. The total consideration from the sale

- 98 -
*SGVFS021357*
of 15.00% equity ownership amounted to P=102.6 million and the Parent Company recognized lossfrom disposal amounting to P=12.2 million in its statement of income. This sale was accounted foras an equity transaction which resulted in a decrease of other equity adjustment amounting to P=0.5million in the consolidated statement of financial position.
PNB GenThe Parent Company contributed P=600.0 million to PNB Gen in 2014 to acquire 65.75% directinterest ownership over the latter. In 2013, the Parent Company has indirect ownership overPNB Gen through PNB Holdings. The additional capital of PNB Gen is meant to strengthen thefinancial position of the subsidiary considering that it suffered a net loss in 2013. Further, therestructuring of relationships between the entities in the Group have no impact on the consolidatedfinancial statements.
PNB Italy SpA (PISpA)PISpA was liquidated on November 9, 2014. The Group will shift to an agent-arrangement tocontinue remittance business in Italy.
Significant restrictionsThe Group does not have significant restrictions on its ability to access or use its assets and settleits liabilities other than those resulting from the regulatory supervisory frameworks within whichinsurance and banking subsidiaries operate.
The BSP and IC regulations require banks and insurance companies to maintain certain levels ofregulatory capital. As of December 31, 2016 and 2015, the total assets of banking subsidiariesamounted to P=59.8 billion and P=57.1 billion, respectively; and P=6.9 billion and P=30.8 billion forinsurance subsidiaries, respectively.
13. Investment Properties
Breakdown of investment properties:
Consolidated Parent Company2016 2015 2016 2015
Properties held for lease P=4,821,335 P=– P=5,137,644 P=1,974,560Foreclosed assets 11,519,917 13,230,005 10,837,486 12,692,271Total P=16,341,252 P=13,230,005 P=15,975,130 P=14,666,831
The composition of and movements in this account follow:
Consolidated2016
LandBuildings and
Improvements TotalCostBeginning balance P=14,287,746 P=3,989,636 P=18,277,382Additions 386,491 295,019 681,510Disposals/transfers/others 1,634,996 777,643 2,412,639Balance at end of year 16,309,233 5,062,298 21,371,531
(Forward)

- 99 -
*SGVFS021357*
Consolidated2016
LandBuildings and
Improvements TotalAccumulated DepreciationBalance at beginning of year P=– P=1,753,738 P=1,753,738Depreciation (Note 11) – 226,545 226,545Disposals/transfers/others – (246,345) (246,345)Balance at end of year – 1,733,938 1,733,938Allowance for Impairment Losses (Note 16) 2,999,854 296,487 3,296,341Net Book Value at End of Year P=13,309,379 P=3,031,873 P=16,341,252
Consolidated2015
LandBuildings andImprovements Total
CostBeginning balance P=21,411,572 P=4,450,944 P=25,862,516Additions 313,968 191,294 505,262Disposals/transfers/others (7,446,794) (653,612) (8,100,406)Cumulative translation adjustments 9,000 1,010 10,010Balance at end of year 14,287,746 3,989,636 18,277,382Accumulated DepreciationBalance at beginning of year – 1,856,814 1,856,814Depreciation (Note 11) – 162,097 162,097Disposals/transfers/others – (265,343) (265,343)Cumulative translation adjustments – 170 170Balance at end of year – 1,753,738 1,753,738Allowance for Impairment Losses (Note 16) 2,855,093 438,546 3,293,639Net Book Value at End of Year P=11,432,653 P=1,797,352 P=13,230,005
Parent Company2016
LandBuildings and
Improvements TotalCostBeginning balance P=16,096,896 P=3,760,994 P=19,857,890Additions 352,577 256,621 609,198Disposals/Transfers/Others (108,319) 609,954 501,635Balance at end of year 16,341,154 4,627,569 20,968,723Accumulated DepreciationBalance at beginning of year – 1,705,410 1,705,410Depreciation (Note 11) – 206,472 206,472Disposals/Transfers/Others – (219,361) (219,361)Balance at end of year – 1,692,521 1,692,521Allowance for Impairment Losses (Note 16) 2,999,854 301,218 3,301,072Net Book Value at End of Year P=13,341,300 P=2,633,830 P=15,975,130
Parent Company2015
LandBuildings andImprovements Total
CostBeginning balance P=21,108,095 P=4,218,699 P=25,326,794Additions 261,352 172,600 433,952Disposals/Transfers/Others (5,272,551) (630,305) (5,902,856)Balance at end of year 16,096,896 3,760,994 19,857,890
(Forward)

- 100 -
*SGVFS021357*
Parent Company2015
LandBuildings andImprovements Total
Accumulated DepreciationBalance at beginning of year P=– P=1,813,425 P=1,813,425Depreciation (Note 11) – 149,309 149,309Disposals/Transfers/Others – (257,324) (257,324)Balance at end of year – 1,705,410 1,705,410Allowance for Impairment Losses (Note 16) 3,051,469 434,180 3,485,649Net Book Value at End of Year P=13,045,427 P=1,621,404 P=14,666,831
Investment properties include real properties foreclosed or acquired in settlement of loans.Foreclosed investment properties of the Parent Company still subject to redemption period by theborrowers amounted to P=155.4 million and P=150.0 million, as of December 31, 2016 and 2015,respectively. Valuations were derived on the basis of recent sales of similar properties in the samearea as the investment properties and taking into account the economic conditions prevailing at thetime the valuations were made. The Group and the Parent Company are exerting continuingefforts to dispose these properties.
The total recoverable value of certain investment properties of the Group that were impairedamounted to P=7.0 billion and P=7.5 billion as of December 31, 2016 and 2015, respectively.For the Parent Company, the total recoverable value of certain investment properties that wereimpaired amounted to P=6.9 billion and P=7.3 billion as of December 31, 2016 and 2015,respectively.
In 2015, investment properties with carrying value of P=2.2 billion were converted as branches andhead offices of its subsidiaries and were transferred to property and equipment by the Group. Alsoin 2015, investment properties under joint arrangements with total carrying value of P=1.2 billionwere transferred to Real Estate Inventories Held under Development under ‘Other Assets’(Note 15). Property and equipment with carrying value of P=54.5 million were leased out underoperating leases and have been transferred to investment properties in 2015.
In 2016, the Group and the Parent Company reclassified certain properties from ‘Property andequipment’ to ‘Investment property’ with aggregate carrying amount of P=4.7 billion andP=3.2 billion, respectively. These properties mainly consist of the office spaces in the Allied BankCenter in Makati leased out and land in Buendia, Makati being held for future development.
For the Group, direct operating expenses on investment properties that generated rental incomeduring the year (other than depreciation and amortization), included under ‘Miscellaneousexpenses - Others’, amounted to P=13.6 million, P=30.5 million and P=26.4 million in 2016, 2015,and 2014, respectively. Direct operating expenses on investment properties that did not generaterental income included under ‘Miscellaneous expenses - Others’, amounted to P=201.8 million,P=192.4 million and P=134.3 million in 2016, 2015, and 2014, respectively.
For the Parent Company, direct operating expenses on investment properties that generated rentalincome during the year (other than depreciation and amortization), included under ‘Miscellaneousexpenses - Others’, amounted to P=8.3 million, P=20.4 million and P=23.3 million in 2016, 2015, and2014, respectively. Direct operating expenses on investment properties that did not generate rentalincome included under ‘Miscellaneous expenses - Others’, amounted to P=201.6 million,P=182.7 million and P=132.6 million in 2016, 2015, and 2014, respectively.

- 101 -
*SGVFS021357*
Net gains on sale or exchange of assetsThis account consists of:
Consolidated Parent Company2016 2015 2014 2016 2015 2014
Net gains from sale of investment property(Note 34) P=2,343,634 P=1,435,798 P=1,072,653 P=2,387,472 P=1,400,650 P=1,058,574
Net gains from foreclosure and repossession ofinvestment property 165,570 152,061 368,341 128,927 152,553 364,745
Net gains from sale of property and equipment(Note 11) 1,157 7,659 12,053 1,462 3,741 12,407
Net gains from sale of receivables (Note 34) − − − − 24,441 −P=2,510,361 P=1,595,518 P=1,453,047 P=2,517,861 P=1,581,385 P=1,435,726
14. Goodwill and Intangible Assets
Goodwill and intangible assets consist of:
Consolidated2016
Intangible Assets
Core DepositCustomer
Relationship Software Cost Total GoodwillCostBalance at beginning of year P=1,897,789 P=391,943 P=1,830,957 P=4,120,689 P=13,375,407Additions − − 406,053 406,053 −Write-offs − − (894) (894) −Cumulative translation adjustment − − 3,146 3,146 −Balance at end of year 1,897,789 391,943 2,239,262 4,528,994 13,375,407Accumulated AmortizationBalance at beginning of year 549,304 378,153 750,354 1,677,811 −Amortization (Note 11) 189,779 13,790 88,854 292,423 −Cumulative translation adjustment − − (3,609) (3,609) −Balance at end of year 739,083 391,943 835,599 1,966,625 −Net Book Value at End of Year P=1,158,706 P=− P=1,403,663 P=2,562,369 P=13,375,407
Consolidated2015
Intangible Assets
Core DepositCustomer
Relationship Software Cost Total GoodwillCostBalance at beginning of year P=1,897,789 P=391,943 P=1,254,343 P=3,544,075 P=13,375,407Additions − − 571,768 571,768 −Write-offs − − (704) (704) −Cumulative translation adjustment − − 5,550 5,550 −Balance at end of year 1,897,789 391,943 1,830,957 4,120,689 13,375,407Accumulated AmortizationBalance at beginning of year 359,525 247,505 642,221 1,249,251 −Amortization (Note 11) 189,779 130,648 103,749 424,176 −Write-offs − − (704) (704) −Cumulative translation adjustment − − 5,088 5,088 −Balance at end of year 549,304 378,153 750,354 1,677,811 −Net Book Value at End of Year P=1,348,485 P=13,790 P=1,080,603 P=2,442,878 P=13,375,407

- 102 -
*SGVFS021357*
Parent Company2016
Intangible Assets
Core DepositCustomer
Relationship Software Cost Total GoodwillCostBalance at beginning of year P=1,897,789 P=391,943 P=1,701,224 P=3,990,956 P=13,515,765Additions – – 404,837 404,837 –Write-offs – – (15) (15) –Cumulative translation adjustment – – 186 186 –Balance at end of year 1,897,789 391,943 2,106,232 4,395,964 13,515,765Accumulated AmortizationBalance at beginning of year 549,304 378,153 717,253 1,644,710 P=–Amortization (Note 11) 189,779 13,790 76,074 279,643 –Cumulative translation adjustment – – 160 160 –Balance at end of year 739,083 391,943 793,487 1,924,513 –Net Book Value at End of Year P=1,158,706 P=− P=1,312,745 P=2,471,451 P=13,515,765
Parent Company2015
Intangible Assets
Core DepositCustomer
Relationship Software Cost Total GoodwillCostBalance at beginning of year P=1,897,789 P=391,943 P=1,142,782 P=3,432,514 P=13,515,765Additions – – 558,372 558,372 –Cumulative translation adjustment – – 70 70 –Balance at end of year 1,897,789 391,943 1,701,224 3,990,956 13,515,765Accumulated AmortizationBalance at beginning of year 359,525 247,505 625,382 1,232,412 –Amortization (Note 11) 189,779 130,648 91,753 412,180 –Cumulative translation adjustment – – 118 118 –Balance at end of year 549,304 378,153 717,253 1,644,710 –Net Book Value at End of Year P=1,348,485 P=13,790 P=983,971 P=2,346,246 P=13,515,765
Core deposit (CDI) and customer relationship (CRI)CDI and CRI are the intangible assets acquired through the merger of the Parent Company withABC. CDI includes the stable level of deposit liabilities of ABC which is considered as favorablypriced source of funds by the Parent Company. CRI pertains to ABC’s key customer base whichthe Parent Company expects to bring more revenue through loan availments.
Software costSoftware cost as of December 31, 2016 and 2015 includes capitalized development costsamounting to P=1.2 billion and P=797.7 million, respectively, related to the Parent Company’s newcore banking system which is expected to be completed and available for use by 2017.
GoodwillAs discussed in Note 1, on February 9, 2013, the Parent Company acquired 100.00% of votingcommon stock of ABC, a listed universal bank. The acquisition of ABC was made to strengthenthe Parent Company’s financial position and enlarge its operations.
The Parent Company accounted for the business combination with ABC under the acquisitionmethod of PFRS 3. The Group has elected to measure the non-controlling interest in the acquireeat proportionate share of identifiable assets and liabilities.

- 103 -
*SGVFS021357*
The business combination resulted in recognition of goodwill which is determined as follows:
Purchase consideration transferred P=41,505,927Add: Proportionate share of the non-controlling interest in the net
assets of ABC 2,768,380Acquisition-date fair value of previously held interest in subsidiaries 2,471,630
Less: Fair values of net identifiable assets and liabilities assumed 33,370,530Goodwill P=13,375,407
Impairment testing of goodwill and intangible assetGoodwill acquired through business combinations has been allocated to three CGUs which arealso reportable segments, namely: retail banking, corporate banking and treasury. Goodwillallocated to the CGUs amounted to P=6.2 billion, P=4.2 billion and P=3.1 billion, respectively. CDI isallocated to retail banking while CRI is allocated to corporate banking.
Goodwill is reviewed for impairment annually in the fourth quarter of the reporting period, ormore frequently if events or changes in circumstances indicate that the carrying value may beimpaired. CDI and CRI, on the other hand, are assessed for impairment where indicator(s) ofobjective evidence of impairment has been identified. Impairment testing is done by comparingthe recoverable amount of each CGU with its carrying amount. The carrying amount of a CGU isderived based on its net assets plus the amount allocated to the CGU. The recoverable amount isthe higher of a CGUs’ fair value less costs to sell and its value in use. The goodwill impairmenttest in 2015 and 2014 did not result in an impairment loss of goodwill of the CGUs as therecoverable amount for these CGUs were higher than their respective carrying amount.
Key assumptions used in value in use calculationsThe recoverable amounts of the CGUs have been determined on the basis of value in usecalculation using the discounted cash flows (DCF) model. The DCF model uses earningsprojections based on financial budgets approved by senior management and the BOD of the ParentCompany covering a three-year period and are discounted to their present value. Estimating futureearning involves judgment which takes into account past and actual performance and expecteddevelopments in the respective markets and in the overall macro-economic environment.
The following rates were applied to the cash flow projections:
2016 2015Retail
BankingCorporate
Banking TreasuryRetail
BankingCorporate
Banking TreasuryPre-tax discount rate 11.17% 11.19% 8.99% 11.21% 13.11% 7.82%Projected growth rate 6.50% 6.50% 6.50% 6.03% 6.03% 6.03%
The calculation of value in use for retail banking, corporate banking and treasury cash generatingunits is most sensitive to interest margin, discount rates, market share during the budget period,projected growth rates used to extrapolate cash flows beyond the budget period, and current localgross domestic product.
Discount rateThe discount rate applied have been determined based on cost of equity for retail and corporatebanking segments and weighted average cost of capital for treasury segment. The cost of equitywas derived using the capital asset pricing model which is comprised of a market risk premium,

- 104 -
*SGVFS021357*
risk-free interest rate and the beta factor. The values for the risk-free interest rate, the market riskpremium and the beta factors were obtained from external sources of information.
Sensitivity to changes in assumptionsManagement believes that no reasonably possible change in any of the key assumptions usedwould cause the carrying value of the units to exceed their recoverable amount.
15. Other Assets
This account consists of:
Consolidated Parent Company2016 2015 2016 2015
FinancialReturn checks and other cash items P=249,528 P=103,667 P=254,420 P=95,886Checks for clearing 198,109 119,134 198,109 119,134Security deposits 109,944 78,922 71,713 38,775Receivable from SPV 500 500 500 500Others 10,186 748 6,535 356
568,267 302,971 531,277 254,651Non-financialCreditable withholding taxes 4,193,254 3,770,716 4,187,074 3,675,683Real estate inventories held under
development 728,752 1,235,530 728,752 1,235,530Deferred reinsurance premium 627,861 786,287 − –Deferred benefits 532,938 401,231 458,119 326,380Prepaid expenses 470,882 395,671 330,930 328,489Documentary stamps on hand 214,969 221,088 212,145 134,459Stationeries and supplies 64,900 78,764 59,433 72,798Chattel mortgage properties-net of
depreciation 36,586 51,086 35,046 47,848Other investments 22,201 37,664 18,862 16,696Miscellaneous 401,510 339,411 729,324 159,795
7,293,853 7,317,448 6,759,685 5,997,6787,862,120 7,620,419 7,290,962 6,252,329
Less allowance for impairmentlosses (Note 16) 770,662 840,151 738,088 835,042
P=7,091,458 P=6,780,268 P=6,552,874 P=5,417,287
Real estate inventories held under developmentThis represents parcels of land contributed by the Parent Company under joint arrangements withreal estate developers to be developed as residential condominium units and subdivision lots.
Deferred reinsurance premiumsThe deferred reinsurance premiums of the Group refer to portion of reinsurance premiums cededthat are unexpired as of December 31, 2016 and 2015.
Prepaid expensesThis represents expense prepayments expected to benefit the Group for a future period notexceeding one year, such as insurance premiums, rent and interest on time certificates of depositspaid in advance which shall be amortized monthly.

- 105 -
*SGVFS021357*
Deferred benefitsThis represents the share of the Group in the cost of transportation equipment acquired under theGroup’s car plan which shall be amortized monthly.
Chattel mortgage propertiesAs of December 31, 2016 and 2015, accumulated depreciation on chattel mortgage propertiesacquired by the Group and the Parent Company in settlement of loans amounted to P=79.1 millionand P=36.5 million, respectively.
As of December 31, 2016 and 2015, the total recoverable value of certain chattel mortgageproperties of the Group and the Parent Company that were impaired amounted to P=2.1 million andP=9.8 million, respectively.
Receivable from SPVThe Group has receivable from SPV, Opal Portfolio Investing Inc. (OPII), which wasdeconsolidated upon adoption of PFRS 10.
Receivable from SPV represents fully provisioned subordinated notes received by the ParentCompany from Golden Dragon Star Equities and its assignee, OPII, relative to the sale of certainNon-performing assets of the Bank. Collections from OPII in 2016, 2015 and 2014 amounting toP=500.0 million, P=353.0 million and P=27.0 million, respectively are recorded under ‘MiscellaneousIncome’ (Note 28).
MiscellaneousOther financial assets include revolving fund, petty cash fund and miscellaneous cash and othercash items.
Other nonfinancial assets include postages, refundable deposits, notes taken for interest andsundry debits.
16. Allowance for Impairment and Credit Losses
Provision for impairment, credit and other lossesThis account consists of:
Consolidated Parent Company2016 2015 2014 2016 2015 2014
Continuing operations:Provision for impairment P=114,448 P=449,698 P=293,384 P=113,593 P=322,649 P=495,674Provision for credit losses 2,696,693 860,393 1,912,663 1,192,348 513,697 1,600,957Provision for (reversal of)
other losses (Note 35) 401,553 (741,911) 58,568 401,553 (741,911) 58,5683,212,694 568,180 2,264,615 1,707,494 94,435 2,155,199
Discontinued operations:Provision for credit losses
(Note 37) 4,704 32,765 − − − −P=3,217,398 P=600,945 P=2,264,615 P=1,707,494 P=94,435 P=2,155,199

- 106 -
*SGVFS021357*
Changes in the allowance for impairment and credit losses on financial assets follow:
Consolidated2016 2015
AFSInvestments
Loans andReceivables
OtherAssets*
AFSInvestments
Loans andReceivables
OtherAssets*
Balance at beginning of year P=930,111 P=13,428,014 P=500 P=929,881 P=12,435,509 P=500Provisions 15,856 2,680,837 – 32,995 860,163 –Accretion on impaired loans
(Note 10) – (103,715) – – (217,097) –Accounts charged-off – (1,282,872) – – (543,736) –Transfers and others (70,492) 170,550 – – 893,175 –Effect of disposal group classified as
held for sale (Note 37) – – – (32,765) − −Balance at end of year P=875,475 P=14,892,814 P=500 P=930,111 P=13,428,014 P=500*Pertains to ‘Receivable from SPV’
Parent Company2016 2015
AFSInvestments
Loans andReceivables
OtherAssets*
AFSInvestments
Loans andReceivables
OtherAssets*
Balance at beginning of year P=930,111 P=12,860,728 P=500 P=929,881 P=11,946,142 P=500Provisions 15,601 1,176,747 – 230 513,467 –Accretion − (103,715) – – (216,973) –Accounts charged-off − (419,978) – – (463,112) –Transfers and others (70,492) 518,340 – – 1,081,204 –Balance at end of year P=875,220 P=14,032,122 P=500 P=930,111 P=12,860,728 P=500*Pertains to ‘Receivable from SPV’
Movements in the allowance for impairment losses on nonfinancial assets follow:
Consolidated2016 2015
Propertyand
EquipmentInvestmentProperties
OtherAssets
Propertyand
EquipmentInvestmentProperties
OtherAssets
Balance at beginning of year P=461,077 P=3,293,639 P=839,651 P=229,506 P=3,757,220 P=457,646Provisions (reversals) – 141,740 (27,292) 5,372 319,880 124,446Disposals – (331,094) – – (475,243) (90)Transfers and others (232,844) 192,056 (42,197) 226,199 (308,218) 257,649Balance at end of year P=228,233 P=3,296,341 P=770,162 P=461,077 P=3,293,639 P=839,651
Parent Company2016 2015 (As restated - Note 2)
Propertyand
EquipmentInvestmentProperties
OtherAssets
Propertyand
EquipmentInvestmentProperties
OtherAssets
Balance at beginning of year P=264,701 P=3,485,649 P=834,542 P=228,453 P=3,760,466 P=452,324Provisions (reversals) – 140,883 (27,290) 5,372 315,514 1,763Disposals – (331,094) − − (475,243) (90)Transfers and others (36,468) 5,634 (69,664) 30,876 (115,088) 380,545Balance at end of year P=228,233 P=3,301,072 P=737,588 P=264,701 P=3,485,649 P=834,542

- 107 -
*SGVFS021357*
The movements in allowance for credit losses for loans and receivables by class follow:
Consolidated2016
Receivable from customers UnquotedDebt
Securities Others TotalBusiness
LoansGOCCs
and NGAs LGUs ConsumersFringe
BenefitsBalance at beginning of year P=5,186,186 P=159,047 P=148,602 P=1,113,167 P=23,066 P=3,619,267 P=3,178,679 P=13,428,014Provisions (reversals) 2,646,019 (60,691) 7,855 345,819 (1,375) 68,221 (325,011) 2,680,837Accretion on impaired loans
(Note 10) (98,161) – (7,478) 1,855 69 – − (103,715)Accounts charged off (886,304) – – (304,081) (1,534) – (90,953) (1,282,872)Transfers and others (782) (2,326) 21,196 84,634 (1,212) – 69,040 170,550Balance at end of year P=6,846,958 P=96,030 P=170,175 P=1,241,394 P=19,014 P=3,687,488 P=2,831,755 P=14,892,814Individual impairment P=4,508,372 P=– P=67,637 P=49,861 P=14,940 P=3,687,488 P=1,761,208 P=10,089,506Collective impairment 2,338,586 96,030 102,538 1,191,533 4,074 – 1,070,547 4,803,308
P=6,846,958 P=96,030 P=170,175 P=1,241,394 P=19,014 P=3,687,488 P=2,831,755 P=14,892,814Gross amounts of loans and
receivables subject toindividual impairment P=5,573,463 P=– P=130,523 P=81,276 P=15,155 P=6,914,864 P=1,763,012 P=14,478,293
Consolidated2015
Receivable from customers UnquotedDebt
Securities Others TotalBusiness
LoansGOCCs
and NGAs LGUs ConsumersFringe
BenefitsBalance at beginning of year P=4,530,880 P=189,270 P=62,462 P=1,012,637 P=17,109 P=3,619,267 P=3,003,884 P=12,435,509Provisions (reversals) 803,832 (1,556) (56,009) 176,565 (376) (166,627) 104,334 860,163Accretion on impaired loans
(Note 10) (195,847) (100) (10,595) (10,398) (157) – – (217,097)Accounts charged off (314,705) – – (19,915) – – (209,116) (543,736)Transfers and others 362,026 (28,567) 152,744 (45,722) 6,490 166,627 279,577 893,175Balance at end of year P=5,186,186 P=159,047 P=148,602 P=1,113,167 P=23,066 P=3,619,267 P=3,178,679 P=13,428,014Individual impairment P=3,191,973 P=47,060 P=50,582 P=79,743 P=22,520 P=3,619,267 P=2,111,427 P=9,122,572Collective impairment 1,994,213 111,987 98,020 1,033,424 546 – 1,067,252 4,305,442
P=5,186,186 P=159,047 P=148,602 P=1,113,167 P=23,066 P=3,619,267 P=3,178,679 P=13,428,014Gross amounts of loans and
receivables subject toindividual impairment P=4,427,469 P=47,060 P=65,424 P=370,763 P=25,993 P=3,694,435 P=2,682,529 P=11,313,673
Parent Company2016
Receivable from customers UnquotedDebt
Securities Others TotalBusiness
LoansGOCCs
and NGAs LGUs ConsumersFringe
BenefitsBalance at beginning of year P=5,038,887 P=159,047 P=148,602 P=995,020 P=23,064 P=3,619,267 P=2,876,841 P=12,860,728Provisions (reversals) 1,178,626 (60,691) 7,855 327,211 (1,375) 68,221 (343,100) 1,176,747Accretion on impaired loans
(Note 10) (98,161) – (7,478) 1,855 69 – – (103,715)Accounts charged off (24,221) – – (304,075) (1,534) – (90,148) (419,978)Transfers and others 592,413 (2,326) 21,196 (129,918) (1,212) – 38,187 518,340Balance at end of year P=6,687,544 P=96,030 P=170,175 P=890,093 P=19,012 P=3,687,488 P=2,481,780 P=14,032,122Individual impairment P=4,045,946 P=– P=67,637 P=575 P=14,940 P=3,687,488 P=1,649,393 P=9,465,979Collective impairment 2,641,598 96,030 102,538 889,518 4,072 – 832,387 4,566,143
P=6,687,544 P=96,030 P=170,175 P=890,093 P=19,012 P=3,687,488 P=2,481,780 P=14,032,122Gross amounts of loans and
receivables subject toindividual impairment P=4,412,364 P=– P=130,523 P=1,075 P=14,940 P=6,914,864 P=1,649,393 P=13,123,159

- 108 -
*SGVFS021357*
Parent Company2015
Receivable from customers UnquotedDebt
Securities Others TotalBusiness
LoansGOCCs
and NGAs LGUs ConsumersFringe
BenefitsBalance at beginning of year P=4,266,298 P=189,270 P=62,462 P=963,545 P=17,105 P=3,619,267 P=2,828,195 P=11,946,142Provisions (reversals) 739,770 (1,556) (56,009) 45,803 (375) (166,627) (47,539) 513,467Accretion on impaired loans
(Note 10) (195,847) (100) (10,594) (10,275) (157) – – (216,973)Accounts charged off (234,454) – – (19,774) – – (208,884) (463,112)Transfers and others 463,120 (28,567) 152,743 15,721 6,491 166,627 305,069 1,081,204Balance at end of year P=5,038,887 P=159,047 P=148,602 P=995,020 P=23,064 P=3,619,267 P=2,876,841 P=12,860,728Individual impairment P=3,121,354 P=47,060 P=50,582 P=1,950 P=22,520 P=3,619,267 P=1,884,127 P=8,746,860Collective impairment 1,917,533 111,987 98,020 993,070 544 – 992,714 4,113,868
P=5,038,887 P=159,047 P=148,602 P=995,020 P=23,064 P=3,619,267 P=2,876,841 P=12,860,728Gross amounts of loans and
receivables subject toindividual impairment P=3,908,379 P=47,060 P=65,424 P=19,716 P=22,520 P=3,694,435 P=2,390,837 P=10,148,371
17. Deposit Liabilities
As of December 31, 2016 and 2015, noninterest-bearing deposit liabilities amounted toP=19.9 billion and P=23.8 billion, respectively, for the Group and P=15.8 billion and P=23.6 billion,respectively, for the Parent Company. The remaining deposit liabilities of the Group generallyearn annual fixed interest rates ranging from 0.00% to 6.23% in 2016, 0.05% to 5.00% in 2015and 0.05% to 6.11% in 2014 for peso-denominated deposit liabilities, and from 0.00% to 3.71% in2016, 0.00% to 2.25% in 2015 and 0.02% to 2.26% in 2014 for foreign currency-denominateddeposit liabilities. The remaining deposit liabilities of the Parent Company generally earn annualfixed interest rates ranging from 0.01% to 6.23% in 2016, 0.10% to 5.00% in 2015, and 0.10% to6.11% in 2014 for peso-denominated deposit liabilities, and from 0.02% to 4.00% in 2016, 0.00%to 2.25% in 2015 and 0.02% to 2.26% in 2014 for foreign-currency denominated depositliabilities.
On March 29, 2012, BSP issued Circular No. 753 which provides for the unification of thestatutory and liquidity reserve requirement, non-remuneration of the unified reserve requirement,exclusion of cash in vault and demand deposits as eligible forms of reserve requirementcompliance, and reduction in the unified reserve requirement ratios.
Under existing BSP regulations, non-FCDU deposit liabilities of the Parent Company and PNBSB are subject to reserves equivalent to 20.00% and 8.00%, respectively.
Available reserves booked under ‘Due from BSP’ are as follows:
2016 2015Parent Company P=87,099,952 P=73,403,945PNB SB 1,895,909 886,496
P=88,995,861 P=74,290,441
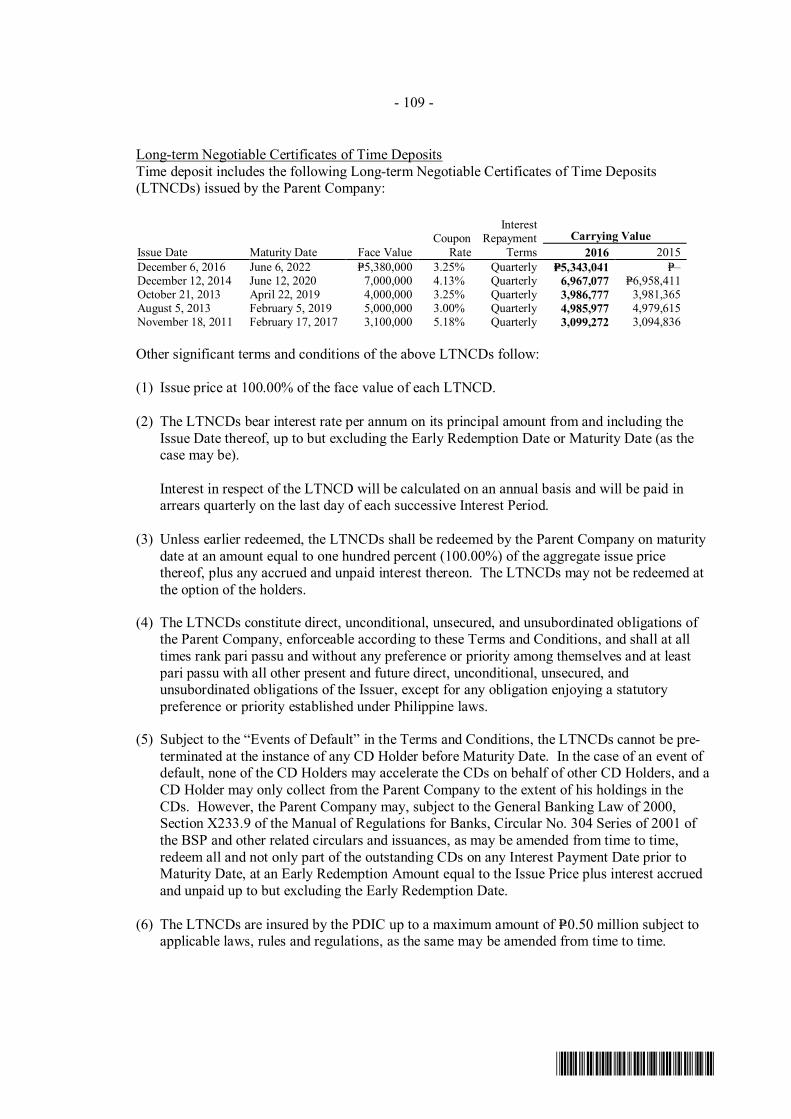
- 109 -
*SGVFS021357*
Long-term Negotiable Certificates of Time DepositsTime deposit includes the following Long-term Negotiable Certificates of Time Deposits(LTNCDs) issued by the Parent Company:
Issue Date Maturity Date Face ValueCoupon
Rate
Interest Repayment
TermsCarrying Value
2016 2015December 6, 2016 June 6, 2022 P=5,380,000 3.25% Quarterly P=5,343,041 P=–December 12, 2014 June 12, 2020 7,000,000 4.13% Quarterly 6,967,077 P=6,958,411October 21, 2013 April 22, 2019 4,000,000 3.25% Quarterly 3,986,777 3,981,365August 5, 2013 February 5, 2019 5,000,000 3.00% Quarterly 4,985,977 4,979,615November 18, 2011 February 17, 2017 3,100,000 5.18% Quarterly 3,099,272 3,094,836
Other significant terms and conditions of the above LTNCDs follow:
(1) Issue price at 100.00% of the face value of each LTNCD.
(2) The LTNCDs bear interest rate per annum on its principal amount from and including theIssue Date thereof, up to but excluding the Early Redemption Date or Maturity Date (as thecase may be).
Interest in respect of the LTNCD will be calculated on an annual basis and will be paid inarrears quarterly on the last day of each successive Interest Period.
(3) Unless earlier redeemed, the LTNCDs shall be redeemed by the Parent Company on maturitydate at an amount equal to one hundred percent (100.00%) of the aggregate issue pricethereof, plus any accrued and unpaid interest thereon. The LTNCDs may not be redeemed atthe option of the holders.
(4) The LTNCDs constitute direct, unconditional, unsecured, and unsubordinated obligations ofthe Parent Company, enforceable according to these Terms and Conditions, and shall at alltimes rank pari passu and without any preference or priority among themselves and at leastpari passu with all other present and future direct, unconditional, unsecured, andunsubordinated obligations of the Issuer, except for any obligation enjoying a statutorypreference or priority established under Philippine laws.
(5) Subject to the “Events of Default” in the Terms and Conditions, the LTNCDs cannot be pre-terminated at the instance of any CD Holder before Maturity Date. In the case of an event ofdefault, none of the CD Holders may accelerate the CDs on behalf of other CD Holders, and aCD Holder may only collect from the Parent Company to the extent of his holdings in theCDs. However, the Parent Company may, subject to the General Banking Law of 2000,Section X233.9 of the Manual of Regulations for Banks, Circular No. 304 Series of 2001 ofthe BSP and other related circulars and issuances, as may be amended from time to time,redeem all and not only part of the outstanding CDs on any Interest Payment Date prior toMaturity Date, at an Early Redemption Amount equal to the Issue Price plus interest accruedand unpaid up to but excluding the Early Redemption Date.
(6) The LTNCDs are insured by the PDIC up to a maximum amount of P=0.50 million subject toapplicable laws, rules and regulations, as the same may be amended from time to time.

- 110 -
*SGVFS021357*
(7) Each Holder, by accepting the LTNCDs, irrevocably agrees and acknowledges that: (a) it maynot exercise or claim any right of set-off in respect of any amount owed to it by the ParentCompany arising under or in connection with the LTNCDs; and (b) it shall, to the fullestextent permitted by applicable law, waive and be deemed to have waived all such rights of set-off.
Interest expense on deposit liabilities consists of:
Consolidated Parent Company2016 2015 2014 2016 2015 2014
Savings P=2,124,979 P=1,677,307 P=1,680,386 P=2,074,446 P=1,646,552 P=1,677,129Time 798,894 463,980 354,016 431,161 292,707 196,795LTNCDs 764,230 752,562 637,957 764,230 752,563 637,957Demand 92,139 86,170 116,041 87,029 81,898 103,075
P=3,780,242 P=2,980,019 P=2,788,400 P=3,356,866 P=2,773,720 P=2,614,956
In 2016, 2015 and 2014, interest expense on LTNCDs for both the Group and the Parent Companyincludes amortization of transaction costs amounting to P=25.3 million, P=16.9 million andP=22.8 million, respectively. Unamortized transaction costs of the LTNCDs amounted toP=97.9 million and P=85.8 million as of December 31, 2016 and 2015, respectively.
18. Financial Liabilities at Fair Value Through Profit or Loss
This account consists of:
Consolidated Parent Company2016 2015 2016 2015
Derivative liabilities (Notes 23 and 36) P=232,832 P=135,193 P=231,977 P=135,009
19. Bills and Acceptances Payable
This account consists of:
Consolidated Parent Company2016 2015 2016 2015
Bills payable to:BSP and local banks (Note 34) P=26,575,781 P=17,580,304 P=23,121,171 P=14,784,750Foreign banks 7,632,548 7,676,238 9,188,027 9,269,456Others 18,279 150,864 18,160 230,865
34,226,608 25,407,406 32,327,358 24,285,071Acceptances outstanding (Note 10) 1,659,340 344,816 1,659,340 344,816
P=35,885,948 P=25,752,222 P=33,986,698 P=24,629,887
Foreign currency-denominated borrowings of the Group and the Parent Company bear annualinterest ranging from 0.05% to 2.00%, 0.01% to 2.50% and 0.03% to 2.50% in 2016, 2015 and2014, respectively.
Peso-denominated borrowings of the Group and the Parent Company bear annual interest of0.63% in 2016 and from 0.38% to 0.63% and 0.63% to 2.00% in 2015 and 2014, respectively.

- 111 -
*SGVFS021357*
The Parent Company’s bills payable to BSP includes the transferred liabilities from Maybankamounting to P=1.8 billion as of December 31, 2015 which were applied against the principalcomponent of the transferred receivables in May 2016 (Note 10).
Bills payable to foreign banks consist of various repurchase agreements and a three-yearsyndicated borrowing, with carrying value of P=7.4 billion and P=7.0 billion as of December 31,2016 and 2015, respectively.
Significant terms and conditions of the three-year syndicated borrowing include the following:
(1) The lenders agree to provide the Parent Company with a term loan facility of up to$150.00 million. The Parent Company must repay all utilized loans at April 24, 2018, thefinal maturity date, which is three years from the agreement date.
(2) The borrowing bears interest at 1.38% over USD LIBOR. The Parent Company may select aninterest period of one or three months for each utilization, provided that the interest period fora utilization shall not extend beyond the final maturity date.
(3) The Parent Company shall ensure that so long as any amount is of the facility is utilized, theCommon Equity Tier 1 Risk Weighted Ratio, the Tier 1 Risk Weighted Ratio, and theQualifying Capital Risk Weighted Ratio will, at all times, be equal to or greater than thepercentage prescribed by BSP from time to time. Failure to comply with such financialcovenants will result to cancellation of the total commitments of the lenders and declare all orpart of the loans, together with accrued interest, be immediately due and payable.
(4) The Parent Company may voluntarily prepay whole or any part of any loan outstanding and inintegral multiples of $1.00 million, subject to prior notice of the Agent for not less than15 business days. Prepayment shall be made on the last day of an interest period applicable tothe loan. Mandatory prepayment may occur if a change of control or credit rating downgradeoccurs. In this case, the lenders may cancel the facility and declare all outstanding loans,together with accrued interest, immediately due and demandable.
As of December 31, 2016 and 2015, the Parent Company has complied with the above debtcovenants.
As of December 31, 2016 and 2015, the unamortized transaction cost of the syndicated borrowingamounted to P=32.7 million and P=54.9 million, respectively.
As of December 31, 2016, bills payable with a carrying amount of P=20.6 billion is secured by apledge of certain AFS investments with carrying value and fair value of P=10.0 billion andP=9.8 billion and HTM investments with carrying value and fair value of P=14.5 billion andP=15.3 billion, respectively (Note 9).
As of December 31, 2015, bills payable with a carrying amount of P=12.8 billion is secured by apledge of certain AFS investments with carrying value and fair value of P=8.5 billion and HTMinvestments with carrying value and fair value of P=7.0 billion and P=7.5 billion, respectively(Note 9).
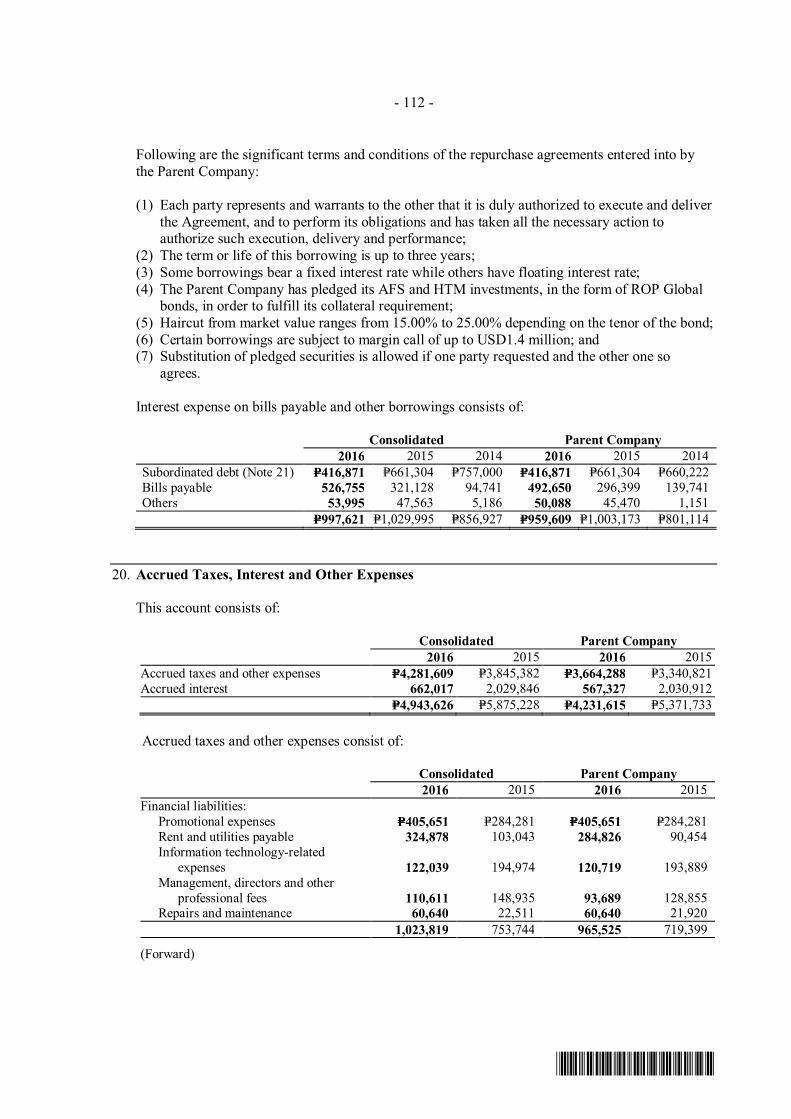
- 112 -
*SGVFS021357*
Following are the significant terms and conditions of the repurchase agreements entered into bythe Parent Company:
(1) Each party represents and warrants to the other that it is duly authorized to execute and deliverthe Agreement, and to perform its obligations and has taken all the necessary action toauthorize such execution, delivery and performance;
(2) The term or life of this borrowing is up to three years;(3) Some borrowings bear a fixed interest rate while others have floating interest rate;(4) The Parent Company has pledged its AFS and HTM investments, in the form of ROP Global
bonds, in order to fulfill its collateral requirement;(5) Haircut from market value ranges from 15.00% to 25.00% depending on the tenor of the bond;(6) Certain borrowings are subject to margin call of up to USD1.4 million; and(7) Substitution of pledged securities is allowed if one party requested and the other one so
agrees.
Interest expense on bills payable and other borrowings consists of:
Consolidated Parent Company2016 2015 2014 2016 2015 2014
Subordinated debt (Note 21) P=416,871 P=661,304 P=757,000 P=416,871 P=661,304 P=660,222Bills payable 526,755 321,128 94,741 492,650 296,399 139,741Others 53,995 47,563 5,186 50,088 45,470 1,151
P=997,621 P=1,029,995 P=856,927 P=959,609 P=1,003,173 P=801,114
20. Accrued Taxes, Interest and Other Expenses
This account consists of:
Consolidated Parent Company2016 2015 2016 2015
Accrued taxes and other expenses P=4,281,609 P=3,845,382 P=3,664,288 P=3,340,821Accrued interest 662,017 2,029,846 567,327 2,030,912
P=4,943,626 P=5,875,228 P=4,231,615 P=5,371,733
Accrued taxes and other expenses consist of:
Consolidated Parent Company2016 2015 2016 2015
Financial liabilities:Promotional expenses P=405,651 P=284,281 P=405,651 P=284,281Rent and utilities payable 324,878 103,043 284,826 90,454Information technology-related
expenses 122,039 194,974 120,719 193,889Management, directors and other
professional fees 110,611 148,935 93,689 128,855Repairs and maintenance 60,640 22,511 60,640 21,920
1,023,819 753,744 965,525 719,399
(Forward)

- 113 -
*SGVFS021357*
Consolidated Parent Company2016 2015 2016 2015
Nonfinancial liabilities:Other benefits - monetary value of
leave credits P=1,506,395 P=1,441,417 P=1,475,124 P=1,416,521PDIC insurance premiums 517,145 470,701 494,466 459,901Employee benefits 373,167 298,183 343,008 282,674Other taxes and licenses 243,134 398,455 86,610 81,966Reinstatement premium 56,922 9,676 – –Other expenses 561,027 473,206 299,555 380,360
3,257,790 3,091,638 2,698,763 2,621,422P=4,281,609 P=3,845,382 P=3,664,288 P=3,340,821
The Parent Company’s accrued interest payable includes the transferred liabilities from Maybankamounting to P=1.6 billion as of December 31, 2015 which were applied against the interestcomponent of the transferred receivables in May 2016 (Note 10).
‘Other expenses’ include janitorial, representation and entertainment, communication and otheroperating expenses.
21. Subordinated Debt
This account consists of:
Issue Date Maturity Date Face ValueCoupon
Rate
InterestRepayment Carrying Value
Terms 2016 2015June 15, 2011 June 15, 2021 P=6,500,000 6.750% Quarterly P=– P=6,494,324May 9, 2012 May 9, 2022 3,500,000 5.875% Quarterly 3,497,798 3,492,103
P=10,000,000 P=3,497,798 P=9,986,427
5.875% P=3.5 Billion Subordinated NotesOn May 9, 2012, the Parent Company’s BOD approved the issuance of unsecured subordinatednotes of P=3.5 billion that qualify as Lower Tier 2 capital. EIR on this note is 6.05%.
Significant terms and conditions of the subordinated notes follow:
(1) The 2012 Notes bear interest at the rate of 5.88% per annum from and including May 9, 2012to but excluding May 9, 2022. Interest will be payable quarterly in arrears on the 9th ofAugust, November, February and May of each year, commencing on May 9, 2012, unless the2012 Notes are redeemed at a redemption price equal to 100.00% of the principal amount onMay 10, 2017, call option date.
(2) Each noteholder, by accepting the 2012 Notes, irrevocably agrees and acknowledges that itmay not exercise or claim any right of set-off in respect of any amount owed by the ParentCompany arising under or in connection with the 2012 Notes.
In a resolution dated January 26, 2017, the BSP Monetary Board approved the request of theParent Company to exercise its call option on the P=3.5 Billion Subordinated Notes, subject tocompliance of relevant regulations. The 2012 Notes will be redeemed on May 10, 2017 at anamount equal to the aggregate issue price of the Notes plus accrued and unpaid interest thereon upto but excluding May 10, 2017 (Call Option Amount). The Call Option Amount shall be paid to

- 114 -
*SGVFS021357*
all noteholders on record as of April 25, 2017. No transfers shall be allowed from April 25 toMay 9, 2017.
6.75% P=6.5 Billion Subordinated NotesOn May 15, 2011, the Parent Company’s BOD approved the issuance of unsecured subordinatednotes of P=6.5 billion that qualify as Lower Tier 2 capital. EIR on this note is 6.94%.
Significant terms and conditions of the subordinated notes follow:
(1) The 2011 Notes bear interest at the rate of 6.75% per annum from and including June 15, 2011to but excluding June 15, 2021. Interest will be payable quarterly in arrears on the 15th ofSeptember, December, March and June of each year, commencing on June 15, 2011, unlessthe 2011 Notes are redeemed at a redemption price equal to 100.00% of the principal amounton June 16, 2016, call option date.
(2) Each noteholder, by accepting the 2011 Notes, irrevocably agrees and acknowledges that itmay not exercise or claim any right of set-off in respect of any amount owed by the ParentCompany arising under or in connection with the 2011 Notes.
On June 16, 2016, the Parent Company exercised its call option and paid P=6.5 billion to allnoteholders as of June 1, 2016.
As of December 31, 2016 and 2015, the unamortized transaction cost of subordinated debtamounted to P=2.2 million and P=13.6 million, respectively.
In 2016, 2015 and 2014, amortization of transaction costs amounting to P=11.4 million,P=16.9 million and P=15.8 million, respectively were charged to ‘Interest expenses - bills payableand other borrowings’ in the statement of income (Note 19).
22. Other Liabilities
This account consists of:
Consolidated Parent Company2016 2015 2016 2015
FinancialAccounts payable P=7,652,222 P=6,825,663 P=6,375,193 P=6,179,304Insurance contract liabilities 4,581,800 4,719,336 − –Bills purchased - contra (Note 10) 3,260,308 3,418,002 3,254,224 3,411,729Manager’s checks and demand drafts
outstanding 1,174,872 937,799 1,003,755 915,764Other dormant credits 928,582 753,338 918,217 734,346Due to other banks 923,777 461,100 763,046 517,261Deposits on lease contracts 805,377 854,817 35,769 37,448Accounts payable - electronic money 791,223 556,618 791,223 556,618Payment order payable 292,336 407,196 292,336 407,196Margin deposits and cash letters of credit 174,206 182,640 162,972 168,820Commission payable 94,618 132,059 – –Transmission liability 31,732 24,976 – –Deposit for keys on safety deposit boxes 14,140 14,217 14,140 14,217
20,725,193 19,287,761 13,610,875 12,942,703
(Forward)

- 115 -
*SGVFS021357*
Consolidated Parent Company2016 2015 2016 2015
NonfinancialRetirement benefit liability (Note 29) P=3,138,824 P=2,955,003 P=3,063,243 P=2,889,735Provisions (Note 35) 1,300,290 898,737 1,300,290 898,737Reserve for unearned premiums 1,075,732 1,191,405 – –Other deferred revenue (Note 12) 939,672 – 939,672 –Due to Treasurer of the Philippines 543,002 438,943 542,501 438,451Withholding tax payable 230,044 224,523 220,859 209,567Deferred tax liabilities (Note 31) 152,532 152,585 – –SSS, Philhealth, Employer’s
Compensation Premiums andPag-IBIG Contributions Payable 28,327 29,092 27,404 24,237
Miscellaneous 431,757 480,235 323,116 265,7017,840,180 6,370,523 6,417,085 4,726,428
P=28,565,373 P=25,658,284 P=20,027,960 P=17,669,131
Other deferred revenue pertains to the allocated portion of the consideration received for thedisposal of APLII related to the Exclusive Distribution Right (Note 12). In 2016, amortization ofother deferred revenue amounting to P=36.6 million was recognized under ‘Service fees andcommission income.’
‘Miscellaneous’ of the Group and the Parent Company include interoffice floats, remittance -related payables, overages, advance rentals and sundry credits.
23. Derivative Financial Instruments
The table below shows the fair values of derivative financial instruments entered into by theGroup, recorded as derivative assets or derivative liabilities, together with the notional amounts.The notional amount is the amount of a derivative’s underlying asset, reference rate or index andis the basis upon which changes in the value of derivatives are measured. The notional amountsindicate the volume of transactions outstanding as of December 31, 2016 and 2015 and are notindicative of either market risk or credit risk (amounts in thousands, except average forward rate).
Consolidated2016
Assets LiabilitiesAverage
Forward Rate*NotionalAmount*
Freestanding derivatives:Currency forwards and spots:
BUY:USD P=99 P=3,766 49.99 200,498EUR 94 48 1.05 979HKD 630 − 0.13 412,710CAD 277 − 0.74 1,861GBP − 160 1.23 2,595
SELL:USD 46,155 10,601 49.85 382,664CAD 873 258 0.74 4,263GBP 5,227 − 1.24 9,550SGD − 361 0.69 5,573HKD − 1,032 0.13 144,748EUR 740 − 1.05 4,000JPY 45,957 504 0.01 16,524,949AUD 483 − 0.74 450
Interest rate swaps 257,042 216,102Warrants 61,545 −
P=419,122 P=232,832*The notional amounts and average forward rates pertain to original currencies.

- 116 -
*SGVFS021357*
Consolidated2015
Assets LiabilitiesAverage
Forward Rate*NotionalAmount*
Freestanding derivatives:Currency forwards and spots:
BUY:USD P=42 P=5,210 47.37 155,521EUR 122 – 1.09 898HKD – 66 7.75 13,012CAD – 170 0.72 1,385GBP – 168 1.36 1,104
SELL:USD 66,932 – 47.31 374,421CAD 520 34 0.72 3,444GBP P=455 P=139 1.49 5,700SGD 411 190 1.41 4,600HKD 86 184 7.75 63,733EUR 4 11 1.10 2,200JPY – 86,305 0.39 4,492,495AUD – 149 0.72 450
Interest rate swaps 49,444 42,567Warrants 63,332 –
P=181,348 P=135,193*The notional amounts and average forward rates pertain to original currencies.
Parent Company2016
Assets LiabilitiesAverage
Forward Rate*Notional
Amount*Freestanding derivatives:Currency forwards and spots:
BUY:USD P=− P=3,766 49.99 196,998CAD 277 − 0.74 1,861GBP − 160 1.23 2,595HKD 520 − 0.13 58,154EUR − 48 1.05 358
SELL:USD 46,155 10,093 49.85 336,314CAD 873 258 0.74 4,263GBP 5,227 − 1.24 9,550SGD − 361 0.69 5,573EUR 740 − 1.05 4,000HKD − 711 0.13 117,609JPY 45,957 478 0.01 16,524,949AUD 483 − 0.74 450
Interest rate swaps 257,042 216,102Warrants 61,545 −
P=418,819 P=231,977*The notional amounts and average forward rates pertain to original currencies.
Parent Company2015
Assets LiabilitiesAverage
Forward Rate*Notional
Amount*Freestanding derivatives:Currency forwards and spots:
BUY:USD P=42 P=5,210 47.37 155,521CAD – 170 0.72 1,385GBP – 168 1.36 1,104HKD – 66 7.75 13,012JPY – – 120.34 1,330
SELL:USD 66,932 – 47.31 374,421CAD 520 34 0.72 3,444GBP 455 139 1.49 5,700
(Forward)

- 117 -
*SGVFS021357*
Parent Company2015
Assets LiabilitiesAverage
Forward Rate*Notional
Amount*SGD P=411 P=190 1.41 4,600EUR 4 11 1.10 2,200HKD 2 – 7.75 6,633JPY – 86,305 0.39 4,492,495AUD – 149 0.72 450
Interest rate swaps 49,444 42,567Warrants 63,332 –
P=181,142 P=135,009*The notional amounts and average forward rates pertain to original currencies.
As of December 31, 2016 and 2015, the Parent Company holds 306,405 shares of ROP WarrantsSeries B1 at their fair value of USD1.2 million and USD1.3 million, respectively.
The table below shows the rollforward analysis of net derivatives assets (liabilities) as ofDecember 31, 2016 and 2015:
Consolidated Parent Company2016 2015 2016 2015
Balance at the beginning of the year:Derivative assets P=181,348 P=136,551 P=181,142 P=135,929Derivative liabilities 135,193 44,903 135,009 44,264
46,155 91,648 46,133 91,665Changes in fair value
Currency forwards and spots* (723,245) (571,666) (723,245) (571,649)Interest rate swaps and warrants** 25,174 (11,709) 25,174 (11,709)
(698,071) (583,375) (698,071) (583,358)Availments (Settlements) 838,206 537,882 838,780 537,826Balance at end of year:
Derivative assets 419,122 181,348 418,819 181,142Derivative liabilities 232,832 135,193 231,977 135,009
P=186,290 P=46,155 P=186,842 P=46,133* Presented as part of ‘Foreign exchange gains - net’.** Recorded under ‘Trading and investment securities gains - net’ (Note 9)
24. Maturity Analysis of Assets and Liabilities
The following table shows an analysis of assets and liabilities of the Group and Parent Companyanalyzed according to whether they are expected to be recovered or settled within one year andbeyond one year from reporting date:
Consolidated2016 2015
Less thanTwelveMonths
OverTwelveMonths Total
Less thanTwelveMonths
OverTwelveMonths Total
Financial AssetsCOCI P=11,014,663 P=– P=11,014,663 P=15,220,536 P=– P=15,220,536Due from BSP 127,337,861 – 127,337,861 81,363,444 – 81,363,444Due from other banks 22,709,805 – 22,709,805 18,287,308 – 18,287,308Interbank loans receivable 7,791,108 – 7,791,108 5,800,383 – 5,800,383Securities held under agreements to resell 1,972,310 – 1,972,310 14,550,000 – 14,550,000Financial assets at FVPL 1,913,864 – 1,913,864 4,510,545 – 4,510,545AFS investments - gross (Note 9) 1,891,137 66,325,077 68,216,214 2,915,170 66,355,965 69,271,135HTM investments – 24,174,479 24,174,479 68,173 23,163,824 23,231,997
(Forward)

- 118 -
*SGVFS021357*
Consolidated2016 2015
Less thanTwelveMonths
OverTwelveMonths Total
Less thanTwelveMonths
OverTwelveMonths Total
Loans and receivables - gross (Note 10) P=176,048,393 P=267,653,955 P=443,702,348 P=159,032,473 P=221,242,883 P=380,275,356Other assets - gross (Note 15) 482,548 85,719 568,267 252,366 50,605 302,971
351,161,689 358,239,230 709,400,919 302,000,398 310,813,277 612,813,675Nonfinancial AssetsProperty and equipment - gross (Note 11) − 24,495,308 24,495,308 – 28,870,304 28,870,304Investments in Subsidiaries and an
Associate - gross (Note 12) – 2,532,755 2,532,755 – – –Investment properties - gross (Note 13) – 21,371,531 21,371,531 – 18,277,382 18,277,382Deferred tax assets – 1,482,214 1,482,214 – 1,173,575 1,173,575Goodwill (Note 14) – 13,375,407 13,375,407 – 13,375,407 13,375,407Intangible assets (Note 14) – 4,528,994 4,528,994 – 4,120,689 4,120,689Residual value of leased assets (Note 10) 249,923 457,969 707,892 225,590 486,731 712,321Other assets - gross (Note 15) 5,620,466 1,673,387 7,293,853 5,787,465 1,529,983 7,317,448
5,870,389 69,917,565 75,787,954 6,013,055 67,834,071 73,847,126Assets of disposal group classified as held
for sale (Note 37) – – – 23,526,757 – 23,526,757Less: Allowance for impairment and credit
losses (Note 16) 20,063,525 18,952,992Unearned and other deferred income
(Note 10) 1,489,955 1,834,517Accumulated amortization and
depreciation (Notes 11, 13and 14) 9,870,283 9,712,312
P=753,765,110 P=679,687,737Financial LiabilitiesDeposit liabilities P=537,325,097 P=33,178,290 P=570,503,387 P=446,102,751 P=39,834,430 P=485,937,181Financial liabilities at FVPL 232,832 − 232,832 126,075 9,118 135,193Bills and acceptances payable 25,066,507 10,819,441 35,885,948 5,836,838 19,915,384 25,752,222Subordinated debt − 3,497,798 3,497,798 – 9,986,427 9,986,427Accrued interest payable (Note 20) 662,017 − 662,017 465,324 1,564,522 2,029,846Accrued other expenses payable (Note 20) 1,023,819 − 1,023,819 753,744 – 753,744Other liabilities (Note 22):
Accounts payable 7,624,523 27,699 7,652,222 6,825,663 – 6,825,663Insurance contract liabilities 4,565,925 15,875 4,581,800 4,528,298 191,038 4,719,336Bills purchased – contra 3,260,308 − 3,260,308 3,418,002 – 3,418,002Managers' checks and demand
drafts outstanding 1,174,872 − 1,174,872 937,799 – 937,799Dormant credits 11,744 916,838 928,582 116,337 637,001 753,338Due to other banks 923,777 − 923,777 461,100 – 461,100Deposit on lease contracts 268,754 536,623 805,377 249,885 604,932 854,817Accounts payable – electronic money 791,223 − 791,223 556,618 – 556,618Payment order payable 292,336 − 292,336 407,196 – 407,196Margin deposits and cash letters of credit 174,206 − 174,206 182,640 – 182,640Commission payable 94,618 − 94,618 132,059 – 132,059Transmission liability 31,732 − 31,732 24,976 – 24,976Deposit for keys on safety deposit boxes 14,140 − 14,140 14,217 – 14,217
583,538,430 48,992,564 632,530,994 471,139,522 72,742,852 543,882,374Nonfinancial LiabilitiesAccrued taxes and other expenses (Note 20) 3,257,790 − 3,257,790 1,177,015 1,914,623 3,091,638Income tax payable 195,240 − 195,240 134,720 – 134,720Other liabilities (Note 22) 2,882,530 4,957,650 7,840,180 2,799,195 3,571,328 6,370,523
6,335,560 4,957,650 11,293,210 4,110,930 5,485,951 9,596,881Liabilities of disposal group classified as
held for sale (Note 37) − − − 21,452,621 – 21,452,621P=589,873,990 P=53,950,214 P=643,824,204 P=496,703,073 P=78,228,803 P=574,931,876

- 119 -
*SGVFS021357*
Parent Company2016 2015 (As Restated - Note 2)
Less thanTwelveMonths
OverTwelveMonths Total
Less thanTwelveMonths
OverTwelveMonths Total
Financial AssetsCOCI P=10,626,525 P=– P=10,626,525 P=12,598,715 P=– P=12,598,715Due from BSP 123,799,952 – 123,799,952 79,203,948 – 79,203,948Due from other banks 12,831,514 – 12,831,514 11,450,573 – 11,450,573Interbank loans receivable 7,907,366 – 7,907,366 5,958,526 – 5,958,526Securities held under agreements to resell 1,972,310 – 1,972,310 14,550,000 – 14,550,000Financial assets at FVPL 1,880,071 – 1,880,071 4,492,864 – 4,492,864AFS investments - gross (Note 9) 1,612,001 65,082,954 66,694,955 2,026,914 65,637,949 67,664,863HTM investments – 24,074,898 24,074,898 4,706 23,132,937 23,137,643Loans and receivables - gross (Note 10) 158,852,021 234,495,768 393,347,789 146,526,387 196,062,353 342,588,740Other assets - gross (Note 15) 467,146 64,131 531,277 220,054 34,597 254,651
319,948,906 323,717,751 643,666,657 277,032,687 284,867,836 561,900,523Nonfinancial AssetsProperty and equipment– gross (Note 11) – 22,275,776 22,275,776 – 25,216,112 25,216,112Investment properties– gross (Note 13) – 20,968,723 20,968,723 – 19,857,890 19,857,890Deferred tax assets – 1,014,308 1,014,308 – 936,492 936,492Investments in Subsidiaries and an
Associate (Note 12) – 28,359,871 28,359,871 – 26,497,732 26,497,732Goodwill (Note 14) – 13,515,765 13,515,765 – 13,515,765 13,515,765Intangible assets (Note 14) – 4,395,964 4,395,964 – 3,990,956 3,990,956Other assets– gross (Note 15) 6,123,328 636,357 6,759,685 5,470,227 527,451 5,997,678
6,123,328 91,166,764 97,290,092 5,470,227 90,542,398 96,012,625Asset of disposal group classified as held for
sale (Note 37) – – – 1,172,963 – 1,172,963Less: Allowance for impairment and credit
losses (Note 16) 19,174,735 18,376,231Unearned and other deferred income
(Note 10) 1,116,929 1,427,774Accumulated amortization and
depreciation (Notes 11, 13and 14) 9,159,530 9,157,333
P=711,505,555 P=630,124,773Financial LiabilitiesDeposit liabilities P=501,442,928 P=40,747,695 P=542,190,623 P=434,664,563 P=35,829,825 P=470,494,388Financial liabilities at FVPL 231,977 − 231,977 125,891 9,118 135,009Bills and acceptances payable 21,876,831 12,109,867 33,986,698 4,714,503 19,915,384 24,629,887Subordinated debt – 3,497,798 3,497,798 – 9,986,427 9,986,427Accrued interest payable (Note 20) 567,327 − 567,327 466,390 1,564,522 2,030,912Accrued other expenses payable (Note 20) 965,525 − 965,525 719,399 – 719,399Other liabilities (Note 22):
Accounts payable 6,375,193 – 6,375,193 6,179,304 – 6,179,304Bills purchased - contra 3,254,224 – 3,254,224 3,411,729 – 3,411,729Managers' checks and demand
drafts outstanding 1,003,755 – 1,003,755 915,764 – 915,764Dormant credits 1,731 916,486 918,217 108,827 625,519 734,346Accounts payable - electronic money 791,223 – 791,223 556,618 – 556,618Due to other banks 763,046 – 763,046 517,261 – 517,261Payment order payable 292,336 – 292,336 407,196 – 407,196Margin deposits and cash letters of
credit 162,972 – 162,972 168,820 – 168,820Deposit on lease contracts – 35,769 35,769 – 37,448 37,448Deposit for keys on safety deposit
boxes 14,140 – 14,140 14,217 – 14,217537,743,208 57,307,615 595,050,823 452,970,482 67,968,243 520,938,725
Nonfinancial LiabilitiesAccrued taxes and other expenses (Note 20) P=2,698,763 P=− P=2,698,763 P=824,541 P=1,796,881 P=2,621,422Income tax payable 60,898 – 60,898 55,180 – 55,180Other liabilities 1,619,827 4,797,258 6,417,085 1,373,445 3,352,983 4,726,428
4,379,488 4,797,258 9,176,746 2,253,166 5,149,864 7,403,030P=542,122,696 P=62,104,873 P=604,227,569 P=455,223,648 P=73,118,107 P=528,341,755

- 120 -
*SGVFS021357*
25. Equity
Capital stock consists of (amounts in thousands, except for par value and number of shares):
Shares Amount2016 2015 2016 2015
Common - P=40 par valueAuthorized 1,750,000,001 1,750,000,001 P=70,000,000 P=70,000,000Issued and outstanding
Balance at the beginning of the year 1,249,139,678 1,249,139,678 49,965,587 49,965,5871,249,139,678 1,249,139,678 P=49,965,587 P=49,965,587
Parent Company Shares Held by a Subsidiary – (120,000) – (9,945)1,249,139,678 1,249,019,678 P=49,965,587 P=49,955,642
The Parent Company shares are listed in the PSE. As of December 31, 2016 and 2015, the ParentCompany had 29,853 and 29,985 stockholders, respectively.
Pursuant to the 1986 Revised Charter of the Parent Company, the Parent Company’s authorizedcapital stock was P=10.0 billion divided into 100,000,000 common shares with a par value ofP=100.0 per share. Its principal stockholder was the NG which owned 25,000,000 common shares.
To foster a financial intermediation system that is both competitive and efficient, the partialprivatization of the Parent Company was carried out through the following public offerings:
Date ofOffering Type of Offering
No. of SharesOffered Par Value Offer Price
AuthorizedNumber of Shares
Issued andOutstanding Shares
June 1989 Initial PublicOffering
10,800,000common shares
P=100.0 P=100.0 250,000,000common shares
36,011,569common shares
April 1992 Second PublicOffering
8,033,140common shares
P=100.0 P=265.0 250,000,000common shares
80,333,350common shares
December1995
Third PublicOffering
7,200,000common shares and
2,400,000 coveredwarrants
P=100.0 P=260.0 250,000,000common shares
99,985,579common shares
After the three (3) public offerings, the NG sold a total of 54.41% of its shareholdings to both thePhilippine public and international investors.
On May 27, 1996, the privatization of the Parent Company was completed when the ParentCompany’s new Articles of Incorporation and By-Laws were approved by the SEC under SECRegistration No. AS096-005555. As of May 27, 1996, the NG owned 45.59% of the outstandingshares of the Parent Company. The Parent Company’s authorized capital stock was increased toP=25.0 billion pesos divided into 250,000,000 common shares with a par value of P=100.0 per share.
As part of the Parent Company’s capital build-up program, the Parent Company also completedthe following rights offerings:
Date ofOffering Type of Offering
No. of SharesOffered
Basis ofSubscription Par Value Offer Price
AuthorizedNumber of
Shares
Issued andOutstanding
SharesSeptember1999
Stock RightsOffering
68,740,086common shares
One (1) RightShare for every
two commonshares
P=100.0 P=137.8 250,000,000common shares
206,220,257common shares
September2000
Pre-emptiveRights Offering
71,850,215common shares
with 170,850,215warrants
Five (5) RightShares for everySix (6) common
shares
P=100.0 P=60.0 833,333,334common shares
206,220,257common shares
February2014
Stock RightsOffering
162,931,262common shares
Fifteen (15)Right Shares for
every 100common shares
P=40.0 P=71.0 1,750,000,001common shares
1,249,139,678common shares

- 121 -
*SGVFS021357*
On August 18, 2000, the SEC approved the decrease of the capital stock of the Parent Companyfrom P=25.0 billion divided into 250,000,000 common shares with a par value of P=100.0 per shareto P=15.0 billion divided into 250,000,000 common shares with a par value of P=60.0 per share.Subsequently on November 7, 2000, the SEC approved the increase of the capital stock of theParent Company from P=15.0 Billion divided into 250,000,000 common shares with a par value ofP=60.0 per share to P=50,000,000,040 divided into 833,333,334 shares with a par value ofP=60.0 per share.
On July 23, 2002, the SEC approved the decrease of the capital stock of the Parent Company fromP=50,000,000,040.0 divided into 833,333,334 shares with a par value of P=60.0 per share toP=33,333,333,360.0 divided into 833,333,334 shares with a par value of P=40.0 per share. On thesame day, the SEC also approved the increase of the capital stock of the Parent Company fromP=33,333,333,360.0 divided into 833,333,334 shares with a par value of P=40.0 per share toP=50,000,000,040.0 divided into 1,054,824,557 common shares and 195,175,444 preferred sharesboth with a par value of P=40.0 each.
In July 2007, the Parent Company made a primary and secondary offering of up to 160,811,091common shares. The Offer consisted of: (i) primary offer by the Parent Company of up to89,000,000 new shares from the Parent Company’s authorized but unissued common share capital,and (ii) secondary offer of up to an aggregate of 71,811,091 existing shares, comprising(a) 17,453,340 shares offered by the NG, and (b) 54,357,751 shares which were owned by thePDIC in the form of convertible preferred shares. The Primary Offer Shares and Secondary OfferShares were offered at the Offer Price of P=59.0 per share.
On January 17, 2013, the SEC approved the conversion of the Parent Company’s 195,175,444authorized preferred shares into common shares, thereby increasing its authorized common sharesto 1,250,000,001. The increase in authorized common shares is intended to accommodate theissuance of the Parent Company of common shares to ABC shareholders relative to the businesscombination.
Prior to conversion to common shares, the preferred shares had the following features:
a. Non-voting, non-cumulative, fully participating on dividends with the common shares;b. Convertible, at any time at the option of the holder who is qualified to own and hold common
shares on a one (1) preferred share for one (1) common share basis;c. With mandatory and automatic conversion into common shares upon the sale of such
preferred shares to any person other than the NG or any other government agency or GOCC’s;and
d. With rights to subscribe to additional new preferred shares with all of the features describedabove, in the event that the Bank shall offer new common shares for subscription, in suchnumber corresponding to the number of shares being offered.
In February 2014, the Bank successfully completed its Stock Rights Offering (Offer) of162,931,262 common shares (Rights Shares) with a par value of P=40.0 per share at a price ofP=71.0 each. The Rights Shares were offered to all eligible shareholders of the Bank at theproportion of fifteen (15) Rights Shares for every one hundred (100) common shares as of therecord date of January 16, 2014. The offer period was from January 27, 2014 to February 3, 2014.A total of 33,218,348 Rights Shares were sourced from the existing authorized but unissuedcapital stock of the Bank. The remaining 129,712,914 Rights Shares were sourced from anincrease in the authorized capital stock of the Bank. The Offer was oversubscribed and raisedgross proceeds of P=11.6 billion. It also strengthened the Bank’s capital position under the BaselIII standards, which took effect on January 1, 2014.

- 122 -
*SGVFS021357*
Surplus amounting to P=7.7 billion and Capital Paid in Excess of Par Value of the Parent Companyamounting to P=2.2 billion as of December 31, 2016 and 2015 which represent the balances ofaccumulated translation adjustment (P=1.6 billion), accumulated equity in net earnings(P=0.6 billion)and revaluation increment from land (P=7.7 billion) that have been applied toeliminate the Parent Company’s deficit through a quasi-reorganization in 2002 and 2000, are notavailable for dividend declaration without prior approval from the Philippine SEC and the BSP.
Accumulated Translation AdjustmentAs part of the Group’s rehabilitation program in 2002, the SEC approved on November 7, 2002the application of the accumulated translation adjustment of P=1.6 billion to eliminate the ParentCompany’s remaining deficit of P=1.3 billion as of December 31, 2001, after applying the totalreduction in par value amounting to P=7.6 billion. The SEC approval is subject to the followingconditions: (a) remaining translation adjustment of P=310.7 million as of December 31, 2001(shown as part of Capital paid in excess of par value in the statement of financial position) will notbe used to wipe out losses that may be incurred in the future without prior approval of SEC; and(b) for purposes of dividend declaration, any future surplus account of the Parent Company shallbe restricted to the extent of the deficit wiped out by the translation adjustment.
Surplus ReservesThe surplus reserves consist of:
2016 2015Reserve for trust business (Note 33) P=493,658 P=474,263Reserve for self-insurance 80,000 80,000
P=573,658 P=554,263
Reserve for self-insurance, contingencies and other account represents the amount set aside tocover losses due to fire, defalcation by and other unlawful acts of the Parent Company’s personnelor third parties.
Other Equity ReservesOn August 26, 2016, the Parent Company's BOD approved the grant of centennial bonus to itsemployees, officers and directors on record as of July 22, 2016, in the form of the ParentCompany's shares of stock to be sourced from open market at fair value. Acquisition anddistribution of the estimated 3.0 million shares shall be done based on a predetermined scheduleover a period of five years, and are subject to service conditions. The grant is accounted for asequity-settled share-based payments. The Parent Company recognized other employee benefitexpense in relation to the grant of centennial bonus amounting to P=105.7 million in 2016 in thestatement of income and a corresponding increase in equity of the same amount in the statement offinancial position as of December 31, 2016 based on P=70.0 per share, the projected fair value atgrant date based on an independent, short-term forecast by a stock broker.
Capital ManagementThe primary objectives of the Parent Company’s capital management are to ensure that it complieswith externally imposed capital requirements and it maintains strong credit ratings and healthycapital ratios in order to support its business and to maximize shareholders’ value.
The Parent Company manages its capital structure and makes adjustments to it in the light ofchanges in economic conditions and the risk characteristics of its activities. In order to maintainor adjust the capital structure, the Parent Company may adjust the amount of dividend payment toshareholders, return capital structure, or issue capital securities. No changes were made in theobjectives, policies and processes from the previous periods.

- 123 -
*SGVFS021357*
Regulatory Qualifying CapitalUnder existing BSP regulations, the determination of the Parent Company’s compliance withregulatory requirements and ratios is based on the amount of the Parent Company’s “unimpairedcapital” (regulatory net worth) reported to the BSP, which is determined on the basis of regulatorypolicies, which differ from PFRS in some respects.
In addition, the risk-based capital ratio of a bank, expressed as a percentage of qualifying capitalto risk-weighted assets, should not be less than 10.00% for both solo basis (head office andbranches) and consolidated basis (parent bank and subsidiaries engaged in financial alliedundertakings but excluding insurance companies). Qualifying capital and risk-weighted assets arecomputed based on BSP regulations. Risk-weighted assets consist of total assets less cash onhand, due from BSP, loans covered by hold-out on or assignment of deposits, loans or acceptancesunder letters of credit to the extent covered by margin deposits and other non-risk itemsdetermined by the MB of the BSP.
The BSP approved the booking of additional appraisal increment of P=431.8 million in 2002 onproperties and recognition of the same in determining the capital adequacy ratio, and booking oftranslation adjustment of P=1.6 billion in 2002 representing the increase in peso value of theinvestment in foreign subsidiaries for purposes of the quasi-reorganization and rehabilitation of theParent Company, provided that the same shall be excluded for dividend purposes.
As of December 31, 2016 and 2015, CAR reported to the BSP, which considered combined credit,market and operational risk weighted asset (BSP Circular No. 538) are shown in the table below(amounts in millions).
2016 2015Consolidated Actual Required Actual RequiredCommon Equity Tier 1 Capital (CET1) P=104,103.60 P=97,272.25Less: Regulatory Adjustments to CET 1 24,454.28 22,978.47Total CET1 Capital 79,649.32 74,293.78Add: Additional Tier 1 Capital (AT1) 0.00 0.00Tier 1 Capital 79,649.32 74,293.78Add: Tier 2 Capital 4,308.03 13,763.24Total qualifying capital P=83,957.35 P=50,410.11 P=88,057.03 P=45,766.26Risk weighted assets P=504,101.07 P=457,662.62Tier 1 capital ratio 15.80% 16.23%Total capital ratio 16.65% 19.24%
2016 2015Parent Actual RequiredCommon Equity Tier 1 Capital (CET1) P=101,545.14 P=94,044.29Less: Regulatory Adjustments to CET 1 49,874.81 47,596.44Total CET1 Capital 51,670.33 46,447.86Add: Additional Tier 1 Capital (AT1) 0.00 0.00Tier 1 Capital 51,670.33 46,447.86Add: Tier 2 Capital 3,866.45 13,417.01Total qualifying capital P=55,536.78 P=45,131.25 P=59,864.87 P=41,504.86Risk weighted assets P=451,312.51 P=415,048.57Tier 1 capital ratio 11.45% 11.19%Total capital ratio 12.31% 14.42%
The Group and its individually regulated subsidiaries/operations have complied with all externallyimposed capital requirement throughout the year.
On January 15, 2013, the BSP issued Circular No. 781, Basel III Implementing Guidelines onMinimum Capital Requirements, which provides the implementing guidelines on the revised risk-based capital adequacy framework particularly on the minimum capital and disclosure

- 124 -
*SGVFS021357*
requirements for universal banks and commercial banks, as well as their subsidiary banks andquasi-banks, in accordance with the Basel III standards. The circular is effective onJanuary 1, 2014.
The Circular sets out a minimum Common Equity Tier 1 (CET1) ratio of 6.0% and Tier 1 capitalratio of 7.5%. It also introduces a capital conservation buffer of 2.5% comprised of CET1 capital.The BSP’s existing requirement for Total CAR remains unchanged at 10% and these ratios shallbe maintained at all times.
Further, existing capital instruments as of December 31, 2010 which do not meet the eligibilitycriteria for capital instruments under the revised capital framework shall no longer be recognizedas capital upon the effectivity of Basel III. Capital instruments issued under BSP CircularNos.709 and 716 (the circulars amending the definition of qualifying capital particularly onHybrid Tier 1 and Lower Tier 2 capitals), starting January 1, 2011 and before the effectivity ofBSP Circular No. 781, shall be recognized as qualifying capital until December 31, 2015.In addition to changes in minimum capital requirements, this Circular also requires variousregulatory adjustments in the calculation of qualifying capital.
On June 27, 2014, the BSP issued Circular No. 839, Real Estate Stress Test (REST) Limit for RealEstate Exposure, which set a prudential limit for real estate exposures and other real estateproperties of universal, commercial and thrift banks. REST will be undertaken for real estateexposure at an assumed write-off of 25.00%. The prudential REST limit which shall be compliedat all times are 6.00% of CET1 ratio and 10.00% of CAR. The Circular is effective July 19, 2014.
The Parent Company has taken into consideration the impact of the foregoing requirements toensure that the appropriate level and quality of capital are maintained on an ongoing basis.
SurplusThe computation of surplus available for dividend declaration in accordance with SECMemorandum Circular No. 11 issued in December 2008 differs to a certain extent from thecomputation following BSP guidelines. Surplus and Capital Paid in Excess of Par Value of theParent Company amounting to P=9.9 billion as of December 31, 2016 and 2015 which representsthe balances of accumulated translation adjustment, accumulated equity in net earnings andrevaluation increment from land that have been applied to eliminate the Parent Company’s deficitthrough a quasi-reorganization in 2002 and 2000, are not available for dividend declarationwithout prior approval from the Philippine SEC and the BSP. Also, unrealized foreign exchangegains, except those attributable to cash and cash equivalents, unrealized actuarial gains, fair valueadjustment or the gains arising from mark-to-market valuation, deferred tax asset recognized thatreduced the income tax expense and increased the net income and retained earnings, adjustmentdue to deviation from PFRS/GAAP and other unrealized gains or adjustments, are excluded fromthe Bank’s surplus available for dividend declaration.
A portion of a Group’s surplus corresponding to the net earnings of the subsidiaries amounting toP=2.7 billion and P=2.6 billion as of December 31, 2016 and 2015, respectively, is not available fordividend declaration. The accumulated earnings become available for dividends upon receipt ofcash dividends from subsidiaries.

- 125 -
*SGVFS021357*
Cash DividendsOn July 22, 2016, the BOD declared and approved cash dividend declaration of one peso (P=1.0)per share or a total of P=1.3 billion out of the unrestricted surplus of the Parent Company as ofMarch 31, 2016, to all stockholders of record as of August 19, 2016, and was paid onSeptember 15, 2016. On August 19, 2016, the Parent Company received the approval from theBSP on the said dividend declaration.
Merger IncentivesIn connection with the merger of the Parent Company with ABC, the BSP gave certain incentivesand the more relevant incentives are:
(a) Recognition of the fair value adjustments under GAAP and RAP books;(b) Full recognition of appraisal increment from the revaluation of premises, improvements and
equipment in the computation of CAR.
Internal Capital Adequacy Assessment Process (ICAAP) ImplementationIn compliance with BSP Circular 639, the Parent Company has adopted its live ICAAP Documentfor 2011 to 2013. However, the BOD and the Management recognized that ICAAP is beyondcompliance, i.e. it is about how to effectively run the Parent Company’s operations by ensuringthat the Parent Company maintains at all times an appropriate level and quality of capital to meetits business objective and commensurate to its risk profile. In line with its ICAAP principles, theParent Company shall maintain a capital level that will not only meet the BSP CAR requirement,but will also cover all material risks that it may encounter in the course of its business. TheICAAP process highlights close integration of capital planning/strategic management with riskmanagement. The Parent Company has in place a risk management framework that involves acollaborative process for assessing and managing identified Pillar 1 and Pillar 2 risks. The ParentCompany complies with the required annual submission of updated ICAAP.
Financial Performance The following basic ratios measure the financial performance of the Group and the Parent
Company:
Consolidated Parent Company
2016 2015 2014 20162015
(As Restated)2014
(As Restated)Return on average equity (a/b) 6.69% 6.19% 6.06% 6.84% 6.19% 6.18%a) Net income P=7,185,586 P=6,311,595 P=5,495,045 P=7,147,566 P=6,113,607 P=5,358,754b) Average total equity 107,348,384 101,908,372 90,699,918 104,530,502 98,815,521 86,747,677Return on average assets (c/d) 1.00% 0.97% 0.89% 1.07% 1.01% 0.93%c) Net income P=7,185,586 P=6,311,595 P=5,495,045 P=7,147,566 P=6,113,607 P=5,358,754d) Average total assets 716,726,424 652,566,785 620,860,726 670,815,164 605,346,798 578,081,537Net interest margin on average
earning assets (e/f) 3.16% 3.22% 3.13% 3.01% 3.16% 3.21%e) Net interest income P=19,566,502 P=17,691,839 P=16,458,662 P=17,057,909 P=15,712,416 P=15,153,084f) Average interest earning assets 618,625,074 549,237,255 525,995,312 567,286,721 496,470,744 472,784,065Note: Average balances were the sum of beginning and ending balances of the respective statement of financial position accounts as ofthe end of the year divided by two (2)

- 126 -
*SGVFS021357*
26. Service Fees and Commission Income
This account consists of:
Consolidated Parent Company2016 2015 2014 2016 2015 2014
Remittance P=830,032 P=739,779 P=735,420 P=460,899 P=363,822 P=344,045Deposit-related 643,991 1,076,041 984,541 618,972 1,050,546 960,199Credit-related 503,891 500,852 387,535 498,514 479,174 374,698Commissions 448,089 820,497 641,216 305,574 685,396 539,146Interchange fees 389,179 317,509 203,501 389,179 317,509 203,501Trust fees (Note 33) 311,882 256,203 230,111 311,882 256,203 230,111Underwriting fees 187,133 327,400 136,265 - – –Credit card-related 61,584 62,071 84,899 61,584 62,071 84,899Miscellaneous 194,177 212,546 142,961 84,654 141,251 135,563
P=3,569,958 P=4,312,898 P=3,546,449 P=2,731,258 P=3,355,972 P=2,872,162
Commissions include those income earned for services rendered on opening letters of credit,handling of collection items, domestic/export/import bills and telegraphic transfers and sale ofdemand drafts, traveler’s checks and government securities.
The interchange fees and rewards revenue were generated from the credit card business acquiredby the Parent Company through rewards revenue.
‘Miscellaneous’ includes income from security brokering activities and other fees andcommission.
27. Net Insurance Premium and Benefits and Claims
Net Insurance PremiumThis account consists of:
2016 2015 2014Gross earned premiums P=2,356,996 P=2,431,033 P=1,682,368Reinsurers’ share of gross earned premiums (1,727,170) (1,890,569) (1,274,095)
P=629,826 P=540,464 P=408,273
Net Insurance Benefits and ClaimsThis account consists of:
2016 2015 2014Gross insurance contract benefits and claims paid P=787,537 P=1,653,355 P=1,453,605Reinsurers’ share of gross insurance contract benefits
and claims paid (304,382) (1,045,150) (1,109,404)Gross change in insurance contract liabilities (69,051) (529,863) (1,011,013)Reinsurers’ share of change in insurance contract
liabilities (158,406) 358,545 762,950P=255,698 P=436,887 P=96,138
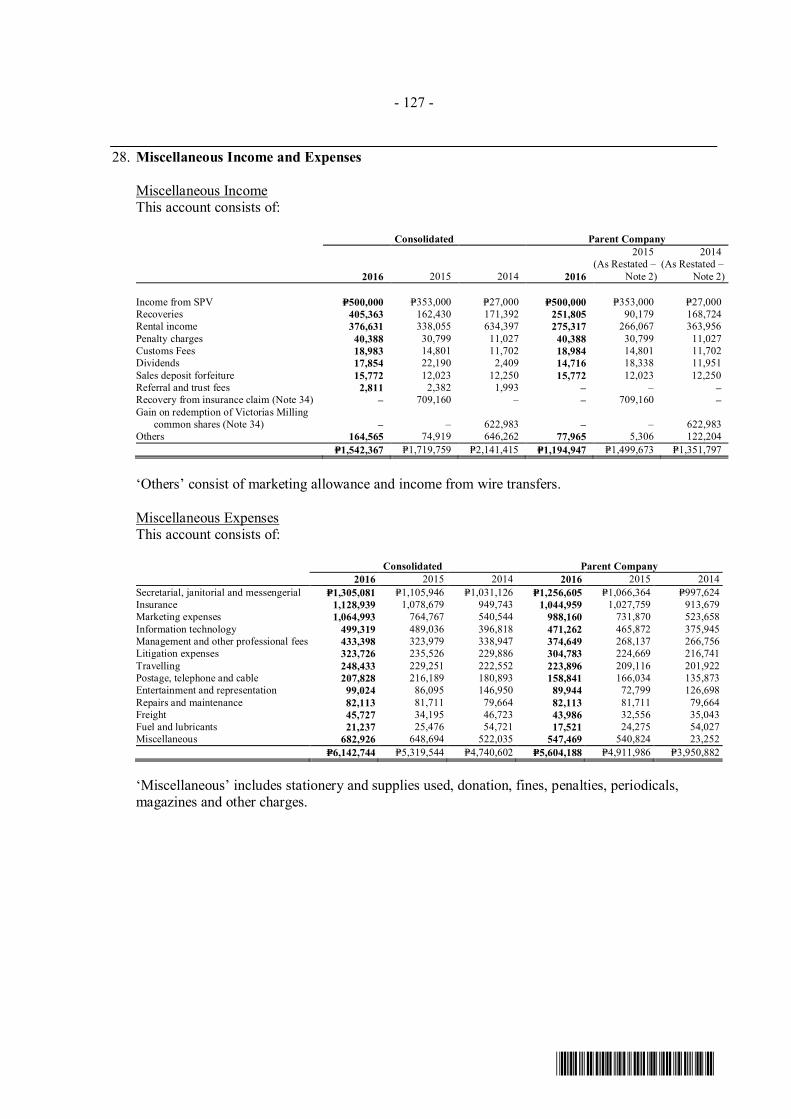
- 127 -
*SGVFS021357*
28. Miscellaneous Income and Expenses
Miscellaneous IncomeThis account consists of:
Consolidated Parent Company
2016 2015 2014 2016
2015(As Restated –
Note 2)
2014(As Restated –
Note 2)
Income from SPV P=500,000 P=353,000 P=27,000 P=500,000 P=353,000 P=27,000Recoveries 405,363 162,430 171,392 251,805 90,179 168,724Rental income 376,631 338,055 634,397 275,317 266,067 363,956Penalty charges 40,388 30,799 11,027 40,388 30,799 11,027Customs Fees 18,983 14,801 11,702 18,984 14,801 11,702Dividends 17,854 22,190 2,409 14,716 18,338 11,951Sales deposit forfeiture 15,772 12,023 12,250 15,772 12,023 12,250Referral and trust fees 2,811 2,382 1,993 – – –Recovery from insurance claim (Note 34) – 709,160 – – 709,160 –Gain on redemption of Victorias Milling
common shares (Note 34) – – 622,983 – – 622,983Others 164,565 74,919 646,262 77,965 5,306 122,204
P=1,542,367 P=1,719,759 P=2,141,415 P=1,194,947 P=1,499,673 P=1,351,797
‘Others’ consist of marketing allowance and income from wire transfers.
Miscellaneous ExpensesThis account consists of:
Consolidated Parent Company2016 2015 2014 2016 2015 2014
Secretarial, janitorial and messengerial P=1,305,081 P=1,105,946 P=1,031,126 P=1,256,605 P=1,066,364 P=997,624Insurance 1,128,939 1,078,679 949,743 1,044,959 1,027,759 913,679Marketing expenses 1,064,993 764,767 540,544 988,160 731,870 523,658Information technology 499,319 489,036 396,818 471,262 465,872 375,945Management and other professional fees 433,398 323,979 338,947 374,649 268,137 266,756Litigation expenses 323,726 235,526 229,886 304,783 224,669 216,741Travelling 248,433 229,251 222,552 223,896 209,116 201,922Postage, telephone and cable 207,828 216,189 180,893 158,841 166,034 135,873Entertainment and representation 99,024 86,095 146,950 89,944 72,799 126,698Repairs and maintenance 82,113 81,711 79,664 82,113 81,711 79,664Freight 45,727 34,195 46,723 43,986 32,556 35,043Fuel and lubricants 21,237 25,476 54,721 17,521 24,275 54,027Miscellaneous 682,926 648,694 522,035 547,469 540,824 23,252
P=6,142,744 P=5,319,544 P=4,740,602 P=5,604,188 P=4,911,986 P=3,950,882
‘Miscellaneous’ includes stationery and supplies used, donation, fines, penalties, periodicals,magazines and other charges.

- 128 -
*SGVFS021357*
29. Retirement Plan
The Parent Company and certain subsidiaries of the Group, have separate funded, noncontributorydefined benefit retirement plans covering substantially all its officers and regular employees.Under these retirement plans, all covered officers and employees are entitled to cash benefits aftersatisfying certain age and service requirements.
The amounts of net defined benefit liability in the statements of financial position follow:
Consolidated Parent Company2016 2015 2016 2015
Retirement benefit liability (included in ‘Other liabilities’) P=3,138,824 P=2,955,003 P=3,063,243 P=2,889,735Net plan assets (included in ‘Other assets’) 2,714 3,045 – –
P=3,136,110 P=2,951,958 P=3,063,243 P=2,889,735
The Group’s annual contribution to the retirement plan consists of a payment covering the currentservice cost, unfunded actuarial accrued liability and interest on such unfunded actuarial liability.The retirement plan provides each eligible employer with a defined amount of retirement benefitdependent on one or more factors such as age, years of service and salary.
As of December 31, 2016 and 2015, the Parent Company has two separate regular retirement plansfor the employees of PNB and ABC. In addition, the Parent Company provides certain post-employee benefit through a guarantee of a specified return on contributions in one of its employeeinvestment plans (EIP).
The latest actuarial valuations for these retirement plans were made as of December 31, 2016.The following table shows the actuarial assumptions as of December 31, 2016 and 2015 used indetermining the retirement benefit obligation of the Group:
ConsolidatedParent Company
ABC PNB EIP2016 2015 2016 2015 2016 2015 2016 2015
Discount rate 4.65% - 5.01% 4.31% - 4.62% 4.81% 4.38% 4.81% 4.38% 4.81% 4.38%Salary rate increase 5.00% - 8.00% 5.00% - 8.00% 6.00% 5.00% 6.00% 5.00% – –

- 129 -
*SGVFS021357*
The changes in the present value obligation and fair value of plan assets are as follows:
Consolidated2016Remeasurements in other comprehensive income
Net benefit costs*
Return onplan assetexcluding
Actuarialchanges
Actuarialchanges
arising from
January 1,2016
Currentservice cost
Pastservice
cost Net interest SubtotalBenefits
paid
amountincluded in
net interest)
arising fromexperience
adjustments
changes infinancial
assumptions Subtotal OthersContributionsby employer
December 31,2016
Present value of pensionobligation P=6,823,317 P=533,442 P=− P=326,287 P=859,729 (P=579,110) P=− (P=58,823) P=467,429 P=408,606 P=− P=− P=7,512,542
Fair value of plan assets 3,871,359 − − 186,219 186,219 (579,110) (50,134) − − (50,134) − 948,098 4,376,432P=2,951,958 P=533,442 P=− P=140,068 P=673,510 P=− P=50,134 (58,832) P=467,429 P=458,740 P=− (P=948,098) P=3,136,110
* Net benefit costs is included in ‘Compensation and fringe benefits’ in the statement of income
Consolidated2015
Remeasurements in other comprehensive income
Net benefit costs*
Return onplan assetexcluding
Actuarialchanges
Actuarialchanges
arising from
January 1,2015
Currentservice cost
Pastservice
cost Net interest SubtotalBenefits
paid
amountincluded in
net interest)
arising fromexperience
adjustments
changes infinancial
assumptions Subtotal** Others***Contributionsby employer
December 31,2015
Present value of pensionobligation P=6,537,062 P=628,059 P=6,759 P=297,507 P=932,325 (P=473,928) P=– P=93,289 (P=334,797) (P=241,508) P=69,366 P=– P=6,823,317
Fair value of plan assets 3,675,484 – – 160,627 160,627 (473,928) (335,775) – – (335,775) (34,084) 879,035 3,871,359P=2,861,578 P=628,059 P=6,759 P=136,880 P=771,698 P=– P=335,775 P=93,289 (P=334,797) P=94,267 P=103,450 (P=879,035) P=2,951,958
* Net benefit costs is included in ‘Compensation and fringe benefits’ in the statement of income** Includes remeasurement losses of P=4.4 million for APLII in 2015*** Others consist of retirement of a disposal group classified as held for sale and retirement previously included in accrued expenses

- 130 -
*SGVFS021357*
Parent Company2016
Remeasurement losses in other comprehensive income
Net benefit costs*
Return onplan assetexcluding
Actuarialchanges
Actuarialchanges
arising from
January 1,2016
Currentservice cost
Pastservice
cost Net interest SubtotalBenefits
paid
amountincluded in
net interest)
arising fromexperience
adjustments
changes infinancial
assumptions Subtotal OthersContributionsby employer
December 31,2016
Present value of pensionobligation P=6,666,412 P=492,729 P=– P=319,738 P=812,467 (P=576,395) P=– (P=17,649) P=435,427 P=417,778 P=– P=– P=7,320,262
Fair value of plan assets 3,776,677 − – 181,658 181,658 (576,395) (46,429) − − (46,429) – 921,508 4,257,019P=2,889,735 P=492,729 P=– P=138,080 P=630,809 P=– 46,429 (P=17,649) P=435,427 P=464,207 P=– (P=921,508) P=3,063,243
* Net benefit costs is included in ‘Compensation and fringe benefits’ in the statement of income
Parent Company2015
Remeasurement losses in other comprehensive income
Net benefit costs*
Return onplan assetexcluding
Actuarialchanges
Actuarialchanges
arising from
January 1,2015
Currentservice cost
Pastservice
cost Net interest SubtotalBenefits
paid
amountincluded in
net interest)
arising fromexperience
adjustments
changes infinancial
assumptions Subtotal Others**Contributionsby employer
December 31,2015
Present value of pensionobligation P=6,370,475 P=587,218 P=6,455 P=290,683 P=884,356 (P=469,129) P=– P=77,139 (P=321,702) (P=244,563) P=125,273 P=− P=6,666,412
Fair value of plan assets 3,573,478 – – 156,518 156,518 (469,129) (334,812) – – (334,812) – 850,622 3,776,677P=2,796,997 P=587,218 P=6,455 P=134,165 P=727,838 P=– 334,812 P=77,139 P=(321,702) P=90,249 P=125,273 (P=850,622) P=2,889,735
* Net benefit costs is included in ‘Compensation and fringe benefits’ in the statement of income** Others consist of retirement previously included in accrued expenses

- 131 -
*SGVFS021357*
The Group and the Parent Company expect to contribute P=934.5 million and P=920.9 million,respectively, to the defined benefit plans in 2017. The average duration of the retirement liabilityof the Group and the Parent Company as of December 31, 2016 is 17.0 years.
Shown below is the maturity analysis of the undiscounted benefit payments:
Consolidated Parent Company2016 2015 2016 2015
Less than one year P=347,321 P=330,098 P=341,323 P=325,319More than one year to five years 1,671,800 1,632,402 1,646,006 1,599,833More than five years to 10 years 3,393,078 3,371,760 3,338,327 3,291,709More than 10 years to 15 years 4,877,000 4,557,857 4,687,986 4,421,078More than 15 years 22,189,610 16,973,725 20,268,606 16,081,829
The fair values of plan assets by each class as at the end of the reporting periods are as follow:
Consolidated Parent Company2016 2015 2016 2015
Cash and cash equivalents P=2,101,820 P=1,871,868 P=2,042,229 P=1,828,922Equity investments
Financial institutions (Note 34) 491,884 468,461 491,884 468,461Others 8,346 13,382 5,440 5,263
Debt investmentPrivate debt securities 1,373,837 1,050,312 1,354,853 1,026,929Government securities 261,749 278,674 244,533 258,215
Investment in UITFs 122,356 175,228 101,572 175,228Loans and receivables 3,713 4,006 3,713 4,006Interest and other receivables 14,699 11,163 14,299 10,904
4,378,404 3,873,094 4,258,523 3,777,928Accrued expenses (1,972) (1,735) (1,505) (1,251)
P=4,376,432 P=3,871,359 P=4,257,018 P=3,776,677
All equity and debt investments held have quoted prices in active markets. The remaining planassets do not have quoted market prices in an active market, thus, their fair value is determinedusing the discounted cash flow methodology, using the Parent Company’s current incrementallending rates for similar types of loans and receivables.
The fair value of the plan assets as of December 31, 2016 and 2015 includes investments in theParent Company shares of stock with fair value amounting to P=491.9 million and P=468.5 million,respectively.
The plan assets have diverse investments and do not have any concentration risk.

- 132 -
*SGVFS021357*
The sensitivity analysis below has been determined based on reasonably possible changes of eachsignificant assumption on the defined benefit obligation as of the end of the reporting period,assuming all other assumptions were held constant:
2016Consolidated Parent Company
Possiblefluctuations
Increase(decrease)
Possiblefluctuations
Increase(decrease)
Discount rate +1.00% (P=774,902) +1.00% (P=751,438)-1.00% 913,564 -1.00% 884,722
Salary increase rate +1.00% 830,911 +1.00% 803,116-1.00% (724,710) -1.00% (701,513)
Employee turnover rate +10.00% (66,070) +10.00% (52,572)-10.00% 66,070 -10.00% 52,572
2015Consolidated Parent Company
Possiblefluctuations
Increase(decrease)
Possiblefluctuations
Increase(decrease)
Discount rate +1.00% (P=685,868) +1.00% (P=670,812)-1.00% 800,477 -1.00% 782,231
Salary increase rate +1.00% 723,151 +1.00% 705,298-1.00% (635,942) -1.00% (620,886)
Employee turnover rate +10.00% (54,767) +10.00% (42,004)-10.00% 54,767 -10.00% 42,004
Full actuarial valuations were performed to test the sensitivity of the defined benefit obligation toa 1.00% increment in salary increase rate and a 1.00% decrement in the discount rate. The resultsalso provide a good estimate of the sensitivity of the defined benefit obligation to a 1.00%decrement in salary increase rate and a 1.00% increment in the discount rate.
The Group and the Parent Company employs asset-liability matching strategies to maximizeinvestment returns at the least risk to reduce contribution requirements while maintaining a stableretirement plan. Retirement plans are invested to ensure that liquid funds are available whenbenefits become due, to minimize losses due to investment pre-terminations and maximizeopportunities for higher potential returns at the least risk.
The current plan assets of the Group and the Parent Company are allocated to cover benefitpayments in the order of their proximity to the present time. Expected benefit payments areprojected and classified into short-term or long-term liabilities. Investment instruments that wouldmatch the liabilities are identified. This strategy minimizes the possibility of the asset-liabilitymatch being distorted due to the Group’s and the Parent Company’s failure to contribute inaccordance with its general funding strategy.
30. Leases
Operating LeasesGroup as LesseeThe Parent Company leases the premises occupied by majority of its branches (about 32.22% ofthe branch sites are Parent Company-owned). Some of its subsidiaries also lease the premisesoccupied by their Head Offices and most of their branches. The lease contracts are for periodsranging from 1 to 25 years and are renewable at the Group’s option under certain terms and

- 133 -
*SGVFS021357*
conditions. Various lease contracts include escalation clauses, most of which bear an annual rentincrease of 5.00% to 10.00%.
Rent expense charged against current operations (included in ‘Occupancy and equipment-relatedcosts’ in the statements of income) amounted to P=824.7 million, P=881.5 million and P=1.1 billion in2016, 2015 and 2014, respectively, for the Group, of which P=787.7 million, P=727.6 million andP=705.3 million in 2016, 2015, and 2014, respectively, pertain to the Parent Company.
Future minimum rentals payable under non-cancelable operating leases follow:
Consolidated Parent Company2016 2015 2016 2015
Within one year P=439,613 P=470,777 P=319,498 P=396,330Beyond one year but not more than five years 988,042 781,652 766,990 671,367More than five years 280,004 118,186 212,890 22,183
P=1,707,659 P=1,370,615 P=1,299,378 P=1,089,880
Group as LessorThe Parent Company has entered into commercial property leases on its investment properties.These non-cancelable leases have lease terms of one to five years. Some leases include escalationclauses (such as 5% per year). In 2016, 2015 and 2014, total rent income (included under‘Miscellaneous income’) amounted to P=376.6 million, P=338.1 million and P=634.4 million,respectively, for the Group and P=275.3 million, P=266.1 million and P=364.0 million, respectively,for the Parent Company (Note 28).
Future minimum rentals receivable under non-cancelable operating leases follow:
Consolidated Parent Company2016 2015 2016 2015
Within one year P=313,458 P=183,496 P=164,501 P=22,654Beyond one year but not more than five years 302,910 169,379 265,821 12,110More than five years 34,849 9,835 16,155 9,835
P=651,217 P=362,710 P=446,477 P=44,599
Finance LeaseGroup as LessorLeases where the Group substantially transfers to the lessee all risks and benefits incidental toownership of the leased asset are classified as finance leases and are presented as receivable at anamount equal to the Group’s net investment in the lease. Finance income is recognized based onthe pattern reflecting a constant periodic rate of return on the bank's net investment outstanding inrespect of the finance lease (EIR method). Lease payments relating to the period are appliedagainst the gross investment in the lease to reduce both the principal and the unearned financeincome.
Future minimum lease receivables under finance leases are as follows:
Consolidated Parent Company2016 2015 2016 2015
Within one year P=1,738,954 P=1,654,119 P=23,509 P=17,909Beyond one year but not more than five years 1,273,921 1,984,772 40,100 35,900More than five years 36,500 47,900 36,500 47,900
(Forward)

- 134 -
*SGVFS021357*
Consolidated Parent Company2016 2015 2016 2015
Gross investment in finance lease contractsreceivable (Note 10) P=3,049,375 P=3,686,791 P=100,109 P=101,709
Less amounts representing finance charges 355,743 62,206 56,880 62,206Present value of minimum lease payments P=2,693,632 P=3,624,585 P=43,229 P=39,503
31. Income and Other Taxes
Under Philippine tax laws, the Parent Company and certain subsidiaries are subject to percentageand other taxes (presented as Taxes and Licenses in the statements of income) as well as incometaxes. Percentage and other taxes paid consist principally of gross receipts tax and documentarystamp tax.
Income taxes include the corporate income tax, discussed below, and final taxes paid whichrepresents final withholding tax on gross interest income from government securities and otherdeposit substitutes and income from the FCDU transactions. These income taxes, as well as thedeferred tax benefits and provisions, are presented as ‘Provision for income tax’ in the statementsof income.
Effective November 1, 2005, Republic Act (RA) No. 9337, an act amending the National InternalRevenue Code (NIRC of 1997), provides that the RCIT rate shall be 30.00% and interest allowedas a deductible expenses shall be reduced by 33.00% of interest income subjected to final tax.
MCIT of 2.00% on modified gross income is computed and compared with the RCIT. Any excessof MCIT over the RCIT is deferred and can be used as a tax credit against future income taxliability for the next three years. In addition, the Parent Company and certain subsidiaries areallowed to deduct NOLCO from taxable income for the next three years from the period ofincurrence. FCDU offshore income (income from non-residents) is tax-exempt while grossonshore income (income from residents) is generally subject to 10.00% income tax. In addition,interest income on deposit placement with other FCDUs and offshore banking units (OBUs) istaxed at 7.50%. RA No. 9294 provides that the income derived by the FCDU from foreigncurrency transactions with non-residents, OBUs, local commercial banks including branches offoreign banks is tax-exempt while interest income on foreign currency loans from residents otherthan OBUs or other depository banks under the expanded system is subject to 10.00% income tax.
Provision for income tax consists of:
Consolidated Parent Company
2016 2015 2014 2016
2015(As Restated -
Note 2) 2014Continuing operations:
CurrentRegular P=1,058,065 P=756,033 P=767,085 P=880,828 P=501,682 P=652,067Final 665,615 504,618 665,813 429,058 512,401 674,058
1,723,680 1,260,651 1,432,898 1,309,886 1,014,083 1,326,125Deferred (206,650) 314,598 (108,782) (81,514) 96,238 43,082
1,517,030 1,575,249 1,324,116 1,228,372 1,110,321 1,369,207Discontinued operations:
CurrentRegular 1,671 5,839 5,084 – – –Final 296,126 38,466 38,088 276,748 – –
297,797 44,305 43,172 276,748 – –Deferred (91,299) – – – – –
206,498 44,305 43,172 276,748 – –Total P=1,723,528 P=1,619,554 P=1,367,288 P=1,505,120 P=1,110,321 P=1,369,207

- 135 -
*SGVFS021357*
The components of net deferred tax assets reported in the statements of financial position follow:
Consolidated Parent Company
2016 2015 2016
2015(As Restated -
Note 2)Deferred tax asset on:
Allowance for impairment, credit andother losses P=5,142,623 P=4,852,727 P=4,695,139 P=4,695,139
Accumulated depreciation on investmentproperties 521,069 512,973 511,623 511,623
Deferred revenue 97,622 − 97,622 –Net retirement liability 20,218 16,474 – –Excess of net provision for unearned
premiums per PFRS over tax basis 7,498 6,339 – –Deferred reinsurance on commission 5,884 20,560 – –Accrued expenses 4,806 1,060 – –Unamortized past service cost 4,224 – – –Unrealized loss on AFS investment 1,116 830 830 830NOLCO – 94,944 – –Unrealized trading loss on FVPL – 10 – –Others 54,053 10,655 10,188 10,556
5,859,113 5,516,572 5,315,402 5,218,148Deferred tax liability on:
Fair value adjustment on investmentproperties 1,448,798 1,593,081 1,448,798 1,584,385
Fair value adjustments due to businesscombination 1,043,112 1,137,326 1,043,112 1,137,326
Revaluation increment on land andbuildings* 736,436 736,436 736,436 736,436
Unrealized foreign exchange gains 664,971 578,555 665,237 577,007Gain on remeasurement of a previously
held interest 160,272 – 164,429 –Unrealized trading gains on financial
assets at FVPL 105,646 53,132 105,646 53,132Lease income differential between
finance and operating lease method 45,662 21,646 – –Deferred acquisition cost 19,354 17,835 – –Temporary difference associated with
investments in disposal groupclassified as held for sale – 91,299 – 95,456
Others 152,648 113,687 137,436 97,9144,376,899 4,342,997 4,301,094 4,281,656
P=1,482,214 P=1,173,575 P=1,014,308 P=936,492* Balance includes deferred tax liability amounting to P=736.4 million acquired from business combination
As of December 31, 2016 and 2015, the Group’s net deferred tax liabilities as disclosed in ‘Otherliabilities’ (Note 22) include deferred tax liabilities on fair value adjustments due to businesscombination amounting to P=148.3 million and on accelerated depreciation on property andequipment amounting to P=6.1 million.

- 136 -
*SGVFS021357*
Benefit from deferred tax charged directly to OCI during the year follows:
Consolidated Parent Company2016 2015 2014 2016 2015 2014
Net unrealized losses (gains) onAFS investments P=286 P=2,887 P=9,059 P=– P=2,887 P=9,059
Remeasurement losses onretirement plan 2,204 2,277 9,334 – 2,277 9,334
The movements in the net deferred tax assets of the Group include impact of CTA amounting toP=8.2 million in 2016 and 2015. The movements in the net deferred tax asset of the ParentCompany include impact of CTA amounting to P=3.7 million and P=0.4 million in 2016 and 2015,respectively.
Based on the three-year financial forecast prepared by management and duly approved by theExecutive Committee of the BOD, the Parent Company’s gross deferred tax assets of P=5.3 billionand P=5.2 billion as of December 31, 2016 and 2015, respectively is expected to be realized fromits taxable profits within the next three years.
Unrecognized Deferred Tax AssetsThe Parent Company and certain subsidiaries did not recognize deferred tax assets on thefollowing unused tax credit and losses and temporary differences since they believe that therelated tax benefits will not be realized in the future:
Consolidated Parent Company2016 2015 2016 2015
Allowance for impairment and creditlosses P=1,676,551 P=1,193,391 P=1,112,654 P=1,060,122
Retirement liability 919,382 778,925 918,973 778,925Unamortized past service cost 603,280 551,466 603,280 551,466Accrued expenses 442,562 426,911 442,537 424,956NOLCO 439,659 426,913 − –Unearned income 122,269 112,500 122,269 112,500Derivative liabilities 69,593 40,503 69,593 40,503Provision for IBNR 65,000 19,500 − –Conveyance of real estate inventories
held for sale 34,321 – 34,321 –Other equity reserves 31,701 – 31,701 –Others 4,244 15,807 4,242 13,347
P=4,408,562 P=3,565,916 P=3,339,570 P=2,981,819
Details of the Group’s NOLCO follow:
Year Incurred Amount Used/Expired Balance Expiry Year2013 P=942,021 P=942,021 P=– 20162014 170,349 – 170,349 20172015 289,320 – 289,320 20182016 3,204 – 3,204 2019
P=1,404,894* P=942,021 P=462,873*Balance includes NOLCO amounting to P=277,952 acquired from business combination

- 137 -
*SGVFS021357*
The Group has net operating loss carryforwards for US federal tax purposes of USD6.2 million asof December 31, 2016 and 2015, respectively, and net operating loss carryforwards for Californiastate tax purposes of USD4.1 million as of December 31, 2016 and 2015, respectively.
Unrecognized Deferred Tax LiabilitiesAs of December 31, 2016, there was a deferred tax liability of P=665.6 million (P=788.2 million in2015) for temporary differences of P=2.2 billion (P=2.6 billion in 2015) related to investment incertain subsidiaries. However, this liability was not recognized because the Parent Companycontrols whether the liability will be incurred and it is satisfied that it will not be incurred in theforeseeable future.
The reconciliation between the statutory income tax rate to effective income tax rate follows:
Consolidated Parent Company
2016 2015 2014 2016
2015(As Restated
- Note 2)
2014(As Restated
- Note 2)Statutory income tax rate 30.00% 30.00% 30.00% 30.00% 30.00% 30.00%Tax effects of: FCDU income before tax (3.68) (4.62) (6.05) (3.78) (5.10) (6.19) Net non-deductible expenses 6.90 10.14 16.34 6.23 8.12 19.91 Optional standard deduction (0.02) (0.38) 0.02 – – – Tax-exempt income (7.82) (6.85) (7.09) (9.22) (8.63) (20.97) Tax-paid income (2.19) (3.77) (4.14) (1.91) (3.15) (3.04) Net unrecognized deferred
tax assets (3.84) (3.66) (8.65) (3.88) (5.87) 0.64Effective income tax rate 19.35% 20.86% 20.43% 17.44% 15.37% 20.35%
Current tax regulations define expenses to be classified as entertainment, amusement andrecreation (EAR) and set a limit for the amount that is deductible for tax purposes. EAR arelimited to 1.00% of net revenues for sellers of services. EAR charged against current operations(included in ‘Miscellaneous expense’ in the statements of income) amounted to P=99.0 million in2016, P=86.1 million in 2015, and P=147.0 million in 2014 for the Group, and P=89.9 million in 2016,P=72.8 million in 2015, and P=126.7 million in 2014 for the Parent Company (Note 28).
32. Earnings Per Share
The following tables reflect the net income and share data used in the earnings per sharecomputations:
Earnings per share attributable to equity holders of the Parent Company:
2016 2015 2014a) Net income attributable to equity holders
of the Parent Company P=7,147,464 P=6,113,508 P=5,358,669b) Weighted average number of common
shares for basic earnings per share(Note 25) 1,249,140 1,249,020 1,163,938
c) Basic/Diluted earnings per share (a/b) P=5.72 P=4.89 P=4.60

- 138 -
*SGVFS021357*
Earnings per share attributable to equity holders of the Parent Company from continuingoperations:
2016 2015 2014a) Net income attributable to equity holders
of the Parent Company P=6,551,658 P=5,827,163 P=5,147,340b) Weighted average number of common
shares for basic earnings per share(Note 25) 1,249,140 1,249,020 1,163,938
c) Basic/Diluted earnings per share (a/b) P=5.24 P=4.67 P=4.42
As of December 31, 2016, 2015 and 2014, there are no potential common shares with dilutiveeffect on the basic earnings per share.
33. Trust Operations
Securities and other properties held by the Parent Company in fiduciary or agency capacitiesfor its customers are not included in the accompanying statements of financial position since theseare not assets of the Parent Company. Such assets held in trust were carried at a value ofP=75.2 billion and P=78.7 billion as of December 31, 2016 and 2015, respectively (Note 35). Inconnection with the trust functions of the Parent Company, government securities amounting toP=924.8 million and P=747.8 million (included under ‘AFS Investments’) as of December 31, 2016and 2015, respectively, are deposited with the BSP in compliance with trust regulations (Note 9).
Trust fee income in 2016, 2015 and 2014 amounting to P=311.9 million, P=256.2 million andP=230.1 million, respectively, is included under ‘Service fees and commission income’ (Note 26).
In compliance with existing banking regulations, the Parent Company transferred from surplus tosurplus reserves the amounts of P=19.4 million, P=16.6 million and P=13.6 million in 2016, 2015 and2014, respectively, which correspond to 10.00% of the net income realized in the preceding yearsfrom its trust, investment management and other fiduciary business until such related surplusreserve constitutes 20.00% of its regulatory capital.
34. Related Party Transactions
Regulatory ReportingIn the ordinary course of business, the Parent Company has loans and other transactions with itssubsidiaries and affiliates, and with certain Directors, Officers, Stockholders and Related Interests(DOSRI). Under the Parent Company’s policy, these loans and other transactions are madesubstantially on the same terms as with other individuals and businesses of comparable risks.The amount of direct credit accommodations to each of the Parent Company’s DOSRI, 70.00% ofwhich must be secured, should not exceed the amount of their respective deposits and book valueof their respective investments in the Parent Company.
In the aggregate, DOSRI loans generally should not exceed the Parent Company’s equity or 15%of the Parent Company’s total loan portfolio, whichever is lower. As of December 31, 2016 and2015, the Group and Parent Company were in compliance with such regulations.
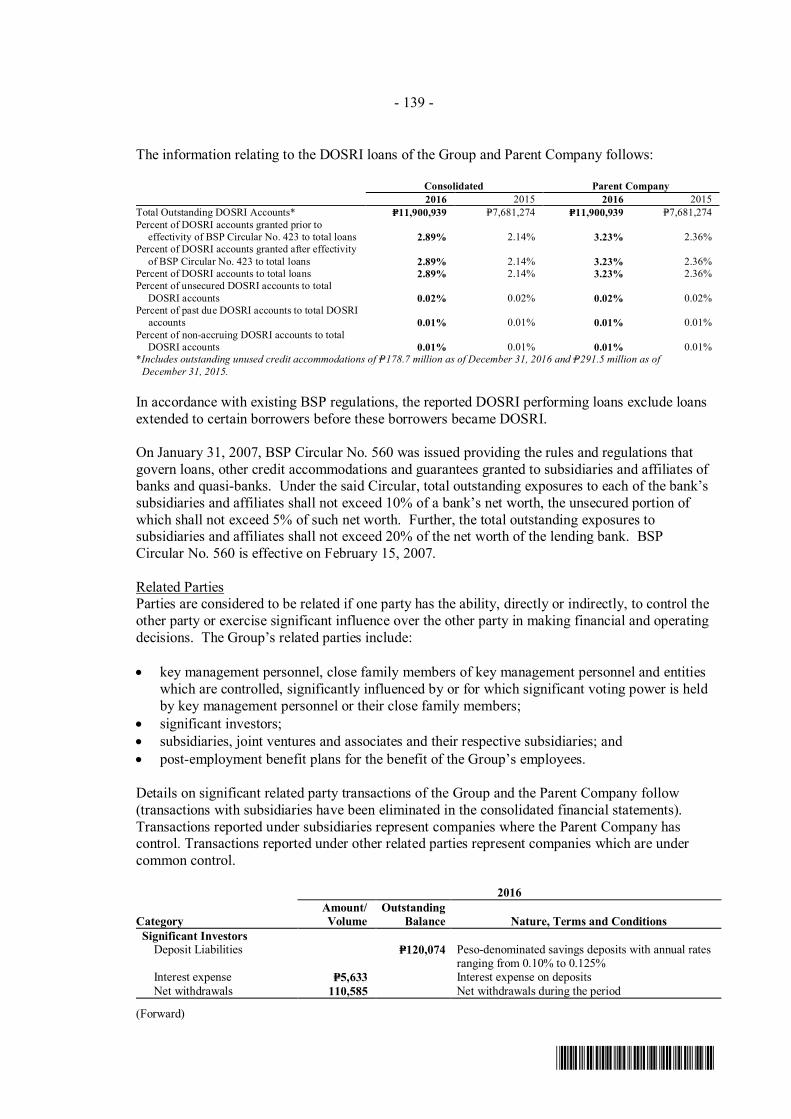
- 139 -
*SGVFS021357*
The information relating to the DOSRI loans of the Group and Parent Company follows:
Consolidated Parent Company2016 2015 2016 2015
Total Outstanding DOSRI Accounts* P=11,900,939 P=7,681,274 P=11,900,939 P=7,681,274Percent of DOSRI accounts granted prior to
effectivity of BSP Circular No. 423 to total loans 2.89% 2.14% 3.23% 2.36%Percent of DOSRI accounts granted after effectivity
of BSP Circular No. 423 to total loans 2.89% 2.14% 3.23% 2.36%Percent of DOSRI accounts to total loans 2.89% 2.14% 3.23% 2.36%Percent of unsecured DOSRI accounts to total
DOSRI accounts 0.02% 0.02% 0.02% 0.02%Percent of past due DOSRI accounts to total DOSRI
accounts 0.01% 0.01% 0.01% 0.01%Percent of non-accruing DOSRI accounts to total
DOSRI accounts 0.01% 0.01% 0.01% 0.01%*Includes outstanding unused credit accommodations of P=178.7 million as of December 31, 2016 and P=291.5 million as of
December 31, 2015.
In accordance with existing BSP regulations, the reported DOSRI performing loans exclude loansextended to certain borrowers before these borrowers became DOSRI.
On January 31, 2007, BSP Circular No. 560 was issued providing the rules and regulations thatgovern loans, other credit accommodations and guarantees granted to subsidiaries and affiliates ofbanks and quasi-banks. Under the said Circular, total outstanding exposures to each of the bank’ssubsidiaries and affiliates shall not exceed 10% of a bank’s net worth, the unsecured portion ofwhich shall not exceed 5% of such net worth. Further, the total outstanding exposures tosubsidiaries and affiliates shall not exceed 20% of the net worth of the lending bank. BSPCircular No. 560 is effective on February 15, 2007.
Related PartiesParties are considered to be related if one party has the ability, directly or indirectly, to control theother party or exercise significant influence over the other party in making financial and operatingdecisions. The Group’s related parties include:
∂ key management personnel, close family members of key management personnel and entitieswhich are controlled, significantly influenced by or for which significant voting power is heldby key management personnel or their close family members;
∂ significant investors;∂ subsidiaries, joint ventures and associates and their respective subsidiaries; and∂ post-employment benefit plans for the benefit of the Group’s employees.
Details on significant related party transactions of the Group and the Parent Company follow(transactions with subsidiaries have been eliminated in the consolidated financial statements).Transactions reported under subsidiaries represent companies where the Parent Company hascontrol. Transactions reported under other related parties represent companies which are undercommon control.
2016
CategoryAmount/Volume
OutstandingBalance Nature, Terms and Conditions
Significant InvestorsDeposit Liabilities P=120,074 Peso-denominated savings deposits with annual rates
ranging from 0.10% to 0.125%Interest expense P=5,633 Interest expense on depositsNet withdrawals 110,585 Net withdrawals during the period
(Forward)

- 140 -
*SGVFS021357*
2016
CategoryAmount/Volume
OutstandingBalance Nature, Terms and Conditions
SubsidiariesReceivables from customers Loan releases Loan collections
P=6,876,0006,740,334
P=2,014,333 Term loan maturing in 2017 with 3.85% nominalrate; Revolving credit lines with interest rate of2.90% maturity of three months; Unsecured
Loan commitments 7,433,296 Omnibus line; credit lineInterbank loans receivable Availments Settlements
1,349,1911,390,990
116,393 Foreign currency-denominated interbank term loanswith interest rates ranging from 0.20% to 0.30% andmaturity terms ranging from 30 to 150 days
Due from other banks 428,290 Foreign currency-denominated demand deposits andtime deposits with maturities of up to 90 days withannual fixed interest rates ranging from 0.01% to4.50%
Accrued interest receivable 2,849 Interest accrual on receivables from customers andinterbank loans receivable
Deposit liabilities 5,465,222 Peso and foreign currency denominated demand,savings and time deposits with annual fixed interestrates ranging from 0.125% to 1.125% and maturitiesfrom 30 to 365 days
Net withdrawals 501,832 Net withdrawals during the periodBills payable Availments Settlements
1,971,7292,097,198
1,776,997 Foreign currency-denominated bills payable withinterest rates ranging from 0.20% to 2.00% andmaturity terms ranging from 30 to 183 days
Due to other banks 45,211 Foreign currency-denominated clearing accountsused for funding and settlement of remittances
Accrued interest payable 9,261 Accrued interest on deposit liabilities and billspayable
Rental deposit 10,900 Advance rental deposit received for 2 years and 3mos.
Interest income 75,684 Interest income on receivable from customers, duefrom other banks and interbank loans receivable
Interest expense 149,832 Interest expense on deposit liabilities and billspayable
Rental income 55,003 Rental income from one to three years leaseagreement, with escalation rate of 10.00% per annum
Securities transactions Purchases 1,549,350 Outright purchase of securities Sales 1,218,139 Outright sale of securities Trading loss 965 Loss from sale of investment securities
AffiliatesReceivables from customers Loan releases Loan Collections
13,803,37212,567,911
19,404,084 Secured by hold-out on deposits, governmentsecurities, real estate and mortgage trust indenture;Unimpaired; With interest rates ranging from 2.82%to 6.00% with maturity terms ranging from 90 daysto 12 years and payment terms of ranging frommonthly to quarterly payments.
Loan commitments 2,941,216 Omnibus line; credit lineInvestment in non-marketable
equity securities269,719 Common shares with acquisition costs ranging from
P=5.00 to P=100.00 per shareSales contract receivable 2,257,651 Purchase of the Parent Company's investment
properties on installment; secured with interest rateof 6.00%, maturity of five years
Accrued interest receivable 26,739 Accrued interest on receivables from customersRental deposits 10,171 Advance rental and security deposits received for
two months, three months and two yearsOperating lease 7,575 Lease contract for 5 years
(Forward)

- 141 -
*SGVFS021357*
2016
CategoryAmount/Volume
OutstandingBalance Nature, Terms and Conditions
Deposit liabilities P=10,918,370 Peso-denominated and foreign currency-denominateddemand, savings and time deposits with annualinterest rates ranging from 0.10% to 1.75% andmaturity terms ranging from 30 days to 365 days
Net deposits P=3,499,520 Net deposits during the periodAccrued interest payable 52 Accrued interest payable from various depositsInterest income 388,599 Interest income on receivable from customersInterest expense 75,633 Interest expense on deposit liabilitiesGain on sale of investment
property1,281,742 20.00% to 30.00% downpayment; 80.00% to 70.00%
balance payable in 5 years. Interest-bearing at 6.00%Rental income 53,253 Monthly rent income from related partiesRental expense 13,213 Monthly rent payments with term ranging from 24 to
240 monthsMiscellaneous expense 438 Claims expense, comprehensive insurance, service
and referral feesSecurities transactions Purchases 1,216 Outright purchase of securities Sales 1,216 Outright sale of securities Trading gains – Gain from sale of investment securities
AssociateDeposit liabilities 352,146 Peso-denominated and foreign currency-denominated
demand, savings and time deposits with annualinterest rates ranging from 0.125% to 2.00% andmaturity terms ranging from 30 days.
Other liabilities 115 Various manager's check related premium insuranceInterest expense 29,440 Interest expense on deposit liabilitiesRental income 10,158 Rental income from a five-year lease agreement,
monthly rental subject to 5% escalation rateKey Management PersonnelLoans to officers 14,941 Housing loans to senior officers with interest rates
ranging from 3.00% to 15.00%; Secured andunimpaired
Loan collections 2,057 Settlement of loans and interestOther equity reserves 105,670 Other employee benefit expense in relation to the
grant of centennial bonus based on P=70.0 per shareTransactions of subsidiarieswith other related partiesDue from banks 940,860 With annual fixed interest rates ranging from 0.01%
to 3.75% and includes time deposits with maturitiesof up to 90 days
Deposit liabilities 940,053 With annual fixed interest rates ranging from 0.01%to 3.75% and includes time deposits with maturitiesof up to 90 days
Other liabilities 1,133 Various manager's checkInterest income 4,524 Interest income on receivable from customersInterest expense 19,051 Interest expense on bills payableMiscellaneous income 5 Premiums collected
2015
CategoryAmount/Volume
OutstandingBalance Nature, Terms and Conditions
Significant InvestorsDeposit liabilities P=230,659 Peso-denominated savings deposits with annual rates
ranging from 0.10% to 0.13%Interest expense P=16,406 Interest expense on deposit liabilitiesNet withdrawals 4,743,187 Net withdrawals during the period
(Forward)

- 142 -
*SGVFS021357*
2015
CategoryAmount/Volume
OutstandingBalance Nature, Terms and Conditions
SubsidiariesReceivables from customers Loan releases Loan collections
P=5,650,7509,982,760
P=1,878,667 Term loan maturing in 2017 with 3.85% nominal rate;Revolving credit lines with interest rate of 3.00maturity of three months; Unsecured
Loan commitments 566,497 Money market line; pre-settlement riskInterbank loans receivable Availments Settlements
1,041,975940,815
158,192 Foreign currency-denominated interbank term loanswith interest rates ranging from 0.03% to 0.35% andmaturity terms ranging from 15 to 150 days
Due from other banks 504,201 Foreign currency-denominated demand deposits andtime deposits with maturities of up to 90 days withannual fixed interest rates ranging from 0.01% to4.50%
Accrued interest receivable 3,923 Interest accrual on receivables from customers andinterbank loans receivable
Deposit liabilities 5,967,054 Peso-denominated and foreign currency-denominateddemand and savings deposits with annual interestrates ranging from 0.10% to 2.35%Foreign currency-denominated time deposits withannual interest rates ranging from 0.62% to 1.25%and maturity terms of 30 days
Net deposits 2,045,599 Net deposits during the periodBills payable Availments Settlements
3,296,9493,648,952
1,902,466 Foreign currency-denominated bills payable withinterest rates ranging from 0.20% to 2.50% andmaturity terms ranging from 30 to 365 days
Due to other banks 252,997 Foreign currency-denominated clearing accounts usedfor funding and settlements of remittances
Accrued interest payable 25,066 Accrued interest on deposit liabilities and billspayable
Rental deposit 10,637 Advanced rental and security deposits received fortwo and three months
Other liabilities 2 Various manager’s check related to premiuminsurance
Interest income 57,385 Interest income on receivables from customers, duefrom other banks and interbank loans receivable
Interest expense 112,529 Interest expense on deposit liabilities and billspayable
Rental income 61,616 Rental income from three years year lease agreement,with escalation rate of 10.00% per annum
Fees and commission income 130,082 Income from client referrals and professional fees onservice agreements with Legal Group
Miscellaneous income 716,247 Proceeds from fire insurance claims on the EverGotesco property
Securities transactions:Purchases 3,141,507 Outright purchase of securitiesSales 3,410,775 Outright sale of securitiesTrading gains 287 Gain from sale of investment securities
AffiliatesReceivables from customers Loan releases Loan collections
15,858,4408,888,360
18,168,623 Secured by hold-out on deposits, governmentsecurities, real estate and mortgage trust indenture;Unimpaired; With interest rates ranging from 2.82%to 6.00%, maturity terms ranging from 90 days to 12years and payment terms ranging from monthlypayments to quarterly payments
Loan commitments 6,340,087 Term loan with maturity in 2023; various short-termlines with expiry in 2016; counterparty line
Investment in non-marketableequity securities
269,719 Common shares with acquisition costs ranging fromP=5.0 to P=100.00 per share
(Forward)
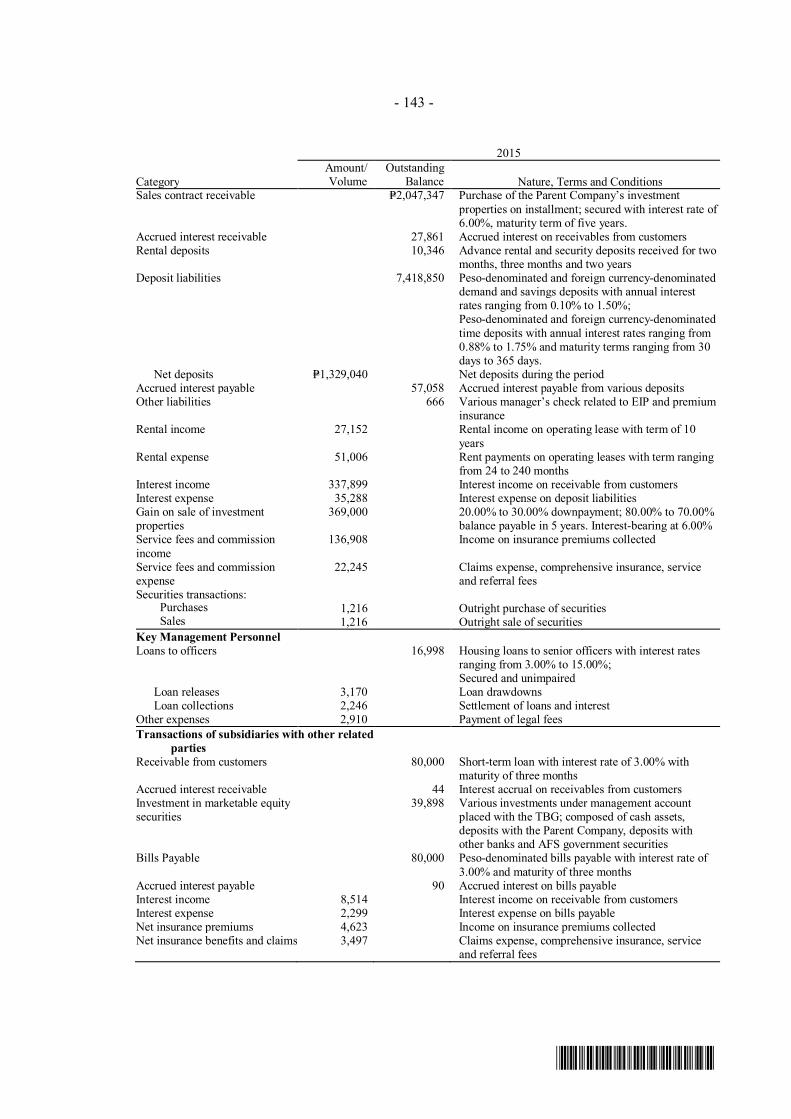
- 143 -
*SGVFS021357*
2015
CategoryAmount/Volume
OutstandingBalance Nature, Terms and Conditions
Sales contract receivable P=2,047,347 Purchase of the Parent Company’s investmentproperties on installment; secured with interest rate of6.00%, maturity term of five years.
Accrued interest receivable 27,861 Accrued interest on receivables from customersRental deposits 10,346 Advance rental and security deposits received for two
months, three months and two yearsDeposit liabilities 7,418,850 Peso-denominated and foreign currency-denominated
demand and savings deposits with annual interestrates ranging from 0.10% to 1.50%;Peso-denominated and foreign currency-denominatedtime deposits with annual interest rates ranging from0.88% to 1.75% and maturity terms ranging from 30days to 365 days.
Net deposits P=1,329,040 Net deposits during the periodAccrued interest payable 57,058 Accrued interest payable from various depositsOther liabilities 666 Various manager’s check related to EIP and premium
insuranceRental income 27,152 Rental income on operating lease with term of 10
yearsRental expense 51,006 Rent payments on operating leases with term ranging
from 24 to 240 monthsInterest income 337,899 Interest income on receivable from customersInterest expense 35,288 Interest expense on deposit liabilitiesGain on sale of investmentproperties
369,000 20.00% to 30.00% downpayment; 80.00% to 70.00%balance payable in 5 years. Interest-bearing at 6.00%
Service fees and commissionincome
136,908 Income on insurance premiums collected
Service fees and commissionexpense
22,245 Claims expense, comprehensive insurance, serviceand referral fees
Securities transactions:Purchases 1,216 Outright purchase of securitiesSales 1,216 Outright sale of securities
Key Management PersonnelLoans to officers 16,998 Housing loans to senior officers with interest rates
ranging from 3.00% to 15.00%;Secured and unimpaired
Loan releases 3,170 Loan drawdownsLoan collections 2,246 Settlement of loans and interest
Other expenses 2,910 Payment of legal feesTransactions of subsidiaries with other related
partiesReceivable from customers 80,000 Short-term loan with interest rate of 3.00% with
maturity of three monthsAccrued interest receivable 44 Interest accrual on receivables from customersInvestment in marketable equitysecurities
39,898 Various investments under management accountplaced with the TBG; composed of cash assets,deposits with the Parent Company, deposits withother banks and AFS government securities
Bills Payable 80,000 Peso-denominated bills payable with interest rate of3.00% and maturity of three months
Accrued interest payable 90 Accrued interest on bills payableInterest income 8,514 Interest income on receivable from customersInterest expense 2,299 Interest expense on bills payableNet insurance premiums 4,623 Income on insurance premiums collectedNet insurance benefits and claims 3,497 Claims expense, comprehensive insurance, service
and referral fees

- 144 -
*SGVFS021357*
The related party transactions shall be settled in cash. There are no provisions for credit losses in2016 and 2015 in relation to amounts due from related parties.
Outsourcing Agreement between the Parent Company and PNB GRFThe ‘Pangarap Loans’, which are all-purpose credit facilities fully secured by customer's depositspledged with either PNB Hong Kong Branch or other PNB overseas branches, mainly comprisethe consumer lending activity of PNB GRF. On March 19, 2004, the Parent Company and PNBGRF entered into an agreement where the Parent Company agreed to undertake all impairedPangarap Loans of PNB GRF. PNB GRF transfers the impaired loans at their carrying values on aquarterly basis or when aggregate carrying value of the impaired loans amounts toHK$2.0 million, whichever comes earlier. Subject to BOD approval, PNB GRF regularly declaresspecial dividends (recognized as a liability). These special dividends are being offset against theintercompany receivables from the Parent Company.
In June 2013, the Parent Company and PNB GRF agreed to amend the settlement procedure ondefaulted Pangarap Loans. Under the new settlement procedure, the Parent Company, in whichthe pledged deposits of the defaulted Pangarap Loans are placed with, remit the correspondingdefaulted amounts (including accrued interests, surcharges and other related charges) from thepledged deposits of the defaulted customers to PNB GRF. The remitted amounts are being offsetagainst the intercompany receivables from the Parent Company.
Financial Assets at FVPL traded through PNB SecuritiesAs of December 31, 2016 and 2015, the Parent Company’s financial assets at FVPL include equitysecurities traded through PNB Securities with a fair value of P=27.2 million and P=199.7 million,respectively. The Parent Company recognized trading losses amounting to P=13.5 million in 2016and trading gains amounting to P=7.2 million and P=19.5 million in 2015 and 2014, respectivelyfrom the trading transactions facilitated by PNB Securities.
Investment in OHBVIThe Group accounts for its investments in OHBVI as a subsidiary although the Group holds lessthan 50.00% of OHBVI’s issued share capital on the basis of the voting rights of 42.78% assignedby certain stockholders to the Parent Company under a voting trust agreement. There are no othertransactions with OHBVI during the year.
VMC Convertible Notes and Common SharesAs of December 31, 2013, the Parent Company holds convertible notes with face amount ofP=353.4 million, recorded under ‘Unquoted debt securities’ and 161,978,996 common shares,recorded under ‘AFS investments’, issued by VMC, an affiliate of the Group. Each of theinvestment has a carrying value of P=1.0 (one peso). In March 2014, VMC redeemed a portion ofthe convertible notes for a total price of P=330.3 million, the same amount of gain was recordedunder ‘Interest income’ in the statement of income of the Parent Company. In April 2014, theParent Company sold the remaining convertible notes to LTG at P=3.50 for every P=1.0 convertiblenote. The Parent Company recognized a gain on sale of convertible notes amounting toP=608. 4 million, booked under ‘Miscellaneous income’ in the statement of income of the ParentCompany (Note 28). Also in April 2014, the Parent Company sold its investment in commonshares of VMC to LTG, at current market price of P=4.54 per share resulting in a gain ofP=735.4 million recorded under ‘Trading and investment securities gains - net’ in the statement ofincome of the Parent Company. The sale of VMC shares to LTG was facilitated by PNBSecurities.

- 145 -
*SGVFS021357*
Compensation of Key Management PersonnelThe compensation of the key management personnel for the Group and Parent Company follows:
2016 2015 2014Short-term employee benefits (Note 20) P=581,302 P=589,199 P=459,759Post-employment benefits 61,544 51,365 47,844
P=642,846 P=640,564 P=507,603
Members of the BOD are entitled to a per diem of P=0.05 million for attendance at each meeting ofthe Board and of any committees, and other non-cash benefit in the form of healthcare plans andinsurance. In 2016 and 2015, total per diem given to the BOD amounted to P=43.2 million andP=42.0 million, respectively, recorded in ‘Miscellaneous expenses’ in the statement of income.Directors’ remuneration covers all PNB Board activities and membership of committees andsubsidiary companies.
Joint ArrangementsThe Parent Company and EPPI signed two Joint Venture Agreement (JVA) for the developmentof two real estate properties of the Parent Company included under ‘Other assets’ and withcarrying values of P=1.2 billion. EPPI and the Group are under common control. These twoprojects are among the Parent Company’s strategies in reducing its non-performing assets.
The Parent Company contributed the aforementioned properties into the Joint Venture (JV) asapproved by BSP. EPPI, on the other hand, contributed its resources and technical expertise forthe completion of the said JV. The Parent Company is prohibited to contribute funds for thedevelopment of the JV. Income from the sale of the properties under the JV will be shared by theParent Company and EPPI in accordance with the terms of the JVAs. These Joints Arrangementsqualify as Joint Operations under PFRS 11.
In July 2016, the Bank executed deeds of conveyance to EPPI on the areas of the land under theJVA arrangement. The execution of the deeds of conveyance was made to facilitate the issuanceof the condominium certificates of title to the buyers.
Outsourcing Agreement between the Parent Company and PNB SBPNB SB entered into a “Deed of Assignment” with the Parent Company for the purchase, on awithout recourse basis, housing (including contract-to-sell loans) and motor vehicle loans with atotal carrying value of P=5.2 billion in July and August 2016 and P=5.0 billion on July 15, 2015.The purchase includes the assignment of the promissory notes and other relevant credit documentsas well as collateral/s and other accessory contract thereto and was implemented in tranches invarious dates. The total consideration paid for the purchased loans amounted to P=5.0 billion in2016 and 2015. In 2016 and 2015, the Parent Company recognized gain of P=18.3 million andP=24.4 million, respectively.
PNB SB and the Parent Company entered into a servicing agreement pertaining to the purchasedloan portfolio. The agreement shall be valid and binding until terminated by the either party if sorequired by the BSP or upon a 60-day prior written notice to the other party. As to the amount ofservice fee, the Parent Company shall charge PNB SB with the amount it charges it customers.
Service charges pertain to outsourced services rendered by the Parent Company, including legaland information technology services. These are payable on a monthly basis.

- 146 -
*SGVFS021357*
PNB SB has available credit lines with the Parent Company amounting to P=1.3 billion andP=300.0 million as of December 31, 2016 and 2015, respectively. As of December 31, 2016 and2015, the credit lines remain undrawn.
Claim from PNB GenIn 2015, the Parent Company recognized income amounted to P=716.2 million under‘Miscellaneous income’ arising from the fire insurance claims of the Parent Company from PNBGen on involving the Ever Gotesco Grand Central ('Insured Property') which was mortgaged to theParent Company by Gotesco Investment, Inc. and Ever Emporium, Inc. (collectively 'EverGotesco Group') to secure certain credit accommodations. The insurable interest of the ParentCompany (as mortgagee) was insured with PNB Gen. The Insured Property was razed by fire onMarch 19, 2012, which justified the payment by PNB Gen of the insurance claims of the ParentCompany, after the Court cleared the legal issues between PNB and Ever Gotesco Group thatmight potentially bar the payment thereof.
Transactions with Retirement PlansManagement of the retirement funds of the Group and the Parent Company is handled by the PNBTrust Banking Group (TBG). The fair values and carrying values of the funds of the ParentCompany amounted to P=4.3 billion and P=3.8 billion as of December 31, 2016 and 2015,respectively.
Relevant information on assets/liabilities and income/expense of the retirement plan assetsfollows:
Consolidated Parent Company2016 2015 2016 2015
Investment in PNB Shares P=491,884 P=468,461 P=491,884 P=468,461Deposits with PNB 330,716 342,767 330,678 342,722Investment in UITFs 122,306 166,258 101,572 153,857Total Fund Assets P=904,906 P=977,486 P=924,134 P=965,040Unrealized gain (loss) on HFT (PNBshares) P=23,423 (P=252,248) P=23,423 (P=252,248)Interest income 15,602 13,427 14,952 11,188
39,025 (238,821) 38,375 (241,060)Trust fees (4,821) (4,854) (4,912) (4,577)Fund income (loss) P=34,204 (P=243,675) P=33,463 (P=245,637)
As of December 31, 2016 and 2015, the retirement fund of the Group and the Parent Companyinclude 9,008,864 PNB shares classified under HFT. There are no limitations and restrictions overthe PNB shares while the corresponding voting rights are exercised by a trust officer or any of itsdesignated alternate officer of TBG.
In addition to the regular retirement funds, TBG also manages the funds of the Parent Company’semployee investment plans.

- 147 -
*SGVFS021357*
35. Provisions, Contingent Liabilities and Other Commitments
In the normal course of business, the Group makes various commitments and incurs certaincontingent liabilities that are not presented in the financial statements including several suits andclaims which remain unsettled. No specific disclosures on such unsettled assets and claims aremade because any such specific disclosures would prejudice the Group’s position with the otherparties with whom it is in dispute. Such exemption from disclosures is allowed under PAS 37,Provisions, Contingent Liabilities and Contingent Assets. The Group and its legal counsel believethat any losses arising from these contingencies which are not specifically provided for will nothave a material adverse effect on the financial statements.
Movements of provisions for legal claims for the Group and the Parent Company are as follows:
2016 2015Balance at beginning of the year P=898,737 P=1,640,648Provisions (reversals) during the year (Note 16) 401,553 (741,911)Balance at the end of the year P=1,300,290 P=898,737
Tax AssessmentIn the ordinary course of the Group’s operations, certain entities within the Group have pendingtax assessments/claims which are in various stages of protest/appeal with the tax authorities, theamounts of which cannot be reasonably estimated. Management believes that the bases of saidprotest/appeal are legally valid such that the ultimate resolution of these assessments/claims wouldnot have material effects on the consolidated financial position and results of operations.
BSP ReportingThe following is a summary of various commitments, contingent assets and contingent liabilitiesat their equivalent peso contractual amounts:
Consolidated Parent Company2016 2015 2016 2015
Trust department accounts (Note 33) P=75,238,152 P=78,708,656 P=75,238,152 P=78,708,656Derivative forwards 40,000,448 32,378,255 34,886,157 26,907,910Interest rate swaps 33,610,720 9,317,880 33,610,720 9,317,880Standby letters of credit 26,232,306 22,031,604 26,133,083 21,916,691Deficiency claims receivable 22,337,807 21,562,415 22,285,950 21,541,459Unutilized credit card lines 27,018,318 15,725,684 27,018,318 15,725,684Derivative spots 2,358,455 5,526,044 2,358,455 5,526,044Inward bills for collection 1,001,375 356,152 974,300 248,839Outward bills for collection 282,212 320,428 117,898 89,201Confirmed export letters of credit 100,461 88,409 100,461 88,409Unused commercial letters of credit 50,062 48,957 50,062 48,957Shipping guarantees issued 13,716 10,033 13,716 10,033Items held as collateral 1,237 42 1,225 31Other credit commitments (Note 9) – 974,377 – 974,377Other contingent accounts 2,073,225 298,336 2,068,481 296,174

- 148 -
*SGVFS021357*
36. Offsetting of Financial Assets and Liabilities
The amendments to PFRS 7, which is effective January 1, 2013, require the Group to discloseinformation about rights of offset and related arrangements (such as collateral postingrequirements) for financial instruments under an enforceable master netting agreements or similararrangements. The effects of these arrangements are disclosed in the succeeding tables.
Financial assets2016
Financial assets recognized atend of reporting period bytype
Gross carryingamounts (before
offsetting)
Gross amountsoffset in
accordance withthe offsetting
criteria
Net amountpresented in
statements offinancialposition
[a-b]
Effect of remaining rights of set-off (including rights to set off financial collateral) that do not meet PAS 32
offsetting criteria
Net exposure[c-d]
Financialinstruments
Fair value offinancial
collateral[a] [b] [c] [d] [e]
Derivative assets P=28,500,758 (P=28,152,954) P=347,804 P=199,855 − P=147,949Securities sold under
agreements to repurchase(Notes 8) 1,972,310 − 1,972,310 − 1,968,603* 3,707
Total P=30,473,068 (P=28,152,954) P=2,320,114 P=199,855 P=1,968,603 P=151,656* Included in bills and acceptances payable in the statements of financial position
2015
Financial assets recognized atend of reporting period bytype
Gross carryingamounts (before
offsetting)
Gross amountsoffset in
accordance withthe offsetting
criteria
Net amountpresented in
statements offinancialposition
[a-b]
Effect of remaining rights of set-off (including rights to set off financial collateral) that do not meet PAS 32
offsetting criteria
Net exposure[c-d]
Financialinstruments
Fair value offinancialcollateral
[a] [b] [c] [d] [e]Securities sold under
agreements to repurchase(Notes 8) P=14,550,000 P=– P=14,550,000 P=– P=14,516,223* P=33,777
* Included in bills and acceptances payable in the statements of financial position
Financial liabilities2016
Financial liabilities recognizedat end of reporting periodby type
Gross carryingamounts (before
offsetting)
Gross amountsoffset in
accordance withthe offsetting
criteria
Net amountpresented in
statements offinancialposition
[a-b]
Effect of remaining rights of set-off (including rights to set off financial collateral) that do not meet PAS 32
offsetting criteria
Net exposure[c-d]
Financialinstruments
Fair value offinancial
collateral[a] [b] [c] [d] [e]
Derivative liabilities P=15,217,658 (P=15,449,106) (P=231,448) P=273,191 P=− P=−Securities sold under
agreements to repurchase(Notes 9 and 19)* 20,635,171 − 20,635,171 − 24,657,929 −
Total P=35,852,829 (P=15,449,106) P=20,403,723 P=273,191 P=24,657,929 P=−* Included in bills and acceptances payable in the statements of financial position
2015
Financial liabilities recognizedat end of reporting periodby type
Gross carryingamounts (before
offsetting)
Gross amountsoffset in
accordance withthe offsetting
criteria
Net amountpresented in
statements offinancialposition
[a-b]
Effect of remaining rights of set-off (including rights to set off financial collateral) that do not meet PAS 32
offsetting criteria
Net exposure[c-d]
Financialinstruments
Fair value offinancialcollateral
[a] [b] [c] [d] [e]Derivative liabilities P=216,636 P=– P=216,636 P=465 P=250,830 P=–Securities sold under
agreements to repurchase(Notes 9 and 19)* 12,806,499 – 12,806,499 – 15,941,143 –
Total P=13,023,135 P=– P=13,023,135 P=465 P=16,191,973 P=–* Included in bills and acceptances payable in the statements of financial position
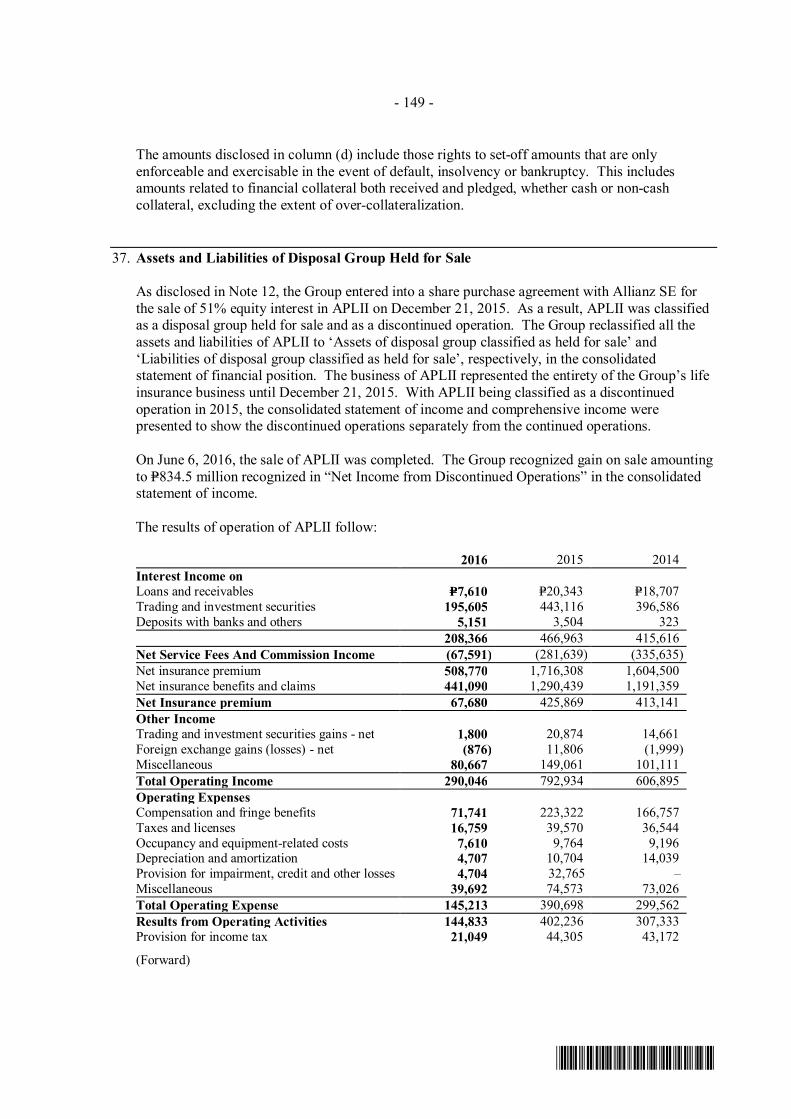
- 149 -
*SGVFS021357*
The amounts disclosed in column (d) include those rights to set-off amounts that are onlyenforceable and exercisable in the event of default, insolvency or bankruptcy. This includesamounts related to financial collateral both received and pledged, whether cash or non-cashcollateral, excluding the extent of over-collateralization.
37. Assets and Liabilities of Disposal Group Held for Sale
As disclosed in Note 12, the Group entered into a share purchase agreement with Allianz SE forthe sale of 51% equity interest in APLII on December 21, 2015. As a result, APLII was classifiedas a disposal group held for sale and as a discontinued operation. The Group reclassified all theassets and liabilities of APLII to ‘Assets of disposal group classified as held for sale’ and‘Liabilities of disposal group classified as held for sale’, respectively, in the consolidatedstatement of financial position. The business of APLII represented the entirety of the Group’s lifeinsurance business until December 21, 2015. With APLII being classified as a discontinuedoperation in 2015, the consolidated statement of income and comprehensive income werepresented to show the discontinued operations separately from the continued operations.
On June 6, 2016, the sale of APLII was completed. The Group recognized gain on sale amountingto P=834.5 million recognized in “Net Income from Discontinued Operations” in the consolidatedstatement of income.
The results of operation of APLII follow:
2016 2015 2014Interest Income onLoans and receivables P=7,610 P=20,343 P=18,707Trading and investment securities 195,605 443,116 396,586Deposits with banks and others 5,151 3,504 323
208,366 466,963 415,616Net Service Fees And Commission Income (67,591) (281,639) (335,635)Net insurance premium 508,770 1,716,308 1,604,500Net insurance benefits and claims 441,090 1,290,439 1,191,359Net Insurance premium 67,680 425,869 413,141Other IncomeTrading and investment securities gains - net 1,800 20,874 14,661Foreign exchange gains (losses) - net (876) 11,806 (1,999)Miscellaneous 80,667 149,061 101,111Total Operating Income 290,046 792,934 606,895Operating ExpensesCompensation and fringe benefits 71,741 223,322 166,757Taxes and licenses 16,759 39,570 36,544Occupancy and equipment-related costs 7,610 9,764 9,196Depreciation and amortization 4,707 10,704 14,039Provision for impairment, credit and other losses 4,704 32,765 –Miscellaneous 39,692 74,573 73,026Total Operating Expense 145,213 390,698 299,562Results from Operating Activities 144,833 402,236 307,333Provision for income tax 21,049 44,305 43,172
(Forward)

- 150 -
*SGVFS021357*
2016 2015 2014Results from Operating Activities, net of tax P=123,784 P=357,931 P=264,161Gain on Sale of Discontinued Operation 834,535 – –Transaction Costs 153,307 – –Provision for Income Tax 185,449 – –Net Income from Discontinued Operations P=619,563 P=357,931 P=264,161
Attributable to:Equity holders of the Parent Company P=594,806 P=286,345 P=211,328Non-controlling interests 24,757 71,586 52,833
P=619,563 P=357,931 P=264,161
The major classes of assets and liabilities of APLII classified as disposal group held for sale toequity holders of the Parent follows:
2016 2015AssetsCash and other cash items P=546,621 P=642,544Financial assets at fair value through profit or loss 14,506,651 13,634,687AFS investments 7,922,461 7,468,653HTM investments 1,254,898 1,269,398Other receivables 473,259 437,210Property and equipment - net 31,931 29,546Other assets 41,791 44,719
P=24,777,612 P=23,526,757
LiabilitiesFinancial liabilities at fair value through profit or loss: P=14,475,772 P=13,725,321Accrued taxes, interest and other expenses 76,938 161,817Insurance contract liability 7,097,270 6,837,144Other liabilities 577,348 728,339
P=22,227,328 P=21,452,621
Net assets of disposal group held for sale 2,550,284 2,074,136
Amounts included in accumulated OCI:Net unrealized gain on AFS investments P=34,876 (P=115,430)Remeasurement losses on retirement plan (18,070) (18,070)
P=16,806 (P=133,500)
Cash flows from (used in) discontinued operations follow:
2016 2015 2014The net cash flows directly associated with
disposal group:Operating P=171,535 P=1,210,588 P=1,535,951Investing (267,458) (903,161) (1,395,508)
(P=95,923) P=307,427 P=140,443

- 151 -
*SGVFS021357*
38. Notes to Statements of Cash Flows
The Group applied creditable withholding taxes against its income tax payable amounting toP=882.2 million, P=504.0 million and P=582.6 million in 2016, 2015 and 2014, respectively.The Parent Company applied creditable withholding taxes against its income tax payableamounting to P=869.9 million, P=498.3 million and P=566.3 million in 2016, 2015, and 2014,respectively.
In 2015, the Group classified APLII as disposal group held for sale and as discontinued operationand classified assets, liabilities, and reserves of APLII amounting to P=23.5 billion, P=21.5 billion,and P=0.1 billion, respectively, as held for sale.
In 2014, the Group and the Parent Company reclassified some of its AFS investment securities,which were previously classified as HTM investments, back to its original classificationamounting to P=22.7 billion and P=21.3 billion, respectively (Note 9).
In 2014, properties with carrying value of P=3.0 million were reclassified by the Parent Companyfrom property and equipment to investment property while P=74.0 million were reclassified by theGroup from investment property to property and equipment (Notes 11 and 13).
In 2015, the Group transferred investment properties with a carrying value of P=2.0 billion andP=1.2 billion to property and equipment and to Other Assets (presented as ‘Real Estate InvestmentsHeld under Development’), respectively.
In 2016, the Group and the Parent Company reclassified certain properties from ‘Property andequipment’ to ‘Investment property’ with aggregate carrying amount of P=4.7 billion andP=3.2 billion, respectively. These properties mainly consist of the office spaces in the Allied BankCenter in Makati leased out and land in Buendia, Makati being held for future development.
For the Group, investment properties acquired through foreclosure and rescission amounted toP=0.7 billion, P=0.5 billion and P=1.3 billion in 2016, 2015 and 2014, respectively. For the ParentCompany, investment properties acquired through foreclosure and rescission amounted toP=0.6 billion, P=0.4 billion, and P=1.2 billion in 2016, 2015 and 2014, respectively.
In 2016, collections booked under accounts payable from sold and turned over units pertaining tothe joint venture with EPPI amounting to P=174.9 million were applied against receivables for soldreal estate inventories held for sale with carrying value of P=422.3 million. The Group and theParent Company also recognized sales contract receivables amounting to P=459.1 million for theremaining unpaid balance for the said units. The resulting gain from the transaction amounted toP=211.7 million.
In 2016, the Group and the Parent Company applied transferred payables from Maybankamounting to P=1.8 billion under bills payable and P=1.6 billion under accrued interest payableagainst the principal and accrued interest components of the transferred receivables.
Interest income of the Group includes fair value amortization of loans and receivables amountingto P=9.2 million, P=16.9 million, and P=27.5 million in 2016, 2015 and 2014, respectively.
Interest expense of the Group includes fair value amortization of deposit liabilities amounting toP=30.3 million, P=80.4 million, and P=249.7 million in 2016, 2015 and 2014, respectively.

- 152 -
*SGVFS021357*
Depreciation and amortization expenses include fair value amortization of property andequipment, investment properties and intangible assets amounting to P=338.6 million,P=352.4 million and P=648.9 million in 2016, 2015 and 2014, respectively.
39. Approval of the Release of the Financial Statements
The accompanying financial statements of the Group and of the Parent Company were authorizedfor issue by the Parent Company’s BOD on February 24, 2017.
40. Report on the Supplementary Information Required Under Revenue Regulations (RR)No. 15-2010
On November 25, 2010, the Bureau of Internal Revenue issued Revenue Regulations (RR)15-2010 to amend certain provisions of RR 21-2002. The Regulations provide that starting 2010the notes to financial statements shall include information on taxes, duties and license fees paid oraccrued during the taxable year.
The Parent Company paid or accrued the following types of taxes for the tax period January toDecember 2016 (in absolute amounts).
1. Taxes and licensesAmount
Gross receipts tax P=1,094,128,139Documentary stamp taxes 1,585,000,000Real estate tax 139,145,101Local taxes 47,910,475Others 93,269,874
P=2,959,453,589
2. Withholdings taxes
Remitted OutstandingWithholding Taxes on Compensation and Benefits P=1,076,620,698 P=175,968,775Final income taxes withheld on interest on deposits and
yield on deposit substitutes 351,743,603 38,607,512Expanded withholding taxes 164,229,237 14,294,521VAT withholding taxes 2,488,464 262,670Other Final Taxes 63,218,988 2,678,612
P=1,658,300,990 P=231,812,090
Tax Cases and AssessmentsAs of December 31, 2016, the Parent Company has no final tax assessment but has outstandingcases filed in courts for various claims for tax refund. Management is of the opinion that theultimate outcome of these cases will not have a material impact on the financial statements of theParent Company.

*SGVFS021357*
INDEPENDENT AUDITOR’S REPORTON SUPPLEMENTARY SCHEDULES
The Stockholders and the Board of DirectorsPhilippine National BankPNB Financial CenterPresident Diosdado Macapagal BoulevardPasay City, Metro Manila
We have audited in accordance with Philippine Standards on Auditing, the consolidated financialstatements of Philippine National Bank (the Bank) and its subsidiaries (the Group) as atDecember 31, 2016 and 2015 and for each of the three years in the period ended December 31, 2016, andhave issued our report thereon dated February 24, 2017. Our audits were made for the purpose of formingan opinion on the basic financial statements taken as a whole. The schedules listed in the Index to theFinancial Statements and Supplementary Schedules are the responsibility of the Bank’s management.These schedules are presented for purposes of complying with Securities Regulation Code Rule 68, AsAmended (2011), and are not part of the basic financial statements. These schedules have been subjectedto the auditing procedures applied in the audit of the basic financial statements and, in our opinion, fairlystate, in all material respects, the financial data required to be set forth therein in relation to the basicfinancial statements taken as a whole.
SYCIP GORRES VELAYO & CO.
Vicky Lee SalasPartnerCPA Certificate No. 86838SEC Accreditation No. 0115-AR-4 (Group A), May 1, 2016, valid until May 1, 2019Tax Identification No. 129-434-735BIR Accreditation No. 08-001998-53-2015, March 17, 2015, valid until March 16, 2018PTR No. 5908709, January 3, 2017, Makati City
February 24, 2017
SyCip Gorres Velayo & Co.6760 Ayala Avenue1226 Makati CityPhilippines
Tel: (632) 891 0307Fax: (632) 819 0872ey.com/ph
BOA/PRC Reg. No. 0001, December 14, 2015, valid until December 31, 2018SEC Accreditation No. 0012-FR-4 (Group A), November 10, 2015, valid until November 9, 2018
A member firm of Ernst & Young Global Limited

PHILIPPINE NATIONAL BANK AND SUBSIDIARIESINDEX TO THE FINANCIAL STATEMENTS AND SUPPLEMENTARY SCHEDULES
DECEMBER 31, 2016
Part ISchedule Content Page No.
A Reconciliation of retained earnings available for dividend declaration 1B Effective standards and interpretations under Philippine Financial Reporting
Standards 2C Map of relationships of the companies within the Group 7
Part II
A Financial AssetsFinancial assets at fair value through profit or loss (FVPL)Available-for-sale (AFS) investmentsHeld-to-maturity (HTM) investmentsLoans and receivables 8
B Amounts Receivable from Directors, Officers, Employees, Related Parties andPrincipal Stockholders (Other than Related Parties) 15
C Amounts Receivable from Related Parties which are eliminated during theconsolidation of financial statements 16
D Intangible Assets - Other Assets 17E Long-Term Debt 18F Indebtedness to Related Parties (included in the consolidated statement of financial
position) 19G Guarantees of Securities of Other Issuers 20H Capital Stock 21
Part III Financial Ratios 22

1
PART IPHILIPPINE NATIONAL BANK (PARENT COMPANY)
SCHEDULE ARECONCILIATION OF RETAINED EARNINGSAVAILABLE FOR DIVIDEND DECLARATION
DECEMBER 31, 2016(In thousands)
Retained Earnings, January 1, 2016 as unadjusted P=24,799,358
Less: Adjustments (see adjustments in previous year’s reconciliation):Appraisal increment closed to capital on quasi-reorganization P=7,691,808Deferred tax assets 5,218,148Fair value adjustment on foreclosed properties - net gain 4,700,400Accumulated equity in net earnings of subsidiaries and an associate 2,580,260Accretion on impaired accounts 1,888,894Translation adjustment applied to deficit on quasi-reorganization 1,315,685Accumulated equity in net earnings applied to deficit on quasi-
reorganization 563,04823,958,243
(23,958,243)Retained Earnings, as adjusted, beginning 841,115
Add: Net income per audited financial statements 7,147,566
Less: Non-actual/unrealized income net of taxGain on remeasurement of a previously held interest 1,644,339Unrealized foreign exchange gain- net (except those attributable to
cash and cash equivalents) 1,208,521Equity in net income of subsidiaries and an associate 255,292Gain on foreclosure on investment properties for the period 128,927Accretion income of impaired loans 103,715Benefits from gross deferred tax assets 97,254Accretion on off market transactions - sales contract receivables 96,701Subtotal 3,534,749
Net income actually earned during the period 3,612,817
Less: Dividends declared (1,249,140)Appropriation to surplus reserves (19,395)
Total Retained Earnings, End Available for Dividend,December 31, 2016 P=3,185,397
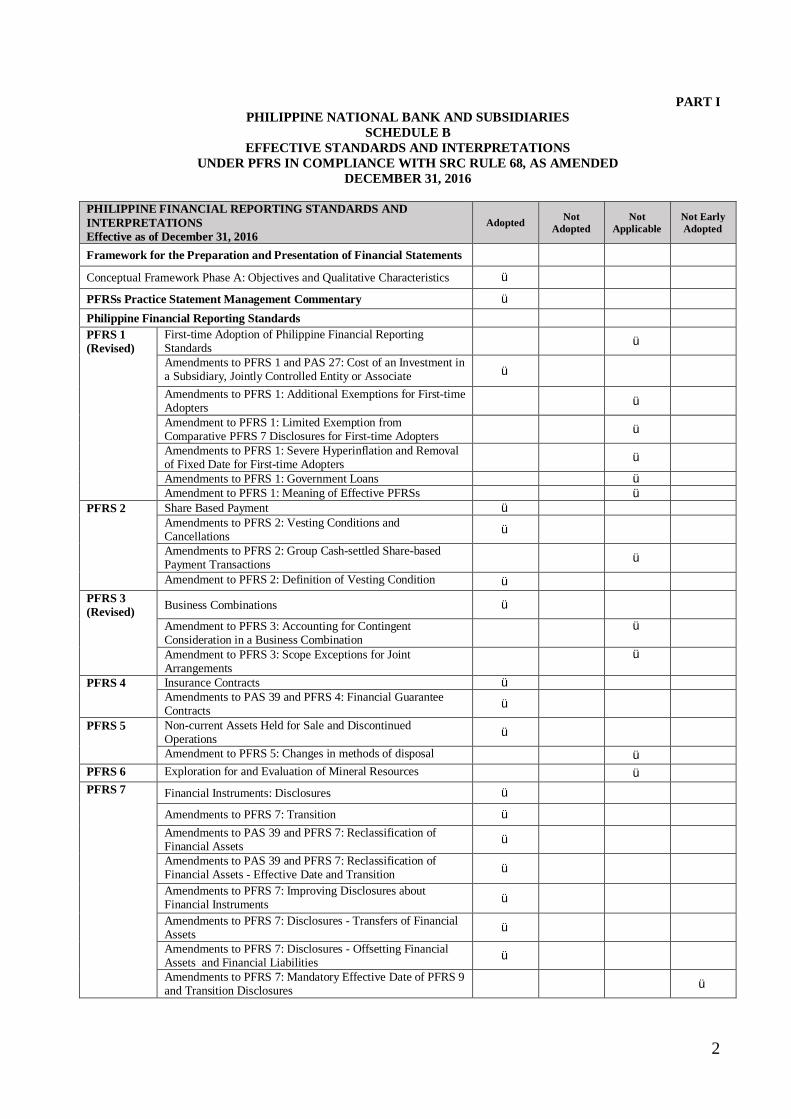
2
PART IPHILIPPINE NATIONAL BANK AND SUBSIDIARIES
SCHEDULE BEFFECTIVE STANDARDS AND INTERPRETATIONS
UNDER PFRS IN COMPLIANCE WITH SRC RULE 68, AS AMENDEDDECEMBER 31, 2016
PHILIPPINE FINANCIAL REPORTING STANDARDS ANDINTERPRETATIONSEffective as of December 31, 2016
Adopted NotAdopted
NotApplicable
Not EarlyAdopted
Framework for the Preparation and Presentation of Financial Statements
Conceptual Framework Phase A: Objectives and Qualitative Characteristics ü
PFRSs Practice Statement Management Commentary ü
Philippine Financial Reporting StandardsPFRS 1(Revised)
First-time Adoption of Philippine Financial ReportingStandards ü
Amendments to PFRS 1 and PAS 27: Cost of an Investment ina Subsidiary, Jointly Controlled Entity or Associate ü
Amendments to PFRS 1: Additional Exemptions for First-timeAdopters ü
Amendment to PFRS 1: Limited Exemption fromComparative PFRS 7 Disclosures for First-time Adopters ü
Amendments to PFRS 1: Severe Hyperinflation and Removalof Fixed Date for First-time Adopters ü
Amendments to PFRS 1: Government Loans üAmendment to PFRS 1: Meaning of Effective PFRSs ü
PFRS 2 Share Based Payment üAmendments to PFRS 2: Vesting Conditions andCancellations ü
Amendments to PFRS 2: Group Cash-settled Share-basedPayment Transactions ü
Amendment to PFRS 2: Definition of Vesting Condition ü
PFRS 3(Revised) Business Combinations ü
Amendment to PFRS 3: Accounting for ContingentConsideration in a Business Combination
ü
Amendment to PFRS 3: Scope Exceptions for JointArrangements
ü
PFRS 4 Insurance Contracts üAmendments to PAS 39 and PFRS 4: Financial GuaranteeContracts ü
PFRS 5 Non-current Assets Held for Sale and DiscontinuedOperations ü
Amendment to PFRS 5: Changes in methods of disposal üPFRS 6 Exploration for and Evaluation of Mineral Resources üPFRS 7 Financial Instruments: Disclosures ü
Amendments to PFRS 7: Transition ü
Amendments to PAS 39 and PFRS 7: Reclassification ofFinancial Assets ü
Amendments to PAS 39 and PFRS 7: Reclassification ofFinancial Assets - Effective Date and Transition ü
Amendments to PFRS 7: Improving Disclosures aboutFinancial Instruments ü
Amendments to PFRS 7: Disclosures - Transfers of FinancialAssets ü
Amendments to PFRS 7: Disclosures - Offsetting FinancialAssets and Financial Liabilities ü
Amendments to PFRS 7: Mandatory Effective Date of PFRS 9and Transition Disclosures ü

3
PHILIPPINE FINANCIAL REPORTING STANDARDS ANDINTERPRETATIONSEffective as of December 31, 2016
Adopted NotAdopted
NotApplicable
Not EarlyAdopted
Amendments to PFRS 7: Additional hedge accountingdisclosures (and consequential amendments) resulting fromthe introduction of the hedge accounting chapter in PFRS 9
ü
Amendments to PFRS 7: Servicing Contracts ü
Amendments to PFRS 7: Applicability of the Amendments toPFRS 7 to Condensed Interim Financial Statements ü
PFRS 8 Operating Segments üAmendments to PFRS 8: Aggregation of Operating Segmentsand Reconciliation of the Total of the Reportable Segments’Assets to the Entity’s Assets
ü
PFRS 9 Financial Instruments üFinancial Instruments: Classification and Measurement ofFinancial Assets ü
Financial Instruments: Classification and Measurement ofFinancial Liabilities ü
Amendments to PFRS 9: Mandatory Effective Date of PFRS 9and Transition Disclosures ü
Reissue to incorporate a hedge accounting chapter and permitearly application of the requirements for presenting in othercomprehensive income the “own credit” gains or losses onfinancial liabilities designated under the fair value optionwithout early applying the other requirements of PFRS 9
ü
Financial Instruments (final version), incorporatingrequirements for classification and measurement, impairment,general hedge accounting and derecognition
ü
PFRS 10 Consolidated Financial Statements ü
Amendments to PFRS 10: Transition Guidance ü
Amendments to PFRS 10: Investment Entities ü
Amendments to PFRS 10 and PAS 28: Sale or Contribution ofAssets Between an Investor and its Associate or Joint Venture ü
Amendments to PFRS 10: Investment Entities – Applying theConsolidation Exception ü
PFRS 11 Joint Arrangements ü
Amendments to PFRS 11: Transition Guidance ü
Amendments to PFRS 11: Accounting for Acquisitions ofInterests in Joint Operations ü
PFRS 12 Disclosure of Interest in Other Entities ü
Amendments to PFRS 12: Transition Guidance ü
Amendments to PFRS 12: Investment Entities - Applying theConsolidation Exception ü
PFRS 13 Fair Value Measurements ü
Amendment to PFRS 13: Short-term Receivables andPayables ü
Amendment to PFRS 13: Portfolio Exception ü
PFRS 14 Regulatory Deferral Accounts üIFRS 15 Revenue from contracts with customers üIFRS 16 Leases ü
Philippine Accounting StandardsPAS 1(Revised)
Presentation of Financial Statements ü
Amendment to PAS 1: Capital Disclosure ü
Amendments to PAS 32 and PAS 1: Puttable FinancialInstruments and Obligations Arising on Liquidation ü
Amendments to PAS 1: Presentation of Items of OtherComprehensive Income ü

4
PHILIPPINE FINANCIAL REPORTING STANDARDS ANDINTERPRETATIONSEffective as of December 31, 2016
Adopted NotAdopted
NotApplicable
Not EarlyAdopted
Amendments to PFRS 10: Investment Entities – Applyingthe consolidation exception ü
Amendments to PAS 1: Disclosure Initiative üPAS 2 Inventories üPAS 7 Statement of Cash Flows üPAS 8 Accounting Policies, Changes in Accounting Estimates and
Errors ü
PAS 10 Events after the Reporting Period ü
PAS 11 Construction Contracts üPAS 12 Income Taxes ü
Amendment to PAS 12 - Deferred Tax: Recovery ofUnderlying Assets ü
PAS 16 Property, Plant and Equipment üAmendment to PAS 16: Revaluation Method – ProportionateRestatement of Accumulated Depreciation on Revaluation ü
Amendments to PAS 16 and PAS 38: Clarification ofAcceptable Methods of Depreciation and Amortization ü
Amendments to PAS 16 and PAS 41, Agriculture: BearerPlants ü
PAS 17 Leases üPAS 18 Revenue üPAS 19 (Amended)
Employee Benefits üAmendments to PAS 19: Actuarial Gains and Losses, GroupPlans and Disclosures ü
Amendments to PAS 19: Defined Benefit Plans: EmployeeContribution ü
Amendments to PAS 19: Discount Rate: Regional MarketIssue ü
PAS 20 Accounting for Government Grants and Disclosure ofGovernment Assistance ü
PAS 21 The Effects of Changes in Foreign Exchange Rates ü
Amendment: Net Investment in a Foreign Operation ü
PAS 23(Revised) Borrowing Costs ü
PAS 24(Revised) Related Party Disclosures ü
PAS 26 Accounting and Reporting by Retirement Benefit Plans üPAS 27(Amended) Separate Financial Statements ü
Amendments for investment entities ü
Amendments to PAS 27: Equity Method in SeparateFinancial Statements ü
PAS 28(Amended) Investments in Associates ü
Amendments to PAS 28: Investment Entities – Applying theConsolidation Exception ü
PAS 29 Financial Reporting in Hyperinflationary Economies ü
PAS 32 Financial Instruments: Disclosure and Presentation ü
Amendments to PAS 32 and PAS 1: Puttable FinancialInstruments and Obligations Arising on Liquidation ü
Amendment to PAS 32: Classification of Rights Issues ü
Amendments to PAS 32: Offsetting Financial Assets andFinancial Liabilities ü
PAS 33 Earnings per Share üPAS 34 Interim Financial Reporting ü
Amendment to PAS 34: Disclosure of information‘Elsewhere in the Interim financial report’ ü
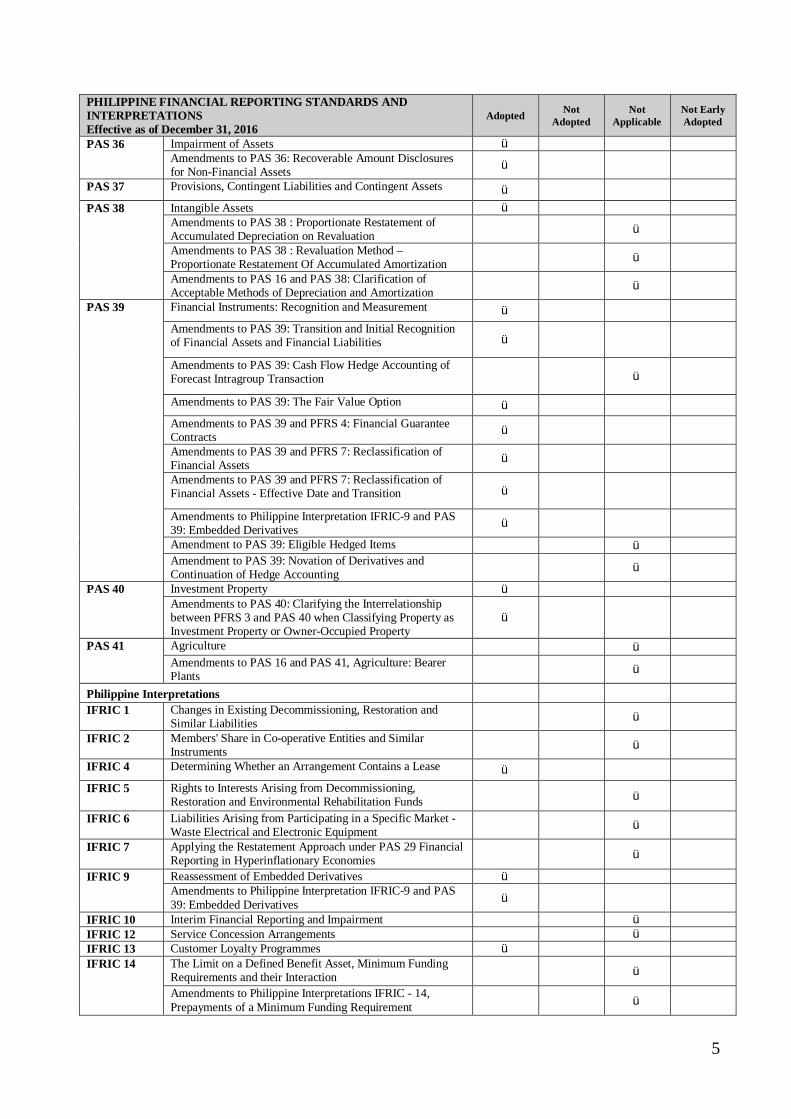
5
PHILIPPINE FINANCIAL REPORTING STANDARDS ANDINTERPRETATIONSEffective as of December 31, 2016
Adopted NotAdopted
NotApplicable
Not EarlyAdopted
PAS 36 Impairment of Assets üAmendments to PAS 36: Recoverable Amount Disclosuresfor Non-Financial Assets ü
PAS 37 Provisions, Contingent Liabilities and Contingent Assets ü
PAS 38 Intangible Assets üAmendments to PAS 38 : Proportionate Restatement ofAccumulated Depreciation on Revaluation ü
Amendments to PAS 38 : Revaluation Method –Proportionate Restatement Of Accumulated Amortization ü
Amendments to PAS 16 and PAS 38: Clarification ofAcceptable Methods of Depreciation and Amortization ü
PAS 39 Financial Instruments: Recognition and Measurement ü
Amendments to PAS 39: Transition and Initial Recognitionof Financial Assets and Financial Liabilities ü
Amendments to PAS 39: Cash Flow Hedge Accounting ofForecast Intragroup Transaction ü
Amendments to PAS 39: The Fair Value Option ü
Amendments to PAS 39 and PFRS 4: Financial GuaranteeContracts ü
Amendments to PAS 39 and PFRS 7: Reclassification ofFinancial Assets ü
Amendments to PAS 39 and PFRS 7: Reclassification ofFinancial Assets - Effective Date and Transition ü
Amendments to Philippine Interpretation IFRIC-9 and PAS39: Embedded Derivatives ü
Amendment to PAS 39: Eligible Hedged Items üAmendment to PAS 39: Novation of Derivatives andContinuation of Hedge Accounting ü
PAS 40 Investment Property üAmendments to PAS 40: Clarifying the Interrelationshipbetween PFRS 3 and PAS 40 when Classifying Property asInvestment Property or Owner-Occupied Property
ü
PAS 41 Agriculture üAmendments to PAS 16 and PAS 41, Agriculture: BearerPlants ü
Philippine InterpretationsIFRIC 1 Changes in Existing Decommissioning, Restoration and
Similar Liabilities ü
IFRIC 2 Members' Share in Co-operative Entities and SimilarInstruments ü
IFRIC 4 Determining Whether an Arrangement Contains a Lease ü
IFRIC 5 Rights to Interests Arising from Decommissioning,Restoration and Environmental Rehabilitation Funds ü
IFRIC 6 Liabilities Arising from Participating in a Specific Market -Waste Electrical and Electronic Equipment ü
IFRIC 7 Applying the Restatement Approach under PAS 29 FinancialReporting in Hyperinflationary Economies ü
IFRIC 9 Reassessment of Embedded Derivatives üAmendments to Philippine Interpretation IFRIC-9 and PAS39: Embedded Derivatives ü
IFRIC 10 Interim Financial Reporting and Impairment üIFRIC 12 Service Concession Arrangements üIFRIC 13 Customer Loyalty Programmes üIFRIC 14 The Limit on a Defined Benefit Asset, Minimum Funding
Requirements and their Interaction ü
Amendments to Philippine Interpretations IFRIC - 14,Prepayments of a Minimum Funding Requirement ü

6
PHILIPPINE FINANCIAL REPORTING STANDARDS ANDINTERPRETATIONSEffective as of December 31, 2016
Adopted NotAdopted
NotApplicable
Not EarlyAdopted
IFRIC 15 Agreements for the Construction of Real Estate ü
IFRIC 16 Hedges of a Net Investment in a Foreign Operation ü
IFRIC 17 Distributions of Non-cash Assets to Owners üIFRIC 18 Transfers of Assets from Customers üIFRIC 19 Extinguishing Financial Liabilities with Equity Investment ü
IFRIC 20 Stripping Costs in the Production Phase of a Surface Mine ü
IFRIC 21 Levies ü
SIC - 7 Introduction of the Euro üSIC - 10 Government Assistance - No Specific Relation to Operating
Activities ü
SIC - 13 Jointly Controlled Entities - Non Monetary Contributions byVenturers ü
SIC - 15 Operating Leases - Incentives üSIC - 27 Evaluating the Substance of Transactions Involving the
Legal Form of a Lease ü
SIC - 29 Service Concession Arrangements: Disclosures üSIC - 31 Revenue - Barter Transactions Involving Advertising
Services ü
SIC - 32 Intangible Assets - Web Site Costs ü
Standards and Interpretations applicable to annual periods beginning on or after January 1,2017 will be adopted by the Group asthey become effective.

7
PART IPHILIPPINE NATIONAL BANK AND SUBSIDIARIES
SCHEDULE CMAP OF RELATIONSHIPS OF THE COMPANIES WITHIN THE GROUP
DECEMBER 31, 2016

8
PART IIPHILIPPINE NATIONAL BANK AND SUBSIDIARIES
SCHEDULE A – FINANCIAL ASSETSDECEMBER 31, 2016
Financial Assets at Fair Value through Profit or Loss(Amounts in thousands, except for number of shares)
Name of Issuing Entity and Association of each IssueNumber of
Shares
PrincipalAmount ofBonds and
Notes
Amount shownin the Balance
Sheet based onBid Prices as of
Balance SheetDate
IncomeReceived and
Accrued
Government securitiesRepublic of the Philippines (ROP) Bonds – P=1,097,022 P=1,259,709 P=23,386Fixed Rate Treasury Notes – 31,085 32,164 36,150
Retail Treasury Bonds – 10,586 11,472 5,808
Power Sector Assets & Liabilities Mgt Corp – 8,701 10,055 542Republic of the Indonesia – – – 1,012
US Treasury Notes – – – 44
– 1,147,394 1,313,400 66,942
Private Debt SecuritiesSM Investments Corporation – 74,580 76,201 3,696
International Container Terminal Services Inc – 32,467 36,403 2,741Ayala Land Inc – 7,550 7,902 977
Fil-Invest Land Inc – 80 83 7
Filinvest Development Cayman Islands – – – 388San Miguel Global Power Holdings Corp – – – 403SM Prime Holdings Inc. – – – 338Export-Import Bank of Korea – – – 4
– 114,677 120,589 8,553
Equity SecuritiesAlco Preferred 7,000 – 718 –Alliance Global Group Inc 60,000 – 767 –Ayala Corporation 10,000 – 7,305 –Ayala Land Inc 70,000 – 2,240 –Cosco Capital, Inc 150,000 – 1,275 –DMCI Holdings Inc 500,000 – 6,630 –Emperador Inc 80,000 – 560 –Filinvest Land, Inc. 200,000 – 306 –First Metro Phil Equity Exchange 7,000 – 791 –First Phil Holdings 10,000 – 679 –Forest Hills Golf and Country Club 1 – 170 –Global Ferro 31,127 – 89 –GT Cap Preferred Series B 1,000 – 1,020 –GT Capital Holdings, Inc. 500 – 635 –Manila Electric Co 20,000 – 5,300 –Manila Water Company, Inc. 25,000 – 725 –

9
Name of Issuing Entity and Association of each IssueNumber of
Shares
PrincipalAmount ofBonds and
Notes
Amount shownin the Balance
Sheet based onBid Prices as of
Balance SheetDate
IncomeReceived and
AccruedPetro Energy Resources Corp 6,289 – 26 –
PLDT Common Shares 7,500 – 10,239 –PNOC Energy Development Corporation 1,230,000 – 6,335 –Resorts World Manila 810,000 – 2,665 –
San Miguel Corp - Preferred 2G 4,100 – 326 –San Miguel Corp - Preferred 2H 26,000 – 2,003 –San Miguel Corp - Preferred 2I 25,970 – 2,026 –
Security Bank Corp 9,000 – 1,710 –Universal Rightfield Prop. Inc. 2,883,000 – 69 –
6,173,487 – 54,609 –
DerivativesAllied Bank Hong Kong – – 303 –Australia and New Zealand Bank Manila – 1,245,850 2,429 –Ban Kee Trading, Inc. – 14,952 3 –Banco De Oro Universal Bank – 2,742,575 7,576 –Bank of Tokyo Mitsubishi UFJ – 1,988,800 11,612 –Bank of Tokyo-Mitsubishi Manila – 500,950 2,440 –BNP Paribas Paris – 1,105,082 10,538 –Chase Manhattan Bank London – 19,221 92 –Citibank N.A. Manila Br. – 4,243,358 16,769 –GETZ Advanced Materials, Inc. – 7,260 23 –Hong Kong and Shanghai Banking Corp – 49,810 92 –I-Remit Inc. – 5,756 0 –Land Bank of the Philippines – 49,810 92 –Metropolitan Bank and Trust Company – 99,620 184 –Mizuho Bank Limited Manila – 747,075 1,047 –Petron Corporation – 4,735,175 10,380 –Philippine Long Distance Telephone Co. – 2,436,280 29,195 –PNB International Investments Corporation – 49,933 243 –PNB Remittance Center Canada – 18,450 34 –Republic of the Philippines – 15,234,457 61,545 –Robinsons Bank Corporation – 499,145 1,964 –Standard Chartered Bank – 599,844 3,157 –Standard Chartered Bank London – 6,047,764 227,979 –Wells Fargo Bank NA – 4,804,430 31,425 –
– 47,245,597 419,122 –
Designated at FVPLUnit Investment Trust Fund – PNB Peso Money Market
Fund 5,390,918 6,049 6,144 –Total Financial Assets at Fair Value
through Profit or Loss P=11,564,405 P=48,513,717 P=1,913,864 P=75,495

10
PART IIAvailable-for-Sale (AFS) Securities(Amounts in thousands, except for number of shares)
Name of Issuing Entity and Association of each IssueNumber of
Shares
PrincipalAmount ofBonds and
Notes
Amount shownin the Balance
Sheet based onBid Prices as of
Balance SheetDate
IncomeReceived
andAccrued
Government securitiesBangko Sentral ng Pilipinas – P=163,658 P=221,010 P=4,086Development Bank of the Philippines – 2,172,217 2,394,652 25,891Fixed Rate Treasury Notes – 5,455,460 5,689,853 318,214Global Peso Notes – 400,000 375,200 13,072Philippines - SGD – 74,580 79,405 28PhilippineTreasury Bills – 690,000 687,130 8,542Power Sector Assets and Liabilities Management
Corporation – 6,822,083 8,271,561 167,113
Republic of Indonesia – 2,794,438 3,025,131 288,534Republic of the Philippines (On-shore Dollar Bonds) – – 24,567 684Republic of the Philippines (ROP) Treasury Bonds – 10,576,240 12,420,267 240,347Retail Treasury Bonds – 3,622,745 3,822,873 132,039Singapore Fixed Rate Treasury Notes – 25,078 25,245 2Singapore Treasury Bills – 394,330 393,641 –Small Business Loan asset backed securities – 278,531 32,661 644Treasury Gilts – 66,961 67,352 2,038U.S. Treasury Bills – 296,132 304,009 6,117
– 33,832,453 37,834,558 1,207,351
Private Debt SecuritiesAboitiz Power – – – 598Agricultural Bank Of China – – – 6,565Apple Inc – 497,200 496,529 27,608Ayala Land Inc – 1,473,390 1,481,245 29,214Banco De Oro – 1,814,482 1,769,897 2,823Bank of China – 894,960 915,033 26,090Barclays Bank – – – 20,511BNP Paribas – 82,790 83,166 664China Construct Bank Asia – – – 4,925Deutsche Bank – – – 12,216Energy Development Corp – 1,217,488 1,341,487 47,408European Investment Bank – 21,213 21,381 49Export-Import Bank of Korea – 845,240 818,141 13,264Filinvest Development Cayman Islands – 1,731,996 1,755,915 64,150Filinvest Land Inc – 460,440 477,212 29,053First Gen Corporation – 1,258,910 1,346,757 35,779First Pacific Company – 1,544,253 1,582,134 46,234FPC Finance Limited – 678,678 709,252 18,077FPC Treasury Limited (FPC) – 49,720 49,231 3,956

11
Name of Issuing Entity and Association of each IssueNumber of
Shares
PrincipalAmount ofBonds and
Notes
Amount shownin the Balance
Sheet based onBid Prices as of
Balance SheetDate
IncomeReceived
andAccrued
FPT Finance Limited – 74,580 80,022 4,815Hongkong & Shanghai Banking Corporation Finance – 310,462 320,164 495Hongkong & Shanghai Banking Corporation Holdings – 103,487 110,804 12,688Hutchison Whampoa Limited – 1,342,440 1,377,482 18,636Industrial & Commercial Bank of China – 198,880 204,011 23,605International Container Terminal Services Inc. – 4,365,615 4,555,829 293,043JP Morgan Chase – – – 17,210Kookmin Bank – – – 2,375Korea Development Bank – 367,928 361,400 3,517Lloyds Bank – – – 2,753Manila North Tollway Corporation Bonds – 50,000 50,133 2,535Metropolitan Bank & Trust Co. – 567,100 550,602 30,397Petron Corporation – 10,000 10,000 70Philippine Long Distance Telephone Company (PLDT) – 1,174,337 1,185,422 19,575Philippine Savings Bank – 75,000 71,796 4,114PNB Prime Peso Money Market – 51,500 51,791 –Rizal commercial Banking Corp – 620,456 638,276 54,051Security Bank Corp – 119,328 123,761 6,670Sinopec Corp – 2,038,520 2,027,171 47,881SM Investments Corporation (SMIC) – 2,470,362 2,524,618 49,033SM Prime Holdings, Inc. – 261,534 269,109 11,327South Luzon Tollway Corporation – 302,700 305,760 17,862Standard Chartered Bank London – 685,603 702,188 8,202State Bank of India – 74,580 76,195 24,099Sumitomo Bank Tokyo – 248,600 248,207 5,991Westpac Bank Sydney – 149,160 148,947 5,374
– 28,232,932 28,841,070 1,055,502Equity Securities
Allied Banker Insurance 200,000 – 20,000 –Apo Golf & Country Club 1 – 2 –Asean Finance – – 3,604 –Asia Pacific Rural & Agricultural Credit AssociationTrust Fund 1 – 1,500 –
Bacnotan Steel Industries 334,499,800 – – –Baguio City Country Club 1 – 1500 –Bancnet, Inc. 49,999 – 5,000 –BAP Credit Guaranty 29,800 – 1,138 –Bulawan Mining Company 2,500,000 – – –Camp John Hay Golf Club 3 – 260 –Club Filipino 1 – 350 –Cruz Telephone Company 30 – 3 –Eagle Ridge Golf & Country Club 30 – 2,700 –Evercrest Golf Club-A 2 – 1,000 –
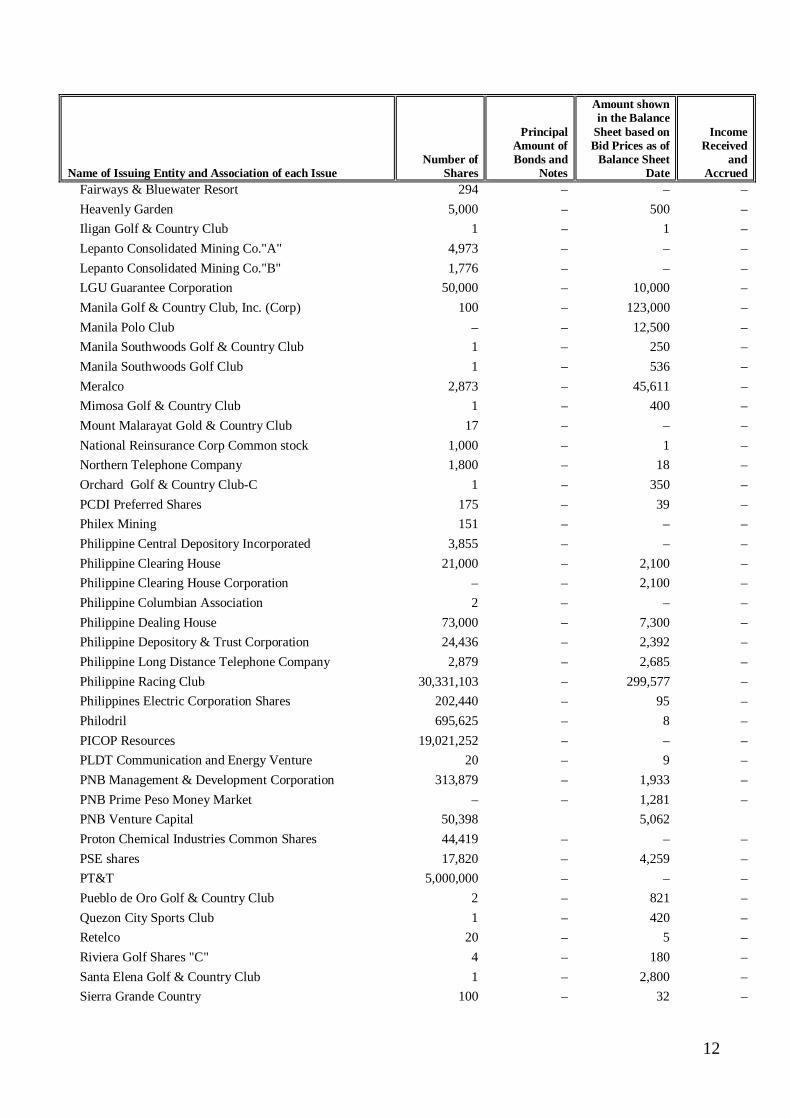
12
Name of Issuing Entity and Association of each IssueNumber of
Shares
PrincipalAmount ofBonds and
Notes
Amount shownin the Balance
Sheet based onBid Prices as of
Balance SheetDate
IncomeReceived
andAccrued
Fairways & Bluewater Resort 294 – – –Heavenly Garden 5,000 – 500 –Iligan Golf & Country Club 1 – 1 –Lepanto Consolidated Mining Co."A" 4,973 – – –Lepanto Consolidated Mining Co."B" 1,776 – – –LGU Guarantee Corporation 50,000 – 10,000 –Manila Golf & Country Club, Inc. (Corp) 100 – 123,000 –Manila Polo Club – – 12,500 –Manila Southwoods Golf & Country Club 1 – 250 –Manila Southwoods Golf Club 1 – 536 –Meralco 2,873 – 45,611 –Mimosa Golf & Country Club 1 – 400 –Mount Malarayat Gold & Country Club 17 – – –National Reinsurance Corp Common stock 1,000 – 1 –Northern Telephone Company 1,800 – 18 –Orchard Golf & Country Club-C 1 – 350 –PCDI Preferred Shares 175 – 39 –Philex Mining 151 – – –Philippine Central Depository Incorporated 3,855 – – –Philippine Clearing House 21,000 – 2,100 –Philippine Clearing House Corporation – – 2,100 –Philippine Columbian Association 2 – – –Philippine Dealing House 73,000 – 7,300 –Philippine Depository & Trust Corporation 24,436 – 2,392 –Philippine Long Distance Telephone Company 2,879 – 2,685 –Philippine Racing Club 30,331,103 – 299,577 –Philippines Electric Corporation Shares 202,440 – 95 –Philodril 695,625 – 8 –PICOP Resources 19,021,252 – – –PLDT Communication and Energy Venture 20 – 9 –PNB Management & Development Corporation 313,879 – 1,933 –PNB Prime Peso Money Market – – 1,281 –PNB Venture Capital 50,398 5,062Proton Chemical Industries Common Shares 44,419 – – –PSE shares 17,820 – 4,259 –PT&T 5,000,000 – – –Pueblo de Oro Golf & Country Club 2 – 821 –Quezon City Sports Club 1 – 420 –Retelco 20 – 5 –Riviera Golf Shares "C" 4 – 180 –Santa Elena Golf & Country Club 1 – 2,800 –Sierra Grande Country 100 – 32 –

13
Name of Issuing Entity and Association of each IssueNumber of
Shares
PrincipalAmount ofBonds and
Notes
Amount shownin the Balance
Sheet based onBid Prices as of
Balance SheetDate
IncomeReceived
andAccrued
Small Business Guarantee 400,000 – 40,000 –Southern Iloilo Telephone Company 20 – 2 –Sta. Elena Properties, Inc. "A" 4 – 12,400 –Subic Bay Yacht Club 58 – – –Tagaytay Highlands 1 – 550 –Tagaytay Midlands 1 – 500 –Ternate Dev't Corporation – – 170 –Valley Golf & Country Club – – 680 –Wack Wack Golf & Country Club 3 – 47,487 –
393,499,773 – 665,111 –
Total Available-for-Sale Securities P=393,499,773 P=62,065,385 P=67,340,739 P=2,262,857
Held to Maturity Securities(Amounts in thousands, except for number of shares)
Name of Issuing Entity and Association of each IssueNumber of
Shares
PrincipalAmount ofBonds and
Notes
Amount shownin the Balance
Sheet based onBid Prices as of
Balance SheetDate
IncomeReceived
andAccrued
Government securitiesRepublic of the Philippines (ROP) Bonds – P=14,813,577 P=17,183,357 P=615,155Retail Treasury Bonds – 2,885,515 3,115,347 136,550Fixed Rate Treasury Notes – 2,737,693 3,514,068 162,653Republic of Indonesia – 248,600 257,045 11,773Federal National Mortgage Association – 77,066 77,138 385Federal Home Loan Mortgage Corp – 22,374 22,443 136Federal Reserve – 5,081 5,081 –
Total Held to Maturity Securities – P=20,789,906 P=24,174,479 P=926,652

14
Loans and Receivables(In thousands)
Name of Issuing Entity and Association of EachIssue
PrincipalAmount ofBonds and
Notes
Amount shownin the Balance
Sheet
Valued based onDiscounted Cash
Flows at end ofReporting Period
Income Receivedand Accrued
Government Securities
Landbank of the Philippines P=124,749 P=124,749 P=124,749 P=5,435
National Food Authority 256,869 256,859 276,183 17,337
Caticlan Super Marina 101,111 101,111 101,948 4,665
Home Guaranty Corporation 14,285 14,285 14,248 453
Home Development and Mutual Fund – 57,846 57,846 1,661
497,014 554,850 574,973 29,550
Private Securities
Agricultural Bank of China Ltd HK 497,200 496,488 496,488 3,602
Bank of China Ltd Sydney 248,600 248,274 248,274 7,356
Bank of China HK 497,200 497,200 497,200 593
China Construction Bank HK 497,200 496,436 496,436 3,555Industrial & Commercial Bank of China
Sydney 497,200 496,455 496,455 6,031
Industrial & Commercial Bank of China 497,200 495,519 495,519 472
Steel Asia Manufacturing Corporation 4,255 – – –
Pilipinas Hino Incorporated 6,988 – – –
Golden Dragon Star Equities Inc./OPAL –* – – –
Global Steel (NSC) 3,676,245 – – –
6,422,088 2,730,372 2,730,372 21,610
Total Unquoted Debt Securities P=6,919,102 P=3,285,222 P=3,305,345 P=51,160*amount less than 1,000 pesos

15
PART IIPHILIPPINE NATIONAL BANK AND SUBSIDIARIES
SCHEDULE B – AMOUNTS RECEIVABLE FROM DIRECTORS, OFFICERS, EMPLOYEES, RELATED PARTIESAND PRINCIPAL STOCKHOLDERS (OTHER THAN RELATED PARTIES)
DECEMBER 31, 2016
(In thousands)
Name and Designation ofDebtor
Balance atBeginning of
Period(12/31/15) Releases
(Collections)/Movements
AmountsWritten Off Status
Balance atEnding of
Period(12/31/16) Due Dates Interest Rates Terms of Payment Collateral
SubsidiaryPNB-IBJL Leasing and Finance
CorpP=1,878,667 P=6,876,000 (P=6,740,333) P=– Current P=2,014,333 01/28/2016 to
5/20/20172.90% to 3.85% Payable within 3
yearsUnsecured
Related PartyPhilippine Airlines Inc. P=– P=1,491,600 P=– P=– Current P=1,491,600 6/12/2017 to
6/25/20173.5% – Real Estate
Victorias Milling 138,968 6,061,577 (6,018,387) – Current 182,159 1/31/2017 2.75% – –Horizon Global Investment 7,059,000 – 399,000 – Current 7,458,000 9/12/2017 3.66% Quarterly payment UnsecuredEton Properties 590,010 2,000,000 (590,010) – Current 2,000,000 5/31/2023 5.00% Quarterly payment Real EstateInterbev Philippines Inc. – 2,227 – – Current 2,227 1/27/2017 – Payable at Maturity UnsecuredLufthansa Teknik 263,536 – (226,246) – Current 37,290 1/27/2017 to
2/22/20173.38% to 3.41% Quarterly payment Unsecured
Maranaw Hotel & Resort Corp 93,000 87,000 (96,107) – Current 83,893 8/8/2023 4.75% Quarterly payment UnsecuredMajor Win Enterprises Limited 1,203,308 – (16,235) – Current 1,187,073 8/17/2027 4.16% Quarterly payment UnsecuredGolden Investments TMK 8,470,800 – (1,510,000) – Current 6,960,800 06/26/2020 4.52% – –Absolut Distillers, Inc. 350,000 200,000 (550,000) – Past Due – 01/26/2016 to
3/22/20164.50% – Unsecured
Asia Brewery – 663,864 (662,821) – Current 1,042 01/27/2017 – Payable at maturity Real EstateTanduay Distillers – 684,885 (684,885) – Current – – – –Himmel Industries – 607,112 (607,112) – Current – – – –Package World – 2,941 (2,941) – Current – – – –Foremost Farms – 2,166 (2,166) – Current – – – –Key Management Personnel 16,998 – (2,057) – Current 14,941 Various Various Payable on demand VariousOfficers 223,747 50,910 (90,966) – Current 183,691 09/30/2015 to
09/30/20360.25% to 16.5% Payable within 1
month to 25 yearsBank deposithold-out, real
estate andchattel
mortgagesP=20,288,034 P=18,730,282 (P=17,401,266) P=– P= 21,617,050
*in Peso equivalentThe related party transactions indicated above are within the ordinary course of business of the Bank and shall be settled in cash. There are no provisions for credit losses in 2015.

16
PART IIPHILIPPINE NATIONAL BANK AND SUBSIDIARIES
SCHEDULE C – AMOUNTS RECEIVABLE FROM RELATED PARTIESWHICH ARE ELIMINATED DURING THE CONSOLIDATION OF FINANCIAL STATEMENTS
DECEMBER 31, 2016
(In thousands)
Name and Designationof Debtor
Balance atBeginning of
Period(12/31/15) Releases
(Collections)/Movements
AmountsWritten Off Status
Balance atEnding of
Period(12/31/16) Due Dates Interest Rates
Terms ofPayment Collateral
PNB-IBJL Leasingand Finance Corp
P=1,878,667 P=6,876,000 (P=6,740,334) P=– Current P=2,014,333 01/04/2017 to05/20/2017
2.90% to3.85%
Payable within3 years
Unsecured
The related party transactions indicated above are within the ordinary course of business of the Bank and shall be settled in cash. There are no provisions for credit losses in 2016.

17
PHILIPPINE NATIONAL BANK AND SUBSIDIARIESSCHEDULE D – INTANGIBLE ASSETS – OTHER ASSETS
DECEMBER 31, 2016
(In thousand pesos)
DescriptionBeginning Balance
12/31/2015 AdditionsCharged to Costs and
Expenses (Amortization)Charged to Other
Accounts Other ChangesEnding Balance
12/31/2016Core deposits* P=1,348,485 P=– (P=189,779) P=– P=– P=1,158,706Customer relationship* 13,790 – (13,790) – – −Other Intangibles 1,080,603 406,053 (88,854) – 5,861 1,403,663*Acquired from business combination

18
PHILIPPINE NATIONAL BANK AND SUBSIDIARIESSCHEDULE E – LONG TERM DEBT
DECEMBER 31, 2016
(In thousands)
Type of Issue and Type of ObligationAmount Authorized
by Indenture
Amount shown undercaption "Current
Portion of Long-TermDebt” in related
balance sheet
Amount shown undercaption "Long-Term
Debt" in related balancesheet Interest Rates
Amounts orNumbers of
PeriodicInstallments Maturity Dates
Long Term Negotiable Certificates of Deposits P=5,380,000 P=– P=5,343,041 3.25%
Interest shall bepayable quarterly 6/6/2022
Long Term Negotiable Certificates of Deposits 7,000,000 – 6,967,077 4.13%
Interest shall bepayable quarterly 6/12/2020
Long Term Negotiable Certificates of Deposits 4,000,000 – 3,986,777 3.25%
Interest shall bepayable quarterly 4/22/2019
Long Term Negotiable Certificates of Deposits 5,000,000 – 4,985,977 3.00%
Interest shall bepayable quarterly 2/5/2019
Long Term Negotiable Certificates of Deposits 3,100,000 3,099,272 – 5.18%
Interest shall bepayable quarterly 2/17/2017
Unsecured Subordinated Notes 3,500,000 – 3,497,797 5.88%Interest shall be
payable quarterly 5/9/2022
Bills Payable 34,225,938 23,406,497 10,819,441 0.05% to 2.00% Various
1/5/2017 to10/9/20181/5/2021

19
PHILIPPINE NATIONAL BANK AND SUBSIDIARIESSCHEDULE F – INDEBTEDNESS TO RELATED PARTIES
DECEMBER 31, 2016(In thousand pesos)
Name of Related Parties (i) Balance at Beginning of Period Balance at Ending of Period (ii) Nature, Terms and Conditions
None to report
_____________________________________________________(i) The related parties named shall be grouped as in Schedule D. The information called shall be stated for any persons whose investments shown separately in such related schedule.(ii) For each affiliate named in the first column, explain in a note hereto the nature and purpose of any increase during the period that is in excess of 10 percent of the related balance
at either the beginning or end of the period.

20
PHILIPPINE NATIONAL BANK AND SUBSIDIARIESSCHEDULE G - GUARANTEES OF SECURITIES OF OTHER ISSUERS
DECEMBER 31, 2016
Name of issuing entity ofsecurities guaranteed by the
company for which thisstatement is filed
Title of issue of each class ofsecurities guaranteed
Total amount of guaranteedand outstanding (i)
Amount owned by person ofwhich statement is filed Nature of guarantee (ii)
None to Report
_____________________________________________________(i) Indicate in a note any significant changes since the date of the last balance sheet file. If this schedule is filed in support of consolidated financial statements, there shall be
set forth guarantees by any person included in the consolidation except such guarantees of securities which are included in the consolidated balance sheet.(ii) There must be a brief statement of the nature of the guarantee, such as “Guarantee of principal and interest”, “Guarantee of Interest”, or “Guarantee of Dividends”. If the
guarantee is of interest, dividends, or both, state the annual aggregate amount of interest or dividends so guaranteed.

21
PHILIPPINE NATIONAL BANK AND SUBSIDIARIESSCHEDULE H – CAPITAL STOCK
DECEMBER 31, 2016
(Absolute number of shares)Title of Issue (i) Number of shares
authorizedNumber of shares issued and
outstanding as shown under therelated balance sheet caption
Number of shares reservedfor options, warrants,
conversion and other rights
Number of shares heldby related parties (ii)
Directors, officersand employees
Others (iii)
Common Shares ₱1,750,000,001 ₱1,249,139,678 – – ₱14,928,214 –
Required information is contained in Note 25: Equity to the Audited Financial Statements of the Bank and Subsidiaries.
_____________________________________________________(i) Include in this column each type of issue authorized.(ii) Related parties referred to include persons for which separate financial statements are filed and those included in the consolidated financial statements, other than the issuer of
the particular security.(iii) Indicate in a note any significant changes since the date of the last balance sheet filed.
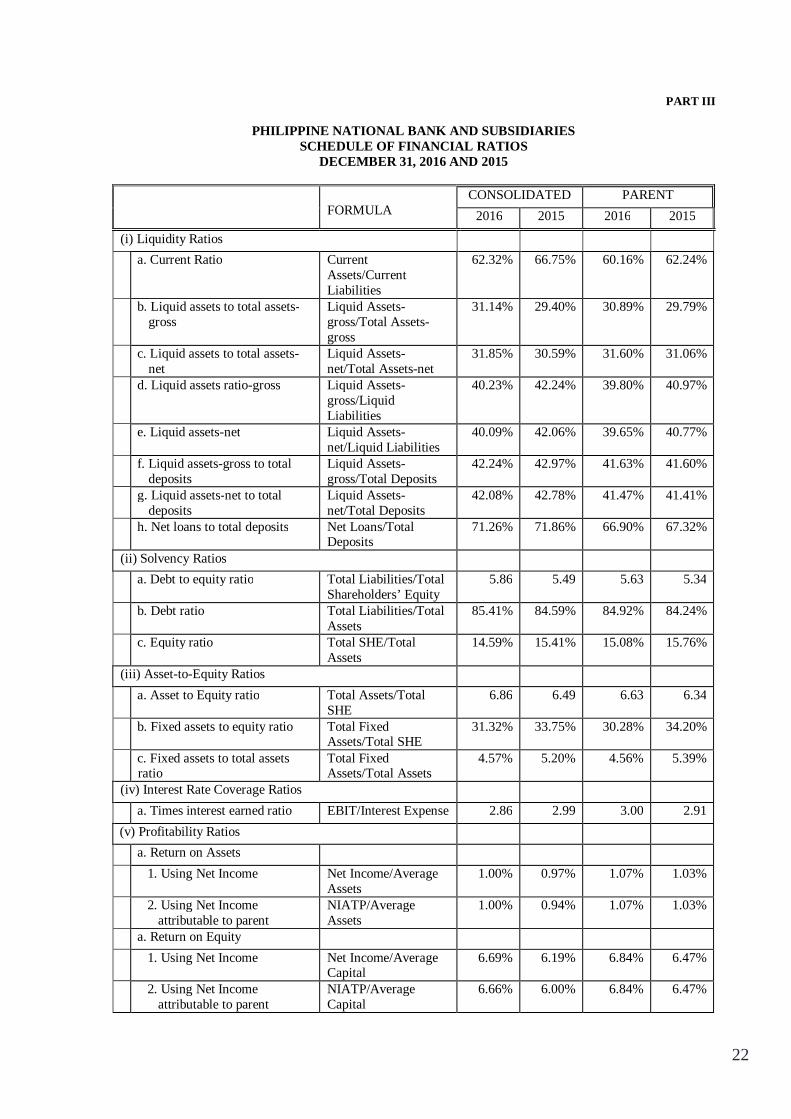
22
PART III
PHILIPPINE NATIONAL BANK AND SUBSIDIARIESSCHEDULE OF FINANCIAL RATIOS
DECEMBER 31, 2016 AND 2015
FORMULACONSOLIDATED PARENT
2016 2015 2016 2015
(i) Liquidity Ratiosa. Current Ratio Current
Assets/CurrentLiabilities
62.32% 66.75% 60.16% 62.24%
b. Liquid assets to total assets-gross
Liquid Assets-gross/Total Assets-gross
31.14% 29.40% 30.89% 29.79%
c. Liquid assets to total assets-net
Liquid Assets-net/Total Assets-net
31.85% 30.59% 31.60% 31.06%
d. Liquid assets ratio-gross Liquid Assets-gross/LiquidLiabilities
40.23% 42.24% 39.80% 40.97%
e. Liquid assets-net Liquid Assets-net/Liquid Liabilities
40.09% 42.06% 39.65% 40.77%
f. Liquid assets-gross to totaldeposits
Liquid Assets-gross/Total Deposits
42.24% 42.97% 41.63% 41.60%
g. Liquid assets-net to totaldeposits
Liquid Assets-net/Total Deposits
42.08% 42.78% 41.47% 41.41%
h. Net loans to total deposits Net Loans/TotalDeposits
71.26% 71.86% 66.90% 67.32%
(ii) Solvency Ratiosa. Debt to equity ratio Total Liabilities/Total
Shareholders’ Equity5.86 5.49 5.63 5.34
b. Debt ratio Total Liabilities/TotalAssets
85.41% 84.59% 84.92% 84.24%
c. Equity ratio Total SHE/TotalAssets
14.59% 15.41% 15.08% 15.76%
(iii) Asset-to-Equity Ratiosa. Asset to Equity ratio Total Assets/Total
SHE6.86 6.49 6.63 6.34
b. Fixed assets to equity ratio Total FixedAssets/Total SHE
31.32% 33.75% 30.28% 34.20%
c. Fixed assets to total assetsratio
Total FixedAssets/Total Assets
4.57% 5.20% 4.56% 5.39%
(iv) Interest Rate Coverage Ratiosa. Times interest earned ratio EBIT/Interest Expense 2.86 2.99 3.00 2.91
(v) Profitability Ratiosa. Return on Assets
1. Using Net Income Net Income/AverageAssets
1.00% 0.97% 1.07% 1.03%
2. Using Net Incomeattributable to parent
NIATP/AverageAssets
1.00% 0.94% 1.07% 1.03%
a. Return on Equity1. Using Net Income Net Income/Average
Capital6.69% 6.19% 6.84% 6.47%
2. Using Net Incomeattributable to parent
NIATP/AverageCapital
6.66% 6.00% 6.84% 6.47%

23
FORMULACONSOLIDATED PARENT
2016 2015 2016 2015(vi) Capital Adequacy Ratios
a. Tier I capital ratio Tier 1/Total RWA 15.80% 16.23% 11.45% 11.19%b. Capital risk asset ratio Qualifying
Capital/Total RWA16.65% 19.24% 12.31% 14.42%
(vii) Other Ratiosa. Non-performing loans ratio Non-performing
loans/Adjusted Loans2.49% 2.81% 2.41% 2.82%
b. Net interest margin Net InterestIncome/AverageEarnings Assets
3.16% 3.24% 3.01% 3.14%
c. Efficiency ratio Total OperatingExpenses/TotalOperating Income
63.81% 70.77% 64.42% 69.44%
d. Allowance for probable loanlosses* to total loans ratio
Allowance forprobable loanlosses*/Total Loans*
2.01% 1.85% 2.12% 1.96%
e. Allowance for probable loanlosses* to NPL ratio
Allowance forprobable loanlosses*/NPL
82.43% 67.46% 89.64% 70.88%
* Total loans pertain to receivables from customers.

Exhibit IPHILIPPINE NATIONAL BANK
List of Bank Owned PropertiesAs of December 31, 2016
Branch Name COMPLETE ADDRESSMetro Manila
ANGONO Quezon Ave. cor. E. Dela Paz St., Brgy. San Pedro, Angono, Rizal
ARRANQUE 1427 Citiriser Building, Soler St., Sta. Cruz, Manila
AYALA AVE. G/F, VGP Center, 6772 Ayala Avenue, Makati City
BAYANAN-MUNTINLUPA Allied Bank Building, National Road, Bayanan, Muntinlupa City
BENAVIDEZ Unit G-1D, G/F BSA Mansion, 108 Benavidez St., Legaspi Village, Makati City
BETTER LIVING 50 ABC Bldg., Doña Soledad Ave., Better Living Subd., Parañaque City
BINONDO CENTER Alliance Bldg., 410 Quintin Paredes St., Binondo, Manila
BUENDIA 56 Gil Puyat Ave., Buendia, Makati City
CALOOCAN Gen. San Miguel St., Brgy. 4, Zone 1, Sangandaan, Dist. II, Caloocan City
CALOOCAN CENTER 1716 Rizal Ave. Ext. corner L. Bustamante St., Caloocan City
CUBAO cor Gen. Araneta St. and Aurora Blvd., Cubao, Quezon City
DAPITAN 1710 Dapitan St. near cor. M. dela Fuente St., Sampaloc, Manila
DIVISORIA-STO. CRISTO 767 Sto. Cristo cor. M. delos Santos Sts., Divisoria, Manila
EARNSHAW 1357 Earnshaw corner Jhocson Sts., Sampaloc, Manila
FELIX AVENUE F. P. Felix Avenue, Brgy. San Isidro, Cainta, Rizal 1900
J. ABAD SANTOS Unit B, Dynasty Towers, J. Abad Santos corner Bambang Sts., Manila
KAMUNING 118 Kamuning Road, Quezon City
LAS PIÑAS #19 Alabang Zapote Road, Pamplona II, Las Piñas City
MAIN G/F, PNB Financial Center, Pres. Diosdado Macapagal Blvd., Pasay City
MAKATI CENTER G/F, Allied Bank Center, 6754 Ayala Ave. cor. Legazpi St., Makati City
MAKATI POBLACION 1204 JP Rizal St., corner Angono & Cardona Streets, Makati City
MAKATI-C. PALANCA G/F, Unit G1 and G2, BSA Suites, G103 C. Palanca cor. dela Rosa Sts., Makati City
MALABON F. Sevilla Blvd., Brgy. Tañong, Malabon City
MALABON-RIZAL AVE. 701 Rizal Avenue Ext., corner Magsaysay St., Malabon City
MANDALUYONG 471 Shaw Blvd., Mandaluyong City

Exhibit IPHILIPPINE NATIONAL BANK
List of Bank Owned PropertiesAs of December 31, 2016
Branch Name COMPLETE ADDRESS
MARIKINA-A. TUAZON Gil Fernando Ave. cor. Chestnut St., Brgy. San Roque, Marikina City
NAVOTAS 865 M. Naval St., Navotas City, Metro Manila
NEW MANILA 322 E. Rodriguez Sr. Ave., New Manila, Quezon City
NIA EDSA corner Nia Road, Brgy. Piñahan, Diliman, Quezon City
NOVALICHES-QUIRINO 903 Quirino Hi-way, Brgy. Gulod, Novaliches, Quezon City
ORTIGAS G/F, JMT Bldg., ADB Avenue, Ortigas Center, Pasig City
P. TUAZON 279 P. Tuazon Blvd., Cubao, Quezon City
PACO 756 Pedro Gil cor. Pasaje-Rosario Sts., Paco, Manila
PASAY 2976 Mexico Avenue, Pasay City
PASIG-SHAW G/F, Jade Center Condominium, 105 Shaw Blvd., Brgy. Oranbo, Pasig City
PETRON MEGA PLAZA G/F, Petron Mega Plaza Bldg., 358 Sen. Gil Puyat Avenue, Makati City
PLAZA DEL CONDE G/F, San Fernando Towers, Plaza del Conde St., Binondo, Manila
PROJECT 3-AURORA BLVD. 1003 Aurora Blvd. cor. Lauan St., Quirino Dist., Quezon City
QUADRANGLE Unit I, Paramount Bldg., EDSA corner West Ave., Quezon City
QUEZON CITY CIRCLE Elliptical Road cor. Kalayaan Avenue, Diliman, Quezon City
RIZAL AVENUE Rizal Avenue corner Saturnino Herrera St., Sta. Cruz, Manila
SAN LORENZO G/F, Jackson Bldg., 926 A. Arnaiz Avenue, Makati City
VALENZUELA 313 San Vicente St. corner Mc Arthur Highway, Karuhatan, Valenzuela City
VALENZUELA-MC ARTHUR 101 McArthur Hi-way, Bo. Marulas, Valenzuela City
WACK WACK G/F, Summit One Tower, 530 Shaw Blvd., Mandaluyong City
WEST AVENUE 92 West Ave., Quezon City
WEST TRIANGLE 1396 Quezon Ave., Quezon City
Northern Luzon
AGOO Verceles St., Consolacion, Agoo, La Union

Exhibit IPHILIPPINE NATIONAL BANK
List of Bank Owned PropertiesAs of December 31, 2016
Branch Name COMPLETE ADDRESS
ALAMINOS Quezon Avenue, Poblacion, Alaminos City, Pangasinan
ANGELES 730 Sto. Rosario St., Angeles City, Pampanga 2009
APARRI J.P.Rizal St., Aparri, Cagayan 3515
BAGUIO 51 Session Road,Corner Upper Mabini St., Baguio City
BALANGA Zulueta St., Poblacion, Balanga, Bataan 2100
BALIUAG 015 Rizal St., San Jose, Baliuag, Bulacan
BANGUED McKinley corner Peñarrubia Streets, Zone 4, Bangued, Abra , 2800
BANGUED-MAGALLANES Taft cor. Magallanes Sts., Zone 5, Bangued, Abra
BASCO NHA Bldg., Caspo Fiesta Road Kaychanarianan, Basco, Batanes
BATAC cor San Marcelino and Concepcion Sts., Batac, Ilocos Norte
BAYOMBONG J.P. Rizal St., District 4, Bayombong, Nueva Vizcaya
CABANATUAN Corner Paco Roman and Del Pilar Sts., Cabanatuan City, Nueva Ecija
CANDON National Highway cor. Dario St., San Antonio, Candon City 2700
CANDON-NATL HI-WAY National Hi-way, Brgy. San Juan, Candon City, Ilocos Sur
CAUAYAN Maharlika Hi-way cor Cabanatuan Rd., Cauayan, Isabela 3305
CONCEPCION A. Dizon St., San Nicolas, Concepcion, Tarlac 2316
DAGUPAN A.B. Fernandez Ave., Dagupan City
DAU MacArthur Highway, Dau, Mabalacat, Pampanga 2010
GAPAN Tinio Street, San Vicente, Gapan City, Nueva Ecija
GAPAN-POBLACION Tinio Street, Poblacion, Gapan City, Nueva Ecija
GUAGUA PNB Guagua Bldg., Brgy. Sto. Cristo, Guagua, Pampanga 2003
IBA 1032 R. Magsaysay Ave., Zone I, Iba, Zambales 2201
ILAGAN Old Capitol Site Calamagui 2, Ilagan City, Isabela 3300
LA UNION Quezon Ave., City of San Fernando, La Union
LAOAG Brgy. 10, Trece Martires St. Corner J.P. Rizal St., Laoag City 2900
LINGAYEN Avenida Rizal East cor. Maramba Blvd., Lingayen, Pangasinan

Exhibit IPHILIPPINE NATIONAL BANK
List of Bank Owned PropertiesAs of December 31, 2016
Branch Name COMPLETE ADDRESS
MALLIG PLAINS Cor. Don Mariano Marcos Ave. & Bernabe Sts., Roxas, Isabela 3320
MALOLOS Sto. Niño, Malolos City, Bulacan
MEYCAUAYAN Mc Arthur Highway, Saluysoy, Meycauayan City, Bulacan
MUÑOZ D. Delos Santos St. cor. Tobias St., Science City of Muñoz, Nueva Ecija
OLONGAPO 2440 Rizal Ave., East Bajac-Bajac, Olongapo City, Zambales 2200
PANIQUI M.H. Del Pilar St., corner Mc Arthur Hi-way, Paniqui Tarlac
ROSALES MC Arthur Highway, Carmen East, Rosales, Pangasinan
SAN FERNANDO A. Consunji St., Sto. Rosario, City of San Fernando, Pampanga
SAN FERNANDO-LA UNION 612 Quezon Ave., San Fernando, La Union
SAN JOSE N. ECIJA Maharlika Hi-way Cor. Cardenas St., San Jose City, Nueva Ecija 3121
SANTIAGO Marcos Highway cor. Camacam St., Centro East, Santiago City, Isabela 3311
SOLANO-MAHARLIKA HI-WAY Maharlika National Highway, Solano, Nueva Vizcaya
TARLAC F. Tanedo St., San Nicolas, Tarlac City
TAYUG PNB Tayug Branch Bldg., Zaragoza Street, Poblacion, Tayug, Pangasinan 2445
TUGUEGARAO Bonifacio St., Tuguegarao City, Cagayan 3500
URDANETA Mc Arthur Highway, Nancayasan, Urdaneta City, Pangasinan 2428
VIGAN Leona Florentino St., Vigan City, Ilocos Sur 2700
Southern Luzon
BACOOR KM 17, Aguinaldo Highway, Bacoor, Cavite
BALAYAN 147 Plaza Mabini, Balayan, Batangas
CALAMBA Burgos St., Calamba City
CALAPAN J.P.Rizal St. Camilmil, Calapan City, Oriental Mindoro
CANDELARIA National Road, Poblacion, Candelaria, Quezon
CAVITE P. Burgos Avenue, Caridad, Cavite City

Exhibit IPHILIPPINE NATIONAL BANK
List of Bank Owned PropertiesAs of December 31, 2016
Branch Name COMPLETE ADDRESS
DAET Carlos II St., Brgy, 3, Daet, Camarines Norte
DARAGA Baylon Compound, Market Site, Rizal St., Daraga, Albay
IRIGA Highway 1, San Roque, Iriga City, Camarines Sur
KAWIT Allied Bank Bldg., Gen. Tirona Highway, Balsahan, Binakayan, Kawit, Cavite
LEGASPI Corner Rizal and Gov. Forbes Sts., Brgy. Baybay, Legaspi City
LIPA B. Morada Ave., Lipa City, Batangas
LOPEZ San Francisco St. Talolong Lopez Quezon
LUCENA Quezon Ave., Brgy IX, Lucena City
MAMBURAO National Road, Brgy. Payompon, Mamburao, Occidental Mindoro
MANGARIN Quirino corner M.H. Del Pilar Sts., Brgy. 6, San Jose, Occidental Mindoro 5100
MASBATE Quezon St., Brgy. Pating, Masbate City, Masbate
NAGA Gen. Luna St., Brgy. Abella, Naga City, Camarines Sur
ODIONGAN #15 J.P. Laurel St., cor M. Formilleza St., Ligaya, Odiongan, Romblon
PUERTO PRINCESA Valencia St. cor. Rizal Avenue, Brgy. Tagumpay, Puerto Princesa City, Palawan
PUERTO PRINCESA-RIZAL AVE. Rizal Ave., Brgy. Mangahan, Puerto Princesa City, Palawan
SAN PABLO M. Paulino St., San Pablo City, Laguna
SAN PEDRO KM 30 National Hi-way, San Pedro, Laguna
SILANG 166 J.P. Rizal St., Silang, Cavite
SORSOGON Rizal St., Sorsogon City
STA. CRUZ Pedro Guevarra Avenue Brgy. Uno Sta. Cruz, Laguna
TABACO Ziga Avenue, Cor. Bonifacio St., Tayhi, Tabaco City
TAGAYTAY-AGUINALDO E. Aguinaldo Hi-way, Kaybagal South, Tagaytay City
Visayas
ANTIQUE T. Fornier St., Bantayan, San Jose, Antique 5700

Exhibit IPHILIPPINE NATIONAL BANK
List of Bank Owned PropertiesAs of December 31, 2016
Branch Name COMPLETE ADDRESS
BACOLOD-ARANETA Araneta Ave., near cor. Luzuriaga St., Bacolod City, Negros Occidental
BAYAWAN National Highway cor Mabini St., Brgy. Suba, Bayawan City
BAYBAY-MAGSAYSAY 148 R. Magsaysay Ave., Baybay, Leyte
BINALBAGAN Don Pedro R. Yulo St., Binalbagan, Negros Occidental 6107
BORACAYBrgy. Balabag, Boracay Island, Malay, AklanFX Counter I - Oro Beach Resort, Station III, Boracay Island, Malay, AklanFX Counter II - Plazoleta, Station II, Boracay Island, Malay, Aklan
BORONGAN Real St., Brgy Songco, Borongan City, Samar
CADIZ Cor Luna and Cabahug Sts., Cadiz City, Negros Occidental 6121
CALBAYOG Maharlika Highway, Brgy Obrero, Calbayog City, Leyte
CATARMAN Cor. Jacinto & Carlos P Garcia St., Brgy Narra, Catarman, Nothern Samar
CATBALOGAN Imelda Park Site, Catbalogan, Western Samar 6700
CEBU Corner M.C. Briones and Jakosalem Streets, Cebu City
DANAO Juan Luna St., Danao City, Cebu
DUMAGUETE Siliman Avenue cor Real St., Dumaguete City, Negros Orriental
DUMAGUETE-LOCSIN 33 Dr. V. Locsin St., Dumaguete City, Negros Oriental
ILOILO Cor. Gen Luna & Valeria Street, Iloilo City
ILOILO-LEDESMA Ledesma cor. Quezon Sts., Brgy. Ed Ganzon, Iloilo
JAKOSALEM D. Jakosalem cor. Legaspi Sts., Cebu City
KABANKALAN NOAC National Highway cor Guanzon St., Kabankalan City
KALIBO 0508 G. Pastrana St., Kalibo, Aklan
LAPU-LAPU * Manuel L. Quezon National Highway, Pajo, Lapulapu City
LARENA Roxas St., Larena, Siquijor
LUZURIAGA Cor Luzuriaga and Araneta Sts., Bacolod City
MAASIN Cor. Allen & Juan Luna St., Brgy. Tunga-tunga, Maasin City, Leyte
NAVAL Cor. Caneja & Ballesteros Sts., Naval, Biliran Province 6543 ,Leyte

Exhibit IPHILIPPINE NATIONAL BANK
List of Bank Owned PropertiesAs of December 31, 2016
Branch Name COMPLETE ADDRESS
ORMOC Cor. Cata-ag & Bonifacio Sts., Ormoc City, Leyte
PASSI 5037 F. Palmares Street, Passi City, Iloilo (beside St. William Parish Church).
PLAZA LIBERTAD JM Basa Street, Iloilo City 5000
POTOTAN Guanco St., Pototan, Iloilo
ROXAS Cor. CM Recto & G. Del Pilar Streets, Brgy. III, Roxas City, Capiz 5800
ROXAS DOWNTOWN Roxas Ave., Roxas City, Capiz
SAN CARLOS V. Gustilo St., San Carlos City
SILAY Rizal St., Silay City
TACLOBAN Cor. Sto. Niño & Justice Romualdez Sts., Tacloban City, Leyte 6500
TACLOBAN-ZAMORA 111 Zamora St., Tacloban City, Leyte
TAGBILARAN C. P. Garcia Ave. cor. J. A. Clarin St., Poblacion, Tagbilaran City, Bohol
TANJAY Magallanes cor. E. Romero Sts, Tanjay City, Negros Oriental.
TOLEDO Rafols St., Poblacion, Toledo City, Cebu
TUBIGON Corner Cabangbang Avenue & Jesus Vaño Street, Centro, Tubigon, Bohol, Philippines
VICTORIAS Cor. Ascalon and Montinola Sts., Victorias City
Mindanao
AGUSAN DEL SUR Roxas St., Brgy 4, San Francsico, Agusan del Sur
BASILAN Strong Blvd., Isabela, Basilan
BASILAN- ROXAS Roxas Ave., Isabela City, Basilan Province
BISLIG Cor. Abarca & Espiritu Sts., Mangagoy, Bislig, Surigao del Sur
BUTUAN Montilla Blvd., Brgy. Dagohoy, Butuan City, Agusan del Norte
BUUG National Highway, Poblacion, Buug, Zamboanga, Sibugay
CAGAYAN DE ORO Corrales Ave., cor. T. Chavez St., Cagayan de Oro City, Misamis Oriental
CDO-COGON JR Borja cor. V. Roa Sts., CDO City, Misamis Oriental

Exhibit IPHILIPPINE NATIONAL BANK
List of Bank Owned PropertiesAs of December 31, 2016
Branch Name COMPLETE ADDRESS
CDO-DIVISORIA Tiano Brothers cor. Cruz Taal Sts., CDO City, Misamis Oriental
CDO-LAPASAN Lim Ket Kai Drive, Lapasan, CDO City, Misamis Oriental
COTABATO 39 Makakua St., Cotabato City, Maguindanao
COTABATO-DOROTHEO Alejandro Dorotheo St. cor. Corcuera St., Cotabato City, North Cotabato
DAVAO San Pedro St., cor. C.M. Recto St., Davao City, Davao del Sur
DAVAO-CM RECTO CM Recto St., Davao City
DAVAO-SAN PEDRO San Pedro St., Davao City
DIGOS Quezon Avenue, Digos, Davao del Sur
DIPOLOG Gen. Luna St. cor. C.P. Garcia Sts., Dipolog City, Zamboanga del Norte
GENERAL SANTOS City Hall Dr. Osmena St., General Santos City, South Cotabato
GINGOOG National Highway, Brgy. 23, Gingoog City, Misamis Oriental
ILIGAN Cor. Gen. Aguinaldo & Labao Sts., Poblacion, Iligan City, Lanao del Norte
IPIL National Hi-way, Poblacion, Ipil, Zamboanga Sibugay
JOLO-AROLAS Gen. Arolas corner Magno Sts., Jolo, Sulu
KIDAPAWAN Quezon Blvd., Kidapawan City, North Cotabato
KORONADAL Morrow St., Koronadal, South Cotabato
KORONADAL-POBLACION Gen. Santos Drive, Brgy. Zone 1, Koronadal City, South Cotabato
LIMKETKAI CENTER Limketkai Center, Lapasan, Cagayan de Oro City, Misamis Oriental
MAMBAJAO Cor. Gen. Aranas & Burgos Sts., Brgy. Poblacion, Mambajao, Camiguin
MARANDING National Highway, Maranding, Lala, Lanao del Norte
MARAWI Perez St., Poblacion, Marawi City, Lanao del Sur
MATI Rizal Ext., Brgy. Central, Mati, Davao Oriental
MIDSAYAP Quezon Avenue, Midsayap, North Cotabato
MOLAVE Mabini St., Molave, Zamboanga del Sur
OROQUIETA Sen. Jose Ozamis St., Lower Lamac, Oroquieta City, Misamis Occidental

Exhibit IPHILIPPINE NATIONAL BANK
List of Bank Owned PropertiesAs of December 31, 2016
Branch Name COMPLETE ADDRESS
OZAMIS Rizal Ave., Aguada, Ozamis City, Misamis Occidental
PAGADIAN Rizal, Ave., Balangasan District, Pagadian City, Zamboanga del Sur
PAGADIAN-PAJARES F.S. Pajares Ave. cor. Cabrera St., Brgy. San Francisco, Pagadian City, Zamboanga del Sur
SK PENDATUN Quezon Ave., Cotabato City
SURIGAO 45 Rizal St., Brgy. Washington, Surigao City, Surigao del Norte
TACURONG Alunan Highway, Tacurong City, Sultan Kudarat
TAGUM Rizal St., Magugpo, Poblacion, Tagum City, Davao del Norte
TANDAG Napo, National Highway, Tandag, Surigao del Sur
TAWI-TAWI BONGAO Datu-Halun St., Bongao, Tawi-Tawi
ZAMBOANGA J.S. Alano St., Zamboanga City, Zamboanga del Sur
ZAMBOANGA-SUCABON Mayor MS Jaldon St., Zamboanga City, Zamboanga del Sur

Exhibit IIPHILIPPINE NATIONAL BANK
LIST OF BRANCHES UNDER LEASEAS OF DECEMBER 31, 2016
Branch Name ADDRESS Monthly Rent(In Pesos)
Expirationof Lease
Metro Manila168 MALL Stall 3S-04, 168 Shopping Mall, Sta. Elena, Soler Sts., Binondo, Manila 124,287.12 14-May-19
A. BONIFACIO 789 A. Bonifacio Ave. Brgy. Pag-Ibig sa Nayon, Balintawak, Quezon City 107,520.00 14-May-19
ACROPOLIS 251 TriQuetra Bldg., E. Rodriguez Jr. Ave., Brgy. Bagumbayan, Quezon City 170,000.00 31-Oct-20
ADRIATICO G/F, Pearl Garden Hotel, 1700 M. Adriatico cor. Malvar Sts., Malate, Manila 203,700.00 30-Jun-24
AGUILAR AVENUE-LAS PIÑAS G/F, Las Piñas Doctors' Hospital, Aguilar Ave., Citadella Subd., Las Piñas City 141,715.61 26-Sep-19
AGUIRRE G/F, 112 All Seasons Building, Aguirre St., Legaspi Village, Makati City 119,142.01 27-Sep-19
ALABANGG/F, Page 1 Building, 1215 Acacia Avenue, Madrigal Business Park, Ayala Alabang,
Muntinlupa165,820.60 15-Mar-17
ALABANG-LAS PIÑAS Don Mariano Lim Industrial Compound, Alabang Zapote Rd. cor. Concha Cruz Rd., Las Piñas 100,000.00 31-Dec-17
ALI MALL Alimall ll Bldg., Gen. Romulo Ave., cor P. Tuazon Blvd., Cubao, Quezon City in progress
ALMANZA Hernz Arcade, Alabang-Zapote Road, Almanza, Las Piñas City 1750 118,543.51 31-Mar-18
AMORSOLO 114 Don Pablo Building, Amorsolo St., Legaspi Village, Makati City 212,991.87 31-Jul-18
ANNAPOLIS G/F, Continental Plaza, Annapolis St., Greenhills, San Juan 137,812.50 28-Feb-18
ANTIPOLO 89 P. Oliveros St., Kapitoloyo Arcade, San Roque, Antipolo City, Rizal 80,000.00 31-Dec-19
ANTIPOLO-CIRCUMFERENTIAL Circumferential Road, Brgy. Dalig, Antipolo, Rizal 9,000.00 21-Apr-16
AURORA BLVD.-KATIPUNAN Aurora Blvd., near PSBA, Brgy. Loyola Heights, Quezon City 38,587.50 14-Nov-16
BALIC-BALIC AGB Bldg., 1816 G. Tuason cor. Prudencio Sts., Balic-Balic, Sampaloc, Manila 77,175.00 31-Mar-18
BAMBANG MASANGKAY G/F, ST Condominium, 1480 G. Masangkay St., Sta. Cruz, Manila 133,705.69 29-Feb-16
BANAWE 210 Banawe Street, Brgy. Tatalon, Quezon City 147,000.00 31-Dec-19
BANAWE-N. ROXAS 395 Prosperity Bldg. Center, Banawe cor. N. Roxas Street, Quezon City 210,000.00 31-Dec-19
BANGKAL G/F, E. P. Hernandez Bldg., 1646 Evangelista St., Bangkal, Makati City 92,137.50 31-Oct-17
BATASANG PAMBANSA Main Entrance, Batasan Pambansa Complex, Constitutional Hills, Quezon City 3,400.00 12-Feb-17

BEL-AIR MAKATI 52 Jupiter St., Bel-Air, Makati City 250,000.00 05-Jun-21
BELLEVUE-FILINVESTG/F, Bellevue Hotel, North Bridgeway, Northgate Cyberzone, Filinvest Corporate City,
Alabang, Muntinlupa City189,000.00 31-Jul-19
BF HOMES 43-C President Avenue, BF Homes, Parañaque City 93,712.50 31-Dec-18
BF HOMES-AGUIRRE AVENUE 47 Aguirre Ave. corner Tirona St., B.F. Homes, Parañaque City 1718 79,763.50 12-Jul-17
BF HOMES-PHASE 3 47 Aguirre Ave. corner Tirona St., BF Homes, Parañaque City 1718 99,225.00 31-Dec-18
BICUTAN VCD Building, 89 Doña Soledad Avenue Betterliving Subdivision, Bicutan, Parañaque City 60,000.00 24-May-16
BICUTAN-WEST SERVICE ROAD Km. 16, West Service Road, South Super Highway, Bicutan, Parañaque City 60,775.31 31-Dec-17
BINONDO 452 San Fernando St. cor. Elcano St., Binondo, Manila 169,400.00 31-Dec-16
BINONDO-NUEVALot 17-18, Blk. 2037, Yuchengco (formerly Nueva) St. & Tomas Pinpin St., Binondo, Manila
158,260.50 30-Nov-20
BLUMENTRITT Citidorm Blumentritt, 1848 Blumentritt corner Leonor Rivera Sts., Sta. Cruz, Manila 90,000.00 30-Nov-19
BLUMENTRITT-RIZAL AVE. EXT. 2229-2231 Rizal Avenue, Sta. Cruz, Manila 88,200.00 31-Dec-17
BONI AVENUE 654 Boni Ave., Mandaluyong City 128,784.62 31-Dec-16
BONIFACIO GLOBAL CITY Shop 2, The Luxe Residences 28th St., cor 4th Ave., Bonifacio Global City, Taguig 288,144.00 30-Nov-19
BSP SU G/F, Cafetorium Building, BSP Complex, A. Mabini cor. P. Ocampo Sts. Malate, Manila 12,000.00 30-Jun-16
C. PALANCA 201 C. Palanca corner Quezon Blvd., Quiapo, Manila 132,300.00 30-Nov-18
CAINTA RRCG Transport Bldg., Km. 18 Ortigas Avenue Extension, Brgy. San Isidro, Cainta, Rizal 65,000.00 08-Sep-16
CAINTA - FELIX AVE. G/F, Arellano Bldg., Felix Ave., cor. Village East Ave., Cainta, Rizal 56,453.34 15-Feb-17CAINTA-ORTIGAS AVE.
EXTENSIONParamount Plaza, Km. 17, Ortigas Ave. Ext., Brgy. Sto. Domingo, Cainta, Rizal 110,617.50 11-Dec-20
CALOOCAN-A.MABINI 451 A. Mabini corner J. Rodriguez St., Caloocan City 80,357.14 14-Feb-18
CARTIMAR-TAFT SATA Corp. Bldg., 2217 Cartimar-Taft Avenue, Pasay City 105,140.25 15-Oct-19
CENTURY PARK G/F, Century Park Hotel, M. Adriatico cor. P. Ocampo Sts., Malate, Manila 227,850.00 28-Feb-19
CHINO ROCES AVENUE EXT. GA Building, 2303 Don Chino Roces Ave. Ext., Makati City 212,854.49 15-May-19
CM RECTO G/F, Dr. Lucio C. Tan Bldg., UE Manila Annex, C.M. Recto, Manila 84,560.85 12-Jul-20
COA COA Building, Commonwealth Avenue, Quezon City 53,556.15 31-Dec-18
COMMONWEALTH G/F, KC Square Bldg., 529 Commonwealth Avenue, Quezon City 85,730.40 01-Dec-19QUEZON CITY-VISAYAS
AVENUE (formerlyCONGRESSIONAL)
Wilcon City Center, No. 121 Visayas Avenue, Brgy. Bahay Toro, Quezon City 119,326.68 19-Apr-17
CUBAO-HARVARD SRMC Bldg., 901 Aurora Blvd. cor Harvard & Stanford Sts., Cubao, Quezon City 100,000.00 30-Sep-16
DASMA-MAKATI 2284 Allegro Center, Chino Roces Avenue Extension, Makati City 122,492.50 31-Oct-20

DEL MONTE 116 Del Monte Ave. cor. D. Tuazon St., Brgy. Maharlika, Quezon City 132,490.18 31-Jul-16
DELTA 101-N dela Merced Bldg., West Avenue corner Quezon Avenue, Quezon City 95,408.99 31-Aug-16
DIVISORIA 869 Sto. Cristo St., Binondo, Manila 100,000.00 06-Sep-20
DIVISORIA MARKET 706-708 Elcano St., Binondo, Manila 30,579.55 28-Feb-15
DIVISORIA-JUAN LUNA CK Bldg., 750 Juan Luna St., Binondo, Manila 130,277.25 31-Mar-18
DOMESTIC AIRPORT G/F, PAL Data Center Bldg., Domestic Airport Road, Pasay City 15,769.28 31-Jan-14
DON ANTONIO HEIGHTS 30 G/F, Puno Foundation Bldg., Brgy. Holy Spirit, Quezon City 59,172.00 30-Nov-11
E. RODRIGUEZ -G. ARANETA 599 B, G. Araneta Ave. cor. E. Rodriguez Sr. Ave., Doña Imelda, Quezon City 40,516.88 31-Aug-17E. RODRIGUEZ SR. AVE.-
BANAUE97 ECCOI Building, E. Rodriguez Sr. Avenue, Brgy. Tatalon, Quezon City 1102 46,800.00 31-Aug-16
E. RODRIGUEZ SR. AVENUE 1706 Rimando Building, E. Rodriguez Sr. Ave., Cubao, Quezon City 97,655.47 31-May-16
EASTWOOD CITYMDC 100 Building, Mezzanine Level, Unit M3, E. Rodriguez Jr. Ave., corner Eastwood Ave.,
Brgy. Bagumbayan, Libis, Quezon City 1110239,982.40 22-Apr-19
EDISON-BUENDIA Visard Bldg, #19 Sen. Gil Puyat Ave., Makati City 101,513.96 07-Feb-21
EDSA BALINTAWAK 337-339 EDSA corner, Don Vicente Ang St., Caloocan City 96,000.00 10-Jun-19
EDSA EXTENSION 235-A Loring St., Pasay City 129,868.34 28-May-19
EDSA ROOSEVELT 1024 Global Trade Center Bldg., EDSA, Quezon City 139,162.10 31-Jan-19
EDSA-CALOOCAN 462 G/F, Insular Life Bldg., cor. B. Serrano, EDSA, Caloocan City 86,691.42 31-Jul-20
EDSA-ETON CYBERPOD CENTRIS G/F, One Cyberpod Centris, EDSA Eton Centris, cor. EDSA & Quezon Ave., Quezon City 108,050.60 31-Mar-20
ELCANO 706-708 Elcano St., Binondo, Manila 120,608.32 30-Nov-17
ERMITA-ROXAS BOULEVARDRoxas Boulevard corner Arquiza St., Ermita, Manila
243,581.00 15-Jan-21
ERMITA-U.N. Physician's Tower, 533 U.N. Avenue, cor. San Carlos Sts., Ermita, Manila 151,648.87 31-Jan-18
ESCOLTA G/F, Regina Bldg., Escolta, Manila 202,447.26 30-Sep-20
ESPAÑAUnit 104, St. Thomas Square, 1150 España Blvd., cor Padre Campa St., Sampaloc East,
Manila51,850.50 15-Mar-18
ESPAÑA-WELCOME ROTONDA 10 Doña Natividad Bldg., Quezon Ave., Welcome Rotonda, Quezon City 90,852.64 15-Jun-16
ETON-BELTON YAKALUnit 5A, Belton Place Makati, Pasong Tamo corner Yakal Sts., Makati City
121,738.59 30-Jun-20
ETON-CORINTHIANUnit 78 E-Life, Eton Cyberpod Corinthian, EDSA cor. Ortigas Ave., Brgy. Ugong Norte,
Quezon City129,105.50 14-Mar-20
EVER GOTESCO Lower G/F, Stall No. 20, Ever Gotesco Commonwealth, Quezon City 43,444.22 06-Mar-16
FAIRVIEW No. 41, Regalado Ave., West Fairview, Quezon City 157,883.16 31-May-21
FAIRVIEW-COMMONWEALTH 70 Commonwealth Ave., Fairview Park Subd., Fairview, Quezon City 79,000.00 31-Mar-18

FILINVEST AVENUEBC Group Center, Filinvest Avenue & East Asia Drive, Filinvest Corporate City, Alabang,
Muntinlupa City184,137.86 15-Jan-17
FORT BONIFACIO-INFINITY G/F, 101 The Infinity Tower, 26th Street, Fort Bonifacio, Taguig City 239,200.00 15-May-16FORT BONIFACIO-MCKINLEY
HILLG/F, Unit B, McKinley Hill 810 Bldg., Upper McKinley Road, McKinley Town Center, Fort
Bonifacio, Taguig City295,900.00 07-Apr-16
FRISCO Unit E/F, MCY Bldg., #136 Roosevelt Ave., SFDM, Quezon City 40,518.00 19-Oct-19
FRISCO-SFDM 972 Del Monte Ave., corner San Pedro Bautista St., SFDM, Quezon City 86,821.87 23-Jan-18
FTI Lot 55, G/F Old Admin Bldg., FTI Complex,Taguig City 80,996.80 07-Jul-19
G. ARANETA 1-B Dolores Go Buidling, G. Araneta Ave., Quezon City 121,501.80 10-May-19
GALAS 20 A. Bayani St., corner Bustamante, Galas, Quezon City 207,966.56 31-May-21
GEN. T. DE LEON4024 General T. de Leon Street, Brgy. Gen. T. de Leon,
Valenzuela City84,251.57 31-Jul-21
GILMORE Gilmore IT Center No. 08, Gilmore Ave., cor 1st St., New Manila, Quezon City 167,388.38 31-Dec-19
GOV. PASCUAL 157 Gov. Pascual Avenue, Acacia, Malabon City 49,498.28 15-Jun-18
GRACE PARK 354 A-C 10th Ave., Grace Park, Caloocan City 73,920.00 13-May-19
GRACE PARK-3RD AVE. 126 Rizal Avenue Ext., Between 2nd and 3rd Avenue, Grace Park, Caloocan City 111,396.73 31-Oct-21
GRACE PARK-7TH AVE. 322 Rizal Ave. Ext. near corner, 7th Avenue, Grace Park, Caloocan City 70,000.00 31-Jul-17
GRACE VILLAGE G/F, TSPS Bldg., Christian cor. Grace Sts., Grace Village, Quezon City 107,854.25 31-Dec-16
GRANADAG/F, Xavier Hills Condominium, 32 Granada cor. N. Domingo Sts., Brgy Valencia, Quezon
City134,361.51 29-Feb-20
GREENBELT G/F, 114 Charter House Building, Legaspi St., Legaspi Village, Makati City 143,487.97 30-Sep-26
GREENHILLS G/F, One Kennedy Place, Club Filipino Drive Greenhills, San Juan City 273,346.70 31-May-25
GREENHILLS CENTER G/F, Limketkai Bldg., Ortigas Ave., Greenhills, San Juan City 306,605.25 18-Jun-18
GSIS Level 1 GSIS Bldg., Financial Center, Roxas Blvd., Pasay City 109,347.15 31-May-18
GUADALUPE Pacmac Bldg., 23 EDSA Guadalupe, Makati City 141,380.59 18-Oct-21
HARRISON PLAZA RMSC Bldg., M. Adriatico St., Malate, Manila Rent free 09-Jan-20
INTRAMUROS G/F, Marine Technology Bldg. Cor. A Soriano Ave. & Arzobispo Sts., Intramuros, Manila 142,412.26 30-Jun-19
INTRAMUROS-CATHEDRAL 707 Shipping Center Condominium, A. Soriano Jr. St., Intramuros, Manila 113,536.35 30-Nov-19
J.P. LAUREL G/F, Gama Bldg., J. P. Laurel cor. Minerva Sts., San Miguel, Manila 118,077.75 28-Feb-19
JADE-ORTIGAS Antel Global Corporate Center Building, Jade Drive, Ortigas Center, Pasig City 118,355.58 29-Feb-16
KAMIAS 99-101 Ground Floor, Topaz Bldg., Kamias Road, Quezon City 99,484.44 31-May-19
KAPASIGAN Emiliano A. Santos Bldg., A. Mabini cor. Dr. Sixto Antonio Ave., Pasig City 210,000.00 30-Sep-20
KATIPUNAN 335 Agcor Bldg., Katipunan Ave., Loyola Heights, Quezon City 169,205.16 31-Dec-16

KATIPUNAN-ST. IGNATIUS G/F, Linear Building, 142 Katipunan Road, Quezon City 97,500.00 31-Jan-19
LAGRO BDI Center Inc., Lot 33, Blk. 114, Regalado Ave., Greater Lagro, Quezon City 144,005.12 16-Sep-18
LAGRO-QUIRINO Km. 21, Lester Bldg., Quirino Highway, Lagro, Quezon City 112,266.00 30-Jun-19
LAS PIÑAS-ALMANZAConsolidated Asiatic Project, Inc. Bldg., Alabang-Zapote Road, Brgy. Almanza Uno, Las
Piñas City144,257.40 31-Mar-17
LEGASPI VILLAGE First Life Center 174 Salcedo St., Legaspi Village, Makati City 117,467.37 15-Oct-19
LEON GUINTO G/F, Marlow Bldg., 2120 Leon Guinto St., Malate Manila 187,393.34 15-Jul-20
LUNETA National Historical Institute (NHI) Compound, T.M. Kalaw St., Ermita, Manila 40,000.00 26-Apr-18
MACEDA-LAONG LAAN G/F, Maceda Place Bldg., Laong-Laan cor. Maceda St., Sampaloc, Manila 86,905.80 14-Sep-19
MALATE-TAFT Mark 1 Building, 1971 Taft Avenue, Malate , Manila 1004 164,514.37 18-Jul-21
MALINTA Moiriah's Building, 407 Mc Arthur Highway, Malinta, Valenzuela City 88,853.50 31-Aug-20
MANDALUYONG SHAW VSK Building, 2 Acacia Lane corner Shaw Blvd., Mandaluyong City 115,473.12 15-Jun-19
MARIKINA Shoe Ave. corner W. Paz St., Sta. Elena, Marikina City 1800 205,838.29 14-Nov-20
MARIKINA-CONCEPCION Bayan-Bayanan Ave. cor. Eustaquio St., Concepcion, Marikina City 162,067.50 30-Jun-17
MARIKINA-STA. ELENA 314 J. P. Rizal St., Bgy. Sta. Elena, Marikina City 65,000.00 31-Jul-18
MASANGKAY 916 G. Masangkay St., Binondo, Manila 239,359.42 30-Nov-21
MASINAG Silicon Valley Bldg., 169 Sumulong Highway, Mayamot, Antipolo City 67,915.20 31-Dec-16
MASINAG-SUMULONG F. N. Crisostomo Bldg. 2, Sumulong Highway, Mayamot, Antipolo City, Rizal 84,000.00 28-Feb-20
MATALINO 21 Tempus Bldg., Matalino St., Diliman, Quezon City 118,411.08 30-Jun-21
METROPOLITAN AVENUE G/F,1012 BUMA Bldg., Metropolitan Avenue, San Antonio Village, Makati City 113,647.60 15-Oct-18
MINDANAO AVE. 888 Yrreverre Square Bldg., Mindanao Ave., Brgy. Talipapa, Novaliches, Quezon City 116,781.44 30-Jun-21
MONTALBAN E. Rodriguez Ave., corner Midtown Subdivision, Rosario, Rodriguez, Rizal 72,930.38 31-May-16
MONUMENTO 419 D&I Bldg., EDSA, Caloocan City 112,000.00 30-Jun-17
MORAYTA 929 Consuelo Building, Nicanor Reyes St., Sampaloc, Manila 141,230.25 31-Jul-17
MUNTINLUPA G/F, Arbar Building, National Highway, Poblacion, Muntinlupa City 84,341.25 18-Jun-19
MWSS MWSS Compound, Katipunan Road, Balara, Quezon City 84,821.70 01-Jan-17
N.S. AMORANTO Unit 103, “R” Place Building, 255 N.S. Amoranto Sr. Avenue, Quezon City 98,091.59 31-May-18
NAGA ROAD-LAS PIÑAS Lot 2A, Naga Road corner DBP Extension, Pulang Lupa Dos, Las Piñas City 44,800.00 12-Apr-22
NAIA Arrival Area Lobby, NAIA Complex, Pasay City 9,959.40 31-Dec-15
NAIA 1 Departure Area, NAIA Terminal Bldg., Imelda Ave., Parañaque City, Metro Manila 28,927.80 31-Aug-11
NAIA 2 NAIA Centennial Terminal II, Northwing Level Departure Intl.,Bldg., Pasay City 21,438.56 31-Dec-14
NAIA 3 Arrival Area Lobby, NAIA Terminal 3 Complex, Pasay City 21,736.00 31-Dec-15

NAVOTAS-FISH PORTBulungan cor Daungan Ave., Navotas Fish Port Complex, North Bay Boulevard South,
Navotas City17,947.20 17-Mar-18
NFA SRA Building, Brgy. Vastra, North Avenue, Quezon City 33,720.96 31-Aug-16
NORTHBAY 511 Honorio Lopez Blvd., Balut, Tondo, Manila 38,408.48 31-Oct-20
NOVALICHES 513 Quirino Highway, Talipapa, Novaliches, Quezon City 53,000.00 24-Feb-20
NPC Agham Road, Diliman, Quezon City 156,697.20 25-Nov-18
ONGPIN Prestige Tower, 919 Ongpin St., Sta. Cruz, Manila 151,011.10 18-Apr-18
ORTIGAS CENTER-GARNET Unit 104, Taipan Place Building, Emerald Ave., Ortigas Center, Pasig City 127,338.75 15-Oct-17
OYSTER PLAZA Unit D1, Oyster Plaza Bldg., Ninoy Aquino Ave., Brgy. San Dionisio, Paranaque City 72,930.38 31-Oct-15
PADRE FAURA PAL Learning Center Bldg., 540 Padre Faura cor. Adriatico Sts., Ermita, Manila 97,337.74 30-Jun-26
PADRE RADA 647 RCS Bldg., Padre Rada St., Tondo, Manila 184,481.23 31-Oct-19
PAMPLONA 267 Alabang-Zapote Road, Pamplona Tres, Las Piñas City 104,186.25 07-Feb-18
PANDACAN Jesus Street, Cor. T. San Luis, Pandacan, Manila 63,720.22 31-Oct-20
PASAY-EDSA 765 EDSA, Malibay, Pasay City 106,203.83 14-Sep-18
PASAY-LIBERTAD 244 P. Villanueva St., Libertad, Pasay City 93,593.99 30-Dec-16
PASAY-TAFT 2482 Taft Avenue, Pasay City 176,400.00 31-Jan-18
PASIG G/F, Westar Bldg., 611 Shaw Blvd., Pasig City 1600 133,827.27 30-Sep-17
PASIG-C. RAYMUNDO G/F, JG Bldg., C. Raymundo Ave., Maybunga, Pasig City 73,169.43 31-Aug-20
PASIG-ORTIGAS EXT. 103 B. Gan Building, Ortigas Ave. Ext., Rosario, Pasig City 111,300.00 31-Aug-18
PASIG-SANTOLAN Amang Rodriguez Ave., Brgy. Dela Paz, Santolan, Pasig City 102,052.91 07-Dec-18
PASIG-TIENDESITASG/F, Units 4-5, Silver City Bldg., No. 03, Frontera Verde Drive, Ortigas Center, Pasig City
176,100.00 29-Sep-20
PASO DE BLAS 179 Paso de Blas, Valenzuela City 110,000.00 31-May-19
PASONG TAMO 2233 Chino Roces Avenue, Makati City 114,916.95 30-Jun-21
PGH PGH Compound, Taft Avenue, Ermita, Manila 334,800.00 01-Nov-13
PIONEER G/F, B. Guerrero Complex, 123 Pioneer St., Mandaluyong City 120,000.00 14-Apr-19
PLAZA STA. CRUZ 740 Florentino Torres St., Sta. Cruz, Manila 1003 144,735.61 14-Sep-22
PORT AREA G/F, Bureau of Customs Compound, South Harbor, Port Area, Manila 92,702.46 23-Nov-18
POTREROA & S Building, 189 McArthur Highway, Potrero, Malabon City
78,100.34 12-Apr-20
PRITIL MTSC Bldg., Juan Luna cor.Capulong Ext., Tondo, Manila 1012 102,678.57 31-Oct-20
PROJECT 8 Mecca Trading Bldg., Congressional Avenue, Project 8, Quezon City 80,000.00 01-Jun-16

QUIAPO 516 Evangelista cor. Ronquillo Sts., Quiapo, Manila 132,490.18 15-Feb-16
REINA REGENTE 1067 Don Felipe St., (near corner Reina Regente), Binondo, Manila 72,930.38 31-Mar-16
REMEDIOSG/F, Royal Plaza Twin Towers Condominium, 648 Remedios cor. Ma. Orosa Sts., Malate,
Manila97,240.50 31-Aug-15
RETIRO 422 N.S. Amoranto St., Edificio Enriqueta Bldg., Sta. Mesa Heights, Quezon City 138,567.71 15-Apr-18
ROCES AVENUE 54 Don Alejandro Roces Ave., Quezon City 41,000.00 31-Aug-14
ROCKWELL CENTER Stall No. RS-03, G/F, Manansala Tower, Estrella St., Rockwell Center, Makati City 196,734.63 31-Mar-18
ROOSEVELT 256 Roosevelt Ave., San Francisco del Monte, Quezon City 147,000.00 30-Apr-19
ROXAS BLVD. Suite 101, CTC Building 2232 Roxas Boulevard, Pasay City 119,125.00 28-Feb-17
SALCEDO VILLAGEG/F, LPL Mansions Condominium, 122 L.P. Leviste St., Salcedo Village, Makati City 1227
173,088.98 19-Apr-21
SALCEDO-DELA COSTA G/F, Classica Tower Condominium, 114 H.V. Dela Costa St., Salcedo Village, Makati City 95,659.20 30-Apr-19
SAMSON ROAD 149 Samson Road corner P. Bonifacio St., Caloocan City 80,405.74 31-Jan-19
SAN ANDRES 1155 Swanson Building cor. Linao Street, San Andres, Manila 102,876.48 31-Jul-20
SAN JUAN 213 F. Blumentritt St. cor. Lope K. Santos, San Juan City 70,420.35 31-Mar-18
SAN LORENZO-ARNAIZ G/F, Power Realty Bldg., 1012 A. Arnaiz Avenue, Brgy. San Lorenzo, Makati City 81,033.75 30-Jun-21
SAN MATEO 19 Gen. Luna St., Brgy. Banaba, San Mateo, Rizal 49,835.76 31-Oct-16
SAN NICOLAS 534 Gedisco Towers, Asuncion St., San Nicolas, Manila 170,093.09 31-Mar-19
SHANGRI-LA PLAZAUnit AX 116 P3 Carpark Bldg., Shangri-la Annex Plaza Mall, Edsa corner Shaw Blvd.,
Mandaluyong City131,054.00 30-Sep-20
SHAW BLVD. Starmall cor. EDSA Shaw Blvd., Mandaluyong City 102,101.10 31-Jul-15
SHAW BLVD.-PRINCETON G/F, Sun Plaza Bldg., 1505 Princeton St. cor. Shaw Blvd., Mandaluyong City 172,500.00 30-May-17
SSS DILIMAN G/F, SSS Building, East Avenue Diliman, Quezon City 172,800.00 31-Jan-18
STARMALL ALABANGUpper Ground Level, Starmall Alabang, South Superhighway, Alabang, Muntinlupa City,
177043,200.00 14-Aug-16
SUCAT G/F, Kingsland Bldg., Dr. A. Santos Avenue, Sucat, Parañaque City 127,310.00 31-Oct-20
SUCAT-EVACOM G/F, AC Raftel Center, 8193 Dr. A. Santos Ave., Sucat Road, Paranaque City 158,015.81 30-May-19
T. ALONZO 905 T. Alonzo cor. Ongpin Sts., Sta. Cruz, Manila 179,025.00 31-Mar-20
TAFT AVENUE G/F, One Archers' Place Condominium, 2311 Taft Avenue, Malate, Manila 114,595.38 30-Nov-20
TANAY Tanay New Public Market Road, Brgy. Plaza Aldea, Tanay, Rizal 40,000.00 29-Oct-17
TANDANG SORA 102 cor. San Miguel Village and Tandang Sora Ave., Brgy. Pasong Tamo, Quezon City 60,500.00 25-Sep-16
TAYTAY Ilog Pugad National Road, Brgy. San Juan, Taytay, Rizal 36,538.25 22-Oct-18
THE FORT-BURGOS CIRCLEUnit GF-4, The Fort Residences, 30th St., corner 2nd Avenue, Padre Burgos Circle, Bonifacio
Global City, Taguig257,571.42 30-Nov-17

TIMOG G/F, Newgrange Bldg., 32 Timog Ave., Brgy. Laging Handa, Quezon City 84,000.00 13-Nov-16
TONDO 1941-1943 Juan Luna St., Tondo, Manila 103,318.03 31-Oct-17
TUTUBAN LS 31 Podium Level, Tutuban Prime Block Mall, Tutuban Center, C.M. Recto, Manila 104,500.52 14-Jun-17
TUTUBAN-ABAD SANTOS 1450-1452 Coyuco Bldg., Jose Abad Santos, Tondo, Manila 55,645.87 31-Aug-16
U.E. RECTO G/F, Dalupan Bldg., University of the East, 2219 Claro M. Recto Ave., Manila 61,528.50 31-Mar-20
U.N. AVENUE G/F, UMC Bldg., 900 U.N. Avenue, Ermita, Manila 80,801.32 30-Nov-17
UNITED PARAÑAQUEIba corner Malugay Sts., East Service Road, Brgy. San Martin de Porres, United Parañaque,
Metro Manila69,457.50 30-Nov-17
UP CAMPUS No. 3 Apacible St., UP Campus, Diliman, Quezon City 1101 476,437.50 31-Dec-17
URATEX-EAST SERVICE ROAD Uratex Bldg., Km. 23, East Service Road, Brgy. Cupang, Muntinlupa City 53,697.00 13-Aug-18
VILLAMOR AIR BASE G/F, Airmens Mall Bldg. cor Andrews & Sales Sts., Villamor Air Base, Pasay City 16,350.00 31-Dec-15
VISAYAS CONGRESSIONAL #22 RTS Building, Congressional Ave., Quezon City 95,206.79 15-Mar-16
VITO CRUZ 550 Pablo Ocampo cor. Mabini Sts., Malate, Manila 100,713.38 31-Aug-16
ZABARTE 1131 Quirino Hi-way, Brgy. Kaligayahan, Novaliches, Quezon City 85,323.04 31-Jul-16
ZAPOTE99 Real Street, Alabang-Zapote Road, Pamplona 1, Las Piñas City
84,234.58 04-Dec-18
Northern Luzon
ABANAO 90 NRC Bldg., Abanao St., Baguio City 93,571.20 15-Oct-18
AGOO-SAN ANTONIO B&D Bldg. National Highway, San Antonio, Agoo, La Union 2504 100,000.00 31-Dec-24
ANGELES-MC ARTHUR F. Navarro Bldg., MacArthur Highway, Brgy. Salapungan, Angeles City, Pampanga 146,250.00 31-Jul-20
APALIT Mc Arthur Highway, San Vicente, Apalit, Pampanga 11,576.25 31-Jul-18
BAGUIO-CENTER MALL G/F, Baguio Center Mall, Magsaysay Ave., Baguio City 126,000.00 31-Mar-19
BALAGTAS G/F D & A Bldg., Mc Arthur Highway, San Juan, Balagtas, Bulacan 45,982.14 30-Jun-20
BAYAMBANGPrime Bldg., Rizal St., Zone 2, Bayambang, Pangasinan
64,000.00 18-May-17
BEPZ Bataan Economic Zone, Luzon Ave., Mariveles, Bataan 2106 61,778.00 07-Mar-19
BOCAUE JM Mendoza Building, McArthur Hi-way, Lolomboy, Bocaue, Bulacan 72,930.38 07-Oct-17
BONTOC G/F Mt. Province Commercial Center, Poblacion, Bontoc, Bontoc, Mountain Province 27,030.00 10-Sep-16CABANATUAN-MAHARLIKA
HIGHWAYKm. 114 Maharlika Highway, Cabanatuan, Nueva Ecija 60,000.00 30-Apr-19
CAMILING-RIZAL Rizal St., Camiling, Tarlac 23,841.82 15-Mar-16
CAPAS Capas Comm'l Complex, Sto. Domingo, Capas, Tarlac 68,645.72 15-Oct-16

CAUAYAN-MAHARLIKA HI-WAY Disston Bldg., Maharlika Highway, Bgy. San Fermin, Cauayan, Isabela 84,000.00 31-Mar-19
CENTRO ILAGAN J. Rizal St., Centro, Ilagan City, Isabela 3300 31,500.00 04-Aug-18
CLARK FIELDRetail 4 & 5, Berthaphil III, Clark Field Center 2, Jose Abad Santos Ave., Clark Field Freeport
Zone, Clark Field, Pampanga 2023US$2,100 31-May-19
DAGUPAN-FERNANDEZ A. B. Fernandez Ave., cor. Noble St., Dagupan City, Pangasinan 90,000.00 31-Dec-19
DINALUPIHAN BDA Bldg., San Ramon Highway, Dinalupihan, Bataan 2110 44,642.86 20-Mar-17
DOLORESUnits 4 & 5 G/F, Peninsula Plaza Bldg., Mc Arthur Highway, Dolores, City of San Fernando,
Pampanga73,420.72 31-May-19
EAST GATE CITY WALKEast Gate CW Commercial Center, Olongapo Gapan Rd., San Jose, City of San Fernando,
Pampanga62,390.62 15-Jun-18
GUIMBA CATMAN Bldg., Provincial Road corner Faigal St., Saranay District , Guimba, Nueva Ecija 39,600.00 30-Sep-17
LA TRINIDAD Benguet State University Compound, Brgy. Balili, Kilometer 5, La Trinidad, Benguet 2601 31,794.40 05-Oct-27
LAGAWE JDT Bldg., Inguiling Drive, Poblacion East, Lagawe, Ifugao 16,000.00 10-Nov-18
LAOAG-CASTRO F.R. Castro St., Brgy. 17, Laoag City, Ilocos Norte 99,225.00 31-Mar-19
LUBAO OG Road, Ela Paz Arcade, Brgy. Sta. Cruz, Lubao, Pampanga 46,189.24 31-Dec-20
MABALACAT Destiny Building, Brgy., Mabiga, Mabalacat, Pampanga 50,594.28 31-Jan-21
MACABEBE Y N CEE Commercial Bldg., Poblacion, San Gabriel, Macabebe, Pampanga 40,000.00 27-Mar-21
MAGSAYSAY AVE. G/F, Lyman Ogilby Centrum Bldg., 358 Magsaysay Ave., Baguio City 2600 85,800.00 21-May-17
MALOLOS-MC ARTHUR FC Bldg., Km 40, McArthur Hi-way, Sumapang Matanda, Malolos City, Bulacan 80,223.41 31-Dec-16
MANGALDAN G/F, Abad Biascan Bldg., Rizal St.,Poblacion, Mangaldan, Pangasinan 55,315.15 30-Mar-20
MEYCAUAYAN-ESPERANZA G/F, Stalls 8 & 9, Esperanza Mall, McArthur Highway, Brgy. Calvario, Meycauayan, Bulacan 81,554.39 31-Oct-16
NAGUILIAN ROAD-BAGUIO G/F, High Country Inn, Naguilian Road, Baguio City 81,033.75 31-Oct-16
NARVACAN Annex Bldg., Narvacan Municipal Hall, Sta. Lucia, Narvacan, Ilocos Sur 49,107.14 01-Sep-17
NORTH ZAMBALES Brgy. Hall, Poblacion South, Sta. Cruz, Zambales 13,392.86 31-Dec-17
OLONGAPO-MAGSAYSAY YBC Mall, 97 Magsaysay Drive, East Tapinac, Olongapo City 154,350.00 31-May-18
ORANI Agustina Bldg., McArthur Highway, Parang-Parang, Orani, Bataan 36,000.00 17-Nov-18
PASUQUIN Farmers Trading Center Bldg., Maharlika Hi-way, Poblacion 1, Pasuquin, Ilocos Norte 20,000.00 12-Feb-22
PEREZ BLVD.-DAGUPAN Orient Pacific Building, Perez Blvd. cor. Rizal Ext., Dagupan City 75,245.63 31-Mar-17
PLARIDEL Cagayan Valley Road, Banga 1st, Plaridel, Bulacan 19,292.30 30-Jul-17
ROBINSONS PULILAN Robinsons Mall Pulilan, Maharlika Highway, Cutcut, Pulilan, Bulacan 41,110.69 21-Dec-19
SAN AGUSTIN G/F, Tagle Bldg., McArthur Hi-way, Bgy. San Agustin, City of San Fernando, Pampanga 104,742.00 15-Aug-18
SAN CARLOS-PANGASINAN Plaza Jaycee, San Carlos City, Pangasinan 60,272.94 14-Aug-19
SAN FERNANDO-MC ARTHUR LNG Bldg., Mc Arthur Highway, Brgy. Dolores, City of San Fernando, Pampanga 77,638.33 31-Jul-18

SAN JOSE DEL MONTE Dalisay Bldg., Quirino Hi-way, Tungkong Mangga, City of San Jose Del Monte, Bulacan 75,000.00 31-Dec-19
SAN RAFAELSan Rafael Public Market, Cagayan Valley Road, Brgy. Cruz na Daan, San Rafael, Bulacan
55,800.00 30-Nov-25
SANCHEZ MIRA C-2 Maharlika Highway, Sanchez Mira, Cagayan 3518 29,464.28 02-Dec-22
SANGITAN R. Macapagal Bldg., Maharlika Highway, Brgy. Dicarma, Cabanatuan City 52,175.20 31-Aug-16
SANTIAGO-PANGANIBAN Municipal Integrated Parking Bldg., Panganiban St., Brgy. Centro East, Santiago City, Isabela 5,023.50 28-Aug-15ISABELA - ALICIA (formerly
SOLANO)Armando & Leticia de Guia Bldg., San Mateo Road, Antonio, Alicia, Isabela 44,642.86 31-Aug-17
STA. MARIA Jose Corazon De Jesus St., Poblacion, Sta. Maria, Bulacan 75,000.00 30-Sep-18
STA. ROSA-NUEVA ECIJA G/F, JNB Bldg., Brgy. Cojuangco, Cagayan Valley Road, Sta. Rosa, Nueva Ecija 43,758.23 30-Sep-16
SUBICLot 5 Retail 2, Times Square Mall, Sta. Rita Road, Subic Bay Freeport Zone, Olongapo City,
Zambales 222066,862.50 08-Oct-16
TABUK I-Square Bldg., Provincial Road, Poblacion Centro, Tabuk City, Kalinga 49,098.00 20-Dec-20
TARLAC-ZAMORA A & E Bldg., Unit 123, #06 Zamora St., Brgy. San Roque, Tarlac City 75,581.39 31-Oct-17
TUAO GF, Villacete Bldg., National Highway, Pata, Tuao, Cagayan 12,000.00 23-Sep-18TUGUEGARAO-BRICKSTONE
MALLG/F, Brickstone Mall, Km. 482, Maharlika Highway, Pengue Ruyu, Tuguegarao City,
Cagayan72,201.07 15-Nov-20
URDANETA-ALEXANDER AAG Bldg. 2, Alexander St., Urdaneta City, Pangasinan 86,821.88 14-Dec-17
VIGAN-QUEZON AVE. 36 Quezon Ave., Vigan City, Ilocos Sur 93,712.50 30-Apr-18
Southern Luzon
ALBAY CAPITOL ANST Bldg. II, Rizal St., Brgy. 14, Albay District., Legaspi City 60,372.90 12-Feb-19
ATIMONAN Our Lady of the Angels Parish Compund, Quezon Street, Atimonan,Quezon 35,000.00 15-Jul-20
BACOOR-PANAPAANSan Miguel Commercial Building, 215 E. Aguinaldo Highway, Barangay Panapaan I, Bacoor,
Cavite75,245.63 13-May-17
BATANGASUnit G1E, G/F Expansion Area, Nuciti Central Mall, P. Burgos St., Batangas City, Batangas
117,820.70 22-Mar-20
BATANGAS-KUMINTANG JPA AMA Bldg., National Hi-way, Kumintang Ilaya, Batangas City 60,000.00 28-Feb-20
BATANGAS-PALLOCAN WEST GF, MAJ Bldg., National Highway, Pallocan West, Batangas City 70,000.00 26-Jun-19
BAUAN G/F, ADD Building, J.P. Rizal St., Poblacion, Bauan, Batangas 31,250.00 02-Aug-16
BIÑAN Ammar Commercial Center, Nepa National Highway, Brgy. Sto. Domingo, Biñan, Laguna 76,500.00 31-Mar-23
BOAC Gov. Damian Reyes St., Murallon, Boac,Marinduque 26,785.20 31-Jul-19
BULAN Zone 4 Tomas de Castro St., Bulan, Sorsogon 40,516.88 31-Jul-17
CABUYAO Asia Brewery Complex, National Hi-way, Brgy. Sala, Cabuyao, Laguna 38,778.53 31-Mar-16

CABUYAO-CENTRO MALL Unit 124, Centro Mall, Brgy. Pulo, Cabuyao, Laguna 59,400.00 21-Jun-20
CALAMBA CROSSING G/F, Unit Building, J. Alcasid Business Center, Crossing Calamba City, Laguna 90,405.00 14-Mar-16
CALAMBA-BUCAL GF, Prime Unit 103 Carolina Center Bldg. COR. Ipil-ipil St., Brgy.Bucal, Calamba, Laguna 72,629.69 30-Nov-18
CALAMBA-NATL HI-WAY G/F, Sta. Cecilia Business Center II, Brgy. Parian, Calamba City, Laguna 39,000.00 15-Oct-16
CARMONA 9767 Brgy. Maduya, Carmona, Cavite 66,150.00 30-Apr-18
CAVITE-DASMARIÑAS G/F LCVM Bldg., Aguinaldo Hi-Way Zone IV, Dasmariñas, Cavite City 143,545.76 21-Dec-20
CEPZ Gen. Trias Drive, Rosario, Cavite 26,032.76 13-Feb-17
DAET-PIMENTEL F. Pimentel Ave. cor. Dasmarinas St., Daet, Camarines Norte 79,000.00 15-Mar-20
DASMARIÑAS-SALITRAN Michael's Bldg., Aguinaldo Highway, Salitran, Dasmariñas City, Cavite 57,821.43 25-Oct-20
GEN. TRIAS 129 Governor's Drive, Manggahan, General Trias, Cavite 59,484.38 31-Aug-18
GOA Juan Go Bldg., cor. Rizal & Bautista Sts., Goa, Camarines sur 37,500.00 31-Aug-17
GUMACA Andres Bonifacio St., Brgy. San Diego Poblacion, Gumaca, Quezon 80,000.00 29-Nov-20
IMUSGF, J. Antonio Bldg. 1167 Gen. Aguinaldo Highway, Bayan Luma 7, Imus, Cavite 4103
125,355.00 11-Nov-16
IMUS-AGUINALDO Sayoc Abella Bldg., E. Aguinaldo Hi-way, Imus, Cavite 91,162.97 30-Aug-20
LEGAZPI-IMPERIAL 35 F. Imperial St., Legaspi City, Albay 67,200.00 31-May-17
LEMERY Humarang Bldg., Corner Ilustre Ave. and P. De Joya St., Lemery Batangas 76,000.00 30-Jun-16
LIGAO San Jose St., Dunao, Ligao City, Albay 56,000.00 30-Sep-17
LIPA - AYALA HI-WAY K-Pointe Plaza, Ayala Hi-way, Brgy. Sabang, Lipa City, Batangas 75,000.00 31-Oct-20
LUCENA-ENRIQUEZ Enriquez corner Enverga Sts., Poblacion, Lucena City, Quezon 70,000.00 15-Sep-17
MAHARLIKA G/F, Kadiwa Building, Brgy. Maharlika, Sta. Cruz, Marinduque 39,025.80 20-Jun-15
MOLINO I.K. Commercial Bldg., Villa Maria Subd., Molino Highway, Molino III, Bacoor Cavite 74,842.50 31-May-19
NAGA-MAGSAYSAY G/F G Square Bldg., Magsaysay Ave. corner Catmon II St., Balatas, Naga City, Camarines Sur 75,000.00 14-Apr-19
NAGA-PANGANIBAN DECA Corporate Center, Panganiban Drive, Brgy. Tinago, Naga City, Camarines Sur 75,600.00 23-Feb-18
NAIC P. Poblete Street, Ibayo Silangan, Naic, Cavite 68,000.00 14-Feb-17
NASUGBU J. P. Laurel corner F. Alix Sts., Nasugbu, Batangas 70,000.00 31-May-19
PACITA COMPLEX JRJ Building, National Highway, Brgy. Nueva, San Pedro, Laguna 52,000.00 31-May-16
PASEO DE SANTA ROSABlk. 5 Lot 3B, Sta. Rosa Estate 2-A, Balibago, Tagaytay Road, Bo. Sto. Domingo, Sta. Rosa
City, 4026 Laguna135,000.00 14-May-16
PILI Cu Bldg, Old San Roque, Pili, Camarines Sur 60,648.00 31-Aug-17
PINAMALAYAN Mabini St., Zone IV, Pinamalayan, Oriental Mindoro 37,991.71 30-Sep-20
POLANGUI National Road, Ubaliw, Polangui, Albay 33,928.57 30-Apr-18

ROMBLON SAL Building, Republika St., Brgy. 1, Romblon, Romblon 18,700.00 11-Oct-19
SAN PABLO-COLAGO AVE. Mary Grace Building, Colago Ave. cor. Quezon Ave., San Pablo City, Laguna 54,697.78 30-Nov-16
SAN PEDRO-NATL HI-WAY Km. 31, National Highway, Brgy. Nueva, San Pedro, Laguna 71,662.50 28-Feb-18
SINILOAN G. Redor St. Siniloan, Laguna 77,058.80 17-Jan-16
SORSOGON-MAGSAYSAY 2nd Floor, PNB Sorsogon Branch Rizal St., Sorsogon City, Sorsogon 110,250.00 15-Dec-18
STA. CRUZ-REGIDOR 37 A. Regidor St., Sta. Cruz, Laguna 90,000.00 21-Feb-19
STA. ROSA NATIONAL HIGHWAY BALIBAGO CITY OF STA ROSA LAGUNA 82,000.00 10-Jun-16
TAGAYTAY Vistamart Bldg., Gen. E. Aguilnado Highway, Mendez Crossing West, Tagaytay City 62,500.00 29-Nov-19
TANAUAN G/F V. Luansing Bldg, J.P. Laurel Highway, Tanauan City, Batangas 70,312.50 21-Aug-16
TANZA G/F, Annie's Plaza Building, A. Soriano Highway, Daang Amaya, Tanza, Cavite 62,400.00 15-Oct-20
UP LOS BAÑOS LANZONES ST. UPLB COLLEGE LOS BANOS, LAGUNA 72,489.55month-to-
monthVIRAC 055 Quezon Ave., Brgy Salvacion, Virac, Catanduanes free BOT 21-Jul-18
Visayas
A. CORTES A. Cortes Ave., Ibabaw, Mandaue City, Cebu 96,032.77 29-Feb-16
BACOLOD 10th Lacson St., Bacolod City P99/year 12-Aug-65
BACOLOD EAST G/F, Besca Properties Bldg., Burgos Extension, Bacolod City, Negros Occidental 59,481.40 25-Oct-19
BACOLOD-HILADO Hilado corner L.N. Agustin Sts., Bacolod City 44,100.00 19-Feb-17
BACOLOD-LIBERTAD Penghong Bldg., Poinsetia St., Libertad Ext., Bacolod City, Negros Occidental 54,697.78 03-Nov-16BACOLOD-NEGROS CYBER
CENTRENegros First Cyber Centre Bldg., Lacson cor. Hernaez St., Bacolod City, Negros Occidental 58,000.00 12-Jul-18
BAIS Rosa Dy-Teves Bldg, Quezon St., Bais City 26,785.71 30-Nov-16
BANILAD Gov. M. Cuenco Ave., cor. Paseo Saturnino St., Banilad, Cebu City 117,315.00 28-Feb-20
BANILAD-FORTUNA AS Fortuna St., Banilad, Mandaue City, Cebu 50,000.00 31-Mar-17
BANTAYANJ.P. Rizal St., Ticad, Bantayan, Cebu City
53,340.00 21-Jun-25
BOGO Cor. R. Fernan & San Vicente Sts., Bogo City, Cebu 24,310.12 16-Apr-16
BORACAY STATION Venue One Hotel, Main Road Station 1, Balabag, Boracay Island, Malay, Aklan 193,821.69 10-Apr-21
CARBON 41-43 Plaridel St., Ermita, Cebu City 108,000.00 31-Oct-19
CARCAR Jose Rizal St., Poblacion 1, Carcar City, Cebu 69,283.86 21-Feb-16
CEBU BUSINESS PARKUnit F, Upper G/F, FLB Corporate Center, Archbishop Reyes Avenue, Cebu Business Park,
Cebu City131,560.00 06-Dec-20
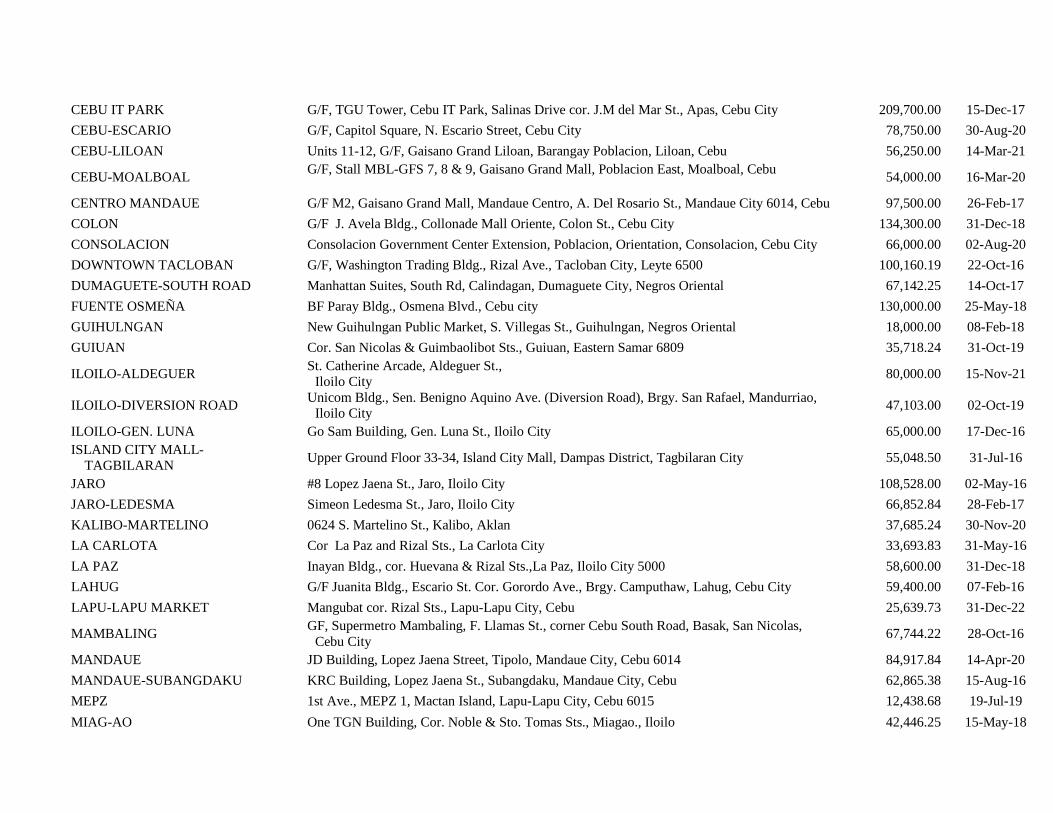
CEBU IT PARK G/F, TGU Tower, Cebu IT Park, Salinas Drive cor. J.M del Mar St., Apas, Cebu City 209,700.00 15-Dec-17
CEBU-ESCARIO G/F, Capitol Square, N. Escario Street, Cebu City 78,750.00 30-Aug-20
CEBU-LILOAN Units 11-12, G/F, Gaisano Grand Liloan, Barangay Poblacion, Liloan, Cebu 56,250.00 14-Mar-21
CEBU-MOALBOALG/F, Stall MBL-GFS 7, 8 & 9, Gaisano Grand Mall, Poblacion East, Moalboal, Cebu
54,000.00 16-Mar-20
CENTRO MANDAUE G/F M2, Gaisano Grand Mall, Mandaue Centro, A. Del Rosario St., Mandaue City 6014, Cebu 97,500.00 26-Feb-17
COLON G/F J. Avela Bldg., Collonade Mall Oriente, Colon St., Cebu City 134,300.00 31-Dec-18
CONSOLACION Consolacion Government Center Extension, Poblacion, Orientation, Consolacion, Cebu City 66,000.00 02-Aug-20
DOWNTOWN TACLOBAN G/F, Washington Trading Bldg., Rizal Ave., Tacloban City, Leyte 6500 100,160.19 22-Oct-16
DUMAGUETE-SOUTH ROAD Manhattan Suites, South Rd, Calindagan, Dumaguete City, Negros Oriental 67,142.25 14-Oct-17
FUENTE OSMEÑA BF Paray Bldg., Osmena Blvd., Cebu city 130,000.00 25-May-18
GUIHULNGAN New Guihulngan Public Market, S. Villegas St., Guihulngan, Negros Oriental 18,000.00 08-Feb-18
GUIUAN Cor. San Nicolas & Guimbaolibot Sts., Guiuan, Eastern Samar 6809 35,718.24 31-Oct-19
ILOILO-ALDEGUERSt. Catherine Arcade, Aldeguer St.,
Iloilo City80,000.00 15-Nov-21
ILOILO-DIVERSION ROADUnicom Bldg., Sen. Benigno Aquino Ave. (Diversion Road), Brgy. San Rafael, Mandurriao,
Iloilo City47,103.00 02-Oct-19
ILOILO-GEN. LUNA Go Sam Building, Gen. Luna St., Iloilo City 65,000.00 17-Dec-16ISLAND CITY MALL-
TAGBILARANUpper Ground Floor 33-34, Island City Mall, Dampas District, Tagbilaran City 55,048.50 31-Jul-16
JARO #8 Lopez Jaena St., Jaro, Iloilo City 108,528.00 02-May-16
JARO-LEDESMA Simeon Ledesma St., Jaro, Iloilo City 66,852.84 28-Feb-17
KALIBO-MARTELINO 0624 S. Martelino St., Kalibo, Aklan 37,685.24 30-Nov-20
LA CARLOTA Cor La Paz and Rizal Sts., La Carlota City 33,693.83 31-May-16
LA PAZ Inayan Bldg., cor. Huevana & Rizal Sts.,La Paz, Iloilo City 5000 58,600.00 31-Dec-18
LAHUG G/F Juanita Bldg., Escario St. Cor. Gorordo Ave., Brgy. Camputhaw, Lahug, Cebu City 59,400.00 07-Feb-16
LAPU-LAPU MARKET Mangubat cor. Rizal Sts., Lapu-Lapu City, Cebu 25,639.73 31-Dec-22
MAMBALINGGF, Supermetro Mambaling, F. Llamas St., corner Cebu South Road, Basak, San Nicolas,
Cebu City67,744.22 28-Oct-16
MANDAUE JD Building, Lopez Jaena Street, Tipolo, Mandaue City, Cebu 6014 84,917.84 14-Apr-20
MANDAUE-SUBANGDAKU KRC Building, Lopez Jaena St., Subangdaku, Mandaue City, Cebu 62,865.38 15-Aug-16
MEPZ 1st Ave., MEPZ 1, Mactan Island, Lapu-Lapu City, Cebu 6015 12,438.68 19-Jul-19
MIAG-AO One TGN Building, Cor. Noble & Sto. Tomas Sts., Miagao., Iloilo 42,446.25 15-May-18
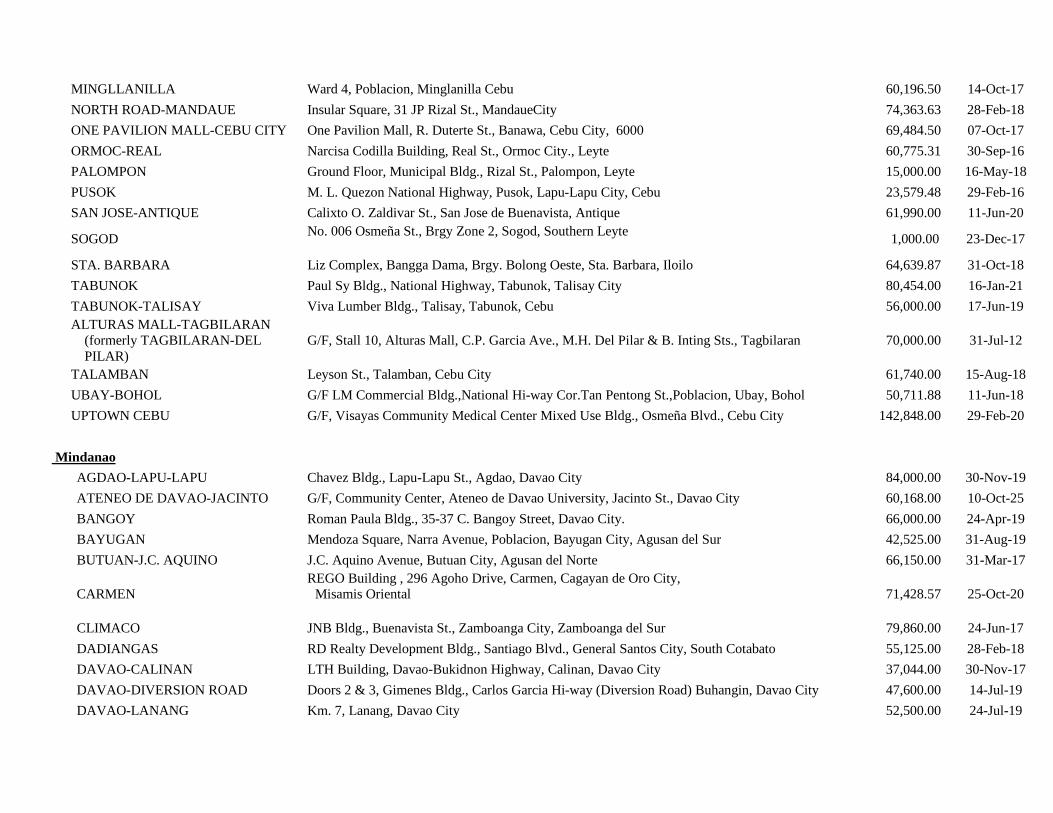
MINGLLANILLA Ward 4, Poblacion, Minglanilla Cebu 60,196.50 14-Oct-17
NORTH ROAD-MANDAUE Insular Square, 31 JP Rizal St., MandaueCity 74,363.63 28-Feb-18
ONE PAVILION MALL-CEBU CITY One Pavilion Mall, R. Duterte St., Banawa, Cebu City, 6000 69,484.50 07-Oct-17
ORMOC-REAL Narcisa Codilla Building, Real St., Ormoc City., Leyte 60,775.31 30-Sep-16
PALOMPON Ground Floor, Municipal Bldg., Rizal St., Palompon, Leyte 15,000.00 16-May-18
PUSOK M. L. Quezon National Highway, Pusok, Lapu-Lapu City, Cebu 23,579.48 29-Feb-16
SAN JOSE-ANTIQUE Calixto O. Zaldivar St., San Jose de Buenavista, Antique 61,990.00 11-Jun-20
SOGODNo. 006 Osmeña St., Brgy Zone 2, Sogod, Southern Leyte
1,000.00 23-Dec-17
STA. BARBARA Liz Complex, Bangga Dama, Brgy. Bolong Oeste, Sta. Barbara, Iloilo 64,639.87 31-Oct-18
TABUNOK Paul Sy Bldg., National Highway, Tabunok, Talisay City 80,454.00 16-Jan-21
TABUNOK-TALISAY Viva Lumber Bldg., Talisay, Tabunok, Cebu 56,000.00 17-Jun-19ALTURAS MALL-TAGBILARAN
(formerly TAGBILARAN-DELPILAR)
G/F, Stall 10, Alturas Mall, C.P. Garcia Ave., M.H. Del Pilar & B. Inting Sts., Tagbilaran 70,000.00 31-Jul-12
TALAMBAN Leyson St., Talamban, Cebu City 61,740.00 15-Aug-18
UBAY-BOHOL G/F LM Commercial Bldg.,National Hi-way Cor.Tan Pentong St.,Poblacion, Ubay, Bohol 50,711.88 11-Jun-18
UPTOWN CEBU G/F, Visayas Community Medical Center Mixed Use Bldg., Osmeña Blvd., Cebu City 142,848.00 29-Feb-20
Mindanao
AGDAO-LAPU-LAPU Chavez Bldg., Lapu-Lapu St., Agdao, Davao City 84,000.00 30-Nov-19
ATENEO DE DAVAO-JACINTO G/F, Community Center, Ateneo de Davao University, Jacinto St., Davao City 60,168.00 10-Oct-25
BANGOY Roman Paula Bldg., 35-37 C. Bangoy Street, Davao City. 66,000.00 24-Apr-19
BAYUGAN Mendoza Square, Narra Avenue, Poblacion, Bayugan City, Agusan del Sur 42,525.00 31-Aug-19
BUTUAN-J.C. AQUINO J.C. Aquino Avenue, Butuan City, Agusan del Norte 66,150.00 31-Mar-17
CARMENREGO Building , 296 Agoho Drive, Carmen, Cagayan de Oro City,
Misamis Oriental 71,428.57 25-Oct-20
CLIMACO JNB Bldg., Buenavista St., Zamboanga City, Zamboanga del Sur 79,860.00 24-Jun-17
DADIANGAS RD Realty Development Bldg., Santiago Blvd., General Santos City, South Cotabato 55,125.00 28-Feb-18
DAVAO-CALINAN LTH Building, Davao-Bukidnon Highway, Calinan, Davao City 37,044.00 30-Nov-17
DAVAO-DIVERSION ROAD Doors 2 & 3, Gimenes Bldg., Carlos Garcia Hi-way (Diversion Road) Buhangin, Davao City 47,600.00 14-Jul-19
DAVAO-LANANG Km. 7, Lanang, Davao City 52,500.00 24-Jul-19

DAVAO-OBREROG/F JJ Commune Bldg., Loyola St., Bo. Obrero, Davao City
72,828.00 30-Jun-18
DIGOS-GEN. LUNA Gonzales Building, Gen. Luna St., Digos City, Davao del Sur 40,262.42 30-Sep-20
DIPOLOG-RIZAL Rizal Ave. cor. Osmena St., Dipolog City, Zamboanga del Norte 98,398.13 16-Apr-17
GAISANO CAPITAL-SURIGAO Gaisano Capital, KM 4, National Highway, Barangay Luna, Surigao City 35,663.00 10-Jul-17
GENERAL SANTOS-ACHARON Pedro Acharon Blvd., General Santos City, South Cotabato 21,533.40 30-Jun-16
ILIGAN-QUEZON Quezon Ave., Poblacion, Iligan City, Lanao del Norte 92,610.00 31-Oct-16
ISULAN Aristoza Bldg., National Highway, Isulan, Sultan Kudarat 38,808.00 31-May-17
KCC MALL DE ZAMBOANGAUpper Ground Floor, KCC Mall de Zamboanga, Gov. Camins St., Brgy. Camino Nuevo,
Zamboanga City17,280.00 28-Feb-17
KCC MALL-GEN. SANTOS CITYUnit 018 Lower G/F KCC Mall of Gensan, Jose Catolico Sr. Ave. General Santos City, South
Cotabato 98,435.17 10-Apr-16
LILOY Chan Bldg., Baybay, Liloy, Zamboanga del Norte 35,000.00 30-Apr-20LIMKETKAI MALL-NORTH
CONCOURSEG/F North Concourse, Limketkai Mall, Limketkai Center, Lapasan, Cagayan de Oro City,
Misamis Oriental174,567.97 31-Oct-16
MALAYBALAY Flores Bldg., cor. Rizal & Tabios Sts., Brgy. 5, Malaybalay City, Bukidnon 54,000.00 30-Apr-17
MALAYBALAY-FORTICH Fortich cor. Kapitan Juan Sts., Brgy 7, Malaybalay City, Bukidnon 42,350.00 31-Mar-18
MATINA HIJ Bldg., Mc Arthur Highway, Brgy. Matina, Davao City 55,357.14 01-May-18
MATINA CROSSING 80 Lua Building, Mc Arthur Highway, Matina, Davao City 40,000.00 14-Sep-20
MONTEVERDE Mintrade Bldg., Monteverde St. cor. Sales St., Davao City,Davao del Sur 94,905.05 31-Mar-17
MONTEVERDE-BANGOY 42 T.Monteverde cor. S. Bangoy Sts., Davao City 119,590.94 13-Mar-20
OZAMIS-GOMEZ Gomez cor. Burgos Sts., 50th Brgy., Ozamis City, Misamis Occidental 52,500.00 30-Sep-18
PALA-O G/F Iligan Day Inn Bldg., Benito S. Ong St., Pala-O, Iligan City, Lanao del Norte 48,616.07 30-Sep-17
PANABO CITYG/F Gaisano Grand Mall of Panabo, Quezon St., Brgy. Sto. Niño, Panabo City, Davao Del
Norte56,223.25 30-Nov-16
SASA Carmart Bldg., Km 8, Sasa, Davao City 41,659.54 14-Nov-18
SINDANGAN Corner Rizal & Bonifacio Sts., Poblacion, Sindangan, Zamboanga del Norte 10,368.00 11-Aug-22
STA. ANA DAVAO Bonifacio Tan Bldg., Rosemary cor. Bangoy Sts., Sta. Ana Dist., Davao City, Davao del Sur 57,375.00 30-Apr-18
STA. ANA-MAGSAYSAY R. Magsaysay Ave. cor. Lizada St., Davao City 115,473.09 24-May-16
SURIGAO-WASHINGTON San Nicolas St., Brgy. Washington, Surigao City, Surigao del Norte 112,815.00 31-Mar-16
TAGUM-APOKONGL 04-06 Gaisano Grand Arcade,Apokon Road corner Lapu-Lapu Ext., Brgy. Visayan
Village, Tagum City, Davao Del Norte52,093.13 15-Sep-17
TETUAN G/F, AL Gonzalez & Sons Bldg., Veterans Ave., Zamboanga City 7000 62,012.50 02-Apr-17

TORIL Anecita G. Uy Bldg., Saavedra St., Toril, Davao City, Davao del Sur 60,062.68 01-Jun-17
VALENCIA Tamay Lang Bldg., G. Lavina St., Poblacion, Valencia, Bukidnon 65,595.63 20-Apr-17
VALENCIA-MABINI Tamaylang Bldg., Mabini Street, Poblacion, Valencia City, Bukidnon 58,593.75 28-Feb-21
ZAMBOANGA-CANELAR G/F Blue Shark Hotel, Mayor Jaldon St., Canelar, Zamboanga City 53,146.83 31-Aug-22ZAMBOANGA-NUÑEZ EXT. Ciudad Medical, Zamboanga Nuñez Ext., Camino Nuevo, Zamboanga City 60,000.00 31-May-16ZAMBOANGA-SAN JOSE San Jose, Zamboanga City, Zamboanga del Sur 30,000.00 22-Apr-19
ZAMBOANGA-VETERANSAVENUE
G/F Zamboanga Doctors' Hospital, Annex Bldg., Veterans Ave., Zamboanga City, Zamboangadel Sur
73,856.48 15-May-17