Embed Size (px)
Citation preview

StudentHealth Center
Survey
September 20th, 2009
LIT Student Health Centerc/o: Mr. Pat GavinDirector, Student Health CenterLordsburg Institute of Technology
Subject: Report on the Results of the Student Health Center Survey
Dear Mr. Gavin:
We are pleased to present you with a report on the findings from our recent survey of LIT students concerning the services provided by the Student Health Center. This report was prepared following our initial meeting with you on April 2nd.
Per our meeting, we aimed to cover a general area of services to determine which services could be improved upon or changed. With no immediate issues to be researched or questions to be answered, we focused on the students’ general awareness of the Student Health Center, its services, and their comparisons of it to other medical providers. We think you will find our results both useful and enlightening.
The survey was distributed to a convenience sample using LIT students throughout campus over the weeklong period of May 13th – May 17th. Campus areas of distribution included but were not limited to the AJ Library, the Olive Center, various classes, and computer labs. The total number of surveys tabulated came to 100. Questions on the survey were prepared using input from our April 2nd meeting as well as personal and secondary data sources.
The results of this project can be used by your department to streamline currently offered services and to suggest new services of interest to students. Our data tabulations can also help your department excel in under-serviced areas and continue to keep up the good work in other areas. We would like to thank you for your assistance in this research and we wish you the best of luck in the future.
Sincerely,
Aaron JeanRobin Peterson
Table of Contents
Letter of Transmittal……………………………………X
Executive Summary……………………………………..1
Research Introduction…………………………………..2
Introduction…...……………………………….2
Objectives………………………………………2
Methodology……………………………………………...3
Results…………………………………………………….3
Frequency Interpretations…………………….3
Cross Tabulations……………………………...9
Conclusions and Recommendations……………………10
Limitations ……………………………………………....12
Appendices ………………………………………………15
Research Proposal……………………………..15
Questionnaire…………………………………..16
Descriptive Statistics…………………………...20
Frequency Tables……………………………....23
Cross Tabulations………………………………47
Executive Summary
Knowing what is offered at your school, what costs you pay without even knowing, and what services are offered to you are all important details that students should be aware of to take full advantage of their “student status”. Does LIT do this for you? A survey was conducted to discover if students at LIT really do know what is offered to them. The purpose of this research is to assess whether or not the Student Health Center is doing a good job at informing students of its services. This research can also help the Student Health Center to improve its services, to help increase patient count and patient service, as well as to give students the confidence to choose the Student Health Center as their primary healthcare provider. An additional benefit most students might overlook is the Student Health Center is located on campus and is reliable. Does this mean anything to the average LIT student? Does the Student Health Center measure up among other healthcare providers? This and more is what we intended to discover.
Information was collected through a survey distributed to 100 LIT students (through a convenience sample) with varying class loads, residence locations, and ages. Data collected from the questionnaire (questionnaire attached in the appendix) was entered into a data analysis program (SPSS) and analyzed through statistical tools including descriptive statistic tables, frequency tables, and cross tabulations.
Results of the survey showed that students’ opinions of current services provided by the Student Health Center generally were positive, even when compared to other healthcare providers. It was concluded that there is significant room for improvement in the areas of advertising, knowledge for preventative healthcare services, and knowledge for hours of operation. Recommendations include a heavy emphasis on a new advertising strategy for the Health Center that will reach students while conveying its array of lesser-known services. Other areas to note are doctor sincerity and affordable pricing. These two factors were more highly regarded than timeliness of service and location of service.
Our intentions for this research project were to increase the effectiveness of the Student Health Center to meet the wants and needs of the LIT student population. It is an already existing service that can be improved.
Research Introduction
Introduction
With an increasingly more health conscious society, Americans are frequenting the doctor’s office on a regular basis and seem to be genuinely concerned with fluctuations in their health and changes in their bodies. In Lordsburg, the organic grocery store Olive Market has opened up in the past year, new beauty and health spas including Dian’s Noble Spa have established themselves just recently, Vitamin-R-Us opened its doors in the downtown mall, and Eat Healthy diet menus have been added to several local restaurants’ menus. This overall shift for Lordsburg means that the general health craze is upon us, so as students of Lordsburg Institute of Technology, we wanted to research who was using the Student Health Center and what the average student knew about its services.
With ever-present health threats to young adults it is important for LIT to do what it can to help keep its students safe and protected. We want to contribute something to the health services and health service improvements being provided to all current and future LIT students; and by doing so, leave our “footprint” at LIT, because health is such a universally important and necessary issue.
Objectives
In creating our research project, we had to narrow the broad topic of health to just the specifics we were interested in addressing at the LIT Student Health Center. Ultimately, we chose these five final objectives for our research:
1. Determine the largest target market for Student Health Center services.
2. Identify this target market’s opinion of the Student Health Center.
3. Discover the target market’s knowledge about the services offered.
4. Determine what severity of illness brings the target market to seek medical attention.
5. Learn what aspects of health care and the health care process the Student Health Center can improve to be more competitive.
Methodology
This research project used an exploratory survey, which consisted of many closed-ended questions. By using these types of questions, we were able to address our research objectives. There were 100 surveys distributed and returned. These surveys were answered by students at LIT, with the majority being from ages 18 to 25, which is the target market for the LIT Student Health Center. A convenience sample of students was collected from places such as AJ Library, the Olive Center, a variety of classes, and computer labs. Upon their consent, students were asked to complete the survey and return it to one of the researchers. Data from all completed questionnaires were entered into SPSS for data analysis.
Results
Frequency Interpretations (see appendix for actual tables)
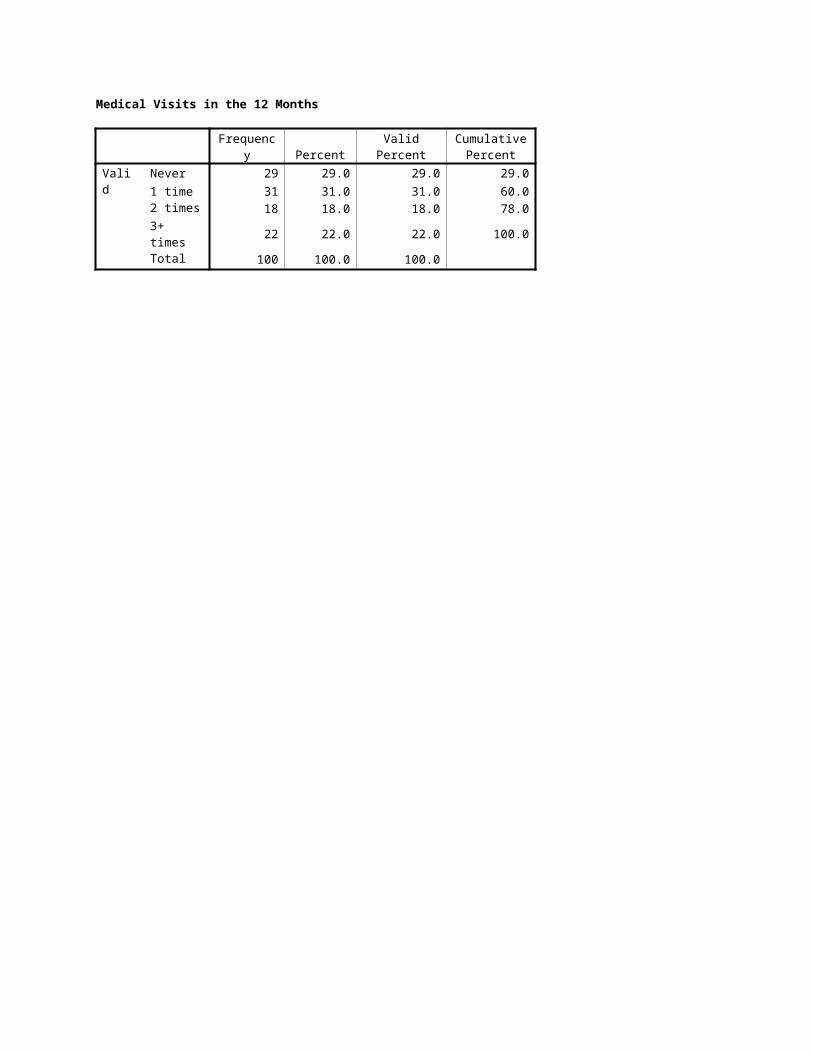
Frequency of Medical AttentionFrequency: The results of the survey showed in the last twelve months 29% of those surveyed never sought medical attention, 31% only received medical attention one time, 18% went twice, and 22% went three times.
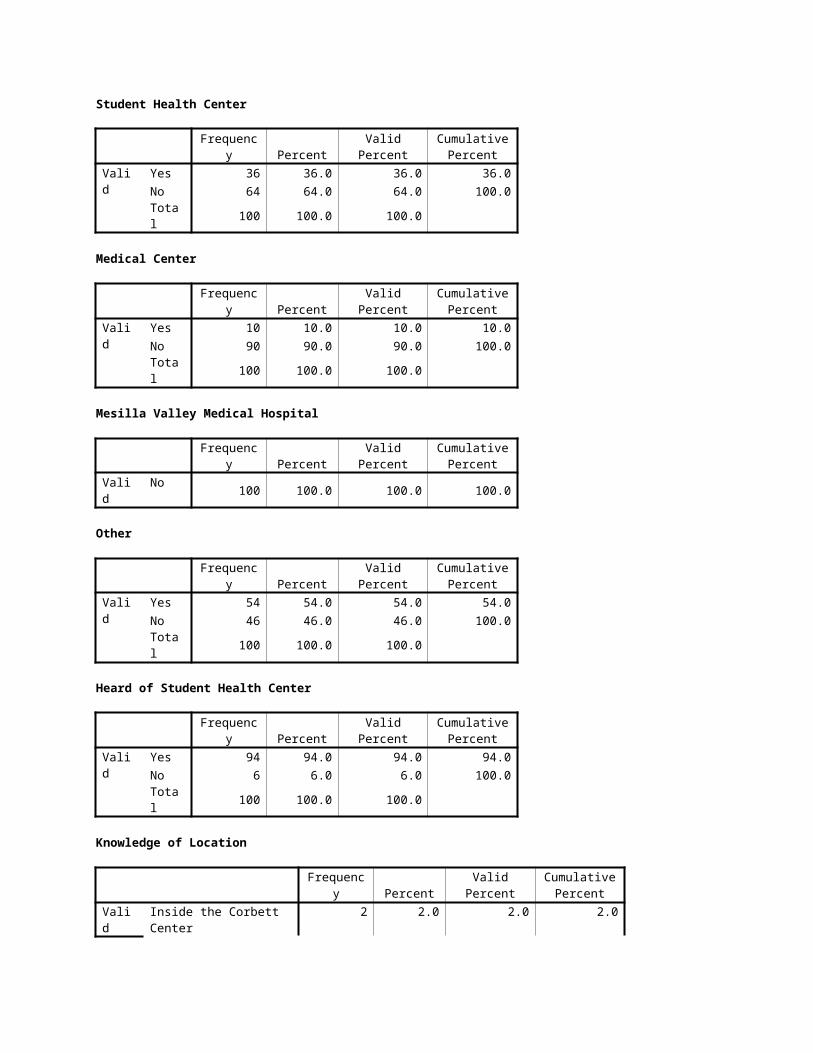
Location of Non-Emergency Medical AttentionFrequency: Of the people surveyed, 36% seek medical attention at the Student Health Center. There were 10% of people that went to the Medical Center, and 54% said they attended other medical facilities.
Knowledge of the Student Health CenterFrequency: 94% of students said that they have heard of the Student Health Center and 6% have not heard of it.
Knowledge of Location of the Student Health CenterFrequency: When asked the location of the Student Health Center, 74% knew the correct location, 2% guessed it to be in the Olive Center, and 24% said that they did not know where it was located.
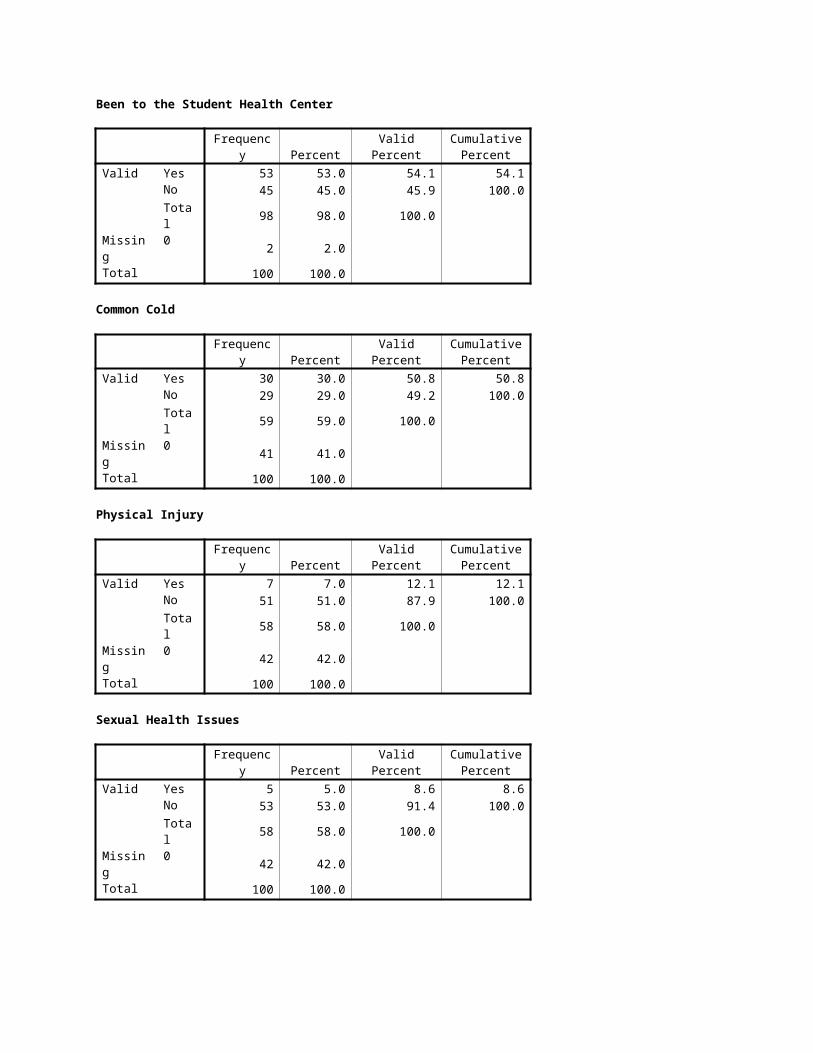
Visited the Student Health CenterFrequency: Of the students surveyed, 53% have visited and 45% never visited the Student Health Center.
Services Sought at the Student Health CenterFrequency: Of the people surveyed, 30% went for a common cold, 7% went for physical injury, 5% for sexual health issues, and 18% for another reason.
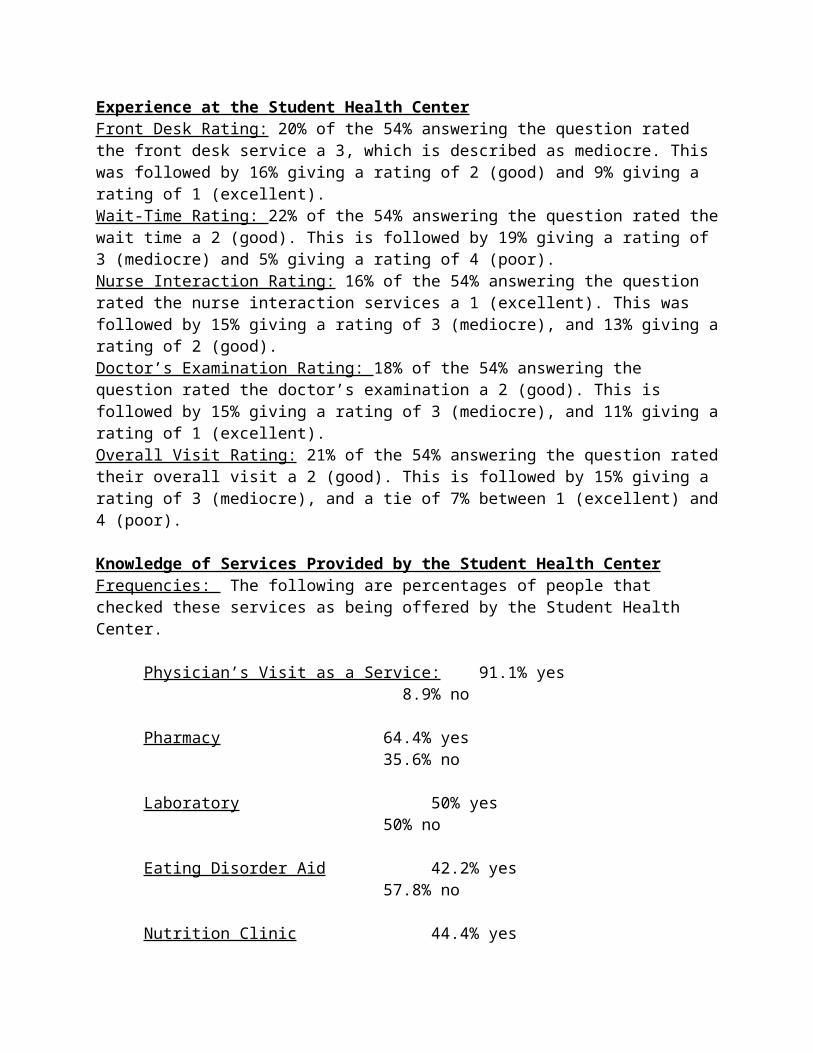
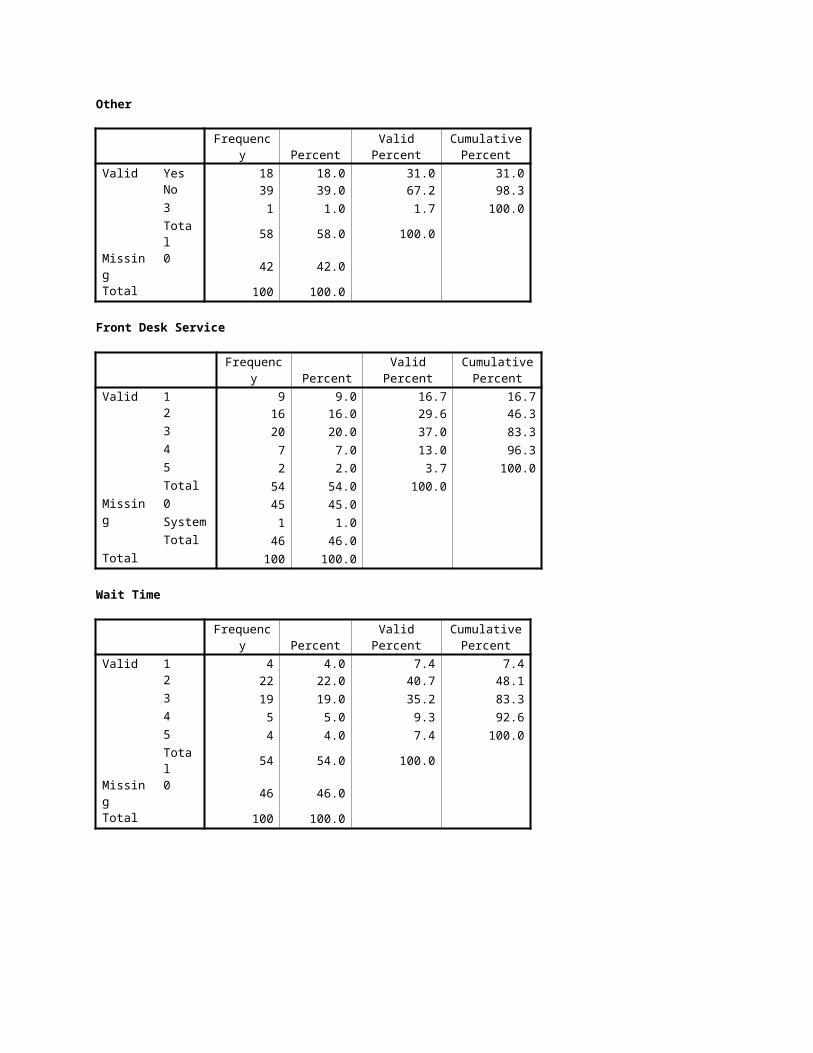
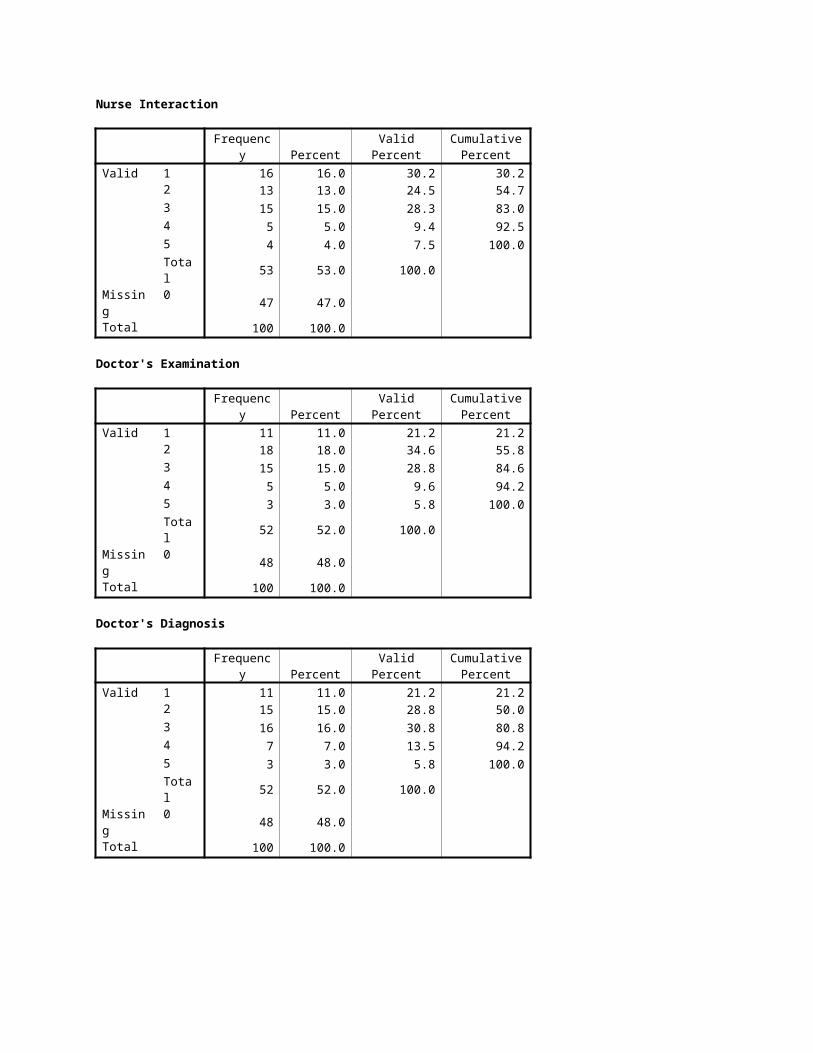
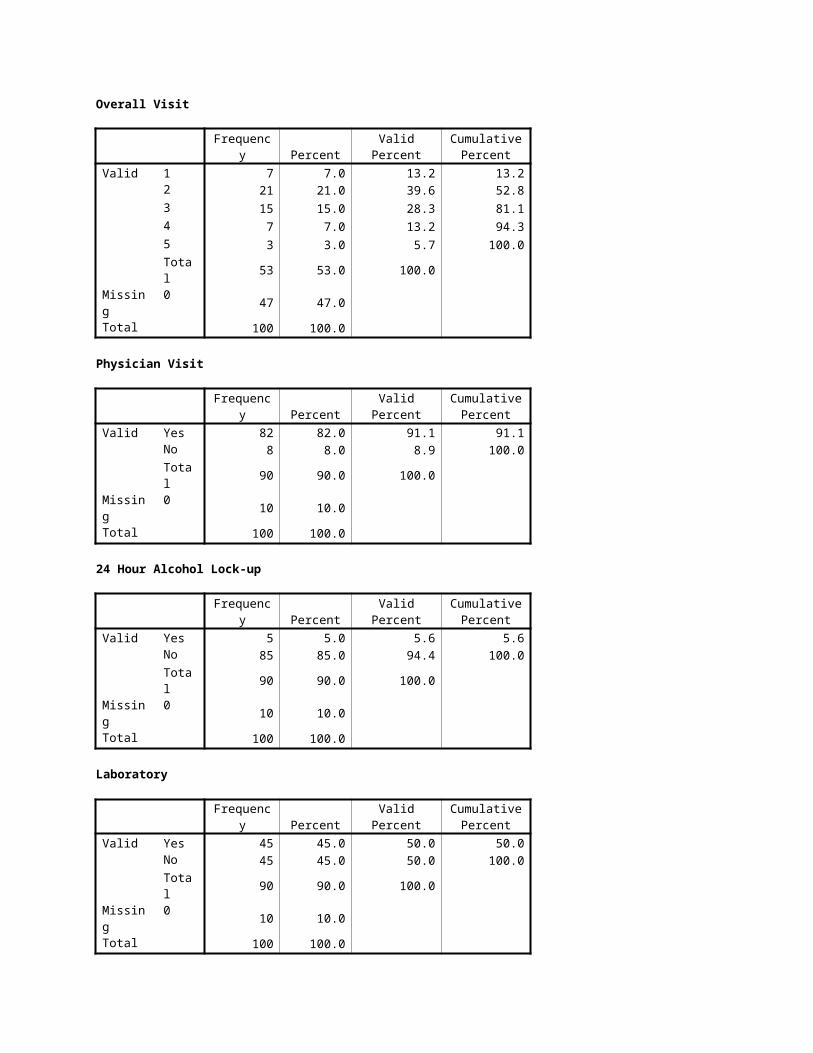
Experience at the Student Health CenterFront Desk Rating: 20% of the 54% answering the question rated the front desk service a 3, which is described as mediocre. This was followed by 16% giving a rating of 2 (good) and 9% giving a rating of 1 (excellent).Wait-Time Rating: 22% of the 54% answering the question rated the wait time a 2 (good). This is followed by 19% giving a rating of 3 (mediocre) and 5% giving a rating of 4 (poor).Nurse Interaction Rating: 16% of the 54% answering the question rated the nurse interaction services a 1 (excellent). This was followed by 15% giving a rating of 3 (mediocre), and 13% giving a rating of 2 (good).Doctor’s Examination Rating: 18% of the 54% answering the question rated the doctor’s examination a 2 (good). This is followed by 15% giving a rating of 3 (mediocre), and 11% giving a rating of 1 (excellent).Overall Visit Rating: 21% of the 54% answering the question rated their overall visit a 2 (good). This is followed by 15% giving a rating of 3 (mediocre), and a tie of 7% between 1 (excellent) and 4 (poor).
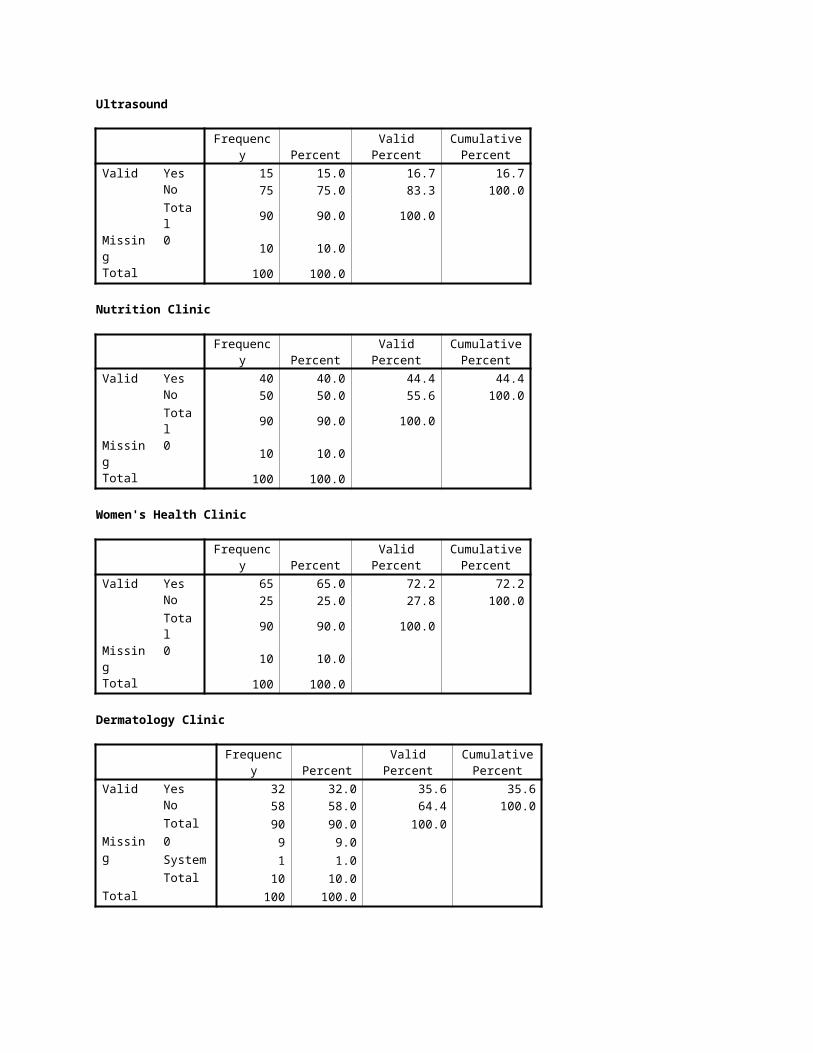
Knowledge of Services Provided by the Student Health CenterFrequencies: The following are percentages of people that checked these services as being offered by the Student Health Center.
Physician’s Visit as a Service: 91.1% yes 8.9% no
Pharmacy 64.4% yes35.6% no
Laboratory 50% yes50% no
Eating Disorder Aid 42.2% yes57.8% no
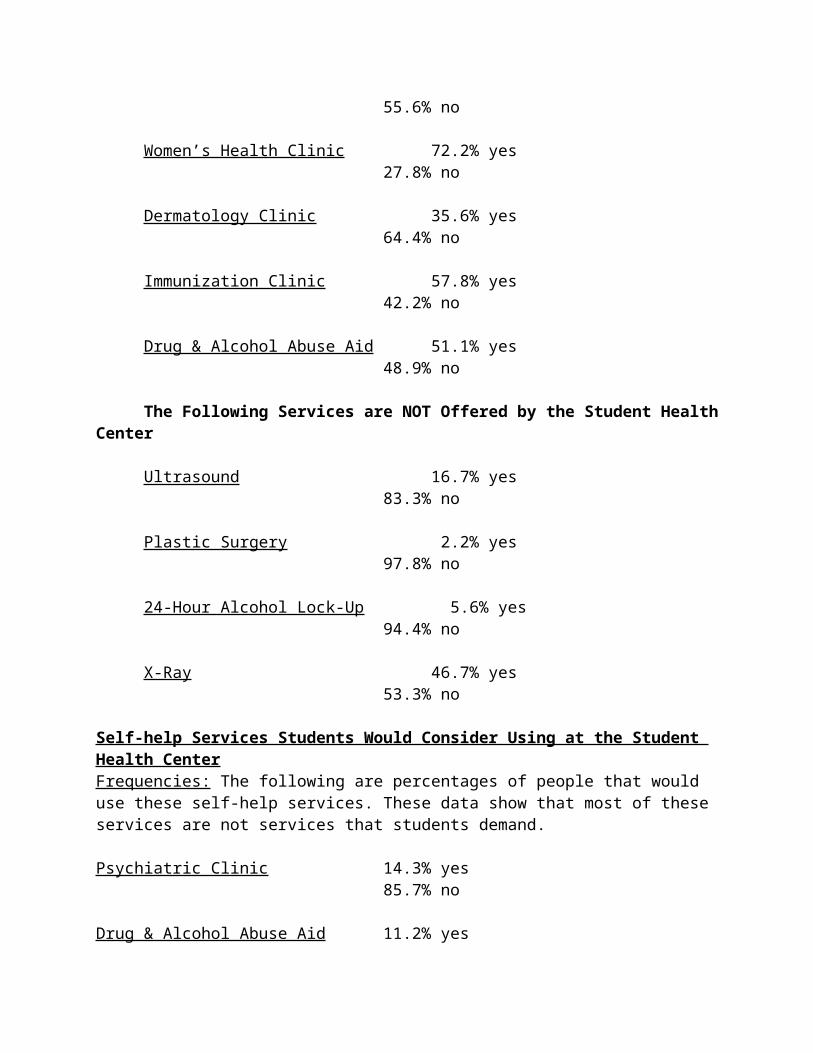
Nutrition Clinic 44.4% yes55.6% no
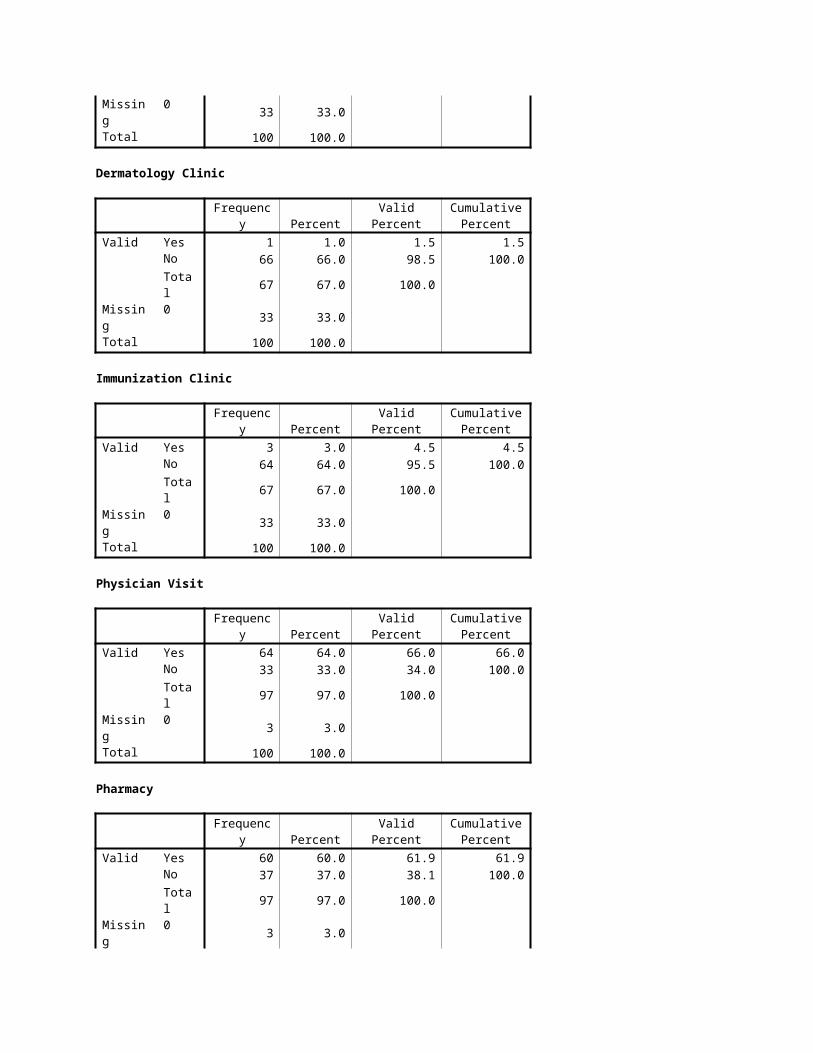
Women’s Health Clinic 72.2% yes27.8% no
Dermatology Clinic 35.6% yes64.4% no
Immunization Clinic 57.8% yes42.2% no
Drug & Alcohol Abuse Aid 51.1% yes48.9% no
The Following Services are NOT Offered by the Student Health Center
Ultrasound 16.7% yes83.3% no
Plastic Surgery 2.2% yes97.8% no
24-Hour Alcohol Lock-Up 5.6% yes94.4% no
X-Ray 46.7% yes53.3% no
Self-help Services Students Would Consider Using at the Student Health CenterFrequencies: The following are percentages of people that would use these self-help services. These data show that most of these services are not services that students demand.
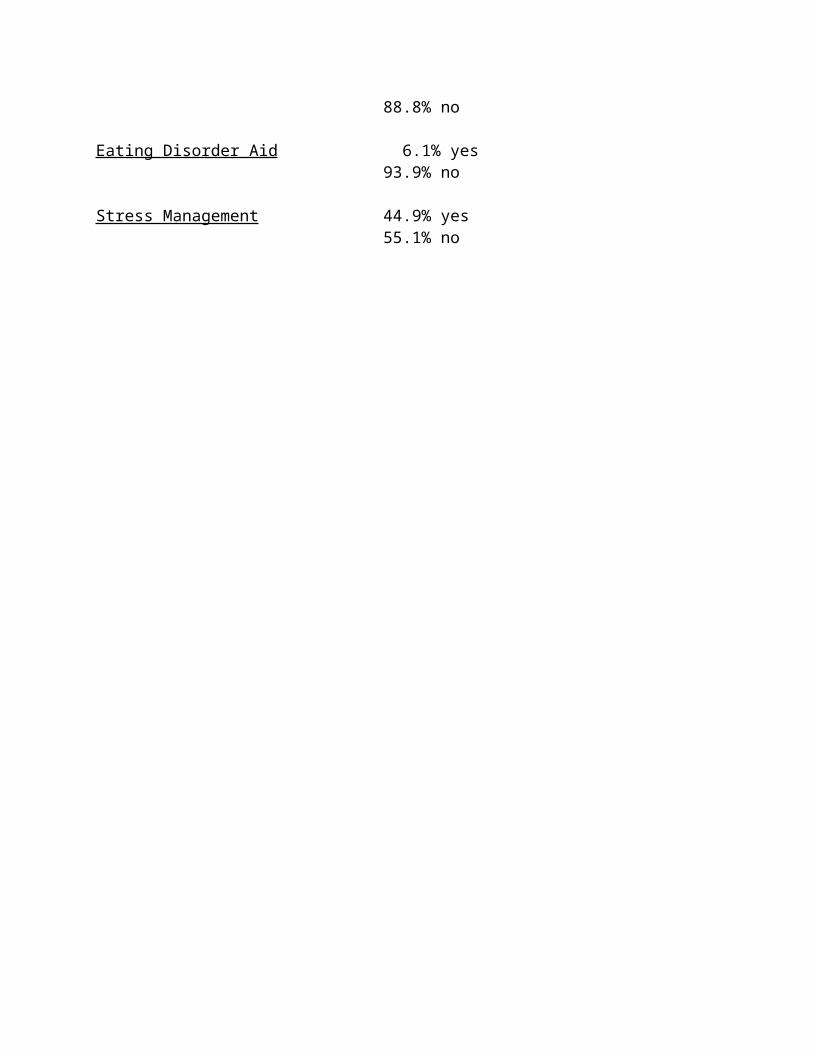
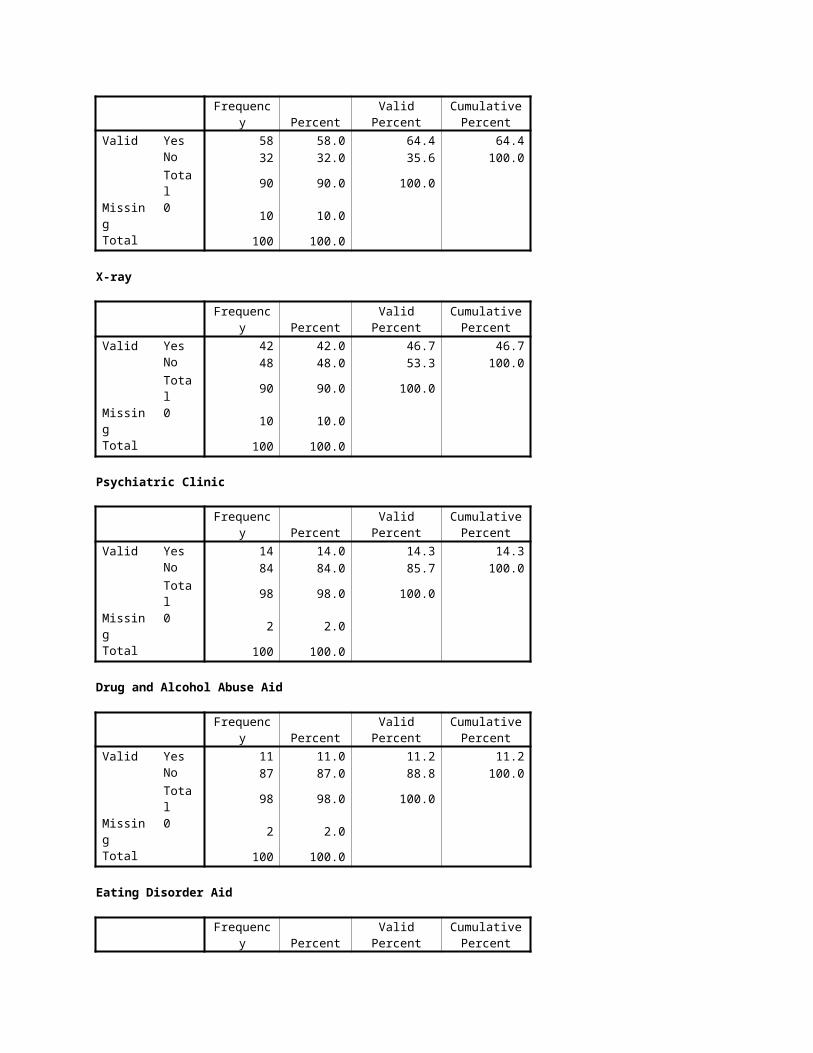
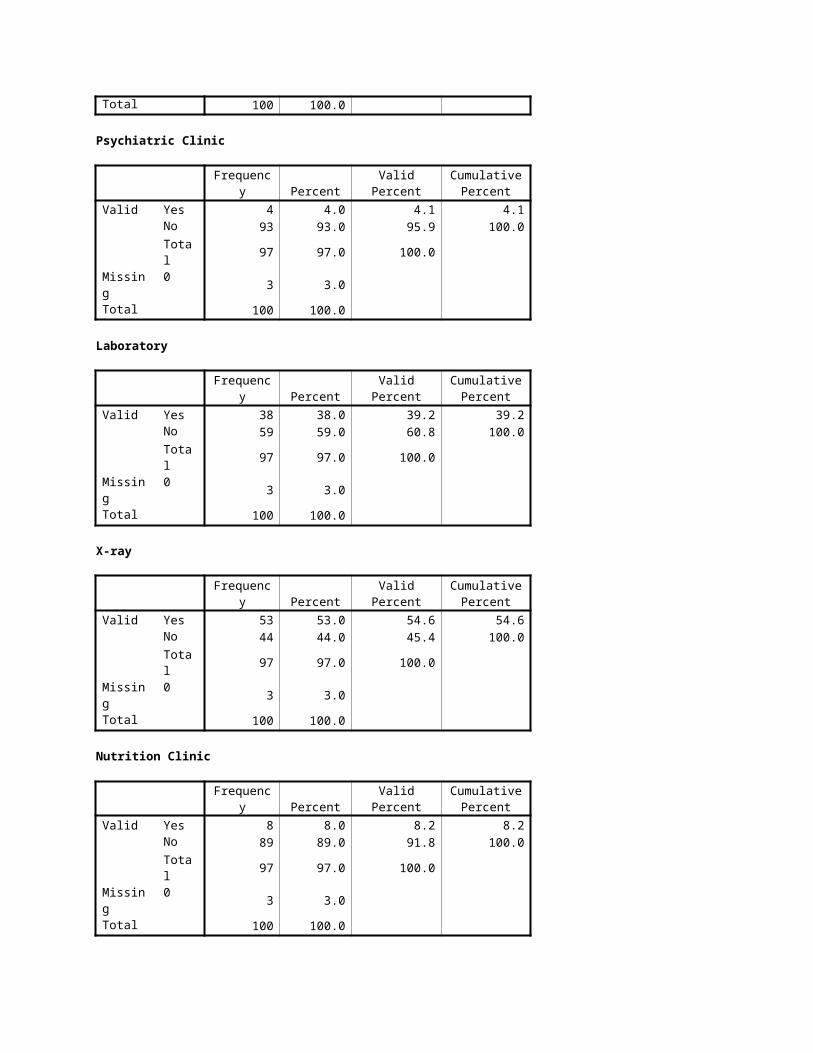
Psychiatric Clinic 14.3% yes85.7% no
Drug & Alcohol Abuse Aid 11.2% yes88.8% no
Eating Disorder Aid 6.1% yes93.9% no
Stress Management 44.9% yes55.1% no
Services Used by Students
LIT Health Center Other Health Care Facilities
Physician’s Visit 67.2% yes 66% yes32.8% no 34% no
Pharmacy 49.3% yes 61.9% yes50.7% no 38.1% no
Psychiatric Clinic 1.5% yes 4.1% yes98.5% no 95.9% no
Laboratory 16.4% yes 39.2% yes83.6% no 60.8% no
X-ray 10.4% yes 54.6% yes89.6% no 45.4% no
Nutrition Clinic 4.5% yes 8.2% yes95.5% no 91.8% no
Women’s Health 16.4% yes 23.7% yesClinic 83.6% no 76.3% no
Dermatology 1.5% yes 8.6% yesClinic 98.5% no 81.4% no
Immunization 4.5% yes 30.9% yesClinic 95.5% no 69.1% no
Importance of Doctor Gender to PatientsFrequency: Of the students surveyed, 24.2% said that the gender of the doctor was important to them when choosing a healthcare provider, and 75.8% said that it didn’t matter. With nearly 25% saying that doctor gender was important to them, it may be worth asking patients if there is a specific gender that they would prefer, to make them more comfortable.
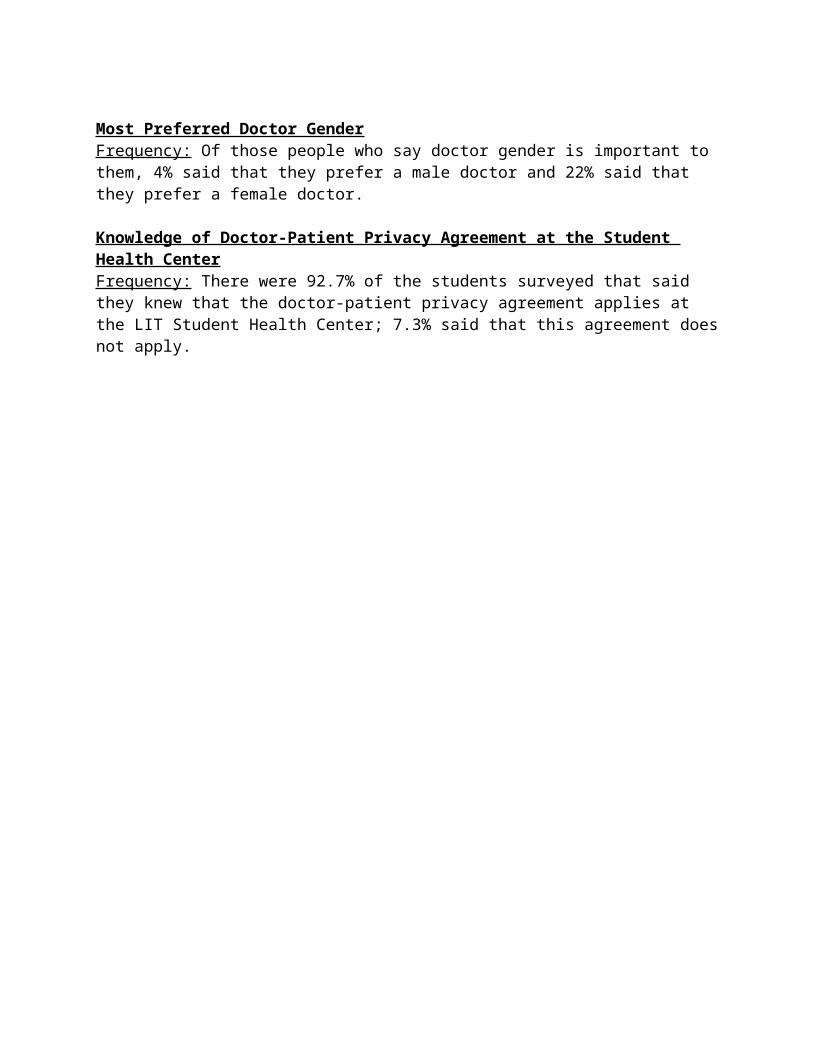
Most Preferred Doctor GenderFrequency: Of those people who say doctor gender is important to them, 4% said that they prefer a male doctor and 22% said that they prefer a female doctor.
Knowledge of Doctor-Patient Privacy Agreement at the Student Health CenterFrequency: There were 92.7% of the students surveyed that said they knew that the doctor-patient privacy agreement applies at the LIT Student Health Center; 7.3% said that this agreement does not apply.
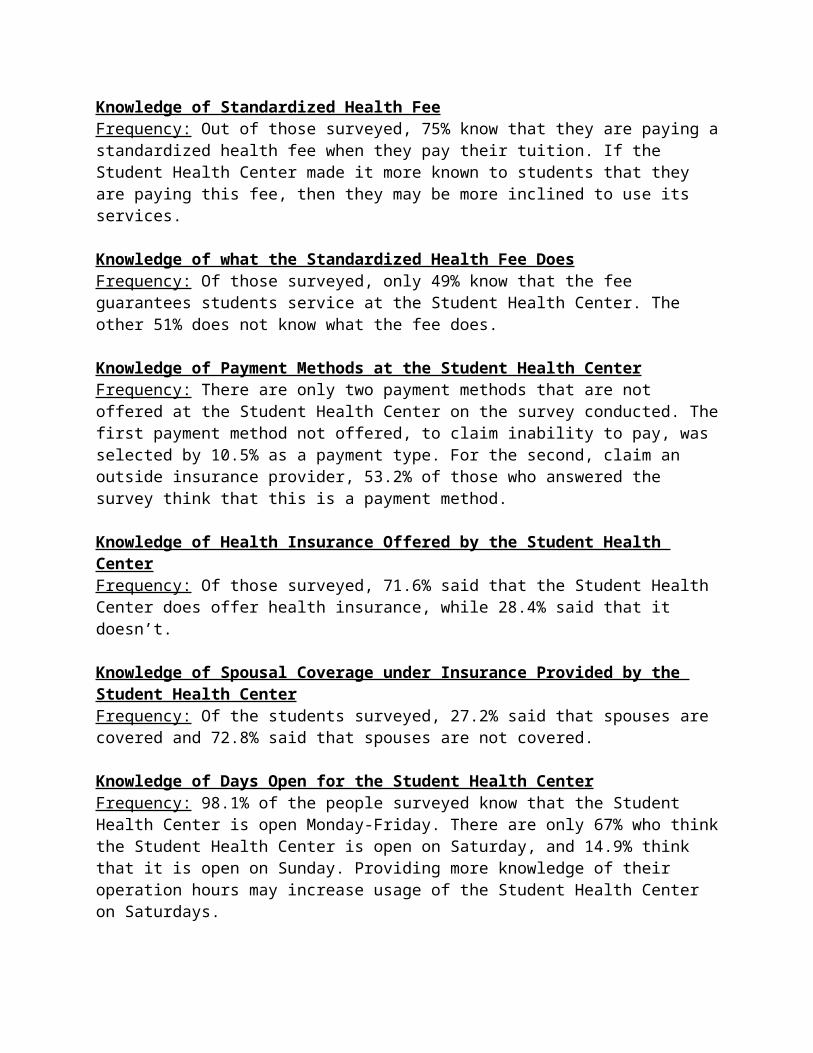
Knowledge of Standardized Health FeeFrequency: Out of those surveyed, 75% know that they are paying a standardized health fee when they pay their tuition. If the Student Health Center made it more known to students that they are paying this fee, then they may be more inclined to use its services.
Knowledge of what the Standardized Health Fee DoesFrequency: Of those surveyed, only 49% know that the fee guarantees students service at the Student Health Center. The other 51% does not know what the fee does.
Knowledge of Payment Methods at the Student Health CenterFrequency: There are only two payment methods that are not offered at the Student Health Center on the survey conducted. The first payment method not offered, to claim inability to pay, was selected by 10.5% as a payment type. For the second, claim an outside insurance provider, 53.2% of those who answered the survey think that this is a payment method.
Knowledge of Health Insurance Offered by the Student Health CenterFrequency: Of those surveyed, 71.6% said that the Student Health Center does offer health insurance, while 28.4% said that it doesn’t.
Knowledge of Spousal Coverage under Insurance Provided by the Student Health CenterFrequency: Of the students surveyed, 27.2% said that spouses are covered and 72.8% said that spouses are not covered.
Knowledge of Days Open for the Student Health CenterFrequency: 98.1% of the people surveyed know that the Student Health Center is open Monday-Friday. There are only 67% who think the Student Health Center is open on Saturday, and 14.9% think that it is open on Sunday. Providing more knowledge of their operation hours may increase usage of the Student Health Center on Saturdays.
Knowledge of Coverage by the Student Health Center after Student GraduationFrequency: Only 21.6% of students know that they can use the Student Health Center for up to three months after graduation. 60.2% think that the services are not offered immediately after graduation, and 9.1% think that they have access to the services for more than six months after they graduate. The other 9.1% think that they only have coverage for one week after they graduate. With people not thinking they have service after graduation, there are bound to be people that do not use the student health center because they don’t feel they can.
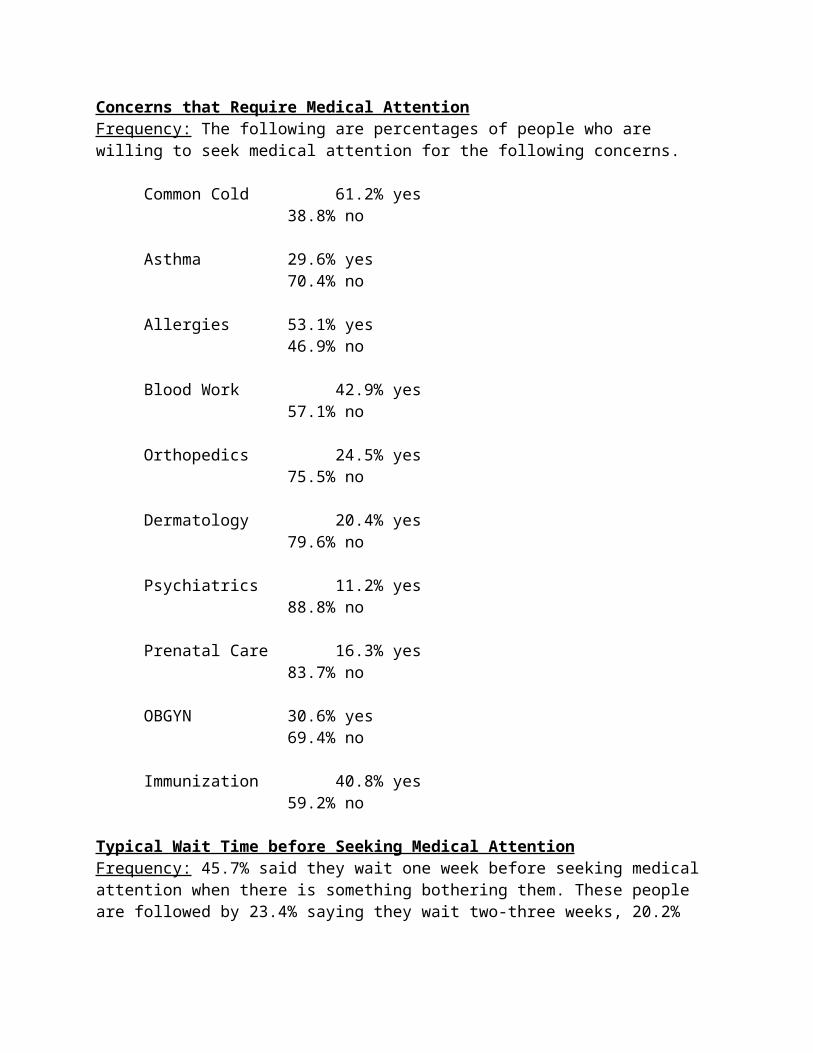
Concerns that Require Medical AttentionFrequency: The following are percentages of people who are willing to seek medical attention for the following concerns.
Common Cold 61.2% yes38.8% no
Asthma 29.6% yes70.4% no
Allergies 53.1% yes46.9% no
Blood Work 42.9% yes57.1% no
Orthopedics 24.5% yes75.5% no
Dermatology 20.4% yes79.6% no
Psychiatrics 11.2% yes88.8% no
Prenatal Care 16.3% yes83.7% no
OBGYN 30.6% yes69.4% no
Immunization 40.8% yes59.2% no
Typical Wait Time before Seeking Medical AttentionFrequency: 45.7% said they wait one week before seeking medical attention when there is something bothering them. These people are followed by 23.4% saying they wait two-three weeks, 20.2% saying they wait one-two days, and 10.6% saying they wait longer than three weeks.
Interests in Preventative Health Care MeasuresFrequency: Of those surveyed, 70.8% said that they are interested in preventative health care measures and 29.2% said they are not interested.
Comparisons to Other Health Care FacilitiesFrequency: 66.1% of students at LIT say that the Student Health Center services are equal to other healthcare facilities. Following this percentage, 18.6% of people surveyed said the Student Health Center is worse, and 15.3% said it is better than other health care providers. With there still being almost 19% of people saying that the service of the Student Health Center was worse than other providers, there is room for improvement.
Aspects of Service Preferred when Choosing a Health Care ProviderFrequency: Of the options given, doctor’s sincerity was ranked the most important to the people surveyed. Students then said price and timeliness are the next most important factors to look at when choosing a health care provider. People said that the least important aspects are location and being a well-known/brand name provider.
Advertisements of the Student Health CenterFrequency: Of the students surveyed, 25% remember seeing an advertisement for the Student Health Center and 75% don’t recall ever seeing one. For students to visit the health center, there has to be advertising to provide knowledge of the service. The Student Health Center needs to make this improvement.
Places of Advertisements Seen for the Student Health CenterFrequency: The most prevalent form of advertising viewed by students was via the Internet, where 25% saw an online ad. Following this percentage, 17% say they’ve seen an ad in the school newspaper, 12% say they’ve seen fliers around school, 7% say they’ve seen ads at www.LIT.edu, 1% say they’ve seen an ad in the local newspaper, and no one saw an ad on television.
Advertisement Effects on LIT StudentsFrequency: Of those surveyed, 54% said an increase in advertising would increase their willingness to seek attention at the Student Health Center.
People Who Have Health InsuranceFrequency: Of the students who participated in the survey, 80.2% have health insurance.
Cross-tabulations
#1
We hypothesized that more females than males would be more inclined to ask for or be interested in stress-management services, but as the data show there is not a significant difference in preference between genders. We conclude that it is a good service that the Student Health Center should continue to offer and even push harder, as more than half of our sample expressed an interest.
#2
For this cross-tabulation, we expected to find results supporting the idea that students living on-campus would have been more likely than commuter students to have used the Student Health
Center. In fact, the table shows that a larger percentage of on-campus students than commuter students have visited the Student Health Center.
#3
For our third cross tabulation, we wanted to draw a conclusion about the advertising efforts of the Student Health Center. In general, we know from the frequency tables that not many students have ever seen advertisements for the Student Health Center, so we were curious what this could say about the Student Health Center’s overall strategy for advertising. The numbers show that of those respondents who have seen an ad (23 in total), only nine continue to say that these types of ads would increase their willingness to frequent the Student Health Center. This is of major importance, as the 14 respondents who have seen an ad indicate that such promotional efforts do not increase their willingness to visit the Student Health Center. Although seemingly ineffective now, we are not recommending that all advertising be eliminated; rather, that the ads should be placed more effectively (e.g., the school newspaper). Interestingly though, students who had not seen an advertisement before said that they feel seeing one would increase their willingness to visit the Student Health Center. This means placement is critical, especially for this proposed new wave of ads.
Conclusion and RecommendationsIn summary, most students knew where the Student Health Center was located, but only about half of them had actually been there or used services provided there. We believe the main reasons for this low number is a combination of poor advertising strategies, mediocre comparisons to other healthcare facilities, and lack of knowledge about specific and desired services. Regarding ads for the Student Health Center, there are few to none in circulation. Few respondents answered yes to having seen some in the school newspaper, but that is where it stopped. Interest in seeing ads was a toss-up because students who had seen them were not impressed by them and continued to say that they would not be swayed by them, but students who had not seen them said that they would be positively influenced by them. Thus, it would seem to behoove the Student Health Center to create new successful and well-placed ads in their next ad campaign. Our research found that they were targeting the most practical target market (objective one); however, they were going about it the wrong way. Some of our ideas and recommendations for improving the ads can be inferred from the survey data.
For instance, many students showed interest in preventative health care services; using this bit of information, the Student Health Center could launch an ad campaign centered around the notion of its ability to provide preventative healthcare (e.g. flu shots, immunizations, regular check-ups, et cetera). Moreover, a large number of students, regardless of living location (on or off-campus), were unaware that the Student Health Center was open and in operation on Saturdays. This is a huge oversight because many students have more time on the weekend (without class) to come in and be seen. Also, for someone to get sick Friday night or Saturday morning and think that they cannot seek medical attention until Monday morning is absurd!
The frequency tables clearly show that affordable pricing and sincere doctors are high on the priority list of students when choosing where to get their medical care. This finding relates to

two objectives stated in our proposal; one about the target market’s opinions of the Student Health Center and the second about possibilities for improving services and the overall health care process. In business, marketers always talk about fulfilling consumers’ needs and wants to be successful. This seems pretty simple; give them what they want. At the Student Health Center, students are more concerned about affordable pricing and sincere and friendly doctors than name-brand medications and timeliness of service.
Overall knowledge of the services offered by the Student Health Center was low. In our third objective of discovering the target market’s knowledge about the services offered (by the Student Health Center), we learned that students for the most part discerned that plastic surgery was not offered by the Student Health Center, but they also did not always know that the Student Health Center has its own operating pharmacy within the same building or offers a great dermatology clinic. In addition, students were unaware that even after graduation from the university they are still covered for up to three months. This is a great benefit that more than 60% of students are currently using. Think of the intermediate time from when seniors graduate until they begin their job; they probably believe they are without medical coverage. Pressing this fact can really benefit the Student Health Center’s image as well as giving students well-needed relief.
Our fourth objective pertained to the timeframe in which the target market seeks their medical attention (based on their personal feelings of its severity). The frequency tables show almost 50% of students claiming they typically wait one week before going to seek help, 20% claiming to wait one to two days, and another 20% claiming to wait up to two or three weeks. To encourage student to seek help sooner, the Student Health Center should revise its ads, services, and other accommodations to this target market. The data support the idea of promoting preventative healthcare services (e.g., flu shots) because students tend to wait too long to seek medical attention. We believe these same people would be interested in a simple shot beforehand to avoid such common cold-related visits.
In addition, knowing that 20% of those surveyed claim to wait two to three weeks is a major concern; what if those people waiting have an STD or some other contagious condition? This possibility calls for the preemptive measures of health education and STD awareness activities. If you cannot get students to come in for help, for whatever reason (possibly embarrassment), then you can at least exhaust all other methods of protecting them.
One question asked respondents to compare their experiences at the Student Health Center to experiences they have had at other medical care facilities. The results were fair. The Student Health Center was ranked as equal for approximately 2/3 of respondents.
Limitations
Lack of funding was not a concern in our research project because our target market consisted of entirely college students, who were happy to help us out for free. However, with the ability to give cash incentives, respondents may have taken more time and been more about serious about filling out our questionnaire. We finalized our four main target areas for dispersal as the AJ Library, the Olive Center, a variety of classes, and computer labs. This choice may have affected
our final results and altered the representative of the average LIT student. Within these pre-specified areas, we chose students that were most convenient and willing. This convenience sampling method makes any projection of our research results beyond the specific sample unscientific.
Although respondents were all enrolled as college students, processing our data proved that many of them were less than equipped to answer some of questions. This is still our fault and may have been avoided with better wording in some of our questions (e.g., “Whether or not you have a spouse”…versus the original “Is your spouse covered…”). Another possible fix for this distortion would have been for the researcher to offer clarification and explanations where needed (for specific questions). But doing this, we feared would have wrongfully influenced our respondents one way or the other in their answers, so we chose to stand back and remain impartial.
A major problem that was unforeseen in the development phase of our questionnaire was the possibility of non-response error. Many students failed to answer certain questions, whether it was because the questionnaire was too long, too complicated, or they did not have the time. Specifically, we had a question about “spousal coverage” at the Student Health Center, which many respondents left blank; we can naturally assume they did so because they thought the question did not apply to them if they did not have a spouse. This was an error on our part because the question was intended as third party’s objective to any person who may have a spouse and be frequenting the Student Health Center, but it is more than obvious that we made a mistake because most other questions were of a direct inquiry to that person.
We tried to circumvent some of the respondent error with “skip directions”. For example: “If you answered no to question 12, please skip to question 31.” Sadly, we concluded that many of our respondents skipped wherever and whenever they pleased, whether this was by choice (because they were brushing our survey off) or because they simply did not understand or were confused by the directions. Along these same lines were questions that were intended as “check one” type answers, but respondents chose multiple answers on their own.
More response error could have occurred in the form of violating the independence of observation assumption. By this we mean people who took the survey in groups or sitting next to a friend with whom they consulted or shared opinions and answers. This action could lessen the accuracy of our results as respondents are not answering based on their own knowledge.
Format is a general concern for all surveys, how many pages, how many questions, et cetera. We chose not to print our questionnaire double-sided, but it still was six pages long and this fact may have deterred some respondents from continuing honestly and painstakingly. Only in our end-analysis of the data did we realize that some of our questions may not have been completely pertinent to our research objectives (e.g., “Do you have health insurance?”) Similarly we found that some important questions were not asked, such as income levels.
As a final point, we tried to limit processing error by keeping the coding of unclear answers to the interpretation of just one researcher. Moreover, we tried to avoid input error by using a double-check system with half the researchers inputting data and the other half of the research
group verifying their accuracy. Inevitably, it is impossible to conduct a research project from start to finish without some type of error.

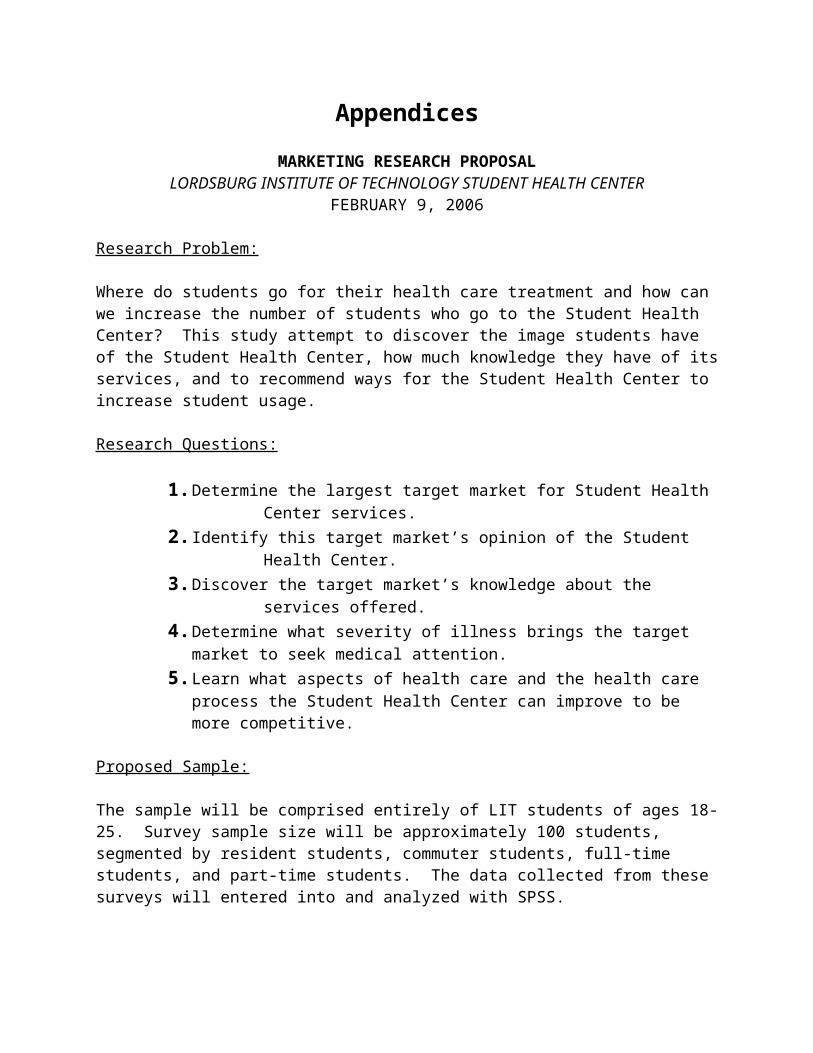
AppendicesMARKETING RESEARCH PROPOSAL
LORDSBURG INSTITUTE OF TECHNOLOGY STUDENT HEALTH CENTERFEBRUARY 9, 2006
Research Problem:
Where do students go for their health care treatment and how can we increase the number of students who go to the Student Health Center? This study attempt to discover the image students have of the Student Health Center, how much knowledge they have of its services, and to recommend ways for the Student Health Center to increase student usage.
Research Questions:
1. Determine the largest target market for Student Health Center services.2. Identify this target market’s opinion of the Student Health Center.3. Discover the target market’s knowledge about the services offered.4. Determine what severity of illness brings the target market to seek medical
attention.5. Learn what aspects of health care and the health care process the Student Health
Center can improve to be more competitive.
Proposed Sample:
The sample will be comprised entirely of LIT students of ages 18-25. Survey sample size will be approximately 100 students, segmented by resident students, commuter students, full-time students, and part-time students. The data collected from these surveys will entered into and analyzed with SPSS.
The following questionnaire has been designed to determine the health care habits of students at Lordsburg Institute of Technology. The Student Health Center is interested in knowing how it can better serve you.
Rest assured that your answers to the following questions are completely confidential.
Your cooperation in filling out this questionnaire is important to the Student Health Center and is greatly appreciated.
INSTRUCTIONS: FOR EACH QUESTION, PLEASE MARK THE BOX (OR MULTIPLE BOXES AS NECESSARY) IN FRONT OF YOUR ANSWER(S) OR FILL IN THE BLANK SPACE. REMEMBER, THERE ARE NO RIGHT OR WRONG ANSWERS TO THESE QUESTIONS.
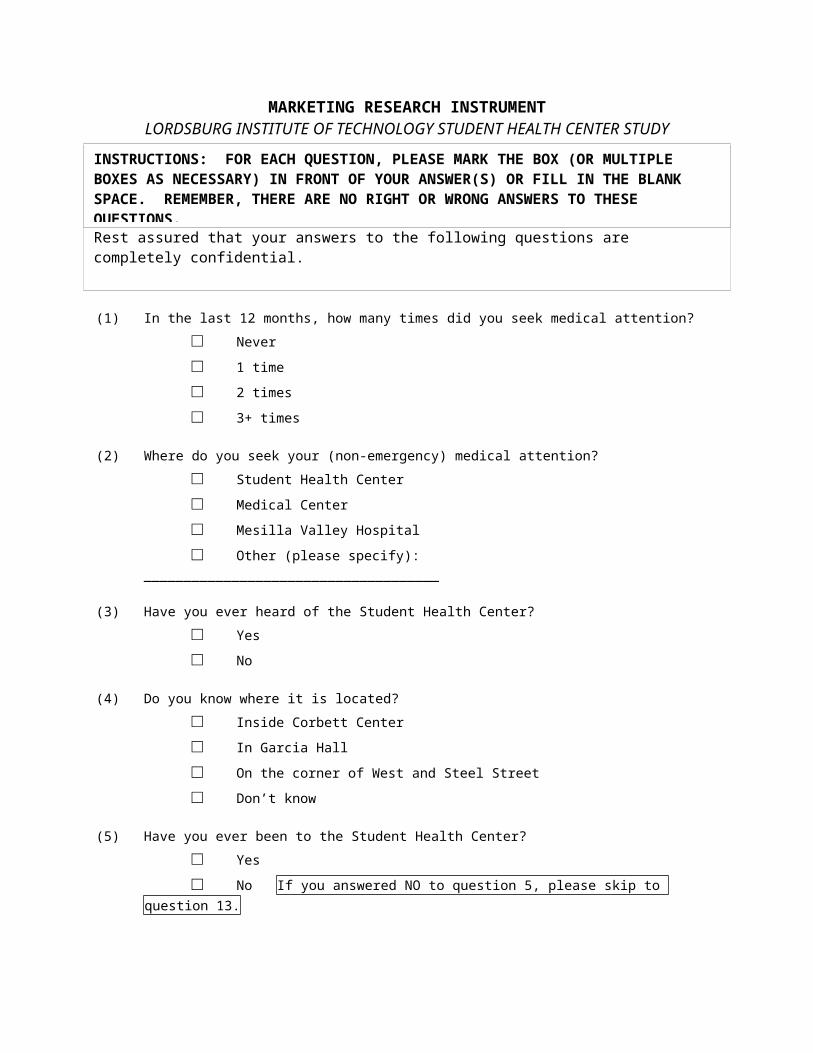
MARKETING RESEARCH INSTRUMENTLORDSBURG INSTITUTE OF TECHNOLOGY STUDENT HEALTH CENTER STUDY
(1) In the last 12 months, how many times did you seek medical attention?□ Never
□ 1 time
□ 2 times
□ 3+ times
(2) Where do you seek your (non-emergency) medical attention?□ Student Health Center
□ Medical Center
□ Mesilla Valley Hospital
□ Other (please specify): _____________________________________
(3) Have you ever heard of the Student Health Center?□ Yes
□ No
(4) Do you know where it is located?□ Inside Corbett Center
□ In Garcia Hall
□ On the corner of West and Steel Street
□ Don’t know
(5) Have you ever been to the Student Health Center?□ Yes
□ No If you answered NO to question 5, please skip to question 13.
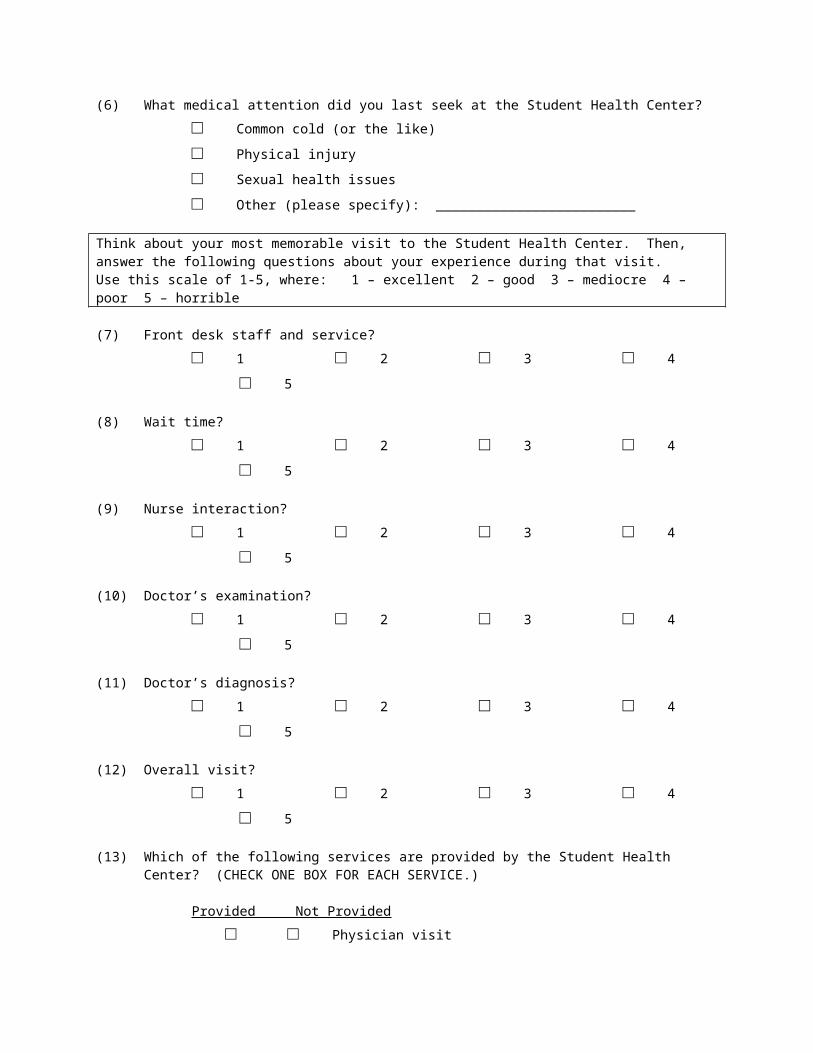
(6) What medical attention did you last seek at the Student Health Center?□ Common cold (or the like)
□ Physical injury
□ Sexual health issues
□ Other (please specify): _________________________
Think about your most memorable visit to the Student Health Center. Then, answer the following questions about your experience during that visit. Use this scale of 1-5, where: 1 – excellent 2 – good 3 – mediocre 4 – poor 5 – horrible
(7) Front desk staff and service?□ 1 □ 2 □ 3 □ 4 □ 5
(8) Wait time?□ 1 □ 2 □ 3 □ 4 □ 5
(9) Nurse interaction?□ 1 □ 2 □ 3 □ 4 □ 5
(10) Doctor’s examination?□ 1 □ 2 □ 3 □ 4 □ 5
(11) Doctor’s diagnosis?□ 1 □ 2 □ 3 □ 4 □ 5
(12) Overall visit?□ 1 □ 2 □ 3 □ 4 □ 5
(13) Which of the following services are provided by the Student Health Center? (CHECK ONE BOX FOR EACH SERVICE.)
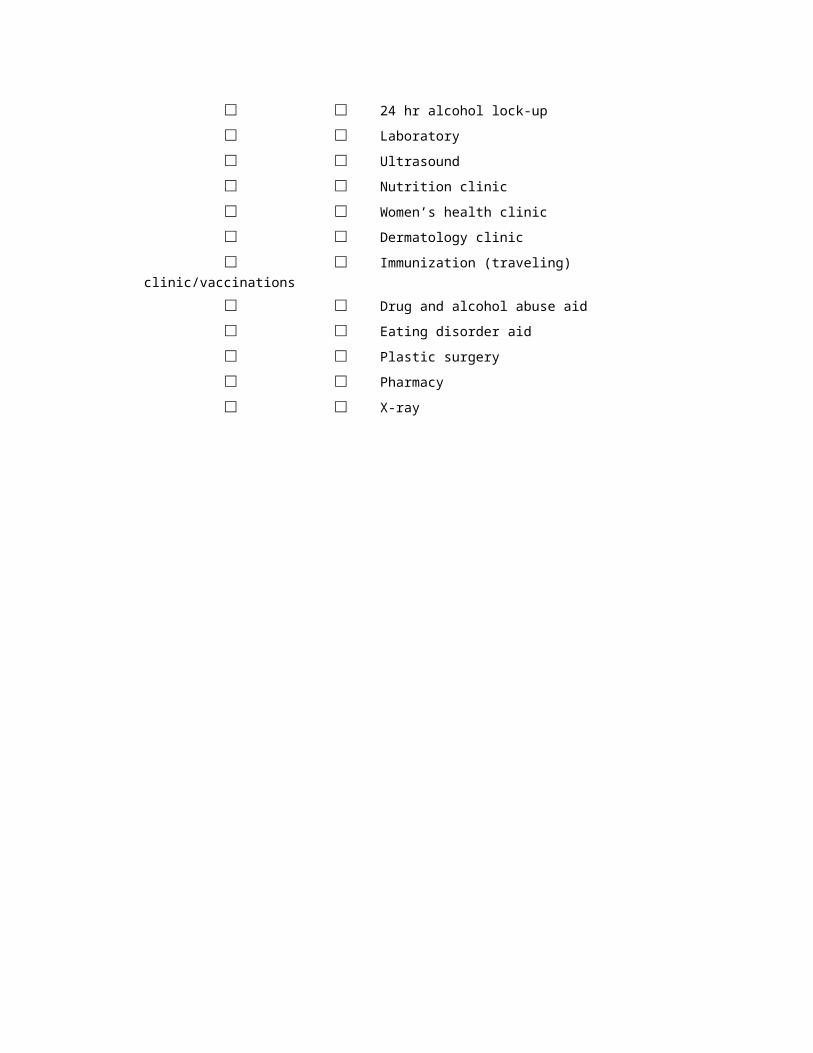
Provided Not Provided □ □ Physician visit
□ □ 24 hr alcohol lock-up
□ □ Laboratory
□ □ Ultrasound
□ □ Nutrition clinic
□ □ Women’s health clinic
□ □ Dermatology clinic
□ □ Immunization (traveling) clinic/vaccinations
□ □ Drug and alcohol abuse aid
□ □ Eating disorder aid
□ □ Plastic surgery
□ □ Pharmacy
□ □ X-ray
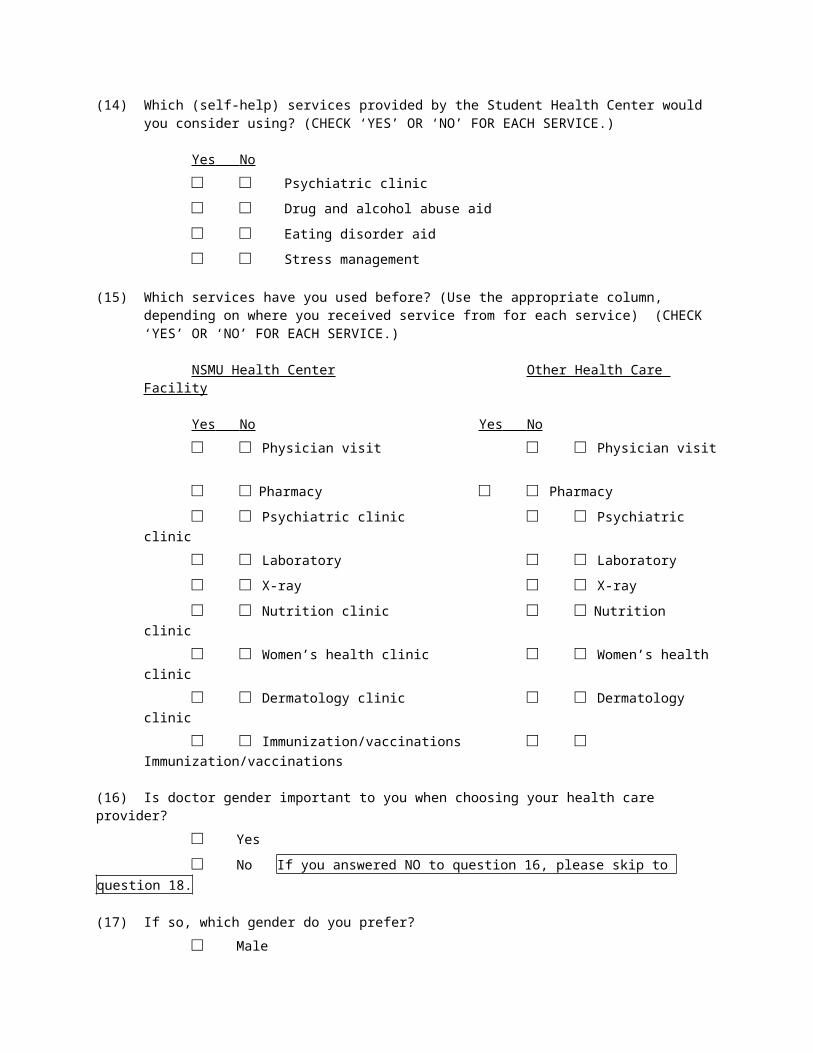
(14) Which (self-help) services provided by the Student Health Center would you consider using? (CHECK ‘YES’ OR ‘NO’ FOR EACH SERVICE.)
Yes No □ □ Psychiatric clinic
□ □ Drug and alcohol abuse aid
□ □ Eating disorder aid
□ □ Stress management
(15) Which services have you used before? (Use the appropriate column, depending on where you received service from for each service) (CHECK ‘YES’ OR ‘NO’ FOR EACH SERVICE.)
NSMU Health Center Other Health Care Facility
Yes No Yes No □ □ Physician visit □ □ Physician visit
□ □ Pharmacy □ □ Pharmacy
□ □ Psychiatric clinic □ □ Psychiatric clinic
□ □ Laboratory □ □ Laboratory
□ □ X-ray □ □ X-ray
□ □ Nutrition clinic □ □ Nutrition clinic
□ □ Women’s health clinic □ □ Women’s health clinic
□ □ Dermatology clinic □ □ Dermatology clinic
□ □ Immunization/vaccinations □ □ Immunization/vaccinations
(16) Is doctor gender important to you when choosing your health care provider?□ Yes
□ No If you answered NO to question 16, please skip to question 18.
(17) If so, which gender do you prefer?□ Male
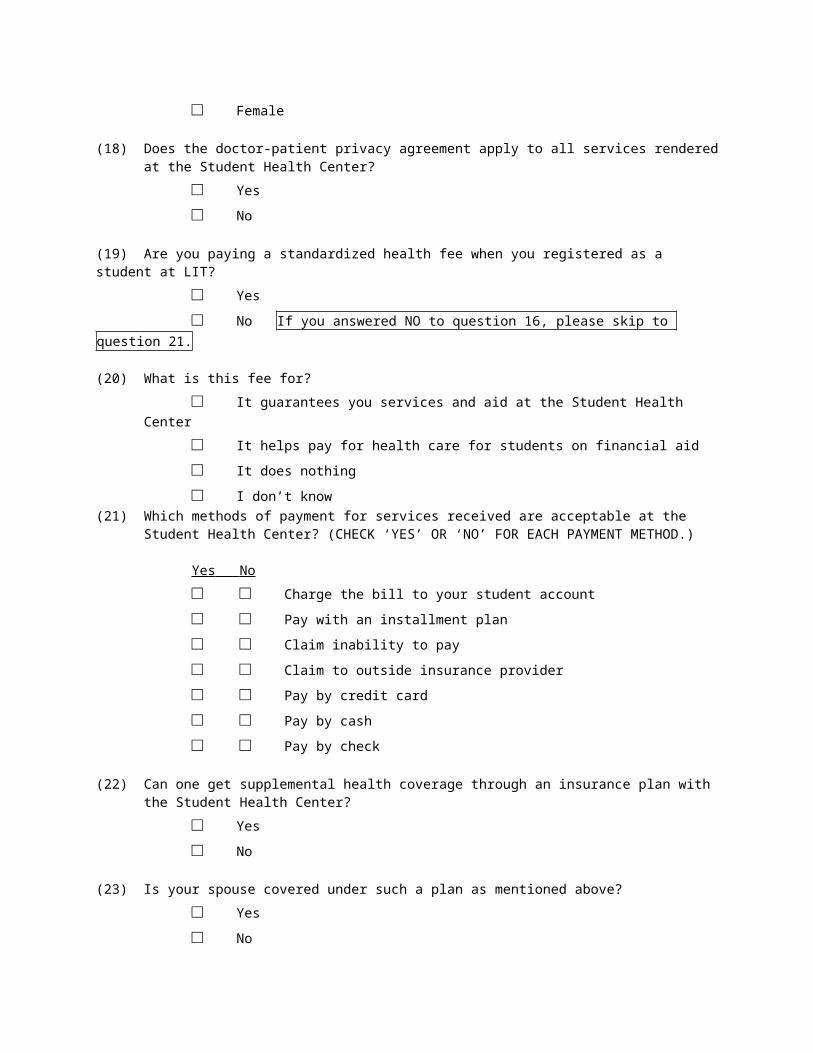
□ Female
(18) Does the doctor-patient privacy agreement apply to all services rendered at the Student Health Center?□ Yes
□ No
(19) Are you paying a standardized health fee when you registered as a student at LIT?□ Yes
□ No If you answered NO to question 16, please skip to question 21.
(20) What is this fee for?□ It guarantees you services and aid at the Student Health Center
□ It helps pay for health care for students on financial aid
□ It does nothing
□ I don’t know
(21) Which methods of payment for services received are acceptable at the Student Health Center? (CHECK ‘YES’ OR ‘NO’ FOR EACH PAYMENT METHOD.)
Yes No □ □ Charge the bill to your student account
□ □ Pay with an installment plan
□ □ Claim inability to pay
□ □ Claim to outside insurance provider
□ □ Pay by credit card
□ □ Pay by cash
□ □ Pay by check
(22) Can one get supplemental health coverage through an insurance plan with the Student Health Center?□ Yes
□ No
(23) Is your spouse covered under such a plan as mentioned above?□ Yes
□ No
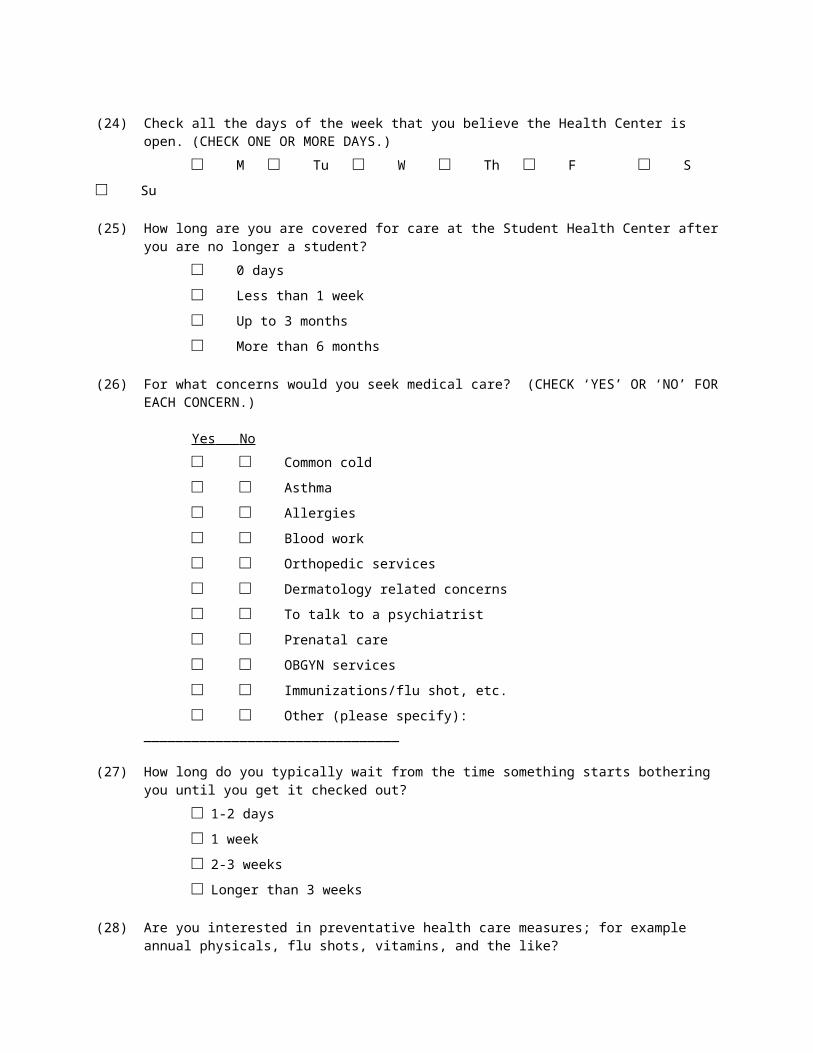
(24) Check all the days of the week that you believe the Health Center is open. (CHECK ONE OR MORE DAYS.)
□ M □ Tu □ W □ Th □ F □ S □ Su
(25) How long are you are covered for care at the Student Health Center after you are no longer a student?□ 0 days
□ Less than 1 week
□ Up to 3 months
□ More than 6 months
(26) For what concerns would you seek medical care? (CHECK ‘YES’ OR ‘NO’ FOR EACH CONCERN.)
Yes No □ □ Common cold
□ □ Asthma
□ □ Allergies
□ □ Blood work
□ □ Orthopedic services
□ □ Dermatology related concerns
□ □ To talk to a psychiatrist
□ □ Prenatal care
□ □ OBGYN services
□ □ Immunizations/flu shot, etc.
□ □ Other (please specify): ________________________________
(27) How long do you typically wait from the time something starts bothering you until you get it checked out?□ 1-2 days
□ 1 week
□ 2-3 weeks
□ Longer than 3 weeks
(28) Are you interested in preventative health care measures; for example annual physicals, flu shots, vitamins, and the like?
□ Yes
□ No
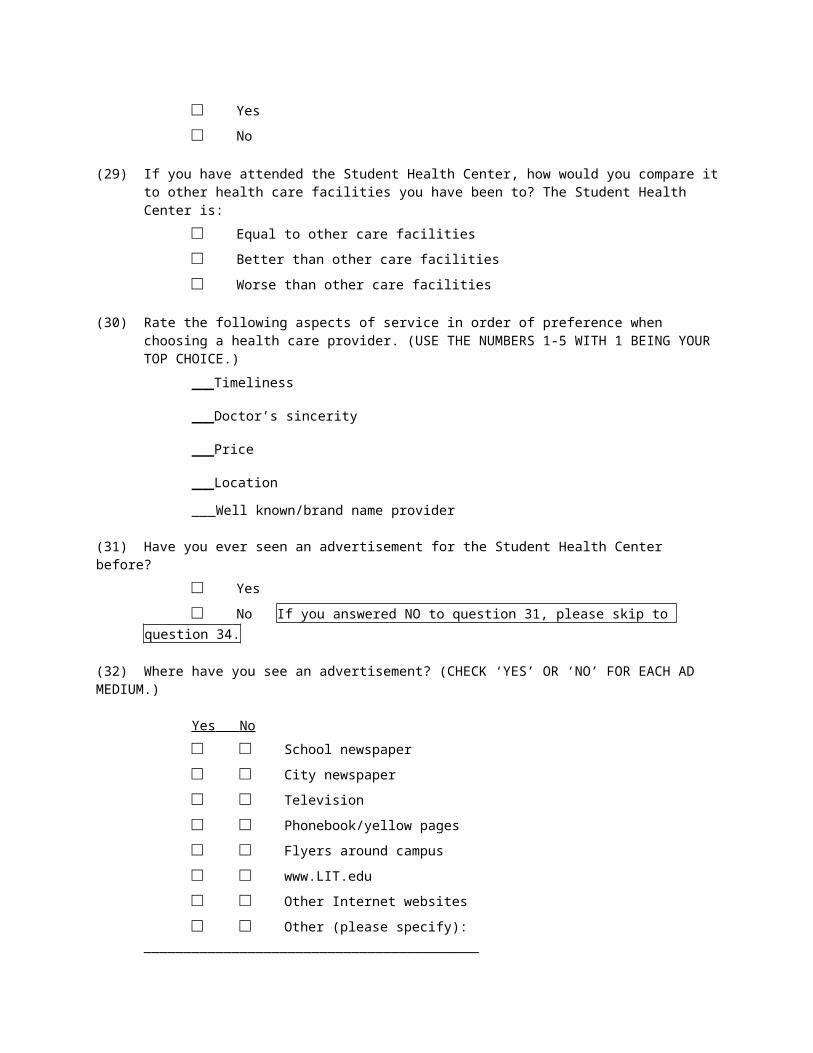
(29) If you have attended the Student Health Center, how would you compare it to other health care facilities you have been to? The Student Health Center is:
□ Equal to other care facilities
□ Better than other care facilities
□ Worse than other care facilities
(30) Rate the following aspects of service in order of preference when choosing a health care provider. (USE THE NUMBERS 1-5 WITH 1 BEING YOUR TOP CHOICE.)
__Timeliness
__Doctor’s sincerity
__Price
__Location
___Well known/brand name provider
(31) Have you ever seen an advertisement for the Student Health Center before?□ Yes
□ No If you answered NO to question 31, please skip to question 34.
(32) Where have you see an advertisement? (CHECK ‘YES’ OR ‘NO’ FOR EACH AD MEDIUM.)
Yes No □ □ School newspaper
□ □ City newspaper
□ □ Television
□ □ Phonebook/yellow pages
□ □ Flyers around campus
□ □ www.LIT.edu
□ □ Other Internet websites
□ □ Other (please specify): __________________________________________
(33) Would these types of advertisements increase your willingness to attend the Student Health Center?□ Yes
□ No
(34) Do you have health insurance?□ Yes
□ No
(35) What is your gender?□ Male
□ Female
(36) What is your class load?□ Full-time Student (12+ units)
□ Part-time Student (>12 units)
(37) What is your student status?□ Commuter Student (live elsewhere than campus)
□ Campus Resident (live in dorm or on campus housing)
(38) In which year were you born? (FILL IN BLANKI SPACE.) _____________
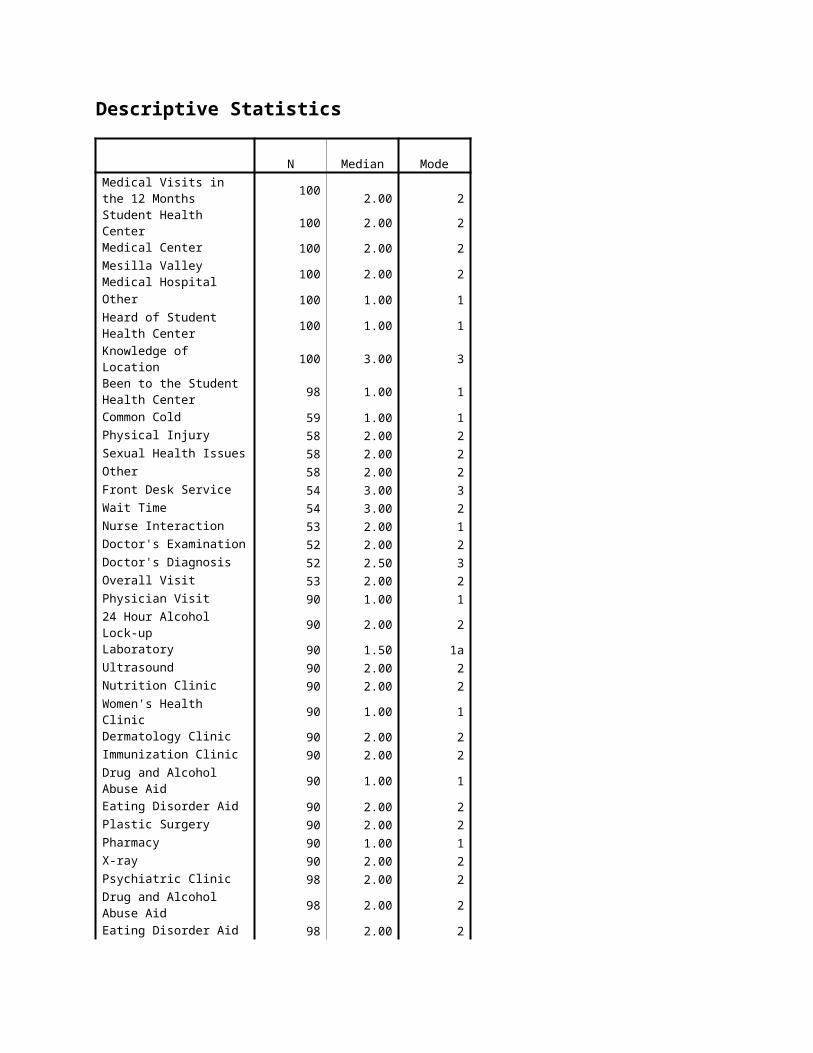
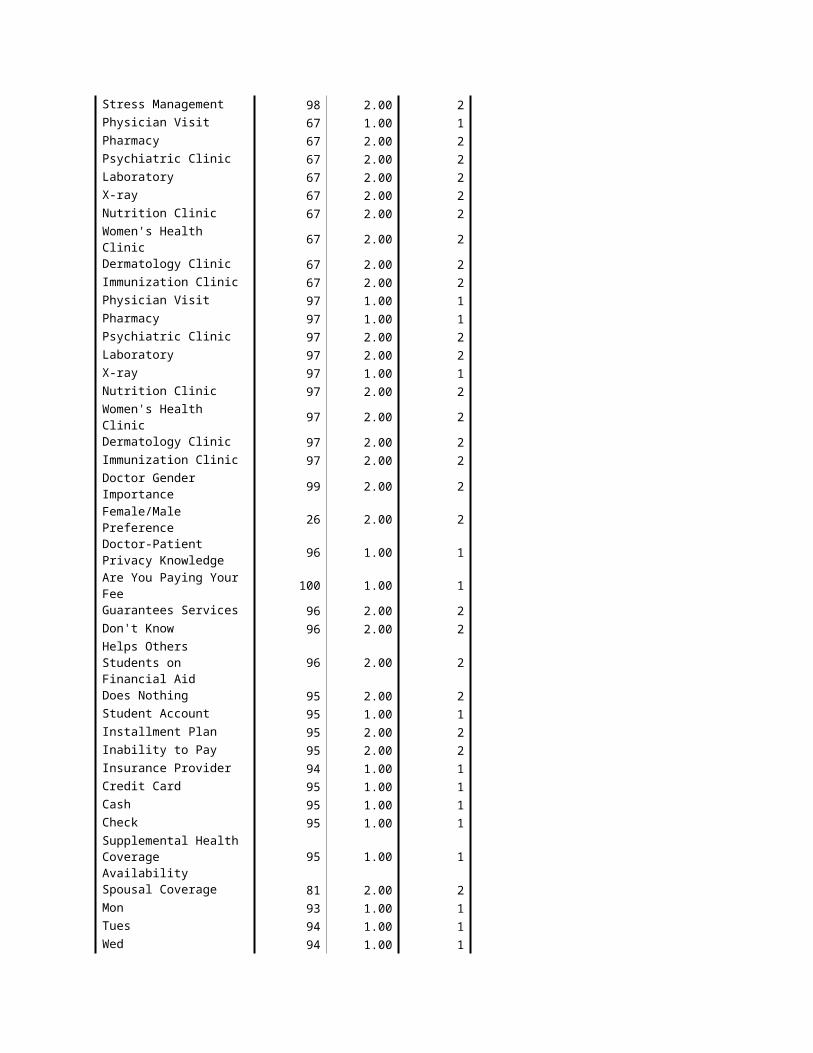
Descriptive Statistics
N Median ModeMedical Visits in the 12 Months 100 2.00 2Student Health Center 100 2.00 2Medical Center 100 2.00 2Mesilla Valley Medical Hospital 100 2.00 2
Other 100 1.00 1Heard of Student Health Center 100 1.00 1
Knowledge of Location 100 3.00 3Been to the Student Health Center 98 1.00 1
Common Cold 59 1.00 1Physical Injury 58 2.00 2Sexual Health Issues 58 2.00 2Other 58 2.00 2Front Desk Service 54 3.00 3Wait Time 54 3.00 2Nurse Interaction 53 2.00 1Doctor's Examination 52 2.00 2Doctor's Diagnosis 52 2.50 3Overall Visit 53 2.00 2Physician Visit 90 1.00 124 Hour Alcohol Lock-up 90 2.00 2Laboratory 90 1.50 1aUltrasound 90 2.00 2Nutrition Clinic 90 2.00 2Women's Health Clinic 90 1.00 1Dermatology Clinic 90 2.00 2Immunization Clinic 90 2.00 2Drug and Alcohol Abuse Aid
90 1.00 1
Eating Disorder Aid 90 2.00 2Plastic Surgery 90 2.00 2Pharmacy 90 1.00 1X-ray 90 2.00 2Psychiatric Clinic 98 2.00 2Drug and Alcohol Abuse Aid
98 2.00 2
Eating Disorder Aid 98 2.00 2Stress Management 98 2.00 2Physician Visit 67 1.00 1Pharmacy 67 2.00 2Psychiatric Clinic 67 2.00 2

Laboratory 67 2.00 2X-ray 67 2.00 2Nutrition Clinic 67 2.00 2Women's Health Clinic 67 2.00 2Dermatology Clinic 67 2.00 2Immunization Clinic 67 2.00 2Physician Visit 97 1.00 1Pharmacy 97 1.00 1Psychiatric Clinic 97 2.00 2Laboratory 97 2.00 2X-ray 97 1.00 1Nutrition Clinic 97 2.00 2Women's Health Clinic 97 2.00 2Dermatology Clinic 97 2.00 2Immunization Clinic 97 2.00 2Doctor Gender Importance
99 2.00 2
Female/Male Preference 26 2.00 2Doctor-Patient Privacy Knowledge 96 1.00 1
Are You Paying Your Fee 100 1.00 1Guarantees Services 96 2.00 2Don't Know 96 2.00 2Helps Others Students on Financial Aid 96 2.00 2
Does Nothing 95 2.00 2Student Account 95 1.00 1Installment Plan 95 2.00 2Inability to Pay 95 2.00 2Insurance Provider 94 1.00 1Credit Card 95 1.00 1Cash 95 1.00 1Check 95 1.00 1Supplemental Health Coverage Availability 95 1.00 1
Spousal Coverage 81 2.00 2Mon 93 1.00 1Tues 94 1.00 1Wed 94 1.00 1Thurs 94 1.00 1Fri 94 1.00 1Sat 94 1.00 1Sun 94 2.00 2Coverage for Care at Student Health Center 88 1.00 1
Common Cold 98 1.00 1Asthma 98 2.00 2Allergies 98 1.00 1

Blood Work 98 2.00 2Orthopedic Services 98 2.00 2Dermatology Related 98 2.00 2Psychiatrist 98 2.00 2Prenatal Care 98 2.00 2OBGYN 98 2.00 2Immunizations 98 2.00 2Other 98 2.00 2Wait Time 94 2.00 2Interest in Preventative Health Care 96 1.00 1
LIT Compared to Others59 1.00 1
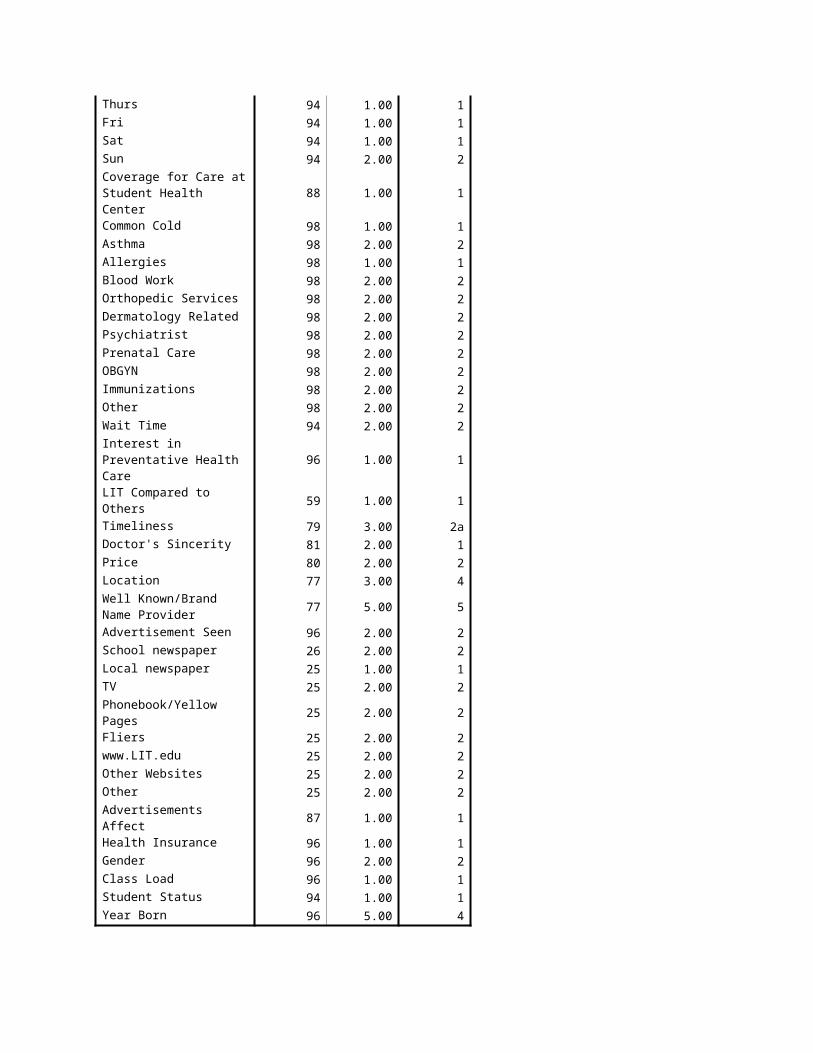
Timeliness 79 3.00 2aDoctor's Sincerity 81 2.00 1Price 80 2.00 2Location 77 3.00 4Well Known/Brand Name Provider 77 5.00 5
Advertisement Seen 96 2.00 2School newspaper 26 2.00 2Local newspaper 25 1.00 1TV 25 2.00 2Phonebook/Yellow Pages 25 2.00 2Fliers 25 2.00 2www.LIT.edu 25 2.00 2Other Websites 25 2.00 2Other 25 2.00 2Advertisements Affect 87 1.00 1Health Insurance 96 1.00 1Gender 96 2.00 2Class Load 96 1.00 1Student Status 94 1.00 1Year Born 96 5.00 4
Medical Visits in the 12 Months
Frequency Percent Valid PercentCumulative
PercentValid Never 29 29.0 29.0 29.0
1 time 31 31.0 31.0 60.02 times 18 18.0 18.0 78.03+ times 22 22.0 22.0 100.0Total 100 100.0 100.0
Student Health Center
Frequency Percent Valid PercentCumulative
PercentValid Yes 36 36.0 36.0 36.0
No 64 64.0 64.0 100.0Total 100 100.0 100.0
Medical Center
Frequency Percent Valid PercentCumulative
PercentValid Yes 10 10.0 10.0 10.0
No 90 90.0 90.0 100.0Total 100 100.0 100.0
Mesilla Valley Medical Hospital
Frequency Percent Valid PercentCumulative
PercentValid No 100 100.0 100.0 100.0
Other
Frequency Percent Valid PercentCumulative
PercentValid Yes 54 54.0 54.0 54.0
No 46 46.0 46.0 100.0Total 100 100.0 100.0
Heard of Student Health Center
Frequency Percent Valid PercentCumulative
PercentValid Yes 94 94.0 94.0 94.0
No 6 6.0 6.0 100.0Total 100 100.0 100.0
Knowledge of Location
Frequency Percent Valid PercentCumulative
PercentValid Inside the Corbett Center 2 2.0 2.0 2.0
On the Corner of West and Steel Street 74 74.0 74.0 76.0
Don't Know 24 24.0 24.0 100.0Total 100 100.0 100.0
Been to the Student Health Center
Frequency Percent Valid PercentCumulative
PercentValid Yes 53 53.0 54.1 54.1
No 45 45.0 45.9 100.0Total 98 98.0 100.0
Missing 0 2 2.0Total 100 100.0
Common Cold
Frequency Percent Valid PercentCumulative
PercentValid Yes 30 30.0 50.8 50.8
No 29 29.0 49.2 100.0Total 59 59.0 100.0
Missing 0 41 41.0Total 100 100.0
Physical Injury
Frequency Percent Valid PercentCumulative
PercentValid Yes 7 7.0 12.1 12.1
No 51 51.0 87.9 100.0Total 58 58.0 100.0
Missing 0 42 42.0Total 100 100.0
Sexual Health Issues
Frequency Percent Valid PercentCumulative
PercentValid Yes 5 5.0 8.6 8.6
No 53 53.0 91.4 100.0Total 58 58.0 100.0
Missing 0 42 42.0Total 100 100.0
Other
Frequency Percent Valid PercentCumulative
PercentValid Yes 18 18.0 31.0 31.0
No 39 39.0 67.2 98.33 1 1.0 1.7 100.0Total 58 58.0 100.0
Missing 0 42 42.0Total 100 100.0
Front Desk Service
Frequency Percent Valid PercentCumulative
PercentValid 1 9 9.0 16.7 16.7
2 16 16.0 29.6 46.33 20 20.0 37.0 83.34 7 7.0 13.0 96.35 2 2.0 3.7 100.0Total 54 54.0 100.0
Missing 0 45 45.0System 1 1.0Total 46 46.0
Total 100 100.0
Wait Time
Frequency Percent Valid PercentCumulative
PercentValid 1 4 4.0 7.4 7.4
2 22 22.0 40.7 48.13 19 19.0 35.2 83.34 5 5.0 9.3 92.65 4 4.0 7.4 100.0Total 54 54.0 100.0
Missing 0 46 46.0Total 100 100.0
Nurse Interaction
Frequency Percent Valid PercentCumulative
PercentValid 1 16 16.0 30.2 30.2
2 13 13.0 24.5 54.73 15 15.0 28.3 83.04 5 5.0 9.4 92.55 4 4.0 7.5 100.0Total 53 53.0 100.0
Missing 0 47 47.0Total 100 100.0
Doctor's Examination
Frequency Percent Valid PercentCumulative
PercentValid 1 11 11.0 21.2 21.2
2 18 18.0 34.6 55.83 15 15.0 28.8 84.64 5 5.0 9.6 94.25 3 3.0 5.8 100.0Total 52 52.0 100.0
Missing 0 48 48.0Total 100 100.0
Doctor's Diagnosis
Frequency Percent Valid PercentCumulative
PercentValid 1 11 11.0 21.2 21.2
2 15 15.0 28.8 50.03 16 16.0 30.8 80.84 7 7.0 13.5 94.25 3 3.0 5.8 100.0Total 52 52.0 100.0
Missing 0 48 48.0Total 100 100.0
Overall Visit
Frequency Percent Valid PercentCumulative
PercentValid 1 7 7.0 13.2 13.2
2 21 21.0 39.6 52.83 15 15.0 28.3 81.14 7 7.0 13.2 94.35 3 3.0 5.7 100.0Total 53 53.0 100.0
Missing 0 47 47.0Total 100 100.0
Physician Visit
Frequency Percent Valid PercentCumulative
PercentValid Yes 82 82.0 91.1 91.1
No 8 8.0 8.9 100.0Total 90 90.0 100.0
Missing 0 10 10.0Total 100 100.0
24 Hour Alcohol Lock-up
Frequency Percent Valid PercentCumulative
PercentValid Yes 5 5.0 5.6 5.6
No 85 85.0 94.4 100.0Total 90 90.0 100.0
Missing 0 10 10.0Total 100 100.0
Laboratory
Frequency Percent Valid PercentCumulative
PercentValid Yes 45 45.0 50.0 50.0
No 45 45.0 50.0 100.0Total 90 90.0 100.0
Missing 0 10 10.0Total 100 100.0
Ultrasound
Frequency Percent Valid PercentCumulative
PercentValid Yes 15 15.0 16.7 16.7
No 75 75.0 83.3 100.0Total 90 90.0 100.0
Missing 0 10 10.0Total 100 100.0
Nutrition Clinic
Frequency Percent Valid PercentCumulative
PercentValid Yes 40 40.0 44.4 44.4
No 50 50.0 55.6 100.0Total 90 90.0 100.0
Missing 0 10 10.0Total 100 100.0
Women's Health Clinic
Frequency Percent Valid PercentCumulative
PercentValid Yes 65 65.0 72.2 72.2
No 25 25.0 27.8 100.0Total 90 90.0 100.0
Missing 0 10 10.0Total 100 100.0
Dermatology Clinic
Frequency Percent Valid PercentCumulative
PercentValid Yes 32 32.0 35.6 35.6
No 58 58.0 64.4 100.0Total 90 90.0 100.0
Missing 0 9 9.0System 1 1.0Total 10 10.0
Total 100 100.0
Immunization Clinic
Frequency Percent Valid PercentCumulative
PercentValid Yes 52 52.0 57.8 57.8
No 38 38.0 42.2 100.0Total 90 90.0 100.0
Missing 0 10 10.0Total 100 100.0
Drug and Alcohol Abuse Aid
Frequency Percent Valid PercentCumulative
PercentValid Yes 46 46.0 51.1 51.1
No 44 44.0 48.9 100.0Total 90 90.0 100.0
Missing 0 10 10.0Total 100 100.0
Eating Disorder Aid
Frequency Percent Valid PercentCumulative
PercentValid Yes 38 38.0 42.2 42.2
No 52 52.0 57.8 100.0Total 90 90.0 100.0
Missing 0 10 10.0Total 100 100.0
Plastic Surgery
Frequency Percent Valid PercentCumulative
PercentValid Yes 2 2.0 2.2 2.2
No 88 88.0 97.8 100.0Total 90 90.0 100.0
Missing 0 10 10.0Total 100 100.0
Pharmacy
Frequency Percent Valid PercentCumulative
PercentValid Yes 58 58.0 64.4 64.4
No 32 32.0 35.6 100.0Total 90 90.0 100.0
Missing 0 10 10.0Total 100 100.0
X-ray
Frequency Percent Valid PercentCumulative
PercentValid Yes 42 42.0 46.7 46.7
No 48 48.0 53.3 100.0Total 90 90.0 100.0
Missing 0 10 10.0Total 100 100.0
Psychiatric Clinic
Frequency Percent Valid PercentCumulative
PercentValid Yes 14 14.0 14.3 14.3
No 84 84.0 85.7 100.0Total 98 98.0 100.0
Missing 0 2 2.0Total 100 100.0
Drug and Alcohol Abuse Aid
Frequency Percent Valid PercentCumulative
PercentValid Yes 11 11.0 11.2 11.2
No 87 87.0 88.8 100.0Total 98 98.0 100.0
Missing 0 2 2.0Total 100 100.0
Eating Disorder Aid
Frequency Percent Valid PercentCumulative
PercentValid Yes 6 6.0 6.1 6.1
No 92 92.0 93.9 100.0Total 98 98.0 100.0
Missing 0 2 2.0Total 100 100.0
Stress Management
Frequency Percent Valid PercentCumulative
PercentValid Yes 44 44.0 44.9 44.9
No 54 54.0 55.1 100.0Total 98 98.0 100.0
Missing 0 2 2.0Total 100 100.0
Physician Visit
Frequency Percent Valid PercentCumulative
PercentValid Yes 45 45.0 67.2 67.2
No 22 22.0 32.8 100.0Total 67 67.0 100.0
Missing 0 33 33.0Total 100 100.0
Pharmacy
Frequency Percent Valid PercentCumulative
PercentValid Yes 33 33.0 49.3 49.3
No 34 34.0 50.7 100.0Total 67 67.0 100.0
Missing 0 33 33.0Total 100 100.0
Psychiatric Clinic
Frequency Percent Valid PercentCumulative
PercentValid Yes 1 1.0 1.5 1.5
No 66 66.0 98.5 100.0Total 67 67.0 100.0
Missing 0 33 33.0Total 100 100.0
Laboratory
Frequency Percent Valid PercentCumulative
PercentValid Yes 11 11.0 16.4 16.4
No 56 56.0 83.6 100.0Total 67 67.0 100.0
Missing 0 33 33.0Total 100 100.0
X-ray
Frequency Percent Valid PercentCumulative
PercentValid Yes 7 7.0 10.4 10.4
No 60 60.0 89.6 100.0Total 67 67.0 100.0
Missing 0 33 33.0Total 100 100.0
Nutrition Clinic
Frequency Percent Valid PercentCumulative
PercentValid Yes 3 3.0 4.5 4.5
No 64 64.0 95.5 100.0Total 67 67.0 100.0
Missing 0 33 33.0Total 100 100.0
Women's Health Clinic
Frequency Percent Valid PercentCumulative
PercentValid Yes 11 11.0 16.4 16.4
No 56 56.0 83.6 100.0Total 67 67.0 100.0
Missing 0 33 33.0Total 100 100.0
Dermatology Clinic
Frequency Percent Valid PercentCumulative
PercentValid Yes 1 1.0 1.5 1.5
No 66 66.0 98.5 100.0Total 67 67.0 100.0
Missing 0 33 33.0Total 100 100.0
Immunization Clinic
Frequency Percent Valid PercentCumulative
PercentValid Yes 3 3.0 4.5 4.5
No 64 64.0 95.5 100.0Total 67 67.0 100.0
Missing 0 33 33.0Total 100 100.0
Physician Visit
Frequency Percent Valid PercentCumulative
PercentValid Yes 64 64.0 66.0 66.0
No 33 33.0 34.0 100.0Total 97 97.0 100.0
Missing 0 3 3.0Total 100 100.0
Pharmacy
Frequency Percent Valid PercentCumulative
PercentValid Yes 60 60.0 61.9 61.9
No 37 37.0 38.1 100.0Total 97 97.0 100.0
Missing 0 3 3.0Total 100 100.0
Psychiatric Clinic
Frequency Percent Valid PercentCumulative
PercentValid Yes 4 4.0 4.1 4.1
No 93 93.0 95.9 100.0Total 97 97.0 100.0
Missing 0 3 3.0Total 100 100.0
Laboratory
Frequency Percent Valid PercentCumulative
PercentValid Yes 38 38.0 39.2 39.2
No 59 59.0 60.8 100.0Total 97 97.0 100.0
Missing 0 3 3.0Total 100 100.0
X-ray
Frequency Percent Valid PercentCumulative
PercentValid Yes 53 53.0 54.6 54.6
No 44 44.0 45.4 100.0Total 97 97.0 100.0
Missing 0 3 3.0Total 100 100.0
Nutrition Clinic
Frequency Percent Valid PercentCumulative
PercentValid Yes 8 8.0 8.2 8.2
No 89 89.0 91.8 100.0Total 97 97.0 100.0
Missing 0 3 3.0Total 100 100.0
Women's Health Clinic
Frequency Percent Valid PercentCumulative
PercentValid Yes 23 23.0 23.7 23.7
No 74 74.0 76.3 100.0Total 97 97.0 100.0
Missing 0 3 3.0Total 100 100.0
Dermatology Clinic
Frequency Percent Valid PercentCumulative
PercentValid Yes 18 18.0 18.6 18.6
No 79 79.0 81.4 100.0Total 97 97.0 100.0
Missing 0 3 3.0Total 100 100.0
Immunization Clinic
Frequency Percent Valid PercentCumulative
PercentValid Yes 30 30.0 30.9 30.9
No 67 67.0 69.1 100.0Total 97 97.0 100.0
Missing 0 3 3.0Total 100 100.0
Doctor Gender Importance
Frequency Percent Valid PercentCumulative
PercentValid Yes 24 24.0 24.2 24.2
No 75 75.0 75.8 100.0Total 99 99.0 100.0
Missing 0 1 1.0Total 100 100.0
Female/Male Preference
Frequency Percent Valid PercentCumulative
PercentValid Male 4 4.0 15.4 15.4
Female 22 22.0 84.6 100.0Total 26 26.0 100.0
Missing 0 74 74.0Total 100 100.0
Doctor-Patient Privacy Knowledge
Frequency Percent Valid PercentCumulative
PercentValid Yes 89 89.0 92.7 92.7
No 7 7.0 7.3 100.0Total 96 96.0 100.0
Missing 0 4 4.0Total 100 100.0
Are You Paying Your Fee
Frequency Percent Valid PercentCumulative
PercentValid Yes 75 75.0 75.0 75.0
No 25 25.0 25.0 100.0Total 100 100.0 100.0
Guarantees Services
Frequency Percent Valid PercentCumulative
PercentValid Yes 47 47.0 49.0 49.0
No 49 49.0 51.0 100.0Total 96 96.0 100.0
Missing 0 4 4.0Total 100 100.0
Don't Know
Frequency Percent Valid PercentCumulative
PercentValid Yes 39 39.0 40.6 40.6
No 57 57.0 59.4 100.0Total 96 96.0 100.0
Missing 0 4 4.0Total 100 100.0
Helps Others Students on Financial Aid
Frequency Percent Valid PercentCumulative
PercentValid Yes 9 9.0 9.4 9.4
No 87 87.0 90.6 100.0Total 96 96.0 100.0
Missing 0 4 4.0Total 100 100.0
Does Nothing
Frequency Percent Valid PercentCumulative
PercentValid Yes 3 3.0 3.2 3.2
No 92 92.0 96.8 100.0Total 95 95.0 100.0
Missing 0 5 5.0Total 100 100.0
Student Account
Frequency Percent Valid PercentCumulative
PercentValid Yes 70 70.0 73.7 73.7
No 25 25.0 26.3 100.0Total 95 95.0 100.0
Missing 0 5 5.0Total 100 100.0
Installment Plan
Frequency Percent Valid PercentCumulative
PercentValid Yes 35 35.0 36.8 36.8
No 60 60.0 63.2 100.0Total 95 95.0 100.0
Missing 0 5 5.0Total 100 100.0
Inability to Pay
Frequency Percent Valid PercentCumulative
PercentValid Yes 10 10.0 10.5 10.5
No 85 85.0 89.5 100.0Total 95 95.0 100.0
Missing 0 5 5.0Total 100 100.0
Insurance Provider
Frequency Percent Valid PercentCumulative
PercentValid Yes 50 50.0 53.2 53.2
No 44 44.0 46.8 100.0Total 94 94.0 100.0
Missing 0 6 6.0Total 100 100.0
Credit Card

Frequency Percent Valid PercentCumulative
PercentValid Yes 70 70.0 73.7 73.7
No 25 25.0 26.3 100.0Total 95 95.0 100.0
Missing 0 5 5.0Total 100 100.0
Cash
Frequency Percent Valid PercentCumulative
PercentValid Yes 75 75.0 78.9 78.9
No 20 20.0 21.1 100.0Total 95 95.0 100.0
Missing 0 5 5.0Total 100 100.0
Check
Frequency Percent Valid PercentCumulative
PercentValid Yes 72 72.0 75.8 75.8
No 23 23.0 24.2 100.0Total 95 95.0 100.0
Missing 0 5 5.0Total 100 100.0
Supplemental Health Coverage Availability
Frequency Percent Valid PercentCumulative
PercentValid Yes 68 68.0 71.6 71.6
No 27 27.0 28.4 100.0Total 95 95.0 100.0
Missing 0 5 5.0Total 100 100.0
Spousal Coverage
Frequency Percent Valid PercentCumulative
PercentValid Yes 22 22.0 27.2 27.2
No 59 59.0 72.8 100.0Total 81 81.0 100.0
Missing 0 19 19.0Total 100 100.0
Mon
Frequency Percent Valid PercentCumulative
PercentValid Yes 90 90.0 96.8 96.8
No 3 3.0 3.2 100.0Total 93 93.0 100.0
Missing 0 7 7.0Total 100 100.0
Tues
Frequency Percent Valid PercentCumulative
PercentValid Yes 93 93.0 98.9 98.9
No 1 1.0 1.1 100.0Total 94 94.0 100.0
Missing 0 6 6.0Total 100 100.0
Wed
Frequency Percent Valid PercentCumulative
PercentValid Yes 93 93.0 98.9 98.9
No 1 1.0 1.1 100.0Total 94 94.0 100.0
Missing 0 6 6.0Total 100 100.0
Thurs
Frequency Percent Valid PercentCumulative
PercentValid Yes 92 92.0 97.9 97.9
No 2 2.0 2.1 100.0Total 94 94.0 100.0
Missing 0 6 6.0Total 100 100.0
Fri
Frequency Percent Valid PercentCumulative
PercentValid Yes 92 92.0 97.9 97.9
No 2 2.0 2.1 100.0Total 94 94.0 100.0
Missing 0 6 6.0Total 100 100.0
Sat
Frequency Percent Valid PercentCumulative
PercentValid Yes 63 63.0 67.0 67.0
No 31 31.0 33.0 100.0Total 94 94.0 100.0
Missing 0 6 6.0Total 100 100.0
Sun
Frequency Percent Valid PercentCumulative
PercentValid Yes 14 14.0 14.9 14.9
No 80 80.0 85.1 100.0Total 94 94.0 100.0
Missing 0 6 6.0Total 100 100.0
Coverage for Care at Student Health Center
Frequency Percent Valid PercentCumulative
PercentValid 0 days 53 53.0 60.2 60.2
Less than 1 week 8 8.0 9.1 69.3Up to 3 months 19 19.0 21.6 90.9More than 6 months 8 8.0 9.1 100.0Total 88 88.0 100.0
Missing 0 11 11.0System 1 1.0Total 12 12.0
Total 100 100.0
Common Cold
Frequency Percent Valid PercentCumulative
PercentValid Yes 60 60.0 61.2 61.2
No 38 38.0 38.8 100.0Total 98 98.0 100.0
Missing 0 2 2.0Total 100 100.0
Asthma
Frequency Percent Valid PercentCumulative
PercentValid Yes 29 29.0 29.6 29.6
No 69 69.0 70.4 100.0Total 98 98.0 100.0
Missing 0 2 2.0Total 100 100.0
Allergies
Frequency Percent Valid PercentCumulative
PercentValid Yes 52 52.0 53.1 53.1
No 46 46.0 46.9 100.0Total 98 98.0 100.0
Missing 0 2 2.0Total 100 100.0
Blood Work
Frequency Percent Valid PercentCumulative
PercentValid Yes 42 42.0 42.9 42.9
No 56 56.0 57.1 100.0Total 98 98.0 100.0
Missing 0 2 2.0Total 100 100.0
Orthopedic Services
Frequency Percent Valid PercentCumulative
PercentValid Yes 24 24.0 24.5 24.5
No 74 74.0 75.5 100.0Total 98 98.0 100.0
Missing 0 2 2.0Total 100 100.0
Dermatology Related
Frequency Percent Valid PercentCumulative
PercentValid Yes 20 20.0 20.4 20.4
No 78 78.0 79.6 100.0Total 98 98.0 100.0
Missing 0 2 2.0Total 100 100.0
Psychiatrist
Frequency Percent Valid PercentCumulative
PercentValid Yes 11 11.0 11.2 11.2
No 87 87.0 88.8 100.0Total 98 98.0 100.0
Missing 0 2 2.0Total 100 100.0
Prenatal Care
Frequency Percent Valid PercentCumulative
PercentValid Yes 16 16.0 16.3 16.3
No 82 82.0 83.7 100.0Total 98 98.0 100.0
Missing 0 2 2.0Total 100 100.0
OBGYN
Frequency Percent Valid PercentCumulative
PercentValid Yes 30 30.0 30.6 30.6
No 68 68.0 69.4 100.0Total 98 98.0 100.0
Missing 0 2 2.0Total 100 100.0
Immunizations
Frequency Percent Valid PercentCumulative
PercentValid Yes 40 40.0 40.8 40.8
No 58 58.0 59.2 100.0Total 98 98.0 100.0
Missing 0 2 2.0Total 100 100.0
Other
Frequency Percent Valid PercentCumulative
PercentValid Yes 4 4.0 4.1 4.1
No 94 94.0 95.9 100.0Total 98 98.0 100.0
Missing 0 2 2.0Total 100 100.0
Wait Time

Frequency Percent Valid PercentCumulative
PercentValid 1-2 days 19 19.0 20.2 20.2
1 week 43 43.0 45.7 66.02-3 weeks 22 22.0 23.4 89.4Longer than 3 weeks 10 10.0 10.6 100.0Total 94 94.0 100.0
Missing 0 6 6.0Total 100 100.0
Interest in Preventative Health Care
Frequency Percent Valid PercentCumulative
PercentValid Yes 68 68.0 70.8 70.8
No 28 28.0 29.2 100.0Total 96 96.0 100.0
Missing 0 4 4.0Total 100 100.0
LIT Compared to Others
Frequency Percent Valid PercentCumulative
PercentValid Equal 39 39.0 66.1 66.1
Better 9 9.0 15.3 81.4Worse 11 11.0 18.6 100.0Total 59 59.0 100.0
Missing 0 41 41.0Total 100 100.0
Timeliness
Frequency Percent Valid PercentCumulative
PercentValid 1 15 15.0 19.0 19.0
2 24 24.0 30.4 49.43 24 24.0 30.4 79.74 8 8.0 10.1 89.95 8 8.0 10.1 100.0Total 79 79.0 100.0
Missing 0 21 21.0Total 100 100.0
Doctor's Sincerity
Frequency Percent Valid PercentCumulative
PercentValid 1 37 37.0 45.7 45.7
2 17 17.0 21.0 66.73 12 12.0 14.8 81.54 11 11.0 13.6 95.15 4 4.0 4.9 100.0Total 81 81.0 100.0
Missing 0 19 19.0Total 100 100.0
Price
Frequency Percent Valid PercentCumulative
PercentValid 1 23 23.0 28.8 28.8
2 29 29.0 36.3 65.03 11 11.0 13.8 78.84 10 10.0 12.5 91.35 7 7.0 8.8 100.0Total 80 80.0 100.0
Missing 0 20 20.0Total 100 100.0
Location
Frequency Percent Valid PercentCumulative
PercentValid 1 9 9.0 11.7 11.7
2 7 7.0 9.1 20.83 23 23.0 29.9 50.64 24 24.0 31.2 81.85 14 14.0 18.2 100.0Total 77 77.0 100.0
Missing 0 23 23.0Total 100 100.0

Well Known/Brand Name Provider
Frequency Percent Valid PercentCumulative
PercentValid 1 6 6.0 7.8 7.8
2 8 8.0 10.4 18.23 11 11.0 14.3 32.54 13 13.0 16.9 49.45 39 39.0 50.6 100.0Total 77 77.0 100.0
Missing 0 23 23.0Total 100 100.0
Advertisement Seen
Frequency Percent Valid PercentCumulative
PercentValid Yes 24 24.0 25.0 25.0
No 72 72.0 75.0 100.0Total 96 96.0 100.0
Missing 0 4 4.0Total 100 100.0
School Newspaper
Frequency Percent Valid PercentCumulative
PercentValid Yes 17 17.0 65.4 65.4
No 9 9.0 34.6 100.0Total 26 26.0 100.0
Missing 0 74 74.0Total 100 100.0
Local Newspaper
Frequency Percent Valid PercentCumulative
PercentValid Yes 1 1.0 4.0 4.0
No 24 24.0 96.0 100.0Total 25 25.0 100.0
Missing 0 75 75.0Total 100 100.0
TV
Frequency Percent Valid PercentCumulative
PercentValid No 25 25.0 100.0 100.0Missing 0 75 75.0Total 100 100.0
Fliers
Frequency Percent Valid PercentCumulative
PercentValid Yes 12 12.0 48.0 48.0
No 13 13.0 52.0 100.0Total 25 25.0 100.0
Missing 0 75 75.0Total 100 100.0
www.LIT.edu
Frequency Percent Valid PercentCumulative
PercentValid Yes 7 7.0 28.0 28.0
No 18 18.0 72.0 100.0Total 25 25.0 100.0
Missing 0 75 75.0Total 100 100.0
Other Websites
Frequency Percent Valid PercentCumulative
PercentValid No 25 25.0 100.0 100.0Missing 0 75 75.0Total 100 100.0
Other
Frequency Percent Valid PercentCumulative
PercentValid Yes 2 2.0 8.0 8.0
No 23 23.0 92.0 100.0Total 25 25.0 100.0
Missing 0 75 75.0Total 100 100.0
Advertisements Affect
Frequency Percent Valid PercentCumulative
PercentValid Yes 47 47.0 54.0 54.0
No 40 40.0 46.0 100.0Total 87 87.0 100.0
Missing 0 13 13.0Total 100 100.0
Health Insurance
Frequency Percent Valid PercentCumulative
PercentValid Yes 77 77.0 80.2 80.2
No 19 19.0 19.8 100.0Total 96 96.0 100.0
Missing 0 4 4.0Total 100 100.0
Gender
Frequency Percent Valid PercentCumulative
PercentValid Male 45 45.0 46.9 46.9
Female 51 51.0 53.1 100.0Total 96 96.0 100.0
Missing 0 4 4.0Total 100 100.0
Class Load
Frequency Percent Valid PercentCumulative
PercentValid Full-time 93 93.0 96.9 96.9
Part-time 3 3.0 3.1 100.0Total 96 96.0 100.0
Missing 0 4 4.0Total 100 100.0
Student Status
Frequency Percent Valid PercentCumulative
PercentValid Commuter 65 65.0 69.1 69.1
Campus 29 29.0 30.9 100.0Total 94 94.0 100.0
Missing 0 6 6.0Total 100 100.0
Year Born
Frequency Percent Valid PercentCumulative
PercentValid 88 1 1.0 1.0 1.0
87 12 12.0 12.5 13.586 24 24.0 25.0 38.585 16 16.0 16.7 55.284 20 20.0 20.8 76.083 5 5.0 5.2 81.382 8 8.0 8.3 89.681 2 2.0 2.1 91.780 or prior 8 8.0 8.3 100.0Total 96 96.0 100.0
Missing 0 4 4.0Total 100 100.0
Cross-tabulations
#1Case Processing Summary
CasesValid Missing Total
N Percent N Percent N PercentGender * Stress Management 94 94.0% 6 6.0% 100 100.0%
Gender * Stress Management Cross tabulation
Stress Management
Total Yes NoGender Male Count 19 25 44 % within Gender 43.2% 56.8% 100.0%
% within Stress Management 44.2% 49.0% 46.8%
% of Total 20.2% 26.6% 46.8%
Female Count 24 26 50
% within Gender 48.0% 52.0% 100.0%
% within Stress Management 55.8% 51.0% 53.2%
% of Total 25.5% 27.7% 53.2%Total Count 43 51 94
% within Gender 45.7% 54.3% 100.0%
% within Stress Management 100.0% 100.0% 100.0%
% of Total 45.7% 54.3% 100.0%
Chi-Square Tests
Value dfAsymp. Sig.
(2-sided)Exact Sig. (2-sided)
Exact Sig. (1-sided)
Pearson Chi-Square .219(b) 1 .640Continuity Correction(a) .068 1 .795Likelihood Ratio .219 1 .640Fisher's Exact Test .682 .397Linear-by-Linear Association .217 1 .642
N of Valid Cases 94
a Computed only for a 2x2 tableb 0 cells (.0%) have expected count less than 5. The minimum expected count is 20.13.
#2Case Processing Summary
CasesValid Missing Total
N Percent N Percent N PercentStudent Status * Been to the Student Health Center 92 92.0% 8 8.0% 100 100.0%
Student Status * Been to the Student Health Center Cross tabulation
Been to the Student Health
Center
Total Yes NoStudent Status
Commuter Count 30 33 63
% within Student Status 47.6% 52.4% 100.0%
% within Been to the Student Health Center 61.2% 76.7% 68.5%
% of Total 32.6% 35.9% 68.5%
Campus Count 19 10 29
% within Student Status 65.5% 34.5% 100.0%
% within Been to the Student Health Center 38.8% 23.3% 31.5%
% of Total 20.7% 10.9% 31.5%Total Count 49 43 92
% within Student Status 53.3% 46.7% 100.0%
% within Been to the Student Health Center 100.0% 100.0% 100.0%
% of Total 53.3% 46.7% 100.0%
Chi-Square Tests
Value dfAsymp. Sig.
(2-sided)Exact Sig. (2-sided)
Exact Sig. (1-sided)
Pearson Chi-Square 2.556(b) 1 .110Continuity Correction(a) 1.887 1 .170Likelihood Ratio 2.591 1 .107Fisher's Exact Test .122 .084Linear-by-Linear Association 2.528 1 .112
N of Valid Cases 92
a Computed only for a 2x2 tableb 0 cells (.0%) have expected count less than 5. The minimum expected count is 13.55.
#3Case Processing Summary
CasesValid Missing Total
N Percent N Percent N PercentAdvertisement Seen * Advertisements Affect 86 86.0% 14 14.0% 100 100.0%
Advertisement Seen * Advertisements Affect Cross tabulation
Advertisements Affect
Total Yes NoAdvertisement Seen
Yes Count 9 14 23
% within Advertisement Seen 39.1% 60.9% 100.0%
% within Advertisements Affect 19.6% 35.0% 26.7%
% of Total 10.5% 16.3% 26.7%
No Count 37 26 63
% within Advertisement Seen 58.7% 41.3% 100.0%
% within Advertisements Affect 80.4% 65.0% 73.3%
% of Total 43.0% 30.2% 73.3%Total Count 46 40 86
% within Advertisement Seen 53.5% 46.5% 100.0%
% within Advertisements Affect 100.0% 100.0% 100.0%
% of Total 53.5% 46.5% 100.0%

Chi-Square Tests
Value dfAsymp. Sig.
(2-sided)Exact Sig. (2-sided)
Exact Sig. (1-sided)
Pearson Chi-Square 2.602(b) 1 .107Continuity Correction(a) 1.873 1 .171Likelihood Ratio 2.607 1 .106Fisher's Exact Test .144 .086Linear-by-Linear Association 2.571 1 .109
N of Valid Cases 86
a Computed only for a 2x2 tableb 0 cells (.0%) have expected count less than 5. The minimum expected count is 10.70.