Embed Size (px)
Citation preview

Covid-19: Challenges for BME
Communities
David R. Williams, PhD, MPHFlorence & Laura Norman Professor of Public Health
Chair, Department of Social and Behavioral Sciences
Professor of African & African American Studies and of
Sociology
Harvard University
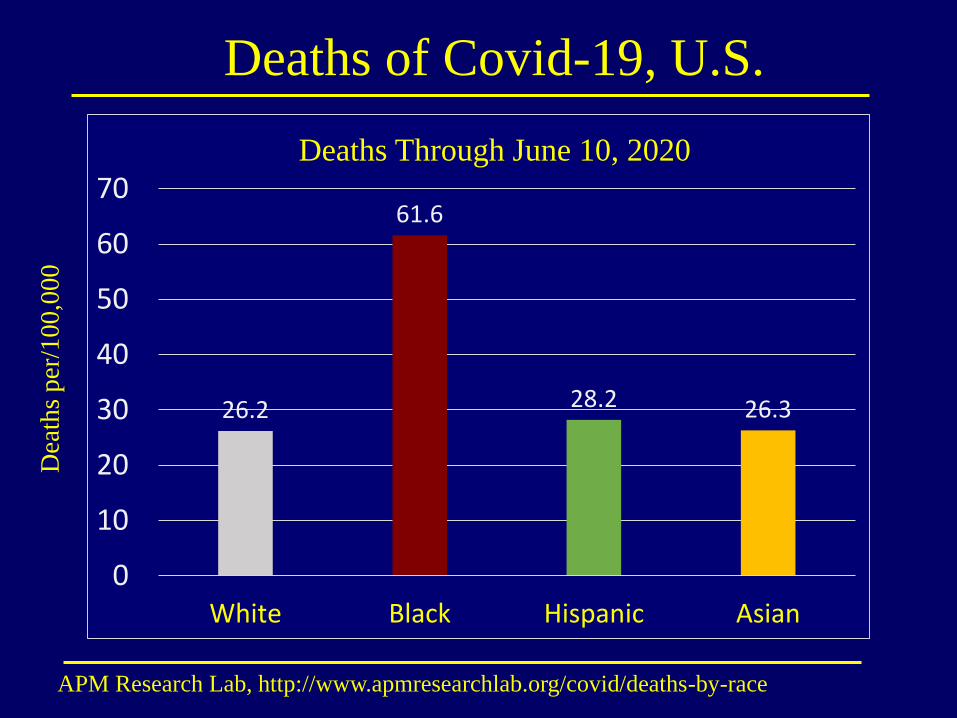
Deaths of Covid-19, U.S.
APM Research Lab, http://www.apmresearchlab.org/covid/deaths-by-race
26.2
61.6
28.2 26.3
0
10
20
30
40
50
60
70
White Black Hispanic Asian
Deaths Through June 10, 2020
Dea
ths
per
/10
0,0
00

Covid-19 Deaths by Race
• If all racial/ethnic groups had died at the
same rate as white Americans:
- 14,400 Black Americans
- 1,200 Hispanic Americans, and
- 200 Indigenous Americans
would still be alive
APM Research Lab, http://www.apmresearchlab.org/covid/deaths-by-race Pixabay.com

Data for Covid-19 are consistent
with other Health Data

Infant Mortality in the U.S., 2015
Health United States, NCHS, 2017
4.9
11.3
8.6
54.1
0
2
4
6
8
10
12
White Black American
Indian
Hispanic Asian/Pl
White Black American Indian Hispanic Asian/Pl

Infant Mortality by Ethnicity, England, 2014
2.2
3.6
6.8
5.8
7.1
3.7 3.9
0
1
2
3
4
5
6
7
8
All
Cau
se I
nfa
nt
Morta
lity
Deaths per 1,000 live births. Public Health England, 2018

Pregnancy-Related Deaths, U.S., 2011-15Deaths Per 100,000 Live Births, by Race/Ethnicity
17
13
43
33
1411
0
10
20
30
40
50
All White Black American Indian Asian/Pacific
Islander
Hispanic
Pre
gn
an
cy-R
elate
d D
eath
s
Race
E.E. Peterson et al., MMWR, May 7, 2019

0
10
20
30
40
50
White Asian Black
40
Ethnicity and Risk of Dying in Pregnancy2014 -2016, UK and Ireland
Marian Knight et al, MBRRACE-UK, 2019
Deaths per 100,000 people
8
15

There are large Inequities in
Socioeconomic Status by Ethnicity

Median Household Income and Race, 2018
Racial Differences in Income are Substantial:
U.S. Census Bureau, Semega et al., 2019; * For 2017; US Census Bureau, ACS, 2017
1 dollar 1.23 dollar 73 cents 59 cents
Whites Asians Hispanics Blacks
59 cents
Am Indians*

Median Household Income, 2009/10-2012/13
For every £ of weekly income that White majority earns
Other Whites earn 79p
Indians earn 86p
Pakistanis earn 57p
Bangladeshis earn 52p
Fisher & Nandi, Joseph Rowntree Foundation, 2015

Medium Household Income, 2009/10-2012/13
For every £ of weekly income that the White majority earns
Chinese earn 76p
Black Caribbeans earn 77p
Black Africans earn 60p
Fisher & Nandi, Joseph Rowntree Foundation, 2015

Wealth versus Income• Home ownership
• Other real estate
• Checking, savings, money
market accounts, CDs
• Vehicles
• Businesses
• IRA/Keogh, stocks, bonds,
mutual funds, treasury bills
• Subtracting mortgages and
debt pixabay
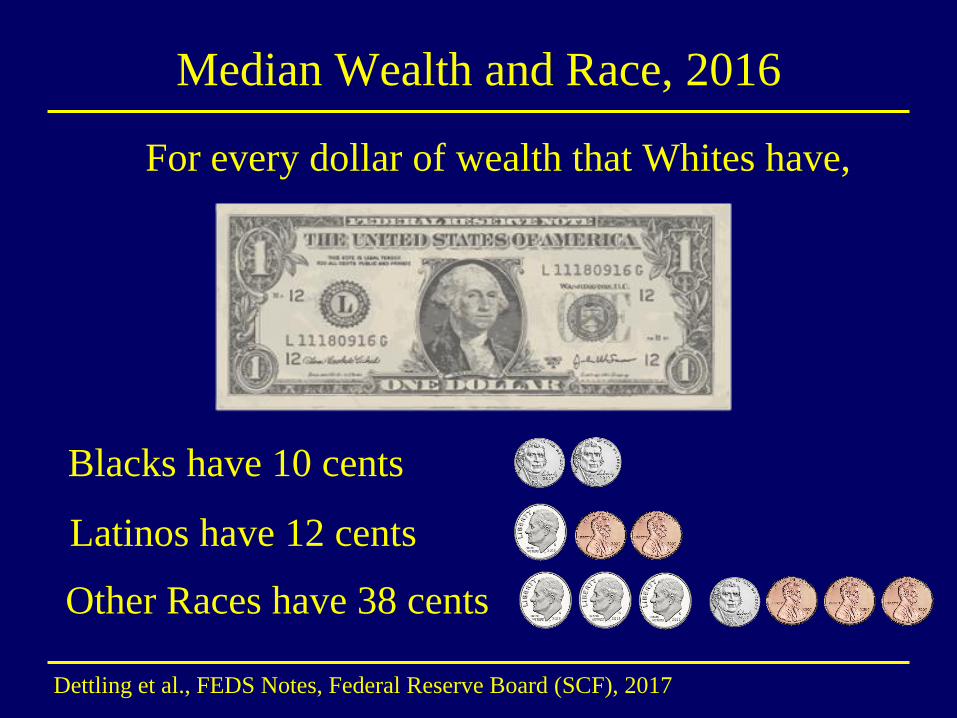
Median Wealth and Race, 2016
For every dollar of wealth that Whites have,
Blacks have 10 cents
Latinos have 12 cents
Other Races have 38 cents
Dettling et al., FEDS Notes, Federal Reserve Board (SCF), 2017

Median Household Wealth, 2014-2016
£282£266
£127
£30
£89
£300
50
100
150
200
250
300
Wea
lth p
er h
ouse
hold
ONS Wealth and Assets Survey Omar Khan, Runnymede, 2020

Wealth by Ethnic Group, 2014-2016
Ethnic Differences in Wealth are Substantial:
ONS Wealth and Assets Survey Omar Khan, Runnymede, 2020
1 pound 95 pence 50 pence 10 pence
White
British Indian PakistaniBlack
African
20 pence
Black
Caribbean Bangladeshi
10 pence

What Low Economic Status Means
We are in the same storm, but in different boats
Pixels
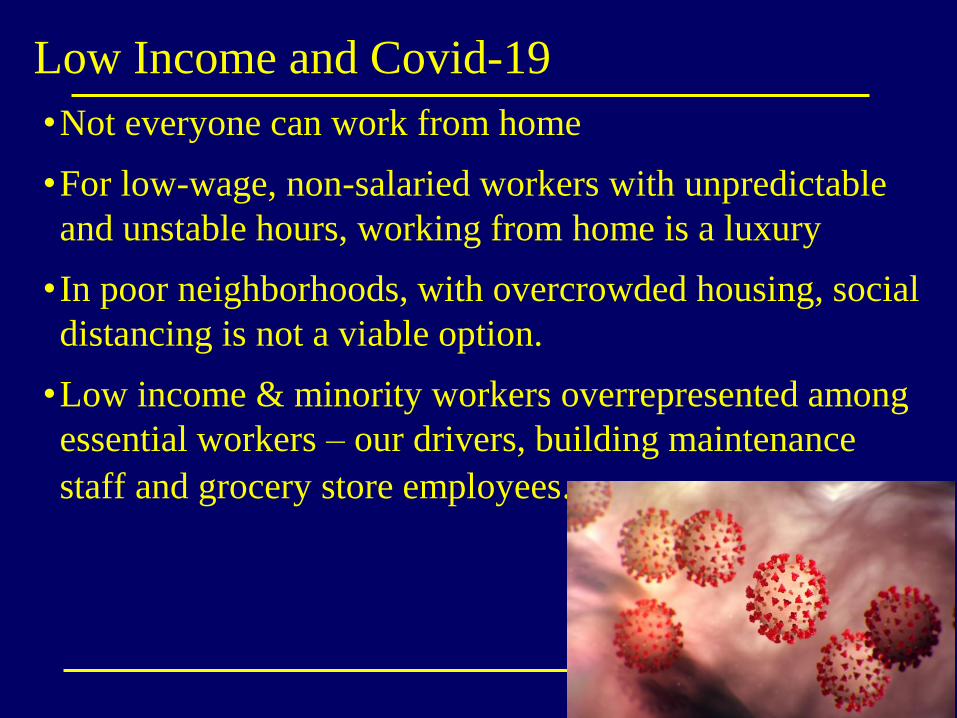
Low Income and Covid-19
•Not everyone can work from home
•For low-wage, non-salaried workers with unpredictable
and unstable hours, working from home is a luxury
• In poor neighborhoods, with overcrowded housing, social
distancing is not a viable option.
•Low income & minority workers overrepresented among
essential workers – our drivers, building maintenance
staff and grocery store employees.

Race Still Matters for Health after
Social class/Socieconomic
Status is taken into Account

Covid-19 Deaths, Relative to Whites
4.2
3.6
2.4
1.9 1.8
1.3
4.3
3.4
2.7
1.91.6
1.4
0
1
2
3
4
5
M - Age Adjusted M - Fully Adj F - Age Adjusted F - Fully Adj
Male Female Male Female Male Female
Black Bangladeshi/Pakistani Indian
Odds
Rat
ios
Office of National Statistics, May 7, 2020
Fully Adjusted: age, urbanicity, IMD, HH, education, HH tenure, health

Residing in Disadvantaged
Communities
Opportunities Linked to Place (an
individual or group’s community
of residence) is a powerful driver
of economic status, resources,
quality of life and exposure to
stress in society

Neighborhood Opportunity Index
1. Institutions: number & quality of
schools, early childhood centers
2. Influences shaping norms and
expectations: (high school graduation
rate, adults with high skill jobs)
3. Economic Resources: income, home
ownership, employment, public assistance
4. Environmental Quality: air, water,
soil pollution, hazardous waste sites
5. Resources for health: green space,
healthy food outlets, walkability
Acevedo-Garcia, 2020, Diversitydatakids.org Shutterstock.com

Percentage of Children at Neighborhood
Opportunity Level
18 17
6567
15
19
58
18
2322
16
62
53
18
29
0
10
20
30
40
50
60
70
80
Very Low/Low Moderate High/Very High
Percen
t a
t o
pp
ortu
nit
y l
ev
el
NH White Black Hispanic API AmI/AN
D. Acevedo-Garcia 2020, Diversitydatakids.org
100 largest Metropolitan areas

Residential Segregation and SES
A study of the effects of segregation on young African American adultsfound that the eliminationof segregation would eraseblack-white differences in:
▪ Earnings
▪ High School Graduation Rate
▪ Unemployment
And reduce racial differences in single
motherhood by two-thirdsCutler & Glaeser, 1997

Residential Segregation in
Western Europe
Douglas Massey, Oxford Handbook of Social Science, 2016
• Levels of segregation in Europe
are rising compared to the steady
or falling levels in\
]\ North America
• Patterns of Segregation in Europe:
1. Religion: Segregation greater for Muslims than
for other religious groups
2. Skin Color: After religion, segregation is greater
for darker skinned nationalities

0
10
20
30
40
50
60
70
Caribbean Blacks Indians Pakistanis Bangladeshis
61
Segregation in Britain
35
56
43
Douglas Massey, Oxford Handbook of Social Science, 2016

Percentage of Ethnic Group Living in Most
Deprived 10% of Neighbourhoods England 2015
8%
9%
9%
10%
10%
12%
18%
19%
20%
28%
31%
0% 5% 10% 15% 20% 25% 30% 35%
Indian
White British
White Irish
Chinese
White other
Gypsy/Traveller
Black Caribbean
Arab
Black African
Bangladeshi
Pakistani
GOV.UK, Ethnicity Facts & Figures, Index of Multiple Deprivation and 2011 Census

Lower economic status, living in more
disadvantaged neighborhoods and
exposure to racism leads to higher
levels of:
1. Economic Stressors
2. Psychosocial Stressors
3. Racial Discrimination
4. Physical & Chemical Stressors

The Stress of Discrimination and
its effects on Health
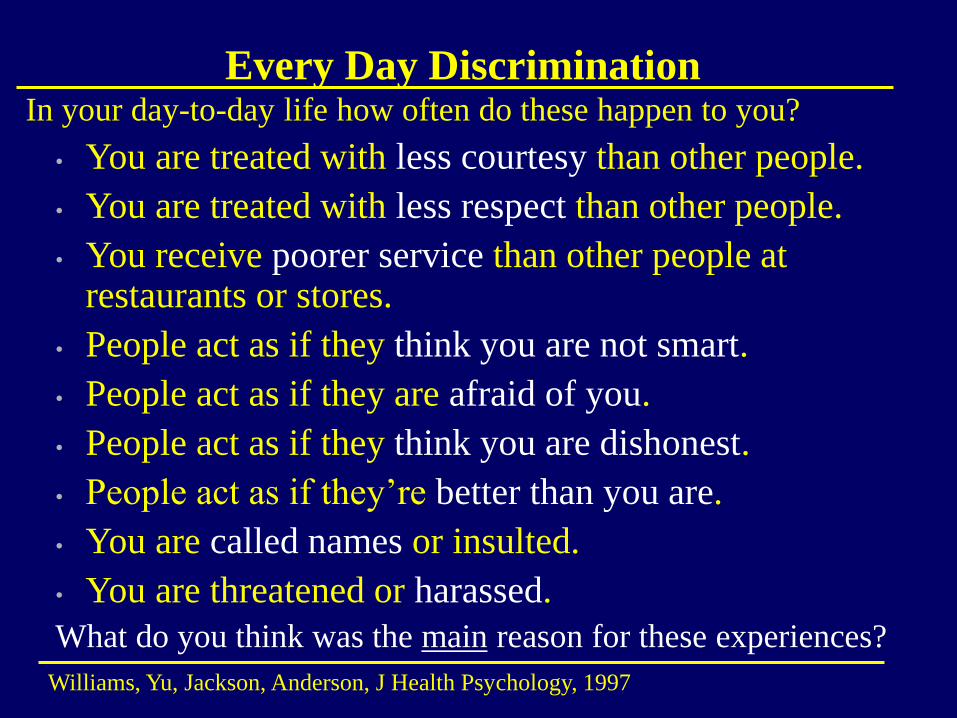
Every Day DiscriminationIn your day-to-day life how often do these happen to you?
• You are treated with less courtesy than other people.
• You are treated with less respect than other people.
• You receive poorer service than other people at restaurants or stores.
• People act as if they think you are not smart.
• People act as if they are afraid of you.
• People act as if they think you are dishonest.
• People act as if they’re better than you are.
• You are called names or insulted.
• You are threatened or harassed.
What do you think was the main reason for these experiences?
Williams, Yu, Jackson, Anderson, J Health Psychology, 1997

Everyday Discrimination & Adult Health
Incident-MetabolicSyndrome
-CVD outcomes-Breast cancer -Type 2 diabetes
Nicotine dependenceBinge eatingSmoking & drug useAt-risk drinking
CAC (coronary artery calcification)
IMT (intima media thickness)
Visceral fat
HRV
Atrial fibrillation
Adult onset asthma Nocturnal amb. BPCognitive functionIncreases in SBP, DBP
Sleep duration
Sleep quality
Inflammation (CRP, IL-6, e-selectin)
CortisolTelomere lengthAllostatic load
Waist circumference
Obesity
Weight gain
Breast cancer screening
Cervical cancer screening
Lower adherence
Delays in seeking
treatment
DSM Disorders
Emotional Distress
Well-being
Changes in personality
Williams, Lawrence, Davis & Vu, Health Services Research, 2019
The Consequences
“Accelerated Aging”
“Premature Aging”
Biological “Weathering”
Earlier Onset of Chronic Disease

Earlier Onset of High Blood Pressure
41%
22%
10%
61.00%
33%
12%
0% 10% 20% 30% 40% 50% 60% 70%
Age 50-64
Age 35-49
Age 18-34
African American White
Behavioral Risk Factor Surveillance System, 2015

Earlier Onset of Diabetes
14%
6%
1.4%
23%
10%
1.5%
0% 5% 10% 15% 20% 25%
Age 50-64
Age 35-49
Age 18-34
African American White
Behavioral Risk Factor Surveillance System, 2015

Individual Discrimination and
Health Care

Racial Bias in
Medical Care

Reducing Racial Inequities in
Health
What Can We Do?

Interventions to Reduce Inequities in Health
Create Communities of Opportunity to minimize,
neutralize and dismantle the systems of racism that
create inequities in health

Communities of Opportunity
• Ensure access to high quality care
• Invest in early Childhood
• Reduce Childhood Poverty
• Enhance Income and Employment
Opportunities for Youth and Adults
• Improve Neighborhood and Housing
Conditions
• Provide Care that Addresses the Social context
• Raise Awareness levels of Racial Inequities and
Build Political Will to Address them______________________________________________________________________
David R Williams & Lisa Cooper, Int J Environmental Res & Public Health, 2019

“It may well be that we
will have to repent in this
generation. Not merely
for the vitriolic words and
the violent actions of the
bad people, but for the
appalling silence and
indifference of the good
people...”
Martin Luther King
-