Embed Size (px)
Citation preview
COVID-19 China Energy Impact Tracker How is the pandemic reshaping China’s energy sector?
ANALYSIS
#1 SEPTEMBER
2020

Agora Energiewende | COVID-19 China Energy Impact Tracker
2
A publication by Agora Energiewende
Kevin Jianjun Tu Zhou Yang
Please cite as: Agora Energiewende (2020): COVID-19 China Energy Impact Tracker: How is the pandemic reshaping China’s energy sector? Issue 1.
187/05-A-2020/EN Version 1.0, September 2020

3
Agora Energiewende | COVID-19 China Energy Impact Tracker
4
Preface
The novel coronavirus (COVID-19) pandemic has precipitated the most severe global recession since the 1930s. The International Monetary Fund recently projected that the global economy could contract significantly by 4.9 per cent year-over-year (YOY) in 2020. And China, once a seemingly unstoppable economic juggernaut, saw its economy decline by 6.8 per cent YOY in the first quarter of 2020. The last time China reported an economic contraction was at the end of the Cultural Revolution in 1976, more than four decades ago.
The second largest economy after the United States, China ranks first in the world in terms of energy production, energy consumption, carbon emissions, power generation, the clean-energy market and imports of coal, oil and gas. In 2019, fuel combustion in China accounted for about 29 per cent of global carbon emissions, and coal-fired power plants in China alone represented near half of global capacity.
Not surprisingly, the COVID-19 pandemic’s impact on China’s energy sector is important not only for the country’s own energy transition but also for the global climate agenda.
With the COVID-19 China Energy Impact Tracker, we at Agora Energiewende regularly provide up-to-date information on how the COVID-19 pandemic has impacted China’s energy sector, covering the sector-level development of energy supply, consumption, carbon emissions and other key indicators. The COVID-19 China Energy Impact Tracker will feature a series of reports aiming to better inform the international community and Chinese audiences alike about COVID-19’s effects on the Chinese energy economy.
Dr. Patrick Graichen, Director, Agora Energiewende
Key findings at a glance:
1 The pandemic triggered an unprecedented economic contraction in the first quarter of 2020, the first
time China has experienced a decline in national output in over four decades.
Following a drastic slump of 6.8 per cent YOY in Q1, the Chinese economy rebounded with 3.2 per cent
YOY growth in Q2. China is projected to be the only major economy to see positive growth in 2020.
2 COVID-19-induced climate and environmental benefits will be short-lived.
Because of the coal-intensive economic recovery in Q2 2020, China’s carbon emissions and air pollution
have already returned to pre-crisis levels. Structural changes and a green stimulus package are urgently
needed to steer China’s economic recovery in a more environmentally sustainable direction.
3 The National Bureau of Statistics should consider readjusting China’s energy statistical reporting in the
near future, especially with regard to coal-related data.
Because of coal’s dominance in China’s primary energy mix and the uncertainty associated with the
country’s statistical reporting on coal in recent years, it is important to focus attention on tracking the
changes and trends in China’s economic activity and energy consumption instead of on the absolute
numbers provided in our COVID-19 China Energy Impact Tracker reports.
Agora Energiewende | COVID-19 China Energy Impact Tracker
5
Content
I | Outlook 2020 6
1 | Insights from crises in the past 7 2 | Economy 8 3 | Energy consumption 10 4 | Carbon emissions 11 5 | Summary 13
2 | Economy & power demand 14
1 | Economy: Quarter 1 15 2 | Economy: Quarter 1 & 2 16 3 | Power consumption: Quarter 1 17 4 | Power consumption: Half 1 18 5 | Summary 19
3 | Fossil fuel energy 20
1 | Energy production 21 2 | Coal consumption 22 3 | Oil & natural gas consumption 25 4 | Summary 27
4 | Renewables 28
5 | Air quality 31
6 | Concluding remarks 33
7 | References 35
Agora Energiewende | COVID-19 China Energy Impact Tracker
6
I | 2020 Outlook
1 | Insights from past crises 7
2 | Economy 8
3 | Energy consumption 10
4 | Carbon emissions 11
5 | Summary 13

I | 2020 Outlook
7
Insights from past crises
Figure 1 | World energy consumption by fuel, 1800–2019
Source: Vaclav Smil (2010), BP (2020)
Figure 2 | Global power generation mix, 1971–2019
Source: IEA online database, BP (2020)
Though major crises do not always leave a permanent mark on the energy sector, they offer a good opportunity for national governments to reshape national energy mix. In the first half of the 20th century, the
Spanish Flu and two world wars accelerated the global energy transition from coal to oil.
By comparison, more recent crises such as the 1973 oil crisis and the 1986 Chernobyl nuclear accident had less of an impact on the trajectories of individual fuels.
COVID-19 is expected to encourage a political preference for self-reliance across the globe, which may benefit renewable and energy conservation.
Unfortunately, for the same reason, COVID-19 may also become a justification for prolonging the use of carbon-intensive coal in some parts of the world.
Finally, the impact of the crisis on the global poor is likely to translate into a higher share of traditional biomass consumption in the global energy mix.
Coal
Oil
Gas
NuclearHydro
Renewable0%
10%
20%
30%
40%
50%1971 1977 1983 1989 1995 2001 2007 2013 2019
1986 Chernobyl 2003 SARS
2008 financial crisis 1973 oil crisis
Coal
Oil
Gas
Hydro
Nuclear Renewables
Traditional biomass
0%
1%
10%
100%1800 1850 1900 1950 2000 2050
1918 Spanish Flu

Agora Energiewende | COVID-19 China Energy Impact Tracker
8
Figure 3 | China’s projected economic growth in 2020
.
2020 Outlook: Economy
Since the Wuhan lockdown on 23 January 2020, the global economy has experienced an economic shock. Forecasters have severely downgraded their growth projections. Further downgrades may be in store as analysts track the evolution of the pandemic
On June 24, the International Monetary Fund (IMF) projected that the global economy would contract by 4.9 per cent YOY in 2020, 1.9 percentage points below its April 2020 forecast, and 8.2 percentage points below its January 2020 forecast.
I | 2020 Outlook
9
2020 Outlook: Economy (cont.)
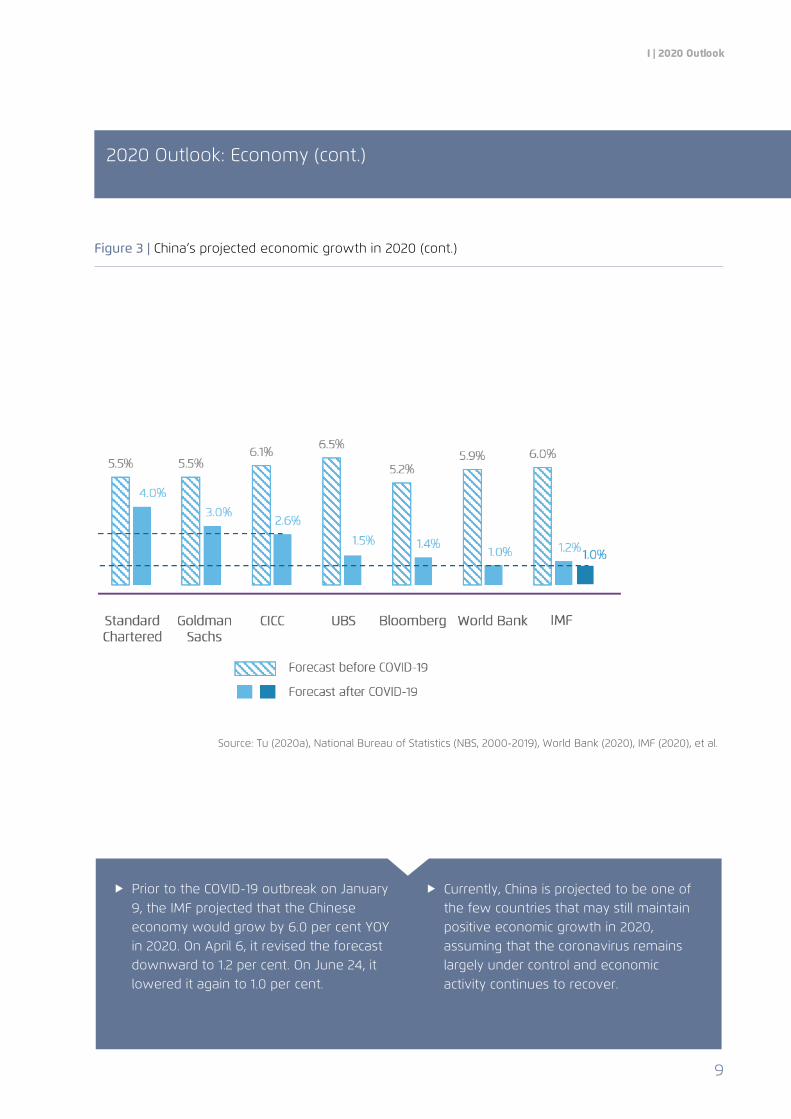
Figure 3 | China’s projected economic growth in 2020 (cont.)
Source: Tu (2020a), National Bureau of Statistics (NBS, 2000-2019), World Bank (2020), IMF (2020), et al.
Prior to the COVID-19 outbreak on January 9, the IMF projected that the Chinese economy would grow by 6.0 per cent YOY in 2020. On April 6, it revised the forecast downward to 1.2 per cent. On June 24, it lowered it again to 1.0 per cent.
Currently, China is projected to be one of the few countries that may still maintain positive economic growth in 2020, assuming that the coronavirus remains largely under control and economic activity continues to recover.
Agora Energiewende | COVID-19 China Energy Impact Tracker
10
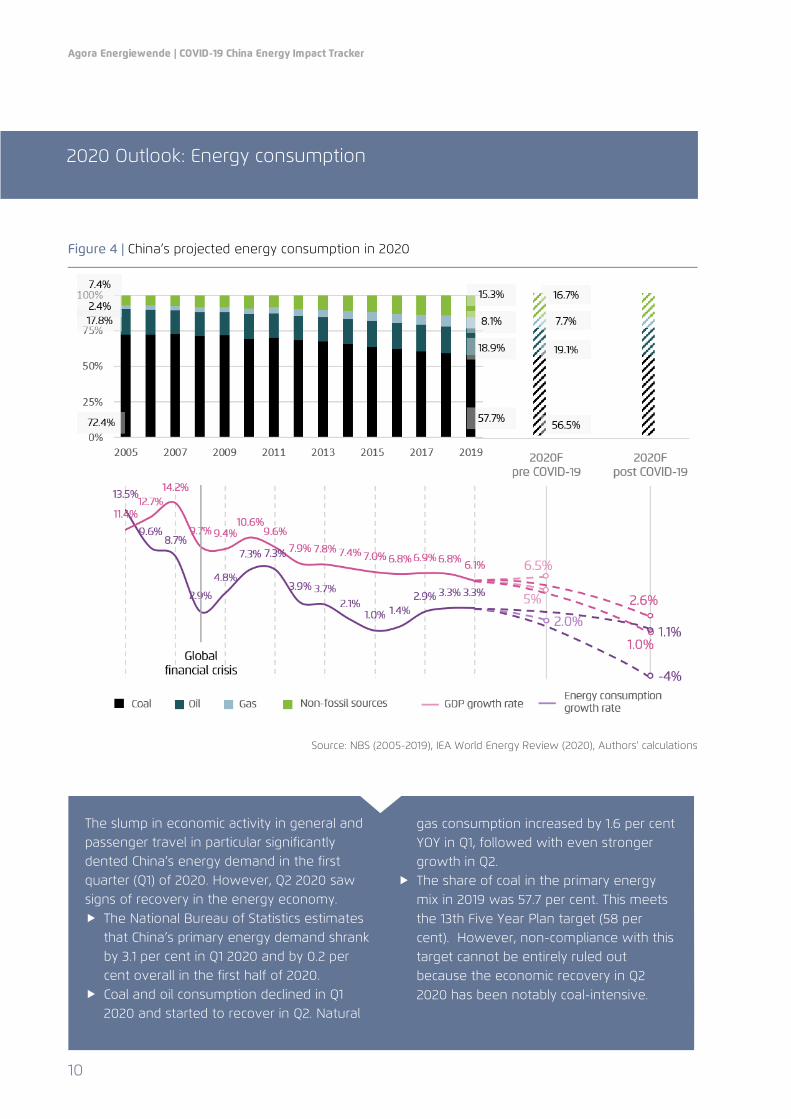
Figure 4 | China’s projected energy consumption in 2020
Source: NBS (2005-2019), IEA World Energy Review (2020), Authors’ calculations
2020 Outlook: Energy consumption
The slump in economic activity in general and passenger travel in particular significantly dented China’s energy demand in the first quarter (Q1) of 2020. However, Q2 2020 saw signs of recovery in the energy economy. The National Bureau of Statistics estimates
that China’s primary energy demand shrank by 3.1 per cent in Q1 2020 and by 0.2 per cent overall in the first half of 2020.
Coal and oil consumption declined in Q1 2020 and started to recover in Q2. Natural
gas consumption increased by 1.6 per cent YOY in Q1, followed with even stronger growth in Q2.
The share of coal in the primary energy mix in 2019 was 57.7 per cent. This meets the 13th Five Year Plan target (58 per cent). However, non-compliance with this target cannot be entirely ruled out because the economic recovery in Q2 2020 has been notably coal-intensive.
I | 2020 Outlook
11
2020 Outlook: Carbon emissions
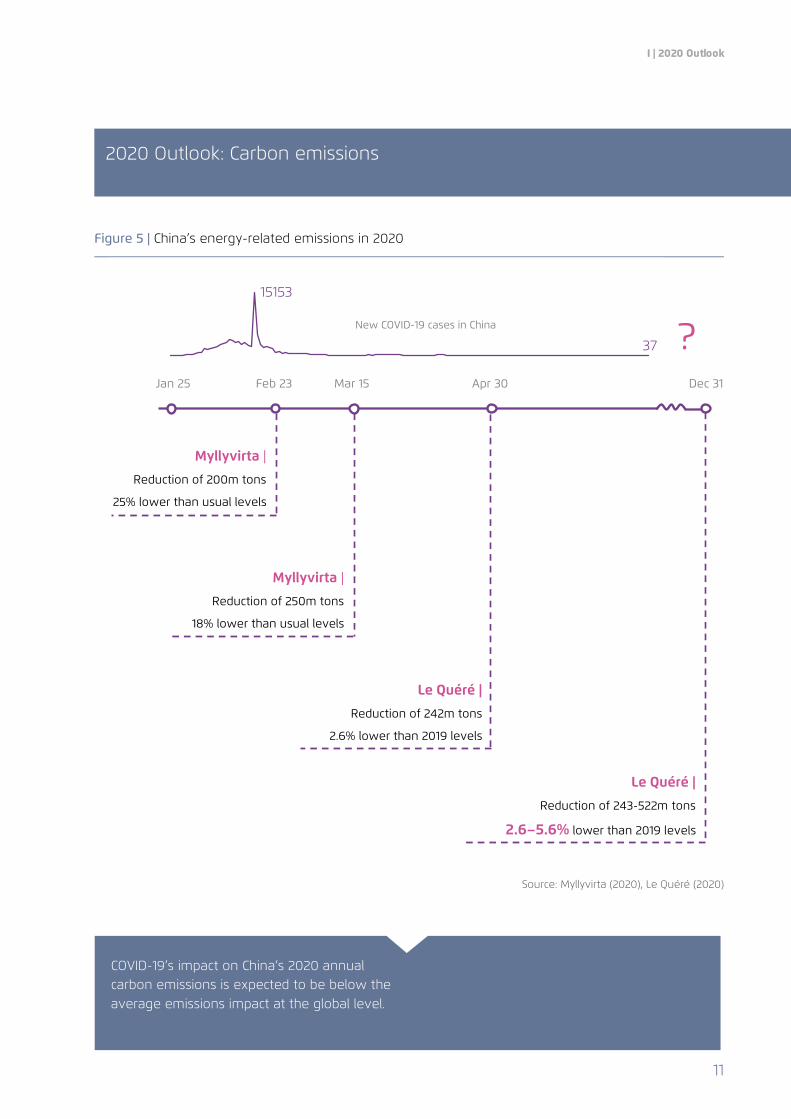
Figure 5 | China’s energy-related emissions in 2020
Source: Myllyvirta (2020), Le Quéré (2020)
COVID-19’s impact on China’s 2020 annual carbon emissions is expected to be below the average emissions impact at the global level.
Myllyvirta | Reduction of 200m tons
25% lower than usual levels
Myllyvirta | Reduction of 250m tons
18% lower than usual levels
Le Quéré | Reduction of 242m tons
2.6% lower than 2019 levels
Le Quéré | Reduction of 243-522m tons
2.6–5.6% lower than 2019 levels
Jan 25 Feb 23 Mar 15 Apr 30 Dec 31
15153
37 ? New COVID-19 cases in China
COVID-19’s impact on China’s 2020 annual carbon emissions is expected to be below the average emissions impact at the global level.
Agora Energiewende | COVID-19 China Energy Impact Tracker
12
2020 Outlook: Carbon emissions (cont.)
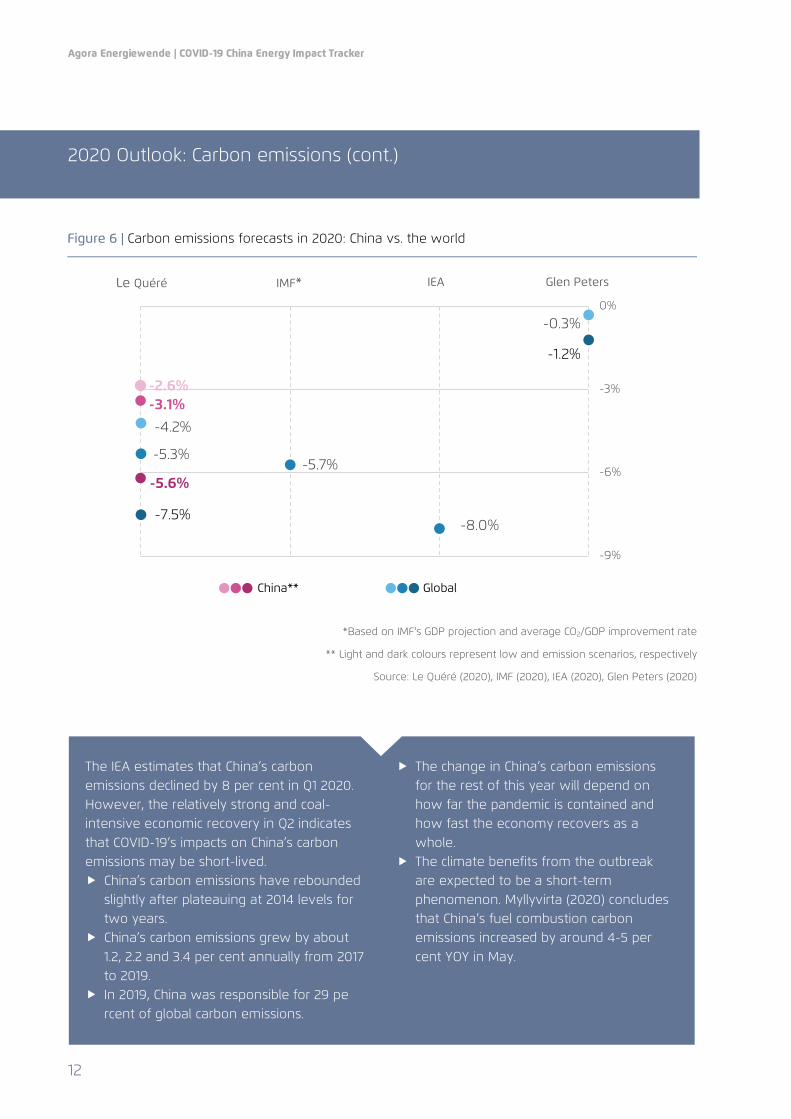
Figure 6 | Carbon emissions forecasts in 2020: China vs. the world
*Based on IMF's GDP projection and average CO2/GDP improvement rate
** Light and dark colours represent low and emission scenarios, respectively
Source: Le Quéré (2020), IMF (2020), IEA (2020), Glen Peters (2020)
The IEA estimates that China’s carbon emissions declined by 8 per cent in Q1 2020. However, the relatively strong and coal-intensive economic recovery in Q2 indicates that COVID-19’s impacts on China’s carbon emissions may be short-lived. China’s carbon emissions have rebounded
slightly after plateauing at 2014 levels for two years.
China’s carbon emissions grew by about 1.2, 2.2 and 3.4 per cent annually from 2017 to 2019.
In 2019, China was responsible for 29 pe rcent of global carbon emissions.
The change in China’s carbon emissions for the rest of this year will depend on how far the pandemic is contained and how fast the economy recovers as a whole.
The climate benefits from the outbreak are expected to be a short-term phenomenon. Myllyvirta (2020) concludes that China’s fuel combustion carbon emissions increased by around 4-5 per cent YOY in May.
-4.2%
-0.3%
-5.3%-5.7%
-8.0%-7.5%
-1.2%
-9%
-6%
-3%
0%
-5.6%
-3.1%
Le Quéré IEA Glen Peters IMF*
China** Global
-2.6%
I | 2020 Outlook
13
2020 Outlook
China faces both risk and opportunity if it wants to leverage COVID-19 to decouple carbon emissions from economic growth
The world has witnessed unprecedentedly fast and large downgrades in economic growth forecasts because of the COVID-19 pandemic. In Q1 2020, the Chinese economy shrank by 6.8 per cent YOY, the country’s first reported economic contraction since the end of the Cultural Revolution in 1976.
Unlike the global Financial Crisis in 2008, the COVID-19 pandemic has triggered a deep recession in the real economy in China, hitting small- and medium-sized enterprises the hardest. The resulting recession is expected to be more severe and long-lasting, and thus requires more stimulus. Despite this outlook, Asia, especially China, is expected to be the engine of global economic recovery, with relatively strong growth pickups. Assuming that the outbreak in China remains largely contained, the country is widely expected to witness positive growth in 2020 and a more pronounced economic rebound in 2021.
Combined with the direct shocks from the economic downturn, China’s energy sector, which has been
undergoing internal restructuring for decades, now faces complicated circumstances caused by both the ongoing pandemic and the associated intervention policy.
In Q1 2020, carbon emissions in China followed the downward trajectory of economic activity and energy demand. Nevertheless, because the economic contraction is temporary, concerted efforts are urgently needed if China is to reap long-term climate benefits from the crisis. With the recovery of economic activity, China’s carbon emissions could either follow the country’s economic trajectory or decouple itself from it. In the end, the direction will largely depend on how green the country’s recovery plan is.
The rest of this report examines economic and energy sector indicators for how the crisis could become an opportunity for China to design a stimulus package that avoids carbon-intensive investments. They show that socially, politically and environmentally benign structural changes will allow China to accelerate the peaking of its national carbon emissions before 2030.

Agora Energiewende | COVID-19 China Energy Impact Tracker
14
2 | Economy & power demand
1 | Economy: Q 1 15
2 | Economy: Q1 & Q2 16
3 | Power consumption: Q1 17
4 | Power consumption: H1 18
5 | Summary 19
2 | Economy & power demand
15
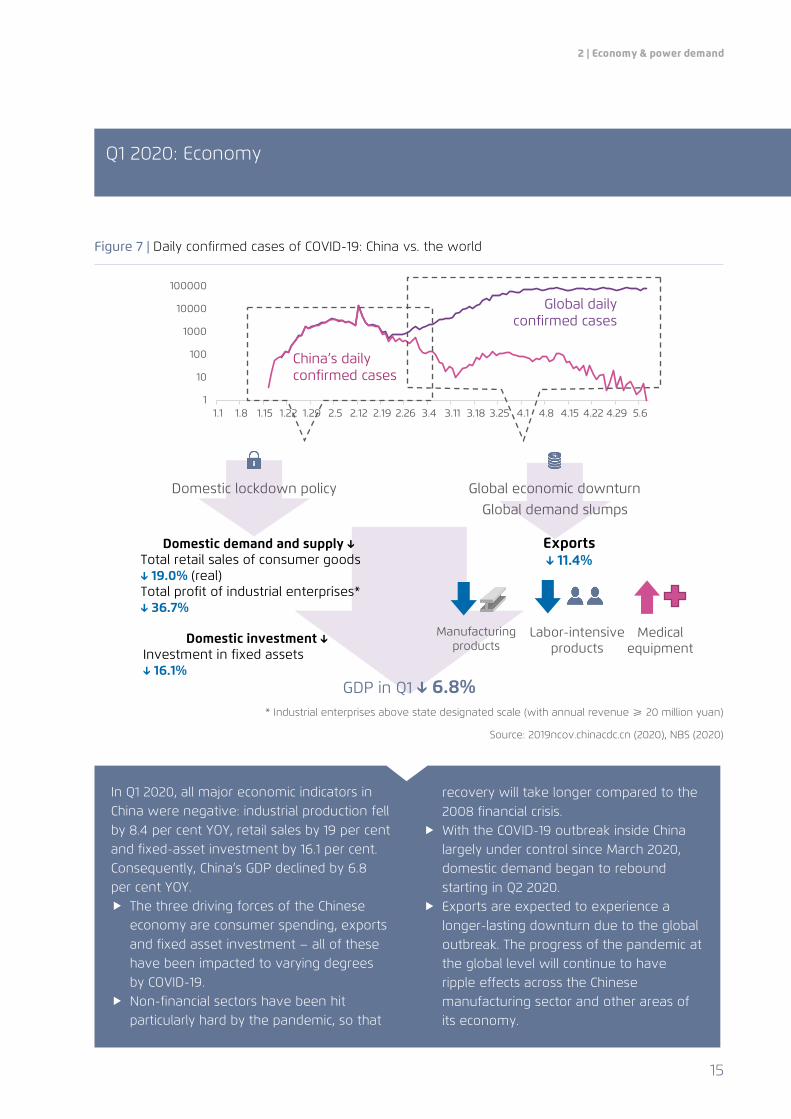
Figure 7 | Daily confirmed cases of COVID-19: China vs. the world
* Industrial enterprises above state designated scale (with annual revenue ≥ 20 million yuan)
Source: 2019ncov.chinacdc.cn (2020), NBS (2020)
Q1 2020: Economy
1
10
100
1000
10000
100000
1.1 1.8 1.15 1.22 1.29 2.5 2.12 2.19 2.26 3.4 3.11 3.18 3.25 4.1 4.8 4.15 4.22 4.29 5.6
China’s daily confirmed cases
Global daily confirmed cases
Domestic lockdown policy Global economic downturn Global demand slumps
Exports ↓ 11.4%
Manufacturing products
Medical equipment
Labor-intensive products
Domestic demand and supply ↓ Total retail sales of consumer goods ↓ 19.0% (real) Total profit of industrial enterprises* ↓ 36.7%
Domestic investment ↓ Investment in fixed assets ↓ 16.1%
GDP in Q1 ↓ 6.8%
In Q1 2020, all major economic indicators in China were negative: industrial production fell by 8.4 per cent YOY, retail sales by 19 per cent and fixed-asset investment by 16.1 per cent. Consequently, China’s GDP declined by 6.8 per cent YOY. The three driving forces of the Chinese
economy are consumer spending, exports and fixed asset investment – all of these have been impacted to varying degrees by COVID-19.
Non-financial sectors have been hit particularly hard by the pandemic, so that
recovery will take longer compared to the 2008 financial crisis.
With the COVID-19 outbreak inside China largely under control since March 2020, domestic demand began to rebound starting in Q2 2020.
Exports are expected to experience a longer-lasting downturn due to the global outbreak. The progress of the pandemic at the global level will continue to have ripple effects across the Chinese manufacturing sector and other areas of its economy.
Agora Energiewende | COVID-19 China Energy Impact Tracker
16
First half (H1) of 2020: Economy
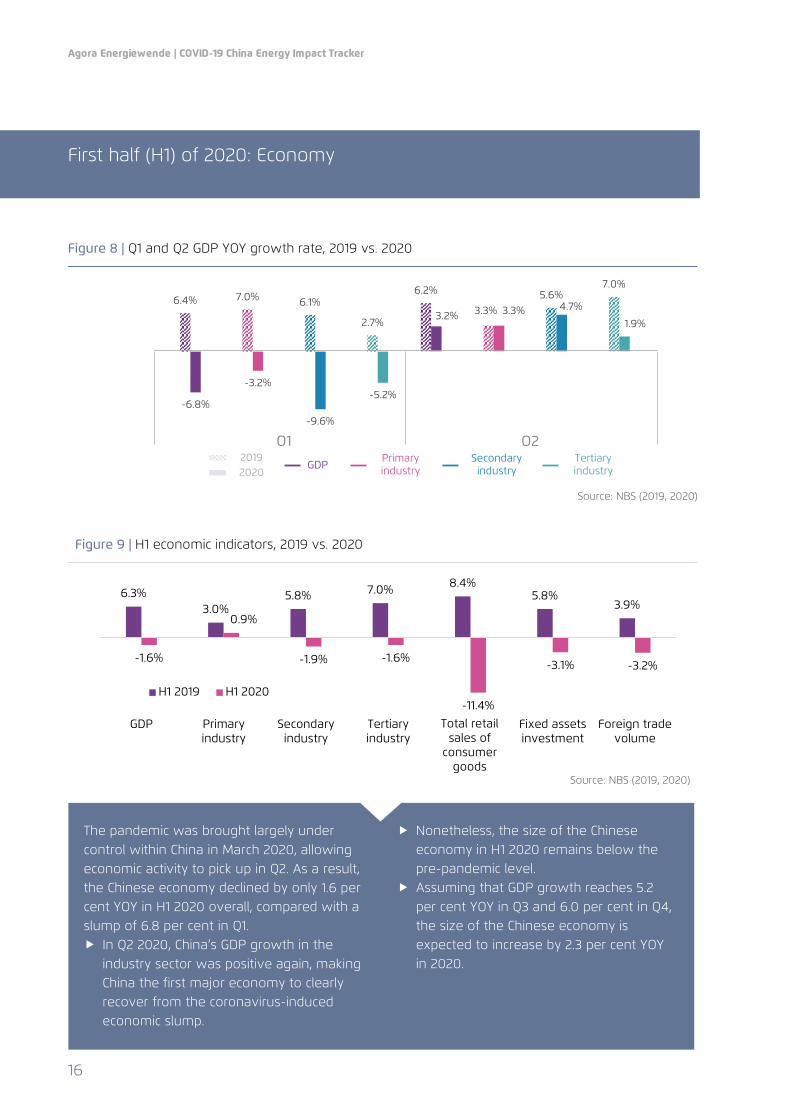
Figure 8 | Q1 and Q2 GDP YOY growth rate, 2019 vs. 2020
Source: NBS (2019, 2020)
Figure 9 | H1 economic indicators, 2019 vs. 2020
Source: NBS (2019, 2020)
6.2%
3.3%5.6%
7.0%
3.2% 3.3% 4.7%
1.9%
6.4% 7.0% 6.1%
2.7%
-6.8%
-3.2%
-9.6%
-5.2%
Q1 Q2 2019 2020 GDP Primary
industry Secondary industry
Tertiary industry
The pandemic was brought largely under control within China in March 2020, allowing economic activity to pick up in Q2. As a result, the Chinese economy declined by only 1.6 per cent YOY in H1 2020 overall, compared with a slump of 6.8 per cent in Q1. In Q2 2020, China’s GDP growth in the
industry sector was positive again, making China the first major economy to clearly recover from the coronavirus-induced economic slump.
Nonetheless, the size of the Chinese economy in H1 2020 remains below the pre-pandemic level.
Assuming that GDP growth reaches 5.2 per cent YOY in Q3 and 6.0 per cent in Q4, the size of the Chinese economy is expected to increase by 2.3 per cent YOY in 2020.
6.3%3.0%
5.8% 7.0% 8.4%5.8%
3.9%
-1.6%
0.9%
-1.9% -1.6%
-11.4%
-3.1% -3.2%
GDP Primaryindustry
Secondaryindustry
Tertiaryindustry
Total RetailSales of
ConsumerGoods
Fixed assetsinvestment
Foreign tradevolume
H1 2019 H1 2020
Total retail sales of
consumer goods

2 | Economy & power demand
17
Figure 10 | Q1 power demand YOY growth, 2014–2020
Source: NBS (2014–2020)
Figure 11 | Q1 power demand YOY growth by selected energy-intensive industries in 2019 and 2020
Source: NBS (2019, 2020)
Q1 2020: Power consumption
-6.5%
4.0%
-8.7% -8.3%
3.5%
-10%
0%
10%
20%
Total Primary industry Secondaryindustry
Tertiary industry Residential
Q1-2014 Q1- 2015 Q1- 2016 Q1- 2017 Q1- 2018 Q1-2019 Q1-2020
In Q1 2020, national power consumption declined at a rate similar to the overall economy. This confirms that the power sector is highly coupled with economic growth, and reveals an increasing electrification of the Chinese energy economy. Chinese national level power consumption
in the industry sector declined by 8.7 per cent YOY in Q1 2020.
Because industry accounted for nearly 70 per cent of national power consumption in
Q1 2020, China’s power demand trajectory will largely depend on how fast industrial activity recovers during the rest of 2020.
The catering, entertainment, retail and tourism sectors were hit particularly hard during the nationwide lockdown. With many small- to medium-sized enterprises still struggling, the Chinese service sector is currently making a weaker recovery compared with the industrial sector.
Agora Energiewende | COVID-19 China Energy Impact Tracker
18
H1 2020: Power consumption
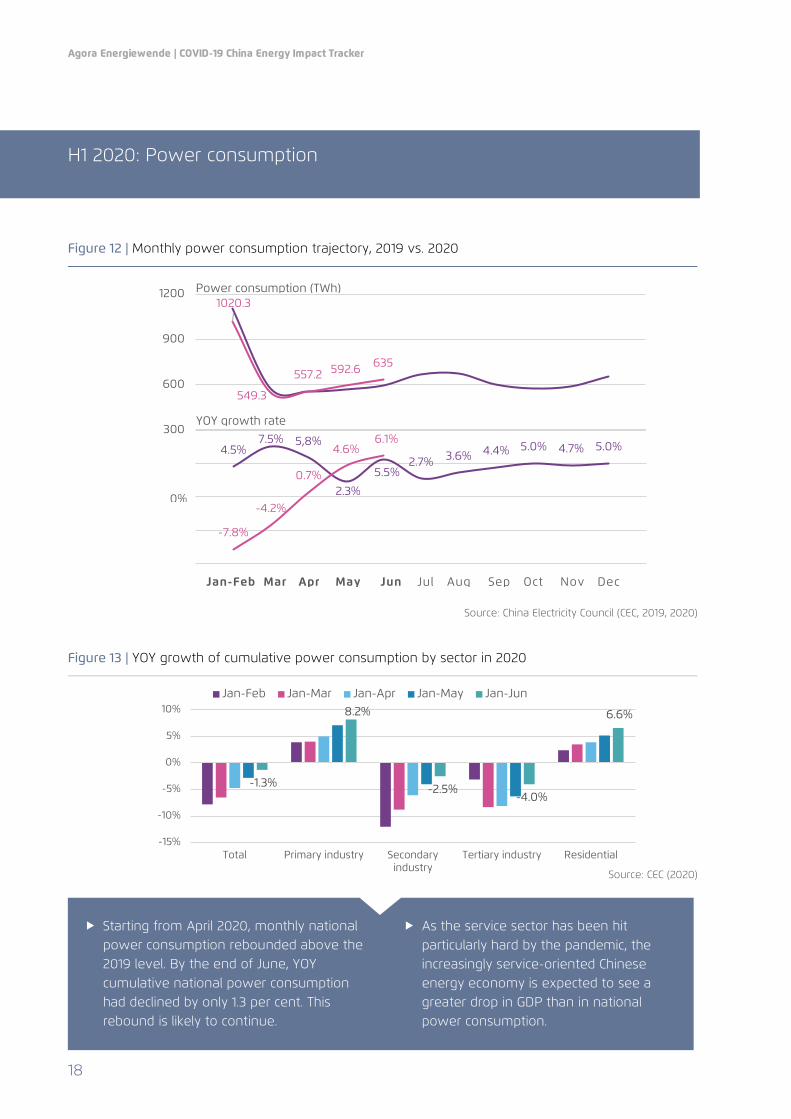
Figure 12 | Monthly power consumption trajectory, 2019 vs. 2020
Source: China Electricity Council (CEC, 2019, 2020)
Figure 13 | YOY growth of cumulative power consumption by sector in 2020
Source: CEC (2020)
Starting from April 2020, monthly national power consumption rebounded above the 2019 level. By the end of June, YOY cumulative national power consumption had declined by only 1.3 per cent. This rebound is likely to continue.
As the service sector has been hit particularly hard by the pandemic, the increasingly service-oriented Chinese energy economy is expected to see a greater drop in GDP than in national power consumption.
4.5%7.5% 5,8%
2.3%
5.5%2.7% 3.6% 4.4% 5.0% 4.7% 5.0%
-7.8%
-4.2%
0.7%
4.6%6.1%
Jan-Feb Mar Apr May Jun Jul Aug Sep Oct Nov Dec
1020.3
549.3
557.2 592.6 635
300
600
900
1200 Power consumption (TWh)
YOY growth rate
-1.3%
8.2%
-2.5%-4.0%
6.6%
-15%
-10%
-5%
0%
5%
10%
Total Primary industry Secondaryindustry
Tertiary industry Residential
Jan-Feb Jan-Mar Jan-Apr Jan-May Jan-Jun
0%

2 | Economy & power demand
19
Economy & power demand
In H2 2020, China’s power consumption will be driven by both domestic economic recovery and the health of the global economy
The secondary (i.e. mostly industrial) and tertiary (i.e. service) industries in China were impacted severely by the COVID-19 pandemic. These two sectors account for more than 80 per cent of China’s national power demand. Not surprisingly, power consumption by industry and service is an important gauge of China’s economic recovery. At the end of June, cumulative power consumption for these sectors were below 2019 levels.
The pandemic’s impact on energy-intensive industries is less severe than on labour-intensive ones such as textiles and clothing manufacturing. In H1 2020, cumulative power consumption in the total industrial sector decreased by 2.4 per cent YOY. By comparison, the four energy-intensive industries (i.e. steel, construction materials, non-ferrous metals and chemicals) saw their aggregate power consumption decline by only 1 per cent YOY.
The trend toward an increasing share of services in the Chinese economy means that the service sector, which accounts for 16 per cent of national power consumption, has been a key driving force for power demand growth. In Q1, the nationwide lockdown caused a sharp rise in internet traffic. As a result, internet infrastructure, software and IT services saw a 27 per cent YOY jump in their power consumption, while accommodation & catering and wholesale & retail industries experienced a precipitous power demand collapse of 22.8 and 15.5 per cent YOY, respectively.
China’s monthly national power consumption returned to 2019 levels in April and has continued to grow ever since. In June, national power consumption grew by 6.1 per cent YOY.
It is clear that Q2’s strong recovery in power demand has largely been driven by economic recovery inside China. During the rest of 2020, export demand for Chinese commodities is expected to become an increasingly important factor for shaping China’s power consumption trajectory.
Agora Energiewende | COVID-19 China Energy Impact Tracker
20
3 | Fossil fuel energy
1 | Energy production 21
2 | Coal consumption 22
3 | Oil & gas consumption 25
4 | Summary 27
3 | Fossil fuel energy
21
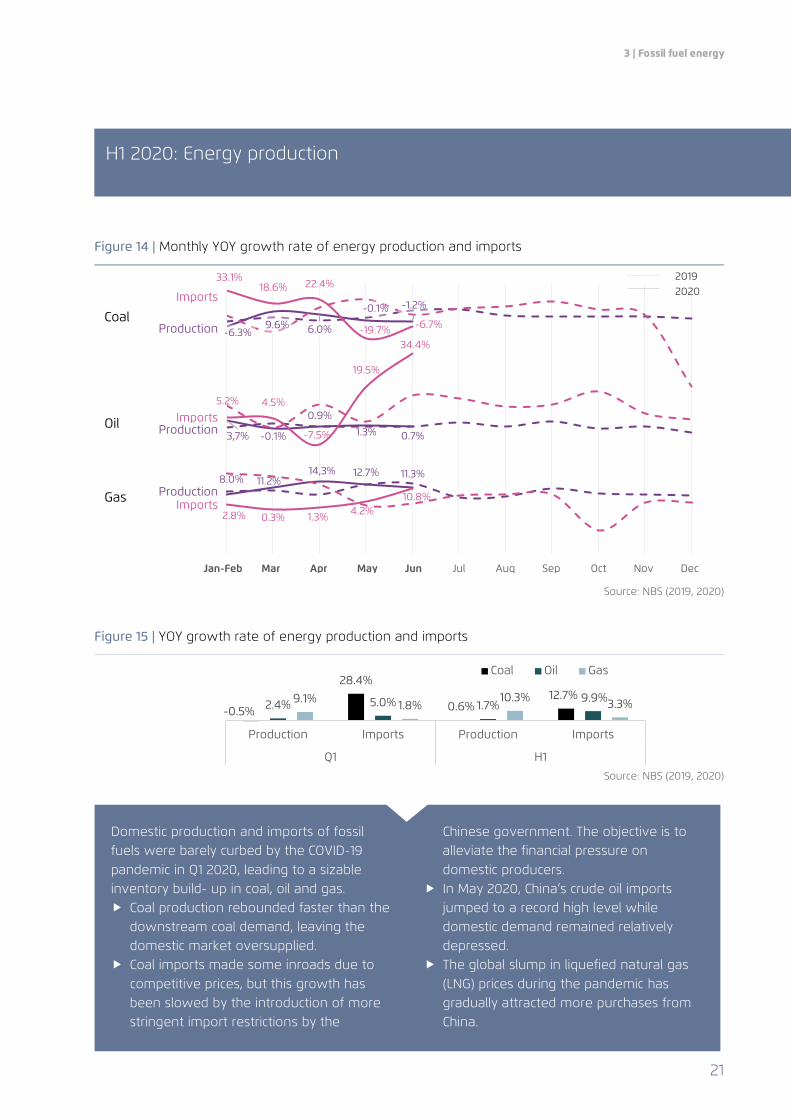
Figure 14 | Monthly YOY growth rate of energy production and imports
Source: NBS (2019, 2020)
Figure 15 | YOY growth rate of energy production and imports
Source: NBS (2019, 2020)
H1 2020: Energy production
-6.3%9.6% 6.0%
-0.1% -1.2%
33.1%18.6% 22.4%
-19.7% -6.7%
Jan-Feb Mar Apr May Jun Jul Aug Sep Oct Nov Dec
2020 2019
Production
Imports
Production Imports
Imports Production
Coal
Oil
Gas
3,7% -0.1%
0.9%
1.3% 0.7%
5.2% 4.5%
-7.5%
19.5%
34.4%
8.0% 11.2%14,3% 12.7% 11.3%
2.8% 0.3% 1.3% 4.2%10.8%
-0.5%
28.4%
0.6%12.7%
2.4% 5.0% 1.7%9.9%9.1% 1.8%
10.3% 3.3%
Production Imports Production Imports
Q1 H1
Coal Oil Gas
Domestic production and imports of fossil fuels were barely curbed by the COVID-19 pandemic in Q1 2020, leading to a sizable inventory build- up in coal, oil and gas. Coal production rebounded faster than the
downstream coal demand, leaving the domestic market oversupplied.
Coal imports made some inroads due to competitive prices, but this growth has been slowed by the introduction of more stringent import restrictions by the
Chinese government. The objective is to alleviate the financial pressure on domestic producers.
In May 2020, China’s crude oil imports jumped to a record high level while domestic demand remained relatively depressed.
The global slump in liquefied natural gas (LNG) prices during the pandemic has gradually attracted more purchases from China.
Agora Energiewende | COVID-19 China Energy Impact Tracker
22
H1 2020: Coal consumption
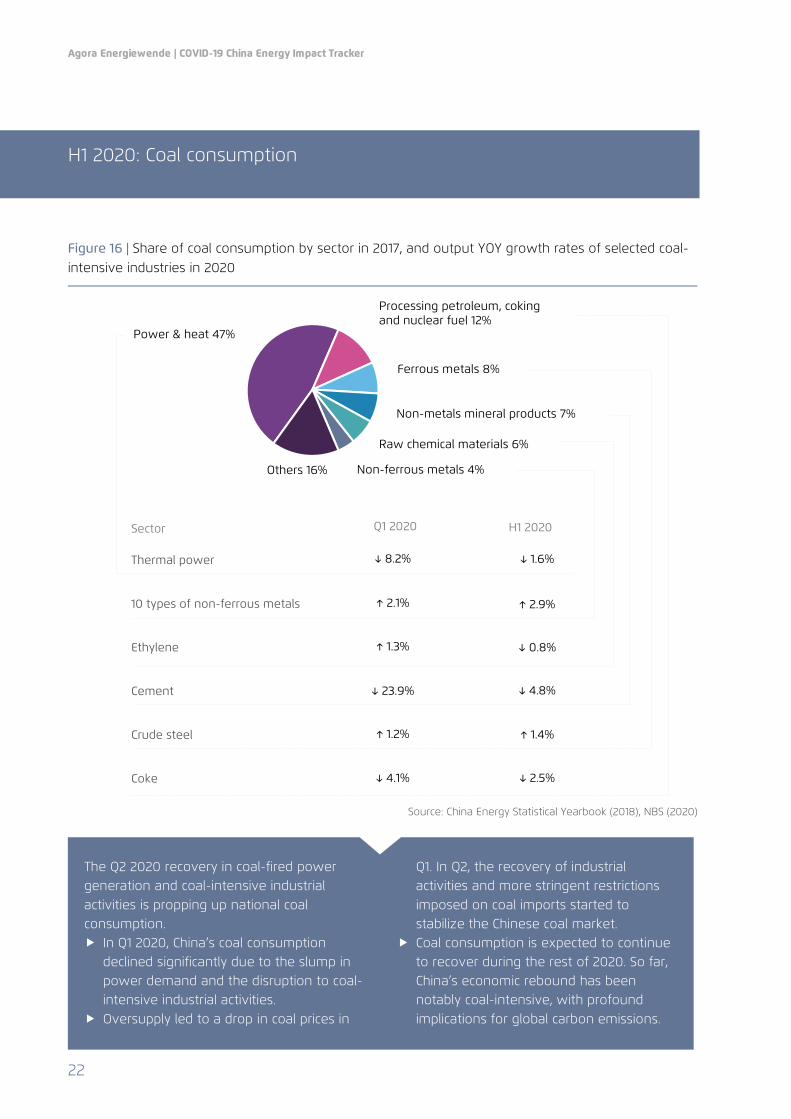
Figure 16 | Share of coal consumption by sector in 2017, and output YOY growth rates of selected coal-intensive industries in 2020
Source: China Energy Statistical Yearbook (2018), NBS (2020)
Power & heat 47%
Processing petroleum, coking and nuclear fuel 12%
Ferrous metals 8%
Non-metals mineral products 7%
Raw chemical materials 6%
Non-ferrous metals 4% Others 16%
Thermal power
Coke
Crude steel
Cement
Ethylene
10 types of non-ferrous metals
Q1 2020 H1 2020
↓ 8.2% ↓ 1.6%
↑ 1.3%
↓ 23.9%
↑ 1.2%
↓ 4.1%
↑ 2.1%
Sector
↑ 2.9%
↓ 0.8%
↓ 4.8%
↓ 2.5%
↑ 1.4%
The Q2 2020 recovery in coal-fired power generation and coal-intensive industrial activities is propping up national coal consumption. In Q1 2020, China’s coal consumption
declined significantly due to the slump in power demand and the disruption to coal-intensive industrial activities.
Oversupply led to a drop in coal prices in
Q1. In Q2, the recovery of industrial activities and more stringent restrictions imposed on coal imports started to stabilize the Chinese coal market.
Coal consumption is expected to continue to recover during the rest of 2020. So far, China’s economic rebound has been notably coal-intensive, with profound implications for global carbon emissions.

Agora Energiewende | China Illustrative Guide
23
Figure 17 | National coal consumption and YOY growth rates, 2017 – H1 2020
H1 2020 Est Q1 2020 Est 2019 2018 2017
1858 Mt
↓3.3%
874 Mt
↓7.7%
2804 Mtce
↑2.4%
2738 Mtce
↑1%
2709 Mtce
↑0.3%
Source: NBS online database, authors’ estimations for H1 2020
Figure 18 | Monthly thermal power generation in 2019 and 2020
Source: NBS online database
H1 2020: Coal consumption – power sector
781
389 398 423 432
8.9%
-7.5%
1.2%
9.0%
5.4%
-10%
-5%
0%
5%
10%
0
300
600
900
Thermal power generation 2019 Thermal power generation 2020
Growth rate 2019 Growth rate 2020
TWh
Depending on policy signals from the central government, the COVID-19 pandemic could either catalyse the transformation of the clean power sector in China or reinforce the position of coal by supporting domestic coal producers and new coal-fired facilities. Coal dominates the Chinese power sector,
accounting for 62 per cent of national power generation in 2019.
In April and May 2020, thermal power generation grew faster than national power demand, undermining the likelihood that 2020 will contribute
to moving clean power sector transformation agenda forward in China.
In 2019, more than half of Chinese coal-fired power plants operated at a financial loss. The COVID-19 pandemic has imposed additional financial pressure on Chinese coal-fired power generators, which are largely unprofitable.
Permitting for greenfield coal-fired power plants in China has accelerated during the pandemic in an effort to stimulate economic growth – with dire consequences for the climate.

Agora Energiewende | COVID-19 China Energy Impact Tracker
24
H1 2020: Coal consumption – industry
Figure 19 | YOY output growth of selected energy–intensive industrial products in 2020
Source: NBS (2020)
Figure 20 | Downstream demand-side recovery for steel and cement in 2020
Source: NBS (2020)
-29.5%
3.1% 2.2%5.6%
18.3%
-1.7%
1.6%
-1.4%
3.8%0.2%
3.8%
-1.4%
8.6%4.2%
4.1%
-2.7%
8.4%4.5% 3.1%
-4.3%
Cement Crude steel Non-ferrous metals Ethylene
Jan-Feb Mar Apr May Jun
Steel Steel & cement
-31.8% -28.2% -24.4% -24.5%-30.3%
-16.3%
-3.1% -2.3%
2.9%
-3.1% -2.7%
1.9%
-35%
-25%
-15%
-5%
5%
Automotivemanufacturing
Generalequipment
manufacturing
Specialequipment
manufacturingFixed assetinvestment
Infrastructureinvestment
Real estateinvestment
Jan-Feb Jan-Mar Jan-Apr Jan-May Jan-Jun
China’s output of major energy-intensive products and the associated coal consumption have rebounded due to recovery in downstream demand. Industrial value added increased by 4.8
per cent YOY in June 2020, compared with the Q1 YOY decrease of 8.4 per cent. The impact of COVID-19 on industrial activity has led to a 1.3 per cent H1 YOY reduction in cumulative industrial value added.
The disruption to transport in Q1 was a major obstacle for cement manufacturing
operations. This industry is now rebounding fast due to the strong recovery in construction activity and the lifting of travel restrictions.
Steel and steel-made products such as machine equipment and cars are major Chinese export products. The continued spread of the pandemic across the world is impacting markets for steel products, which remain depressed.
China’s iron and steel output recovery has primarily been driven by domestic demand.
3 | Fossil fuel energy
25
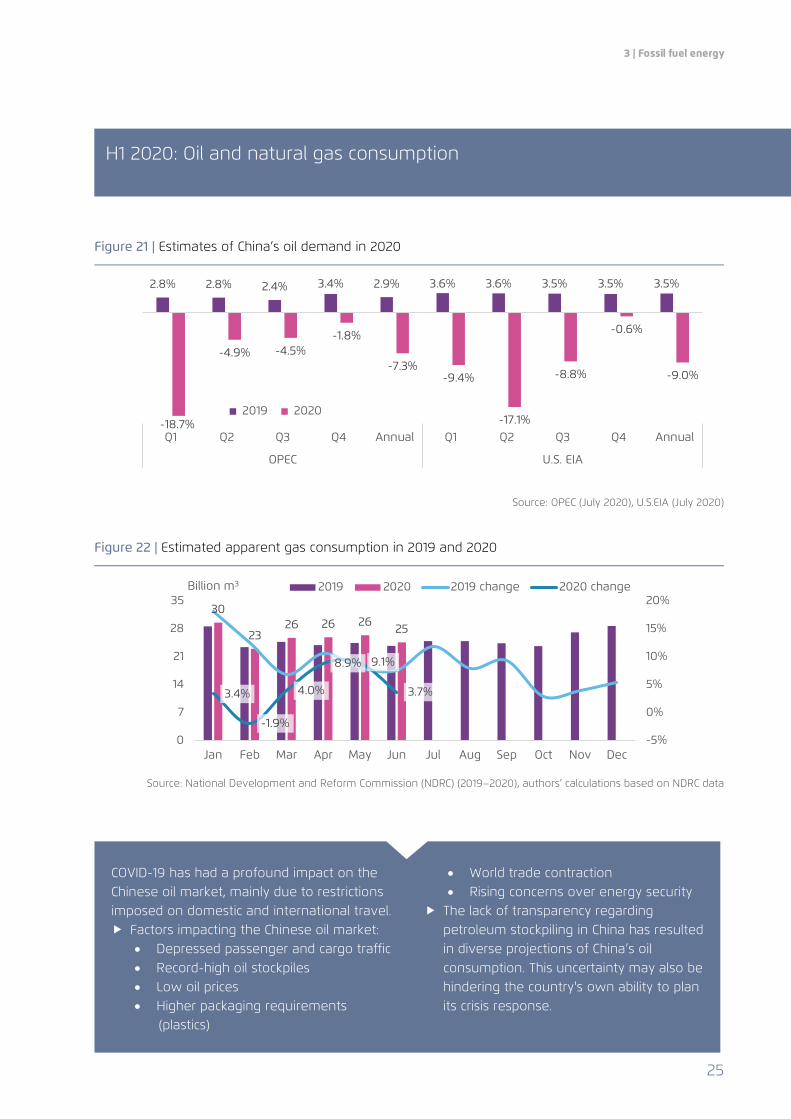
Figure 21 | Estimates of China’s oil demand in 2020
Source: OPEC (July 2020), U.S.EIA (July 2020)
Figure 22 | Estimated apparent gas consumption in 2019 and 2020
Source: National Development and Reform Commission (NDRC) (2019–2020), authors’ calculations based on NDRC data
H1 2020: Oil and natural gas consumption
2.8% 2.8% 2.4% 3.4% 2.9% 3.6% 3.6% 3.5% 3.5% 3.5%
-18.7%
-4.9% -4.5%-1.8%
-7.3%-9.4%
-17.1%
-8.8%
-0.6%
-9.0%
Q1 Q2 Q3 Q4 Annual Q1 Q2 Q3 Q4 Annual
OPEC U.S. EIA
2019 2020
30
2326 26 26 25
3.4%
-1.9%
4.0%
8.9% 9.1%
3.7%
-5%
0%
5%
10%
15%
20%
0
7
14
21
28
35
Jan Feb Mar Apr May Jun Jul Aug Sep Oct Nov Dec
2019 2020 2019 change 2020 changeBillion m3
COVID-19 has had a profound impact on the Chinese oil market, mainly due to restrictions imposed on domestic and international travel. Factors impacting the Chinese oil market:
• Depressed passenger and cargo traffic • Record-high oil stockpiles • Low oil prices • Higher packaging requirements
(plastics)
• World trade contraction • Rising concerns over energy security
The lack of transparency regarding petroleum stockpiling in China has resulted in diverse projections of China’s oil consumption. This uncertainty may also be hindering the country's own ability to plan its crisis response.
Agora Energiewende | COVID-19 China Energy Impact Tracker
26
H1 2020: Oil consumption
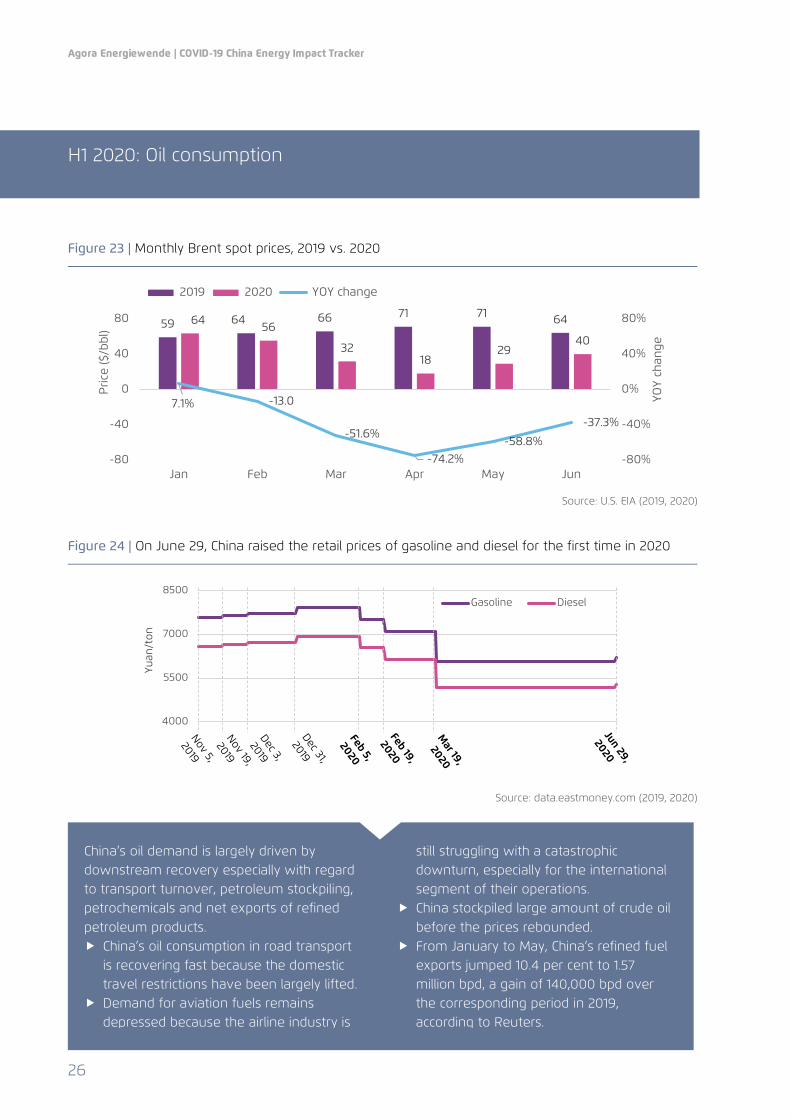
Figure 23 | Monthly Brent spot prices, 2019 vs. 2020
Source: U.S. EIA (2019, 2020)
Figure 24 | On June 29, China raised the retail prices of gasoline and diesel for the first time in 2020
Source: data.eastmoney.com (2019, 2020)
59 64 66 71 71 6464 56
3218
2940
7.1% -13.0
-51.6%
-74.2%-58.8%
-37.3%
-80%
-40%
0%
40%
80%
-80
-40
0
40
80
Jan Feb Mar Apr May Jun
YOY
chan
ge
Pric
e ($
/bbl
)
2019 2020 YOY change
4000
5500
7000
8500Gasoline Diesel
Yuan
/ton
China’s oil demand is largely driven by downstream recovery especially with regard to transport turnover, petroleum stockpiling, petrochemicals and net exports of refined petroleum products. China’s oil consumption in road transport
is recovering fast because the domestic travel restrictions have been largely lifted.
Demand for aviation fuels remains depressed because the airline industry is
still struggling with a catastrophic downturn, especially for the international segment of their operations.
China stockpiled large amount of crude oil before the prices rebounded.
From January to May, China’s refined fuel exports jumped 10.4 per cent to 1.57 million bpd, a gain of 140,000 bpd over the corresponding period in 2019, according to Reuters.

3 | Fossil fuel energy
27
Fossil fuel energy
China’s notably coal-intensive economic recovery in Q2 raises legitimate concerns about environmental integrity and the alignment of national policy choices with the global climate agenda
Despite a relatively strong economic recovery – 3.2 per cent YOY GDP growth in Q2 – the demand for fossil fuels in China is growing more slowly than supply.
Depressed demand for coal since the start of the COVID-19 outbreak has driven down China’s domestic coal prices, leading to a 31.2 per cent YOY reduction in Chinese coal companies’ profits in H1 2020. In order to alleviate competitive pressure on domestic producers from cheap international imports, the Chinese government has further tightened import restrictions at coastal ports. Nevertheless, China’s coal imports still increased by 12.7 per cent in H1 2020.
The demand for coal in China is dominated by coal-fired power generation, followed by steel and cement manufacturing. Output in these sectors in June 2020 all exceeded 2019 levels. Not surprisingly, China’s monthly coal consumption in June is estimated to reach 334 Mt, which also exceeds the 2019 level on a YOY basis.
The recovery of the Chinese oil industry has been slower than that of coal. However, oil supply is rebounding with rising crude imports, a large amount of which is flowing into commercial and strategic storage. Recovery in road transport and the relatively
resilient demand for petrochemical products are the two key drivers for oil consumption in China.
Except in February, China’s monthly natural gas consumption continuously grew on a YOY basis, with 4 per cent cumulative demand growth in H1.
Against the backdrop of rising anxiety among Chinese decision makers about energy security, domestic natural gas output increased by 10.3 per cent YOY in H1. As global LNG prices fell to record lows, imports surged by 11.2 per cent YOY. This was achieved at the expense of pipeline gas imports, which declined by 7.4 per cent YOY in H1. As a result, overall gas imports increased modestly by 3.3 per cent YOY.
Though natural gas fared the strongest among all fossil fuels in H1 2020, Chinese decision makers’ political preference for domestic production against reliance on imports makes gas’s role in China’s energy transition more uncertain than it otherwise would be, especially considering the great difficulty associated with opening up China’s upstream oil and gas sector.
Passenger transport has been the weakest link in the Chinese energy economic recovery so far, with additional rebound likely to be linked to the further recovery of the services sector.
In sum, China’s economic recovery in Q2 2020 has been notably carbon-intensive, with negative impacts for China’s environmental integrity and for the global climate agenda.

Agora Energiewende | COVID-19 China Energy Impact Tracker
28
4 | Renewables
4 | Renewables
29
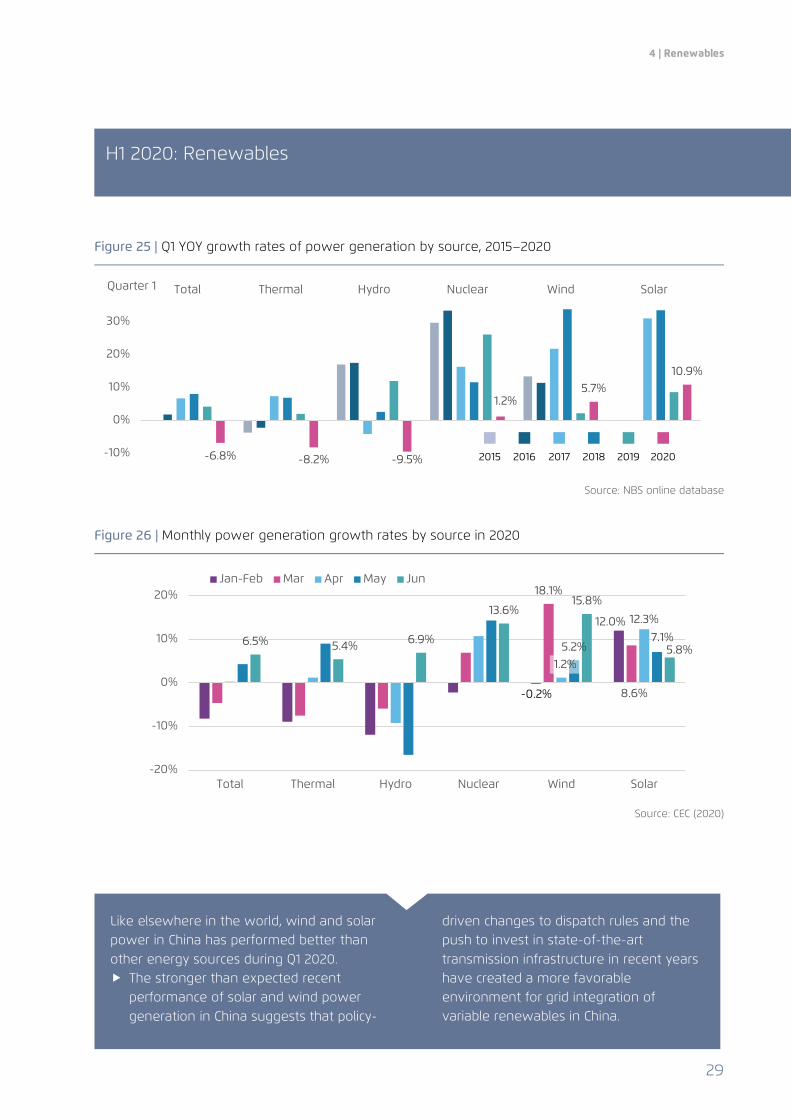
Figure 25 | Q1 YOY growth rates of power generation by source, 2015–2020
Source: NBS online database
Figure 26 | Monthly power generation growth rates by source in 2020
Source: CEC (2020)
H1 2020: Renewables
-6.8% -8.2% -9.5%
1.2%5.7%
10.9%
-10%
0%
10%
20%
30%
Total Thermal Hydro Nuclear Wind SolarQuarter 1
2015 2016 2017 2018 2019 2020
12.0%
18.1%
8.6%
1.2%
12.3%
5.2%7.1%6.5% 5.4% 6.9%
13.6%15.8%
5.8%
-20%
-10%
0%
10%
20%
Total Thermal Hydro Nuclear Wind Solar
Jan-Feb Mar Apr May Jun
-0.2%
Like elsewhere in the world, wind and solar power in China has performed better than other energy sources during Q1 2020. The stronger than expected recent
performance of solar and wind power generation in China suggests that policy-
driven changes to dispatch rules and the push to invest in state-of-the-art transmission infrastructure in recent years have created a more favorable environment for grid integration of variable renewables in China.

Agora Energiewende | COVID-19 China Energy Impact Tracker
30
H1 2020: Renewables
Figure 27 | Added capacity of wind and solar in 2019 and 2020
Source: CEC (2019, 2020)
Figure 28 | Downgraded forecasts of China’s added renewable capacity in 2020
Original
forecast Downgraded forecast
Change
Solar BNEF 37–45 GW 25–37 GW ↓18–32%
China PV Industry Association
40–50 GW 35–45 GW ↓10–13%
Wind Global Wind Energy Council
35 GW 20–25 GW ↓29–43%
Source: BNEF (2020), China PV Industry Association (2020) and Global Wind Energy Council (2020)
990
13701190
1350 14201070
2350
1140
1590
4000
0
1500
3000
4500
Wind 2019 Wind 2020Solar 2019 Solar 2020
Jan-Feb Mar Apr May Jun Jul Aug Sep Oct Nov
Capacity addition (MW)
Disruptions to domestic and international supply chains and reductions in government subsidies are now the main challenges for sustaining renewable development in China.
Despite the positive performance of renewables in Q1 2020, forecasters have lowered their 2020 projections for added renewable capacity in China.

31
5 | Air Quality
Agora Energiewende | COVID-19 China Energy Impact Tracker
32
H1 2020: Air pollution
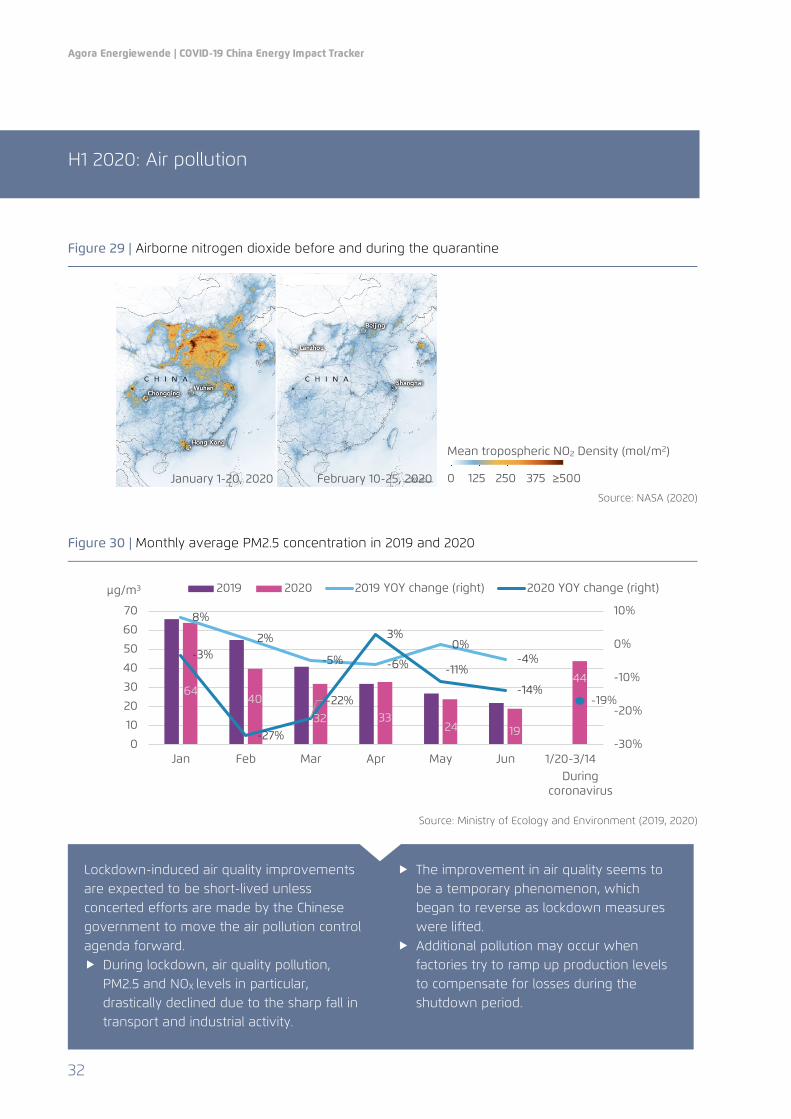
Figure 29 | Airborne nitrogen dioxide before and during the quarantine
Source: NASA (2020)
Figure 30 | Monthly average PM2.5 concentration in 2019 and 2020
Source: Ministry of Ecology and Environment (2019, 2020)
.
6440
32 3324 19
44
8%
2%
-5% -6%
0%-4%-3%
-27%
-22%
3%
-11%
-14%
-30%
-20%
-10%
0%
10%
0
10
20
30
40
50
60
70
Jan Feb Mar Apr May Jun 1/20-3/14
2019 2020 2019 YOY change (right) 2020 YOY change (right)
-19%
During coronavirus
Lockdown-induced air quality improvements are expected to be short-lived unless concerted efforts are made by the Chinese government to move the air pollution control agenda forward. During lockdown, air quality pollution,
PM2.5 and NOX levels in particular, drastically declined due to the sharp fall in transport and industrial activity.
The improvement in air quality seems to be a temporary phenomenon, which began to reverse as lockdown measures were lifted.
Additional pollution may occur when factories try to ramp up production levels to compensate for losses during the shutdown period.
μg/m3
January 1-20, 2020 February 10-25, 2020
Mean tropospheric NO2 Density (mol/m2)
0 125 250 375 ≥500

33
6 | Concluding Remarks
Agora Energiewende | COVID-19 China Energy Impact Tracker
34
Concluding Remarks
COVID-19 has inflicted high economic costs in China and around the world. In Q1 2020, the Chinese economy contracted by 6.8 per cent YOY – the first economic contraction in China since 1976. Despite a relatively quick recovery in Q2, the size of the Chinese economy as a whole nevertheless decreased 1.6 per cent YOY in H1 2020.
In energy production, outputs of coal, oil and gas increased in H1 2020 by 0.6, 1.7 and 10.3 per cent YOY, respectively. Against the backdrop of the demand slump, China’s preference for indigenous production appears crucial and is driven particularly by rising anxiety about energy security.
In energy transformation, following a 6.8 per cent YOY reduction in Q1, China’s national power generation rebounded in Q2, leading to a 1.4 per cent YOY reduction in H1.
By comparison, refinery throughput dropped by 4.6 per cent in Q1. Following a rather strong recovery in Q2, refinery throughput increased by 0.6 per cent YOY in H1.
Due to depressed fossil fuel prices in global markets in H1 2020, Chinese imports of cheap coal, oil and gas increased by 12.7, 9.9 and 3.3 per cent, respectively. Despite record-low LNG spot market prices, overall growth in China’s natural gas imports in H1 lag well behind the increase in coal and oil imports, which indicates the importance of moving China’s gas market reform agenda forward.
The National Bureau of Statistics (NBS) estimated that national energy consumption declined by 3.1 in Q1 and by 0.2 per cent overall in H1. By comparison, national power consumption declined during the same periods by 6.5 per cent and 1.3 per cent, respectively.
While COVID-19 has significantly dented China’s carbon emissions in Q1 of 2020, preliminary analysis indicates that in Q2 emissions had already rebounded back to levels similar to 2019. This is largely due to the coal-intensive character of the economic recovery, with Q2 seeing a resurgence of coal-fired power generation, cement, iron & steel, coking and coal chemical manufacturing.
Following the first three rounds of China’s National Economic Census conducted in 2004, 2008 and 2013, the NBS drastically revised the country’s national energy balance tables, especially coal-related data. Preliminary analysis by the authors and Agora Energiewende indicates that inconsistencies in the statistical reporting of coal have recurred in recent years. Further revisions by the NBS are thus likely after the fourth round of the National Economic Census in 2018. Consequently, it is important to focus attention on tracking the relative changes and trends in China’s economic activity and energy consumption, instead of on the absolute numbers listed in our COVID-19 China Energy Impact Tracker reports.
From a Chinese cultural perspective, a crisis as significant as the COVID-19 pandemic is often perceived as having two aspects: it is not only a threat (危 wei); it may also be treated as an opportunity (机 ji)—or wei ji (危机). Instead of relying on a carbon-intensive recovery to achieve short-term economic gains, Chinese decision-makers should review the trends presented in this report and double down on efforts to create a clean-energy transition that aims to better balance short-term political targets with longer strategic goals. If this happens, China has the potential to become, in the post-coronavirus world, a true global leader in clean-energy investment and the low-carbon economy of the future.

35
7 | References
Agora Energiewende | COVID-19 China Energy Impact Tracker
36
References
2019ncov.chinacdc. (2020). Distribution of the COVID-19 Pandemic (新型冠状病毒肺炎疫情分布). Retrieved from Distribution of the COVID-19 Pandemic (新型冠状病毒肺炎疫情分布): http://2019ncov.chinacdc.cn/2019-nCoV/ (accessed on 24 July 2020).
BP. (2020). CO₂ emissions – 2019 in review. Retrieved from BP: https://www.bp.com/en/global/corporate/energy-economics/statistical-review-of-world-energy/co2-emissions.html (accessed on August 24 2020).
CEC. (2018-2020). Monthly report on the operation of power sector (月度电力运行简况). Retrieved from China Electricity Council (中国电力企业联合会): https://www.cec.org.cn/menu/index.html?592 (accessed on 24 July 2020).
Corinne Le Quéré, R. B. (2020). Temporary reduction in daily global CO2 emissions during the COVID-19 forced confinement. Nature Climate Change, 647–653.
Eastmoney. (2020). National oil price trends (全国油价走势一览). Retrieved from Eastmoney Securities: http://data.eastmoney.com/cjsj/oil_default.html (accessed on 24 July 2020).
EIA, U. (2020, July 7). Short-term Energy Outlook. Retrieved from U.S. EIA: https://www.eia.gov/outlooks/steo/ (accessed on 17 July 2020).
Enlit Europe. (2020, March). BNEF predicts slow-down in clean energy economy due to Covid-19. Retrieved from Enlit Europe: https://www.enlit-europe.com/industry-news/bnef-predicts-slow-down-in-clean-energy-economy-due-to-covid-19 (accessed on 24 July 2020).
HKET. (2020, January). [China Economy] Many institutions lower China's GDP forecast for this year, S&P predicted that the growth will be 2.9% (【中國經濟】多家機構降中國今年 GDP 預測 標普料增長2.9%). Retrieved from HKET : https://china.hket.com/article/2593611/%E3%80%90%E4%B8%AD%E5%9C%8B%E7%B6%93%E6%BF%9F%E3%80%91%E5%A4%9A%E5%AE%B6%E6%A9%9F%E6%A7%8B%E9%99%8D%E4%B8%AD%E5%9C%8B%E4%BB%8A%E5%B9%B4GDP%E9%A0%90%E6%B8%AC%20%20%E6%A8%99%E6%99%AE%E6%96%99%E5%A2%9E%E9%95%B72.9- (accessed on 17 July 2020).
IEA. (2020, April). Global Energy Review 2020. Retrieved from IEA: https://www.iea.org/reports/global-energy-review-2020 (accessed on 17 July 2020).
IMF. (2020, January). Tentative Stabilization, Sluggish Recovery? Retrieved from World Economic Outlook: https://www.imf.org/en/Publications/WEO/Issues/2020/01/20/weo-update-january2020 (accessed on 6 May 2020).
IMF. (2020, April). World Economic Outlook, April 2020: The Great Lockdown. Retrieved from World Economic Outlook: https://www.imf.org/en/Publications/WEO/Issues/2020/04/14/weo-april-2020 (accessed May 2020).
John Baffes, A. D. (2020). Global Economic Prospects. World Bank Group.
Liu, W. (2018). China Energy Statistical Yearbook. China Statistics Press.
Myllyvirta, L. (2020, March). Analysis: Coronavirus temporarily reduced China’s CO2 emissions by a quarter. Retrieved from CarbonBrief: https://www.carbonbrief.org/analysis-coronavirus-has-temporarily-reduced-chinas-co2-emissions-by-a-quarter (accessed on 20 May 2020).
7 | References
37
NASA. (2020). Airborne Nitrogen Dioxide Plummets Over China. Retrieved from NASA Earth Observatory: https://earthobservatory.nasa.gov/images/146362/airborne-nitrogen-dioxide-plummets-over-china (accessed on 7 August 2020)
National Bureau of Statistics of China. (2000-2020). National data. Retrieved from National data.
NDRC. (2018-2020). Monthly report on natural gas (月度天然气运行简况). Retrieved from NDRC: https://www.ndrc.gov.cn/fgsj/tjsj/jjyx/mdyqy/index.html (accessed 7 August 2020).
OPEC. (2020). Monthly Oil Market Report: 14 July 2020. OPEC. (accessed on 30 July 2020).
Shadia Nasralla, V. V. (2020, April). Coronavirus could trigger biggest fall in carbon emissions since World War Two. Retrieved from REUTERS: https://www.reuters.com/article/us-health-coronavirus-emissions/coronavirus-could-trigger-biggest-fall-in-carbon-emissions-since-world-war-two-idUSKBN21L0HL (accessed on 23 July 2020).
Shan, X. (2020, March). The official bank said that the economic growth this year is only 2.6% but will grow sharply next year by 9.0% (官方银行称今年经济增长仅 2.6%但明年爆 9.0%). Retrieved from RFI: https://www.rfi.fr/cn/%E4%B8%AD%E5%9B%BD/20200323-%E5%AE%98%E6%96%B9%E9%93%B6%E8%A1%8C%E7%A7%B0%E4%BB%8A%E5%B9%B4%E7%BB%8F%E6%B5%8E%E5%A2%9E%E9%95%BF%E4%BB%852-6-%E4%BD%86%E6%98%8E%E5%B9%B4%E7%88%869-0 (accessed on 6 May 2020).
Smil, V. (2010). Energy Transitions: History, Requirements, Prospects. Santa Barbara: Praeger.
Sun, S. (2020, March). Bloomberg economists expect China's GDP to shrink by 11% in the first quarter and grow by 1.4% for the whole year (彭博經濟學家料中國首季GDP 收縮 11% 全年增長 1.4%). Retrieved from hk01: https://www.hk01.com/%E8%B2%A1%E7%B6%93%E5%BF%AB%E8%A8%8A/450265/%E5%BD%AD%E5%8D%9A%E7%B6%93%E6%BF%9F%E5%AD%B8%E5%AE%B6%E6%96%99%E4%B8%AD%E5%9C%8B%E9%A6%96%E5%AD%A3gdp%E6%94%B6%E7%B8%AE11-%E5%85%A8%E5%B9%B4%E5%A2%9E%E9%95%B71-4 (accessed on 6 May 2020).
Tu, K. (2020a) COVID-19 pandemic‘s impacts on China‘s energy sector. A presentation at a webinar organized by Columbia University Global Centers Beijing, 29 April 2020.
Tu, K. (2020b). COVID-19 Pandemic’s Impacts on China’s Energy Sector: A Preliminary Analysis. Retrieved from Center on Global Energy Policy of Columbia University: https://energypolicy.columbia.edu/research/commentary/covid-19-pandemic-s-impacts-china-s-energy-sector-preliminary-analysis (accessed 4 June 2020).
Yao, L. (2020, March). China's 2020 GDP is estimated to be below 5%, negative growth in the first quarter is a foregone conclusion (中国 2020 年 GDP 预估至 5%以下 一季度负增长成定局). Retrieved from DWNEWS: https://www.dwnews.com/%E7%BB%8F%E6%B5%8E/60172576/%E4%B8%AD%E5%9B%BD2020%E5%B9%B4GDP%E9%A2%84%E4%BC%B0%E8%87%B35%E4%BB%A5%E4%B8%8B%E4%B8%80%E5%AD%A3%E5%BA%A6%E8%B4%9F%E5%A2%9E%E9%95%BF%E6%88%90%E5%AE%9A%E5%B1%80 (accessed 6 May 2020).
Zhou, C. (2020, June). China to buck global economic downturn in 2020 as coronavirus continues to drive down activity, says IMF. Retrieved from South China Morning Post: https://www.scmp.com/economy/global-economy/article/3090420/china-buck-global-economic-downturn-2020-coronavirus (accessed on 23 July 2020).
Agora Energiewende | COVID-19 China Energy Impact Tracker
38
187/05-A-2020/EN
About Agora Energiewende Agora Energiewende develops evidence-based and politically viable strategies for ensuring the success of the clean energy transition in Germany, Europe and the rest of the world. As a think tank and policy laboratory we aim to share knowledge with stakeholders in the worlds of politics, business and academia while enabling a productive exchange of ideas. Our scientifically rigorous research highlights practical policy solutions while eschewing an ideological agenda. As a non-profit foundation primarily financed through philanthropic donations, we are not beholden to narrow corporate or political interests, but rather to our commitment to confronting climate change.
Agora Energiewende is a joint initiative of the Mercator Foundation and the European Climate Foundation.
Agora Energiewende
Anna-Louisa-Karsch-Straße 2 | 10178 Berlin
P +49 (0)30 700 14 35-000
F +49 (0)30 700 14 35-129
www.agora-energiewende.de


![Analyse der Wechselwirkung von CO -Einsparungen …...[1]VDE ETG: VDE-Studie: Energiespeicher für die Energiewende. Frankfurt a. M., 2012 [2] Agora Energiewende: Stromspeicher in](https://img.pdfslide.net/doc/110x75/5fe612723e47c3120464dc60/analyse-der-wechselwirkung-von-co-einsparungen-1vde-etg-vde-studie-energiespeicher.jpg)