Embed Size (px)
Citation preview

© 2020 KPMG LLP, a Delaware limited liability partnership and the U.S. member firm of the KPMG network of independent member firms affiliated with KPMG International Cooperative (“KPMG International”), a Swiss entity. All rights reserved. [Printed in the U.S.]
kpmg
Consumer & Retail
May 20,2020
COVID-19 consumer pulse

© 2020 KPMG LLP, a Delaware limited liability partnership and the U.S. member firm of the KPMG network of independent member firms affiliated with KPMG International Cooperative (“KPMG International”), a Swiss entity. All rights reserved. [Printed in the U.S.]
2
COVID-19 CONSUMER PULSE
Three key themes from COVID-19 consumer pulse
Lasting changes regarding where and how consumers
spend are underway
To maintain social distancing, consumers migrated online and plan to stay online Online shift is favoring scaled players (e.g., Amazon and Walmart) Post lockdown, consumers expect to engage in smaller group activities like “seeing friends” However, businesses will have to make changes to attract customers (e.g., increase table
spacing in restaurants, have staff wear masks)
3
Almost half have had their income negatively impacted as a result of the pandemic Wide range of views on recovery: both when economy and consumer spending returns to normal Significant shift in spending away from discretionary categories during lockdown Most consumers will not return to their “pre-COVID-19” routine until a vaccine is found
Consumers have been deeply impacted by COVID-
19 and have uncertainty about the recovery
1
“Hit hard and cutting deep” (~23% of our respondents): Heavily impacted by job loss and reduction of income. They were also in a difficult financial position prior to the pandemic.
“Proceed with caution” (~45% of our respondents): Less impacted by job loss but bearish on economic recovery. Still have not altered spend dramatically.
“Hunker down and save” (~27% of our respondents) Relatively affluent and most concerned with the economy. They are saving more and spending less on discretionary categories.
“Ready to roll” (5% of our respondents): Youngest group, spending more across categories despite some concern over the economy
Four key consumer archetypes have emerged2
© 2020 KPMG LLP, a Delaware limited liability partnership and the U.S. member firm of the KPMG network of independent member firms affiliated with KPMG International Cooperative (“KPMG International”), a Swiss entity. All rights reserved. [Printed in the U.S.]
01
COVID-19 CONSUMER PULSE
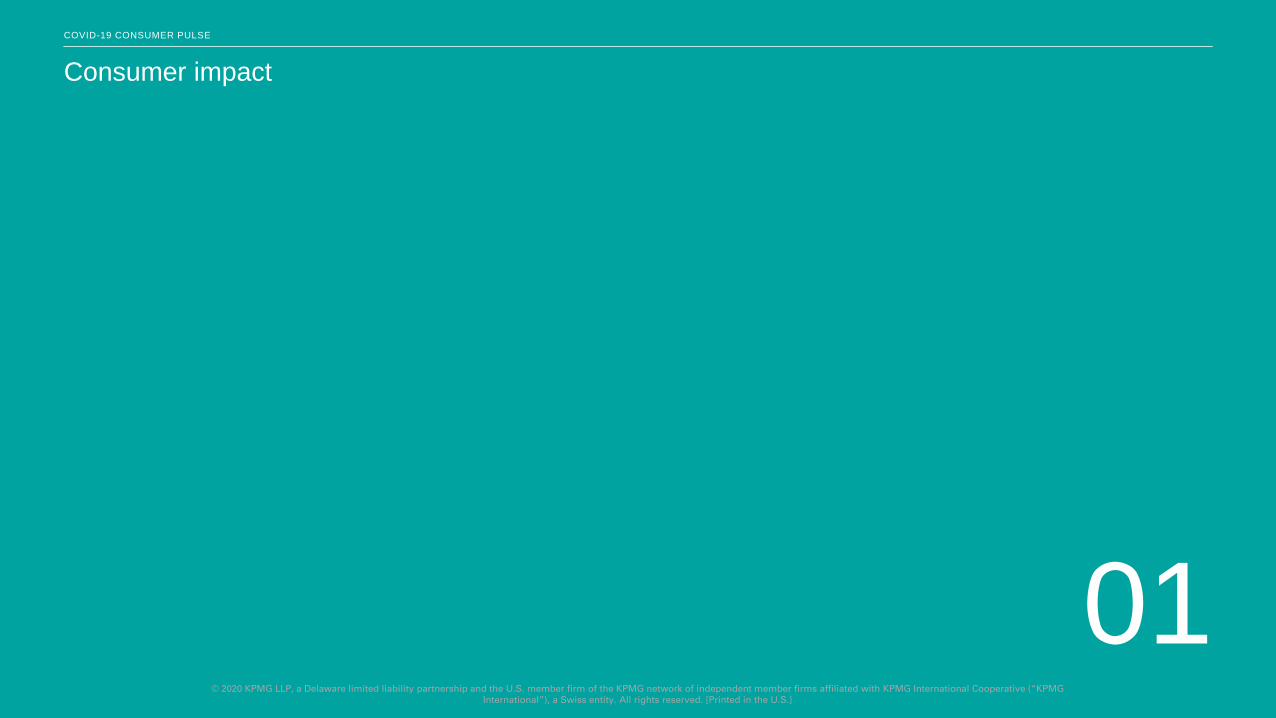
Consumer impact

© 2020 KPMG LLP, a Delaware limited liability partnership and the U.S. member firm of the KPMG network of independent member firms affiliated with KPMG International Cooperative (“KPMG International”), a Swiss entity. All rights reserved. [Printed in the U.S.]
4
We found that over 11% of survey respondents were not working as a result of COVID-19; of the total survey population, almost half had income negatively impacted
Percentage of survey not working because of COVID-19 Percentage of survey whose income was negatively impacted by COVID-19
56%
44%
2020
Not impacted
Income negatively impacted
100%
6%
15%
12%
57%
9%
Other
2020
100%
Position eliminated
Position furloughed
Self-employed and no work
Symptoms of COVID-1933%
11%
56%
Other
2020
Working
Not working b/c of COVID-19
100%
35%
26%
21%
18%
50-75 %
75-100 %
2020
0-25 %
25-50 %
100%
Workforce composition - US Reduction in household income - %Impact on income - %
Status of job position for workforce not working due to COVID-19
Note(s): (a) KPMG conducted a survey of 1,000 consumers across the United States and they were asked the question, “Please describe you current working arrangement” and “Please estimate the percentage reduction of your household income caused by COVID-19 Source: (1) KPMG Consumer survey, fielded April 27,2020 – April 30, 2020
CONSUMER IMPACT1
© 2020 KPMG LLP, a Delaware limited liability partnership and the U.S. member firm of the KPMG network of independent member firms affiliated with KPMG International Cooperative (“KPMG International”), a Swiss entity. All rights reserved. [Printed in the U.S.]
5
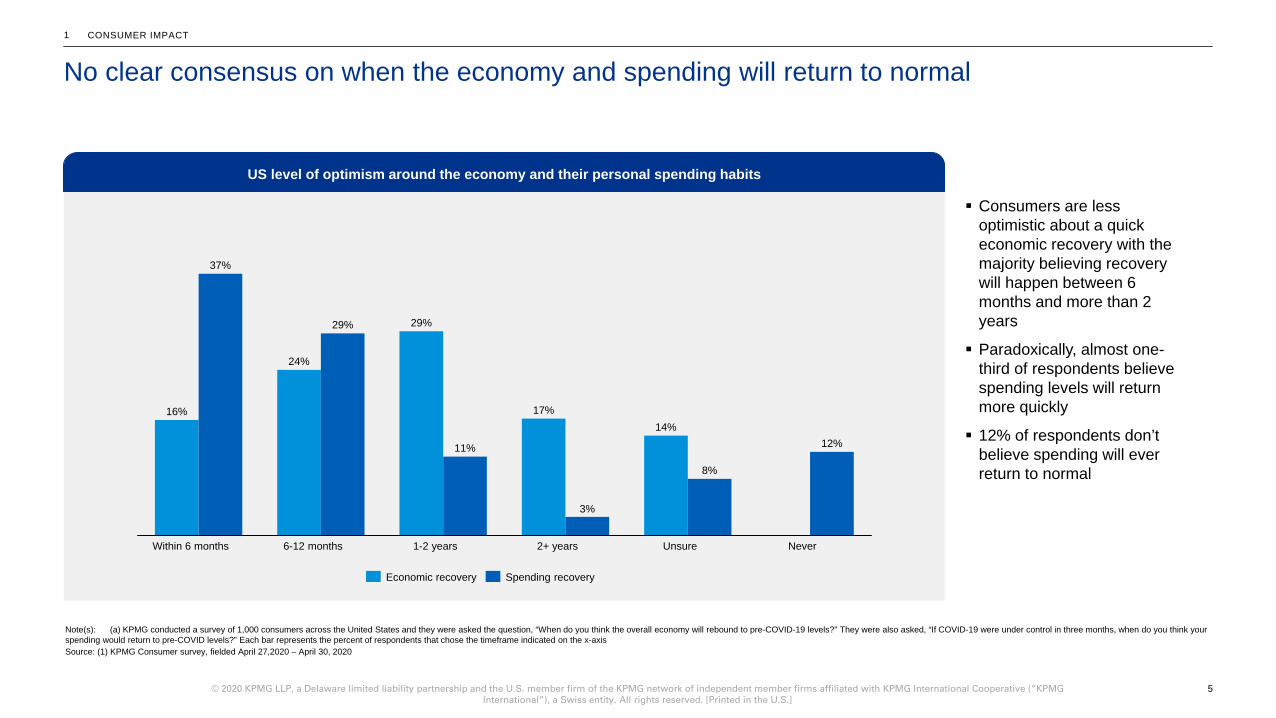
No clear consensus on when the economy and spending will return to normal
Note(s): (a) KPMG conducted a survey of 1,000 consumers across the United States and they were asked the question, “When do you think the overall economy will rebound to pre-COVID-19 levels?” They were also asked, “If COVID-19 were under control in three months, when do you think your spending would return to pre-COVID levels?” Each bar represents the percent of respondents that chose the timeframe indicated on the x-axisSource: (1) KPMG Consumer survey, fielded April 27,2020 – April 30, 2020
CONSUMER IMPACT1
16%
24%
29%
17%14%
37%
29%
11%
3%
8%
12%
Unsure6-12 monthsWithin 6 months 1-2 years 2+ years Never
Economic recovery Spending recovery
US level of optimism around the economy and their personal spending habits
Consumers are less optimistic about a quick economic recovery with the majority believing recovery will happen between 6 months and more than 2 years
Paradoxically, almost one-third of respondents believe spending levels will return more quickly
12% of respondents don’t believe spending will ever return to normal

© 2020 KPMG LLP, a Delaware limited liability partnership and the U.S. member firm of the KPMG network of independent member firms affiliated with KPMG International Cooperative (“KPMG International”), a Swiss entity. All rights reserved. [Printed in the U.S.]
6
Groceries (food and beverage) 19.8 %
Prescription medications 5.7 %
Restaurants (in-person, take-out, or delivery) (20.5%)
Apparel (e.g., clothing, shoes, accessories) (17.9%)
Entertainment / media (e.g., movies, music, videogames, etc.) (19.5%)
Hobbies (e.g., sporting goods, musical instruments, books, etc.) (17.0%)
Furniture or home improvement supplies (14.8%)
Electronics and appliances (12.8%)
Toys (13.4%)
Office supplies (11.2%)
Personal care products (e.g., hair, skin, eye, makeup.) (0.2%)
All other purchases (4.9%)
CONSUMER IMPACT1
During lockdown, most survey respondents accelerated spend on groceries (food & beverage) at the expense of discretionary categories, with restaurant spending being most deeply impacted
Category Avg. % change % of respondents within category
Note(s): (a) KPMG conducted a survey of 1,000 consumers across the United States and they were asked the question, “How much do you think your monthly household spend on each of the following categories changed during COVID-19?”Source: (1) KPMG Consumer survey, fielded April 27,2020 – April 30, 2020
% change in household spend during COVID-19
Essential
Discretionary
12%
12%
54%
46%
46%
41%
37%
34%
31%
31%
28%
31%
27%
62%
17%
33%
29%
39%
42%
44%
49%
48%
44%
45%
60%
26%
29%
21%
25%
20%
21%
22%
20%
21%
28%
25%
Decreased Remained the same Increased
Approximately 60% of survey respondents say grocery spend has increased, with spend increasing 20% overall
Approximately 50% of our survey respondents said restaurant spend decreased with an overall decrease in spend of 20%
Other categories with similar declines in spend include entertainment and apparel, where reductions were 20% and 18% respectively

© 2020 KPMG LLP, a Delaware limited liability partnership and the U.S. member firm of the KPMG network of independent member firms affiliated with KPMG International Cooperative (“KPMG International”), a Swiss entity. All rights reserved. [Printed in the U.S.]
7
Average % reduction ~ 47.7%
CONSUMER IMPACT1
Millennials have been particularly hard hit by the pandemic
25%
26%
23%
26%
50-75 %
2020
0-25 %
25-50 %
100%
75-100 %
Purchases of "essential" goods and services (e.g., food,
prescription medications, personal care products)
19.4 %
Regular monthly living expenses (e.g., housing costs, utilities,
home and auto insurance, health insurance, and education)
14.3 %
Savings and investments 5.7 %
Purchases of "discretionary" goods and services (e.g.,
restaurants, clothing, entertainment)
2.9 %
18%
15%
26%
37%
19%
42%
31%
19%
62%
43%
43%
44%
Category Avg. % change % of consumers within category
Remained the sameDecreased Increased
Note(s): (a) Millennials include people in the age group of 22-38 (b) KPMG conducted a survey of 1,000 consumers across the United States and they were asked the question, “Please estimate the percentage reduction of your household income caused by COVID-19.”, “How much do you think your monthly household spend on each of the following categories changed during COVID-19?”, “Since the COVID-19 outbreak, how has your monthly household spend changed for each of the following categories?”Source: (1) KPMG Consumer survey, fielded April 27,2020 – April 30, 2020
Impact of COVID-19 on income and spend for millennials(a)
48%
52%
2020
Negatively impacted
Not impacted
100%Impact on income % reduction of income
© 2020 KPMG LLP, a Delaware limited liability partnership and the U.S. member firm of the KPMG network of independent member firms affiliated with KPMG International Cooperative (“KPMG International”), a Swiss entity. All rights reserved. [Printed in the U.S.]
8
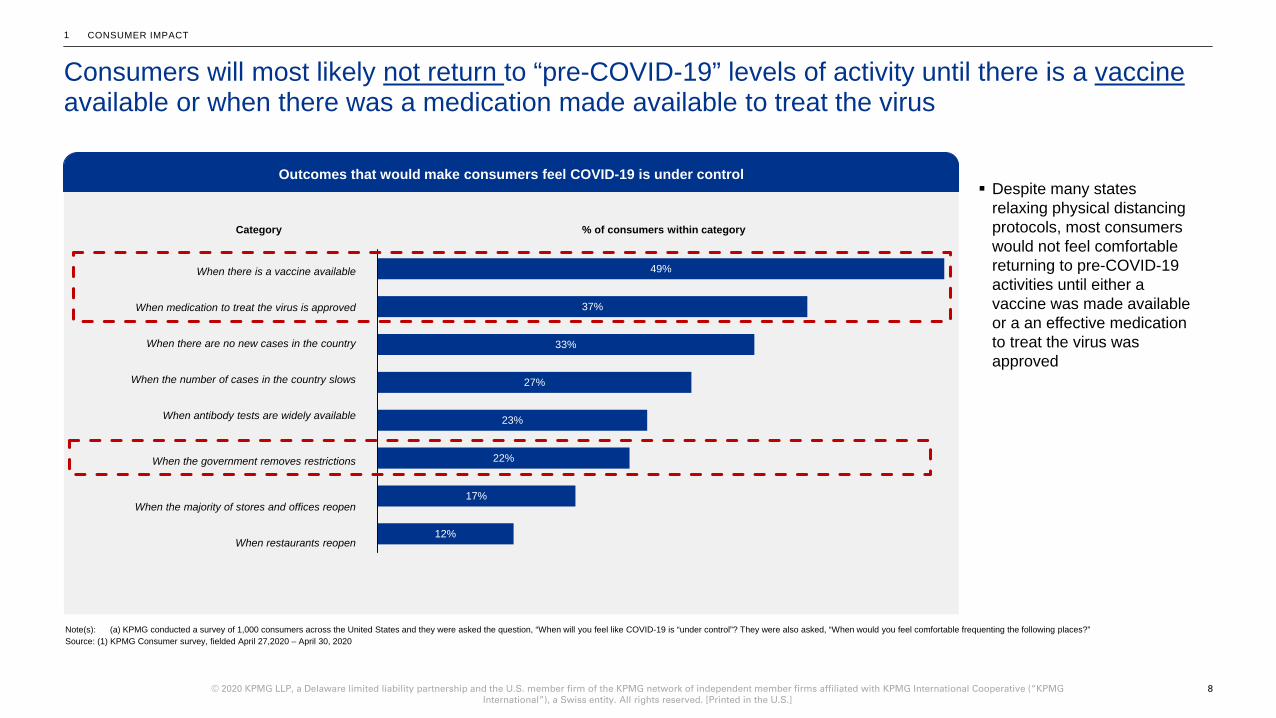
Consumers will most likely not return to “pre-COVID-19” levels of activity until there is a vaccine available or when there was a medication made available to treat the virus
CONSUMER IMPACT
When there is a vaccine available
When medication to treat the virus is approved
When there are no new cases in the country
When the number of cases in the country slows
When antibody tests are widely available
When the government removes restrictions
When the majority of stores and offices reopen
When restaurants reopen
49%
37%
33%
27%
23%
22%
17%
12%
Category % of consumers within category
Note(s): (a) KPMG conducted a survey of 1,000 consumers across the United States and they were asked the question, “When will you feel like COVID-19 is “under control”? They were also asked, “When would you feel comfortable frequenting the following places?”Source: (1) KPMG Consumer survey, fielded April 27,2020 – April 30, 2020
Despite many states relaxing physical distancing protocols, most consumers would not feel comfortable returning to pre-COVID-19 activities until either a vaccine was made available or a an effective medication to treat the virus was approved
Outcomes that would make consumers feel COVID-19 is under control
1

© 2020 KPMG LLP, a Delaware limited liability partnership and the U.S. member firm of the KPMG network of independent member firms affiliated with KPMG International Cooperative (“KPMG International”), a Swiss entity. All rights reserved. [Printed in the U.S.]
02
COVID-19 CONSUMER PULSE
Four emerging archetypes
© 2020 KPMG LLP, a Delaware limited liability partnership and the U.S. member firm of the KPMG network of independent member firms affiliated with KPMG International Cooperative (“KPMG International”), a Swiss entity. All rights reserved. [Printed in the U.S.]
10
1 “Hit hard and cutting deep”
[22%]
2“Proceed with caution”
[45%]
3“Hunker down
and save”[28%]
4“Ready to roll”
[5%]
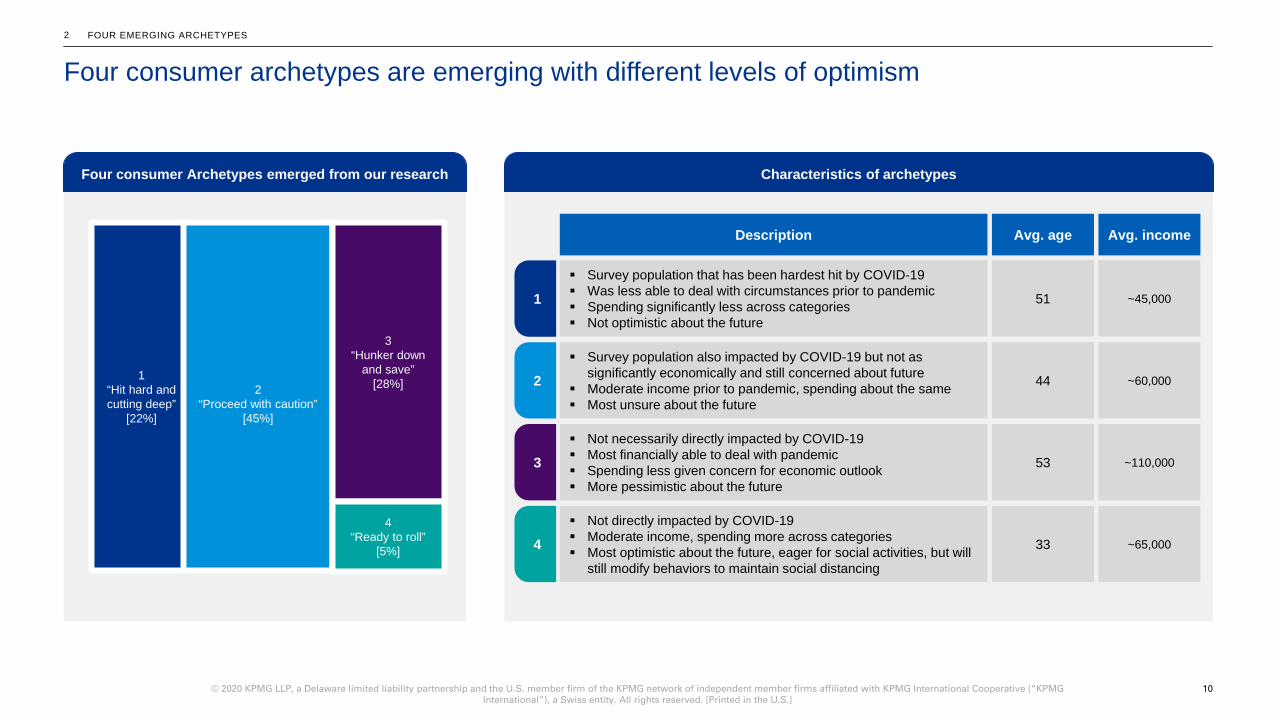
Four consumer archetypes are emerging with different levels of optimismFOUR EMERGING ARCHETYPES2
Four consumer Archetypes emerged from our research Characteristics of archetypes
1
2
3
4
Description
Survey population that has been hardest hit by COVID-19 Was less able to deal with circumstances prior to pandemic Spending significantly less across categories Not optimistic about the future
Avg. incomeAvg. age
Survey population also impacted by COVID-19 but not as significantly economically and still concerned about future
Moderate income prior to pandemic, spending about the same Most unsure about the future
Not necessarily directly impacted by COVID-19 Most financially able to deal with pandemic Spending less given concern for economic outlook More pessimistic about the future
Not directly impacted by COVID-19 Moderate income, spending more across categories Most optimistic about the future, eager for social activities, but will
still modify behaviors to maintain social distancing
51 ~45,000
44 ~60,000
53 ~110,000
33 ~65,000

© 2020 KPMG LLP, a Delaware limited liability partnership and the U.S. member firm of the KPMG network of independent member firms affiliated with KPMG International Cooperative (“KPMG International”), a Swiss entity. All rights reserved. [Printed in the U.S.]
11
“Hunker down and save”
Groceries
Entertainment
Restaurants
Apparel
Change in spend (%)
Avg. income of group~110,000
“Proceed with caution”
Groceries
Restaurants
Apparel
Entertainment
Change in spend (%)
Avg. income of group~60,000
“Hit Hard and Cutting Deep”
Groceries
Restaurants
Apparel
Entertainment
Change in spend (%)
Avg. income of group~45,000
FOUR EMERGING ARCHETYPES2
Those hit hardest by the economic consequences of the government response have cut deep, but there is a significant portion of the economy who are well off and are still reducing spend
8.2%
-72.4%
-76.5%
-79.5%
Note(s): (a) KPMG conducted a survey of 1,000 consumers across the United States and they were asked the question, “How much do you think your monthly household spend on each of the following categories changed during COVID-19?”Source: (1) KPMG Consumer survey, fielded April 27,2020 – April 30, 2020
19.7%
0.1%
-0.6%
4.0%
10.3%
-46.8%
-30.5%
-43.2%
“Ready to roll”
49.5%
49.1%
42.0%
44.8%
Groceries
Restaurants
Apparel
Entertainment
Change in spend (%)
Avg. income of group~65,000

© 2020 KPMG LLP, a Delaware limited liability partnership and the U.S. member firm of the KPMG network of independent member firms affiliated with KPMG International Cooperative (“KPMG International”), a Swiss entity. All rights reserved. [Printed in the U.S.]
12
FOUR EMERGING ARCHETYPES2
Most consumers expect recovery within two years; however, there are a significant number of consumers who believe the economy will not return to pre-COVID-19 levels
Note(s): (a) KPMG conducted a survey of 1,000 consumers across the United States and they were asked the question, “When do you think the overall economy will rebound to pre-COVID-19 levels?”, “If COVID-19 were under control in three months, when do you think your spending would return to pre-COVID levels”Source: (1) KPMG Consumer survey, fielded April 27,2020 – April 30, 2020
“Hit Hard and Cutting Deep”
2422
Economic recovery
Spending recovery
Average recovery period (months)
“Proceed with caution”
2422
Spending recovery
Economic recovery
Average recovery period (months)
“Hunker down and save”
22
14
Economic recovery
Spending recovery
Average recovery period (months)
“Ready to roll”
14
10
Economic recovery
Spending recovery
Average recovery period (months)
% of segment unsure of economic recovery
% of segment who say will
never recover
12% 13%
% of segment unsure of economic recovery
% of segment who say will
never recover
17% 9%
% of segment unsure of economic recovery
% of segment who say will
never recover
7% 6%
% of segment unsure of economic recovery
% of segment who say will
never recover
0% 2%

© 2020 KPMG LLP, a Delaware limited liability partnership and the U.S. member firm of the KPMG network of independent member firms affiliated with KPMG International Cooperative (“KPMG International”), a Swiss entity. All rights reserved. [Printed in the U.S.]
13
Dine in restaurant
Cooking at home
Restaurant drive through
Restaurant delivery
“Hunker down and save”
FOUR EMERGING ARCHETYPES2
Across archetypes, more “at home” and less “dine out” eating occasions
24%
9%
15%
40%
21%
18%
20%
29%
Note(s): (a) KPMG conducted a survey of 1,000 consumers across the United States and they were asked the question, “How do you expect your typical behaviors to change after social distancing (e.g., “shelter in place” or “stay at home”) mandates are lifted”Source: (1) KPMG Consumer survey, fielded April 27,2020 – April 30, 2020
“Proceed with caution”
27%
15%
22%
22%
12%
18%
19%
31%
Cooking at home
Dine in restaurant
Restaurant delivery
Restaurant drive through
“Ready to roll”
32%
25%
36%
25%
27%
11%
25%
41%
Restaurant delivery
Cooking at home
Restaurant drive through
Dine in restaurant
DecreaseIncrease
“Hit Hard and Cutting Deep”
33%
13%
22%
21%
10%
33%
28%
48%
Cooking at home
Restaurant drive through
Restaurant delivery
Dine in restaurant

© 2020 KPMG LLP, a Delaware limited liability partnership and the U.S. member firm of the KPMG network of independent member firms affiliated with KPMG International Cooperative (“KPMG International”), a Swiss entity. All rights reserved. [Printed in the U.S.]
14
Exercising at home
Travel
Working at home
Going to the gym
Going to shopping centers
“Hunker down and save”
FOUR EMERGING ARCHETYPES2
Across archetypes, consumers plan on more “at home” activities post COVID-19
18%
16%
19%
32%
30%
12%
17%
21%
27%
31%
Note(s): (a) KPMG conducted a survey of 1,000 consumers across the United States and they were asked the question, “How do you expect your typical behaviors to change after social distancing (e.g., “shelter in place” or “stay at home”) mandates are lifted”Source: (1) KPMG Consumer survey, fielded April 27,2020 – April 30, 2020
“Proceed with caution”
19%
13%
12%
18%
19%
10%
14%
25%
30%
31%
Working at home
Exercising at home
Going to the gym
Going to shopping centers
Travel
“Ready to roll”
30%
32%
34%
32%
23%
18%
23%
32%
32%
39%
Working at home
Exercising at home
Travel
Going to the gym
Going to shopping centers
DecreaseIncrease
“Hit Hard and Cutting Deep”
29%
15%
8%
21%
22%
12%
19%
39%
44%
46%
Exercising at home
Working at home
Going to shopping centers
Travel
Going to the gym

© 2020 KPMG LLP, a Delaware limited liability partnership and the U.S. member firm of the KPMG network of independent member firms affiliated with KPMG International Cooperative (“KPMG International”), a Swiss entity. All rights reserved. [Printed in the U.S.]
03
COVID-19 CONSUMER PULSE
Lasting changes to where and how consumers spend

© 2020 KPMG LLP, a Delaware limited liability partnership and the U.S. member firm of the KPMG network of independent member firms affiliated with KPMG International Cooperative (“KPMG International”), a Swiss entity. All rights reserved. [Printed in the U.S.]
16
Restaurants (in-person, take-out, or delivery) 27.6%
Office supplies 24.5%
Personal care products (e.g., hair, skin, eye, makeup) 29.1%
Groceries (food and beverage) 29.5%
Toys 23.4%
Furniture or home improvement supplies 24.5%
Prescription medications 27.7%
Electronics and appliances 28.9%
Apparel (e.g., clothing, shoes, accessories) 32.7%
Entertainment / media (e.g., live shows, movies, music.) 30.8%
Sporting goods, hobby supplies, instruments and books 26.2%
One key “COVID-19” behavior was migration to online shopping as a way to maintain social distancing protocols, our survey respondents indicate that spend will stay online in the future
LASTING CHANGES TO WHERE AND HOW CONSUMERS SPEND3
35%
45%
34%
43%
50%
46%
49%
38%
26%
34%
42%
24%
17%
23%
12%
13%
17%
11%
18%
25%
21%
17%
11%
8%
10%
7%
9%
10%
6%
9%
13%
9%
10%
21%
20%
23%
25%
19%
19%
21%
22%
24%
23%
21%
9%
9%
10%
12%
9%
9%
14%
12%
12%
12%
10%
0% 50% -75 %0% -25 % 25% -50 % 75% -100%
Category Avg. % spend % of consumers within category % of increase in future
Note(s): (a) KPMG conducted a survey of 1,000 consumers across the United States and they were asked the question, “Before COVID-19, what percent of your spend was online in each of the following categories?” and “What percent of your spend do you expect to be online in each of the following categories after social distancing (e.g., “shelter in place” or “stay at home”) mandates are lifted?“”Source: (1) KPMG Consumer survey, fielded April 27,2020 – April 30, 2020
5.0%
4.3%
3.9%
3.5%
3.2%
2.7%
2.5%
2.5%
2.3%
2.2%
2.0%
Consumer online behaviors prior to COVID-19 and in future

© 2020 KPMG LLP, a Delaware limited liability partnership and the U.S. member firm of the KPMG network of independent member firms affiliated with KPMG International Cooperative (“KPMG International”), a Swiss entity. All rights reserved. [Printed in the U.S.]
17
LASTING CHANGES TO WHERE AND HOW CONSUMERS SPEND3
Majority of the online shoppers preferred Walmart or Amazon for purchasing groceries and personal care products; opting for ‘delivery’ for personal care products and ‘pickup’ for groceries
51%
34%
22%
21%
17%
17%
10%
6%
5%5%
40%
60%
23%
21%
33%
18%
Delivery
In-store pickup
Groceries
Curb side pickup
2%
Personal Care Products
Other
100% 100%
Avg. % of total ordered online by mode of receiving
Note(s): (a) KPMG conducted a survey of 1,000 consumers across the United States and they were asked the question, “Have you purchased groceries or personal care products online since social distancing protocols began?”, “Where have you purchased groceries online?”, “Please rate your experience with each of the following online grocery retailers on a scale of 1 to 7, 1 being poor and 7 being excellent:”, “How do you receive your online grocery orders? Please estimate the percentage across options, total must equal 100%.” “Where have you purchased Personal care products online?”, “Please rate your experience with each of the following online personal care products retailers on a scale of 1 to 7, 1 being poor and 7 being excellent”, “How do you receive your personal care items? Please estimate the percentage across options, total must equal 100%”Source: (1) KPMG Consumer survey, fielded April 27,2020 – April 30, 2020
Amazon 6.1
Walmart 6.0
Target 6.0
Ulta Beauty 6.0
Instacart 6.0
Pharmacy chain e.g. CVS
or Walgreens6.1
Sephora 6.0
Other NA
65%
50%
28%
10%
10%
10%
9%
6%
Store Rating (1 = Poor, 7 = Excellent)
Online store Avg. store rating
% of online shoppers shopping from store
Groceries Personal Care Products
Walmart 5.9
Amazon Prime Now 5.8
Instacart 5.5
Amazon Fresh 5.8
Local grocery’s online store 5.6
Kroger 5.8
Other NA
Fresh Direct 6.2
PeaPod 5.4
Online store Avg. store rating
% of online shoppers shopping from store
Mode of online delivery Consumer ratings of online retailers

© 2020 KPMG LLP, a Delaware limited liability partnership and the U.S. member firm of the KPMG network of independent member firms affiliated with KPMG International Cooperative (“KPMG International”), a Swiss entity. All rights reserved. [Printed in the U.S.]
18
Consumers appear to be more comfortable in smaller social settings “visiting friends” or “going to a restaurant” rather than frequenting potentially more crowded spaces such as bars or gyms…
LASTING CHANGES TO WHERE AND HOW CONSUMERS SPEND3
Activities consumers are likely to do once “stay at home” mandates are lifted Activities consumers are unlikely to do once “stay at home” mandates are lifted
Visit friends
Go to a sit down restaurant and eat in dining room
Get a service (doctor, dentist, haircut, massage, etc.)
Leisure travel
Go to the movies
Go to the gym
Go to a fast food restaurant and eat in the dining room
Go to the mall
Go to restaurant restaurant’s drive through
Go to a bar
Go to a concert / music festival
Other
Host a party
42%
37%
33%
33%
22%
17%
15%
15%
13%
11%
11%
7%
4%
Go to a bar
Go to the gym
Go to a concert / music festival
Go to the movies
Host a party
Go to the mall
Leisure travel
Go to a fast food restaurant and eat in the dining room
Go to a sit down restaurant and eat in dining room
Go to restaurant restaurant’s drive through
Visit friends
Get a service (doctor, dentist, haircut, massage, etc.)
Other
40%
39%
35%
29%
26%
22%
17%
16%
15%
10%
7%
5%
3%
Category % of consumers within category Category % of consumers within category
Note(s): (a) KPMG conducted a survey of 1,000 consumers across the United States and they were asked the question, “What are the top three things you are looking forward to doing once “shelter in place” or “stay at home” mandates are lifted?” They were also asked, “What are the three things you are least likely to do once “shelter in place” or “stay at home” mandates are lifted?”Source: (1) KPMG Consumer survey, fielded April 27,2020 – April 30, 2020

© 2020 KPMG LLP, a Delaware limited liability partnership and the U.S. member firm of the KPMG network of independent member firms affiliated with KPMG International Cooperative (“KPMG International”), a Swiss entity. All rights reserved. [Printed in the U.S.]
19
LASTING CHANGES TO WHERE AND HOW CONSUMERS SPEND3
… however businesses will need to make changes to attract consumers back
Measures that would increase likeliness of visiting a restaurant Measures that would increase likeliness of visiting a retail store
Note(s): (a) KPMG conducted a survey of 1,000 consumers across the United States and they were asked the question, “What are the top three things you are looking forward to doing once “shelter in place” or “stay at home” mandates are lifted?” They were also asked, “What are the three things are you least likely to do once “shelter in place” or “stay at home” mandates are lifted?”Source: (1) KPMG Consumer survey, fielded April 27,2020 – April 30, 2020
Tables are spaced 6 feet apart
Wait staff wears a mask
Wait staff wears gloves
Confirmation that the kitchen staff wore protective gear
I would not need any new considerations
Temperatures are checked at door
Tables have glass or other protective barriers between them
Contactless payment
Confirmation of kitchen staff’s temperatures
Other
44%
40%
28%
25%
20%
19%
14%
14%
10%
7%
Store staff wearing masks
Limited number of customers in store at a time
Shopping carts wiped after each use
Customers are required to wear masks
More space between isles and fixtures
Protective barriers at check-out
Temperature checks for customers at the door
Special hours for at risk customers
Restocking must take place overnight (while customers are not present)
Contactless payment (e.g., Apple Pay, Google Pay)
Restrictions around trying on outfits in apparel storesOther
No returns
31%
30%
27%
24%
23%
17%
16%
15%
13%
12%
8%
7%
7%
Category % of consumers within category Category % of consumers within category

© 2020 KPMG LLP, a Delaware limited liability partnership and the U.S. member firm of the KPMG network of independent member firms affiliated with KPMG International Cooperative (“KPMG International”), a Swiss entity. All rights reserved. [Printed in the U.S.]
04
COVID-19 CONSUMER PULSE
Taking action

© 2020 KPMG LLP, a Delaware limited liability partnership and the U.S. member firm of the KPMG network of independent member firms affiliated with KPMG International Cooperative (“KPMG International”), a Swiss entity. All rights reserved. [Printed in the U.S.]
21
TAKING ACTION4
Where KPMG can help you redefine your consumer approach
KPMG can support you to rapidly re-evaluate your consumer base, identify the signals of lasting change so that you can retool your business model and succeed in the new normal
Based on variance in gross to net ranges across countries, identify opportunities to improve price, promotion and discount structures
Increase reach to key consumer demographicsPricing & promotion
Prepare leading digital platform while improving cost to serve Improve direct-to-consumer penetration and targetingE-commerce platform
integration
Apply advanced data and analytics to achieve greater efficiency and accelerate revenue across platforms, content and channelsMarketing spend
improvement

© 2020 KPMG LLP, a Delaware limited liability partnership and the U.S. member firm of the KPMG network of independent member firms affiliated with KPMG International Cooperative (“KPMG International”), a Swiss entity. All rights reserved. [Printed in the U.S.]
22© 2020 KPMG LLP, a Delaware limited liability partnership and the U.S. member firm of the KPMG network of independent member firms affiliated with KPMG International Cooperative (“KPMG International”), a Swiss entity. All rights reserved. [Printed in the U.S.]
TAKING ACTION4
Our firm brings unrivaled capabilities to assist you in your response and recovery
Better people. Better approach. Better technology.
Deep experience in all areas of CPG, retail and digital commerce including working with companies on all aspects of strategy, transformation and M&A transactions
Team with senior management and operational experience at leading companies
Delivered $1B+ in value creation in both transformations and transactions
Industry depth
Operational specialists across business functions such as finance, IT, HR, sourcing and operations
Seamless orchestration of organization-wide activities, initiatives and transformations
Designed and structured to execute as one cohesive advisor
Integrated teaming approach
Leading analytics and data science capabilities leveraged in every project: consuming vast amounts of data, applying advanced statistical techniques and delivering insights at ‘deal speed’
Industry-tailored proprietary tools to accelerate data ingestion and virtually eliminate set-up costs
Leading cloud based platforms including a Signals Repository leveraged for machine learning models
Advanced analytics capabilities
Speed to value creation
Alignment of improvement activities with your key value drivers
Rapid identification of critical factors and operating levers that impact organizational performance
Actionable roadmap for integrated performance improvement and value creation planning and execution
© 2020 KPMG LLP, a Delaware limited liability partnership and the U.S. member firm of the KPMG network of independent member firms affiliated with KPMG International Cooperative (“KPMG International”), a Swiss entity. All rights reserved. [Printed in the U.S.]
23
100+ projects per year in Enterprise wide transformations and M&A
540 Performance Improvement professionals located in 28 offices in the US
2,200 global network of PI practitioners in 40 countries
500+ functional experts in our HR, IT, and Finance COEs
Wide ranging solutions across the deal lifecycle
Deep industry-focused strategy and operational capabilities
Analytics horsepower to drive rich data-supported insights at deal speed
Technology enabled to help accelerate and control execution
Truly integrated team
TAKING ACTION4
Your KPMG Consumer & Retail team
Scott RankinConsumer & Retail Strategy Leader
Daniel ShaughnessyPrincipal
Jonathan SeastromManaging Director
Andrew NolanPrincipal
Jeff WilsonPrincipal
Colin HareManaging Director
David RoszmannPrincipal
Andrew LindsayManaging Director
R. Sean StephensManaging Director
Jamil SatchuPrincipal
Sunder RamakrishnanManaging Director
Julia WilsonManaging Director
© 2020 KPMG LLP, a Delaware limited liability partnership and the U.S. member firm of the KPMG network of independent member firms affiliated with KPMG International Cooperative (“KPMG International”), a Swiss entity. All rights reserved. [Printed in the U.S.]
05
COVID-19 CONSUMER PULSE
Appendix – survey profiles and baseline data
© 2020 KPMG LLP, a Delaware limited liability partnership and the U.S. member firm of the KPMG network of independent member firms affiliated with KPMG International Cooperative (“KPMG International”), a Swiss entity. All rights reserved. [Printed in the U.S.]
25
APPENDIX5
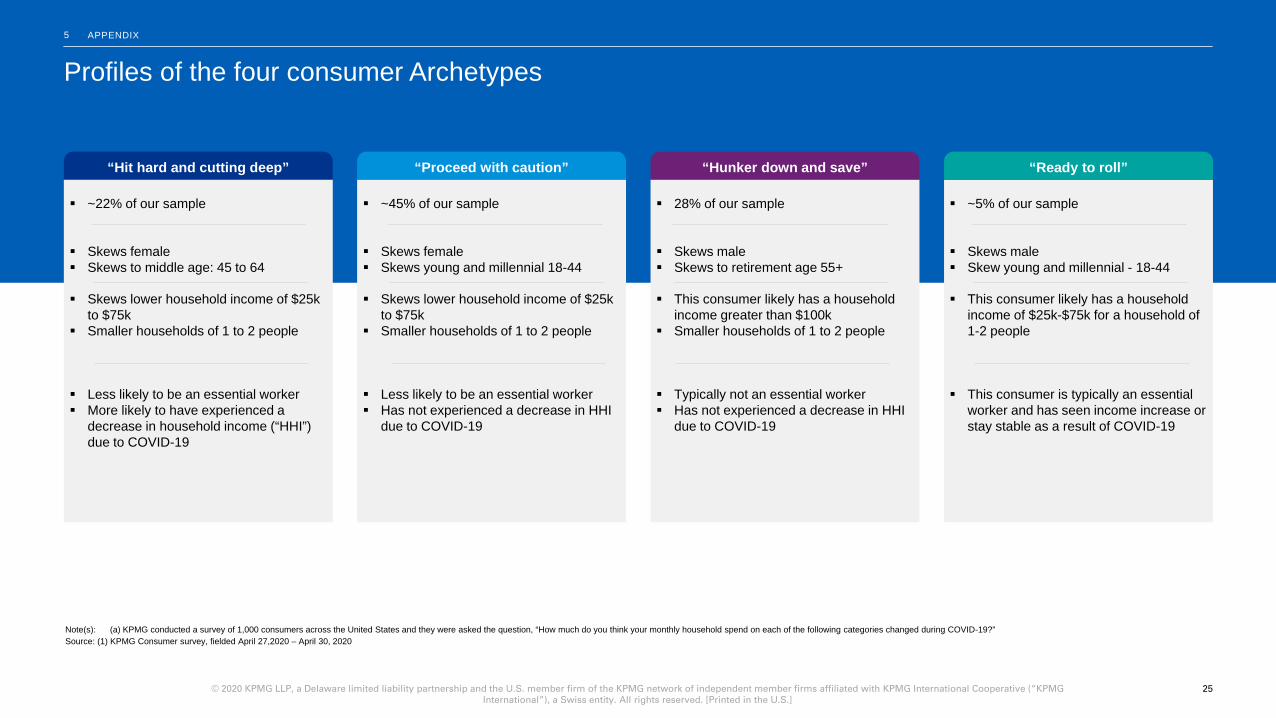
Profiles of the four consumer Archetypes
Note(s): (a) KPMG conducted a survey of 1,000 consumers across the United States and they were asked the question, “How much do you think your monthly household spend on each of the following categories changed during COVID-19?”Source: (1) KPMG Consumer survey, fielded April 27,2020 – April 30, 2020
“Hit hard and cutting deep”
~22% of our sample
Skews female Skews to middle age: 45 to 64
Skews lower household income of $25k to $75k
Smaller households of 1 to 2 people
Less likely to be an essential worker More likely to have experienced a
decrease in household income (“HHI”) due to COVID-19
“Proceed with caution”
~45% of our sample
Skews female Skews young and millennial 18-44
Skews lower household income of $25k to $75k
Smaller households of 1 to 2 people
Less likely to be an essential worker Has not experienced a decrease in HHI
due to COVID-19
“Hunker down and save”
28% of our sample
Skews male Skews to retirement age 55+
This consumer likely has a household income greater than $100k
Smaller households of 1 to 2 people
Typically not an essential worker Has not experienced a decrease in HHI
due to COVID-19
“Ready to roll”
~5% of our sample
Skews male Skew young and millennial - 18-44
This consumer likely has a household income of $25k-$75k for a household of 1-2 people
This consumer is typically an essential worker and has seen income increase or stay stable as a result of COVID-19

© 2020 KPMG LLP, a Delaware limited liability partnership and the U.S. member firm of the KPMG network of independent member firms affiliated with KPMG International Cooperative (“KPMG International”), a Swiss entity. All rights reserved. [Printed in the U.S.]
26
APPENDIX5
Consumer survey demographics by Archetype
Age Region
Number of people in the household Household Annual Income
% of consumers "Proceed with caution"
"Hit hard and cutting deep" "Ready to roll" "Hunker down
and save"Total
populationn 434 215 44 268 961
Northeast 18% 18% 20% 16% 18%
Midwest 20% 23% 30% 27% 23%
South 38% 36% 30% 34% 36%
West 24% 23% 20% 22% 23%
% of consumers "Proceed with caution"
"Hit hard and cutting deep" "Ready to roll" "Hunker down
and save"Total
populationn 434 215 44 268 961 1 25% 28% 36% 21% 25%2 34% 41% 18% 47% 38%3 16% 14% 20% 16% 16%4 14% 11% 14% 11% 12%5 7% 3% 5% 4% 5%6 3% 2% 0% 0% 2%7 0% 0% 2% 0% 0%More than 7 1% 0% 5% 0% 1%
Avg. # of people in the household 2.6 2.3 2.6 2.4 2.5
% of consumers "Proceed with caution"
"Hit hard and cutting deep" "Ready to roll" "Hunker down
and save"Total
populationn 434 215 44 268 961 Less than $25,000 34% 25% 14% 7% 24%$25,000 to $34,999 13% 10% 14% 7% 11%$35,000 to $49,999 13% 22% 20% 7% 14%$50,000 to $74,999 21% 19% 18% 16% 19%$75,000 to $99,999 11% 11% 18% 15% 13%$100,000 to $149,999 6% 9% 9% 25% 12%$150,000 to $199,999 1% 4% 7% 11% 5%$200,000 or more 0% 1% 0% 11% 3%
Avg. household annual income
$35,000 to $49,999
$35,000 to $49,999
$50,000 to $74,999
$75,000 to $99,999
$50,000 to $74,999
% of consumers "Proceed with caution"
"Hit hard and cutting deep" "Ready to roll" "Hunker down
and save"Total
population
n 434 215 44 268 961 Under 18 0% 0% 0% 0% 0%18-24 15% 4% 30% 2% 9%25-34 19% 12% 34% 13% 17%35-44 20% 15% 16% 16% 17%45-54 17% 27% 14% 18% 20%55-64 13% 23% 5% 23% 18%65+ 16% 18% 2% 27% 19%
Avg. age 44.4 51.2 33.3 53.2 47.9
More than 5 percentage points below average Within 5 percentage points of the average More than 5 percentage points above average

© 2020 KPMG LLP, a Delaware limited liability partnership and the U.S. member firm of the KPMG network of independent member firms affiliated with KPMG International Cooperative (“KPMG International”), a Swiss entity. All rights reserved. [Printed in the U.S.]
27
APPENDIX5
Consumer survey demographics by COVID-19 impact profile
Considered “At risk” Considered “essential worker”
Following social distancing protocols Date of beginning of social distancing protocols
More than 5 percentage points below average Within 5 percentage points of the average More than 5 percentage points above average
% of consumers "Proceed with caution"
"Hit hard and cutting deep" "Ready to roll" "Hunker down
and save"Total
population
n 434 215 44 268 961
Considers self at risk 28% 30% 23% 27% 28%
Considers someone in household 13% 10% 23% 10% 12%
Considers self and someone in household at risk 12% 14% 11% 20% 15%
Not at risk 47% 46% 43% 43% 45%
% of consumers "Proceed with caution"
"Hit hard and cutting deep" "Ready to roll" "Hunker down
and save"Total
population
n 434 215 44 268 961
Essential worker 33% 28% 66% 30% 33%
Not an essential worker 67% 72% 34% 70% 67%
% of consumers "Proceed with caution"
"Hit hard and cutting deep" "Ready to roll" "Hunker down
and save"Total
populationn 434 215 44 268 961 City/area does not have any protocols 9% 4% 30% 3% 7%
Following protocols 69% 80% 45% 82% 74%
Somewhat following protocols 18% 13% 23% 14% 16%
Not following protocols 5% 3% 2% 1% 3%
% of consumers "Proceed with caution"
"Hit hard and cutting deep" "Ready to roll" "Hunker down
and save"Total
population
n 434 215 44 268 961
Jan 2020 1% 0% 2% 0% 1%
Feb 2020 5% 2% 5% 2% 3%
Mar 2020 64% 73% 32% 81% 69%
Apr 2020 16% 17% 25% 13% 16%
May 2020 1% 0% 5% 0% 1%
Missing Date 13% 7% 32% 4% 10%

© 2020 KPMG LLP, a Delaware limited liability partnership and the U.S. member firm of the KPMG network of independent member firms affiliated with KPMG International Cooperative (“KPMG International”), a Swiss entity. All rights reserved. [Printed in the U.S.]
28
APPENDIX5
Consumer survey demographics by social profile
Number of visits prior to COVID-19% of consumers visiting atleast once
"Proceed with caution"
"Hit hard and cutting deep" "Ready to roll" "Hunker down
and save"Total
populationn 434 215 44 268 961 Go to restaurant’s drive through 21% 14% 23% 11% 17%
Go to a fast food restaurant and eat in the dining room 25% 19% 34% 18% 22%
Go to a sit down restaurant and eat in dining room 42% 52% 41% 57% 48%
Go to a bar 17% 11% 34% 21% 17%
Go to the gym 22% 20% 45% 25% 23%
Go to the movies 30% 28% 59% 24% 29%
Go to a concert / music festival 10% 16% 34% 21% 16%
Go to the mall 24% 31% 41% 20% 25%
Leisure travel 36% 43% 32% 51% 42%
Visit friends 43% 56% 32% 48% 47%
Host a party 11% 12% 20% 9% 11%
Get a service (doctor, dentist, haircut, massage) 30% 45% 9% 43% 36%
Average # of visits per month
"Proceed with caution"
"Hit hard and cutting deep" "Ready to roll" "Hunker down
and save"Total
population
n 434 215 44 268 961
Go to restaurant’s drive through 3.9 2.3 10.5 2.9 3.7
Go to a fast food restaurant and eat in the dining room 3.4 2.9 8.6 2.4 3.3
Go to a sit down restaurant and eat in dining room 3.6 3.2 7.4 4.6 4.0
Go to a bar 1.3 0.8 4.1 1.2 1.3
Go to the gym 3.8 4.7 7.6 5.7 4.8
Go to the movies 1.7 1.0 3.8 0.9 1.4
Go to a concert / music festival 1.4 0.5 1.9 0.7 1.0
Go to the mall 2.6 2.0 5.1 1.6 2.3
Leisure travel 2.0 2.8 2.8 3.1 2.6
Visit friends 4.6 6.0 17.6 5.2 5.5
Host a party 1.1 0.5 2.4 0.5 0.8
Get a service (doctor, dentist, haircut, massage, etc.) 1.7 2.0 11.3 2.4 2.1
More than 5 percentage points below average Within 5 percentage points of the average More than 5 percentage points above average

© 2020 KPMG LLP, a Delaware limited liability partnership and the U.S. member firm of the KPMG network of independent member firms affiliated with KPMG International Cooperative (“KPMG International”), a Swiss entity. All rights reserved. [Printed in the U.S.]
29
Social distancing summary
Note(s): (a) KPMG conducted a survey of 1,000 consumers across the United States and they were asked the question, “Is your household following social distancing protocols (e.g., “stay at home” or “shelter in place”)”Source: (1) NY Times Covid-19 coverage, accessed May 1, 2020 (2) KPMG Consumer survey, fielded April 27,2020 – April 30, 2020
Level of restrictions states have in place for social distancing Social distancing measures
73%
15%
4%8%
Following
2020
Somewhat following
Not currently following
No protocols
100%
Almost 90% of Americans are following some form of
social distancing measures according to our
KPMG survey
APPENDIX5
Partial reopening Order lifting or reopening soonShut down or restricted
AK
HI

© 2020 KPMG LLP, a Delaware limited liability partnership and the U.S. member firm of the KPMG network of independent member firms affiliated with KPMG International Cooperative (“KPMG International”), a Swiss entity. All rights reserved. [Printed in the U.S.]
30
Regular monthly living expenses (e.g., housing costs, utilities, home and auto insurance, health insurance, and education) 8.4 %
Savings and investments (0.5) %
Purchases of "essential" goods and services (e.g., food, prescription medications, personal care products) 13.9 %
Purchases of "discretionary" goods and services (e.g., restaurants, clothing, entertainment) (13.0) %
Spend summary
13%
25%
16%
48%
56%
45%
33%
24%
32%
30%
51%
28%
Category Avg. % change % of consumers within category
Decreased Remained the same Increased
Note(s): (a) KPMG conducted a survey of 1,000 consumers across the United States and they were asked the question, “How much do you think your monthly household spend on each of the following categories changed during COVID-19?”Source: (1) KPMG Consumer survey, fielded April 27,2020 – April 30, 2020
On average, survey respondents accelerated spend on “essential” goods such as food, prescriptions and personal care products at the expense of more discretionary items such as restaurants, clothing and entertainment
% change in household spend during COVID
APPENDIX5

kpmg
© 2020 KPMG LLP, a Delaware limited liability partnership and the U.S. member firm of the KPMG network of independent member firms affiliated with KPMG International Cooperative ('KPMG International'), a Swiss entity. All rights reserved.
The KPMG name and logo are registered trademarks or trademarks of KPMG International. DAS-2020-1766
The information contained herein is of a general nature and is not intended to address the circumstances of any particular individual or entity. Although we endeavor to provide accurate and timely information, there can be no guarantee that such information is accurate as of the date it is received or that it will continue to be accurate in the future. No one should act on such information without appropriate professional advice after a thorough examination of the particular situation.
kpmg.com/socialmedia
Some or all of the services described herein may not be permissible for KPMG audit clients and their affiliates or related entities.