Embed Size (px)
Citation preview
Competition and International Competitiveness: Evidence from Japanese Industries
Noriyuki Doi
School of Economics and Innovation Research Center Kwansei Gakuin University, and CPRC
Yasushi Kudo
Competition Policy Research Center, Japan Fair Trade Commission
Masatoshi Kato
School of Economics and Innovation Research Center Kwansei Gakuin University
CPDP-60-E February 2014
CPRC Discussion Paper Series
Competition Policy Research Center Japan Fair Trade Commission
1-1-1, Kasumigaseki, Chiyoda-ku, TOKYO 100-8987 JAPAN
Phone:+81-3-3581-1848 Fax:+81-3-3581-1945
URL: http://www.jftc.go.jp/cprc/index.html
E-mail:[email protected]
Competition and International Competitiveness:
Evidence from Japanese Industries
Noriyuki Doi, Yasushi Kudo and Masatoshi Kato
February, 2014
Abstract
In this paper, we examine the effects of domestic competition and international competitive pressures. We use industry’s world export share and individual firms’ foreign sales ratio in Japanese manufacturing industries as
two measures of overseas operations as a proxy for international competitiveness. As for measures of domestic competition, we use domestic concentration indexes, such as the Herfindahl-Hirschman Index and the 3-firm
concentration ratio. We found no significant effect of domestic concentration on the world export share, but found that there was an inverted U-shaped relationship between concentration and firms’ foreign sales ratio.
Another measure for competition, mobility indices all had no definite effect on both the measures of international competitiveness.
Overseas operation-related factors, such as export intensity and the intra-industry trade ratio, have a significant effect, although being likely to have a tautological explanation. Interpreting literally, international
competitive pressures lead to larger competitiveness.
Key Words: international competitiveness; world export share; overseas production (FDI); concentration; market mobility
JEL Classification: L11, L12, L13, L41, L42
---------------------------------- Author Affiliation: Noriyuki Doi, School of Economics and Innovation Research Center, Kwansei Gakuin University, Nishinomiya,
662-8501, Japan. Tel & Fax: +81 (0)798 54 6316, e-mail: [email protected] (corresponding author).
Yasushi Kudo, Competition Policy Research Center, Fair Trade Commission, 1-1-1, Kasumigaseki, Chioyoda-ku, Tokyo, 100-8987, Japan.
Masatoshi Kato, School of Economics and Innovation Research Center, Kwansei Gakuin University, Nishinomiya, 662-8501, Japan.
* The views expressed in this paper are those of the authors' and do not represent those of CPRC or JFTC.
2
I. Introduction
Growing economic globalization has raised the debates on industrial competitiveness in international
markets, in particular in Japan. Japanese firms have been said to have lost or, to be in the process of
losing international competitiveness since the mid-1990s in which fuller-scale globalization started.
But at the same time, it has been found that there was a larger variation in competitiveness between
industries. As a result, competitiveness-promoting factors have received much interest. In fact,
government initiatives intended to revive international competitiveness have been, and are now a hot
policy issue in Japan.
Industrial competitiveness may be determined by many internal factors, such as business
resources and capabilities. Also, the industrial and country’s context of international activities of a
firm may exert direct impacts on industrial competitiveness. Therefore, the existing studies have
examined the industrial factors affecting the competitiveness.
The intensity of industry competition is likely to be amongst the context that may have a large
influence on competitiveness. Competition is one of the driving forces of industrial competitiveness,
and further of industrial and economic development. To date, however, there has been limited
evidence on the relationship between competition and competitiveness in Japanese industries.
This paper empirically explores the importance of domestic and international competition in
providing greater international competitiveness for industries. Our approach is to econometrically
estimate the effects of competition factors on industrial internationalization activities, using a sample
of industries and firms in Japanese manufacturing before the collapse of Lehman Brothers in 2008.
Also, some face-to-face interviews were complementarily conducted.
The organization of the paper is as follows. Section II discusses and summarizes the relationship
between competition and industrial competitiveness to test in the following sections. Section III
describes the methodology and results on world export share of an industry. Sections IV discusses
the methodology and results on a firm’s foreign sales ratio. The final section includes some
concluding remarks.
II. Competition and industrial competitiveness
1. Definition and measurement of competitiveness
First of all, it is difficult to define the concept of international competitiveness. Although the term is
frequently found in various opportunities and literature, the definitions are vague and diversified,
suggesting various usages, such as macroeconomic competitiveness and business competitiveness. In
fact, many studies use various notions as well. The representative definition frequently used in
3
business world is that it is equivalent to a firm’s or an industry’s ability to compete, or to acquire its
favorable relative position, in an international market, reminding of the concept of “competitive
advantage.” The term is referred to in strategic management studies (e.g., Porter [1990]).
In general, the concept of competitiveness includes both comparative and absolute advantages.
The former is of a concept used in international economics, while the latter is equivalent to
competitive advantage. Microeconomic studies focus on absolute advantage rather than comparative
advantage, because the former is thought to be the key determinant of industrial and economic
development. In other words, business competitiveness or absolute advantage is not the same as, but
closely related to, an industry’s or a country’s competitiveness. Therefore, the above definition of
absolute advantage is used in this study, although being vague.
Before we discuss the effects of competition, we have to mention what firms’ successful overseas
operations suggest. If firms successfully develop overseas operations, this suggests that; 1) they hold
greater capability, 2) they engage in international activities, and 3) they enjoy greater benefits from
the activities. That is, overseas operation includes the following three dimensions: capability for
internationalization, internationalization activities, and performance from internationalization.
Capability is related to sources of competitive advantages; international activities involve both
foreign trade and foreign direct investment (FDI); performance is outcomes from competitive
advantage. And the three factors have mutually interdependent relationships: sources ↔ operation ↔
performance.
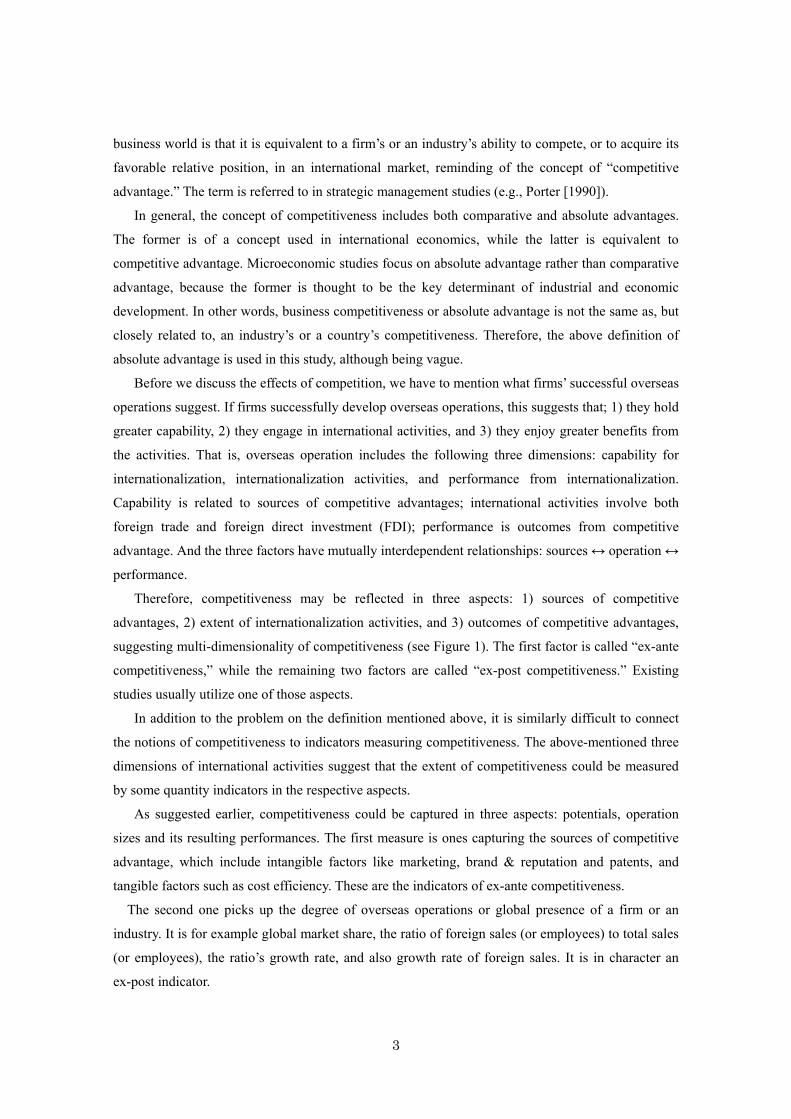
Therefore, competitiveness may be reflected in three aspects: 1) sources of competitive
advantages, 2) extent of internationalization activities, and 3) outcomes of competitive advantages,
suggesting multi-dimensionality of competitiveness (see Figure 1). The first factor is called “ex-ante
competitiveness,” while the remaining two factors are called “ex-post competitiveness.” Existing
studies usually utilize one of those aspects.
In addition to the problem on the definition mentioned above, it is similarly difficult to connect
the notions of competitiveness to indicators measuring competitiveness. The above-mentioned three
dimensions of international activities suggest that the extent of competitiveness could be measured
by some quantity indicators in the respective aspects.
As suggested earlier, competitiveness could be captured in three aspects: potentials, operation
sizes and its resulting performances. The first measure is ones capturing the sources of competitive
advantage, which include intangible factors like marketing, brand & reputation and patents, and
tangible factors such as cost efficiency. These are the indicators of ex-ante competitiveness.
The second one picks up the degree of overseas operations or global presence of a firm or an
industry. It is for example global market share, the ratio of foreign sales (or employees) to total sales
(or employees), the ratio’s growth rate, and also growth rate of foreign sales. It is in character an
ex-post indicator.
4
Finally, competitiveness could be observed by financial performance from overseas operations.
The performance measure in this regard is largely profit rates of firms in foreign markets (return on
exports and on foreign investments). The measure also is of an ex-post or a “revealed” type.
While we can capture ex-ante or ex-post competitiveness via these indicators, they all suffer
problems. First, firms or industries with larger potentials of competitiveness may not have the
incentive to operate overseas. Also, higher degree of overseas operations does not always suggest
that firms or industries have the ability to sell their products successfully and profitably on foreign
markets. For example, firms or industries with higher overseas operations may have less profits or
even deficits on foreign markets.
Thus, the multitude of definitions and indicators, and also their qualifications are helpful to
understand the complexity of the international competitiveness problem. It is difficult to a-priori
explain an order of ranks among these indicators. Therefore, measures should be selected taking into
account their qualifications. In this study, we used the following indicators for competitiveness:
share of Japanese exports in the world total exports at an industry level, and the ratio of foreign sales
in aggregate sales of a firm at a firm level, which are mainly attributable to availability of data.
Figure 1 Determinants of International Competitiveness
Competitive Demand Factor Related & supporting
environments conditions conditions industries
Strategies Resources
Competitive advantages: sources, ex-ante competitiveness
Overseas operations: internationalization activities,
ex-post competitiveness
Outcomes of operations: performance, ex-post competitiveness
2. Effects of competition
Before empirical examination, the relation of competition to competitiveness will be summarized
theoretically. Competition affects the degree and pattern of firms’ overseas operations, and also is
(international market)
5
affected by business internationalization.1
Competition is one of the driving forces of a firm's competitiveness, which in turn leads to
industrial and economic development. Therefore, many researchers and policy makers emphasize the
role of competition. On determinants of industrial competitiveness, however, several theories have
been proposed in business and economics literature.
First, the resource-based theory of a firm suggests that internally-accumulated competences and
managerial resources are a major source of competitiveness, and also that the competences and
resources may be internally or endogenously created by business strategies. This argument is
frequently found in strategic management perspective. For example, Barney and Clark [2007]
examine the view.
But, the advantages depend not only on such internal factors, but also on external factors. The
external factors include domestic competitive environments like industry structure elements because
internal factors may be affected by competitive environments and firm behavior, and the incentives
of firm behavior also may be affected by competitive environments. For example, Porter’s [1990]
diamond approach emphasizes four external factors: competitive environments, demand conditions,
factor conditions, and related and supporting industries. In particular, Porter puts greater emphasis
on the roles of business competition, and also of antitrust policy.2 Competition is likely to improve
cost-(or X-) efficiency and to promote innovation (dynamic efficiency), which in turn induce greater
competitiveness. This argument is accepted by competition authorities in many countries; fierce
competition is necessary for improving business competitiveness. Also, economists agree with the
view (for example Vickers [1995]).. For example, Gorodnichinko et al. [2010] empirically support
the view, by implying the evidence that domestic and international competition bring pressures for
domestic firms to innovate more in order to survive. Then, the intensity of competition is captured as
a binary variable.
The relation may have different interpretations with reference to market structure elements, such
as concentration. First, concentration may have a promoting effect on overseas operation. It is
because higher concentration may induce more rival or strategic interaction among firms and in
particular leading firms. That is, as concentration increases, export rivalry may take place due to
larger mutual interdependence. Such relationship is emphasized by strategic management
perspective, and also has been confirmed by for example Pagoulatos and Sorensen [1981]. Also, in
multinational enterprises (MNEs) study, for example, Knickerbocker [1973] emphasized that
oligopolistic interaction took place in FDI. In addition, Pugel [1978] empirically shows that there is
a positive relationship between concentration and FDI.
1 The relationship is examined by Desai et al. [2009], Levenstein et al. [2011], Pitelis & Sugden [1991], Porter [2007], and Spulber [2007]. 2 For example, Porter [2008] emphasizes that “Government’s proper role is a catalyst and challenger: it is to encourage – or even push – companies to raise their aspirations and move to higher levels of competitive performance” (pp. 200).
6
However, higher concentration may induce restricted competition and market power, which lead
to a firm’s less incentive to improve productivity and competitiveness due to the “quiet life.” This
view has been emphasized by many industrial organization economists. Although the
concentration-innovation relation is still an open, and controversial problem (see for example
Peneder and Wörter [2013]), the negative effect of concentration on innovation was partially
supported by the empirics-oriented inverted-U relationship hypothesis (for example Scherer and
Ross [1990] and Aghion et al. [2005] as representative studies). It is because the argument suggests
that in highly-concentrated industries, the intensity of R&D activities tends to decline.
Thus, it is important to look at the relationship between competition and international
competitiveness. But, the existing studies have scarcely paid attention to the empirical examination
of the problem in Japan, possibly due to limited availability of necessary statistical data. In reality,
economic globalization and innovation are inducing dynamic competition in many industries. The
analysis of the relationship is becoming more and more important.
Also, as suggested above, the empirical examination may involve the question of what more
useful indicators measuring the intensity of competition are. Usually industrial organization
literature has used industry concentration measures, such as -firm concentration ratio (for the
largest firms) and Herfindahl-Hirschman Index. But it is well-known that those measures have
qualifications. They are static, and ignore dynamics of market share and position, which may capture
the competition intensity. Therefore, it is necessary to find an alternative or a complementary
measurement. One of the alternative measures is market share mobility or change in leader in an
industry.
One more competition factor is international pressures. As Gorodnichinko et al. [2010] suggest,
it is likely to be an effective competition factor which forces firms to innovate more and improve
themselves more. Then, the measurement of the intensity of international competitive pressures is a
major issue as well.
Thus, various competition factors should be taken into examination. In this paper we have
introduced not only concentration, but also other competition factors such as market share mobility
and international pressure factors.
III. Empirical Analysis 1: Analysis of World Export Share
1. Indicators used
This study examines competitiveness through the presence of Japanese industries or firms in global
markets, which is related to the second indicator earlier referred to. It is largely because it is possible
to measure the presence from available data in Japan. The presence is equivalent to the degree of
7
“internationalization” of a firm or an industry.
Generally, as overseas operations of a firm consist of both exports and FDI, the measurement of
competitiveness should include both the operations. Thus, as a measurement of competitiveness, it is
desirable to employ world market share of a domestic firm or an industry in the world production or
sales. But unfortunately, in Japan there is no available statistical data on foreign production at a firm
or an industry level.3 This paper alternately makes use of the share of Japanese exports in the world
total exports at an industry level (hereafter world export share) because various business documents
suggest that Japanese firms with larger exports tend to prefer FDI to more expanded exports. As a
positive relation exists between foreign production and exports at an inter-industry level, world
export share is likely to reflect approximately the whole overseas operations.
2. Prior studies
There is scarcely existing study examining the world export share, except Sakakibara and Porter
[2001]. Their study analyzed the determinants of world export share in Japanese manufacturing
industries over 1991 to 1993, taking into account some possible factors, including the intensity of
competition. The share is the same with the definition used here.
The study introduced concentration ratio and market share mobility index referred to later to
examine the influences of competition-related factors on world export share. The market share
mobility may capture the intensity of competition because frequent or great changes in market share
and position of leading firms usually mean fierce competition. The results suggest that concentration
is not amongst the significant influences on world export share. But, market share mobility in a
domestic market has a positive and significant effect, suggesting that fierce competition plays a
significant role of enhancing firm competitiveness and then promoting exports, as competition is
likely to promote X-efficiency and/or innovation.
However, though the results have interesting implications, the study has some qualifications.
First of all, a measurement problem is picked up. The measures based on only direct exports from
Japan may under-evaluate the presence or competitiveness. As mentioned above, nowadays firms
tend to prefer FDI to exports as overseas operations (an export-substituting type of FDI). Also, firms
frequently export products manufactured in a foreign country to another foreign countries (an export
platform type of FDI), and also to Japan (an inverse import type of FDI). The measurement of
industrial competitiveness should involve both overseas production and exports. Then, the better
measure is, as indicated above, for example the ratio of foreign sales to total sales, which reflects
3 We inquired into the relevant industry-level data by many methods, including questionnaire to most of business associations, but could not find available statistics except some industries.
8
total net sales from both exports and overseas production.4
Also, the period covered in the study is before the large-scale globalization took place. The
relationship between competition and international competitiveness during the period of
globalization is more interesting.
Second, it is not clear that the used mobility indicators are a sufficient measure. It is because
market mobility may be measured by alternative indicators. Therefore, the finding should be
confirmed by utilizing those alternative indicators.
Third, competition consists of foreign market pressures as well as domestic competition. Other
competition factors like cartels also should be taken into account.
Finally, global competition may be an important determinant of the intensity of competition. For
example, international oligopoly or world concentration is a candidate for possible relevant
determinants.5
3. Analytical design: estimated equation
The inter-industry and inter-temporal variations in world export share of a Japanese industry may be
explained by the following linear-form model:
= + ( or ) + ( = 1, 2, 3, 4) + + + + + + + + + + + ,
where is world export share of an industry, is market mobility index of method ( = 1, 2, 3, 4), is Herfindahl-Hirschman Index, is 3-firm concentration ratio, EX is
export intensity, is intra-industry trade ratio, is growth of domestic demand, is firm
size ratio, is research and development (R&D) intensity, is advertising intensity, KL is
capital labor ratio, and is processing intensity. Also, dummy variables are used to account for
variation by mergers and cartels. is a merger dummy and takes 1 for industry with merger and
0 otherwise, and is a cartel dummy, and takes 1 for industry with cartel and 0 otherwise. is the
error term. ( = 0, 1, … ,12) is regression coefficient. The variables all involve letter (industry),
which indexes observations by industry, but in the equation the industry index is omitted for
simplicity.
A cross-sectional analysis has a qualification when changes over time are examined. Then,
cross-sectional data are usually complemented with time dummy. We analyzed the determinants of
each year’s the share and also their 5-year average. The results were similar among those years, and
4 Desai et al. [2009] also show that there is a positive relationship between exports and FDI. 5 For world concentration ratio, see Franko [2002, 2003], Ghemawat & Ghadar [2006], and Carr & Collins [2011].
9
also to the results with the average share. In fact, world export share is very stable over the period in
most of the used sample. Therefore, discussion here was based on the estimations with 5-year
average.
The sample size was 85, based on the availability of data. The sample industries are mostly of
4-digit level of Japan Standard Industrial Classification (JSIC).
Most of the independent variables are assumed to be predetermined or exogenous. But, as some
variables (mobility indices, R&D intensity, advertising intensity and merger dummy) cover the
period 2004 to 2008 as well, the estimation may involve the reverse causality problem. R&D
intensity and advertising intensity both do not vary much after 2000. And we assume, from statistical
constraint, that both mobility indexes and merger dummy also do not change over the period.
Therefore, the equation may be estimated as a single equation rather than as part of a simultaneous
equation system. The equation was estimated by ordinary least squares (OLS).
4. Variable explanation
Next, we will explain the definitions of the variables in turn.
(1) World export share ( )
This is an average of the ratio of Japanese exports to world total exports over 2004 to 2008. It was
computed based on the United Nation’s International Trade Statistical Yearbook.
(2) Concentration ( and )
Many existing studies suggest that, in industries with higher concentration, firms are likely to have a
greater market power through implicit or explicit collusion. The finding suggests market power
interpretation for two situations: the first “structural” relationship is that highly concentrated
industries are characterized with skewness in firm size distribution biasing for larger firms; the
second “behavioral” relationship implies that in those industries leading firms can take strategies of
giving smaller firms disadvantages. In those situations, leading firms can exercise market power. In
other words, in a highly-concentrated industry, leading firms can set prices at discretion and
collusively without fearing counterattack or reaction from smaller firms. Restricted competition may
induce less incentive of firms to improve competitiveness due to “quiet life.” Then, high
concentration is expected to be negatively related to world export share ( < 0).
But, concentration also, as suggested earlier, may have an export-promoting effect because of
oligopolistic strategic interaction. Then, concentration may be positively related to world export
share( > 0). In addition, the square of concentration was introduced to test for the inverted
U-shaped relationship: as concentration increases, the share rises until the critical level of
10
concentration, and beyond the level declines.
Thus, concentration involves the three possibilities: competitive, cooperative and mixed patterns.
It is difficult to predict the effect a-priori. We use two measures for concentration in 2003:
Herfindahl-Hirschman Index and 3-firm concentration ratio (based on production). These are made
from the Report by Enterprise, Census of Manufactures, compiled by the Ministry of Economy,
Trade and Industry (METI).
(3) Market mobility index ( , = 1, 2, 3, 4)
The intensity of competition may be captured not only by concentration, but also by firms’ changes
in market share. The changes in share and position consist of growth or decline of existing firms,
new entry, exit and mergers. In particular, strategic interaction is worth noting because a firm’s share
and position are affected by the actions of competitors, and the firm is aware of their impacts. The
situation may be captured by leading firms’ changes in share and position, which are called market
mobility.
So far several indicators for the market mobility have been suggested, but it is difficult to
determine theoretically and empirically the best indicator among them a-priori.6 We use the
following four market mobility indices.
1) Relative mobility index( )
Doi [2001] proposed the relative mobility index defined as
= ∑ | − | + ∑ + ∑∑ + ∑ × 12 ( + = + = 5)
where ( 1, ) is market share in year in which = 1 if it is the final year and = 0 if it is
the initial year of sample periods of a firm surviving through the sample periods (1994 to 2008),
is market share in the initial year of a firm that existed in the initial year but was not within
the top 5 in the final year, and is market share in the final year of a firm , which was not
within the top 5 in the initial year, but was within the top 5 in the final year. And, the denominator is
equivalent to cumulative concentration ratio of the 5 largest firms (5-firm concentration ratio) in the
initial year. The magnitude of the index means the equivalent of percentage of the initial total market
shares of top 5 firms that changed hands over the period.
6 For some alternative measures other than the indicators used here, see for example Baldwin [1995], Caves [1998], Kato &Honjo[2006] and recently Koster et al. [2013] as some representative studies.
11
2) Absolute instability index ( )
This measure is what Sakakibara and Porter [2001] used in their study. It is the sum of the absolute
value of changes in share between year and year − 1 (previous year) for the largest four firms
divided by number of firms in computation multiplied by sample periods minus one:
= ∑ ∑ , − ,×
where , is market share in year of a firm with rank over period 1995 to 2008; is 14, the
total year of observations; and is 4, the number of firms in the computation. This index shows an
average absolute change in market share for a firm par year in the sample periods.
3) Absolute share change ( )
Izumida et al. [2004] used squared, not absolute, values of changes in shares. This measure is the
sum of squared change in share of top 4 firms divided by − 1, where is the number of
observation years.
= ∑ ∑ , − ,− 1
4) Relative instability index ( )
This measure is the sum of the absolute value of changes in share between year and year − 1
(previous year) divided by share in previous year − 1 for the largest four firms, and then further
divided by × . It also was used in Sakakibara and Porter [2001].
= ∑ ∑ , − , ,×
where the variables are the same ones used for . This index is a relative measure of in
the sense that while indicates an average absolute change in market share of one firm par year,
indicates an absolute change in market share relative to previous year of one firm par year.
Thus, and are a measure of “absolute” change, while the remaining and
are a “relative” measure in which absolute change is normalized by individual share at a previous
year, or total share of relevant firms at an initial year. The above-mentioned examination suggests
that these indices all are expected be positively related to world export share ( > 0). Market
12
shares used to compute these indices are from Yano Research Institute’s Market Share in Japan over
1994 to 2008.
(4) Firm size ratio ( )
Major exporters in Japan are large firms, which account for a larger percent of aggregate exports
(Doi [1991]). The finding suggests that firm size may have an influence on exports. To take into
account this relation, size-related variable was introduced: the share of value of shipments by firms
with over 300 employees in an industry value of shipments in 2003.
But, it should be noted that the ratio is share of firms with over the critical size of employees, not
share of large firms. Firms with less than 300 employees are defined as “small and medium sized
enterprise” (SME) by the government. Therefore, the ratio is equivalent to market share of non-SME
firms. is expected to have a positive effect ( > 0).The data source is the Report by Enterprise,
Census of Manufacture.
(5) Export intensity ( ) and intra-industry trade ratio ( )
Firms are subject to competitive pressure from exposure to global markets. Then, larger international
competitive pressure may provide for firms larger competitiveness-improving incentives. The
presence of international competitive pressure was measured as proxy by export intensity and
intra-industry trade ratio.
These factors serve as degree of internationalization. Export intensity was measured by ratio of
exports to domestic output in 2003. Intra-industry trade ratio was introduced as indicator measuring
export competitiveness. The ratio is given by (exports-imports) / (exports + imports) in 2003, based
on the Updated Input-Output Table. Usually in international economics the numerator of is
defined as the absolute value of differences between exports and imports. But, because our purpose
for the use of is to measure export competitiveness and international competitive pressure, we
do not adopt the approach here, and the ratio takes values between one and minus one: one when
there is no import, zero when exports are equal to imports, and minus one when there is no export.
The closer it is to one, the higher the export competitiveness.
Also, these two ratios may be understood as reflecting international competitiveness because
they pick up the weight of exports in production and foreign trade, respectively. Then, there may be
a tautological relationship between world export share and these ratios.
(6) R&D intensity ( ) and advertising intensity ( )
Competitiveness may reflect the “specific advantage” of a firm. In particular, marketing and R&D
supports are frequently required for overseas operation because they are useful to adapt existing
products or processes, or to develop new products or production processes, and then to sell products
13
in foreign markets. is measured as a R&D expenditure as a proportion of output, and is
measured as an advertising expenditure as a proportion of output, which were both computed from
the Input-Output Table.
Thus, these variables are expected to have a positive relation to world export share ( >0, > 0).
(7) Processing intensity ( ) and capital intensity ( )
In Japan the vertical relation-specific “integral” production system and skills (“suri-awase” in
Japanese) - carriers of “codified knowledge” - have been emphasized as strength. This study
introduced processing intensity, i.e., value added / value of shipment as a surrogate for the intensity
of integral and skill system. Its data are from the Report by Industry, Census of Manufacture.
Also, capital-intensive production is likely to be highly efficient, which in turn leads to improved
competitiveness. It is captured by capital-labor ratio, of which the measure was fixed assets per
employee, similarly from the Report by Industry, Census of Manufacture.
These variables both are expected to have a positive relation to world export share ( > 0, >0).
(8) Domestic demand growth ( )
Exports may be affected by domestic demand growth. For example, with stagnant demand, firms
may have an incentive to export more to make up for falling domestic sales. But, the factor may have
an inverse relationship to exports. With expanding domestic demand, firms have an incentive to
improve efficiency or to innovate more to expand their shares in domestic markets, which leads to
larger competitive advantage in international markets. Therefore, the factor has no definite effect on
world export share ⋛ 0 .
Domestic demand growth was measured by the ratio of “apparent consumption” (output -
exports +imports) in 2008 to in 2003, from the Input-Output Table.
(9) Merger and cartel dummy variables( and )
Mergers and cartels may be related to the intensity of competition together with concentration and
mobility: they may induce restricted competition, leading to reduced competitiveness. The dummy
variables were used to account for “by market behavior” variations in cross-industry model. These
variables were introduced only for the subsamples due to limited availability of necessary
information.
is 1 for industry in which mergers took place during periods 1994-2008, and 0 otherwise,
and is 1 for industry in which illegal cartels took place during periods 1994–2003, and 0
14
otherwise.7 Those variables are based on Japan Fair Trade Commission’s Annual Reports of
Hearing Decisions (various years) and Yano Research Institute’s Market Share in Japan.
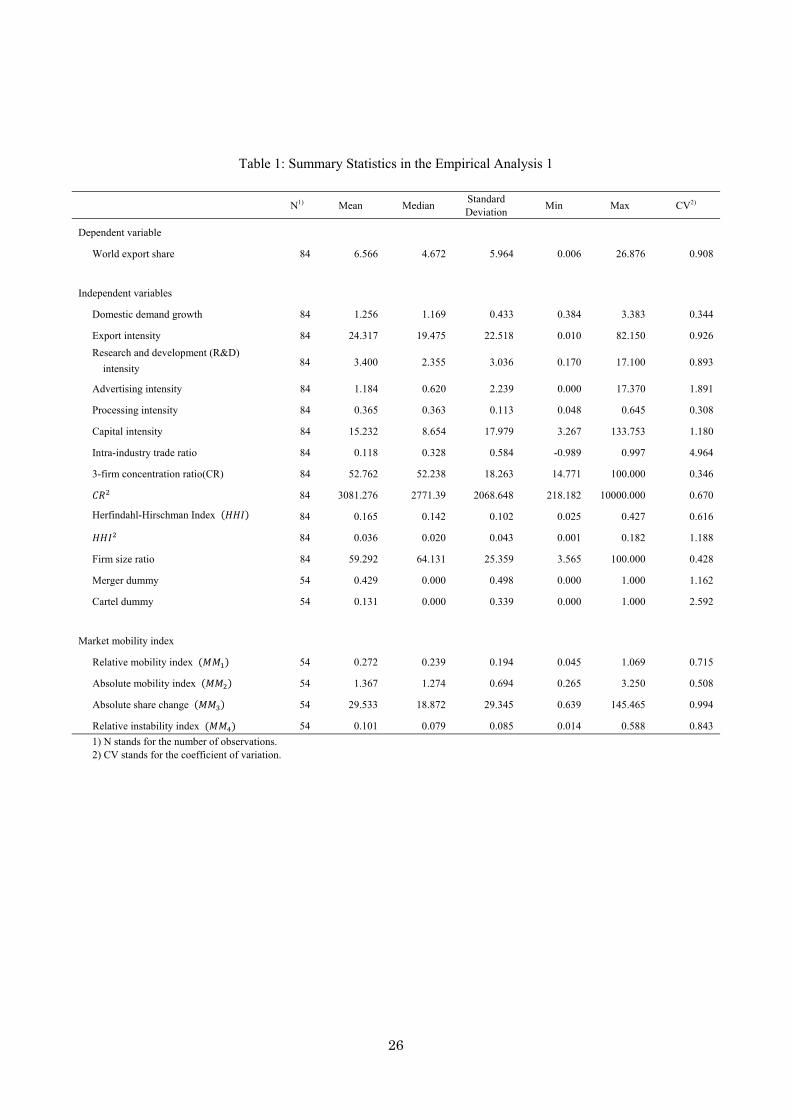
The above explanations of those used variables are summarized in Table A1 in Appendix, their
summary statistics are shown in Table 1, and Pearson correlations coefficients between the
independent variables are given in Table A2 in Appendix. Although we earlier suggested the
importance of world concentration, the factor is not included because unfortunately there is no
available large-scale statistics on world concentration ratio. World concentration ratio is available
only for some industries in Japan. In this paper, alternative approach was adopted later.
< Table 1 here>
5. Estimated Results
Now, we will show the regression results. The regression results for the full sample without mobility
index and the subsample with mobility index are reported in Tables 2 (the full sample without
mobility index) and 3 (the subsample with mobility index), respectively.8 We will discuss them in
turn.
This study includes many independent variables, which may cause multi-collinearity. We tested
for the problem using variance inflation factors (VIF) to eliminate the risk of suppressor effects in
multiple regression estimation. The VIF measures how much the variance of an estimated regression
coefficient increases due to collinearity. The computed VIF indices here range from 1.58 to 3.39,
which are sufficiently less than the usually used cutoff value of 10. Therefore, there is no serious
bias in the results. The VIFs are reported at the bottom of the Tables.
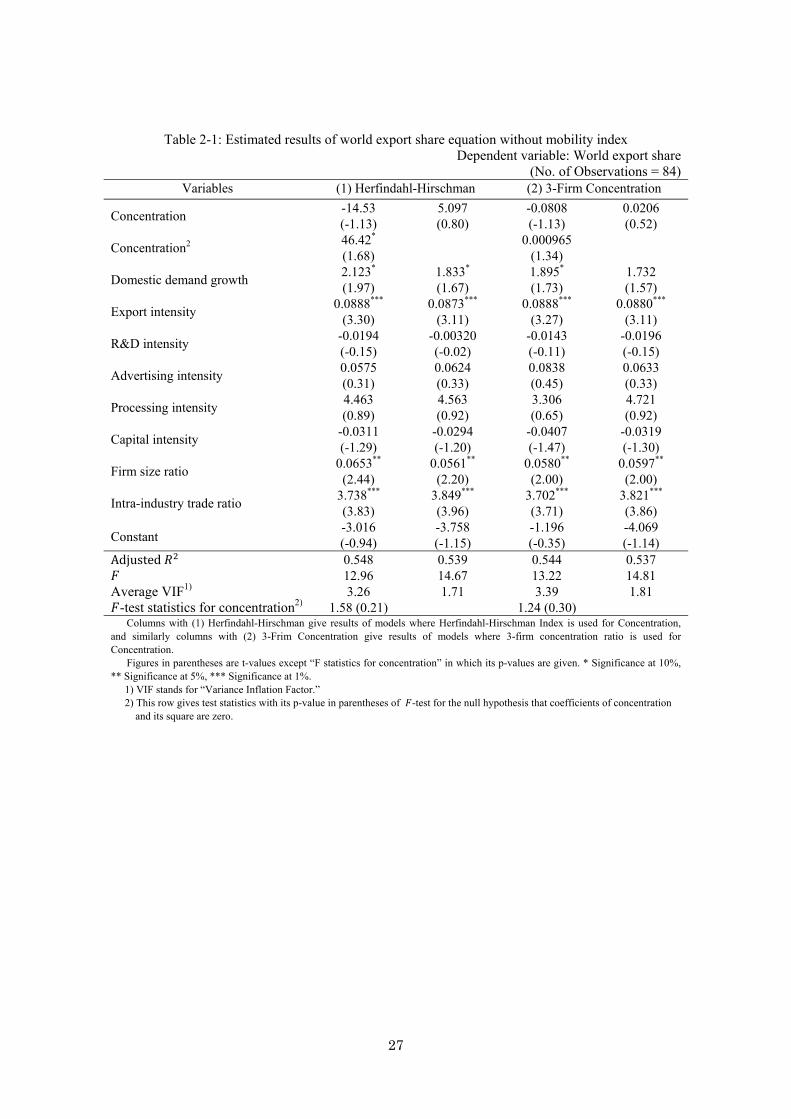
(1) Results from equations without mobility index
First, both Herfindahl-Hirschman Index ( ) and 3-firm concentration ( ) have a positive
sign and are not statistically significant, suggesting that concentration has no discernible effect on
world market share. This result is inconsistent with the argument prevailing in the business world
that higher concentration leads to greater international competitiveness captured by the share and
with the hypothesis that higher concentration impedes competiveness through restricted competition.
In addition, to test for the non-linear relationship between competitiveness and concentration, the
two measures’ squared terms were introduced to the empirical model. The squared (HHI2) has
7By illegal here, it means that cartels are discovered and cease and desist orders against them were issued by Japan Fair Trade Commission during the periods. 8 We need firm’s market share to compute mobility index, while or are available on Census of Manufactures. Because for some industries we do not have firm’s market share and thus mobility index, the sample size with mobility index is restricted to 54.
15
a positive and significant sign, while its linear term is not significant. The result suggests that the
world market share rises increasingly with . On the other hand, the linear and squared
(CR2) are both insignificant.
One of the possible explanations for the above results is that the sample involves some
“international oligopoly” industries such as tractor, automobile, automobile tires, sheet glass and
bearing (for example Carr and Collis [2011]). It is because if oligopolists in a Japanese industry are
responsible for a larger share in its oligopolistic international market as well, then the Japanese
industry is likely to have a larger world export share. In such case, there may be a positive
relationship between domestic concentration and world export share. This relation may have a
disturbing effect in this estimation. We should examine the explanation in more detail in future.
Second, firm size ratio ( ) is of a positive sign and statistically significant, and the effects are
stable and robust. Therefore, it is concluded that industries with higher share of large-sized firms
(with more than 300 employees) are likely to have larger competitive advantage. But, this finding
does not mean that larger firms have greater competitiveness.
Third, both export intensity ( ) and intra-industry trade ratio ( ) have a positive and
significant effect on world export share. Industries with higher export-related ratios may capture the
competitive pressures from foreign markets, which in turn lead firms to have higher incentives for
improving and strengthening competitiveness.
But, these variables may capture export competitiveness in themselves, suggesting the
tautological relation. Therefore, the results should be interpreted carefully.
Fourth, domestic demand growth ( ) has a positive sign, and is significant, though having
less significance in one equation. This result is rather against our a priori expectation because
industries with lower domestic demand growth may have the so-called “export-drive” incentive, and
are likely to prefer export activity in foreign markets. But, the implication from the finding is that as
in higher growth industries firms have more opportunities to expand shares and output in domestic
markets, they try to improve cost efficiency and to innovate more. The consequence is expanded
competitive advantage in international markets, which leads to a larger world export share. In other
words, industries with lower demand growth tend to have a weaker international competitiveness.
This interpretation seems to be consistent with the present economic condition.
Fifth, both R&D intensity ( ) and advertising intensity ( ) were introduced as a “specific
advantage”-driving exports. But, the both factors have no discernible effect on export behavior,
being inconsistent with our expectations. It is probably because the variables reflect domestic
behavior and do not always capture the relative advantage in international markets compared with
overseas.
Sixth, processing intensity ( ) has no definite effect on world export share, suggesting that
only processing innovation or Japan-specific value chain system has no sufficient competitive
16
advantage in international markets. Frequently user-oriented product innovations and improvements
are said to be more important than process innovations and improvements in overseas markets and in
particular in emerging markets. This result may be consistent with such argument.
Finally, capital intensity ( ) is of a negative sign and is insignificant. Therefore,
capital-intensive industries are not necessarily competitive.
<Table 2-1 around here>
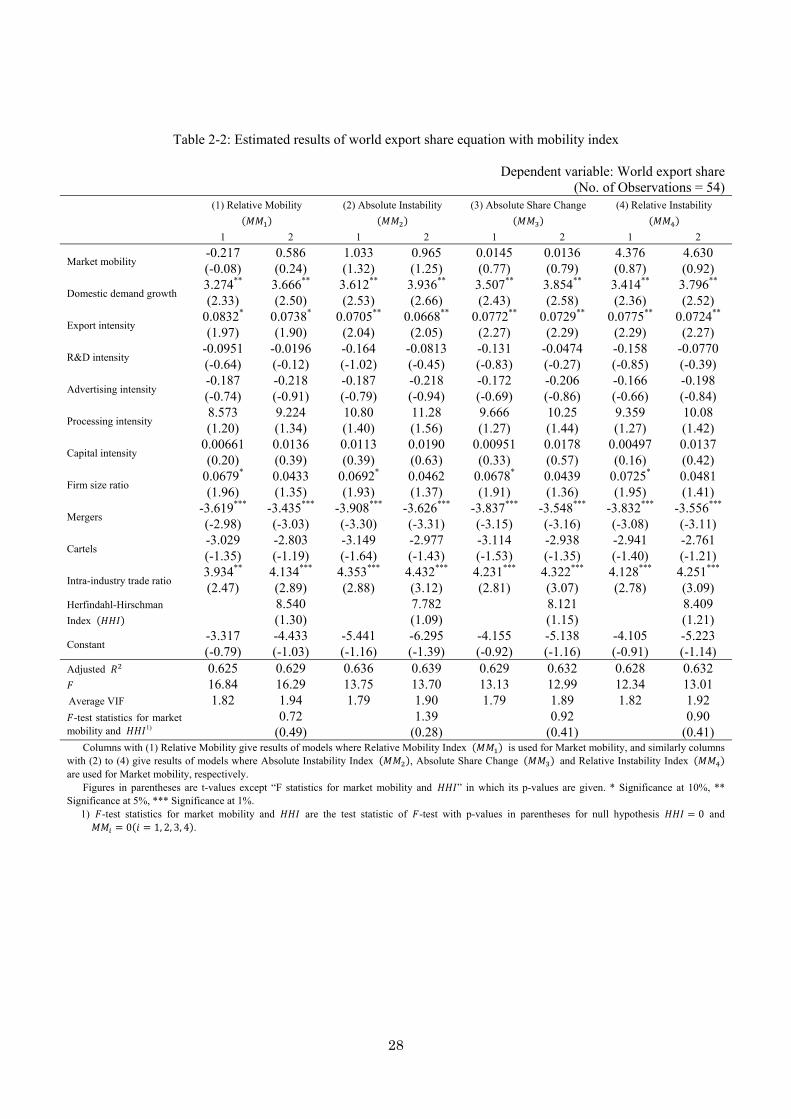
(2) Results from equations with mobility index: mobility subsamples
Next, the findings from equations with mobility index will be discussed following Table 2-2. The
available sample is limited to fifty-four industries due to the computability of mobility index.
First of all, all the four mobility indices ( , = 1, 2, 3, 4) have no statistical significance, with
variation in sign. This result is inconsistent with Sakakibara and Porter’s [2001] finding.
Second, among other competition-related factors, concentration ( ) has no discernible effect.
On the other hand, merger dummy ( ) has a negative and significant effect, suggesting that
industries with mergers tend to have lower share. This finding is worth being noted.
Third, firm size ratio ( ) , domestic demand growth ( ) , export intensity ( ) and
intra-industry trade ratio ( ) are all positively related to world export share, similarly to the
findings from equations without mobility index.
Fourth, R&D intensity ( ) and advertising intensity ( ) both have a negative sign and are
not significant, though significant in some models. The result about the advertising may suggest that
consumer goods industries have smaller world export share, because those industries tend to have a
larger advertising intensity. The result may reflect that in Japan producer goods have a larger
“comparative advantage” than consumer goods, because advertising intensity is likely to be larger in
consumer-goods industries than in producer-goods industries. Thus, the result does not statistically
support the hypotheses that in Japan R&D and advertising lead to larger specific advantage in
international markets.
Finally, processing intensity ( ) and capital intensity ( ) have both no significant and
robust result. The results are consistent with the previous estimations here.
<Table 2-2 around here>
IV. Empirical Analysis 2: Analysis of Foreign Sales Ratio
The second analysis is on the determinants of foreign sales ratio at a firm level. The first analysis, as
indicated earlier, does not include overseas production, which is likely to lead to underestimation of
17
overall overseas operations of an industry. But, unfortunately industry-level data of overseas
production is not available in Japan. To fill the gap, this study analyzes foreign sales ratio at a firm
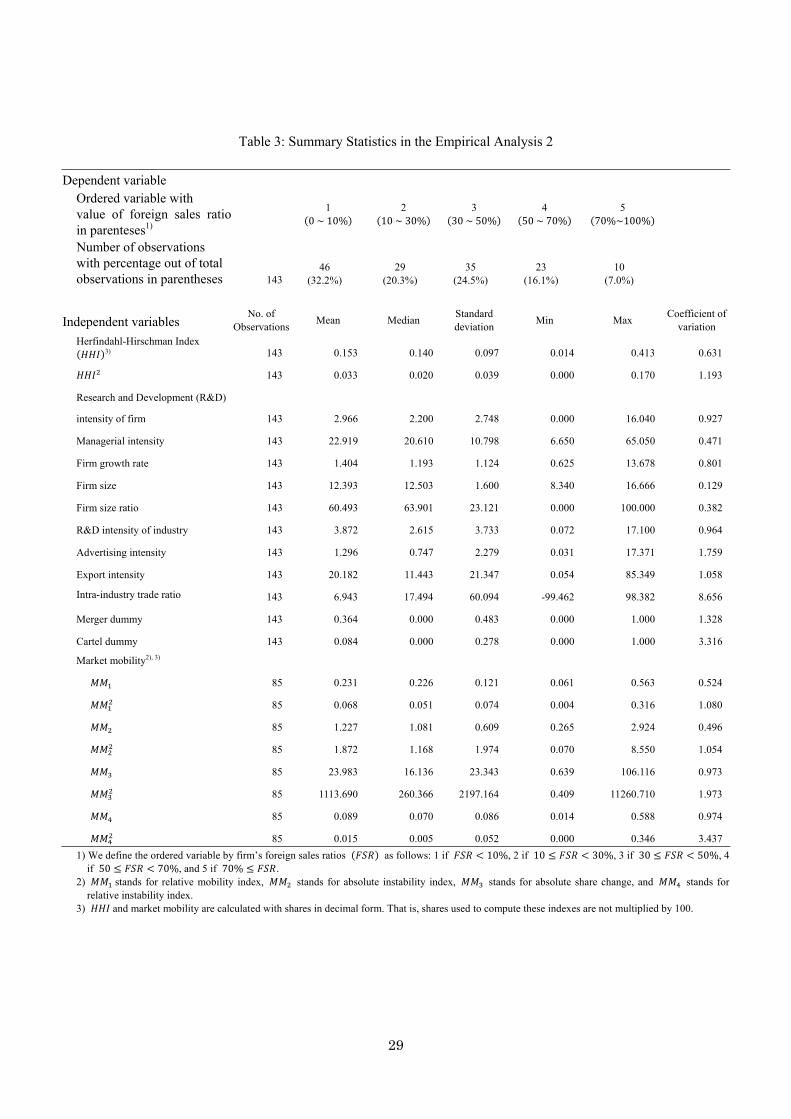
level. Table 3 shows the summary statistics of the data in the analysis of foreign sales ratio.
1. Indicator used
The used indicator is foreign sales as percentage of total sales of a firm. Foreign sales include sales
of foreign subsidiaries (net of internal transactions such as sales to parent companies) as well as
exports from Japan. The 5-year average over 2004 to 2008 was computed from the Annual Securities
Reports (consolidated base) of sample firms.
2. Prior studies
Foreign sales ratio at a firm level has not been examined except Grogaard et al. [2011]. The study
utilized three indicators as intensity of overseas operations in Norwegian large firms: foreign sales as
percentage of total sales, foreign employees as percentage of total employees, and the number of
foreign subsidiaries. The first indicator is the same as the foreign sales ratio used in this study.
There is no variation on the results among the three measures of overseas operation.
Concentration has no significant effect on overseas operations. On the other hand, R&D intensity has
a positive and significant effect, leading to the conclusion that technological advantages are likely to
contribute to international competitiveness. Also, firm size has a positive and significant effect.
Finally, the study interestingly suggests that diversification has a negative and significant effect.
Diversified firms are less interested in overseas operations.
3. Analytical design: estimated equation and sample
The inter-firm variations in foreign sales ratio (FSR) may be explained by the following linear-form
equation model:
= + × ( - ) + × ( - ) +
where the dependent variable is foreign sales ratio; the - include the
variables used for the analysis of world export share; the - are R&D intensity ( ), selling and administrative intensity ( ), firm growth rate ( ), and firm size ( );
and are the parameters to be estimated, and is the error term.
18
The equation was estimated for 143 firms without mobility index (the full sample), and for 85
firms with mobility indices (the mobility subsample). Smaller sample sizes for the latter analysis are
entirely due to availability of mobility indexes. Those sample firms were selected following a given
rule. The rule is that; 1) a firm is within the top 5 in an industry, and 2) its share of sales in a
particular industry in the whole sales (i.e., specialization ratio) is larger than 60 percent. When a firm
operates in multiple industries, combined specialization ratio was adopted which could capture total
share of sales of particular relevant industries in its whole sales.
4. Variable explanation
Now, we will explain the definitions of the variables in turn (summarized in Table A1 in Appendix).
Foreign sales ratio ( ) is as defined above, and is computed as average ratio over 2004 to 2008
from the Annual Securities Reports of sample firms. Following the accounting standard in Japan,
firms with foreign sales ratio of less than 10 percent are not forced to disclose foreign sales,
indicating only that their ratio is less than the critical line. In order to take into examination this
practice, based on the computed average ratio we define an ordered variable that takes a value of 1 to
5 in the following way: 1 for firms with < 10%, 2 for firms with 10 ≤ < 30%, 3 for
firms with 30 ≤ < 50%, 4 for firms with 50 ≤ < 70%, and 5 for firms with 70% ≤. Then, the ordered logit estimation was applied.
Next, - are the same ones used in the world export share analysis.
Therefore, the explanations are omitted here. But, we have a note: when a firm includes two and
more fields, average values of the relevant fields were used.
Turning to the - , firm R&D intensity ( ) is computed as R&D
expenditures / sales in 2003. Selling and administrative intensity (hereafter shortly called as
managerial intensity. ) is measured by selling and administrative expenditures as percentage of
sales in 2003. This factor was introduced for two reasons. First, as some firms do not publish
advertising expenditures, we use this variable as a proxy for advertising intensity. Second, the
variable may pick up its specific effects of “marketing and administrative capabilities” in a wider
way than advertising effects. Firm growth rate ( ) is defined as sales in 2008 / sales in 2003. And,
firm size is the logarithm of sales in 2003. These factors are made from the Annual Securities
Reports of sample firms.
Table 3 gives the summary statistics of the variables in the analysis, and Table A3 in Appendix
gives Pearson correlation coefficients between independent variables used here.
< Table 3 around here >
19
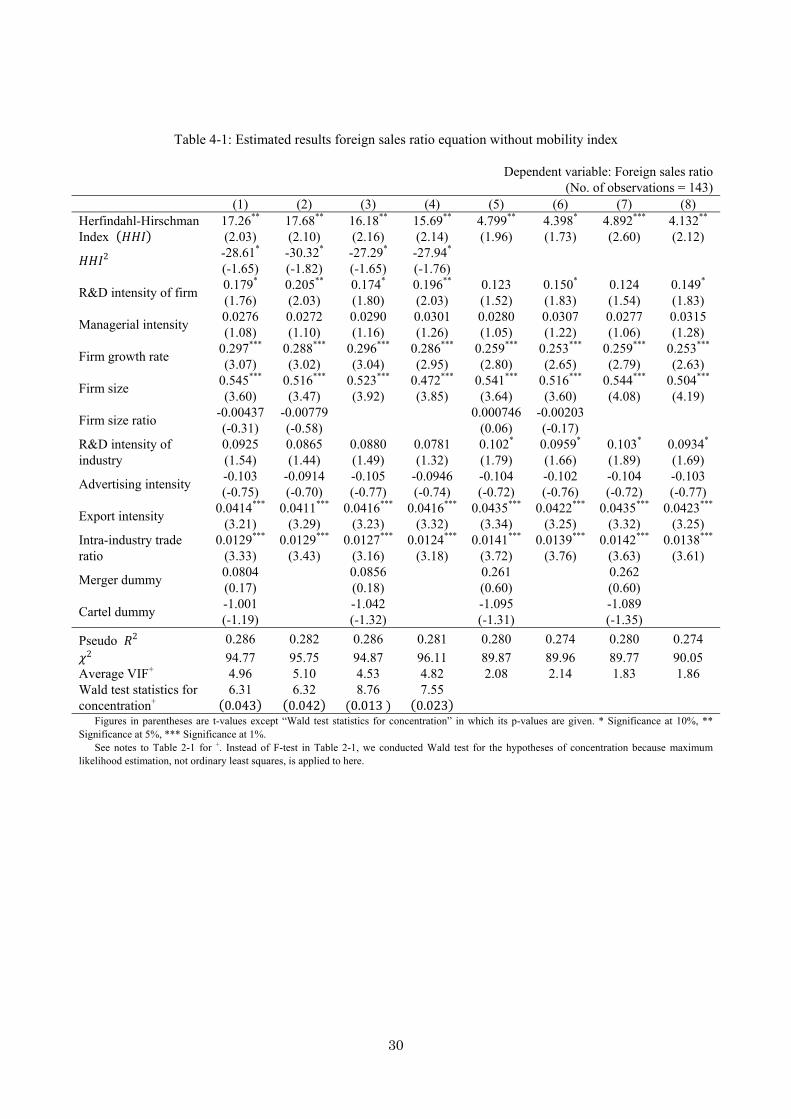
5. Estimated Results
Regressions are performed for both samples without mobility index (the full sample) and with
mobility index (the mobility subsample). Estimated results are shown in Table 4-1 for the former,
and in Table 4-2 for the latter.
(1) Results from equations without mobility index: the full sample analysis
First, we look at the effects of industry factors. Industry concentration ( ) has a positive and
significant effect in all the equations without the quadratic term of . This finding is consistent
with the results of existing studies. For example, Pugel [1978] finds that there is a positive
relationship between concentration and overseas production. The results with both and its
squared term show that has a positive and significant effect and squared has a negative
and significant effect. The latter association is of an inverted-U shape. That is, as concentration
increases, tends to increase until a critical level of , and then beyond the level starts to
fall. The results suggest that in highly-concentrated industries, overseas operations are likely to
decline at least relatively.
On the other hand, competition-related variables, such as firm size ratio ( ), merger dummy ( ) and cartel dummy ( ) all have no significant relation to .
Industry R&D intensity ( ) roughly has a positive and significant effect, with some
exceptions. Also, industry export ratio ( ) and intra-industry trade ratio ( ) both have a
positive sign and statistical significance. These results indicate that in industries with higher export
weight in production and trade, firms tend to have larger foreign sales ratio, being consistent with the
a-priori prediction. That is, those firms are likely to have larger overseas operations.
Next, concerning firm-level factors, firm growth rate ( ) and firm size ( ) have both a
positive and significant effect, and also R&D intensity ( ) roughly has a similar effect. But,
managerial intensity ( ) has no significant effect. This result is not in accordance with the
findings shown in many existing studies on MNEs (for example Pugel [1978]).
< Table 4-1 around here >
(2) Results from equations with mobility index: the mobility subsample
To examine the effects of market mobility on foreign sales, this study introduced four indicators
measuring the mobility, which were utilized in the above-mentioned world export share analysis as
well. Unfortunately due to availability of market shares of firms, the sample size is reduced to 85.
Four mobility indexes roughly have a similar effect on both sign and significance test. Significant
positive relationships were found for all the indexes. Therefore, mobility has a restrictive effect on
20
overseas operations, suggesting that in industries with fierce domestic competition, firms may
concentrate their activities on domestic markets rather than on foreign markets to strengthen their
home base as much as possible.
has a significant positive effect, depending on the mobility indexes used. The equations with
mobility indices and (of an “absolute” type) have statistical significance, while the
equations with and (of a “relative” type) do not. These results suggest that there may be
correlation between and indices and .
The industry export ratio has a positive significant relation to foreign sales ratio. This result is the
same as the finding in the results with the full sample. Also, intra-industry trade ratio has a similar
effect except the estimation for mobility index (equation 1).
But, almost all of the other industry-level variables have consistently the same sign but no
significant relation in all the models. The results suggest that they are not amongst the more
important influences on the internationalization of firms. Among them, the result of cartel dummy
should be noted because the variable has a negative sign in all equations, and is significant in some
equations, though being at a lower significance level. Also, the intra-industry trade ratio is
significant in all the models except ones with .
Next, concerning firm-level factors, R&D intensity has a positive and significant effect in
equations with mobility indices , and , but has only a lower significance level for
mobility index . Therefore, R&D-intensive firms have a larger internationalization activity.
Also, the effect of firm size similarly varies among mobility indices: the variable is positive and
significant in the equations with mobility indices , and , while it is insignificant
for . Although there is a little variation among equations, we can conclude that these results are
roughly in accordance with the ones from the full sample. These results raise the question of “which
one of mobility indexes serves as a better proxy for market mobility.”9
Firm growth rate and managerial intensity have a similar result in all equations, respectively. The
former has a positive and significant effect, and on the contrary the latter has no significance,
although being of a positive sign. These results also show the similar relation to the previous
estimation.
< Table 4-2 around here >
V. Concluding Remarks
In this paper, we have estimated the effects of domestic and international competitive pressures on
9 We are now examining the measurement of market dynamics for Japanese industries.
21
industry’s world export share and also on individual firms’ foreign sales ratio in Japanese
manufacturing industries. The two measures of overseas operations were captured as a proxy for
international industrial competitiveness. This section summarizes the findings and discusses their
policy implications.10
1. Analysis of world export share
First of all, concentration has no influence on world export share. This finding does not provide
empirical support for the argument, prevailing in business world, that a concentration-increasing
type of industrial reorganization is required for improving international or export competitiveness.
But, it is necessary to note that the intensity of competition is not sufficiently picked up by only
concentration. Market mobility which was introduced to take into account the problem has also no
discernible influence on world export share. Therefore, we could not find the relationship that
domestic competition had an impact on world market share.
On the other hand, it is noted that industries in which mergers took place have smaller world
export share, suggesting that mergers do not lead to improved competitiveness. This result is
consistent with the stylized fact, called the “merger paradox,” where mergers frequently have not
improved financial performance of the merged firms. The implication from this result also is that
industrial reorganization by mergers is not likely to induce improved competitiveness.
Also, international competitive pressures measured by export intensity and intra-industry trade
ratio have a significant positive relationship to world export share. Therefore, international
competitive pressures have an important role in international competitiveness.
Finally, the other main findings here are summarized as follows. Non-SMEs share and domestic
market growth have both an export-promoting effect. The former never mean that big mergers
between leading firms are desirable for competitiveness. Also, the effect of domestic demand growth
is worth to be noted because in Japan, as domestic demand growth became stagnant, firms have lost
international competitiveness as well. However, other factors have no effect.
2. Analysis of foreign sales ratio
First, concerning industry factors, concentration (i.e., ) has a positive relationship in both the
full sample and the mobility subsamples, with some exceptions in the mobility subsamples. These
facts are partly in line with the findings in existing works that show a positive relationship between
concentration and exports to sales ratio. Also, has a positive effect in all equations without
10 Table 5 summarizes our estimation.
22
squared , and and its squared term both have a positive and negative sign in all equations
with squared , respectively. The findings imply that the relationship is of an inverted-U shape
between and firm’s foreign sales ratio.
Market mobility, not in line with expectation, has all a negative and significant effect, regardless
of its types. The results suggest that with fierce domestic competition, firms tend to concentrate
more on domestic activities. As for mergers and cartels, while merger dummy has no definite effect,
cartel dummy is negative and significant in some equations in the subsamples.
Export intensity and the intra-industry trade ratio have both a significant and positive effect,
similar to the results of world export share analysis. However, other industry factors have no effect.
Next, concerning firm factors, firm growth, firm size, and R&D intensity, in accordance with
expectations, have a positive significant effect. But, managerial intensity has a positive sign, but is
not significant. This result is not amenable to sufficiently obvious explanation, but may reflect that
the managerial intensity picks up largely the activities in domestic markets, not in foreign markets.
Thus, we have not found robust and consistent results in the effects of competition factors on relative
foreign operations. But, the results are a fact finding from Japanese industries, which would reflect
Japan-specific relationships.
These results may be attributable to the following methodological problems as well. First, the
variables used in the analyses may suffer from the lack of adequate measurement of competitiveness
or internationalization. For example, they do not pick up competitive potential and financial
performance from internationalization. It is necessary to complementarily examine the dimensions of
the potential and performance. Also, it is necessary, as we emphasized earlier, to more explicitly
include overseas production.
Second, the intensity of competition should be measured by alternative indicators because these
used indicators do not always capture the intensity. Also, international competition and market
structure are amongst the determinants of internationalization. Consequently, it is necessary to
introduce direct measures, such as world market share and concentration.
Third, internationalization may inversely have an influence on mobility in domestic markets.
Therefore, such endogenous relationship also should be examined in a simultaneous system.
Finally, the estimated results vary depending on samples, suggesting that estimation is sensitive
to heterogeneity of sampled industries. As indicated above, international competitiveness or
internationalization of firms are likely to be affected by various factors other than the variables used
here. For example, in recent manufacturing, a greater role of business model is assigned to the
so-called “servicization,” that is, the service component of products based on the value for
consumers. The trend may have an influence on international competition and competitiveness. To
control for heterogeneity among firms and industries, other industry-specific effects should be taken
23
into examination: business model, industrial policy and comparative advantage of an industry.
These problems will be left to another study.
Note
The paper is based on a research project at Competition Policy Research Center (CPRC), Japan Fair
Trade Commission. But, CPRC does not always concur in the view we have expressed here. We are
indebted to Commissioner Hiroyuki Odagiri, Prof. Yosuke Okada, and participants at the CPRC
seminar. Also the financial support (Grants-in-Aids for Scientific Research) of the Japan Society for
the Promotion of Science (for Doi and Kato) is also greatly acknowledged.
24
Reference
Aghion, Philippe, Nick Bloom, Richard Blundell, Rachel Griffith, and Peter Howitt, 2005,
Competition and Innovation: An Inverted-U Relationship,” Quarterly Journal of Economics,
Vol.120, No.2, pp.701-728.
Baldwin, John R., 1995, The Dynamics of Industrial Competition: A North American Perspective,
Cambridge University Press.
Barney, Jay B. and Delwyn N. Clark, 2007, Resource-Based Theory: Creating and Sustaining
Competitive Advantage, Oxford University Press.
Carr, Chris and David Collins, 2011, “Should You Have a Global Strategy?” MIT Sloan Management
Review, Vol.53, No.1, pp.21-24.
Caves, Richard E., 1998, “Industrial Organization and New Findings on the Turnover and Mobility
of Firms,” Journal of Economic Literature, Vol.36, No.4, pp.1947-1982.
Desai, Mihir A., C. Fritz Foley and James R. Hines Jr., 2009, “Domestic Effects of the Foreign
Activities of US Multinationals,” American Economic Journal: Economic Policy, Vol.1, No.1,
pp.181-203.
Doi, Noriyuki, 1991, “Aggregate Export Concentration in Japan,” Journal of Industrial Economics,
Vol.39, No.4, pp.433-438.
Doi, Noriyuki, 2001, “Market Leadership Volatility in Japanese Industries,” Review of Industrial
Organization, Vol.18, No.4, pp.427-444.
Franko, Lawrence G., 2002, “Global Competition in the 1990s: American Renewal, Japanese
Resilience, European Cross-currents,” Business Horizons, Vol.45, Issue 3, pp.25-38.
Franko, Lawrence G., 2003, “Corporate Concentration and Turnover in Global Industries,
1960-2000,” Competition & Change, Vol.7, No.2-3, pp.163-184.
Ghemawat, Pankaj and Fariborz Ghadar, 2006, “Global Integration ≠ Global Concentration,”
Industrial and Corporate Change, Vol.15, No.4, pp.595-623.
Gorodnichinko, Yuriy, Jan Svejnar, and Katherine Terrell, 2010, “Globalization and innovation in
Emerging Markets,”American Economic Journal: Macroeconomics, Vol.2, No.2, pp.194-226.
Grogaard, Birgitte, Carmine Gioia, and Gabriel R.G. Benito, 2011, “An Empirical Investigation of
the Role of Industry Factors in the Internationalization Patterns of Firms,” International
Studies of Management and Organization, forthcoming.
Izumida, Shigemi,Makoto Funakoshi and Yoshihisa Takahashi,2004,“Economic Analysis on New
Market Structure Indicators and Competition,” Competition Policy Research Center, Japan
Fair Trade Commission (In Japanese).
Kato, Masatoshi and Yuji Honjo, 2006, “Market Share Instability and the Dynamics of Competition:
A Panel Data Analysis of Japanese Manufacturing Industries,” Review of Industrial
25
Organization, Vol.28, No.2, pp.165-182.
Knickerbocker, Frederick T., 1973, Oligopolistic Reaction and Multinational Enterprise, Graduate
School of Business Administration, Harvard University.
Kogut, Bruce, 1988, “Country Patterns in International Competition: Appropriability and
Oligopolistic Agreement,” in Hood, N. and J-E, Vahlne (eds.), Strategies in Global
Competition, Croom Helm, pp.315-340.
Koster, Sierdjan, André van Stel and Mickey Folkeringa, 2012, “Start-ups as Drivers of Market
Mobility: an Analysis at the Region-Sector Level for the Netherlands,” Small Business
Economics, Vol.39, No.3, pp.575-585.
Levenstein, Margaret C., Jagadeesh Sivadasan and Valerie Y. Suslow, 2011, “The Effect of
Competition on Trade Patterns: Evidence from the Collapse of International Cartels,”
Working Paper No.1147, Ross School of Business, University of Michigan.
Pagoulatos, Emilio, and Robert Sorensen, 1981, “Domestic Market Structure and International
Trade: An Empirical Analysis,” Quarterly Journal of Economics and Business, Vol.16, No.1,
pp.45-59.
Peneder, Michael and Martin Wörter, 2013, “Competition, R&D and Innovation: Testing the
Inverted-U in a Simultaneous System,” Austrian Institute of Economic Research, working
paper, No.448.
Pitelis, Christos N. and Roger Sugden (eds.), 1991, The Nature of the Transnational Firm,
Routledge.
Porter, Michael E., 1990, The Competitive Advantages of Nations, The Free Press.
Porter, Michael E., 2007, “Building the Microeconomic Foundations of Prosperity: Findings from
the Microeconomic Competitiveness Index,” in Global Competitiveness Report 2007-2008,
World Economic Forum, pp.51-81.
Porter, Michael E., 2008, On Competition: Updated and Expanded Edition, Harvard Business Press.
Pugel, Thomas A., 1978, International Market Linkages and U.S. Manufacturing, Ballinger.
Sakakibara, Mariko and Michael E. Porter, 2001, “Competing at Home to Win Abroad: Evidence
from Japanese Industry,” Review of Economics and Statistics, Vol.83, No.2, pp.310-322.
Scherer, Frederic M. and David Ross, 1990, Industrial Market Structure and Economic Performance,
3rd, Houghton Mifflin.
Spulber, Daniel F., 2007, Global Competitive Strategy, Cambridge University Press.
Vickers, John S., 1995, “Concepts of Competition,” Oxford Economic Papers, Vol.47, No.1, pp.1-23.
26
Table 1: Summary Statistics in the Empirical Analysis 1
N1) Mean Median Standard Deviation
Min Max CV2)
Dependent variable
World export share 84 6.566 4.672 5.964 0.006 26.876 0.908
Independent variables
Domestic demand growth 84 1.256 1.169 0.433 0.384 3.383 0.344
Export intensity 84 24.317 19.475 22.518 0.010 82.150 0.926
Research and development (R&D)
intensity 84 3.400 2.355 3.036 0.170 17.100 0.893
Advertising intensity 84 1.184 0.620 2.239 0.000 17.370 1.891
Processing intensity 84 0.365 0.363 0.113 0.048 0.645 0.308
Capital intensity 84 15.232 8.654 17.979 3.267 133.753 1.180
Intra-industry trade ratio 84 0.118 0.328 0.584 -0.989 0.997 4.964
3-firm concentration ratio(CR) 84 52.762 52.238 18.263 14.771 100.000 0.346
84 3081.276 2771.39 2068.648 218.182 10000.000 0.670
Herfindahl-Hirschman Index ( ) 84 0.165 0.142 0.102 0.025 0.427 0.616
84 0.036 0.020 0.043 0.001 0.182 1.188
Firm size ratio 84 59.292 64.131 25.359 3.565 100.000 0.428
Merger dummy 54 0.429 0.000 0.498 0.000 1.000 1.162
Cartel dummy 54 0.131 0.000 0.339 0.000 1.000 2.592
Market mobility index
Relative mobility index ( ) 54 0.272 0.239 0.194 0.045 1.069 0.715
Absolute mobility index ( ) 54 1.367 1.274 0.694 0.265 3.250 0.508
Absolute share change ( ) 54 29.533 18.872 29.345 0.639 145.465 0.994
Relative instability index ( ) 54 0.101 0.079 0.085 0.014 0.588 0.843
1) N stands for the number of observations. 2) CV stands for the coefficient of variation.
27
Table 2-1: Estimated results of world export share equation without mobility index Dependent variable: World export share
(No. of Observations = 84)Variables (1) Herfindahl-Hirschman (2) 3-Firm Concentration
Concentration -14.53 (-1.13)
5.097 (0.80)
-0.0808 (-1.13)
0.0206 (0.52)
Concentration2 46.42* (1.68)
0.000965 (1.34)
Domestic demand growth 2.123* (1.97)
1.833* (1.67)
1.895* (1.73)
1.732 (1.57)
Export intensity 0.0888***
(3.30) 0.0873***
(3.11) 0.0888***
(3.27) 0.0880***
(3.11)
R&D intensity -0.0194 (-0.15)
-0.00320 (-0.02)
-0.0143 (-0.11)
-0.0196 (-0.15)
Advertising intensity 0.0575 (0.31)
0.0624 (0.33)
0.0838 (0.45)
0.0633 (0.33)
Processing intensity 4.463 (0.89)
4.563 (0.92)
3.306 (0.65)
4.721 (0.92)
Capital intensity -0.0311 (-1.29)
-0.0294 (-1.20)
-0.0407 (-1.47)
-0.0319 (-1.30)
Firm size ratio 0.0653** (2.44)
0.0561** (2.20)
0.0580** (2.00)
0.0597** (2.00)
Intra-industry trade ratio 3.738*** (3.83)
3.849*** (3.96)
3.702*** (3.71)
3.821*** (3.86)
Constant -3.016 (-0.94)
-3.758 (-1.15)
-1.196 (-0.35)
-4.069 (-1.14) Adjusted 0.548 0.539 0.544 0.537
12.96 14.67 13.22 14.81 Average VIF1) 3.26 1.71 3.39 1.81
-test statistics for concentration2) 1.58 (0.21) 1.24 (0.30) Columns with (1) Herfindahl-Hirschman give results of models where Herfindahl-Hirschman Index is used for Concentration, and similarly columns with (2) 3-Frim Concentration give results of models where 3-firm concentration ratio is used for Concentration. Figures in parentheses are t-values except “F statistics for concentration” in which its p-values are given. * Significance at 10%, ** Significance at 5%, *** Significance at 1%.
1) VIF stands for “Variance Inflation Factor.” 2) This row gives test statistics with its p-value in parentheses of -test for the null hypothesis that coefficients of concentration
and its square are zero.
28
Table 2-2: Estimated results of world export share equation with mobility index
Dependent variable: World export share (No. of Observations = 54)
(1) Relative Mobility ( )
(2) Absolute Instability ( )
(3) Absolute Share Change ( )
(4) Relative Instability ( )
1 2 1 2 1 2 1 2
Market mobility -0.217 (-0.08)
0.586 (0.24)
1.033 (1.32)
0.965 (1.25)
0.0145 (0.77)
0.0136 (0.79)
4.376 (0.87)
4.630 (0.92)
Domestic demand growth 3.274** (2.33)
3.666** (2.50)
3.612** (2.53)
3.936** (2.66)
3.507** (2.43)
3.854** (2.58)
3.414** (2.36)
3.796** (2.52)
Export intensity 0.0832* (1.97)
0.0738* (1.90)
0.0705**
(2.04) 0.0668**
(2.05) 0.0772**
(2.27) 0.0729** (2.29)
0.0775** (2.29)
0.0724**
(2.27)
R&D intensity -0.0951 (-0.64)
-0.0196 (-0.12)
-0.164 (-1.02)
-0.0813 (-0.45)
-0.131 (-0.83)
-0.0474 (-0.27)
-0.158 (-0.85)
-0.0770 (-0.39)
Advertising intensity -0.187 (-0.74)
-0.218 (-0.91)
-0.187 (-0.79)
-0.218 (-0.94)
-0.172 (-0.69)
-0.206 (-0.86)
-0.166 (-0.66)
-0.198 (-0.84)
Processing intensity 8.573 (1.20)
9.224 (1.34)
10.80 (1.40)
11.28 (1.56)
9.666 (1.27)
10.25 (1.44)
9.359 (1.27)
10.08 (1.42)
Capital intensity 0.00661 (0.20)
0.0136 (0.39)
0.0113 (0.39)
0.0190 (0.63)
0.00951 (0.33)
0.0178 (0.57)
0.00497 (0.16)
0.0137 (0.42)
Firm size ratio 0.0679* (1.96)
0.0433 (1.35)
0.0692* (1.93)
0.0462 (1.37)
0.0678* (1.91)
0.0439 (1.36)
0.0725* (1.95)
0.0481 (1.41)
Mergers -3.619*** (-2.98)
-3.435*** (-3.03)
-3.908***
(-3.30) -3.626***
(-3.31) -3.837***
(-3.15) -3.548*** (-3.16)
-3.832***
(-3.08) -3.556***
(-3.11)
Cartels -3.029 (-1.35)
-2.803 (-1.19)
-3.149 (-1.64)
-2.977 (-1.43)
-3.114 (-1.53)
-2.938 (-1.35)
-2.941 (-1.40)
-2.761 (-1.21)
Intra-industry trade ratio 3.934** (2.47)
4.134*** (2.89)
4.353*** (2.88)
4.432*** (3.12)
4.231*** (2.81)
4.322*** (3.07)
4.128*** (2.78)
4.251*** (3.09)
Herfindahl-Hirschman
Index ( )
8.540 (1.30)
7.782 (1.09)
8.121 (1.15)
8.409 (1.21)
Constant -3.317 (-0.79)
-4.433 (-1.03)
-5.441 (-1.16)
-6.295 (-1.39)
-4.155 (-0.92)
-5.138 (-1.16)
-4.105 (-0.91)
-5.223 (-1.14)
Adjusted 0.625 0.629 0.636 0.639 0.629 0.632 0.628 0.632 16.84 16.29 13.75 13.70 13.13 12.99 12.34 13.01
Average VIF 1.82 1.94 1.79 1.90 1.79 1.89 1.82 1.92 -test statistics for market
mobility and 1) 0.72
(0.49)
1.39 (0.28)
0.92
(0.41)
0.90 (0.41)
Columns with (1) Relative Mobility give results of models where Relative Mobility Index ( ) is used for Market mobility, and similarly columns with (2) to (4) give results of models where Absolute Instability Index ( ), Absolute Share Change ( ) and Relative Instability Index ( ) are used for Market mobility, respectively. Figures in parentheses are t-values except “F statistics for market mobility and ” in which its p-values are given. * Significance at 10%, ** Significance at 5%, *** Significance at 1%.
1) -test statistics for market mobility and are the test statistic of -test with p-values in parentheses for null hypothesis = 0 and = 0( = 1, 2, 3, 4).
29
Table 3: Summary Statistics in the Empirical Analysis 2
Dependent variable Ordered variable with value of foreign sales ratio in parenteses1)
1 (0 ~ 10%) 2 (10 ~ 30%)
3 (30 ~ 50%) 4 (50 ~ 70%) 5 (70%~100%)
Number of observations with percentage out of total observations in parentheses 143
46 (32.2%)
29 (20.3%)
35 (24.5%)
23 (16.1%)
10 (7.0%)
Independent variables No. of
Observations Mean Median
Standard deviation
Min Max Coefficient of
variation Herfindahl-Hirschman Index ( )3) 143 0.153 0.140 0.097 0.014 0.413 0.631
143 0.033 0.020 0.039 0.000 0.170 1.193
Research and Development (R&D)
intensity of firm 143 2.966 2.200 2.748 0.000 16.040 0.927
Managerial intensity 143 22.919 20.610 10.798 6.650 65.050 0.471
Firm growth rate 143 1.404 1.193 1.124 0.625 13.678 0.801
Firm size 143 12.393 12.503 1.600 8.340 16.666 0.129
Firm size ratio 143 60.493 63.901 23.121 0.000 100.000 0.382
R&D intensity of industry 143 3.872 2.615 3.733 0.072 17.100 0.964
Advertising intensity 143 1.296 0.747 2.279 0.031 17.371 1.759
Export intensity 143 20.182 11.443 21.347 0.054 85.349 1.058
Intra-industry trade ratio 143 6.943 17.494 60.094 -99.462 98.382 8.656
Merger dummy 143 0.364 0.000 0.483 0.000 1.000 1.328
Cartel dummy 143 0.084 0.000 0.278 0.000 1.000 3.316
Market mobility2), 3)
85 0.231 0.226 0.121 0.061 0.563 0.524
85 0.068 0.051 0.074 0.004 0.316 1.080
85 1.227 1.081 0.609 0.265 2.924 0.496
85 1.872 1.168 1.974 0.070 8.550 1.054
85 23.983 16.136 23.343 0.639 106.116 0.973
85 1113.690 260.366 2197.164 0.409 11260.710 1.973
85 0.089 0.070 0.086 0.014 0.588 0.974
85 0.015 0.005 0.052 0.000 0.346 3.437
1) We define the ordered variable by firm’s foreign sales ratios ( ) as follows: 1 if < 10%, 2 if 10 ≤ < 30%, 3 if 30 ≤ < 50%, 4 if 50 ≤ < 70%, and 5 if 70% ≤ .
2) stands for relative mobility index, stands for absolute instability index, stands for absolute share change, and stands for relative instability index.
3) and market mobility are calculated with shares in decimal form. That is, shares used to compute these indexes are not multiplied by 100.
30
Table 4-1: Estimated results foreign sales ratio equation without mobility index
Dependent variable: Foreign sales ratio(No. of observations = 143)
(1) (2) (3) (4) (5) (6) (7) (8) Herfindahl-Hirschman Index ( )
17.26** (2.03)
17.68** (2.10)
16.18** (2.16)
15.69** (2.14)
4.799** (1.96)
4.398* (1.73)
4.892*** (2.60)
4.132** (2.12) 2
-28.61* (-1.65)
-30.32* (-1.82)
-27.29* (-1.65)
-27.94* (-1.76)
R&D intensity of firm 0.179* (1.76)
0.205** (2.03)
0.174* (1.80)
0.196** (2.03)
0.123 (1.52)
0.150* (1.83)
0.124 (1.54)
0.149* (1.83)
Managerial intensity 0.0276 (1.08)
0.0272 (1.10)
0.0290 (1.16)
0.0301 (1.26)
0.0280 (1.05)
0.0307 (1.22)
0.0277 (1.06)
0.0315 (1.28)
Firm growth rate 0.297*** (3.07)
0.288*** (3.02)
0.296***
(3.04) 0.286***
(2.95) 0.259***
(2.80) 0.253*** (2.65)
0.259*** (2.79)
0.253***
(2.63)
Firm size 0.545*** (3.60)
0.516*** (3.47)
0.523***
(3.92) 0.472***
(3.85) 0.541***
(3.64) 0.516*** (3.60)
0.544*** (4.08)
0.504***
(4.19)
Firm size ratio -0.00437 (-0.31)
-0.00779(-0.58)
0.000746(0.06)
-0.00203 (-0.17)
R&D intensity of industry
0.0925 (1.54)
0.0865 (1.44)
0.0880 (1.49)
0.0781 (1.32)
0.102* (1.79)
0.0959* (1.66)
0.103* (1.89)
0.0934*
(1.69)
Advertising intensity -0.103 (-0.75)
-0.0914 (-0.70)
-0.105 (-0.77)
-0.0946(-0.74)
-0.104 (-0.72)
-0.102 (-0.76)
-0.104 (-0.72)
-0.103 (-0.77)
Export intensity 0.0414***
(3.21) 0.0411***
(3.29) 0.0416***
(3.23) 0.0416***
(3.32) 0.0435***
(3.34) 0.0422***
(3.25) 0.0435***
(3.32) 0.0423***
(3.25) Intra-industry trade ratio
0.0129*** (3.33)
0.0129***
(3.43) 0.0127***
(3.16) 0.0124***
(3.18) 0.0141***
(3.72) 0.0139***
(3.76) 0.0142***
(3.63) 0.0138***
(3.61)
Merger dummy 0.0804 (0.17)
0.0856 (0.18)
0.261 (0.60)
0.262 (0.60)
Cartel dummy -1.001 (-1.19)
-1.042 (-1.32)
-1.095 (-1.31)
-1.089 (-1.35)
Pseudo 2 0.286 0.282 0.286 0.281 0.280 0.274 0.280 0.274 2 94.77 95.75 94.87 96.11 89.87 89.96 89.77 90.05 Average VIF+ 4.96 5.10 4.53 4.82 2.08 2.14 1.83 1.86 Wald test statistics for concentration+
6.31 (0.043) 6.32 (0.042)
8.76 (0.013 ) 7.55 (0.023)
Figures in parentheses are t-values except “Wald test statistics for concentration” in which its p-values are given. * Significance at 10%, ** Significance at 5%, *** Significance at 1%. See notes to Table 2-1 for +. Instead of F-test in Table 2-1, we conducted Wald test for the hypotheses of concentration because maximum likelihood estimation, not ordinary least squares, is applied to here.
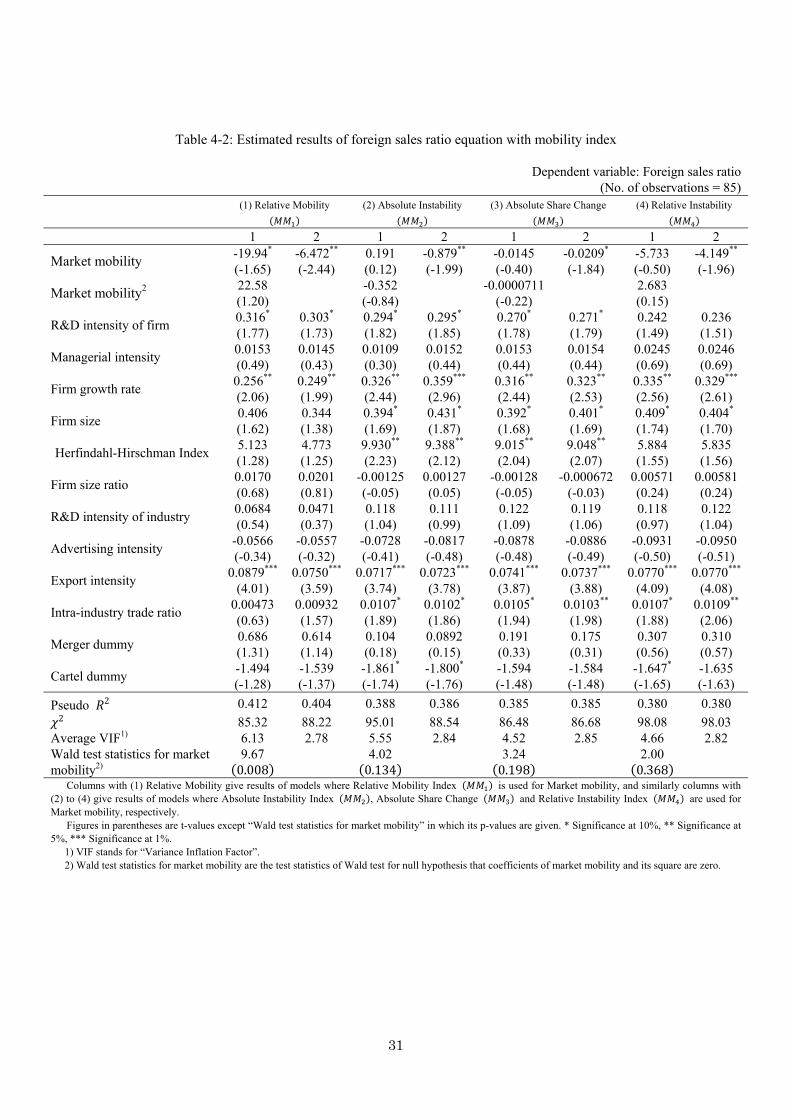
31
Table 4-2: Estimated results of foreign sales ratio equation with mobility index
Dependent variable: Foreign sales ratio(No. of observations = 85)
(1) Relative Mobility ( )
(2) Absolute Instability ( )
(3) Absolute Share Change ( )
(4) Relative Instability ( )
1 2 1 2 1 2 1 2
Market mobility -19.94* (-1.65)
-6.472**
(-2.44) 0.191 (0.12)
-0.879**
(-1.99) -0.0145 (-0.40)
-0.0209* (-1.84)
-5.733 (-0.50)
-4.149**
(-1.96)
Market mobility2 22.58 (1.20)
-0.352 (-0.84)
-0.0000711(-0.22)
2.683 (0.15)
R&D intensity of firm 0.316* (1.77)
0.303* (1.73)
0.294* (1.82)
0.295* (1.85)
0.270* (1.78)
0.271* (1.79)
0.242 (1.49)
0.236 (1.51)
Managerial intensity 0.0153 (0.49)
0.0145 (0.43)
0.0109 (0.30)
0.0152 (0.44)
0.0153 (0.44)
0.0154 (0.44)
0.0245 (0.69)
0.0246 (0.69)
Firm growth rate 0.256** (2.06)
0.249** (1.99)
0.326** (2.44)
0.359***
(2.96) 0.316** (2.44)
0.323** (2.53)
0.335** (2.56)
0.329***
(2.61)
Firm size 0.406 (1.62)
0.344 (1.38)
0.394* (1.69)
0.431* (1.87)
0.392* (1.68)
0.401* (1.69)
0.409* (1.74)
0.404* (1.70)
Herfindahl-Hirschman Index 5.123 (1.28)
4.773 (1.25)
9.930** (2.23)
9.388** (2.12)
9.015** (2.04)
9.048** (2.07)
5.884 (1.55)
5.835 (1.56)
Firm size ratio 0.0170 (0.68)
0.0201 (0.81)
-0.00125(-0.05)
0.00127(0.05)
-0.00128 (-0.05)
-0.000672 (-0.03)
0.00571(0.24)
0.00581(0.24)
R&D intensity of industry 0.0684 (0.54)
0.0471 (0.37)
0.118 (1.04)
0.111 (0.99)
0.122 (1.09)
0.119 (1.06)
0.118 (0.97)
0.122 (1.04)
Advertising intensity -0.0566 (-0.34)
-0.0557(-0.32)
-0.0728(-0.41)
-0.0817(-0.48)
-0.0878 (-0.48)
-0.0886 (-0.49)
-0.0931(-0.50)
-0.0950(-0.51)
Export intensity 0.0879***
(4.01) 0.0750***
(3.59) 0.0717***
(3.74) 0.0723***
(3.78) 0.0741***
(3.87) 0.0737***
(3.88) 0.0770***
(4.09) 0.0770***
(4.08)
Intra-industry trade ratio 0.00473 (0.63)
0.00932(1.57)
0.0107*
(1.89) 0.0102*
(1.86) 0.0105* (1.94)
0.0103** (1.98)
0.0107*
(1.88) 0.0109**
(2.06)
Merger dummy 0.686 (1.31)
0.614 (1.14)
0.104 (0.18)
0.0892 (0.15)
0.191 (0.33)
0.175 (0.31)
0.307 (0.56)
0.310 (0.57)
Cartel dummy -1.494 (-1.28)
-1.539 (-1.37)
-1.861* (-1.74)
-1.800* (-1.76)
-1.594 (-1.48)
-1.584 (-1.48)
-1.647* (-1.65)
-1.635 (-1.63)
Pseudo 2 0.412 0.404 0.388 0.386 0.385 0.385 0.380 0.380 2 85.32 88.22 95.01 88.54 86.48 86.68 98.08 98.03 Average VIF1) 6.13 2.78 5.55 2.84 4.52 2.85 4.66 2.82 Wald test statistics for market mobility2)
9.67 (0.008) 4.02 (0.134) 3.24 (0.198)
2.00 (0.368)
Columns with (1) Relative Mobility give results of models where Relative Mobility Index ( ) is used for Market mobility, and similarly columns with (2) to (4) give results of models where Absolute Instability Index ( ), Absolute Share Change ( ) and Relative Instability Index ( ) are used for Market mobility, respectively. Figures in parentheses are t-values except “Wald test statistics for market mobility” in which its p-values are given. * Significance at 10%, ** Significance at 5%, *** Significance at 1%.
1) VIF stands for “Variance Inflation Factor”. 2) Wald test statistics for market mobility are the test statistics of Wald test for null hypothesis that coefficients of market mobility and its square are zero.
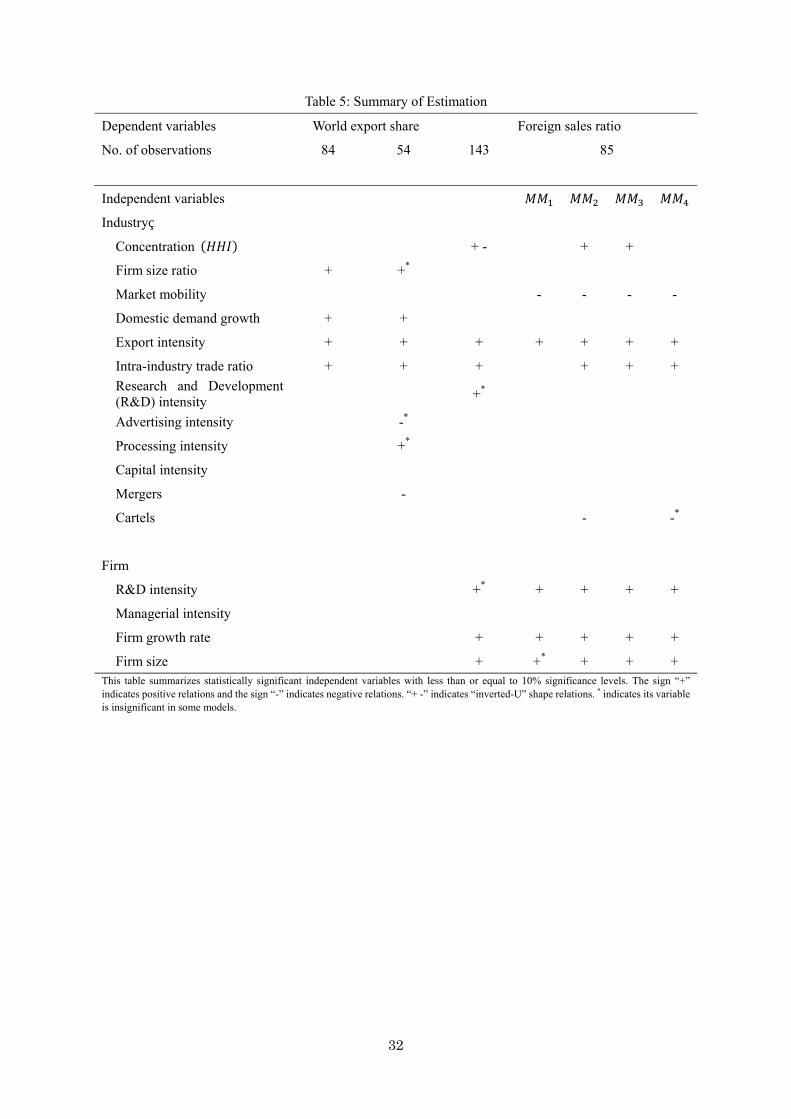
32
Table 5: Summary of Estimation
Dependent variables World export share Foreign sales ratio
No. of observations 84 54 143 85
Independent variables
Industry
Concentration ( ) + - + +
Firm size ratio + +*
Market mobility - - - -
Domestic demand growth + +
Export intensity + + + + + + +
Intra-industry trade ratio + + + + + +
Research and Development (R&D) intensity
+*
Advertising intensity -*
Processing intensity +*
Capital intensity
Mergers -
Cartels - -*
Firm
R&D intensity +* + + + +
Managerial intensity
Firm growth rate + + + + +
Firm size + +* + + + This table summarizes statistically significant independent variables with less than or equal to 10% significance levels. The sign “+” indicates positive relations and the sign “-” indicates negative relations. “+ -” indicates “inverted-U” shape relations. * indicates its variable is insignificant in some models.
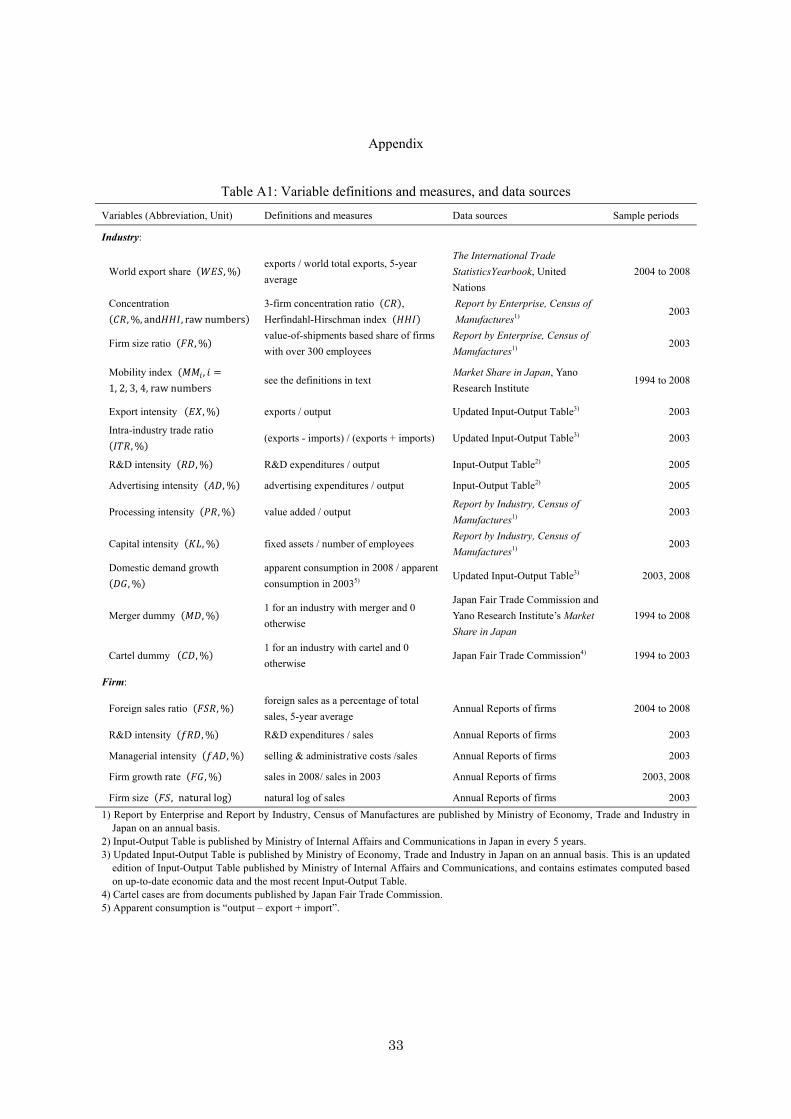
33
Appendix
Table A1: Variable definitions and measures, and data sources
Variables (Abbreviation, Unit) Definitions and measures Data sources Sample periods
Industry:
World export share ( , %) exports / world total exports, 5-year
average
The International Trade
StatisticsYearbook, United
Nations
2004 to 2008
Concentration ( , %, and , raw numbers)
3-firm concentration ratio ( ),
Herfindahl-Hirschman index ( )
Report by Enterprise, Census of
Manufactures1) 2003
Firm size ratio ( , %) value-of-shipments based share of firms
with over 300 employees
Report by Enterprise, Census of
Manufactures1) 2003
Mobility index ( , =1, 2, 3, 4, raw numbers see the definitions in text
Market Share in Japan, Yano
Research Institute 1994 to 2008
Export intensity ( , %) exports / output Updated Input-Output Table3) 2003
Intra-industry trade ratio ( , %) (exports - imports) / (exports + imports) Updated Input-Output Table3) 2003
R&D intensity ( , %) R&D expenditures / output Input-Output Table2) 2005
Advertising intensity ( , %) advertising expenditures / output Input-Output Table2) 2005
Processing intensity ( , %) value added / output Report by Industry, Census of
Manufactures1) 2003
Capital intensity ( , %) fixed assets / number of employees Report by Industry, Census of
Manufactures1) 2003
Domestic demand growth ( , %)
apparent consumption in 2008 / apparent
consumption in 20035) Updated Input-Output Table3) 2003, 2008
Merger dummy ( , %) 1 for an industry with merger and 0
otherwise
Japan Fair Trade Commission and
Yano Research Institute’s Market
Share in Japan
1994 to 2008
Cartel dummy ( , %) 1 for an industry with cartel and 0
otherwise Japan Fair Trade Commission4) 1994 to 2003
Firm:
Foreign sales ratio ( , %) foreign sales as a percentage of total
sales, 5-year average Annual Reports of firms 2004 to 2008
R&D intensity ( , %) R&D expenditures / sales Annual Reports of firms 2003
Managerial intensity ( , %) selling & administrative costs /sales Annual Reports of firms 2003
Firm growth rate ( , %) sales in 2008/ sales in 2003 Annual Reports of firms 2003, 2008
Firm size ( , natural log) natural log of sales Annual Reports of firms 2003
1) Report by Enterprise and Report by Industry, Census of Manufactures are published by Ministry of Economy, Trade and Industry in Japan on an annual basis.
2) Input-Output Table is published by Ministry of Internal Affairs and Communications in Japan in every 5 years. 3) Updated Input-Output Table is published by Ministry of Economy, Trade and Industry in Japan on an annual basis. This is an updated
edition of Input-Output Table published by Ministry of Internal Affairs and Communications, and contains estimates computed based on up-to-date economic data and the most recent Input-Output Table.
4) Cartel cases are from documents published by Japan Fair Trade Commission. 5) Apparent consumption is “output – export + import”.
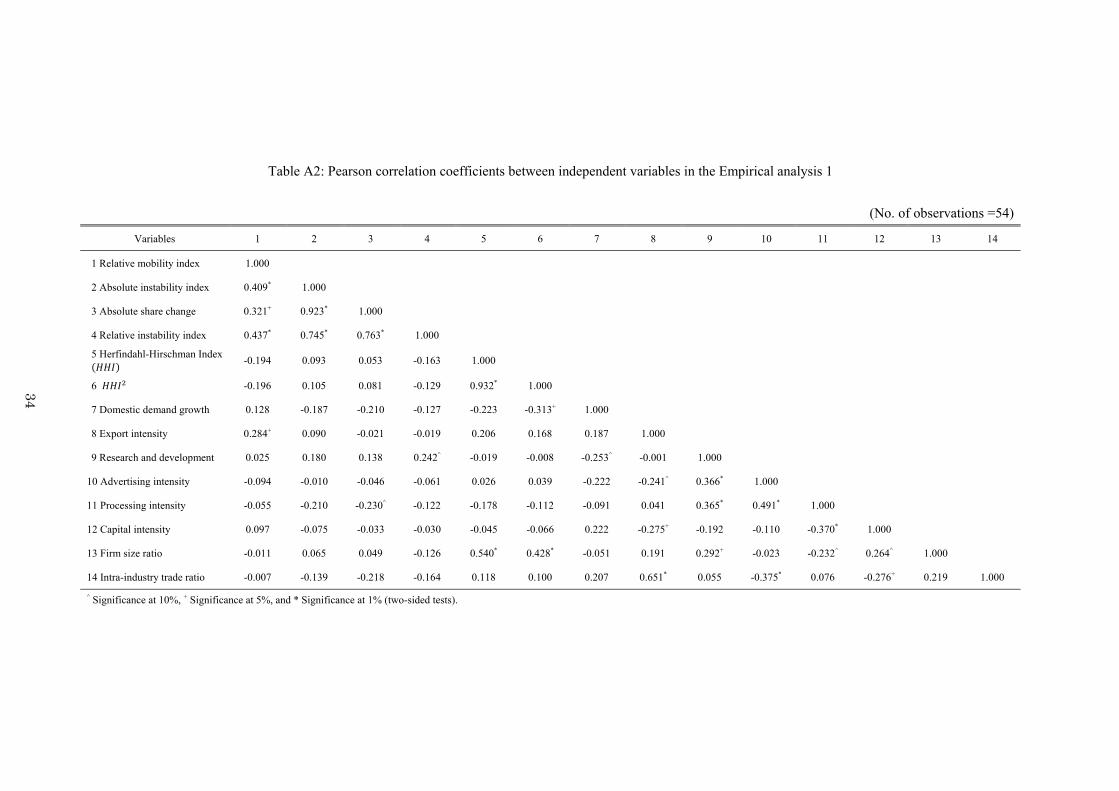
34
Table A2: Pearson correlation coefficients between independent variables in the Empirical analysis 1
(No. of observations =54)
Variables 1 2 3 4 5 6 7 8 9 10 11 12 13 14
1 Relative mobility index 1.000
2 Absolute instability index 0.409* 1.000
3 Absolute share change 0.321+ 0.923* 1.000
4 Relative instability index 0.437* 0.745* 0.763* 1.000
5 Herfindahl-Hirschman Index ( ) -0.194 0.093 0.053 -0.163 1.000
6 -0.196 0.105 0.081 -0.129 0.932* 1.000
7 Domestic demand growth 0.128 -0.187 -0.210 -0.127 -0.223 -0.313+ 1.000
8 Export intensity 0.284+ 0.090 -0.021 -0.019 0.206 0.168 0.187 1.000
9 Research and development 0.025 0.180 0.138 0.242^ -0.019 -0.008 -0.253^ -0.001 1.000
10 Advertising intensity -0.094 -0.010 -0.046 -0.061 0.026 0.039 -0.222 -0.241^ 0.366* 1.000
11 Processing intensity -0.055 -0.210 -0.230^ -0.122 -0.178 -0.112 -0.091 0.041 0.365* 0.491* 1.000
12 Capital intensity 0.097 -0.075 -0.033 -0.030 -0.045 -0.066 0.222 -0.275+ -0.192 -0.110 -0.370* 1.000
13 Firm size ratio -0.011 0.065 0.049 -0.126 0.540* 0.428* -0.051 0.191 0.292+ -0.023 -0.232^ 0.264^ 1.000
14 Intra-industry trade ratio -0.007 -0.139 -0.218 -0.164 0.118 0.100 0.207 0.651* 0.055 -0.375* 0.076 -0.276+ 0.219 1.000
^ Significance at 10%, + Significance at 5%, and * Significance at 1% (two-sided tests).
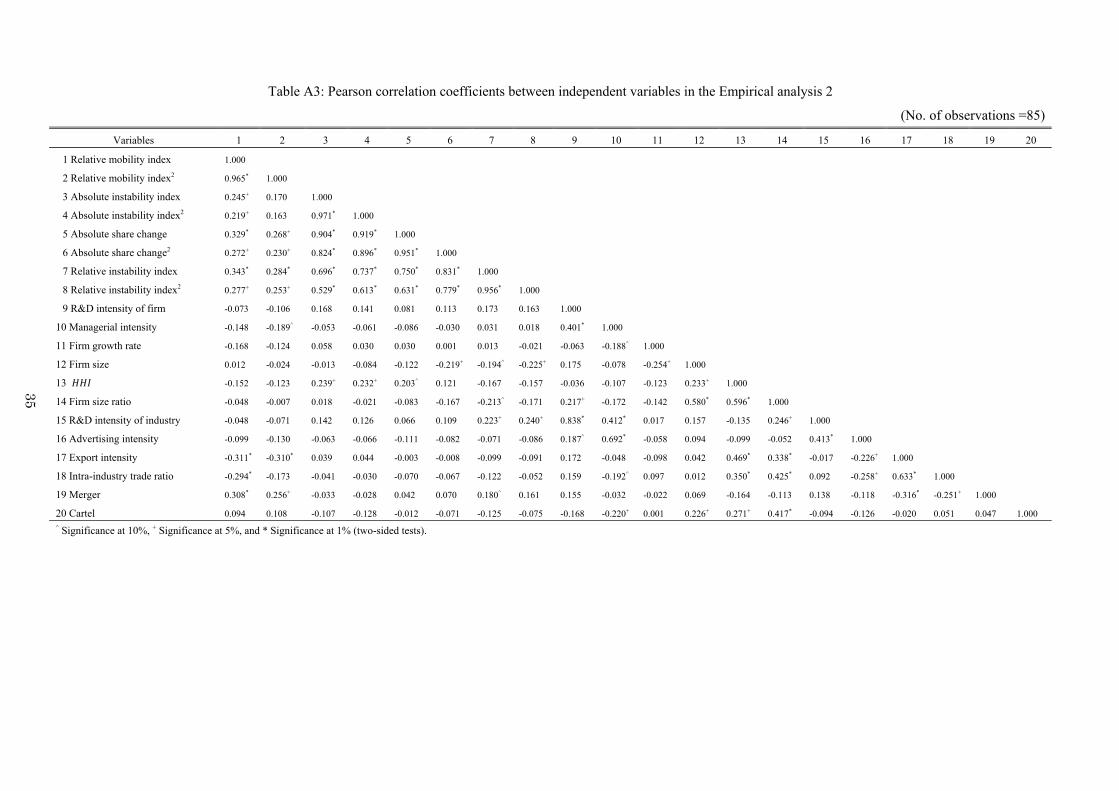
35
Table A3: Pearson correlation coefficients between independent variables in the Empirical analysis 2
(No. of observations =85)
Variables 1 2 3 4 5 6 7 8 9 10 11 12 13 14 15 16 17 18 19 20
1 Relative mobility index 1.000
2 Relative mobility index2 0.965* 1.000
3 Absolute instability index 0.245+ 0.170 1.000
4 Absolute instability index2 0.219+ 0.163 0.971* 1.000
5 Absolute share change 0.329* 0.268+ 0.904* 0.919* 1.000
6 Absolute share change2 0.272+ 0.230+ 0.824* 0.896* 0.951* 1.000
7 Relative instability index 0.343* 0.284* 0.696* 0.737* 0.750* 0.831* 1.000
8 Relative instability index2 0.277+ 0.253+ 0.529* 0.613* 0.631* 0.779* 0.956* 1.000
9 R&D intensity of firm -0.073 -0.106 0.168 0.141 0.081 0.113 0.173 0.163 1.000
10 Managerial intensity -0.148 -0.189^ -0.053 -0.061 -0.086 -0.030 0.031 0.018 0.401* 1.000
11 Firm growth rate -0.168 -0.124 0.058 0.030 0.030 0.001 0.013 -0.021 -0.063 -0.188^ 1.000
12 Firm size 0.012 -0.024 -0.013 -0.084 -0.122 -0.219+ -0.194^ -0.225+ 0.175 -0.078 -0.254+ 1.000
13 -0.152 -0.123 0.239+ 0.232+ 0.203^ 0.121 -0.167 -0.157 -0.036 -0.107 -0.123 0.233+ 1.000
14 Firm size ratio -0.048 -0.007 0.018 -0.021 -0.083 -0.167 -0.213^ -0.171 0.217+ -0.172 -0.142 0.580* 0.596* 1.000
15 R&D intensity of industry -0.048 -0.071 0.142 0.126 0.066 0.109 0.223+ 0.240+ 0.838* 0.412* 0.017 0.157 -0.135 0.246+ 1.000
16 Advertising intensity -0.099 -0.130 -0.063 -0.066 -0.111 -0.082 -0.071 -0.086 0.187^ 0.692* -0.058 0.094 -0.099 -0.052 0.413* 1.000
17 Export intensity -0.311* -0.310* 0.039 0.044 -0.003 -0.008 -0.099 -0.091 0.172 -0.048 -0.098 0.042 0.469* 0.338* -0.017 -0.226+ 1.000
18 Intra-industry trade ratio -0.294* -0.173 -0.041 -0.030 -0.070 -0.067 -0.122 -0.052 0.159 -0.192^ 0.097 0.012 0.350* 0.425* 0.092 -0.258+ 0.633* 1.000
19 Merger 0.308* 0.256+ -0.033 -0.028 0.042 0.070 0.180^ 0.161 0.155 -0.032 -0.022 0.069 -0.164 -0.113 0.138 -0.118 -0.316* -0.251+ 1.000
20 Cartel 0.094 0.108 -0.107 -0.128 -0.012 -0.071 -0.125 -0.075 -0.168 -0.220+ 0.001 0.226+ 0.271+ 0.417* -0.094 -0.126 -0.020 0.051 0.047 1.000 ^ Significance at 10%, + Significance at 5%, and * Significance at 1% (two-sided tests).