Embed Size (px)
Citation preview
CPSC Staff Statement on the University of Northern Iowa (UNI)’s “Report for National
Study of Public Playground Equipment and Surfacing”1 October 2019
The “Report for National Study of Public Playground Equipment and Surfacing,” presents results from playground surface testing conducted by UNI’s National Program for Playground Safety (“NPPS”) on 103 public playgrounds located at schools and parks across the United States under Contract CPSC-S-16-0061. In addition, the report presents results of UNI’s safety checklist to identify equipment and surfacing hazards for the same playgrounds tested under CPSC-S-16-0061. The objectives of CPSC-S-16-0061 were to assess the mechanical and general safety and maintenance status of a variety of playground surfacing materials nationwide. Results in the contractor’s report are limited by the use of a convenience sample, and do not assess chemical exposure.
1 This statement was prepared by CPSC staff, and has not been reviewed or approved by, and does not necessarily represent the views of, the Commission.
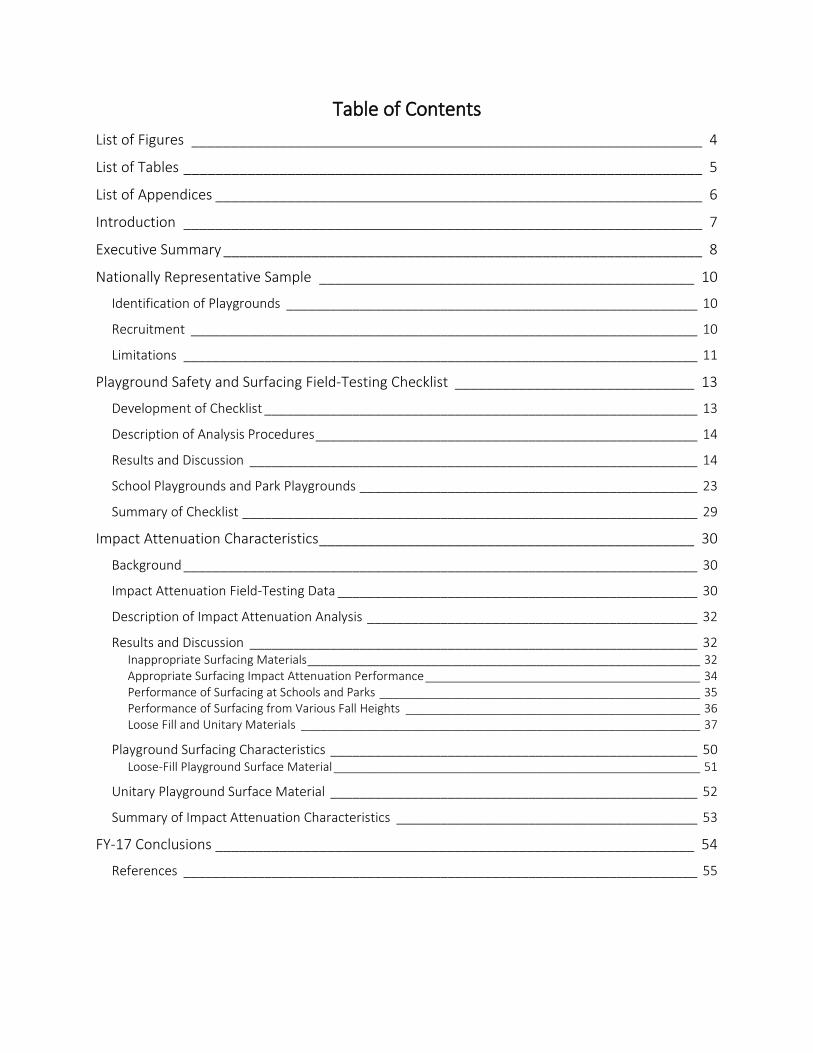
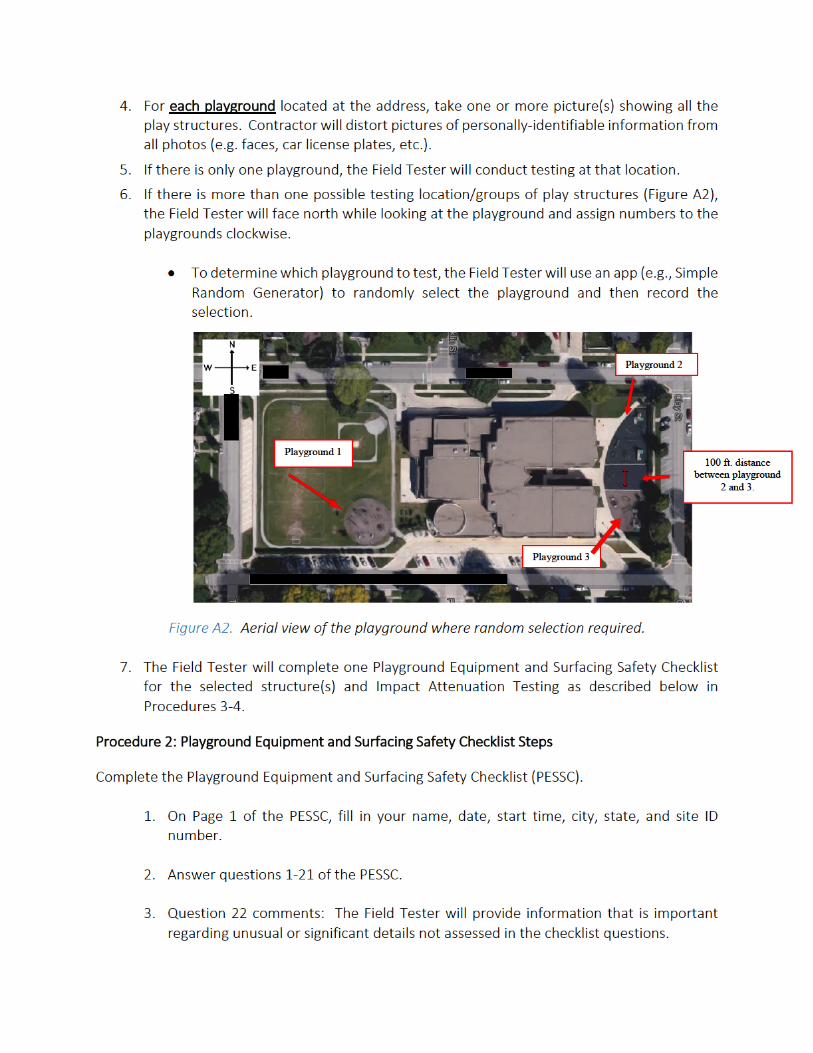
Table of Contents List of Figures ________________________________________________________________ 4
List of Tables _________________________________________________________________ 5
List of Appendices _____________________________________________________________ 6
Introduction _________________________________________________________________ 7
Executive Summary ____________________________________________________________ 8
Nationally Representative Sample _______________________________________________ 10
Identification of Playgrounds ________________________________________________________ 10
Recruitment _____________________________________________________________________ 10
Limitations ______________________________________________________________________ 11
Playground Safety and Surfacing Field-Testing Checklist ______________________________ 13
Development of Checklist ___________________________________________________________ 13
Description of Analysis Procedures ____________________________________________________ 14
Results and Discussion _____________________________________________________________ 14
School Playgrounds and Park Playgrounds ______________________________________________ 23
Summary of Checklist ______________________________________________________________ 29
Impact Attenuation Characteristics _______________________________________________ 30
Background ______________________________________________________________________ 30
Impact Attenuation Field-Testing Data _________________________________________________ 30
Description of Impact Attenuation Analysis _____________________________________________ 32
Results and Discussion _____________________________________________________________ 32 Inappropriate Surfacing Materials ____________________________________________________________ 32 Appropriate Surfacing Impact Attenuation Performance __________________________________________ 34 Performance of Surfacing at Schools and Parks _________________________________________________ 35 Performance of Surfacing from Various Fall Heights _____________________________________________ 36 Loose Fill and Unitary Materials _____________________________________________________________ 37
Playground Surfacing Characteristics __________________________________________________ 50 Loose-Fill Playground Surface Material ________________________________________________________ 51
Unitary Playground Surface Material __________________________________________________ 52
Summary of Impact Attenuation Characteristics _________________________________________ 53
FY-17 Conclusions ____________________________________________________________ 54
References ______________________________________________________________________ 55
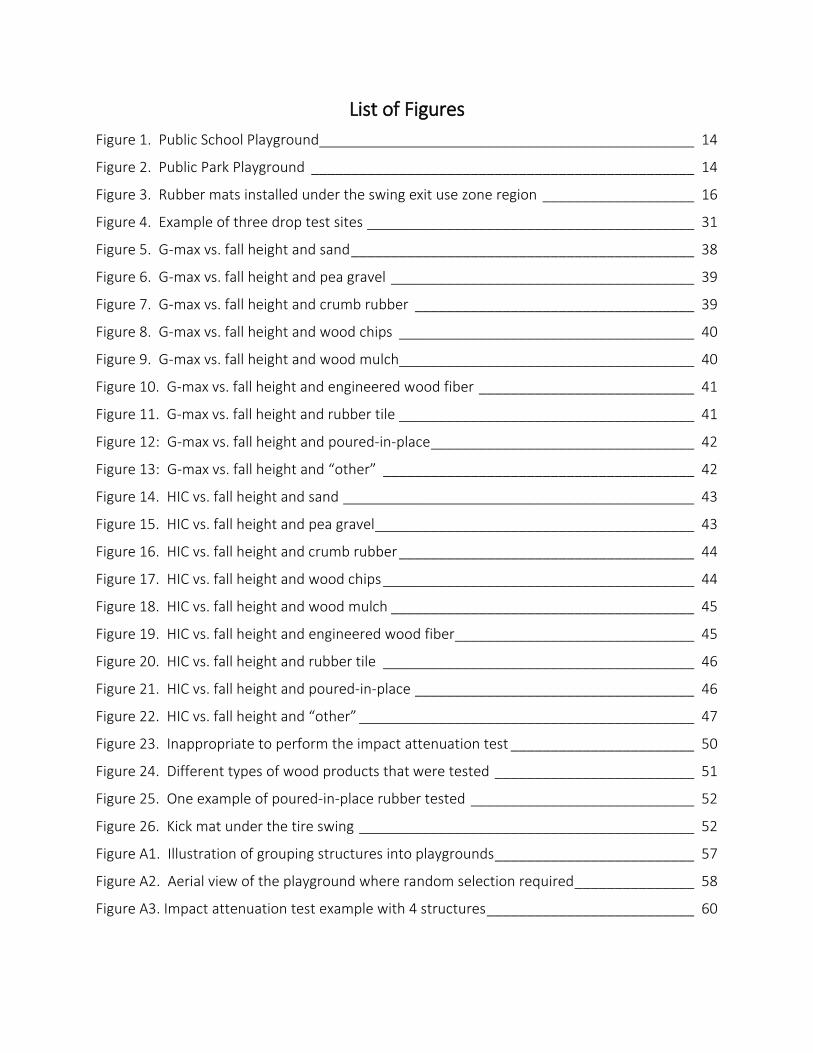
List of Figures Figure 1. Public School Playground_______________________________________________ 14
Figure 2. Public Park Playground ________________________________________________ 14
Figure 3. Rubber mats installed under the swing exit use zone region ___________________ 16
Figure 4. Example of three drop test sites _________________________________________ 31
Figure 5. G-max vs. fall height and sand ___________________________________________ 38
Figure 6. G-max vs. fall height and pea gravel ______________________________________ 39
Figure 7. G-max vs. fall height and crumb rubber ___________________________________ 39
Figure 8. G-max vs. fall height and wood chips _____________________________________ 40
Figure 9. G-max vs. fall height and wood mulch _____________________________________ 40
Figure 10. G-max vs. fall height and engineered wood fiber ___________________________ 41
Figure 11. G-max vs. fall height and rubber tile _____________________________________ 41
Figure 12: G-max vs. fall height and poured-in-place _________________________________ 42
Figure 13: G-max vs. fall height and “other” _______________________________________ 42
Figure 14. HIC vs. fall height and sand ____________________________________________ 43
Figure 15. HIC vs. fall height and pea gravel ________________________________________ 43
Figure 16. HIC vs. fall height and crumb rubber _____________________________________ 44
Figure 17. HIC vs. fall height and wood chips _______________________________________ 44
Figure 18. HIC vs. fall height and wood mulch ______________________________________ 45
Figure 19. HIC vs. fall height and engineered wood fiber ______________________________ 45
Figure 20. HIC vs. fall height and rubber tile _______________________________________ 46
Figure 21. HIC vs. fall height and poured-in-place ___________________________________ 46
Figure 22. HIC vs. fall height and “other” __________________________________________ 47
Figure 23. Inappropriate to perform the impact attenuation test _______________________ 50
Figure 24. Different types of wood products that were tested _________________________ 51
Figure 25. One example of poured-in-place rubber tested ____________________________ 52
Figure 26. Kick mat under the tire swing __________________________________________ 52
Figure A1. Illustration of grouping structures into playgrounds _________________________ 57
Figure A2. Aerial view of the playground where random selection required _______________ 58
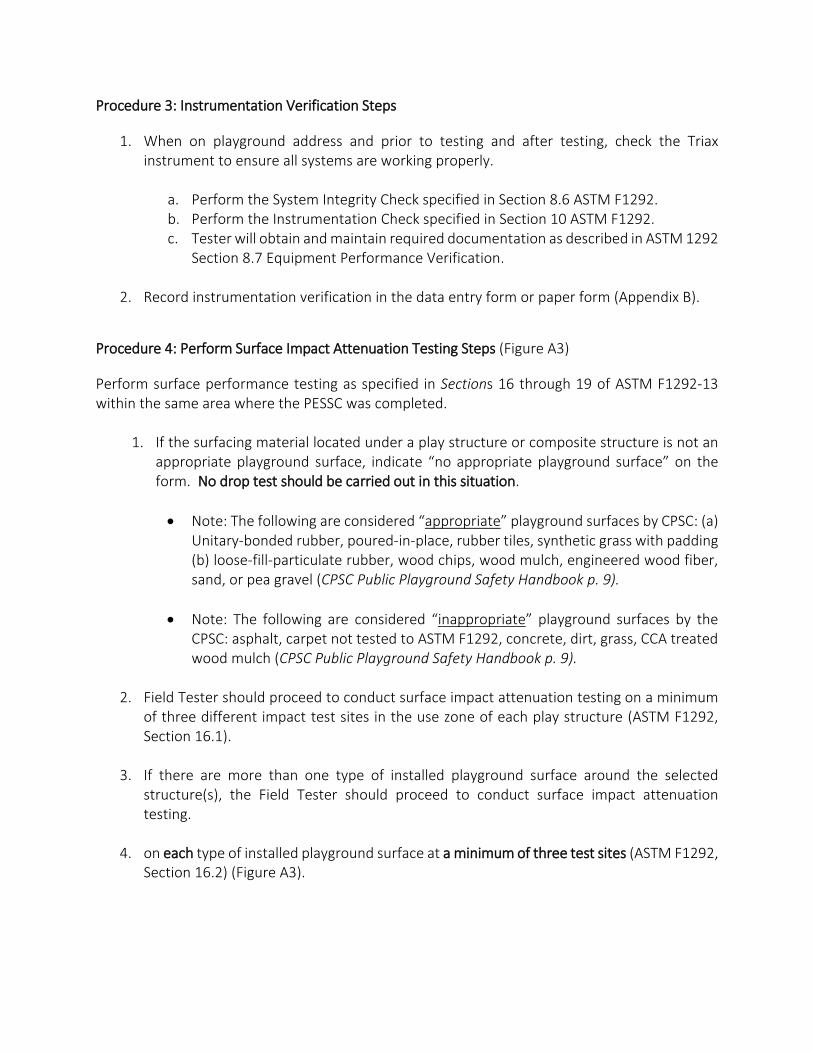
Figure A3. Impact attenuation test example with 4 structures __________________________ 60
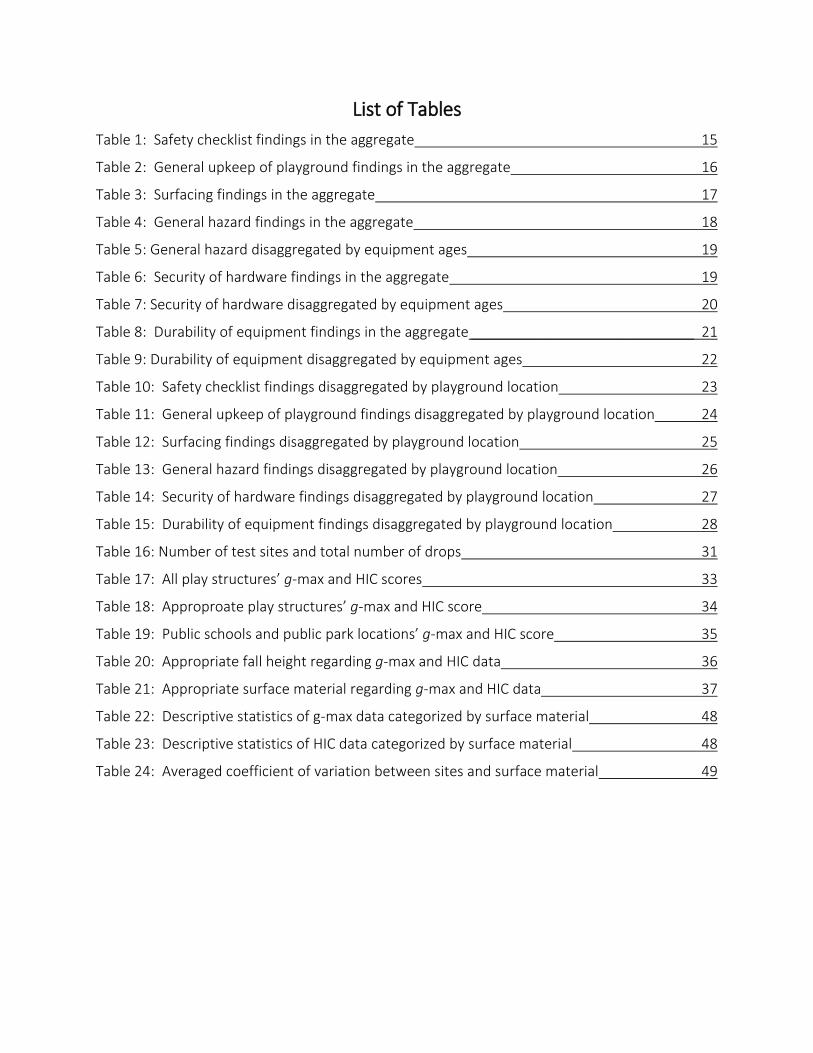
List of Tables Table 1: Safety checklist findings in the aggregate 15
Table 2: General upkeep of playground findings in the aggregate 16
Table 3: Surfacing findings in the aggregate 17
Table 4: General hazard findings in the aggregate 18
Table 5: General hazard disaggregated by equipment ages 19
Table 6: Security of hardware findings in the aggregate 19
Table 7: Security of hardware disaggregated by equipment ages 20
Table 8: Durability of equipment findings in the aggregate ____________________________ 21
Table 9: Durability of equipment disaggregated by equipment ages 22
Table 10: Safety checklist findings disaggregated by playground location 23
Table 11: General upkeep of playground findings disaggregated by playground location 24
Table 12: Surfacing findings disaggregated by playground location 25
Table 13: General hazard findings disaggregated by playground location 26
Table 14: Security of hardware findings disaggregated by playground location 27
Table 15: Durability of equipment findings disaggregated by playground location 28
Table 16: Number of test sites and total number of drops 31
Table 17: All play structures’ g-max and HIC scores 33
Table 18: Approproate play structures’ g-max and HIC score 34
Table 19: Public schools and public park locations’ g-max and HIC score 35
Table 20: Appropriate fall height regarding g-max and HIC data 36
Table 21: Appropriate surface material regarding g-max and HIC data 37
Table 22: Descriptive statistics of g-max data categorized by surface material 48
Table 23: Descriptive statistics of HIC data categorized by surface material 48
Table 24: Averaged coefficient of variation between sites and surface material 49

List of Appendices Appendix A: Test Plan Protocol _________________________________________________ 56
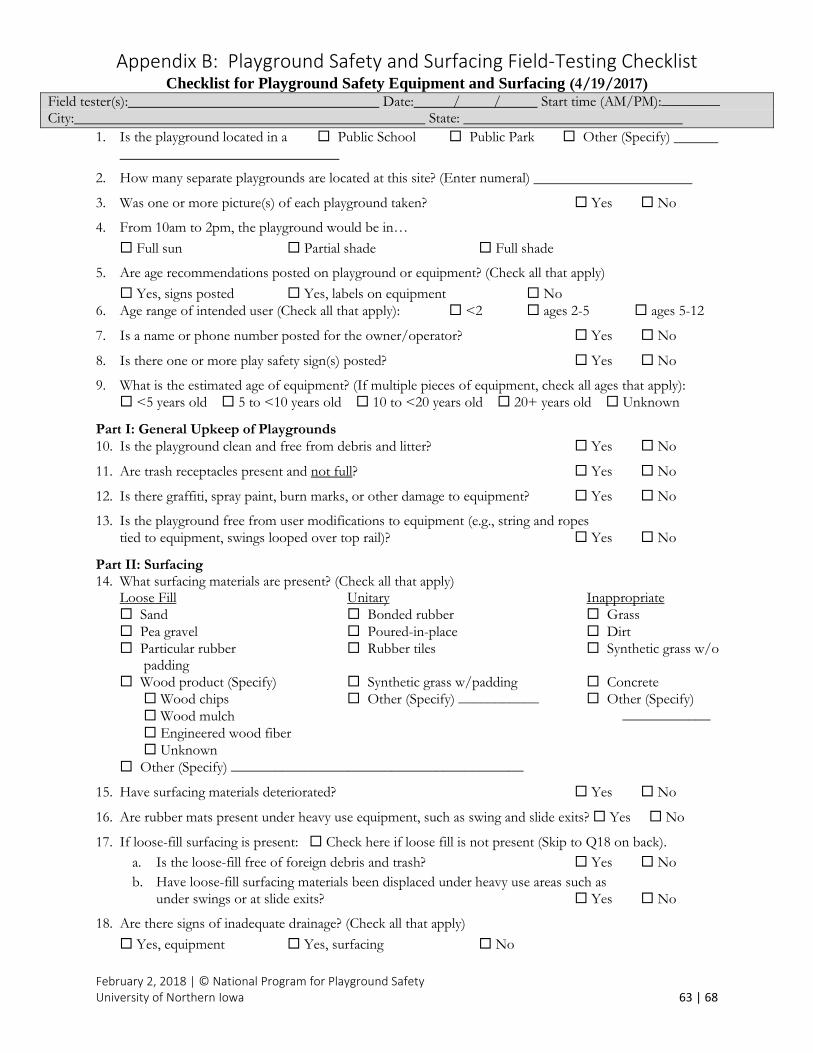
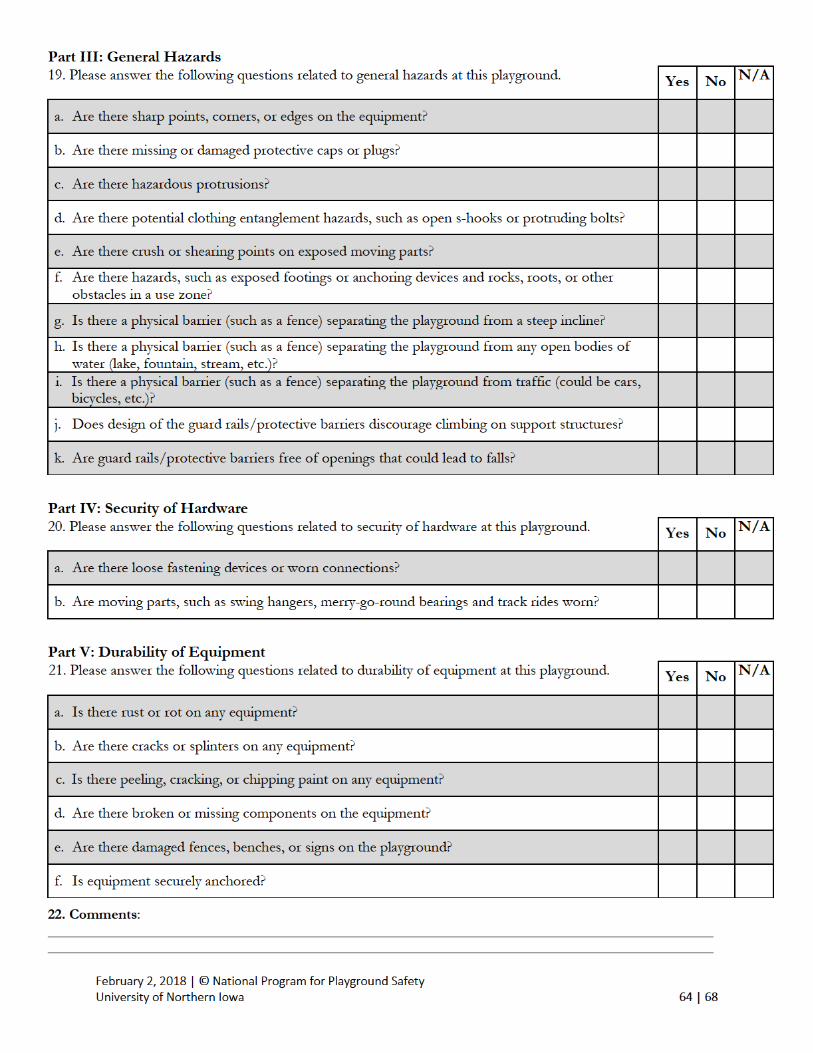
Appendix B: Playground Safety and Surfacing Field-Testing Checklist ____________________ 63
Appendix C: Impact Attenuation Testing in the Laboratory versus Field Testing ___________ 65
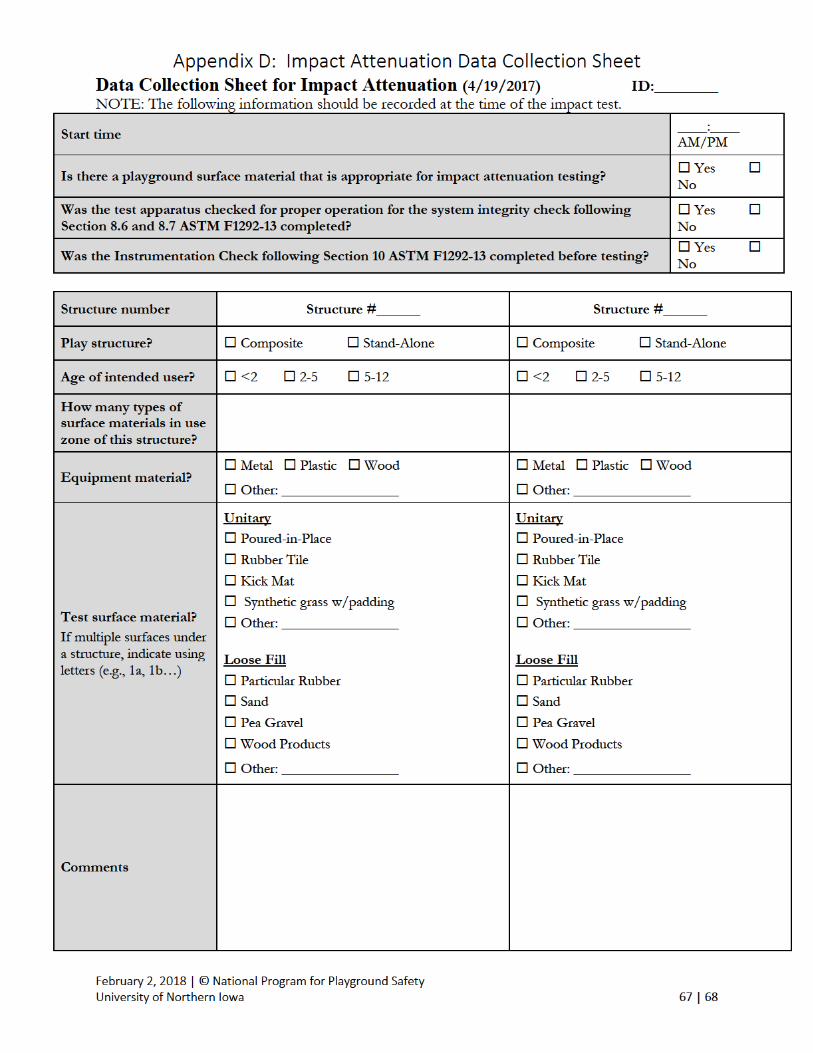
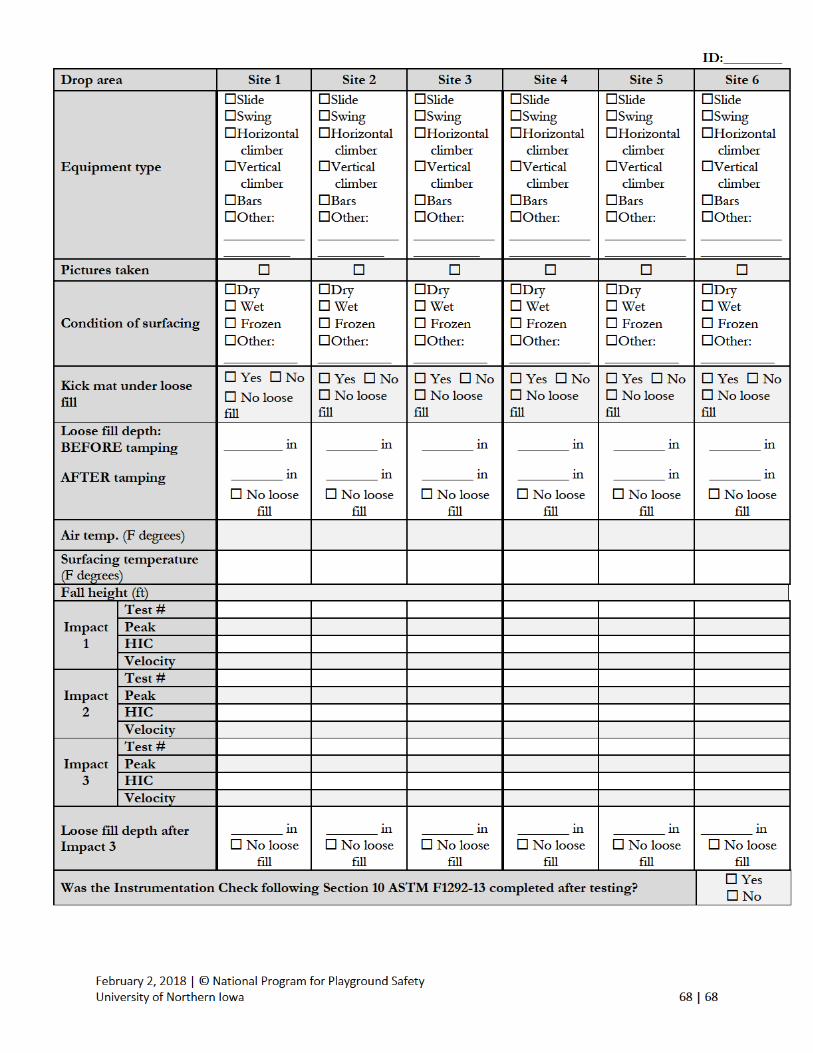
Appendix D: Impact Attenuation Data Collection Sheet_______________________________ 67

Introduction Under contract by the U.S. Consumer Product Safety Commission (CPSC), the National Program for Playground Safety (NPPS) located at the University of Northern Iowa began collecting data for CPSC on the safety of public playgrounds across the United States. The overall purpose of this study was to allow CPSC to be able to discern:
1. The general safety status of playground equipment and surfacing throughout the United States; and
2. The impact attenuation characteristics of safety surfacing using a nationally representative sample of public playground surfacing materials.
Based on discussions with CPSC staff, it was decided that data collection for the study would be performed in three phases. This report summarizes the work and findings of the first phase of the project which ran from September 2016 until February 2018. Playgrounds were tested during the spring and summer of 2017. During the first year, the following tasks were completed:
1. Development of a test plan outlining the methodology of a nationally representative sample of public playgrounds and the protocol for data collection procedures;
2. Creation of a safety checklist for identifying the safety concerns of playground equipment
and surfacing based on federal guidelines and voluntary standards; 3. Development of an impact attenuation field test data collection sheet; and 4. Completion of on-site surface impact attenuation testing and an assessment of the safety
of playground equipment of public playgrounds based on voluntary standards.
A database of information was created describing the public playgrounds, assessing the equipment’s related safety hazards, and evaluating the impact attenuation performance on a variety of playground surface materials. In total, 103 public playgrounds were assessed (out of a recommended sample size of 400 playground locations), representing public schools and public parks. The field testers performed drop tests using the test protocol outlined in the ASTM F1292 – Impact Attenuation of Surfacing Materials Within the Use Zone of Playground Equipment on nine distinct types of playground surface materials found under and around 388 structures5.
5 There were 27 play structures out of 415 recoded where no drop tests were performed due to the absence of appropriate surfacing under and around the play structure.
Executive Summary The data collected revealed that there are safety concerns with playground equipment and surfacing materials. There are fewer issues with the performance of impact attenuation of surfacing materials. A summary presents the findings from the safety checklist and results from the impact attenuation performance of playground surfacing materials. Playground Safety Checklist Conclusions
• Sixty-four percent (64%) of the public playgrounds did not have any safety signs posted at the playground to inform users of safety concerns and age appropriateness of equipment.
• Sixty-four percent (64%) of the playground equipment had evidence of worn parts, rust, and rot.
• Thirty-four percent (34%) of playground equipment had broken or missing play components.
• Twenty-two percent (22%) of playgrounds had potential clothing entanglement hazards (e.g. open s-hooks and protruding bolts).
• Seventeen percent (17%) of the playgrounds had foreign safety hazards present on the playground equipment (e.g., string and ropes tied to equipment, swings looped over top rail).
Playground Surfacing Impact Attenuation Results
• There were 415 play structures that were assessed. Twenty-seven (27) play structures were found to have an inappropriate surface material under and around the play structure. Overall, analyzing appropriate and inappropriate playground surfacing materials, 87% of play structures fell below 200 g’s and 81% had a HIC score below 1000 at all three test sites surrounding each play structure.
• Ninety-three percent (93%) of tested surface material (n=388) under and around tested play structures are meeting impact attenuation standards of <200 g and 87% had a HIC score below 1000 at all three test sites surrounding each play structure.
• Ninety-eight percent (98%) of wood products (e.g. engineered wood fiber, wood chips, and wood mulch) are meeting impact attenuation standards of <200 g and 87% had a HIC score below 1000 at all three test sites surrounding each play structure.
• Eighty-five percent (85%) of unitary products (e.g. poured-in-pace and rubber tile) tested under play structures are meeting impact attenuation standards of <200 g and 87% had a HIC score below 1000 at all three test sites surrounding each play structure.
• Eighty-five percent (85%) of sand tested under play structures are meeting impact attenuation standards of <200 g and 82% had a HIC score below 1000 at all three test sites surrounding each play structure.
• Eighty percent (80%) of pea gravel tested under play structures are meeting impact attenuation standards of <200 g and 65% had a HIC score below 1000 at all three test sites surrounding each play structure.
• Seventy-four percent (74%) of loose-fill playground surfacing material had been displaced at the time of testing and 40% of loose-fill material had deteriorated surrounding each play structure.
Overall, the data show most playgrounds are meeting general safety of the environment, playground equipment, and playground surfacing materials. However, there are still public playgrounds that are putting children at risk for injury through inadequate safety signage and lack of maintenance on equipment’s hardware (e.g. gaps, ropes, strings, head entrapments). Data from field-testing revealed most playground surface materials under play structures with an appropriate surface material (e.g. loose-fill or unitary) met impact attenuation performance of ASTM F1292. The findings provide a first glimpse into the direction that the final data may take when the total project is completed. The investigation of performance of playground surfacing materials may change as field-testing is completed representing the complete sample of the identified public playgrounds for this project. As the project moves into further stages, a geographical distribution will investigate the safety of playgrounds and various playground surfaces.
Nationally Representative Sample In consultation with CPSC and collaboration with the Center for Social and Behavioral Research (CSBR) at the University of Northern Iowa, a national sampling design was developed to ensure a random selection of 400 playground sites throughout the United States. Because this was a labor intensive and complex project involving on-site assessment and testing, the project was divided into manageable stages to complete the study. As discussed in further detail below, the number of playgrounds assessed did not meet the criteria for a nationally representative sample.
Identification of Playgrounds Identification of playgrounds within each geographic Primary Sampling Units (PSU) was limited to the Census Block Group (CBG) geographic boundary. Any elementary or middle school listed in the Dun and Bradstreet Database that fell within the CBG boundary was automatically selected. The first step in the process involved canvassing each CBG using the Aerial Imagery available in Google Maps. Using an editable aerial imagery map, a marker (point) was placed on top of identified playgrounds. Locations were marked if only there was 100% certainty, there was a playground. To begin the sampling, 400 of the original sample was randomly selected and was replaced via random selection as needed to complete the goal of 400 completes. In agreement with CPSC, the first 100 completes was considered 100 of the 400 to allow for efficient use of project resources. In that way, evaluation of playgrounds proximal to one another in the 400 was completed during the same travel time/trip. It is important to note that this non-random sampling of the first 100 cases limits the findings both in terms of statistical power (small number of cases) and generalizability. All findings summarized should be considered preliminary and should not be considered a statistically representative sample of playgrounds in the US. The sample was provided by CSBR staff to the PI for contact and scheduling yielding 103 completed cases.
Recruitment Once the list of randomly selected public school districts or public municipality sites was generated, NPPS contacted 197 playground owner/operators to request permission to conduct an on-site evaluation of equipment and impact attenuation test of surfacing. A point of contact was identified through email that was published on the agency’s website or by making a telephone call to obtain a contact number and email. The agency’s point of contact included one of the following positions: Superintendent, Elementary Principal and/or Assistant Principal, Park Director, Superintendent of Parks, Risk Management Director, Mayor, or Facility and Grounds Director. The agency’s point of contact was notified of the project and was informed the results of the testing were aggregated data and no individual test results would be reported and would be kept strictly confidential. NPPS learned two of the playgrounds were not eligible as they were located in a private housing complex.
During the recruitment period, the response rate was a challenge. NPPS would email and call the agency’s point of contact, but the return of response was minimal. The initial statement of work reported “The Contractor shall obtain written access to examine the playground for safety hazards and conduct impact attenuation testing.” Written permission occurred from 28 playground owner/operators. Twelve (12) playgrounds declined participation. The remaining playground owner/operators did not respond to the various attempts for obtaining written permission. Due to the delay in response and the number of attempts that were needed to obtain permission the contract was modified to state that repeated attempts to notify the public playgrounds was sufficient. One hundred and fifty-five (155) playground owner/operators did not respond to emails, telephone messages and a playground visit. While in the field, the field tester was instructed to attempt to meet the owner/operator and obtain written permission. There were two instances when a field tester arrived, but could not test. In one instance, the playground was locked; in the other instance, there was no structure present. Data was recorded at 103 public playgrounds, located at public parks and public schools. The number of playgrounds tested in each region includes:
• Mid-Atlantic (14 playgrounds) • Midwest (45 playgrounds) • New England (15 playgrounds) • Southwest (2 playgrounds) • West North Central (27 playgrounds)
Limitations These results should not be generalized to represent a national sample. The 103 playgrounds visited and 388 structures tested are not geographically dispersed to capture the national representation that was established for the purpose of the project. Field-testing has not been conducted in the south, east, and northwest regions of the United States. Collection of data over a wider geographical distribution may be helpful in investigating the safety of playgrounds and various playground surfaces. Future analysis could review different climates and different surface conditions in the various regions. A larger sample with more data points may allow for further investigation of several other variables (i.e. climatic conditions). In addition, impact attenuation performance of kick mats could be investigated to determine if there is a difference in performance percentages with play structures with inappropriate surface material under and around the use zone. Data from additional playgrounds would significantly strengthen the sample size and provide a deeper

understanding of safety hazards related to playgrounds, playground surfacing, and impact attenuation performance.
Playground Safety and Surfacing Field-Testing Checklist There are a number of elements to consider when examining the safety of playgrounds. The playground location, the playground equipment (e.g. crush and shearing points, entanglements and impalements, and entrapments), maintenance of the playground, and playground surfacing materials are important factors to preventing playground injuries. Appendix A describes the test plan protocol for the study. The report is divided into the following sections to provide a comprehensive picture of the study and playground safety data that were obtained.
• Development of Checklist • Description of Analysis Procedures • Results and Discussion • School Playgrounds and Park Playgrounds • Summary of Checklist
Development of Checklist The intent of the playground safety and surfacing field-testing checklist was to evaluate possible safety risks on public playgrounds. The playground safety and surfacing checklist was developed to provide a complete list of potential safety hazards on playground equipment and playground surfacing materials. The checklist is based on the U.S. Consumer Product Safety Commission’s Handbook for Public Playground Safety (CPSC, 2010), which presents safety information for public playground equipment in the form of a guideline. Its intent is to promote greater safety awareness among those who purchase, install, and maintain public playgrounds. The checklist was also based on the American Society for Testing Material (ASTM) F1487, which is a standard for consumer safety performance specification for playground equipment for public use. ASTM F1487 is a voluntary standard intended primarily as a guide for equipment manufacturers. The Playground Safety and Surfacing Field-Testing Checklist included 37 possible playground safety hazards (See Appendix B). The questions adhered to the CPSC’s Handbook for Public Playgrounds were categorized as (a) general playground considerations, (b) general upkeep of playgrounds, (c) surfacing, (d) general hazards, (e) security of hardware, and (f) durability of equipment.
Description of Analysis Procedures The dataset and tabulated data for the assessment of Playground Safety and Surfacing Field-Testing Checklist was entered and analyzed in Statistical Package for the Social Sciences (SPSS). SPSS database was used to allow for determination of quantitative descriptive statistics. The dataset for the Playground Safety and Surfacing Field-Testing Checklist was analyzed in the aggregate by playgrounds (n=103). The dataset was also disaggregated by location (public schools versus public parks) and estimated age of equipment.
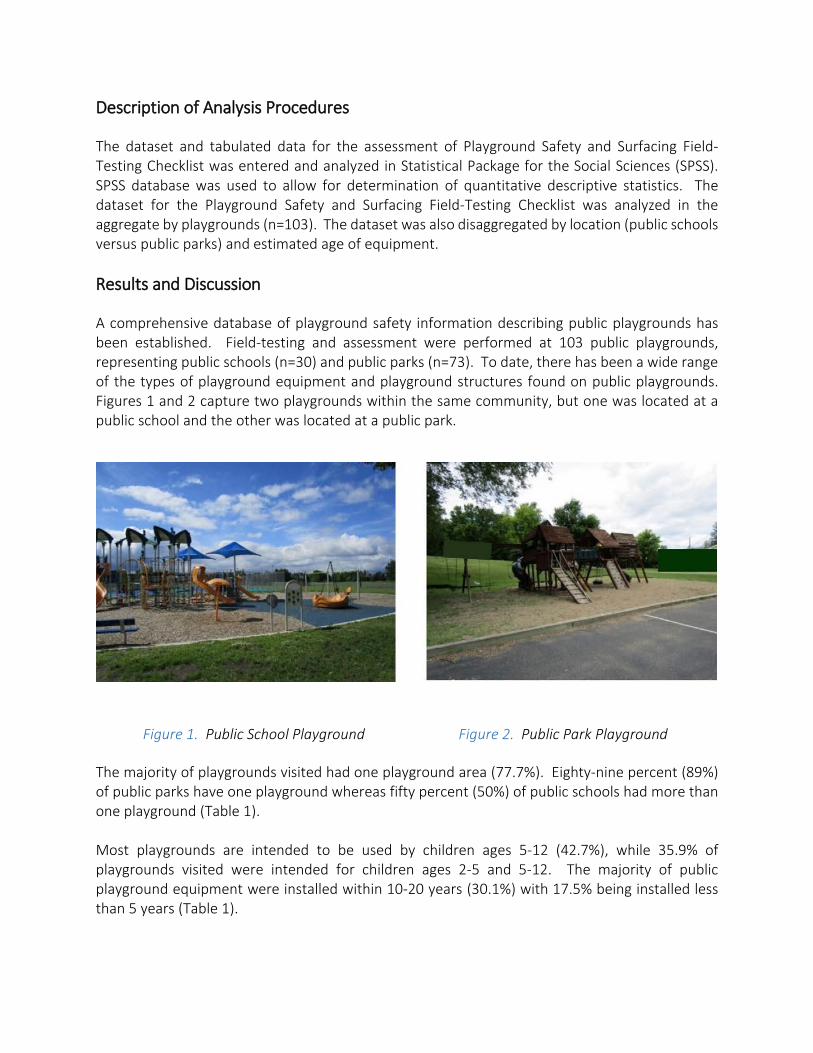
Results and Discussion A comprehensive database of playground safety information describing public playgrounds has been established. Field-testing and assessment were performed at 103 public playgrounds, representing public schools (n=30) and public parks (n=73). To date, there has been a wide range of the types of playground equipment and playground structures found on public playgrounds. Figures 1 and 2 capture two playgrounds within the same community, but one was located at a public school and the other was located at a public park.
Figure 1. Public School Playground Figure 2. Public Park Playground The majority of playgrounds visited had one playground area (77.7%). Eighty-nine percent (89%) of public parks have one playground whereas fifty percent (50%) of public schools had more than one playground (Table 1). Most playgrounds are intended to be used by children ages 5-12 (42.7%), while 35.9% of playgrounds visited were intended for children ages 2-5 and 5-12. The majority of public playground equipment were installed within 10-20 years (30.1%) with 17.5% being installed less than 5 years (Table 1).
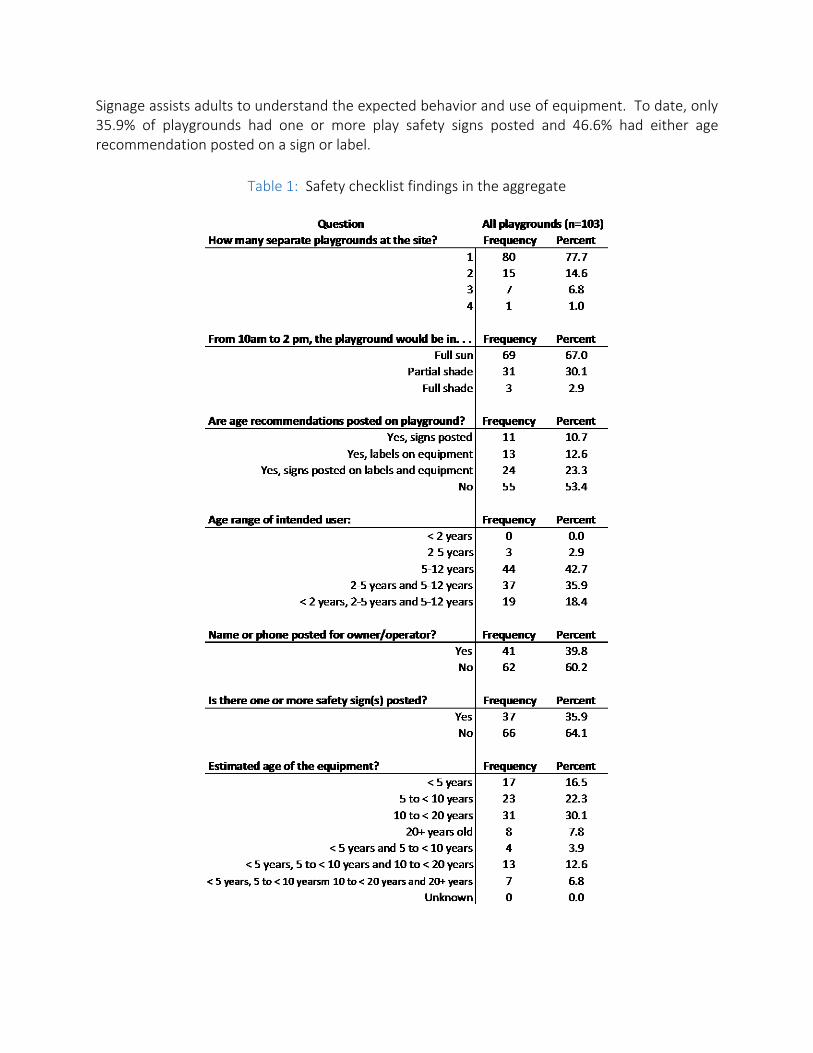
Signage assists adults to understand the expected behavior and use of equipment. To date, only 35.9% of playgrounds had one or more play safety signs posted and 46.6% had either age recommendation posted on a sign or label.
Table 1: Safety checklist findings in the aggregate
The general upkeep of the playground (Table 2) seems to be reasonable by owners/operators of playground. Most playgrounds tested (70.9%) were clean and free from debris and litter. Also, 82.5% of playgrounds were free from user modifications to equipment (e.g. strings and ropes tied to equipment, swings looped over top rail, etc.).
Table 2: General upkeep of playground findings in the aggregate
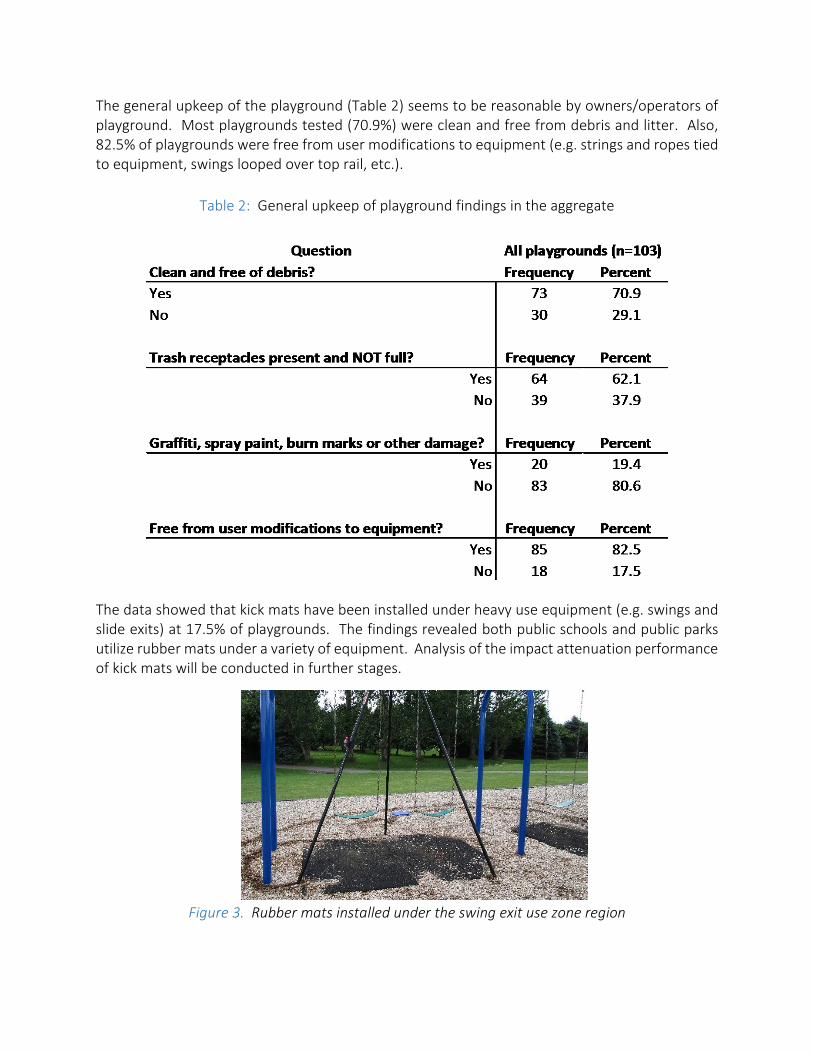
The data showed that kick mats have been installed under heavy use equipment (e.g. swings and slide exits) at 17.5% of playgrounds. The findings revealed both public schools and public parks utilize rubber mats under a variety of equipment. Analysis of the impact attenuation performance of kick mats will be conducted in further stages.
Figure 3. Rubber mats installed under the swing exit use zone region
Most playground surface materials have not deteriorated (60.2%) and appear to have adequate drainage (91.3%). However, 73.8% of playgrounds that had loose fill surfacing materials, the materials had been displaced at the time of testing. Loose-fill playground surfacing materials were free of debris and trash (66%). (See Table 3).
Table 3: Surfacing findings in the aggregate
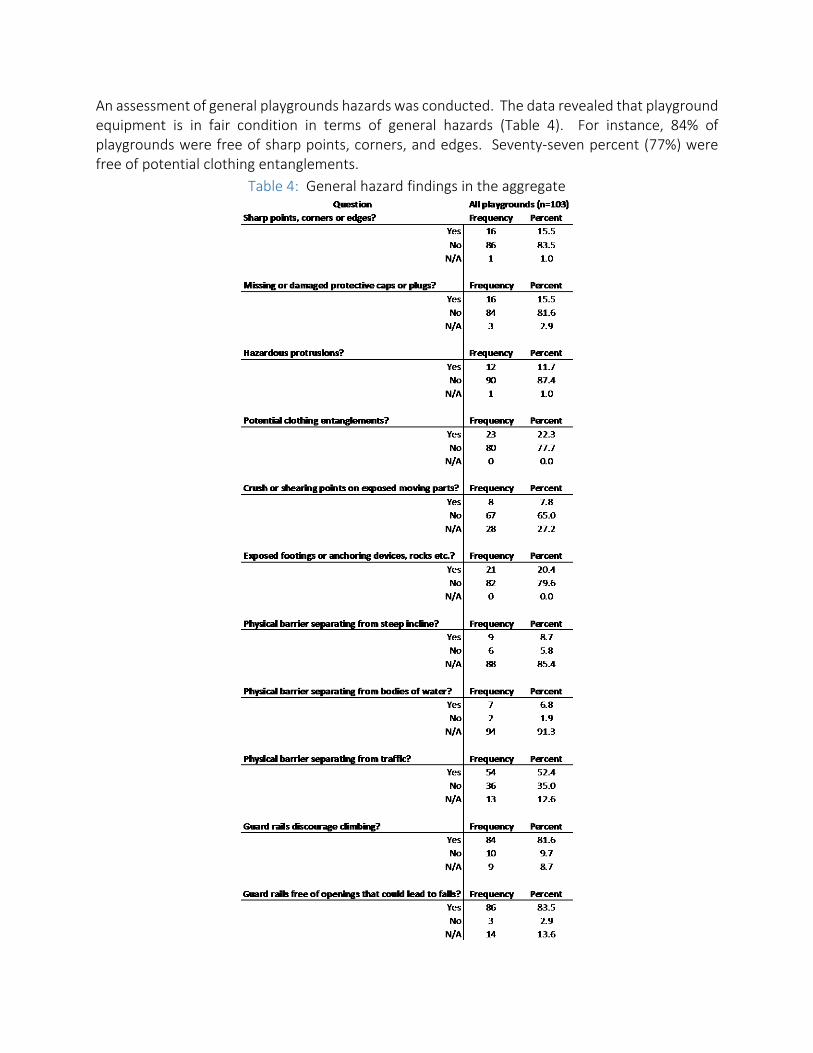
An assessment of general playgrounds hazards was conducted. The data revealed that playground equipment is in fair condition in terms of general hazards (Table 4). For instance, 84% of playgrounds were free of sharp points, corners, and edges. Seventy-seven percent (77%) were free of potential clothing entanglements.
Table 4: General hazard findings in the aggregate
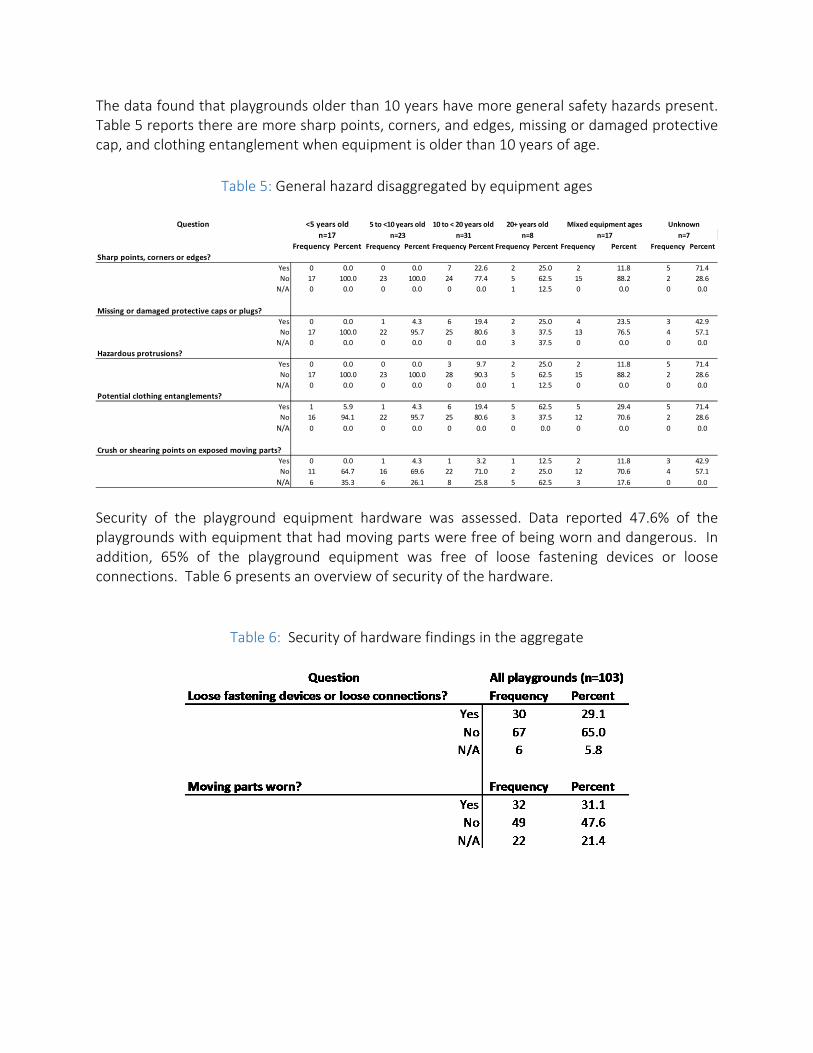
The data found that playgrounds older than 10 years have more general safety hazards present. Table 5 reports there are more sharp points, corners, and edges, missing or damaged protective cap, and clothing entanglement when equipment is older than 10 years of age.
Table 5: General hazard disaggregated by equipment ages
Security of the playground equipment hardware was assessed. Data reported 47.6% of the playgrounds with equipment that had moving parts were free of being worn and dangerous. In addition, 65% of the playground equipment was free of loose fastening devices or loose connections. Table 6 presents an overview of security of the hardware.
Table 6: Security of hardware findings in the aggregate
Question
Frequency Percent Frequency Percent Frequency Percent Frequency Percent Frequency Percent Frequency PercentSharp points, corners or edges?
Yes 0 0.0 0 0.0 7 22.6 2 25.0 2 11.8 5 71.4No 17 100.0 23 100.0 24 77.4 5 62.5 15 88.2 2 28.6
N/A 0 0.0 0 0.0 0 0.0 1 12.5 0 0.0 0 0.0
Missing or damaged protective caps or plugs?Yes 0 0.0 1 4.3 6 19.4 2 25.0 4 23.5 3 42.9No 17 100.0 22 95.7 25 80.6 3 37.5 13 76.5 4 57.1
N/A 0 0.0 0 0.0 0 0.0 3 37.5 0 0.0 0 0.0Hazardous protrusions?
Yes 0 0.0 0 0.0 3 9.7 2 25.0 2 11.8 5 71.4No 17 100.0 23 100.0 28 90.3 5 62.5 15 88.2 2 28.6
N/A 0 0.0 0 0.0 0 0.0 1 12.5 0 0.0 0 0.0Potential clothing entanglements?
Yes 1 5.9 1 4.3 6 19.4 5 62.5 5 29.4 5 71.4No 16 94.1 22 95.7 25 80.6 3 37.5 12 70.6 2 28.6
N/A 0 0.0 0 0.0 0 0.0 0 0.0 0 0.0 0 0.0
Crush or shearing points on exposed moving parts?Yes 0 0.0 1 4.3 1 3.2 1 12.5 2 11.8 3 42.9No 11 64.7 16 69.6 22 71.0 2 25.0 12 70.6 4 57.1
N/A 6 35.3 6 26.1 8 25.8 5 62.5 3 17.6 0 0.0
n=7Mixed equipment ages Unknown
n=17 n=23 n=31 n=8 n=17<5 years old 5 to <10 years old 10 to < 20 years old 20+ years old
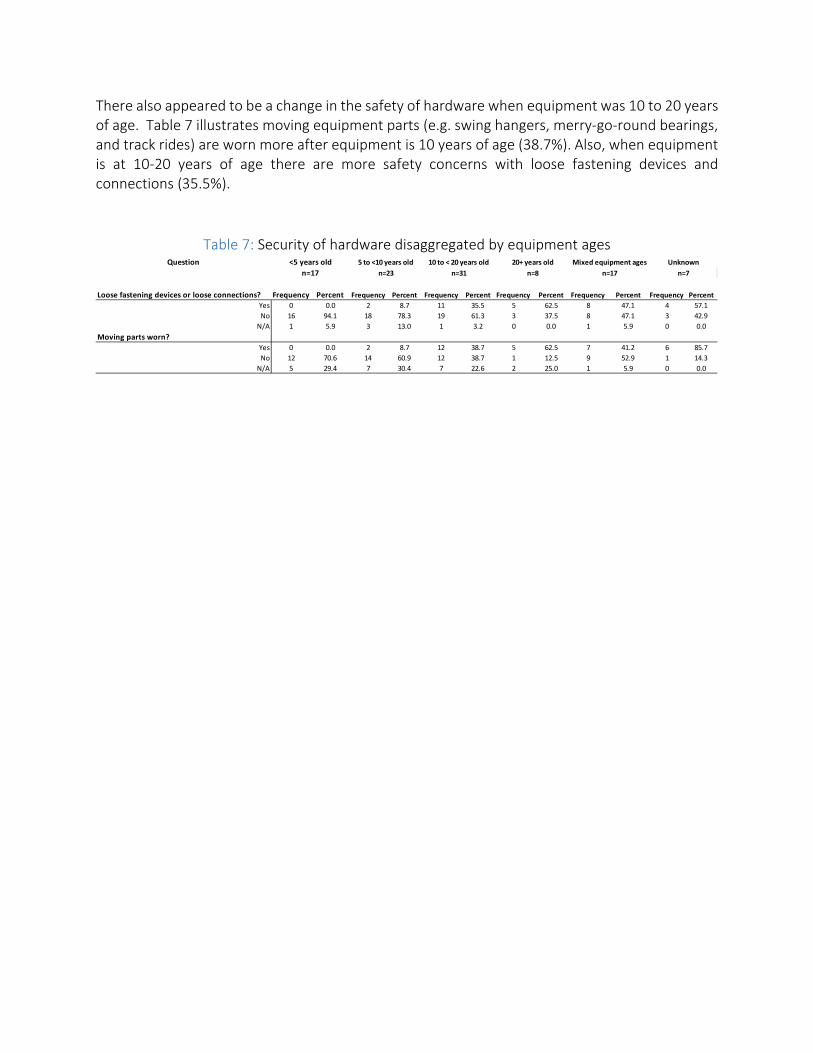
There also appeared to be a change in the safety of hardware when equipment was 10 to 20 years of age. Table 7 illustrates moving equipment parts (e.g. swing hangers, merry-go-round bearings, and track rides) are worn more after equipment is 10 years of age (38.7%). Also, when equipment is at 10-20 years of age there are more safety concerns with loose fastening devices and connections (35.5%).
Table 7: Security of hardware disaggregated by equipment ages
Question
Loose fastening devices or loose connections? Frequency Percent Frequency Percent Frequency Percent Frequency Percent Frequency Percent Frequency PercentYes 0 0.0 2 8.7 11 35.5 5 62.5 8 47.1 4 57.1No 16 94.1 18 78.3 19 61.3 3 37.5 8 47.1 3 42.9
N/A 1 5.9 3 13.0 1 3.2 0 0.0 1 5.9 0 0.0Moving parts worn?
Yes 0 0.0 2 8.7 12 38.7 5 62.5 7 41.2 6 85.7No 12 70.6 14 60.9 12 38.7 1 12.5 9 52.9 1 14.3
N/A 5 29.4 7 30.4 7 22.6 2 25.0 1 5.9 0 0.0
Unknownn=17 n=23 n=31 n=8 n=17 n=7
<5 years old 5 to <10 years old 10 to < 20 years old 20+ years old Mixed equipment ages
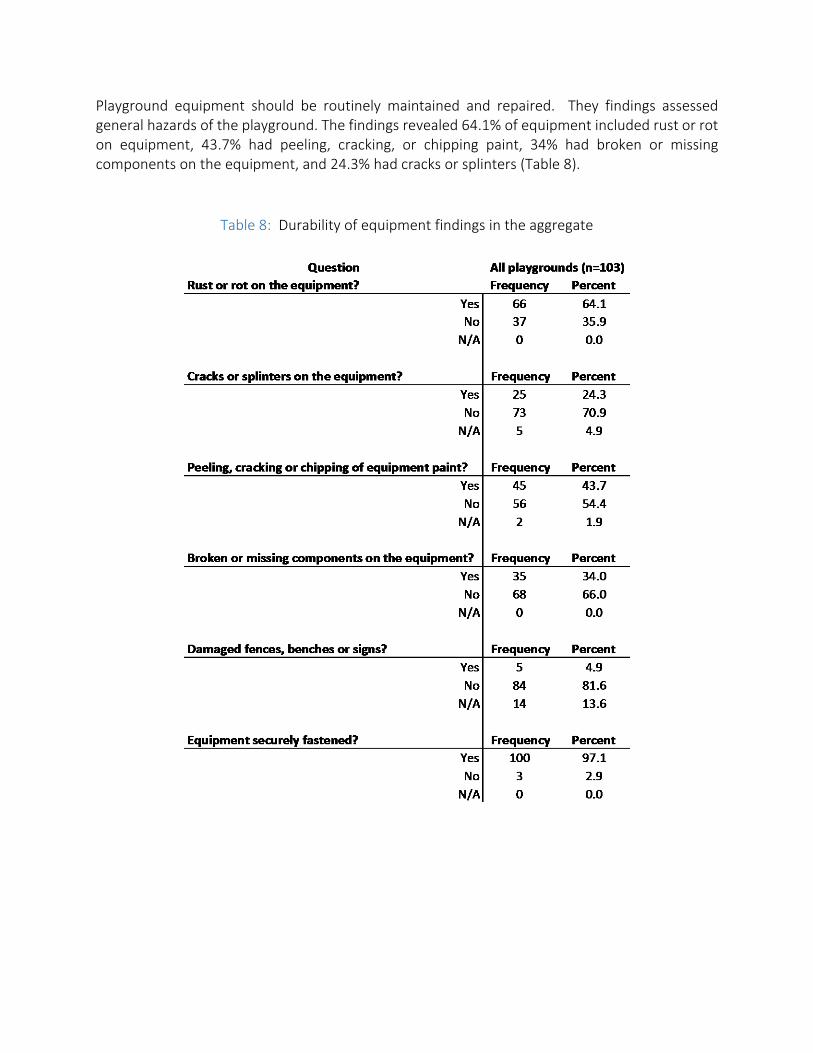
Playground equipment should be routinely maintained and repaired. They findings assessed general hazards of the playground. The findings revealed 64.1% of equipment included rust or rot on equipment, 43.7% had peeling, cracking, or chipping paint, 34% had broken or missing components on the equipment, and 24.3% had cracks or splinters (Table 8).
Table 8: Durability of equipment findings in the aggregate
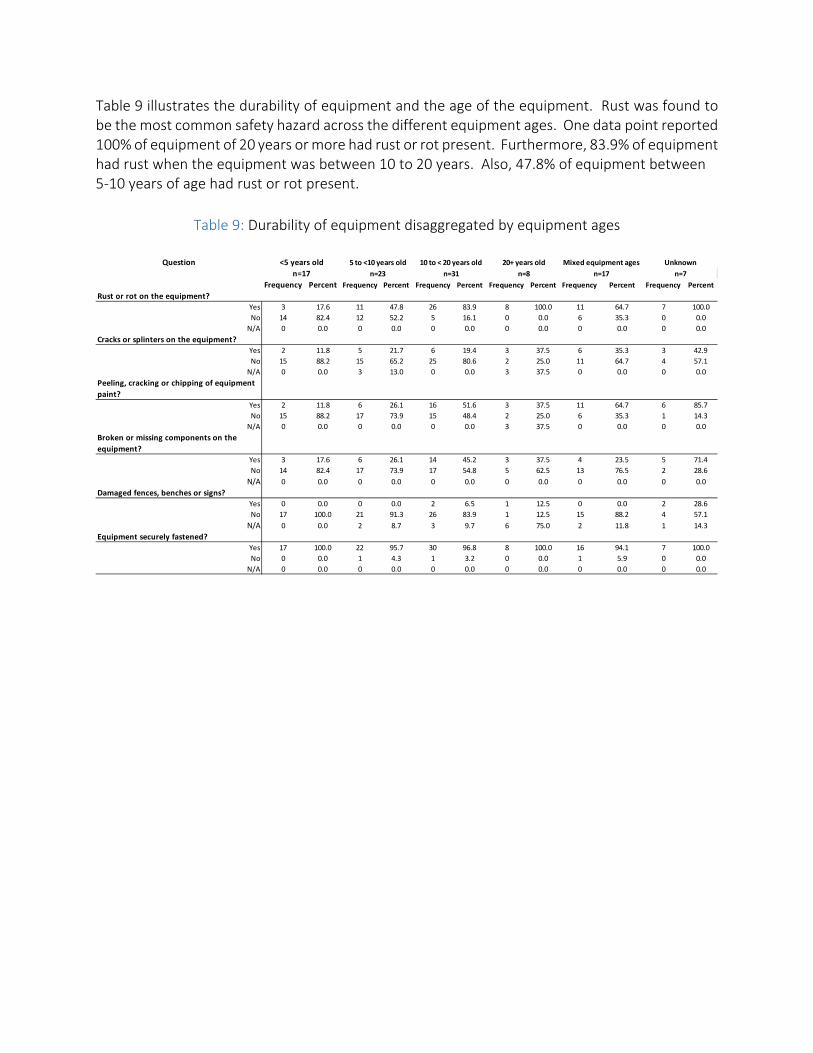
Table 9 illustrates the durability of equipment and the age of the equipment. Rust was found to be the most common safety hazard across the different equipment ages. One data point reported 100% of equipment of 20 years or more had rust or rot present. Furthermore, 83.9% of equipment had rust when the equipment was between 10 to 20 years. Also, 47.8% of equipment between 5-10 years of age had rust or rot present.
Table 9: Durability of equipment disaggregated by equipment ages
Question
Frequency Percent Frequency Percent Frequency Percent Frequency Percent Frequency Percent Frequency PercentRust or rot on the equipment?
Yes 3 17.6 11 47.8 26 83.9 8 100.0 11 64.7 7 100.0No 14 82.4 12 52.2 5 16.1 0 0.0 6 35.3 0 0.0
N/A 0 0.0 0 0.0 0 0.0 0 0.0 0 0.0 0 0.0Cracks or splinters on the equipment?
Yes 2 11.8 5 21.7 6 19.4 3 37.5 6 35.3 3 42.9No 15 88.2 15 65.2 25 80.6 2 25.0 11 64.7 4 57.1
N/A 0 0.0 3 13.0 0 0.0 3 37.5 0 0.0 0 0.0Peeling, cracking or chipping of equipment paint?
Yes 2 11.8 6 26.1 16 51.6 3 37.5 11 64.7 6 85.7No 15 88.2 17 73.9 15 48.4 2 25.0 6 35.3 1 14.3
N/A 0 0.0 0 0.0 0 0.0 3 37.5 0 0.0 0 0.0Broken or missing components on the equipment?
Yes 3 17.6 6 26.1 14 45.2 3 37.5 4 23.5 5 71.4No 14 82.4 17 73.9 17 54.8 5 62.5 13 76.5 2 28.6
N/A 0 0.0 0 0.0 0 0.0 0 0.0 0 0.0 0 0.0Damaged fences, benches or signs?
Yes 0 0.0 0 0.0 2 6.5 1 12.5 0 0.0 2 28.6No 17 100.0 21 91.3 26 83.9 1 12.5 15 88.2 4 57.1
N/A 0 0.0 2 8.7 3 9.7 6 75.0 2 11.8 1 14.3Equipment securely fastened?
Yes 17 100.0 22 95.7 30 96.8 8 100.0 16 94.1 7 100.0No 0 0.0 1 4.3 1 3.2 0 0.0 1 5.9 0 0.0
N/A 0 0.0 0 0.0 0 0.0 0 0.0 0 0.0 0 0.0
Unknownn=17 n=23 n=31 n=8 n=17 n=7
<5 years old 5 to <10 years old 10 to < 20 years old 20+ years old Mixed equipment ages
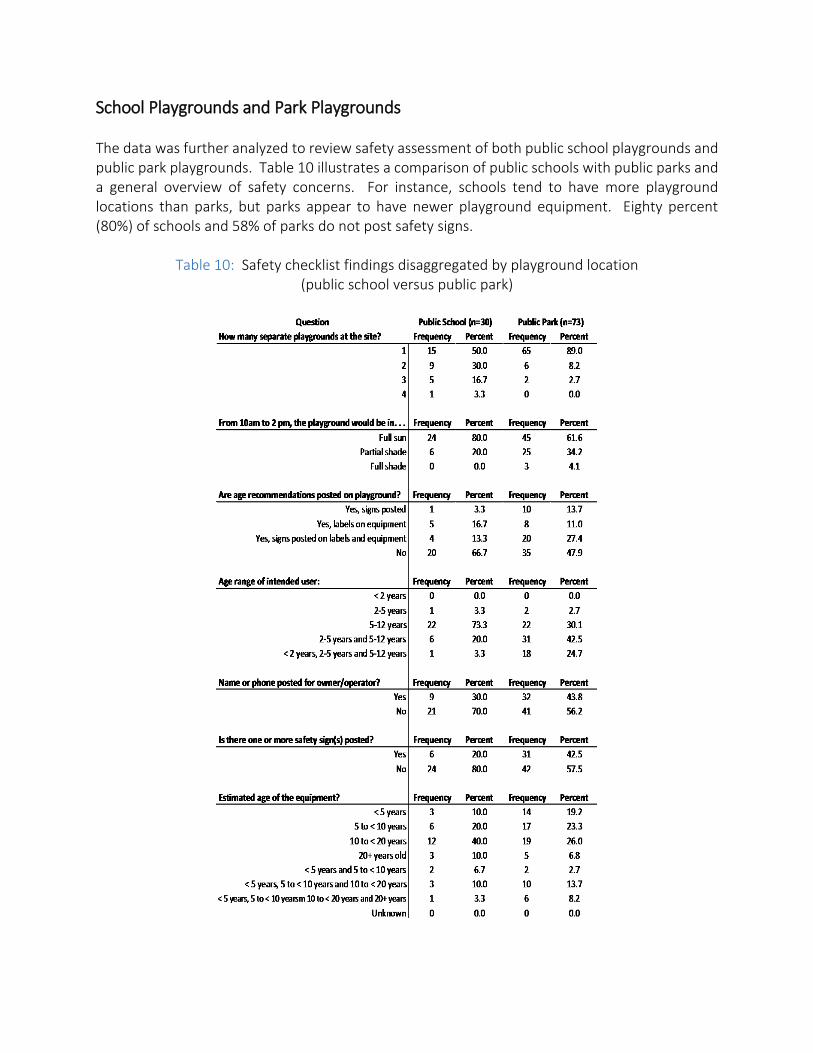
School Playgrounds and Park Playgrounds The data was further analyzed to review safety assessment of both public school playgrounds and public park playgrounds. Table 10 illustrates a comparison of public schools with public parks and a general overview of safety concerns. For instance, schools tend to have more playground locations than parks, but parks appear to have newer playground equipment. Eighty percent (80%) of schools and 58% of parks do not post safety signs.
Table 10: Safety checklist findings disaggregated by playground location (public school versus public park)
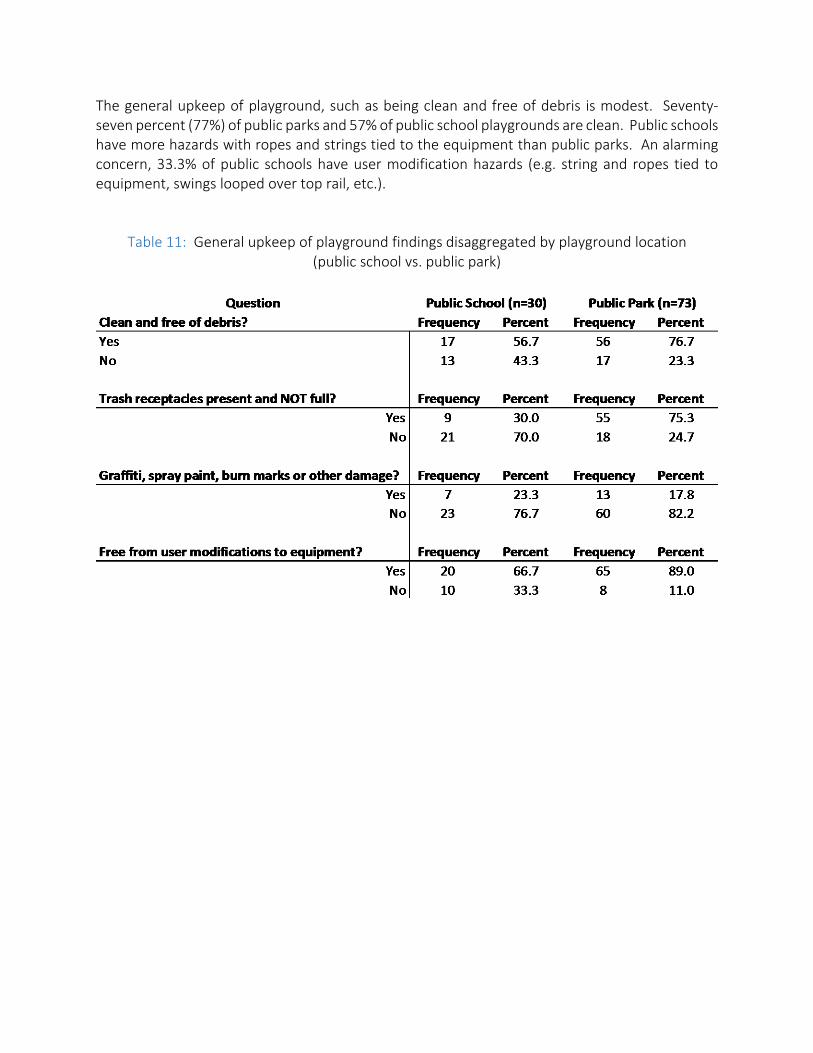
The general upkeep of playground, such as being clean and free of debris is modest. Seventy-seven percent (77%) of public parks and 57% of public school playgrounds are clean. Public schools have more hazards with ropes and strings tied to the equipment than public parks. An alarming concern, 33.3% of public schools have user modification hazards (e.g. string and ropes tied to equipment, swings looped over top rail, etc.).
Table 11: General upkeep of playground findings disaggregated by playground location (public school vs. public park)
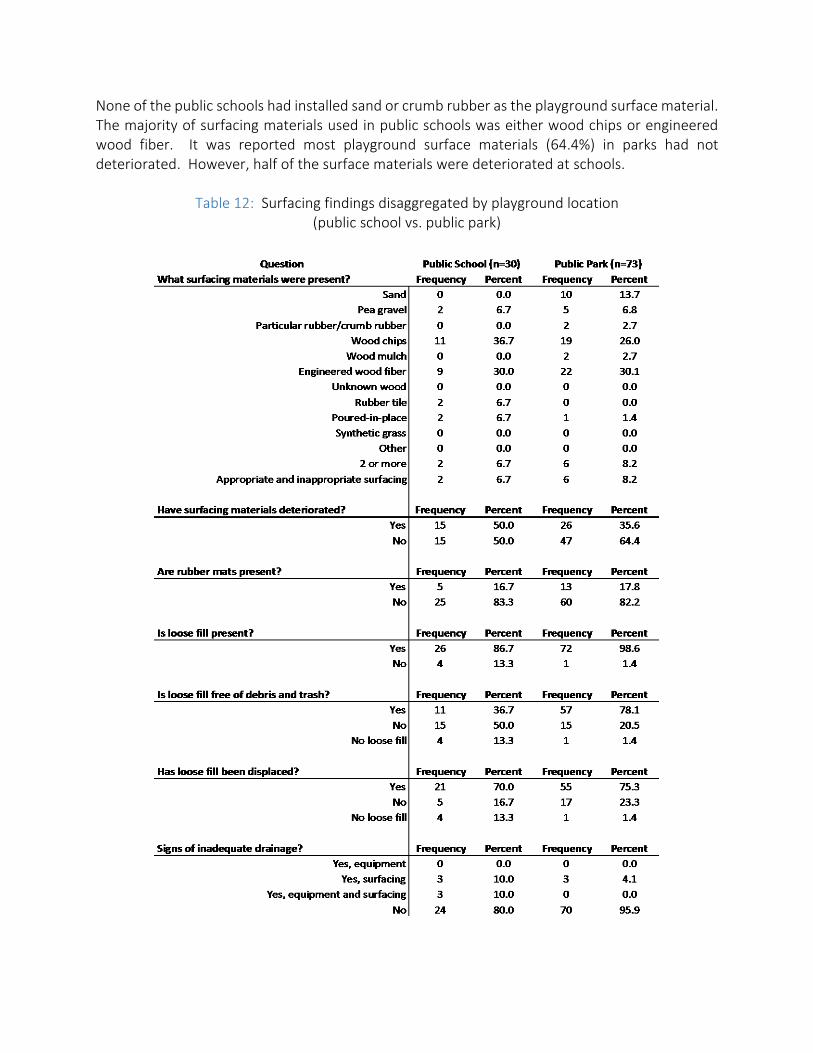
None of the public schools had installed sand or crumb rubber as the playground surface material. The majority of surfacing materials used in public schools was either wood chips or engineered wood fiber. It was reported most playground surface materials (64.4%) in parks had not deteriorated. However, half of the surface materials were deteriorated at schools.
Table 12: Surfacing findings disaggregated by playground location (public school vs. public park)
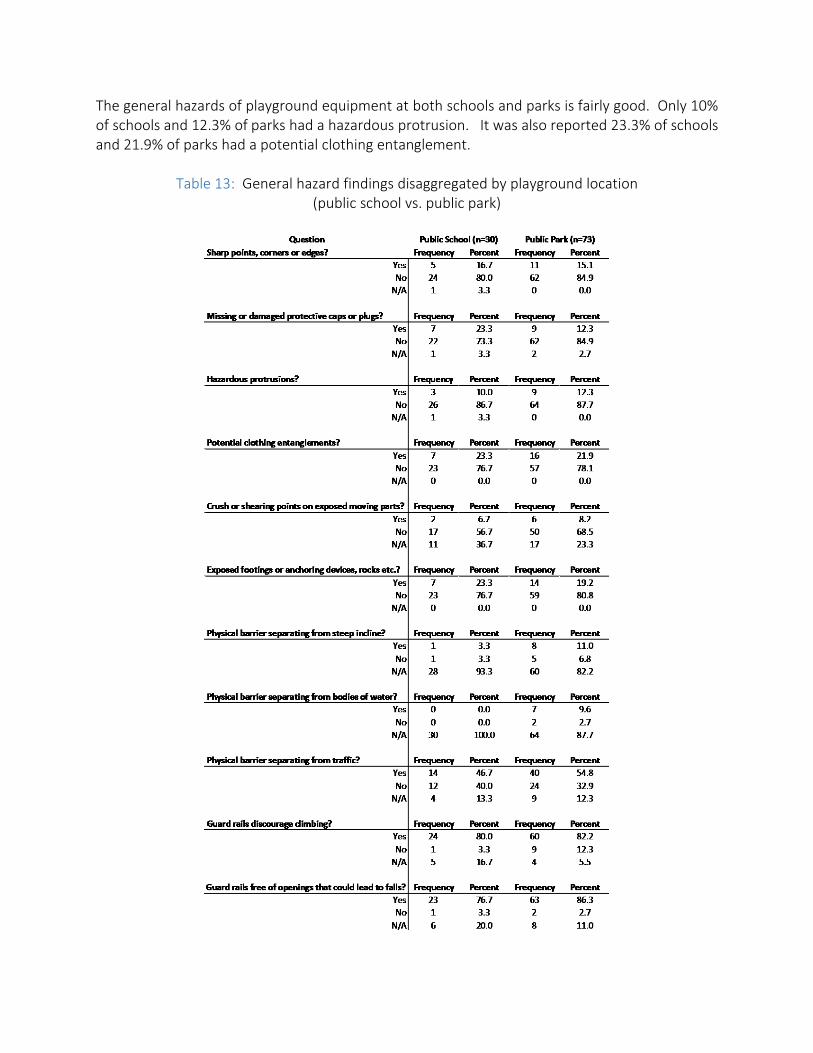
The general hazards of playground equipment at both schools and parks is fairly good. Only 10% of schools and 12.3% of parks had a hazardous protrusion. It was also reported 23.3% of schools and 21.9% of parks had a potential clothing entanglement.
Table 13: General hazard findings disaggregated by playground location (public school vs. public park)
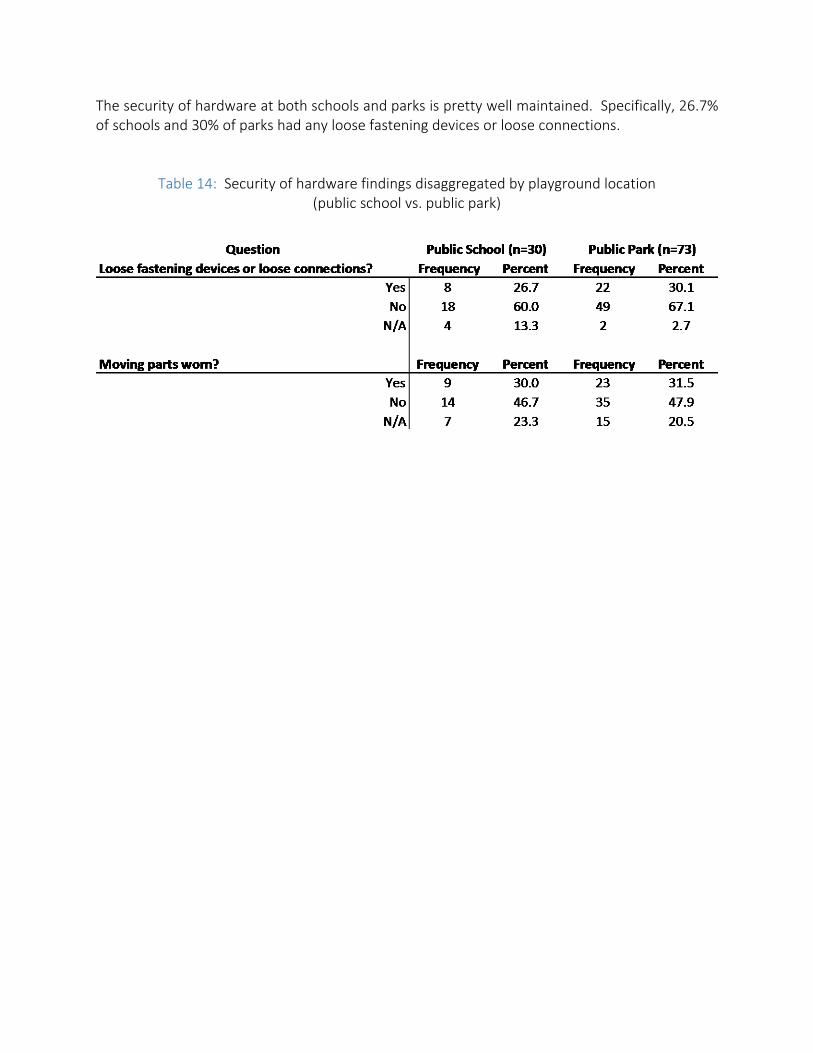
The security of hardware at both schools and parks is pretty well maintained. Specifically, 26.7% of schools and 30% of parks had any loose fastening devices or loose connections.
Table 14: Security of hardware findings disaggregated by playground location (public school vs. public park)
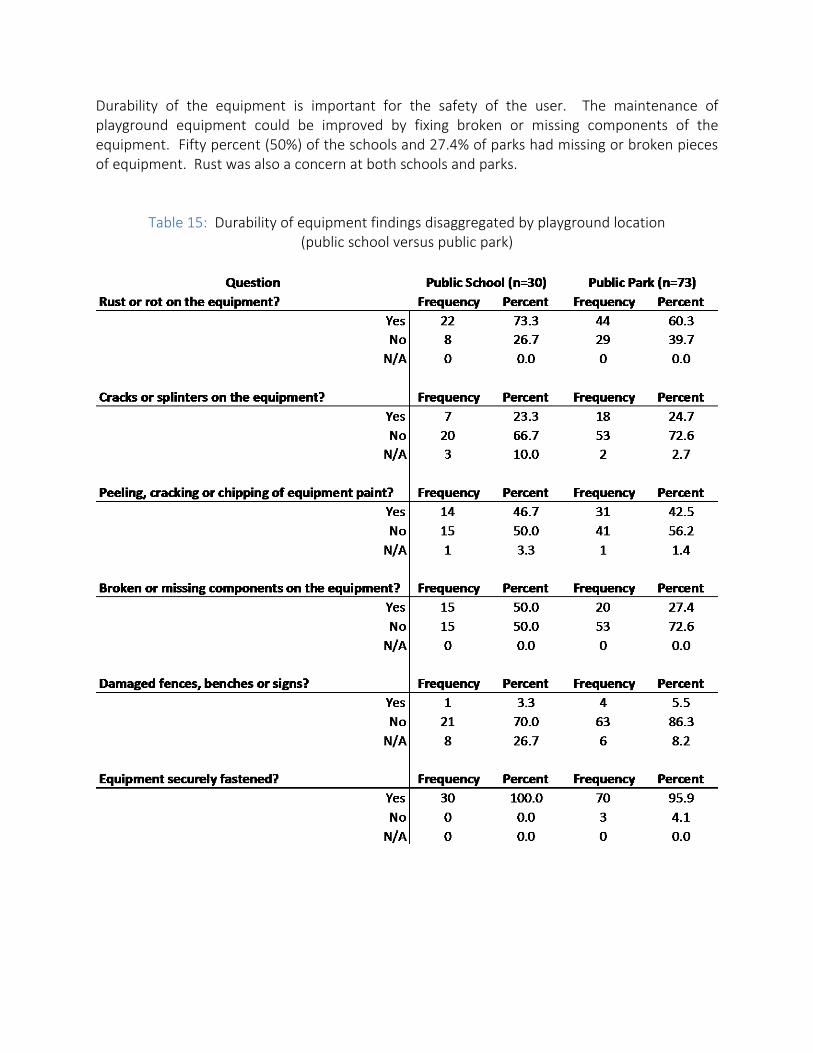
Durability of the equipment is important for the safety of the user. The maintenance of playground equipment could be improved by fixing broken or missing components of the equipment. Fifty percent (50%) of the schools and 27.4% of parks had missing or broken pieces of equipment. Rust was also a concern at both schools and parks.
Table 15: Durability of equipment findings disaggregated by playground location (public school versus public park)
Summary of Checklist The safety of each individual piece of playground equipment, as well as the layout and the entire environment of the play area, is a contributing factor to prevent playground injuries. Without routine inspection and repair, any equipment will deteriorate and pose a hazard to children using the equipment. The data have begun to highlight concerns with the safety elements of the condition of playgrounds. It appears that the maintenance of rust is problematic with 73% of playgrounds having rust present on the equipment. Another important factor is informing users of safety. Sixty-four percent (64%) of the playgrounds did not have any signs posted to inform users of safety concerns and age appropriateness of equipment. Additionally, there is an alarm with the number of loose ropes and strings attached to the playground equipment. Seventeen percent (17%) of playgrounds had user modifications to the equipment. An important effort continues to educate playground users on strangulation hazards. General upkeep of the playground is an important element in keeping children safe. The data disclosed that 22% of playgrounds had potential clothing entanglement hazards (e.g. open s-hooks and protruding bolts). Also, 15.5% of playgrounds had sharp points, corners, or edges on the playground equipment. It appears owner/operators are taking preventative measures, but, the data begins to report that once playgrounds are older than 10 years, there are more safety hazards present. Specifically, playground equipment which had been approximately located at the playground for more than 10 years had more clothing entanglements, hazardous protrusions, missing or damaged protective caps, and sharp points/edges than playgrounds installed less than five years. The data can assist in making efforts to improve the safety conditions of playgrounds.
Impact Attenuation Characteristics Background The 2013 publication of the American Society for Testing and Materials (ASTM) F1292 specification for impact attenuation of surface systems under and around playground equipment provides a standardized method for evaluation of attenuation of playground surfacing materials. Sections 16 through 19 of the voluntary standard provides field-testing methodology. The F1292 specification specifies impact attenuation performance requirements for playground surfaces and surfacing materials and provides a means of determining impact attenuation performance using a test method which simulates the impact of a child’s head with the surface. The test method quantifies impact in terms of (1) g-max (Peak Acceleration), which measures the maximum acceleration produced by an impact, and (2) Head Injury Criterion (HIC), which is an empirical measure of impact severity based on published research describing the relationship between the magnitude and duration of impact accelerations and the risk of head trauma. Any comparison between laboratory testing and field-testing when examining impact attenuation of playground surface materials should be done with extreme caution. Appendix C provides an observational comparison between laboratory testing and field-testing that was discussed and encountered during the study.
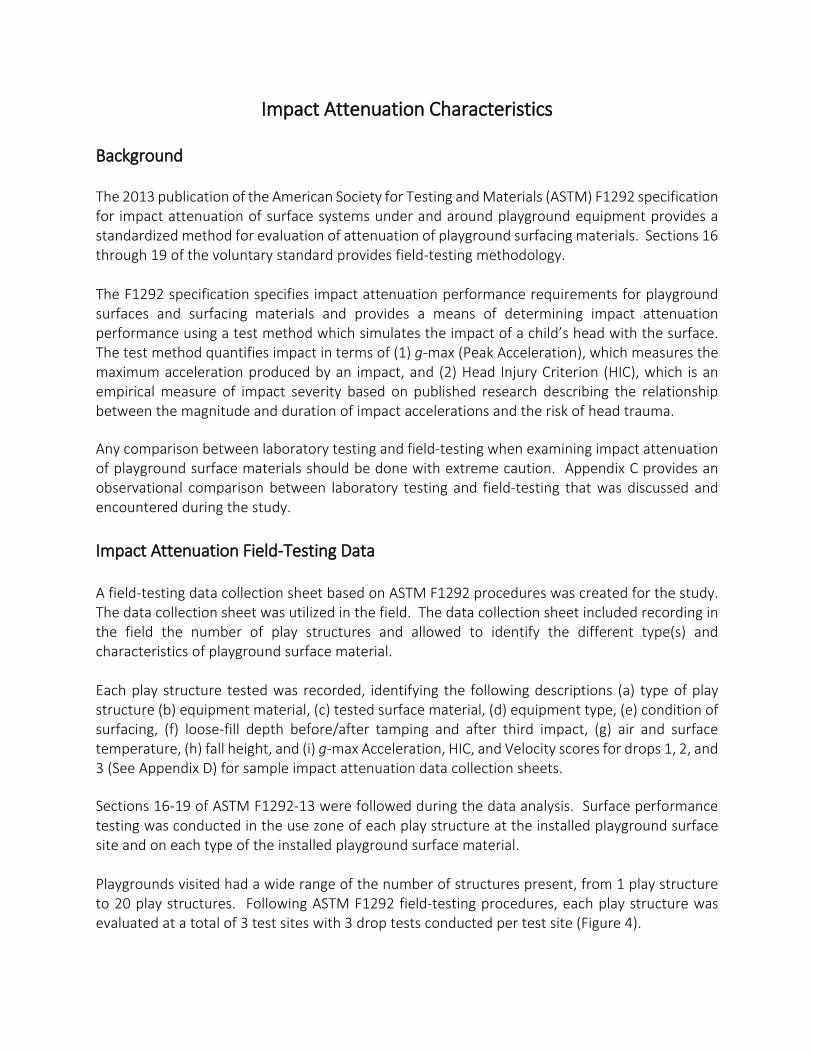
Impact Attenuation Field-Testing Data A field-testing data collection sheet based on ASTM F1292 procedures was created for the study. The data collection sheet was utilized in the field. The data collection sheet included recording in the field the number of play structures and allowed to identify the different type(s) and characteristics of playground surface material. Each play structure tested was recorded, identifying the following descriptions (a) type of play structure (b) equipment material, (c) tested surface material, (d) equipment type, (e) condition of surfacing, (f) loose-fill depth before/after tamping and after third impact, (g) air and surface temperature, (h) fall height, and (i) g-max Acceleration, HIC, and Velocity scores for drops 1, 2, and 3 (See Appendix D) for sample impact attenuation data collection sheets. Sections 16-19 of ASTM F1292-13 were followed during the data analysis. Surface performance testing was conducted in the use zone of each play structure at the installed playground surface site and on each type of the installed playground surface material. Playgrounds visited had a wide range of the number of structures present, from 1 play structure to 20 play structures. Following ASTM F1292 field-testing procedures, each play structure was evaluated at a total of 3 test sites with 3 drop tests conducted per test site (Figure 4).
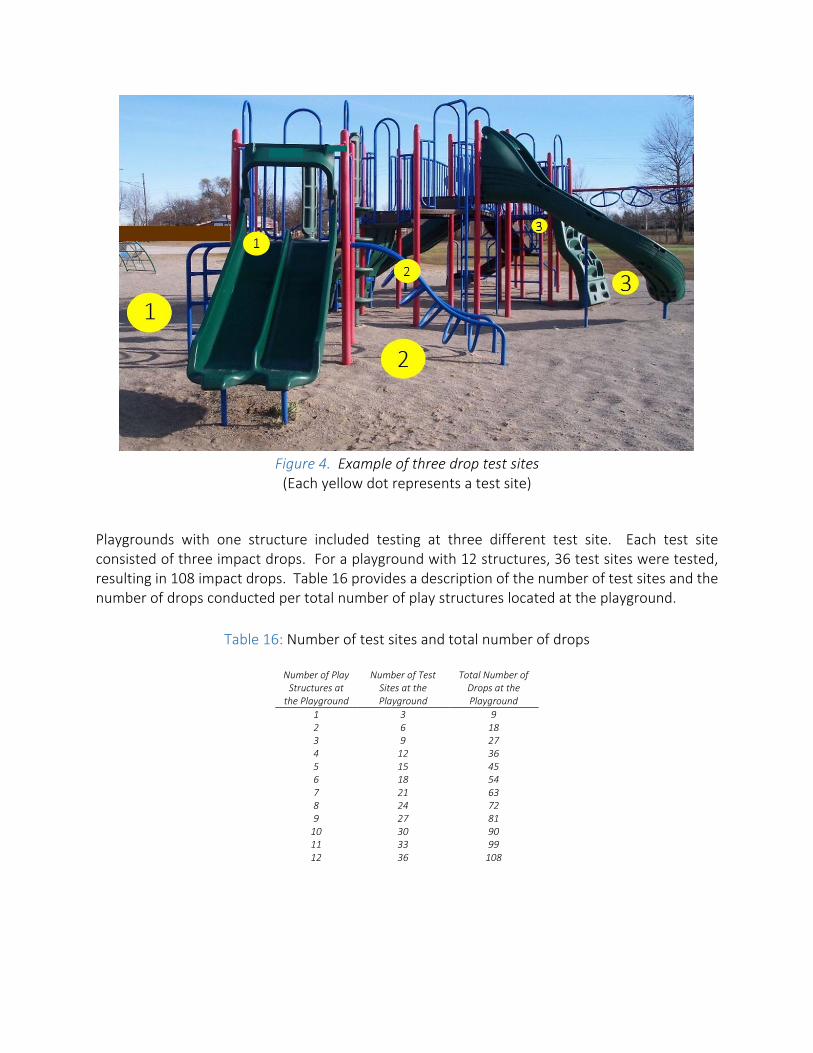
Figure 4. Example of three drop test sites
(Each yellow dot represents a test site) Playgrounds with one structure included testing at three different test site. Each test site consisted of three impact drops. For a playground with 12 structures, 36 test sites were tested, resulting in 108 impact drops. Table 16 provides a description of the number of test sites and the number of drops conducted per total number of play structures located at the playground.
Table 16: Number of test sites and total number of drops
Number of Play Structures at
the Playground
Number of Test Sites at the Playground
Total Number of Drops at the Playground
1 3 9 2 6 18 3 9 27 4 12 36 5 15 45 6 18 54 7 21 63 8 24 72 9 27 81
10 30 90 11 33 99 12 36 108
Description of Impact Attenuation Analysis The intent of the impact attenuation data was to evaluate certain performance requirements for g-max and HIC from ASTM F1292. The tabulated groupings for interpretation of test site performance, provided a summary statistics of number of test sites relative to the ASTM F1292 performance criteria, primarily using Microsoft Excel. The impact attenuation data generated descriptive statistics and an assessment of performance relative to F1292’s g-max requirement (200 g) and HIC performance (1000 HIC) criteria with respect to individual play structures tested in the field at the playground.
• Per ASTM F1292 (Section 9.3/20.4.2.3 ), the second and third drop tests for each test site are averaged and used for assessment purposes, as a result the first drop test data is not included in the analysis.
• Each play structure was evaluated to determine the number of test sites that fell below 200 g and/or 1000 HIC (e.g. it is possible that 3, 2, 1 or 0 test sites for each structure fell below these thresholds).
Results and Discussion Four hundred and fifteen (415) play structures were present at the 103 public playgrounds visited during the study. A total of 3,687 impact attenuation drops occurred following F1292 procedures. The impact attenuation analysis examined the play structures (n=415) which had inappropriate and appropriate playground surfacing materials under and around the use zone, as well as only the play structures (n=388) which had appropriate playground surfacing materials under and around the use zone. Inappropriate and Appropriate Surfacing Materials The majority of the 103 playgrounds had appropriate surfacing materials (e.g. loose-fill and unitary) under and around the play structures. However, eight playgrounds (6 parks and 2 schools) tested had 27 play structures with inappropriate surface material (e.g. grass, dirt, or concrete surface) under and around the play structure. Affording discretionary judgement to the field testers, these 27 inappropriate surfaces under the play structures were not tested because of the potential risk to the drop testing equipment, due to the hardness of the surface. It is important to note, nearly half (13 of the 27) of the play structures with inappropriate surfacing observed were found at one playground (located in a park). The analysis team was cautious when examining the effects of these surfaces on the aggregate dataset. While the majority of the analysis in the report excludes the inappropriate surfaces under 27 play structures from the impact attenuation data, it was desirable to understand the influence of
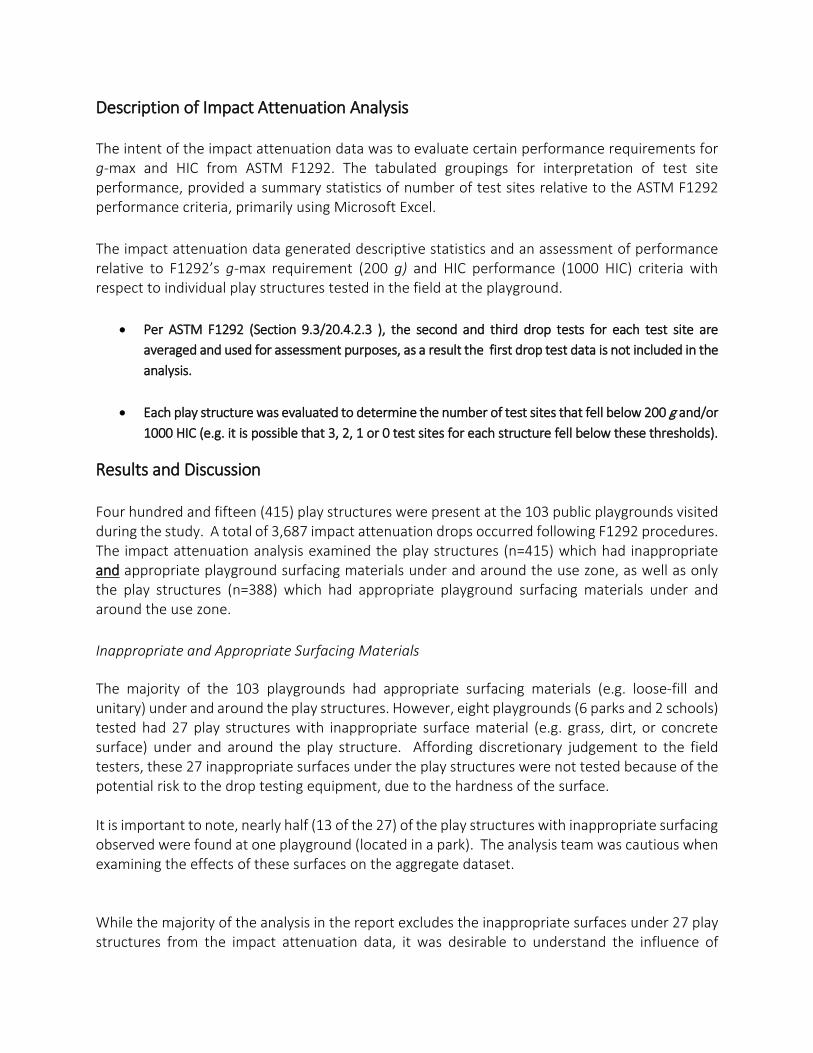
inappropriate surface materials relative to ASTM F1292 performance criterion. Table 17 represents inappropriate and appropriate surfacing materials under all play structures (n=415) at the 103 playgrounds. The number of test sites where the average of drops 2 & 3, fell below the ASTM F1292 threshold for g-max and HIC are reported.
Table 17: Impact attenuation results for appropriate and inappropriate surfacing materials under all play structures (n=415) with all three, two, one, or zero test sites demonstrating
g-max below 200 g’s and a HIC score below 1000.
*NOTE: Surfaces classified as “inappropriate surfaces” by field testers were categorized in the zero test sites column (judgement that all three test sites would exceed performance criterion).
Analyzing all play structures tested (n=415) at all three test sites (those with appropriate surfacing and without appropriate surfacing) found 87% of play structures fell below 200 g’s and 81% had a HIC score below 1000 at all three test sites (Table 17). These numbers would suggest, that overall roughly one of five playgrounds in a condition that would be inappropriate from an impact attenuation perspective. Further investigation of all three test sites play structures (n=415) result in 8% not meeting 200 g’s and 9% did not meet a HIC score below 1000 at any of the drop test site.
3 2 1 0 3 2 1 0All Structures (n=415) 360 (87%) 16 (4%) 5 (1%) 34 (8%) 338 (81%) 29 (7%) 9 (2%) 39 (9%)
g -max HIC# Sites Below 200g # Sites Below 1000
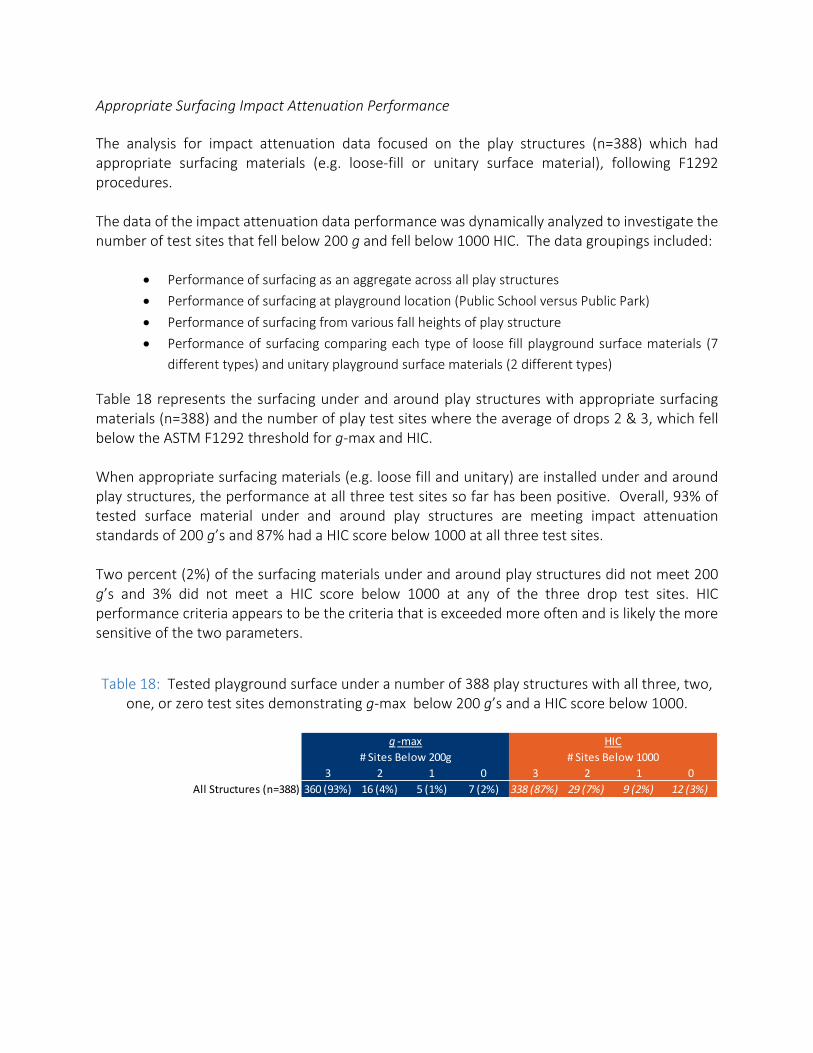
Appropriate Surfacing Impact Attenuation Performance The analysis for impact attenuation data focused on the play structures (n=388) which had appropriate surfacing materials (e.g. loose-fill or unitary surface material), following F1292 procedures. The data of the impact attenuation data performance was dynamically analyzed to investigate the number of test sites that fell below 200 g and fell below 1000 HIC. The data groupings included:
• Performance of surfacing as an aggregate across all play structures • Performance of surfacing at playground location (Public School versus Public Park) • Performance of surfacing from various fall heights of play structure • Performance of surfacing comparing each type of loose fill playground surface materials (7
different types) and unitary playground surface materials (2 different types)
Table 18 represents the surfacing under and around play structures with appropriate surfacing materials (n=388) and the number of play test sites where the average of drops 2 & 3, which fell below the ASTM F1292 threshold for g-max and HIC. When appropriate surfacing materials (e.g. loose fill and unitary) are installed under and around play structures, the performance at all three test sites so far has been positive. Overall, 93% of tested surface material under and around play structures are meeting impact attenuation standards of 200 g’s and 87% had a HIC score below 1000 at all three test sites. Two percent (2%) of the surfacing materials under and around play structures did not meet 200 g’s and 3% did not meet a HIC score below 1000 at any of the three drop test sites. HIC performance criteria appears to be the criteria that is exceeded more often and is likely the more sensitive of the two parameters.
Table 18: Tested playground surface under a number of 388 play structures with all three, two, one, or zero test sites demonstrating g-max below 200 g’s and a HIC score below 1000.
3 2 1 0 3 2 1 0All Structures (n=388) 360 (93%) 16 (4%) 5 (1%) 7 (2%) 338 (87%) 29 (7%) 9 (2%) 12 (3%)
g -max HIC# Sites Below 200g # Sites Below 1000
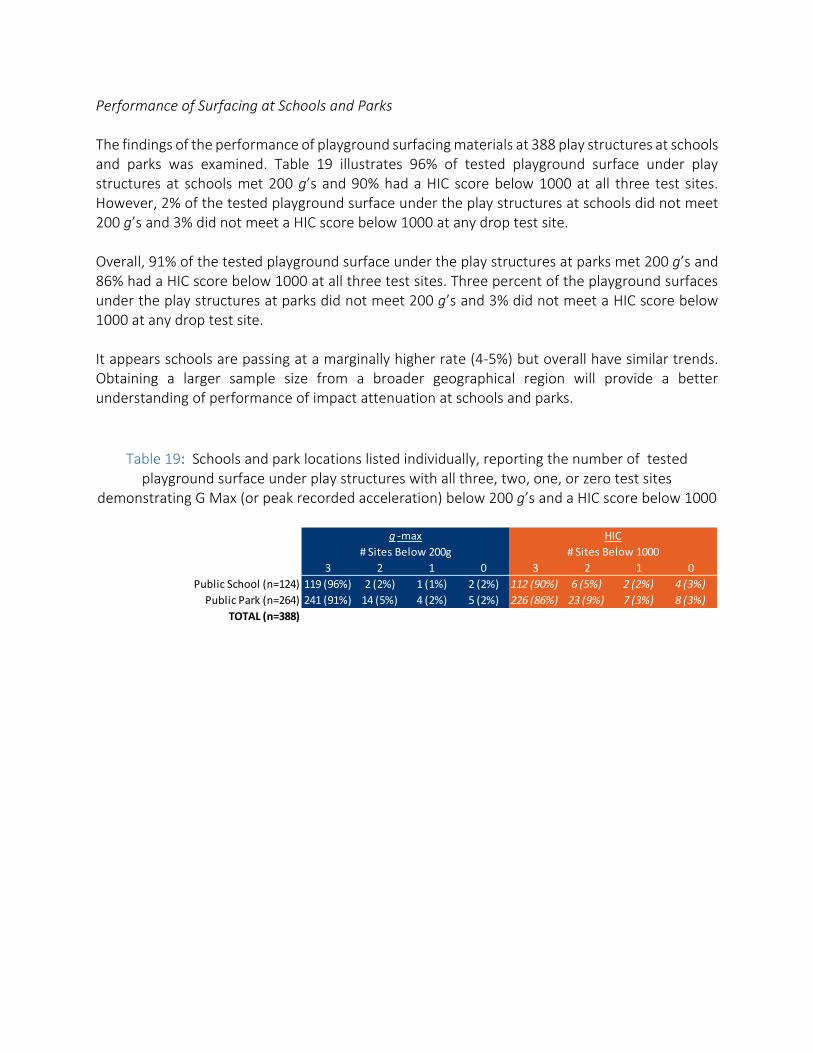
Performance of Surfacing at Schools and Parks The findings of the performance of playground surfacing materials at 388 play structures at schools and parks was examined. Table 19 illustrates 96% of tested playground surface under play structures at schools met 200 g’s and 90% had a HIC score below 1000 at all three test sites. However, 2% of the tested playground surface under the play structures at schools did not meet 200 g’s and 3% did not meet a HIC score below 1000 at any drop test site. Overall, 91% of the tested playground surface under the play structures at parks met 200 g’s and 86% had a HIC score below 1000 at all three test sites. Three percent of the playground surfaces under the play structures at parks did not meet 200 g’s and 3% did not meet a HIC score below 1000 at any drop test site. It appears schools are passing at a marginally higher rate (4-5%) but overall have similar trends. Obtaining a larger sample size from a broader geographical region will provide a better understanding of performance of impact attenuation at schools and parks.
Table 19: Schools and park locations listed individually, reporting the number of tested playground surface under play structures with all three, two, one, or zero test sites
demonstrating G Max (or peak recorded acceleration) below 200 g’s and a HIC score below 1000
3 2 1 0 3 2 1 0Public School (n=124) 119 (96%) 2 (2%) 1 (1%) 2 (2%) 112 (90%) 6 (5%) 2 (2%) 4 (3%)
Public Park (n=264) 241 (91%) 14 (5%) 4 (2%) 5 (2%) 226 (86%) 23 (9%) 7 (3%) 8 (3%)TOTAL (n=388)
# Sites Below 1000g -max HIC
# Sites Below 200g
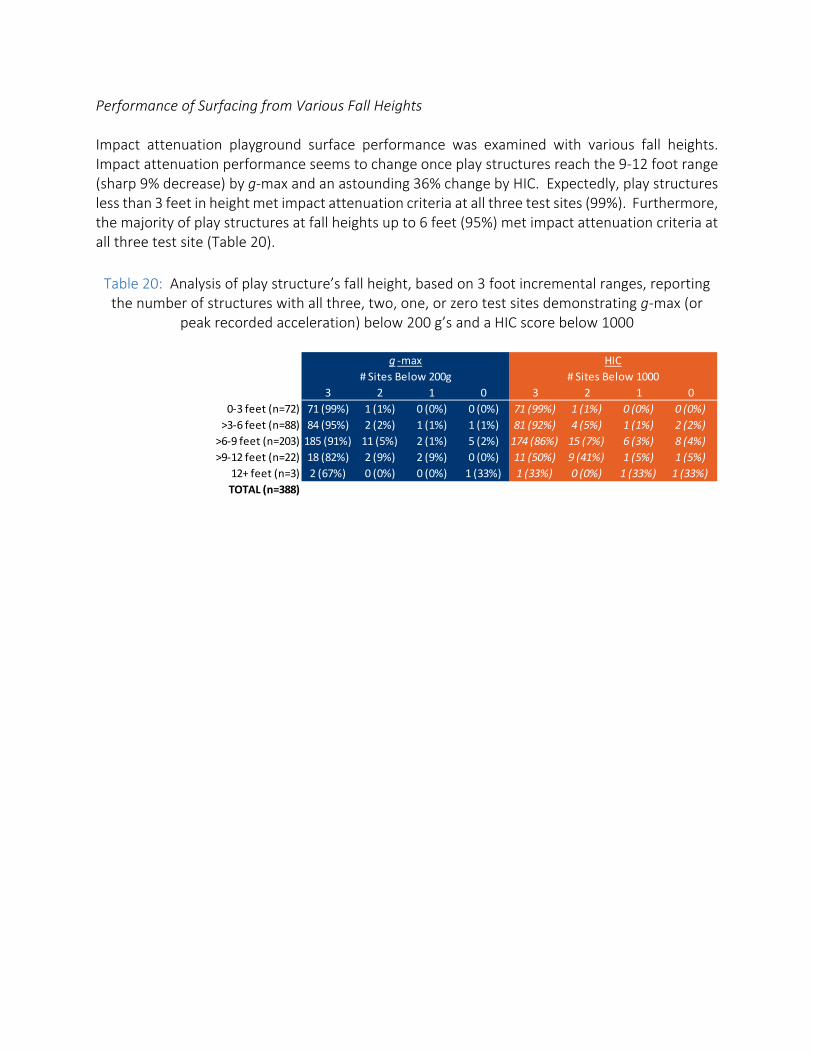
Performance of Surfacing from Various Fall Heights Impact attenuation playground surface performance was examined with various fall heights. Impact attenuation performance seems to change once play structures reach the 9-12 foot range (sharp 9% decrease) by g-max and an astounding 36% change by HIC. Expectedly, play structures less than 3 feet in height met impact attenuation criteria at all three test sites (99%). Furthermore, the majority of play structures at fall heights up to 6 feet (95%) met impact attenuation criteria at all three test site (Table 20).
Table 20: Analysis of play structure’s fall height, based on 3 foot incremental ranges, reporting the number of structures with all three, two, one, or zero test sites demonstrating g-max (or
peak recorded acceleration) below 200 g’s and a HIC score below 1000
3 2 1 0 3 2 1 00-3 feet (n=72) 71 (99%) 1 (1%) 0 (0%) 0 (0%) 71 (99%) 1 (1%) 0 (0%) 0 (0%)
>3-6 feet (n=88) 84 (95%) 2 (2%) 1 (1%) 1 (1%) 81 (92%) 4 (5%) 1 (1%) 2 (2%)>6-9 feet (n=203) 185 (91%) 11 (5%) 2 (1%) 5 (2%) 174 (86%) 15 (7%) 6 (3%) 8 (4%)>9-12 feet (n=22) 18 (82%) 2 (9%) 2 (9%) 0 (0%) 11 (50%) 9 (41%) 1 (5%) 1 (5%)
12+ feet (n=3) 2 (67%) 0 (0%) 0 (0%) 1 (33%) 1 (33%) 0 (0%) 1 (33%) 1 (33%)TOTAL (n=388)
g -max HIC# Sites Below 200g # Sites Below 1000
Loose Fill and Unitary Materials Table 21 outlines each playground surface material tested. From the results, it appears all the playground surface materials are performing appropriately at all three test sites. However, there is a difference in the impact attenuation performance when comparing surface material type. The playground surface materials with n> 30, wood chips and engineered wood fiber fell below 200 g’s or 1000 HIC cutoffs at higher rates (90-100%) than sand, pea gravel, or poured-in-place materials (65-85%). Future work will include statistical analysis of these performance differences as the number of playgrounds tested increases.
Table 21: Analysis of each surfacing material, reporting the number of structures with all three, two, one, or zero test sites demonstrating g-max below 200 g’s
and a HIC score below 1000
3 2 1 0 3 2 1 0Sand (n=34) 29 (85%) 3 (9%) 2 (6%) 0 (0%) 28 (82%) 3 (9%) 2 (6%) 1 (3%)
Pea Gravel (n=40) 32 (80%) 5 (13%) 1 (3%) 2 (5%) 26 (65%) 7 (18%) 4 (10%) 3 (8%)Particular Rubber/Crumb Rubber (n=1) 1 (100%) 0 (0%) 0 (0%) 0 (0%) 1 (100%) 0 (0%) 0 (0%) 0 (0%)
Wood Chips (n=126) 122 (97%) 4 (3%) 0 (0%) 0 (0%) 114 (90%) 12 (10%) 0 (0%) 0 (0%)Wood Mulch (n=7) 7 (100%) 0 (0%) 0 (0%) 0 (0%) 7 (100%) 0 (0%) 0 (0%) 0 (0%)
Engineered Wood Fiber (n=132) 130 (98%) 1 (1%) 0 (0%) 1 (1%) 127 (96%) 3 (2%) 1 (1%) 1 (1%)Unknown Wood (n=0) 0 0 0 0 0% 0% 0% 0%
Rubber Tile (n=12) 12 (100%) 0 (0%) 0 (0%) 0 (0%) 11 (92%) 0 (0%) 0 (0%) 1 (8%)Poured-in-Place (n=34) 27 (79%) 1 (3%) 2 (6%) 4 (12%) 24 (71%) 2 (6%) 2 (6%) 6 (18%)
Synthetic Grass (n=0) 0 0 0 0 0% 0% 0% 0%Other (n=2) 0 (0%) 2 (100%) 0 (0%) 0 (0%) 0 (0%) 2 (100%) 0 (0%) 0 (0%)
TOTAL (n=388)
g -max HIC# Sites Below 200g # Sites Below 1000
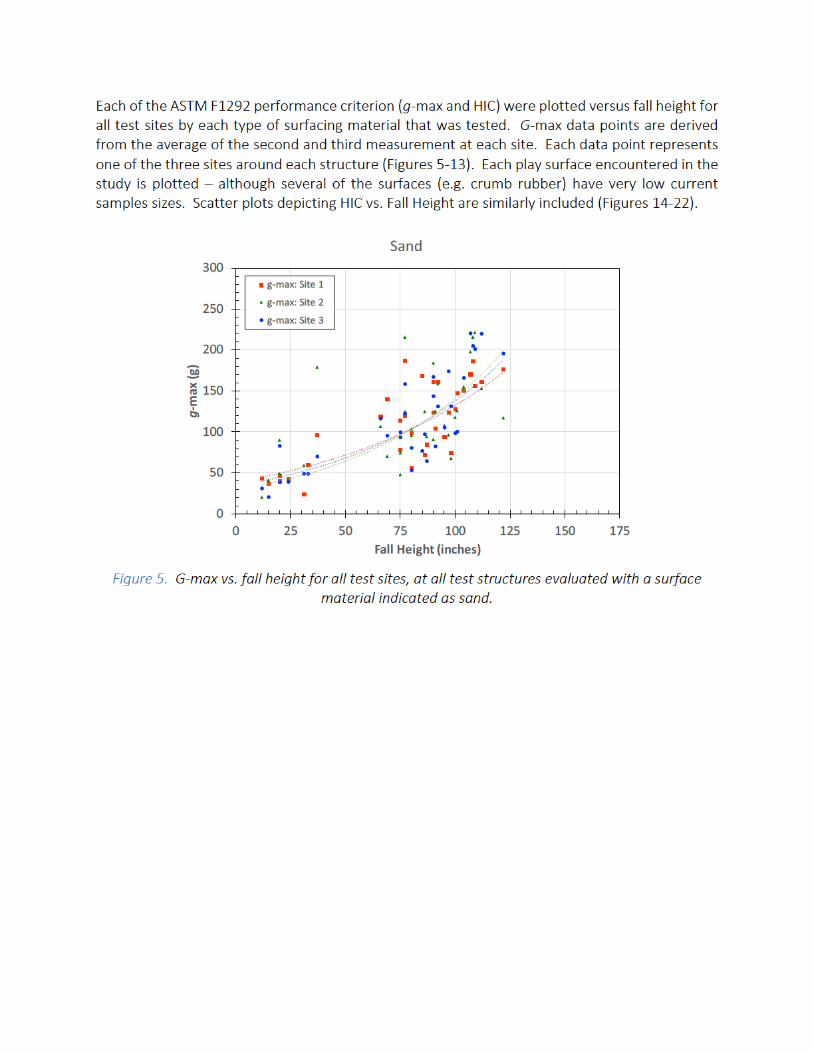
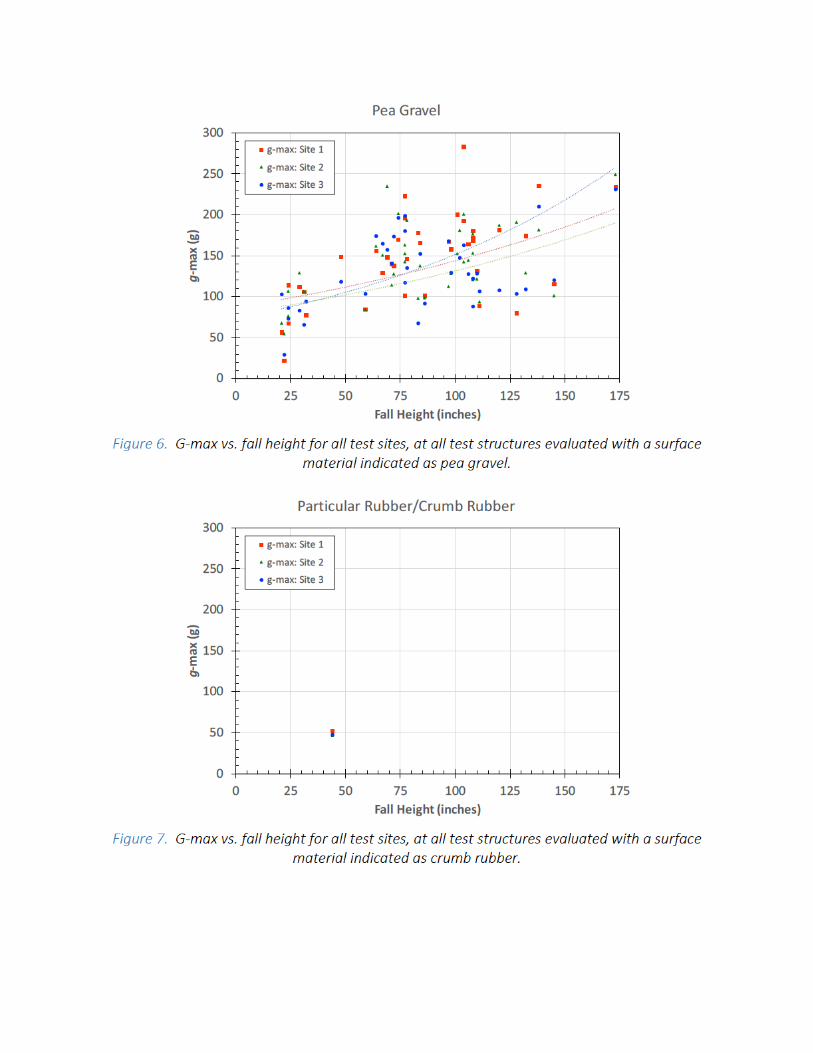
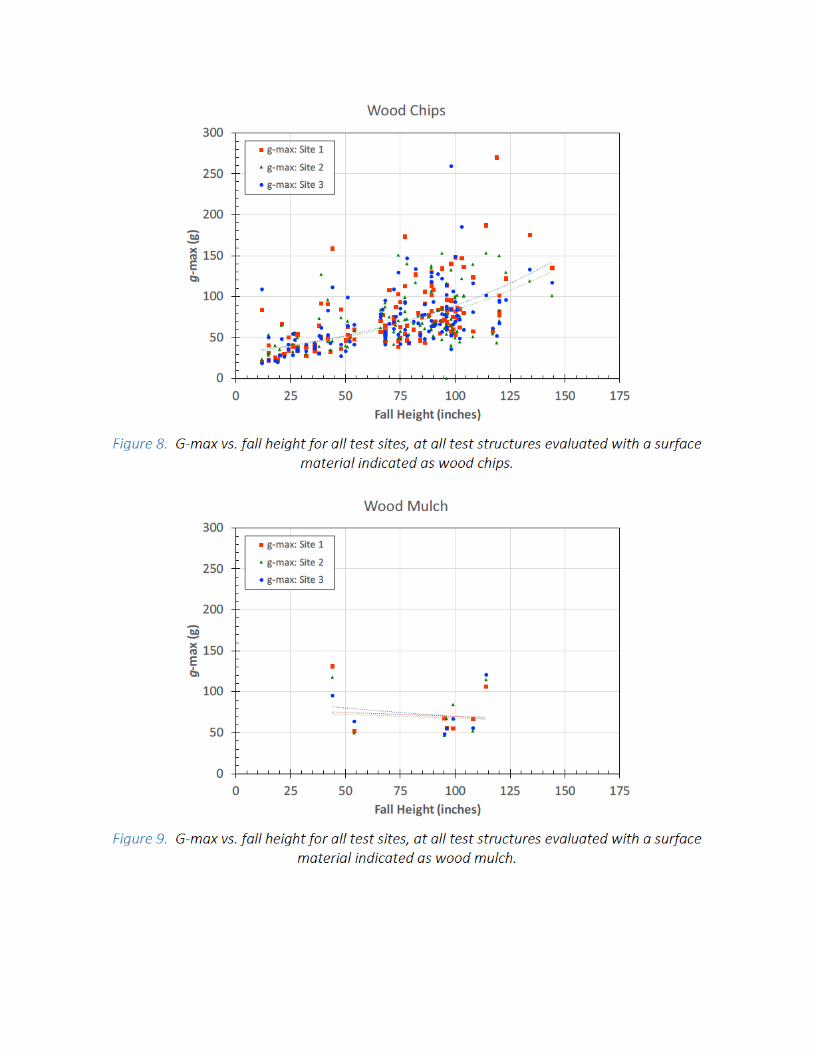
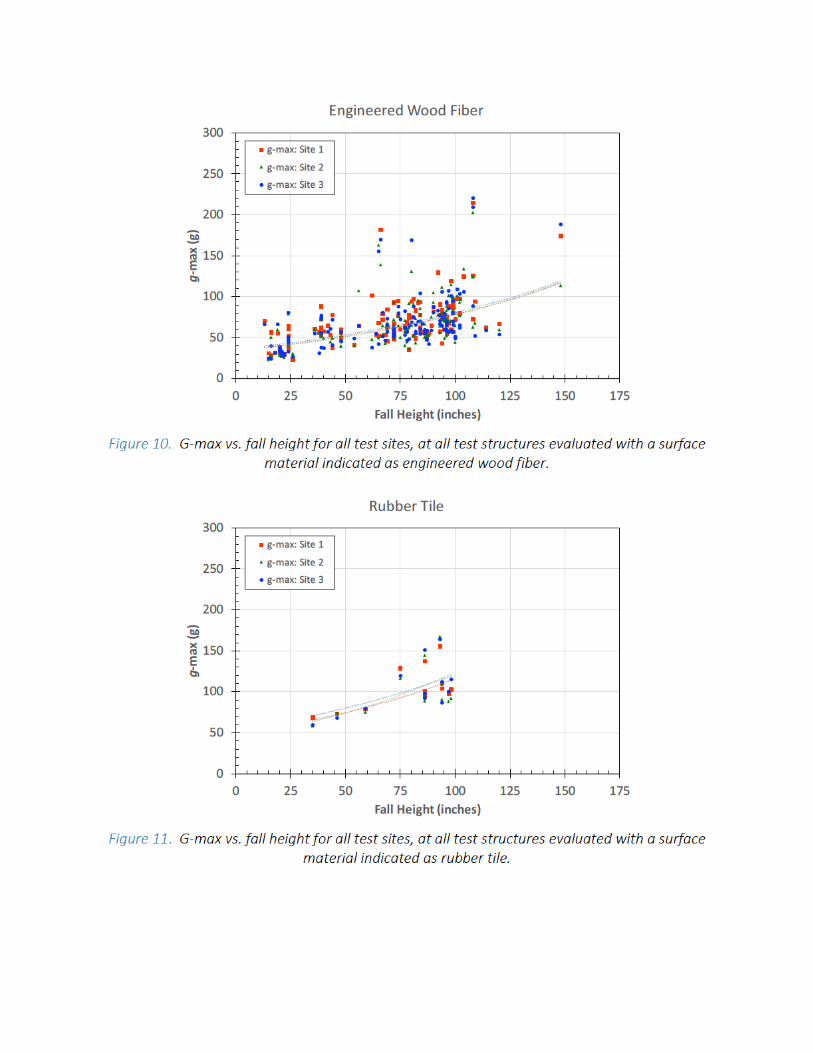
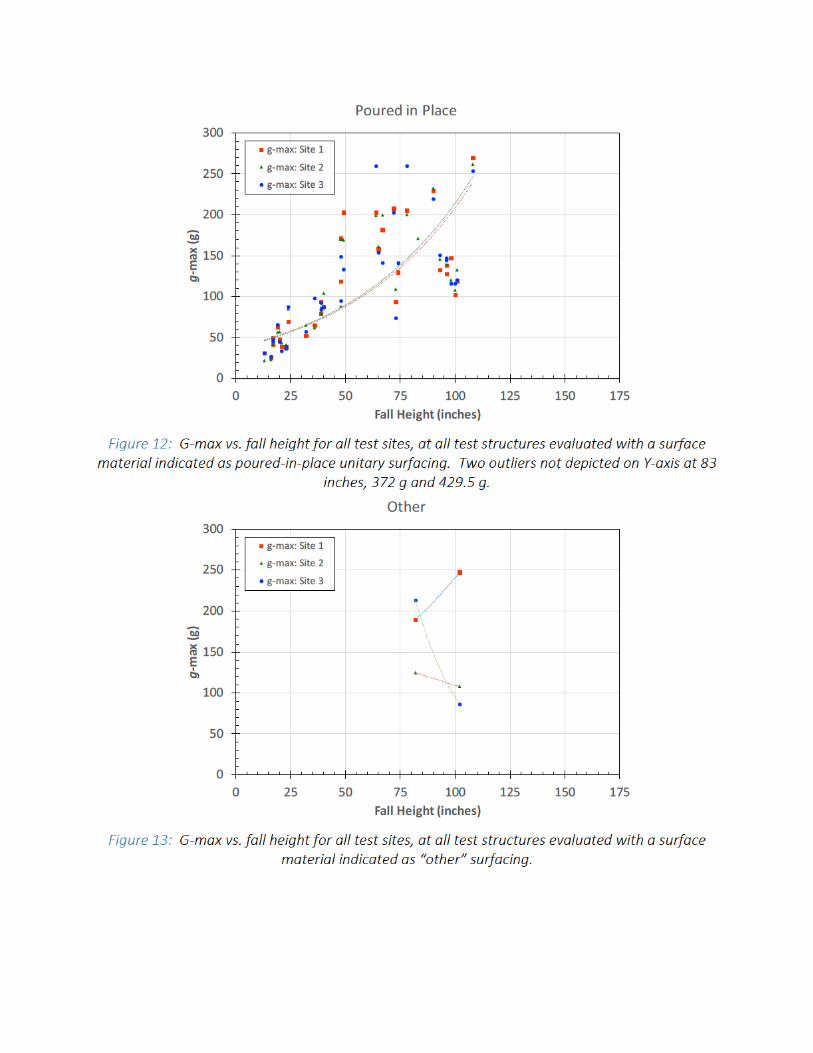
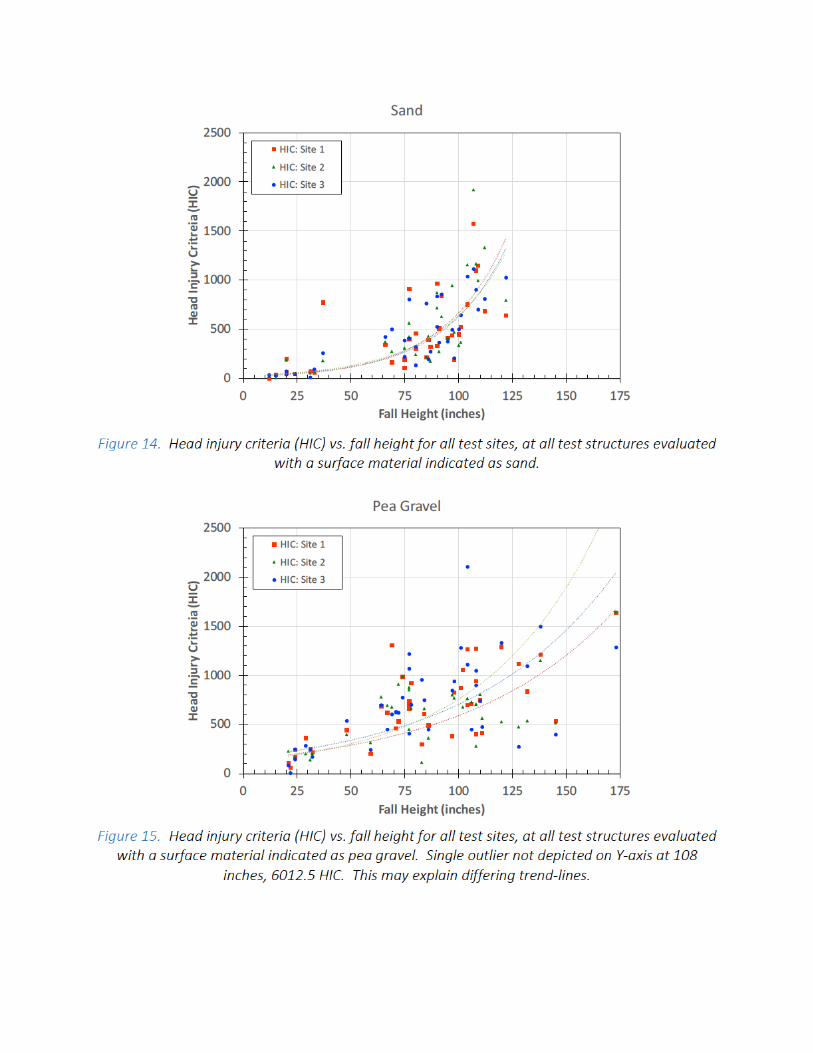
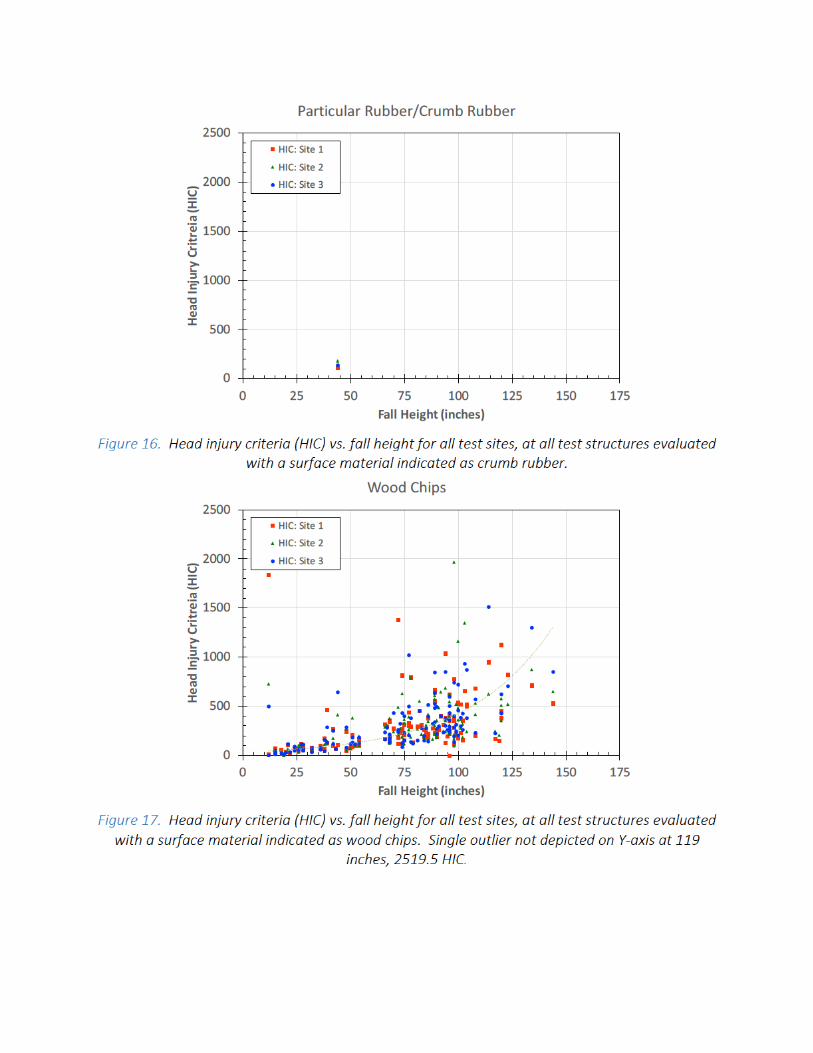
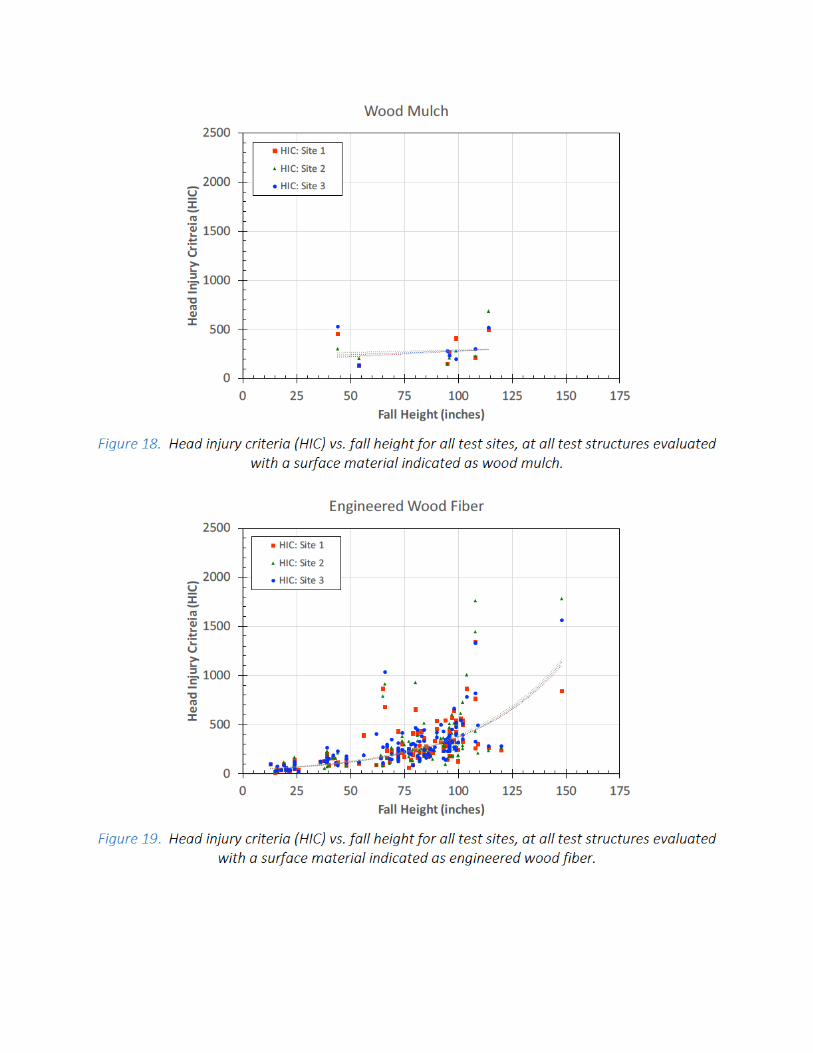
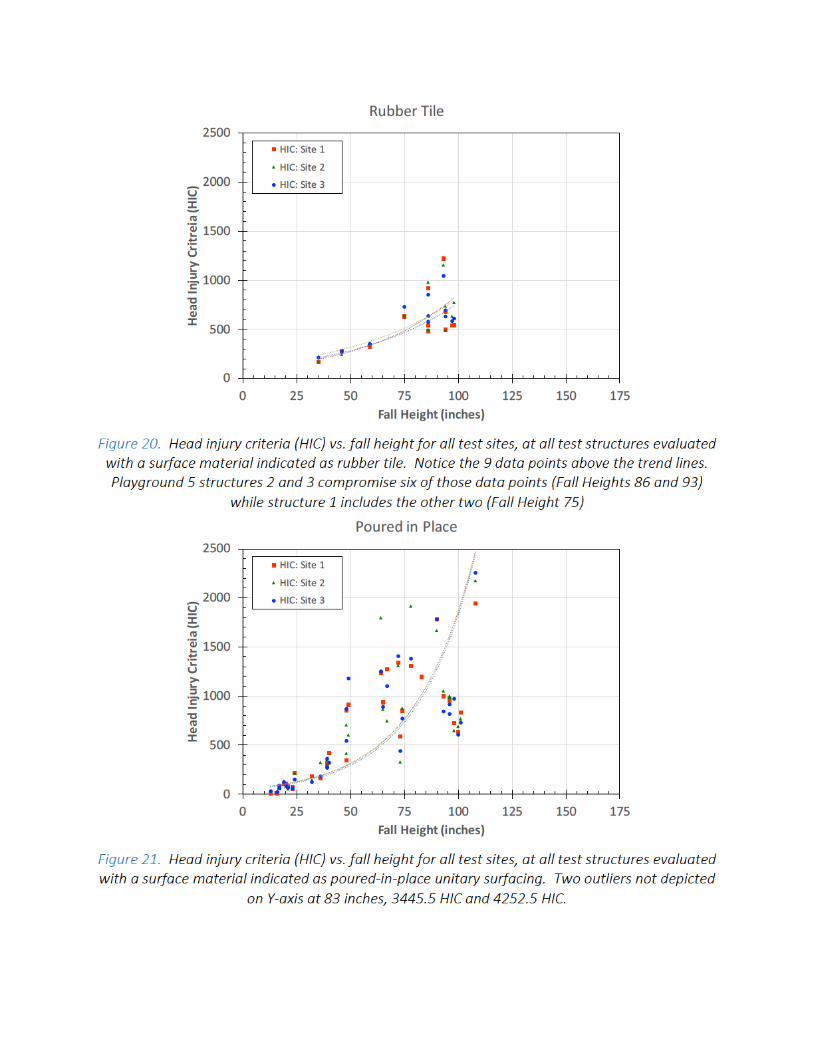
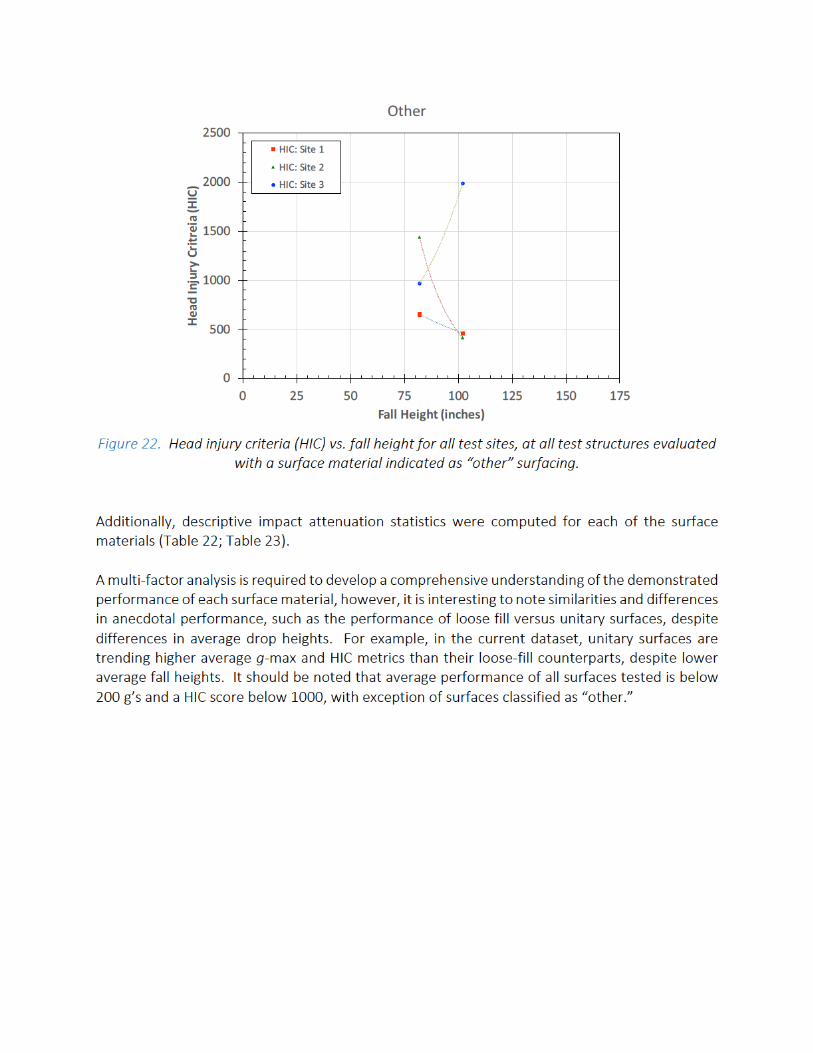
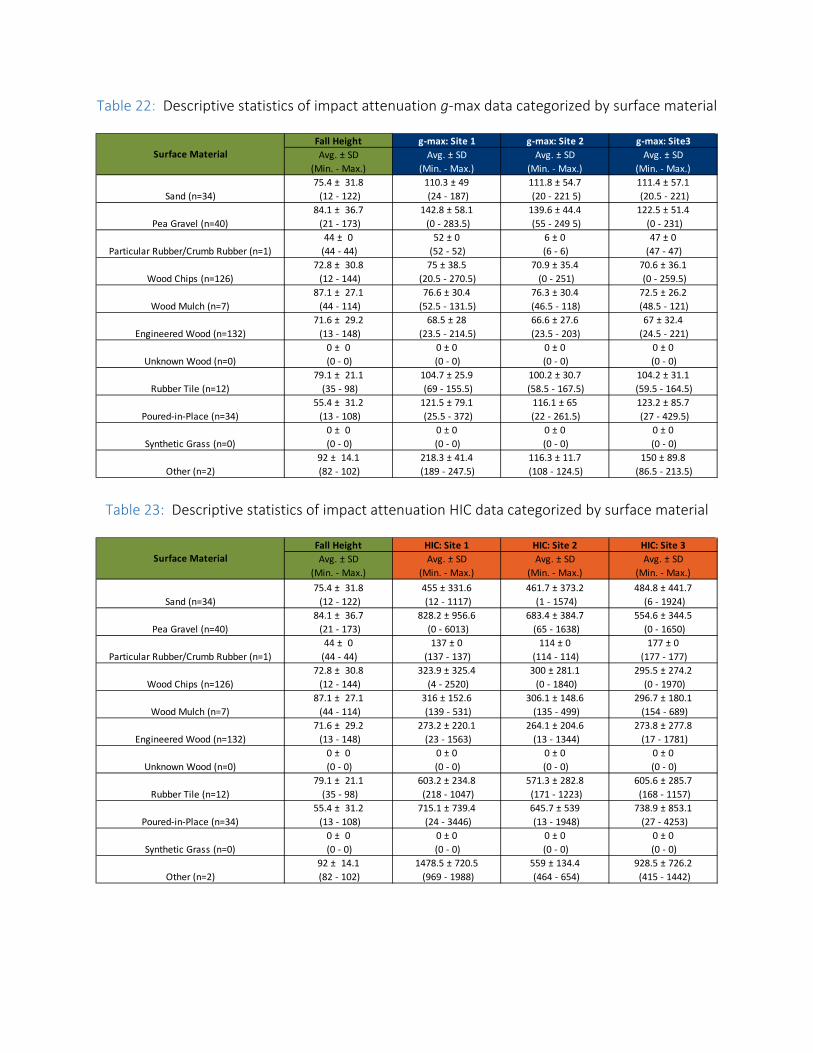
Table 22: Descriptive statistics of impact attenuation g-max data categorized by surface material
Table 23: Descriptive statistics of impact attenuation HIC data categorized by surface material
Fall Height g-max: Site 1 g-max: Site 2 g-max: Site3Avg. ± SD
(Min. - Max.)Avg. ± SD
(Min. - Max.)Avg. ± SD
(Min. - Max.)Avg. ± SD
(Min. - Max.)
Sand (n=34)75.4 ± 31.8 (12 - 122)
110.3 ± 49 (24 - 187)
111.8 ± 54.7 (20 - 221 5)
111.4 ± 57.1 (20.5 - 221)
Pea Gravel (n=40)84.1 ± 36.7 (21 - 173)
142.8 ± 58.1 (0 - 283.5)
139.6 ± 44.4 (55 - 249 5)
122.5 ± 51.4 (0 - 231)
Particular Rubber/Crumb Rubber (n=1)44 ± 0
(44 - 44)52 ± 0
(52 - 52)6 ± 0
(6 - 6)47 ± 0
(47 - 47)
Wood Chips (n=126)72.8 ± 30.8 (12 - 144)
75 ± 38.5 (20.5 - 270.5)
70.9 ± 35.4 (0 - 251)
70.6 ± 36.1 (0 - 259.5)
Wood Mulch (n=7)87.1 ± 27.1 (44 - 114)
76.6 ± 30.4 (52.5 - 131.5)
76.3 ± 30.4 (46.5 - 118)
72.5 ± 26.2 (48.5 - 121)
Engineered Wood (n=132)71.6 ± 29.2 (13 - 148)
68.5 ± 28 (23.5 - 214.5)
66.6 ± 27.6 (23.5 - 203)
67 ± 32.4 (24.5 - 221)
Unknown Wood (n=0)0 ± 0
(0 - 0)0 ± 0
(0 - 0)0 ± 0
(0 - 0)0 ± 0
(0 - 0)
Rubber Tile (n=12)79.1 ± 21.1
(35 - 98)104.7 ± 25.9 (69 - 155.5)
100.2 ± 30.7 (58.5 - 167.5)
104.2 ± 31.1 (59.5 - 164.5)
Poured-in-Place (n=34)55.4 ± 31.2 (13 - 108)
121.5 ± 79.1 (25.5 - 372)
116.1 ± 65 (22 - 261.5)
123.2 ± 85.7 (27 - 429.5)
Synthetic Grass (n=0)0 ± 0
(0 - 0)0 ± 0
(0 - 0)0 ± 0
(0 - 0)0 ± 0
(0 - 0)
Other (n=2)92 ± 14.1 (82 - 102)
218.3 ± 41.4 (189 - 247.5)
116.3 ± 11.7 (108 - 124.5)
150 ± 89.8 (86.5 - 213.5)
Surface Material
Fall Height HIC: Site 1 HIC: Site 2 HIC: Site 3Avg. ± SD
(Min. - Max.)Avg. ± SD
(Min. - Max.)Avg. ± SD
(Min. - Max.)Avg. ± SD
(Min. - Max.)
Sand (n=34)75.4 ± 31.8 (12 - 122)
455 ± 331.6 (12 - 1117)
461.7 ± 373.2 (1 - 1574)
484.8 ± 441.7 (6 - 1924)
Pea Gravel (n=40)84.1 ± 36.7 (21 - 173)
828.2 ± 956.6 (0 - 6013)
683.4 ± 384.7 (65 - 1638)
554.6 ± 344.5 (0 - 1650)
Particular Rubber/Crumb Rubber (n=1)44 ± 0
(44 - 44)137 ± 0
(137 - 137)114 ± 0
(114 - 114)177 ± 0
(177 - 177)
Wood Chips (n=126)72.8 ± 30.8 (12 - 144)
323.9 ± 325.4 (4 - 2520)
300 ± 281.1 (0 - 1840)
295.5 ± 274.2 (0 - 1970)
Wood Mulch (n=7)87.1 ± 27.1 (44 - 114)
316 ± 152.6 (139 - 531)
306.1 ± 148.6 (135 - 499)
296.7 ± 180.1 (154 - 689)
Engineered Wood (n=132)71.6 ± 29.2 (13 - 148)
273.2 ± 220.1 (23 - 1563)
264.1 ± 204.6 (13 - 1344)
273.8 ± 277.8 (17 - 1781)
Unknown Wood (n=0)0 ± 0
(0 - 0)0 ± 0
(0 - 0)0 ± 0
(0 - 0)0 ± 0
(0 - 0)
Rubber Tile (n=12)79.1 ± 21.1
(35 - 98)603.2 ± 234.8 (218 - 1047)
571.3 ± 282.8 (171 - 1223)
605.6 ± 285.7 (168 - 1157)
Poured-in-Place (n=34)55.4 ± 31.2 (13 - 108)
715.1 ± 739.4 (24 - 3446)
645.7 ± 539 (13 - 1948)
738.9 ± 853.1 (27 - 4253)
Synthetic Grass (n=0)0 ± 0
(0 - 0)0 ± 0
(0 - 0)0 ± 0
(0 - 0)0 ± 0
(0 - 0)
Other (n=2)92 ± 14.1 (82 - 102)
1478.5 ± 720.5 (969 - 1988)
559 ± 134.4 (464 - 654)
928.5 ± 726.2 (415 - 1442)
Surface Material
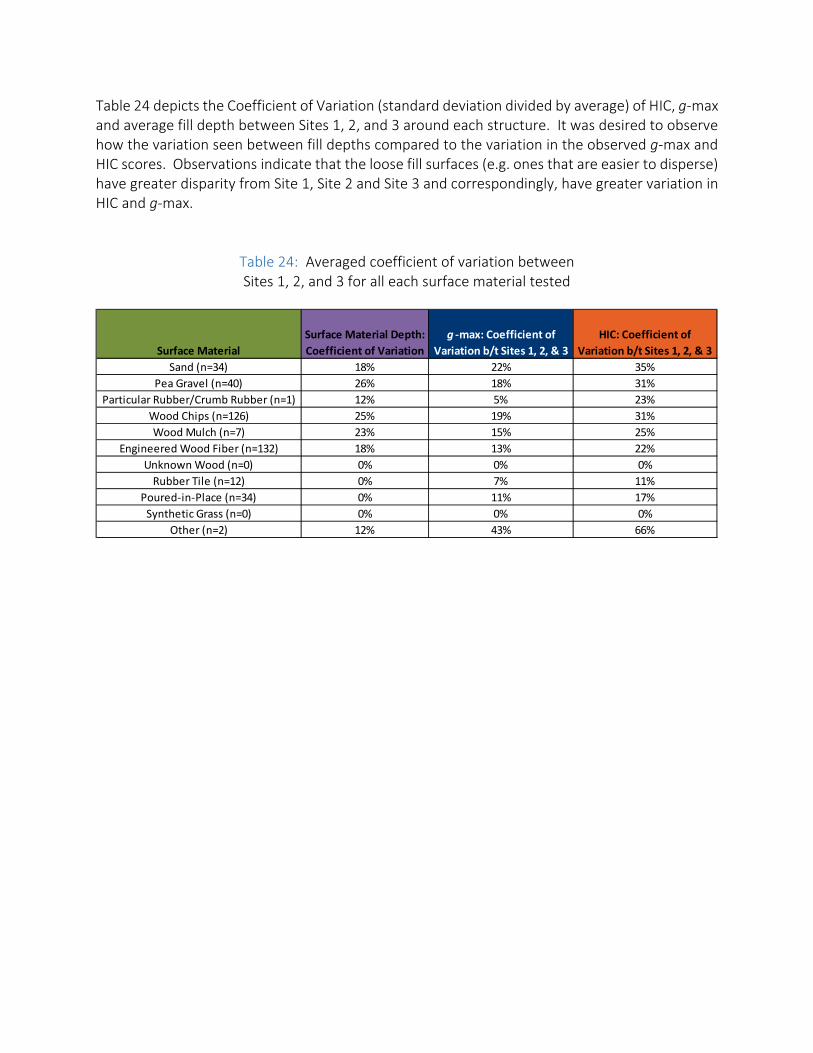
Table 24 depicts the Coefficient of Variation (standard deviation divided by average) of HIC, g-max and average fill depth between Sites 1, 2, and 3 around each structure. It was desired to observe how the variation seen between fill depths compared to the variation in the observed g-max and HIC scores. Observations indicate that the loose fill surfaces (e.g. ones that are easier to disperse) have greater disparity from Site 1, Site 2 and Site 3 and correspondingly, have greater variation in HIC and g-max.
Table 24: Averaged coefficient of variation between Sites 1, 2, and 3 for all each surface material tested
Surface MaterialSurface Material Depth: Coefficient of Variation
g -max: Coefficient of Variation b/t Sites 1, 2, & 3
HIC: Coefficient of Variation b/t Sites 1, 2, & 3
Sand (n=34) 18% 22% 35%Pea Gravel (n=40) 26% 18% 31%
Particular Rubber/Crumb Rubber (n=1) 12% 5% 23%Wood Chips (n=126) 25% 19% 31%Wood Mulch (n=7) 23% 15% 25%
Engineered Wood Fiber (n=132) 18% 13% 22%Unknown Wood (n=0) 0% 0% 0%
Rubber Tile (n=12) 0% 7% 11%Poured-in-Place (n=34) 0% 11% 17%
Synthetic Grass (n=0) 0% 0% 0%Other (n=2) 12% 43% 66%
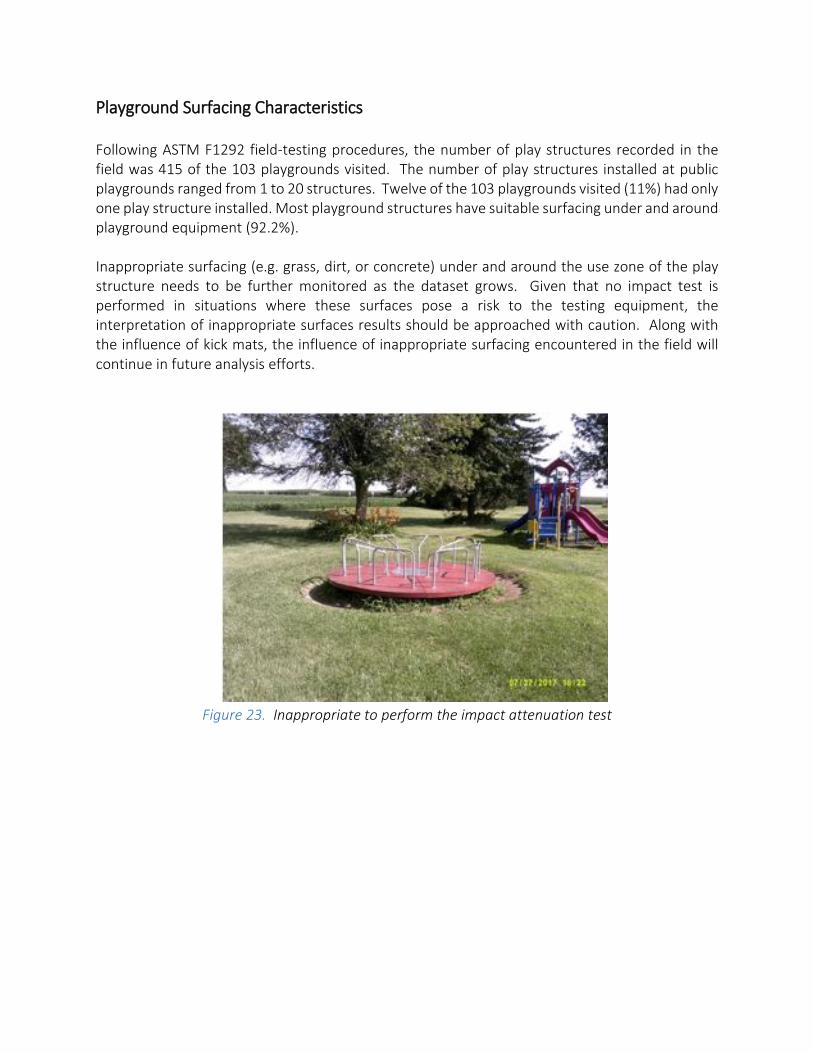
Playground Surfacing Characteristics Following ASTM F1292 field-testing procedures, the number of play structures recorded in the field was 415 of the 103 playgrounds visited. The number of play structures installed at public playgrounds ranged from 1 to 20 structures. Twelve of the 103 playgrounds visited (11%) had only one play structure installed. Most playground structures have suitable surfacing under and around playground equipment (92.2%). Inappropriate surfacing (e.g. grass, dirt, or concrete) under and around the use zone of the play structure needs to be further monitored as the dataset grows. Given that no impact test is performed in situations where these surfaces pose a risk to the testing equipment, the interpretation of inappropriate surfaces results should be approached with caution. Along with the influence of kick mats, the influence of inappropriate surfacing encountered in the field will continue in future analysis efforts.
Figure 23. Inappropriate to perform the impact attenuation test
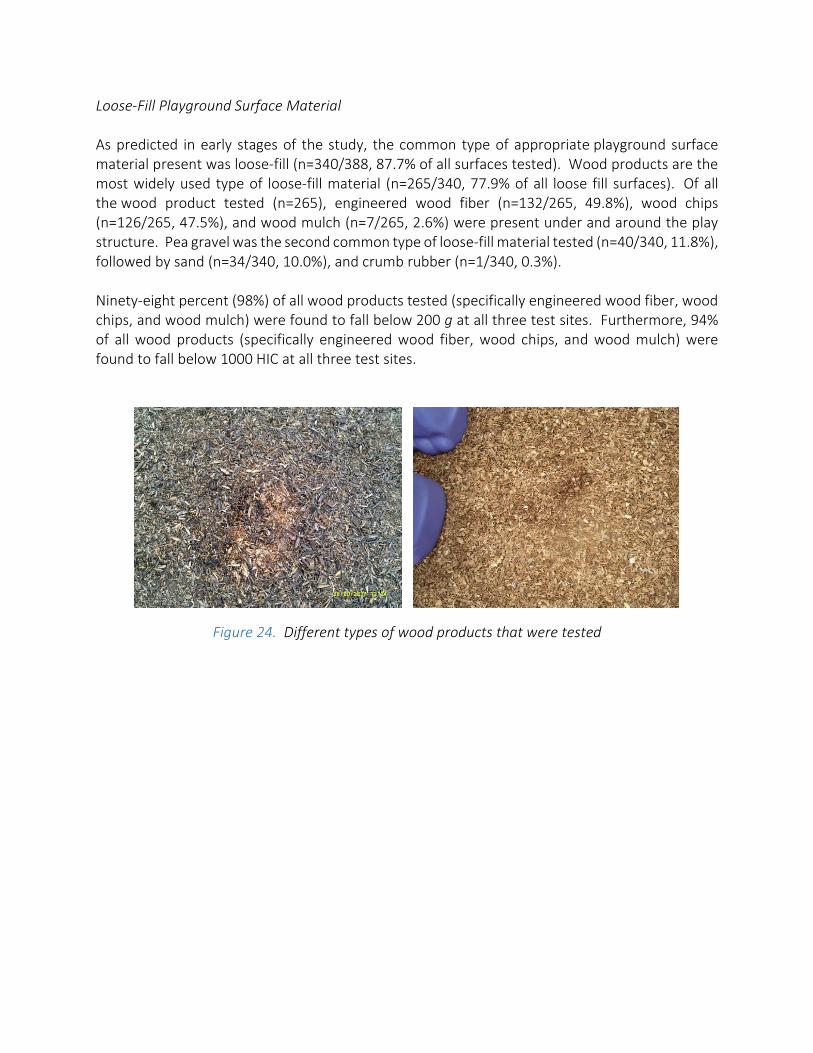
Loose-Fill Playground Surface Material As predicted in early stages of the study, the common type of appropriate playground surface material present was loose-fill (n=340/388, 87.7% of all surfaces tested). Wood products are the most widely used type of loose-fill material (n=265/340, 77.9% of all loose fill surfaces). Of all the wood product tested (n=265), engineered wood fiber (n=132/265, 49.8%), wood chips (n=126/265, 47.5%), and wood mulch (n=7/265, 2.6%) were present under and around the play structure. Pea gravel was the second common type of loose-fill material tested (n=40/340, 11.8%), followed by sand (n=34/340, 10.0%), and crumb rubber (n=1/340, 0.3%). Ninety-eight percent (98%) of all wood products tested (specifically engineered wood fiber, wood chips, and wood mulch) were found to fall below 200 g at all three test sites. Furthermore, 94% of all wood products (specifically engineered wood fiber, wood chips, and wood mulch) were found to fall below 1000 HIC at all three test sites.
Figure 24. Different types of wood products that were tested
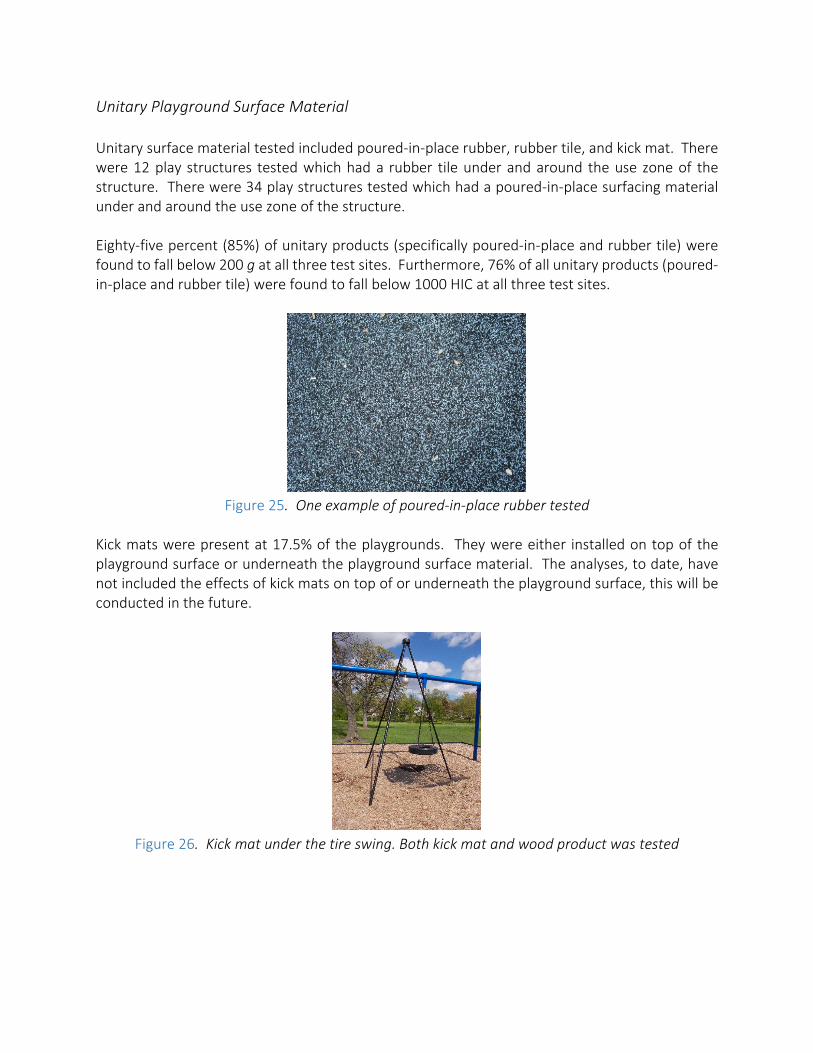
Unitary Playground Surface Material Unitary surface material tested included poured-in-place rubber, rubber tile, and kick mat. There were 12 play structures tested which had a rubber tile under and around the use zone of the structure. There were 34 play structures tested which had a poured-in-place surfacing material under and around the use zone of the structure. Eighty-five percent (85%) of unitary products (specifically poured-in-place and rubber tile) were found to fall below 200 g at all three test sites. Furthermore, 76% of all unitary products (poured-in-place and rubber tile) were found to fall below 1000 HIC at all three test sites.
Figure 25. One example of poured-in-place rubber tested
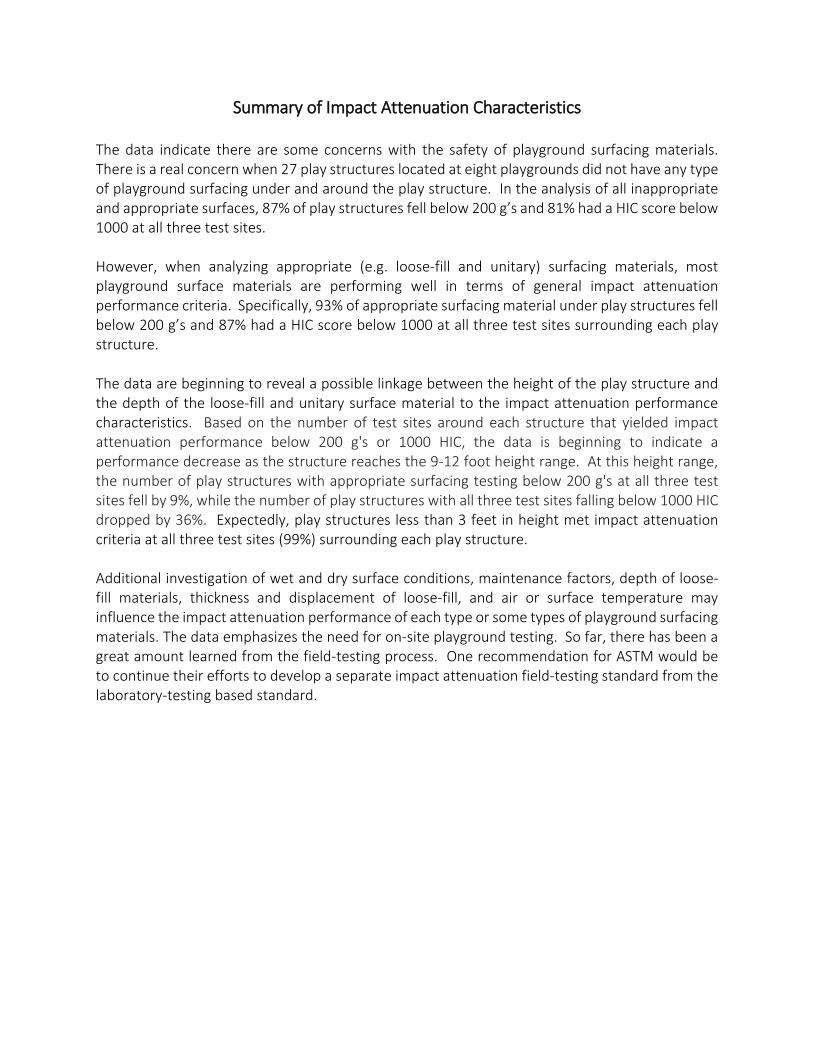
Kick mats were present at 17.5% of the playgrounds. They were either installed on top of the playground surface or underneath the playground surface material. The analyses, to date, have not included the effects of kick mats on top of or underneath the playground surface, this will be conducted in the future.
Figure 26. Kick mat under the tire swing. Both kick mat and wood product was tested
Summary of Impact Attenuation Characteristics The data indicate there are some concerns with the safety of playground surfacing materials. There is a real concern when 27 play structures located at eight playgrounds did not have any type of playground surfacing under and around the play structure. In the analysis of all inappropriate and appropriate surfaces, 87% of play structures fell below 200 g’s and 81% had a HIC score below 1000 at all three test sites. However, when analyzing appropriate (e.g. loose-fill and unitary) surfacing materials, most playground surface materials are performing well in terms of general impact attenuation performance criteria. Specifically, 93% of appropriate surfacing material under play structures fell below 200 g’s and 87% had a HIC score below 1000 at all three test sites surrounding each play structure. The data are beginning to reveal a possible linkage between the height of the play structure and the depth of the loose-fill and unitary surface material to the impact attenuation performance characteristics. Based on the number of test sites around each structure that yielded impact attenuation performance below 200 g's or 1000 HIC, the data is beginning to indicate a performance decrease as the structure reaches the 9-12 foot height range. At this height range, the number of play structures with appropriate surfacing testing below 200 g's at all three test sites fell by 9%, while the number of play structures with all three test sites falling below 1000 HIC dropped by 36%. Expectedly, play structures less than 3 feet in height met impact attenuation criteria at all three test sites (99%) surrounding each play structure. Additional investigation of wet and dry surface conditions, maintenance factors, depth of loose-fill materials, thickness and displacement of loose-fill, and air or surface temperature may influence the impact attenuation performance of each type or some types of playground surfacing materials. The data emphasizes the need for on-site playground testing. So far, there has been a great amount learned from the field-testing process. One recommendation for ASTM would be to continue their efforts to develop a separate impact attenuation field-testing standard from the laboratory-testing based standard.
Conclusions It is important to emphasize the findings from this sample cannot be generalized to all public playgrounds based on the incomplete sample. However, the findings do provide a first glimpse into the direction that the final data may take when the total project is completed. While there are playgrounds that have maintenance and equipment safety concerns, the general upkeep of the playground is an important element in keeping children safe. However, for playgrounds older than 10 years of age, a greater number of safety hazards were observed. It is critical for consumers to be aware of the importance of having an appropriate surfacing material under and around all play structures. The data illustrated inappropriate surfacing materials contributed significantly to the performance of the safety of the surfacing. Overall, analyzing appropriate and inappropriate playground surfacing materials, 87% of play structures fell below 200 g’s and 81% had a HIC score below 1000 at all three test sites (which would achieve the current performance criterion of ASTM F1292) It should be noted, the data show there are a variety of choices to utilize as an appropriate and safe playground surfacing material (e.g. loose-fill or unitary). These materials will provide impact attenuation protection to mitigate the potential for serious injuries on playgrounds. However, it appears that there is a need for consumer and owner/operator awareness about playground safety, maintenance, and the importance of playground surfacing materials under and around play structures. Furthermore, the establishment of a methodology to identify playgrounds, development of field-test protocol for assessment of equipment and environment, and procedures used to adapt ASTM F1292 protocol for use in the field has led to a growing and information-rich dataset for significant future analyses. The continuation of this project will allow for assessments of additional playgrounds that will strengthen the sample size and provide a deeper understanding of the safety status of playground equipment and environments, as well as the impact attenuation of surfacing materials nationwide.
References
1. American Society for Testing and Materials (ASTM). (2017). F1292. Impact attenuation of surfacing materials within the use zone of playground equipment; Philadelphia: Author.
2. American Society for Testing and Materials (ASTM). (2017). F1487. Standard consumer safety performance specification for playground equipment for public use; Philadelphia: Author.
3. Consumer Product Safety Commission. (CPSC). (2010). Handbook for public playground safety. Washington, D.C.: U.S. Government Printing Office.
Appendix A: Test Plan Protocol
Protocol for Playground Surface Impact Attenuation Testing & Completion of Playground Equipment Safety Checklist
Goals for Test Procedure and Safety Checklist Completion The goal of project was to assess the safety and maintenance status of playgrounds and playground surfacing materials nationwide. The project includes completing a playground equipment and surfacing safety checklist and conducting impact testing, as specified in ASTM F1292 Standard Specification for Impact Attenuation of Surface Systems Under and Around Playground Equipment. The test procedure includes a protocol outlining playground sample notification, field-testing procedures, and terminology. Playground Sample Notification Municipal local governments or schools districts (owner/operator) of selected playgrounds will receive written email or phone notification two-four weeks prior to the estimated testing date. Organizations will be informed that they have been selected to participate in the project, be provided with a brief description of the project, and assurance that the results of the testing will be aggregated and that individual test results will not reported and will be kept strictly confidential. The owner/operator will be asked not to modify the playground equipment or playground surfacing in any way prior to testing. Contractor will notify the field tester to schedule the testing once owner/operators have agreed to participate. Owner/operators will be asked to send a return email or sign and return to contractor a signed agreement to permit testing at their playground. This document will be kept on file by the contractor. The municipal governments or schools districts will be contacted again 1-2 days prior to the testing to remind them of the upcoming work to be conducted and to ascertain whether or not any additional notification is needed the day of testing. Contractor will notify the selected municipality and/or school district when the testing has been completed
Field-testing Procedures Procedure 1: Public playground selection steps
1. The contractor will provide the field tester a satellite image of the site.
2. If the identified address is for a playground in a school district, the field tester will be instructed to report to the main office or follow arrival protocol as provided by contractor.
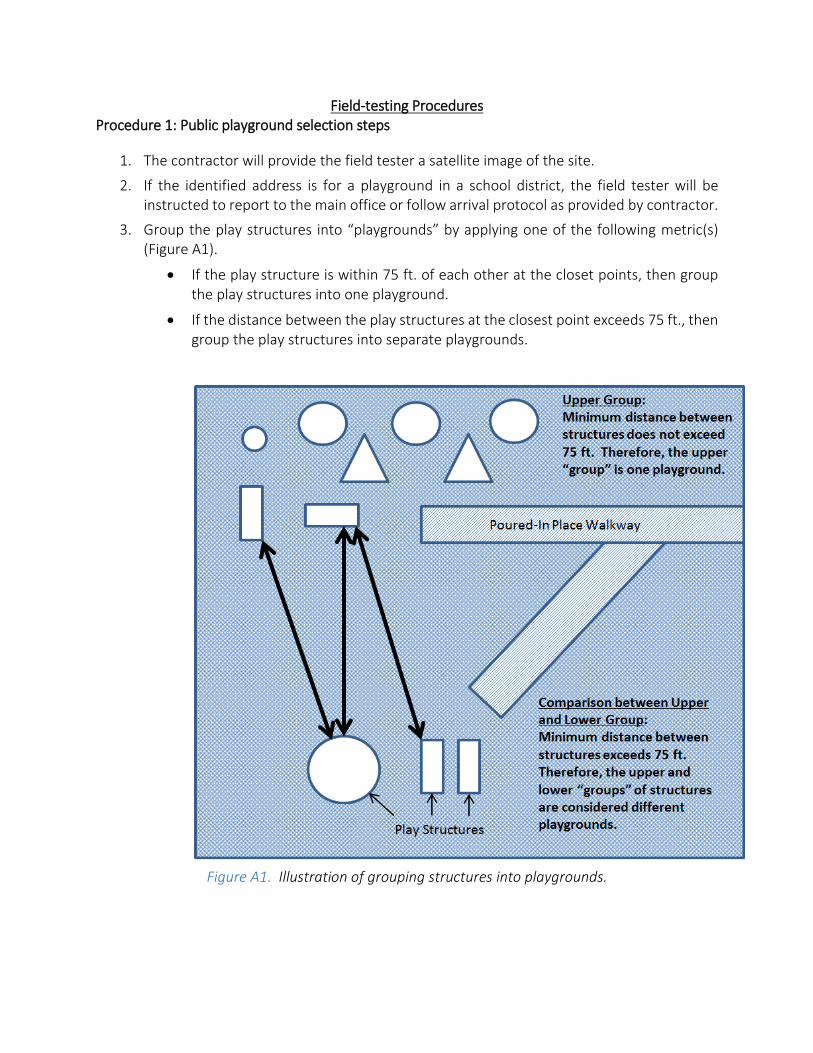
3. Group the play structures into “playgrounds” by applying one of the following metric(s) (Figure A1).
• If the play structure is within 75 ft. of each other at the closet points, then group the play structures into one playground.
• If the distance between the play structures at the closest point exceeds 75 ft., then group the play structures into separate playgrounds.
Figure A1. Illustration of grouping structures into playgrounds.
Procedure 3: Instrumentation Verification Steps
1. When on playground address and prior to testing and after testing, check the Triax instrument to ensure all systems are working properly.
a. Perform the System Integrity Check specified in Section 8.6 ASTM F1292. b. Perform the Instrumentation Check specified in Section 10 ASTM F1292. c. Tester will obtain and maintain required documentation as described in ASTM 1292
Section 8.7 Equipment Performance Verification.
2. Record instrumentation verification in the data entry form or paper form (Appendix B).
Procedure 4: Perform Surface Impact Attenuation Testing Steps (Figure A3)
Perform surface performance testing as specified in Sections 16 through 19 of ASTM F1292-13 within the same area where the PESSC was completed.
1. If the surfacing material located under a play structure or composite structure is not an
appropriate playground surface, indicate “no appropriate playground surface” on the form. No drop test should be carried out in this situation.
• Note: The following are considered “appropriate” playground surfaces by CPSC: (a)
Unitary-bonded rubber, poured-in-place, rubber tiles, synthetic grass with padding (b) loose-fill-particulate rubber, wood chips, wood mulch, engineered wood fiber, sand, or pea gravel (CPSC Public Playground Safety Handbook p. 9).
• Note: The following are considered “inappropriate” playground surfaces by the CPSC: asphalt, carpet not tested to ASTM F1292, concrete, dirt, grass, CCA treated wood mulch (CPSC Public Playground Safety Handbook p. 9).
2. Field Tester should proceed to conduct surface impact attenuation testing on a minimum of three different impact test sites in the use zone of each play structure (ASTM F1292, Section 16.1).
3. If there are more than one type of installed playground surface around the selected structure(s), the Field Tester should proceed to conduct surface impact attenuation testing.
4. on each type of installed playground surface at a minimum of three test sites (ASTM F1292, Section 16.2) (Figure A3).
Calculate the average g-max and HIC scores by averaging results from the second and third impacts. (ASTM F1292, Section 17.1, Section 18.1).
8. When play structures have overlapping use zones, test sites in the overlapping regions shall be permitted to be used for all applicable play structures (ASTM F1292, Section 16.2).
9. Each impact test site shall be within the use zone of the play structure or composite play
structure (ASTM F1292, Section 16.2.1).
10. The reference drop height for each impact test site shall be the fall height of the play structure or composite play structure located in the use zone where the impact testing is being performed.
Note: If the tester judges that the surfacing offers little or no impact attenuation and therefore may damage the test equipment (e.g. a few inches of loose-fill over asphalt or concrete, frozen surfacing, hardened unitary surfacing), the tester should approach cautiously. Tester may begin testing at a lower drop height to assess the risk of test equipment damage. If this testing indicates that testing at a drop height equal to the fall height of the play structure or composite play structure may damage the test equipment, tester may, as an alternative, conduct testing to determine the critical fall height of the playground surfacing, using the procedure in ASTM F1292, Section 15 Critical Fall Height Test Procedure. The tester shall report the critical fall height and HIC and g-max values at that critical fall height.
11. At each test site;
a. The air temperature shall be measured with a digital thermometer that meets or exceeds the performance characteristics of ASTM F1292, Section 8.1. Measure air temperature 24 ± 12 inches above the surface temperature measurement location within 5 minutes of the surface temperature measurement time.
b. The surface temperature shall be measured using the temperature measuring
device specified in ASTM F1292, Section 8.1. Temperature measurements shall be made at the sample test point before the first impact in any series. The probe shall be inserted to a minimum depth of 1 in. (25 mm) or 50 % of the thickness of the sample, whichever is least. (ASTM F1292, Section 19.1.1).
c. Two photographs shall be taken at each test site:
Photo 1- Capture the Triax instrument and play structure Photo 2- Show a close up of the surface material where the drop occurred. Avoid capturing persons or personally-identifiable information when taking the photographs (e.g. faces, apparel, etc.) or contractor will distort this information afterwards.
d. Align the test device so that the missile will impact the selected impact test site at the same location for the required number of drops. The device supporting the missile (for example, a tripod) shall be capable of ensuring that each drop takes place from the same reference drop height. (ATSM F1292, Section 19.3.1).
e. Perform the specified number of impact tests using the impact test described in
Section 11 Impact Test Procedure ASTM F1292. (ASTM F1292, Section 19.3.2).
f. Enter in the data collection form fall height, velocity, peak, and HIC scores calculated in accordance with 17.2 or 18.2 (ASTM F1292 Section, 19.3.4).
g. Enter in the data collection form the surface temperature indicated by the
temperature-measuring device (ASTM F1292, Section, 19.3.5) in the data collection sheet.
12. Repeat sequence as necessary as specified in Sections 16 through 19 of ASTM F1292 in the
use zones of each play structure or composite play structure.
13. Enter all applicable information on in the data collection sheet including details about equipment, structure, intended use, drop height, ambient conditions, type of surfacing, etc.
14. Complete the system instrumentation check specified in Section 10 ASTM F1292.
Component 5: Exiting & Transmitting Data
1. Once data have been collected and equipment is stored, follow exit procedures as provided by contractor.
2. If all data were not entered electronically during testing, complete all remaining data entry on the electronic form and transmit to contractor within 24 hours. Maintain all paper data entry form
February 2, 2018 | © National Program for Playground Safety University of Northern Iowa 63 | 68
Appendix B: Playground Safety and Surfacing Field-Testing Checklist Checklist for Playground Safety Equipment and Surfacing (4/19/2017)
Field tester(s): Date: / / Start time (AM/PM):________ City: State:
1. Is the playground located in a Public School Public Park Other (Specify)
2. How many separate playgrounds are located at this site? (Enter numeral)
3. Was one or more picture(s) of each playground taken? Yes No
4. From 10am to 2pm, the playground would be in… Full sun Partial shade Full shade
5. Are age recommendations posted on playground or equipment? (Check all that apply) Yes, signs posted Yes, labels on equipment No
6. Age range of intended user (Check all that apply): <2 ages 2-5 ages 5-12
7. Is a name or phone number posted for the owner/operator? Yes No
8. Is there one or more play safety sign(s) posted? Yes No
9. What is the estimated age of equipment? (If multiple pieces of equipment, check all ages that apply): <5 years old 5 to <10 years old 10 to <20 years old 20+ years old Unknown
Part I: General Upkeep of Playgrounds 10. Is the playground clean and free from debris and litter? Yes No
11. Are trash receptacles present and not full? Yes No
12. Is there graffiti, spray paint, burn marks, or other damage to equipment? Yes No
13. Is the playground free from user modifications to equipment (e.g., string and ropes tied to equipment, swings looped over top rail)? Yes No
Part II: Surfacing 14. What surfacing materials are present? (Check all that apply)
Loose Fill Unitary Inappropriate Sand Bonded rubber Grass Pea gravel Poured-in-place Dirt Particular rubber Rubber tiles Synthetic grass w/o
padding Wood product (Specify) Synthetic grass w/padding Concrete Wood chips Other (Specify) ___________ Other (Specify) Wood mulch ____________ Engineered wood fiber Unknown
Other (Specify) ________________________________________
15. Have surfacing materials deteriorated? Yes No
16. Are rubber mats present under heavy use equipment, such as swing and slide exits? Yes No
17. If loose-fill surfacing is present: Check here if loose fill is not present (Skip to Q18 on back). a. Is the loose-fill free of foreign debris and trash? Yes No b. Have loose-fill surfacing materials been displaced under heavy use areas such as
under swings or at slide exits? Yes No
18. Are there signs of inadequate drainage? (Check all that apply) Yes, equipment Yes, surfacing No
February 2, 2018 | © National Program for Playground Safety University of Northern Iowa 66 | 68
• Determination of critical height should be reviewed for field-testing.
• Field-testing standards need to account for more than just the safety surface; or single-type safety surfaces as done with lab testing. It should document and account for the installation method, sub-surface material, age of safety surface, maintenance, combination surfaces, use factors, and environmental factors so a more complete picture can be determined how a playground area surface performs.
• Review the definition and explanation of “testing the most adverse area of the surface”. Challenges include equipment may not be able to test most adverse situation and equipment over 12’1” in height cannot be accurately measured.
• Reasoning and process of tamping. Tamping loose-fill material does not seem to fulfill a
purpose for field-testing. In fact, compression of the surface material occurs naturally at playgrounds. The study found tamping dry materials other than sand, does little to change the depth of the surfacing. In cases where the surface material was wet, cratering after the drops occurred.
• Review whether field testers should restore the loose-fill surface materials after cratering
after the first drop or does a field tester allow the cratering to get deeper in subsequent drops?
• Review information and testing procedures of use zone. Should surface testing be
performed if there is not a proper use zone? In the study, use zone compliance under and around swings was a common concern. Proceeding with testing non-compliant use zone provides a mindset for field tester they are testing surfacing but not safety.
• There should be a discussion about testing of kick mats found on top of surfacing materials based on the findings in the study. In the case of swings, they are installed to prevent adding more surfacing rather than as a safety feature.
• Review the reporting procedures. Why does the standard contain the reporting procedures of field drops when the process is between a commercial entity and organization / agency that is contracting for the service?
• Once the project is complete, Table 2 in the CPSC Handbook for Public Playgrounds should be reviewed based off of the data gathered in the study.


![U.S. Consumer Product Safety Commission [Docket No. CPSC ...€¦ · U.S. Consumer Product Safety Commission [Docket No. CPSC-2011-0074] Table Saw Blade Contact Injuries; Advance](https://img.pdfslide.net/doc/110x75/5fb1ff896efa5069226fe448/us-consumer-product-safety-commission-docket-no-cpsc-us-consumer-product.jpg)