Embed Size (px)
Citation preview
CPSY 501: CPSY 501: Advanced Advanced StatisticsStatistics
Instructor: Dr. Sean HoInstructor: Dr. Sean HoTeaching Assistant: Teaching Assistant:
Jessica NeeJessica Nee
ReminderReminder:: We are not allowed to have food or drink We are not allowed to have food or drink near the computers, so please keep your edibles & near the computers, so please keep your edibles & drink bottles in your pack, or on the shelf at the side drink bottles in your pack, or on the shelf at the side “of the class while you are this “ISYS lab” in the CanIL “of the class while you are this “ISYS lab” in the CanIL bldg. bldg.
Fall, 2008Fall, 2008
Course Dedication & Introductions Course Dedication & Introductions
Syllabus: … strolling through the term Syllabus: … strolling through the term
Statistics Review: purpose Statistics Review: purpose
Statistics Review: approaches Statistics Review: approaches
Data Analysis Project & Assignm’t #1 Data Analysis Project & Assignm’t #1
t t -tests, correlations, Χ-tests, correlations, Χ22, levels of m’t , levels of m’t
CPSY 501: Class 1 CPSY 501: Class 1 OutlineOutline
Stats, Math, Faith, & ?!!Stats, Math, Faith, & ?!!
Faculty have many different ways to Faculty have many different ways to show faith-affirming dimensions of show faith-affirming dimensions of disciplines, classes, & topics disciplines, classes, & topics
The “common sense” presumption The “common sense” presumption current in Canadian culture = math & current in Canadian culture = math & faith are mutually irrelevant. faith are mutually irrelevant. ButBut … … ethnomath; the ethnomath; the Pirahã; math history & phil; … lively traffic!
Dedication: All of life shows God’s hand…
IntroductionsIntroductions
Instructors: Instructors: Dr. Dr. Sean Ho (& Mac as Sean Ho (& Mac as assistant?) assistant?)
TA: TA: Jessica NeeJessica Nee
You: You: – name – name
– – year in this programyear in this program
– – interests, fears, gifts: interests, fears, gifts: research, or research, or
experiences, or hopes, … experiences, or hopes, …
Syllabus: Tentative notesSyllabus: Tentative notes
Class notes, articles, data files, etc. Class notes, articles, data files, etc.
Offices & contact info Offices & contact info
Course description & objectives; teams Course description & objectives; teams
SPSS: in labs, including the Wong Rsch SPSS: in labs, including the Wong Rsch CentreCentre
Course requirements and evaluation Course requirements and evaluation
Advice and policy Advice and policy
Textbooks: 1 required, others optional … Textbooks: 1 required, others optional …

Statistics: Review Statistics: Review
Statistics as a decision-making tool: Statistics as a decision-making tool:
- is an effect / relationship real? - is an effect / relationship real?
- how strong is it? [Connect “variables”] - how strong is it? [Connect “variables”]
Possible limitations of statistical approaches:Possible limitations of statistical approaches:
- some assumptions: extreme - some assumptions: extreme reductionism, reductionism, neutrality of neutrality of observation, objectivity = ? observation, objectivity = ?
- groups, - groups, notnot individuals individuals
What is the purpose of statistics in counselling psychology research? Focus: Research questions!
Statistics: Review Statistics: Review exampleexample
Research Question = RQ Research Question = RQ RQ: are men taller than women? RQ: are men taller than women?
- is this relationship real? - is this relationship real?
- how strong is it? - how strong is it? Variables = ______? & ______? Variables = ______? & ______? Independent samples Independent samples tt-test …-test … Limitations illustrationLimitations illustration: grps vs. : grps vs.
individuals; variables as ‘incomplete’ … individuals; variables as ‘incomplete’ …
Statistics as Model-Statistics as Model-BuildingBuilding
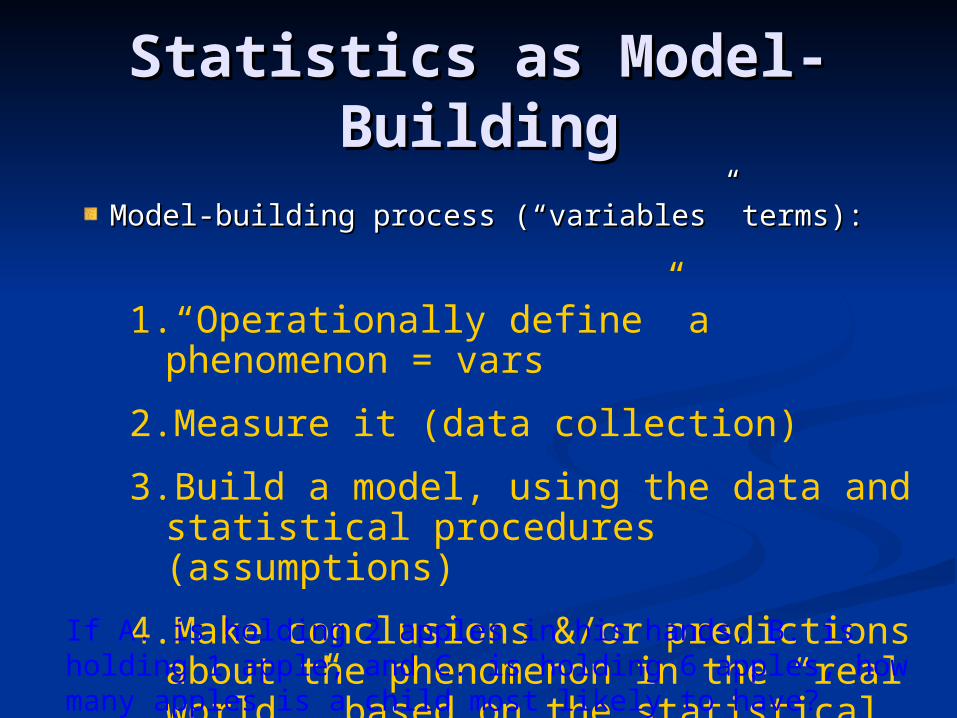
Model-building process (“variables” terms):Model-building process (“variables” terms):
1.“Operationally define” a phenomenon = vars
2.Measure it (data collection)
3.Build a model, using the data and statistical procedures (assumptions)
4.Make conclusions &/or predictions about the phenomenon in the “real world,” based on the statistical model
If A. is holding 2 apples in his hands, B. is holding 1 apple, and C. is holding 6 apples, how many apples is a child most likely to have?
Statistical Models: EXStatistical Models: EX
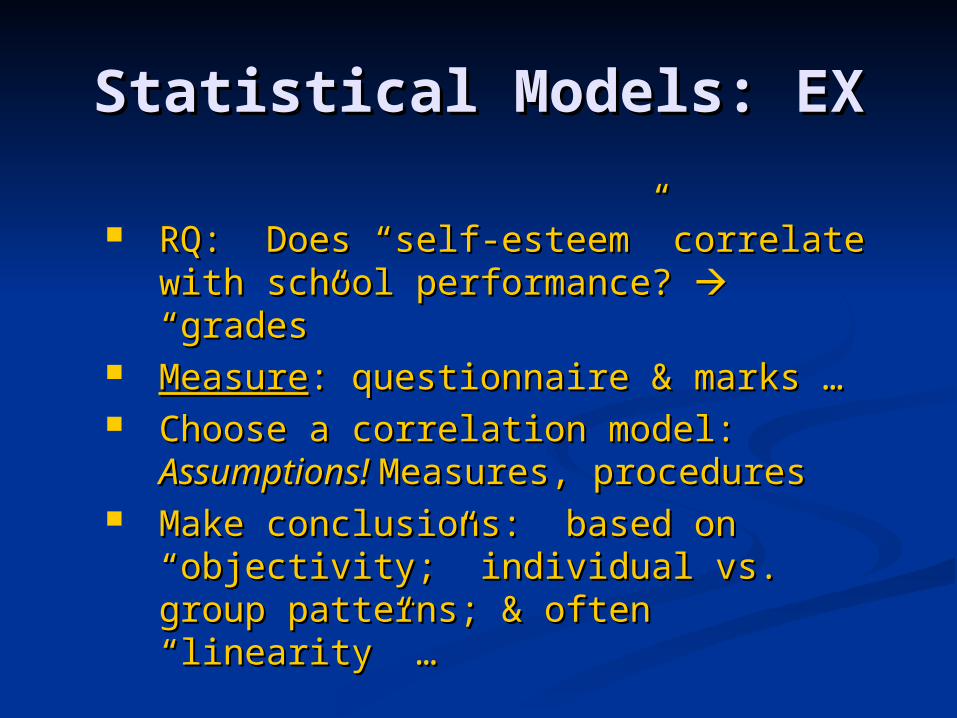
RQ: Does “self-esteem” correlate RQ: Does “self-esteem” correlate with school performance? with school performance? “grades” “grades”
MeasureMeasure: questionnaire & marks …: questionnaire & marks … Choose a correlation model: Choose a correlation model:
Assumptions! Assumptions! Measures, procedures Measures, procedures Make conclusions: based on Make conclusions: based on
“objectivity;” individual vs. group “objectivity;” individual vs. group patterns; & often “linearity” … patterns; & often “linearity” …
Linear ModellingLinear Modelling
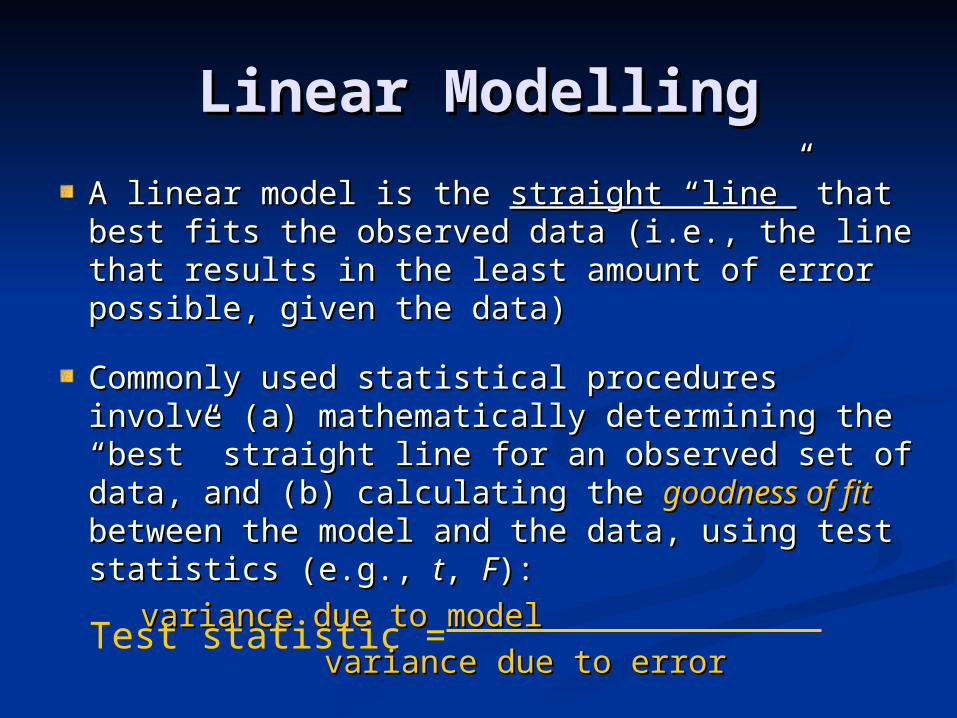
A linear model is the A linear model is the straight “line”straight “line” that best fits that best fits the observed data (i.e., the line that results in the observed data (i.e., the line that results in the least amount of error possible, given the the least amount of error possible, given the data)data)
Commonly used statistical procedures involve Commonly used statistical procedures involve (a)(a) mathematically determining the “best” mathematically determining the “best” straight line for an observed set of data, and straight line for an observed set of data, and (b) (b) calculating calculating the the goodness of fitgoodness of fit between the between the model and the data, using test statistics (e.g., model and the data, using test statistics (e.g., tt, , FF):):
variance due to modelvariance due to model
variance due to errorvariance due to error
Test statistic =
Linear Modelling (cont.)Linear Modelling (cont.)
In summary:In summary: Statistics are used to Statistics are used to build modelsbuild models of of
psychological phenomena out of psychological phenomena out of observations gathered from specific samples observations gathered from specific samples of individualsof individuals
Common type of models found in statistics Common type of models found in statistics are are linearlinear (the straight “line” that minimizes (the straight “line” that minimizes the distance between the model and the the distance between the model and the data)data)
The adequacy of the model, as a summary The adequacy of the model, as a summary of the observed data, can be calculated of the observed data, can be calculated through through test statisticstest statistics..
Limitations of Linear Limitations of Linear ModelsModels
Common statistical procedures (some ANOVA & Common statistical procedures (some ANOVA &
some regression) are only some regression) are only approximateapproximate for phenomena that do not relate to each other for phenomena that do not relate to each other in a linear way. (even in a linear way. (even non-linear modelsnon-linear models are are often very “crude” approximations base on often very “crude” approximations base on group patterns)group patterns)
What are some examples of psychological phenomena where the variables are related to each other in a non-linear way? [practical approx. vs “reifying” models]

Group Project: Suitable Group Project: Suitable DataData
Obtain existing data set to conduct a new analysis Obtain existing data set to conduct a new analysis
No collection of new data & no simulated (made No collection of new data & no simulated (made up) dataup) data
Minimum sample sizeMinimum sample size: 50 : 50
Minimum of 3 variables in your analysis (one Minimum of 3 variables in your analysis (one outcome/DV) outcome/DV)
Possible sourcesPossible sources: your own data; faculty : your own data; faculty members; departmental thesis data storage members; departmental thesis data storage (permission required from original student and (permission required from original student and supervisor)supervisor)
Group Project: IntroGroup Project: Intro
PurposePurpose: to demonstrate what you have learned: to demonstrate what you have learned
Multiple regression OR some form of ANOVA Multiple regression OR some form of ANOVA (complex non-parametric analyses (complex non-parametric analyses maymay be be acceptable, with permission) acceptable, with permission)
Up to 3 people per group (submit 1 paper for Up to 3 people per group (submit 1 paper for the group). The project the group). The project cancan be done be done individually.individually.
Instructor approval required before proceeding Instructor approval required before proceeding with part 3 or 4. with part 3 or 4.
Project Step 1: Data SetProject Step 1: Data Set
Written description of the data set that you Written description of the data set that you will be using will be using
Preliminary explorations of that data (attach Preliminary explorations of that data (attach SPSS outputs)SPSS outputs)
Only describe the variables that you are Only describe the variables that you are thinking of using for this project.thinking of using for this project.
Tentative Due DateTentative Due Date: September 26 : September 26
Project Step #2: Project Step #2: Data MeetingData Meeting
Meetings between the group and the Meetings between the group and the professor, to discuss proposed analysis and professor, to discuss proposed analysis and obtain permission to proceed obtain permission to proceed
Bring previous assignment AND an electronic Bring previous assignment AND an electronic copy of your data-setcopy of your data-set
It is expected that the group will have briefly It is expected that the group will have briefly reviewed the literature, planned the reviewed the literature, planned the analyses, and determined that the sample analyses, and determined that the sample size is sufficient.size is sufficient.
DueDue: In September (by October 3: In September (by October 3rdrd at the at the latest) latest)
Project Step #3: Project Step #3: Research Ethics Board Research Ethics Board
SubmissionSubmissionAll new analyses of existing data sets conducted All new analyses of existing data sets conducted at TWU must be approved by the REB at TWU must be approved by the REB
Complete the “Complete the “Request for Ethical Review - Request for Ethical Review - Reanalysis of Existing DataReanalysis of Existing Data” form” form
Consult with instructor if any part of the form is Consult with instructor if any part of the form is confusing.confusing.
Submit Submit twotwo signed copies of the completed form signed copies of the completed form
DueDue: October 10 : October 10
Group Project: Group Project: manuscriptmanuscript
The emphasis is to demonstrate your The emphasis is to demonstrate your statistical knowledge, not to deal with the statistical knowledge, not to deal with the topic area that you are studyingtopic area that you are studying
Full APA manuscript format is required (with Full APA manuscript format is required (with exceptions as noted) exceptions as noted)
SectionsSections: Title page; Abstract; Intro; Method & : Title page; Abstract; Intro; Method & Data Set; Data Preparation & Results; Data Set; Data Preparation & Results; Discussion; References; Tables/Figures; SPSS Discussion; References; Tables/Figures; SPSS OutputsOutputs
Include at least one table/figure Include at least one table/figure
Maximum LengthMaximum Length: 15 pages + SPSS outputs: 15 pages + SPSS outputs
Project Step #4: Project Step #4: Analysis ReportAnalysis Report

Review AssignmentReview Assignment Review of Basic Statistics & Review of Basic Statistics &
practicing SPSSpracticing SPSS download files, etc. download files, etc.
DUE: Sept. 19 DUE: Sept. 19
Data set: Data set: AttnDefDis-#1AttnDefDis-#1
Basic Stats: Conceptual Basic Stats: Conceptual HeartHeart
Research Questions:Research Questions: numbers vs. numbers vs. “data” “data”
Variables & “levels of measurement”Variables & “levels of measurement” Designs: Between & within “subjects” Designs: Between & within “subjects”
EX: EX: tt-tests -tests Theory & conceptual work: Theory & conceptual work:
description vs. inference, description vs. inference,
Uses of Uses of t t -tests, correlations, Χ-tests, correlations, Χ22, etc. , etc.