Embed Size (px)
Citation preview


Special Thanks &
Acknowledgements Community Planning Workshop wishes to thank the following individuals for their participation and contribution to this project.
• John Arndt, University of Oregon
• George Beard, PSU • David Belyea, Oregon DEQ • Juli Brode, UO • Alex Cuyler, Lane County • Mike Dockendorf, Lane
County • Felicity Fahy, EWEB • Kevin Finney, City of
Eugene • Alan Fraser, EWEB • Steve Gallup, City of
Eugene • Kathy Ging, The Energy
Forum • Courtney Griesel, City of
Springfield • Phil Guyette, Lane County • David Harris, SUB • Lyn Hart, • Jennifer Hayward, LCC • Jason Heuser, EWEB • Mike Hodgert, Bethel
School District • Herb Horner, UO • Rob Inerfield, City of
Eugene • Lyle Jensen, SOLARC • Tony Jobanek, City of
Eugene • Michael Johns, Lane
County • Peggy Keppler, City of
Eugene
• Tom Larsen, City of Eugene • Kelsy Laughnan, SOLARC • Gery Lentsch, EWEB • Sasha Luftig, Good
Company • Steve Mital, UO • Kiersten Muenchinger, UO • Jeff Nelson, SUB • Keli Osborn, City of Eugene • Jeannine Parisi, EWEB • Linda Pauly, City of
Springfield • Susan Payne, LCOG • Jeff Petry, City of Eugene • Joshua Proudfoot, Good
Company • Anna Scott, Lane
Community College • Will Shaver, Eugene
Sustainability Commission • Charlie Simmons, LTD • Joshua Skov, Good
Company • Susie Smith, City of
Springfield • John Tamulonis, City of
Springfield • Fred Tepfer, UO • Jeff Towery, City of
Springfield • Bill Welch, EWEB • Brenda Wilson, City of
Eugene • Wesley Wilson, UO
CPW Staff:
Robert Parker AICP, Director
Amanda West
Project Manager:
Sasha Fertig
Research Team:
Stephen Abbott
Joshua Havener
Rithy Khut
Molly Promes
Project Partners CPW thanks our sponsoring project partners: the City of Eugene and the Eugene Water and Electric Board. Your contributions to our mission of providing quality educational experiences and community service are appreciated. We thank Steve Mital of the University of Oregon for suggesting the project, Jeannine Parisi of EWEB for organizing the committee and general guidance, and Jeff Petry from the City of Eugene for input and guidance.
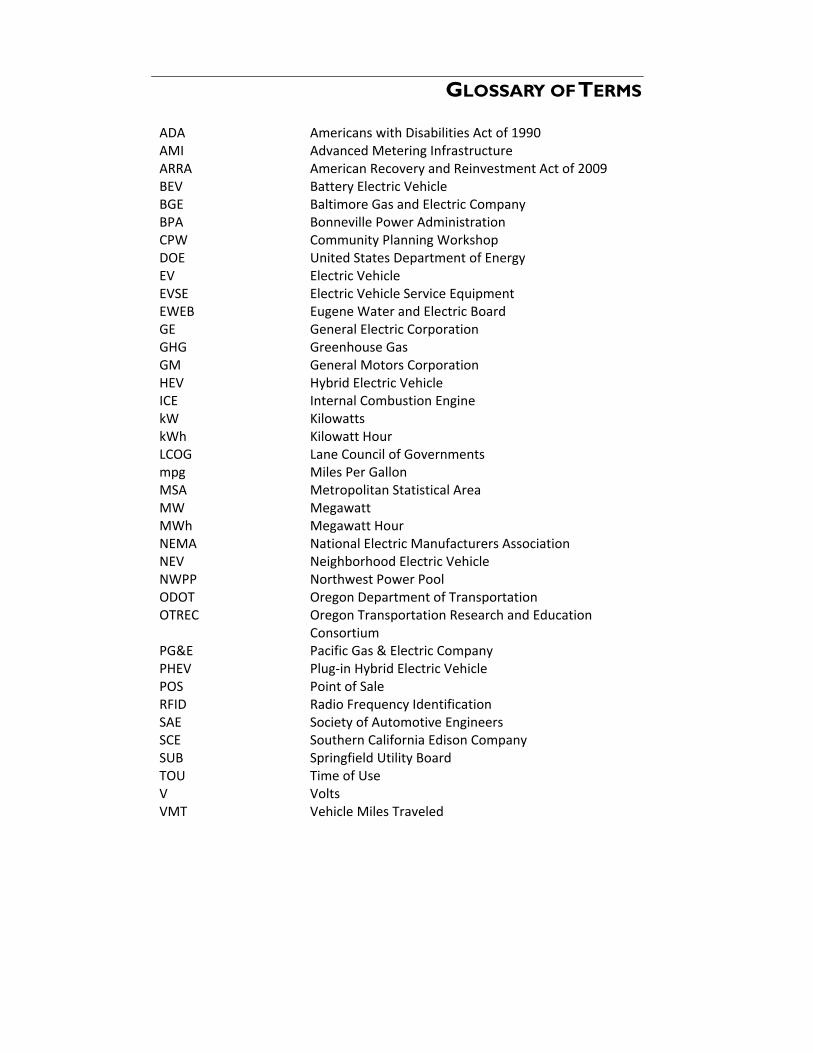
GLOSSARY OF TERMS ADA Americans with Disabilities Act of 1990 AMI Advanced Metering Infrastructure ARRA American Recovery and Reinvestment Act of 2009 BEV Battery Electric Vehicle BGE Baltimore Gas and Electric Company BPA Bonneville Power Administration CPW Community Planning Workshop DOE United States Department of Energy EV Electric Vehicle EVSE Electric Vehicle Service Equipment EWEB Eugene Water and Electric Board GE General Electric Corporation GHG Greenhouse Gas GM General Motors Corporation HEV Hybrid Electric Vehicle ICE Internal Combustion Engine kW Kilowatts kWh Kilowatt Hour LCOG Lane Council of Governments mpg Miles Per Gallon MSA Metropolitan Statistical Area MW Megawatt MWh Megawatt Hour NEMA National Electric Manufacturers Association NEV Neighborhood Electric Vehicle NWPP Northwest Power Pool ODOT Oregon Department of Transportation OTREC Oregon Transportation Research and Education
Consortium PG&E Pacific Gas & Electric Company PHEV Plug‐in Hybrid Electric Vehicle POS Point of Sale RFID Radio Frequency Identification SAE Society of Automotive Engineers SCE Southern California Edison Company SUB Springfield Utility Board TOU Time of Use V Volts VMT Vehicle Miles Traveled


Eugene‐Springfield Electric Vehicle Assessment November 2010 Page | i
EXECUTIVE SUMMARY
Transportation planners, the auto industry, and consumers are seeking alternatives to the internal combustion engine. Electric vehicles (EVs) are an increasingly feasible alternative and may soon be widely available to individual consumers and businesses. EVs, however, represent a nascent technology and their implications for cities and transportation systems have yet to be fully understood. This report identifies and analyzes key issues and opportunities related to the adoption of EVs in the Eugene‐Springfield metropolitan region.
This project was funded by the Oregon Transportation Research and Education Consortium (OTREC) as part of a broader initiative in support of EV research. Additional support was provided by the Eugene Water and Electric Board and the City of Eugene. The purpose of this project is to assess the implications of EVs for the Eugene‐Springfield metropolitan area.
Findings The goal of this project is to evaluate the implications of electrification of the transportation system within the context of the Eugene‐Springfield metropolitan area. The framework builds from local input and data analysis. To develop it we conducted interviews with local subject experts, analyzed publicly available market data for the region, and conducted a web‐based poll of area residents. Given this context, our key conclusions follow:
• Local interest in EVs appears high. Based on their expressed intent to purchase an EV, survey respondents expressed a surprisingly high level of confidence with EV technology. A large percentage of respondents (41%) also plan to buy an EV or are considering buying one. These facts, taken together, may suggest that there is a ‘pent up’ demand for EVs.
• EV technology is not a serious barrier to early EV adoption. On a case‐by‐case basis most homes can be upgraded to include charging equipment. Barriers related to insufficient power, or local infrastructure inadequacies, will only occur (if at all) at a later date.
• Some perceived barriers (safety, ‘range anxiety, etc) may keep many potential EV buyers on the sidelines for years to come. However, as noted in Chapter 3 above, there is some evidence that these concerns are rapidly diminishing. Moreover, external factors such as gasoline prices and federal greenhouse gas legislation could accelerate EV adoption.
• Local adoption will probably occur faster than national rates. We expect that Eugene will experience a higher demand rate for EVs per capita than most mid‐sized cities in the U.S. We estimate that the cumulative demand rate for EVs in the Eugene‐Springfield area will be roughly 9,000 (low estimate) to 14,000 (high estimate) vehicles by the year 2020. We further expect that EV sales will mirror early hybrid sales, and that in the short term (1 to 3 years) demand for EVs will exceed supply.

Page | ii Community Planning Workshop
• It is not clear how important publicly accessible EVSE is in the long‐term. The answer to this question depends on factors on which we have little reliable data. Studies suggest that the presence of highly visible EVSE in public locations is important to curb concerns about “range anxiety.” The fact is that most commuters in our region drive less than 40 miles per day—a distance that is well within the range of contemporary EVs. The longer term need for publicly accessible EVSE is less clear; it depends on a variety of factors that include technological advances that increase the range of EVs and how those factors affect travel behavior.
• Evidence suggests a preference for EVSE in high profile locations. Respondents to the community survey expressed a preference for public charging stations in the downtown Eugene area, places of employment, and large shopping and retail centers.
Local Considerations A key challenge of planning for electric vehicles is the fact that electric vehicles – in their current form at least – utilize relatively new technologies that are coming to market at a time when tremendous economic and political changes are occurring in the energy and transportation sectors. In this environment the ‘knowns’ are subject to rapid change. The introduction of EVs into our community presents many opportunities; however, it also presents an enormous challenge – that of keeping up to date with this pace of change.
The pace of change is one issue that local governments and utilities should be concerned about. The potential exists for extremely rapid adoption of EVs – a scenario that has profound implications for local governments. Among the most important are impacts on power demand and load and the location and management of EVSE. While rapid adoption is far from certain in the U.S., the evidence suggests that EV technology is ripe and is close to reaching a critical mass. External factors such as gasoline prices and federal greenhouse gas legislation could cause quicker adoption rates.
Despite these challenges, EV technology meets multiple needs of the local residents and public agencies. Its adoption complements and supports strategic economic goals of the State of Oregon as well as climate action and sustainability goals for the City of Eugene and the nation. However, four key questions emerged from our investigation as unanswered, or only partly answered:
• Do consumer concerns about EVs create a barrier to local adoption, and if so how can they be over come? What actions should local governments take to promote adoption?
• What should local electric utility providers do to prepare for the potential electrical load increases that will arrive with widespread EV adoption?
• Could increasing demand for EVSE related permits become a barrier to EV adoption? What actions should be taken to streamline permitting processes in anticipation of this demand?

Eugene‐Springfield Electric Vehicle Assessment November 2010 Page | iii
• How should these actions be prioritized? What are the appropriate timeframes for addressing each?
The conclusions and recommendations that follow address these key questions.
Policy Implications Based on these conclusions, what policy implications may be drawn? We summarized areas that will impact public policy decisions in six broad categories:
1 Public Awareness / Understanding of EVs While strong interest in EVs already exists in some quarters of the community, for most people the technology, its benefits, and its limitations are still largely unfamiliar. Familiarity with new technology is a key to its rapid adoption. Early experiences, for better or worse, will frame public expectations and adoption patterns. Community engagement will be essential to a successful EV rollout program.
2 Publicly-Accessible EVSE Installations The location and number of publicly accessible EVSE installations needs to be carefully considered. In the immediate term many of these will be installed by private, third party agents, working under the auspices of a federal grant as part of the EV Project. In this circumstance it may be tempting for cities and utilities to let this initial process ‘take care of itself’. There is a risk, however, to this approach. Those charged with the initial wave of EVSE installations have a short‐term focus of a few years to complete their grant‐funded mission. Initial EVSE, placed in inconvenient or inappropriate locations, could have a negative rather than positive effect on public awareness.
3 Parking management An EVSE is located, by definition, at a parking place. Publicly accessible EVSE must be dedicated for EV parking only if they are to be available when needed for charging. In the metro area, however, business owners, customers, and residents alike may chafe at the prospect of valuable parking spaces sitting empty for hours. Must a space remain unused if not occupied by an EV? If so what signage is required to designate the restriction? What codes control this and who will enforce them?
4 Road Maintenance Revenue The revenue necessary to maintain roads and associated infrastructure is primarily generated through taxes on the sale of auto fuels. EVs will use the same roadway network as ICE vehicles. A potential issue of fairness is raised if one user group pays for access to public facilities and another does not. Beyond this cost equity issue looms a potential funding shortfall. As EV adoption grows, the sale of gasoline and bio‐fuels, and therefore tax revenues, will likely diminish. An alternative funding source for roads maintenance will need to be identified and implemented.

Page | iv Community Planning Workshop
5 Electricity Consumption/Demand We do not anticipate that EV demand, in the short term, poses a risk to local electrical generation capacity. At the neighborhood level, however, individual transformers may fail if overloaded by clustered level 2 home charging units. Utilities providers will need sufficient notice before these home installations occur, and they will need a feasible plan to upgrade transformers when needed.
6 Public Safety Traditional automobiles and filling stations dispense and carry a highly volatile fuel. Millions of drivers use both every day, and while many vehicular accidents do happen, the occurrence of fires or explosions is rare. The design, manufacture, and installation of EVs and EVSE fall under a combination of state and federal regulations, and industry standards. EVs, used as intended, do not pose an undue risk to public safety. To the extent that unique emergency procedures exist for EV or EVSE, police, firefighters, EMTs and paramedics, and other emergency responders should all receive training in those procedures.
Recommendations As noted, EV technology supports existing polices of the State and of the City of Eugene. It is a primary recommendation of this report that the City of Eugene, the City of Springfield, Eugene Water and Electric Board (EWEB), Springfield Utility Board (SUB), and the University of Oregon should actively promote the adoption of EV technology. This work would be facilitated by the creation of a working group of employees from each agency. The role of such a group would be to create and maintain an effective feedback loop between agencies; one that promotes dialogue and alignment on the myriad issues that will arise related to the implementation of EVs.
Figure S-1. Recommended Action Steps
• Form EV Working Group & EV Advisory Council
• Secure consumer feedback / Conduct public outreach
• Plan fleet purchases
• Conduct emergency responder training
• Research smart metering and tiered pricing
• Coordinate EVSE permitting and notification procedures
Longer Term OngoingNow
• Implement fleet purchases
• Update land use codes
• Prioritize locations for 2nd wave of EVSEs
• Place infrastructure for 2nd wave of EVSE’s / Upgrade transformer network
• Develop long term ‘smart‐grid’ implementation strategy
• Develop “Green Street” strategy
• Implement smart metering
• Implement tiered pricing
• Determine alternate revenue sources
• Develop ‘One Stop Shop’ process for home EVSE permitting and installation
Phase
Priority
Years 3 to 6 Years 1 to 2 Years 7+

Eugene‐Springfield Electric Vehicle Assessment November 2010 Page | v
Action Steps to Take Now (Years 1- 2) As a guiding principle, local governments and institutions should seek to promote EVs through the visible, prominent placement of charging stations. They should also work to assure that their various efforts are efficiently coordinated and that the constituencies they represent are both informed and consulted with regard to EVSE infrastructure planning. In that light the most urgent action steps are those which will facilitate outreach, communication, and long term planning.
• Adopt Local Policy Statement. Local governments and utilities should adopt a policy statement in support of EV adoption and establish a formal ‘EV Working Group’ comprised of employees from each agency.
• Establish an Advisory Committee. A community advisory body, similar in scope to the Bicycle and Pedestrian Advisory Council, should be formed to provide input to, and assist with implementation of, these steps. .
• Research EV User Needs. Local governments should pay attention to user needs. It will be critical to respond to the needs of early adopters..
• Develop a Community Education Strategy. The City governments, together with EWEB should initiate a community education campaign about these vehicles, their benefits, and their potential impact on power supply for the area.
• Consider Fleet Purchases. Local governments can demonstrate a commitment to EV technology through fleet purchases. Fleet purchases help ‘mainstream’ new technology in the eyes of the public and are therefore key to public education and acceptance.
• Train First Responders. Incorporate EV manufacturers’ recommendations into emergency responder procedural documentation. Provide training and certificate for all responders.
• Follow EVSE Business Models. Utilities will need to come to terms with the long range policy decisions that will determine future EVSE business models. Questions about pricing for EV charging and cost recovery for infrastructure upgrades needed to support EVSE must be addressed, as must future maintenance responsibilities for installed infrastructure.
• Monitor Power Loads. Our modeling suggests that an increase in overall power load demand will not affect EWEB and SUB in the first few years. This will give both utilities time to study and learn from other communities that are aggressively promoting EV technology.
Longer Term Actions (Years 3 to 6) Careful long‐range planning is will be necessary to successfully integrate electric vehicles into the regional transportation network. With this in mind, we recommend the following actions to be carried out over a slightly longer time period:

Page | vi Community Planning Workshop
• Institutionalize Fleet Purchases. Incorporate EVs into government and institutional fleet purchases. Set purchase targets for EV’s in fleets by 2020 that equal or exceed the historic pace of Hybrid fleet adoption.
• Review land use codes. Review and update land use codes to reflect EV parking and signage requirements. Consideration should be given to amending building codes and / or land use code to require placement of conduit for future EVSE in new parking garages and multi‐family housing developments.
• Develop a community‐wide EVSE strategy. Local governments should form a working coalition to define and implement a methodology for prioritizing charging station locations once the initial DOE funded wave of installations is complete. Consideration should be given to possibility of a level 3 EVSE unit rollout.
• Conduct research on the travel behavior of EV owners. While it is conceivable that the behavior of EV owners will be a lot like those of conventional vehicle owners, the cost and range of EVs may lead to shifts in how people use EVs.
• Develop a “Green Streets” program. Such a program would create restricted travel corridors for electric vehicles, bicycles, pedestrians, and other low‐impact transportation modes. A green street would make use of existing infrastructure, but would address safety concerns by creating dedicated right‐of‐ways for certain classes of vehicles and transportation modes.
• Develop a “one‐stop shop program. Over the next few years the priorities of EV manufacturers, and of policymakers who wish to promote EV adoption, must be to ensure that in‐home charging equipment can be easily and affordably installed in the homes of early buyers. But to satisfy this need several problems must first be overcome. Section D of the Appendix outlines a proposed ‘one stop shop’ program to address these issues.
Ongoing Actions (Years 7+) Over the longer term, as EV adoption reaches critical mass, actions focused on outreach, study, and planning must result in the implementation of changes on a broader scale.
• Implement the planned combination of EV enabling technologies (smart‐metering/ tiered pricing/consumer education).
• Develop a strategic plan for eventual supplementation of revenues lost from falling gas sales.

Eugene‐Springfield Electric Vehicle Assessment November 2010 Page | vii
Table of
Contents
CHAPTER I: INTRODUCTION ............................................................................ 1
BACKGROUND .......................................................................................................................... 1 PURPOSE AND METHODS ........................................................................................................... 2 ORGANIZATION OF THIS REPORT ................................................................................................. 2
CHAPTER II: ELECTRIC VEHICLE OVERVIEW .................................................... 5
HISTORY OF ELECTRIC VEHICLES .................................................................................................. 5 OVERVIEW OF EV TECHNOLOGY .................................................................................................. 6 Electric Vehicle Configurations ......................................................................................... 6 Hybrid Electric Vehicles .................................................................................................... 6 Electric Vehicle Categories ............................................................................................... 7 Electric Vehicle Charging Equipment ............................................................................... 8 Policy Related to Electric Vehicles .................................................................................... 8
IMPLICATIONS OF ELECTRIC VEHICLES ......................................................................................... 10 Implications for Consumers............................................................................................ 10 Implications for the Environment .................................................................................. 12 Implications for Utilities Providers ................................................................................. 12
SUMMARY ‐ IMPLICATIONS OF ELECTRIC VEHICLES IN OUR REGION ................................................. 12
CHAPTER III: MARKET ANALYSIS – DEMAND AND ADOPTION RATES ....... 15 ELECTRIC VEHICLE AVAILABILITY ................................................................................................ 15 FACTORS AFFECTING DEMAND .................................................................................................. 16 EV SALES FORECASTS .............................................................................................................. 16 ADOPTION BY FLEET MANGERS ................................................................................................. 18 CONSUMER PROFILE ............................................................................................................... 18 Characteristics of Electric Vehicle and Hybrid Purchasers ............................................. 19 National Barriers to Consumer Purchase of Electric Vehicles ........................................ 19 Local Barriers to Consumer Purchase of Electric Vehicles ............................................. 20 Charging Infrastructure .................................................................................................. 21
ESTIMATED DEMAND IN EUGENE AND SPRINGFIELD ..................................................................... 23
CHAPTER IV: ELECTRIC VEHICLE SUPPORT EQUIPMENT ............................. 25 TYPES AND COSTS OF EVSE UNITS ............................................................................................ 25 Charging Station Plug Standards .................................................................................... 25 Level 1 ............................................................................................................................. 25 Level 2 ............................................................................................................................. 26 Level 3 ............................................................................................................................. 26 Summary ........................................................................................................................ 27

Page | viii Community Planning Workshop
EVSE SITING ISSUES ................................................................................................................ 27 Charging Station Installation Scenarios .......................................................................... 27 Site Level Installation Considerations ............................................................................. 29
EVALUATION OF EVSE DISTRIBUTION AND LOCATIONS IN THE EUGENE‐SPRINGFIELD METROPOLITAN
AREA .................................................................................................................................... 34 Siting considerations ...................................................................................................... 34 Survey Respondents’ Preferred EVSE Locations ............................................................. 35 High Priority EVSE Locations ........................................................................................... 36
POTENTIAL BUSINESS MODELS .................................................................................................. 36 Better Place Subscription Model .................................................................................... 37 Chargepoint Subscription and Direct Point of Sale Model ............................................. 37 Direct Utility Billing Model ............................................................................................. 37 Summary ......................................................................................................................... 38
CHAPTER V: POWER LOAD IMPLICATIONS .................................................. 39 REGIONAL ELECTRICAL SUPPLY .................................................................................................. 39 LOCAL ELECTRICAL SUPPLY ....................................................................................................... 39 Local Generation Capacity .............................................................................................. 39
IMPLICATIONS FOR LOCAL UTILITIES ........................................................................................... 40 Influence of EVs on Electricity Demand ......................................................................... 40 Localized Limitations of Grid .......................................................................................... 41
TECHNOLOGIES AVAILABLE FOR MANAGING POWER LOAD ............................................................ 41 On‐board Technology ..................................................................................................... 41 Time of Use Pricing ......................................................................................................... 42 Advanced Metering ........................................................................................................ 42 Smart Grid ...................................................................................................................... 43
CONCLUSION ......................................................................................................................... 43
CHAPTER VI: PROPOSED FRAMEWORK FOR SUPPORTING ELECTRIC VEHICLES IN EUGENE‐SPRINGFIELD ............................................................. 45
CONSIDERATIONS ................................................................................................................... 45 CONCLUSIONS ........................................................................................................................ 47 POLICY IMPLICATIONS .............................................................................................................. 48 1 Public Awareness / Understanding of EVs................................................................... 48 2 Publicly‐Accessible EVSE Installations ......................................................................... 48 3 Parking management................................................................................................... 49 4 Road Maintenance Revenue ....................................................................................... 49 5 Electricity Consumption/Demand ............................................................................... 49 6 Public Safety ................................................................................................................ 50
RECOMMENDATIONS ............................................................................................................... 50
APPENDIX A: PROJECTED EV DEMAND FOR THE EUGENE‐SPRINGFIELD REGION .......................................................................................................... 57

Eugene‐Springfield Electric Vehicle Assessment November 2010 Page | ix
HYBRID ADOPTION RATES ........................................................................................................ 57 HYBRID BUYER PROFILE ........................................................................................................... 58 CHARACTERISTICS OF EUGENE HYBRID OWNERS .......................................................................... 60 WHERE ARE EV BUYERS LIKELY TO LIVE? .................................................................................... 62 EV PENETRATION FORECAST FOR EUGENE‐SPRINGFIELD ............................................................... 64
APPENDIX B .................................................................................................... 67 COMMUNITY SURVEY RESULTS .................................................................... 67
RESPONDENT CHARACTERISTICS ................................................................................................ 67 CONSUMER PERCEPTIONS OF ELECTRIC VEHICLES ......................................................................... 70 CHARGING PREFERENCES ......................................................................................................... 75 CONCLUSIONS ........................................................................................................................ 78 SURVEY INSTRUMENT .............................................................................................................. 80
APPENDIX C: POWER LOAD ESTIMATES ...................................................... 87 Projected EV Adoption Rates and Local Utilities ............................................................ 87
APPENDIX D: ‘ONE STOP SHOP’ PERMITTING ............................................ 95

Page | x Community Planning Workshop

Eugene‐Springfield Electric Vehicle Assessment November 2010 Page | 1
CHAPTER I: INTRODUCTION
Transportation planners, the auto industry, and consumers are seeking alternatives to the internal combustion engine. Electric vehicles (EVs) are an increasingly feasible alternative and may soon be widely available to individual consumers and businesses. EVs, however, represent a nascent technology. Their implications for cities and transportation systems have yet to be fully understood. This report identifies and analyzes key issues and opportunities related to the adoption of EVs in the Eugene‐Springfield metropolitan region.
Background The Oregon Department of Transportation (ODOT) forecasts strong growth in the demand for electric vehicles, and estimates that they may account for up to 20 percent of new vehicles sold in the state within the a decade.1 ODOT also, however, identified the lack of a reliable network of charging facilities as the most significant barrier to the widespread adoption of EVs, suggesting that careful attention be given to infrastructure development.2
Moreover, in 2009 Oregon and Washington were identified as two of five sites to participate in The EV Project. This partnership between ECOtality and Nissan North America is funded by a $99.8 million grant from the U.S. Department of Energy. The project includes the large‐scale deployment of Nissan’s new electric vehicle, the LEAF, as well as the deployment and evaluation of new EV charging infrastructure. The EV project will begin installation of EV charging infrastructure throughout the Willamette Valley—including the Eugene‐Springfield Metropolitan region—in 2011.
Given recent advances in EV technology, strong state support, and the potential environmental and economic benefits of electric vehicles, local governments in our region are keenly interested in better understanding the implications of EVs. The City of Eugene recent adopted the goals of an 80% reduction of local greenhouse gas emissions by 2050 and a 50% reduction of fossil fuel consumption by 2020.3 The steps for achieving these goals have yet to be fully defined. Provision of public electric vehicle charging stations, however, was included in the City’s draft climate action plan. Few precedents yet exist to guide cities in the installation of EV charging infrastructure, a technology still in its infancy. The need for a better understanding of EVs is particularly urgent with the arrival of EVs in Eugene‐Springfield by the end of 2010.
1 State of Oregon. (2010, May 24). Innovative Partnerships Program. Retrieved June 05, 2010, from Office of Innovative Partnerships and Alternative Funding: http://www.oregon.gov/ODOT/HWY/OIPP/inn_ev‐charging.shtml
2 ibid
3 Climate and Energy Action Plan Advisory Team. (2010, May 5). DraftCEAP_May2010. Retrieved June 6, 2010, from Sustain Eugene: http://www.sustaineugene.com/eugeneclimate/wp‐content/uploads/2009/08/DraftCEAP_May2010.pdf

Page | 2 Community Planning Workshop
Purpose and Methods This project is funded by the Oregon Transportation Research and Education Consortium (OTREC) as part of a broader initiative in support of EV research. In 2009, OTREC funded EV‐related research at four participating campuses around the state.4 The purpose of this project is to assess the implications of EVs for the Eugene‐Springfield metropolitan area. The project included the following elements:
• A literature review focused on EV technology and strategies for its development
• An assessment of local demand for EVs
• Identification of power load implications for utilities based on the local demand assessment
• Identification of siting implications, opportunities, and challenges, such as local developmental codes and safety issues
• Maps of potential locations for charging infrastructure in the metropolitan area
• Analysis of pricing implications, potential pricing structures, and regulatory issues for fleet, residential and convenience charging sites
• Development of materials and outreach strategies to raise public
In preparing this report, we drew on existing EV research, and conducted an online survey to gauge local EV demand and preferences for charging station locations. We combined existing research with community input to ensure that our conclusions and recommendations reflect the unique characteristics of the Eugene‐Springfield community.
Organization of this Report The remainder of this report is organized as follows:
• Electric Vehicle Overview (History & Technology)
• Market Analysis of Local Consumer Demand for EVs
• Electric Vehicle Support Equipment (EVSE) and Analysis of Emerging Business Models
• Local Power Load Implications and Technologies available for Managing Peak Power Loads
• Proposed Framework for Supporting Electric Vehicles in Eugene‐Springfield ‐ recommendations to Local governments and Utilities to Facilitate EV rollout and Transportation Network Planning.
4 These include University of Oregon, Portland State University, Oregon State University, and the Oregon Institute of Technology.

Eugene‐Springfield Electric Vehicle Assessment November 2010 Page | 3
This report also includes four appendices”
A. Market Analysis Details
B. Community Survey Results
C. Power Load Estimations
D. ‘One Stop Shop’ proposal

Page | 4 Community Planning Workshop

Eugene‐Springfield Electric Vehicle Assessment November 2010 Page | 5
CHAPTER II: ELECTRIC VEHICLE OVERVIEW
Because EV technology is rapidly evolving it is import to understand its status in 2010. We begin with a brief history of EVs and then address various elements of EV technology. The next section addresses federal, state, and local policies. The section concludes with a discussion of key issues for local governments and utilities agencies.
History of Electric Vehicles Electric vehicles (EVs) have received much media attention recently as automobile manufacturers prepare to release new plug‐in electric models. These offer the promise of reduced reliance on fossil fuels and zero tailpipe carbon emissions, thus presenting a possible solution to many of the key impacts of internal combustion engines.
Optimism, however, must be tempered with the knowledge that electric vehicles already have a long and fitful history in the United States. New Jersey’s Electric Vehicle Company began planning its first electric fleets for urban areas along the East Coast in 1897.5 These EVs, though cleaner and quieter than their gasoline‐powered counterparts, never gained significant market traction. Ultimately, the small scale of production of these vehicles, coupled with limited battery capacities, and a sparse and unreliable charging infrastructure rendered these vehicles incompatible with America’s growing automobile ‘touring’ culture.6 Production ceased, and EV technology entered a long period of dormancy.
Nearly a century later, in 1990, EV technology enjoyed a brief resurgence on the opposite coast. Responding to rapidly deteriorating air quality in the Los Angeles Basin, the California Air Resources Board (CARB) introduced a mandate requiring that the state’s major automobile manufacturers develop electric vehicles each year.7 Ultimately the requirements of this zero‐emissions mandate were substantially reduced and weak consumer demand rendered these electric vehicle ventures unprofitable.8 Following this short period, electric vehicle technology once again faded into the background.
A renewed interest in EVs has recently begun to emerge. In 2010, the federal government adopted more stringent fuel economy standards for vehicles9, and 5 Kirsch, D. A. (2000). The electric vehicle and the burden of history. New Brunswick, N.J.: Rutgers University Press.
6 ibid
7 The initial requirement for EVs was 2 percent in 1998, gradually increasing to 10 percent in 2003. California Air Resources Board. Zero‐emission vehicle legal and regulatory activities. Retrieved on May 17, 2010, from http://www.arb.ca.gov/msprog/zevprog/background.htm
8 In a now infamous act, General Motors recalled all of its EVs and ordered them crushed.
9 EPA and NHTSA finalize historic national program to reduce greenhouse gases and improve fuel economy for cars and trucks. (2010, April 5). Retrieved from http://www.epa.gov/otaq/climate/regulations/420f10014.htm

Page | 6 Community Planning Workshop
consumers increasingly demand more efficient vehicles. Major automakers responded to this potential demand for compact EVs by announcing plans to release plug‐in electric vehicles by 2011.
EV technology has advanced in recent years, and continues to evolve at a brisk pace. The following section provides a brief snapshot of the state of electric vehicle technology today. It introduces and clarifies basic terminology and concepts that is referenced throughout this report. This includes summary of the types of EVs currently available, and those under development; a description of the types and characteristics of charging stations; and a synopsis of federal, state, and local policies that are intended to spur the development and adoption of EVs. This technology review establishes a context for subsequent discussion EV implications for consumers, utilities providers, and local governments.
Overview of EV Technology
Electric Vehicle Configurations This report focuses on vehicles that are exclusively powered by an electric motor and a rechargeable battery. Other electric vehicle (EV) configurations, however, also fall within this general category.
Hybrid Electric Vehicles Hybrid electric vehicles, known as HEVs or simply “hybrids,” are powered by both a gasoline engine and an electric motor. Toyota’s Prius is probably the best known vehicle in this category. The electric motor provides additional power when needed, reducing the need, and the size, of the internal combustion engine, allowing HEVs to boast greater fuel efficiency and lower tailpipe emissions than conventional automobiles.10 Onboard generators and regenerative braking recharge the electric motor’s battery. Plugging in to an external power source is not a possibility.
PLUG-IN HYBRID ELECTRIC VEHICLES Plug‐in hybrid electric vehicles (PHEVs), like hybrids, are powered by both a gasoline engine and an electric motor. Unlike HEVs, the batteries of PHEVs can be charged by plugging into an external electric source, or powered by an energy conversion device.11 PHEVs require a larger battery pack than conventional hybrid electric vehicles.
10 U.S. Department of Energy. (2010, February 19). Vehicle Technologies Program: Hybrid Electric Vehicles (HEVs). Retrieved January 10, 2010, from Energy Efficiency & Renewable Energy: vehicle Technology Program: http://www1.eere.energy.gov/vehiclesandfuels/technologies/systems/hybrid_electric_vehicles.html
11 U.S. Department of Energy. (2010, February 19). Vehicle Technologies Program: Hybrid Electric Vehicles (HEVs). Retrieved January 10, 2010, from Energy Efficiency & Renewable Energy: vehicle Technology Program: http://www1.eere.energy.gov/vehiclesandfuels/technologies/systems/phev.html

Eugene‐Springfield Electric Vehicle Assessment November 2010 Page | 7
BATTERY ELECTRIC VEHICLES Pure electric vehicles, also known as battery electric vehicles (BEVs), are powered solely by a battery pack. Unlike plug‐in hybrids, BEVs have no internal combustion engine for back‐up power, and can only be recharged by an external electric power source.12 Ford, Chrysler, Toyota, and Nissan each have plans to release a BEV soon.
Electric Vehicle Categories Most major auto manufacturers do not yet offer light‐duty, passenger BEVs. They are, however, used in many other applications. The basic categories are outlined below.
NEIGHBORHOOD ELECTRIC VEHICLES Neighborhood Electric Vehicles (NEVs) are low‐speed vehicles that are restricted to travel on roads with speed limits of 35 mph or less. They are well suited to small, enclosed communities; and are used on college campuses for maintenance tasks.
CITY ELECTRIC VEHICLES City electric vehicles are small, light, short‐range vehicles designed for in‐town travel; they fill the gap between low‐speed NEVs and full‐size passenger EVs.13 With a top speed of less than 60 mph, city electric vehicles are not intended for highway travel.
MOTORCYCLES Electric motorcycles, scooters, and three‐wheeled vehicles use the same technology as electric passenger cars. Battery requirements for these vehicles are much lower than for a standard light‐duty passenger vehicle.14
FREIGHT AND LIGHT-/HEAVY-DUTY VEHICLES Electric vehicles are also used in freight and light‐/ heavy‐duty applications. Smaller light‐duty EVs use the same technology as NEVs. They move goods in neighborhoods where speed limits are constrained. Medium and heavy‐duty EVs have a payload capacities and maximum speeds comparable to their gasoline‐powered counterparts.15
12 U.S. Department of Energy. (2010, February 19). What is a plug‐in hybrid electric vehicle? Retrieved January 10, 2010, from Energy Efficiency and Renewable Energy: Alternative Fuels and Advanced Vehicles Data Center: http://www.afdc.energy.gov/afdc/vehicles/plugin_hybrids_what_is.html
13 Oregon DMV. (2009, October 2). Electric & Hybrid Vehicles. Retrieved January 10, 2010, from Oregon DMV: http://www.oregon.gov/ODOT/DMV/vehicle/electric_hybrid.shtml
14 Oregon DMV. (2009, October 2). Electric & Hybrid Vehicles. Retrieved January 10, 2010, from Oregon DMV: http://www.oregon.gov/ODOT/DMV/vehicle/electric_hybrid.shtml
15 Plug in America. (2010, March 17). Plug‐in Vehicle Tracker. Retrieved January 14, 2010, from Plug In America: http://www.pluginamerica.org/vehicles/#Commercial‐Vehicles

Page | 8 Community Planning Workshop
Electric Vehicle Charging Equipment Although electric vehicle service equipment (EVSE—frequently called charging infrastructure) will usually be installed at the residence or workplace of EV users, a network of publically available EVSE is widely seen as a necessary first step to broad scale EV adoption. EVSE are generally categorized by their three voltage levels. Level 1 operates at 110 volts (15‐20 amps), Level 2 from 220 to 240 volts (either 15 or 30 amps, max 80 amps), and Level 3 at 480 volts (up to 167 amps). Table 1 shows that charging times depend on the type of charging station and the size of the battery.
Most existing Level 1 charging stations employ a three‐prong standard outlet (NEMA 5‐10P/5‐20P). In January 2010, the Society of Automotive Engineers (SAE) adopted the J1772 standard for new Level 1 and Level 2 charging stations. For Level 3 charging stations, there is currently no standard plug. It is likely, however, that the SAE‐J1772 plug will become the standard for all chargers.
Table 2-1. Typical charging times for Level 1, 2, and 3 charging stations
Charging Station Level Typical Charging Time Likely Location
Level 1 10 – 20 hours Household
Level 2 3 – 6 hours Household, Commercial, Public
Level 3 20 – 40 minutes Commercial, Public Based on a 24 kWh battery and charged from empty to full charge
Policy Related to Electric Vehicles The emergence of electric vehicle technology has received broad policy support at federal, state, and local levels. Policy incentives, designed to encourage EV development, are outlined below.
FEDERAL POLICY The federal government has implemented several policies to encourage the production and deployment of electric vehicles. The Advanced Technology Vehicle Manufacturing Loan Program, authorized through the Energy Independence and Security Act (EISA) of 2007, appropriated $25 billion for loans to manufacturers of vehicles and components that improve fuel economy at least 25 percent above 2005 levels.
The Electric Drive Vehicle Battery and Component Manufacturing Initiative –part of the American Recovery and Reinvestment Act of 2009 (ARRA) ‐ authorized $2 billion for the manufacture of batteries and electric drive components, and development of a lithium ion battery recycling program. Grant recipients must contribute matching funds. The result is a total investment of $4 billion in electric vehicle technologies, spread over thirty companies.
Other federal policies encourage consumer adoption of EVs. The Emergency Economic Stabilization Act of 2008 established a federal income tax credit for the purchase of new hybrid and battery electric vehicles. This credit was expanded under ARRA. The amount of the tax credit ranges from $2,500 to $7,500,

Eugene‐Springfield Electric Vehicle Assessment November 2010 Page | 9
depending upon vehicle battery capacity. The credit phases out for vehicle models that exceed a sales limit of 200,000 units.
A separate federal income tax credit exists for Neighborhood Electric Vehicles (NEVs), electric motorcycles, and electric three‐wheeled vehicles. This credit equals 10% of the cost of the electric vehicle, up to $2,500.
In addition to establishing federal income tax credits, the U.S. Congress has appropriated funding for vehicle electrification programs to be administered through the Department of Energy. The Nissan and ECOtality partnership EV Project, noted above, is an example.
STATE OF OREGON Oregon’s 2006 Sustainability for the 21st Century Act mandates that state agencies develop and implement a sustainability plan, as well as maintain performance measures to gauge its progress. Deployment of electric vehicles fits well within the state’s broader sustainability goals, particularly to the Oregon Department of Transportation’s (ODOT) Sustainability Plan. The Plan outlines a vision for the state’s transportation system, including efficient vehicles powered by renewable fuels for all transportation modes, substantial air and water quality improvement, and the use of new technologies to improve safety and mobility.
In 2008 Governor Kulongoski created the Alternative Fuel Vehicle Infrastructure Working Group to collect market and policy research on existing alternative fuel infrastructure programs in an effort to identify opportunities and barriers to the development of such infrastructure in Oregon.16
In February 2009 the governor created the Oregon Way Advisory Group, a public‐private partnership of experts in sustainable technologies,17 to assist state agencies in obtaining ARRA funds for large‐scale electric vehicle deployment.18
In addition to actively promoting electric vehicle legislation, the Governor has acted to encourage major automobile manufacturers to use Oregon as a test market for electric vehicles.19
OREGON DEPARTMENT OF TRANSPORTATION ODOT, in accordance with its stated sustainability goals, has taken steps to support deployment of electric vehicle charging infrastructure. Currently, ODOT is working to develop a charging station installation guide, with user‐friendly instructions for the purchase, installation, and maintenance of electric vehicle
16 Alternative Fuel Vehicle Infrastructure Working Group. (2010, January). AFVIWG Final Report. Retrieved from http://governor.oregon.gov/Gov/pdf/afviwg_final_report.pdf
17 Economic stimulus and recovery "The Oregon Way". (2010, March 12). Retrieved from http://www.oregon.gov/recovery/mission.shtml
18 The Oregon Way: Deployment of Electric Vehicles and Charging Infrastructure. (n.d.). Retrieved from http://www.oregon.gov/ODOT/HWY/OIPP/docs/CleanCities_OWAG_Summary_final.pdf.
19 Governor encourages legislature to pass electric vehicle bills. (2010, April 7). Retrieved from http://governor.oregon.gov/Gov/P2009/press_040709.shtml.

Page | 10 Community Planning Workshop
service equipment. The guide, geared toward consumers, business owners, and government project managers alike, provides information on permitting and code issues, and on new technologies which might affect purchasing decisions.20
In April 2009 ODOT issued a Request for Proposals for EVSE in order to establish consistent standards and uniformity across Oregon’s new EV infrastructure. By implementing centralized purchase agreements ODOT is encouraging a standardization that can help enable a consistent charging experience for consumers across the state.
CITY OF EUGENE The City of Eugene has also demonstrated support EV adoption. City officials have encouraged development of an electric vehicle charging equipment (EVSE) infrastructure by incorporating it into the City’s Green Infrastructure Project (GIP), a concept plan intended to boost downtown economic development and vitality. The GIP specifically includes development of EVSE infrastructure, as a way of promoting the economic competitiveness of downtown businesses. Vehicle charging stations are expected to create jobs, as they will require trade skills to safely operate, and may spur development of related industries such as battery technology development and component manufacturing within the metropolitan region.
Support of EVSE development fits within the City of Eugene’s broader policy framework. It aligns with the City’s Sustainable Business Initiative, Downtown Plan, City Council 2009 Vision and Goals, and Downtown and Riverfront Urban Renewal Plans21. The Community Climate and Energy Action Plan recommends a community‐wide a fossil fuel reduction of 50%. Development of an electric vehicle charging network is included in the plan as a key mitigation strategy to achieve this reduction.22
Implications of Electric Vehicles Wide‐scale adoption of EVs and installation of EVSE has implications of broad scale EV deployment for consumers, for the environment, and for local government agencies and utilities providers.
Implications for Consumers TRAVEL BEHAVIOR The willingness of consumers to purchase EVs is affected by the vehicles’ range limitations. The potential to become stranded, without access to a publicly
20 Office of Innovative Partnerships and Alternative Funding. (2010, May 24). Office of innovative partnerships and alternative funding ‐ innovative partnerships program. Retrieved from http://www.oregon.gov/ODOT/HWY/OIPP/inn_ev‐charging.shtml
21 Green Infrastructure – Project Description. (n.d.). Retrieved from http://www.eugene‐or.gov/portal/server.pt/gateway/PTARGS_0_2_355981_0_0_18/Attachment%20F%20CC%20AIS.
22 Climate and Energy Action Plan Advisory Team. (2010). A Community Climate and Energy Action Plan for Eugene. Retrieved June 02, 2010, from http://www.sustaineugene.com/eugeneclimate/wp‐content/uploads/2009/08/DraftCEAP_May2010.pdf

Eugene‐Springfield Electric Vehicle Assessment November 2010 Page | 11
accessible charging station, creates the fear dubbed “range anxiety”. A study by Aerovironment found that drivers are unwilling to travel a distance greater than half of an EVs range.23
How will EV ownership fit with current driving patterns? In one scenario, EV drivers will use their vehicles primarily for in‐town errands, and for commuting to work. The size of the Eugene‐Springfield metropolitan region is ideal for this situation. According to the Lane Council of Governments, residents who live and commute in Eugene‐Springfield drive an average of 8.5 miles per day; well within the 100‐mile range of contemporary EVs.24 Moreover, the average household in the Willamette Valley owns 2.1 vehicles, indicating that an EV could be an ideal primary ‘commute’ car, with a secondary car being used for longer trips.
LIFETIME COSTS OF OWNERSHIP The lifetime cost of ownership is defined as the total cost of ownership over the life of a vehicle. This includes the initial cost to purchase and install the EV and charging station, electricity to fuel the EV, and ongoing maintenance costs. Electric vehicles currently have a higher initial cost than internal combustion engine vehicles, though this cost will undoubtedly decrease for EVs as the technology matures.
Over time, savings in maintenance and fuel costs will likely create parity between EVs and ICE vehicles. While its initial cost is higher, the simplicity of the EV’s single electric motor is expected to make it cheaper to maintain than an ICE that has hundreds of moving parts that require oil, coolant, and filter changes.25
The largest savings is from fuel. At the current price of about $3 per gallon of gasoline, a vehicle that achieves 35 mpg and travels 12,000 miles annually has an approximate operating cost of $0.09/mile. This cost is expected to increase as global demand for gasoline increases. Assuming the cost of electricity to be about $0.09/kWh, the comparable cost to operate an EV is approximately $0.02/mile. Using these figures, the yearly fuel savings for an EV would be $840, and the payback period for the difference in initial costs is roughly 11.5 years. If gasoline costs increase, the payback period would be less. Moreover, advances in battery technology and other factors may reduce the production cost of EVs.
23 Loveday, E. (2009, August 24). High Gear Media. Retrieved February 18, 2010, from allcarselectric.com: http://www.allcarselectric.com/blog/1034449_interesting‐study‐shows‐range‐anxiety‐does‐not‐involve‐rational‐thinking.
24 Lane Council of Governments. (2007, November). Transplan: The Eugene‐Springfield Transportation System Plan. Retrieved May 18, 2010, from lcog.org: http://docs.lcog.org/mpo/PDF/rtp/2031/2031RTP_Chapter4_Nov‐07Adoption_Corrected.pdf
25 Including the maximum $7,500 federal tax credit for which the Nissan LEAF will be fully eligible, the consumer’s after‐tax net value of the vehicle could be as low as $25,280. The Manufacturer’s Suggested Retail Price *(MSRP) for the 2011 all‐electric, zero‐emission Nissan LEAF is $32,780. Additionally, there is an array of state and local incentives that may further defray the costs, and increase the benefits, for owning and charging a Nissan LEAF. For example, a $5,000 clean‐vehicle rebate is offered in California; a $5,000 tax credit in Georgia; a $1,500 tax credit in Oregon; and carpool‐lane access in some states, including California. The lease price for the Nissan LEAF begins at $349 per month.

Page | 12 Community Planning Workshop
Implications for the Environment IMPLICATIONS FOR THE ENVIRONMENT Replacing fossil fuels with renewable energy sources could reduce the U.S. carbon footprint, decrease greenhouse gas emissions (GHG), and improve air quality for local communities. The carbon footprint and amount of GHGs emitted from EVs, however, will depend on the type of energy sources used to fuel the vehicle. The amount of carbon released by an ICE over its lifetime is three times greater than that of an EV, if renewable energy sources are used to generate the electricity. Even the use of EVs powered by coal produced energy will result in some GHG improvements when compared with ICEs.26
Another environmental concern is the improvement of air quality. EVs emit no emissions at their tailpipe of greenhouse gases, nitrous oxides, particulates, and smog.27 This has potential for significant air quality improvement in metropolitan areas. As electricity producers move toward more sustainable energy sources, these emissions at the location of power production will also decline.
Implications for Utilities Providers IMPLICATIONS FOR UTILITIES Concern has been expressed that the mass introduction of EVs could overwhelm the ability of local utility providers to both produce and deliver the needed power. It is estimated that the current US national electric infrastructure could support 84% of the nation’s cars and trucks (estimated to be around 198 million vehicles). Estimating the impact at power supply at a local level, however, is more complicated. Possible local EV adoption rates, and the implications for local power demand, are examined in more detail subsequent sections of this report.
Summary - Implications of Electric Vehicles in Our Region Any assessment of implications for the local community must begin with certain assumptions regarding market penetration rates and anticipated charging behaviors. The availability of EVs raises some challenging questions:
1. How fast will consumers adopt EVs? 2. What factors could limit adoption? What actions might support
adoption? 3. What infrastructure is necessary to support potential levels of
adoption? How will it be developed? What is the public role? 4. Where should charging equipment be located? What criteria should be
used now and in the next 5‐10 years? 5. What are the implications for local utilities?
26 Institute for Lifecycle Environmental Assessment. (2003, September 12). Automobiles: Electric vs Gasoline. Retrieved January 13, 2010, from Institute for Lifecycle Environmental Assessment: http://www.iere.org/ILEA/lcas/taharaetal2001.html
27 UK Department for Transport. (2010, January 14). Investigation into the Scope for the Transport Sector to Switch to Electric Vehicles and Plug‐in Hybrid Vehicles. Retrieved January 14, 2010, from Department for Transport: http://www.berr.gov.uk/files/file48653.pdf

Eugene‐Springfield Electric Vehicle Assessment November 2010 Page | 13
The remainder of this report attempts to address these questions and proposes a local framework for accommodating electric vehicles in the Eugene‐Springfield region.

Page | 14 Community Planning Workshop

Eugene‐Springfield Electric Vehicle Assessment November 2010 Page | 15
CHAPTER III: MARKET ANALYSIS – DEMAND AND ADOPTION RATES
Electric vehicles (EVs) are coming to the Eugene‐Springfield metropolitan area. How quickly they will arrive, how much infrastructure will be needed to support them, and how quickly policies need to be enacted to assure an orderly transition depends on the rate at which consumers adopt EVs. In this section we examine factors that will determine how quickly EVs are bought or leased by area residents, and predict the rate at which they will arrive.
A 2009 survey conducted by Davis, Hibbitts, and Midgehall (DHM) found that Willamette Valley residents generally have positive views about EVs, but also that good access to charging stations is perceived to be a critical factor to their adoption.28 This suggests that the availability and visibility of publically available charging infrastructure will likely impact the rate at which Oregonians adopt EVs.
Beyond infrastructure availability, other macroeconomic factors may affect EV adoption rates. A continued economic recession will depress the demand for all new cars, particularly those perceived to have a cost premium. On the other hand rising fuel costs could make EVs’ per/mile cost advantage compelling to consumers. Lower operating and maintenance costs, combined with the availability of financial incentives such as tax credits, may well foster an EV adoption rate, in the next few years, which mirrors that of hybrid vehicles over the last decade. In that light we developed EV adoption estimates for the Eugene‐Springfield area.
Electric Vehicle Availability Automobile manufacturers were eager to display their EVs at the January 2010 Detroit auto show, many announcing plans to introduce all electric vehicles soon. Plug‐in electric vehicles, such as the Chevy Volt29 and Toyota Prius, have well established distribution plans. Production plans for battery electric vehicles such as the Nissan LEAF30 and Mitsubishi MiEV31 are also known. For many ‘concept cars’ distribution plans are speculative at best. Most carmakers have not yet made their EV plans public. ECOtality, drawing upon data published by Credit
28 Davis, Hibbitts, and Midgehall, inc,, Initials. (2009, November). 10 things buyers believe about electric vehicles. Retrieved from http://www.dhmresearch.com/downloads/PSU‐PGE_link_1.pdf
29 GM is planning to produce 8,000 to 10,000 VOLTS in 2011 according to report by earth2tech, GM: First Profit in 3 Years, Chevy Volt in the Wings, (May17,2010), http://earth2tech.com/2010/05/17/gm‐first‐profit‐in‐3‐years‐chevy‐volt‐in‐the‐wings/
30 Nissan will have a limited number of LEAFs available in 2010. They plan to build 50,000 in 2011 and will then go into full‐scale production.
31 Mitsubishi began selling the i‐MiEV in July 2009
Page | 16 Community Planning Workshop
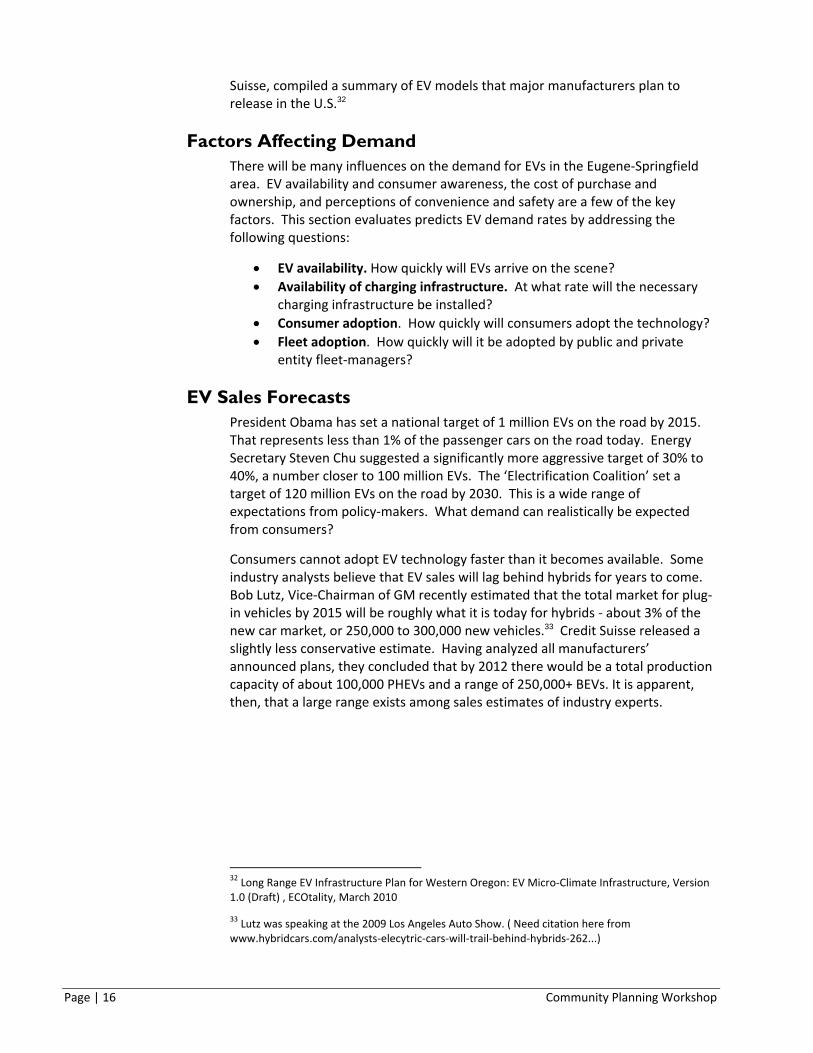
Suisse, compiled a summary of EV models that major manufacturers plan to release in the U.S.32
Factors Affecting Demand There will be many influences on the demand for EVs in the Eugene‐Springfield area. EV availability and consumer awareness, the cost of purchase and ownership, and perceptions of convenience and safety are a few of the key factors. This section evaluates predicts EV demand rates by addressing the following questions:
• EV availability. How quickly will EVs arrive on the scene? • Availability of charging infrastructure. At what rate will the necessary
charging infrastructure be installed? • Consumer adoption. How quickly will consumers adopt the technology? • Fleet adoption. How quickly will it be adopted by public and private
entity fleet‐managers?
EV Sales Forecasts President Obama has set a national target of 1 million EVs on the road by 2015. That represents less than 1% of the passenger cars on the road today. Energy Secretary Steven Chu suggested a significantly more aggressive target of 30% to 40%, a number closer to 100 million EVs. The ‘Electrification Coalition’ set a target of 120 million EVs on the road by 2030. This is a wide range of expectations from policy‐makers. What demand can realistically be expected from consumers?
Consumers cannot adopt EV technology faster than it becomes available. Some industry analysts believe that EV sales will lag behind hybrids for years to come. Bob Lutz, Vice‐Chairman of GM recently estimated that the total market for plug‐in vehicles by 2015 will be roughly what it is today for hybrids ‐ about 3% of the new car market, or 250,000 to 300,000 new vehicles.33 Credit Suisse released a slightly less conservative estimate. Having analyzed all manufacturers’ announced plans, they concluded that by 2012 there would be a total production capacity of about 100,000 PHEVs and a range of 250,000+ BEVs. It is apparent, then, that a large range exists among sales estimates of industry experts.
32 Long Range EV Infrastructure Plan for Western Oregon: EV Micro‐Climate Infrastructure, Version 1.0 (Draft) , ECOtality, March 2010
33 Lutz was speaking at the 2009 Los Angeles Auto Show. ( Need citation here from www.hybridcars.com/analysts‐elecytric‐cars‐will‐trail‐behind‐hybrids‐262...)
Eugene‐Springfield Electric Vehicle Assessment November 2010 Page | 17
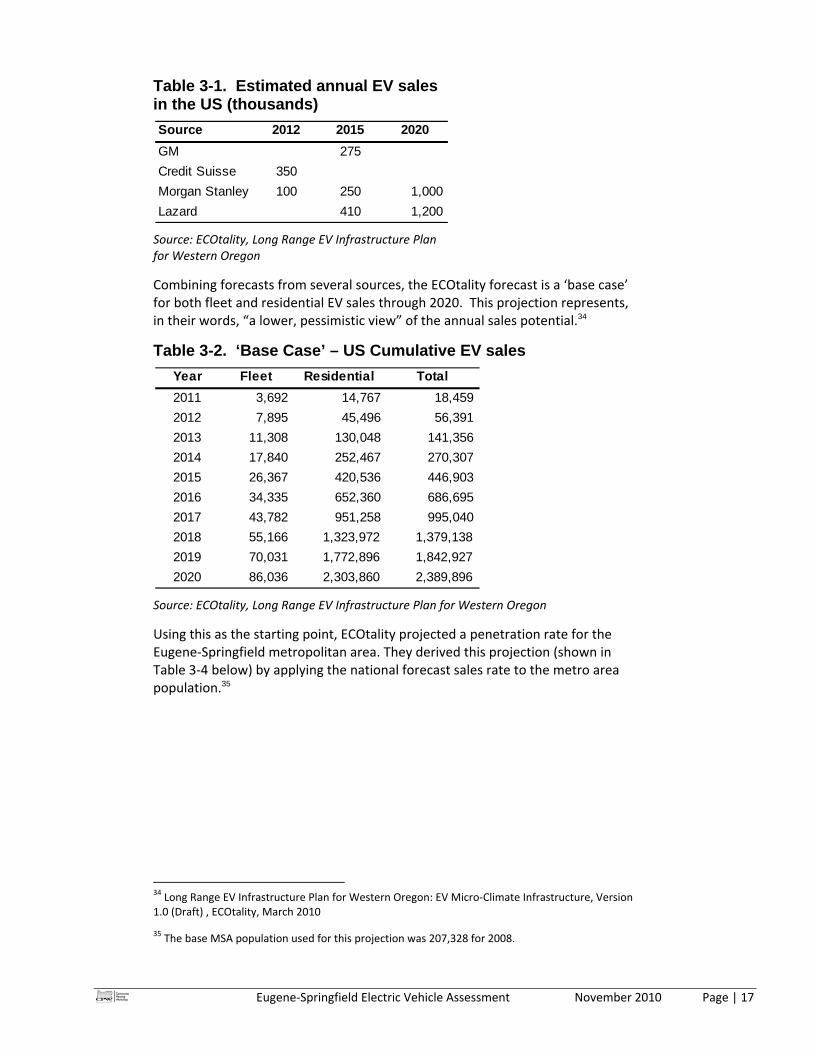
Table 3-1. Estimated annual EV sales in the US (thousands)
Source: ECOtality, Long Range EV Infrastructure Plan for Western Oregon
Combining forecasts from several sources, the ECOtality forecast is a ‘base case’ for both fleet and residential EV sales through 2020. This projection represents, in their words, “a lower, pessimistic view” of the annual sales potential.34
Table 3-2. ‘Base Case’ – US Cumulative EV sales
Source: ECOtality, Long Range EV Infrastructure Plan for Western Oregon
Using this as the starting point, ECOtality projected a penetration rate for the Eugene‐Springfield metropolitan area. They derived this projection (shown in Table 3‐4 below) by applying the national forecast sales rate to the metro area population.35
34 Long Range EV Infrastructure Plan for Western Oregon: EV Micro‐Climate Infrastructure, Version 1.0 (Draft) , ECOtality, March 2010
35 The base MSA population used for this projection was 207,328 for 2008.
Source 2012 2015 2020GM 275Credit Suisse 350Morgan Stanley 100 250 1,000 Lazard 410 1,200
Year Fleet Residential Total2011 3,692 14,767 18,459 2012 7,895 45,496 56,391 2013 11,308 130,048 141,356 2014 17,840 252,467 270,307 2015 26,367 420,536 446,903 2016 34,335 652,360 686,695 2017 43,782 951,258 995,040 2018 55,166 1,323,972 1,379,138 2019 70,031 1,772,896 1,842,927 2020 86,036 2,303,860 2,389,896

Page | 18 Community Planning Workshop
Table 3-3. ‘Base Case’ Eugene-Springfield EV sales
Source: ECOtality, Long Range EV Infrastructure Plan for Western Oregon
We reviewed other available indicators to evaluate whether the local adoption rate of EVs will be higher or lower than the national rate. The past registration rates of hybrid vehicles may be one indicator of future EV adoption rates. Later in this section that indicator will be used to develop an EV penetration forecast in the local area.
Adoption by Fleet Mangers Mass purchasing by fleet managers is one area where EVs could achieve large scale quickly. Fleet managers identified cost savings and cost containment as top priorities for 2010 in a poll conducted by GE Capital Fleet Services.36 As existing fleets age, and come due for replacement, EVs are likely to become an increasingly popular choice, particularly in response to significant increasing gasoline prices. The Cities of Eugene and Springfield may be forced by current budgetary constraints to defer fleet replacement in the next year, and possibly beyond. It is likely, then, that there will be some ‘pent‐up demand’ for replacement fleet vehicles sometime in the next two to five years when economic conditions, hopefully, improve.
Consumer Profile Little literature is available to help us understand the consumer profile of the ‘typical’ EV buyer, simply because there are currently so few of them. Much more has been written about the profile of the hybrid owner. The perception that EVs offer lower operating and maintenance costs versus traditional internal combustion engine vehicles (ICEs), and the availability of tax credits and other
36 Environmental Leader, Energy & Environmental News for Business. (2010, May 21). Fleet managers say fuel consumption, miles. Retrieved from http://www.environmentalleader.com/2010/05/21/fleet‐managers‐say‐fuel‐consumption‐miles‐driven‐are‐top‐metrics‐for‐managing‐their‐fleets/
YearAnnual Sales
Cumulative Sales
2011 147 147 2012 155 301 2013 194 495 2014 313 808 2015 526 1,334 2016 763 2,098 2017 1,105 3,203 2018 1,484 4,687 2019 1,976 6,663 2020 2,511 9,175

Eugene‐Springfield Electric Vehicle Assessment November 2010 Page | 19
financial incentives, will logically foster an EV adoption rate in the next few years mirrors that of hybrid vehicles over the last decade.
Assuming that the profile of EV drivers will be similar we can examine what has been learned about hybrid drivers. This may provide some insight into the profile of the consumers who will buy the first wave of EVs.
Characteristics of Electric Vehicle and Hybrid Purchasers Studies conducted by Scarborough Research37 and Topline Strategy Group38 show that hybrid buyers tend to be older, better educated, and wealthier than the average automobile purchaser. It also noted a high rate of people, 88%, who reported being ‘very happy’ with their purchase.
For this group of ‘early adopters’ purchase price was not the primary consideration. Most had planned to buy a car of equal cost to a hybrid, and over 80% seriously considered only a hybrid vehicle when deciding what car to buy. For these early adopters environmental and other social considerations trump both initial cost and operating costs in their purchase decision.
National Barriers to Consumer Purchase of Electric Vehicles What factors influence consumer decisions to buy an electric vehicle? Conventional wisdom holds that for most consumers high initial cost, range anxiety, and a lack of infrastructure are nearly insurmountable barriers to purchase intent.39 A 2009 Ernst and Young study reinforced some of these concerns.40 Other research however presents a more nuanced picture of consumer attitudes.
A 2009 study conducted by the University of Michigan41 found potential fuel cost savings, and perceived environmental benefits, are at least as important as initial cost. Reducing trips to the gas station was also a highly valued benefit among this group of respondents.42
A study conducted by the City of New York found that, among New Yorkers, attitudes toward the environment and toward new technologies will drive early
37 Scarborough Research. (2007, December 4). Hybrid Vehicle Owners are Wealthy, Active, Educated, and Overwhelmingly Democratic. Retrieved Feb 28, 2010, from www.hybridcars.com: http://www.hybridcars.com/hybrid‐drivers/profile‐of‐drivers.html
38 Klein, Jonathan (2007). Why People Really Buy Hybrids. Newton, Ma: Topline Strategy Group.
39 See Chapter 2 for a discussion of EV pricing.
40 Ernst & Young, Automotive Survey: Measuring the understanding of and interest in plug‐in hybrid and electric vehicles in the US, Dec. 2009 Retrieved January 24, 2010, from www.hybridcars.com: http://www.hybridcars.com/hybrid‐drivers/profile‐of‐drivers.html
41 Curtin, R., Shargo, Y., and Mikkelsen, J. “Plug‐in hybrid Vehicles”, The University of Michigan, 2009
42 The survey, conducted among a sample of 2,513 adults nationwide, was specifically addressed to knowledge of and attitudes toward PHEVs.

Page | 20 Community Planning Workshop
adoption of EVs to a greater extent than will concerns about cost.43 It found a “potentially large group of early adopters willing to change behavior to accommodate electric vehicles.” A large enough group of early adopters, in fact, as to outstrip the available supply of EVs in New York for at least the next five years.44 The study concluded that early adopters would be willing to pay more to buy an EV, and would be willing to change where they currently park in order to charge their vehicles, even if they had to pay more to do so.
The New York study suggests that, for this group of early adopters, tax credits and other price incentives are less important than availability of information from which to make an informed purchase decision. Another commonly expressed motivation among this group was the desire to be recognized for purchasing an electric vehicle. Perceived social benefits may be as large a consideration in the decision to purchase an EV as price or widespread availability of charging stations. The study recommends that the City of New York’s early policy actions should be targeted to the issues that early adopters find most important.
The Ernst and Young study, cited above, drew a similar conclusion, if for different reasons. It noted that, “not many consumers are willing to embrace the new technology prior to it being well established in the market, making it crucial for vehicle manufacturers to facilitate the best possible purchase and ownership experience for the 10% to 15% of early adopters.”
Local Barriers to Consumer Purchase of Electric Vehicles The studies cited above reached similar conclusions about barriers to EV and PHEV adoption. Two drew from a nationwide sample; one was targeted to a specific profile of New York City residents. How much do these studies tell us about perceived barriers among residents of the Eugene‐Springfield metropolitan area? Does the same range of issues apply, and are these issues weighted similarly?
To address these questions we conducted a convenience survey of 246 residents of the Eugene‐Springfield Metropolitan area. Results of that survey are detailed in Appendix B, and summarized by key themes below.
COST While the initial cost of an EV may be higher than that of a standard automobile, consumers are expected to save significantly over the life of the vehicle. Because the electric engines will contain fewer moving parts, service costs are expected to be minimal. Fuel also represents a saving as cost per mile for electricity is significantly lower than for fossil fuels.
Eugene‐Springfield area residents who took the CPW survey were asked to rate various factors that would influence their decision to purchase an electric vehicle. 43 The City of New York, “Exploring electric vehicle adoption in New York City”, planyc, A greener, greater New York, January 2010.
44 The survey was conducted among a sample of 1,384 consumers, matching demographic characteristics that are representative of 28% of New York City’s total population and 63% of the city’s car owning households.

Eugene‐Springfield Electric Vehicle Assessment November 2010 Page | 21
When asked, “How important or unimportant would the following factors be in your decision to purchase a plug‐in electric vehicle as your next new vehicle,” cost was rated “very important” (VI) or “important” (I) by 96% of respondents. However, 92% also rated fuel cost savings as VI or I, and 69% rated government incentives as VI or I (Table 3‐4).
Clearly initial cost is a key factor in the purchase decision. Tax credits and other incentives, however, can also be strong modifying factors, as is the price of fuel.
Table 3-4. Factors in EV Purchase Decision
Source: Community Survey, CPW 2010
Charging Infrastructure As noted above, a 2009 DHM study concluded that having publicly accessible EVSE infrastructure is critical to the acceptance of EVs by Oregonians.45 Other recent studies, however, cast doubt on the importance of public charging station infrastructure as a pre‐requisite to EV adoption. Tom Turrentine, director of the Plug‐In Hybrid Electric Vehicle Center at the University of California, Davis points to the experience in Berlin, Germany where a large installed network of public charging stations has gone largely unused by that city’s EV drivers.46
When asked to rate factors influencing their decision to purchase an electric vehicle, 86% of our survey respondents rated “access to charging stations outside your home” as either important or very important. Only 5% rated such access as unimportant or very unimportant (Table 3‐4).
It seems clear that, for potential Oregon EV purchasers, the perception that charging equipment is not available outside of their home is a significant concern.
45 Davis, Hibbitts, and Midgehall, inc, 10 things buyers believe about electric vehicles, November 2009
46 http://www.msnbc.msn.com/id/35352973/ns/business‐autos/ Electric vehicle range: What, me worry?: Studies show ‘range anxiety’ may be low hurdle for EV acceptance., msnbc.com March 4, 2010, accessed April 17, 2010.
FactorsVery Important
or ImportantUnimportant or Very
UnimportantGovernment Incentive 92% 3%Environmental Impact 93% 3%Cost 81% 2%Design / Appearance 69% 7%Values or Recognition 59% 10%Energy Security 26% 33%Fuel Cost Savings 82% 2%Driving Range between Charges 96% 1%Access to Charging Outside Your Home 90% 4%Convenience 86% 5%

Page | 22 Community Planning Workshop
RANGE A typical EV like the Nissan LEAF can expect a range of about 100 miles.47 However, the Tesla Roadster, Model S, and the Chrysler Dodge Circuit are EVs with a range greater than 200 miles.48 An EV’s range, or the distance that can be traveled between charges, has been expected to be a barrier to consumer adoption. Recent studies, however, suggest that barrier may be smaller than once thought. Market research for instance, recently reported by MSNBC, found that current EV drivers consider 100 miles per charge an acceptable range to satisfy their typical needs.49
In our own survey 56% of respondents indicated a range of 100 miles or less per charge would represent an acceptable daily driving range. Of the same group of respondents, 41% indicated that they intend to buy or are considering buying an EV. Only 7% of respondents indicated that they would not buy an EV.50 Though not statistically valid, the survey results suggest that ‘range anxiety’ may be a smaller barrier for residents in the metropolitan area than previously thought.
FAMILIARITY WITH EV TECHNOLOGY As with any new technology the general lack of knowledge about EVs, their range, maintenance costs, and charging requirements, can be a significant barrier to consumer acceptance.
Respondents to our consumer survey51 were asked about their familiarity with EV technology and about their intent to buy an EV in the future. Figure 3‐1 shows a correlation between familiarity with the technology and intent to buy an EV. For policymakers, and others, who wish to promote EV adoption, this suggests that public education is an important consideration in each aspect of infrastructure rollout.
47 http://green.autoblog.com/2009/12/19/electric‐moto‐corporation‐unveils‐new‐emax‐72ds/
48 ECOtality. (2010, January). Electric Vehicle Charging Infrastructure Deployment Guidelines for the Oregon I‐5 Metro Areas of Portland, Salem, Corvallis and Eugene.
49 http://www.msnbc.msn.com/id/35352973/ns/business‐autos/ Electric vehicle range: What, me worry?: Studies show ‘range anxiety’ may be low hurdle for EV acceptance., msnbc.com March 4, 2010, accessed April 17, 2010.
50 See Appendix B
51 There were 246 total respondents to the survey. This was a web based ‘convenience’ survey, and so not statistically representative of the metro area population.

Eugene‐Springfield Electric Vehicle Assessment November 2010 Page | 23
Figure 3-1. EV Familiarity and Intent to Purchase
Source: Community Survey, CPW 2010
Estimated Demand in Eugene and Springfield The emerging state of EV technology makes it difficult to develop EV demand estimates. No direct precedents exist on which to base such estimates. Yet the rate of adoption of EVs has profound implications at the national, regional, and local levels. Most importantly, the number and type of EVs will have implications for electrical demand and the need for external charging infrastructure to support the EV fleet. We developed alternative estimates of EV demand for the Eugene‐Springfield metropolitan area with these considerations in mind.
Like any forecast, these estimates are based on assumptions, and are only relevant if those assumptions are correct. Moreover, the state of EV technology is rapidly changing. Advances that increase range or lower prices could have a profound effect on consumer demand.
As a starting point for our forecast, we looked at hybrid adoption rates in our region. Many industry analysts consider historic adoption rate of hybrid vehicles an indicator of likely EV adoption rates. With this in mind, we analyzed hybrid adoptions in the Eugene‐Springfield metropolitan area as compared with national adoption rates.52
Oregon ranks 11th among all states for hybrid popularity, with 1.18 hybrids registered for every 1,000 residents. Portland is consistently rated as the top city for hybrid popularity, with per capita hybrid registrations indexing at roughly five times the national average. Eugene‐Springfield consistently ranks among the top
52 See Appendix A for the detailed analysis of hybrid ownership in Eugene‐Springfield.
30%22%
6% 9% 3%0%
37%
17%
27% 27%
20%
0%
27%
56%63% 64%
75%
100%
0%
10%
20%
30%
40%
50%
60%
70%
80%
90%
100%
Might consider buying
Would not buy
Am considering buying
Will buy in 6‐10 years
Will buy in 1‐5 years
Currently own EV
Not at all familiar Not very familiar Somewhat familiar
Familiar No response

Page | 24 Community Planning Workshop
fifteen census defined Metropolitan Statistical Areas (MSAs), with hybrid registrations indexing at about twice the national average.
Taking these factors (and others)53 into account, we established a likely case projection, and a high case projection for Eugene‐Springfield EV adoption through the year 2020. These cases, along with the ECOtality base case projection, are shown in Figure 3‐2.
The methodology used to make these projections is fully discussed in Appendix A of the report.
Figure 3-2. Cumulative EV Purchase Estimates, Eugene-Springfield, 2011-2020
53 See Appendix A for a discussion of the methodology for making our EV penetration forecast
‐
2,000
4,000
6,000
8,000
10,000
12,000
14,000
16,000
2011 2012 2013 2014 2015 2016 2017 2018 2019 2020
Year
Base
Likely
High

Eugene‐Springfield Electric Vehicle Assessment November 2010 Page | 25
CHAPTER IV: ELECTRIC VEHICLE SUPPORT EQUIPMENT
Electric vehicle support equipment (EVSE) units are to electric vehicles (EVs) what gas pumps are to internal combustion engine vehicles (ICEs). This section describes the various types of EVSE units, siting and installation considerations, the potential distribution of the EVSE units in Eugene and Springfield, and emerging EVSE business models.
Types and Costs of EVSE Units Electric vehicle charging stations are units that enable recharging of plug‐in electric vehicle batteries. These units are referred to as electric vehicle service equipment (EVSE), but are better known to the public simply as “charging stations.” As the EVSE overview below demonstrates, these units can vary widely in both their design and functionality.
Charging Station Plug Standards Standardization of charging station plugs is still in its early phases and a variety of plugs have been introduced in recent years. Consequently, the ability to connect a specific EV to a specific charging station will depend on the type, and age, of each. Most EVs can connect to charging stations using either a common three‐prong plug (NEMA 5‐20R), or a newly developed five‐prong plug (SAE‐J1772) designed specifically for EV charging applications.
In January 2010, the Society of Automotive Engineers International (SAE International) designated the SAE‐J1772 plug as the industry standard for Level 1 and Level 2 charging stations. This standard will likely be adopted by manufacturers and will result in the phasing out of the conventional three‐prong plug (NEMA 5‐20R). Specifications for a standard plug for Level 3 charging stations are still under development.
Level 1 APPLICATION Level 1 charging stations, most commonly found in residential use, take a significant amount of time to charge an electric vehicle battery fully. These charging stations operate on the standard household voltage supply of 110‐120V and, depending on the circuit amperage, can require between 7 to 27 hours to deliver a full charge. These units tend to be used primarily for charging NEVs, golf carts, and other low speed, low capacity vehicles.54
54 ECOtality. (2010). Electric Vehicle Charging Infrastructure Deployment Guidelines for The Oregon I‐5 Metro Areas of Portland, Salem, Corvallis and Eugene. ECOtality.

Page | 26 Community Planning Workshop
COST Level 1 charging stations vary in price depending on the number of plugs available on each unit. These units tend to fall within a range of $600‐$1,000.55 Installation costs for these units also vary, depending on the power available at the current circuit.
Level 2 APPLICATION Level 2 charging stations present a significantly faster charging option and will probably become the new household standard as major automobile manufacturers begin their EV rollout over the next few years. These charging stations operate on a 220V supply and are capable of fully charging an electric vehicle in 4 to 8 hours,56 depending upon the circuit amperage.
Level 2 charging stations are available for residential applications as well as commercial and public charging applications. Level 2 chargers are designed to charge all electric vehicles that use the SAE‐J1772 plug standard. This standard, approved and maintained by the Society of Automotive Engineers, is a five‐prong plug designed specifically for use with EVs in North America.57
COST Level 2 charging stations vary in price depending on the amperage of the unit. These units tend to fall within a range of $1,500‐$3,300.58 Installation costs for these units will also vary depending on the available service to the dwelling or business and the availability of power on the current circuit.
Level 3 APPLICATION The fastest option available is the Level 3 “quick charger,” which operates on a 480V power supply and is capable of fully charging an electric vehicle battery in just 20 to 50 minutes.59 Level 3 charging stations are expected to be available solely for commercial and public charging applications in the near future.
55 ECOtality. Pricing and specifications. (2010, April 19). Retrieved from http://www.minit‐charger.com/other/chargers/specs_prices.php
56 ECOtality. (2010). Electric Vehicle Charging Infrastructure Deployment Guidelines for The Oregon I‐5 Metro Areas of Portland, Salem, Corvallis and Eugene. ECOtality.
57 Society of Automotive Engineers; Craig B. Toepfer (2001‐09‐27) (DOC). SAE Electric Vehicle Conductive Charge Coupler, SAE J1772, REV. MONTH01. California Air Resources Board. Retrieved 2009‐10‐23
58 ECOtality. Pricing and specifications. (2010, April 19). Retrieved from http://www.minit‐charger.com/other/chargers/specs_prices.php
59 ECOtality. (2010). Electric Vehicle Charging Infrastructure Deployment Guidelines for The Oregon I‐5 Metro Areas of Portland, Salem, Corvallis and Eugene. ECOtality.

Eugene‐Springfield Electric Vehicle Assessment November 2010 Page | 27
COST Level 3 charging stations are still in development and not yet available for purchase. Initial estimates put these charging stations in the $5,000‐$20,000 price range.60 Installation costs on these units will also vary greatly.
Summary Table 4‐1 summarizes typical electric vehicle charging times for each of the three charging levels, taking into account the effect of differing circuit amperage levels.
Table 4-1. Electric Vehicle Charging Times
Level I Level 2 Level 3
Battery Size (kWh)
110‐volt AC, 15 amps – 1.6 kW
110‐volt AC, 20 amps – 2.2 kW
220‐volt AC, 20 amps – 4.4 kW
220‐volt AC, 35 amps – 7.7kW
480‐volt AC, 85 amps – 55
kW
16 10h 7h 16m 3h 38m 2h 5m 17m
24 15h 10h 55m 5h 27m 3h 7m 26m
42 26h 30m 19h 5m 9h 33m 5h 27m 46m
* Charging times are estimated based on the following formulae: Voltage x Amperage = kW; and kWh/kW = charge time
EVSE Siting Issues
Charging Station Installation Scenarios The type and charging level of a deployed EVSE unit will vary depending on the intended application. Five basic installation scenarios are outlined below, ranging from the typical home charging unit to the curbside public charging station.
SINGLE ATTACHED/DETACHED GARAGE Residential installations will likely emerge as the predominant charging scenario, as EVSE units are bundled with individual vehicle sales. Communities such as San Francisco have already recognized this potential and have adopted building codes that require new residences to be “EVSE‐ready.”
In the typical residential scenario of a single attached/detached garage, a Level 1 or Level 2 charging station will most often be installed. Here, standard electrical codes require that the EVSE be permanently mounted and hardwired into a dedicated branch circuit. For Level 1 installations, the circuit that handles the charging receptacle is no different from other typical household circuits. For Level 2 installations, however, the circuit must handle a 240‐volt alternating current/single phase with 4‐wires (2 Hot, GND, Neutral) and a 40‐amp breaker, much like the circuit requirements for typical household dryers and electric ranges.61
60 ChargeNW. Pricing and specifications. (2010, April 19). Retrieved from http://www.chargenw.com/products.html
61 ECOtality. (2010). Electric Vehicle Charging Infrastructure Deployment Guidelines for The Oregon I‐5 Metro Areas of Portland, Salem, Corvallis and Eugene. ECOtality.

Page | 28 Community Planning Workshop
CAR PORT In the car port scenario, voltage levels and circuit requirements remain the same, but the EVSE units must be of a more durable construction. Specifically, EVSE units must be able to withstand exposure to extreme temperatures, precipitation, and other weather hazards. Another consideration is the slope of the driveway due to the hazard of water pooling near the EVSE.62
MULTI-FAMILY DWELLINGS Landlord/tenant relations, and the cost of EVSE, make multi‐family dwelling scenarios more complicated than those for single‐family dwellings. Nearly one‐third of Eugene’s housing stock—over 21,000 dwelling units—are multifamily. It is our judgment that the property owners of multi‐family properties will have little incentive to install EVSE due to purchase, installation, and maintenance costs. Moreover, financial models for recovering the cost of EVSE are unclear at this time. In the near‐term, the limited number of renters that will likely own EVs is a disincentive to property owners for EVSE installation. Conversely, limited EVSE in rental housing will be a barrier to EV purchase by home renters.
If a renter is interested in purchasing an EV, a discussion between the EV purchaser and their property owner should occur before the purchase. There should be clear agreements and a resolution of issues of EVSE ownership, installation, and electricity pricing.63 The siting requirements and circuit installation are similar to a either a single attached/detached garage or carport depending on location. Similarly, a Level 1 or 2 charging station is appropriate.
COMMERCIAL FLEETS The only constraint of a commercial fleet scenario for EVSEs is the amount of available electricity at the installation location. Similar to other scenarios, Level 1 and 2 charging stations are appropriate for commercial fleets. As the technology matures, some fleet managers may prefer Level 3 chargers. As with the carport scenario, commercial fleet charging stations that are located out of doors will need to be capable of handling all types of weather.
PUBLICLY ACCESSIBLE CHARGING STATIONS Broadly speaking, there are three types of charging station scenarios: (1) standalone use; (2) accessory use of another commercial building; and (3) in the public right‐of‐way. In each of these scenarios, the use of a Level 2 or Level 3 charging station is appropriate. Most publicly accessible charging stations will likely be located in parking lots or garages. In most cases, this installation will be considered as an accessory use of another commercial building or a standalone use. However, regardless of the location, the siting, permit, and installation process is different for each situation.64
62 ibid
63 ibid
64 ibid

Eugene‐Springfield Electric Vehicle Assessment November 2010 Page | 29
The following three examples all describe different installation situations that would have different permitting and siting requirements:
• For an installation associated with a shelter, additional building permits must be secured for the shelter.
• For an installation that requires the placement of additional conduit, additional inspection fees may be required.
• For an installation that requires additional power service or additional connections, higher permitting fees may be required.
Other scenarios may emerge as EVSE manufacturers begin to explore the provision of publicly accessible charging facilities.
Site Level Installation Considerations A number of siting issues will arise in the consideration of a specific property on which to locate EVSE units, whether it is a commercial, industrial, or public development. Some of these considerations are outlined below.
SIGNAGE ISSUES Placing signs that draw the driver’s attention to the location of an EVSE is a recommended best practice though current codes do not require it. Standard signage standard for EVSE units located in public or semi‐public places have not yet been adopted. A sign currently proposed by ECOtality, however, may become the de facto standard. There are three primary components that need to be addressed when designing a signage standard: the color, size, and logo of the sign.
COLOR
Color‐coding of signs and striping is essential to a driver’s ability to recognize the location and purpose of a parking space. Many colors have been used in the past to represent EVSE units, including blue with white writing, green with white writing, and white with green writing. Some municipalities are concerned that blue and white signage could be easily confused with that for handicap accessible parking. Additionally, green and white signage could be confusing in cities such as Portland, OR where green curbs and green lane painting are associated with bike traffic. The sign currently proposed by ECOtality, a white sign with red lettering, can be seen in Figure 4‐1, alongside three other common designs.65
SIZE
After color, shape and size are the most important elements for sign recognition. Current EV signage is typically the same size and shape as a handicap accessible parking space sign. While most signage regulations will likely be left to local governments, industry standardized signage tends to be adopted on a national scale. A complicating consideration is signage indicating a space that is both EV accessible and handicap accessible. Some jurisdictions place a handicap accessible designator alongside an EVSE designator, though the effectiveness and clarity of these combination signs is debatable. The size and lighting standards of
65 ibid

Paage | 30
LIG
PA
any commermuch like a g
LOGO / GRAP
The third impHere again a yet been adowhite car witunits, a white
Figure 4-1
Sources (from lehttp://www.tra
GHTING AND
Some publicaunits. Shelteground fault consumer feon sunny daybe mounted lots and streeneeded – eitlighting may taken to ensshelter or lig
ARKING IMPAC
By definitionquestions reglots still needspots for peoDisabilities Acustomer groadvent of thein the parkinfront entranconly” parkingcustomers, t 66 ibid
67 ibid
cial signs at Egas station.66
PHIC
portant elemstandard log
opted, thoughth an over‐size circular sign
. Example
eft to right): ECOafficsign.us
D SHELTER ally accessibleer from weathcircuit interrars about chays. In larger pon car park cetlights will pher for safetybe installed wure complianhting is adde
CTS , publicly‐accgarding the lod to be answeople with disaAct), pregnantoups (employese parking sg lot. Becausce of commeg spots may chose who dri
EVSE units wil
ent for sign rgo to identify h several are zed battery shn with a blue
s of curren
Otality, http://w
e EVSE locatioher is not neeupters ‐ but marging in the rparking solar covers. For mprovide adequy or to draw awhere permisce with buildd to support
cessible EVSE ocations of deered. Many sabilities (a reqt or expectingyee of the mopots, the nexse most reserrcial buildingscreate a barrieve ICE vehicle
ll usually fall u
ecognition is an EVSE accecurrently in uhown in the fplug has also
nt EVSE pa
www.impactlab.c
ons may requeded so muchmore as a conrain or snow.arrays that h
many public usuate lighting.attention to tssible by city ding codes andEVSE installat
will be locateedicated EVSstores currentquirement ung mothers, anonth or membxt task becomrved parking ss there are coer to store enes. Because a
Community
under local si
the graphic, essible parkinuse. One comront. For cero been used.
arking sign
com, http://ecx.i
uire lighting ah for safety – nvenience, an They can alselp curb elecses existing li Where morehe EVSE unitsordinances.67
d other local tions.
ed in parking E accessible stly have dedicnder the Amend even certabership holdees locating “Espaces are loconcerns that dntry for the vaadoption rate
y Planning Wor
gnage ordina
or logo elemeg space has n
mmon examplrtain bollard s
nage
images‐amazon
nd shelter fosince EVSEs hnd to alleviateso provide shtricity usage ghts in parkine illuminations – additional7 Care should ordinances w
lot. A numbespots in parkicated parkingricans with in employee ers). With theEVSE only” spcated near thdesignating “ast majority oes of EVs will
rkshop
ances,
ent. not le is a style
.com,
r have e ade can ng n is l be
where
er of ng g
or e pots he “EVSE of

Eugene‐Springfield Electric Vehicle Assessment November 2010 Page | 31
initially be low, store owners or managers need to consider the best placement of these spaces. Considerations for the best placement will include:
• Visibility to customers • The proximity of adequate electrical service • Installation costs. • The number spaces dedicated EV parking spaces that they wish to
create.68 Concerns also exist around parking management—customers that “ICE” parking spaces (when a conventional internal combustion engine vehicle parks in an EV charging space), parking turnover, to name a few.
ADA ACCESSIBILITY The Americans with Disabilities Act (ADA) mandates that parking spaces for individuals with disabilities be provided in all commercial parking facilities. Building codes for the Cities of Eugene and Springfield conform to ADA; however, those requirements do not currently address EVs. The National Electric Code for EVSE provides additional guidance for installing EVSE units and some municipalities provide guidelines for creating accessible EV parking locations.69 When considering guidelines for the Eugene‐Springfield area, the following should be taken into consideration:
• The height of an EV Coupler should be no less than 24 inches and no more than 48 inches above the ground.
• The parking space should be at least 8 feet wide by 18 feet deep
• The parking space should include at least 5 feet of aisle space on the passenger side for standard accessibility spaces and 8 feet of aisle space for van accessible spaces.
• The space should provide adequate space for a wheelchair to pass the wheel stop.
68 ibid
69 National Fire Prevention Association. (2007). National Electric Code 2008 (NFPA 70). National Fire Prevention Association (NFPA).

Page | 32 Community Planning Workshop
Figure 4-2. Diagram of EV accessible parking space
Source: “Electric Vehicle Charging Infrastructure Deployment Guidelines” ECOtality, Jan 2010
Guidelines that apply to accessible spaces will also apply to EV accessible spaces. Because EVSE accessible spaces should be reserved for EV use only, any such spaces must be provided in addition to the number of required accessible spaces.
Currently, there are no minimum requirements for EVSE accessible spaces in a large‐scale installation. One suggested rule of thumb is that for every 25 parking stalls, one should be EVSE accessible. For every 10 EVSE accessible stalls, one should be van accessible. Table 4‐2 summarizes how this standard would be applied.
Table 4-2. Accessible spaces in relation to total spaces EV Parking Spaces Accessible Spaces Van Accessible Spaces
1 1 1
2‐25 1 1
26‐50 2 1
51‐75 3 1
76‐100 4 1
Source: “Electric Vehicle Charging Infrastructure Deployment Guidelines,” ECOTality, January 2010
It should be noted that EV accessible parking spaces are typically not exclusive and any EV driver may park in one of these locations if it is the only space available for charging.70
70 ECOtality. (2010). Electric Vehicle Charging Infrastructure Deployment Guidelines for The Oregon I‐5 Metro Areas of Portland, Salem, Corvallis and Eugene. ECOtality.

Eugene‐Springfield Electric Vehicle Assessment November 2010 Page | 33
FLOOD ZONES Adequate drainage must be ensured at all EVSE installations to prevent accumulation of standing water. Special care should to be taken in areas where flooding is possible. For these areas, EVSE units with retractable cables will be ideal, as a retractable cable will keep the charging plug off the ground and out of any standing water that might damage or trip the ground fault circuit interrupter. Additionally, elevated units, such as pole or wall mounted and bollard style units installed on concrete risers will be preferable in flood prone areas.
OPERATIONS AND MANAGEMENT EVSE contain complex electronics and, as such, require care in their operation and management. Moreover, the operation and management of publicly accessible EVSE—whether on public land, private land, or in the public right‐of‐way—will be a concern of local governments. The degree to which local governments will want, or need, to regulate EVSE is not yet clear. At the extreme, it is possible that local governments will want to enter in franchise agreements with companies that install and operate EVSE. The remainder of this section describes some of the potential issues related to operations and management of publicly accessible EVSE.
POINT OF SALE OPERATIONS
Many commercial grade EVSE units are equipped with Point of Sale (POS) terminals. These terminals offer the choice to purchase electricity by the kWh or by a set amount of charging time.71 The cost of electricity may, in the short term, be absorbed into the commercial parking rate. Available POS options for EVSE include credit card terminals, RFID scanners, and bill and coin slots. These POS options, especially bill and coin slots, may be prone to vandalism and theft. Care should be taken to locate POS enabled EVSE units in secure, well‐lit areas.72
VANDALISM
During the initial launch of EVSE units in the 1990s, vandalism, theft, and defacement of EVSE units was minimal. Vandalism, however, is always a possibility and care must be taken to minimize the threat. Most EVSE units are constructed of materials that are easily cleaned to remove graffiti. Many POS options can also be replaced or serviced as the need arises.73
To minimize the threat of vandalism, EVSE units should be placed in well‐lit areas that are highly visible or under video surveillance. Retractable cables or cable locks can also prevent vandalism to the unit, as these methods can curb intentional or inadvertent damage to the unit.
OWNERSHIP
In some situations, the ownership of EVSE may come into question. For example, a business owner may not own the parking lot, but may want to install an EVSE
71 Charging per kWh is currently not legal in Oregon, though the possibility exists for this to change.
72 ibid
73 ibid

Page | 34 Community Planning Workshop
unit. In situations like this, the business owner would need to make sure their use of the parking lot allows them to install EVSE, or gain such approval from the property owner. Local governments can help to forestall such conflicts by requiring landowner approval as a condition of granting EVSE installation permits.
A another example EVSE units may be leased from a third party, in which case that third party could claim ownership. Property and business owners should agree on the ownership of EVSE units and come to a consensus on who will own the equipment if the property or business is eventually sold. Appropriate contracts or lease amendments regarding EVSE ownership should be executed in these situations, helping to minimize the likelihood that disputes will arise that require legal resolution.74
MAINTENANCE
EVSE units will not typically require maintenance75; however, units can wear and periodic inspections should be conducted to ensure that units are in proper working order. Occasional cleaning may be required if the unit is marked by graffiti or reported to be unacceptably dirty. Communications systems and lighting should also be tested periodically. Repair of accidental damage or purposeful vandalism may also be required.76
Evaluation of EVSE Distribution and Locations in the Eugene-Springfield Metropolitan Area
This section presents the survey results pertaining to placement of EVSE units in the Eugene‐Springfield metropolitan area. The survey sought feedback from metro area residents about potential EVSE unit locations. The complete survey results can be found in Appendix B.
Siting considerations The survey asked respondents to suggest the types of locations where Eugene‐Springfield residents would like to see public and semi‐public EVSE installed. Other site specific concerns – accessibility, visibility, parking availability, density, and grid capacity – should be considered when considering specific potential sites.
Some questions to ask when considering a specific site location are:
• What is the typical turnover time for a car parked at this location? How does that time compare to EV charging times. Less than an hour may be too short, more than a few hours is probably too long
• Will the EVSE unit or signage be visible to drivers such that they have adequate time to slow down and turn in safely?
74 ibid
75 ibid
76 ibid

Eugene‐Springfield Electric Vehicle Assessment November 2010 Page | 35
• Is the location easily accessible to drivers arriving from and continuing on to all directions?
• Will the conversion of one or more parking spaces significantly impact the overall parking requirements at this location?
• Is the distribution of EVSE units adequate to cover all areas of the city? Conversely, is the density of units in each area sufficient to meet the localized demand?
• Can the existing power grid handle the additional load of an array of EVSE units in this location?
Survey Respondents’ Preferred EVSE Locations The locations marked with purple points in Map 4‐1 represent the 36 most popular choices of our survey respondents. The ten most popular locations were the Market of Choice on Willamette and 29th, Valley River Center, Oakway Center, Gateway Mall, the University of Oregon, parking garages located in downtown Eugene, Costco, and the Eugene Public Library. These locations are shown in larger, orange points. See Appendix B for a detailed listing of all of the recommended locations.
Map 4-1. Preferred locations for EVSE units, as identified by survey respondents
Source: Community Planning Workshop Electric Vehicle Survey

Page | 36 Community Planning Workshop
High Priority EVSE Locations EVSE units should be placed at popular destinations that are also evenly distributed throughout the metropolitan area. The capacity of the current power grid may prohibit installation of units in certain areas, particularly the downtown area, despite its popularity as a location among survey respondents.
Using these survey results as a basis 13 areas were identified as being ‘high priority’. These locations are labeled in Map 4‐2 for their proximity to familiar landmarks. Each point is surrounded by a ¼‐mile circle. This represents an ideal area within which to search for a site for one of the first 14 EVSE to be installed.
Map 4-2. High priority locations for EVSE units, as identified by the Eugene-Springfield EV working group and city staff
Source: Community Planning Workshop Electric Vehicle Survey and Input from Eugene-Springfield EV working group
Potential Business Models Electric vehicles are gaining traction as a viable transportation option. Because of this many companies are pursuing business opportunities related to public charging equipment. This will have municipal code and other policy implications for local government and utilities agencies. Some of the potential business models, and attendant code and policy implications, are outlined below.
As EVSE units begin to rollout questions will arise about cost burdens:
• Who will pay for EVSE units and the electricity to charge an EV? • How will they payment be made?

Eugene‐Springfield Electric Vehicle Assessment November 2010 Page | 37
• Who has ultimate ownership of and maintenance responsibilities for publically accessible EVSE?
Business models, currently proposed by utility providers and private companies, may help to answer these questions.
Better Place Subscription Model California‐based startup Better Place has partnered with the Renault‐Nissan automotive alliance in an ambitious plan to bring nearly 500,000 EVSE units and 200 battery exchange stations to Israel. Battery exchange stations are service stations that will exchange batteries for commuters who are traveling further than a charge will carry them and do not have time to charge their battery at a charging station. In this model the purchase of a Renault or Nissan vehicle from a Better Place authorized representative includes a monthly service plan for battery exchanges. The customer owns the EV but not the battery. This resembles the US cellular communications industry in which the cost of the battery is subsidized by a monthly service plan. Better Place plans deployment in Denmark, Australia, Canada, Japan, California, and Hawaii) following the initial startup in Israel at the end of 2010.77
Chargepoint Subscription and Direct Point of Sale Model ChargePoint, a subsidiary of Coulomb Technologies, is installing a network of charging stations that communicate with one another, and with central processing centers, via cellular networks. In contrast to Better Place, ChargePoint has no partnership with EV manufacturers. The driver of any EV can purchase a radio frequency Identification (RFID) dongle that is linked to a monthly subscription plan. This system resembles Exxon/Mobil’s ‘SpeedPass’ method for gas purchases. Other methods are available for non subscribers to charge on a pay‐per‐use basis.
This model provides for bi‐directional metering, which allows Coulomb to charge exact amounts per kWh used. Coulomb’s website says of this technology that it provides “flexible subscriber payment methods like “free” charging, pay per use, by subscription, and by kWh (where allowed).”78
Direct Utility Billing Model Under the direct utility billing model, the each EV charge is metered and added to the driver’s home utility bill. This is can be used for charges that occur within the driver’s home utility service area; travel outside this area will require charging by other methods.
77 Betterplace. Global Progress. (2010, April 18). Retrieved from http://www.betterplace.com/global‐progress/
78 ChargeNW. Pricing and Specifications. (2010, April 19). Retrieved from http://www.chargenw.com/products.html

Page | 38 Community Planning Workshop
Summary A number of EVSE business models are in development around the world. None is currently dominant, primarily because EVs are still relatively rare. As demand for EVs increases, the market for EVSE related businesses will begin to take shape.

Eugene‐Springfield Electric Vehicle Assessment November 2010 Page | 39
CHAPTER V: POWER LOAD IMPLICATIONS
This section examines the electrical power load implications of large‐scale EV adoption. We begin with a review of power load issues and implications at the national and regional levels, and conclude with an analysis of local implications, including key considerations for Eugene‐Springfield’s electrical utilities suppliers.
Regional Electrical Supply In 2010, the overall electrical generation capacity in the United States was sufficient to meet demand for electricity. Experts assert that sufficient generation capacity exists for widespread adoption of electric vehicles. By some estimates the United States has enough electrical capacity to support 74 million PHEVs or approximately one‐half of the total U.S. automobile fleet.79 The Northwest Power Pool (NWPP) area, which includes all of the west coast and much of the mountain west, can support 11.9 million PHEVs.80 The electricity generation and transmission infrastructure is designed to accommodate peak demand loads. Because of this the electrical capacity is underused during most of the 24‐hour daily cycle.81
Local Electrical Supply The Eugene Water and Electric Board (EWEB) and the Springfield Utility Board (SUB) are both part of the Northwest Power Pool (NWPP) area. The NWPP is sub‐divided into areas serving Washington, Oregon, Idaho, Utah, Wyoming, and the western part of Montana. Like most providers in the NWPP, most of EWEB and SUB’s electricity comes from hydroelectric generation. The remainder is derived from nuclear, coal, wind, natural gas, and biomass sources.8283
Local Generation Capacity EWEB and SUB currently provide electricity to about 118,000 customers (87,000 and 31,000 customers, respectively). Those customers consumed 5.25 billion kilowatt hour (kWh) of electricity in 2008. EWEB owns some generation resources and sells some power on the open wholesale market. Most of the
79 Stephan, C. H., & Sullivan, J. (2008). Environmental and Energy Implications of Plug‐In Hybrid‐Electric Vehicles. Environmental Science and Technology , 1185‐1190.
80 Ibid. (It is assumed that current electrical capacity can support a lower number of EVs than PHEVs due to their greater reliance on electricity.)
81 Kintner‐Meyer, M., Schneider, K., & Pratt, R. (2007). Impacts Assessment of Plug‐in Hybrid Vehicles on Electrical Utilities and Regional U.S. Power Grids. Online Journal of EUEC 1: paper # 04, p. 1.
82 Eugene Water and Electric Board. (2009). ewebFacts. Retrieved March 18, 2010, from EWEB: http://www.eweb.org/public/documents/ewebFacts.pdf
83 Springfield Utility Board. (2010). Springfield Utility Board ‐ Where the power comes from. Retrieved April 25, 2010, from http://www.subutil.com/electric_service/where_the_power_comes_from
Page | 40 Community Planning Workshop
power used by both utilities – over 5 billion kWh in 2008 – was purchased from the Bonneville Power Administration (BPA).8485
Through a “slice of the system” contract, EWEB receives 2.4% of any electricity generated from BPA and purchases any remaining electricity needs in “blocks” from BPA. SUB uses a “partial requirements” contract. This affords the utility the flexibility to purchase electricity either from BPA or from other suppliers.86
The electricity contract method is important to consider since large‐scale adoption of EVs could result in an increase in electricity demand.87 If demand should exceed supply, local utilities will have to install extra capacity or enter into new contracts. In either case, any additional infrastructure cost incurred in procuring power through these sources would likely be passed on to the consumer.88
Implications for Local Utilities Future power load demands, imposed by electric vehicles, will depend on how quickly consumers adopt EVs. A preliminary study commissioned by EWEB found a capacity to absorb between 200 and 700 electric vehicles per year.89 This is within the adoption rates estimated in this report. The EV absorption capabilities of SUB are unknown at this time.
While the overall electrical supply may be sufficient to absorb demands imposed by EVs, daily peak demand could still present problems for the local transmission network. This could result in the necessity to purchase additional electricity from across the NWPP during specific peak periods.
Influence of EVs on Electricity Demand EV owners are likely to begin to charge their vehicles during peak electrical demand hours. Our survey results showed that 43% of respondents prefer to charge between 4:00 PM and 8:00 PM. This timeframe coincides with the peak load period. If significant EV adoption rates are reached, the peak period will
84 Eugene Water and Electric Board. (2009). ewebFacts. Retrieved March 18, 2010, from EWEB: http://www.eweb.org/public/documents/ewebFacts.pdf
85 Springfield Utility Board. (2010). Springfield Utility Board ‐ SUB Statistics. Retrieved April 25, 2010, from http://www.subutil.com/about_sub/sub_statistics
86 Springfield Utility Board. (2010). Springfield Utility Board ‐ Where the power comes from. Retrieved April 25, 2010, from http://www.subutil.com/electric_service/where_the_power_comes_from
87 United States Bureau of Reclamation. (2005, July). Reclamation: Managing Water in the West ‐ Hydroelectric Power. Retrieved April 04, 2010, from United States Bureau of Reclamation: www.usbr.gov/power/edu/pamphlet.pdf
88 Gordon, G. (2009). Effect of Plug‐in Hybrid Electric and Extended Range Vehicles on the Eugene Water and Electric Board Power Grid. Eugene: Eugene Water and Electric Board.
89 ibid

Eugene‐Springfield Electric Vehicle Assessment November 2010 Page | 41
both increase in demand load and extend further into the evening.90 This could present short‐term supply issues for utility providers.
If consumers have the option to charge their vehicles at work as well as at home, then this scenario could shift substantially. Two peak periods would occur: one peak when consumers arrive at work, between 6:00 AM and 8:00 AM, and then a second peak between 4:00 PM and 6:00 PM when they return from work.
In either scenario, the possibility exists that peak demand could exceed supply because of the “clustering” of EVSE in specific neighborhoods, resulting in a disruption of local distribution networks. The methodology used to model local electrical demand loads is detailed in Appendix C.
Localized Limitations of Grid The existing local electrical grid may be stressed by increasing EV adoption, primarily due to two factors:
1. Local “clustering” of EVSE units in one area. The concentration of many EVSE in one neighborhood may stress the capacity of existing transformers. Moreover, transformers are designed to cool off during the night. EVSE charging is likely to extend peak demands throughout the night, overheating and reducing the useful life of transformers. High concentrations of EVSE in one neighborhood lead to localized brownouts or blackouts.
2. Distribution Network Age. The age and capacity of the distribution and transformer network, throughout the Eugene‐Springfield area is variable. The location of Level 2 and 3 charging stations in some area may require expensive upgrades.
Technologies Available for Managing Power Load The long‐term goal of the U.S. Department of Energy is the creation of a Smart Grid network; one that gives both the consumer and the utility the ability to manage power demands over various times of the day. Various technical solutions exist to help realize this goal. Each varies in initial cost, deployment time, and the need for consumer education. Using a phased approach, each solution can play a part in providing tools for both the consumer and the utility.
On-board Technology The simplest power load management tool is the EV itself. Most will be equipped with a user interface and timer system. The owner of a Nissan LEAF, for instance, will be able to control the vehicle’s charging from any computer or internet‐enabled phone. Such features, combined with an aggressive consumer education strategy, can help minimize EV charging during peak demand hours.
90 ibid

Page | 42 Community Planning Workshop
Time of Use Pricing “Time of use” (TOU) pricing is a power load management tool used increasingly utilities agencies. A tiered pricing structure charges the highest rates during peak demand, encouraging consumers to shift their electricity use to off‐peak hours. This pricing scheme enables utilities to shape peaks and valleys in electricity usage. 91
Several major utilities, including Southern California Edison (SCE), Pacific Gas & Electric (PG&E), and Baltimore Gas and Electric (BGE), have successfully implemented TOU pricing. BGE rolled out visual aid technologies that inform consumers when electricity prices are at off‐peak, peak or critical peak pricing.92 Programmable thermostats are another technology that enables TOU pricing. These thermostats are sensitive to electricity pricing and turn off according to consumer set thresholds.93
Advanced Metering Advanced metering infrastructure (AMI) gives consumers the control to determine their power load needs and the means to communicate their needs to the utility agency. The consumer can choose the time that charging will begin, at what depletion level to begin charging, and what price they wish to pay. This information passes to the utility, which then supplies the requested power when those conditions arise.94 Combined with TOU pricing, the introduction of AMI could help to even out demand and to flatten the peak load issues that arise with EV adoption.
Advanced metering also helps utilities to better control local electricity distribution. With consumer permission, the utility has the ability to turn off or delay power to various appliances with a large electrical demand. By turning off or delaying power to EVs, water heaters, and air conditioning units, local utilities have the ability to avoid brownouts and blackouts, which, in turn, reduces system wide maintenance costs.95
Finally, the use of AMI will gives real time visibility of current condition to both the utility and the consumer. A two‐way connection between the utility and the
91 Pacific Electric and Gas. (2010, April 11). Smart Meter System: How It Works. Retrieved April 11, 2010, from http://www.pge.com/myhome/customerservice/meter/smartmeter/howitworks/
92 Faruqui, A., Sergici, S., & Wood, L. (2009, June). Moving Towards Utility‐Scale Deployment of Dynamic Pricing in Mass Markets. Retrieved May 02, 2010, from Reports‐Edison Foundation: http://www.edisonfoundation.net/iee/reports/IEE_Utility‐ScaleDynamicPricing_0609.pdf
93 ibid
94 Department of Energy. (2008, September 9). The Smart Grid: An Introduction. Retrieved April 11, 2010, from Department of Energy: http://www.oe.energy.gov/DocumentsandMedia/DOE_SG_Book_Single_Pages(1).pdf
95 Faruqui, A., Sergici, S., & Wood, L. (2009, June). Moving Towards Utility‐Scale Deployment of Dynamic Pricing in Mass Markets. Retrieved May 02, 2010, from Reports‐Edison Foundation: http://www.edisonfoundation.net/iee/reports/IEE_Utility‐ScaleDynamicPricing_0609.pdf

Eugene‐Springfield Electric Vehicle Assessment November 2010 Page | 43
consumer improves control of electricity the ability to manage system wide power load conditions.
Smart Grid The so‐called “Smart Grid”; a multi‐corridor communication arrangement between consumers, centralized electricity providers, smaller decentralized electricity providers, and large‐scale battery systems has promise to address the impacts of broad scale electrification of the transportation system. Self‐aware, the smart grid automatically corrects problems by shifting energy demands and consumption between the different groups.96
In its current state, the electrical grid is a one‐way street where electricity generation and delivery is centralized via power plants and utilities. This leads to power plants sitting idle until electricity needs increase because electricity is used as it is generated. This is highly inefficient and reactive to consumer needs. With the installation of Smart Grid technologies, the electrical grid could be more proactive. To accomplish this, as peak loads begin, electricity providers can use decentralized small‐scale power generation, solar and wind power and electric vehicle batteries to handle the peak loads instead of turning on another power plant.97
The federal government has funded 100 current smart grid projects around the United States. The Department of Energy is allocating $3.4 billion to utility companies like Baltimore Gas and Electric, San Diego Gas and Electric and Southern California Edison. More locally, Portland General Electric was awarded a $178 million grant to a regional smart grid demonstration project. In most cases, the money from these grants will be invested in various infrastructure improvements and disbursement of smart metering technology.
Conclusion Based on the data presented, system wide supply issues are not the problem. However, as more EVs are added to the electricity grid, daily peak loads will begin to create new peaks. It is encouraging that regulated charging scenarios have the ability to reduce the new peaks. Even without regulated charging through smart metering and AMI, simple timers and education can prove effective at negating new peaks. Moreover, near‐term the concern will be on the local transformer level as possible clustering can occur.
96 Department of Energy. (2008, September 9). The Smart Grid: An Introduction. Retrieved April 11, 2010, from Department of Energy: http://www.oe.energy.gov/DocumentsandMedia/DOE_SG_Book_Single_Pages(1).pdf
97 ibid

Page | 44 Community Planning Workshop

Eugene‐Springfield Electric Vehicle Assessment November 2010 Page | 45
CHAPTER VI: PROPOSED FRAMEWORK FOR SUPPORTING ELECTRIC VEHICLES IN EUGENE-
SPRINGFIELD
This section presents a proposed framework for supporting electric vehicles in Eugene‐Springfield metropolitan area. The framework identifies key considerations for local governments and utilities and includes recommended steps to facilitate the adoption of EVs. The preceding discussion provided an overview of Electric Vehicles (EVs), including:
• The history of EVs
• Technical characteristics of EVs and the infrastructure that supports them
• The current business, political, and consumer climate into which EVs are entering the ‘mass market’
• Power load implications as EVs become ‘mainstream.’
Our goal has been to place this discussion squarely within the context of the Eugene‐Springfield metropolitan area. The framework builds from local input and data analysis. To develop it we conducted interviews with local subject experts, analyzed publicly available market data for the region, and conducted a web‐based poll of area residents.
Four key questions emerge from this investigation as unanswered, or only partly answered:
• Do consumer concerns about EVs create a barrier to local adoption, and if so how can they be over come? What actions should local governments take to promote adoption?
• What should local electric utility providers do to prepare for the potential electrical load increases that will arrive with widespread EV adoption?
• Could increasing demand for EVSE related permits become a barrier to EV adoption? What actions should be taken to streamline permitting processes in anticipation of this demand?
• How should these actions be prioritized? What are the appropriate timeframes for addressing each?
The conclusions and recommendations that follow address these key questions.
Considerations We recognize the need for caution before drawing definitive conclusions with respect to this investigation. The community survey, for example, was not based on a ‘randomized sample’ and is, therefore, not statistically valid (nor was it intended to be). The results, in fact, suggest that the survey respondents were

Page | 46 Community Planning Workshop
largely ‘early adopters’ rather than a more representative sample of the total metropolitan population. Nevertheless, it is useful to this analysis to have data from early adopters, since manufacturers and public agencies must address their needs in the early phase of EV infrastructure rollout.
Added to that difficulty is the fact that electric vehicles – in their current form at least – utilize relatively new technologies that are coming to market at a time when tremendous economic and political changes are occurring in the energy and transportation sectors. In this environment the ‘knowns’ are subject to rapid change. News stories concerning proposed legislation and government grants for EV infrastructure, new corporate investment into EV production, and potential breakthroughs in battery technology continue to hit the wires even as this report is being written. Clearly the introduction of EVs into our community presents many opportunities; however, it also presents an enormous challenge – that of keeping up to date with this pace of change.
The pace of change is one issue that local governments and utilities should be concerned about. The potential exists for extremely rapid adoption of EVs – a scenario that has profound implications for local governments. Among the most important are impacts on power demand and load and the location and management of EVSE. While rapid adoption is far from certain in the U.S., the evidence suggests that EV technology is ripe and is close to reaching a critical mass. External factors such as gasoline prices and federal greenhouse gas legislation could cause quicker adoption rates.
Despite these challenges, EV technology meets multiple needs of the local citizenry and public agencies. Its adoption complements and supports strategic economic goals of the State of Oregon as well as climate action and sustainability goals for the City of Eugene and the nation.98 The Eugene‐Springfield area is well suited geographically for adoption of EV technology since most weekday driving trips are less than 40 miles , within the battery range of most EVs, and the urban growth boundary, for both cities combined, is less than 20 miles wide.99 The metropolitan area is also well poised demographically for adoption of this technology. It has consistently been one of the highest per capita sales markets for hybrid vehicles.100 EV’s have evolved from an early phase of ‘test’ technology and are becoming financially competitive with more traditional automobiles. And while some early government incentives are beginning to phase out, other grants are still being proposed.101
98 “By accelerating the adoption of electric vehicles, we can take a major step in moving away from oil. These next‐generation cars and trucks take advantage of the resources and technology we have available right now while putting us on the road to energy independence.” – Senator Jeff Merkley. Merkley, Senator Jeff. (2010, May 27). Merkley introduces nationwide bill to encourage electric vehicle deployment. Retrieved from http://merkley.senate.gov/newsroom/press/release/?id=5c21e59f‐b235‐4b5a‐b4e1‐d1436dde3250
99 CPW Community Survey results – see Appendix B, Chapter 3
100 ibid
101 Senator Merkley, and others, have recently introduced the Electric Vehicle Deployment Act of 2010, “a bill that promotes the rapid, near‐term deployment of plug‐in electric drive motor

Eugene‐Springfield Electric Vehicle Assessment November 2010 Page | 47
With these considerations in mind, we drew upon the survey results, as well as other primary and secondary data sources, to form the following conclusions and recommendations.
Conclusions • Local interest in EVs appears high. Based on their expressed intent to
purchase an EV, survey respondents expressed a surprisingly high level of confidence with EV technology. A high percentage of respondents own two cars or more (69%), and plan to replace one in the next 1 to 3 years (48%). A large percentage of respondents (41%) also plan to buy an EV or are considering buying one.102 These facts, taken together, may suggest that there is a ‘pent up’ demand for EVs.
• EV technology is not a serious barrier to early EV adoption. On a case‐by‐case basis most homes can be upgraded to include charging equipment. Barriers related to insufficient power, or local infrastructure inadequacies, will only occur (if at all) at a later date.
• Some perceived barriers (safety, ‘range anxiety, etc) may keep many potential EV buyers on the sidelines for years to come. However, as noted in Chapter 3 above, there is some evidence that these concerns are rapidly diminishing. Moreover, external factors such as gasoline prices and federal greenhouse gas legislation could accelerate EV adoption.
• Local adoption will probably occur faster than national rates. We expect that Eugene will experience a higher demand rate for EVs per capita than most mid‐sized cities, and higher than ECOtality’s ‘base case’ forecast. We estimate that the cumulative demand rate for EVs in the Eugene‐Springfield area will be roughly 9,000 (low estimate) to 14,000 (high estimate) vehicles by the year 2020. We further expect that EV sales will mirror early hybrid sales, and that in the short term (1 to 3 years) demand for EVs will exceed supply. Supply will catch up after year 3.
• It is not clear how important publicly accessible103 EVSE is in the long‐term. The answer to this question depends on factors on which we have little reliable data. The EV Project will generate data that will provide key insights into consumer behavior and travel patterns, but that data is at least a year out. Studies suggest that the presence of highly visible EVSE in public locations is important to curb concerns about “range anxiety.” The fact is that most commuters in our region drive less than 40 miles per
vehicles” Merkley, Senator Jeff. (2010, May 27). Merkley introduces nationwide bill to encourage electric vehicle deployment. Retrieved from http://merkley.senate.gov/newsroom/press/release/?id=5c21e59f‐b235‐4b5a‐b4e1‐d1436dde3250
102 CPW Community Survey results – see Appendix B, Chapter 3
103 “Publically accessible EVSE” refers to all charging stations available to the public, as distinct from home units, typically dedicated for use by only one household. In this context, then, public refers broadly to equipment that is available to multiple users, whether it is located on private land (e.g. at shopping centers) or located in the public right of way.

Page | 48 Community Planning Workshop
day—a distance that is well within the range of contemporary EVs. The longer term need for publicly accessible EVSE is less clear; it depends on a variety of factors that include technological advances that increase the range of EVs and how those factors affect travel behavior104.
• Evidence suggests a preference for EVSE in high profile locations. Respondents to the community survey expressed a preference for public charging stations in the downtown Eugene area, places of employment, and large shopping and retail centers.
Policy Implications Based on these conclusions, what policy implications may be drawn? We summarized areas that will impact public policy decisions in six broad categories:
1 Public Awareness / Understanding of EVs While strong interest in EVs already exists in some quarters of the community, for most people the technology, its benefits, and its limitations are still largely unfamiliar. As noted earlier in this report, familiarity with new technology is a key to its rapid adoption. Early experiences, for better or worse, will frame public expectations and adoption patterns. Community engagement will be essential to a successful EV rollout program. This should occur in forums and formats that balance the need to educate the public about EV technology and the need to incorporate community members’ ideas and concerns into the EVSE planning process. All EV related policies should include a public engagement element to accomplish this.
2 Publicly-Accessible EVSE Installations The location and number of publicly accessible EVSE installations needs to be carefully considered. In the immediate term many of these will be installed by private, third party agents, working under the auspices of a federal grant as part of the EV Project.105 In this circumstance it may be tempting for cities and utilities to let this initial process ‘take care of itself’. There is a risk, however, to this approach. Those charged with the initial wave of EVSE installations have a short‐term focus of a few years to complete their grant‐funded mission. The infrastructure they install, public attitudes toward EVSE, habits and patterns of their use – all these will remain in the community long after the EV project is completed. Initial EVSE, placed in inconvenient or inappropriate locations, could have a negative rather than positive effect on public awareness. These stations will also require ongoing maintenance and operational support. Installations that are fresh and exciting today could become future eyesores and drains on city maintenance funds if these issues are not adequately addressed in the beginning.
104 One critical factor that will affect the need for publicly‐available EVSE is the consumer preference for Hybrid EV technology, which has gasoline back‐up, vs. purely electric vehicles.
105 See www.evproject.com for more information

Eugene‐Springfield Electric Vehicle Assessment November 2010 Page | 49
3 Parking management An EVSE is located, by definition, at a parking place. Publicly accessible EVSE must be dedicated for EV parking only if they are to be available when needed for charging. In the metro area, however, business owners, customers, and residents alike may chafe at the prospect of valuable parking spaces sitting empty for hours. Must a space remain unused if not occupied by an EV? If so what signage is required to designate the restriction? What codes control this and who will enforce them?
Likewise land use codes regulate the number, and type, of parking spaces required for types of uses. Do spaces equipped with EVSE count toward filling these requirements? A parking space occupies roughly two hundred square feet of property. As such the codes that regulate them involve fundamental issues of property rights, and of equity between landowners and renters. Homeowners, for example, may install EVSE’s for personal use, but what about renters? Should multi‐family housing complexes be required to provide a certain number of EVSE for renters who wish to purchase or lease EVs? All of these questions require careful consideration and clarification of existing land use codes.
4 Road Maintenance Revenue The revenue necessary to maintain roads and associated infrastructure is primarily generated through taxes on the sale of auto fuels. EVs will use the same roadway network as ICE vehicles. A potential issue of fairness is raised if one user group pays for access to public facilities and another does not. Beyond this cost equity issue looms a potential funding shortfall. As EV adoption grows, the sale of gasoline and bio‐fuels, and therefore tax revenues, will likely diminish. An alternative funding source for roads maintenance will need to be identified and implemented.106
5 Electricity Consumption/Demand We do not anticipate that EV demand, in the short term, poses a risk to local electrical generation capacity. At the neighborhood level, however, individual transformers may fail if overloaded by clustered level 2 home charging units. Utilities providers will need sufficient notice before these home installations occur, and they will need a feasible plan to upgrade transformers when needed.
In coming years system capacity may become an issue. Utilities providers should use these intervening years to develop the infrastructure, policies, and training that will facilitate the transition to smart metering and time of use pricing. This will help to solve peak demand issues in ways other than adding overall generation capacity. 106 Many jurisdictions pay for the maintenance of new highways via tolls. This can be viewed as an equitable cost basis – charges collected per use – but is often an unpopular program. Vehicle weight is factor to consider since heavier vehicles degrade roads faster than lighter ones. Any weight based fees, however, would primarily affect commercial vehicles and those costs would be passed on to consumers. Today’s computerized car technology would certainly allow for the tracking of VMT by individual autos, and commensurate fee assessments. This, however, may raise privacy issues. All of these considerations, and more, will need to be factored into any long term revenue replacement plan.

Page | 50 Community Planning Workshop
6 Public Safety Traditional automobiles and filling stations dispense and carry a highly volatile fuel. Millions of drivers use both every day, and while many vehicular accidents do happen, the occurrence of fires or explosions is rare. This is attributable to safety standards that are designed into the equipment, regulations that control pump installations and operations, and the familiarity of most people with basic safety procedures. Likewise the design, manufacture, and installation of EVs and EVSE fall under a combination of state and federal regulations, and industry standards. EVs, used as intended, do not pose an undue risk to public safety.
Notwithstanding those facts however, the batteries that power EVs, and the high voltage equipment used to charge them, represent an unfamiliar technology to most people, including first responders to emergency situations. To the extent that unique emergency procedures exist for EV or EVSE, police, firefighters, EMTs and paramedics, and other emergency responders should all receive training in those procedures.
Recommendations As noted, EV technology supports existing polices of the State and of the City of Eugene. It is a primary recommendation of this report that the City of Eugene, the City of Springfield, Eugene Water and Electric Board (EWEB), Springfield Utility Board (SUB), and the University of Oregon should actively promote the adoption of EV technology. This work would be facilitated by the creation of a working group of employees from each agency. The role of such a group would be to create and maintain an effective feedback loop between agencies; one that promotes dialogue and alignment on the myriad issues that will arise related to the implementation of EVs. Figure 6‐1 illustrates some of the agency and policy adjacencies that should be considered in the formation of this working coalition.

F
Figure 6-1.
Source: CPW
The followingaddress the i‘phased’ viewFigure 6‐2.
Eugene‐S
. Existing P
g section of tidentified polw of rollout ac
Springfield Elec
Policies an
his report outicy implicatioctions. A sug
ctric Vehicle As
nd Action F
tlines specificons. The EV Wggested phasi
ssessment
Framework
c recommendWorking Groung of prioritie
Novem
k
ded actions toup should adoes is illustrate
mber 2010
o opt a ed in
Page | 51

Page | 52 Community Planning Workshop
Figure 6-2. Phasing and prioritization of Action Steps
Action Steps to Take Now (Years 1- 2)
As a guiding principle, local governments and institutions should seek to promote EVs through the visible, prominent placement of charging stations. They should also work to assure that their various efforts are efficiently coordinated and that the constituencies they represent are both informed and consulted with regard to EVSE infrastructure planning. In that light the most urgent action steps are those which will facilitate outreach, communication, and long term planning.
• Adopt Local Policy Statement. Local governments and utilities should adopt a policy statement in support of EV adoption and establish a formal ‘EV Working Group’ comprised of employees from each agency, to foster interagency coordination and information‐sharing regarding implementation of EV related policies. This group should have a formal charge and the support of their decision makers.
• Establish an Advisory Committee. A community advisory body, similar in scope to the Bicycle and Pedestrian Advisory Council, should be formed to provide input to, and assist with implementation of, these steps. Private companies, such as EV and EVSE manufacturers, should be represented on this body, which should also work closely with the City’s Sustainability Commission.
• Research EV User Needs. Local governments should pay attention to user needs. It will be critical to respond to the needs of early adopters.107 Driving and charging habits of Nissan LEAF drivers will be captured and
107 As the New York City study concluded
• Form EV Working Group & EV Advisory Council
• Secure consumer feedback / Conduct public outreach
• Plan fleet purchases
• Conduct emergency responder training
• Research smart metering and tiered pricing
• Coordinate EVSE permitting and notification procedures
Longer Term OngoingNow
• Implement fleet purchases
• Update land use codes
• Prioritize locations for 2nd wave of EVSEs
• Place infrastructure for 2nd wave of EVSE’s / Upgrade transformer network
• Develop long term ‘smart‐grid’ implementation strategy
• Develop “Green Street” strategy
• Implement smart metering
• Implement tiered pricing
• Determine alternate revenue sources
• Develop ‘One Stop Shop’ process for home EVSE permitting and installation
Phase
Priority
Years 3 to 6 Years 1 to 2 Years 7+
Eugene‐Springfield Electric Vehicle Assessment November 2010 Page | 53
studied via a U.S. Department of Energy (DOE) grant (the EV Project).108 The cities should work closely with ECOtality, Idaho National Laboratories, and Nissan to gain insights into these drivers’ habits and preferences. In siting EV charging stations, care should be taken to ensure that location selections are responsive to community needs.109
• Develop a Community Education Strategy. The City governments, together with EWEB should initiate a community education campaign about these vehicles, their benefits, and their potential impact on power supply for the area. Education is critical to ensuring that demand increases with supply. Opportunities should be taken to publicize EV technology and supporting policies. The local EV enthusiast group is a good candidate to partner with on public education.
• Consider Fleet Purchases. Local governments can demonstrate a commitment to EV technology through fleet purchases. Fleet purchases help ‘mainstream’ new technology in the eyes of the public and are therefore key to public education and acceptance. Current budgetary restrictions are limiting the purchase of new autos for many public agencies. This could create an artificially high wave of new purchases in the years ahead as economic conditions improve, allowing the backlog to be filled. In the interim fleet managers should plan for inclusion of EVs, EVSE, and mechanic training in their programs. RFPs should be researched and written now to allow for the quick adoption of EVs into fleets when revenues allow.
• Train First Responders. Incorporate EV manufacturers’ recommendations into emergency responder procedural documentation. Provide training and certificate for all responders.
• Follow EVSE Business Models. Utilities will need to come to terms with the long range policy decisions that will determine future EVSE business models. Questions about pricing for EV charging and cost recovery for infrastructure upgrades needed to support EVSE must be addressed, as must future maintenance responsibilities for installed infrastructure.
• Monitor Power Loads. Our modeling suggests that an increase in overall power load demand will not affect EWEB and SUB in the first few years. This will give both utilities time to study and learn from other communities that are aggressively promoting EV technology. We recommend the following actions in the first 1‐2 years:
Commission a study on low cost strategies (i.e. charging timers, consumer education on energy usage, simple enabling technologies
108 ECOtality, Inc. (2010, June 01). The Ev Project. Retrieved from http://www.theevproject.com/overview.php
109 The results of the CPW web survey may be useful to review in the site selection process. Data from the EV Project will provide important data that can inform EVSE location strategies.

Page | 54 Community Planning Workshop
that notify consumers of peak demand) to test consumer willingness to mitigate peak load issues.
Conduct a study and/or pilot a program on advanced metering infrastructure that is being installed across the United States to learn best practices in development and implementation of AMI, including costs for implementation and role of AMI in energy conservation strategies. Review financial policies that exist to support these programs.
Coordinate with the local governments on permitting, notification and installation of home EV charging equipment to identify where potential distribution system problems might be encountered. Develop financial policies to address distribution system upgrades, if needed to support localized increased in demand.110
Track the location of EVSE installations. Beginning in fall 2010, EVSE will be installed in housing units and commercial locations. Utilities should coordinate with their municipal partners to establish a reporting system that monitors the location of EVSE installations. This will allow utilities to monitor power demand and better understand consumer behavior.
Longer Term Actions (Years 3 to 6)
Careful long‐range planning is will be necessary to successfully integrate electric vehicles into the regional transportation network. With this in mind, we recommend the following actions to be carried out over a slightly longer time period:
• Institutionalize Fleet Purchases. Incorporate EVs into government and institutional fleet purchases. Set purchase targets for EV’s in fleets by 2020 that equal or exceed the historic pace of Hybrid fleet adoption.
• Review land use codes. Review and update land use codes to reflect EV parking and signage requirements. Consideration should be given to amending building codes and / or land use code to require placement of conduit for future EVSE in new parking garages and multi‐family housing developments.
• Develop a community‐wide EVSE strategy. Local governments should form a working coalition to define and implement a methodology for prioritizing charging station locations once the initial DOE funded wave of installations is complete. Consideration should be given to possibility of a level 3 EVSE unit rollout.
110 See ‘one stop shop’ proposal in the additional considerations section at the end of this chapter.

Eugene‐Springfield Electric Vehicle Assessment November 2010 Page | 55
• Conduct research on the travel behavior of EV owners. While it is conceivable that the behavior of EV owners will be a lot like those of conventional vehicle owners, the cost and range of EVs may lead to shifts in how people use EVs.
• Develop a “Green Streets” program. Such a program would create restricted travel corridors for electric vehicles, bicycles, pedestrians, and other low‐impact transportation modes. A green street would make use of existing infrastructure, but would address safety concerns by creating dedicated right‐of‐ways for certain classes of vehicles and transportation modes.
• Develop a “one‐stop shop program. Over the next few years the priorities of EV manufacturers, and of policymakers who wish to promote EV adoption, must be to ensure that in‐home charging equipment can be easily and affordably installed in the homes of early buyers. But to satisfy this need several problems must first be overcome. Section D of the Appendix outlines a proposed ‘one stop shop’ program to address these issues.
Sometime in the next 1‐10 years, following the scenarios presented in Chapter 5, EV adoption will begin to create new daily demand peaks and present clustering issues. We recommend the following actions to help mitigate those scenarios:
• To the extent that additional transformers and underground conduit and conductors will be needed to implement this 2nd wave of EVSE, that infrastructure must be planned, funded, and implemented.
• Move from the study of enabling technologies to implementation planning. Develop a long‐term implementation strategy to realize a smart grid system.
Ongoing Actions (Years 7+)
Over the longer term, as EV adoption reaches critical mass, actions focused on outreach, study, and planning must result in the implementation of changes on a broader scale.
• Implement the planned combination of EV enabling technologies (smart‐metering/ tiered pricing/consumer education).
• Develop a strategic plan for eventual supplementation of revenues lost
from falling gas sales.

Page | 56 Community Planning Workshop

Eugene‐Springfield Electric Vehicle Assessment November 2010 Page | 57
APPENDIX A: PROJECTED EV DEMAND FOR THE EUGENE-SPRINGFIELD REGION
CPW used hybrid adoption rates as a proxy for EV adoption in one of our demand scenarios. Many auto industry analysts expect the adoption of electric vehicles (EVs) to mirror the hybrid automobile adoptions of the last decade. This appendix examines the history of hybrid adoptions, locally and nationally. It uses that analysis to project likely EV adoption rates in the Eugene‐Springfield metropolitan area, and finally it attempts to forecast areas where the earliest concentrations of EVs are likely to occur. This may be an important indicator for utility providers to consider in planning for transformer upgrades.
Hybrid Adoption Rates Electric vehicle sales are expected to increase dramatically in coming years. Industry analysts, however, do not have a long history of EV sales to the public on which to base EV sales forecasts. Many analysts have suggested that hybrid sales over the last decade or so may offer a reasonable analogue to EV adoption rates. To that end, this report section examines what is known about hybrid vehicle owners.
To understand how hybrid sales may help forecast future EV adoption rates, CPW compared the rates of hybrid ownership in the Portland and Eugene‐Springfield metropolitan statistical areas (MSA’s) with other US cities. Figure A‐1 below shows the six US MSA’s with the highest Hybrid registrations per 1,000 households in 2009. Portland, OR ranks highest, indexing nearly 5 times the national average.
Figure A-1. MSAs - highest Hybrid registrations* (FY 2009)
(Source: Hybridcars.com)111
111 Hybrid Cars: Auto alternatives for the 21st century. (2010, Jan 20). December 2009 Dashboard:Year end Tally Retrieved January 24, 2010, http://www.hybridcars.com/hybrid-sales-dashboard/december-2009-dashboard.html
Rank Metropolitan Area New Hybrids* Index
1 Portland, OR 8.8 4.892 Helena, MT 6.7 3.722 San Francisco, CA 6.7 3.723 Washington, DC 5.1 2.834 Los Angeles, CA 4.8 2.675 San Diego, CA 4.7 2.616 Seattle, WA 4.7 2.61
1.8 1US Metro Area Average* per 1000 households

Page | 58 Community Planning Workshop
The same source shows that for year to date (YTD) counts taken in November 2008, Eugene ranked twelfth among all MSA’s, and Portland first, indexing at 1.9 and 5.4 to the national average, respectively. The data show that households in the Eugene MSA are purchasing hybrid vehicles at roughly twice the national rate.
Figure A-2. MSAs - highest Hybrid registrations* (YTD Nov. 2008)
(Source: Hybridcars.com)
Hybrid Buyer Profile Many analysts have speculated that ‘early adopters’ of EV technology will share demographic traits with early adopters of hybrid technology. To gain a better understanding of hybrid owners, CPW compared the demographic profile of hybrid owners with that of residents of the Eugene‐Springfield metropolitan statistical area (MSA).
Various studies conducted in the last few years have been summarized to define the profile of the typical US hybrid owner.112 They are characterized as being:
• Closer to 50 years old than 40 (23% over 50)
• With higher than average incomes (42% with $100,000 vs. $85,000 for the average buyer)
• Higher than average levels of education (bachelors degree or higher)
CPW examined the differences between the top six US metropolitan statistical areas (MSAs), and the Eugene‐Springfield MSA, for hybrid registrations and the three demographic variables. As can be seen in Figures A‐3, A‐4, and A‐5 below, median household income and educational attainment are all higher in these six MSAs than the US average. For Eugene‐Springfield, educational attainment is nearly identical to the US average. Only San Francisco and Eugene‐Springfield show a percentage of population older than 55 that is higher than the US average.
112 Hybrid Cars: Auto alternatives for the 21st century. (2008, September 9). January 2009 Dashboard: Hybrid Pickups Arrive Retrieved May 3, 2010, http://www.hybridcars.com/hybrid-sales-dashboard/january-2009-hybrid-pickups-arrive-25547.html
Rank Metropolitan Area New Hybrids* Index
1 Portland, OR 11.16 5.413 Eugene, OR 3.93 1.9
1.8 1US Metro Area Average* per 1000 households

Eugene‐Springfield Electric Vehicle Assessment November 2010 Page | 59
Figure A-3. Median Household Income
Source: American Community Survey 3 year estimates 2006-2008
Figure A-4. Population % with Bachelors Degree or Higher
Source: American Community Survey 3 year estimates 2006-2008
Figure A-5. Population % older than 55
Source: American Community Survey 3 year estimates 2006-2008
A rough correlation can be drawn from these data between hybrid ownership, higher than average income and higher than average levels of educational attainment for the six major MSAs. A correlation is not seen with higher than average percentages of population over the age of 55. For Eugene‐Springfield, no discernable correlation is seen for any of the three demographic measures. These results may be influenced by the fact that the MSA encompasses all of Lane
110%146% 163%
115% 122% 126%85%
Portland San Fran DC LA San Diego Seattle Eug‐Spfd
27% 33%43% 47%
30% 34% 36%28%
23% 22% 24% 21% 20% 20% 22%27%

Page | 60 Community Planning Workshop
County and so includes other cities and a sizable rural population. Or they may simply suggest that consumer values among Eugene‐Springfield residents do not correspond to the same demographic characteristics seen at a national level.
Characteristics of Eugene Hybrid Owners CPW administered a web‐based survey to Eugene‐Springfield residents during March and April of 2010. The results are detailed in Appendix B. Survey participants identified whether they now own, or have ever owned, a hybrid vehicle. These data were cross‐tabulated to develop a clearer picture of the typical Eugene‐Springfield hybrid owner.113
Figure A‐6 shows that respondents that own hybrids have a significantly higher household income than the MSA median of approximately $44,000.114
Figure A-6. Household Income of Hybrid Owners
Source: Community Survey, CPW 2010
Figure A‐7 shows that 88% of responding hybrid owners have a college degree, and 50% have some post graduate education.
113 This was a ‘web hosted’ convenience survey. As such the sample was not randomized and the results are not statistically valid for a population greater than the survey takers. Never the less, the results are helpful in understanding the characteristics and attitudes of a segment of the population that was motivated to take the survey. In that regard the sample may well represent typical EV ‘early adopters’. 114 The American Community Survey 3 year estimate (2006-2008) shows a median household income of $44,180 for the Eugene-Springfield MSA.
6%
0%
6%
32%
53%
3%
0% 20% 40% 60%
no response
Less than $14,999
$15,000 to $34,999
$35,000 to $74,999
$75,000 to $149,999
$150,000 or more
Percent of Respondents
EugeneSpringfield Residents

Eugene‐Springfield Electric Vehicle Assessment November 2010 Page | 61
Figure A-7. Educational Attainment of Hybrid Owners
Source: Community Survey, CPW 2010
Figure A‐8 shows that 45% of respondents that are hybrid owners are 55 years old or older.
Figure A-8. Age – Hybrid Owners Eug-Spfd
Source: Community Survey, CPW 2010
While the CPW survey is not statistically valid for the MSA population, and so not conclusive, the results suggest that, in the MSA, the typical hybrid owner:
• Has a much higher than median household income.
• Is far more likely than the average resident to have a college education.
• But is not more likely to fall into the 55+ age group.
If the hypothesis is valid – that early adopters of EV technology in the Eugene‐Springfield MSA will demographically resemble hybrid owners – then we can expect to find early adopters among the wealthier, and better educated, but not necessarily older residents of the area.
50%
38%
12%
0%
0%
0% 20% 40% 60%
Some post‐graduate college
College graduate
Completed some college
High school graduate or …
Did not a complete high …
Percent of Respondents
EugeneSpringfield Residents
0%6%
32%18%18%
15%12%
0% 10% 20% 30% 40%
18‐2425 ‐ 3435 ‐ 4445 – 5455 – 5960 ‐ 64
65 and over
Percent of Respondents
EugeneSpringfield Residents

Page | 62 Community Planning Workshop
Where Are EV Buyers Likely to Live? One reason to hypothesize about the demographic profile of early EV adopters is to forecast where they are likely to live. Concentrations of EVs, and their home charging equipment, may pose a challenge for the existing power and transformer network within neighborhoods. It may be useful to utilities planners to forecast where these neighborhoods are likely to be. To that end CPW performed a spatial analysis of neighborhoods, using the data available.
Hybrid registration data for 2008 was available by ZIP code.115 MSA income and educational attainment data was available, by census block groups in the MSA, from the 2000 U.S. Census. These data were analyzed to identify ‘target’ block groups and ZIP code areas, where high adoption rates of EVs might be expected, based on high percentages of residents that match our hybrid owner profile:
• College graduates were 28% of the MSA population in the 2000 census, so the educational measure was set to be above the average of 28%.
• Household income targets were set to a target of $60,000, or a 1.6 index to the MSA median.
All block groups in the MSA were screened for those that have both of these demographic traits. The result, for block groups in total, is illustrated in Figure A‐9.
115 The data was provided by the Oregon Department of Transportation, Division of Motor Vehicles.
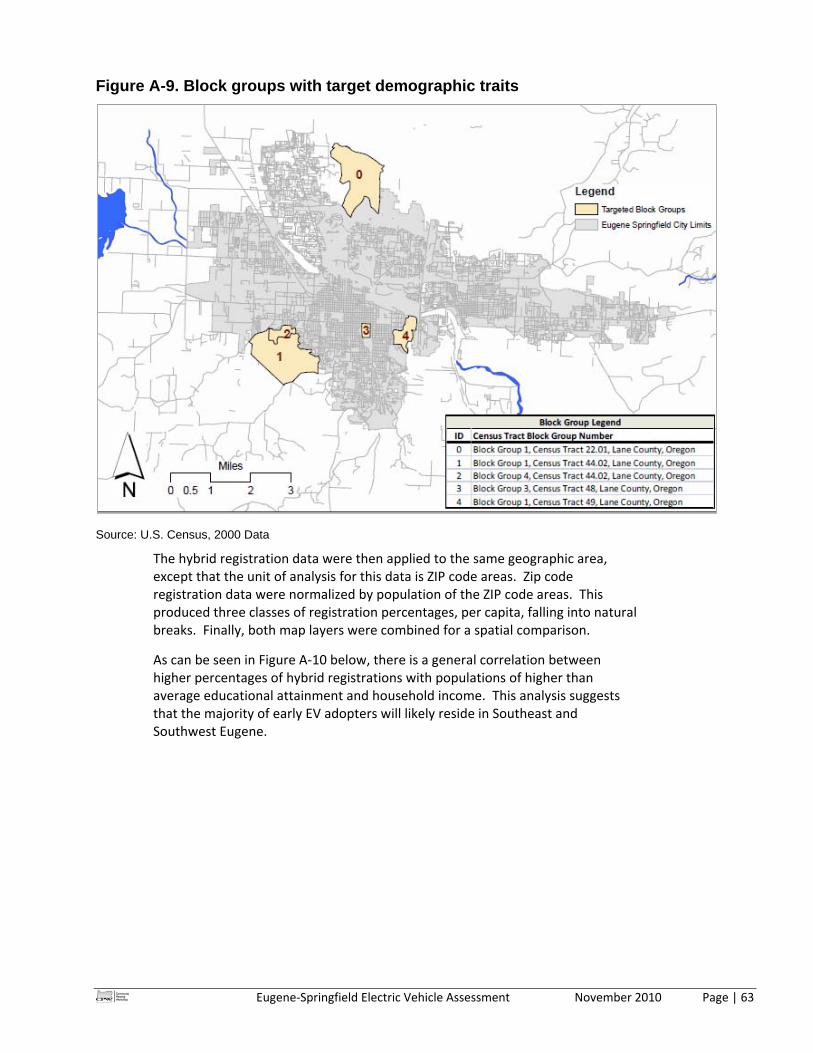
Eugene‐Springfield Electric Vehicle Assessment November 2010 Page | 63
Figure A-9. Block groups with target demographic traits
Source: U.S. Census, 2000 Data
The hybrid registration data were then applied to the same geographic area, except that the unit of analysis for this data is ZIP code areas. Zip code registration data were normalized by population of the ZIP code areas. This produced three classes of registration percentages, per capita, falling into natural breaks. Finally, both map layers were combined for a spatial comparison.
As can be seen in Figure A‐10 below, there is a general correlation between higher percentages of hybrid registrations with populations of higher than average educational attainment and household income. This analysis suggests that the majority of early EV adopters will likely reside in Southeast and Southwest Eugene.
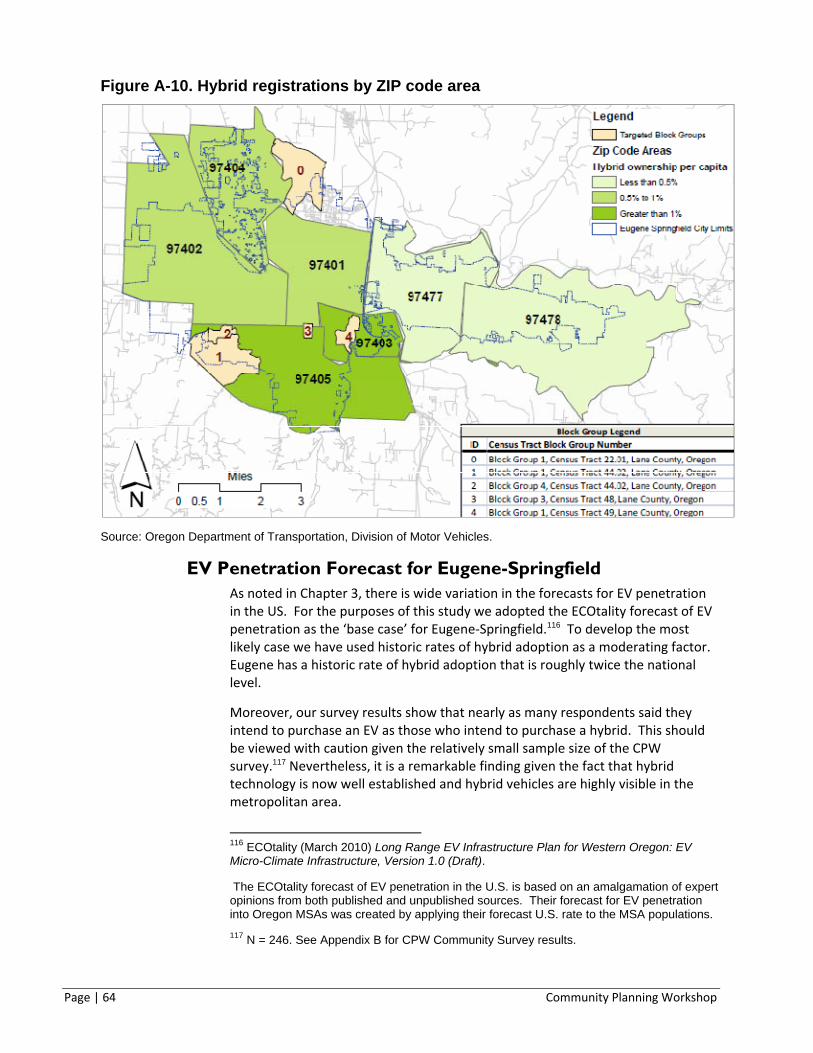
Page | 64 Community Planning Workshop
Figure A-10. Hybrid registrations by ZIP code area
Source: Oregon Department of Transportation, Division of Motor Vehicles.
EV Penetration Forecast for Eugene-Springfield As noted in Chapter 3, there is wide variation in the forecasts for EV penetration in the US. For the purposes of this study we adopted the ECOtality forecast of EV penetration as the ‘base case’ for Eugene‐Springfield.116 To develop the most likely case we have used historic rates of hybrid adoption as a moderating factor. Eugene has a historic rate of hybrid adoption that is roughly twice the national level.
Moreover, our survey results show that nearly as many respondents said they intend to purchase an EV as those who intend to purchase a hybrid. This should be viewed with caution given the relatively small sample size of the CPW survey.117 Nevertheless, it is a remarkable finding given the fact that hybrid technology is now well established and hybrid vehicles are highly visible in the metropolitan area.
116 ECOtality (March 2010) Long Range EV Infrastructure Plan for Western Oregon: EV Micro-Climate Infrastructure, Version 1.0 (Draft).
The ECOtality forecast of EV penetration in the U.S. is based on an amalgamation of expert opinions from both published and unpublished sources. Their forecast for EV penetration into Oregon MSAs was created by applying their forecast U.S. rate to the MSA populations. 117 N = 246. See Appendix B for CPW Community Survey results.

Eugene‐Springfield Electric Vehicle Assessment November 2010 Page | 65
Hybrid sales have significantly declined in recent months, as have all car sales during the current economic downturn. This is reflected in declining rates of passenger car registrations in Lane County since 2007 (Figure A‐11). While opinions vary as to the likely rate of future consumer spending, it is likely that the rate of new technology adoptions, particularly those with a price premium, may be somewhat dampened versus that of the last decade.
Figure A-11. Lane County passenger Car Registrations
Source: Oregon Department of Transportation, Division of Motor Vehicles.118
Finally, CPW considered the effect of other economic inputs, particularly the price of fuel, as a modifier to EV adoption rates. Taking all of these factors into account CPW established a likely case and a high case for Eugene‐Springfield EV adoption through the year 2020. These were established by applying multipliers of 1.4 and 1.9, respectively, to the base case established by ECOtality. The 1.9 multiplier, or high case, reflects the index of Eugene‐Springfield MSA to the national average for hybrid registrations, as shown in Figure A‐2. The 1.4 multiplier, or likely case, is the midpoint between the base and high cases.
The base case, likely case, and high case estimates, then, are shown in Table A‐1 and Figure A‐12.
118 Oregon.gov (2010, January 22). Oregon dmv vehicle registration statistics. Retrieved from http://www.oregon.gov/ODOT/DMV/news/vehicle_stats.shtml
305306
303
301
299300301302303304305306307
2006 2007 2008 2009
Thousands of Registrations
S

Page | 66 Community Planning Workshop
Table A-1. Estimated EVs - Eugene-Springfield
Source: ECOtality, Long Range EV Infrastructure Plan for Western Oregon (base case) / CPW (likely and high cases)
Figure A-12. Estimated EVs - Eugene-Springfield (graphical)
Source: ECOtality, Long Range EV Infrastructure Plan for Western Oregon (base case) / CPW (likely and high cases)
Year Base Likely High2011 147 351 426 2012 301 515 594 2013 495 764 864 2014 808 1,243 1,403 2015 1,334 2,065 2,333 2016 2,098 3,159 3,550 2017 3,203 4,738 5,303 2018 4,687 6,748 7,507 2019 6,663 9,407 10,417 2020 9,175 12,664 13,948
‐2,000 4,000 6,000 8,000 10,000 12,000 14,000 16,000
2011 2012 2013 2014 2015 2016 2017 2018 2019 2020
Forecast Cumulative EV Rates Eugene ‐ Springfield
Base Likely High

Eugene‐Springfield Electric Vehicle Assessment November 2010 Page | 67
APPENDIX B COMMUNITY SURVEY RESULTS
CPW developed and administered an online survey to better understand determine consumer knowledge of EVs, attitudes about purchasing EVs, and preferences for charging station locations. The survey used a non‐random sampling method called convenience sampling. Convenience sampling relies on respondents to be self‐selecting. Because of this methodology, the results cannot be inferred to the larger population of drivers, nor generalized to vehicle owners in the Eugene‐Springfield area. While convenience sampling has inherent limitations, the results are still helpful for understanding consumer preferences.
The survey was posted on the EWEB and City of Eugene websites. Where possible, major regional employers were asked to distribute the survey to their employees; the University of Oregon and Palo Alto Software were among the employers to distribute the questionnaire. The Lane County Electric Vehicle Association, a local group of 45 existing plug‐in EV owners, and the City of Eugene Sustainability Commission were also invited to participate to provide input on ideal charging stations in the area. The survey was also mentioned in Eugene’s Register‐Guard on March 29, 2010. CPW received 246 responses to the survey.
The survey questions addressed respondents’ knowledge of and familiarity with electric vehicles (EVs), their likelihood to buy an EV, and their likely vehicle charging preferences should they decide to buy one. A copy of the survey instrument is included at the end of this appendix.
Respondent Characteristics Of the respondents, nearly 76% indicated that they live in Eugene, 6% live in Springfield, and 15% live in other nearby cities including Coburg, Cottage Grove, Creswell, Dexter, and Veneta (Figure B‐1).
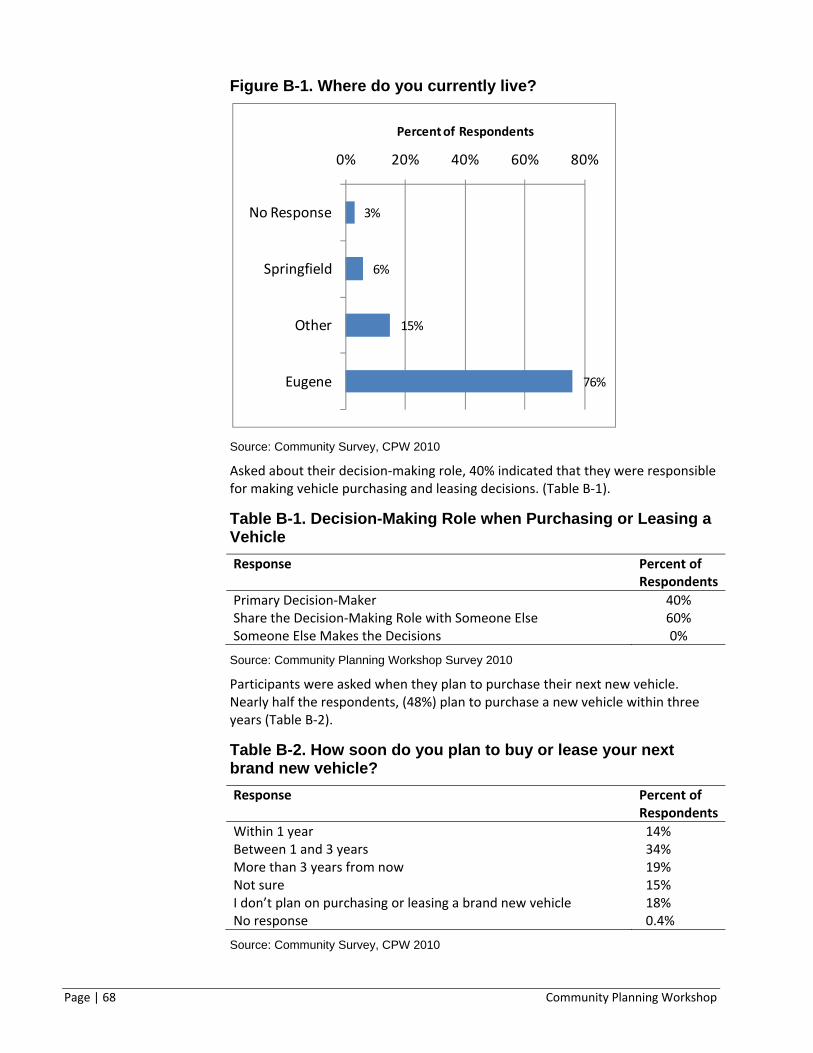
Page | 68 Community Planning Workshop
Figure B-1. Where do you currently live?
Source: Community Survey, CPW 2010
Asked about their decision‐making role, 40% indicated that they were responsible for making vehicle purchasing and leasing decisions. (Table B‐1).
Table B-1. Decision-Making Role when Purchasing or Leasing a Vehicle Response Percent of
RespondentsPrimary Decision‐Maker 40% Share the Decision‐Making Role with Someone Else 60% Someone Else Makes the Decisions 0%
Source: Community Planning Workshop Survey 2010
Participants were asked when they plan to purchase their next new vehicle. Nearly half the respondents, (48%) plan to purchase a new vehicle within three years (Table B‐2).
Table B-2. How soon do you plan to buy or lease your next brand new vehicle? Response Percent of
RespondentsWithin 1 year 14% Between 1 and 3 years 34% More than 3 years from now 19% Not sure 15% I don’t plan on purchasing or leasing a brand new vehicle 18% No response 0.4%
Source: Community Survey, CPW 2010
3%
6%
15%
76%
0% 20% 40% 60% 80%
No Response
Springfield
Other
Eugene
Percent of Respondents

Eugene‐Springfield Electric Vehicle Assessment November 2010 Page | 69
Asked approximately how many miles they drive on an average weekday; respondents, on average, indicated travel 31 miles.
Participants were then asked to identify their trip destinations during a typical week. Basic destination categories were provided, and respondents were allowed to select multiple destinations.
Figure B-2. In a typical week, where do you drive? (Check all that apply)
Source: Community Survey, CPW 2010
The most popular trip destinations were a grocery store, and one’s place of employment; followed closely by restaurants and Downtown Eugene. Among those who selected “Other” as a response, the most popular destinations were dropping children off at school, and weekend leisure activities (Figure B‐2).
Most respondents are male, (56%), married (75%) and have a college degree or some post‐graduate level of education (76%). A majority (70.1%) have a household income of over $50,000 (Table B‐3).
2%
3%
11%
19%
20%
24%
25%
28%
40%
46%
50%
73%
78%
0% 20% 40% 60% 80%
No response
None of these
Downtown Springfield
Shopping mall
Hardware Store
Bulk retail
Gym/Sports Facilities
Other
Commercial strip mall
Downtown Eugene
Restaurants
Place of employment
Grocery Store
Percent of Respondents

Page | 70 Community Planning Workshop
Table B-3. Demographic Characteristics of Respondents Characteristics Percent of RespondentsMale 56%Female 39%Prefer not to answer 1%Did not answer 4%Income PrimaryLess than $15,000 3%$15,000 – 24,999 5%$25,000‐49,999 15%more than $50,000 71%Did not answer 7%Education Less than HS 1%HS/GED 3%Some college 18%College 4+ 76%Did not answer 3%Marital Status Married 75%Single 13%Divorced 30%Did not answer 4% n=246
Source: Community Survey, CPW 2010
Consumer Perceptions of Electric Vehicles The survey included questions regarding intent to purchase a hybrid electric vehicle. Respondents were asked about their level of knowledge about, and the likelihood that they would consider buying a hybrid EV.
Results showed that 95% of respondents consider themselves familiar or somewhat familiar with hybrid technology, while only 4% said they were unfamiliar of somewhat unfamiliar (Figure B‐3).

Eugene‐Springfield Electric Vehicle Assessment November 2010 Page | 71
Figure B-3. Levels of Familiarity with Hybrid Electric Vehicles
Source: Community Survey, CPW 2010
About 29% said that they have bought, or will buy, a hybrid vehicle within the next 10 years, while 69% reported that they are considering buying, might buy, or will not buy a hybrid vehicle (Table B‐4).
Table B-4. Hybrid Electric Vehicle Purchase Plans Response Percent of
Respondents Would not purchase a hybrid 9% Might consider purchasing a hybrid 42% Considering purchase of a hybrid 18% Will purchase a hybrid within the next 1‐5 years 12% Will purchase a hybrid within the next 6‐10 years 3% Current hybrid owner or have purchased a hybrid vehicle in the past
14%
No response 2%
Source: Community Survey, CPW 2010
Respondents were then asked these same questions with respect to plug‐in electric vehicles. In contrast to hybrid vehicles, only 76% of respondents consider themselves familiar or somewhat familiar with plug‐in electric vehicle technology, while 22% said they were unfamiliar of somewhat unfamiliar (Figure B‐4). Of the same sample 24% said that they have bought, or will buy, a plug‐in electric vehicle within the next 10 years, while 74% reported that they are considering buying, might buy, or will not buy a plug‐in electric vehicle (Table B‐5).
0%
1%
4%
23%
71%
0% 10% 20% 30% 40% 50% 60% 70% 80%
Not at all familiar
No response
Not very familiar
Somewhat familiar
Familiar
Percent of Respondents

Page | 72 Community Planning Workshop
Figure B-4. Levels of Familiarity with Plug-In Electric Vehicles
Source: Community Survey, CPW 2010
Table B-5. Plug-In Electric Vehicle Purchase Plans Response Percent of
RespondentsWould not buy a plug‐in electric vehicle 7% Might consider buying a plug‐in electric vehicle 46%Am considering buying a plug‐in electric vehicle 21%Will buy a plug‐in electric vehicle sometime within the next 1‐5 years
16%
Will buy a plug‐in electric vehicle sometime within the next 6‐10 years
4%
Currently own a plug‐in electric vehicle 3% No response 2%
Source: Community Survey, CPW 2010
These results suggest that ‐ among this survey sample at least ‐ a high degree of familiarity with and intent to purchase EVs mirror familiarity with and intent to purchase hybrid vehicles. Hybrid vehicle ownership rates in Oregon, and in the Eugene‐Springfield metropolitan area, are among the highest in the nation. The CPW survey sample is too small to draw definitive conclusions. Never the less, these results reinforce the conclusion of Chapter 3 that EV adoption rates may exceed national averages. Further, of those indicating their intent to purchase an EV, nearly four times as many said they would buy in the next 5 years as those would said they would buy in 10 years. For hybrids, roughly three and one half times as many people said that they would buy in five years as those who said ten years. This suggests that among the sample there is a high confidence in EV’s relative to their familiarity. Further, at least for this group, it may indicate a ‘pent up’ demand for the technology.
2%
4%
17%
28%
48%
0% 10% 20% 30% 40% 50%
No response
Not at all familiar
Not very familiar
Somewhat familiar
Familiar
Percent of Respondents

Eugene‐Springfield Electric Vehicle Assessment November 2010 Page | 73
Responses to a series of follow‐up questions further suggest that EVs will be widely adopted in the Eugene‐Springfield market.
Newer EVs, such as the Nissan LEAF, achieve an approximate driving range of 100 miles between charges. This range would be acceptable to 55% of the survey respondents (Figure B‐5).
Figure B-5. Acceptable Daily Driving Range for a Plug-In EV
Source: Community Survey, CPW 2010
The average number of household vehicles reported by the survey sample is 2.5 Further, 69% of respondents indicated that their household owns 2 or more vehicles (Figure B‐6).
Figure B-6. Number of Household Vehicles
Source: Community Survey, CPW 2010
18%
38%
25%
12%
8%
0% 10% 20% 30% 40%
Less than 50 miles
51‐100 miles
101‐200 miles
More than 200 miles
Not sure
Percent of Respondents
28%
42%
17%
7%
3%
3%
0% 10% 20% 30% 40% 50%
1
2
3
4
5+
None
Percent of Respondents
Num
ber of Veh
icles

Page | 74 Community Planning Workshop
Finally, respondents indicated that factors such as fuel cost savings, environmental impact, and energy security would be ‘very important’ to their decision to purchase a plug‐in electric vehicle. When responses of ‘very important’ and ‘important’ are combined, three themes stand out.
• The first theme is convenience, with ‘driving range between charges’, ‘access to charging stations’, and ‘convenience’ ranking as the top, fourth, and fifth concerns respectively.
• The second theme is cost. ‘Government incentives’, ‘fuel cost savings’, and ‘cost’ are ranked second, sixth , and seventh respectively when VI and I are combined’.
• The third theme is concern for the environment. ‘Environmental impact’ holds the second rank when ‘very important’ and ‘important’ are combined and was the factor most frequently rated as ‘very important’ at 70% (Table B‐6).
Despite the high ranking of environmental concerns, the category of ‘values or recognition’ was most frequently ranked ‘highly unimportant’ at 12%.119 When ‘unimportant’ and ‘very unimportant’ are combined the top three responses, in order, are ‘energy security’, ‘values or recognition’, and ‘design/appearance’.
Respondents were given the opportunity to write in other factors not listed. There were 34 responses. These fell generally into the following themes, with the number of responses per theme shown in parentheses: vehicle design (15), range (6), maintenance (2), vehicle performance (2), cost (1), environmental concerns (1), government support (1), safety (1), and difficult to categorize (4).
119 This apparent contradiction may simply mean that respondents place high importance of environmental concerns as a ‘value’, but do not place high importance on receiving individual recognition for their values. If this is true it would suggest that the sample of respondents are very different from early EV adopters as characterized in the NYC study referenced in Chapter 3(citation).

Eugene‐Springfield Electric Vehicle Assessment November 2010 Page | 75
Table B-6. Factors Influencing Decision to Purchase an EV Factor Very
Important Important Neither
Important Nor Unimportant
Unimportant Very Unimportant
Fuel cost savings 58% 34% 7% 2% 1%Environmental impact 70% 23% 4% 1% 2%Energy security 44% 37% 17% 1% 1%Government incentive 18% 51% 23% 6% 1%Design / Appearance 13% 46% 30% 9% 1%Values or recognition 5% 21% 42% 21% 12%Convenience 25% 57% 16% 2% 0%Cost 53% 43% 4% 1% 0%Driving Range between charges
47% 43% 7% 2% 2%
Access to charging stations outside your home
46% 40% 9% 2% 3%
Safety 55% 37% 8% 0% 0%State of the technology 35% 46% 18% 1% 0%Other 61% 8% 29% 3% 0%No response 2% 2% 2% 2% 2%
Source: Community Survey, CPW 2010
Charging Preferences Respondents were provided with some basic facts about plug‐in electric vehicles and the time required for charging them, after which they were asked to describe their ideal charging scenarios if they were to purchase an electric vehicle. The majority of respondents indicated a preference to charge at home most of the time. (Table B‐7) These results suggest that people may be less inclined to charge their cars while running errands if using a Level 2 charger.
Table B-7. Anticipated Consumer Charging Preferences Response Percent of
Respondents Overnight at Home 38% 3‐4 hour charging while at work 25% 3‐4 hour charging while running errands 3% 30‐40 minute charging while at work 7% 30‐40 minute charging while running errands 20% Other 2% Did not answer 2%
Source: Community Survey, CPW 2010
Respondents were then asked to take this exercise one‐step further, and describe the specific locations where they would most like to see electric vehicle charging stations. Of all locations picked, downtown Eugene, downtown Springfield, shopping malls, and grocery stores account for 51% (Figure B‐7).

Page | 76 Community Planning Workshop
Figure B-7. Preferred Locations for Electric Vehicle Charging Stations
Source: Community Survey, CPW 2010
Respondents were then given the opportunity to suggest specific locations within Eugene and Springfield for EV infrastructure. Respondents provided 556 suggestions for specific locations, shown in Table B‐8 below. The most commonly mentioned suggestions were for shopping malls, grocery stores, downtown Eugene, the University of Oregon, and Lane Community College. Those suggestions align closely with the types of locations most frequently mentioned in the more general question, summarized in Figure B‐7 above.
2%3%3%
6%7%7%
8%13%
15%17%
18%
0% 5% 10% 15% 20%
Hardware storeStrip mall
Gym/Sports FacilitiesDowntown Springfield
Bulk retailRestaurants
OtherGrocery storeShopping mall
Place of EmploymentDowntown Eugene
Percent of Respondents
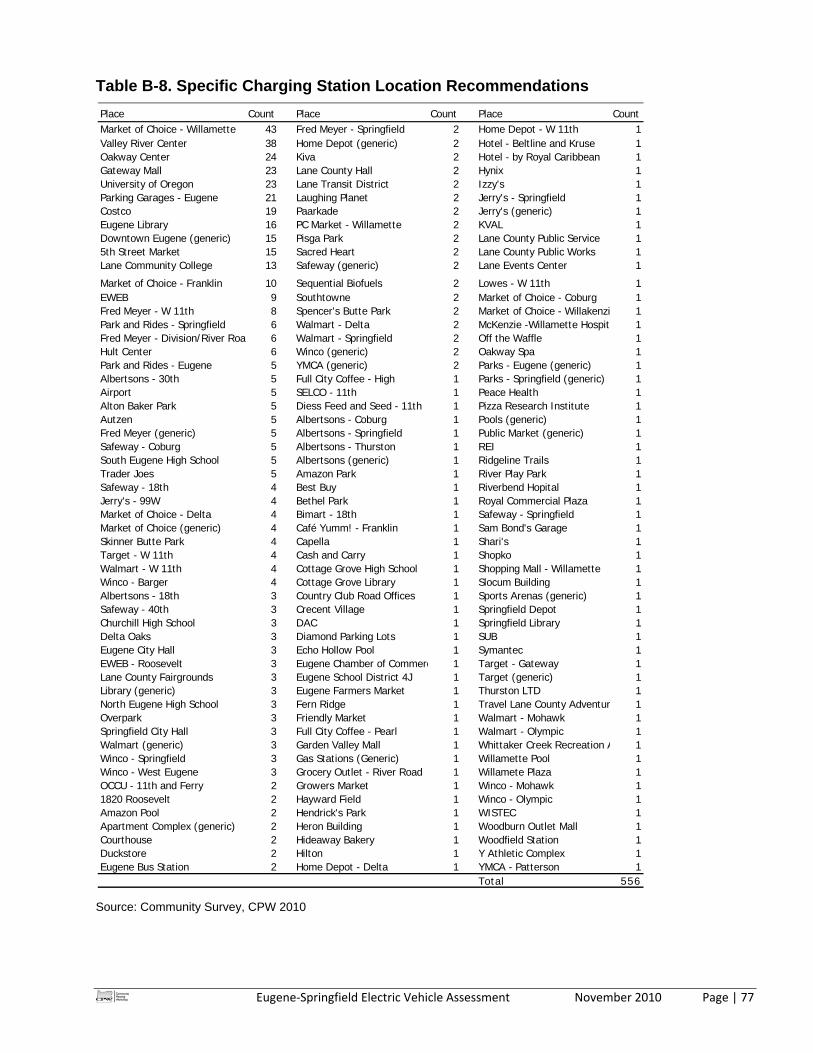
Eugene‐Springfield Electric Vehicle Assessment November 2010 Page | 77
Table B-8. Specific Charging Station Location Recommendations
Source: Community Survey, CPW 2010
Place Count Place Count Place CountMarket of Choice - Willamette 43 Fred Meyer - Springfield 2 Home Depot - W 11th 1Valley River Center 38 Home Depot (generic) 2 Hotel - Beltline and Kruse 1Oakway Center 24 Kiva 2 Hotel - by Royal Caribbean 1Gateway Mall 23 Lane County Hall 2 Hynix 1University of Oregon 23 Lane Transit District 2 Izzy's 1Parking Garages - Eugene 21 Laughing Planet 2 Jerry's - Springfield 1Costco 19 Paarkade 2 Jerry's (generic) 1Eugene Library 16 PC Market - Willamette 2 KVAL 1Downtown Eugene (generic) 15 Pisga Park 2 Lane County Public Service 15th Street Market 15 Sacred Heart 2 Lane County Public Works 1Lane Community College 13 Safeway (generic) 2 Lane Events Center 1
Market of Choice - Franklin 10 Sequential Biofuels 2 Lowes - W 11th 1EWEB 9 Southtowne 2 Market of Choice - Coburg 1Fred Meyer - W 11th 8 Spencer's Butte Park 2 Market of Choice - Willakenzi 1Park and Rides - Springfield 6 Walmart - Delta 2 McKenzie -Willamette Hospita 1Fred Meyer - Division/River Roa 6 Walmart - Springfield 2 Off the Waffle 1Hult Center 6 Winco (generic) 2 Oakway Spa 1Park and Rides - Eugene 5 YMCA (generic) 2 Parks - Eugene (generic) 1Albertsons - 30th 5 Full City Coffee - High 1 Parks - Springfield (generic) 1Airport 5 SELCO - 11th 1 Peace Health 1Alton Baker Park 5 Diess Feed and Seed - 11th 1 Pizza Research Institute 1Autzen 5 Albertsons - Coburg 1 Pools (generic) 1Fred Meyer (generic) 5 Albertsons - Springfield 1 Public Market (generic) 1Safeway - Coburg 5 Albertsons - Thurston 1 REI 1South Eugene High School 5 Albertsons (generic) 1 Ridgeline Trails 1Trader Joes 5 Amazon Park 1 River Play Park 1Safeway - 18th 4 Best Buy 1 Riverbend Hopital 1Jerry's - 99W 4 Bethel Park 1 Royal Commercial Plaza 1Market of Choice - Delta 4 Bimart - 18th 1 Safeway - Springfield 1Market of Choice (generic) 4 Café Yumm! - Franklin 1 Sam Bond's Garage 1Skinner Butte Park 4 Capella 1 Shari's 1Target - W 11th 4 Cash and Carry 1 Shopko 1Walmart - W 11th 4 Cottage Grove High School 1 Shopping Mall - Willamette 1Winco - Barger 4 Cottage Grove Library 1 Slocum Building 1Albertsons - 18th 3 Country Club Road Offices 1 Sports Arenas (generic) 1Safeway - 40th 3 Crecent Village 1 Springfield Depot 1Churchill High School 3 DAC 1 Springfield Library 1Delta Oaks 3 Diamond Parking Lots 1 SUB 1Eugene City Hall 3 Echo Hollow Pool 1 Symantec 1EWEB - Roosevelt 3 Eugene Chamber of Commerc 1 Target - Gateway 1Lane County Fairgrounds 3 Eugene School District 4J 1 Target (generic) 1Library (generic) 3 Eugene Farmers Market 1 Thurston LTD 1North Eugene High School 3 Fern Ridge 1 Travel Lane County Adventur 1Overpark 3 Friendly Market 1 Walmart - Mohawk 1Springfield City Hall 3 Full City Coffee - Pearl 1 Walmart - Olympic 1Walmart (generic) 3 Garden Valley Mall 1 Whittaker Creek Recreation A 1Winco - Springfield 3 Gas Stations (Generic) 1 Willamette Pool 1Winco - West Eugene 3 Grocery Outlet - River Road 1 Willamete Plaza 1OCCU - 11th and Ferry 2 Growers Market 1 Winco - Mohawk 11820 Roosevelt 2 Hayward Field 1 Winco - Olympic 1Amazon Pool 2 Hendrick's Park 1 WISTEC 1Apartment Complex (generic) 2 Heron Building 1 Woodburn Outlet Mall 1Courthouse 2 Hideaway Bakery 1 Woodfield Station 1Duckstore 2 Hilton 1 Y Athletic Complex 1Eugene Bus Station 2 Home Depot - Delta 1 YMCA - Patterson 1
Total 556

Page | 78 Community Planning Workshop
Finally, questions were asked to help gauge peak load demands for local utilities. Participants were asked to identify what times of day they would be most likely to charge an EV at home. The results are shown in Figure B‐8. A large majority (82%) indicated a preference for charging between the hours of 4pm and midnight. This may present a challenge for utilities providers who already face peak customer demand loads during those hours.
Figure B-8. Anticipated Time of Day to Begin Charging Vehicle
Source: Community Survey, CPW 2010
Conclusions The survey results presented in this appendix represent a ‘convenience’ sample. Because the sample was not random, the results are not representative of the population of drivers and vehicle owners in the area. In fact, a comparison of basic figures suggests the sample was biased towards respondents that have a strong interest in EVs. For example, 14% of respondents said that they currently own a hybrid vehicle, or had purchased one in the past. That compares with an average hybrid auto registration rate in the area of about 0.6%. That, and other indicators such as high familiarity with EVs, leads us to the conclusion that many of the survey respondents are likely ‘early adopters’ of EV technology. For that reason, the results should be treated with appropriate caution, and conclusions should not be over generalized. With that said, however, the results are illuminating, and will be particularly useful in anticipating the wants and needs of those who will likely be the first drivers of EVs in the Eugene –Springfield area.
The following are key survey results:
• Over 40% of respondents said that they are considering buying, or will buy, an EV in the next 1 to 10 years. Compare this with 33% who said they are considering or will buy a hybrid vehicle. This suggests that the rate of EV purchases in Eugene is likely to outpace other comparable
1%
43%
39%
11%
3%
2%
0% 10% 20% 30% 40% 50%
Noon ‐ 3 pm
4pm ‐ 8 pm
9pm ‐midnight
After midnight
Not sure
No response
Percent of Respondents

Eugene‐Springfield Electric Vehicle Assessment November 2010 Page | 79
sized cities. Slightly less than half of the respondents said they would buy a new car within the next 3 years.
• After downtown Eugene, and places of employment, large shopping malls, retail centers, and grocery stores are the most popular locations for public charging stations.
• Home and place of work are, by far, the most popular locations for charging an EV.
• ‘Environmental impact’ of EVs was the most cited ‘very important’ factor influencing respondents’ intent to purchase an EV. Other important factors are driving range, cost, and fuel cost.
• Only 18% of respondents said that less than 50 miles is an acceptable daily driving range. However, when asked how far they drive on the typical weekday, only 9% said more than 50 miles, and the average response was 28.6 miles.
• Respondents who professed a higher level of familiarity with EV technology also expressed higher levels of intent to purchase an EV. This suggests that, for EV manufacturers and others seeking to promote EV sales, consumer education and awareness building should be a high priority. A primary criterion for placement of the first wave of public charging stations should be that they are prominently visible to a large number of passers‐by. The first EVSEs should be ‘billboards’ for the technology at least as much as they are convenient facilities for EV drivers.
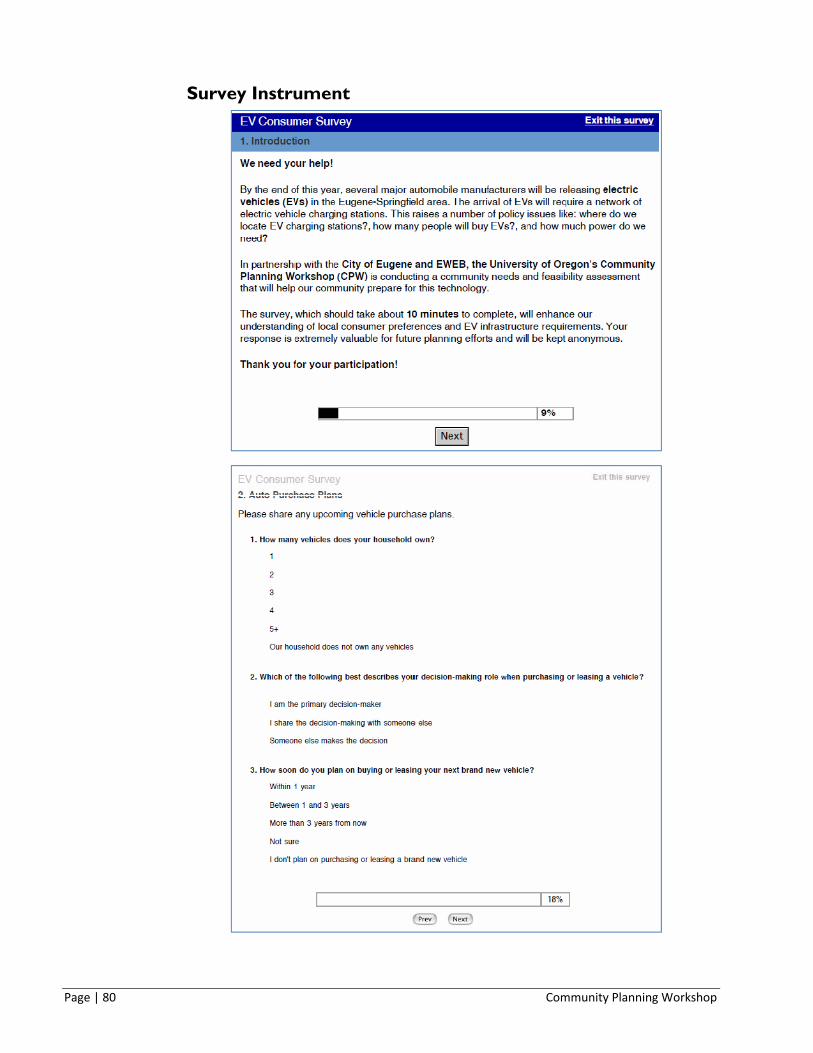
Page | 80 Community Planning Workshop
Survey Instrument

Eugene‐Springfield Electric Vehicle Assessment November 2010 Page | 81

Page | 82 Community Planning Workshop

Eugene‐Springfield Electric Vehicle Assessment November 2010 Page | 83

Page | 84 Community Planning Workshop

Eugene‐Springfield Electric Vehicle Assessment November 2010 Page | 85

Page | 86 Community Planning Workshop

Eugene‐Springfield Electric Vehicle Assessment November 2010 Page | 87
APPENDIX C: POWER LOAD ESTIMATES
A key concern of utilities is the potential impact of EVs on power load. CPW worked with the Eugene Water and Electric Board to develop power load estimates based on the projected EV adoption rates. This appendix describes the methods used to develop the estimates.
Projected EV Adoption Rates and Local Utilities This appendix examines daily power load issues that EWEB might encounter. To do models were created, using EV adoption rates identified in the market analysis above, to explore peak demand issues.
METHODOLOGY This analysis of possible electrical consumption and load scenarios for local utilities is based on specific assumptions regarding EV adoption rates, battery size, and vehicle miles traveled (VMT). The model uses two daily power load profiles provided by EWEB. 120 The first, shown in Figure C‐1, is for the month of January.121
Figure C-1. Typical January Power Load Profile
Source: Gordon, G., EWEB 2009
The second power load profile, shown in Figure C‐2, is for the month of July 2009. This profile may be conservative in its portrayal since energy usage has been rising during the summer months.122
120 Gordon, G. (2009). Effect of Plug-in Hybrid Electric and Extended Range Vehicles on the Eugene Water and Electric Board Power Grid. Eugene: Eugene Water and Electric Board. 121 Based on a ten-year average between 1999 and 2009 122 Parisi, J., Fahy, F., Fraser, A., Koski, D., Kelleher, G., Jeffreys, R., et al. (2010, May 20). EWEB Power load Meeting. (R. Khut, J. Havener, & S. Fertig, Interviewers)

Page | 88 Community Planning Workshop
Figure C-2. Typical July Power Load Profile
Source: EWEB 2010
We used the Nissan LEAF's battery size for modeling purposes because it is the first commercially available, fully electric, vehicle. The LEAF’s battery capacity is 24 kWh. The estimated range of the LEAF is 100 miles. Simple division, then, suggests that the LEAF uses approximately 0.24 kWh/mile. The average vehicle miles traveled (VMT) for Eugene‐Springfield residents, according to the Lane County of Governments (LCOG), are approximately 8.4 miles/day.123 To model a high travel scenario we also modeled a use scenario of VMT of 16.8 miles/day. Using battery capacity data, and vehicle range, we multiply the number of miles traveled per day by the amount of energy consumed per mile and thereby estimate daily electricity use. Finally, assuming that each EV has a Level 2 charging station with a 4.4 kW output, both scenarios require that EVs charge for less than 1 hour to compensate for energy consumed during average daily use.
Table C-1 . Energy Usage/Day
Note: 24 h /100 0.24 h/
Source: Lane County of Governments, 2007
We calculated electrical consumption and load models based on three possible adoption rates, as specified in the market analysis section of this report, and shown in Table C‐2 below.
123 Lane Council of Governments. (2007, November). Transplan: The Eugene-Springfield Transportation System Plan. Retrieved May 18, 2010, from lcog.org: http://docs.lcog.org/mpo/PDF/rtp/2031/2031RTP_Chapter4_Nov-07Adoption_Corrected.pdf
S ce n ario kW h /m i VM T/P e rso n /D ay kW h U se d /D ayLCO G 0.24 8.4 2.016H igh T rav e l 0 .24 16.4 3.936

Eugene‐Springfield Electric Vehicle Assessment November 2010 Page | 89
Table C-2 . Unregulated Charging 6:00 PM 2011
Source: CPW 2010
The first two scenarios in table C‐2 assume that all consumers will charge when they arrive home from work, and that EWEB does not regulating the time when consumers can charge their EVs. Using the lowest adoption rate we estimate that 147 EVs will use 0.30 MWh of electricity under the Unregulated Charging 6:00 PM 2011 scenario. Using medium and high adoption rates 351 and 426 EVs, respectively, will add a demand between 0.71 to 0.86 MWh/day. Figures C‐3 and C‐4 illustrate that these estimated demands are negligible additions to current usage.
Figure C-3. Unregulated Charging 6:00 PM 2011 – January
Note: The difference between each adoption rate and typical power load creates a line that overlaps.
Source: CPW 2010
Scenario Adoption Rate kWh Used/Day Total kWh Used Total MWhECOtality 147 2.02 296.35 0.30CPW‐Low 351 2.02 707.95 0.71CPW‐High 426 2.02 858.82 0.86

Page | 90 Community Planning Workshop
Figure C-4 . Unregulated Charging 6:00 PM 2011 – July
Note: The difference between each adoption rate and typical power load creates a line that overlaps.
Source: CPW 2010
By 2020, however, there will roughly be 9,000 to 14,000 local EVs, as shown in Table C‐3. This equates to a use of 18 MWh/day, 26 MWh/day, or 28 MWh/day under the Unregulated 6:00 PM 2020 scenario. Assuming unregulated consumer charging preferences, similar to those above, the new demand peak will occur at 6:00pm, both in January and July.
Table C-3. Unregulated Charging 6:00 PM 2020
Source: CPW 2010
Figure C-5. Unregulated Charging 6:00 PM 2020 – January
Source: CPW 2010
Scenario Adoption Rate kWh Used/Day Total kWh Used Total MWhECOtality 9,175 2.02 18,497 18CPW‐Low 12,664 2.02 25,530 26CPW‐High 13,948 2.02 28,119 28

Eugene‐Springfield Electric Vehicle Assessment November 2010 Page | 91
Figure C-6. Unregulated Charging 6:00 PM 2020 – July
Source: CPW 2010
An alternative scenario for regulated charging, shown in table 5‐4, spreads charging start times during the period from 6pm to 10pm. Of our community survey respondents, 43% indicated a preference to charge from 4:00 PM – 8:00 PM 39% preferred to charge from 9:00 PM – 12:00 AM. For this Regulated Charging scenario, therefore, models EV charging to be phased, beginning at 6 pm. It assumes 30% of all EV owners will plug in at that time, 25% will begin charging at 7 pm and 20% will begin at 8 pm. A reduction of 5% will occur until 10 pm.
Table C-4. Regulated Charging 6:00 PM to 10:00 PM 2020
Source: CPW 2010
% of EV Charging EVs MWh EVs MWh EVs MWh30% 2,753 6 3,799 8 4,184 825% 2,294 5 3,166 6 3,487 720% 1,835 4 2,533 5 2,790 615% 1,376 3 1,900 4 2,092 410% 918 2 1,266 3 1,395 3Total 9,175 18 12,664 26 13,948 28
ECOtality ‐ 9,175 EVs 12,664 EVs 13,948 EVs

Page | 92 Community Planning Workshop
Figure C-7. Regulated 6:00 PM to 10:00 PM 2020 – January
Source: CPW 2010
The January demand peak would be mitigated under this regulated scenario, as shown in Figure C‐7.
Figure C-8. Regulated 6:00 PM to 10:00 PM 2020 – July
Source: CPW 2010
However, as shown in Figure C‐8, even this regulated scenario shows an increased demand peak in July, though less drastic than the unregulated peak in Figure C‐6.

Eugene‐Springfield Electric Vehicle Assessment November 2010 Page | 93
Table C-5. Regulated Charging 6:00 PM to 10:00 PM 2020
Source: CPW 2010
The last set of scenarios assume that VMT is 16.8 miles per day. Under this assumption the unregulated charging scenario predicts an additional 37 to 56 MWh of electricity usage. This would create January and July demand peaks similar to Figures 5‐3 and 5‐4. The regulated charging scenario, however, predicts that peaks can either be avoided or reduced drastically, as shown in Figures C‐9 and 5‐10.
Figure C-9. Regulated 6:00 PM to 10:00 PM 2020 – January High VMT
Source: CPW 2010
% of EV Charging EVs MWh EVs MWh EVs MWh30% 2,753 11 3,799 15 4,184 1625% 2,294 9 3,166 12 3,487 1420% 1,835 7 2,533 10 2,790 1115% 1,376 5 1,900 7 2,092 810% 918 4 1,266 5 1,395 5Total 9,175 36 12,664 50 13,948 55
ECOtality ‐ 9,175 EVs 12,664 EVs 13,948 EVs

Page | 94 Community Planning Workshop
Figure C-10. Regulated 6:00 PM to 10:00 PM 2020 – July High VMT
Source: CPW 2010
Eugene‐Springfield Electric Vehicle Assessment November 2010 Page | 95
APPENDIX D: ‘ONE STOP SHOP’ PERMITTING
Over the next few years the priorities of EV manufacturers, and of policymakers who wish to promote EV adoption, must be to ensure that in‐home charging equipment can be easily and affordably installed in the homes of early buyers. Several problems need to be overcome:
• In‐home charging equipment, and its installation, can add $3,000 or more to the purchase price of a car. The requirement for a power upgrades could raise this cost even more.124
• Consumers and auto dealers are not electrical contractors. Neither of them can easily determine the scope of electrical work needed at the car purchaser’s home. Neither of them can easily estimate the cost in advance, and they are neither staffed nor trained to secure the necessary electrical permits.
• Cities are not staffed for a large increase in electrical permit applications and required inspections. They will need to ‘staff up’ or outsource to handle volumes approaching the sales estimated above.
• Utility companies will need to know where EVSE units are being installed so they can upgrade transformers as necessary.
While the cost and permit requirements for the installation of a home charging unit do not present significant barriers, the complexity of the process requires technical expertise that neither the end user nor the typical auto dealer possess. This could create a process bottleneck that will significantly impede the pace of EV adoption.
The following is a rough outline of the suggested process that might be undertaken to overcome these problems.
• EV manufacturers should offer in‐home installation of EVSE. Installation could be financed as part of the purchase price.
• Costs for installation will vary. Cost ranges should be identified for typical ranges of scope. The required scope will be verified by an in‐home consultation.
• A pool of qualified local vendors and electrical contractors should be established to manage this process.
• The vendors and contractors would:
1. Review conditions in‐home to verify the scope requirements and secure the necessary permits.
2. Receive the EVSE equipment from the manufacturer. 124 See Chapter 2, Types and Costs of EVSE Units.
Page | 96 Community Planning Workshop
3. Perform the installation and manage any required inspections.
4. Warranty the equipment and installation.
5. Provide any needed repair and maintenance service for the equipment as specified during the warranty period, or for a fee afterward.
• City development services departments may wish to contract with these vendors, or others, to provide third‐party plan checking or inspection services as a method of streamlining the process should demand exceed the city’s resource capacity.
• Where cars are leased the charging unit and accompanying services might be rolled into the leasing fee. Determining how to handle installed home charging equipment at the end of the lease term is an open question.
Some entity must lead to create and manage the installer network. There are three likely scenarios for this:
• EV manufacturers could lead. Nissan is currently managing an installation network for its initial rollout of LEAFS under a $100MM DOE grant, beginning in 2010. “Nissan has also struck a deal with AeroVironment Inc., of Monrovia, Calif., to supply home charging packages that will be sold along with the car: Customers can buy 220‐volt outlets for their garage and get installation included in the price. The company will also take care of the often‐onerous permitting involved, Nissan says.” 125
• Utility companies could lead. That model is being explored by PG&E in Southern California. Their proposal would fast‐track the entire process – from inquiry to installation‐ into just one week. Where utilities are public agencies this may raise a conflict with their non‐profit, or regulated profit status.126
A consortium of electrical contractors, working in partnership with the manufacturers and utilities, could lead.
125 Wall Street Journal, May 10, 2010, Charging Ahead: Cities are working with car companies to prepare for the arrival of electric vehicles http://online.wsj.com/article_email/SB10001424052748703837004575013744046280672‐lMyQjAxMTAwMDEwMTExNDEyWj.html [5/12/2010 12:30:34 PM]
126 All such questions inevitably lead back to a broader policy decision for utilities agencies; that of their role in the proliferation of EV and EVSE technology. Should they install and / or operate EV charging infrastructure? Would doing so benefit existing missions, such as consumer consistency, low carbon fuel standard credits, etc.?