Embed Size (px)
Citation preview

Energy Research Institute of Academy of Macroeconomic Research/NDRC
Executive Summary
2020

Fejl! Brug fanen Hjem til at anvende Heading 1 på teksten, der skal vises her.
| 3
Preface
China Renewable Energy Outlook 2020 is the fifth annual outlook from Energy Research
Institute.
Since 2016 we have analysed the long-term visions and possibilities for a Chinese energy
system with renewable energy as the backbone. We have developed appropriate model-
ling tools and methodology to make detailed scenario analyses to 2050 for the transfor-
mation of the Chinese energy sector. A particular focus has been on the power sector, with
detailed analyses of how to integrate large amounts of fluctuating power production from
wind and solar PV into the power system and how it can be dispatch in a least-cost way.
The aim has been to analyse and showcase how the Chinese energy system can develop
into a clean, low-carbon, safe, and efficient energy system with three main drivers: green
power system, energy efficiency in end-use sectors, and electrification of industry,
transport, and building sectors. Also, we wanted to analyse how China can contribute to
the fulfilment of the Paris agreement targets for a future with a below 2 °C rise in temper-
ature due to human-made climate changes.
This year, the focus on a long-term low-carbon vision has become even more topical. 22
September 2020 President Xi Jinping announced at the General Debate of the 75th Session
of The United Nations General Assembly that “China will scale up its Intended Nationally
Determined Contributions by adopting more vigorous policies and measures. We aim to
have CO2 emissions peak before 2030 and achieve carbon neutrality before 2060”. Even
though these targets are challenging, our analyses show that it is possible to reach the tar-
gets and that a low-carbon strategy is the only feasible way to ensure sustainable economic
growth for China in the future.
China Renewable Energy Outlook 2020 is the last outlook that focuses on renewable en-
ergy. From 2021 Energy Research Institute will prepare comprehensive China Energy
Transformation Outlooks.
I want to thank the ERI team for their strong efforts, the Danish Energy Agency, Energinet,
and NREL for their strong support and input to the analyses, and, not least, our long-term
cooperation partner, Children’s Investment Fund Foundation (CIFF), for funding and sup-
port to ERI. I am looking forward to continuing the cooperation with the international part-
ners and CIFF in the future.
Wang Zhongying,
Director-General,
Energy Research Institute of National Reform and Development Commission

China Renewable Energy Outlook 2020 – Summary Report
4 |
Table of Contents
Preface .................................................................................................................. 3
2020 was a game-changing year ............................................................................. 6
The frontrunner countries are heading towards carbon neutrality .................................... 6
Solar and wind became mainstream and cost-competitive technologies .......................... 8
The pathway to carbon neutrality in 2060.............................................................. 11
CO2 emission peak before 2030 .................................................................................... 11
China’s energy-related emission envelope .....................................................................12
China’s carbon emission intensity reduced in 2030 .........................................................12
The transformation pillars .................................................................................... 14
The energy consumption control decouples energy demand from economic growth ........14
Electrification strategy decreases coal and oil in the end-use sectors .............................. 15
Solar and wind power makes the power sector green and clean ...................................... 17
The energy roadmaps towards 2050 ...................................................................... 20
Primary energy demand peak in 2030 .......................................................................... 20
A steady increase in non-fossil fuel share ..................................................................... 20
A peak in CO2 emission before 2030 and a rapid decrease afterwards .............................21
Key results for the two scenarios ...................................................................................23
Development indices 2000 - 2050 ................................................................................ 25
Regulation and reforms can support the energy transformation ............................. 26
Power markets as the key driver for power system transformation and RE integration ... 26
Lower risk for green investments will boost the deployment of renewables ..................... 27
Control measures to guide the transformation in the right direction ............................... 28
Policy recommendations ...................................................................................... 29
Wind and solar development towards 2035 .................................................................. 29
Coordinated drivers for a green energy transition .......................................................... 29
Use energy transition scenarios as a platform for energy roadmaps ................................ 31

Fejl! Brug fanen Hjem til at anvende Heading 1 på teksten, der skal vises her.
| 5
Additional key findings from the Outlook research ................................................ 32
Power sector ................................................................................................................32
Grid planning ............................................................................................................... 33
Electric vehicles and renewable energy .......................................................................... 35
Hainan Green Island .....................................................................................................38

China Renewable Energy Outlook 2020 – Summary Report
6 |
2020 was a game-changing year
The frontrunner countries are heading towards carbon neutrality
An increasing number of governments are translating the Paris Agreement into national
strategies setting out visions of a carbon-free future. By the end of 2020, 26 countries were
on Climate Home’s list of countries with a net-zero goal. Most Western European countries,
the Nordics, and countries such as Canada, Chile, Japan, New Zealand, Singapore, and
South Korea have committed to a carbon-free future. China is committed gradually to re-
place the current fossil energy consumption with clean energy. In the absence of federal
targets, many US states and cities are pursuing net-zero goals, including California, New
York City, and Hawaii. For example, California passed a law to make electricity entirely re-
newable from 2045. At COP25, 177 companies, combined with annual direct emissions
equivalent to France’s annual total CO2 emissions, pledged to reach net-zero emissions by
2050.
The European Commission’s Green Deal vows European countries to achieve climate neutrality by 2050. The European Commission has set out a vision of achieving climate
neutrality by 2050 and proposed the first European’ Climate Law’ in March 2020 for public
consultation. The European Green Deal contains plans for, amongst other things, a new
circular economy, building renovation, zero-pollution, external relations, ecosystems & bi-
odiversity, and a “Just Transition Mechanism” to help regions most heavily dependent on
fossil fuels.
Denmark leads the way for climate policies and commits to a 70% reduction in CO2 emissions by 2030. A broad majority of the Danish Parliament successfully negotiated a
climate act that sets out to reduce Denmark’s greenhouse gas emissions by 70% in 2030
compared to the 1990-level. The Danish Government has adopted a whole-of-the-govern-
ment approach and established the ministerial Committee for the Green Transformation -
to ensure a comprehensive, targeted and coordinated effort across government depart-
ments to tackle the climate crisis. The Danish Parliament has approved several action plans
to fulfil the climate act target by 2030.
China is committed to implementing a profound energy transformation. China is the
largest developing country globally, with a large population and the world’s largest energy
consumption. China has a coal consumption of half of the total global consumption and is
a high-carbon energy consumer. President Xi Jinping emphasises that “low-carbon energy
system directs human future.” It is paramount for China to achieve the emission reduction
targets in cooperation with the world by exploring and implementing energy pathways to
a low carbon future. Success in China would support leadership towards other countries
and regions’ efforts to address global climate crises.
China aims to fully implement the new energy security strategy of “Four Revolutions and
One Cooperation” and firmly follow the road of green, low-carbon and sustainable energy
development. Firstly, China will continue to adhere to the priority policy of energy conser-
vation and promote a green production lifestyle that saves energy and gives priority to the
use of clean and low-carbon energy. Secondly, China will accelerate the use of low-carbon
energy to replace high-carbon energy and non-fossil energy to replace fossil energy, rely
Fejl! Brug fanen Hjem til at anvende Heading 1 på teksten, der skal vises her.
| 7
on non-fossil energy and other clean energy to meet incremental energy demand, and
gradually make clean energy the main body of energy supply. Thirdly, China will continue
to strengthen energy science and technology innovation, break down energy resource con-
straints through technological progress, and add new momentum to economic and social
development. Fourthly, China will continue to deepen the reform of energy markets and
improve the energy governance mechanism1.
In the near to mid-term, the low carbon and green pathway will reduce the use of coal,
stabilise oil consumption, increase gas consumption, and vigorously develop renewable
energy. In the medium and long-term, it will reduce oil consumption, stabilise gas con-
sumption, massive deploy renewable energy, and finally reduce gas consumption and have
a stable development of renewable energy.
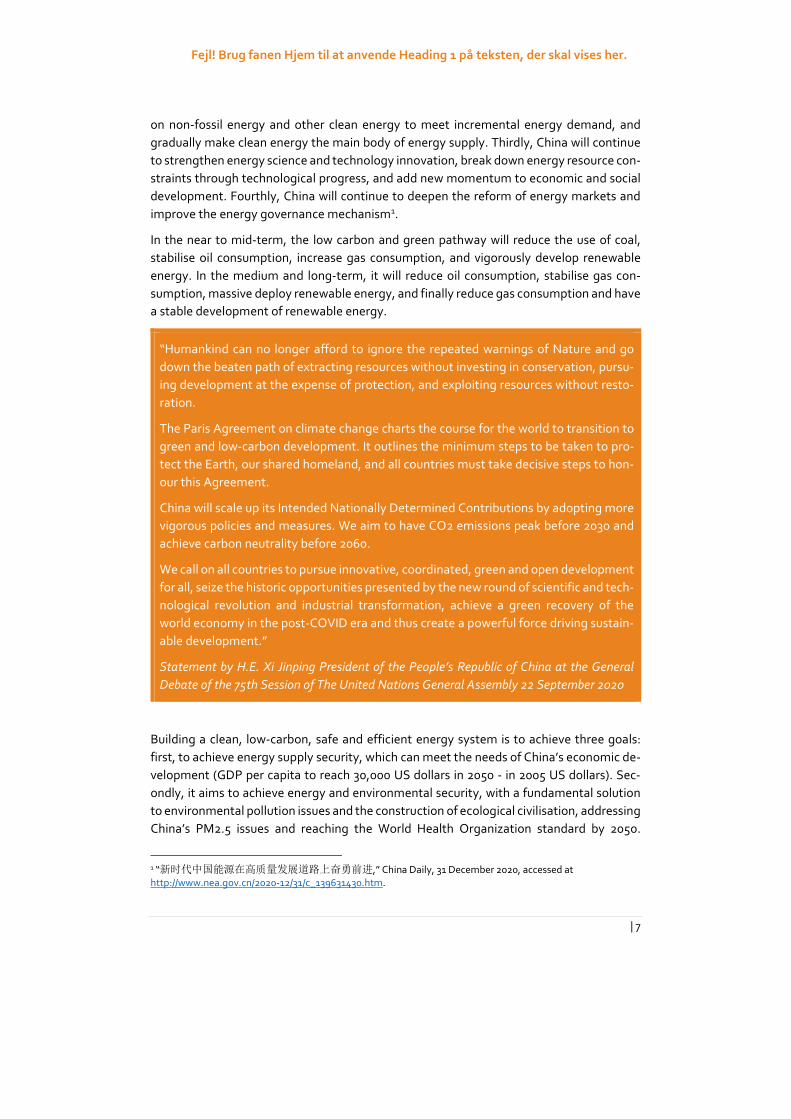
“Humankind can no longer afford to ignore the repeated warnings of Nature and go
down the beaten path of extracting resources without investing in conservation, pursu-
ing development at the expense of protection, and exploiting resources without resto-
ration.
The Paris Agreement on climate change charts the course for the world to transition to
green and low-carbon development. It outlines the minimum steps to be taken to pro-
tect the Earth, our shared homeland, and all countries must take decisive steps to hon-
our this Agreement.
China will scale up its Intended Nationally Determined Contributions by adopting more
vigorous policies and measures. We aim to have CO2 emissions peak before 2030 and
achieve carbon neutrality before 2060.
We call on all countries to pursue innovative, coordinated, green and open development
for all, seize the historic opportunities presented by the new round of scientific and tech-
nological revolution and industrial transformation, achieve a green recovery of the
world economy in the post-COVID era and thus create a powerful force driving sustain-
able development.”
Statement by H.E. Xi Jinping President of the People’s Republic of China at the General
Debate of the 75th Session of The United Nations General Assembly 22 September 2020
Building a clean, low-carbon, safe and efficient energy system is to achieve three goals:
first, to achieve energy supply security, which can meet the needs of China’s economic de-
velopment (GDP per capita to reach 30,000 US dollars in 2050 - in 2005 US dollars). Sec-
ondly, it aims to achieve energy and environmental security, with a fundamental solution
to environmental pollution issues and the construction of ecological civilisation, addressing
China’s PM2.5 issues and reaching the World Health Organization standard by 2050.
1 “新时代中国能源在高质量发展道路上奋勇前进,” China Daily, 31 December 2020, accessed at
http://www.nea.gov.cn/2020-12/31/c_139631430.htm.
China Renewable Energy Outlook 2020 – Summary Report
8 |
Thirdly, to achieve energy and climate security, fulfil the Chinese Government’s commit-
ment to the Paris Agreement, take a low-carbon energy transition pathway, limit global
warming to below 2°C by the end of this century and try to keep it within 1.5°C.
Solar and wind became mainstream and cost-competitive technologies
Electricity costs from renewables have fallen sharply over the past decade, driven by im-
proving technologies, economies of scale, increasingly competitive supply chains and
growing developer experience. As a result, renewable power generation technologies have
become the least-cost option for new capacity in almost all parts of the world. The global
weighted-average levelised cost of electricity (LCOE) of utility-scale solar photovoltaics
(PV) fell 82% between 2010 and 2019, and the levelised cost of concentrating solar power
(CSP) fell 47%, onshore wind by 39% and offshore wind at 29%, According to the latest cost
data from the International Renewable Energy Agency (IRENA).
In sharp contrast to all other fuels, renewables used for generating electricity should have
grown by almost 7% in 2020, according to IEA’s Renewables 2020 report. Global energy
demand is set to decline 5% – but long-term contracts, priority access to the grid, and con-
tinuous installation of new plants are all underpinning strong growth in renewable electric-
ity. This more than compensates for declines in the use of bioenergy for industry and bio-
fuels for transport due to lower economic activity. The net result is an overall increase of
1% in renewable energy demand in 2020.
Wind and solar in China is cost-competitive with fossil generating sources already, and
soon wind and solar power in China will be cheaper than coal power (with and without CCS),
even with the most conservative assumptions regarding their annual full load hours. Figure
1 illustrates how the evolution of LCOE of four key technologies with CREO technology and
market assumptions within ranges of annual full load hours. For coal power CCS, the full
load hours band is between 4500 and 7500, while for coal power without CCS the range
indicated is between 2000 and 6000 FLH for all years, thus the upper part of the band cor-
responds to a coal power plant having 2000 full load hours, while the lower part of the band
corresponds to 6000 full load hours. Onshore wind starts in the range of 1700 to 2700 full
load hours in 2020 which are increased 7.5% by 2050 due to projected technological devel-
opment. Likewise, solar USPV is between 1000 and 1550 full load hours in 2020, both in-
creasing by 3 % by 2050.

Fejl! Brug fanen Hjem til at anvende Heading 1 på teksten, der skal vises her.
| 9
Figure 1: LCOE by fuel in China from 2015 towards 2050
Despite looming economic uncertainties, investor appetite for renewables remains strong.
From January to October 2020, auctioned renewable capacity was 15% higher than for the
same period last year, a new record. Simultaneously, the shares of publicly listed renewa-
ble equipment manufacturers and project developers have been outperforming most ma-
jor stock market indices and the overall energy sector, thanks to expectations of healthy
business growth and finances over the medium term. In October 2020, shares of solar com-
panies worldwide had more than doubled in value from December 2019.
In China, wind power and solar PV installations’ deployment showed a record year in 2020
with a total of 120 GW new grid-connected capacity, while the curtailment rates main-
tained low. For wind power, 72 GW new capacity was installed in 2020, which gives a total
of 282 GW wind power in the Chinese energy system, of which 271 GW was onshore pro-
jects, and 9 GW was offshore projects. For solar PV, 48 GW new capacity in 2020 bring the
total capacity of solar PV to 253 GW. Utility-scale PV accounted for 174 GW, and distributed
PV accounted for 78 GW. The blowout growth of wind power and solar PV is mainly because
the Government no longer provides subsidies for new wind power projects from 2021 and
because the NDRC issued a policy clarifying that the delayed grid connection of solar PV
projects will be reduced or eliminated in subsidies. Notable, within the 14th and the 15th
Five-Year Plan periods, the target of 1,200 GW of wind power and solar PV would be real-
ised with stable capacity additions at the 2020 level, all existing capacity notwithstanding.
0
100
200
300
400
500
600
700
800
900
1.000
2020 2030 2040 2050
RM
B/M
Wh
Coal power CCS - LCOE band Coal power - LCOE band
Wind onshore - LCOE band Solar USPV - LCOE band

China Renewable Energy Outlook 2020 – Summary Report
10 |
Figure 2: Total installed capacity of wind (left) and solar (right) power in China from 2005 to 2020
Figure 3: The average wind power and solar PV curtailment rates in China from 2016 to 2020
Fejl! Brug fanen Hjem til at anvende Heading 1 på teksten, der skal vises her.
| 11
The pathway to carbon neutrality in 2060
The scenarios in CREO comprises two development pathways for the Chinese energy sys-
tem. The Stated Policies scenario (SPS) expresses firm implementation of the announced
energy sector and related policies. The Below 2 °C scenario (B2D) shows how China can
build an energy system for the ecological civilisation. The main driver for the B2D scenario
is a hard target for energy-related CO2 emissions through a strategy with renewable elec-
tricity, electrification and sectoral transformation at the core. The CREO scenarios illumi-
nate the first 30 years of China’s journey towards carbon neutrality.
CO2 emission peak before 2030
“We aim to have CO2 emissions peak before 2030 and achieve carbon neutrality before
2060.” – President Xi Jinping, 22 September 2020
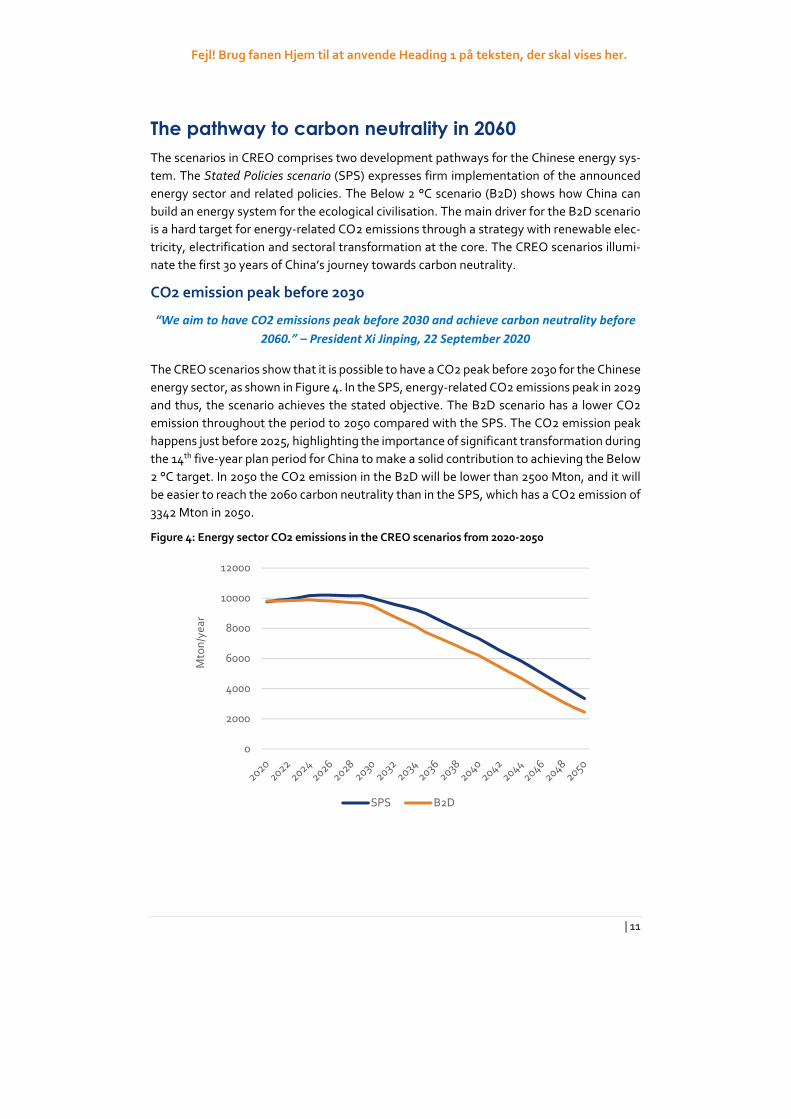
The CREO scenarios show that it is possible to have a CO2 peak before 2030 for the Chinese
energy sector, as shown in Figure 4. In the SPS, energy-related CO2 emissions peak in 2029
and thus, the scenario achieves the stated objective. The B2D scenario has a lower CO2
emission throughout the period to 2050 compared with the SPS. The CO2 emission peak
happens just before 2025, highlighting the importance of significant transformation during
the 14th five-year plan period for China to make a solid contribution to achieving the Below
2 °C target. In 2050 the CO2 emission in the B2D will be lower than 2500 Mton, and it will
be easier to reach the 2060 carbon neutrality than in the SPS, which has a CO2 emission of
3342 Mton in 2050.
Figure 4: Energy sector CO2 emissions in the CREO scenarios from 2020-2050
0
2000
4000
6000
8000
10000
12000
Mto
n/y
ea
r
SPS B2D
China Renewable Energy Outlook 2020 – Summary Report
12 |
China’s energy-related emission envelope
The envelope of China’s energy-related CO2 emissions towards carbon neutrality will
consume around 21.8 per cent of the remaining global carbon budget for keeping tem-
perature increase below 2 °C 2.
With China accounting for 18.5 per cent of the global population, 19 per cent of global GDP
and starting from 29 per cent of the global emissions in 2019, this is a vital contribution in
combating global climate change. The scenario does not consider the potential contribu-
tion from negative emissions (CO2 sinks) after 2060. The results demonstrate the oppor-
tunity and necessity to explore further opportunities to increase the pace and depth of de-
carbonisation, particularly in pursuit of the goal of 1.5 °C.
China’s carbon emission intensity reduced in 2030
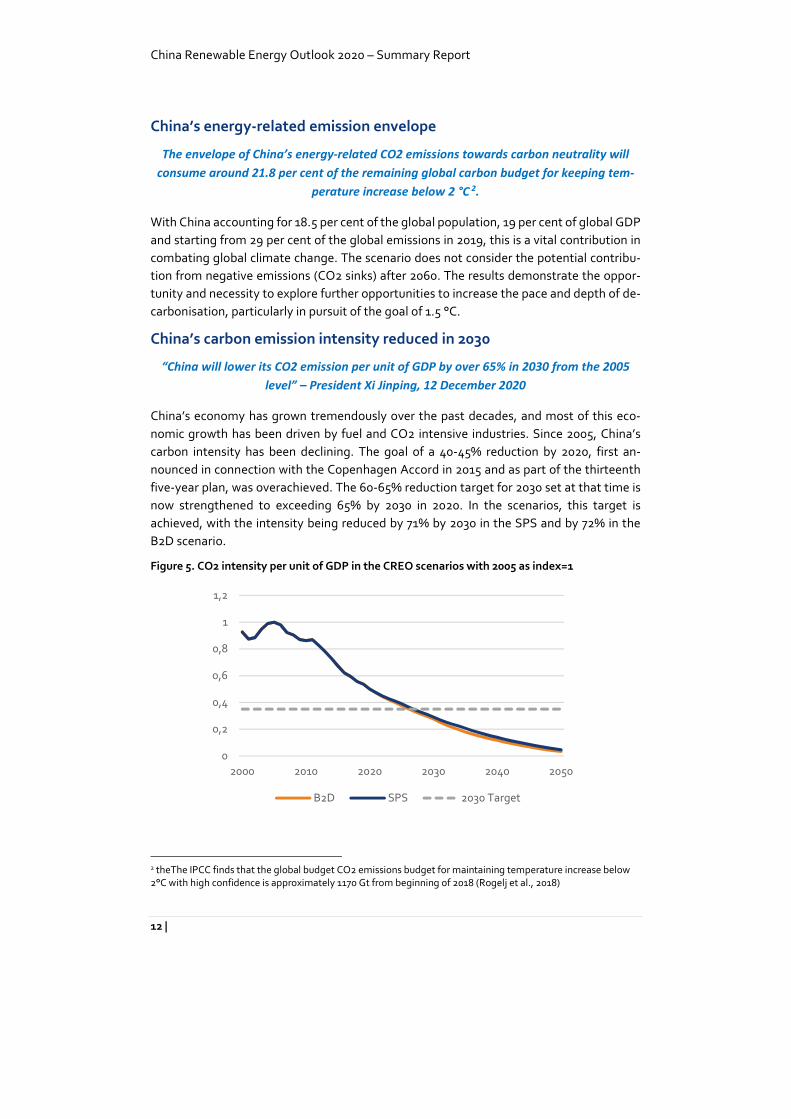
“China will lower its CO2 emission per unit of GDP by over 65% in 2030 from the 2005
level” – President Xi Jinping, 12 December 2020
China’s economy has grown tremendously over the past decades, and most of this eco-
nomic growth has been driven by fuel and CO2 intensive industries. Since 2005, China’s
carbon intensity has been declining. The goal of a 40-45% reduction by 2020, first an-
nounced in connection with the Copenhagen Accord in 2015 and as part of the thirteenth
five-year plan, was overachieved. The 60-65% reduction target for 2030 set at that time is
now strengthened to exceeding 65% by 2030 in 2020. In the scenarios, this target is
achieved, with the intensity being reduced by 71% by 2030 in the SPS and by 72% in the
B2D scenario.
Figure 5. CO2 intensity per unit of GDP in the CREO scenarios with 2005 as index=1
2 theThe IPCC finds that the global budget CO2 emissions budget for maintaining temperature increase below
2°C with high confidence is approximately 1170 Gt from beginning of 2018 (Rogelj et al., 2018)
0
0,2
0,4
0,6
0,8
1
1,2
2000 2010 2020 2030 2040 2050
B2D SPS 2030 Target

Fejl! Brug fanen Hjem til at anvende Heading 1 på teksten, der skal vises her.
| 13
ERIs energy system modelling tool
The scenario’s development in CREO is supported by the ERIs energy system modelling
tool, consisting of interlinked models covering the energy sector of Mainland China.
Final energy demands are directed in the END-USE model
Based on the Long-range Energy Alternatives Planning system, LEAP (https://ener-
gycommunity.org/), the END-USE model represents bottom-up models of end-use de-
mand and how this demand is satisfied. Assumed developments in key activity levels
specified for each subsector and the economic value added for where no other driver is
available drives the consumption in the end-use sectors. These drivers translate to en-
ergy consumption when combined with assumptions, as well as end-use behavioural
features adjustment. Transformation and resource activities aside from district heating
and power are also covered by LEAP, including upstream refinery activity.
EDO models the Power and district heating sectors
The EDO (Electricity and District heating Optimisation) model is a fundamental model
of power and district heating systems built on the Balmorel model (www.bal-
morel.com). The power system is represented at the provincial level, considering the
interprovincial grid constraints and expansion options. The model includes thermal
power (including CHP), wind, solar (including CSP), hydro, power storage, heat boilers,
heat storages, heat pumps, etc. It also considers demand-side flexibility from industries,
options for charging electric vehicles and the option of a fully integrated coupling with
the district heating sector.
The model can represent the current dispatch in the Chinese power system on an hourly
basis, including technical limitations on the thermal power plants and interprovincial ex-
change of power, as well as the dispatch in a power market, provincial, regional or na-
tional, based on the least-cost marginal price optimisation. Key characteristics relate to
the detailed representation of the variability of load and supply (e.g. from VRE sources)
as well as flexibility and flexibility potentials, which can operate optimally and be de-
ployed efficiently in capacity expansion mode.
Combined summary tool
Results from the two models are combined in an integrated Excel-based tool, which pro-
vides an overall view of the energy system, combining fuel consumption from the power
and heating systems from EDO with direct consumption in end-use sectors and other
transformation sectors from LEAP.

China Renewable Energy Outlook 2020 – Summary Report
14 |
The transformation pillars
The strategy for the energy transition explored in CREO 2020 relies on three pillars:
Energy efficiency is a critical demand-side pillar to ensure the pace and scale of
supply-side deployments are adequate to support the required economic growth.
Electrification and market reforms will change the rules of the game and create
the opportunity to replace fossil fuels with electricity in the end-use consumption,
in conjunction with decarbonised electricity supply.
Green energy supply – technological progress and cost reduction allow renewable
energy to provide clean energy in bulk, mainly through renewable electricity.
The energy consumption control decouples energy demand from eco-
nomic growth
The total final energy consumption in the B2D scenario will peak at 3971 Mtce around 2030,
with a very flat peak, as shown in Figure 6. The increase in final energy consumption is the
biggest in the SPS, which peak around 2034, reaching 4068 Mtce.
Figure 6: Total Final Energy Consumption (Mtce) in the SPS and B2D scenario
0
1000
2000
3000
4000
5000
2020 2025 2030 2035 2040 2045 2050
Mtc
e/ y
ea
r
SPS B2D

Fejl! Brug fanen Hjem til at anvende Heading 1 på teksten, der skal vises her.
| 15
Figure 7: Energy consumption (Mtce) in the end-use sectors
Final energy consumption decreases at a rate of 0.4% per year in B2D from 2020 to 2050,
while gross domestic product grows by 4.5% annually over the same period. Meanwhile,
the structure of the final energy consumption is also changed due to the economic reform
process in China. The share of industrial energy consumption drops from 58% in 2020 to
41% in 2050. Several drivers cause the decoupling of the final energy consumption from
the economic growth:
Firstly, the economic reform in China will move economic activity from heavy in-
dustry with high energy consumption towards high tech industry and services with
much lower energy consumption per value-added.
Secondly, the shift from direct fuel combusting to the use of electricity in the in-
dustry and transport sectors will increase the energy efficiency in the end-use sec-
tors significantly (see below for more details about electrification).
Thirdly, focus on energy efficiency and efficiency gains from replacing old equip-
ment with new will lower the energy consumption in the different sectors, espe-
cially in the industry sector.
Electrification strategy decreases coal and oil in the end-use sectors
An essential part of the energy transformation is to substitute fossil fuels in the end-use
sectors with electricity from a green power system. Furthermore, the introduction of green
hydrogen produced by wind and solar power is an indirect way to electrify the end-use sec-
tors.
0
1000
2000
3000
4000
20
20
20
23
20
26
20
29
20
32
20
35
20
38
20
41
20
44
20
47
20
50
B2D(Mtce)
0
1000
2000
3000
4000
20
20
20
23
20
26
20
29
20
32
20
35
20
38
20
41
20
44
20
47
20
50
SPS(Mtce)

China Renewable Energy Outlook 2020 – Summary Report
16 |
Figure 8: Energy consumption in the end-use sectors on energy carriers in SPS and B2D scenario
With the deepening of industrial electrification (especially the iron industry) and the pro-
motion of electric vehicles, electricity consumption will increase substantially. In 2050, the
general electrification rate in the end-use sectors reaches 56% in SPS and 68% in B2D.
In industry, the most rapid electrification will happen in the subsectors: ferrous metals,
non‐ferrous metals, chemicals, machinery manufacturing, food and paper. The electrifi-
cation rate (share of electricity of the total final energy consumption) in the industry sector
will increase from around 27% in 2020 to 52% in 2050 in the B2D scenario and 49% in the
SPS.
In the transport sector, electric vehicles and plug-in hybrid vehicles will be the main route
for long-term development. According to the analysis, 450 – 490 million electric vehicles
(including passenger and freight) are expected on the road by 2050. As a result, the electri-
fication rate in the transport sector will grow from 3% in 2020 to 39% in 2050 in the B2D
scenario and 33% in the SPS.
In the building sector, the electrification rate will grow from 35% in 2020 to 60% in 2050.
0
1000
2000
3000
4000
5000
20
20
20
23
20
26
20
29
20
32
20
35
20
38
20
41
20
44
20
47
20
50
B2D Mtce
0
1000
2000
3000
4000
5000
20
20
20
23
20
26
20
29
20
32
20
35
20
38
20
41
20
44
20
47
20
50
SPS Mtce

Fejl! Brug fanen Hjem til at anvende Heading 1 på teksten, der skal vises her.
| 17
Figure 9: Electrification rate development for key end-use sectors in B2D and SPS
(solid line = B2D, dottted line = SPS)
Solar and wind power makes the power sector green and clean
In both scenarios, the total electricity generation grows in the period towards 2050, dou-
bling from around 8000 TWh in 2020 to almost 16000 TWh in 2050 in the B2D scenario and
an increase to slightly below 14000 TWh in the SPS.
The electricity consumption is generally higher in the B2D scenario than in the SPS due to
the more ambitious electrification of the end-use sectors.
Coal-based power production is gradually phased out and replaced by electricity from re-
newable energy, mainly solar PV and wind turbines. The share of renewables in power pro-
duction increases from nearly 30% in 2020 to 88% in 2050 in the B2D scenario and 85% in
the SPS.
The Stated Policies scenario has 707 GW of wind and 880 GW of solar to a combined 1587
GW by 2030, and the total installed capacity of wind power and solar PV is thereby higher
than the target of 1200 GW. This is mainly due to the economic competitiveness of wind
and solar compared with other technologies combined with the target to have a CO2 peak
before 2030. The B2D scenario has 850 GW wind and 1010 GW solar installed in 2030.
0%
10%
20%
30%
40%
50%
60%
70%
Industry Industry Transport
Transport Buildings Buildings

China Renewable Energy Outlook 2020 – Summary Report
18 |
Figure 10: Power generation in the two scenarios (TWh)
Figure 11: Installed power capacity in the two scenarios (GW)
0
4000
8000
12000
16000
20
20
20
23
20
26
20
29
20
32
20
35
20
38
20
41
20
44
20
47
20
50
B2D
0
4000
8000
12000
16000
20
20
20
23
20
26
20
29
20
32
20
35
20
38
20
41
20
44
20
47
20
50
SPS
0
1000
2000
3000
4000
5000
6000
7000
20
20
20
25
20
30
20
35
20
40
20
45
20
50
B2D
0
1000
2000
3000
4000
5000
6000
7000
20
20
20
25
20
30
20
35
20
40
20
45
20
50
SPS

Fejl! Brug fanen Hjem til at anvende Heading 1 på teksten, der skal vises her.
| 19
Reliability will depend on a more extensive sharing of resources between regions, a more
robust grid, and advanced coordination between grids. Reliability will also depend on in-
troducing a variety of power sources that can reduce the risk of failure due to weather-
related technical failures and a shortage of resources and fuels.
Figure 12: Hourly balance of supply and demand in China’s power system for a week in 2050
0
500
1000
1500
2000
2500
3000
Day 1 Day 2 Day 3 Day 4 Day 5 Day 6 Day 7
Po
we
r g
en
era
tio
n (G
Wh
)
Coal Natural gas Nuclear Hydro
Biomass Geothermal Ocean Wind
Solar Storage discharge V2G discharge Total
China Renewable Energy Outlook 2020 – Summary Report
20 |
The energy roadmaps towards 2050
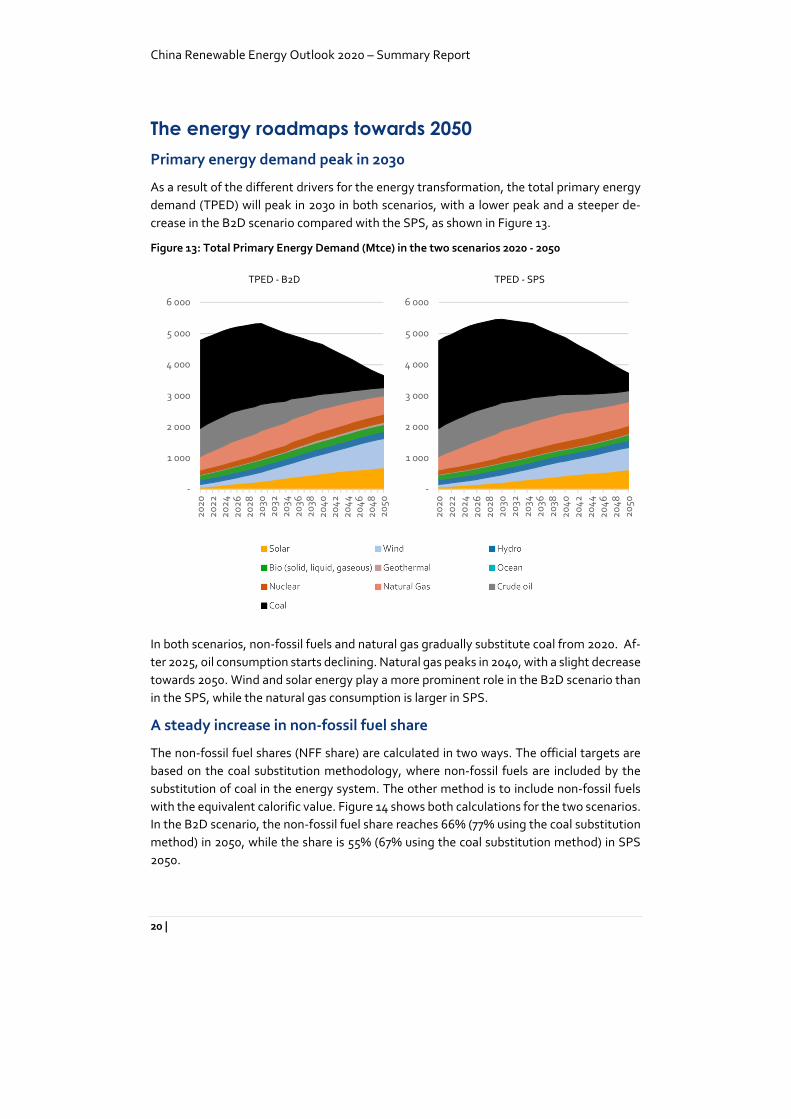
Primary energy demand peak in 2030
As a result of the different drivers for the energy transformation, the total primary energy
demand (TPED) will peak in 2030 in both scenarios, with a lower peak and a steeper de-
crease in the B2D scenario compared with the SPS, as shown in Figure 13.
Figure 13: Total Primary Energy Demand (Mtce) in the two scenarios 2020 - 2050
In both scenarios, non-fossil fuels and natural gas gradually substitute coal from 2020. Af-
ter 2025, oil consumption starts declining. Natural gas peaks in 2040, with a slight decrease
towards 2050. Wind and solar energy play a more prominent role in the B2D scenario than
in the SPS, while the natural gas consumption is larger in SPS.
A steady increase in non-fossil fuel share
The non-fossil fuel shares (NFF share) are calculated in two ways. The official targets are
based on the coal substitution methodology, where non-fossil fuels are included by the
substitution of coal in the energy system. The other method is to include non-fossil fuels
with the equivalent calorific value. Figure 14 shows both calculations for the two scenarios.
In the B2D scenario, the non-fossil fuel share reaches 66% (77% using the coal substitution
method) in 2050, while the share is 55% (67% using the coal substitution method) in SPS
2050.
-
1 000
2 000
3 000
4 000
5 000
6 000
20
20
20
22
20
24
20
26
20
28
20
302
032
20
342
036
20
382
04
02
04
22
04
42
04
62
04
82
050
TPED - B2D
-
1 000
2 000
3 000
4 000
5 000
6 000
20
20
20
22
20
24
20
26
20
28
20
302
032
20
342
036
20
382
04
02
04
22
04
42
04
62
04
82
050
TPED - SPS

Fejl! Brug fanen Hjem til at anvende Heading 1 på teksten, der skal vises her.
| 21
Figure 14: Non-fossil fuel share (%) - direct equivalent and coal substitution method
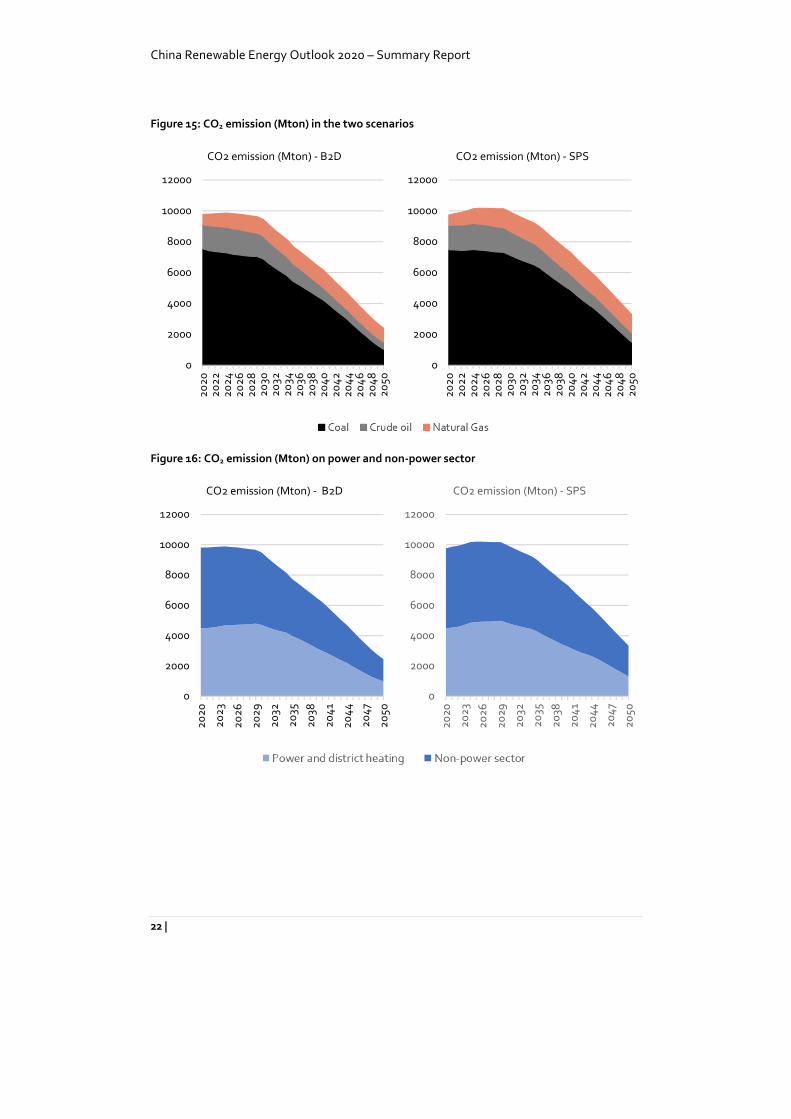
A peak in CO2 emission before 2030 and a rapid decrease afterwards
The CO2 emission is stable in the B2D scenario until 2030, with a small peak in 2024.
After 2030 the scenario has a steep decrease, and in 2050 the emission is reduced to 2442
Mton, less than 25% of the 2020 level. The SPS has a plateau of around 10,800 Mton in
2025-2029 and a decrease after 2030. In 2050 the emission is calculated to 3342 Mton in
the SPS.
Coal is the dominant source for CO2 emission, but natural gas emissions become more crit-
ical by the end of the period. In both scenarios, the CO2 emission from the non-power sec-
tor is more significant than the emission from the power system.
0%
20%
40%
60%
80%
100%
20
20
20
23
20
26
20
29
20
32
20
35
20
38
20
41
20
44
20
47
20
50
Non-fossil fuel share (%) - B2D
0%
20%
40%
60%
80%
100%
20
20
20
23
20
26
20
29
20
32
20
35
20
38
20
41
20
44
20
47
20
50
Non-fossil fuel share (%) - SPS
China Renewable Energy Outlook 2020 – Summary Report
22 |
Figure 15: CO2 emission (Mton) in the two scenarios
Figure 16: CO2 emission (Mton) on power and non-power sector
0
2000
4000
6000
8000
10000
12000
20
20
20
22
20
24
20
26
20
28
20
302
032
20
342
036
20
382
04
02
04
22
04
42
04
62
04
82
05
0
CO2 emission (Mton) - B2D
0
2000
4000
6000
8000
10000
12000
20
20
20
22
20
24
20
26
20
28
20
302
032
20
342
036
20
382
04
02
04
22
04
42
04
62
04
82
05
0
CO2 emission (Mton) - SPS
0
2000
4000
6000
8000
10000
12000
20
20
20
23
20
26
20
29
20
32
20
35
20
38
20
41
20
44
20
47
20
50
CO2 emission (Mton) - B2D
0
2000
4000
6000
8000
10000
12000
20
20
20
23
20
26
20
29
20
32
20
35
20
38
20
41
20
44
20
47
20
50
CO2 emission (Mton) - SPS

Fejl! Brug fanen Hjem til at anvende Heading 1 på teksten, der skal vises her.
| 23
Key results for the two scenarios
Figure 17: Key results for the B2D scenario
B2D 2020 2025 2030 2035 2050
Energy basis
Total Primary Energy Demand (TPED) Mtce
4,784
5,158
5,318
4,946
3,650
Total Final energy consumption (TFEC) Mtce
3,491
3,803
3,971
3,758
3,091
CO2 emission Mton
9,807
9,847
9,488
7,736
2,442
Non-fossil fuel share of TPED (NFF) % 13% 17% 22% 31% 66%
RE share of TPED % 10% 14% 18% 26% 59%
Coal share of TPED % 59% 52% 49% 41% 11%
Coal share of TFEC % 34% 28% 24% 18% 4%
Gas share of TPED % 9% 12% 13% 15% 16%
Oil share of TPED % 19% 19% 16% 13% 7%
Electrification rate % 28% 33% 38% 46% 68%
Coal substitution method
Total Primary Energy Demand (TPED) Mtce
5,103
5,667
6,072
6,005
5,440
Non-fossil fuel share of TPED (NFF) % 18% 24% 32% 43% 77%
RE share of TPED % 16% 21% 28% 39% 72%
Total installed power capacity GW
2,150
3,016
3,791
4,699
6,532
Renewable GW
919
1,598
2,343
3,413
6,142
Hydro GW
350
388
439
456
533
Wind GW
282
515
850
1,250
2,656
Bio (solid, liquid, gaseous) GW
34
40
44
45
60
Solar GW
253
651
1,002
1,650
2,870
Solar CSP GW
1
4
9
10
16
Geothermal GW
0
0
0
1
5
Ocean GW
0
0
1
1
2
Nuclear GW
53
66
79
87
100
Fossil fuels GW
1,178
1,351
1,369
1,200
290

China Renewable Energy Outlook 2020 – Summary Report
24 |
Figure 18: Key results for the SPS
SPS 2020 2025 2030 2035 2050
Energy basis
Total Primary Energy Demand (TPED) Mtce
4,766
5,251
5,458
5,307
3,726
Total Final energy consumption (TFEC) Mtce
3,476
3,837
4,058
4,060
3,203
CO2 emission Mton
9,759
10,198
9,988
8,995
3,342
Non-fossil fuel share of TPED (NFF) % 13% 16% 20% 25% 55%
RE share of TPED % 10% 12% 16% 20% 48%
Coal share of TPED % 59% 53% 49% 44% 15%
Coal share of TFEC % 34% 28% 25% 23% 6%
Gas share of TPED % 9% 12% 15% 17% 21%
Oil share of TPED % 19% 19% 17% 14% 10%
Electrification rate % 28% 31% 35% 38% 56%
Coal substitution method
Total Primary Energy Demand (TPED) Mtce
5,084
5,706
6,122
6,204
5,164
Non-fossil fuel share of TPED (NFF) % 18% 22% 28% 36% 67%
RE share of TPED % 16% 19% 25% 32% 62%
Total installed power capacity GW
2,150
2,784
3,465
4,121
5,885
Renewable GW
919
1,426
2,064
2,884
5,307
Hydro GW
350
388
439
456
533
Wind GW
282
450
707
990
2,052
Bio (solid, liquid, gaseous) GW
34
38
37
37
50
Solar GW
253
546
872
1,390
2,652
Solar CSP GW
1
4
9
11
16
Geothermal GW
0
0
0
0
2
Ocean GW
0
0
1
1
2
Nuclear GW
53
66
79
87
100
Fossil fuels GW
1,178
1,291
1,322
1,150
478

Fejl! Brug fanen Hjem til at anvende Heading 1 på teksten, der skal vises her.
| 25
Development indices 2000 - 2050
A helpful way to understand the long-term development trends is to show the index of key
results relative to 2005, as shown in Figure 19 for the B2D scenario. We assume that the
total GDP in real terms will grow 12,58 times from 2005 to 2050 (A). At the same time, the
scenario analysis shows that the primary energy demand will peak in 2030 and decline af-
terwards (B). The CO2 emission has a steep increase from 2000 to 2010, a plateau from
2010 to 2030 and a steep decrease from 2030 to 2050 (C).
As explained in the previous chapters, the development is driven by a cleaner energy sys-
tem with a lower CO2 emission per energy unit of consumption (D) and a decoupling be-
tween economic growth and energy consumption (E). Hence, the CO2 intensity per GDP
will continue to fall steadily towards 2050 (F).
Figure 19: Indices for GDP, Energy and CO2 in the B2D scenario. Index 2005 = 1)
0
5
10
15
20
00
20
10
20
20
20
30
20
40
20
50
A: GDP
0,0
1,0
2,0
3,0
20
00
20
10
20
20
20
30
20
40
20
50
B: Energy
0,0
0,5
1,0
1,5
2,0
20
00
20
10
20
20
20
30
20
40
20
50
C: CO2
0,0
0,5
1,0
1,5
20
00
20
10
20
20
20
30
20
40
20
50
D: CO2 / Energy
0,0
0,5
1,0
1,5
20
00
20
10
20
20
20
30
20
40
20
50
E: Energy / GDP
0,0
0,5
1,0
1,5
20
00
20
10
20
20
20
30
20
40
20
50
F: CO2 / GDP

China Renewable Energy Outlook 2020 – Summary Report
26 |
Regulation and reforms can support the energy trans-
formation
The scenario analyses show that it is technically feasible and beneficial to have a genuine
transformation of the Chinese energy sector towards 2050 to reach the goals for an eco-
logical civilisation with a clean, low-carbon, safe and efficient energy system. This will also
be a precondition for the 2060 carbon neutrality target for China.
However, the energy transformation does not happen by itself. A dedicated policy effort is
necessary to encourage change and remove barriers to implementation. The effort in-
cludes regulations and reforms like
Power sector reforms, including wholesale and retail electricity markets, unbun-
dling of monopolies, third party access to grids and markets and transparency re-
garding market information
Coordinated use of economic measures like emission trading systems, taxation,
and marginal pricing in power markets (wholesale and retail)
Promotion of green investments, which can reduce risks for green technologies
and remove protection for black, fossil fuel-based technologies
Existing control measures like caps for coal consumption, quotas for RE consump-
tion, pollution control, etc.
Focus on a transformation that preserves jobs and a healthy local economy, using
green growth as a driver.
Power markets as the key driver for power system transformation and
RE integration
Experiences from Europe3, the US, and other regions demonstrate that establishing effi-
cient, transparent and liquid short-term power markets with clear price signals is funda-
mental for enhancing the flexibility in the power system, easing the integration of variable
power production from wind and solar power.
China relaunched its power market reform in 2014 and has established several pilot project
for wholesale markets. However, it is crucial that the practical power market design and
implementation consider the need to stimulate the integration of fluctuating power pro-
duction.
Besides the fundamentals in power market design4 – spot markets based on marginal pric-
ing, transparency for all market participants, access to grids and markets for all producers
etc. - the market design should also include trading close to the operating hour, allowing
adjustments to changes in production patterns, especially for VRE. Also, a well-defined
3 “European Experiences on Power Markets Facilitating Efficient Integration of Renewable Energy,” Danish En-
ergy Agency, March 2018. 4 “Electricity Market Design, Integrating renewables at low cost,” Danish Energy Agency, August 2020.

Fejl! Brug fanen Hjem til at anvende Heading 1 på teksten, der skal vises her.
| 27
market for ancillary services is in the spotlight when defining market products that reflect
the specific flexibility need of the power system in question. Correctly designed products
meeting particular needs can substantially reduce the power system costs by reducing the
need for large reserves. Furthermore, integrating markets into larger market areas has sig-
nificant economic benefits for integrating renewable energy, which can be achieved even
without complete harmonisation5.
Retail markets, exposing the price signals for the end-use consumers, can play an essential
role in shifting load away from peak hours and reducing the need for expensive peak ca-
pacity.
Transparency of market data, system data and infrastructure data are preconditions for a
well-functioning power market. The EU transparency efforts6 could be an inspiration for
China to develop its transparency policy.
From a policy point of view, power markets are tools for the energy transition. It is essential
to conduct comprehensive energy system analyses based on rigorous modelling, which will
reproduce the market function in combination with policy measures to evaluate the inter-
play between regulation and market forces.
Lower risk for green investments will boost the deployment of renewa-
bles
In addition to introducing power markets for all production technologies, including renew-
able energy, policy measures to reduce the risk for investments are essential to the rapid
deployment of renewable energy7. Support schemes like feed-in-premium or contracts for
differences (CfD) might be necessary for a period for technologies like offshore wind and
concentrated solar power (CSP), while power purchase agreements (PPA) would be a risk
minimising tool for more mature technologies. These instruments must be developed in
line with the power market set up to support the market function and integration of renew-
able while reducing investor risks.
Power market reform is necessary to improve VRE integration, but market and regulatory
risk may adversely affect the appetite for RE investments. Striking the right balance is crit-
ical.
The introduction of market discipline is essential for the green transition, but how can this
be introduced, while it is assumed that nobody (no SOEs) should lose out, and without
5 “Power markets and power sector planning in Europe - Lessons learnt for China,” Danish Energy Agency, Octo-
ber 2015. 6 “Electricity Market Transparency,” ENTSO-E, accessed in February 2021 at https://www.entsoe.eu/data/trans-
parency-platform/. 7 “Spot market models for renewable energy integration - international experience,” China National Renewable
Energy Centre and Danish Energy Agency, May 2020.

China Renewable Energy Outlook 2020 – Summary Report
28 |
bringing down the house of cards. Wind and solar are the cheapest sources of new electric-
ity generation in China - cheaper than coal, yet coal investments continue and bring moral
hazard to the system.
Control measures to guide the transformation in the right direction
At the level of policy design, the Chinese Government has continuously formulated plans
and regulations focusing on structural energy reform, carbon emission reduction and air
pollution control. China’s renewable energy support policy has begun to transform in 2019
and has gradually shifted from a purely supply-side incentive to a consumer-side responsi-
bility. NEA has implemented the mandatory renewable power consumption mechanism
since 2019. It is a binding policy, requiring that a certain percentage of electricity consump-
tion of each province be from renewable energy and non-hydro renewable energy, respec-
tively. The general idea is to raise the provincial consumption targets year by year and grad-
ually reduce the difference in the proportion of consumption among provinces in the 14th
and 15th Five-Year Plan periods. The purpose is to realise that all provinces will bear the
responsibility for the development and consumption of renewable power equally by 2030.
To curb CO2 emissions and transition to clean energy, China is working to decrease the
share of coal in its overall energy mix and decrease the dominant role of coal in electricity
generation, aiming to control the total annual coal consumption within 4.1 billion tons by
2020. In the 13th Five-Year Plan period, the Government has further promoted supply-side
structural reform by phasing outdated coal production capacity and stabilising coal prices.
While shutting down the outdated small coal mines, coal mining has become further con-
centrated in areas with high-quality coal resources. To reduce fluctuations in coal prices,
the coal market has increased the proportion of medium- and long-term trading contracts.
The Government has further reformed coal prices to stabilise supply and demand. Specifi-
cally, in the power sector, NEA and NDRC set a clear target of keeping the total coal power
capacity under 1,100 GW by 2020. More than 20 GW of outdated thermal power capacity
was targeted for closure. Any remaining coal-fired units under 300 MW should meet ultra-
low emission standards.
Besides CO2 emission reduction, China also stipulates in explicit policies the Air Pollution
Prevention and Control Action Plan (2013-2017) and Three-Year Blue Sky Action Plan (2018-
2020) to control major air pollutant emissions such as SO2 and NOx, as well as reduce the
concentration of PM 2.5 and number of heavily polluted days. The Ministry of Finance is-
sued dedicated funds annually to carry out relevant activities across the country, especially
in key control areas, including the Beijing-Tianjin-Hebei region, the Yangtze River Delta
region and the Fenwei Plain (Shaanxi and Shanxi) region.
Fejl! Brug fanen Hjem til at anvende Heading 1 på teksten, der skal vises her.
| 29
Policy recommendations
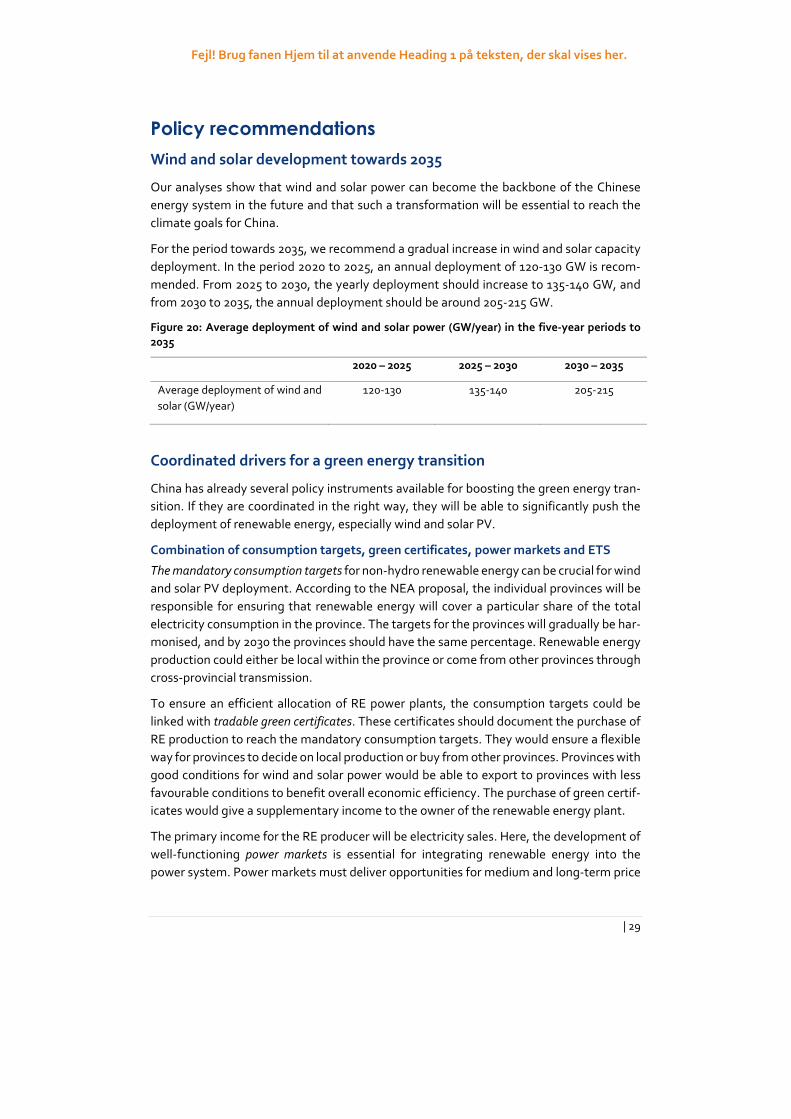
Wind and solar development towards 2035
Our analyses show that wind and solar power can become the backbone of the Chinese
energy system in the future and that such a transformation will be essential to reach the
climate goals for China.
For the period towards 2035, we recommend a gradual increase in wind and solar capacity
deployment. In the period 2020 to 2025, an annual deployment of 120-130 GW is recom-
mended. From 2025 to 2030, the yearly deployment should increase to 135-140 GW, and
from 2030 to 2035, the annual deployment should be around 205-215 GW.
Figure 20: Average deployment of wind and solar power (GW/year) in the five-year periods to
2035
2020 – 2025 2025 – 2030 2030 – 2035
Average deployment of wind and
solar (GW/year)
120-130 135-140 205-215
Coordinated drivers for a green energy transition
China has already several policy instruments available for boosting the green energy tran-
sition. If they are coordinated in the right way, they will be able to significantly push the
deployment of renewable energy, especially wind and solar PV.
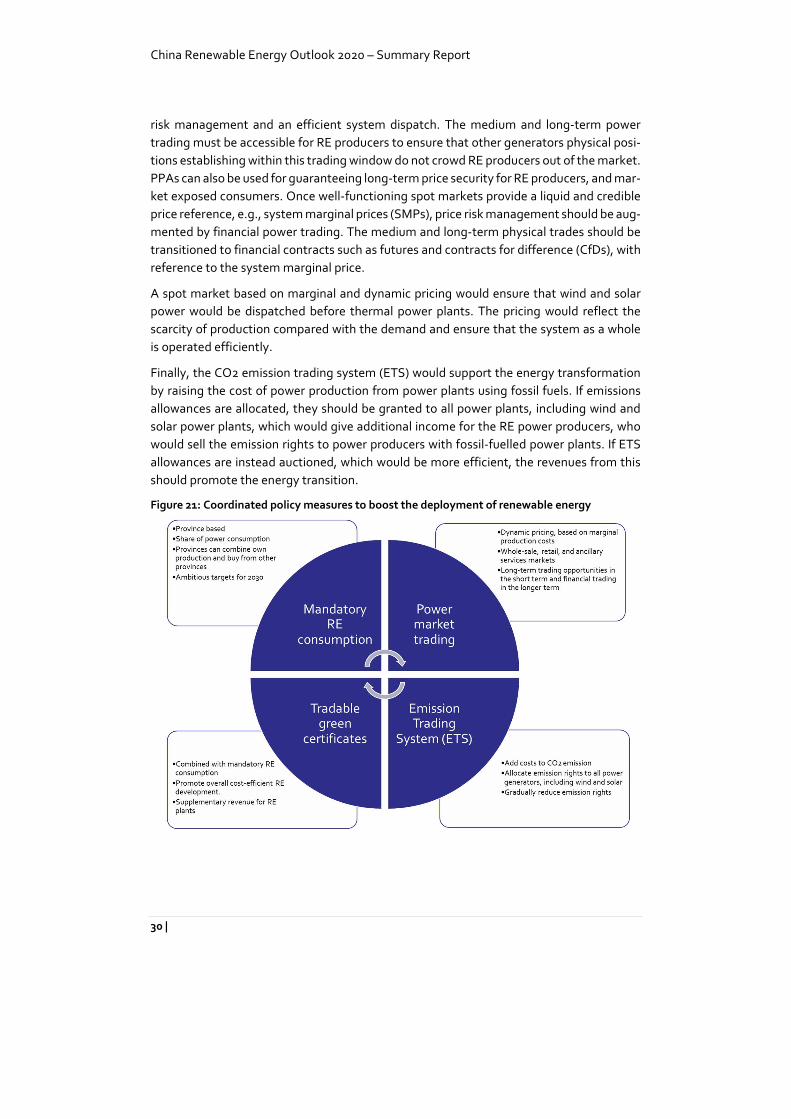
Combination of consumption targets, green certificates, power markets and ETS
The mandatory consumption targets for non-hydro renewable energy can be crucial for wind
and solar PV deployment. According to the NEA proposal, the individual provinces will be
responsible for ensuring that renewable energy will cover a particular share of the total
electricity consumption in the province. The targets for the provinces will gradually be har-
monised, and by 2030 the provinces should have the same percentage. Renewable energy
production could either be local within the province or come from other provinces through
cross-provincial transmission.
To ensure an efficient allocation of RE power plants, the consumption targets could be
linked with tradable green certificates. These certificates should document the purchase of
RE production to reach the mandatory consumption targets. They would ensure a flexible
way for provinces to decide on local production or buy from other provinces. Provinces with
good conditions for wind and solar power would be able to export to provinces with less
favourable conditions to benefit overall economic efficiency. The purchase of green certif-
icates would give a supplementary income to the owner of the renewable energy plant.
The primary income for the RE producer will be electricity sales. Here, the development of
well-functioning power markets is essential for integrating renewable energy into the
power system. Power markets must deliver opportunities for medium and long-term price
China Renewable Energy Outlook 2020 – Summary Report
30 |
risk management and an efficient system dispatch. The medium and long-term power
trading must be accessible for RE producers to ensure that other generators physical posi-
tions establishing within this trading window do not crowd RE producers out of the market.
PPAs can also be used for guaranteeing long-term price security for RE producers, and mar-
ket exposed consumers. Once well-functioning spot markets provide a liquid and credible
price reference, e.g., system marginal prices (SMPs), price risk management should be aug-
mented by financial power trading. The medium and long-term physical trades should be
transitioned to financial contracts such as futures and contracts for difference (CfDs), with
reference to the system marginal price.
A spot market based on marginal and dynamic pricing would ensure that wind and solar
power would be dispatched before thermal power plants. The pricing would reflect the
scarcity of production compared with the demand and ensure that the system as a whole
is operated efficiently.
Finally, the CO2 emission trading system (ETS) would support the energy transformation
by raising the cost of power production from power plants using fossil fuels. If emissions
allowances are allocated, they should be granted to all power plants, including wind and
solar power plants, which would give additional income for the RE power producers, who
would sell the emission rights to power producers with fossil-fuelled power plants. If ETS
allowances are instead auctioned, which would be more efficient, the revenues from this
should promote the energy transition.
Figure 21: Coordinated policy measures to boost the deployment of renewable energy
Fejl! Brug fanen Hjem til at anvende Heading 1 på teksten, der skal vises her.
| 31
In such a coordinated policy system, the RE power producers will generate income from
three different sources:
1. Power market trading
2. Green certificate trading
3. Emission rights trading
To get these measures to work efficiently, it is essential that the consumption targets and
emission trading rights are based on the ambitious long-term targets needed to reach car-
bon neutrality in 2060 and avoid stop-go situations where the targets are temporary ful-
filled.
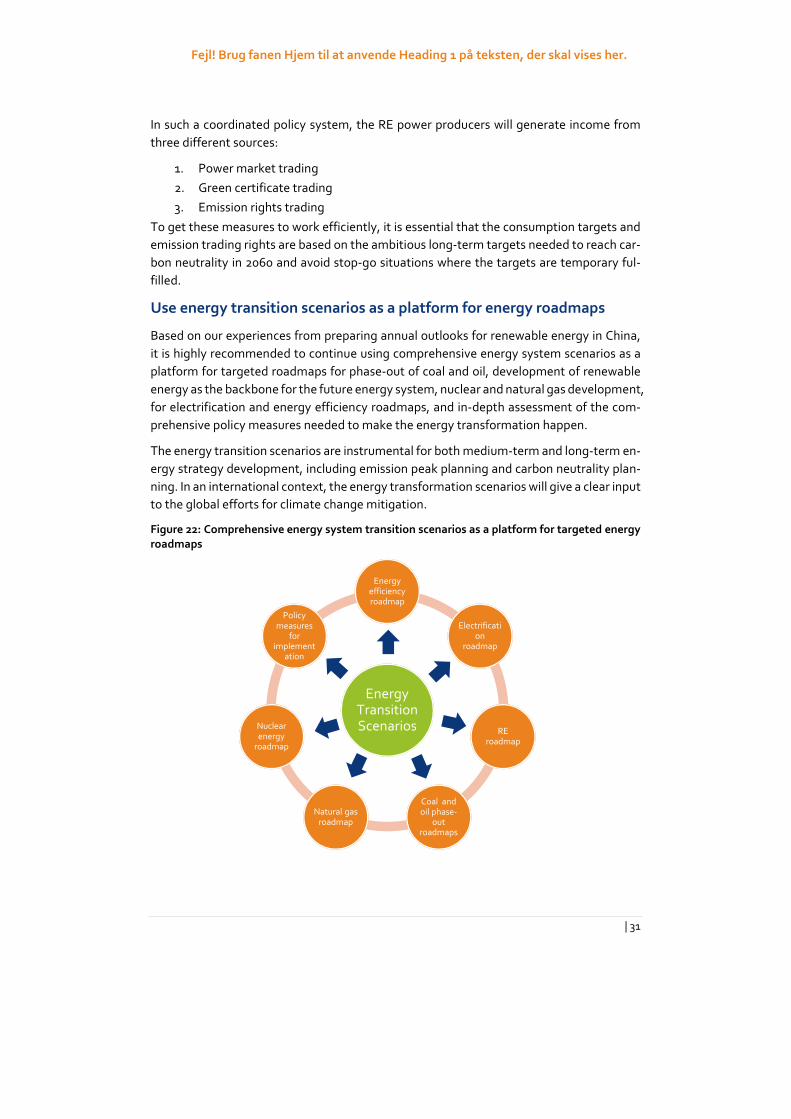
Use energy transition scenarios as a platform for energy roadmaps
Based on our experiences from preparing annual outlooks for renewable energy in China,
it is highly recommended to continue using comprehensive energy system scenarios as a
platform for targeted roadmaps for phase-out of coal and oil, development of renewable
energy as the backbone for the future energy system, nuclear and natural gas development,
for electrification and energy efficiency roadmaps, and in-depth assessment of the com-
prehensive policy measures needed to make the energy transformation happen.
The energy transition scenarios are instrumental for both medium-term and long-term en-
ergy strategy development, including emission peak planning and carbon neutrality plan-
ning. In an international context, the energy transformation scenarios will give a clear input
to the global efforts for climate change mitigation.
Figure 22: Comprehensive energy system transition scenarios as a platform for targeted energy
roadmaps
Energy Transition Scenarios
Energy efficiency roadmap
Electrification
roadmap
RE roadmap
Coal and oil phase-
out roadmaps
Natural gas roadmap
Nuclear energy
roadmap
Policy measures
for implement
ation

China Renewable Energy Outlook 2020 – Summary Report
32 |
Additional key findings from the Outlook research
This chapter summarises other key findings from the report
Power sector
Electrification in the end-use sectors boosts electricity consumption. The energy tran-
sition requires a high penetration of renewable energy in the power sector.
Electrification is one of the key elements in energy transition. It provides space for effi-
ciency improvements on the end use of energy and considerable potential for electricity
supplied by renewable energy that can significantly accelerate the energy transition. Ac-
cording to Below 2 °C Scenario, the electrification rate grows from 30% in 2019 to 46% in
2035 and 68% in 2050. The electricity consumption in 2050 is nearly doubled compared
with the 2019 level. It is mainly driven by the transport and agriculture sectors and increas-
ing applications of hydrogen produced from electricity.
Renewable power technologies are the most promising and mature technologies that can
efficiently and cost-effectively reduce CO2 emissions in the energy sector. Along with
growing electricity consumption, the power sector needs to provide clean energy by inte-
grating a high penetration of renewable energy. Our results show that in the Below 2 °C
Scenario, the share of renewable energy generation in the power sector increases from 25%
in 2019 to 57% in 2035 and 88% in 2050. Renewable energy in the power sector contributes
to 72% of overall renewable energy consumption in 2019, 78% in 2035 and 83% in 2050,
respectively.
An energy transition driven by renewables requires a reimagining of China’s power
system.
To adopt renewable power generation in the power system, the integration becomes crit-
ical, as renewable generation is fluctuant, distributed and uncertain. The scenarios demon-
strate that while the post-transition power system outperforms the present system accord-
ing to all relevant criteria, it is radically different. Characteristics in asset mix, dispatchabil-
ity, operational paradigm, cost structure, operational timescales, and topology will trans-
form. The system cannot be planned or operated according to today’s principles, using to-
day’s sources of flexibility under today’s regulatory paradigms. Every aspect of the power
industry needs to be changed, including market designs, regulatory setups, product and
service definitions, and stakeholder roles. Power system planning, innovation, and reform
must be forward-looking. Managing uncertainty, variability, and complexity will be essen-
tial.
To accommodate the high penetration of renewable sources, China’s electricity market
should mobilise existing flexibility through efficient price signals and market services and
guide investments in unavailable flexibility sources through long-term market design. The
power system should be structured to efficiently dispatch available flexibility such that fluc-
tuations and uncertainties can be handled without interfering with system security.

Fejl! Brug fanen Hjem til at anvende Heading 1 på teksten, der skal vises her.
| 33
Renewable energy is competitive on a cost basis, on value adjusted basis, and in the
long run, it can reach high penetration levels if cost-effective flexibility is deployed.
Based on recent years’ experiences, it is projected that renewable energy costs will con-
tinue to decline, making wind and solar competitive with investing in new coal power plants
during the 14th Five-Year Plan period. When the external costs of coal power plants are
accounted for, investments in new renewable energy sources will be cheaper than contin-
uing to operate existing coal plants. The focus on cost reduction of onshore wind and solar
PV will be shifted from reducing equipment and construction cost to improving the capac-
ity factor.
The power reforms and meaningful carbon price levels will take some time to implement.
The scenario results suggest that the carbon market is a very efficient tool to make non-
fossil fuel competitive with fossil fuel, which indicates that the additional system integra-
tion cost by renewable energy still needs stimulations through policies. The price of CO2
should translate to a higher market value for renewables and a disincentive for fossil-fired
generation as a (partial) proxy for the external costs of fossil fuel combustion. Auctioning
CO2 allowances could finance accelerated investments in the energy transition.
The role of coal and natural gas in future power system.
To facilitate the structural reform and proceed energy transition, coal capacity does not
significantly increase during the 14th Five-Year Plan period. From 2025 to 2050, coal capac-
ity gradually declines since the role of coal plants is turned to providing flexibility and spin-
ning reserve from simply serving the baseload. The role of natural gas plants in the future
power system is the same as coal plants, except that natural gas plants bring less CO2 emis-
sion. The development space for natural gas power is determined both by the CO2 cap and
the flexibility demand of the power system.
Grid planning
The substantial expansion of variable renewable energy generation challenges the para-
digm of grid planning in China. The importance of coordinating wind and solar deploy-
ments with the planning of grid connectors to bring renewable electricity to consumption
areas has been long recognised in China. Several large and long-distance transmission pro-
jects find justification in facilitating remote RE developments in areas with abundant en-
dowments of RE resources. However, historically large-scale wind and solar deployments
in China have been developed in conjunction with traditional coal power generation as
backup and support. As the overall VRE penetration levels increase, this bundling of coal
with wind and solar gradually becomes infeasible, notably as such thermal capacity is re-
duced.
In CREO’s power system simulations, there is a clear indication that new transmission ca-
pacity between provinces provides value to:
Connect structural surplus generation areas with deficit areas,
smoothen out VRE variability over broader geographical footprints,
efficiently and dynamically connect flexible resources to areas they are needed.

China Renewable Energy Outlook 2020 – Summary Report
34 |
These results are derived from the holistic optimisation applied to capacity expansion and
dispatch. On a per timestep basis, down to hour-by-hour simulations, the marginal cost of
supplying electricity to each region is a result. This can be interpreted as spot market prices
within each timestep. Regional price differences reflect the value of having the capability
to transmit electricity in each hour between locations. Over the year, the value of this ca-
pability is the sum of distinct values, given 8760 (hourly) different supply and demand situ-
ations.
Presently, the business cases in transmission planning in China are based on the difference
in the average cost of supply between regions – essentially as reflected in the first bullet
above. When VRE penetration increases and flexibility gains importance in power dispatch,
it becomes increasingly important to value both dispatch and investment planning pur-
poses. The business cases for new transmission lines in the future must be adapted to re-
flect this reality.
Grid expansions are an essential component in the realisation of either CREO 2020
scenario. The simulations indicate that not expanding interprovincial grid capacity
increases the overall economic cost by 900 billion per year in 2030, and at the same
time produces inferior environmental outcomes.
In further developing grid planning methodology in China, there are significant
and relevant lessons to be learned from Europe and the process applied by the
European Network of Transmission System Operators for Electricity (ENTSO-E)
to develop Ten-Year Network Development Plans (TYNDP). Globally, this remains
the single comprehensive grid planning coordination methodology applied at a
scale proportional to that of China.
The development of well-functioning spot market(s) in China will provide essen-
tial information to grid planners and refine the possibilities for creating sound
cost-benefit analyses of power transmission projects to accurately reflect the ex-
pected societal benefits of transmission projects to weigh against the costs.
Compared with Europe, the needs for grid development in China, as identified in
the CREO scenarios, are substantial. This implies that the Chinese equivalent of a
TYNDP would be complex and comprehensive, including many opportunities for
cost-effective grid reinforcements and complex interactions in the value determi-
nations of many potential projects under consideration.
Grid planning analyses presented in the CREO report have been prepared for work under
the EU-China Energy Cooperation Platform, ECECP8. This work builds on the CREO 2020
Scenarios. It uses supplementary simulations to look at grid planning in China in a market-
based context, following ENTSO-E’s TYNDP process methodology.
8 Specifically, the activity A4.1.1: ENTSO-E Grid Planning Modelling Showcase for China. For more information in
the EU China Energy Collaboration Platform visit the ECECP website at http://www.ececp.eu/.

Fejl! Brug fanen Hjem til at anvende Heading 1 på teksten, der skal vises her.
| 35
Electric vehicles and renewable energy
Electric vehicles (EVs) can act as energy storage in the power system and thereby increase
the flexibility of the system. This flexibility includes peak shaving, frequency control, reac-
tive compensation, modern information and communication technology, power electronic
technology and optimal control technique. The widespread use of EVs also provides con-
siderable potential for renewable energy grid integration when renewable energy is gener-
ated but not needed immediately. This has historically been one of the main limitations of
renewable energy, namely, the problems of short-term storage so that the cycles of de-
mand and supply can be more readily reconciled. The transport sector may have a pivotal
role to play here. The combination of different EV storage options and the expansion of
EVs provide the necessary capacity for short-term energy storage.
The flexibility potential of EVs can be realised through four pathways: Smart Charging (SC),
Battery Swap (BS), Vehicle to Grid (V2G) and Repurposing Retired Batteries (RB).
Pathway 1: Smart Charging (SC)
EVs can shift their charging time according to the power system demand through smart
charging. The concept is similar to the conventional power demand response but poten-
tially with improved flexibility and reduced cost. The storage capacity of smart charging is
determined mainly by driving behaviour, but the theoretical maximum storage capacity
equals the electricity consumption for transport use.
Pathway 2: Vehicle to Grid (V2G)
Vehicle to Grid (V2G) exploits the storage potential from onboard batteries via bidirec-
tional power flows between the vehicle and the grid. The theoretical storage capacity of a
V2G EV is decided by onboard battery storage capacity.
Pathway 3: Battery Swap (BS)
A battery swap (BS) offers a quick refuelling solution and could also release the maximum
storage potential of EV batteries. A swapped battery can be charged and discharged ac-
cording to the power system demand as a stationary storage unit. The lifetime of batteries
could also be extended through the relaxation of the fast charging requirement. The vol-
ume of off-board batteries determines the storage capacity of the battery swap.
Pathway 4: Repurposing Retired Batteries (RB)
Because retired EV batteries usually hold about 70-80% of the charge of new batteries, the
use of these repurposed batteries for storage (RB) could add to their residual value. It
should be noted that the storage value of retired batteries can only be delivered after bat-
teries’ onboard duty has been completed, and this is typically 6-10 years after the begin-
ning of the battery lifecycle.
The theoretical capacity of the four EV storage pathways is illustrated in Figure 23. We refer
to the pumped hydro storage capacity for comparison. Pumped hydro storage currently
dominates over 90% of the energy storage market and serves various applications in the
power system in China. However, given the geological and water resource conditions, the

China Renewable Energy Outlook 2020 – Summary Report
36 |
proven reserves of pumped hydro storage capacity in China are 150GW, or 1.2TWh, assum-
ing an average of 8 hours discharge. Therefore, the theoretical capacity of V2G storage by
2030 is about 6 (power) or 4 (energy) times that of pumped hydro.
To realise a future with high VRE penetration, policymakers and planners need to know the
potential role of EV in the energy system and how EV-RE coordination can be implemented
in a cost-efficient way. We find that the development of EVs is the fundamental driver for
making substantial cost reductions in energy storage. Large scale investment in EVs and
the purchase of these vehicles can also offer a flexible solution in a cost-efficient way, as
the potential capacity for storage increases with the number of EVs. Of the four different
but complementary pathways by which EV flexibility can be delivered, V2G provides the
largest capacity, whilst RB shows diminishing market competitiveness in the longer term
than the other EV-RE coordination pathways.
Figure 23: Theoretical Energy Storage Capacity of Electric Vehicles
We have examined four pathways in combination to determine the range of options avail-
able, together with some of the costs, risks and uncertainties involved with each. The four
EV-RE coordination pathways all rely on different business models and policy instruments.
SC is technically mature with the least cost and should be promoted firstly by, for instance,
the implementation of the time of use (TOU) charging tariff. The discharging tariff, refer-
ring to the TOU charging tariff, should also be developed in parallel to encourage the ap-
plication of V2G. The potential of BS can be realised in a relatively efficient way for EV fleets,
such as buses and freight vehicles.
Policymakers should formulate standards/protocols on battery designs, cascade use and
material recycling as early as possible. All these factors will have a decisive impact on the
EV potential and the cost of RB. Given the concern on the limited battery life, the current
R&D on battery technology should focus on the performance parameters such as specific
energy and fast-charging capacity and the number of cycles, as this is the critical factor in
realising EV storage potential for the power system.

Fejl! Brug fanen Hjem til at anvende Heading 1 på teksten, der skal vises her.
| 37
EV flexibility needs to address complex issues related to intra-day storage demand result-
ing from the high penetration of variable renewable energy and tends to facilitate a distrib-
uted energy system where end-users can support each other instead of purely relying on
the main grid. Innovations in the transport sector, such as car-sharing and vehicle automa-
tion technology may influence EV-RE coordination. Still, EVs can always extract a consid-
erable amount of flexibility from the variation of daily transport demand (the gap between
peak and off-peak). BS and RB can offer the highest flexibility where vehicle use is highest,
such as in applying autonomous driving technologies.
China Renewable Energy Outlook 2020 – Summary Report
38 |
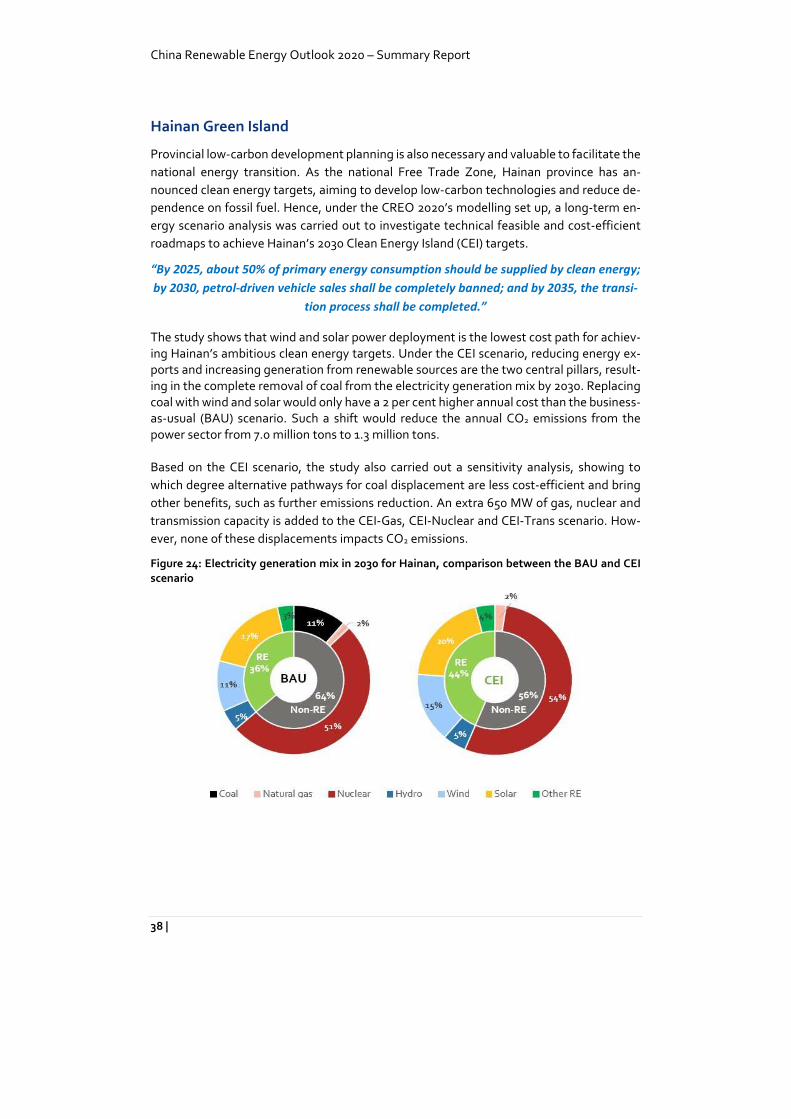
Hainan Green Island
Provincial low-carbon development planning is also necessary and valuable to facilitate the
national energy transition. As the national Free Trade Zone, Hainan province has an-
nounced clean energy targets, aiming to develop low-carbon technologies and reduce de-
pendence on fossil fuel. Hence, under the CREO 2020’s modelling set up, a long-term en-
ergy scenario analysis was carried out to investigate technical feasible and cost-efficient
roadmaps to achieve Hainan’s 2030 Clean Energy Island (CEI) targets.
“By 2025, about 50% of primary energy consumption should be supplied by clean energy;
by 2030, petrol-driven vehicle sales shall be completely banned; and by 2035, the transi-
tion process shall be completed.”
The study shows that wind and solar power deployment is the lowest cost path for achiev-
ing Hainan’s ambitious clean energy targets. Under the CEI scenario, reducing energy ex-
ports and increasing generation from renewable sources are the two central pillars, result-
ing in the complete removal of coal from the electricity generation mix by 2030. Replacing
coal with wind and solar would only have a 2 per cent higher annual cost than the business-
as-usual (BAU) scenario. Such a shift would reduce the annual CO2 emissions from the
power sector from 7.0 million tons to 1.3 million tons.
Based on the CEI scenario, the study also carried out a sensitivity analysis, showing to
which degree alternative pathways for coal displacement are less cost-efficient and bring
other benefits, such as further emissions reduction. An extra 650 MW of gas, nuclear and
transmission capacity is added to the CEI-Gas, CEI-Nuclear and CEI-Trans scenario. How-
ever, none of these displacements impacts CO2 emissions.
Figure 24: Electricity generation mix in 2030 for Hainan, comparison between the BAU and CEI
scenario

Fejl! Brug fanen Hjem til at anvende Heading 1 på teksten, der skal vises her.
| 39
2020