Embed Size (px)
Citation preview
Electronic supporting Information (ESI)
An amino-decorated dual-functional metal-organic
framework for highly selective sensing of Cr(Ⅲ) and
Cr(Ⅵ) ions and detection of nitroaromatic explosives
Rui Lv, Jingyao Wang ,Yanping Zhang , Hui Li, Linyan Yang, Shengyun Liao, Wen Gu,* Xin Liu*
Department of Chemistry, Collaborative Innovation Center of Chemical Science and Engineering, Nankai University, and Key Laboratory of Advanced Energy Materials Chemistry (MOE), Tianjin 300071, P. R. China. E-mail: [email protected], [email protected]
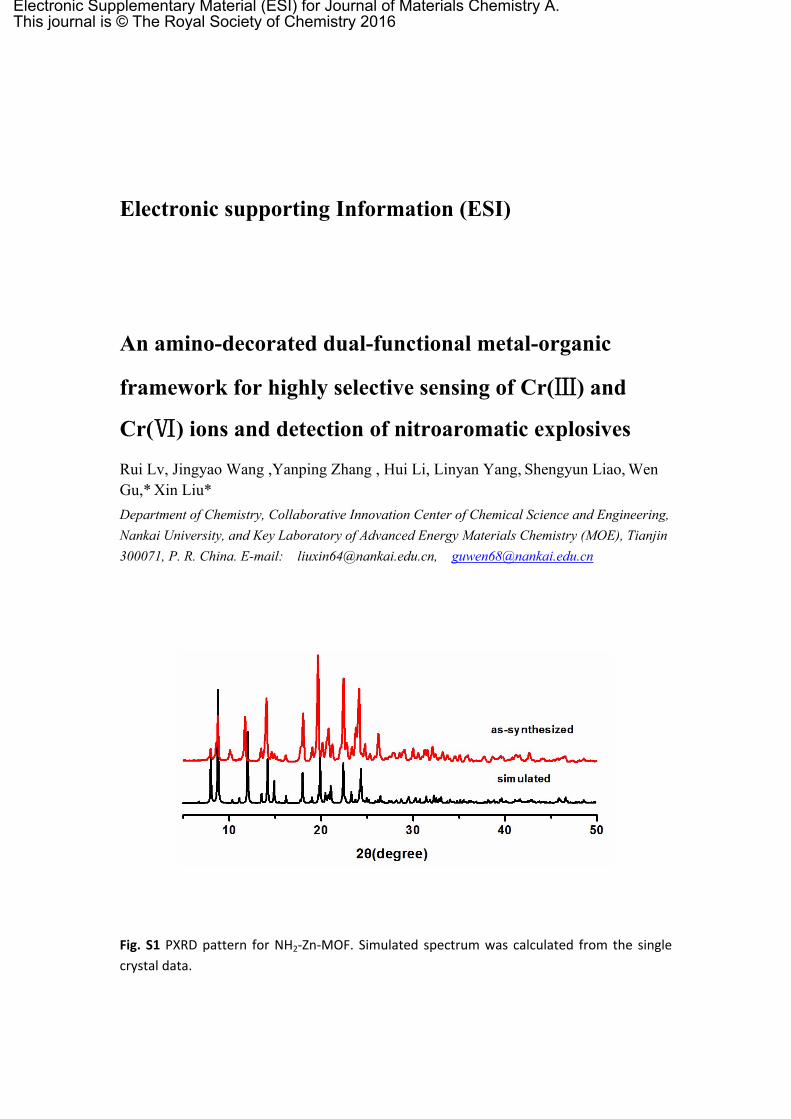
Fig. S1 PXRD pattern for NH2-Zn-MOF. Simulated spectrum was calculated from the single crystal data.
Electronic Supplementary Material (ESI) for Journal of Materials Chemistry A.This journal is © The Royal Society of Chemistry 2016

Fig. S2 PXRD pattern for Zn-MOF. Simulated spectrum was calculated from the single crystal data.
Fig. S3 TG curves of NH2-Zn-MOF in N2 condition .
Fig. S4 N2 adsorption and desorption isotherms of NH2-Zn-MOF.
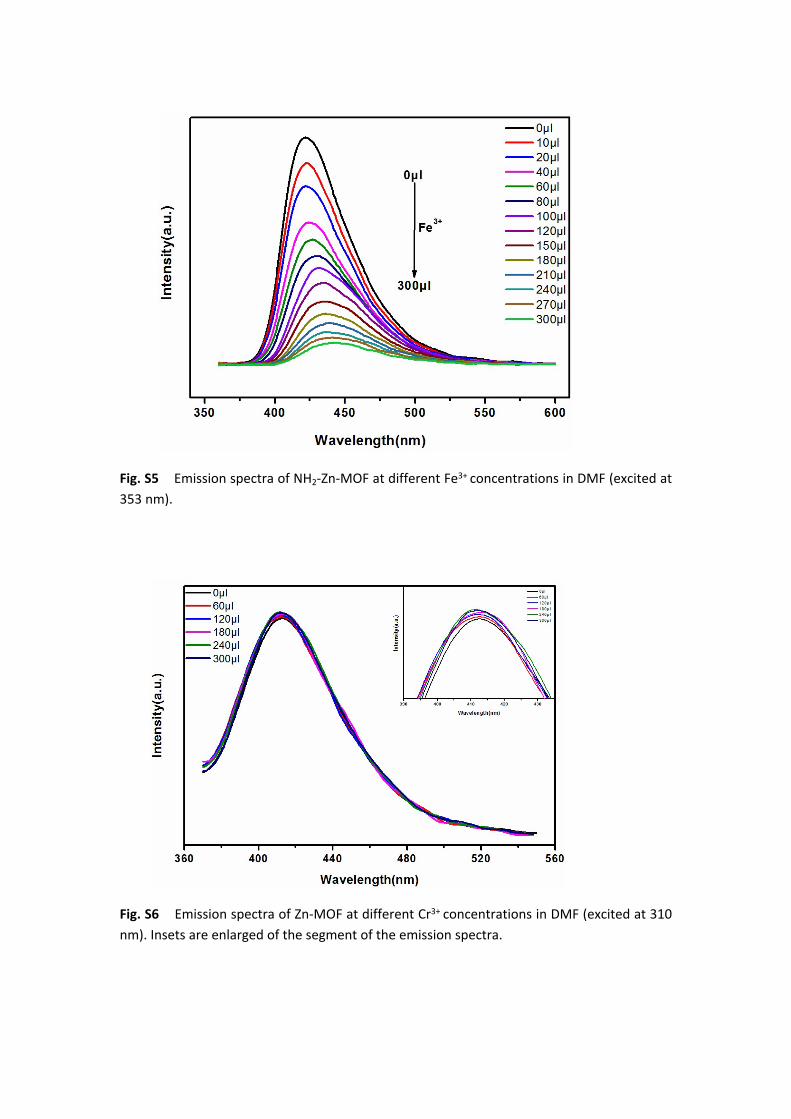
Fig. S5 Emission spectra of NH2-Zn-MOF at different Fe3+ concentrations in DMF (excited at 353 nm).
Fig. S6 Emission spectra of Zn-MOF at different Cr3+ concentrations in DMF (excited at 310 nm). Insets are enlarged of the segment of the emission spectra.

Fig. S7 Comparison of the luminescence intensity of NH2-Zn-MOF immersed in presence of 300μL CrO4
2− and other anions .
Fig. S8 Stern–Volmer plot for Cr2O72− (a), CrO4
2− (b), 4-NP(c) and TNP(d) in full concentration region , respectively.

Fig. S9 Emission spectra of Zn-MOF at different Cr2O72- concentrations in DMF (excited at
310 nm).
Fig. S10 Emission spectra of Zn-MOF at different CrO42- concentrations in DMF (excited at
310 nm).

Fig. S11 Comparison of the luminescence intensity of NH2-Zn-MOF immersed in presence of 100μL 4-NP and other aromatic compounds.
Fig. S12 Emission spectra of Zn-MOF at different 4-NP concentrations in DMF (excited at 310 nm).

Fig. S13 Emission spectra of Zn-MOF at different TNP concentrations in DMF (excited at 310 nm).
Fig. S14 PXRD patterns of NH2-Zn-MOF in different environments.

Table S1 Selected bond lengths (Å) and angles (deg) for NH2-Zn-MOF.
Symmetry transformations used to generate equivalent atoms:
#1 1/2-X, 1/2+Y, 3/2-Z
NH2-Zn-MOF
Zn(1)-O(3) 1.955(3)
Zn(1)-O(1) 1.957(3)
Zn(1)-N(2)#1 2.048(3)
Zn(1)-N(1) 2.005(3)
O(3)-Zn(1)-O(1) 105.14(13)
O(3)-Zn(1)-N(2)#1 94.99(12)
O(3)-Zn(1)-N(1) 107.02(13)
O(1)-Zn(1)-N(2)#1 107.34(12)
O(1)-Zn(1)-N(1) 126.99(12)
N(1)-Zn(1)-N(2)#1 110.50(13)
Fluorescent Materials analyte Quenching constant
(KSV , M-1 )
Detection Limits(µM)
Responsive time
Ref.
[Zn(btz)]n Cr2O72-/CrO4
2- 4.23×10³/ 3.19×10³
2/10 1
[Zn2(ttz)H2O]n Cr2O72-/CrO4
2- 2.19×10³/ 2.35×10³
20/20 1
Eu3+@MIL-121 Cr2O72-- 4.34×10³ 24h 2
[Eu(Hpzbc)2(NO3)]∙H2O Cr2O72- 22 6min 3
[Cd(TPTZ)(H2O)2(HCOOH) (IPA)2]n
Cr2O72- 12h 4
[Zn(2-NH2 bdc)(bibp)] n Cr2O72- 6555070 5
{[Zn2.5(cpbda)(OH)2]∙solvent2}n
Cr2O72-/CrO4
2- 6
[Cd6(L)2(bib)2(DMA)4] Cr2O72-/CrO4
2- 7
[Cd3(L)(tib)(DMF)2] Cr2O72-/CrO4
2- 7
Zn-MOF Cr2O72-/CrO4
2- 7.59×10³/ 4.45×10³
3.9/4.8 seconds This work

Table S2 Performance comparison between various MOF fluorescent sensors for Cr(Ⅵ).
Table S3 Detection limit comparison between Zn- MOF and NH2-Zn-MOF.
References:
1 C.-S. Cao, H.-C. Hu, H. Xu, W.-Z. Qiao and B. Zhao, CrystEngComm, 2016, 18, 4445−4451.
2 J.-N. Hao and B. Yan, New J. Chem., 2016, 40, 4654--4661.
3 G.-P. Li, G. Liu, Y.-Z.Li, L. Hou, Y.-Y. Wang and Z.-H Zhu, Inorg. Chem., 2016, 55, 3952−3959.
4 Y. Wang, L. Cheng, Z.-Y. Liu, X.-G. Wang, B. Ding, L. Yin, B.-B. Zhou, M.-S. Li, J.-X. Wang and X.-J.
Zhao, Chem. Eur. J., 2015, 21, 14171−14178.
5 L. L. Wen, X. F. Zheng, K. L. Lv, C. G. Wang and X. Y. Xu, Inorg. Chem., 2015, 54, 7133−7135.
6 W.-H. Huang, J.-Z. Li, T. Liu, L.-S. Gao, M. Jiang, Y.-N. Zhang and Y.-Y. Wang, RSC Adv., 2015, 5,
97127 −97132 .
7 F.-Y. Yi, J.-P. Li, D. Wu and Z.-M. Sun, Chem. Eur. J., 2015, 21, 11475–11482.
MOF
LOD(µM)
Cr3+ Cr2O72- CrO4
2- 4-NP TNP
Zn-MOF - 19.48 37.97 13.80 4.57
NH2-Zn-MOF 4.90 3.90 4.80 3.50 0.98

![Reduction of Nitroaromatic Compounds on the Surface of ... · nitroaromatic compounds [1]. The reduction of nitro-organic compounds also may be affected by non-ferrous metals or by](https://img.pdfslide.net/doc/110x75/5e7d7d0ea1c81b2392003275/reduction-of-nitroaromatic-compounds-on-the-surface-of-nitroaromatic-compounds.jpg)

![Ⅵ 논문발표 - KCSkcs.cosar.or.kr/2017/download/program/TP1.pdf · 2017-02-10 · 44 제24회 한국반도체학술대회 Ⅵ 논문발표 [TP1] Poster Ⅰ 2017년 2월 14일](https://img.pdfslide.net/doc/110x75/5f3fdcb4c732f476262f577a/a-eeeoeoe-2017-02-10-44-oe24oe-oeeeeeoeoe-a-eeeoeoe.jpg)


![Ⅵ 논문발표 - KCSkcs.cosar.or.kr/2017/download/program/WP1.pdf · 2017-02-10 · 104 제24회 한국반도체학술대회 Ⅵ 논문발표 [WP1] Poster 2 2017년 2월 15일 (수),](https://img.pdfslide.net/doc/110x75/5f0469ba7e708231d40dd884/a-eeeoeoe-2017-02-10-104-oe24oe-oeeeeeoeoe-a-eeeoeoe.jpg)