Embed Size (px)
Citation preview

CRAB and MIT
Chart ProjectOF THE LOWER CHARLES RIVER
Carl Zimba Micheal Sacarny

Agenda
● Organizations and People
● Project Background and Scope
● Experimental Methods and Instrumentation
● Watersheet Level
● Uncertainty and Error
● Digital Depth Charts
● Future Work

Charles River Alliance of Boaters
● Mission is to encourage safe and accessible boating by the entire
community on the Lower Basin of the Charles.
● This includes power boaters, sailors, rowers, paddlers, and others,
working together to keep the Charles River a healthy resource for the
enjoyment of boaters and park users alike.
● A cornerstone of our effort is the development of better avenues of
communication between and among this diverse community of users.
● www.CharlesRiverAllianceofBoaters.org

MIT Sea Grant College Program
● Mission is to conduct and support research and develop technology to
enable scientific investigation into problems surrounding the health and
human use of the sea
● Education and outreach efforts disseminate the results of our research,
encourage the stewardship and the adoption of sustainable and useful
technologies, and support public policy and industry with information that
is relevant, evidence-based and scientifically sound.
● Wide variety of activity including the Autonomous Underwater Vehicles
(AUV) Lab, the Design Lab for naval architecture and systems, and the
MIT Sea Grant Marine Advisory Services group.
● SeaGrant.mit.edu

People
● Carl Zimba
Project Coordinator
Charles River Alliance of Boaters
● Michael Sacarny
Project and Survey Lead
Research Engineer, MIT Sea Grant College Program
● Madonna Yoder
Chart Development and Survey Crew
Student Intern, MIT Sea Grant College Program
● Ben Bray
Arc-GIS Website Development
Web Developer, MIT Sea Grant College Program
● Additional Survey Crew
● Katrina Alleyne, Hugh Dougherty, Bill Gallagher, Mark Landsberg, Paul
Robinette, Cam Sacarny, and Juliet Simpson
Funding
Individual
Donors

Boston - 1775
Pelham Map
Mount Vernon Collection

Boston 1630
The diagrams were prepared by The Muriel G. and Norman B. Leventhal Family Foundation;
Cartography by MapWorks, Herb Heidt and Eliza McClemen.
Published in Karl Haglund, Inventing the Charles River (Cambridge: MIT Press, 2003), 460-3.

Boston 1795
The diagrams were prepared by The Muriel G. and Norman B. Leventhal Family Foundation;
Cartography by MapWorks, Herb Heidt and Eliza McClemen.
Published in Karl Haglund, Inventing the Charles River (Cambridge: MIT Press, 2003), 460-3.

Boston 1852
The diagrams were prepared by The Muriel G. and Norman B. Leventhal Family Foundation;
Cartography by MapWorks, Herb Heidt and Eliza McClemen.
Published in Karl Haglund, Inventing the Charles River (Cambridge: MIT Press, 2003), 460-3.

Boston 1880
The diagrams were prepared by The Muriel G. and Norman B. Leventhal Family Foundation;
Cartography by MapWorks, Herb Heidt and Eliza McClemen.
Published in Karl Haglund, Inventing the Charles River (Cambridge: MIT Press, 2003), 460-3.

Boston 1916
The diagrams were prepared by The Muriel G. and Norman B. Leventhal Family Foundation;
Cartography by MapWorks, Herb Heidt and Eliza McClemen.
Published in Karl Haglund, Inventing the Charles River (Cambridge: MIT Press, 2003), 460-3.

Boston 1934
The diagrams were prepared by The Muriel G. and Norman B. Leventhal Family Foundation;
Cartography by MapWorks, Herb Heidt and Eliza McClemen.
Published in Karl Haglund, Inventing the Charles River (Cambridge: MIT Press, 2003), 460-3.
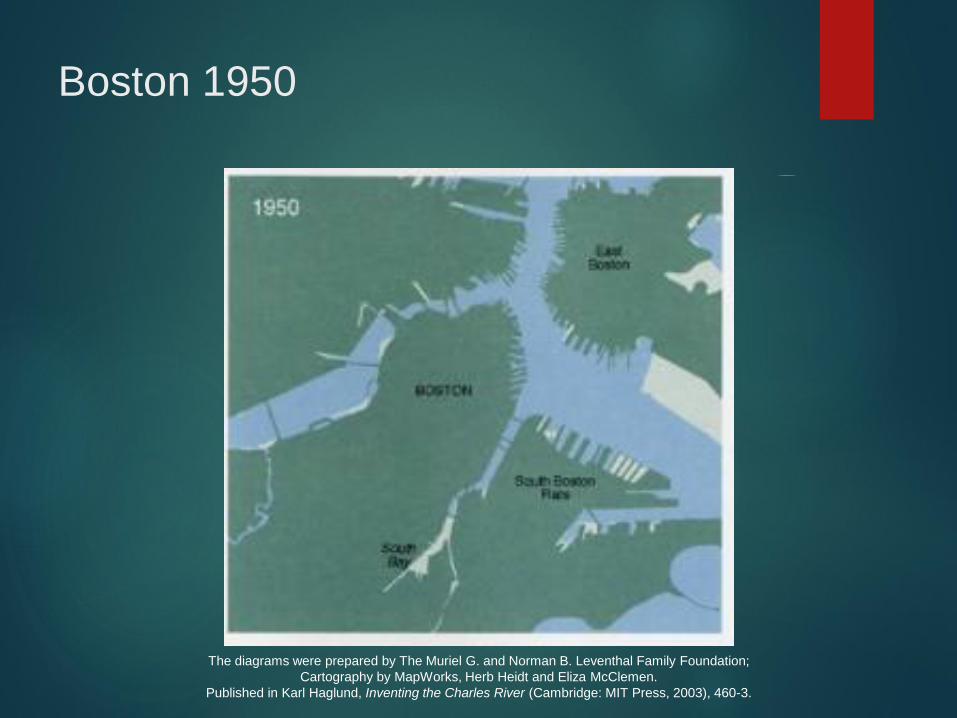
Boston 1950
The diagrams were prepared by The Muriel G. and Norman B. Leventhal Family Foundation;
Cartography by MapWorks, Herb Heidt and Eliza McClemen.
Published in Karl Haglund, Inventing the Charles River (Cambridge: MIT Press, 2003), 460-3.

Boston 1995
The diagrams were prepared by The Muriel G. and Norman B. Leventhal Family Foundation;
Cartography by MapWorks, Herb Heidt and Eliza McClemen.
Published in Karl Haglund, Inventing the Charles River (Cambridge: MIT Press, 2003), 460-3.

Back Bay Development

Timeline1630 Boston and Cambridge founded
1636 Harvard established
1662 Great Bridge
1786 Charles River Bridge
1793 West Boston Bridge
1821 Mill Dam and Cross Dam
1881 Cambridge Esplanade
1889 Weld Boat Club
1891 Harvard Bridge
1900 Newell Boathouse
1906 Weld Boathouse
1906 Longfellow Bridge
1909 Union Boat Club
1910 Charles River Dam
1910 Boston Embankment
1912 Riverside Boat Club
1934 Charles River Yacht Club
1935 MIT Sailing Pavilion
1935 Storrow Memorial Embankment
1941 Community Boating
1941 Watertown Yacht Club
1951 Storrow Drive and Esplanade expansion
1978 New Charles River Dam
2003 Zakim Bunker Hill Bridge

Long-standing Concerns
● Shallow areas affect recreational use of the river● Several recent incidents resulting in damage to boats
● Sediment is reducing the channel width and depth● Faneuil Brook sandbar – removed in January-April 2016
● Muddy River delta
● Areas near some docks are getting filled with sediment● Newton YC, Watertown YC, Community Rowing, BB&N Rowing
● Lots of anecdotal evidence
of problem areas
● Little quantitative data

CRAB and MIT Partnership
● Goal is to obtain high quality quantitative data
● Good enough to compare with future measurements
● Disclaimer : Not suitable as a navigational aid
● Depth data collection
● Using fish-finder sonar units and GPS
● Characterize the influence of daily water releases
● Use stream gauge data loggers over several months
● Correlate magnitude and temporal variations to USGS gauge
● Deliverables
● Web-based charts: Arc-GIS, Google Earth, Google Map
● Printed wall poster and chart booklet
● Chart data for navigational instruments

Depth Measurements
● Equipment● Lowrance HDS-7 chartplotter/fishfinder
● Lowrance HST-WSBL 200 kHz broadband sonar transducer
● Lowrance LSS-2 800 kHz sidescan sonar transducer
● Lowrance Point-1 GPS
● Onset HOBO U20L-4 Water Level (13 ft) Data Loggers
● Survey Tracks● Where the river was wide, survey lines were spaced between 30 and 65 feet
apart and drive at speeds between 3 and 4.8 knots
● Where the river was narrow, several passes were made up and down the
river over multiple weeks
● Broadband sonar was used in all surveys to measure depth
● Sidescan sonar was used downriver of the BU Bridge to image the river
bottom

Sonar/GPS mounting

Sonar/GPS mounting

Crew

Crew

Chartplotter underway

Depth spot checks

Hobo water level loggers

ReefMaster

ReefMaster: Tracklines

ReefMaster: Sonar

ReefMaster: Raw chart

ReefMaster: Side scan mosaic


ArcMAP component layers

Old and new

Old and new

Data Measurements
● Depth using sonar fish-finders
● Position and time using GPS
● Height of water sheet using stream gauge data loggers
● Apply a correction to sonar depth data
● Zero depth = 107.5 ft @ USGS First St gauge

Stream Gauge Data Loggers
Community Rowing
Herter Park
Riverside Boat Club
USGS Gauge

Gauge Heights and Rainfall
Rainfall : data from BWSC gauge in Allston
Water level : 5177 data points @ 15 minute intervals for each gauge

Differential Gauge Heights

Gauge Heights and Rainfall

Differential Gauge Heights

Uncertainty in Data
● Vertical Uncertainty
● Transducer : 2% on a hard bottom, 5% on soft bottom
● Water Sheet Height : < 0.05 foot
● Total Depth Uncertainty : ± 5%
● Depth is normalized to the height of the water sheet
● Zero depth = 107.5 ft @ USGS First St gauge
● Horizontal Uncertainty
● GPS Accuracy : ±3 meters
● Point-to-point precision is much lower
● GPS signal is degraded under bridge, especially the Zakim Bridge
● Difference between track path and width of track
● Data measured at 10 Hz, every 0.85 ft at 5 knots along the track path
● Depth perpendicular to the track (width) is extrapolated by the software
● Non-overlapping tracks
● Caution with over-extrapolating the width
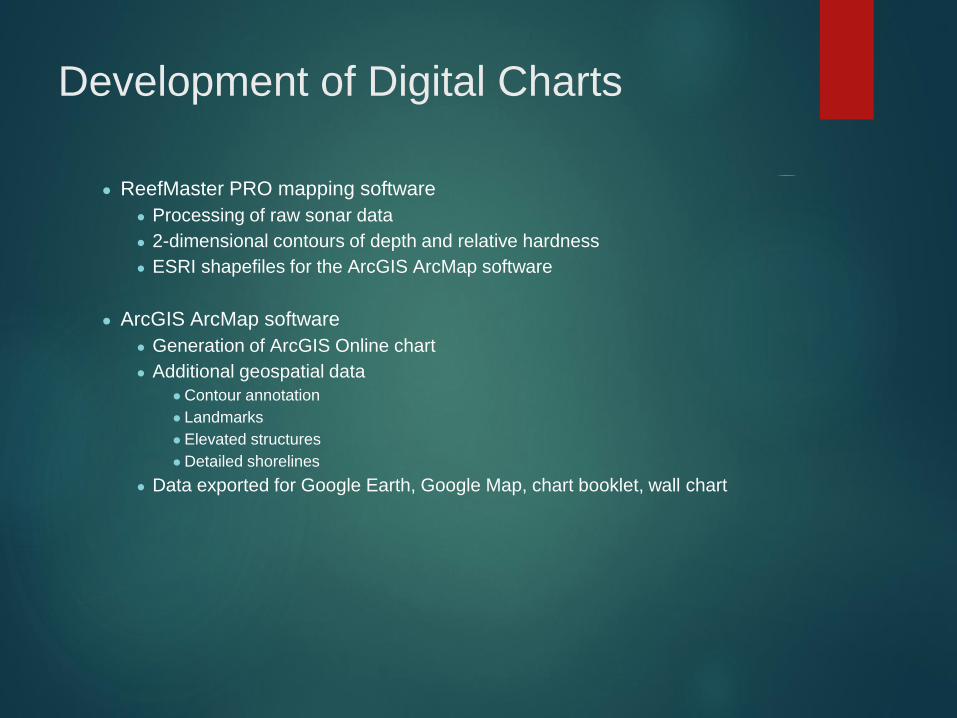
Development of Digital Charts
● ReefMaster PRO mapping software
● Processing of raw sonar data
● 2-dimensional contours of depth and relative hardness
● ESRI shapefiles for the ArcGIS ArcMap software
● ArcGIS ArcMap software
● Generation of ArcGIS Online chart
● Additional geospatial data
● Contour annotation
● Landmarks
● Elevated structures
● Detailed shorelines
● Data exported for Google Earth, Google Map, chart booklet, wall chart

Digital Charts
Several formats have been developed by MIT and CRAB.
All are available to the public via CRAB website.
● Web-based● Arc-GIS, hosted by MIT
● Google Earth
● Google Map
● Printed● Wall Poster
● Chart Booklet
● Data for navigational instruments● kmz file that can be converted by user

Exploration of on-line chart and mosaic
• Arc_GIS Online charthttp://seagrant.mit.edu/charleschart/

Historical Perspective
● Detailed depth charts of Charles River Basin
● Watertown dam to Boston Harbor
● 1902 Committee on the Charles River Dam
● 2000 US Geological Survey
● More recent surveys have been done in selected areas
● Camp, Dresser & McKee, 1976, BU Bridge to Science Park
● MDC / Cortell Associates, 1997, 20 transits at various locations between
Newton YC and Science Park
● Mirant-Kendall Station Outfall, 2010 ?
● MIT Pierce Boathouse, 2013
● Bridge Rehabilitation – Longfellow, River St, Western Ave, Anderson, 2011
● North Point Park area by Charles River Conservancy, 2016
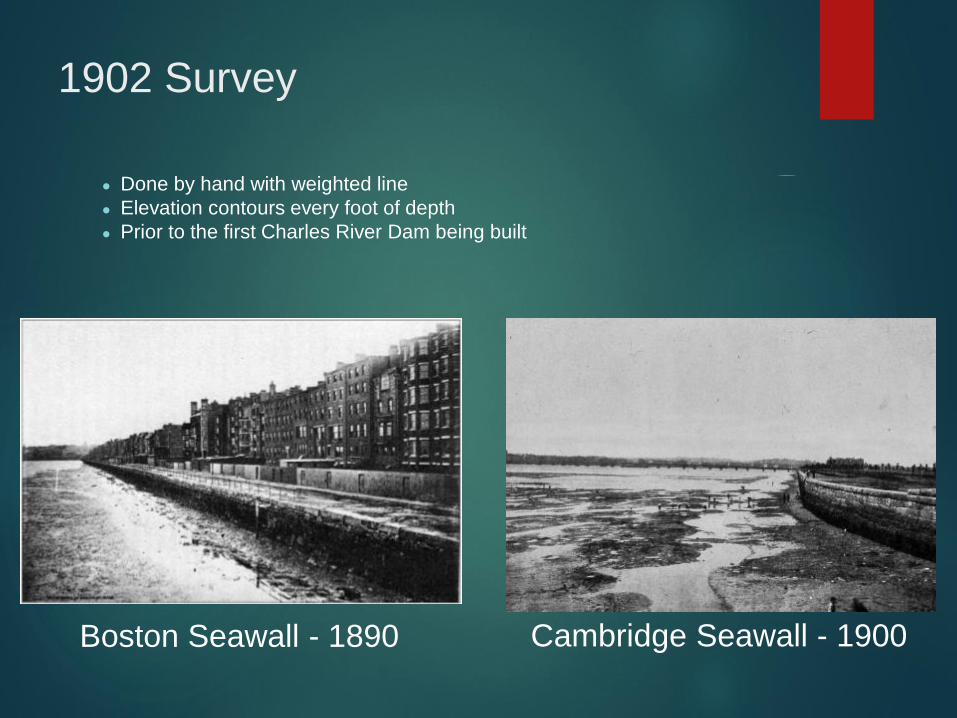
1902 Survey
● Done by hand with weighted line
● Elevation contours every foot of depth
● Prior to the first Charles River Dam being built
Boston Seawall - 1890 Cambridge Seawall - 1900

1902 Chart

2000 USGS Survey
● Hydrographic survey done as part of larger studies● Spatial distribution, temporal variability, and chemistry of the salt wedge in
the lower Charles River, USGS Report 00-4124
● Distribution and potential for adverse biological effects of inorganic elements
and organic compounds in bottom sediment, lower Charles River, USGS
Report 00-4180
● Streamflow, water quality, and contaminant loads in the lower Charles River
watershed, USGS Report 02-4137
● Potential Effects of Structural Controls and Street Sweeping on Stormwater
Loads to the Lower Charles River, USGS Report 02-4220
● Charts were published with limited depth contours ● 8000 data points - 75 times less than the 2016-17 survey
● Contours either every 2 meters or every 5 feet of depth
● Limited spatial resolution and detail about underwater features

2000 USGS Chart

Muddy River / Stony Brook Delta

Muddy River / Stony Brook Delta
CRAB-MIT 2017
Major contour lines every 3 feet of depth
Minor contour lines every foot of depth
USGS 2000
Contour line every 5 feet of depth
Shaded areas = 1-2 feet sediment thickness

Muddy River / Stony Brook Delta
CRAB-MIT 2017
Major contour lines every 3 feet of depth
Minor contour lines every foot of depth
MDC / EPA 1976
Contour line every 5 feet of elevation

Sunset Bay, Watertown
● Lots of space for open water mooring field in 1940s
● Anecdotal recollections suggest that there was 6-10 feet of water depth

Watertown YC
Newton YCCommunity
RowingNonantum
Boat Ramp
Committee on the Charles River Dam, 1902
Major contour lines every 5 feet of depth
Minor contour lines every foot of depth
CRAB-MIT 2017
Major contour lines every 3 feet of depth
Minor contour lines every foot of depth
3
24 5
6

Watertown YC
Newton YCCommunity
RowingNonantum
Boat Ramp
USGS 2000
Contour line every 5 feet of depth
Shaded areas = 1-2 feet sediment thickness
CRAB-MIT 2017
Major contour lines every 3 feet of depth
Minor contour lines every foot of depth
3
24 5
6

Sedimentation Rate
● Madonna Yoder Senior Thesis, 2017
● Lower basin area between Science Park and BU Bridge
● 5-10 mm per year
● 1.8 – 3.5 feet since 1908
● Undoubtedly, sedimentation rate is different in other areas

What’s Next ?
● Comparison to historical surveys underway
● More detailed measurements near bridges
● Develop better understanding of bottom hardness data
● Sedimentation rate in other areas of the river
● Can we determine sediment thickness ?
● Monitor changes in future
● www.CharlesRiverAllianceofBoaters.org/chart.html
● seagrant.mit.edu/charleschart

Funding
Individual
Donors

Boston - Today

Boston - Today

USGS Gauge Height and Discharge

Gauge Height Noise Histogram
2 = 0.029 0.036 0.031 0.038 0.041 0.047