Embed Size (px)
Citation preview

Price $1.50
CRACK PROPAGATION IN LOW-CYCLE
FATIGUE OF MILD STEEL
BY
S. T. ROLFE AND W. H. MUNSE
SHIP STRUCTURE COMMITTEE
For sale by the U.S. Department of” Commerce, O~ce ‘of Technical Services,
Washington 25, D. C.
--

..
MEMBER ACENCIESt
SHIP STRUCTURE COMMI17EE
BURIAU or SHIPS. Qcw. or MAW
MILITARY SEA TRANSPORTATION SERVICE, DIPT. OF NAW
u~lTKB ‘8TATE9 COAST ~UARO. TREA~URY DCH.
MARITIME ADMINISTRATION. DEPT. OF COUMtRC-
AWtRICAN BUREAU OF 6HIP?IN0
ADDRESS CORRESPONDENCEYW,
$ECRETARY
SHIP 8TRUCTUnC cOMMlW8-
U. s. COAmT MUAUD WADOUARTCRO
WAOHIM9TQN am. D. C.
1 May 1963
Dear Sir:
Structural experience both with ships and other structureshas ~ndlcated that fatigue-type failures, particularly 10W-cyCk fa-tigue, are an important structural problem. In order to evaluate theinfluence of a few load cycles at high-stress levels upon the me-chanical properties of ship steels, a project on “Low-Cycle Fatigue”was initiated at the University of Illinois . Herewith is a copy ofthe second progress report, SSC-143, Crack Propagation in Low-Cycle Fatigue of Mild Steel by S . T . Rolfe and W. H. Munse .
This project is being conducted under the advisory guidanceof the Committee on Ship Structural Design of the National Academyof Sciences–National Research Council.
Comments concerning this report are solicited.
Yours sincerely,
T~J. FabikRear Admiral, U.S , Coast GuardChairman, Ship Structure
Committee
.—

Serial No. SSC-143
Second Progress Repoflof
Project SR-149
to the
SHIP STRUCTURE COMMITTEE
on
CRACK PROPAGATION IN LOW-CYCLE FATIGUE
OF MILD STEEL
by
S . T. Rolfe and W. H. Munse
University of IllinoisUrbana, Illinois
under
Department of the NavyBureau of Ships Contract NObs-77008
BuShips Index No. NS-731 -034
transmitted through
Committee on Ship Structural DesignDivision of Engineering and Industrial Research
National Academy of Sciences-National Re search Council
under
Department of the NavyBureau of Ships Contract NObs-84321Index No. S-R 009 03 01, Task 2004
Washington, D. C .U. S . Depafiment of Commerce, Office of Technical Services
1 May 1963

ABSTRACT
The investigation reported is concerned
cycle fatigue of mild-steel plate specimens and
with crack propagation in low-
has indicated that during crack
propagation the type of loading cycle will affect markedly the fatigue behavior.
Several types of reversed loading cycles have been included in the in-
ve stigation, namely constant load, reduced loads and constant stre!ss. In the
constant-load tests the stress increases throughout the test as the crack propa-
gates, and the rate of crack propagation continuously increases. If the load
range is reduced throughout a test (reduced-load test) so as to produce constant
net- section stresses, the rate of crack growth will decrease throughout the te ST.
In the constant-stress tests the stress range was maintained constant during
the test. In this latter use, the rate of fatigue crack propagation remained con-
stant after a short initial period.
Constant-stress tests were conducted at stress levels ranging from ~ 27
ksi to ~ 36 ksi, on 3/4-in. thick specimens with widths of 5 in. and 7 in., at
test temperatures of 78 F and -40 F and for both unaged and aged specimens.
It was found that the fatigue crack propagation behavior during a con-
stant- stress test may be divided into an initial, linear, and final stage. A hy -
pothe sis
describe
relating the rate of crack gro-wth and the stress has been developed to
the behavior during the various stages of propagation.
CONTENTS
Introduction . . . . . . . . . . . . . . . . . . . . . . . . . . . . . . .~.**cD-
Fatigue Crack Propagation Revi@w . . . . . . . . . . . . . . . . . . . . . . .
ption
Object and Scope . . . . . . . . . . . . . . . . . . . . . . . . . .Nomenclature . . . . . . . . . . . . . . . . . . . . . . . . . . . .
of Experimental Investigation . . . . . . . . . . . . . . . . . .
Description Of Specimens . . . . . . . . . . . . . . . . . . . .Test Equipment . . . . . . . . . . . . . - . . . . . . . . . ...=Test Procedure . . . . . . . . . . . . . . . . . . . . . . . . . . .
Measure merits During Tests. . . . . . . . . . . . . . . . . . . . . . . . . . .
Crack Length . . . . . . . . . . . . . . . . . . . . . . . . . . . . .Strain Gage Measurements . . . . . . . . . . . . . . . . . . . .Photoelastic Strain Measurements . . . . . . . . . . . . . . .
Discus sionand Analysis of Tests . . . . . . . . . . . . . . . . ...= . . .
Effect of Type of Loading on Fatigue Behavior . ● ● ● . . ●
Constant- Load Tests . . . . . . . . . . . . . . . . . . . . . . . .Reduced- Load Tests . . . . . . . . . . . . . . . . . . . . . . . .Constant- Stress Tests . . . . . . . . . . . . . . . . . . . . . . .Significance of Type of Loading . . . . . . . . . . . . . . . . .Rate, of Fatigue Crack Propagation . . . . . . . . . . . . . . .Effect of Temperature and Aging . . . . . . . . . . . . . . . . .
Summary and Conclusions. . . . . . . . . . . . . . . . . . . . . . . . . . . .
Summary. . . . . . . . . . . . . . . . . . . . . . . . . . . . . . . .Conclusions . . . . . . . . . . . . . . . . . . . . . .’.......
References
Appendix A
Appendix
Appendix
. . . .
Study
● ☛☛✎✎✎✎✎✎ ✎ ✎ ✎ ✎ ✎
of Compressive LoadSpecimen . . . . . . .
. ...*.*. ● ✎✎✎☛☛☛☛ ✎✎✝☛
Carried by Partially Cracked● ☛✎✎✎✎✎✎✎ ✎☛ ✎ ✎ ✎✎✎☛☛ ●
.
EsE1
2
55
5
577
10
101012
13
13131416171832
34
3435
37
Correlation of Existing Theories with Initial Stage ofCrack Propagation . . . . . . . . . . . . . . . . . . . .
c:Strain Distributions . . . . . . . . . . . . . . . . . . . . . . .
.
.
45
48

NATIONAL ACADEMY OF SCIENCES ‘NATIONAL RESEARCH COUNCIL
Division of Engineering & Industrial Research
SR- 149 PROJECT ADVISORY COMMITTEE
“ Low-Cycle Fatigue”
for the
COMMITTEE ON SHIP STRUCTURAL DESIGN
~hairrnan:
J. M. FrarklandConsultant, Mechanics DivisionNational Bureau of Standards
Members:
J. A. BennettChief, Mechanical MetallurgyNational Bureau of Standards
B. J. LazanHead, Department of Aeronautical and
Mechanical EngineeringUniversity of Minnesota
J. D. LubahnDirector, Materials Research I,aboratoryColorado School of Mines
Dana YoungTechnical Vice PresidentSouthwest Research Institute
Liaison:
John Va staBureau of Ships, Dept. of the Navy

Low-cycle Fatigue——
The rnaj or objective in
INTRODUCTION
many fatigue investigations has been to deter-
mine the fatigue limits and corresponding S-N curves for members constructed
of various materials for very long service life. Recentlyj however, there has
been an increase in interest in the fatigue behavior of structures at high stress
levels and low numbers of cycles of lo~ding, usually referred to as low-cycle
fatigue. Although no clear distinction exists between low-cycle and long-life
fatigue, the upper limit of low-cycle fatigue is usually considered to be 104
to 105 cycles.
To better study fatigue behavior, and particularly low-cycle fatigue, it
is desirable to divide the total fatigue life of a member into an initiation stage
and a propagation stage.
likely to be influenced by
crack propagation is more
This is done because fatigue-crack initiation is more
the conditions near the point of origin while fatigue-
likely to be affected by the conditions throughout
the entire cross section that the crack traverses, 1 Various theories which at-
tempt to explain the mechanism of fatigue-crack initiation have been developed.
Since the investigation reported herein was concerned primarily with fatigue-
crack propagation, theories of fatigue initiation are not discussed in this re-
port but may be found in many other references. 2‘9 As may be noted in the
literature, the division between initiation and propagation usually depends
upon the type of observation used in the investigation, i. e. , phenomenological
or microscopic. In this and most other studies of fatigue-crack propagation, a
phenomenological observation, the occurrence of a visual surface crack, has
been employed to establish the beginning of the propagation stage.
The study of fatigue-crack propagation is important since it is the propa-
gation of a crack which ultimately leads to failure of a member by fatigue. It
has been suggested that in certain types of structures, a fatigue crack may
grow to some “critical” length and then lead to a sudden catastrophic brittle
fracture. 10 For other structures a knowledge of the rate of crack growth may
be important in establishing inspection procedures to protect against failure.

‘L”
These and other factors make a knowledge of
gation an important part of our understanding
the process of fatigue-crack propa -
of fatigue.
FATIGUE CRACK PROPAGATION REVIEW
In 1936, De Forestl 1 noted that fatigue re suits were usually somewhat
ambiguous because there was no distinction between the number of cycles re-
quired to initiate fatigue cracks and the number of cycles required to propagate
the cracks to failure. He stated that in addition to determining the maximum
stress level at which a fatigue crack would not propagate, it was also neces-—
sary to determine the rate at wh; ch a given crack would propagate. He con–
ducted rotating-beam tests of Jew-carbon steel specimens and found the rate
of crack propagation to increase markedly with the applied stress level. In
addition, he found that the stress level and number of cycles of load required
to initiate a crack were largely determined by the surface condition of the speci-
men while the resistance to crack growth was independent of the initial surface.
Wilson~ 2 tested 12-in. -wide steel plates with a 2-7/8-in. central saw
cut as a stress-raiser and found that the rate of crack propagation remained
constant for fatigue cracks of lengths up to O. 6-in. Strain aging was found to
decrease the rate of crack propagation but changing the test temperature within
the range of 120 F to -40 F appeared to have no effect on the rate of crack growth.
It should be noted, however, that a relatively low- stress level was used (~ 16
ksi) and that the rates were determined for fairly short fatigue-crack lengths
(0.6-in.).
Head 13’14 considered the fatigue mechanism to consist of a cycle-
dependent work-hardening which occurs at the tip of a crack. He postulated
that, when the region ahead of the crack has work-hardened to the true fracture
strength of the material, the crack propagates through this region and the proc-
ess is repeated. Then, for any given set of conditions he concluded that the3/2
rate of crack growth is a function of the crack length (dL/dN = k? ).
McClintockl b conducted
growth in bars subjected to fully
theoretical and experimental studies of crack
plastic cycles of torsion. The strain distri-

-3-
bution was computed theoretically for this type of specimen using a sand-hill
analogy. The material was assumed to be” fully plastic, nonwork-hardening and
to have a negligible Bauschinger effect. Experimental results were in good
agree ment with the the oretica 1 predictions.
Hultl ‘ derived an expression for the redistribution of stress and strain
in front of a growing crack in a twisted bar. The results of this analysis were
used in connection with a simple fracture criterion, based on the maximum shear
strain, to determine the initial rate of growth of a fatigue crack.
Fatigue tests of thin plate specimens of 24S-T3 aluminum alloy were
conducted by Martin and Sinclair. 17 They suggest that the fatigue mechanism
may be considered to consist of three parts, namely, (a) crack nucleation or
initiation, (b) crack propagation by fatigue, and (c) crack propagation by creep.
They conclude that it is not possible to describe crack growth in terms of the
theoretical stress at the tip of the crack since the crack length affects the rate
of growth.~iul 8 conducted constant load tests on 4-in. wide 2024-T3 aluminum
alloy sheet specimens and developed an expression for rate of crack growth for
a semi–infinite sheet in terms of the crack length and a stress dependent propa-
gation factor, C. His expression, d+/dN = Cl, gave consistent results for the
major portion of the life of the specimens. However, the expression was valid
only for crack lengths which varied from about O. 07-in. to about O. 16-in. AS
the crack grew beyond a length of O. 16-in. it was necessary to modify the ex-
pre ssion to predict the total fatigue life of the specimens because of the change
in nominal stress.
Frost and Dugdalel” 20 concluded from theoretical considerations that
the strain distribution around a small internal slit in wide plates remains geo-
metrically similar as the slit grows. This conclusion was verified using the
re suits of fatigue tests on mild steel plates. It was found that the rate of crack
propagation was proportional to crack length, i. e., dl/dN = kl. However, this
relationship was valid for only crack lengths less than 1/8 the width of the plate.
A method for determining the rate of fatigue-crack propagation in sheet
specimens of 2024-T3 and 7075-T6 aluminum alloys has been developed by

-4-
McEvily and Illg. 21’23 Semi-empirical expressions using Kn 0 (theoretical
stress-concentration factor modified for size effect times the stress based on
the remaining cross-sectional area) were developed and verified experimentally
for stress ratios of R = O and R = -1. The effective stress concentration factor,
K is Neuber’ S24 stress concentration factor modified for the effect of finiten’
plate width as determined by Howland. 25 Sheet specimens with a central stress
raiser were tested and values of dL/dN vs. Kn 0 were used to determine the
empirical relationship:
log d%/dN =
where d4/dN =
Kn =
u’
(r=end
rate of crack growth
con stants
effective stress concentration factor
stress based on the remaining or instantaneouscross sectional area
fatigue limit (or stress at 108 cycles).
Weibull 26’29 tested aluminum sheets under conditions of constant
tensile stress based on the remaining area and found that the rate of crack
growth was independent of the crack length after an initial transition period. A
relationship between stress amplitude and growth rate was developed and may
be expressed in the following form:
where k and n = constants
00 = lower limit of the applied stress below which acrack did not propagate.
Massonnet and his associates30 studied the rate of propagation under
conditions of constant load and also constant stress based on the remaining
area for specimens subjected to repeated bending. They concluded that the gen-
eral relationship developed by Weibull for axial load on aluminum specimens
was valid also for mild steel specimens subjected to bending.

-5-
QmQ ’22EQE!sThe purpose of the investigation reported herein was to study the parame -
ters affecting fatigue crack propagation at high stress levels and to develop a
basic expression for fatigue crack growth. Flat plates were te steal to study the
manner in which various parameters such as type of loading cycle, temperature,
geometry, and aging affect the rate of fatigue-crack growth. In addition, the
re suits of the tests were correlated with existing theories of fatigue crack growth.
Nomenclature
& = crack length measured from center-line of specimen (initial crack length
plus fatigue crack), in.
LO = initial crack length, radius of initial central hole plus saw cut, in.
N = number of cycles of loading
dL/dN = rate of fatigue crack propagation, in. /cycle
a = constant
K = crack growth parameter
W = width of plate specimen, in.
NL = number of cycles of loading required to propagate a fatigue crack a
given distance L.
(T = stress = applied load divided by the remaining or instantaneous net cross-
sectional area.
“Average” maximum strain ( Measured) = strain ~ ahead of the crack tip meas -
ured with strain gages.
DESCRIPTION OF EXPERIMENTAL INVESTIGATION
Description of Specimens—
The specimens used to study crack propagation were 3/4-in. -thick by
4- ft- long flat plates with either a 5-in. or 7-in. width and initial central notches
of various lengths, as may be seen in Fig. 1. These notches served to reduce
the time of crack initiation, to minimize the effect of prior stress history on
crack propagation, and to predetermine the position of the fatigue crack for ea se
of crack-growth measurement.

L
>-0
Ezw
3/4”
o
0
0
0
00
00
00
0
:
,-
SEE NOTCHDETAIL
‘g \+
i
IW =5” OR 7“
o 0
000
000
000
/
-6-
“’6’’%’’/’’’6”
l-t
U,, JEWELER,S
uSAW CUT(0.007”);,8,,
“8+%3”1’
pl\ JEWELER’S
1-‘ SAW CUT+
3/4” (0.007”)
\.
,, ,, ,, ,, ,,1/84 , 518 !.1/2 & , I/a
———12”
0.) TEST SPECIMEN
+=W.I I
1 ‘HACKSAW BLADE ::%:;:’(~o.034”)
J (0.007”)
2’4
b.) NOTCH DETAILS
60
50 – —6
@@
o
20- --
-*- ‘ ? . . . . .... . . ., ._ . . . . _
o
FIG. 1.NOTCH
SPECIMEN ANDDETAILS
FIG. 2. RESULTS OF CHARPYV-NOTCH IMpACT ‘-H--L. Lb”l-s
-40 -20 0 20 40 60 80
TEMPERATURE, DEG. F.

-7-
All of the fatigue cracks initiated from a . 007-in. -wide jeweler’s saw cut which
was used to produce a sharp initiating notch. The two widths investigated (5-in.
and 7-in. ) were chosen to study propagation over as great a distance as possi-
ble and still be within the load capacity of the available fatigue testing machines.
The specimens were polished in the longitudinal direction to facilitate the ob-
servations and measurements of cracks. Although this surface treatment may
affect slightly the initiation of the fatigue cracks, it would have little or no ef-
fect on the crack propagation. 1,11
The material used in these tests was an ABS-C as-rolled ship steel.
The lower yield point of the material was 39.4 ksi and the ultimate strength was
70.6 ksi. These properties are typical of mild steel and are presented in Table 1
along with the other mechanical properties of the material. The 15-ft- lb Charpy
V-notch temperature was about O‘F as may be seen in Fig. 2. The axial fatigue
limit for polished plain plate specimens was approximately ~ 27 ksi.
Test Equipment
All fatigue tests were conducted in the 200, 000-lb capacity University
of Illinois lever-type fatigue testing machines. A detailed description of the
operation of the machines may be found elsewhere.31
Throughout the investigation the alignment of the machines was care-
fully controlled and the bending strains were found to be less than 10 per cent
of the axial strains. These strains corresponded to an eccentricity of less than
.03-in. Considering the size of the specimens and testing machines, this was
considered to be a relatively small amount of bending. As pointed out later in
the discus sion, this slight eccentricity of the load had little effect on the test
results.
Test Procedure
Three types of repeated load cycles were studied in this investigation,
namely, constant load, reduced load, and constant stress. Two types were
basically complete reversal of load with the mean load equal to zero
was essentially complete reversal of stress.
In the constant-load tests the tensile and compressive loads
and one
were kept

-8-
TABLE 1
SUMMARY OF MATERIAL PROPERTIES
(A) Tensile Test Data (Standard ASTM 0.505-in. Diameter)’*
Temperature Lower Upper Ultimate Elongation Reduction Fracturedeg. F Yield Yield Strength in 2-in. of Area Stress
Stress Stress(ksi) (ksi) (ksi) ‘% ‘% (ksi)
78 39.4 41.6 70.6 35.2 60.0 133.8
-40 43.5 46.1 76.0 35.0 60.0 146.6
Acred Specimens (90 min. at +1 50° C)
78 40.1 43.3 70.6 33.5 61.6 140.2
-40 44.6 47.9 80.9 34.5 62.4 162.7
*(A1l specimens parallel to direction of rolling each value average oftwo tests. )
(B) Chemical (Check) Analysis - Percent
c Mn P s Si Cu Cr Ni Al
0.24 0.69 0.022 0.030 0.20 0.22 0.08 0.15 0.034

-9-
constant throughout the entire test.
In the reduced-load tests, both the tensile and compressive loads were
decreased periodically throughout the test to maintain ~ constant stress on the
remaining cross- sectional area during the test.
IrI the constant stress tests the maximum tensile stress was based on
the remaining cross- sectional area while the maximum compressive stress was
based on the original net cross-sectional area. Therefore the maximum tensile
load was decreased periodically throughout the test but the maximum cornpres -
sive load was maintained.
The procedure for conducting the constant stress tests was as follows.
Initially the maximum tensile and compressive stresses were based on the
original net area (gross area minus the area of the initial hole and sawed notch).
As the fatigue crack propagated, the surface crack length was measured, the
remaining untracked area was determined, and the tensile load was changed to
rrmintain a constant tensile stress on the remaining area. The frequent y with
which the crack length was measured and the load adjusted was such that the
maximum change or adjustment in tensile stress was never greater than 2.0 ksi.
During the compressive load cycle, the fatigue crack closes fully and
the cracked portion of the specimen continues to carry load. Verification of the
fact that the cracked portion does carry compressive load is presented in Ap-
pendix A. Therefore the maximum compressive load (and thus the maximum com-
press ive stress) was kept constant throughout the entire test.
All tests were conducted at room temperature (approximately 78 F) ex-
cept for four constant-stress low-temperature tests which were conducted at
-40 F. To cool the latter specimens, four special containers were placed ad-
jacent to the central notched region of the plates and dry ice was placed in the
containers in direct contact with the specimens. Thermocouples mounted on
the plate surface were used to record the surface temperatures in the vicinity
of the notch. Although the temperature of the specimen at the cooling contain-
ers was lower than -40 F, the temperature of the test section was maintained
between -40 F and -50 F by controlling the amount of dry ice in the containers.
This slight temperature variation was due to the cooling method used and was

-1o-
not considered great enough to affect the results of the crack-propagation studies.
MEASURE MENTS DURING TESTS
Crack Length
IrI all tests, the total crack length (initial drilled hole and saw cut plus
the fatigue crack) was measured from the cerrterline of the specimens. This
measurement was made on both surfaces and an average of the four measurements
was designated as the crack length (L) at any given number of cycles of loading
(N). During the tests a 10X microscope and a dye-penetrant were used to de-
termine the location of the tip of the crack. Using this procedure it was possi-
ble to measure the surface crack lengths to the nearest . 005-in.
In several tests radiographs were made at various surface crack lengths
to determine whether the surface crack measurements gave an accurate indicat-
ion of the remaining area. The re suits of the radiographic examinations indi-
cated that the fatigue cracks propagated with essentially a full-thickness front.
This fact is evident in the series of radiographs presented in Fig. 3 for a con-
stant-load test. Figure 3a shows the initial drilled hole and saw cuts. * The re-
maining radiographs then show the fatigue cracks propagating from the notches.
The apparent fanning-out of the crack in Fig. 3e indicates that as the crack
propagates the angle which the crack makes with the direction of loading changes.
However, even near the end of a test the interior crack front was not advancing
ahead of the surface crack. Therefore, the surface crack length measurements
do in fact give an accurate representation of the cracked area.
flrain Gage Measurements
Foil strain gages were mounted ahead of the expected fatigue crack lo-
cation on the plate surface of several specimens. Periodically during the fatigue
tests, as the fatigue cracks propagated, the machine was stopped to manually
load the specimen to different stress levels and to determine the strains. By
repeating this procedure at various crack lengths it was possible to obtain the
longitudinal strain gradient ahead of the crack at various stages of the test. A
photograph showing a typical strain gage layout is presented in Fig. 4b.

-11-
+,“
“0
!’!’””‘,
!’),,, ,,‘.“ !., ,’
. “’
,,e, , !!
,$ ,;> ;:;, ,, ,
q<
!,’!,,
,,
.,
,:;
% “‘‘% ,;,!,!
,$’
,, ,
,’,“
.,, ,,
., n
FIG. 3. RADIOGRAPHS OF CRACK GROWTH IN CONSTANT-LOAD TEST

-12-
FIG. 4. TYPICAL SPECIMEN AND EQUIPMENT FORSTRAIN DISTRIBUTION STUDIES
Photoela stic Strain Measurements
A photoelastic stress analysis technique ‘was used to determine the
over-all strain distribution ahead of the fatigue crack at various crack lengths
or at various stages of the test. As the load. is applied, the surface strains in
the specimen are transmitted to a plastic sheet bonded to the surface of the
specimen. Using a reflection polariscope, contours for various values of prin-
cipal strain difference (El - C2) can be seen directly in the transparent plastic
sheet. The se contours ( isochromatics) were photographed for later reproduction
and analysis. Figure 4a is a photograph showing a spec irnen in the fatigue test-
ing machine, the photoela stic test equipment and the camera used to record the
strain distribution at various crack lengths. Figure 4b is a close-up of the
transparent plastic sheet with a fatigue crack that has propagated about 1. 4-in.
A more detailed discussion of this photoelastic strain measuring technique may
be found elsewhere .32

-13-
DISCUSSION AND ANALYSIS OF TESTS
Effect of Type of Loading on Fatique Behavior
Prior to crack initiation, the stress distribution in a specimen is usually
well defined on the basis of the initial geometry. Once a crack initiates, how-
ever, the stress at the point of initiation and the stress distribution ahead of the
crack both change. Additional changes in the stress distribution ahead of the
crack tip occur during propagation and, at failure, the stress condition is quite
different than it was prior to initiation. Since fatigue crack propagation will be
affected by the stress distribution during the test, the type of repeated loading
used is very important in any study of crack propagation. This is especially
true when results of small-scale laboratory test specimens are used to predict
the behavior of actual structures.
Constant- Load Tests.—
In a constant-load fatigue test, the load is kept constant as the fatigue
crack grows thereby catising the maximum tensile stress to increase during the
test. However, since the fatigue crack closes during the compressive cycle,
the maximum compressive stress remains essentially constant throughout the
test. Thus, because the load range is kept constant, the maximum stress range
continuously increases throughout the test. As a consequence, the rate of crack
growth (d4/dN) increases also. This general behavior is shown schematically
in Fig. 5a.
In the constant-load tests the fatigue cracks initially propagated in a
direction perpendicular to the direction of applied loading. When, as a result
of the increase in crack length, the maximum tensile stress reached the yield
strength of the material, the mode of failure began to change. At that time the
surface of the crack at mid-thickness remained perpendicular to the applied
load but near the surface of the member, the crack gradually changed direction
arid shear lips developed. These shear lips continued to grow until the entire
fracture surface was oriented in a plane or planes making an angle of 450 with
the direction of applied load. After the cracks had reached this latter stage,
complete failure occurred within a very few additional cycles of loading ~ A

-14-
STRESS RANGE
a) CONSTANT LOAD TEST
‘+
b“
-E
N
N
STRESS RANGE
b) REDUCED LOAD TEST
CRACK GROWTH
i“’---1 N
CRACK GROWTH
FIG. 5. TYPES OFREPEATED LOADING
+=N j= -~NLOAD RANGE STRESS RANGE CRACK GROWTH
c) CONSTANT STRESS TEST
photograph of this type of fatigue crack propagations presented in Fig. 6a.
As maybe seen in the photograph, when the crack was about 7\8-in. long
(measured from the centerline) the mode of failure began to change. At this
point, the maximum tensile stress was 39.2 ksi, whereas the yield strengthof
this materialism 39.4 ksi. Thus the mode of fracture at any given location ap-
pears to be a function of the maximum stress on the member.
Reduced-Load Tests——
In these tests the initial maxfmum tensile and compressive stresses were
based on the original net area. As the fatigue crack propagated, both the tensile
and compressive loads were similarly decreased so that the maximum stresses,
based on the remaining untracked area, were maintained constant. Thus the
maximum tensile stress remains constant but, since the cracked portion continues

,,, ,’,’< *J*,,,.<—., . . . .,,,,-,,,. ,,,,.
k.< !’
.,, dti! ., ”’”’’..’ !Mk . ,,!,
-16-
to carry compressive load, the maximum compressive stress and the maximum
stress range decrease throughout the test. As a result of the decrease in stress
range, the rate of fatigue crack growth decreases also. This general type of
behavior is shown in Fig. 5b.
In the reduced-load tests, the direction of the fatigue cracks remained
perpendicular to the direction of the applied load throughout the tests, as may
be seen in Fig. 6b. Note the symmetry and the relatively blunt full-thickness
front of the fatigue crack. In this case the test was continued until the crack
was less than an inch away from the edges, at which time the specimen was
loaded statically to failure.
Constant-Stress Tests
In the constant stress tests the initial maximum tensile and compressive
stresses were based on the original net area, just as in the previous two types
of tests. To maintain the maximum tensile stress constant, the tensile load
was decreased periodically throughout the test. Since the cracked portion car-
ried compression, the maximum compressive load was maintained constant.
Thus, a constant maximum stress range was obtained by decreasing the tensile
load but keeping the compressive load constant. This general behavior may be
seen schematically in Fig. 5C.
In this type of test the rate of crack growth increased with increasing
crack length during a short initial period of the test and then remained e ssen-
tially constant. A study of this initial increase in rate of growth and the ex-
tens ive period of linear rate of crack growth constitutes a major portion of this
investigation.
As may be seen in Fig. 6C, the fatigue crack for this type of loading
was essentially the same as that observed in the reduced-load tests, and con-
sequently, the surface crack measurements give a good indication of the cracked
area even though a slight eccentricity in propagation can be observed. After
the crack had propagated acress the major portion of the specimen the fatigue
test was stopped and the specimen was J“oaded statically to failure.
-17-
—, .——
RC-I
i+- ““—–-__,- “
I ~-1i..~.. .
/ 3“-.
i’ +-l7 -IN. WIDE SPECIMEN
j_r =+33
ROOMTEMPERATURE I
0
7- IN. WIDE SPECIMEN
T= *33I
ROOM TEMPERATURE /I
~ --4----+
i
I
/“
IRC-13 1
—
-+
----4”-./”
~ ,“’
–4
/“—
//“
~-”
20 ——.
RC-3 /f
7’” i~1: .—— —.- .—
.
u T
. )“’=
xt- j’~ ~
%0z .-+--L.--+ ‘–wJ
/ 1
,/”
;
I
/ 7- IN. WIDE SFECIMENKu 05 L u=+ 33 I
IROOM TEMPERATURE
o 10 20 0 10 2 () o 10 20
N N, NUMBER OF CYCLES IN THOUSANDS N
o) CONSTANT LOAD TEST b) CONSTANT STRESS TEST c) REDUCED LOAD TEST
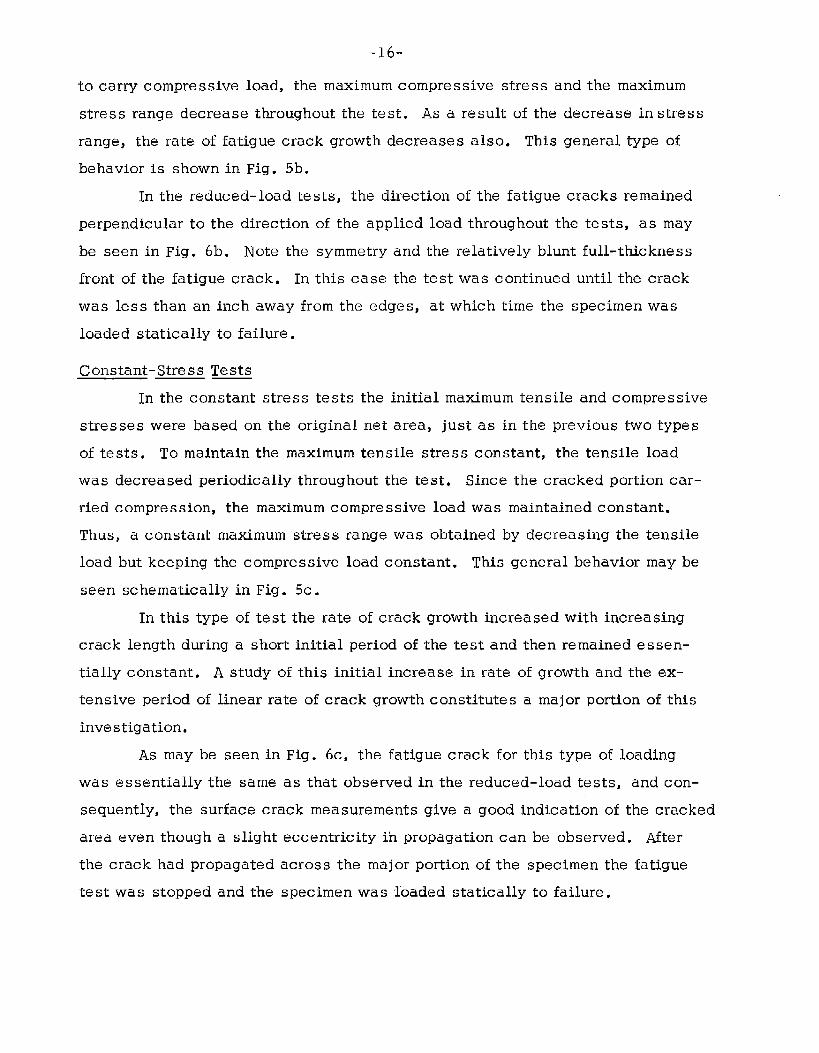
FIG. 7. FATIGUE CRACK PROPAGATION FOR THREE TYPES OF REPEATEDLOADING
The crack growth curves for the three types of specimens shown inFig. 6
are presented in Fig. 7 and indicate the actual behavior as portrayed by the
crack propagation data.
Significance g Type of Loading
One of the principal purposes of laboratory fatigue studies is to obtain
information to predict the behavior of actual structures. Most of these inve sti-
gations are conducted on fairly small specimens in which the stress distribution
ahead of a crack changes markedly as the crack propagates (constant-load tests).
However, in a structure, depending upon its size, a fatigue crack can generally
grow for some distance without significantly changing the over-all stress dis-
tribution in the structure. To approximate this condition in the laboratory speci-
mens, the studies of the constant-load tests must be limited to only very small
crack lengths (usually less than 1/8 the plate width). However, a closer ap-
proximation to the behavior of actual structures may be obtained with constant-
stress tests, since in these tests the over-all stress distribution ahead of the
crack is not markedly affected by the increase in crack length. Thus it would

-18-
appear that constant- stress tests more closely approximate the fatigue crack
propagation behavior of actual structures than do the other types of tests.
Ari important point that the different types of loading cycles bear out is
the significant effect that the tensile and compressive loadings have on the
propagation rate. This is demonstrated schematically in Fig. 5 where the crack-
growth curve is changed when the stress and loading are varied. The greatest
rate of crack propagation is obtained under the constant-load condition. If the
tensile load is decreased to provide the constant-stress condition, a reduced
propagation rate is obtained and, finally, if the compressive load is also de-
creased to provide the reduced load condition, a further reduction in crack growth
is obtained.
Rate of Fatigue Crack Propagation—.
W @ c- Growth: The study of various loading cycles sugge steal
that for constant- stress tests, the rate of fatigue crack growth (d4/dN) might be
proportional to the applied stress for the rnaj or portion of the life of a specimen.
Therefore it has been assumed that,
dl/dN = K U (1)
where dL/dN and 0 are defined as before and K is a coefficient that depends on
material, geometry and test temperature.
To verify this hypothesis, constant- stress tests were conducted at stress
levels ranging from ~ 27 ksi to ~ 36 ksi, on 3\4-in. thick specimens with widths
of 5-in. and 7-in. , at test temperatures of 78 F and -40 F and for both unaged
and aged specimens. A summary of the test conditions for all constant-stress
tests is presented in Table 2.
For all tests, crack-length measurements were made and curves of crack
length & vs. number of cycles of loading N were obtained. These general rela-
tionships between 4 and N may be separated into an initial, linear, and final
stage as shown schematically in Fig. 8.
The initial stage is a relatively short period in the total life of the speci-
men and is affected by the stress level, the number of cycles to crack initiation,
initial geometry and increasing stress field around the crack tip. However, this
is the period for which most expressions for fatigue crack growth have been de-

-19-
TABLE 2
SUMMARY OF CONSTANT-STRESS TEST RESULTS
Specimen Stress Width ‘:’ Test Initial Rate Linear RateNumber (ksi) (in. ) Temperature of Crack of Crack
deg. F Propagation~<* Fropagation~<’:C*
RC- 32
RC-33
RC-16
RC-31
RC-21
RC-30
RC-20
RC-27
RC-7
RC-35
RC-19
RC- 34
RC- 18
RC-29
RC-26
RC-28
(A) Unaged
A 36 5 7’8
~ 33 5 78
~ 30 7 78
+ 30 5 78—
~ 27 7 78
~ 27 5 78
~ 30 7 -40
~ 30 5 -40
0 to +33 7 78
(B) Aqed (90 min. at 150 C)
~ 33 5 78
~ 30~27) 7 78
~ 30 5 78
~ 27~30) 7 78
~27 5 78
~ 30 7 -40
~ 30 5 -40
205
83
28
32
13
12
12
8
11
85
19
27
9
13
10
12
600
230
95
77
40
29
25
21
15
237
54 (30)
50
25 (6o)
16
25
20
‘~<Total initial central crack length, 2 z.., = 3/8 in.
*’~<Measured at L = 0.20-in. (in./cycle x 106)
***Refers to linear stage of crack growth (in ./’cycle x 106 )

.20-
LI
N, NUMBEROF CYCLES OF LOADING
I./o“’’T’AL~TAGER ‘ “1
N
b) INITIAL STAGE OF CRACK GROWTHa) TYPICAL FATIGuE CRACK PROPAGATION CURVE
FIG. 8. STAGES OF CRACK GROWTH FOR CONSTANT-STRESS TESTS
veloped. During this period it is generally found that the rate of crack growth
is proportional to the crack length and may be expressed as,
dL/dN = k L (2)
where k is a constant.
Much of the previous work on fatigue crack propagation in plates has
been based on the assumption of constant stress in a semi-infinite plate. After
the crack has grown a small amount, this assumption is no longer valid for
finite plate widths. Consequently, Eq. 2 is valid only for relatively short crack
lengths.
In this investigation it has been found that the rate of crack growth in-
creases with increasing crack length during the initial stage of crack propaga-
tion, and that a constant relationship exists between log L and N, as is shown
in Fig. 8b. Thus, the results of this investigation agree with the re suits of
other investigations for very short crack lengths ( see Appendix B).
After the initial stage, a linear rate of crack growth was observed during
the major portion of the life
d~ _ constantdN
.
As the crack neared
specimens and edge effects
for all specimens, i. e.,
(3)
the edges of the specimens, eccentricity in the
began to affect the growth markedly. This latter

-21-
2.5,0 /c
:RC-25 ~/ Rc- 16 ,U
CONSTANT LOAD,,V
/ W=*3O
I {
‘ /<,,., = t 30 /
n uNAGED /$’
II I
,+
.0-+
/“”-----#- -V/---- --*-----
- –..-–..-–... -7-.
,-’+-/+F
RC-18u=t27
AGED
#’P/ -+. -+_+- 1~;eyg<-+-+ ~
I I
I ~ ROOM TEMPERATURE TESTS
Iw
o 10 20 30 40 50 60 70 80
N, NUMBER OF CYCLES IN THOUSANDS
FIG. 9. FATIGUE CRACK PROPAGATION FOR7-IN. -WIDE SPECIMENS
stage has been called the final stage. Once the linear rate of crack growth had
been determined over a sufficiently long crack length in any particular test, the
test was usually stopped.
Analysis of Linear Stage of Crack Growth: The rnaj or portion of this in-— ——
vestigatiori consisted of an analysis of the relationship between the rates of
fatigue crack growth in the linear stage and such parameters as stress level,
te rnperature, aging and geometry.
Curves of L vs. N for all tests are presented in Figs. 9-11. From these
figures, rates of crack propagation were determined by measuring the slope of
the curves at L = O. 20-in. (just after crack initiation) arid after a constant rate
of propagation had been reached. The linear rates of crack propagation and the
rates at L = O. 20-in. for all tests are presented in Table 2.
The linear stage crack growth data of Figs. 9, 10, and 11 have been
analyzed in terms of Eq. 1. For tests of specimens having the same width, test
te rnperature arid aging, a definite linear relationship exists between log (dL/dN)
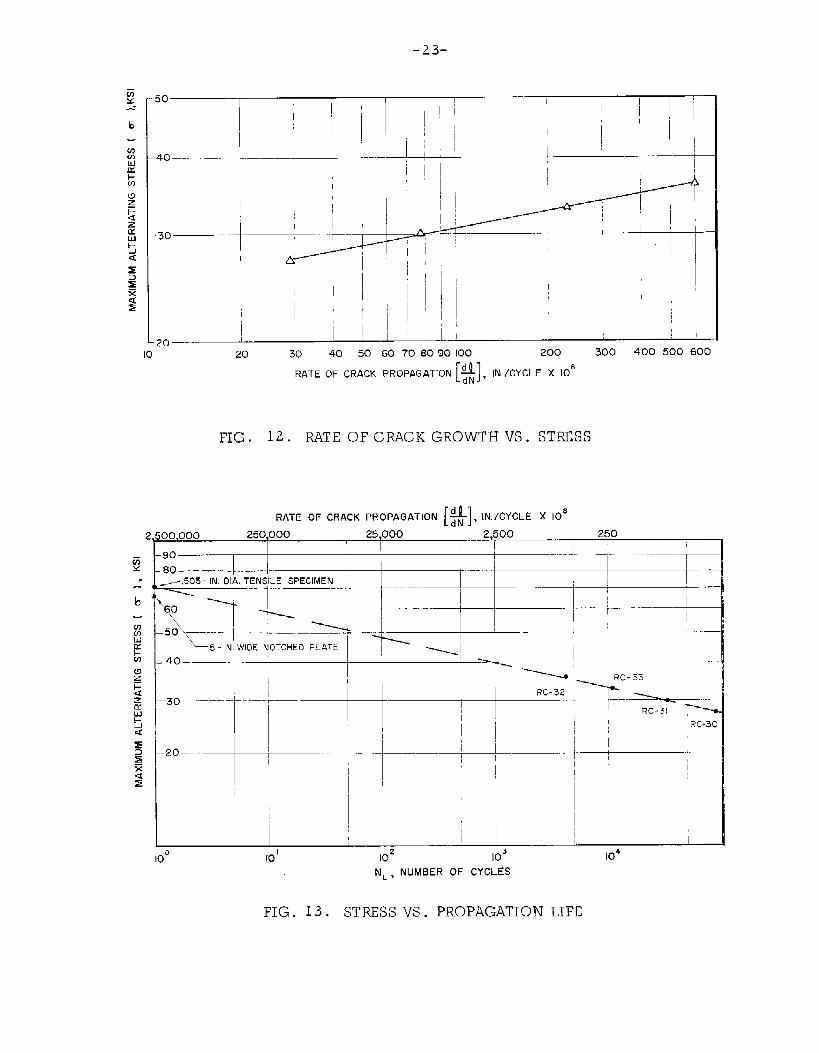
and log U as shown in Fig. 12. The general equation of this relationship is:
log :: = log K+alog U (4)

1,25
.25
0
RC-33C= *33
RC- 32
11
u=*z7
I /
R OOM TEMPERATuRE TESTS
5 10 15 20 25 30 35 40
., .,, ,..RF- a- n“-, F- ,., -, la, i-. ., F.-PJq IUUMBLK Ur LTLLL> 111 lnUU>HIVUS
FIG. 10. FATIGUE CRACK PROPAGATION FOR5-IN. -W1DE SPECIMENS
RC- 20
I 1 uNAGED
I~= ~,,
100
-.75 ---- -’ --—-- I --–--—~r
50.. . , –..-
<=*3O
RC-26
AGED~= ~~~
.-
--A--
FOR ALL
L+—–—-,““”+-”””
,.-—4-~~--TEsTS
1 I70 Em
I I I I10 2C 30 4-0 50 m
1 I
N, NUMBER OF CYCLES IN THOUSANDS
FIG. 11. FATIGUE CRACK PROPAGATION AT -40 DEG. F ,
-23-
40 ---- --—-1
I
I
~,I
,’
--- -—”””” “~,.,
1~
I,,,’ II ,,
II
~ \ I20
I
10 20 30 40 m
RATE OF CRACK
60 70 8090100 200 300 400 500 600
PROPAGATION [+-], lN./d
CYCLE X 106
FIG. 12. RATE OF CRACK GROWTH VS. STRESS
RATE OF CRACK PROPAGATION [#, lN. /CYCLE X 106
30,000 250,000 25,000 2,500 250I I I
90—..’. I I
80--- ------ - ---- --I---
-,505- IN. DIA. TENSILE SPECIMEN
~“-”- -1““”- “——”-”-
‘f-=a ‘ ,I
50 ~------- I 1--—--—-—-~=5 - IN, WIDE NOTCHED PLATE
40–—
30- -------
20--- --—
-l---—
I
I
1“”””””-----””~““- 1 ! i “-”_.._ , . . . .I
—- 1. . . . . L.—.
I
..-...:1.. Ip
>~ I
~I
I RC-32
1 II.—
----}--—~
I I
I
I I
10 ‘ 102 103
N ~ , NUMBER OF CYCLES
-----553~-----—=------
RC-31 ~
RC-3(
I—-J -—
I I
10’
FIG. 13. STRESS VS. PROPAGATION LIFE

ordl—=K~adN
-24-
(5)
which is of the same form as Eq. 1.
Thus, the experimental re suits verify the general hypothesis that, after
the initial stage of crack growth, the rate of fatigue crack propagation is prima-
rily a function of the stress on the remaining area.
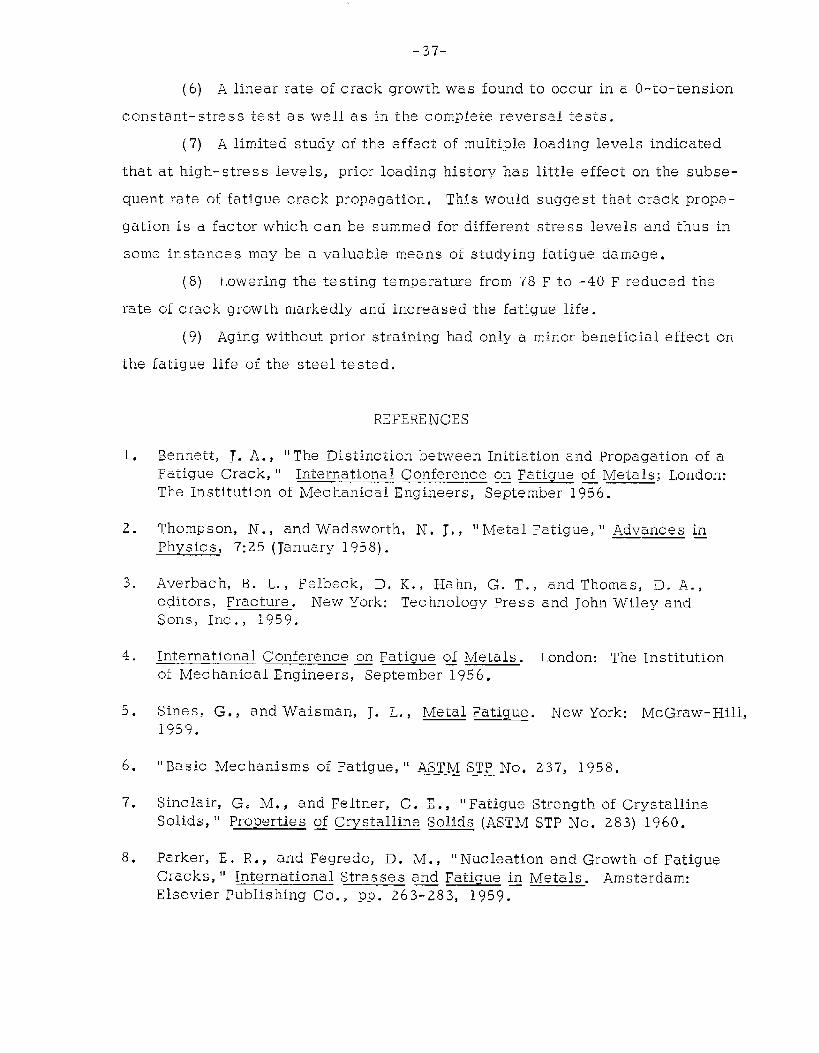
Using the fact that the rate of crack propagation is primarily a function
of the stress, one can determine the number of cycles of loading required to
propagate a crack through any distance L at a given stress level, ~. Thus, for
a given stress and the corresponding constant rate of crack propagation, the
following expression
and propagation life.
L‘L = dL/dN
can be used to determine the relation. ship between stress
(6)
where
NL = number of cycles required to propagate acrack a given distance, L.
The linear stage values of crack growth and stress for the 5-in. -wide specimens
te steal at the same temperature and with no prior artificial aging were as follows:
Rate ofCrack Growthin~c yc le x 10 6
600
230
77
29
Using these values and Eq. 6, the total propagation lives then may be computed
(neglecting the effect of the initial stage of crack propagation) and the relation-
ship between stress and propagation life determined as s hewn in Fig. 13. If
the relationship is extended to N = 1 (one application of failure load or in other
words a static tensile test) a close approximation to the tensile coupon strength
(7o.6 ksi) or the strength of a 5-in. -wide centrally notched plate loaded to failure

-25-
(65.5 ksi) is obtained. The equation of this relationship is:
This is
fatigue
where
of the general
behavior,
(7)
form used by Tavernelli and Coffin33 to predict low-cycle
Nt = plastic tensile strain range
qf = true fracture strain measured
(8)
in tensile test
It should be noted that Eqs. 7 and 8 are similar and are both ralated to condi-
ti~ns in a tensile test. However, much more work remains to be done on crack
to better define the fatigue crack propagation life in the very low-cycle fatigue
range.
Evaluation of Crack Growth Parameters:—— For a given material, thickness,
stress level, temperature, etc. , the coefficients ~ and Q in Eq. 5 are functions
of geometry only. During a test the geometry changes (crack length increases)
and therefore it would be expected that ~ and/or ~ should change also. This
change in ~ and/or ~ would be apparent in the rate of crack growth and in the
strain distribution around the crack front.
A change in the rate of crack growth does occur during the initial stage
and may be seen in the crack propagation curves in Figs. 9-11. This is evident
further from a comparison of the initial (at L = O. 20-in. ) and linear values of
d%/dN presented in Table 2. A plot of the initial d&/dN (at L = O. 20-in. ) vs. U
and the linear dL/dN vs. (T is presented in Fig. 14, where it can be seen that”
the slope of both curves, g is the same but that ~, the propagation intercept of
the lines, increases as the crack length increases. The value of ~ increases
with increasing crack length only up to the beginning of the linear stage of crack
growth. Thus, ~ appears to be a constant for this material arid ~ a factor related
to crack length during the initial stage of crack propagation and a constant dur-
ing the linear stage.
For a given material, if ~ increases with crack length, the extent and

-26-
50
i ‘+ ‘- “ - ‘“ ‘-” :
t +ff
.40-— — ___
~d~
j
NT \AL ~
----<
LINEAR ~
30 — ——
~<
●
zz
i;
r
2010 20 30 40 50 60 70 8090100
200 300
[1400 500 6oo
RATE OF CRACK PROPAGATION $ , lN./CYCLE X 10g
FIG. 14. INITIAL AND LINEAR RATES OF CRACK GROWT13 VS. STMSS
magnitude of the strain field ahead of the propagating crack would also increase.
Frost 19,20 and ~ul Snoted this behavior as a growth of the “plastic zone”
ahead of the crack.
For an elliptical crack in a plate Timoshenko34 expresses the elastic
stress as being related to ( 1 + 2 d/b) where g and ~ are the major and minor
axes of the ellipse. If a fatigue crack can be approximated by an elliptical
slit of large d/b ratio, then for a constant value of ~, the ;stress would in-
crease with increasing crack length (increasing major axis ~).
Evaluation o~ Strain Distribution: Strain gages were used to determinethe effect of crack length on the strain distribution ahead cf a propagating fa-
tigue crack. It was not possible to obtain the value of strain at the tip of the
crack because of the finite size of a strain gage. However, by using small
gage lengths ( 1/4 in. and 1/1 6 in. ) the effect of crack length on the “ average”
maximum strain (measured) near the crack tip could be determined. In some— —cases, the strain gages were placed slightly above or below the expected crack
path so that strain measurements could be obtained after the crack has propa-
gated beyond a gage.
The O-to-tension increments of strain were examined to study the effect

-27-
of crack length on the strain near the tip of the crack. As the crack propagated
toward a gage, hysteresis loops were obtained in the strain records. In addi-
tion, when the load was removed at any time during a test, some permanent
strain was recorded. This permanent strain was used as the “ zero” reference
to determine the incremental tensile strain for that particular crack length. The
incremental strain distributions for O-to-tension loadings at various crack lengths
are presented in Append& C.
Initially the measured maximum tensile strain near the saw cut is some
multiple of the computed average strain acress the net section. Then, as the
fatigue crack initiates and the crack length increases, the measured maximum
tensile strain near the crack tip appears to increase further. This increase in
strain with crack length, even though the load is decreased to maintain a con-
stant stress, occurs until the rate of crack growth reaches the linear stage.
After reaching the linear stage the maximum strain near the tip of the crack ap-
pears to remain essentially constant.
The average increase in the maximum strain, i. e., the ratio of measured
maximum strain near the tip of the crack during the linear rate of crack growth
to the measured maximum strain for a crack length of only O. 20-in. (just after
crack initiation) was 2.90. Similarly, the average increase in rate of crack
growth for the se same tests (ratio of linear rate of growth to rate of growth at
L = 0.20 -in.) was 2.63. Thus it appears that during the initial stage as well
as the linear stage of propagation the rate of crack growth is approximately
proportional to the maximum strain near the crack tip.
To investigate the effect of initial crack length on the initial stress
distribution and initial rate of crack growth, fatigue tests were conducted on
specimens with saw-cut lengths of 3/8 in. , 3\4 in. and 2 in. As seen in the
following tabulation, increasing the initial crack length resulted in an increase
in the initial rate of crack growth.

.28.
Initial- Notch Initial RateLength ( 2 4.) of Crack Growt)
in. in. /cycle x 10
3/8 853/4 1602 250
The maximum tensile strain at the tip of the notch was measured during
the first cycle of load for specimens with 2-in. and 3/8-in. saw cuts to inves-
tigate the effect of initial crack length on the maximum strain. The net section
stress in both specimens was + 33 ksi. The maximum tensile strain at the—-6notch root in the specimen with a 2-in. saw cut was about 3 x 10 in. /in. and
in the specimen with a 3/8-in. saw cut was about 2 x 10⁻⁶ in. /in. Therefore,
the specimen with the longer saw cut had a greater strain at the tip of the
notch than the specimen with the shorter notch thus acc ou:~ting for the variation
in initial rate of crack growth noted above.
Photoelastic Evaluation of Strain Distribution: The results of the photo-——
elastic studies indicated the same general behavior as the results of the strain
gage studies, i.e. , the strain field ahead of the crack enlarged with increas-
ing crack length until the rate of crack growth became linear. The strain field
then remained fairly constant in extent and magnitude until the final stage of
crack growth. A sequence of contours of maximum principal strain difference
(El - <a ) for various numbers of cycles of loading during t-he test of Specimen
RC-16 show this quite clearly (Figs. 15 and 16). Note th~t up to N = 14, 860
both the magnitude and extent of the highly strained region in the vicinity of
the crack tip enlarged with increasing crack length even though the stress was
kept constant. At approximately N = 15, 000 the rate of crack growth became
linear as may be seen in Fig. 8. The strain distribution remained fairly constant
during the linear stage of crack propagation and then began to decrease as the
crack neared the edge of the specimen. A typical photograph from which the
maximum principal strain difference contours were obtained is presented in
Fig. 17.
Varying Stress Levels: A limited investigation was made of the effect of

-29-
1 STRAIN CONTOURS IN MICROINLHESI INCH
wr2 .2 5“ sCALE I z 1<’H ANO V
N=5
$.I
N= 7200
SPECIMEN RC-16
900
1250!520
q
1,
~q
N= 3110
900125015202200
I
N = 14,860
(a-. +30 KSI)
STRAIN CONTOURS IN MICROINCHES 1 INCH
w/2 . 2 5“SCALE 1’ = 1“ H AND v
-~9001?50(5202200
a-~
- n
0
u
(
N= 24,2Go
I
N = ?5,8%0
SPECIMEN RC-16
290012501520
Q!
%200
~~
II
N. 30,479
(m=+ 30 KSl)
FIG. 15. CONTOURS OF MIMI MUMPRINCIPAL STRAIN DIFFERENCE (~1 -~z ) FOR VARIOUS C RACK LENGTHS
FIG. 16. CONTOURS OF MAXIMUMPRINCIPAL STRAIN DIFFERENCE (CI -<z ) FOR VARIOUS CRACK LENGTHS
prior loading on the linear rate of crack growth. After establishing the linear
rate of growth in a constant- stress test, the stress level was changed from ~ 27
ksi to+_ 30 ksi in one case (Specimen RC-18) and from~ 30 ksi to ~ 27 ksi in
the other case (Specimen RC-19) as may be seen in Fig. 18. The iinear rates
of growth for these tests were as follows:
Specimen Stress Linear Crack Second Stress Linear CrackNumber Level Growth Rate ~ Level Growth Rate ~
ksi in. /cycle x 10 ksi in. /cyclexl O
RC-18 ~ 27 25 ~ 30 60
RC-19 ~ 30 54 ~ 27 30
On the basis of these limited results, it would appear that, in the linear stage

-30-
,!., ,;
FIG. 17. TYPICAL PHOTOGRAPH OF MAXIMUM PRINCIP.9L STRAIN CONTOURS
I
u .10 20 30 40 50 60 70 so
N, THOUSANDS OF CYCLES OF LOAD
FIG. 18. CRACK PROPAGATION FOR MULTIPLE STRESS LEVELS
and at high-stress levels, prior loading history has little effect on the subse-
quent rate of fatigue crack propagation. This would suggest that crack propaga-
tion is a factor which can be summed for different stress levels and thus in
some instances may be a valuable means of studying fatigue damage.
Studies by Hudson and Hardrath35 indicate that prior loading history
does have an effect orI rate of crack growth if the difference in stress levels—

-31-
I
I1 i
I -- -’ ----- 1- --— -... ....k’~”’””F“-
, ––—.I
) I
~ ---f +
~ / “=”’*
->
.,..~y’
–.-––r–— -- .T——-2,::~_
.,..’ LT=o f~ +331I I
J:’” ~ ~=15x,o-’,
dn
~“”+”–- ‘
““”--”1.,,=, .... .
.,,, I
-,
..
- —.. — t-— - ..:----------- ;
o 20 40 60 80 100 120 140
N, THOUSANDS OF CYCLES OF LOAD
FIG . 19. CJRACK PROPAGATION IN 0-TO-TENSI.ON CONSTANT-STRESS TEST
is large. However, they observed that as the stress levels are increased and
as the difference between the stress levels is made smaller the effect of prior
loadings is reduced. The results of their constant-load tests, at the smaller
differences in stress levels, are in agreement with the general re suits found
for the two constant- stress tests described above.
Zero-to-Tension Constant-Stress Test:_ One specimen was tested at— —
O = + 33 ksi to evaluate the fatigue behavior of a plate specimen under condi-
tions of O-to-tension ioading. As expected, a linear relationship existed be-
tween 1 and N for the major portion of the test ( see Fig. 19) . An indication of
the importance of total range of loading and compressive loading rather than
just the maximum load can be obtained by comparing the crack-growth data from
the various tests. The linear rate of crack propagation for the O to + 33 ksi6
stress cycle was 15 in. /cycle x 10 whereas the iinear rate of crack propaga-6
tion for the ~ 33 ksi stress cycle ‘was 230 in. /cycle x 10 .
Zero-to-tension constant-stress tests conducted by Weibu112s J 2= on
aluminum sheets showed the same general behavior for the major portion of the
life of his specimens.

Effect of Te rnperature—
Temperature:
-32-
and Aging.—
In general, lowering the temperature of steels increases
their strength but decreases their ductility, For unnotched specimens, the
yield strength, ultimate strength and fatigue limit increase with decreasing
temperature. 3s’3 8 Since the fatigue limit increases at lower temperatures, it
would be reasonable to expect the rate of fatigue crack propagation to decrease.
Tensile tests on the material used in this investigation showed that for
unaged specimens, the upper yield point was increased from 41.6 ksi to 46.1
ks i by lowering
tures there was
this material at
the test temperature from 78 F to -40 F. For these two tempera-
no significant change in ductility. The tensile properties of
-40 F are presented in Table 1.
Four constant- stress fatigue tests were conducted a.t -40 F to study the
effect of temperature on rate of crack growth. The test stress was ~ 30 ksi for
all specimens; two specimens were aged and two were unaged. The temperature
of -40 F was chosen because it was a convenient test temperature well below
the 15 ft-lb Charpy V-notch impact value (Fig. 2).
In comparison to the rates at 78 F the rate of crack growth in all four
tests decreased markedly. However, there was negligible variation in the be-
havior of specimens tested at -40 F indicating that the rate of fatigue-crack
growth may be insensitive to aging at low temperatures. The crack growth
rates for specimens te steal at -40 and 78 F are presented in the following tabu-
lation. All specimens were tested at u = ~ 30 ksi.
AGED UNAGED
Specimen TemperatureNumber “F
7-in. -Wide Specimens
RC-26 -40R(7-19 78
5-in. -Wide Specimens
RC-28 -40RC-34 78
Linear Crack Linear CrackGrowth Rate Specimen Temperature Growth Rate ~in. /cycle x106 Number ‘F in. /cyclexl O
25 RC-20 -40 2554 RC-16 78 95
20 RC-2750 RC-31
-4(J78
2177

-33-
In addition to the decrease in growth rates, the time required to initiate
the crack and the initial stage of fatigue crack growth were increased. There-
fore the total fatigue lives at -40 F would be much longer than at 78 F. The
crack growth curves for these four tests are presented in Fig. 10.
= Strain aging Of mild steel iS the change which takes place as a
re suit of cold working followed by an “ aging” or precipitation process in which
carbon and nitrogen atoms are pre surned to strengthen the metal by diffusing to
dislocations in the crystal lattice. The aging process occurs at room tempera-
tures over a long period of time but is markedly accelerated at temperatures
only slightly above ambient. This combination in susceptible steels of prior
cold work and aging re suits in increased yield strength and hardness, and de-
creased ductility. In addition, aging may make some steels more susceptible
to brittle fracture.29 ‘40 Rally and SinclairA ~ fourid that the shape of an S-N
curve may be influenced by strain aging. In addition, they noted that, “ strain
aging appears to influence the rate of crack propagation, however, quantitative
predictions on the location of the knee cannot be made since the relationship
between temperature and rate of crack propagation is not known. ”
In the investigation reported herein, no attempt was made to evaluate
the effect of various strain aging or aging conditions but merely to use one
aging condition. Based on studies of a similar mild steel by other investiga-
tors, 42 the specimens were aged at 150 C (302 F) for 90 minutes.
The specimens were not strained prior to aging so that the effect of aging
alone on the rate of crack growth at different temperatures could be studied.
Since the specimens were not strain aged, but merely aged, a signifi-
cant change in material properties would not be expected. This was indeed the
case as the upper yield point increased only from 41.6 ksi to 43.3 ksi as a re-
sult of the aging and there was no significant change oh served ,in the ductility.:,
A detailed comparison of the tensile properties of aged and unaged specimens
is presented in Table 1.
In the fatigue tests of specimens at 78 F the linear rate of crack growth
was lower for aged specimens than it was for unaged specimens in all cases
except one. The one exception was at the highest stress level at which both

-34’
aged and unaged specimens were tested, U = ~ 33 ksi. In this instance the
linear rates were almost the same, i.e. , 237 x 10-6
in. /cycle for the aged-6
specimen and 230 x 10 in. /cycle for the unaged specimen. For specimens
tested at lower stress levels the difference in linear rate o: crack growth be-
tween aged and unaged specimens increased as shown in the following tabula-
tion:
6Stress Specimen Linear Rate of Crack Growth, in. /cycle x 10_—— _Leve 1 Width Aged Specimens Unaged Specimens
ksi in. (Specimen Nos. in Parentheses)
~ 33 5 237 (RC-35) 230 (RC-33)
~ 30 7 54 (RC-19) 95 (RC-16)5 50 (RC-34) 77 (RC-31)
~ 27 7 25 (RC-18) 40 (RC-21)5 16 (RC-29) 29 (RC-30)
However, as may be seen in the crack growth curves of Figs. 9 and 10, the fa-
tigue life of an aged specimen te steal at room temperature was always greater
than that of a comparable unaged specimen because of a longer initial crack
propagation stage and, in all cases except one, a lower crack growth rate.
There was no difference in the linear rates of crack propagation be-
tween the aged and unaged specimens tested at -40 F (see Table 2 and Fig. 11).
Thus, at low temperatures there apparently is no significant effect of aging on
the rate of crack growth or the life.
SUMMARY AND CONCLUSIONS
Summary
This investigation has been conducted to study the parameters affecting
crack propagation in low-cycle fatigue of mild steel. Flat plate specimens,
centrally notched to reduce the number of cycles required to initiate the fatigue
cracks, were subjected to reversal of axial loading. Three types of repeated
load cycles were studied: constant load, reduced load, and constant stress.

-35-
The constant- stress tests were conducted at stress levels ranging from
~ 27 ksi to ~ 36 ksi, on specimens with widths of 5 in. and 7 in. , at test temp-
eratures of 78 F and -40 F and for both unaged and aged specimens.
A hypothesis relating the rate of crack growth and the stress has been
presented to describe the behavior during various stages of propagation. In
addition, the test results obtained in this study have been correlated with ex-
isting theories of crack propagation.
Conclusions
On the basis of the study reported herein it may be concluded that:
(1) The De Forest theory that fatigue life of a member may be most
realistically divided into an initiation stage and a propagation stage has been
confirmed by the different tests conducted in this study; fatigue crack initiation
is primarily influenced by the conditions near the point of origin while fatigue
crack propagation is affected more by the conditions throughout the entire cross-
section that the crack traverses.
(2) During the propagation stage the type of loading cycle will affect
the fatigue behavior markedly.
(a) In constant-load tests, in ‘which the stress increases through-
out the test, the rate of crack growth continuously increases.
(b) If the maximum stress range is reduced throughout the test, as
in a reduced-load test, the rate of crack growth will decrease
throughout the test.
(c) In a constant-stress test, .in which the stress range is main-
tained constant during the test, the rate of fatigue crack propa-
gation remains constant after a short initial period.
In most structures, depending upon their size, fatigue cracks will gen-
erally grow for some distance without changing greatly the over-all stress dis -
tribution. Thus it is believed that constant-stress tests more closely approxi -
mate the fatigue crack propagation behavior of actual structures than do the
other types of tests.
(3) The fatigue crack propagation behavior during a constant-stress

-34-
test may be divided into an initial, linear, and final stage. The initial stage
is a relatively short period in the total life of a specimen and is affected by
the stress level, the number
changing stress field around
growth is proportional to the
of cycles to crack initiation, initial geometry and
the crack tip. During this period the rate of crack
crack length and may be expressed as:
In this initial stage, there is little difference in the behavior of specimens sub-
jected to constant-load or constant- stress conditions.
After the initial stage, a linear rate of crack growth occurs and may be
expressed as:
This linear rate of growth was observed in
gardle ss of stress level, test temperature, initial
or aged specimens.
all constant-stress tests re-
geometry and for both unaged
The third or final stage of propagation occurs as a crack nears the edges
of a specimen. In this stage the behavior is affected by eccentricity in the
specimens and edge effects.
(4) In the initial stage of crack propagation during which the rate of
crack growth increases with crack length, the strain field ahead of the crack
tip also increases in extent and magnitude. However, during the linear stage
or major portion of the life of a member subjected to a constant- stress condi-
tion, both the rate of crack growth and the strain field ahead of the crack re-
main essentially constant. It is expected that this “ steady- state” condition
would exist for a considerable distance of crack propagation if the specimen
were wide enough to be considered semi-infinite.
(5) Using the fact that the rate of crack propagaticln is primarily a”func-
tion of the stress (dL/dN = K ma), one can determine the number of cycles of
loading required to propagate a crack through any distance L, for a condition
of constant stress, by using the relationship:L
‘L = dL/dN
-37-
(6) A linear rate of crack growth was found to occur in
constant-stress test as well as in the complete reversal tests.
a O-to-tension
(7) A limited study of the effect of multiple
that at high- stress levels, prior loading history has
querit rate of fatigue crack propagation. This would
gation is a factor which can be summed for different
loading levels indicated
little effect on the subse-
suggest that crack propa -
stress levels and thus in
some instances may be a valuable means of stu,dying fatigue damage.
(8) Lowering the te sting temperature from 78 F to -40 F reduced the
rate of crack growth markedly and increased the fatigue life.
(9) Aging without prior straining had only a minor beneficial effect on
the fatigue life of the steel tested.
1.
2.
3.
4.
5.
6.
7.
8.
REFERENCES
Bennett, J. A., “ The Distinction between Initiation and Propagation of aFatigue Crack, “ International conference on Fatigue of Metals; London:——_ _The Institution of Mechanical Engineers, September 1956.
Thompson, N.j and Wadsworth, N. J, , “ Metal Fatigue, “ Advances inPhysics, 7:25 (January 1958).
—— —
Averbach, B. L., Felbeck, D, K., Hahn, G. T., and Thomas, D. A.,editors, Fracture. New York: Technology Press and John Wiley andSons, Inc. , 1959.
International Conference on Fatigue o< Metals. London: The Institutionof Mechanical Engineers j~eptember 1956.
Sines, G., and Waisman, J. L. , Metal Fatique. New York: McGraw-Hill,1959.
“ Basic Mechanisms of Fatigue, “ ASTM STP No.——
Sinclair, G. M., and Feltner, C. E. , “ Fatigue
237, 1958.
Strength of CrystallineSolids, “ Properties of Crystalline Solids (ASTM STP No. 283) 1960.
Parker, E. R., and Fegredo, D. M., “ Nucleation and Growth of FatigueCracks, “ International Stresses and Fatigue in Metals. Amsterdam:Elsevier Publishing Co. , pp. 263-283, 1959.—

9. Gross kreutz, J. C., and Rollins, F. R., “Research on the Mechanisms ofFatigue, “ WADC ~echnical Report (No. 59-192), September 1959.
10. Vedeler, G., A Naval Architect’s Reflections on Some Research Problems—— ——with Ship Steel (Ship Structure Committee Report Serial No. SSC-140).~h~fion: National Academy of Sciences-National Re search Council,August 4, 1961.
11. DeForest, A. V., “ The Rate of Growth of Fatigue Cracks, “ JQIU@ Q @= Mechanics vol. 58, pp. A23-A25 (1936).
12. Wilsonj W. M. , and Burke, J. L., “ Rate of Propagation of Fatigue Cracksin 12- by 3/4-in. Steel Plates with Severe Geometrical Stress-Raisers, “The Welding Journal, 27:8, Research Supplement, pp. 405-s–408-s~gust 1948).
13. Head, A. K., “ The Growth of Fatigue Cracks, “ Philosophical Magazine,44:356 (7th series), pp. 925-938 (September 1953).
14. Head, A. K., “ The Propagation of Fatigue Cracks, “ @IQ%!QAQ@@Mechanicg, vol. 23, p. 407 (1956).
15. McClintock, F. A., “ The Growth of Fatigue Cracks under Plastic Torsion, “International Conference on Fatique of Metals. London: The Institutionof Mechanical Engineers, ~eptember—l 956.
16. Hult, J. A. H., “Fatigue Crack Propagation in Torsion, “ Journal ofMechanics and Physics of Solids, 6:1, PP. 47-52 (1957).
———
17. Martin, D. E., and Sinclair, G. M., “ Crack Propagation under RepeatedLoading, “ Proc. , Third U. ~. National Congress g Applied Mechanics,——pp. 595-604, 1958.
18. Liu, H. W., “Crack Propagation in Thin Metal Sheet under Repeated Load-ing, “ Trans. AS ME, 83:1, Series D (March 1961).——
19. Frost, N. E., and Dugdale, D. S., “ Fatigue Tests cm Notched Mild SteelPlates with Measurements of Fatigue Cracks, “ Journal of the Mechanicsand Physics of Solids, vol. 5, PP. 182-192 (1957).—
20, Frost, N. E., and Dugdale, D. S. , “The Propagation of Fatigue Cracks inSheet Specimens, “ _ o~ t~ Mechanics a- Physics ~ SS, vol. 6,pp. 92-110 (1958).
21. McEvily, A. J., Jr., and Illg. W., “ The Rate of Fatigue--Crack propaga-tion in Two Aluminum A11oYs, “ NACA TN 4394? 1958.
-39-
22. 1119, w., and McEvily, A. J., Jr. , “The Rate Of Fatigu@--Crack propaga-tion for Two Aluminum Alloys under Completely Reversed Loading, “ NASATN D-52, 1959..—
23. McEvily, A. J., Jr. , and Illg, W. # “A Method for Predicting the Rate ofFatigue Crack Propagation, “ Proc. Symposium cm Fatigue q Aircraft Struc-—tures, (ASTM STP No. 274), 1959.—.
24. Neuber, Heinz, Theory of Notch Stresses: Principles for Exact Stress Cal-.— — .— —.culation. Ann Arbor, Michigan: J. W. Edwards, 1946.
25. Howland, R. C. J., “ On the Stresses in the Neighborhood of a CircularHole in a Strip under Tension, “ Trans. Philosophical Royal Society (London),——225:671, (Series A), pp. 49-86 (January 1930).
26. Weibull, W., “ Basic Aspects of Fatigue, “ Colloquium on Fatigue,Stockholm ( 1955), Springer-Verlag, Berlin ( 1956): Inter~ational Union ofTheoretical and Applied Mechanics.
27. Weibull, W., “ The Propagation of Fatique Cracks in Light-Alloy Plates, “NACA TN-25, SAAB Aircraft Co., 1954.
28. Weibull, W., “Effect of Crack Length and Stress Amplitude on Growth ofFatigue Cracks, “ T- Aeronautical Research Institute @ Sweden (Report65), Stockholm, 1956.
29. Weibull, W., “ Size Effects on Fatigue Crack Initiation and Propagation inAluminum Sheet Specimens Subjected to Stresses of Nearly Constant Ampli-tude, “ ibid, Report 86.
30. Massonnet, Cuvelier, G., and Kayser, G., “Etude des lois de la propaga-tion de la fissure de fatigue clans des eprouvettes d’ acier doux soumises~ flexion, “ Extrait dfl Bulletin du Centre ~’ Etudes d= Recherches et d’Essais Scientifiques du Genie ~ivil, Tome XI, 1960.
—.—— —
31. StaUmeyer, J. E., Nordrnark, G. E., Munse, W. H., and N@wmark, N. M.,“Fatigue Strength of Welds in Low-Alloy Structural Steels, “ The Welding
JQUZ!Q4* 35:67 Research Supplement, pp. 298-s— 307-s (June~56).
32. McMaster, Robert C., ed., Nondestructive Testing Handbook (vo1. II),Society for Nondestructive Testing, Ronald Press Co., 1959.
33. Tavernelli, J. F., and Coffin, L. F., Jr., “A Compilation and Interpreta-tion of Cyclic Strain Fatigue Tests on Metals, “ Trams. ASM, vol. 51,——p. 438 (1959).

34*
35.
36.
37.
38.
39.
40.
41.
42.
-4g -
Tirnoshenko, S., and Goodier, J. N. , Theory of Elasticity. New York:McGraw Hill, p. 201, 1951.
—
Hudson, C. M., and Hardrath, H. F., “Effects of Changing Stress Ampli-tude on the Rate of Fatigue-Crack Propagation in Two Aluminum Alloys, “NASA TN D-960, 1961.—— _
Spretndk, J. W. , Fontana, M. G. , and Brooks, H. E., “Notched andUnnotc hed Tensile and Fatigue Properties of Ten Engineering Alloys at25° C and -196””Cj “ Trans. ASM, vol. 43, pp. 547-570 (1951).—.
Zambrow, J. L., and Fontana, M. G., “ Mechanical Propertiesj IncludingFatigue Properties at Very Low Temperatures, “ Trans. A=, vol. 41,pp. 480-518 (1949).
Campbell, J. E., Review ~ Current Data on the Tensile Properties of—. .Metals at Very Low Temperatures (DMIC Report 148). Columbus, C)hio:
———— —Battelle Memoria~nstitute, February 14, 1961.
Parker, E. R., Brittle Behavior of Engineering Structures. New York:John Wiley & Sons, Inc. , 1957.
Dieter, G. E., Jr,. , Mechanical Metallurgy. New York: McGraw Hill,—1961.
Rally, F. C. , and Sinclair, G. M., Influence of Strain Aging on the Shape.— .—of the S-N Diagram (Technical Report No. 45, Office of Naval Research. . —~ontract No. N60ri-071(04) . Urbana: University of Illinois, T and AMDepartment, June 1955.
Drucker, D. C., Mylonas, C. , and Lianis, G. , “Exhaustion of Ductilityof E-Steel in Tension Following Compressive Prestrain, “ The Welding~ournal, 39:3, Research Supplement, p. 11 7-s (March 196~
ACKNOWLEDGMENT
The tests and analysis reported herein were conducted at the University of
Illinois as a part of the Low-Cycle Fatigue program (SR- 149) sponsored by the Ship
Structure Committee through the Bureau of Ships, U. S. Navy, with the assistance of
a Project Advisory Committee of the NAS-NRC. The investigation is a part of the
structural research program of the Department of Civil Engineering of which Dr. N.
M. Newmark is head. The authors wish to express their appreciationtoa number of
University staff members who assisted in the investigation in various ways and tothe NAS-NRC staff members who as,sisted in the final editing of this report.

-41-
APPENDIX A
STUDY OF COMPRESSIVE LOAD CARRIED BY PARTIALLY CRACKED SPECIMEN
To investigate the cornpres sive load carrying capacity of a cracked
specimen, strain gages were placed slight ly above or below the expected
crack path on several specimens. As the crack propagated past a strain gage,
strain measurements could still be obtained since the gages were intact.
At various crack lengths, the O-to-compression increments of strain
were examined and indicated that the cracked portion of the member continued
to carry as much compressive load as the untracked portion carried. Except
for the region near the crack tip, where the strain is increased because of
the stress concentration effect of the crack tip, the compressive strain
increments were essentially the same for both the untracked and cracked
portions of a specimen, as may be seen in Figs. A-1 to A-5. Thus the assump-
tion that the maximum rmmina 1 cornpres sive stress may be based on the original
net area is valid.
Further proof of the relative uniformity of compressive strain distribu-
tion, regardless of the fatigue crack length, was obtained with photo-elastic
strain measurements. Contours of maximum principal strain difference under
compressive loading (F; - ~ ) were obtained for various crack lengths and are~presented in Fig. A-6. It can be seen clearly in these figures that even when
the crack increases in length, the compressive strain distribution remains
relative ly constant.

kSPECIMEN
h016”
2467891011 12
‘,”:BDWI IIIUom
25”
1o) STRAIN GAGE
ILAYOIJT
‘mOF
0
000
I c) N= 1030
sPECIMEN
d) N= 1720
SPECIMEN Rc-33
c= -33 KSI
l“ V = 2000 MICROINCHES/lNCH
l“ H = l“
k~ SPECIMEN
o1,
1:”’
1’00
100
e) N= 3190
w0 ~T i1:
00I
f) N= 3B60
L-
m0 ~!i,,‘1
;.
00
I g)N= 56oO
SCALE
-SPECIMEN
h) N= 7430
SPECIMEI% RC-33
I O-=-33KSI
I
l“ V = 2000 MICROINCHES / INCH
I“H=I”
~ SPECIMEN
-4mo - LL0
b) N=3
)
z0.
0I
!
-2W
I c1 N = B70 1RC-6 U=-33KSI
SCALE: ~ V = 2000 MICROlt#CHES / INCH
~H= l“
FIG. A-1. STRAIN GAGE LAYOUTAND COMPRESSIVE STRAIN INCRE-MENTS FOR VARIOUS CRACKLENGTHS
FIG, A-2 . COMPRESSIVE STRAININCREMENTS FOR VARIOUS CRACKLENGTHS
FIG. A-3. STRAIN GAGELAYOUT AND COMPRESSIVESTRAIN INCREMENTS FORVARIOUS CRACK LENGTHS

- m-,. ,. .-.,
o
-200C
c
- 2W(
I SPECIMENc
d] N = 1302\
. ●) N ~ 2345
1)
I g} N = 5381
u = -33 KSI RC-6
SCALE : l“ V = 2000 MICROINCHES / INCH
fH= l“
FIG. A-4. COMPRESSWE STRAININCREMENTS FOR VARIOUS CRACKLENGTHS
c
-200(
o
-200C
c
h] N = 78B2-.
-
i] N = 9750\
\ j) N = 12826
-2000t 1) N = 16680
I
SCALE: I“V ❑ 2000 MICROINCHES / INCH I“H= i’
FIG. A-5. COMPRESSIVE STRAIN INCRE-MENTS FOR VARIOUS CRACK LENGTHS
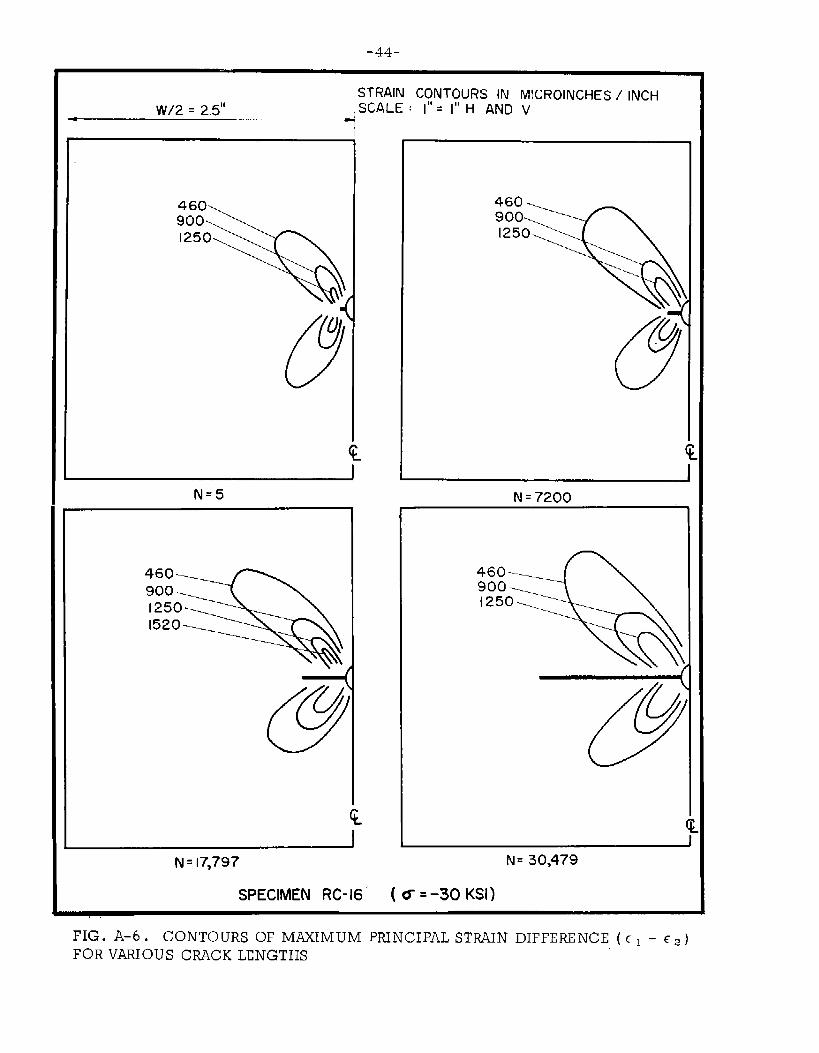
-44-
STRAIN CONTOURS IN MICROINCHES/lNCH
W/2 ❑ 2.5” SCALE: l“= I“H ANI) VP
250
1N=5
460
900
w
1250
1520=
u@(
c
N= 17,797
SPECIMEN RC-16
IN = 7200
N= 30,479
(6=-30 KSI)
.,
FIG. A-6 , CONTOURS OF MAXIMUM PRINCIPAL STRAIN DIFFERENCE ( c ~ - E~ )FOR VARIOUS CRACK LENGTHS

-45-
APPENDIX B—
CORRELATION OF EXISTING THEORTES WITHINITIAL STAGE OF CRACK PROPAGATION
Other investigators~ e -20 have concluded that the rate of fatigue crack
propagation in sheet specimen containing a small central slit should be pro-
portional to the crack length and may be expressed as follows:
dl=kldN
Llog ~ --k (N-No)
where
1 = half-length of crack (measured from the center-line
of the specimen)
N ❑ number of cycles of loading
k ❑ coefficient of proportionality
7.0= initial haLf crack length
No = number of cycles of load corresponding to to
Re suits of constant-load fatigue tests indicated that the
pression was valid orLly for crack lengths of less than shut 1/8
almve ex-
the specimen
width. Thus, measurements of crack growth vs. cycles of loading indicated
a linear relationship when the crack length was plctted on a logarithmic scale.
As the crack length became greater than about 1/8 the specimen width the rate
of growth increased.
This same general behavior was observed in the constant- load tests
conducted as a part of this investigation (see Fig. B-1). Note that initially
there is a linear relationship between log L and N (dt/dN = kt) but~ as the
crack length increased the rate of crack propagation increased rapidly. Thus,
the results of constant–load tests in which the stress range is continuously

-46-
increasing indicate that during the first part of the test the following relation-
ship is valid.
In a constant-stress test, the rate of crack growth remains linear
after a short initial period. During the initial period, it was found that the
relationship between log -t and N was the same as in the constant–load tests
(see Fig. B-2). This behavior could be expected since for very short crack
lengths there is little difference betvreen a constant-load test and a constant-
stress test. However, as the crack length increases, the linear relationship
no longer exists between log L and N as may be seen in Fig. B-2. The short
lines perpendicular to the initial slopes of the crack growth curves mark the
end of the initial stage of crack growth for each specimen. Thus, it can be
seen that for the major portion of the life in a constant–stress test, there is
a non–linear relationship between loq L and N.
In
results of
results of
summary, it can be stated that for very short crack
both constant–load tests and constant-stress tests
other investigators.
lengths the
agree with the
As the crack length increases however, this relationship is no longer valid
for either constant- load tests or constant-stress tests.

Yvaau
FIG .
I I I
~~ –.——– .T>-~’P:~i~y3~~{”-––~-”–-”--–~-
/“+ I4 j A R~.!5 ~
~ RC- I(Uinitlal = * 33 Ksl ) I “/
A
Ij
f
1
1
_—1.0 “—-”-
.— —}
.__--.,.––– .:-:
9 -—-— — ‘—_., __.–+ ——— -— — —-
+
●
_.— ——8 ———
.——
4’
/ :’Rj &!-
.7 -—” ‘—
/~ _—. , .—— J—-—-— -— ““ ‘— “’”–
!..–. -m/ –––” “–”--
.5 —,- —-—’———”——
14
/’
‘f ,$,”---[ ~“:’- ‘
_..—_.—— _ +—.—..——. —,—
4-”RC_25 (~lnitlal =+30 KSI)
I__ –. .—-~_ ———~— –
+
\
_i._.__.._2 :;—/ ‘——
L___ – –._-.___ _____r
6 8 10 12
2 4
}5 N, WOUSANDs OF CYCLES OF LOhD
B-1 . FATIGUE C RACK PROPAGATION FOR CONSTANT -LOAD TESTS
L1-0zw-1
‘Yu
1:,LJ
51----”-”-x”-----”E”-’”t--”E”-l”-- ““‘-”A 1I_t__.:. / _,,. L+@._> _ +_ .__. _.+ ____ ..l _ _
I.._. _. . . . .
I
I r“-” ‘-
.-
—--l”–-— ‘“ -“— ‘“’ -
I““?..:-iI
,3 . J _? ,_--, \~--- ---+—––~”—”– “– “–”T–– I
/,2 “
.~ ~ ~ ~ ] _.~_._.._..+ __!..!. _..._.__
20 25 30 35 40
h 5 10 15
,15 N, THOUSANDS OF CYCLES OF LOAD
FIG. 13-~. FATIGUE CRACK PROPAGATION FOR CONSTANT -STWSS TESTS

-48-
APPENDIx G
STWUN DISTRIBUTIONS
The O-to=tension increments of strain for various crack lengths in four
different specimens tested at four stress levels are presented in Figs. C-1 to
C-5 . A photograph showing a typical strain gage layout may be seen in Fig. 4.
The following tabulation shows the specimen numbers and test stress levels .
The general conclusions based on the results of these figures are discussed in
the text.
Fiqure Number
C-1 and c-2
c-3
c -4
c ‘5
FIG .
Specimen Number Test Stress (0), ksi
RC-30
RC-31
RC-35
RC-32[ SPECIMEN
k SPECIMEN
t—25“ —.— .
1
I a) STRAIIY GAGE LAYOUT
I I,0 )---- .... ... ______ . .
gv
;
o-%
> u
b) N=3 Em
I Io ) -— -— — ––. .–.– .
{
o-
/ d) N=8500
I2000 .–
0
~ e] N= IZ,400 I
spEclMEN Rc.30
>
II 16 =+.27
c) N. 3200
SCALE
l“ V = 2000 MICROINCHES /INCH
I“H = l“
c-1. STRAIN GAGE LAYOUT AND TENSILE STRAININCREME~S FOR VARIOUS CRACK LENGTHS

,,z
—o 000N
EoN
o 0
I i -t
El
N3W133dS 40 39C13
I T1 I vzI
t,, II
>1— ‘—
i!
N3W153dS 40 13Q3
/( 0
11’1m?eU-Jm
II;
-J_
z
---- /n
0wm-WN
o 0 00
00 0 0 0
0 0 0 w>o 0 0w * 2 0
u0N

SPECIMEN RC-35 SCALE:
b17”
i
)00
o
u =+33
a) STRAIN GAGE LAYOUT
IIimiiiPb) N=3
>00
0
000 L
000
0)—d) N= 3400
l“ V = 2000 MICROINCHES f INCHI“H = l“
6000
6000
4000
2000
/f) N= 6480
\
—
FIG . C-4. STRAIN GAGE IAYOUT AND TENSILEI STRAIN INCREMENTS FOR VARIOUS CRACK LENGTHS
000
000
0
I
$000
~
1000
[!000 ,
okc) N = 495h
8000
6000
4000
2000
c
~ SPECIMEN
~d) N= IIOO
SPECIMEN RC-32
6 ❑+36
?IG. C-5. STRAIN GAGEITRAIN INCREMENTS FOR
SCALE:
l“ V = 2000 MICROINCHES / INCH
I“H = 1“
LAYOUT AND TENSILEVARIOUS CRACK LENGTHS
COMMITTEE ON SHIP STRUCTURAL DESIGNDivision of Engineering & Industrial Research
National Academy of Sciences-National Research Council
Chairman:
Vice Chairman:
Members:
.—A. E. LytleDirector
N. J. HoffHead, Department of Aeronautics & AstronauticsStanford University
M. G. ForrestVice President,Gibbs and Cox,
Naval ArchitectureInc.
C. O. DohrenwendProvost and Vice PresidentRensselaer Polytechnic Institute
J. H. EvansDepartment of Naval Architecture & Marine EngineeringMassachusetts Institute of Technology
D. K. FelbeckDepartment of Mechanical EngineeringUniversity of Michigan
J. M. FranklandMechanics DivisionNational Bureau of Standards
William PragerBrown University
J. J. StokerDirector of Institute of Mathematical SciencesDepartment of MathematicsNew York University
Dana YoungTechnical Vice PresidentS.outhwe st Research Institute
R. W. RumkeExecutive Secretary