Embed Size (px)
Citation preview
AJS Volume 114 Number 6 (May 2009): 1591–1643 1591
� 2009 by The University of Chicago. All rights reserved.0002-9602/2009/11406-0001$10.00
Cracking the Glass Cages? Restructuring andAscriptive Inequality at Work1
Alexandra KalevUniversity of Arizona
This study shows that the organization of work, particularly thestructure of jobs, can sustain or erode gender and racial disadvan-tage. Restructuring work around team work and weaker job bound-aries can improve women’s and minorities’ visibility and reducestereotyping and thus should reduce their career disadvantage. Pro-ponents of bureaucratic formalization argue, in contrast, that relax-ing formal job definitions and emphasizing social relations at workwill deepen ascriptive disadvantage. The reorganization of work incorporate America over the last two decades provides a test case.Using unique data on the life histories of more than 800 organi-zations, the author examines whether alleviating job segregationleads to better career outcomes for women and minorities. This studyfinds that when employers adopt popular team and training pro-grams that increase cross-functional collaboration, ascriptive in-equality declines. Similar programs that do not transcend job bound-aries do not lead to such increases. The results point to differenteffects at the intersection of gender and race.
INTRODUCTION
Women and minorities have made significant progress in the labor market,yet they continue to be segregated into low-level, undervalued positions.
1 I thank Ronald Edwards and Bliss Cartwright of the Equal Employment OpportunityCommission for sharing their data and expertise. For comments on earlier versions Ithank Eileen Applebaum, Paul DiMaggio, Nancy DiTomaso, Frank Dobbin, TristinGreen, Joshua Guetzkow, Michael Handel, Seema Jayachandran, Erin Kelly, JulieKmec, Jordan Matsudaira, Marjukka Ollilainen, Pat Roos, Paul Segal, Yehouda Shen-hav, Steve Vallas, Bruce Western, Viviana Zelizer, and three AJS reviewers. For fund-ing I thank the National Science Foundation, the Russell Sage Foundation, and theRobert Wood Johnson Foundation. Direct correspondence to Alexandra Kalev, De-partment of Sociology, University of Arizona, Social Sciences Building, Room 400,1145 East South Campus Drive, Tucson, Arizona 85721. E-mail: [email protected]
American Journal of Sociology
1592
Early stratification research studied occupational attainment as a functionof individual characteristics (Blau and Duncan 1967; Featherman andHauser 1978). The notion that organizational structures also shape dis-advantage emerged in the late 1970s in feminist research on genderedorganizations and in sociologists’ efforts to bring the organization backin to stratification research (Kanter 1977; Baron and Bielby 1980; Baron1984; Ferguson 1984; Acker 1990). Researchers have examined how per-sonnel practices channel women and minorities into certain jobs (Ander-son and Tomaskovic-Devey 1995; Reskin and McBrier 2000; Kmec 2005)and how these jobs become devalued (Baron and Newman 1990; Steinberg1992; Tomaskovic-Devey 1993). Little attention has been paid to the im-pact of job segregation on the structure of opportunities. Yet, since jobsegregation runs along demographic distinctions, it plays a role in thereproduction of inequality (Kanter 1977; Baron 1984; Smith-Doerr 2004).
The concentration of women and minorities in lower-level and mar-ginalized jobs limits their visibility and strategic networks (Baron andNewman 1990; Steinberg, Haignere, and Chertos 1990; Ibarra 1995; Burt1998; Petersen, Saporta, and Seidel 1998; Blair-Loy 2001), and it reinforcesnegative stereotypes about their capabilities and aspirations (Kanter 1977;Ridgeway and Smith-Lovin 1999; Reskin 2003). Segregated jobs can thusbe thought of as “glass cages” that institutionalize informal barriers toadvancement. Research in sociology, social psychology, and organizationalbehavior suggests that less segregated job structures that emphasize col-laborative work and more porous job boundaries could reduce women’sand minorities’ disadvantage by giving them more opportunities for vis-ibility, relations, and interactions that contradict stereotypes (Kanter 1977;Kramer 1991; Brickson 2000). An alternative approach argues that in-creasing reliance on social relations at work and relaxing the rules thatgovern job assignments would allow gender and racial bias to creep into personnel decisions (Bielby 2000; Reskin 2000) and deepen women’sand minorities’ disadvantage (McIlwee and Robinson 1992; Cook andWaters 1998; Baron et al. 2007).
The popularity of cross-functional work programs in American orga-nizations—such as self-directed work teams and cross-training—providesa unique test case. These programs, which were adopted by at least fourof every 10 medium or large-size organizations by 2000, undermine jobsegregation by increasing the contact and collaboration between workersand jobs from different levels and departments. Case studies show thatalthough these programs do not eliminate gender and racial bias, theyprovide new opportunities for women and minorities to work with a widerrange of people, to demonstrate their capabilities, to be treated as peers,and to resist devaluation (Kvande and Rasmussen 1994; Smith 1996;Ollilainen and Rothschild 2001; Daday and Burris 2002; Smith-Doerr
Restructuring and Ascription at Work
1593
2004). While all workers can benefit from such opportunities, cross-func-tional programs mark a larger break from women’s and minorities’ typicalexperiences. The adoption of self-directed teams and cross-training canthus have the unintended consequence of improving women’s and mi-norities’ career outcomes. In this study, I examine whether this is indeedthe case.
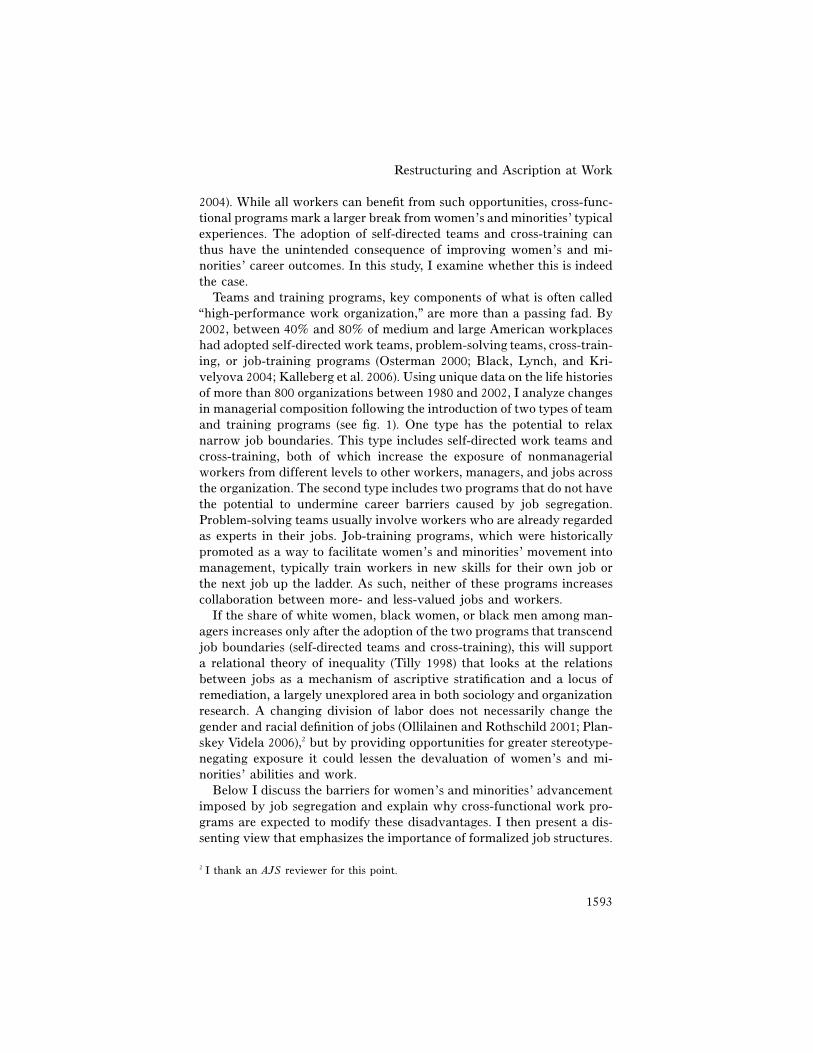
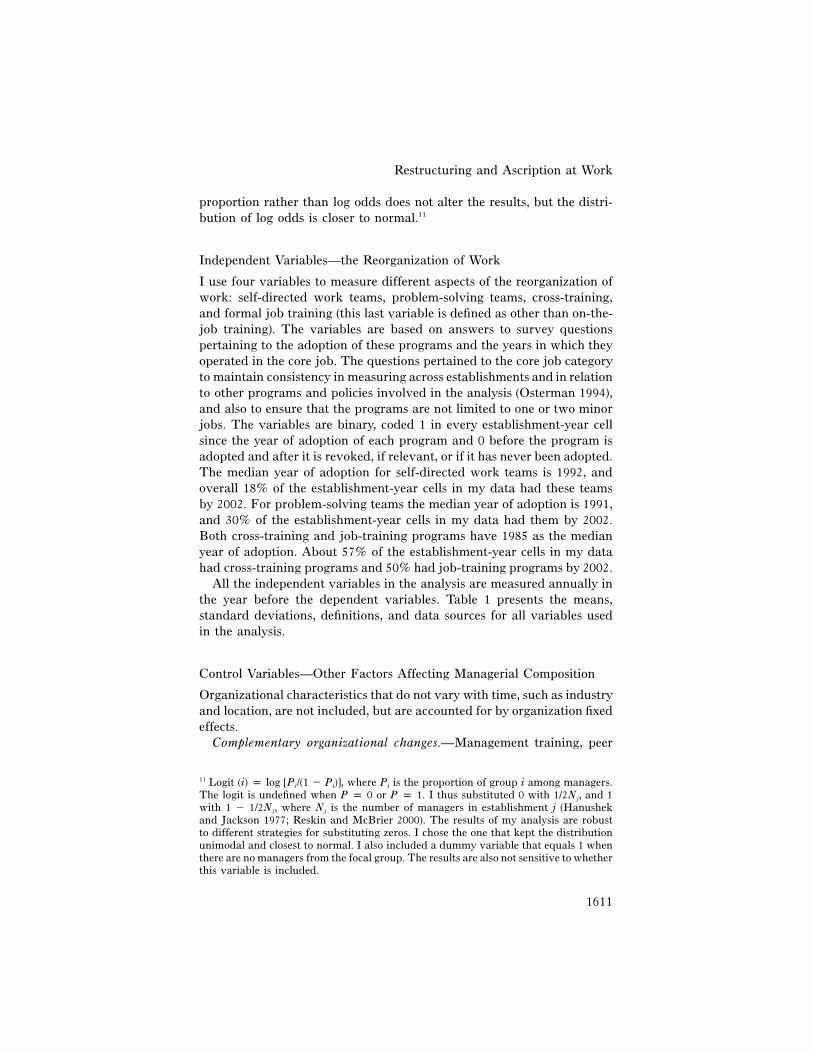
Teams and training programs, key components of what is often called“high-performance work organization,” are more than a passing fad. By2002, between 40% and 80% of medium and large American workplaceshad adopted self-directed work teams, problem-solving teams, cross-train-ing, or job-training programs (Osterman 2000; Black, Lynch, and Kri-velyova 2004; Kalleberg et al. 2006). Using unique data on the life historiesof more than 800 organizations between 1980 and 2002, I analyze changesin managerial composition following the introduction of two types of teamand training programs (see fig. 1). One type has the potential to relaxnarrow job boundaries. This type includes self-directed work teams andcross-training, both of which increase the exposure of nonmanagerialworkers from different levels to other workers, managers, and jobs acrossthe organization. The second type includes two programs that do not havethe potential to undermine career barriers caused by job segregation.Problem-solving teams usually involve workers who are already regardedas experts in their jobs. Job-training programs, which were historicallypromoted as a way to facilitate women’s and minorities’ movement intomanagement, typically train workers in new skills for their own job orthe next job up the ladder. As such, neither of these programs increasescollaboration between more- and less-valued jobs and workers.
If the share of white women, black women, or black men among man-agers increases only after the adoption of the two programs that transcendjob boundaries (self-directed teams and cross-training), this will supporta relational theory of inequality (Tilly 1998) that looks at the relationsbetween jobs as a mechanism of ascriptive stratification and a locus ofremediation, a largely unexplored area in both sociology and organizationresearch. A changing division of labor does not necessarily change thegender and racial definition of jobs (Ollilainen and Rothschild 2001; Plan-skey Videla 2006),2 but by providing opportunities for greater stereotype-negating exposure it could lessen the devaluation of women’s and mi-norities’ abilities and work.
Below I discuss the barriers for women’s and minorities’ advancementimposed by job segregation and explain why cross-functional work pro-grams are expected to modify these disadvantages. I then present a dis-senting view that emphasizes the importance of formalized job structures.
2 I thank an AJS reviewer for this point.
American Journal of Sociology
1594
Fig. 1.—Types of organizational change
After describing the team and training programs I study and exploringevidence from case studies, I present the data and methods I use and theresults.
“GLASS CAGES” AND THE REORGANIZATION OF WORK
Job Segregation as Scaffold of Ascriptive Disadvantage
Visibility with high-status workers can increase women’s and minorities’access to career opportunities (Kanter 1977; Ibarra and Andrews 1993),improve managers’ information about their potential (Thomas 2004; Hew-lett, Luce, and West 2005), and reduce the perception of risk associatedwith promoting workers from different demographic groups (Kanter 1977;Thomas and Gabbaro 1999). Women executives often cite lack of visibilityas a significant barrier to their advancement (Wellington, Knopf, andGerkovich 2003). For the women interviewed by Bell and Nkomo (2001),the opportunity to prove themselves in a prestigious task and build cred-ibility was a key career resource: “They were surprised that I was smart,competent and capable because they didn’t expect that,” recalled oneblack female manager (Bell and Nkomo 2001, p. 145). Due to their seg-regation into lower-level positions at every rank, however, women andminorities are less likely to get such a break. Their jobs usually do notinvolve communication with people outside their work group, high-profileassignments, or training eligibility (Kanter 1977; Knoke and Ishio 1998;McGuire 2000), and their networks are often composed of similarly sit-uated workers (Kanter 1977; Miller 1986; Ibarra 1992; Burt 1998; McGuire2000; Meyerson and Fletcher 2000).
Segregation not only limits visibility, but it also perpetuates negativestereotypes about women’s and minorities’ competence (Ridgeway 1997).According to expectation states theory, when men and women interactwithin a structurally unequal context, status beliefs are perpetuated, lead-ing them to recreate the gender system in everyday interaction (Ridgewayand Smith-Lovin 1999, p. 191). When structural inequality is less pro-nounced, interactions among men and women are less likely to evoke
Restructuring and Ascription at Work
1595
stereotypes (Ridgeway and Smith-Lovin 1999; Bunderson 2003). Otherresearch by social psychologists supports this notion. Research on the“contact hypothesis” (Allport 1954) shows that contact between racialgroups is more likely to reduce prejudice when participants are of peerstatus (Pettigrew and Tropp 2006). Social identity theory (Tajfel andTurner 1979), self-categorization theory (Turner 1987), and small-groupsresearch (Sherif et al. 1961) suggest that demographic group boundariesshould be less salient in the context of cooperative interdependence thatfosters a common identity (Gaertner et al. 1990; Kramer 1991; Gaertnerand Dovidio 2000; see also Reskin 2000, p. 324). Based on these insights,organizational behavior scholars have found that when organizations em-phasize collaboration and common goals rather than individualism anddistinctiveness, demographic differences become less salient (Chatman etal. 1998) and supportive intergroup relations develop (Bacharach, Bam-berger, and Vashdi 2005).
Taken together, sociological, social psychological, and organizationalresearch suggest that organizational structures that create new opportu-nities for peerlike collaborative relations between workers from more- andless-valued jobs can increase visibility and reduce the stereotyping ofwomen and minorities. The adoption of such work structures is thus likelyto result in lower levels of ascriptive inequality. This proposition echoesfeminist and postcolonial scholarship on organizations, which views thebureaucratic division of labor as reproducing white masculinity (Kanter1977; Ferguson 1984; Acker 1990; Nkomo 1992; Britton 2000; Frenkeland Shenhav 2006) and emphasizes collaborative structures as a meansof increasing the perceived value of all workers’ contributions (Meyersonand Fletcher 2000; Ely and Padavic 2007). To date we have little evidenceof the tangible benefits of such organizational structures for diversity.
An alternative view heralds the impersonality of bureaucratic rules andemployment relations as an effective means for reducing nepotism andthe ascriptive allocation of resources (Weber 1968; Bielby 2000; Reskin2000). The guiding assumption here is that formalization limits implicitbiases and unconscious stereotypes in decision making. Researchers findascriptive inequality to be lower where personnel decisions are more for-malized (Reskin and McBrier 2000; Elvira and Zatzick 2002) and inworkplaces with bureaucratic employment logics (Baron et al. 2007) andhigher in workplaces where social relations and collegiality are empha-sized as part of the organization of work (McIlwee and Robinson 1992;Cook and Waters 1998). Others find that, regardless of their positions atwork, women’s and minorities’ social networks remain less useful becauseof stereotypes and devaluation (McGuire 2002). According to this view,blurring job boundaries and emphasizing cross-functional collaborationwill at best have no effect on gender and racial disadvantage and at worst
American Journal of Sociology
1596
deepen it, as the deterioration of formal rules governing jobs and assign-ments unleashes bias and discrimination.
Changes at Work
The diffusion of cross-functional teams and training programs providesa unique opportunity for examining the relationship between the structureof work and the ascriptive structure of opportunities. The ideas of teamsand job enrichment have been around at least since the 1930s, with EltonMayo’s human relations theory and, later, Douglas McGregor’s human-istic management. The contemporary surge of these programs is usuallyassociated with technological changes and accelerating international com-petition in the early 1980s. Inspired by Japanese and Western Europeanexperiences, managers and scholars viewed moving away from the Fordistmodel of production toward team structures and skill-development pro-grams as an effective way to improve quality and competitiveness (Pioreand Sabel 1984). Research on these transformations has mostly focusedon their implications for labor control and firm performance (Barker 1993;Appelbaum et al. 2000; Osterman 2000; Handel and Levine 2004). Yetscholarship on the implications of restructuring for gender and racialinequality has developed as well, particularly around case studies illus-trating the new opportunities these programs can provide disadvantagedworkers (Kvande and Rasmussen 1994; Smith 1996; Ollilainen and Roths-child 2001; Daday and Burris 2002; Smith-Doerr 2004). Given that cross-functional programs modify the segregated structure of jobs, and giventhe documented role of segregation in perpetuating disadvantage, it islikely that such restructuring of work will have unintended consequenceson women’s and minorities’ positions. Below I discuss evidence on theeffects of these programs in more detail.
Team-Based Organization of Work
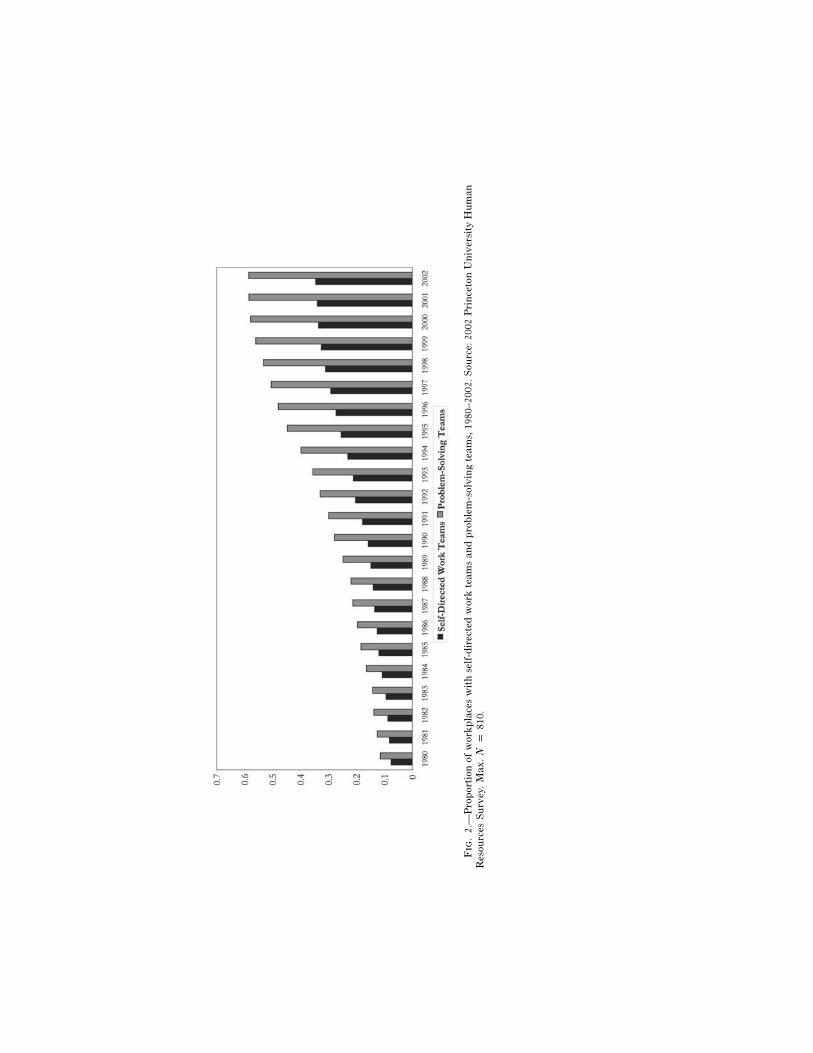
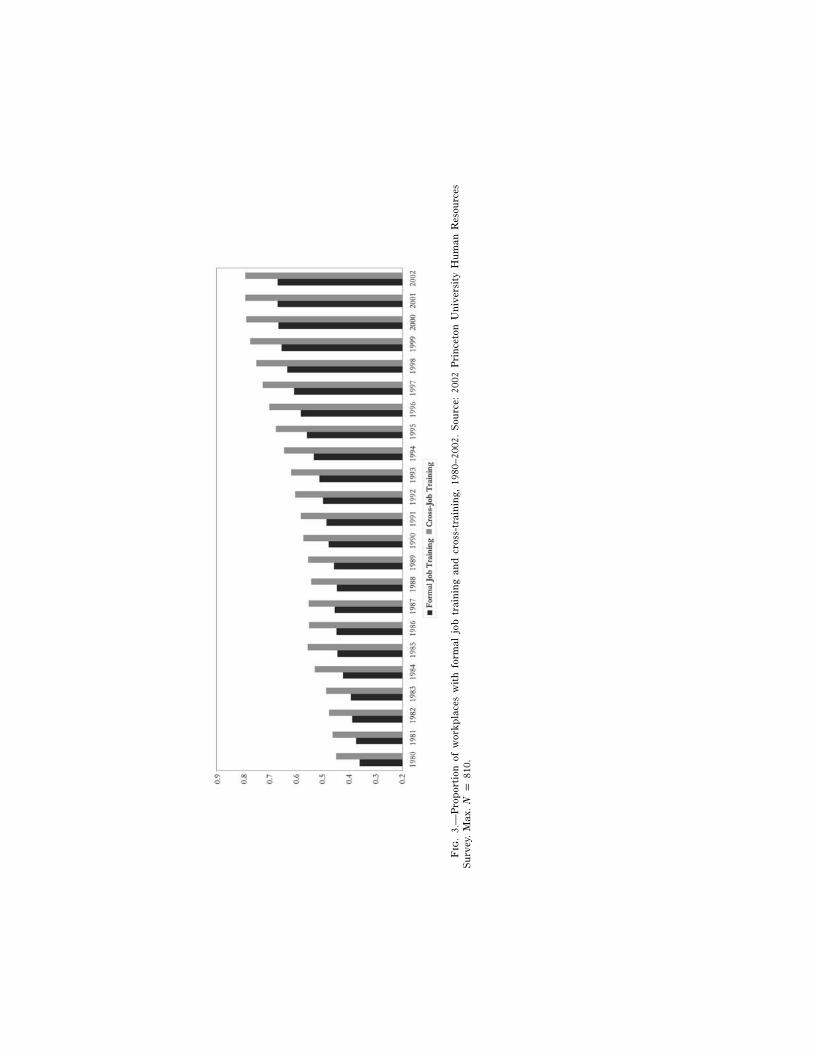
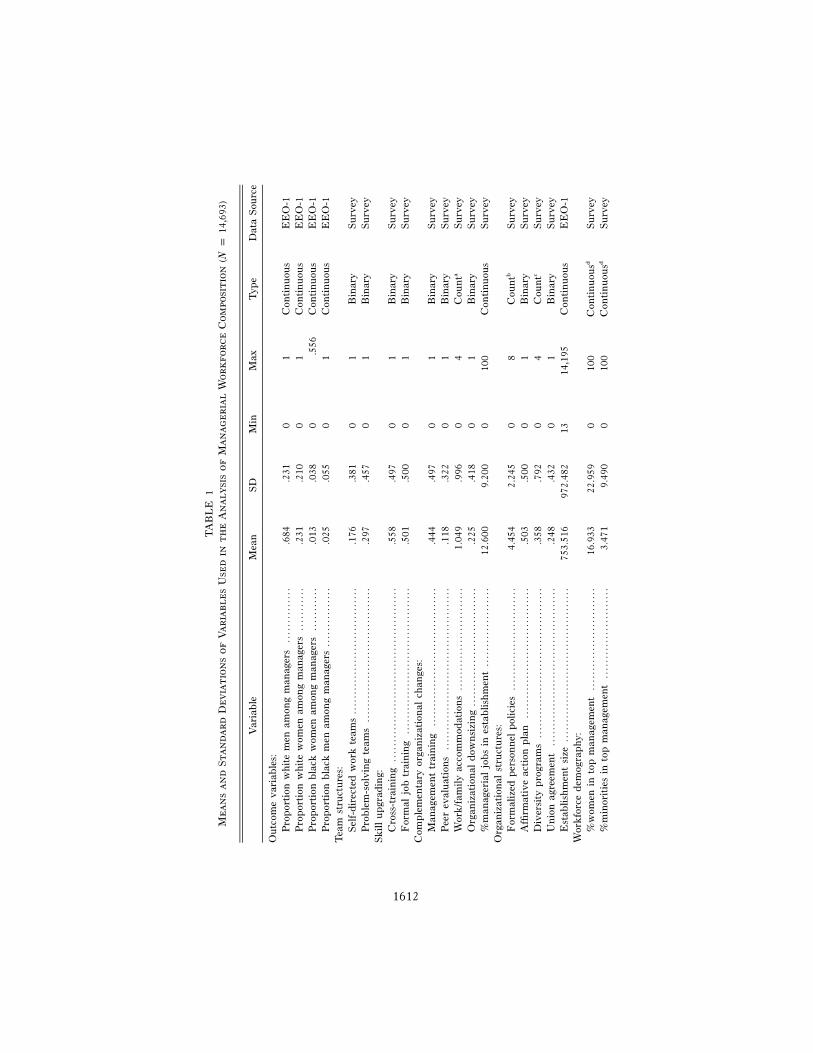
Few dispute the popularity of team-based work structures in Americanworkplaces. Figure 2 shows the proportion of workplaces with self-directed work teams or problem-solving teams from 1980 to 2002,based on a 2002 retrospective survey of a stratified random sample of 810medium and large American establishments. The proportions are basedon the number of surveyed workplaces that existed in each year. Thesample represents older and more stable work establishments, and thefindings might be more pronounced in a sample of younger firms. Self-directed work teams were adopted by about 7% of the organizations thatexisted in the early 1980s, compared to roughly 35% of the organizationsexisting in 2002. In the median organization, 75% of core-job workers
Fig
.2.
—P
rop
orti
onof
wor
kp
lace
sw
ith
self
-dir
ecte
dw
ork
team
san
dp
rob
lem
-sol
vin
gte
ams,
1980
–200
2.S
ourc
e:20
02P
rin
ceto
nU
niv
ersi
tyH
uman
Res
ourc
esS
urv
ey.
Max
.N
p81
0.
American Journal of Sociology
1598
participated in such teams in 2002 (core job is defined as the largest jobcategory in the establishment). Problem-solving teams, a more modesttransformation of work arrangements, were adopted by about 11% ofexisting workplaces in the early 1980s, compared to 60% in 2002, with amedian of 50% of core-job workers participating. Similar figures are foundin other national surveys (Lawler, Mohrman, and Ledford 1992; Kelly2000; Osterman 2000; Kalleberg et al. 2006).
Self-directed work teams.—Self-directed work teams are considered themost far-reaching effort to transform the organization of work (Cappelliet al. 1997; Osterman 2000; Appelbaum and Berg 2001). These teamstypically bring together workers from different jobs to hold frequent meet-ings, assume joint responsibilities on work tasks, share knowledge, andparticipate in decision making. For example, in a high-tech company,engineers, technicians, and administrative assistants are members of self-directed work teams. They meet a few times a week to design and createnew technologies (Daday and Burris 2002, p. 12). In a bank, team membersare jointly responsible for phone service and technical tasks (Ollilainenand Rothschild 2001, p. 153), and workers in a paper mill plan key ac-tivities and tasks collectively, assign and rotate jobs among themselves,and assume greater responsibility for production, quality, and safety (Val-las 2003c, p. 230).
Some work teams might do little more than impose production quotason workers, with no real changes in the work routine (Taplin 1995; Smith1997). Yet case studies point to several ways in which self-directed workteams can enhance women’s and minorities’ career opportunities: theyenable workers to perform tasks beyond their traditional job boundariesand demonstrate hitherto unobserved capabilities (Smith 1996; Berg,Frost, and Preuss 2001; Smith-Doerr 2004); to be treated with more respectby their co-workers (Kvande and Rasmussen 1994; Daday and Burris2002; Smith-Doerr 2004); and to resist subordination (Ollilainen andRothschild 2001; Planskey Videla 2006). Below I detail some of thisevidence.
Analyzing data on more than two thousand life scientists, Smith-Doerr(2004) finds that women are significantly more likely to be in supervisorypositions when they work in biotech firms that are organized aroundproject-based teams than in hierarchical organizations. The female sci-entists Smith-Doerr interviewed attributed this difference to the flexibilityto collaborate with more people in a peerlike fashion and to the highervisibility of their skills and contributions in a team environment. In an-other context, a similar account was given by a human resources managerat a large auto-manufacturing firm:3
3 Personal communication, June 15, 2001.
Restructuring and Ascription at Work
1599
I started as a security guard and climbed my way up to being a secretary,and then to a higher secretary, and in the last three years I am in thisposition in HR, EEO representative, and an administrator of salaried per-sonnel. It wasn’t easy. . . . I had to work hard to prove my talent. To makepeople see my talent. Because my job didn’t provide such opportunities,joining work teams was the best way for me to do that. . . . In general, Ithink that it’s a good opportunity to interact with people, and with peoplein management, and to show that you can do things.
The visibility granted by the teaming structure is often absent in women’sand minorities’ segregated jobs.
Researchers find that status differences are less pronounced when workis structured in cross-functional teams (Kvande and Rasmussen 1994;Smith-Doerr 2004). Studying a high-tech company, for example, Dadayand Burris (2002) argue that the teaming environment mitigates the ex-empt/nonexempt divide (which, for the most part, is also a gender andracial divide). As one of their interviewees, an administrative assistant,attests, “Nonexempt can now feel like they are not demeaned; they aretreated as an equal part of the team” (Daday and Burris 2002, p. 17).Gender and racial biases do not stop at the team’s doorstep. Researchersfind that men and whites in teams continue to erect boundaries thatexclude women and minorities (Ollilainen and Rothschild 2001; Dadayand Burris 2002; Vallas 2003a, p. 235). But because job boundaries andstatus differences are more lax and are not reinforced by the formal struc-ture of work, stereotypes are less likely to be reinforced in the team context(Ridgeway and Smith-Lovin 1999; Pettigrew and Tropp 2006), and high-quality relations between workers from diverse groups are likely to evolve(Phillips, Rothbard, and Dumas, in press).
The adoption of self-directed work teams may also open new avenuesfor women and minorities to resist stereotypes and ascription—first, sim-ply by demonstrating their capabilities, as previous examples have shown,and second, by using the team rhetoric to claim their rights. For example,Ollilainen and Rothschild (2001, p. 154) report that while men continuedto treat the women in their team as secretaries, these women resisted theirdegradation as team members, and their concerns were openly discussedin team meetings. Their grievances would have had no legitimacy absentthe team context. In another example, Planskey Videla (2006, p. 108) showshow, despite the gender subordination in their teams, women used theteam’s autonomy to further their interests, such as favoring mothers ingranting permission for time off.
These new opportunities presented by the team structure to becomevisible in stereotype-negating contexts, to network, to be treated withrespect, and to resist devaluation can translate into better career oppor-tunities for women and minorities (Smith 1996, p. 178; Ollilainen and
American Journal of Sociology
1600
Rothschild 2001, p. 161; Smith-Doerr 2004) and improve their access tobetter jobs.
Problem-solving teams.—A different team structure is best known asquality circles, or off-line expert teams, which originated in the “qualitymovement” of the early 1980s. These teams are less inclusive. They tendto be composed of experts, who are mostly white and male, who cometogether periodically to address problems of quality, efficiency, or safety(Cappelli et al. 1997, pp. 90–92; Smith 1997; Vallas 2003c, p. 232; Batt2004, p. 188). Unlike self-directed work teams, then, problem-solvingteams have less potential to ameliorate the segregated structure of jobsand increase the exposure of women and minorities to new people andwork tasks. And so, if counteracting segregation is the mechanism thatleads to increases in managerial diversity, we are not likely to observe anincrease in diversity following the adoption of such teams.
Cross-training and Job-Training Programs
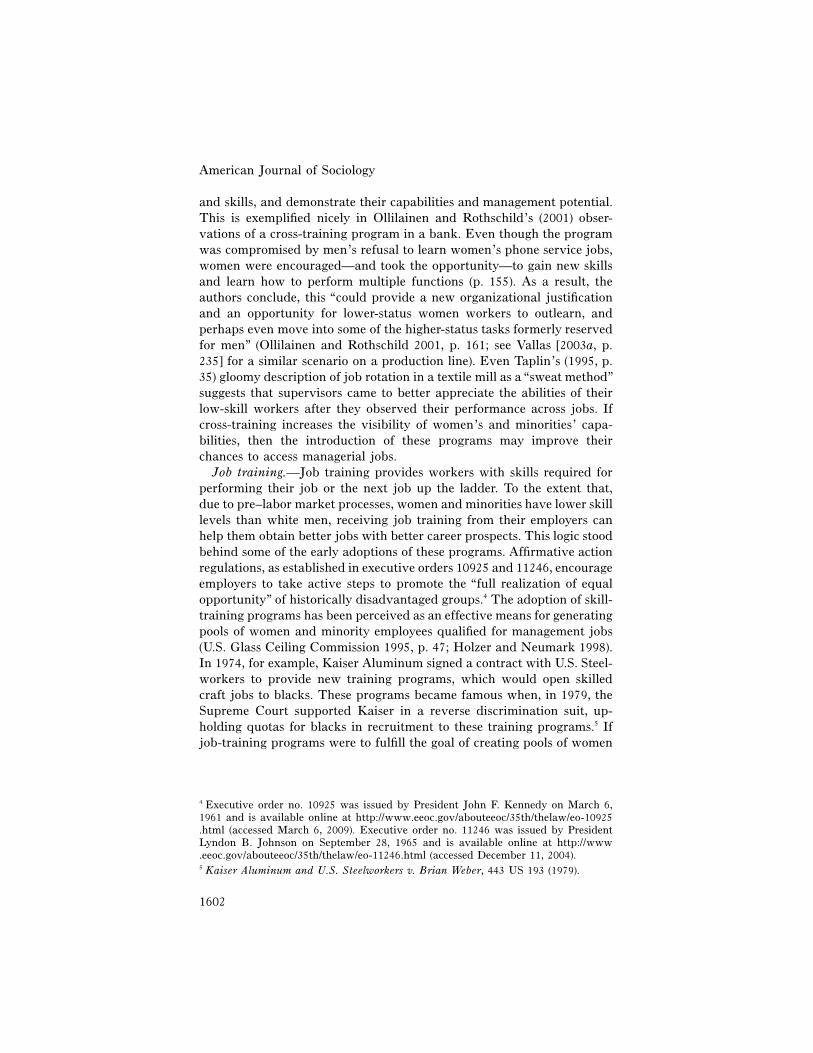
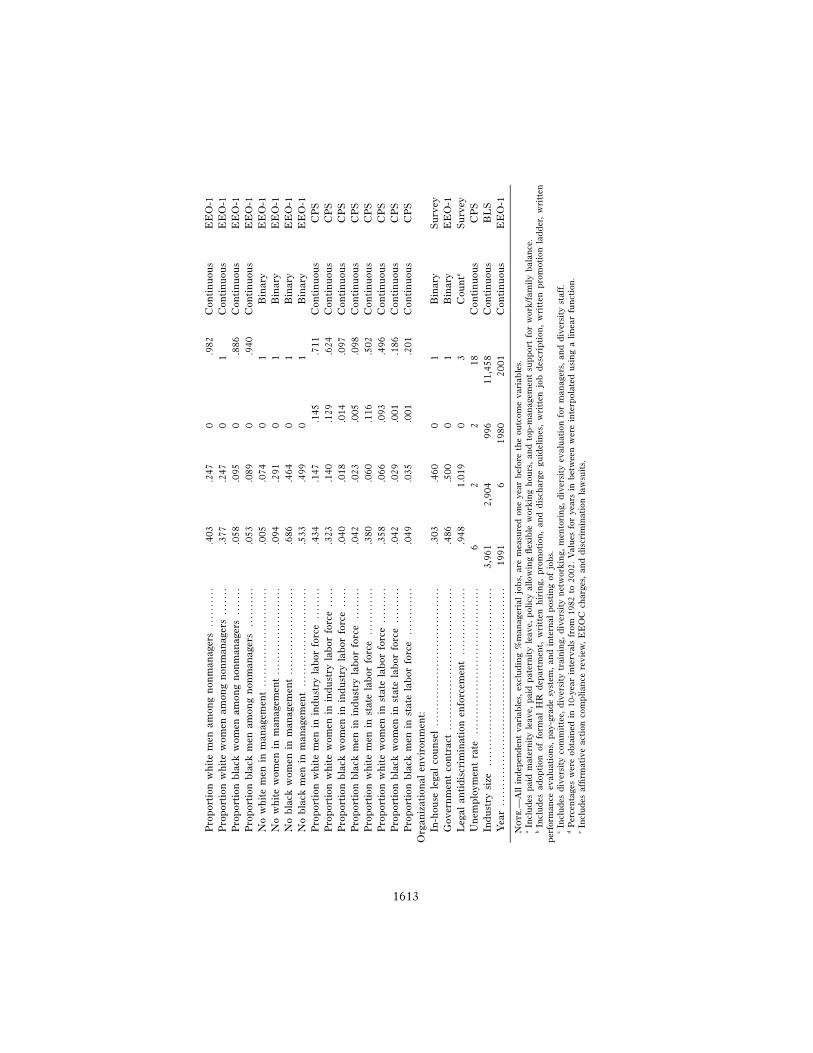
Developing workers’ skill is another commonly cited aspect of the re-organization of work (Piore and Sabel 1984; Osterman 1995), with em-ployers offering workers cross-training and regular job-training programs(U.S. Department of Labor 1992; Osterman 1994; Lynch and Black 1998;Appelbaum and Berg 2001). As figure 3 shows, cross-training was offeredby about 45% of the existing workplaces in my data in 1980, and thisgrew to almost 80% in 2002. The figures for job-training programs are35% and 67%, respectively (see also Osterman 2000; Kalleberg et al. 2006).
Before I discuss these two types of training, it is important to note thatin analyzing the adoption of training programs, I do not examine indi-vidual skill level. My research question is whether organizational changes,in the form of adopting cross-training or job-training programs, have beeneffective in bringing more women and minorities into management.
Cross-training.—Cross-training involves multiskilling programs thatprovide workers with knowledge of and experience in different jobs. Thecontent of these programs varies widely; while some studies report oncross-training programs that enrich workers’ skills and increase their mo-tivation and job satisfaction (Adler 1992; Campion, Cheraskin, and Ste-vens 1994; Ollilainen and Rothschild 2001), others describe them as “job-intensification” methods (Smith 1997, p. 322), whereby workers arepressured to perform more deskilled work at a higher pace (Taplin 1995;Handel and Levine 2004, p. 6).
Like self-directed work teams, cross-training programs can underminethe negative implications of job segregation on women’s and minorities’careers. Through rotating across jobs, women and minorities can reachout beyond their job boundaries, gain access to new people, experiences,
Fig
.3.
—P
rop
orti
onof
wor
kp
lace
sw
ith
form
aljo
btr
ain
ing
and
cros
s-tr
ain
ing,
1980
–200
2.S
ourc
e:20
02P
rin
ceto
nU
niv
ersi
tyH
um
anR
esou
rces
Su
rvey
.M
ax.
Np
810.
American Journal of Sociology
1602
and skills, and demonstrate their capabilities and management potential.This is exemplified nicely in Ollilainen and Rothschild’s (2001) obser-vations of a cross-training program in a bank. Even though the programwas compromised by men’s refusal to learn women’s phone service jobs,women were encouraged—and took the opportunity—to gain new skillsand learn how to perform multiple functions (p. 155). As a result, theauthors conclude, this “could provide a new organizational justificationand an opportunity for lower-status women workers to outlearn, andperhaps even move into some of the higher-status tasks formerly reservedfor men” (Ollilainen and Rothschild 2001, p. 161; see Vallas [2003a, p.235] for a similar scenario on a production line). Even Taplin’s (1995, p.35) gloomy description of job rotation in a textile mill as a “sweat method”suggests that supervisors came to better appreciate the abilities of theirlow-skill workers after they observed their performance across jobs. Ifcross-training increases the visibility of women’s and minorities’ capa-bilities, then the introduction of these programs may improve theirchances to access managerial jobs.
Job training.—Job training provides workers with skills required forperforming their job or the next job up the ladder. To the extent that,due to pre–labor market processes, women and minorities have lower skilllevels than white men, receiving job training from their employers canhelp them obtain better jobs with better career prospects. This logic stoodbehind some of the early adoptions of these programs. Affirmative actionregulations, as established in executive orders 10925 and 11246, encourageemployers to take active steps to promote the “full realization of equalopportunity” of historically disadvantaged groups.4 The adoption of skill-training programs has been perceived as an effective means for generatingpools of women and minority employees qualified for management jobs(U.S. Glass Ceiling Commission 1995, p. 47; Holzer and Neumark 1998).In 1974, for example, Kaiser Aluminum signed a contract with U.S. Steel-workers to provide new training programs, which would open skilledcraft jobs to blacks. These programs became famous when, in 1979, theSupreme Court supported Kaiser in a reverse discrimination suit, up-holding quotas for blacks in recruitment to these training programs.5 Ifjob-training programs were to fulfill the goal of creating pools of women
4 Executive order no. 10925 was issued by President John F. Kennedy on March 6,1961 and is available online at http://www.eeoc.gov/abouteeoc/35th/thelaw/eo-10925.html (accessed March 6, 2009). Executive order no. 11246 was issued by PresidentLyndon B. Johnson on September 28, 1965 and is available online at http://www.eeoc.gov/abouteeoc/35th/thelaw/eo-11246.html (accessed December 11, 2004).5 Kaiser Aluminum and U.S. Steelworkers v. Brian Weber, 443 US 193 (1979).
Restructuring and Ascription at Work
1603
and minorities eligible for promotion, managerial diversity should increaseafter employers adopt these programs.
Facing intensified international competition during the 1980s and 1990s,employers increased their provision of skill training as a way to improvequality and productivity (U.S. Department of Labor 1992; Lynch andBlack 1998). Studies indicate, however, that employers view training moreas an investment in human capital than as a means of equalizing op-portunities; employers tend to provide job training to workers whom theyperceive as most likely to return the investment, namely, more educatedworkers and those they expect to have continued employment and highproductivity (Hight 1998; Lynch and Black 1998). These preferences resultin statistical discrimination against women and minorities (Knoke andIshio 1998). Not surprisingly, then, studies have shown that employer-provided training has not lived up to its potential to iron out pre–labormarket disadvantages (Appelbaum and Berg 2001). If this is the case, theadoption of job-training programs will not bring more women and blacksinto management.
Summary
I examine changes in the shares of women and minorities in managementfollowing the adoption of two types of team and training programs. Basedon a structural relational approach to stratification that views job seg-regation as a mechanism of ascriptive inequality, I expect those programsthat counteract job segregation—self-directed teams and cross-training—to be followed by an increase in managerial diversity. To the extent thatwhite men’s higher share of managerial jobs is a result of sex- or race-based privilege, programs that reduce ascription are likely to reduce whitemen’s advantage (Reskin and McBrier 2000, p. 210). Because problem-solving teams and formal job training do not alter the organization ofjobs, I do not expect their adoption to lead to similar increases in man-agerial diversity. Thus, I hypothesize that the adoption of self-directedwork teams and cross-training programs will be associated with subse-quent increases in the proportions of white women, black women, andblack men and a decline in the proportion of white men among managers.
A caveat to this hypothesis is related to the differences between themechanisms shaping gender and racial inequality at work. First, whitewomen are, on average, more educated than blacks and better positionedin organizations (Bell, Nkomo, and Hammond 1994; Altonji and Blank1999, pp. 3151–55); consequently, white women may be more likely tomake use of their new career resources and acquire management positions.Second, research shows that racial diversity, to a greater extent thangender diversity, can have a negative impact on group processes, such as
American Journal of Sociology
1604
communication and integration (Baugh and Graen 1997; Williams andO’Reilly 1998, p. 115; Townsend and Scott 2001; Vallas 2003b); hence,racial boundaries may be slower to change than gender boundaries. Thesedifferences lead me to expect that self-directed teams and cross-trainingwill be associated with higher subsequent increases in the proportion ofwhite women among managers than in the proportions of black womenand black men among managers.
ALTERNATIVE SOURCES OF VARIATION IN MANAGERIALDIVERSITY
Some organizational changes that often accompany the adoption of teamand training programs may also affect the gender and racial compositionof management. I incorporate in the analysis measures of those changesand of other factors related to management composition, including theorganizations’ structure, labor pools, and legal and economic environ-ments. Note that because I use a fixed-effects analysis, factors that donot vary with time, such as industry or geographical location, cannot beincluded in the models explicitly, but the variation stemming from themis implicitly accounted for.
Complementary Organizational Changes
Management training.—Firms that adopt autonomous work teams mayestablish leadership-training programs (as distinct from job-training pro-grams), with the idea of increasing workers’ efficacy in these teams (Ap-pelbaum et al. 2000, p. 104). These training programs can provide womenand minorities a formal path and credentials for entering the managerialpipeline, and so their introduction should increase management diversity.
Peer evaluations.—Peer evaluations, whereby workers are evaluatedby their co-workers, are common among firms with team structures. Re-searchers have found gender and racial bias in managers’ performanceevaluations (Greenhaus, Parasuraman, and Wormley 1990; Williams andO’Reilly 1998; Elvira and Town 2001). Peer evaluations rely on a broaderset of views that may be less biased (Smith-Doerr 2004) and consequentlymay improve the promotion chances of women and minorities.
Work/family accommodations.—Employers that adopt “high-perfor-mance” programs are likely to adopt work/family practices as well (Berg,Kalleberg, and Appelbaum 2003). Because the “ideal worker” is expectedto be available for work around the clock and because women still bearprimary caregiving responsibilities (Williams 2000), women are expectedto benefit disproportionately from employers’ work/family support.
Restructuring and Ascription at Work
1605
Organizational downsizing.—Downsizing of the establishment’s work-force is likely to accompany changes in the organization of work (Oster-man 2000; Black et al. 2004) and may affect workforce composition.Studies of downsizing layoffs, though not focused on managerial jobs,suggest that blacks are more likely to be displaced than whites, controllingfor individual and occupational characteristics (Fairlie and Kletzer 1998;Elvira and Zatzick 2002), while women seem to be less or equally as likelyas men to be displaced (Farber 1997). Hence, downsizing may reduce theshare of blacks in management.
Percentage of managerial jobs.—Osterman (2000) finds that establish-ments with high-performance work organization have smaller managerialranks. Growth in managerial ranks has been shown to increase diversity(Blum, Fields, and Goodman 1994). Konrad and Linnehan (1995) andLeonard (1990, p. 52) find that managerial growth positively affects whitewomen more than African-Americans.
Organizational Structures
Personnel policies.—The presence of formal personnel systems has playeda prominent role in research on organizational stratification. Such systemsare expected to limit managerial discretion and thereby curtail discrim-ination (Reskin 2000). Using data from the National Organizations Survey,Reskin and McBrier (2000) find that formalization of personnel decisionsis associated with a lower share of white men in management. Otherscontend that formalization may create separate career trajectories fordifferent groups and thus may not equalize access to management acrossgroups (Baron and Bielby 1985; Baldi and McBrier 1997). Still othersfind that some “identity-conscious” personnel programs, namely, affir-mative action and diversity policies, are effective in increasing manage-ment diversity (Konrad and Linnehan 1995; Edelman and Petterson 1999;Holzer and Neumark 2000; Kalev, Dobbin, and Kelly 2006). I include inthe analysis measures for formalized personnel policies, affirmative actionplans, and diversity programs, expecting these programs to have a positiveeffect on managerial diversity.
Union agreement.—Unions may affect management diversity to theextent that they can affect the composition of workers in promotable jobs.Despite improvements in their status, women remained underrepresentedin unions in the period under study (Milkman 2007), while black menwere disproportionately hurt by the decline in union coverage during the1980s (Blau and Kahn 1992, p. 9). Union coverage may thus correlatewith white and male advantage in access to good, promotable jobs. Yetunions vary in composition and agendas (Leonard 1985; Baron, Mittman,and Newman 1991). For example, some unions have promoted work/
American Journal of Sociology
1606
family programs, which may enhance women’s careers (Kelly 2003). Theirexpected effect can thus go either way.
Establishment size.—Growth in establishment size may be an indicationof success, rendering managerial jobs more desirable, and more likely togo to white men than to women and minorities (Reskin and Roos 1990).Evidence is mixed (Bielby and Baron 1986; Baron et al. 1991; Reskin1993), and so I do not specify the direction of the expected effect.
Workforce Demography
Women and minorities in top management.—Managerial composition issaid to be self-reproducing due to homosocial reproduction (Kanter 1977;Elliott and Smith 2004), social closure (Tomaskovic-Devey 1993; Roscigno2007), or social networks (Burt 1998; Reskin and McBrier 2000). Cohen,Broschak, and Haveman (1998) find that women are more likely to bepromoted when some of the positions above them are filled by women.I thus expect the gender and racial composition of top management tobe positively associated with the overall composition of managerial rungs.
Demographic composition of the external and internal labor pools.—Employers operating in diverse labor markets have a more diverse poolof managerial candidates to draw from and may also face pressures toadopt norms of inclusiveness (Blum et al. 1994, p. 245). The compositionof nonmanagerial jobs at the organization may affect women’s and mi-norities’ access to management also because members of these groups aremore likely to supervise workers from the same groups (Paulin and Mellor1996; Cohen et al. 1998; Elliott and Smith 2001).
Organizational Environment
Legal environment.—Title VII of the Civil Rights Act of 1964 outlaweddiscrimination based on sex and race, and in 1965, executive order number11246 mandated that covered employers take “affirmative action” to enddiscrimination in employment (see n. 4 above). Research has establishedthat employers that have a legal counsel and those that experience TitleVII litigation or affirmative action compliance reviews are more likely tosee increases in managerial diversity (Leonard 1984; Kalev and Dobbin2006; Skaggs 2008).
Unemployment.—High unemployment rates may disadvantage womenand minorities in the labor queue for managerial jobs (Reskin and Roos1990). I thus expect lower managerial diversity when unemployment ishigh.
Industry size.—Growing industries may provide more opportunities forwomen and minorities, but they also indicate increased market success,
Restructuring and Ascription at Work
1607
which renders managerial jobs more attractive and more likely to go towhite men (Reskin and Roos 1990). Because the analysis includes separatemeasures for the proportion of each group in the industry labor force, Iexpect growth in industry employment to be associated with a higherpresence of white men in management.
DATA AND METHODS
I analyze unique longitudinal data on annual measures of the workforcecomposition and work practices of 810 establishments to estimate changesin the proportions of managers who are white men, white women, blackwomen, and black men following the adoption of team and training pro-grams between 1980 and 2002.
Data
The data set was assembled from two main sources: annual reports onestablishments’ workforce composition from 1980 to 2002 and an originalsurvey of these same establishments’ work and personnel structures. Thedata collection was conducted in collaboration with Frank Dobbin andwas funded by the National Science Foundation and the Russell SageFoundation.
The workforce composition data come from annual EEO-1 reportssubmitted to the Equal Employment Opportunity Commission (EEOC)by all private-sector employers with more than 100 employees and gov-ernment contractors with more than 50 employees and $50,000 worth ofcontracts.6 These reports detail the sex, racial, and ethnic composition ofthe workforce in nine broad occupational categories. These data wereobtained for research purposes from the EEOC under an Intergovern-mental Personnel Act (IPA) agreement.7
The broad occupational categories used by the EEOC obscure segre-gation within management, where women and minorities are often con-centrated in lower-level positions. Accordingly, my analysis examines the
6 Excluded employers, such as state and local governments, schools, and colleges, pro-vide different reports (see the EEOC’s “Instructions for Standard Form 100 (EEO-1),” available at http://www.eeoc.gov/stats/jobpat/e1instruct.html [accessed April 19,2004]).7 EEO-1 data were obtained for 1971–2002. The 1970s were not included here becausecross-functional work arrangements as such began their diffusion in the early to mid-1980s, with high-profile employers such as GM, Xerox, and Corning transforming theirorganization of work. The in-person interviews I conducted in 2000–2001 confirm thatwhen employers talk about cross-training before the 1980s, they are referring to it aspart of executive programs.
American Journal of Sociology
1608
entrance of women and minorities at least to lower-level managerial ranks,but not mobility within management.8 Still, EEO-1 reports provide thebest available data for studying long-term change in organizations’ work-force composition (see Robinson et al. 2005).
I drew a random sample of establishments from the EEO-1 data forthe year 1999 (the latest year of data available at the time of sampling).The sample was stratified by the number of years the establishment ap-peared in the EEO-1 data to ensure a sufficient longitudinal perspectiveas well as variation in the establishments’ age. Half of the establishmentshad to have been in the data at least since 1992 and half since 1980. Thesample was also stratified by size, with 35% of the establishments havingless than 500 employees, and by industry, into the following categories:food, chemical, computer, and transportation equipment manufacturing,wholesale and retail trade, and insurance, business, and health services.The sampling unit was an establishment (that is, a single location of afirm or a firm with a single location), and only one establishment perparent firm was sampled.
Before composing the survey instrument, I examined the wording andfindings of other employment surveys conducted in the last decade (inparticular, Appelbaum, Bailey, and Berg 2000; Kelly 2000; Osterman2000), as well as information about changes in work organization obtainedfrom in-person interviews with human resources managers that I con-ducted in 2000–2001. During 2002, trained interviewers at the PrincetonUniversity Survey Research Center completed 833 interviews with a re-sponse rate of 67%, which is higher than or comparable to similar surveys(Osterman 1994, 2000; Kalleberg et al. 1996; Kelly 2000).9 The interview-ees were mostly human resources or plant managers with an average
8 The growth in managerial diversity in the EEO-1 reports may be an artifact of thereclassification of clerical and lower-level supervisory jobs as management jobs (Smithand Welch 1984; Baron and Bielby 1985). Reclassification is most likely to have oc-curred in the 1970s, the early years of the EEO-1 reporting requirement. Nonetheless,I excluded all organization-year cells in which there was a large change in the numberof women or blacks in management (larger than 95% of the cases), and results werenot affected. This is consistent with evidence that women’s and minorities’ entranceto management does represent a significant, if small, change in their status (Jacobs1992).9 I examined response bias using logistic regression with industry, establishment status(headquarters, subunit, or stand-alone organization), size, government contract status,and managerial composition (results are available upon request). Responding estab-lishments were larger and had a larger proportion of white men in their managerialranks than nonresponding organizations. Size is included in the models, as well as thecomposition of top management teams. All industries were equally likely to participatein the survey, excluding establishments from the business services industry, which wereless likely to participate. The proportion of each industry in the final sample varieslittle, between 9.66% and 12.80%.
Restructuring and Ascription at Work
1609
tenure of 11 years. Interviewees were asked whether a series of programsrelated to the organization of work had ever been adopted in their es-tablishment, in what years they were first adopted, and whether they werestill in place. The survey included similar questions about related per-sonnel practices and other organizational characteristics that are includedas control variables in this analysis. When the respondents did not knowthe year in which certain programs were adopted, they were sent a listof the unanswered questions, so they could answer them after consultingtheir records or colleagues. For three of the four programs examined here,4% or less of the respondents did not know the years of adoption. Forjob-training programs this number was 7%. All missing values were im-puted using ordinary least squares (OLS) regression with industry, estab-lishment age, and type of establishment as covariates. The results remainrobust when imputed data for each variable are excluded.
Upon completion of the phone interviews, I matched the survey datafor each establishment with the corresponding annual EEO-1 records andremoved all identifying information from the data set to ensure confi-dentiality. Data on national, state, and industry labor market character-istics were added from Bureau of Labor Statistics (BLS) sources. Thefinal data set used in this analysis contains 810 cases and 14,693 estab-lishment-years, with a median of 23 years of data for each establishment.10
Dependent Variable—Managerial Diversity
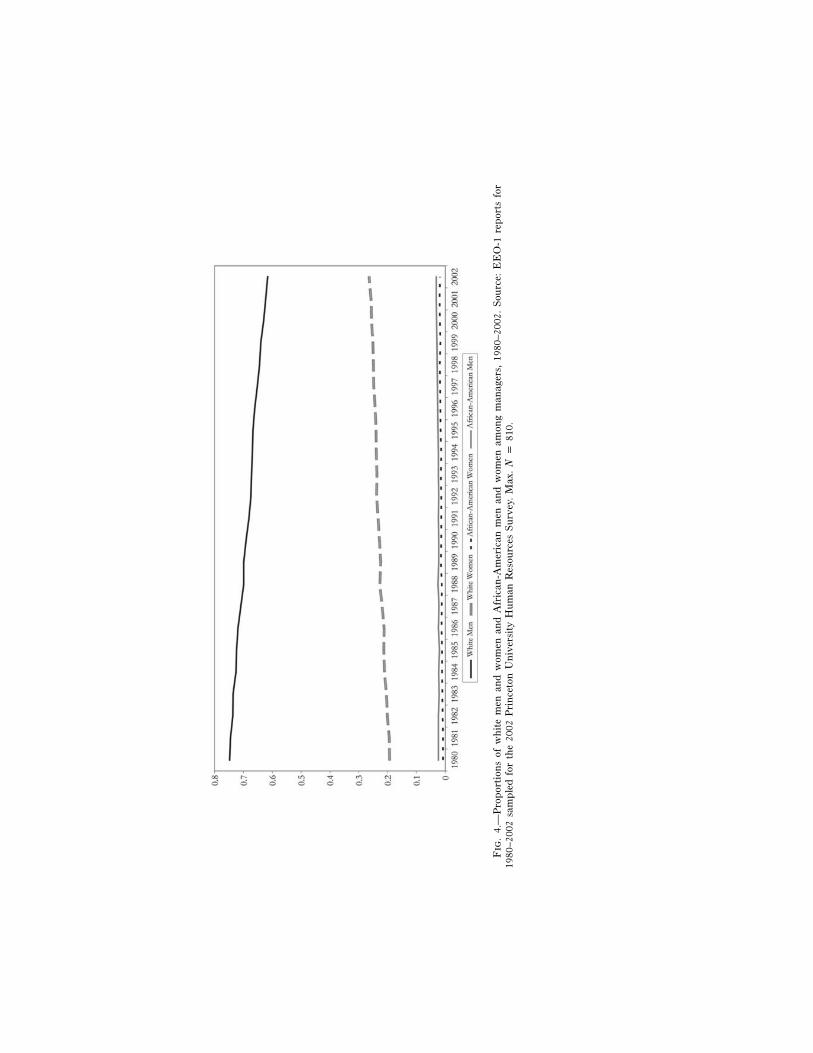
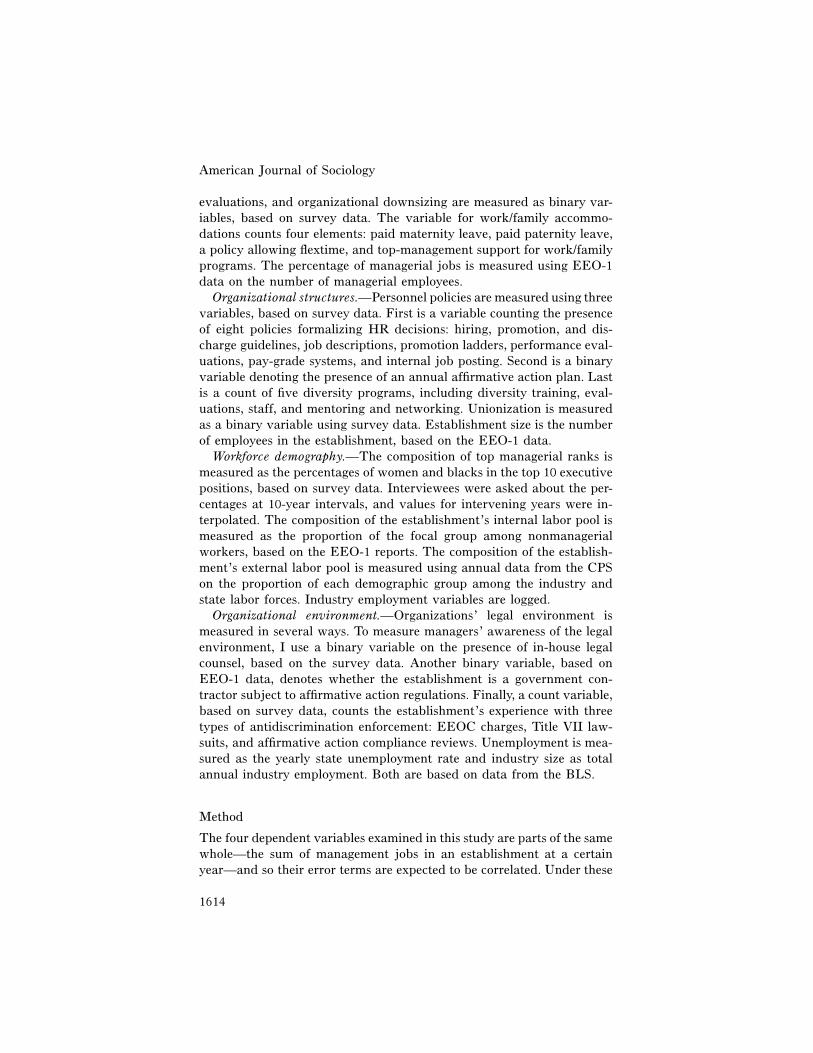
The outcome variables are the proportions of white men, white women,black women, and black men among managers in an establishment, ascalculated from the EEO-1 data. Between 1980 and 2002 the share ofwhite men among managers declined from 75% to 62%, while whitewomen’s share grew from 19% to 26%, black women’s from less than1% to 2%, and black men’s from 2.4% to 3.1% (see fig. 4). Similar trendsare found in the overall EEO-1 data set and in data from the CurrentPopulation Survey (CPS) of the BLS, but those other data sets show largergains for women and blacks because they describe a dynamic population,rather than the stable set of firms in my sample, and they also includenonprofits and government agencies.
Because there are large differences in the absolute magnitude of thechange in the proportions across groups, I use the log odds of each group’sbeing in management as dependent variables (Fox 1997, p. 78). Using log
10 For 15 cases, EEO-1 data were usable for only four years or less. For an additionaleight cases, the survey data were unusable. These cases are excluded from the analysis.
Fig
.4.
—P
rop
orti
ons
ofw
hit
em
enan
dw
omen
and
Afr
ican
-Am
eric
anm
enan
dw
omen
amon
gm
anag
ers,
1980
–200
2.S
ourc
e:E
EO
-1re
por
tsfo
r19
80–2
002
sam
ple
dfo
rth
e20
02P
rinc
eton
Uni
vers
ity
Hu
man
Res
ourc
esS
urv
ey.
Max
.N
p81
0.
Restructuring and Ascription at Work
1611
proportion rather than log odds does not alter the results, but the distri-bution of log odds is closer to normal.11
Independent Variables—the Reorganization of Work
I use four variables to measure different aspects of the reorganization ofwork: self-directed work teams, problem-solving teams, cross-training,and formal job training (this last variable is defined as other than on-the-job training). The variables are based on answers to survey questionspertaining to the adoption of these programs and the years in which theyoperated in the core job. The questions pertained to the core job categoryto maintain consistency in measuring across establishments and in relationto other programs and policies involved in the analysis (Osterman 1994),and also to ensure that the programs are not limited to one or two minorjobs. The variables are binary, coded 1 in every establishment-year cellsince the year of adoption of each program and 0 before the program isadopted and after it is revoked, if relevant, or if it has never been adopted.The median year of adoption for self-directed work teams is 1992, andoverall 18% of the establishment-year cells in my data had these teamsby 2002. For problem-solving teams the median year of adoption is 1991,and 30% of the establishment-year cells in my data had them by 2002.Both cross-training and job-training programs have 1985 as the medianyear of adoption. About 57% of the establishment-year cells in my datahad cross-training programs and 50% had job-training programs by 2002.
All the independent variables in the analysis are measured annually inthe year before the dependent variables. Table 1 presents the means,standard deviations, definitions, and data sources for all variables usedin the analysis.
Control Variables—Other Factors Affecting Managerial Composition
Organizational characteristics that do not vary with time, such as industryand location, are not included, but are accounted for by organization fixedeffects.
Complementary organizational changes.—Management training, peer
11 Logit (i) p log [Pi/(1 � Pi)], where Pi is the proportion of group i among managers.The logit is undefined when P p 0 or P p 1. I thus substituted 0 with 1/2Nj, and 1with 1 � 1/2Nj, where Nj is the number of managers in establishment j (Hanushekand Jackson 1977; Reskin and McBrier 2000). The results of my analysis are robustto different strategies for substituting zeros. I chose the one that kept the distributionunimodal and closest to normal. I also included a dummy variable that equals 1 whenthere are no managers from the focal group. The results are also not sensitive to whetherthis variable is included.
1612
TA
BL
E1
Me
ans
an
dS
tan
dar
dD
evi
ati
ons
of
Var
iabl
esU
sed
int
he
An
alys
iso
fM
an
ager
ial
Wo
rkf
orce
Com
posi
tio
n(N
p14
,693
)
Var
iab
leM
ean
SD
Min
Max
Typ
eD
ata
Sou
rce
Ou
tcom
ev
aria
ble
s:P
rop
orti
onw
hite
men
amon
gm
anag
ers
....
....
....
...6
84.2
310
1C
onti
nu
ous
EE
O-1
Pro
por
tion
whi
tew
omen
amon
gm
anag
ers
....
....
...
.231
.210
01
Con
tin
uou
sE
EO
-1P
rop
orti
onb
lack
wom
enam
ong
man
ager
s..
....
....
..0
13.0
380
.556
Con
tin
uou
sE
EO
-1P
rop
orti
onb
lack
men
amon
gm
anag
ers
....
....
....
...
.025
.055
01
Con
tin
uou
sE
EO
-1T
eam
stru
ctu
res:
Sel
f-di
rect
edw
ork
team
s..
....
....
....
....
....
....
....
...1
76.3
810
1B
inar
yS
urv
eyP
rob
lem
-sol
vin
gte
ams
....
....
....
....
....
....
....
....
...2
97.4
570
1B
inar
yS
urv
eyS
kill
upg
rad
ing:
Cro
ss-t
rain
ing
....
....
....
....
....
....
....
....
....
....
....
.558
.497
01
Bin
ary
Su
rvey
For
mal
job
trai
nin
g..
....
....
....
....
....
....
....
....
...
.501
.500
01
Bin
ary
Su
rvey
Com
ple
men
tary
orga
niz
atio
nal
chan
ges:
Man
agem
ent
trai
nin
g..
....
....
....
....
....
....
....
....
..4
44.4
970
1B
inar
yS
urv
eyP
eer
eval
uat
ion
s..
....
....
....
....
....
....
....
....
....
...
.118
.322
01
Bin
ary
Su
rvey
Wor
k/f
amily
acco
mm
odat
ion
s..
....
....
....
....
....
....
1.04
9.9
960
4C
ount
aS
urv
eyO
rgan
izat
ion
ald
own
sizi
ng..
....
....
....
....
....
....
....
.225
.418
01
Bin
ary
Su
rvey
%m
anag
eria
ljo
bs
ines
tab
lish
men
t..
....
....
....
....
..12
.600
9.20
00
100
Con
tin
uou
sS
urv
eyO
rgan
izat
ion
alst
ruct
ure
s:F
orm
aliz
edp
erso
nne
lp
olic
ies
....
....
....
....
....
....
..4.
454
2.24
50
8C
ount
bS
urv
eyA
ffirm
ativ
eac
tion
pla
n..
....
....
....
....
....
....
....
...
.503
.500
01
Bin
ary
Su
rvey
Div
ersi
typ
rogr
ams
....
....
....
....
....
....
....
....
....
...3
58.7
920
4C
ount
cS
urv
eyU
nio
nag
reem
ent
....
....
....
....
....
....
....
....
....
....
.248
.432
01
Bin
ary
Su
rvey
Est
ablis
hmen
tsi
ze..
....
....
....
....
....
....
....
....
....
.75
3.51
697
2.48
213
14,1
95C
onti
nu
ous
EE
O-1
Wor
kfo
rce
dem
ogra
phy
:%
wom
enin
top
man
agem
ent
....
....
....
....
....
....
..16
.933
22.9
590
100
Con
tin
uou
sdS
urv
ey%
min
orit
ies
into
pm
anag
emen
t..
....
....
....
....
....
.3.
471
9.49
00
100
Con
tin
uou
sdS
urv
ey
1613
Pro
por
tion
whi
tem
enam
ong
non
man
ager
s..
....
....
.403
.247
0.9
82C
onti
nu
ous
EE
O-1
Pro
por
tion
whi
tew
omen
amon
gn
onm
anag
ers
....
...
.377
.247
01
Con
tin
uou
sE
EO
-1P
rop
orti
onb
lack
wom
enam
ong
non
man
ager
s..
....
..0
58.0
950
.886
Con
tin
uou
sE
EO
-1P
rop
orti
onb
lack
men
amon
gn
onm
anag
ers
....
....
...0
53.0
890
.940
Con
tin
uou
sE
EO
-1N
ow
hit
em
enin
man
agem
ent
....
....
....
....
....
....
..0
05.0
740
1B
inar
yE
EO
-1N
ow
hit
ew
omen
inm
anag
emen
t..
....
....
....
....
....
.094
.291
01
Bin
ary
EE
O-1
No
bla
ckw
omen
inm
anag
emen
t..
....
....
....
....
....
.686
.464
01
Bin
ary
EE
O-1
No
bla
ckm
enin
man
agem
ent
....
....
....
....
....
....
..5
33.4
990
1B
inar
yE
EO
-1P
rop
orti
onw
hit
em
enin
ind
ust
ryla
bor
forc
e..
....
...4
34.1
47.1
45.7
11C
onti
nu
ous
CP
SP
rop
orti
onw
hit
ew
omen
inin
du
stry
lab
orfo
rce
....
..3
23.1
40.1
29.6
24C
onti
nu
ous
CP
SP
rop
orti
onb
lack
wom
enin
indu
stry
lab
orfo
rce
....
..0
40.0
18.0
14.0
97C
onti
nu
ous
CP
SP
rop
orti
onb
lack
men
inin
du
stry
lab
orfo
rce
....
....
.042
.023
.005
.098
Con
tin
uou
sC
PS
Pro
por
tion
whi
tem
enin
stat
ela
bor
forc
e..
....
....
...3
80.0
60.1
16.5
02C
onti
nu
ous
CP
SP
rop
orti
onw
hite
wom
enin
stat
ela
bor
forc
e..
....
...
.358
.066
.093
.496
Con
tin
uou
sC
PS
Pro
por
tion
bla
ckw
omen
inst
ate
lab
orfo
rce
....
....
..0
42.0
29.0
01.1
86C
onti
nu
ous
CP
SP
rop
orti
onb
lack
men
inst
ate
lab
orfo
rce
....
....
....
.049
.035
.001
.201
Con
tin
uou
sC
PS
Org
aniz
atio
nal
envi
ron
men
t:In
-hou
sele
gal
cou
nsel
....
....
....
....
....
....
....
....
...
.303
.460
01
Bin
ary
Su
rvey
Gov
ern
men
tco
ntr
act
....
....
....
....
....
....
....
....
....
.486
.500
01
Bin
ary
EE
O-1
Leg
alan
tid
iscr
imin
atio
nen
forc
emen
t..
....
....
....
...
.948
1.01
90
3C
ount
eS
urv
eyU
nem
plo
ymen
tra
te..
....
....
....
....
....
....
....
....
...
62
218
Con
tinu
ous
CP
SIn
dust
rysi
ze..
....
....
....
....
....
....
....
....
....
....
...
3,96
12,
904
996
11,4
58C
onti
nu
ous
BL
SY
ear
....
....
....
....
....
....
....
....
....
....
....
....
....
...
1991
619
8020
01C
onti
nu
ous
EE
O-1
No
te.—
All
ind
epen
den
tv
aria
ble
s,ex
clu
din
g%
man
ager
ial
job
s,ar
em
easu
red
one
year
bef
ore
the
outc
ome
var
iab
les.
aIn
clu
des
pai
dm
ater
nit
yle
ave,
pai
dp
ater
nit
yle
ave,
pol
icy
allo
win
gfl
exib
lew
ork
ing
hou
rs,
and
top
-man
agem
ent
sup
por
tfo
rw
ork
/fam
ilyb
alan
ce.
bIn
clu
des
adop
tion
offo
rmal
HR
dep
artm
ent,
wri
tten
hir
ing,
pro
mot
ion
,an
dd
isch
arge
guid
elin
es,
wri
tten
job
des
crip
tion
,w
ritt
enp
rom
otio
nla
dde
r,w
ritt
enp
erfo
rman
ceev
alua
tion
s,p
ay-g
rad
esy
stem
,an
din
tern
alp
osti
ngof
job
s.c
Incl
udes
dive
rsit
yco
mm
itte
e,di
vers
ity
trai
ning
,d
iver
sity
netw
orki
ng,
men
tori
ng,
dive
rsit
yev
alua
tion
for
man
ager
s,an
ddi
vers
ity
staf
f.d
Per
cen
tage
sw
ere
obta
ined
in10
-yea
rin
terv
als
from
1982
to20
02.
Val
ues
for
year
sin
bet
wee
nw
ere
inte
rpol
ated
usi
ng
ali
nea
rfu
nct
ion
.e
Incl
ud
esaf
firm
ativ
eac
tion
com
plia
nce
rev
iew
,E
EO
Cch
arge
s,an
dd
iscr
imin
atio
nla
wsu
its.
American Journal of Sociology
1614
evaluations, and organizational downsizing are measured as binary var-iables, based on survey data. The variable for work/family accommo-dations counts four elements: paid maternity leave, paid paternity leave,a policy allowing flextime, and top-management support for work/familyprograms. The percentage of managerial jobs is measured using EEO-1data on the number of managerial employees.
Organizational structures.—Personnel policies are measured using threevariables, based on survey data. First is a variable counting the presenceof eight policies formalizing HR decisions: hiring, promotion, and dis-charge guidelines, job descriptions, promotion ladders, performance eval-uations, pay-grade systems, and internal job posting. Second is a binaryvariable denoting the presence of an annual affirmative action plan. Lastis a count of five diversity programs, including diversity training, eval-uations, staff, and mentoring and networking. Unionization is measuredas a binary variable using survey data. Establishment size is the numberof employees in the establishment, based on the EEO-1 data.
Workforce demography.—The composition of top managerial ranks ismeasured as the percentages of women and blacks in the top 10 executivepositions, based on survey data. Interviewees were asked about the per-centages at 10-year intervals, and values for intervening years were in-terpolated. The composition of the establishment’s internal labor pool ismeasured as the proportion of the focal group among nonmanagerialworkers, based on the EEO-1 reports. The composition of the establish-ment’s external labor pool is measured using annual data from the CPSon the proportion of each demographic group among the industry andstate labor forces. Industry employment variables are logged.
Organizational environment.—Organizations’ legal environment ismeasured in several ways. To measure managers’ awareness of the legalenvironment, I use a binary variable on the presence of in-house legalcounsel, based on the survey data. Another binary variable, based onEEO-1 data, denotes whether the establishment is a government con-tractor subject to affirmative action regulations. Finally, a count variable,based on survey data, counts the establishment’s experience with threetypes of antidiscrimination enforcement: EEOC charges, Title VII law-suits, and affirmative action compliance reviews. Unemployment is mea-sured as the yearly state unemployment rate and industry size as totalannual industry employment. Both are based on data from the BLS.
Method
The four dependent variables examined in this study are parts of the samewhole—the sum of management jobs in an establishment at a certainyear—and so their error terms are expected to be correlated. Under these
Restructuring and Ascription at Work
1615
conditions, ordinary least squares would produce unbiased and consistentestimators, but not efficient ones. I thus use seemingly unrelated regres-sion, a generalized least squares (GLS) estimation that takes into accountthis covariance between the errors (Zellner 1962; Felmlee and Hargens1988).12 This estimation also allows me to perform a formal test of thehypothesis that self-directed work teams and cross-training will be moreeffective in eroding gender barriers than racial barriers (Zellner 1962;Kalleberg and Mastekaasa 2001).
An important concern in the analysis of organizational changes is es-tablishing reliable estimates that are not biased by unobserved hetero-geneity. In addition to including in the analysis an expansive series ofcontrol variables that may affect the outcome variable, I address thisconcern by using a fixed-effects specification for establishment and year(Hsiao 1986; Hicks 1994; Western 2002) and by conducting several sen-sitivity analyses, which I discuss later on.
Establishment fixed effects capture the variance from unmeasured char-acteristics of individual establishments that do not change with time andmay affect both the independent and the outcome variables. For example,a progressive organizational culture may cause organizations to experi-ment with new work structures and also to promote more women andminorities. The fixed-effects specification increases my confidence that anunobserved factor of that sort does not drive my results. This specificationis achieved by subtracting the values of each observation from the es-tablishment’s mean (Hsiao 1986, p. 31):13
y � E(y ) p b[x � E(x )] � dD � [u � E(u )],it i it�1 i t�2 it�1 i
where y is a vector of outcome variables, x is a vector of time-varyingvariables, D is a vector of dummy variables for t � 2 years (the first year,1980, is the omitted year, and the last year, 2002, is included only forcalculating the outcome variable), E denotes a mean, i denotes an estab-lishment, and t denotes a year. This transformation is logically equivalentto including in the model 810 dummy variables, one for each establishmentin the data. By virtue of this definition, fixed-effects estimation modelsonly within-establishment variation, and hence only variables that changeover time are included in the analysis.
Year fixed effects are included to capture unobserved heterogeneity that
12 Available in Stata using the sureg command. The substantive results in this articleare not sensitive to the choice between this GLS estimation and OLS estimation.13 The intercept in these models is not an explanation of the between-unit or over-timevariance. It is simply a characterization of the variance that attempts to minimize the“true” explanation, or a measure of the “specific ignorance,” as opposed to the “generalignorance,” captured by the error term (Maddala 1977; Sayrs 1989).
American Journal of Sociology
1616
is associated with the passage of time and affects all establishments alike,such as national cultural or legal changes. The establishment and yearfixed effects also offer an efficient means of dealing with the noncon-stant variance of the errors (heteroscedasticity) that stems from the cross-sectional and over-time aspect of the pooled data (Sayrs 1989).14 To ex-amine the robustness of my results to within-unit serial correlation, Icorrected for AR(1) using the Cochrane-Orcutt method,15 which multipliesthe equation for time t � 1 by the autocorrelation coefficient, r, andsubtracts it from the equation for time t: y � ry p (1 � r)b � (x �t t�1 0 t
. The results of the analysis and the main argumentrx )b � u � rut�1 1 t t�1
of the article are robust to this correction.Additional sources of unobserved heterogeneity can come from the un-
balanced nature of the data (30% of the establishments enter the data setafter the first year of data, 1980) if the reason that an establishment isnot in the data (e.g., its size or age) is correlated with the outcome variable.To verify that the results are not driven by the selection of establishmentsinto the data, I replicated the analysis using a subsample of establishmentsthat enter and exit the data in the same year; the results were substantiallysimilar to those of the main analysis reported here. Additional robustnesschecks are discussed at the end of the findings section.
FINDINGS
My analysis provides strong support for the argument that restructuringwork to weaken job segregation improves the access of women and mi-norities to management. Both self-directed work teams and cross-trainingprograms have significant positive effects on the odds that managers arewhite women, black women, and black men and a negative effect onwhite men’s odds of being in management. In contrast, programs that donot expand workers’ opportunities to transcend job boundaries—prob-lem-solving teams and job training—do not have these effects. The resultsalso indicate that racial barriers are more resistant to change than aregender barriers. The effect of self-directed teams on black women is sig-nificantly smaller than that on white women, and problem-solving teamshave a negative effect on black men’s and black women’s shares in man-agement. Below I discuss the findings in greater detail.
Table 2 includes the results of the full model. Exponentiating the co-efficients b in the following way, [exp(b) � 1] # 100, gives us the average
14 Using the Huber-White robust standard errors did not change the results of theanalysis.15 Available in Stata using the xtregar procedure.
TABLE 2Fixed-Effects Estimates of the log Odds that Managers are White Men,
White Women, Black Women, or Black Men after Adoption of New Forms ofWork Organization, 1980–2002
WhiteMen
WhiteWomen
BlackWomen
BlackMen
Team work:Self-directed work teams . . . . . . . . . . . . . . . . . . �.081** .087** .035* .048*
(.019) (.020) (.018) (.019)Problem-solving teams . . . . . . . . . . . . . . . . . . . . .014 .024 �.031* �.058**
(.014) (.015) (.013) (.014)Skill upgrading:
Cross-training . . . . . . . . . . . . . . . . . . . . . . . . . . . . . . �.076** .044* .033* .040*(.016) (.017) (.016) (.018)
Job training . . . . . . . . . . . . . . . . . . . . . . . . . . . . . . . . �.005 .007 .017 �.002(.016) (.017) (.015) (.017)
Complementary organizational changes:Management training . . . . . . . . . . . . . . . . . . . . . .002 .040** .003 �.017
(.015) (.015) (.014) (.015)Peer evaluations . . . . . . . . . . . . . . . . . . . . . . . . . . . .007 .013 .011 .032
(.018) (.019) (.018) (.018)Work/family accommodations . . . . . . . . . . . . �.036** .029** .018* �.005
(.008) (.008) (.007) (.008)Organizational downsizing . . . . . . . . . . . . . . . . �.025 .070** .080** .024
(.016) (.022) (.015) (.016)%managerial jobs in establishment . . . . . . �1.357** .823** �2.919** �2.191**
(.103) (.110) (.098) (.101)Organizational structures:
Formalized personnel policies . . . . . . . . . . . . .002 �.007 �.012** �.007(.004) (.004) (.004) (.004)
Affirmative action plan . . . . . . . . . . . . . . . . . . . �.045** .029 �.003 .040*(.017) (.018) (.016) (.017)
Diversity programs . . . . . . . . . . . . . . . . . . . . . . . . �.046** .059** .043** .015(.009) (.009) (.008) (.009)
Union agreement . . . . . . . . . . . . . . . . . . . . . . . . . . �.086* �.019 �.019 .037(.035) (.038) (.034) (.036)
Establishment size (log) . . . . . . . . . . . . . . . . . . . �.096** .041** �.549** �.342**(.012) (.013) (.012) (.013)
Workforce composition:%women in top management . . . . . . . . . . . . �.002** .004** .001 �.003**
(.000) (.001) (.001) (.001)%minorities in top management . . . . . . . . . �.001 �.003 .008** .013 **
(.001) (.002) (.001) (.002)Proportion focal group in nonmanagerial
jobs . . . . . . . . . . . . . . . . . . . . . . . . . . . . . . . . . . . . . . . 1.058** 1.217** .475** 1.533**(.048) (.054) (.116) (.136)
No focal group in management . . . . . . . . . . �.360** �.221** �.579** �.156**(.046) (.013) (.012) (.007)
TABLE 2 (Continued)
WhiteMen
WhiteWomen
BlackWomen
BlackMen
Proportion white men in industry laborforce (log) . . . . . . . . . . . . . . . . . . . . . . . . . . . . . . . . .400** �.240** .123 .151
(.086) (.090) (.082) (.088)Proportion white women in industry la-
bor force (log) . . . . . . . . . . . . . . . . . . . . . . . . . . . �.037 .235** .151* �.084(.059) (.063) (.056) (.061)
Proportion black women in industry la-bor force (log) . . . . . . . . . . . . . . . . . . . . . . . . . . . �.042 .037 �.023 .051*
(.022) (.024) (.021) (.023)Proportion black men in industry labor
force (log) . . . . . . . . . . . . . . . . . . . . . . . . . . . . . . . . �.058* .048 .030 .008(.025) (.026) (.024) (.025)
Proportion white men in state laborforce . . . . . . . . . . . . . . . . . . . . . . . . . . . . . . . . . . . . . . .192 �.097 �1.349** �.020
(.350) (.370) (.333) (.359)Proportion white women in state labor
force . . . . . . . . . . . . . . . . . . . . . . . . . . . . . . . . . . . . . . �.493 1.070** �.439 .056(.294) (.312) (.280) (.302)
Proportion black men in state laborforce . . . . . . . . . . . . . . . . . . . . . . . . . . . . . . . . . . . . . . 1.080 �.378 �1.049 �1.614*
(.720) (.761) (.687) (.740)Proportion black women in state labor
force . . . . . . . . . . . . . . . . . . . . . . . . . . . . . . . . . . . . . . �.943 2.638** 1.200* .245(.604) (.639) (.580) (.620)
Organizational environment:In-house legal counsel . . . . . . . . . . . . . . . . . . . . . �.059* .104** .023 .074**
(.024) (.025) (.023) (.024)Government contract . . . . . . . . . . . . . . . . . . . . . . �.013 .039* �.036* .040*
(.019) (.020) (.018) (.019)Legal antidiscrimination enforcement . . . �.034** .050** .002 .015
(.008) (.008) (.007) (.008)Unemployment rate . . . . . . . . . . . . . . . . . . . . . . . .023** �.026** �.011** �.002
(.004) (.004) (.004) (.004)Industry employment . . . . . . . . . . . . . . . . . . . . . . .023** �.053** �.007 �.014**
(.005) (.005) (.005) (.005)R2 . . . . . . . . . . . . . . . . . . . . . . . . . . . . . . . . . . . . . . . . . . . . . . .2215 .1936 .2362 .1305x2 . . . . . . . . . . . . . . . . . . . . . . . . . . . . . . . . . . . . . . . . . . . . . . . 4,464 3,661 4,635 1,970
Note.—Unstandardized coefficients from a seemingly unrelated regression. Numbers in parenthesesare SEs. All independent variables are lagged by one year, excluding the percentage of managerial jobs.The analysis includes 20 variables for the years 1981–2001 (1980 is the omitted year, and 2002 is includedin the analysis only for calulating the outcome variable). N p 14,693; number of parameters p 53. Log-likelihood ratio tests: x2 (16) p 84.01; P 1 x p .000.
* P ! .05 (two-tailed tests).** P ! .01.
Restructuring and Ascription at Work
1619
percentage change in the odds that managers are from a focal demographicgroup, a change that is associated with a change in an independent var-iable, net of all other variables and each establishment’s unique stablecharacteristics. When the coefficient’s absolute value is smaller than 0.1,the percentage change can be calculated simply as b # 100. The errorof such approximation is about 0.005. The R-squared statistics reportedin this table represent the percentage of the variance explained by thepredictors when excluding the unique (fixed) effects of each establishment.The log-likelihood ratio test shows that adding measures of teams andtraining programs to the baseline model (presented in app. table A1)significantly increases the percentage variance explained by the model.
Team-Based Work
The results presented in table 2 show that the adoption of self-directedteams by an establishment has a significant positive effect on the sharesof women and minorities among managers of that establishment. Afterthe adoption of self-directed work teams, the odds that managers arewhite men decline by an average of 8%, the odds for white women increaseby an average of 9%, and those for black women and black men increaseby about 3.5% and 5%, respectively. A chi-squared test indicates that theestimated effect of self-directed teams on white women is significantlylarger than the estimated effect on black women (x2 p 3.98; df p 1; P! .046), but not significantly larger than the effect on black men (x2 p1.86; df p 1; P ! .173).
In contrast to self-directed work teams, the adoption of problem-solvingteams is not followed by increased diversity; rather, it lowers the oddsthat managers are black women by 3% and that managers are black menby 6%. The magnitude of these effects is comparable to the positive effectsof self-directed work teams. Does this mean that when both programsare adopted, there will be no change in the proportions of black men andwomen in management, or is there an added value of having both pro-grams in place? To examine this question, in a separate model, I includedan interaction term for self-directed work teams and problem-solvingteams. The coefficients for the interaction term indicated that having boththese programs at the same time has a weak positive effect on blackwomen, significant only at the 10% level of confidence (b p 0.053; SE p0.029), and no effect on black men (b p 0.024; SE p 0.031). In otherwords, there is no evidence of an added value from having both types ofprograms at the same time.16
16 Coefficients of the interaction analysis for white men and women also show nosignificant effects. Full results are available upon request.
American Journal of Sociology
1620
Problem-solving teams, which often include experts and higher-rankingworkers, who are typically white and male, may improve the careerchances of other workers (white men or women) and thereby deepen thedisadvantage of black workers. Note that the coefficients for white womenand men are positive, though not statistically significant.
Cross-training and Job Training
According to the analysis presented in table 2, the introduction of cross-training programs increases the odds that managers are white women,black women, or black men by about 4% on average and reduces theodds for white men by about 7.5%. These results suggest that cross-functional training programs may indeed translate into new mobility op-portunities for women and minorities, as case studies have suggested(Smith 1996; Ollilainen and Rothschild 2001).
The shares of women and blacks among managers do not change fol-lowing employers’ adoption of job-training programs. None of the coef-ficients for job training are significant. Despite the historical intent to usejob training as a means for helping women and minorities advance, em-ployers’ adoption of these programs does not undermine ascriptive dis-advantage, perhaps because women and minorities are less likely to beeligible for training (Knoke and Ishio 1998; Lynch and Black 1998).
What do these coefficients mean in terms of changes in the proportionsof women and minorities in management between 1980 and 2002? Becausethe log odds transformation is not a linear transformation, the magnitudeof the change associated with each program varies according to the start-ing point, the baseline proportion (Fox 1997, p. 78). Table 3 summarizesthe percentage and percentage-point differences between the sample meanproportion of each group among managers and the predicted proportionfollowing the adoption of each program. These magnitudes are calculatedusing the coefficients in table 2 and are associated only with the adoptionof the focal program.17 For example, the mean proportion of white menamong managers in the sample is 67.9%. Adopting self-directed workteams is estimated to reduce their share to 66.2%, net of all the other
17 To evaluate the magnitude of the effect as a percentage change in the proportion ofa focal group in management. I use the following calculation: DP /P pij ij
, where j{exp (L )/[1 � exp (L )]} � {exp (L )/[1 � exp (L )]} / {exp (L )/[1 � exp (L )]}1ji 1ji 0ji 0ji 0ji 0ji
denotes the focal demographic group and i is the focal program. L0ji is the log oddsof group j’s being in management before the unit change in Di (i.e., before the adoptionof program i) and L1ji p L0ji � Bij is the log odds of group j’s being in managementafter the unit change in Di (after adoption), where Bij is the regression coefficient,estimating the percentage change in odds associated with adoption of program i inthe model for the jth group (Petersen 1985).
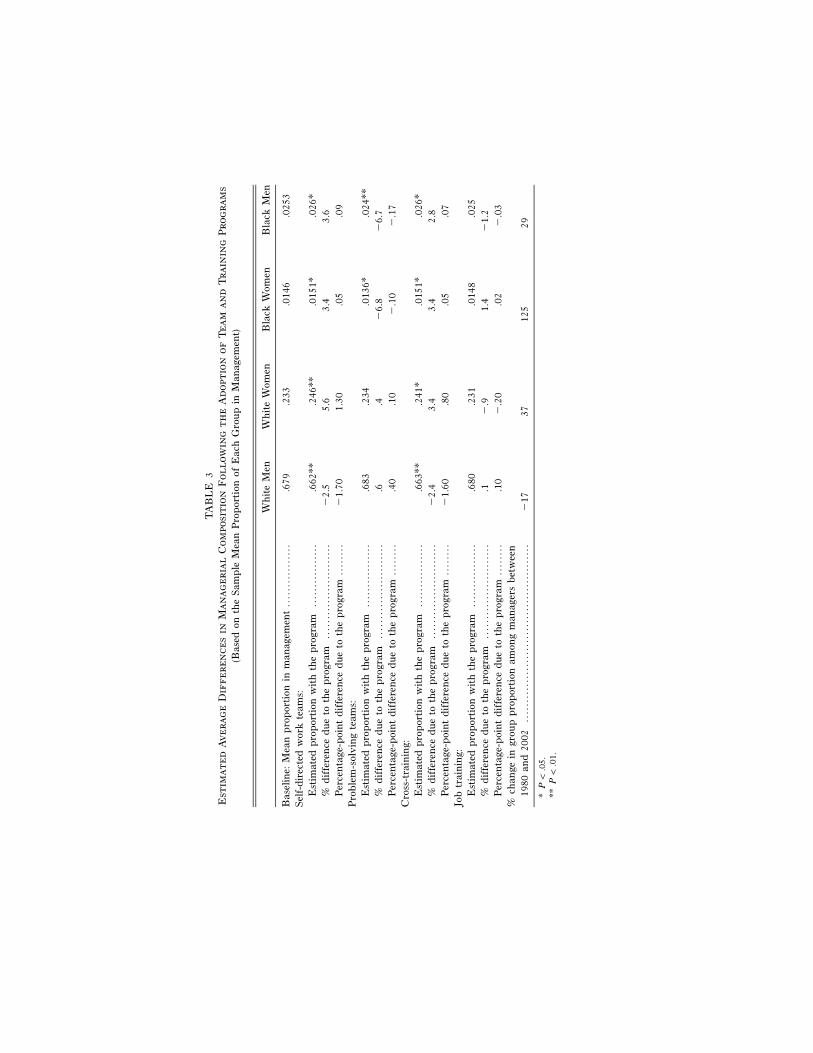
TA
BL
E3
Est
imat
edA
vera
ge
Dif
fere
nce
sin
Ma
na
ger
ial
Com
posi
tio
nF
ollo
win
gt
he
Ad
opt
ion
of
Te
ama
nd
Tra
inin
gP
rog
ram
s(B
ased
onth
eS
amp
leM
ean
Pro
por
tion
ofE
ach
Gro
up
inM
anag
emen
t)
Wh
ite
Men
Wh
ite
Wom
enB
lack
Wom
enB
lack
Men
Bas
elin
e:M
ean
pro
por
tion
inm
anag
emen
t..
....
....
....
...6
79.2
33.0
146
.025
3S
elf-
dire
cted
wor
kte
ams:
Est
imat
edp
rop
orti
onw
ith
the
pro
gram
....
....
....
....
.662
**.2
46**
.015
1*.0
26*
%d
iffe
ren
ced
ueto
the
pro
gram
....
....
....
....
....
....
�2.
55.
63.
43.
6P
erce
nta
ge-p
oint
dif
fere
nce
due
toth
ep
rogr
am..
....
..�
1.70
1.30
.05
.09
Pro
ble
m-s
olv
ing
team
s:E
stim
ated
pro
por
tion
wit
hth
ep
rogr
am..
....
....
....
...6
83.2
34.0
136*
.024
**%
dif
fere
nce
due
toth
ep
rogr
am..
....
....
....
....
....
...6
.4�
6.8
�6.
7P
erce
nta
ge-p
oint
dif
fere
nce
due
toth
ep
rogr
am..
....
...4
0.1
0�
.10
�.1
7C
ross
-tra
inin
g:E
stim
ated
pro
por
tion
wit
hth
ep
rogr
am..
....
....
....
...6
63**
.241
*.0
151*
.026
*%
dif
fere
nce
due
toth
ep
rogr
am..
....
....
....
....
....
..�
2.4
3.4
3.4
2.8
Per
cen
tage
-poi
ntd
iffe
ren
ced
ueto
the
pro
gram
....
....
�1.
60.8
0.0
5.0
7Jo
btr
aini
ng:
Est
imat
edp
rop
orti
onw
ith
the
pro
gram
....
....
....
....
.680
.231
.014
8.0
25%
dif
fere
nce
due
toth
ep
rogr
am..
....
....
....
....
....
...1
�.9
1.4
�1.
2P
erce
nta
ge-p
oint
dif
fere
nce
due
toth
ep
rogr
am..
....
...1
0�
.20
.02
�.0
3%
chan
gein
grou
pp
rop
orti
onam
ong
man
ager
sb
etw
een
1980
and
2002
....
....
....
....
....
....
....
....
....
....
....
.�
1737
125
29
*P
!.0
5.**
P!
.01.
American Journal of Sociology
1622
variables and the establishment and year fixed effects. This is a declineof 1.7 percentage points or 2.5% in their proportion that is associatedsolely with the adoption of these teams. To evaluate this 2.5% change incontext we can look at the bottom line in table 3, which summarizes thepercentage change in the share of each group among managers between1980 and 2002. The proportion of white men among managers declinedin this period by 17%, from 75% to 62%. To give another example, theproportion of white women among managers is estimated to increase by5.6% due to the adoption of self-directed work teams, while overall theshare of white women among managers increased by 37% (from 19% to26%) between 1980 and 2002.
Self-directed work teams and cross-training programs erode job seg-regation, but if these programs are implemented in highly segregatedorganizations, or if women and minorities are excluded from participating,the programs might not change these groups’ career opportunities. Theanalysis cannot account for variation in women’s and minorities’ partic-ipation (data on their participation were not collected), and so the esti-mated effects we observe may include cases where these programs aredemographically homogeneous and may thus underestimate the extent towhich women and minorities benefit from participation.
Accompanying Changes and Other Factors Affecting ManagerialComposition
Coefficients for variables measuring other organizational changes thatmay affect managerial composition, presented in table 2, are generallyconsistent with expectations based on theory and previous research. Thesemeasures are included in the analysis to help isolate the effects of theteam and training programs, but their coefficients contribute to a broaderunderstanding of stratification at work.
One clear pattern that arises from these results is of intersectionality,whereby organizational characteristics create distinct opportunities foreach demographic group (McCall 2001; Browne and Misra 2003). In par-ticular, the results show that some organizational features advantage blackwomen more than black men (e.g., work/family and diversity programs,as well as downsizing), while other features advantage black men more(see also Nkomo and Cox 1989, p. 835). Black women, however, rarelybenefit more than white women in these models (excluding the effect ofminorities in top management). I review specific results below.
Management training has the expected positive effect on the share ofwhite women in management, suggesting that expanding formal oppor-tunities for access to management can reduce ascriptive disadvantage,though these effects are not observed for black men and women. White
Restructuring and Ascription at Work
1623
women may be better positioned to take advantage of these programs(Bell et al. 1994). Peer evaluations show no significant effect on managerialdiversity. This result is in contrast to Smith-Doerr’s (2004) argument thatbeing evaluated by a wider range of people helps women’s careers. Itappears that the exposure and visibility granted by changes in work struc-tures, such as self-directed teams and cross-training, are a more effectivemeans for reducing career barriers than formal peer-evaluation programs.Work/family accommodations have the expected effect of reducingwomen’s disadvantage in access to management (they are the most likelybeneficiaries of these programs). The parallel decline in white men’s oddssuggests that women’s work/family conflict serves as a source of advan-tage for white men. Downsizing layoffs show a positive effect on whiteand black women in management and no effect on black men. Theseresults are inconsistent with what we know from individual-level dataabout minorities’ higher vulnerability to downsizing, controlling for in-dividual and occupational characteristics (Farber 1997; Fairlie andKletzer 1998; McBrier and Wilson 2004) and may suggest that interveningorganizational factors shape the vulnerability of women and minoritiesto downsizing layoffs. Higher availability of managerial jobs has a positiveeffect on white women in management, at the expense of all other groups.
Formalization of human resources does not seem to increase managerialdiversity. This result is anticipated by mixed evidence from past researchlooking at different aspects of formalization (Baldi and McBrier 1997;Reskin and McBrier 2000). Consistent with previous research, affirmativeaction plans and diversity programs have positive effects on managerialdiversity (Konrad and Linnehan 1995; Edelman and Petterson 1999;Kalev et al. 2006), as do the presence of in-house legal counsel and anti-discrimination enforcement (Leonard 1984; Kalev and Dobbin 2006;Skaggs 2008). Some argue that the negative effects of affirmative actionplans, diversity programs, and antidiscrimination enforcement on whitemen reflect a quota system or reverse discrimination.18 Several studiesprovide evidence against this notion. Holzer and Neumark (1998) findthat when affirmative action is used in recruiting it does not result inlower credentials or performance for the women and minorities hired.Wilson (1995) found that only 100 of 3,000 discrimination cases filedinvolved reverse discrimination and that only six of these had claims thatcould be substantiated (cited in Bond and Pyle 1998, p. 260). The resultsalso show that the presence of a union contract leads to declines in theodds that managers are white men, though it does not have, on average,
18 This criticism is usually directed at affirmative action plans and is less relevant forcross-functional work programs, which are not adopted as part of employers’ effortsto comply with antidiscrimination regulations.
American Journal of Sociology
1624
a significant effect on any other group. This pattern suggests that onaverage unions help erode, rather than sustain, white men’s advantagein good jobs (Leonard 1985).
The variables measuring organizational workforce composition showthat higher presence of women and minorities—be it in top managementor in nonmanagerial jobs—enhances the entrance of women or minoritiesto management (Cohen et al. 1998). When women’s share of top man-agement increases, only white women gain, and when top managementis more racially diverse, both black women and men benefit. Here tooracial barriers seem to be more resistant to change than gender boundaries,and black women do not experience a “double advantage” of being bothwomen and black (Nkomo and Cox 1989). Also, men’s share among man-agers declines when the share of women among top managers increases.This may reflect homophily among women that disadvantages men (Elliotand Smith 2004). It may also reflect the ability of highly ranked womenmanagers to serve as the role models and mentors that aspiring womenoften lack (Ely 1995; Bell and Nkomo 2001).
Among industry and state labor force composition variables, it is note-worthy that a higher presence of black men in industry has a negativeeffect on white men in management, and there is weak evidence thatwhite women’s share among managers increases in these cases. An in-crease in the share of black men among the state labor force is associatedwith a lower share of black men among managers, suggesting indirectsupport for the threat hypothesis holding that a higher presence of blacksthreatens the majority group, which may then intensify exclusion efforts(Blalock 1967). Finally, high unemployment hurts the share of womenamong managers, supporting the queuing theory, whereby men are po-sitioned higher in the gender queue for jobs (Reskin and Roos 1990).
Confounding Factors and Reverse Causality
The model specification, with fixed effects for each establishment andyear, accounts for two possible sources of bias. First, the establishmentfixed effects account for stable unobserved heterogeneity that might affectthe outcomes. For example, adopters may have a change-oriented orga-nizational culture or may be concentrated in progressive industries orstates and so may be more likely to both adopt new programs and bediversity-friendly. Second, the inclusion of a dummy variable for eachyear accounts for unmeasured heterogeneity that is correlated with timeand affects all organizations alike, such as changes in societal attitudes,legal environment, or managerial fads.
Time-varying organization-specific exogenous changes.—The fixed-effects specification by itself does not rule out the possibility that time-
Restructuring and Ascription at Work
1625
varying organization-specific exogenous changes—for example, new lead-ership or a decline in profits—may affect both the organization of workand the access of women and blacks to management. I try to rule outspuriousness due to such unobserved heterogeneity in three ways. Thefirst way is through the research design: all four programs I examine areoften adopted as part of what is called “high-performance reorganization”(Cappelli et al. 1997; Osterman 2000). That only two of the four inno-vations examined here show positive effects on managerial diversity in-creases my confidence that these effects are not caused by a latent factor.For example, if the real factor that affected management diversity wasthe arrival of a new CEO infatuated with progressive management pro-grams, we would expect to see positive effects for all four programs.Second, the effects of cross-functional team and training programs areobserved despite the inclusion of many related organizational innovations,such as management training, peer reviews, work/family accommoda-tions, and diversity efforts (see table 2). Third, the models may still besubject to omitted variable bias, if an unmeasured factor led both to theadoption of cross-functional programs and to changes in managementdiversity. To test for omitted variable bias, I performed an additionalanalysis (results are available upon request) in which I added binaryvariables as proxies for the occurrence of unmeasured events (such asfinancial or technological changes) before the adoption of each program.I performed this sensitivity analysis with proxy events assumed to occurtwo and three years prior to the adoption of each of the four team andtraining programs examined here, in models parallel to those in table 2.If adding a proxy variable for an event occurring before, say, the adoptionof self-directed work teams caused the coefficients for these teams todecline in size or become nonsignificant, and the proxy variable showedsignificant effects in the same direction as the original coefficients, theresults for these teams might be spurious (Bennear 2007). As expected,however, the coefficients of interest and the standard errors remainedrobust to the inclusion of these proxy variables, and the proxy variablesdid not produce significant coefficients. These analyses also suggest thatthe observed relationship between the reorganization of work and man-agerial diversity is not spurious.
Reverse causality.—If adopters of cross-functional team and trainingprograms are more diverse firms, there is a possibility of reverse causality.Appendix figure A1 shows the presence of each of the four team andtraining programs in workplaces with different workforce composition.For example, the first quartile includes organizations that are located inthe bottom 25% of the distribution in terms of the proportion of whitewomen, black women, or black men in their workforce—these are theleast diverse organizations. The figure illustrates that team and training
American Journal of Sociology
1626
programs are present in organizations with different levels of diversityand are not concentrated in the more diverse firms. For example, self-directed work teams are about equally present in organizations in the firstand fourth quartiles of %white women in their workforces and the secondand fourth quartiles of %black women, while cross-training programs aremore highly concentrated in workplaces with the lowest proportions ofwhite and black women and about equally present across the distributionof the proportions of black men. The heterogeneous patterns shown infigure A1 suggest that the effects of self-directed work teams and cross-training programs are unlikely to be a reflection of their concentration infirms with higher initial shares of women and minority workers. Finally,to buttress our confidence that the results do not reflect previous levelsof diversity, I repeated the multivariate analysis presented in table 2, thistime including the proportion of each group in management in the yearof adoption as an independent variable (the proportion of each group innonmanagement positions is already included in the models). This variableabsorbs the variance in the outcome that comes from earlier levels ofdiversity. The results of that analysis (available upon request) are notsignificantly different from the results reported here.
Taken together, the fixed-effects specifications, the research design, therange of control variables, and the various additional analyses reportedhere strengthen my confidence in the conclusions about the effects of cross-functional team and training programs on the shares of women and mi-norities in management.
CONCLUSION AND DISCUSSION
The modern workplace has traditionally been structured around a rigiddivision of labor and narrow job definitions, themselves the products ofearly management ideologies, job-control unionism, and government in-tervention in labor markets during World War II (Jacoby 1985; Baron,Dobbin, and Jennings 1986). More than a system of labor control (Ed-wards 1979), narrow job definitions also institutionalize ascriptive dis-advantage, as women and minorities are segregated into low-level, un-dervalued positions with limited opportunities to be evaluated for theircontributions and to build strategic networks (Kanter 1977; Baron andBielby 1985; Acker 1990). While the question of how to reduce the chan-neling of women and minorities into segregated jobs has been keepingscholars busy, I focus on what happens when the segregated structure ofjobs is ameliorated. If job segregation reinforces ascription, then reor-ganizing work around teams and more porous job boundaries shouldimprove career outcomes for women and minorities. This type of reor-
Restructuring and Ascription at Work
1627
ganization has become popular in the United States over the last quartercentury.
Analyzing data on changes in the organization of work and managerialcomposition from 1980 to 2002 in a national sample of more than 800workplaces, I find that the introduction of cross-functional work pro-grams—self-directed teams and cross-training—leads to increases in theshares of women and minorities in management. These results are notmerely due to the churning of managerial positions associated with or-ganizational change: team and training programs that do not allow womenand minorities to transcend job boundaries do not have these effects.Though it would be myopic to assume that gender and racial biases ceaseto exist in a restructured work setting (or to ignore the possibility thatrestructuring remains decoupled), my findings provide strong support fora relational approach to stratification and for the notion that relaxingnarrow job boundaries and emphasizing collaborative work, instead ofsegregated work, erodes ascription and gives women and minorities newcareer opportunities (Smith 1996; Ollilainen and Rothschild 2001; Smith-Doerr 2004).
The research reported here has significant implications for theory andpractice. It provides a wake-up call for stratification researchers to movebeyond personnel policies for allocating jobs and rewards and look at theorganization of work and the relations between jobs as a source of as-cription. On their end, industrial relations researchers who study restruc-turing focus on labor control and class inequalities, overlooking the dis-tinct effects of the labor process on women’s and minorities’ careeropportunities (Edwards 1979; Baron and Bielby 1980; Barker 1993; Os-terman 2000; Handel 2005). The finding that changes in the structure ofwork change the ascriptive structure of opportunities corroborates evi-dence from case studies showing that women and minorities working incross-functional contexts get more exposure, voice, and appreciation thanthose working in segregated structures (e.g., Smith 1996; Ollilainen andRothschild 2001; Smith-Doerr 2004).
How would this translate into higher shares of women and minoritiesin management? The general causal chain, based on evidence from re-search and theory, suggests the following stages: the restructuring of workalters the type of intergroup contact and interaction, from segregated tocollaborative; these more collaborative relations weaken stereotypes andgroup boundaries (Ridgeway and Smith-Lovin 1999; Pettigrew and Tropp2006); weakened stereotypes can lead to better assessment of women’sand minorities’ capabilities by others (Reskin 2000, p. 322) and increasethe tendency of higher-status workers to network with them (McGuire2002); these improved evaluations and expanded networks in turn can
American Journal of Sociology
1628
lead to new promotion opportunities.19 Such opportunities could come,for example, through lateral moves to jobs with better career ladders.Lateral moves often provide the only outlet from jobs with limited pro-motion ladders (DiPrete and Soule 1988; Spilerman and Petersen 1998),but here too segregated workers are disadvantaged because these movesrequire that the worker know of the vacancy and be perceived as eligiblefor that job (Spilerman and Petersen 1998, p. 225). The networking andvisibility opportunities afforded by cross-functional work environmentscan help women and minorities learn of these opportunities and put themon the radar screen for such moves. Other career opportunities facilitatedby the new work environment can include, for example, new mentoringrelations or assignments to prestigious tasks, both of which have beenfound to facilitate the entrance of women and minorities to management(Bell and Nkomo 2001; Kalev et al. 2006). Whether women and minoritiesseek out career opportunities in these new environments, managers andhigh-status employees reach out to the newly discovered talent, or thetwo processes work together, the end result is improved access to man-agement jobs.
Looking at the organization of work as a source of ascription adds arelational dimension to the dialogue between structural and social psy-chological theories of stratification (Baron and Pfeffer 1994; Bielby 2000;Reskin 2000). Social psychologists argue that biases and stereotypes areadaptive. Sociologists have mostly studied the effect of personnel struc-tures on cognitive biases among decision makers. Here we explore a re-lational aspect of the connection between the structure of work and cog-nitive biases in intergroup relations (see also Reskin 2000). Socialpsychologists have shown that power and status differentials affect ste-reotypes, boundaries, and prejudice (Tajfel and Turner 1979; Ridgeway1997; Pettigrew and Tropp 2006). We have now seen that work structuresthat weaken these differentials also lead to better access to managementfor women and minorities.
The analysis explores distinct effects of restructuring across the inter-section of gender and race, suggesting that this model might not be equallyapplicable for all groups of women and minorities. First, black women’sgains from the transition to team-based work are significantly smallerthan white women’s. Black women might benefit less from teams becausethey are more segregated than white women, and so fewer of them may
19 It remains an open question whether the positive effects pertain only to women andminorities participating in these teams, or whether there is a spillover effect wherein,following workers’ and managers’ encounters with countertypical examples, genderand racial biases at the workplace are attenuated more generally (see Kang and Banaji[2006, p. 1109] on the effects of debiasing agents).
Restructuring and Ascription at Work
1629
be in a position to actually participate in these programs. Because of theirdouble minority status (as women and as blacks), once they participatein teams black women may have lower returns to participation; they mayface stronger intergroup boundaries and may be less successful in forminguseful networks (McGuire and Reskin 1993; Bell and Nkomo 2001). Forexample, even though teams may serve as a conduit for career-buildingmentoring relations, if having a mentor of the same race matters, as someargue (Thomas 2001), black woman may simply have fewer potentialmentors than white women. The second pattern we have observed is thatblack men and black women experience adverse effects from the intro-duction of problem-solving teams. This probably reflects a pattern inwhich highly valued employees—usually whites and men—are more likelyto participate in these expert teams (Vallas 2003a; Batt 2004) and so tobenefit from the associated career opportunities, deepening the disadvan-tage of minority workers in access to management. Another possible ex-planation of these adverse effects is suggested by evidence that problem-solving teams (but not self-directed work teams) are accompanied byincreased tension at the workplace (Appelbaum et al. 2000, p. 177; Vallas2003a). It is possible that racial boundaries, more than gender boundaries,are reinforced in such a context (Vallas 2003a). Taken together, the resultsfor the main and control variables show that race and gender combineto create unique opportunities for each group (Nkomo and Cox 1989;Nkomo 1992; Browne and Misra 2003, p. 506; Elliott and Smith 2004).We need to explore the structural, relational, and cognitive mechanismsthat sustain and erode disadvantage separately for each of these groups.
It is also significant that the adoption of conventional job-training pro-grams does not undermine gender and racial inequality. Proponents ofaffirmative action have promoted employers’ training programs as ameans of improving the career chances of women and minorities (U.S.Glass Ceiling Commission 1995). Yet research has shown that women areless likely to receive such training, precisely because of their segregationin positions that are not eligible for training (Knoke and Ishio 1998). Itis hardly surprising, then, that job-training programs do not lead to highermanagerial diversity in my analyses.
This study bridges organizational and sociological research on genderand race relations in organizations. Management researchers studyingintergroup relations focus on the implications for organizational efficiencyand productivity (Chatman and Flynn 2001; Bacharach et al. 2005), whilesociologists mostly look at how intergroup relations shape stratificationand exclusion (Ridgeway 1997; see also DiTomaso, Post, and Parks-Yancy2007). The results of the current study tie these two literatures together.Others have already shown that cross-functional work improves orga-nizational efficiency (Ichniowski et al. 1996; Appelbaum et al. 2000), and
American Journal of Sociology
1630
I have shown here that it also increases managerial diversity. Becauserestructured jobs may remain nonetheless within the realm of white’s andmen’s jobs, if employers are to consciously tie high-performance worksystems to diversity efforts they will need to ensure that restructuring isindeed cross-functional, rather than creating collaborative relations withinexisting functional divisions (Kanter 1985; Brickson 2000), and thatwomen and minorities participate in these programs.
Sociologists of stratification rarely discuss the decline in white men’sshare in management that often accompanies the improvements inwomen’s and minorities’ careers. We have seen that the odds of managers’being white men decline following the adoption of self-directed teams andcross-training programs as well as other organizational changes analyzedin the models. These results are likely a symptom of the current structureof work, where opportunities are, at least partially, based on ascriptivecharacteristics and where women’s and minorities’ disadvantage is in-herently linked to white men’s advantage (Linnehan and Konrad 1999,p. 409). White men, as a group, benefit from job segregation because theyare more likely to be concentrated in the more visible jobs with bettercareer ladders and to face lower competition over career opportunities.If other groups gain more visibility and access to better jobs, white men’sadvantages will be reduced. At minimum, as the managerial pipelinebecomes more diverse, ceteris paribus, the chances of white men becomingmanagers will decline.20
If a given program helps one group but clearly harms another, it mightevoke backlash by the harmed group, be it due to sexism or racism,aversion to change, or the feeling that the group’s interests, status, socialidentity, or rights are being undermined (Cockburn 1991; Tsui, Egan, andO’Reilly 1992; Tomaskovic-Devey 1993; Linnehan and Konrad 1999;Lowery, Knowles, and Unzueta 2007).21 There are good reasons to believe,however, that diversity gains from cross-functional reorganization maybe less likely to evoke a backlash. First, because such diversity gains area product not of diversity efforts but rather of efficiency efforts, they aremore likely to be associated with organizational effectiveness than with
20 An alternative explanation for the negative effect of self-directed teams on the oddsthat managers are white men is that white male managers may voluntarily leave afterthe adoption of these programs, which may entail a change in management style. Ifvoluntary resignation is the mechanism, this pattern will be less pronounced in periodsof high unemployment. I examined this possibility by reanalyzing the data, adding tothe model measures for an interaction between the presence of self-directed teams andstate unemployment rates. None of the interaction coefficients was significant (for whitemen the coefficient is 0.006; SE p 0.007), and so the analysis does not support thevoluntary exit hypothesis. Full results are available upon request.21 I thank an anonymous reviewer for this point.
Restructuring and Ascription at Work
1631
legal compliance; researchers find that an organizational perspective ondiversity that emphasizes efficiency is less associated with backlash thana perspective emphasizing compliance and fairness (Ely and Thomas2001). Second, researchers report a greater sense of opportunity for allworkers in cross-functional structures, because of the flexibility to tran-sition across jobs and tasks (Kvande and Rasmussen 1994, p. 172; Smith-Doerr 2004). Given that what constitutes individuals’ self-interest is af-fected by the opportunities afforded by organizational structures (Kanter1977; Dobbin et al. 1993, p. 400), it is possible that this greater sense ofopportunity will reduce the majority group’s sense of threat and tendencyfor exclusion and social closure.
The negative effects on white men suggest that access to managementmay be a zero-sum game across demographic groups. Yet the implicationsof these results for the life chances of workers from all groups should beinterpreted with caution. Census data show that the percentage of whitemen who are managers continues to rise (Padavic and Reskin 2002, p.102), and white men continue to hold most high-level, powerful jobs(Elliott and Smith 2004). At the same time, women’s and minorities’ labormarket gains remain unstable. Blacks suffered higher rates of downwardmobility from managerial occupations during the 1990s than whites(McBrier and Wilson 2004), and white men are more likely than any otherdemographic groups to find jobs after layoffs (Spalter-Roth and Deitch1999). No single program will stop these trends. But if the increaseddiversity that follows the adoption of cross-functional work structures isless likely to provoke a backlash, as the discussion above suggests, suchstructures may help women and minorities institutionalize their labormarket gains.
Employers have been experimenting with ways to increase the repre-sentation of women and minorities in the workforce and in managementfor almost half a century (Dobbin et al. 1993). The formalization of humanresources policies is one prominent means for curbing bias by proceduralfairness (Reskin 2000). But researchers (Baldi and McBrier 1997; Elviraand Town 2001), as well as the Supreme Court,22 have found formalizationto be far from a panacea. Employers have devised special networkingand mentoring programs for women and minorities to reduce their socialisolation. Research has shown that these programs have weak, and oftennegative, effects on diversity outcomes (Carter 2003; Friedman and Craig2004; Kalev et al. 2006). The results of my research shift our attentiontoward the way work is done and advance a relational approach to in-equality and its reduction (Tilly 1998). Compliance structures attempt tochange behavior from the top down, through formal rules. The organi-
22 Griggs v. Duke Power Co., 401 U.S. 424 (1971).
American Journal of Sociology
1632
zation of work changes the structure of intergroup relations and inter-actions more organically. People collaborate and cooperate rather thangive and accept assignments. Previously invisible and undervalued work-ers now voice their opinions on important issues or perform tasks no onethought they could. New types of relations between advantaged and dis-advantaged groups are more likely to evolve under these conditions. Weneed to think about how to structure relations at work in a way that willdisrupt the reproduction of stereotypes and group boundaries. Job seg-regation is one of the most institutionalized work practices that reinforceand reify ascriptive disparities. As this study demonstrates, employers andmanagers can alter the organization of jobs in ways that will reduceascriptive disadvantage.
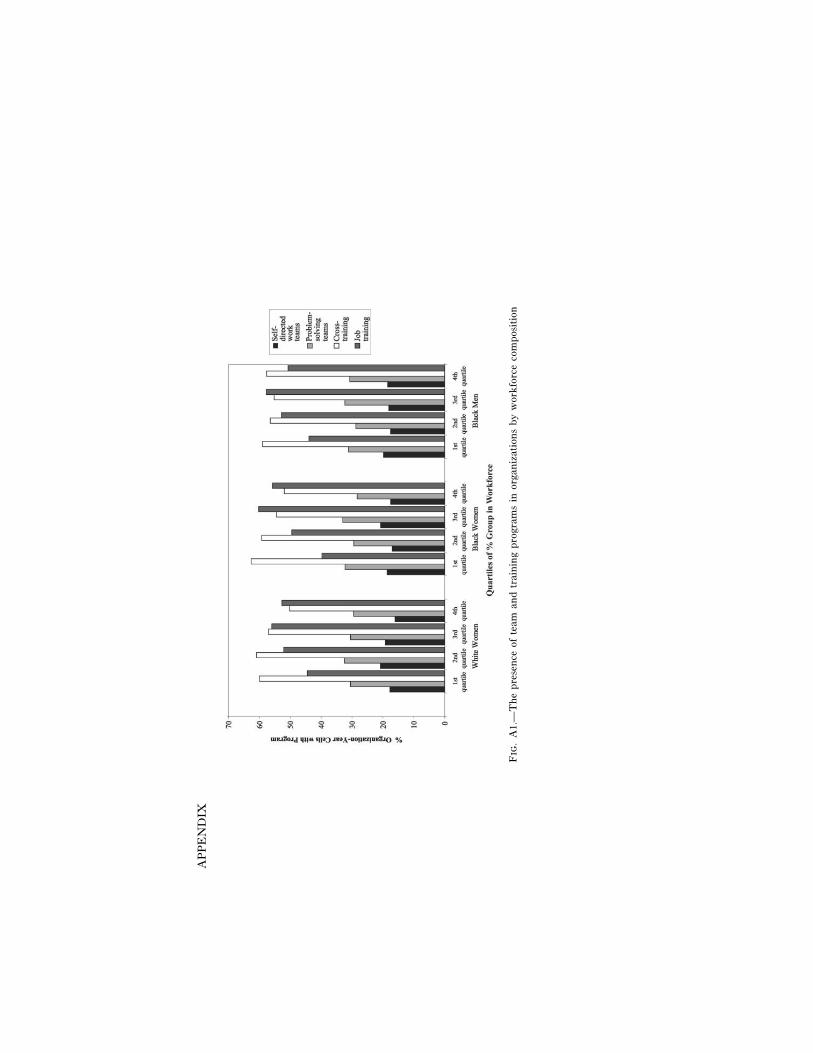
AP
PE
ND
IX
Fig
.A
1.—
Th
ep
rese
nce
ofte
aman
dtr
aini
ng
pro
gram
sin
orga
niz
atio
ns
by
wor
kfo
rce
com
posi
tion

TABLE A1Fixed-Effects Estimates of the log Odds that Managers are White Men,
White Women, Black Women, or Black Men, 1980–2002, Baseline Model
WhiteMen
WhiteWomen
BlackWomen
BlackMen
Complementary organizational changes:Management training . . . . . . . . . . . . . . . . . . . . . . . . . . . .002 .043** .002 �.020
(.015) (.015) (.014) (.015)Peer evaluations . . . . . . . . . . . . . . . . . . . . . . . . . . . . . . . . . �.002 .025 .014 .034
(.018) (.019) (.017) (.018)Work/family accommodations . . . . . . . . . . . . . . . . . . �.041** .034** .021** �.003
(.008) (.008) (.007) (.008)Organizational downsizing . . . . . . . . . . . . . . . . . . . . . . �.032* .062** .082** .024
(.016) (.017) (.015) (.016)%managerial jobs in establishment . . . . . . . . . . . . �1.339** .795** �2.920** �2.186**
(.104) (.110) (.098) (.101)Organizational structures:
Formalized personnel policies . . . . . . . . . . . . . . . . . . �.001 �.005 �.010** �.006(.004) (.004) (.004) (.004)
Affirmative action plan . . . . . . . . . . . . . . . . . . . . . . . . . �.053** .037* .001 .043*(.017) (.018) (.016) (.017)
Diversity programs . . . . . . . . . . . . . . . . . . . . . . . . . . . . . . �.046** .059** .043** .015(.008) (.009) (.008) (.008)
Union agreement . . . . . . . . . . . . . . . . . . . . . . . . . . . . . . . . �.079* .027 �.022 .034(.035) (.038) (.034) (.036)
Establishment size (log) . . . . . . . . . . . . . . . . . . . . . . . . . �.096** .042** �.549** �.343**(.012) (.013) (.012) (.012)
Workforce composition:%women in top management . . . . . . . . . . . . . . . . . . �.002** .004** .001 �.003**
(.001) (.001) (.001) (.001)%minorities in top management . . . . . . . . . . . . . . . �.001 �.002 .008** .013**
(.001) (.002) (.001) (.002)Proportion focal group in nonmanagerial
jobs . . . . . . . . . . . . . . . . . . . . . . . . . . . . . . . . . . . . . . . . . . . . . 1.060** 1.226** .469** 1.539**(.048) (.054) (.116) (.136)
No focal group in management . . . . . . . . . . . . . . . . �.362** �.223** �.579** �.156**(.046) (.013) (.012) (.007)
Proportion white men in industry labor force(log) . . . . . . . . . . . . . . . . . . . . . . . . . . . . . . . . . . . . . . . . . . . . . .402** �.246** .126 .155
(.086) (.090) (.082) (.088)Proportion white women in industry labor
force (log) . . . . . . . . . . . . . . . . . . . . . . . . . . . . . . . . . . . . . . �.039 .236** .153* �.083(.059) (.063) (.056) (.061)
Proportion black women in industry laborforce (log) . . . . . . . . . . . . . . . . . . . . . . . . . . . . . . . . . . . . . . �.039 .034 �.024 .050*
(.022) (.024) (.021) (.023)Proportion black men in industry labor force
(log) . . . . . . . . . . . . . . . . . . . . . . . . . . . . . . . . . . . . . . . . . . . . . �.056* .045 .031 .010(.025) (.026) (.024) (.025)
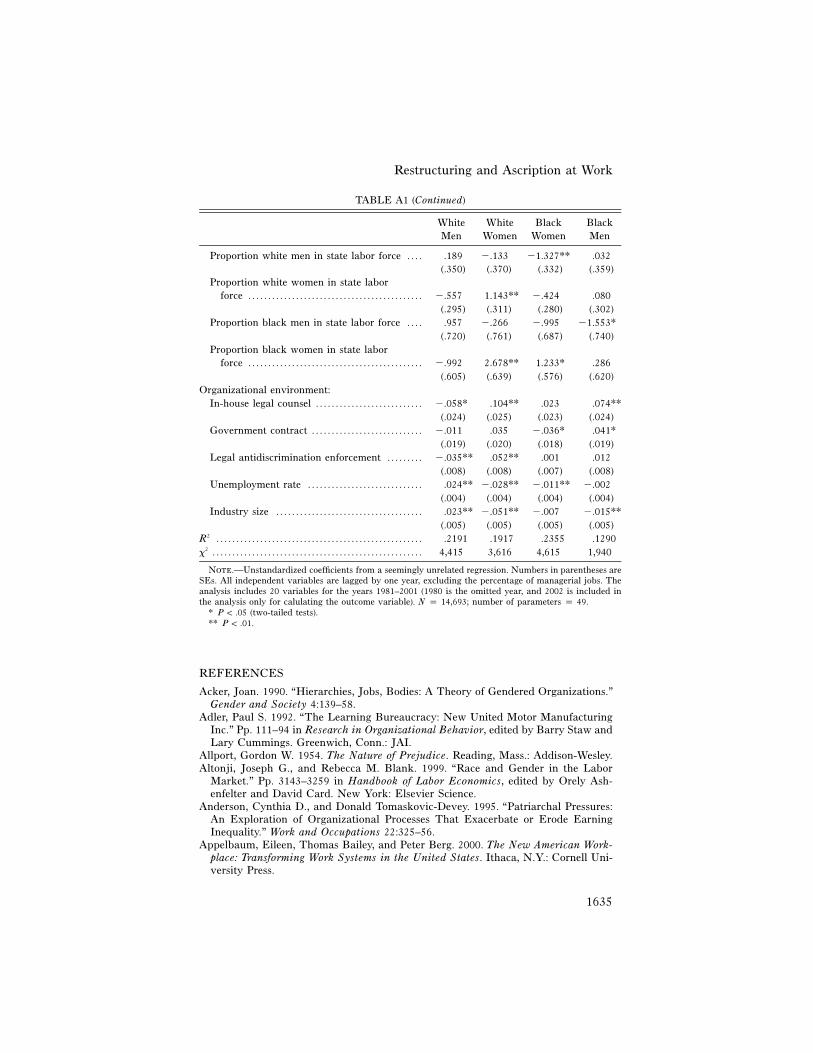
Restructuring and Ascription at Work
1635
TABLE A1 (Continued)
WhiteMen
WhiteWomen
BlackWomen
BlackMen
Proportion white men in state labor force . . . . .189 �.133 �1.327** .032(.350) (.370) (.332) (.359)
Proportion white women in state laborforce . . . . . . . . . . . . . . . . . . . . . . . . . . . . . . . . . . . . . . . . . . . . �.557 1.143** �.424 .080
(.295) (.311) (.280) (.302)Proportion black men in state labor force . . . . .957 �.266 �.995 �1.553*
(.720) (.761) (.687) (.740)Proportion black women in state labor
force . . . . . . . . . . . . . . . . . . . . . . . . . . . . . . . . . . . . . . . . . . . . �.992 2.678** 1.233* .286(.605) (.639) (.576) (.620)
Organizational environment:In-house legal counsel . . . . . . . . . . . . . . . . . . . . . . . . . . . �.058* .104** .023 .074**
(.024) (.025) (.023) (.024)Government contract . . . . . . . . . . . . . . . . . . . . . . . . . . . . �.011 .035 �.036* .041*
(.019) (.020) (.018) (.019)Legal antidiscrimination enforcement . . . . . . . . . �.035** .052** .001 .012
(.008) (.008) (.007) (.008)Unemployment rate . . . . . . . . . . . . . . . . . . . . . . . . . . . . . .024** �.028** �.011** �.002
(.004) (.004) (.004) (.004)Industry size . . . . . . . . . . . . . . . . . . . . . . . . . . . . . . . . . . . . . .023** �.051** �.007 �.015**
(.005) (.005) (.005) (.005)R2 . . . . . . . . . . . . . . . . . . . . . . . . . . . . . . . . . . . . . . . . . . . . . . . . . . . . .2191 .1917 .2355 .1290x2 . . . . . . . . . . . . . . . . . . . . . . . . . . . . . . . . . . . . . . . . . . . . . . . . . . . . . 4,415 3,616 4,615 1,940
Note.—Unstandardized coefficients from a seemingly unrelated regression. Numbers in parentheses areSEs. All independent variables are lagged by one year, excluding the percentage of managerial jobs. Theanalysis includes 20 variables for the years 1981–2001 (1980 is the omitted year, and 2002 is included inthe analysis only for calulating the outcome variable). N p 14,693; number of parameters p 49.
* P ! .05 (two-tailed tests).** P ! .01.
REFERENCES
Acker, Joan. 1990. “Hierarchies, Jobs, Bodies: A Theory of Gendered Organizations.”Gender and Society 4:139–58.
Adler, Paul S. 1992. “The Learning Bureaucracy: New United Motor ManufacturingInc.” Pp. 111–94 in Research in Organizational Behavior, edited by Barry Staw andLary Cummings. Greenwich, Conn.: JAI.
Allport, Gordon W. 1954. The Nature of Prejudice. Reading, Mass.: Addison-Wesley.Altonji, Joseph G., and Rebecca M. Blank. 1999. “Race and Gender in the Labor
Market.” Pp. 3143–3259 in Handbook of Labor Economics, edited by Orely Ash-enfelter and David Card. New York: Elsevier Science.
Anderson, Cynthia D., and Donald Tomaskovic-Devey. 1995. “Patriarchal Pressures:An Exploration of Organizational Processes That Exacerbate or Erode EarningInequality.” Work and Occupations 22:325–56.
Appelbaum, Eileen, Thomas Bailey, and Peter Berg. 2000. The New American Work-place: Transforming Work Systems in the United States. Ithaca, N.Y.: Cornell Uni-versity Press.
American Journal of Sociology
1636
Appelbaum, Eileen, Thomas Bailey, Peter Berg, and Arne L. Kalleberg. 2000. Man-ufacturing Advantage: Why High-Performance Work Systems Pay Off. Ithaca, N.Y.:Cornell University Press.
Appelbaum, Eileen, and Peter Berg. 2001. “High-Performance Work Systems andLabor Market Structures.” Pp. 271–93 in Sourcebook of Labor Markets: EvolvingStructures of Processes, edited by Ivar Berg and Arne L. Kalleberg. New York:Kluwer Academic/Plenum.
Bacharach, Samuel B., Peter A. Bamberger, and Dana Vashdi. 2005. “Diversity andHomophily at Work: Supportive Relations among White and African-AmericanPeers.” Academy of Management Journal 48:619–44.
Baldi, Stephan, and Debra B. McBrier. 1997. “Do the Determinants of PromotionDiffer for Blacks and Whites? Evidence from the U.S. Labor Market.” Work andOccupations 24:478–97.
Barker, James R. 1993. “Tightening the Iron Cage: Concertive Control in Self-Man-aging Teams.” Administrative Science Quarterly 38:408–37.
Baron, James N. 1984. “Organizational Perspectives on Stratification.” Annual Reviewof Sociology 10:37–69.
Baron, James N., and William T. Bielby. 1980. “Bringing the Firms Back In: Strati-fication, Segmentation, and the Organization of Work.” American Sociological Re-view 45:737–65.
———. 1985. “Organizational Barriers to Gender Equality: Sex Segregation of Jobsand Opportunities.” Pp. 233–51 in Gender and the Life Course, edited by Alice S.Rossi. New York: Aldine.
Baron, James N., Frank Dobbin, and Devereaux P. Jennings. 1986. “War and Peace:The Evolution of Modern Personnel Administration in U.S. Industry.” AmericanJournal of Sociology 92:350–83.
Baron, James N., Michael T. Hannan, Greta Hsu, and Ozgecan Kocak. 2007. “In theCompany of Women: Gender Inequality and the Logic of Bureaucracy in Start-UpFirms.” Work and Occupations 34:35–66.
Baron, James N., Brian S. Mittman, and Andrew E. Newman. 1991. “Targets ofOpportunity: Organizational and Environmental Determinants of Gender Integra-tion within the California Civil Services, 1976–1985.” American Journal of Sociology96:1362–1401.
Baron, James N., and Andrew E. Newman. 1990. “For What It’s Worth: Organizations,Occupations and the Value of Work Done by Women and Nonwhites.” AmericanSociological Review 55:155–75.
Baron, James N., and Jeffrey Pfeffer. 1994. “The Social Psychology of Organizationsand Inequality.” Social Psychology Quarterly 57:190–209.
Batt, Rosemary. 2004. “Who Benefits from Teams? Comparing Workers, Supervisorsand Managers.” Industrial Relations 43:183–212.
Baugh, Gayle S., and George B. Graen. 1997. “Effects of Team Gender and RacialComposition on Perceptions of Team Performance in Cross-functional Teams.”Group and Organization Management 22:366.
Bell, Ella L. J. Edmonson, and Stella M. Nkomo. 2001. Our Separate Ways: Blackand White Women and the Struggle for Professional Identity. Cambridge, Mass.:Harvard Business School Press.
Bell, Ella L. J. Edmonson, Stella M. Nkomo, and John Hammond. 1994. Barriers toWork Place Advancement Experienced by African-Americans. Washington, D.C.:Glass Ceiling Commission, U.S. Department of Labor.
Bennear, Lori Snyder. 2007. “Are Management-Based Regulations Effective? Evidencefrom State Pollution Prevention Programs.” Journal of Policy Analysis and Man-agement 26:327–48.
Berg, Peter, Ann Frost, and Gil Preuss. 2001. “Team Models of Work Organizationand Outcomes for Low-Skilled Workers in American Hospitals.” Pp. 293–300 in
Restructuring and Ascription at Work
1637
Proceedings of the Fifty-third Annual Meeting of the Industrial Relations ResearchAssociation. Madison, Wis.: Industrial Relations Research Association.
Berg, Peter, Arne L. Kalleberg, and Eileen Appelbaum. 2003. “Balancing Work andFamily: The Role of High-Commitment Environments.” Industrial Relations 42:168.
Bielby, William T. 2000. “Minimizing Workplace Gender and Racial Bias.” Contem-porary Sociology—a Journal of Reviews 29:120–29.
Bielby, William T., and James N. Baron. 1986. “Men and Women at Work: Sex Seg-regation and Statistical Discrimination.” American Journal of Sociology 91:759–99.
Black, Sandra E., Lisa M. Lynch, and Anya Krivelyova. 2004. “How Workers FareWhen Employers Innovate.” Industrial Relations 43:44–66.
Blair-Loy, Mary. 2001. “It’s Not Just What You Know, It’s Who You Know: TechnicalKnowledge, Rainmaking, and Gender among Finance Executives.” Research in theSociology of Work 10:51–83.
Blalock, Hubert M. 1967. Toward a Theory of Minority-Group Relations. New York:Wiley.
Blau, Francine D., and Lawrence M. Kahn. 1992. “Race and Gender Pay Differentials.”Working paper no. 4120. National Bureau of Economic Research, Cambridge, Mass.
Blau, Peter M., and Otis D. Duncan. 1967. The American Occupational Structure.New York: Wiley.
Blum, Terry C., Dail L. Fields, and Jodi S. Goodman. 1994. “Organization-LevelDeterminants of Women in Management.” Academy of Management Journal 37:241–68.
Bond, Megan A., and Jean L. Pyle. 1998. “Diversity Dilemmas at Work.” Journal ofManagement Inquiry 7:252–69.
Brickson, Shelley. 2000. “The Impact of Identity Orientation on Individual and Or-ganizational Outcomes in Demographically Diverse Settings.” Academy of Manage-ment Review 25:82–101.
Britton, Dana M. 2000. “The Epistemology of the Gendered Organization.” Genderand Society 14:418–34.
Browne, Irene, and Joya Misra. 2003. “The Intersection of Gender and Race in LaborMarkets.” Annual Review of Sociology 29:487–513.
Bunderson, Stuart J. 2003. “Recognizing and Utilizing Expertise in Work Groups: AStatus Characteristics Perspective.” Administrative Science Quarterly 48:557–91.
Burt, Ronald S. 1998. “The Gender of Social Capital.” Rationality and Society 10:5–46.
Campion, Michael A., Lisa Cheraskin, and Michael J. Stevens. 1994. “Career-RelatedAntecedents and Outcomes of Job Rotation.” Academy of Management Journal 37:1518–42.
Cappelli, Peter, Laurie Bassi, Harry Katz, David Knoke, Peter Osterman, and MichaelUseem. 1997. Change at Work. New York: Oxford University Press.
Carter, John. 2003. Ethnicity, Exclusion and the Workplace. London: PalgraveMacmillan.
Chatman, Jennifer A., and Francis J. Flynn. 2001. “The Influence of DemographicHeterogeneity on the Emergence and Consequences of Cooperative Norms in WorkTeams.” Academy of Management Journal 44:956–74.
Chatman, Jennifer A., Jeffrey T. Polzer, Sigal G. Barsade, and Margaret A. Neale.1998. “Being Different yet Feeling Similar: The Influence of Demographic Com-position and Organizational Culture on Work Processes and Outcomes.” Adminis-trative Science Quarterly 43:749–80.
Cockburn, Cynthia. 1991. In the Way of Women: Men’s Resistance to Sex Equality inOrganizations. Ithaca, N.Y.: Industrial and Labor Relations Press.
Cohen, Lisa E., Joseph P. Broschak, and Heather A. Haveman. 1998. “And Then There
American Journal of Sociology
1638
Were More? The Effect of Organizational Sex Composition on the Hiring and Pro-moting of Managers.” American Sociological Review 63:711–27.
Cook, Clarissa, and Malcolm Waters. 1998. “The Impact of Organizational Form onGendered Labour Markets in Engineering and Law.” Sociological Review 46:314–39.
Daday, Gerhard, and Beverly Burris. 2002. “The Effects of Teaming-Structures onRace, Ethnicity, and Gender Differences in a High-Tech Corporation: A Case Study.”Paper presented at the annual meetings of the American Sociological Association,Chicago, August.
DiPrete, Thomas A., and Whitman T. Soule. 1988. “Gender and Promotion in Seg-mented Job Ladder Systems.” American Sociological Review 53:26–40.
DiTomaso, Nancy, Corinne Post, and Rochelle Parks-Yancy. 2007. “Workforce Diver-sity and Inequality: Power, Status, and Numbers.” Annual Review of Sociology 33:473–501.
Dobbin, Frank, John R. Sutton, John W. Meyer, and Richard W. Scott. 1993. “EqualOpportunity Law and the Construction of Internal Labor Markets.” American Jour-nal of Sociology 99:396–427.
Edelman, Lauren B., and Stephen M. Petterson. 1999. “Symbols and Substance inOrganizational Response to Civil Rights Law.” Research in Social Stratification andMobility 17:107–35.
Edwards, Richard C. 1979. Contested Terrain. New York: Basic Books.Elliott, James R., and Ryan A. Smith. 2001. “Ethnic Matching of Supervisors to Sub-
ordinate Work Groups: Findings on Bottom-Up Ascription and Social Closure.”Social Problems 48:258–76.
———. 2004. “Race, Gender and Workplace Power.” American Sociological Review69:365–86.
Elvira, Marta M., and Robert Town. 2001. “The Effects of Race and Worker Pro-ductivity on Performance Evaluations.” Industrial Relations 40:571–90.
Elvira, Marta M., and Christopher D. Zatzick. 2002. “Who’s Displaced First? TheRole of Race in Layoff Decisions.” Industrial Relations 41:329–61.
Ely, Robin. 1995. “The Power of Demography: Women’s Social Construction of GenderIdentity at Work.” Academy of Management Journal 38:589–634.
Ely, Robin, and Irene Padavic. 2007. “A Feminist Analysis of Organizational Researchon Sex Differences.” Academy of Management Review 32:1121–43.
Ely, Robin J., and David A. Thomas. 2001. “Cultural Diversity at Work: The Effectsof Diversity Perspectives on Work Group Processes and Outcomes.” AdministrativeScience Quarterly 46:229–73.
Fairlie, Robert W., and Lori G. Kletzer. 1998. “Jobs Lost, Jobs Regained: An Analysisof Black/White Differences in Job Displacement in the 1980s.” Industrial Relations37:460–77.
Farber, Henry. 1997. “The Changing Face of Job Loss in the United States, 1981–1995.”Brookings Papers on Economic Activity: Microeconomics 1997:55–142.
Featherman, David L., and Robert M. Hauser. 1978. Opportunity and Change. NewYork: Academic.
Felmlee, Diane H., and Lowell L. Hargens. 1988. “Estimation and Hypothesis Testingfor Seemingly Unrelated Regression: A Sociological Application.” Social ScienceResearch 17:384–99.
Ferguson, Kathy E. 1984. The Feminist Case against Bureaucracy. Philadelphia: Tem-ple University Press.
Fox, John. 1997. Applied Regression Analysis, Linear Models, and Related Methods.Thousand Oaks, Calif.: Sage.
Frenkel, Michal, and Yehouda Shenhav. 2006. “From Binarism Back to Hybridity: APostcolonial Reading of Management and Organization Studies.” Organization Stud-ies 27:855–76.
Restructuring and Ascription at Work
1639
Friedman, Raymond A., and Kellina M. Craig. 2004. “Predicting Joining and Partic-ipating in Minority Employee Network Groups.” Industrial Relations 43:793–816.
Gaertner, Samuel L., and John F. Dovidio. 2000. Reducing Intergroup Bias: The Com-mon Ingroup Identity Model. Philadelphia: Psychology Press.
Gaertner, Samuel L., Jeffrey A. Mann, John F. Dovidio, Audrey J. Murrell, and MarinaPomare. 1990. “How Does Cooperation Reduce Intergroup Bias?” Journal of Per-sonality and Social Psychology 59:692–704.
Greenhaus, Jeffrey H., Saroj Parasuraman, and Wayne M. Wormley. 1990. “Effects ofRace on Organizational Experiences, Job Performance Evaluations, and Career Out-comes.” Academy of Management Journal 31:64–86.
Handel, Michael J. 2005. “Trends in Perceived Job Quality, 1989 to 1998.” Work andOccupations 32:66–94.
Handel, Michael J., and David I. Levine. 2004. “Editors’ Introduction: The Effects ofNew Work Practices on Workers.” Industrial Relations 43:1–43.
Hanushek, Erin A., and John E. Jackson. 1977. Statistical Methods for Social Sci-entists. New York: Academic Press.
Hewlett, Sylvia Ann, Carolyn Buck Luce, and Cornel West. 2005. “Leadership in YourMidst: Tapping the Hidden Strengths of Minority Executives.” Harvard BusinessReview 83:74–82.
Hicks, Alexander M. 1994. “Introduction to Pooling.” Pp. 169–88 in The ComparativePolitical Economy of the Welfare State, edited by Thomas Janoski and AlexandraM. Hicks. Cambridge: Cambridge University Press.
Hight, Joseph E. 1998. “Young Worker Participation in Post-school Education andTraining.” Monthly Labor Review 121:14–21.
Holzer, Harry J., and David Neumark. 1998. “What Does Affirmative Action Do?”Working paper no. 6005. National Bureau of Economic Research, Cambridge, Mass.
———. 2000. “Assessing Affirmative Action.” Industrial and Labor Relations Review53:240–71.
Hsiao, Cheng. 1986. Analysis of Panel Data. Cambridge: Cambridge University Press.Ibarra, Herminia. 1992. “Homophily and Differential Returns: Sex Differences in Net-
work Structure and Access in an Advertising Firm.” Administrative Science Quar-terly 34:422–47.
———. 1995. “Race, Opportunity and Diversity of Social Circles in Managerial Net-works.” Academy of Management Journal 38:673–703.
Ibarra, Herminia, and Steven B. Andrews. 1993. “Power, Social Influence, and SenseMaking: Effects of Network Centrality and Proximity on Employee Perceptions.”Administrative Science Quarterly 38:277–303.
Ichniowski, Casey, Thomas Kochan, David Levine, Craig Olson, and George Strauss.1996. “What Works at Work: An Overview and Assessment.” Industrial Relations35:356–74.
Jacobs, Jerry A. 1992. “Women’s Entry into Management: Trends in Earnings, Au-thority, and Values among Salaried Managers.” Administrative Science Quarterly37:282–301.
Jacoby, Sanford M. 1985. Employing Bureaucracy: Managers, Unions, and the Trans-formation of Work in American Industry, 1900–1945. New York: Columbia Uni-versity Press.
Kalev, Alexandra, and Frank Dobbin. 2006. “Enforcement of Civil Rights Law inPrivate Workplaces: The Effects of Compliance Reviews and Lawsuits over Time.”Law and Social Inquiry 31:855–903.
Kalev, Alexandra, Frank Dobbin, and Erin Kelly. 2006. “Best Practices or BestGuesses? Assessing the Efficacy of Corporate Affirmative Action and Diversity Pol-icies.” American Sociological Review 71:589–617.
Kalleberg, Arne L., David Knoke, Peter V. Marsden, and Joe L. Spaeth. 1996. Orga-
American Journal of Sociology
1640
nizations in America: Analyzing Their Structures and Human Resource Practices.Thousand Oaks, Calif.: Sage Publications.
Kalleberg, Arne L., Peter V. Marsden, Jeremy Reynolds, and David Knoke. 2006.“Beyond Profit? Sectoral Differences in High-Performance Work Practices.” Workand Occupations 33:271–302.
Kalleberg, Arne L., and Arne Mastekaasa. 2001. “Satisfied Movers, Committed Stayers:The Impact of Job Mobility on Work Attitudes in Norway.” Work and Occupations28:183–209.
Kang, Jerry, and Mahzarin R. Banaji. 2006. “Fair Measures: A Behavioral RealistRevision of Affirmative Action.” California Law Review 94:1063–1118.
Kanter, Rosabeth Moss. 1977. Men and Women of the Corporation. New York: BasicBooks.
———. 1985. The Change Masters: Corporate Entrepreneurs at Work. New York: FreePress.
Kelly, Erin L. 2000. “Corporate Family Policies in U.S. Organizations, 1965–1997.”Ph.D. dissertation. Princeton University, Department of Sociology.
———. 2003. “The Strange History of Employer-Sponsored Child Care: InterestedActors, Uncertainty, and the Transformation of Law in Organizational Fields.” Amer-ican Journal of Sociology 109:606–49.
Kmec, Julie A. 2005. “Setting Occupational Sex Segregation in Motion: Demand-SideExplanations of Sex Traditional Employment.” Work and Occupations 32:322–54.
Knoke, David, and Yoshito Ishio. 1998. “The Gender Gap in Company Job Training.”Work and Occupations 25:141.
Konrad, Alison M., and Frank Linnehan. 1995. “Formalized HRM Structures: Co-ordinating Equal-Employment Opportunity or Concealing Organizational Prac-tices.” Academy of Management Journal 38:787–820.
Kramer, Roderick M. 1991. “Intergroup Relations and Organizational Dilemmas: TheRole of Categorization Processes.” Research in Organizational Behavior 13:191–228.
Kvande, Elin, and Bente Rasmussen. 1994. “Men in Male-Dominated Organizationsand Their Encounter with Women Intruders.” Scandinavian Journal of Management10:163–73.
Lawler, Edward, Susan Mohrman, and Gerald Ledford. 1992. Employee Involvementand Total Quality Management: Practices and Results in Fortune 1000 Companies.San Francisco: Jossey-Bass.
Leonard, Jonathan. 1984. “Employment and Occupational Advance under AffirmativeAction.” Review of Economics and Statistics 66:377–85.
———. 1985. “Unions and the Employment of Blacks, Hispanics and Women.” In-dustrial and Labor Relations Review 39:115–32.
———. 1990. “The Impact of Affirmative Action Regulation and Equal EmploymentOpportunity Law on Black Employment.” Journal of Economic Perspectives 4:47–63.
Linnehan, Frank, and Alison Konrad. 1999. “Diluting Diversity: Implications for Inter-group Inequality in Organizations.” Journal of Management Inquiry 8:399–413.
Lowery, Brian S., Eric D. Knowles, and Miguel M. Unzueta. 2007. “Framing InequitySafely: Whites’ Motivated Perceptions of Racial Privilege.” Personality and SocialPsychology Bulletin 33:1237–50.
Lynch, Lisa M., and Sandra E. Black. 1998. “Beyond the Incidence of Employer-Provided Training.” Industrial and Labor Relations Review 52:64.
Maddala, G. S. 1977. Econometrics. New York: McGraw-Hill.McBrier, Debra Branch, and George Wilson. 2004. “Going Down? Race and Down-
ward Occupational Mobility for White-Collar Workers in the 1990s.” Work andOccupations 31:283–322.
McCall, Leslie. 2001. Complex Inequality: Gender, Class and Race in the New Economy.New York: Routledge.
Restructuring and Ascription at Work
1641
McGuire, Gail M. 2000. “Gender, Race, Ethnicity and Networks: The Factors Affectingthe Status of Employees’ Network Members.” Work and Occupations 27:500–523.
———. 2002. “Gender, Race, and the Shadow Structure: A Study of Informal Networksand Inequality in a Work Organization.” Work and Occupations 16:303–22.
McGuire, Gail M., and Barbara Reskin. 1993. “Authority Hierarchies at Work: TheImpacts of Race and Sex.” Work and Occupations 7:487–506.
McIlwee, Judith S., and J. Gregg Robinson. 1992. Women in Engineering: Gender,Power, and Workplace Culture. Albany: State University of New York Press.
Meyerson, Debra E., and Joyce K. Fletcher. 2000. “A Modest Manifesto for Shatteringthe Glass Ceiling.” Harvard Business Review 78:126–36.
Milkman, Ruth. 2007. “Two Worlds of Unionism: Women and the New Labor Move-ment.” Pp. 63–80 in The Sex of Class: Women Transforming American Labor, editedby Dorothy Sue Cobble. Ithaca, N.Y.: Cornell University Press.
Miller, Jon. 1986. Pathways in the Workplace. Cambridge: Cambridge University Press.Nkomo, Stella M. 1992. “The Emperor Has No Clothes: Rewriting ‘Race in Organi-
zations.’” Academy of Management Review 17:487–513.Nkomo, Stella M., and Taylor Cox. 1989. “Gender Differences in the Upward Mobility
of Black Managers: Double Whammy or Double Advantage?” Sex Roles 21:825–39.Ollilainen, Marjukka, and Joyce Rothschild. 2001. “Can Self-Managing Teams be Truly
Cross-functional? Gender Barriers to a ‘New’ Division of Labor.” Research in theSociology of Work 10:141–64.
Osterman, Paul. 1994. “How Common Is Workplace Transformation and Who AdoptsIt?” Industrial and Labor Relations Review 47:173–88.
———. 1995. “Skill Training and Work Organization in American Establishments.”Industrial Relations 34:125–46.
———. 2000. “Work Reorganization in an Era of Restructuring: Trends in Diffusionand Effects on Employee Welfare.” Industrial and Labor Relations Review 53:179–96.
Padavic, Irene, and Barbara Reskin. 2002. Women and Men at Work. Thousand Oaks,Calif.: Pine Forge Press.
Paulin, Elizabeth A., and Jennifer M. Mellor. 1996. “Gender, Race and Promotionswithin a Private-Sector Firm.” Industrial Relations 35:276–95.
Petersen, Trond. 1985. “A Comment on Presenting Results from Logit and ProbitModels.” American Sociological Review 50:130–31.
Petersen, Trond, Ishak Saporta, and Marc David Seidel. 1998. “Offering a Job: Mer-itocracy and Social Networks.” American Journal of Sociology 106:763–816.
Pettigrew, Thomas F., and Linda R. Tropp. 2006. “A Meta-analytic Test of IntergroupContact Theory.” Journal of Personality and Social Psychology 90:751–83.
Phillips, Katherine W., Nancy P. Rothbard, and Tracy L. Dumas. In press. “To Discloseor Not to Disclose: Status Distance and Self-Disclosure in Diverse Environments.”Academy of Management Review 34 (4).
Piore, Michael, and Charles Sabel. 1984. The Second Industrial Divide: Possibilitiesfor Prosperity. New York: Basic Books.
Planskey Videla, Nancy. 2006. “Gendered Contradictions: Managers and Women Work-ers in Self-Managed Teams.” Research in the Sociology of Work 16:85–116.
Reskin, Barbara. 1993. “Sex Segregation in the Workplace.” Annual Review of Soci-ology 19:241–79.
———. 2000. “The Proximate Causes of Employment Discrimination.” ContemporarySociology: A Journal of Reviews 29:319–28.
———. 2003. “Including Mechanisms in Our Models of Ascriptive Inequality.” Amer-ican Sociological Review 68:1–21.
Reskin, Barbara, and Debra B. McBrier. 2000. “Why Not Ascription? Organizations’Employment of Male and Female Managers.” American Sociological Review 65:210–33.
American Journal of Sociology
1642
Reskin, Barbara, and Patricia Roos. 1990. Job Queues, Gender Queues: ExplainingWomen’s Inroads into Male Occupations. Philadelphia: Temple University Press.
Ridgeway, Cecilia. 1997. “Interaction and the Conservation of Gender Inequality: Con-sidering Employment.” American Sociological Review 62:218–35.
Ridgeway, Cecilia L., and Lynn Smith-Lovin. 1999. “The Gender System and Inter-action.” Annual Review of Sociology 25:191–216.
Robinson, Corre, Tiffany Taylor, Donald Tomaskovic-Devey, Catherine Zimmer, andMatthew W. Irvine Jr. 2005. “Studying Race/Ethnic and Sex Segregation at theEstablishment Level: Methodological Issues and Substantive Opportunities UsingEEO-1 Reports.” Work and Occupations 32:5–38.
Roscigno, Vincent J. 2007. The Face of Discrimination: How Race and Gender ImpactWork and Home Lives. Lanham, Md.: Rowman & Littlefield.
Sayrs, Lois W. 1989. Pooled Time Series Analysis. Thousand Oaks, Calif.: SagePublications.
Sherif, Muzafer, O. J. Harvey, B. Jack White, William R. Hood, and Carolyn W. Sherif.1961. Intergroup Conflict and Cooperation. Norman: University of Oklahoma Press.
Skaggs, Sheryl. 2008. “Producing Change or Bagging Opportunity? The Effects ofDiscrimination Litigation on Women in Supermarket Management.” American Jour-nal of Sociology 113:1148–82.
Smith, James P., and Finis Welch. 1984. “Affirmative Action and the Labor Markets.”Journal of Labor Economics 2:269–301.
Smith, Vicki. 1996. “Employee Involvement, Involved Employees: Participative WorkArrangements in a White-Collar Service Occupation.” Social Problems 43:166–79.
———. 1997. “New Forms of Work Organization.” Annual Review of Sociology 23:315–39.
Smith-Doerr, Laurel. 2004. “Flexibility and Fairness: Effects of the Network Form ofOrganization on Gender Equity in Life Science Careers.” Sociological Perspectives47:25–54.
Spalter-Roth, R., and Cynthia Deitch. 1999. “‘I Don’t Feel Right Sized; I Feel Out-of-Work Sized’: Gender, Race, Ethnicity, and the Unequal Costs of Displacement.”Work and Occupations 26:446–82.
Spilerman, Seymour, and Trond Petersen. 1998. “Organizational Structure, Deter-minants of Promotion, and Gender Differences in Attainment.” Social Science Re-search 28:203–27.
Steinberg, Ronnie J. 1992. “Gendered Instructions: Cultural Lag and Gender Bias inthe Hay System of Job Evaluation.” Work and Occupations 19:387–423.
Steinberg, Ronnie, Lois Haignere, and Cynthia H. Chertos. 1990. “Managerial Pro-motions in the Public Sector.” Work and Occupations 17:287–301.
Tajfel, Henri, and John C. Turner. 1979. “An Integrative Theory of Intergroup Con-flict.” Pp. 33–47 in The Social Psychology of Intergroup Relations, edited by WilliamG. Austin and Stephen Worchel. Monterey, Calif.: Brooks/Cole.
Taplin, Ian. 1995. “Flexible Production, Rigid Jobs: Lessons from the Clothing In-dustry.” Work and Occupations 22:412–38.
Thomas, David A. 2001. “The Truth about Mentoring Minorities: Race Matters.”Harvard Business Review 79:99–107.
———. 2004. “Diversity as Strategy.” Harvard Business Review 82:98–108.Thomas, David A., and John J. Gabbaro. 1999. Breaking Through: The Making of
Minority Executives in Corporate America. Cambridge, Mass.: Harvard BusinessSchool Press.
Tilly, Charles. 1998. Durable Inequality. Berkeley and Los Angeles: University ofCalifornia Press.
Tomaskovic-Devey, Donald. 1993. Gender and Racial Inequality at Work: The Sourcesand Consequences of Job Segregation. Ithaca, N.Y.: Industrial and Labor RelationsPress.
Restructuring and Ascription at Work
1643
Townsend, Anthony M., and Dow K. Scott. 2001. “Team Racial Composition, MemberAttitudes, and Performance: A Field Study.” Industrial Relations 40:317–37.
Tsui, Anne, Terri D. Egan, and Charles A. O’Reilly. 1992. “Being Different: RelationalDemography and Organizational Attachment.” Administrative Science Quarterly37:549–79.
Turner, John C. 1987. Rediscovering the Social Group: A Self-Categorization Theory.New York: Basil Blackwell.
U.S. Department of Labor. 1992. “How Workers Get Their Training: A 1991 Update.”Washington, D.C.: Bureau of Labor Statistics.
U.S. Glass Ceiling Commission. 1995. A Solid Investment: Making a Full Use of OurNation’s Human Capital. Washington, D.C.: U.S. Glass Ceiling Commission.
Vallas, Steven P. 2003a. “Rediscovering the Color Line within Work Organizations:The ‘Knitting of Racial Groups’ Revisited.” Work and Occupations 30:379–400.
———. 2003b. “The Adventures of Managerial Hegemony: Teamwork, Ideology, andWorker Resistance.” Social Problems 50:204–25.
———. 2003c. “Why Teamwork Fails: Obstacles for Workplace Change in Four Man-ufacturing Plants.” American Sociological Review 68:223–50.
Weber, Max. 1968. Economy and Society, translated and edited by Guenther Rothand Claus Wittich. New York: Bedminster Press.
Wellington, Sheila, Marcia B. Knopf, and Paulette R. Gerkovich. 2003. “What’s Hold-ing Women Back?” Harvard Business Review 81 (6): 18–19.
Western, Bruce. 2002. “The Impact of Incarceration on Wage Mobility and Inequality.”American Sociological Review 67:477–98.
Williams, Joan. 2000. Unbending Gender: Why Family and Work Conflict and Whatto Do About It. New York: Oxford University Press.
Williams, Katherine Y., and Charles A. O’Reilly. 1998. “Demography and Diversityin Organizations.” Pp. 77–140 in Research in Organizational Behavior, edited byBarry M. Staw and L. L. Cummings. Greenwich, Conn.: JAI Press.
Wilson, Reginald. 1995. Affirmative Action: Yesterday, Today and Beyond. Washington,D.C.: American Council on Education.
Zellner, Alfred. 1962. “An Efficient Method of Estimating Seemingly Unrelated Re-gressions and Tests for Aggregation Bias.” Journal of the American Statistical As-sociation 57:348–68.