Embed Size (px)
Citation preview

CRANFIELD UNIVERSITY
NICHOLAS FARQUHARSON PEARCE
MODELLING THE IMPACT OF REDUCED VARIABILITY OF MACHINE TOOLDOWNTIME
SCHOOL OF APPLIED SCIENCES
MRes THESIS
2
CRANFIELD UNIVERSITY
SCHOOL OF APPLIED SCIENCES
MRes THESIS
ACADEMIC YEAR 2007
NICHOLAS FARQUHARSON PEARCE
MODELLING THE IMPACT OF REDUCED VARIABILITY OF MACHINE TOOLDOWNTIME
SUPERVISOR: DR RICK GREENOUGH
SEPTEMBER 2008
This thesis is submitted in partial fulfilment of the requirementsfor the Degree of Master of Research
© Cranfield University 2007. All rights reserved. No part of this publication may bereproduced without the written permission of the copyright holder.

i
ABSTRACT
A model is presented, which allows a machine tool in a service arrangement to be
simulated. The impact of machine tool downtime and the sensitivity of machine performance
to the services provided may be modelled and optimised. SHOAM, developed by the Boeing
Company, is used to make the model and modified to make it applicable for use with a
machine tool. SHOAM is a tool which uses discrete event simulation to analyse the
performance of an aircraft in a realistic operational setting, allowing the benefits of using
health management technologies, which use vehicle condition based information to predict
failures and plan the support services, to be assessed.
Machine tool industry members are interviewed to gather information on typical
operational scenarios involving advanced machine tools and the approaches to the services
provided to maintain them. These reveal the highly user-driven nature of the machine tool
service industry, with users specifying the services they desire, the costs of which are then
added to machine sales for a premium. Machine maintenance is often neglected by users
who value short-term productivity gains over longer-term performance and manufacturers are
therefore unable to guarantee performance based contracts. This neglect and the variability in
machine tool environments are found to impede the development of machine reliability.
The information from the interviews, in concert with a literature review of equipment
service management is used to develop the behavioural requirements. A new model is then
created using elements from SHOAM. Fundamental changes are made to the way SHOAM
models operational scenarios and the response to condition-based information to represent
the current behaviour in the machine tool industry. Typical machine tool services are included,
which allows the costs and benefits of using health management technologies to be compare

ii
to existing machine services. These technologies are found to increase machine tool
operational reliability and make a significant contribution to reducing lifecycle costs.

iii
ACKNOWLEDGEMENTS
I wish to thank Rick Greenough, whose patience and guidance were invaluable during
this project. I would also like to thank Ian Walton for his efforts within the industry and Tonci
Grubic for the discussions and insight.

iv
CONTENTS
ABSTRACT ........................................................................................................................ i
ACKNOWLEDGEMENTS ................................................................................................ iii
CONTENTS ...................................................................................................................... iv
LIST OF FIGURES ........................................................................................................... vi
LIST OF TABLES........................................................................................................... viii
GLOSSARY OF TERMS .................................................................................................. ix
1. INTRODUCTION AND BACKGROUND ....................................................................... 1
1.1 Machine Tool Industry in the UK.......................................................................... 11.2 The Integrated Vehicle Health Management Programme.................................... 21.3 Summary of Thesis Aim and Objectives.............................................................. 41.4 Thesis Structure .................................................................................................. 4
2. INDUSTRIAL CONTEXT............................................................................................... 5
2.1 UK Market for Machine Tools .............................................................................. 52.2 UK Machine Tool Industry & Trends.................................................................... 72.3 Summary ............................................................................................................. 9
3. LITERATURE REVIEW............................................................................................... 10
3.1 “Servitization” in Manufacturing ......................................................................... 103.2 Manufacturing Services Paradox....................................................................... 123.3 Maintenance...................................................................................................... 143.4 Value of Maintenance and Services .................................................................. 15
3.4.1 Lifecycle Costing and Profit ........................................................................ 163.4.2 Value Driven Maintenance ......................................................................... 183.4.3 Balanced Score Card ................................................................................. 21
3.5 Maintenance Methodologies.............................................................................. 223.5.1 Reliability-Centred Maintenance................................................................. 223.5.2 Risk-Based Maintenance............................................................................ 243.5.3 Condition-Based Maintenance ................................................................... 25
3.6 Prognostics and Health Management Technologies ......................................... 263.7 Summary ........................................................................................................... 30
4. RESEARCH METHODOLOGY ................................................................................... 32
4.1 Research Problem............................................................................................. 324.2 Project aims and Objectives .............................................................................. 324.3 Programme of Research ................................................................................... 334.4 Deliverables....................................................................................................... 36
5. INDUSTRY INTERVIEWS AND DATA COLLECTION ............................................... 37
5.1 Interview Method and Topics for Discussion ..................................................... 375.2 Interview Findings.............................................................................................. 38
5.2.1 Machine Reliability Data ............................................................................. 385.2.2 Machine Operational Environment ............................................................. 39

v
5.2.3 Service Contract Type and Maturity Level.................................................. 405.2.4 Service Strategy and Maintenance Management....................................... 415.2.5 Relationship Management.......................................................................... 435.2.6 Use of PHM/CBM....................................................................................... 43
5.3 Specification of Model Requirements ................................................................ 445.3.1 Operational Environments.......................................................................... 455.3.2 Variable Service Scenarios ........................................................................ 455.3.3 PHM System Specifications ....................................................................... 465.3.4 Performance Measures .............................................................................. 46
6. SHOAM FAMILIARISATION AND MODIFICATION................................................... 48
6.1 Modification Method .......................................................................................... 486.2 Job Priority Scheduling...................................................................................... 486.3 Machine Design................................................................................................. 506.4 Operational Environment................................................................................... 516.5 CBM/PHM.......................................................................................................... 516.6 Quality ............................................................................................................... 546.7 Maintenance & Resources ................................................................................ 556.8 Performance Measurement ............................................................................... 57
7. MODEL TESTING AND DISCUSSION ....................................................................... 58
7.1 Testing Method.................................................................................................. 587.2 Testing Results.................................................................................................. 59
7.2.1 Model Inputs and Outputs .......................................................................... 597.2.2 Service Comparison Results ...................................................................... 60
7.3 Model Evaluation and Discussion...................................................................... 66
8. CONCLUSION............................................................................................................. 68
8.1 Summary of Findings......................................................................................... 688.2 Research Limits................................................................................................. 708.3 Further Work...................................................................................................... 70
REFERENCES ................................................................................................................ 72
APPENDIX A: SEMI-STRUCTURED INTERVIEW TOPICS........................................... 77
APPENDIX B: MODEL DESCRIPTION .......................................................................... 81
APPENDIX C: SUBSYSTEM SPECIFICATION............................................................ 108
APPENDIX D: INPUT SHEET DATA ............................................................................ 112
APPENDIX E: SERVICE EVALUATION & SENSITIVITY ANALYSIS.......................... 114

vi
LIST OF FIGURES
Figure 1: UK manufacturing investment in capital equipment (Source: MTA, 2008).................6
Figure 2: Machine tool market by sector (%) (Source: Mintel, 2006) ........................................7
Figure 3: Trends in UK metalworking machine tool production and sales (Source: MTA, 2008)
..................................................................................................................................................8
Figure 4: Generic model of maintenance from a management perspective (Adapted from
Soderholm et al., 2007)...........................................................................................................15
Figure 5: A generic product lifecycle (Source: Emblemsvåg, 2003)........................................18
Figure 6: A value based view of operations and maintenance configuration (Adapted from
Liyanage and Kumar, 2003)....................................................................................................19
Figure 7: Companies fundamental and strategic objectives at the plant level, adapted from
(Rosqvist et al., 2007) .............................................................................................................20
Figure 8: Competencies in value driven maintenance (Source: Haarman, 2005) ...................21
Figure 9: Fault diagnostics using expert systems and neural networks (Source: Star et al.,
2001).......................................................................................................................................28
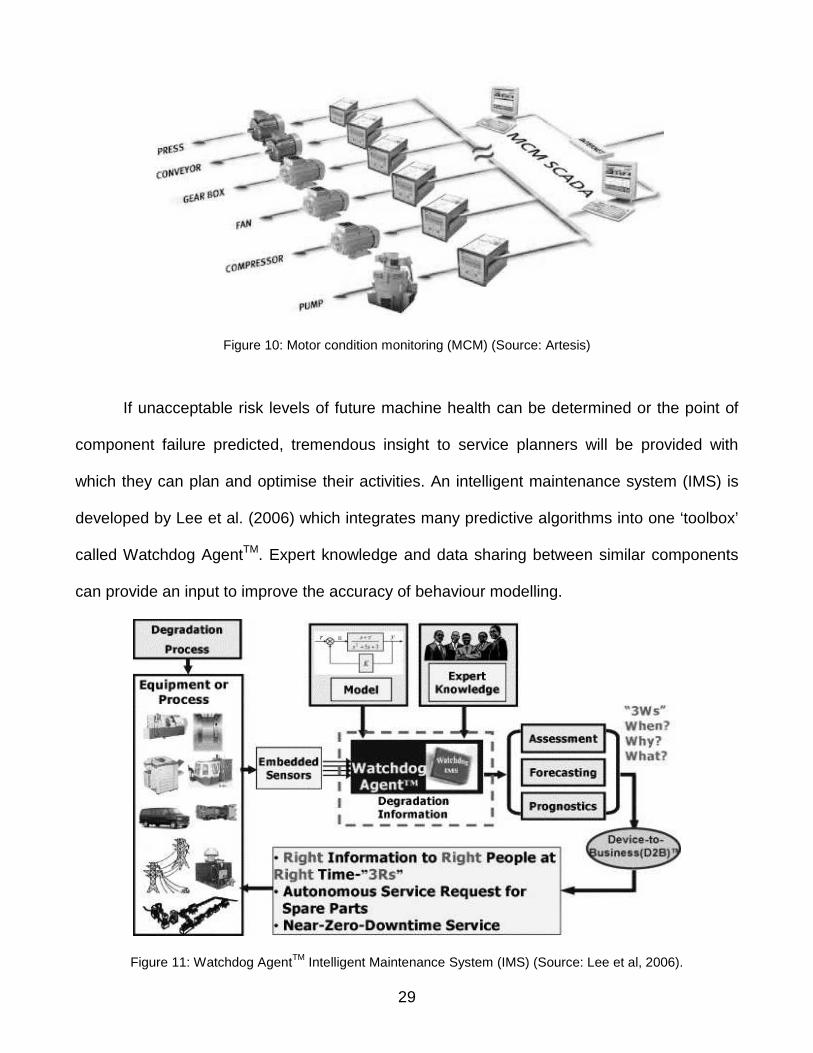
Figure 10: Motor condition monitoring (MCM) (Source: Artesis) .............................................29
Figure 11: Watchdog AgentTM Intelligent Maintenance System (IMS) (Source: Lee et al,
2006).......................................................................................................................................29
Figure 12: Programme of research .........................................................................................34
Figure 13: Priority mode distribution .......................................................................................49
Figure 14: Typical P-F curve (source: Moubray, 1997)...........................................................52
Figure 15: Monitoring accuracy (source: Impact Technologies)..............................................53
Figure 16: The bathtub curve..................................................................................................54
Figure 17: Maintenance flag ...................................................................................................56
Figure 18: New model interface ..............................................................................................60
Figure 19: Cell manufacturing performance under each service contract ...............................61
Figure 20: Cell productivity under each service contract.........................................................62
Figure 21: Waiting times for priority jobs in each service contract ..........................................63
Figure 22: Lifecycle cost .........................................................................................................64
Figure 23: Average downtime and maintenance visits............................................................65
Figure 24: Model overview......................................................................................................81
Figure 25: Manufacturer logic .................................................................................................83

vii
Figure 26: Fault monitoring & prognostics assignment logic...................................................84
Figure 27: Production control logic .........................................................................................86
Figure 28: Manufacturing system logic ...................................................................................88
Figure 29: Operation sub module logic part 1 .........................................................................90
Figure 30: Operation logic part 2 ............................................................................................91
Figure 31: Fault monitoring logic.............................................................................................92
Figure 32: Subsystem compensation sub module ..................................................................94
Figure 33: Quality control sub module ....................................................................................95
Figure 34: Scheduling and prognostics logic ..........................................................................95
Figure 35: Prognostics logic....................................................................................................97
Figure 36: Maintenance ..........................................................................................................98
Figure 37: No. Repairs logic ...................................................................................................99
Figure 38: Parts, planning and repairs logic part 1 ...............................................................101
Figure 39: Parts, planning and repairs logic part 2 ...............................................................103
Figure 40: Parts, planning and repairs logic part 3 ...............................................................105
Figure 41: Scheduled maintenance logic ..............................................................................106
Figure 42: Single machine cell downtime..............................................................................114
Figure 43: Single cell availability and quality.........................................................................115
Figure 44: Single cell productivity .........................................................................................116
Figure 45: Single cell lifecycle cost .......................................................................................117
Figure 46: Impact of extending the P-F interval on breakdowns ...........................................118
Figure 47: Maintenance flag .................................................................................................119
Figure 48: Impact of message ambiguity on availability........................................................120
Figure 49: Impact of message ambiguity on average downtime ...........................................121
Figure 50: Impact of monitoring different subsystems on operational reliability ....................122
Figure 51: Oil filter compensation .........................................................................................123
Figure 52: Production ramp up scenario ...............................................................................124
Figure 53: Impact of spares levels on availability..................................................................125
Figure 54: Impact of spares levels on downtime...................................................................126

viii
LIST OF TABLES
Table 1: Maintenance contract types, adapted from Martin (1997)....................................12
Table 2: Service offerings of machine tool companies.......................................................41
Table 3: Example subsystems ..........................................................................................50
Table 4: Service contract test matrix..................................................................................58
Table 5: Nine machine tool subsystem ............................................................................109
Table 6: Three machine cell test results for each contract...............................................117

ix
GLOSSARY OF TERMS
PHM Prognostics and Health Management
CBM Condition Based Maintenance
RCM Reliability Centred Maintenance
RBM Risk Based Maintenance
PM Preventative Maintenance
IVHM Integrated Vehicle Health Management
SHOAM System Health and Operational Analysis Model
PICAM Probabilistic IVHM Cost-benefit Analysis Model
MTA Manufacturing Technologies Association
LCC/P Life Cycle Cost/Profit
FMECA Failure Mode and Effect Criticality Analysis
ABC Activity Based Costing
CM Condition Monitoring
VDM Value Driven Maintenance
BSC Balanced Score Card
MSG Maintenance Steering Group
LRU Lowest Replaceable Unit
MCM Machine Condition Monitoring
IMS Intelligent Maintenance System
MOE Measure of effectiveness
MTBF Mean time between failure
MTTR Mean time to repair

1
1. INTRODUCTION AND BACKGROUND
This chapter introduces the increasing importance of services to the UK machine tool
industry, which forms the industrial context of the research. The aims of the Integrated
Vehicle Health Management programme (IVHM) are presented as is the System Health and
Operations Analysis Model (SHOAM), the modification of which is the one of the main
objectives of the project. Finally, the aims, objectives and thesis structure are given.
1.1Machine Tool Industry in the UK
Markets for machine tools in the UK have traditionally been turbulent, driven by the
fluctuating investment in the manufacturing sector. The establishment of competition from low
labour cost economies in the industry has increased pressure on the already limited margins
of domestic producers, who themselves face export disadvantages. Manufacturers have
reacted with increased specialisation of machine functions and technological complexity
which allows them to target hi-tech niche markets. Maintenance and services are also
increasing in importance for manufacturers as a way of adding long-term value to individual
sales to provide a more stable income.
When supplying such services to the machine user, persistent difficulties are often
encountered which impede the development of machine tool service markets. There are
many factors causing these difficulties such as improper management values and inefficient
maintenance organisation. Maintenance of machines has traditionally been viewed as a cost
to be minimised or avoided; invested in when the economic climate is good and neglected
when times are bad. Servicing tasks are also managed blindly, with little or no knowledge of
equipment condition, leading to wasted components and unplanned downtime. The impact of
maintenance is always weighed against the immediate costs of the maintenance activities, so

2
increases in future manufacturing efficiency are rarely traced to the maintenance services that
originated them.
1.2The Integrated Vehicle Health Management Programme
For airline companies, the costs of keeping an aircraft on the ground and not in flight
can be considerable, not only because a piece of capital intensive equipment is not creating
value, but also due to the high tariffs charged by airports for holding the aircraft. Companies
therefore try to minimise turn around times at airports and keep aeroplanes in the air as much
as possible. This requires that the activities and services conducted at airports be carefully
planned and executed. Service and operations planners therefore try to ensure that the
required resources are available at an aircraft’s destination ready for when it arrives, so that
servicing time is minimised. Unforeseen problems aboard aircraft which require significant
maintenance present a nightmare scenario for an airline, especially if the necessary
resources are unavailable immediately or at an incorrect destination.
IVHM is a programme initiated by Boeing which aims to use prognostics and health
management (PHM) systems to accurately asses the health of an aircraft in flight (Ofsthun,
2002). This information can be relayed to maintenance and operations planners to manage
maintenance resources and vehicle use more effectively. There are potentially many benefits
to IVHM implementation. Services can be carried out in a more cost effective manner, at a
more appropriate time, reducing maintenance costs and increasing overall vehicle availability.
Ofsthun (2002) notes the potential for improving aircraft operational performance as aircraft
can be matched with greater accuracy to a operational environments and the reduction of
aircraft servicing for reducing the lifecycle costs of an aircraft.
IVHM is not restricted to aircraft applications and will be useful where monitoring the
current system health and planning maintenance services are required. Indeed many

3
automobiles today already have fault diagnostic and prognostic systems installed to inform
the driver of the health status of components in the vehicle. The driver can then plan for the
necessary services to keep the car in a working condition. Capital intensive, precision or
advanced machine tools are an industrial application which may also justify investment in
expensive PHM technologies. The availability and performance of such machines is usually
vital for the efficiency of a production facility, given the large investment and skills needed to
acquire and operate one. Maintenance and servicing will therefore be critical not just to
achieve a high machine utilisation, but also for manufacturing efficiency and organisational
success.
The System Health and Operations Analysis Model (SHOAM) is a tool developed to
support the IVHM program that enables aircraft builders and IVHM planners to design and
simulate different IVHM solutions and assess their effectiveness over the aircraft lifecycle.
Analysts can then determine and optimise a service strategy and the necessary resources.
The model creates fleets of aircraft with specific reliability characteristics and uses discrete
event simulation methods to simulate the aging of each aircraft in a realistic operational
setting. Systems on the aircraft then fail, which require maintenance and servicing. Different
prognostic and diagnostic technologies can then be installed on these systems and the
sensitivity of fleet performance and maintenance resources to these different solutions
simulated over the lifecycle of the aircraft. The most effective techniques can then be
distinguished, reducing the risk of investment in expensive IVHM technologies. The
development of tools similar to SHOAM for use with specialised or complex machine tools
can directly benefit productive efficiency because it might allow manufacturers and service
planners to asses the impact of failures upon the operational performance of the machine
tool.

4
1.3 Summary of Thesis Aim and Objectives
The aim of the project is create a model using Boeing’s SHOAM tool which can
evaluate the operational impact of failures upon the quality of service delivered by an
advanced machine tool. The effectiveness of different maintenance and service techniques
may then be assessed using the model. Objectives to achieve this aim include researching
typical operational scenarios featuring a machine tool performing at a given service level, so
that the modifications to the SHOAM model accurately reflect the industrial context. Boeing
experts will need to be consulted so that a familiarisation with the model can be achieved.
Finally, the SHOAM model itself will be modified to make it applicable for a machine tool as
part of a manufacturing and supply system.
1.4Thesis Structure
The thesis begins with a brief overview of the current trends in the UK machine tool
industry. The increased importance of services and the development of advanced machines
which forms the industrial context of the research are also explored. A literature review
follows immediately, which examines some of the problems experienced by equipment
producers when providing services. New and current approaches to machine maintenance
are explored, as are some of the current PHM technologies available. The research
methodology provides an overview of the research aims, objectives and programme, which is
followed by the interviews of industry members. The interviews gather information on the
operational environment of advanced machine tools and these provide the requirements of
the model. Some of the changes to the SHOAM tool are highlighted and finally, the model is
tested and evaluated.

5
2. INDUSTRIAL CONTEXT
This chapter introduces the machine tool industry in the UK which provides the
industrial context to the research. The structure of the industry is discussed along with the
current markets and trends for machine tools. Current issues within the machine tool industry
are examined, some of which will be dealt with in more detail in the next chapter.
2.1UK Market for Machine Tools
Almost all manufacturing industries use machine tools as part of their production
process in some form and consequently, machine tools vary considerably in type and
application. Markets for machine tools can therefore be segmented by different
characteristics, but the prevailing approach used is based on the processed material. This
research concerns machine tools used for working metals, but they are also essential to
process wood, stone and other materials. The Manufacturing Technologies Association
(MTA) defines a metalworking machine tool as “a power driven machine, not portable by hand
when in operation, which works metal by cutting, forming or physico-chemical machining”.
The position of machine tools as capital goods in the supply chain means that market
demand is driven by investment confidence, finance and capacity utilisation in the UK’s
manufacturing sector (MTA, 2008). The pattern of demand therefore takes on the form of a
business cycle, as the market is subject to investment fluctuations in the economy (Figure 1).
This susceptibility to investor confidence also exposes machine tool markets to political and
economic influences, creating large fluctuations in business between years as well as over a
long term cycle.

6
10
11
12
13
14
15
16
17
18
19
1996 1997 1998 1999 2000 2001 2002 2003 2004 2005 2006 2007
Year
Investm
ent
(£bill
ion)
Figure 1: UK manufacturing investment in capital equipment (Source: MTA, 2008)
The largest consumers of machine tools in the UK are the automotive and aerospace
industries, accounting for roughly 75% of end users (Figure 2). Investment from these two
sectors will have the biggest impact on the demand for metalworking machine tools and they
themselves are exposed to political and economic conditions. The September 11th 2001
terrorist attacks on the United States, for example, caused a 12% fall in aerospace turnover in
2002, despite increases during the 3 preceding years and the 3 years following. Aerospace
sectors both in the UK and America underwent considerable consolidation and employment
reduction during the 1990s with a resulting contraction in demand and consolidation down the
supply chain. Despite this however, Mintel (2006) reports that the supply chain in the
aerospace industry remains highly fragmented, with subcontracting and delegation spread
over many levels of suppliers.

7
Aerospace
General
Engineering
Automotive
Figure 2: Machine tool market by sector (%) (Source: Mintel, 2006)
2.2 UK Machine Tool Industry & Trends
There are many challenges facing the machine tool industry in the UK from both
national and international sources. The UK machine tool industry makes up only 1% of total
world production, competing with Japan, China and Germany who account for over 50%
between them (MTA). These countries however, tend to specialise significantly between types
of machines, with Japan supplying most of the worlds machining centres and lathes and
Germany the leading supplier of physio-chemical machines. Many providers in the UK are
therefore either subsidiaries of larger international producers or simply third party suppliers of
machines produced by them. According to Mintel, high interest rates in the UK compared to
Europe have reduced domestic demand for machine tools and a strong pound sterling has
impeded exports. Domestic producers also face increasing competition from low labour-cost
economies in East Asia and Latin America, yet due to the inherently large size and weight of
machine tools, they retain some advantages in transportation costs.
Despite these challenges the industry has, until recently, managed to reduce the trade
balance and exports exceeded imports from 2003 to 2006 (Figure 3).

8
300
350
400
450
500
550
600
650
2001 2002 2003 2004 2005 2006
Year
Cu
rre
nt
pri
ce
s(£
mill
ion
s)
UK sales
Imports
Exports
Figure 3: Trends in UK metalworking machine tool production and sales (Source: MTA, 2008)
This improvement has been helped by the ability of UK manufacturers to continue operation
with lower margins on machines, but also due to gradual specialisation of machine functions
and types and an increased technological complexity (The Engineer, 2006). This hi-tech
approach is a response to the low labour cost economies entering the industry and allows UK
producers to target high value niche opportunities in machine tool markets and concentrate
on specific sectors. UK manufacturers producing advanced, automated machine tools for
complex and precision applications can exploit the technological advantages the UK enjoys
and add value to their machines through the flexibility and high quality provided.
After sales services are also gaining importance to the industry as a source of added
income and some machine tool manufacturers are trying to move beyond the role of
equipment providers to service providers (Mintel). Services, particularly maintenance,
installation and training can be offered to customers to add more value to individual machine
sales, whilst differentiating the provider from competitors according to criteria not based on
the machine alone. Contracts for these services supply continued revenue for the provider

9
over the life of the machine and improve product experience for the machine user. Markets for
services should also be far more stable than those for the machine tools themselves as these
services are less susceptible to fluctuations in manufacturing investment.
There are clear advantages for domestic manufacturers when providing services
including proximity, language and expertise. The increasing technical sophistication of the
machines themselves complements the emphasis on services due to the complexity of
operation and repair and the desire of the user to get the maximum performance out of the
machine. An emphasis on services then, may offer the UK machine tool industry a
competitive advantage over the international competition and a solution to some of the issues
it currently faces.
2.3 Summary
Machine tool manufacturers in the UK have traditionally had to struggle against severe
market turbulence, caused by the susceptibility of machine tool demand to confidence in
manufacturing investment, which in turn, is highly vulnerable to political and other economic
influences. The establishment of competition form low labour economies has added to these
challenges and caused domestic machine producers to adopt new strategies to compete.
This includes machine specialisation and technological complexity, to exploit niche markets
and the increased emphasis placed on services, which add value to individual machine sales
and provide a more stable income.

10
3. LITERATURE REVIEW
This chapter will examine the current maintenance and service environment for
machine tools and the broader problems of providing them for industrial equipment.
Maintenance is clearly a critical service to any piece of equipment and is one the main
focuses of SHOAM. Maintenance however, is often managed in too simple or too narrow a
way as to be effective in the long term, so the current and emerging approaches to
maintenance and other equipment services management will be explored. The effectiveness
of an IVHM-style application will also depend on the PHM technologies and their integration
into a complex machine tool. Since these technologies are continuously changing and
improving, some of the current diagnostic and prognostic tools available will be explored.
3.1 “Servitization” in Manufacturing
Since the late 1970s a trend in organisational development has seen both
manufacturers and service providers throughout the world placing a greater emphasis on the
services offered which support their main value adding activities. Vandermerwe and Rada
(1988) describe this change as “servitization” of business, with the establishment and
maintenance of customer relationships being the main emphasis. Indeed, the demands of the
customer have been the main drivers of servitization, aided by deregulation, technological
development and increased competition in markets (Vandermerwe and Rada, 1988).
Servitization can impact organisational competitiveness in different ways. By extending their
enterprise along their respective value chains, firms may effectively set up barriers to
competitors and third parties, as well as increase business competitiveness through service
differentiation and extending product or service lifecycles. For manufacturers, Johansson and
Olhager (2003) observe that providing downstream services such as finance, maintenance
11
and spares can make a real improvement to profitability; if the range of services offered is
appropriate for the maturity level of a company’s service business. They term this alignment
‘industrial service profiling’ and develop a framework that allows the correct service profile for
a manufacturer to be identified, with those at the most mature levels attracting new customers
and driving profitability through the services provided.
Markeset and Kumar (2005) examine the support strategies of advanced industrial
product manufacturers, such as those of precision machine tools. The conventional
relationship between the customer and supplier is identified where the customer receives the
machine, whilst services, such as maintenance and spares, are added for an additional
premium. They differentiate this approach to an alternative whereby the manufacturer delivers
a defined performance of the product. In the first case the services provide an income to the
manufacturer as the customer pays for those activities which deliver the performance. This
can be defined as low maturity level on Johansson and Olhager’s framework. In the latter
case, which would be defined as ‘mature’, the services necessary to deliver performance are
built into the overall contract cost. The advantage of this approach is a better integration of
the product with the value proposition to the customer, as the manufacturer must optimise the
processes which the customer is interested in. This clearly requires much greater cooperation
with the customer, as the operational conditions of the product must be known to the
manufacturer if effective performance is to be delivered. In both cases, the lifecycle cost of
the product should be minimised, as this results in lower operational and maintenance costs,
as well as extended product life (Markeset and Kumar, 2005).
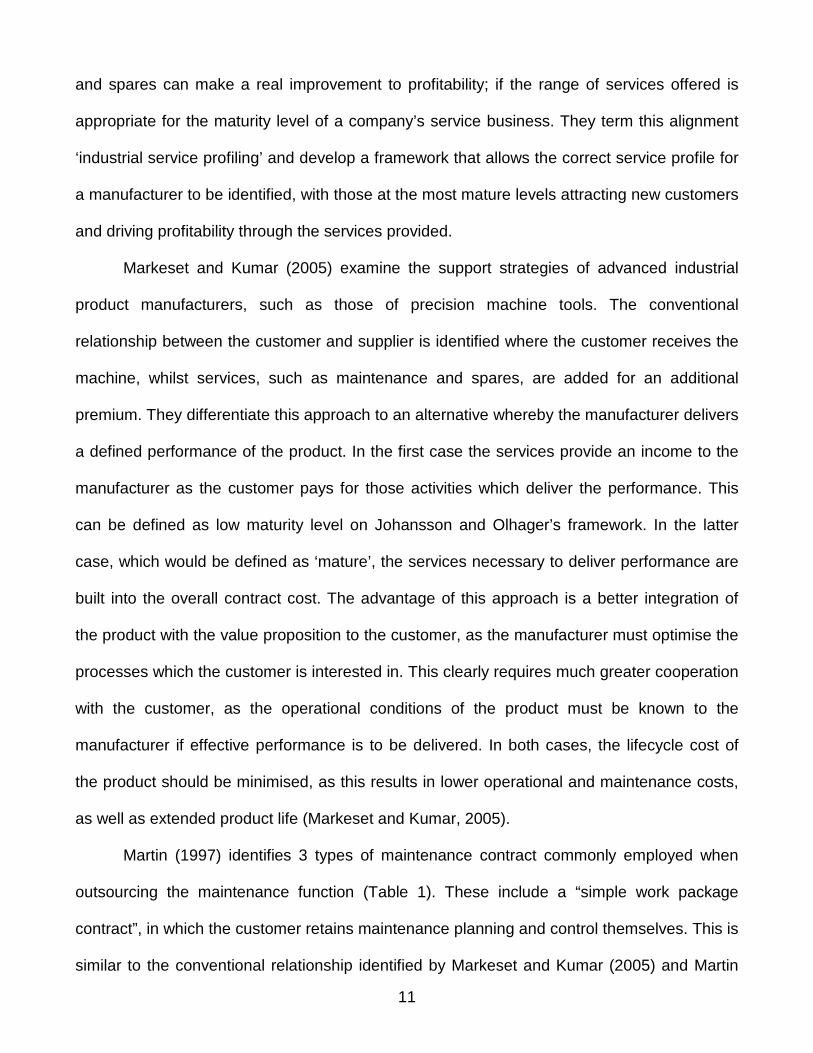
Martin (1997) identifies 3 types of maintenance contract commonly employed when
outsourcing the maintenance function (Table 1). These include a “simple work package
contract”, in which the customer retains maintenance planning and control themselves. This is
similar to the conventional relationship identified by Markeset and Kumar (2005) and Martin

12
notes the short term duration of these types of contracts. A performance contract can also be
defined whereby the customer is guaranteed the performance of a machine based on
availability. This conforms to the performance based relationship defined by Markeset and
Kumar (2005) and this contract type is distinguished by its complexity. A facilitator contract
type is also identified by Martin where the manufacturer retains ownership of the machine or
system and the customer rents it for periods of time. The duration of these contracts is longer
than the other types and the knowledge and experience needed to operate the machine is the
responsibility of the manufacturer. This last type of contract however, might go beyond what
might commonly be defined as a maintenance contract.
Table 1: Maintenance contract types, adapted from Martin (1997)
ContractType
Service offering from manufacturer Complexity DurationKnowledge base of
customer
Workpackage
Simple fixed number of activities, somepreventative maintenance
Low Short term High
PerformanceUptime guarantee, physical measurement
and maintenance of performanceHigh
Mediumterm
Medium
FacilitatorManagement of machine tool lifecycle and
all functionsLow Long term Low
3.2 Manufacturing Services Paradox
Despite the potential benefits of servitizaion, many manufacturers particularly machine
tool and other equipment providers have failed in their attempts to generate higher returns
based on the transition to service provider. Gebauer et al. (2005) describe this as a paradox
because the gap in the financial gains from the services provided between successful and
unsuccessful firms is large, despite equal investments in their respective service businesses.
The causes of the paradox are complex and numerous. Gebauer et al. (2005) identify a lack

13
of managerial motivation as a major contributor, due largely to the intangibility of services and
the perceived risk and uncertainty of investments in their development. The latter also
describes the attitudes of customers, who are reluctant to share knowledge of their
operations; a prerequisite to developing effective services for industrial products.
Organisational factors include an improper identification of customer value and needs. This
relates to the service profile alignment framework developed by Johansson and Olhager
(2003), who note that the range of service offerings will change throughout the lifecycle of the
equipment, as will the development of the customer relationship. Gebauer et al. (2005) also
find that manufacturers who successfully make the transition to service provider have a
clearly defined service strategy, with the product becoming only part of the total service
offering, not the central component.
Through an empirical study of equipment manufacturing companies, Ojasalo (2007)
highlights the conflict over resources that can develop between the traditional manufacturing
operations and the developing service business, which is also compounded by the perceived
lack of value at the management level. For these equipment providers, the maturity level of
the service business is found to be low on Johansson’s and Olhager’s framework and only
those services necessary for the efficient maintenance and operation of the machines will
initially be demanded from customers. These include maintenance, spares and some training.
As well as noting similar problems to Gebauer et al., Brax (2005) emphasises the rate
at which servitization takes place. If the shift takes too long, then conflicts over resources and
other internal contradictions within an organisation will develop causing the process to stall.
Brax (2005) agrees with Gebauer et al. that strategy is one of the most problematic areas for
servitization, but instead highlights the conflict of interest between the management and
operational levels of the customer and the service strategy offered. Management are found to
understand total product lifecycle costs and so appreciate the strategic benefits of the

14
services offered by manufacturers. Operators within the customer’s organisation however,
were found to be maximising machine uptime and decreasing short term costs meaning many
immediate maintenance tasks were skipped, damaging the service performance.
3.3 Maintenance
Effective management of reliability and the maintenance services supporting advanced
industrial products are clearly critical to the operational performance of the machine tool user
and all those with a stake in the equipment performance. Maintenance is therefore not a
strategic option for companies as they are dependent on the performance of the whole supply
chain and as such, process reliability is also a measure of customer satisfaction (Madu,
2004). The alignment of the maintenance and service functions with other processes to meet
changing stakeholder requirements is considered by Söderholm et al. (2007), who adopt both
a managerial and a process view to look at maintenance. The first approach is used to build a
model of maintenance management, where the changing requirements of the stakeholders
are translated into 3 elements of maintenance management: core values, methods and tools.
Core values are viewed for the total system and can include the goals of the organisation’s
long term strategy. Methodologies are those used to achieve the goals, such as reliability
centred maintenance (RCM). Söderholm et al. (2007) suggest tools which can be used in
each methodology and will therefore be largely dictated by the choice of methodology. The
maintenance management hierarchy is shown in Figure 4.

15
Figure 4: Generic model of maintenance from a management perspective (Adapted from Soderholm et al., 2007)
It is clear from the model that as stakeholder requirements change, the methodology
and tools used will also change to reflect these new needs. Failures are therefore defined by
both equipment problems and failure to meet stakeholder requirements; hence the latter can
drive change in the approach to maintenance adopted. As customer needs change over the
entire lifecycle of a product, maintenance and services must also change if they are to
support the product “from cradle to grave” (Madu, 2004). Although not specified by Söderholm
et al., the lifecycle costing, value-driven maintenance and balanced score card approaches
discussed below will likely fall into the core values category.
3.4 Value of Maintenance and Services
Maintenance and services are clearly vital for both equipment and organisational
performance, but are often poorly understood and managed. Some of the current and
emerging approaches to maintenance are therefore reviewed.
ToolsCondition
monitoring, FMEA,etc
MethodologiesRCM, RBM, PM,
CBM, etc
Core valuesValue-driven
maintenance, stake-holder focus, LCC/P
etc
AimsIncrease stake-
holder satisfaction
Support
Requirements

16
3.4.1 Lifecycle Costing and Profit
According to Tsang et al., (1999) the traditional view of maintenance as ‘the process of
fixing broken things’ is too narrow and instead, maintenance should be viewed as physical
asset management, in that the scope of management extends over the whole lifecycle of the
equipment in the production environment. Sherwin (2000) also emphasises the impact of the
maintenance function on the product lifecycle because focusing on short term savings may
have a negative impact on the future performance of a system. Calculating the contribution of
maintenance tasks to lifecycle costs and lifecycle profits (LCC/P) is recommended as this will
take into account the future as well as present costs. This is particularly important for product
support services as improvements in system reliability and hence quality (Madu, 2004) will
often be claimed as a result of improved production and not of effective maintenance.
Sherwin even suggests that production schedules be changed to improve LCC/P, but this
may cause further difficulty if the maintenance function is external to production.
Hayek et al. (2005) calculate the LCC/P for a piece of complex rotating equipment.
Some systems will contain thousands of components making reliability calculations and cost
driver optimisation costly and time-consuming, especially if parts are removed and
maintained. In accordance with reliability centred maintenance (RCM) theory, Hayek et al.
identify the critical parts which drive maintenance activities by performing a Pareto analysis of
the Weibull trends for each module. The whole system is considered as a series of connected
modules and a module is defined at the level where it can be removed and serviced, helping
to reduce the number of parts in the analysis. The Weibull trends are then used to simulate
the aging of parts in operation and to estimate the optimal combination of modules which
maximise equipment availability. The decision to either refurbish modules or replace them
with new ones presents a trade-off for lifecycle costs against availability.

17
Mirghani (2003) explores some of the difficulties of costing a maintenance activity and
finds that supporting activities such as planning, design, work scheduling, etc are not easily
traceable to any particular service activity. These are labelled maintenance overheads and
will present a considerable cost for a service supplier in a support environment. Their
allocation to maintenance tasks can be performed in a number of ways and for Mirghani,
activity-based costing provides the best method. Activity based costing (ABC) calculates an
overhead rate per activity based on the cost drivers for the activity area and the demanded
and budgeted costs during ‘normal’ operating conditions. This allows a more strategic
approach to maintenance as a trade-off can be made between different maintenance costs.
Emblemsvåg (2003) also purports the use of activity based costing in LCC/P
calculations due to its process orientation, which allows both the internal organisational costs
and external costs such as the environment to be factored in. Emblemsvåg highlights the role
LCC/P plays in an effective design process as the only efficient way of handling costs but
asserts that LCC/P must take risk and uncertainty into account to be useful. The different
perspectives which may be taken when viewing a product’s LCC/P are also examined by
Emblemsvåg, himself adopting both a product perspective (Figure 5) and a marketing
perspective. The latter represents the growth, maturity and decline for a product type whereas
a product lifecycle incorporates the production, operation and disposal activities of a single
product.

18
Figure 5: A generic product lifecycle (Source: Emblemsvåg, 2003)
3.4.2 Value Driven Maintenance
The need for a more holistic view of maintenance and operations has led to the
development of the value concept in maintenance and the value-driven maintenance (VDM)
method. One reason, as contended by Liyanage and Kumar (2003), is that in high risk, capital
intensive industries, maintenance management needs to go “beyond its pure financial
implications” in order to suit changing business conditions. Companies must increasingly
recognise the impact from and sensitivity to non economical values such as the environment
and society which alter an organisation’s strategy over different time periods. Absence of
data, uncertainty and the risk inherent in these factors render the traditional approaches to
operations and maintenance management unsuitable.
Liyanage and Kumar (2003) develop a value-based model of operations and
maintenance management (Figure 6) from observations of the petroleum industry. The model
comprises 4 propositions of what constitutes a value-adding activity and a steering model
which defines the importance of each value proposition with the causal relationships shown
between them. They apply the model to an oil and gas production asset, noting issues of
responsibility and authority in its application. The first issue looks at the system in its entirety
where the scope of responsibilities for operations and maintenance must be clearly defined.
Naturalenvironment
Mining Manufacture Distribution
Use
Disposal De-manufacture Producttake-back
Clean fuelEnergyrecovery
RECYCLE/REUSE

19
The second issue recognises that authority must be given to those in operations and
maintenance to carry out necessary actions. In a support service environment, the
responsibilities of the service provider must be defined and authority given to meet these
requirements. The responsibilities of the service consumer may also need to be defined with
respect to the performance of the service to avoid the conflicting interest problems
encountered by Brax (2005).
Figure 6: A value based view of operations and maintenance configuration (Adapted from Liyanage and Kumar,
2003)
Rosqvist et al. (2007) take a less holistic view and distinguish between operations and
maintenance, stating that “maintenance has no intrinsic value”. Instead, they emphasise the
supporting role maintenance plays to the strategic objectives of the organisation. These
organisational objectives become tactical at the plant level, which in turn, are supported by
the maintenance objectives. This hierarchy is shown in Figure 7.
Delivery Performance
Plant & ProcessCondition
Capacity &Capabilities
Strategic resource &competencies
Causal Presumption
Results & quality of deliveries aredependent on the condition of theplant and support processes.
Causal Presumption
Condition of plant or supportprocess is dependent of capacities& capabilities.
Causal Presumption
Available capacity & capabilitiesare dependent on the nature ofresources & competencies weprocess
Delivery-based value
Condition-based value
Ability-basedvalue
Resource-based value
Steering model Value proposition

20
Figure 7: Companies fundamental and strategic objectives at the plant level, adapted from (Rosqvist et al., 2007)
Rosqvist et al. use this hierarchy in a value-driven maintenance planning technique, where
the maintenance objectives are adjusted to support the organisational strategy through
adjustment of the plant level tactics. Operations level performance is considered as leading to
plant level performance, allowing risks at the operational level to be associated with the
strategic objectives of the organisation.
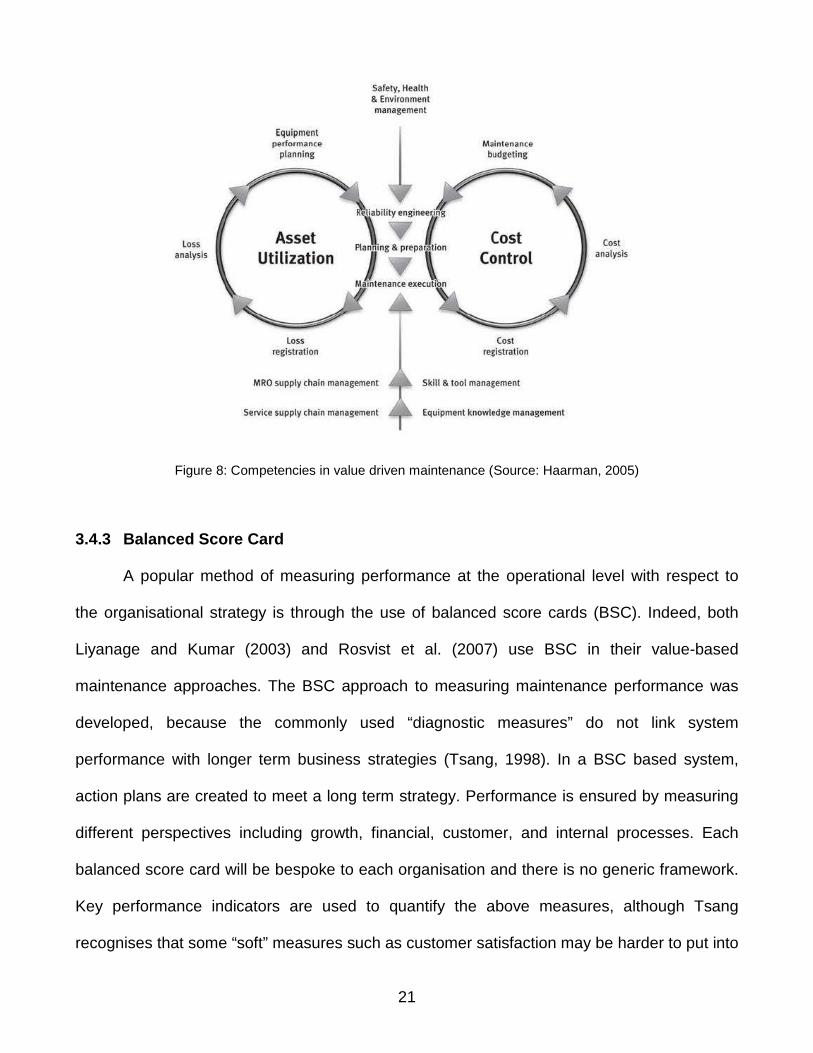
Another approach to value driven maintenance has been developed by Mainnovation
where the term value is adapted from financial literature; defined as the sum of all future free
cash flows (Haarman, 2005). There are four drivers of value; safety and environment, cost
control, resource allocation and asset utilisation, all of which can be influenced by
maintenance. Again, no intrinsic value of maintenance is identified and the supporting role
which maintenance plays in creating value is similar to that used by Rosvist et al. (2007). The
four drivers are used to identify the “value potential”, which will be based on the prevailing
business conditions, such as controlling costs through reduced spares or machine availability.
The maintenance competences or methodologies are then configured to match the value
drivers (Figure 8). Each maintenance method is changed to suit organisational objectives. For
a service support environment, the service supplier will most likely possess some, if not all of
the maintenance competences shown in Figure 8. This approach can therefore be used by
maintenance planners to effectively show that the services they provide help to create value
for the equipment user.
Organisation’sfundamentalobjectives
Plant specificstrategic objectives
Maintenanceobjectives
Goals
Keyperformance
indicators
Maintenanceperformance
indicators
Goals
21
Figure 8: Competencies in value driven maintenance (Source: Haarman, 2005)
3.4.3 Balanced Score Card
A popular method of measuring performance at the operational level with respect to
the organisational strategy is through the use of balanced score cards (BSC). Indeed, both
Liyanage and Kumar (2003) and Rosvist et al. (2007) use BSC in their value-based
maintenance approaches. The BSC approach to measuring maintenance performance was
developed, because the commonly used “diagnostic measures” do not link system
performance with longer term business strategies (Tsang, 1998). In a BSC based system,
action plans are created to meet a long term strategy. Performance is ensured by measuring
different perspectives including growth, financial, customer, and internal processes. Each
balanced score card will be bespoke to each organisation and there is no generic framework.
Key performance indicators are used to quantify the above measures, although Tsang
recognises that some “soft” measures such as customer satisfaction may be harder to put into

22
numbers. Tsang et al. (1999) give examples of some key performance indicators for
maintenance such as “reduce maintenance cost by 30% in 2 years”, which complements the
financial perspective above.
3.5 Maintenance Methodologies
The policies outlined below have been differentiated from the above because they
focus more on the technical management of maintenance performance and therefore are less
holistic in their view of maintenance as a service, although there is clearly overlap between
them.
3.5.1 Reliability-Centred Maintenance
Reliability-centred maintenance (RCM) aims to maintain the reliability of a particular function
by identifying its maintenance requirements in an operating context. Reliability centred
maintenance typically begins by analysing the failure modes, effects and criticality (FMECA)
of a system to determine which of the constituent subsystems or components are to be
reviewed and the importance of each subsystem reliability. RCM evolved from the
maintenance steering group 1 (MSG – 1), which was formed to oversee development the
development of the Boeing 747 aeroplane (Maubray, 1997). The second MSG lead to
improvements in the scheduling of maintenance activities for other aircraft. Despite its age,
RCM remains one of the more common approaches used to manage maintenance and
services.
Wessels (2003) uses reliability-centred maintenance to schedule activities to optimise
maintenance cost verses production losses from failures. This is achieved by identifying the
lowest replaceable unit (LRU), similar to that defined by Hayek et al. (2005), and calculating
the reliability for each. Non-detectable deterioration of the system is then simulated to

23
estimate the operational duration so that components can be replaced before their estimated
breakdown. This eliminates the need for preventative data collection and minimises corrective
maintenance costs. The transition to a “failed” state is therefore assumed to be
instantaneous, but given advances in condition monitoring and uncertainty, Eisinger and
Rakowsky, (2000) argue that forcing a two-state response can be inefficient.
Zhou et al. (2004) integrate condition monitoring to determine the exact hazard rate for
a deteriorating system and schedule maintenance accordingly. The cost of breakdowns and
failures are assumed to be greater than preventative maintenance (PM) due to production
losses, where PM aims to prevent a failure from occurring. This may be too simplistic
however, because the losses from failure could easily be less than the costs of a PM action if
that action is at an inconvenient location or production schedule. Zhou et al. find that as the
system ages more frequent PM tasks are required. Their model is based however, on the
behaviour of a complete system rather than a series of discrete components or modules.
Inclusion of components with different failure rates might affect their observations as these
components can be replaced and repaired discretely.
Saranga and Knezevic (1999) attempt to predict the reliability of a system using
condition-based maintenance (CBM), but include the possibility of failure to detect a fault.
Maintenance is performed when a significant deterioration in performance is detected,
allowing different failure mechanisms to be modelled and appropriate condition monitoring
tools selected. This assumes an instantaneous transition to a failed state again, which may
not exist or represent a trade-off in a support service environment. Their model allows a CBM
policy to be determined to meet a specified reliability level which may be useful for an
equipment manufacturer. Sherwin (2000) is critical of RCM, claiming that its aims are too
narrow. According to Sherwin, the reliability of a system is shaped by the maintenance policy
and is not inherent to any particular system under maintenance. This is especially true when

24
the performance of components in complex systems is manageable with PM and CBM
policies which renders complete “system overhauls” used by RCM to be uneconomical.
3.5.2 Risk-Based Maintenance
Risk-based maintenance (RBM) is similar to RCM, but expanded so that the
consequences of decisions and failures affect the scheduling of services. Khan and Haddara
(2003) define risk as: probability of failure × consequence of failure and the level of risk
determines the maintenance policy which is used. Dey et al. (2004) use a risk-based
methodology for the maintenance strategy of offshore oil and gas pipelines. Failures of small
unreliable lines have a lower impact on the environment than larger ones, failures of which
could be disastrous. Different maintenance tools can then be selected to match the
associated level of risk. Evaluating environmental and social impacts however, will be difficult
to accomplish in a quantitative manner. Dey et al. use the “experiences and opinions of
selected experts”, which may be highly subjective. Khan and Haddara categorise
consequences into four losses: system performance, financial, human health and
environmental loss with an acceptable level of risk identified for each. Similarities to the value-
based methods discussed above become apparent and RBM may become an important tool
in value-based methodologies.
Consequences should be easier to quantify for precision machine tools limited to
production environments because losses will rarely extend to non-economical factors such as
the environment or society. The definition of risk used above however, associates a single
consequence with the failure of a component. Todinov (2006) argues that this will rarely be
the case as “component failures are usually associated with different losses from failures”.
This is similar to the discussion of the “two-state” assumption of RCM by Eisinger and
Rakowsky (2000) and the criticism by Sherwin (2000) of system behaviour aggregation.
25
Todinov (2006) shows that if a system contains two components in series and the failure of
one component precipitates the failure of the system, maximising the reliability of the whole
system does not minimise the losses from failures of the system. Todinov expands the risk
equation beyond the calculation of average losses to provide an evaluation of the potential
losses from cumulative failures. A limit to potential losses can be set and the risk of exceeding
that limit calculated at the component level. Condition-based maintenance policies can be
assigned to components accordingly.
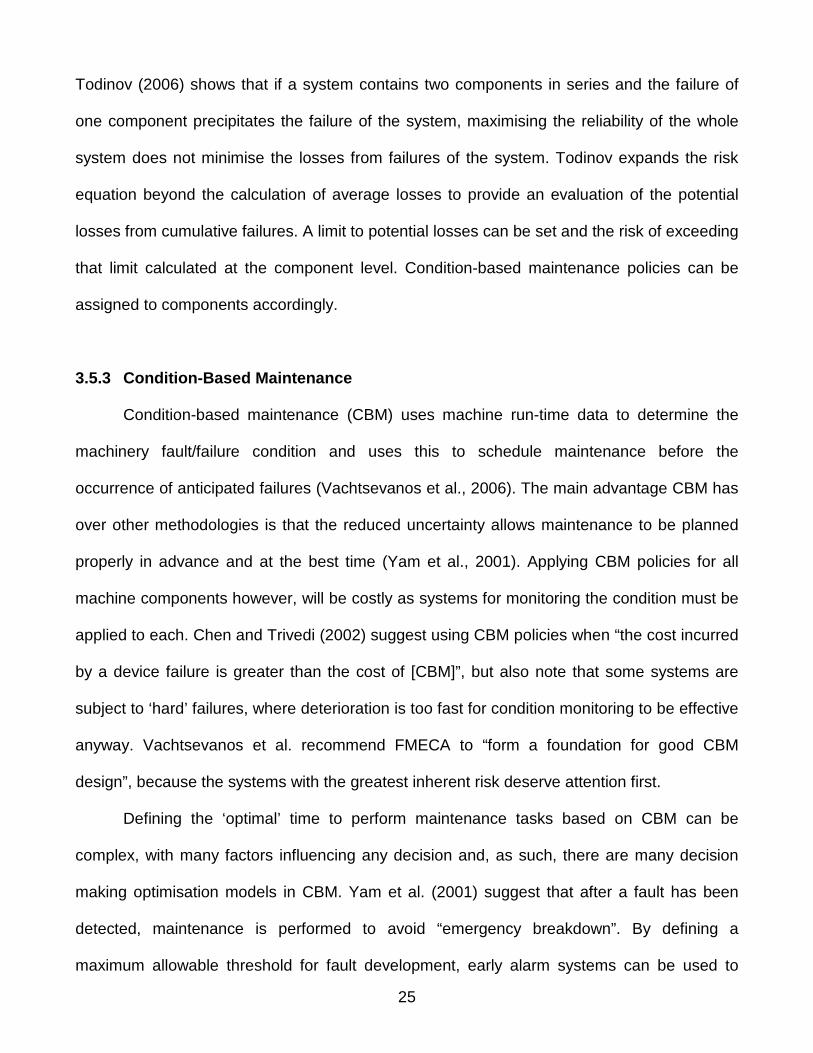
3.5.3 Condition-Based Maintenance
Condition-based maintenance (CBM) uses machine run-time data to determine the
machinery fault/failure condition and uses this to schedule maintenance before the
occurrence of anticipated failures (Vachtsevanos et al., 2006). The main advantage CBM has
over other methodologies is that the reduced uncertainty allows maintenance to be planned
properly in advance and at the best time (Yam et al., 2001). Applying CBM policies for all
machine components however, will be costly as systems for monitoring the condition must be
applied to each. Chen and Trivedi (2002) suggest using CBM policies when “the cost incurred
by a device failure is greater than the cost of [CBM]”, but also note that some systems are
subject to ‘hard’ failures, where deterioration is too fast for condition monitoring to be effective
anyway. Vachtsevanos et al. recommend FMECA to “form a foundation for good CBM
design”, because the systems with the greatest inherent risk deserve attention first.
Defining the ‘optimal’ time to perform maintenance tasks based on CBM can be
complex, with many factors influencing any decision and, as such, there are many decision
making optimisation models in CBM. Yam et al. (2001) suggest that after a fault has been
detected, maintenance is performed to avoid “emergency breakdown”. By defining a
maximum allowable threshold for fault development, early alarm systems can be used to

26
forecast or schedule maintenance activities. Stopping equipment to conduct maintenance, if
performed at the wrong time may result in significant losses. Koomsap et al. (2005)
recommend that both maintenance and operational factors should be considered when
aiming to minimise losses because servicing itself results in downtime. They develop an
integrated control system that minimises average waiting times for machines where
maintenance resources act as a constraint. Baek (2006) uses decision tree learning and
historical data obtained using condition-based policies to schedule tasks to minimise the total
maintenance cost over the lifetime of a machine.
Grall et al. (2002) provide a maintenance scheduling model which optimises both the
costs of maintenance actions and the losses due to failures and breakdowns. Losses from
failures are variable, so Grall et al. set a different maintenance policy and inspection interval
depending on the condition of the system at inspection. This allows a less severe
maintenance and inspection policy to be scheduled if the losses caused by these actions rise
above some preset value. The more expensive maintenance and inspection tasks can then
be carried out during periods of low demand. CBM can also be integrated into many other
maintenance methodologies to give greater certainty in decision making. Jardine et al. (1998)
use CBM to find the optimal replacement policy for equipment which minimises the risk of
failure. Wang and Zhang (2008) use CBM policies to determine the remaining life of
equipment, which has application for costing methodologies.
3.6 Prognostics and Health Management Technologies
Prognostics and health management (PHM) involves predicting the future behaviour of
a system from the current operating state and scheduling the required maintenance activities
(Vachtsevanos et al., 2006). CBM policies typically provide the condition of the machine,
through monitoring the components in operation, using sensors to detect abnormal

27
conditions. On detection of an abnormal condition, the presence of a fault must be isolated to
the particular machine component and then the mode of failure classified (Vachtsevanos et
al., 2006). This is typically termed fault diagnostics and the technologies and approaches
used in the process depend on the machine components being monitored and the physical
mode of degradation.
Hu et al. (2000) use fault trees to structure diagnostic knowledge for use in an
integrated monitoring, diagnostic and decision system. Operators or experts use the fault
trees to locate causes, which are then compared to the monitoring data and machine or
process rules. Another popular method of fault diagnosis in machine tools is to monitor the
vibration of machine components and measure any deviation from the ‘healthy’ condition.
Identifying the failure signatures in vibration data is complicated by the multiple elements in a
system which could be responsible for faulty behaviour and the periodicity over which these
faulty elements act on the machine. Rehorn et al. (2006) use selective regional correlation as
it focuses only on the specific part of the signal which is of interest, allowing the particular
source of a fault to be identified.
Neural networks and expert systems have also been developed to locate machine
faults. Expert systems use reasoning methods similar to human experts, but the acquisition of
that knowledge is difficult. Neural networks can be used for simple machine processes, but
struggle when applied to complex machine tools characterised by simultaneous processes
and the possibility of new fault development (Starr et al., 2001). Starr et al. use a combination
of both to overcome their respective disadvantages. Condition data are fed into a ‘meta
system’ which acts as an interface between the neural network and the expert system (Figure
9).

28
Figure 9: Fault diagnostics using expert systems and neural networks (Source: Star et al., 2001)
The neural network is used to diagnose faults first and the expert system is used when a new
fault is encountered. The meta-system also trains the neural network to recognise this new
type of fault.
Condition monitoring has been successfully developed by Artesis for use with machine
tools. Their motor condition monitoring (MCM) products can be applied to any electrically
driven motor allowing the health of the machine component to be measured. The 3 phases of
the operating motor’s power supply are compared to a reference value of the normal condition
which has been learned automatically by the device. The development of a fault causes the
power supply to diverge from the normal condition which can be monitored and managed
using computer software. This data can also be sent to remote locations via the internet,
making remote monitoring and plant level performance monitoring much more effective.
Machine Tool
Condition data Machine interface
Meta-system
Expert systemNeural network Knowledge base
User
Explanation mechanism
29
Figure 10: Motor condition monitoring (MCM) (Source: Artesis)
If unacceptable risk levels of future machine health can be determined or the point of
component failure predicted, tremendous insight to service planners will be provided with
which they can plan and optimise their activities. An intelligent maintenance system (IMS) is
developed by Lee et al. (2006) which integrates many predictive algorithms into one ‘toolbox’
called Watchdog AgentTM. Expert knowledge and data sharing between similar components
can provide an input to improve the accuracy of behaviour modelling.
Figure 11: Watchdog AgentTM
Intelligent Maintenance System (IMS) (Source: Lee et al, 2006).

30
The system can also memorise machine behaviour and therefore learn to diagnose faults
from particular pattern signatures. Lee et al. simulate the effectiveness of the system when
used to schedule maintenance, including both production losses and maintenance costs in
the model. A significant improvement is shown using the prognostic system over other
maintenance scheduling methods including a simplified CBM approach.
Health monitoring itself produces large quantities of data that must be stored
and compared to that of the machine performing under normal conditions. Martin (1993)
comments that failure data itself is of interest to the manufacturer, as it allows feedback for
improvements in design and greater accuracy in fault diagnosis. This feedback could be used
to improve the relationship between manufacturer and customer, but issues of intellectual
property, data acquisition and data storage must be addressed first.
3.7 Summary
Manufacturers are attempting to make the transition to service provider with the hope
of increasing the competitiveness of their existing offerings through service differentiation and
the establishment of long term customer relationships. A paradox is often encountered
however, where the returns on investments to improve services by some manufacturers are
poor compared to others who have made similar moves. There are many possible causes for
this including a lack of perceived value, conflict over resources between maintenance and
operations and ineffective service strategy.
Maintenance is a critical service to the performance of both the machine user and the
entire supply chain. Recent approaches to operations and maintenance are taking a more
holistic view of the two. Many commentators emphasise the lifecycle performance of the
equipment in operation because maintenance has traditionally been undervalued as

31
organisations opt for short term gains through maintenance cutbacks. The future performance
of the machine is reduced, which can be predicted using lifecycle modelling. Value driven
maintenance aims to demonstrate the value which maintenance provides to the organisation.
This is achieved by matching maintenance and service strategies to the prevailing
organisational strategy and business conditions.
CBM has many advantages over other maintenance approaches as decisions are
made according to the physical condition of the machine, which reduces uncertainty and
therefore lowers risk. CBM is more expensive than the simpler risk and reliability based
approaches however, and the decisions concerning maintenance actions are more complex.
CBM relies on the detection of faults and the monitoring of their development and therefore
sensing and fault diagnostic strategies are required. These can be extended using PHM
techniques, which forecast the future behaviour of the machine and use this information to
optimise maintenance activities.

32
4. RESEARCH METHODOLOGY
The research problem is defined in this chapter and the aims, scope and objectives of
the project are given. The scope is outlined which leads to a programme for research.
4.1 Research Problem
The difficulty of planning and executing maintenance effectively for machine tools
stifles productivity and causes manufacturing inefficiency. Machine tool and service providers
struggle to manage machine performance, which limits development in equipment services
and maintenance is consequently undervalued. The IVHM programme and SHOAM tool
developed by Boeing for use with aircraft are therefore highly desirable concepts for both
industrial equipment providers and users alike. Capital intensive advanced machine tools may
justify investment in technologies which provide a similar insight into machine health as IVHM
provides for aircraft.
4.2Project aims and Objectives
The aim of the research is to modify Boeing’s SHOAM tool for use with an advanced
machine tool so that the operational impact of failures on the quality of service from the
machine can be evaluated.
The required objectives of the project are stated below:
1. Research typical operational scenarios featuring a machine that is required to perform
according to a specified service level
2. Become familiar with Boeing’s SHOAM tool through application and discussion with
Boeing and SHOAM experts

33
3. Modify SHOAM to make it applicable to a machine tool as part of a manufacturing and
supply system
The scope of the research extends to using the modified SHOAM model to show the impact
of different maintenance techniques and condition-based technologies on the performance of
the machine. The current approaches to maintenance of advanced machine tools and their
operational environment must be investigated so that the adapted model has useful
applicable.
4.3 Programme of Research
The stages of the research programme are broken down into work items and the
objectives are met with the completion of particular work items. Figure 12 displays the
research programme in block diagram form. Descriptions of each stage follow.

34
Figure 12: Programme of research
Stage 1: Data Collection and Model Requirements
The literature review reveals the current difficulties experienced by machine tool
manufacturers attempting to make the transition to service provider. Different approaches to
maintenance management, a key component of any machine tool service, are addressed
Objectives completed
Work item 1.1: Interviews &data collection
Literature review
Work item 1.2: Define modelrequirements
Stage 1
Work item 2.1: Familiarisationwith Arena
Work item 2.2: Familiarisationwith SHOAM
Work item 2.3: Modify SHOAM
Stage 2
Arena guides &literature
Boeing & SHOAMexperts
Work item 3.1: Testing &validation
Work item 3.2: Check &improve model
Work item 3.3: Evaluate model
Machine tooloperational data
Stage 3
Resources1
2
3

35
using the literature and the currently available PHM technologies applicable for an advanced
machine tool are also reviewed. To further focus the research for advanced machine tools,
UK producers of specialised machines are interviewed to see how they currently maintain
service levels and to investigate the operational environments in which these machines
perform (work item 1.1). The topics raised in the literature review are used to provide a
framework for discussion, but the interview technique will remain informal to allow for
variability between responses. A preliminary analysis of SHOAM will also be used to identify
some of the data which will be required. Work item 1.1 and the literature review complete the
first objective.
Work item 1.2 will use the results of the interviews and the literature review to define
the requirements of the modified SHOAM tool. In this way, the operational environment of an
advanced machine tool will be modelled more accurately and the value for manufacturers is
ensured. In addition to the model requirements, operational data will be sought from
advanced machine tool producers to provide the inputs to the modelling environment. There
are many formats in which this data may be available; historical data such as failure rates and
modes or component reliability data. Some partners of the University who produce machine
tools for aerospace have expressed an interest in the project and will be approached for this
data.
Stage 2: SHOAM Familiarisation and Modification
SHOAM is modelled in the Arena discrete event simulation environment. Work item 2.1 is a
familiarisation with the Arena software package from Rockwell Automation, which is
undertaken using the many tutorials and help files available with the software and other
literature. When acquainted with the Arena modelling environment, a familiarisation with
SHOAM follows using the literature available with the model and through application (work

36
item 2.2). Throughout this stage, Boeing and SHOAM experts provide guidance and
consultation with the familiarisation effort where required, in order to quickly overcome
obstacles to learning.
Modification of the SHOAM model may begin during work item 2.2, because the level
of intimacy with SHOAM may be sufficient to begin modification before proficiency with the
complete model is achieved. This is possible because of the expertise provided by Boeing
which is available throughout this stage. Modification makes up work item 2.3 and follows, as
much as possible, the requirements specified in Stage 1.
Stage 3: Testing and Evaluation
On completion of work item 2.3, work item 3.1 tests and validates the model. First, the model
will be validated by comparing the performance with the operational data obtained in stage 1.
A sensitivity analysis then will be performed to test the features of the model and then the
benefits of using CBM/PHM solutions tested for an advanced machine tool.
Deficiencies within the model, identified during testing, are used to improve the model
performance (work item 3.2). Work item 3.2 completes the final objective. Finally the model is
evaluated with the requirements and the value it delivers (work item 3.3).
4.4 Deliverables
The principle deliverable of the project is the modified SHOAM tool which may be used
to analyse the benefits of CBM/PHM technologies and their impact on operational
performance. The research and interviews in the earlier stages of the project will provide
insight into the current state of machine tool servitization and the adoption of CBM/PHM.

37
5. INDUSTRY INTERVIEWS AND DATA COLLECTION
This chapter presents the results of the interviews with advanced machine tool users
and manufacturers and the requirements of the model modifications are specified. The
purpose of interviewing industry members is to identify how after sales services are currently
being managed and to gather data on the operational environments of advanced machine
tools. Issues found in the literature review can also be raised and will act as a guide for
inquiry into maintenance management. This information is then used to specify the
requirements which the modified SHOAM model must meet for it to be applicable for
advanced machine tools. Empirical data will provide a comparison with the model for
validation and to model a realistic environment.
5.1Interview Method and Topics for Discussion
A preliminary examination of SHOAM and the literature review are used as a guide for
the data collection and interviews. Reliability data and periods of maintainability are required
for 9 subsystems in a machine tool. This data may be inferred from failure modes or rates.
The intensity of the processing environment may be harsh for an advanced machine tool, so
operational periods such as uptimes or shift lengths of machine use are required as is the
impact of breakdowns. Information regarding the operation and management of both the
machine and the manufacturing system will also be sought. This approach to data collection
should ensure that the modified model reflects the current service and operational
approaches for machine tools and will therefore be useful to equipment manufacturers and
suppliers of product support.
As the variability in machine tool usage and the approaches to maintenance were
anticipated to be high, a semi-structured interview approach was chosen, as it allows for

38
divergence between responses. Semi-structured interviews have a framework for discussion,
but questions are flexible and less formal than structured interviews. Descriptions of the main
discussion topics are given in the appendix A. Advanced machine tool manufactures and
service providers were identified in consultation with the Manufacturing Technologies
Association (MTA). They are those which are most likely to supply specialised machine tools
in which PHM technologies may be applied and include NCMT, Mazak, Electroimpact,
Holroyd and Heller. Most of these companies supply machines for the aerospace industry,
who are one of the largest consumers of complex and precision machine tools due to the
demanding production requirements for aircraft.
5.2Interview Findings
Some observations and results from the interviews and data collection are summarised
under the respective topic headings used during interviewing.
5.2.1 Machine Reliability Data
To test and validate the model, reliability data from a machine tool was sought from
those industry members interviewed. However due to many reasons, empirical data could not
be obtained. A machine tool company who was a collaboratot to the research declined to
cooperate towards the end of the project which caused further difficulties. Other machine tool
companies who were interviewed such as Electroimpact, NCMT and Mazak could not release
any data due to the sensitivity of reliability information to their customers operations. Other
companies such as Holroyd and Cinetic Landis showed a lack of interest in developing
services due to the highly user driven nature of the industry. Users specify the level of service
they want and the machine providers will often meet their demands in order to win contracts.
Some manufacturers were found not to collect empirical data on the reliability performance of

39
their machines. This is due to the modular construction of many machines in which
components from multiple sources are used, which makes reliability engineering difficult.
Commodity machine producers were also approached for reliability data; however
these machines are often treated poorly by their users. Maintenance is often entirely
neglected and machines simply run to breakdown. Sometimes this is done purposefully to
provide a reason for late work to their customers. Also, the high variability between
manufacturing environments in which these machines are operated renders any meaningful
reliability data uninformative, as failure modes and rates vary considerably for any single
component. This is similar to state of the aerospace industry before reliability engineering of
aircraft components took place. The lower risks of machine tool downtime compared to
aircraft however, and their modular constructions make further reliability studies seem
expensive and time consuming to manufacturers.
5.2.2 Machine Operational Environment
Machine availability is often defined on a shift basis with typical shift length of 8 hours
and manufacturers guarantee uptimes over the number of shifts required. Some advanced
machine tools have an expected availability of 24 hours a day, 7 days a week, which is
understandable given the high costs and overheads incurred using them. The uptimes
guaranteed by manufacturers were found to range between 95 to 98%. Actual machine use
rarely achieves a corresponding level however, as the production system management of
machine users often cause idle periods for machines. PM also needs to be factored into
availability and some manufacturers deduct planned maintenance time from the quoted
machine performance.
There is a high variability between production environments which affects the machine
performance depending on how the customer uses the machine and what metal is being

40
processed. These factors cause uncertainty for service planners as both affect the reliability
of machine components. Certain operations do not use all machine functions, as Mazak found
when they experimented with CBM technologies. Some orientation features were not being
utilised, which meant that these subsystems appeared to be very reliable, before CBM was
employed.
Electroimpact machines used for wing assembly are often left without work due to an
insufficient supply of parts and management conflict within the wing production facility. Work
is scheduled to machines according to the priority of the job. The different stages of
fabrication are managed as individual ‘business centres’, but share 10 machines causing
conflict over machine availability. Holroyd machines are designed to run unmanned and so
facilities with parts machine feeders aim to maintain a constant level of production. Heller
machines often go through periods of production dropdown where once or twice a year
industry reduces machine work load which precipitates a fall in utilisation. Service providers
often take advantage of this period to schedule maintenance
5.2.3 Service Contract Type and Maturity Level
Due to the user driven nature of the industry, a large amount of flexibility in service
offerings is demanded by machine users and so most manufacturers provide a range of
services and customisable options allowing the customer to specify the level of service they
require or can afford. Table 5.1 presents some of the typical service offerings from advanced
machine tool providers and their positions according to the frameworks from Martin (1997)
and Johansson and Olhager (2003). The contract used by Electroimpact for wing assembly is
one of the more complex contracts found involving CBM, however the service duration is very
short at only one year and machine performance is not the focus of the agreement.

41
Table 2: Service offerings of machine tool companies
Company Service offeringContractduration
Contract type(Martin, 1997)
Service maturitylevel (Johansson and
Olhager, 2003)
ElectroimpactFixed maintenance budget,
scheduled maintenance, CBM1 year Performance Med
NCMTMonthly tasks & payment
determined using historicalcost data
2 years Work package Low-med
Holroyd
Installation and ramp up,training and technical adviceoffered based on condition
data
1-2 years Work package Low-Med
MazakGuaranteed uptime, some
CBM used, onsite engineersoffered on request
1 year Performance Med
Heller
No parts included, wholelifecycle can be included,scheduled preventative
maintenance
Up to 6years
Work package Low - Med
5.2.4 Service Strategy and Maintenance Management
Most manufacturers were found to be using a preventative maintenance (PM) schedule
which was determined using historical experience of the machine components. For wing
assembly, Electroimpact use a PM schedule which places each machine into a rota, where
monthly inspections and minor work accompany a more intensive service, scheduled for
every three months. Parts found in poor condition are replaced immediately to maintain
machine function and a large amount of downtime is spent finding the causes of parts
producing poor quality output. Spares are owned by the customer and stored onsite leaving
Electroimpact to purchase spares as and when required. Costs are controlled using a fixed
budget for maintenance and out of this comes a substantial amount of manpower and
expertise, with up to 14 engineers onsite. Most companies offer to place an engineer onsite if
the customer has purchased sufficient machines or requests one. Downtime and lost

42
production are not covered in the Electroimpact service contract and incurred by the
customer.
NCMT also have a contract offering scheduled PM similar to that used by
Electroimpact. Inspections and replacement of machine consumables are carried out for
components with a known reliability of 2000hrs and more rigorous service is scheduled again
for components with reliabilities of 4-5000hrs. After inspections, a maintenance schedule and
report is produced showing trends of components against future machine performance. The
customer is contacted to decide whether and when the service to replace the components
takes place. Most service providers estimate the average time to perform scheduled
maintenance to be 3 to 5 days. NCMT also offer a care package in which historical data of
maintenance cost is used to determine a monthly payment scheme. Machine consumables
are ordered in according to a schedule although some buffer stock is held for rescheduling
and NCMT hold a substantial amount of breakdown components due to the fast response
demanded by some customers.
Holroyd offer a maintenance schedule which accommodates the customer’s shift
pattern, but Holroyd do not guarantee that the machine will be ready on time to start work
again. Advice on the component condition and remaining life is offered by Holroyd in a similar
manner to NCMT. Engineers note the component condition during inspections and advise the
customer on component life and machine performance. Mazak determine schedules through
consultation with the customer. They have a widely distributed network of manufacturing
plants and so use production stocks as replacements. Regional sales centres are also used
to hold stocks of components as is a central warehouse in Belgium guaranteeing 24 hr
breakdown response for parts. This performance however, depends on the reliability of
couriers.

43
5.2.5 Relationship Management
The departmental management structure of Electroimpact’s customers causes
competition between the departments which share equipment. Maintenance costs are
therefore often the first to be targeted for reduction by the customer’s management which
increases machine deterioration causing poor performance in the long term. This is a problem
for Electroimpact who have to manage the performance of machines over the duration of the
period. The maintenance schedule which they provide in the contract is often ignored by their
customer’s management, as completing wings is seen to be more important than maintaining
a machine. As a result, machines scheduled for maintenance are often placed back onto the
production line which reduces long term efficiency.
Confrontation with the customer is reduced by Electroimpact as their contract does not
require them to compensate the customer for lost production time. NCMT however, do
provide compensation for downtime, with an agreed value for losses to production. Their
customers are required to perform daily checks on the machines and operate them according
to machine specification, but when operators neglect these requirements, machine
performance can deteriorate. Machine mistreatment and operator error are not compensated
for by NCMT and are often cause of confrontation with their customers. Issues of a similar
nature are experienced by many machine manufacturers and service providers. Condition
monitoring and data issues were not found to be causing confrontation with machine users,
but this is mainly due to the lack of monitoring and learning techniques used in industry.
5.2.6 Use of PHM/CBM
Most advanced machine tools have some form of built in fault diagnosis; however this
is usually in the form of a machine code which informs the maintenance engineer of possible
causes to an error which has already occurred. As already seen, maintenance engineers also

44
use a form of condition monitoring and prognostics for components using the data obtained
from inspections. Customers are then advised on the future performance of the machine
which is used to optimise the maintenance schedule. For example some NCMT machines use
condition monitoring on spindle bearings which is downloaded from the machine by the
engineer.
The adoption of health monitoring and prognostic techniques, similar to those used for
aircraft maintenance however, remains low overall. Some suppliers of machine oil will provide
an analysis of oil samples taken from a used machine and determine possible problems.
Bearing fragments found in the fluid for example, may indicate faulty bearing wear. Mazak
use monitoring systems on a few of their advanced machines to record component run time
data and schedule maintenance according. This provides a greater insight into the operational
use of components in a machine. Advanced machine tools are used in different ways by
different users, so components in similar machines undergo different levels of deterioration
depending on the manner in which the machine is used. Monitoring usage tells Mazak how
the machine is being operated and for how long, around which, maintenance is scheduled.
This data is downloaded from a machine interface or streamed over the internet for remote
monitoring. Mazak are also looking at using fault diagnosis and prognostics for key
components such as spindles.
5.3 Specification of Model Requirements
The results from the interviews are used to produce the required model modifications
to make SHOAM applicable for advanced machine tools.

45
5.3.1 Operational Environments
The modifications to SHOAM should allow maintenance planners and manufacturers to model
the variability in operational environments which their machines will experience
A priority based work schedule based on that used by Electroimpact will be used because
it provides a realistic way of deciding between machine performance and job importance.
This trade-off is made frequently by machine users given the perceived lower risk of future
machine downtime compared to immediate productivity gains.
Operations are based on a shift system with a minimum length of 8 hrs each. Numbers of
shifts and shift length can then be varied to control utilisation.
The ability to model operations in which certain machine components may not be used
and variability between operational intensities will be included.
The model must also be able to simulate the sensitivity of machine performance over
longer term variations so that the machine lifecycle performance can be captured. This
can include production ramp up periods and long term variations in manufacturing
intensity.
Advanced machine tools were found to by run in cells of many similar machines as well as
individual machines. The sensitivity of multiple-machine cells to maintenance and
operational variations may be different to that of a single machine which the model will
analyse.
5.3.2 Variable Service Scenarios
As already seen, there are many different strategies for machine services and maintenance
which the service designer will wish to model

46
A planned maintenance approach with a variable schedule for activities. Examples from
NCMT include an inspection and minor maintenance every 2000hrs and a longer service
every 4000hrs.
The model must allow the different approaches to managing spares to be compared and
contrasted. These include a prognostic based spares ordering system and an onsite
spares store. The response time to spares orders will vary with 24 hours used as an
average.
The ability to model the impact of having engineers onsite against offsite must be included
The ability to use PHM techniques to schedule services in a timelier manner must also be
available in the model to show any benefits of using these systems.
5.3.3 PHM System Specifications
One of the purposes of SHOAM is to simulate the benefits of machine performance to
different PHM technologies. Given the apparent limited use of these systems in the machine
tool industry, the model may be useful for demonstrating what, if any benefits using PHM
technologies provide to manufacturers and service planners. The model can also provide
feedback regarding which machine components need these systems the most.
5.3.4 Performance Measures
SHOAM uses Measures of Effectiveness (MOE) to indicate the performance of ‘benefactors’,
such as equipment manufactures and maintenance providers. It is clear that some
performance measures will depend on the service contract being offered. The measures of
interest to machine users include:
Availability (also productivity)

47
Quality of output
Waiting times for jobs
Machine utilisation (depending on the service contract)
Lifecycle costs and the service performance are critical for those manufacturers wishing to
expand their services. For maintenance, the key measures include largely the lifecycle costs,
which must be measured over periods up to 5 years. Included in this will be:
Resource usage such as labour hours and spares
Downtime (time in maintenance)
Costs of CBM/PHM technologies

48
6. SHOAM FAMILIARISATION AND MODIFICATION
This chapter describes the main modifications to the SHOAM concept tool which were
necessary to make it applicable for an advanced machine tool. Many intricate modifications
are not described below, as these are largely concerned with the operation of the model itself
and are of little relevance to the research findings.
6.1Modification Method
SHOAM is a large model built using the Arena software package to simulate the aging
of aircraft in a service environment and therefore contains many elements which have no
application for a machine tool. In order to modify the model effectively within the time period,
Boeing and SHOAM experts were consulted to provide insight where complexity or a lack of
information impeded understanding. Modifying SHOAM directly proved difficult given the
complexity of the model and the inter-dependence between different model areas. A new
model is constructed using elements from SHOAM, but with modification so that the new
system meets the requirements set out in the previous chapter. This approach to building the
model is faster than direct modification, as a preliminary filtering of the unnecessary SHOAM
elements is not needed. Only those elements which add value for advanced machine tool
manufacturers are included with modifications. Most of these are described below and for a
detailed description of the model, see appendix B.
6.2 Job Priority Scheduling
It was discovered in the previous chapter that machine tool maintainers regularly have
to contend with a machine user’s operations for access to the machine. This is due to the
short term necessity of finishing some jobs which are given a higher priority than the

49
immediate maintenance of the machine. To capture this, a system is created that assigns
every new production order with a priority ranging between one to three. Priorities affect the
behaviour of the model in different ways and the effect on each area is explained under the
corresponding heading below.
The immediate effect on job scheduling is that machines will wait in a ‘pool’ or queue
until an order arrives. Priority one orders are the most important and these are assigned to
waiting machines first. Priority three is the lowest priority and these jobs are scheduled last.
The distribution of job priorities can also be used to reflect different manufacturing scenarios.
A cellular design, for example could assign priorities using a triangular distribution with an
adjustable mode allowing the variability in assigned priorities to be adjusted (Figure 13).
Figure 13: Priority mode distribution
A lower mode will result in a higher proportion of priority one jobs which effectively increases
the intensity of the manufacturing environment. Alternatively, if a uniform distribution is used,
the model behaviour will roughly reflect a production line, as apposed to a manufacturing cell,
with job priority representing the job ‘progression’ along the line.
Prioritymode
Highpriority
Lowpriority

50
6.3 Machine Design
Aircraft in SHOAM are modelled as having 9 different subsystems, each characterised
by a set of reliability data and maintenance times. Each system is then aged and fails
according to the distribution assigned. This setup is also used to characterise a machine tool
in the modified model. As discussed in the previous chapter, meaningful reliability data could
not be obtained so instead 9 subsystems which are typical of machine tools are designed.
The mean time between failures (MTBF) of each subsystem is inferred from the best data
obtained during interviews and the characteristic distribution from discussion with machine
researchers in the university. Details of these subsystems are available in appendix C as is
more information on the modified model to capture the behaviour of a machine tool. Examples
are given in Table 3. Lognormal distributions are used to characterise the repair time of a
subsystem as it reflects typical process time carried out by humans (Kelton, 2007).
Table 3: Example subsystems
System DescriptionReliability
distribution
Mean time
between failure
Mean time to
repair
Spindle
Provides main
rotational force on
tool head
Exponential 6000 hrs 16 hrs
Oil filters Maintains oil purity Exponential 2000 hrs 2 hrs
X-axis motion
system
Controls position of
tool headExponential 4000 hrs 6 hrs

51
6.4 Operational Environment
The aircraft in SHOAM age during a flight and can either fail and return home, or can
complete their ‘missions’. This is modified as industrial equipment breaks down without
changing location substantially. The model environment is also modified to allow greater
variability in operational intensity and more flexibility over the aging process. Aircraft during
flight are simulated as aging only according to the duration of the flight. The level of intensity
of a machine tool’s processing environment will detriment the machine in different ways, such
as when different metals are processed, and therefore simulating the impact of different
operational intensities is essential for maintenance planners. Different aging processes can
therefore be set for different job priorities. A priority one job environment, for example, could
work or age the machine twice as hard as a priority two environment.
The probability that certain machine functions will not be utilised (§5.3.1) has been
included as a separate module which can be attached or removed within the modelling
environment. It essentially ‘heals’ certain subsystems after an operation before checking if
any machine components have broken down. This may be useful for advanced machine tools
which perform many functions, as Mazak discovered when experimenting with CBM
technologies. It also allows far greater control over the manufacturing environment, because
rather than all subsystems aging by the operation duration, different environments can be
modelled to age certain systems differently over the lifecycle of the machine.
6.5 CBM/PHM
Subsystem faults develop during flights in SHOAM and if a fault occurs planes enter
maintenance as soon as they land. Prognostics are modelled by setting a prognostic ‘horizon’
to indicate the point at which a failure can be detected. In RCB, this is often referred to as the
‘potential failure’ interval and is characterised by the P-F curve (Moubray, 1997). A typical P-F

52
curve is shown in Figure 14, where P is the point when monitoring systems can detect a
machine fault and F is the fail point of the component. SHOAM deducts the time between P
and F from the subsystem failure point, effectively reducing the MTBF of the subsystem by
the P-F interval.
Figure 14: Typical P-F curve (source: Moubray, 1997)
The aircraft enters maintenance immediately on detection of a fault (or reaching point
P) instead of flying again and risking failure. The risk of aircraft failure however, is
substantially greater than that of a machine tool as machine tool operation and failure rarely
impacts human health. A different approach to prognostics is therefore used to allow the
analyst to differentiate between fault detection and maintenance action. This flexibility is also
practiced for machine tools and other industrial equipment as CBM, where engineers collect
data from a machine which then returns to production whilst the data analysis takes place
(§5.2.6). For more information on these changes, see appendix C.
Confidence in any prognosis will depend on the accuracy of the monitoring and
diagnostic systems being employed. Accuracy may also be a function of the P-F interval
length and the time at which the fault was detected. Figure 15 illustrates this by showing that
detection accuracy (top distributions) increases as the fault develops (a1, a2, a3) and more
information about the fault obtained from the monitoring systems. The longer the P-F interval
t
P
F
Start of failure
Condition

53
then, the greater the probability is for detection. This is represented by characterising the P-F
interval by a reliability distribution itself. A normal distribution is selected with the standard
deviation representing the inherent system accuracy. As the machine tool ages the probability
that any faults are detected accurately increases.
Figure 15: Monitoring accuracy (source: Impact Technologies)
Knowledge and learning abilities are now common features in the development of
machine tool fault diagnostic and prognostic systems (§3.6). This is simulated by using the
knowledge variable from SHOAM and using it to improve the P-F interval. The knowledge
variable itself is used in SHOAM to show improvement in maintenance planning by reducing
the time for maintenance tasks by a percentage. For the machine tool model, knowledge
increases the P-F interval length and decreases the standard deviation; if a fault is detected
during operation accurately. This increases maintenance response and improves the
accuracy of detection systems.

54
6.6 Quality
Quality is not measured in the SHOAM model, but is for advanced machine tools as a
large proportion are used in the aerospace industry. Three subsystems in machine tools
which impact quality of the output substantially are those used to control the coordinates of
the tool in the work envelope. Poor quality is modelled by introducing a random variable which
causes a poor quality product as these systems reach the end of their lives. This only affects
the very end of the subsystem life and is not a function over the entire life of the component.
This reflects the wear-out phase of the ‘bathtub curve’ (Figure 16), which characterises the
failure rate λ of many engineering components and where failures increase towards the end
of life (Dhillon, 2007).
Figure 16: The bathtub curve
The observation by Todinov (2006), that the different consequences of failure affect risk, is
also captured because maximising overall machine reliability may not minimise the risk of
poor quality. Components can also fail without producing any poor quality work and quality
can be improved using PHM systems.
Usefullife
Wearout
Burn inFailure
rate
λ
t
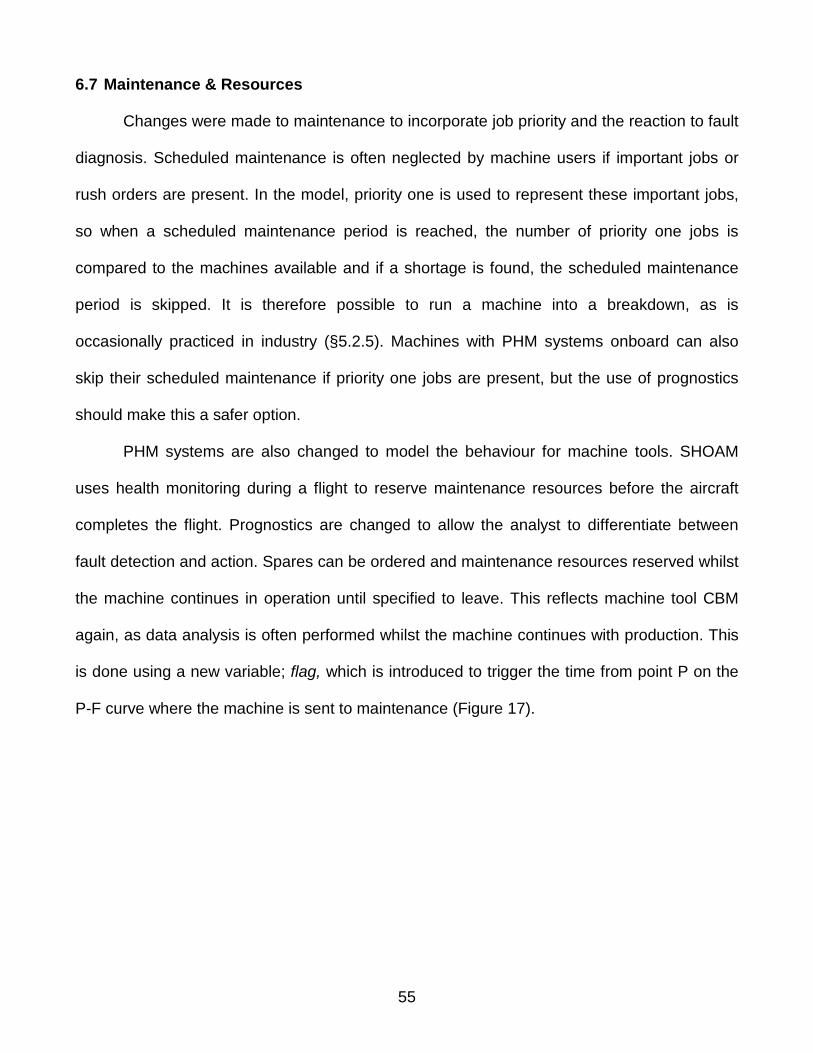
55
6.7 Maintenance & Resources
Changes were made to maintenance to incorporate job priority and the reaction to fault
diagnosis. Scheduled maintenance is often neglected by machine users if important jobs or
rush orders are present. In the model, priority one is used to represent these important jobs,
so when a scheduled maintenance period is reached, the number of priority one jobs is
compared to the machines available and if a shortage is found, the scheduled maintenance
period is skipped. It is therefore possible to run a machine into a breakdown, as is
occasionally practiced in industry (§5.2.5). Machines with PHM systems onboard can also
skip their scheduled maintenance if priority one jobs are present, but the use of prognostics
should make this a safer option.
PHM systems are also changed to model the behaviour for machine tools. SHOAM
uses health monitoring during a flight to reserve maintenance resources before the aircraft
completes the flight. Prognostics are changed to allow the analyst to differentiate between
fault detection and action. Spares can be ordered and maintenance resources reserved whilst
the machine continues in operation until specified to leave. This reflects machine tool CBM
again, as data analysis is often performed whilst the machine continues with production. This
is done using a new variable; flag, which is introduced to trigger the time from point P on the
P-F curve where the machine is sent to maintenance (Figure 17).

56
Figure 17: Maintenance flag
There are clearly tradeoffs involved when setting the flag position which may improve
or detriment the performance of a machine. If the flag is set very late after a fault is detected,
maintenance resources will be reserved for that fault whilst the machine continues with its
operation. It could fail or develop another fault however, and therefore require a longer period
in maintenance and risk breakdown. If the flag is set very early, the machine will enter
maintenance early despite usable life in the machine components. The length of the P-F
interval, delivery times and the reliability of the components must all be considered when
setting the flag and therefore presents a strategic decision for the maintenance planner which
can be optimised using simulation. This also prevents forcing a two-state response to fault
detection, noted by Eisinger and Rakowsky, (2000) to cause inefficiency.
Spares in SHOAM are ordered using PHM systems or when the plane is in
maintenance. The option of using a scheduled approach for ordering spares is also
introduced whereby a minimum level of spares is specified, which are replenished to this level
intermittently, allowing a ‘parts store’ to be modelled as part of a service. This can also be set
up to model a just-in-time approach to parts if the part delivery time is known and the
minimum level set accordingly.
Condition
t
P
F
flag

57
Changes to the way spares are allocated means that measuring the cost of the spares
‘store’ is more accurate, as is the unavailability of maintenance resources. Parts are now
reserved immediately when requested, but remain in the parts store until the repair is
performed. Reserving spares early therefore incurs a premium, as the parts will be
unavailable for other machine repairs, but a holding cost may still be applied, making lifecycle
costs for spares easier to calculate. The option of modelling the availability of engineers on-
site against off-site is also introduced, where a delay is incurred to model the response time of
an engineer to a break down.
6.8 Performance Measurement
Changes to the way SHOAM calculates availability and utilisation provide a more
accurate reflection of machine availability. Given the difficulty of extracting data for individual
entities in the Arena simulating environment, SHOAM uses a ‘snap-shot’ of the number of
machines in maintenance at a particular interval and computes the number of aircraft
available at that time. A sampling method is used instead in which all machines pass through
a module which records the time each machine spent in maintenance. After 10 records have
been collected, the average of all machines is calculated. This is also done for utilisation and
provides a running estimate of the average performance of the production system. The
performance of machines over the lifecycle period has been modified from SHOAM to provide
a breakdown of performance into 6 month intervals. This makes the impact of maintenance
and services easier to visualise over longer durations.

58
7. MODEL TESTING AND DISCUSSION
This chapter presents the design and results of the model testing. A discussion follows
where the utility for machine tool services and performance is evaluated and the limits of the
model identified.
7.1 Testing Method
Reliability data could not be obtained for a machine tool and as such, model validation
cannot take place. A sensitivity analysis is performed to test the model features and
experiments using the best available data from the interviews are conducted to illustrate the
capability of the model for evaluating the impact of reduced downtime and the benefits of
CBM/PHM technologies. An example of one experimental service evaluation, based on a ten
machine cell similar to that used in wing manufacture, is given below and further examples
can be found in appendix E for comparison. In the ten machine cell test, different designs of
service contracts offered by machine tool manufacturers are simulated using multiple
experimental runs of the model and evaluated over a 5 year lifecycle. The benefits of using
CBM/PHM systems will also be compared and the result is the test matrix in Table 4.
Table 4: Service contract test matrix
Service contractPreventativemaintenance
scheduleEngineer onsite Parts store PHM
1
2
3
4

59
The machine used for the test is based on the information obtained for an NCMT
machine and the corresponding preventative maintenance schedule is therefore also applied.
A single shift inspection and repair of systems every three months is supported by a longer
three shift service every six months. A two shift scheduling system is used, with each shift
averaging around nine hours to simulate a harsher production environment compared to the
typical 8 hour shift. Artesis motor condition monitoring systems are used to simulate condition
monitoring and are therefore only applied to the six subsystems which are motorised. Each of
these units costs £2000 and it therefore costs £12000 to monitor a complete machine.
7.2Testing Results
The results of the sensitivity analysis are available in appendix E. Shown below are the
model behaviour in terms of inputs and outputs and the results of the example service
comparison given above.
7.2.1 Model Inputs and Outputs
Data is entered into a spreadsheet which provides the input to the model. This includes
the machine design characteristics, the operational scenario and the service strategy. The
data which can be put into the input sheet to design a service scenario is included in appendix
D. Some data must be changed in the model itself, including the schedules for maintenance
engineers and the delivery intervals for spares schedules. There are three formats for
simulation results. An interface in the model (Figure 18) provides live information whilst the
simulation is in progress. Built-in plots in the interface display average stock levels and
resource utilisation, giving a short-term view of changes in performance. Another format for
results is a report which is automatically generated by the Arena software package at the end
of a completed simulation. A further format for results is an output spreadsheet which has

60
been created to record ten performance statistics at six month intervals and records the total
failures for each subsystem at the end of the simulation. Each of these three formats is most
useful for analysing changes in performance over different time intervals.
Figure 18: New model interface
7.2.2 Service Comparison Results
The first three contracts do not improve the operational reliability of the machine itself,
but aim to get the machine working again as soon as possible. Breakdowns therefore do not
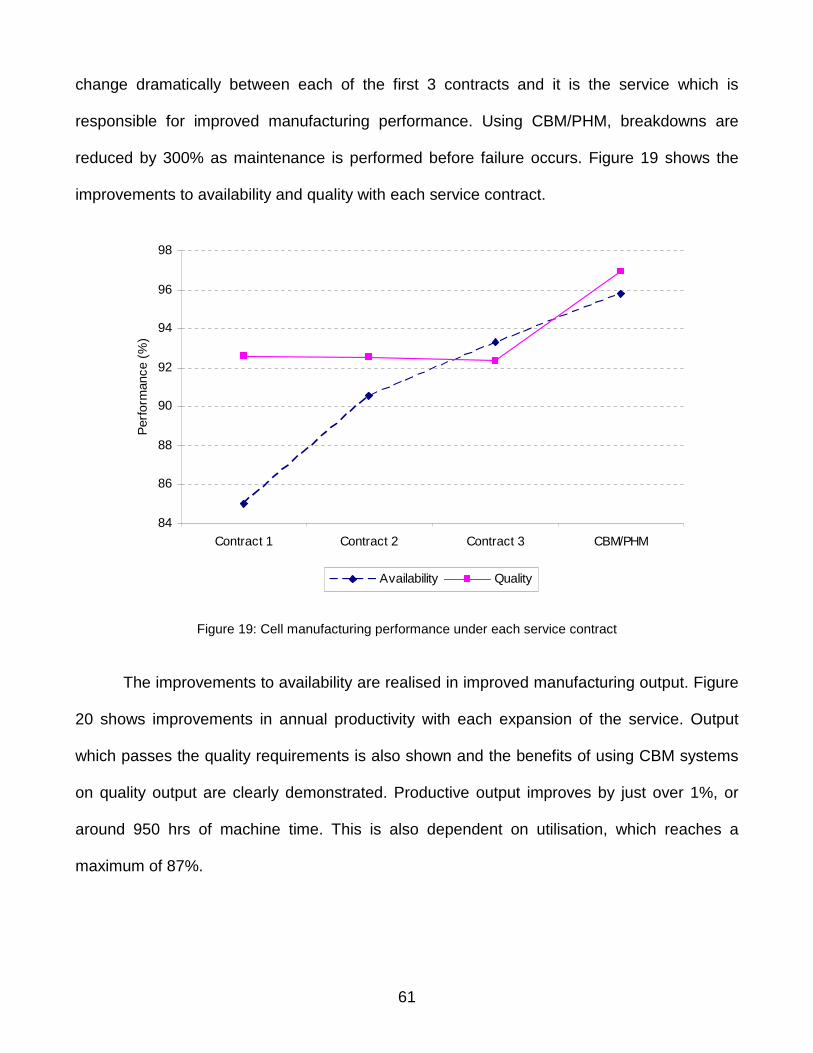
61
change dramatically between each of the first 3 contracts and it is the service which is
responsible for improved manufacturing performance. Using CBM/PHM, breakdowns are
reduced by 300% as maintenance is performed before failure occurs. Figure 19 shows the
improvements to availability and quality with each service contract.
84
86
88
90
92
94
96
98
Contract 1 Contract 2 Contract 3 CBM/PHM
Perf
orm
ance
(%)
Availability Quality
Figure 19: Cell manufacturing performance under each service contract
The improvements to availability are realised in improved manufacturing output. Figure
20 shows improvements in annual productivity with each expansion of the service. Output
which passes the quality requirements is also shown and the benefits of using CBM systems
on quality output are clearly demonstrated. Productive output improves by just over 1%, or
around 950 hrs of machine time. This is also dependent on utilisation, which reaches a
maximum of 87%.
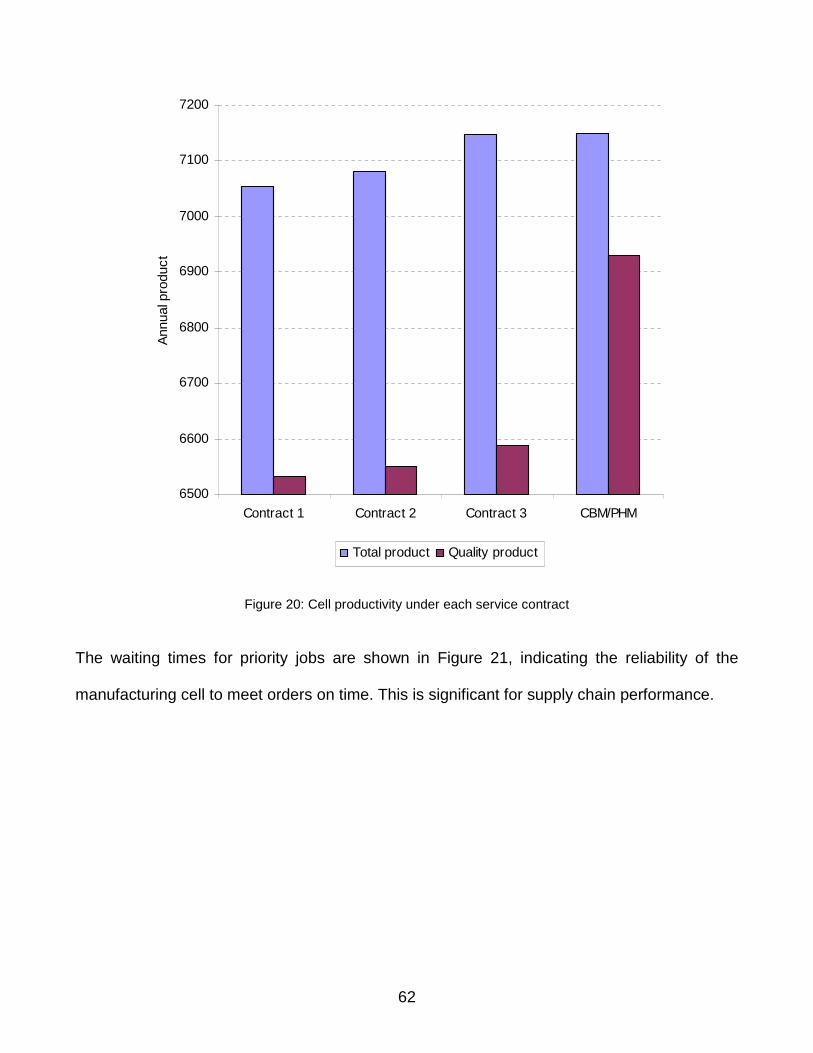
62
6500
6600
6700
6800
6900
7000
7100
7200
Contract 1 Contract 2 Contract 3 CBM/PHM
Annualp
roduct
Total product Quality product
Figure 20: Cell productivity under each service contract
The waiting times for priority jobs are shown in Figure 21, indicating the reliability of the
manufacturing cell to meet orders on time. This is significant for supply chain performance.

63
0
1
2
3
4
5
6
7
8
Contract 1 Contract 2 Contract 3 CBM/PHM
Waiti
ng
time
(hrs
)
Priority 1 Priority 2
Figure 21: Waiting times for priority jobs in each service contract
Using these results, manufacturers can clearly demonstrate the value that their services
provide and may guarantee a specified performance with increased certainty that this level of
service will be met.
For machine maintainers, cost will be a factor in determining if the service should be
expanded. The SHOAM tool effectively demonstrates lifecycle performance, but assessing
costs using the model is more difficult. Modelling the spare parts store is particularly difficult
because complete subsystems are rarely held onsite by machine tool service providers and
repairs do not typically replace entire subsystems. Components also vary considerably in cost
with spindles found to reach up to £20,000, but cartridge loading spindles can be changed for
a significantly reduced cost. Electroimpact estimate that around 59% of the cost of a machine
is held on the shelf for their 10 machine facility, which is used to model a full part store in this
analysis. The particular machines used in this test typically cost £250,000, but some
advanced machine tools were found to cost up to £8m. The parts store also rarely remains

64
full, so the average number of spares in the store over the five years is used to determine the
final holding cost. Typical technicians cost £28,000 per year and the costs of downtime are
determined using the machine cost. Figure 22 shows the change in the lifecycle cost of each
service contract with contract 1 as 100%.
0%
20%
40%
60%
80%
100%
120%
Contract 1 Contract 2 Contract 3 Contract 4
Cost
Figure 22: Lifecycle cost
The main driver of maintenance effectiveness is downtime, which is shown in Figure
23. The improved service throughput with each contract results from the increased availability
of maintenance resources including spares and engineers, which reduces the waiting times
for broken machines. Despite a longer downtime period than contract 3, contract 4 has an
improved availability. The use of CBM means that maintenance is performed according to
machine condition, which eliminates unnecessary servicing and therefore the machine
downtime is minimised over the lifecycle of the contract. This is shown in Figure 23 as a

65
reduced number of maintenance visits. Using CBM/PHM systems also reduces the time being
repaired, because faults have been already been diagnosed.
0
5
10
15
20
25
30
35
Contract 1 Contract 2 Contract 3 Contract 4
Tim
e(h
rs)
0
2
4
6
8
10
12
14
No.
vis
its
Average downtime per maintenance visit Average annual maintenance visit
Figure 23: Average downtime and maintenance visits
The test reveals that reducing machine tool downtime is being achieved effectively by
the services which machine tool manufacturers provide, but this does not necessarily
minimise cost. Holding an engineer onsite only marginally reduces downtime, but the lifecycle
cost is also reduced. Holding spare parts considerably reduces the downtime, but to the
detriment of lifecycle costs. This may be the reason why this type of service is only found in
intensive manufacturing environments where there are more machines or more expensive
machines over which the costs of the parts store are spread. Indeed, economies of scale can
be seen between single and three cell tests in appendix E. Using CBM greatly improves
operational reliability through reduced breakdowns and also by increasing the quality of
output by allowing faults which do not cause subsystem failures to be recognised and
66
reduced. CBM also eliminates unnecessary maintenance which improves availability. PHM
reduces the time in maintenance significantly, although not as much as the spare parts store.
7.3Model Evaluation and Discussion
The value which each service delivers to the customer can clearly be demonstrated in
the model. The difficulty of demonstrating the value of a particular service is one of the main
causes of the servitization paradox experienced by manufacturers and noted by Gebauer et
al. (2005).The benefits delivered by CBM/PHM solutions over the lifecycle of the machine are
also demonstrated and these can be compared to the expense of implementing these
systems for a machine. Even if PHM is not used, employing CBM systems can significantly
increase performance through the elimination of unnecessary maintenance, improved
operational reliability and quality.
The maintenance flag increases the flexibility of CBM/PHM system management and
allows the behaviour seen in the machine tool industry to be modelled, in which machines
continue operating despite the detection of a system fault. The increased risks of keeping a
machine in operation whilst maintenance is prepared can be evaluated using the model
before implementing for a machine. The response to CBM/PHM information can therefore be
optimised according to the designer’s constraints; be they manufacturing system
performance, cost or service environment. Services can therefore be matched to the
organisational and business conditions, which Haarman (2005) uses in a VDM methodology,
again to show the value of maintenance services for an organisation.
Including quality in the model introduces another risk seen in industry to be modelled,
as poor quality for aerospace is a failure, even if the particular subsystem may still be
operational. Management of quality is therefore essential for advanced machine tools. The
manufacturing environment also effects quality performance and risk can be reduced through

67
simulation. Indeed, uncertainty and risk can be managed more effectively through simulation,
which should help manufacturers develop more effective long term service strategies .
Feedback to a machine designer is also provided, because machine performance can
be matched to the anticipated operational environment. Designing services and machine cells
in concert could be used for plant level designs, where process plant reliability is optimised
during the design phase (Goel et al, 2003). Limiting a machine tool to a single set of
subsystems however, may be too restrictive. Unless each subsystem is an LRU as defined by
Wessels, (2003) then systems will undoubtedly comprise numbers of components and a risk
analysis of the subsystem will be necessary. This could also be true for PHM systems, as it is
unlikely that one P-F interval is sufficient to describe the behaviour of an entire subsystem.
Given the lack of accurate data for machine tool reliability, many of the model features,
such as the impact of different manufacturing environments could not be used. Without
accurate reliability data, only the model capabilities are being demonstrated here and the
model must first be validated in order to make full use of these capabilities. This will require
substantial cooperation from an advanced machine tool manufacturer, as data from
commodity machine producers could not be used in this type of analysis. Failure modes and
rates seen in these machines can vary considerably for any single component due to the
variability in manufacturing environments and the user neglect of the machines. It may only
be capital intensive manufacturing environments then, where downtime cannot be afforded
and where far more failure data is collected, that a model such as this can be used.

68
8. CONCLUSION
8.1 Summary of Findings
Machine tool manufacturers in the UK have responded to market turbulence and
competition from low labour cost economies by increasing the technological complexity of
their machines to target niche markets and by focusing on the services which maintain them.
The transition to service provider however, has been problematic for many equipment
providers, such that the success of some companies in contrast to the failure of others, has
been described as a paradox. The causes are complex and involve the sensitive relationship
between service provider and equipment user, the difficulty of demonstrating the value of
services in the manufacturing sector and the uncertainty involved in making long term
commitments.
A model is created to allow the operation of a machine tool in a service arrangement to
be simulated. The SHOAM tool, developed by The Boeing Company, which performs a
similar function for aircraft, is used and modified which improves the model scope. The
operational environments of advanced machine tools are researched using interviews of
industry members and literature, the results of which define the requirements of the new
model. The interviews reveal the low maturity of machine tool services, with services offered
on machines for a premium. The industry is highly user driven, with customers specifying the
services they require and manufacturers agreeing to supply them. One of the causes of this
low maturity result from the fierce competition in the industry which gives manufacturers
relatively low bargaining power compared to users. Another is the neglect of maintenance by
machine users, who are therefore responsible for a large proportion of machine downtime.
Consequently, performance based contracts cannot be guaranteed. Compounded with this,
the high variability in machine tool operational environments and the modular construction of

69
the machines makes component failures highly variable and reliability engineering costly.
They also reveal the lack of adoption of health management technologies, which have shown
potential for improving maintenance and service response for aerospace and automotive
applications.
The SHOAM tool, modified to build the model, is used to analyse aircraft, but the risks
of machine tool failure are lower than that of an aircraft and consequently, many SHOAM
modifications allow greater flexibility in the response to system health information. This allows
the behaviour seen in industry to be modelled more effectively. More control over the
operational environment is also introduced, which allows the different manufacturing
conditions and levels of uncertainty in which machine tools operate to be modelled. Typical
services that are present in the machine tool industry are also included so that the benefits of
health monitoring systems can be compared to existing service strategies.
The model demonstrates the sensitivity of machine tool performance to different
service and maintenance strategies, which can then be optimised over the lifecycle of the
machine or service contract. This allows risks and uncertainty to be reduced and an effective
service strategy planned, which could help overcome some of the causes to the service
paradox experienced by equipment manufacturers. Demonstrating the value delivered by
equipment services is another cause and the model allows the benefits of a service strategy
to be clearly demonstrated.
CBM/PHM systems show great potential for improving the performance of machines
and reducing lifecycle costs. CBM reduces unnecessary maintenance and can increase
operational reliability substantially. Quality can also be managed more effectively, which is
critical for advanced machine tools in aerospace. PHM systems allow similar reductions in
machine downtime to the more capital intensive services currently used for advanced
machines, but a significantly reduced lifecycle cost.
70
8.2 Research Limits
The greatest limit of the model was the lack of quality data for machine tool reliability.
This prevented validation of the model and so only the model capabilities could be analysed.
This was largely due to the nature of the data itself, which is highly sensitive to the customers
of advanced machine tool manufacturers. Commodity machine data was not consistent
enough to be used either. The variability between modes and rates would make any result
from a model such as this unrealistic and the risk of using such results would therefore
increase substantially. The method of interviewing may also be responsible for the lack of
quality data. Phone interviews proved inefficient and a more direct, face-to-face approach
may have been more useful, although the interest of the some manufactures in the
development of services was found to be low.
There are potentially a great many improvements to the model which could be made
depending on the application. Modelling logistics in greater detail is one example. Not all
machine tool manufacturers use a centralised parts distributor and the flexibility to model a
decentralised approach might be of interest. More data and knowledge of how the model will
be used in practice should be sought however, before changes such as these are made.
Although SHOAM does not currently model costs, it has great potential in doing so and a
more efficient way of modelling repairs would therefore be useful for analysis.
8.3 Further Work
The model must be validated using a real operational setting with the corresponding
machine reliability data so that its effectiveness can be evaluated. A list of model failures
should follow immediately which can be used for future improvements. These may only be
cosmetic; requiring just minor modification of measures and variables, however if more detail,
such as increased subsystem decomposition is required, then more fundamental changes to

71
the model will be necessary. It will be interesting to see how the problem of subsystem
decomposition is addressed in the Arena modelling environment, although it is understood
that another programme; PICAM, is in development which aims to provide the inputs to
SHOAM.

72
REFERENCES
Baek, J. G. (2007). An intelligent condition-based maintenance scheduling model.
International Journal of Quality and Reliability Management, 24(3), 312-327.
Brax, S. (2005). A manufacturer becoming service provider – challenges and a paradox.
Managing Service Quality, 15(2)
Chen, D., & Trivedi, K. S. (2002). Closed-form analytical results for condition-based
maintenance. Reliability Engineering & System Safety, 76(1), 43-51.
Dey, P. K., Ogunlana, S. O., & Naksukakul, S. (2004). Risk-based maintenance model for
offshore oil and gas pipelines: A case study. Journal of Quality in Maintenance
Engineering, 10(3), 169.
Dhillon, B. S. (2007). Applied reliability and quality: Fundamentals, methods and procedures
(1st ed.). London: Springer-Verlag.
Eisinger, S., & Rakowsky, U. K. (2001). Modeling of uncertainties in reliability centered
maintenance — a probabilistic approach. Reliability Engineering & System Safety, 71(2),
159-164.
Emblemsvåg, J. (2003). Life-cycle costing: Using activity-based costing and monte carlo
methods to manage future costs and risk (1st ed.). Hoboken, New Jersey.: John Wiley &
Sons, Inc.
Gebauer, H., Fleisch, E., & Freidli, T. (2005). Overcoming the service paradox in
manufacturing companies. European Management Journal, 23(1), 14.
Goel, H. D., Grievink, J., & Weijnen, M. P. C. (2003). Integrated optimal reliable design,
production, and maintenance planning for multipurpose process plants. Computers &
Chemical Engineering, 27(11), 1543-1555.
Grall, A., Dieulle, L., Berenguer, C., & Roussignol, M. (2002). Continuous-time predictive-
maintenance scheduling for a deteriorating system

73
Haarman, M. (2005). Value driven maintenance “Creating shareholder value with
maintenance”. Mainnovation
Hayek, M. E., van Voorthuysen, E., & Kelly, D. W. (2005). Optimizing life cycle cost of
complex machinery with rotable modules using simulation. Journal of Quality in
Maintenance Engineering, 11(4), 333.
Hu, W., Starr, A., Zhou, Z., & Leung, A. (2001). An intelligent integrated system scheme for
machine tool diagnostics. The International Journal of Advanced Manufacturing
Technology, 18(11), 836.
Hu, W., Starr, A. G., Zhou, Z., & Leung, A. Y. T. (2000). A systematic approach to integrated
fault diagnosis of flexible manufacturing systems. International Journal of Machine Tools
and Manufacture, 40(11), 1587-1602.
Jardine, A. K. S., Makis, V., Banjevic, D., Braticevic, D., & Ennis, M. (1998). A decision
optimization model for condition-based maintenance. Journal of Quality in Maintenance
Engineering, 4(2), 115.
Jennings, A. D., & Drake, P. R. (1997). Machine tool condition monitoring using statistical
quality control charts. International Journal of Machine Tools and Manufacture, 37(9),
1243-1249.
Johansson, P., & Olhagar, J. (2004). Industrial service profiling: Matching service offerings
and processes. International Journal of Production Economics, 89(3), 309.
Kelton, D. W., Sadowski, R. P., & Sturrock, D. T. (2007). Simulation with arena (4th ed.). New
York: McGraw-Hill.
Khan, F. I., & Haddara, M. M. (2003). Risk-based maintenance (RBM): A quantitative
approach for maintenance/inspection scheduling and planning. Journal of Loss
Prevention in the Process Industries, 16(6), 561-573.

74
Koomsap, P., Shaikh, N. I., & Prabhu, V. V. (2005). Integrated process control and condition-
based maintenance scheduler for distributed manufacturing control systems. International
Journal of Production Research, 43(8), 1625-1641.
Labib, A. W. (1998). World-class maintenance using a computerised maintenance
management system. Journal of Quality in Maintenance Engineering, 4(1), 66.
Lee, J., Ni, J., Djurdjanovic, D., Qiu, H., & Liao, H. (2006). Intelligent prognostics tools and e-
maintenance. Computers in Industry, 57(6), 476-489.
Liyanage, J. P., & Kumar, U. (2003). Towards a value-based view on operations and
maintenance performance management. Journal of Quality in Maintenance Engineering,
9(4), 333.
MACHINING: Productivity bonus.(2006). The Engineer, , 35.
Madu, C. N. (2005). Strategic value of reliability and maintainability management. The
International Journal of Quality & Reliability Management, 22(2/3), 317.
MTA Basic Facts. (2008). The Manufacturing Technologies Association
Markeset, T., & Kumar, U. (2005). Product support strategy: Conventional versus functional
products. Journal of Quality in Maintenance Engineering, 11(1), 53.
Martin, H. H. (1997). Contracting out maintenance and a plan for future research. Journal of
Quality in Maintenance Engineering, 3(2), 81.
Martin, K. F. (1994). A review by discussion of condition monitoring and fault diagnosis in
machine tools. International Journal of Machine Tools and Manufacture, 34(4), 527-551.
Mintel Marketing Intelligence. (2006). Machine Tools (Industrial Report). UK: Mintel Oxygen
Moubray, J. (1997). Reliability-centered maintenance (2nd ed.). Oxford: Butterworth-
Heinemann,.
Ofsthun, S. (2002). Integrated vehicle health management for aerospace platforms.
Instrumentation & Measurement Magazine, IEEE, 5(3), 21.

75
Ojasalo, K. (2007). Developing industrial services - an empirical study. The Business Review,
Cambridge, 7(1), 58.
Rehorn, A. G., Sejdić, E., & Jiang, J. (2006). Fault diagnosis in machine tools using selective
regional correlation. Mechanical Systems and Signal Processing, 20(5), 1221-1238.
Rosqvist, T., Laakso, K., & Reunanen, M. (2007). Value-driven maintenance planning for a
production plant. Reliability Engineering & System Safety, In Press, Corrected Proof
Saranga, H., & Knezevic, J. (2001). Reliability prediction for condition-based maintained
systems. Reliability Engineering & System Safety, 71(2), 219-224.
Saranga, H., & Knezevic, J. (2001). Reliability prediction for condition-based maintained
systems. Reliability Engineering & System Safety, 71(2), 219-224.
Sherwin, D. (2000). A review of overall models for maintenance management. Journal of
Quality in Maintenance Engineering, 6(3), 138.
Söderholm, P., Holmgren, M., & Klefsjö, B. (2007). A process view of maintenance and its
stakeholders. Journal of Quality in Maintenance Engineering, 13(1), 19.
Spoerre, J., & Wang, H. -. B. (1995). Machine performance monitoring and fault classification
using an exponentially weighted moving average scheme. International Journal of
Production Research, 33(2), 445.
Todinov, M. T. (2006). Reliability analysis based on the losses from failures. Risk Analysis,
26(2), 311.
Tsang, A. H. C. (1998). A strategic approach to managing maintenance performance. Journal
of Quality in Maintenance Engineering, 4(2), 87.
Tsang, A. H. C., Jardine, A. K. S., & Kolodny, H. (1999). Measuring maintenance
performance: A holistic approach. International Journal of Operations & Production
Management, 19(7), 691.

76
Vachtsevanos, G., Lewis, F., Roemer, M., Hess, A., & Biqing, W. (2006). Intelligent fault
diagnosis and prognosis for engineering systems (1st ed.). United States of America:
John Wiley & Sons, Inc.
Vandermerwe, S., & Rada, J. (1988). Servitization of business: Adding value by adding
services. European Management Journal, 6(4), 314-324.
Wang, W., & Zhang, W. (2008). An asset residual life prediction model based on expert
judgments. European Journal of Operational Research, 188(2), 496.
Wessels, W. R. (2003). Cost-optimized scheduled maintenance interval for reliability-centered
maintenance
Yam, R. C. M., Tse, P. W., Li, L., & Tu, P. (2001). Intelligent predictive decision support
system for condition-based maintenance. International Journal of Advanced
Manufacturing Technology, 17(5), 383-391.
Zhou, X., Xi, L., & Lee, J. (2007). Reliability-centered predictive maintenance scheduling for a
continuously monitored system subject to degradation. Reliability Engineering & System
Safety, 92(4), 530-534.

77
APPENDIX A: SEMI-STRUCTURED INTERVIEW TOPICS
A.1 Machine Operational Environment
Given the costs of acquiring advanced machine tools it is anticipated that utilisation will
be a common concern for machine users. Information regarding typical operational durations
is therefore required to provide an insight into the value of machine availability. This
information is also useful for designing efficient services both for the machine users and
service providers. A preliminary examination of SHOAM reveals that reliability data for
machine tool subsystems will be needed. SHOAM models an aircraft as a set of 9
subsystems, each characterised by sets of reliability data. There are three key reliability
measures need for each subsystem and these are listed below:
1. Mean time between failure (MTBF) & distribution
2. Mean time between unscheduled maintenance (maintenance which does not cause
critical breakdown)
3. Mean time to repair (MTTR) & distribution
It may also be possible to infer MTBFs and the characteristic distribution from historical data
or past performance measures.
Topics:
Brief description of machine purpose and tasks being performed
How long is the machine required to be operational per day?
What is a typical cycle time of a single job?
How many jobs are performed per day?
How are jobs scheduled and controlled?
How many similar machines are in use at the same time?

78
Is the machine part of a manufacturing cell or production line?
How are parts delivered to the machine?
What happens to parts after processing?
What happens to the job and production system if the machine breaks down?
A.2 Service Contract Type & Maturity Level
This subject is included to provide a benchmark between the different service offerings.
The services included in the contract, how they are paid for and their duration may be used to
place the company into one of the frameworks from the literature.
What is offered/guaranteed – service level/warranty?
Under what conditions are services offered – i.e. types/numbers of machines etc?
Period of service contract
Does the customer purchase the machine and the services are included for a
premium?
Does the customer purchase the services the machine function provides i.e. rent the
machine?
Which service type generates most profit/business?
Most popular types of contract and growth trends
How are the benefits shown to the customer?
A.3 Service Strategy and Management
This subject is where the most variability in responses is anticipated, as there are
many ways to manage maintenance, as seen from the literature review. Particular attention is
therefore given to suppliers of product services and not in-house maintenance. The key areas

79
of focus will be on the management of maintenance activities, particularly regarding the
interface between operations and machine performance. Measures of effectiveness (MOEs)
which are used in SHOAM to analyse performance will also be obtained and are expected to
vary depending on the particular service contract being offered.
How are the tasks which need to be performed on a machine identified?
How maintenance activities are planned and scheduled?
How does production and operations impact the service strategy?
How are service costs calculated?
How is performance measured?
A.4 Implementation and Confidentiality
The problems with implementation and execution of service contracts and issues such
as data sharing, privacy and responsibility will be raised here.
Problems with implementation and execution
Data sharing with customer
A.5 Maintenance Methodologies
The technical side of maintenance will be raised here. The success of a PHM offering
is the effective use of health monitoring and prognostic systems. The use and proliferation of
monitoring technologies and prognostic techniques currently employed in industry will also be
surveyed. The use of this data for learning/knowledge can also increase service effectiveness
How the service level is ensured
Delivery of services including spares/installation/replacement
Use of CBM and PHM

80
Scheduling of maintenance activities and integration with CBM
What happens to the collected data? E.g. use for learning process

81
APPENDIX B: MODEL DESCRIPTION
B.1 Model Overview
Figure 24: Model overview
1. Manufacturer is where the machines are designed and created. The reliability of each
machine and the machine cell size is also specified. This is similar to the Original Equipment
Manufacturer benefactor in SHOAM.
2. Production control generates and introduces production orders, or jobs, into the
manufacturing system. It is used to generate the manufacturing scenario in which the
machine tool and service arrangement can be simulated. The SHOAM counterpart to
Production control is the Flight Planning benefactor.
3. The Manufacturing system ages the machines according to the operational environment
specified in Production control. Machines are introduced and assigned to operations or
Manufacturing systemManufacturer
Production control
Maintenance& PM
scheduling
Parts store &engineers
CBM/PHM
1.
2.
3.4.
Production orders
Health updates
Machines
Key

82
orders, which then age the machine. It can then go to maintenance if scheduled or undergoes
a breakdown. Fixed and repaired machines are reintroduced into the manufacturing system
from maintenance to continue work. CBM/PHM systems if used send repeated health updates
to maintenance with which maintenance resources are ordered accordingly. SHOAM
counterparts include a mix of Hold Aircraft and Assign Flights, Fix or Fly and Flights. All these
functions will be internal to a machine cell in a manufacturing environment and Manufacturing
system models a machine cell.
4. Maintenance and PM scheduling repairs machines and reintroduces them into the
manufacturing system. Preventative maintenance is also scheduled here if used. Parts store
and engineers, although displayed separately to Maintenance and PM scheduling in Figure
24, is actually contained within it. Here, parts are held in stock and ordered in according to a
stock schedule or at the request of PHM systems. The SHOAM counterpart is clearly the
Maintenance Operations benefactor.
Both the Manufacturer and Production control are used to transfer data from the input sheet
into the model. They are mostly legacy systems of SHOAM, but with modification to include
the new modelling behaviour. The Production system, CBM/PHM and Parts store are almost
entirely different to SHOAM. Maintenance and PM scheduling is a mix of SHOAM legacy and
new systems. In the description of the model below, machines are described as ‘moving’
around the model because the Arena user interface animates each event as a movement.
Machines or any other entities however, do not actually move anywhere in the model. A
movement then, indicates a new event.

83
B.2 Manufacturer & Machine Design
Figure 25: Manufacturer logic
1. The machine cell specification, which is defined in the input sheet, is loaded into the
Arena model environment. The cells size and start time, percentage of machines with
PHM systems, the learning capabilities of those systems and the engineer resources
available to the cell are introduced here. The machine specification is then duplicated
to make up the machines in the cell.
2. The machines are then delayed for the duration of the cell start time, which is specified
in the input sheet. This can be used to model the installation time for machines or
simply be used to allow production orders to be accumulated before the machines are
introduced into the cell.
3. The Rclock attribute and number of subsystems are assigned here. Rclock
accumulates the time which the machine has been in operation. When it reaches the
fail point of the subsystem, the machine breaks down. To repair the machine, the
subsystem MTBF is added to the fail point so that Rclock can begin to accumulate
again. After Rclock is assigned, the Fault monitoring & prognostics sub module assigns
the reliability and prognostic characteristics of each machine subsystem.
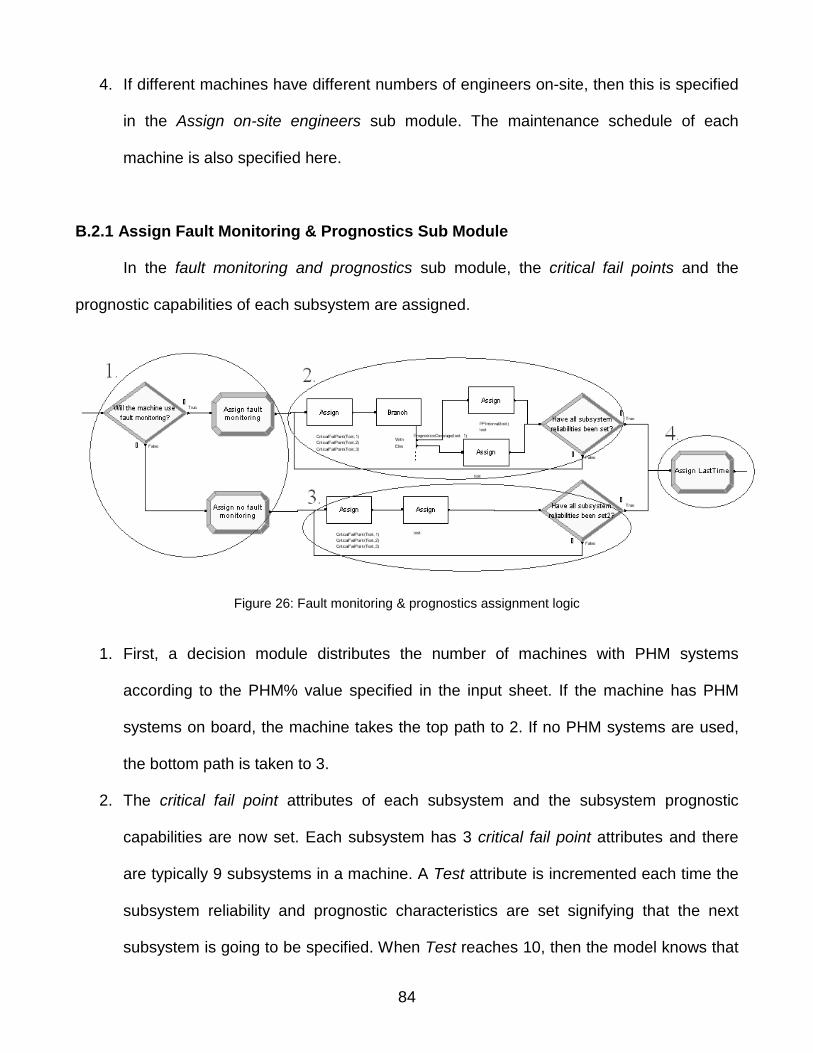
84
4. If different machines have different numbers of engineers on-site, then this is specified
in the Assign on-site engineers sub module. The maintenance schedule of each
machine is also specified here.
B.2.1 Assign Fault Monitoring & Prognostics Sub Module
In the fault monitoring and prognostics sub module, the critical fail points and the
prognostic capabilities of each subsystem are assigned.
Figure 26: Fault monitoring & prognostics assignment logic
1. First, a decision module distributes the number of machines with PHM systems
according to the PHM% value specified in the input sheet. If the machine has PHM
systems on board, the machine takes the top path to 2. If no PHM systems are used,
the bottom path is taken to 3.
2. The critical fail point attributes of each subsystem and the subsystem prognostic
capabilities are now set. Each subsystem has 3 critical fail point attributes and there
are typically 9 subsystems in a machine. A Test attribute is incremented each time the
subsystem reliability and prognostic characteristics are set signifying that the next
subsystem is going to be specified. When Test reaches 10, then the model knows that

85
all subsystem characteristics have been assigned and the machine proceeds to 4.
First, the 3 critical fail points of the subsystem are set.
Critical fail point 1 is the actual fail point of the sub system. When the Rclock attribute
reaches the value in critical fail point 1, the subsystem and machine breakdown. To
repair the subsystem, MTBFs are added to critical fail point 1 until it is above Rclock
again.
The number of times an MTBF is added to critical fail point 1 is recorded in the critical
fail point 2 attribute of the subsystem, which represents the number of repairs required
for the subsystem.
Critical fail point 3 is used when creating a health update message during fault
diagnostics. Instead of adding MTBFs to critical fail point 1, they are added to critical
fail point 3, leaving the first fail point in tact so that the machine can continue working
normally. The number of times an MTBF is added to critical fail point 3 is recorded in
critical fail point 2 as a negative value, representing that the faults were discovered
using PHM systems. Critical fail point 3 is later assigned to the subsystem critical fail
point 1, when the machine is repaired.
After the critical fail points have been assigned, a decision block decides if the
subsystem has PHM systems by checking the prognostic coverage specified in the
input sheet. Prognostic coverage determines the probability that a catastrophic failure
can be prevented using PHM systems. The Test attribute is incremented for the next
subsystem.

86
3. If no PHM capabilities are to be assigned to the machine, then only the critical fail
points are set for the 9 subsystems, and the machine proceeds to 4.
4. Finally, Test is reset to 1 and the Last Time attribute, which is used for statistical
gathering is set to the current simulation time.
B.3 Production Control
Figure 27: Production control logic
Production control generates the manufacturing scenario, including the operation
durations, long term business cycles and the job priority control system. Production control is
generally a function of the customer, but can be used to simulate the performance of a
machine tool service arrangement under different manufacturing conditions.
1. First, a scenario entity is created which is used to load the operation variables into the
model from the input sheet, which includes the operation durations, setup and shut
down times and the service life of the machine in operational hours.

87
2. The subsystem variables are then loaded into the model from the input sheet. These
include all the tables such as MTBFs and MTTRs of the subsystems, the subsystem
spares management and the scheduled maintenance and engineers.
3. The scenario entity is then used to schedule the business cycle scenario, if it is used.
In the Load operation rates sub module, the normal production load of jobs per day is
loaded from the input sheet, which controls the number of production jobs generated
per day in 4. This rate is continued until the business cycle is ready to start, which is
defined in the input sheet. The business cycle production load is then loaded into the
model, which alters the job orders per day of 4 and this lasts for the duration of the
business cycle. The normal load rates are then returned and the scenario entity is
disposed of.
4. Here, the production jobs or orders are generated. The production job rates, which
were specified in 3, are used to control the number of jobs generated per day in 4.
When the rate changes, then so too will the number of production orders sent to
manufacturing. This can be used to control the level of machine utilisation, in concert
with the operation durations and priority modes.
5. The operation durations, which can be used to simulate a single shift or a single job
are then loaded. Each order is subject to a variability, which introduces uncertainty into
the modelling environment. The priority mode, which controls the distribution of job
priorities, is also assigned to the production order here.
6. There are 3 exits to Production control, one for each job priority. This decision module
ensures that each job takes the correct path to the Manufacturing system. The assign
block in 6 is used to gather statistics on priority one jobs, such as the time which these
orders wait for a machine. The orders or jobs then continue to their respective match
modules in the Manufacturing system, where they wait to be assigned to a machine.

88
B.4 Manufacturing System
Figure 28: Manufacturing system logic
Machines enter from the left from either the manufacturer, as fixed machines from
maintenance, or as machines which have completed an operation and are healthy.
1. Machines enter the first sub module Tallies. Tallies records the performance statistics
for 10 machines, including availability, utilisation and maintenance visits. An average is
then taken and displayed on the interface. After Tallies, the machines enter the
process Pre TPM, where any pre maintenance checks are carried out. The time for this
a function of the TPM value from the input sheet.
2. The machine then enters the machine pool, where it is held and waits with other
machines until assigned to a job. When a job is available, a decision module assigns it
to highest priority job waiting.
3. Production orders enter via the upward pointing arrow. Each will have a priority and will
wait in its respective match module until a machine is available. When a machine is
assigned to a job, they leave the match module, the machine continuing to 5 and the
production order continuing to 4.

89
4. Qtime measures the time which priority one orders had to wait for an available
machine. After this is recorded, the operational environment of the job is recorded
temporarily and the order is disposed of.
5. The machines leave the match module and are the production environment is assigned
from the temporary values recorded in 4. After this they enter the Operation sub
module where the operation takes place. During operation, the machines are aged and
can breakdown, in which case they exit the operation module and leave via the
downward pointing arrow in Figure 28 to maintenance. If not they proceed to 6. Health
messages are also generated in the Operation module and enter into 7.
6. After finishing their operation, the output of the machine is checked in the Quality
control sub module. The machines then proceed to 7.
7. The health messages generated during operation and the machines after the quality
check both enter the Scheduling & prognostics sub module. Here, decisions based on
the machine health, the maintenance schedule and the waiting production orders
determine whether the machine should go to maintenance (and exit via the downward
pointing arrow) or should return to production and go to 8.
8. If the machine is going back into production some maintenance checks are carried and
the machine returns to 1.

90
B.4.1 Operation Sub Module
Figure 29: Operation sub module logic part 1
1. Machines enter the machine setup module, where any setup operations take place.
The time for the setup module comes from the input sheet and an operator resource is
required.
2. After setup, the decision module decides which priority the job is and sends it to the
corresponding environment module in 3.
3. The environment module is a legacy of SHOAM and is programmed to increase the
Rclock of each machine by the value determined by the expression entered in the
module. In this case, the expression takes either the shortest remaining life (critical
failpoint – Rclock), 0 (in case all sub systems have failed), or the operation duration.
So if the shortest remaining life is less than the operation duration, then Rclock will
increase by this amount and vice versa if operation duration is less than the shortest
remaining life.
4. The decision module then decides if the machine failed during that operation. It
compares the time the machine was in the environment module to the length of the

91
operation duration. It is clear from 3, that if the time the machine was in the
environment module is less than the operation duration, then the shortest life was not
long enough to complete the operation and the machine has broken down. If the time
the machine was in the environment module is equal to the operation duration, then
the machine must have completed the operation and remains healthy. If healthy, the
machine progresses to 5 via the top arrow in Figure 29. If it has broken down, it goes
down from the decision module via the arrow in Figure 29 to 8.
Figure 30: Operation logic part 2
5. Healthy machines are then checked for their fault diagnosing capabilities. If so they
enter the Fault monitoring sub module 6.
6. The Fault monitoring sub module generates a health update on the machine which is
then sent to Scheduling and Prognostics via the centre arrow in Figure 30.
7. The final tasks of the operation include recording the completion of the successful
operation and then shutting the machine down. Shut down process is similar to the

92
Setup. After the completion of this process, the machine leaves via the top arrow in
Figure 30.
8. Machines which have broken down are recorded as unsuccessful jobs and leave via
the bottom arrow in Figure 30.
3.5The Subsystem compensation module replaces the environment module 3 and allows
the probability of not using a subsystem during operation. Although it sounds unlikely,
this was found to be occurring by manufacturers when they applied CBM technologies
to certain machine components. The module must be attached before the model is run.
B.4.2 Fault Monitoring Sub Module
Figure 31: Fault monitoring logic
Much of the fault monitoring module design is a legacy of SHOAM
1. As machines enter the fault monitoring module, they are blocked so that only one is
tested at any one time. An attribute Test is applied which determines which subsystem
is being tested at that time. Test can therefore vary from 1 to 9.
2. The health of each subsystem is tested for faults independently. This branch module
determines if all the subsystems on the machine have been tested by seeing if the Test
is equal to 10. Test is incremented when the subsystem test has been completed.

93
When Test reaches 10, then all subsystems have been tested and the machine leaves
via 6. This module also decides if the subsystem has developed a fault. Rclock is
compared to the P-F interval, and if it is found to be within this region, then a fault has
occurred and the subsystem will require maintenance soon. It leaves via the module
and enters the Determine no. repairs module 3. If a fault has not occurred, then the
machine goes to 5.
3. The Determine no. repairs first records the critical fail point of the sub system into the
attribute critical fail point 3 so that this attribute can be changed without affecting the
actual fail point of the system. MTBFs are then added to critical fail point 3 until its
‘health’ is above the P-F interval i.e. to return the subsystem health back up to beyond
the P-F interval. The number of times this has to happen is recorded in critical fail point
2. This number is negative to indicate that the faults were detected using PHM
techniques.
4. After the number of repairs recorded in critical fail points 2 and 3, the machine is
duplicated and one is turned into a health message, the other returns for the next test.
The Test attribute of the machine that is used as a message is still set to the machine
subsystem which was tested, so in effect, a message is sent for each subsystem which
has developed a fault. These messages exit the module via the far right arrow, after
the display picture is changed to a red report.
5. The duplicated machine from 4 and any subsystems which do not have faults have
their Test attribute incremented ready for the next subsystem test and go via the arrow
pointing to the left in Figure 31, back to the decision module at 2.
6. After all subsystems in the machine have been tested, the module is unblocked to
allow the next machine to be tested.

94
B.4.3 Subsystem Compensation Sub Module
Figure 32 shows the subsystem compensation module.
Figure 32: Subsystem compensation sub module
1. A branch module uses the probabilities specified in the compensation table in the input
sheet to distribute the subsystems during simulation.
2. Each machine then enters another subsystem compensation module, which ages all
subsystems in the machine, and then ‘heals’ or compensates the subsystem which is
not being aged. The aging process is also changed so that the subsystem which is not
being aged does not affect the duration of the aging of the remaining subsystems
3. The probability that all subsystems will be aged is also included and used if the
compensation table is left blank. This is simply the normal aging process.

95
B.4.4 Quality Control Sub Module
Figure 33: Quality control sub module
In quality control, the output of machines is tested for good or bad quality. The three
quality systems on the machine decrease in quality performance as they reach the end of life.
This is similar to the wear out phase seen in the bath tub curve which characterises the
lifecycle reliability of many engineering components (Dhillon, 2007). The quality test in the
module takes the smallest remaining life of all the quality systems and sees if it is within 5% of
the remaining sub module life. If so, a random variable determines if poor quality is produced.
This increases as the remaining life decreases. Poor quality and good quality are recorded
and displayed in the interface. The machine then proceeds to Scheduling and prognostics.
B.4.5 Scheduling and Prognostics Sub Module
Figure 34: Scheduling and prognostics logic
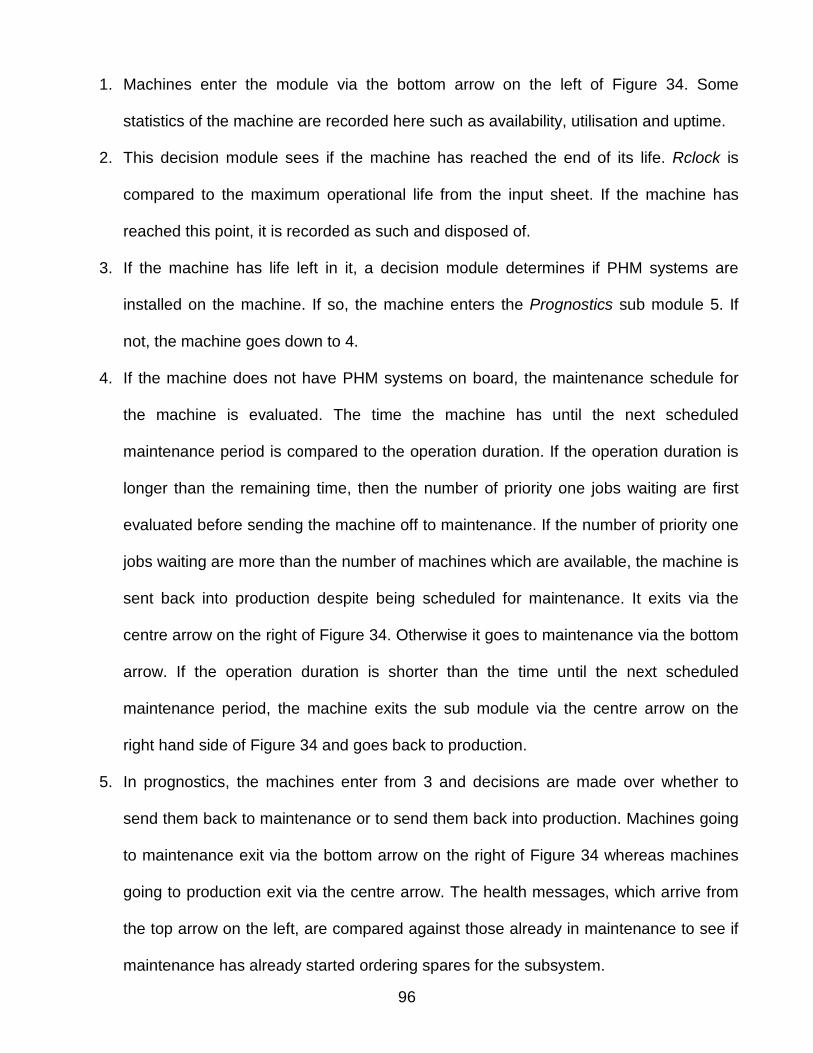
96
1. Machines enter the module via the bottom arrow on the left of Figure 34. Some
statistics of the machine are recorded here such as availability, utilisation and uptime.
2. This decision module sees if the machine has reached the end of its life. Rclock is
compared to the maximum operational life from the input sheet. If the machine has
reached this point, it is recorded as such and disposed of.
3. If the machine has life left in it, a decision module determines if PHM systems are
installed on the machine. If so, the machine enters the Prognostics sub module 5. If
not, the machine goes down to 4.
4. If the machine does not have PHM systems on board, the maintenance schedule for
the machine is evaluated. The time the machine has until the next scheduled
maintenance period is compared to the operation duration. If the operation duration is
longer than the remaining time, then the number of priority one jobs waiting are first
evaluated before sending the machine off to maintenance. If the number of priority one
jobs waiting are more than the number of machines which are available, the machine is
sent back into production despite being scheduled for maintenance. It exits via the
centre arrow on the right of Figure 34. Otherwise it goes to maintenance via the bottom
arrow. If the operation duration is shorter than the time until the next scheduled
maintenance period, the machine exits the sub module via the centre arrow on the
right hand side of Figure 34 and goes back to production.
5. In prognostics, the machines enter from 3 and decisions are made over whether to
send them back to maintenance or to send them back into production. Machines going
to maintenance exit via the bottom arrow on the right of Figure 34 whereas machines
going to production exit via the centre arrow. The health messages, which arrive from
the top arrow on the left, are compared against those already in maintenance to see if
maintenance has already started ordering spares for the subsystem.

97
B.4.6 Prognostics Sub Module
Figure 35: Prognostics logic
1. The machines enter via the bottom arrow on the left of Figure 35 and go into the
Remaining life test sub module. Here, Rclock is compared to the maintenance flag of
each subsystem, which is set in the input sheet. If the Rclock is greater than the
maintenance flag, then the machine is sent to maintenance via the bottom arrow on the
right in Figure 35. If Rclock is less than the maintenance flag, then the machine tool is
evaluated for scheduled maintenance.
2. The machine maintenance schedule is evaluated in a similar manner to that conducted
in the Scheduling and prognostics sub module. The time the machine has until the next
scheduled maintenance period is compared to the operation duration. If the operation
duration is longer than the remaining time, the machine is scheduled for maintenance
and goes to 3. If the operation duration is shorter than the time until the next scheduled
maintenance period, the machine exits the sub module via the centre arrow on the
right hand side of Figure 34 and goes back to production.

98
3. The number of priority one jobs waiting are evaluated before sending the machine for
the scheduled maintenance. If the number of priority one jobs waiting for machines are
more than the number of machines which are available, the machine is sent back into
production despite being scheduled for maintenance. It exits via the centre arrow on
the right of Figure 34. Otherwise it goes to maintenance via the bottom arrow.
4. Health messages, which have come from the Operation sub module, are evaluated to
see if maintenance is already processing orders for that machine subsystem. If so, the
message is deleted. If not, the message goes to maintenance.
B.5 Maintenance
Figure 36: Maintenance
1. Machines enter maintenance via the top left arrow in Figure 36. Machines which have
broken down during operation are red, whereas machines which have been sent to
maintenance before breakdown are blue. The Test attribute is set to 1, ready for the
first subsystem test. The number of subsystem repairs are also reset, as they are
either determined in maintenance or from health messages.

99
2. The fault messages enter the Maintenance sub module via the bottom arrow on the left
of Figure 36 and machines continue from 1. In Maintenance, machines are repaired
and spares are stored. There are 3 sub modules within Maintenance and include No.
repairs, Parts planning and repairs, and Scheduled maintenance.
3. After being repaired, machines have their uptime statistics updated and the picture is
changed back into a blue healthy machine.
B.5.1 No. Repairs Sub Module
Figure 37: No. Repairs logic
The No. repairs sub module is where the machine is actually repaired. A lot of the design is
legacy of SHOAM, but with some modification.
1. Machines enter from the left of Figure 37 and exit on the right. When they enter, the
first decision module recognises that no machine subsystems have been tested yet.
The Test attribute is used again and is incremented for each machine subsystem that
is being tested. When Test is greater than the number of subsystems, this decision
module recognises that all subsystems on the machine have been tested, and the
machine goes to 7.

100
2. When all subsystems have not been tested, the machine enters a branch block, which
decides if any faults on the machine were detected in operation. If so, the Critical fail
point 3 attribute, will have a value in it which was defined in the Fault monitoring sub
module in Operation. The machine is then sent to 3. If the critical fail point 3 attribute
has no value in it, then the subsystem must be checked to see if faults have occurred
and the machine goes to 5.
3. The value in critical fail point 3 is the value of the next MTBF of the subsystem and was
assigned in the fault monitoring sub module. This is assigned to critical fail point 1 of
the subsystem as the new fail point and the machine subsystem is repaired. The value
in critical fail point 2 was also assigned during fault monitoring and is a record of the
number of times the MTBF had to be added to critical fail point 3 to get the subsystem
healthy again. This value is assigned to the No. subsystem repairs attribute and is
used later to assign spares. The Test attribute is also incremented so that the next
subsystem may be tested. The next branch block looks to see if the P-F interval of the
subsystem is greater than 0 if so, this means that the fault was recorded using PHM
systems and the machine goes to 4. If not, the machine goes back to 1 for the next
subsystem test.
4. The failures were successfully recorded during fault monitoring and this data is used
for the PHM learning capabilities. A new P-F interval is assigned which is slightly
longer than before, depending on the learning coefficient, defined in the input sheet.
The standard deviation of the P-F interval is also reduced by a factor of the learning
coefficient, which increases the accuracy of the P-F interval estimate. The machine
then returns to 1 to have the next subsystem checked.
5. If faults were not detected using the PHM systems a fault has been detected and
critical fail point 2, is incremented by one.

101
6. Similar to the method used for critical fail point 3, the subsystem critical fail point 1 has
MTBFs added to its health is above that needed to return to work. The subsystem has
been repaired. Each time an MTBF is added to critical fail point 1, critical failpoint 2 is
incremented, recording the need for another repair. When the value of critical fail point
1 is above that which is required to continue working, the number of subsystem repairs
is recorded and the Test attribute is incremented ready for the next test.
7. When all subsystems have been tested, the Test attribute is reset to 1 and the
machine exist the submodule.
B.5.2 Parts, Planning and Repairs Sub Module
The Parts, planning and repairs sub module is large and has been divided up into
several parts leading from the left, where machines and messages enter, to the right, where
they exit. It should be noted that machines have already been repaired in the No. repairs
module. Here, there the maintenance delay and the spares consumption are modelled.
Figure 38: Parts, planning and repairs logic part 1
1. Machines enter having been through the No. repairs module. Each machine is blocked
on entry so that only one machine is treated at any one time. This does not mean that

102
machines go through a delay until maintenance is cleared, because blockages in arena
use a global variable to make up the time difference. Resources permitting then,
multiple machines can be maintained at once. After a machine is released from the
block, the Test value is reset to one for the first subsystem test.
2. The branch block decides if all machine subsystems have been tested by comparing
the Test attribute, which is incremented as subsystems are tested, with the number of
subsystems in the machine. If all subsystems have been tested, the machine exits via
3. If not, the machine goes to 4.
3. When all subsystems have been tested, the next machine which is ready for
maintenance is unblocked in 1. The original proceeds to 17, to wait for all the
subsystem repairs to be carried out.
4. If a subsystem requires maintenance, the absolute value of the Critical fail point 2
attribute, which records the number of subsystem repairs required for that subsystem,
will have a value which is greater than 1. The absolute value is taken because the
number of repairs stored in critical fail point 2 will be negative if the failure was
detected in the fault monitoring module. If the subsystem requires maintenance, this
branch block duplicates the machine, sending one machine to 6, the other to 5. In
effect, a new machine is generated for each subsystem which requires repairs. These
are combined later with original machine at 17. If the subsystem does not require
maintenance, it is not duplicated and continues to 5.
5. The Test attribute for the subsystem is incremented ready for the next subsystem test
and the machine returns to 2.
6. The subsystem requires maintenance and so has a unique maintenance number
attached to it so that it can be distinguished from all the other repairs which may be
going on. The machine then continues to 7.

103
Figure 39: Parts, planning and repairs logic part 2
7. The decision model sees if the fault was discovered using fault monitoring by looking at
the critical fail point 2 again. If so, then the message will have been sent ahead of the
machine and will be either waiting for it with spares ready, in the process of ordering
spares in which case the machine will have to wait, or the message will be ambiguous
and cannot. If the critical fail point 2 holds a negative value, then the machine proceeds
to 8. If not, it goes to 10.
8. Fault messages which are ambiguous will not be used to order spares, so the machine
will have to wait for them to arrive. In the Check ambiguous messages module, the
fault messages which are ambiguous will be waiting for the machine to enter
maintenance. The machine is matched to the right message and the message is
deleted. The machine is then treated as if no fault forwarding messages existed and
proceeds to 10. Machines whose messages were not ambiguous proceed to 9.
9. Machines wait for the spares and messages to arrive. Once matched, they proceed to
15. The messages proceed to 16.
10.Faults which were not detected using prognostics arrive from 7 or 8 and must have
their spares collected here in maintenance. The machine is duplicated with one being

104
used to collect parts, the other goes to 9 and waits with the other machines for the
parts to arrive.
11.The duplicated machines or ambiguous messages from 8 are turned into a yellow
report picture signifying that the spares collection has not been done using PHM
systems. The messages then proceed to 12.
12.Here spares are ordered and managed. If spares are available, they are reserved on
the shelf in the Parts store and the message proceeds to 9 where the machine is
waiting. If no spares are available, the message is used to order spares and wait for
them to arrive. The delay is the delivery time for that subsystem, which is specified in
the input sheet. The spare arrives at the Parts store and is reserved on the shelf. The
minimum parts delay which is specified in the input sheet is the time it takes to get the
spare from the shelf to the machine. The message then proceeds to 9 where the
machine is waiting. If fault was detected using PHM systems, it is assumed that the
fault will already have been diagnosed. If not, then a delay is incurred in 12 to model
the fault diagnostic period. The duration of this period is defined in the input sheet.
13.Messages enter via the bottom left of Figure 39. First the message is tested for
ambiguity. The probability that a message is ambiguous is specified in the input sheet
for each subsystem. If the message is ambiguous it proceeds to 8 and waits for the
machine. If not, it proceeds straight to 12 to reserve the spares the machine will
require.
14. In the Parts store sub module, spare parts are held for each subsystem. Statistics on
the spares are kept and displayed on the interface including the average stocks
available and the total spares consumed. A scheduling system also orders in parts
according to the minimum level of spares specified in the input sheet. Every time this
occurs, it records this as a stock check and displays it in the interface.

105
Figure 40: Parts, planning and repairs logic part 3
15.Once machines are matched successfully with their spares, they are repaired. Here,
Engineer resources are used according to the required number specified in the input
sheet for that subsystem and undergo a delay according to the MTTR of the
subsystem, also specified in the input sheet. Once repaired, they proceed to 17.
16.The messages which have the spares reserved for the machines now relinquish the
reserve and a spare is deducted from the shelf. This allows the whole time which the
spare has been waiting in the store to be modelled accurately, if the parts are ordered
ahead. The messages are then disposed of.
17.Every time a subsystem fault was detected, the machine was duplicated so that the
subsystem could be used for repairs and to order spares. Now all the duplicates are
combined with the original machine, which was waiting here. Once combined, the
machine proceeds to 18.
18.Machines which have engineers on site do not need to wait for the engineers to
respond to the breakdowns as they are already there. If the machine does not have an
engineer on site, it must undergo a delay, which represents the response time of
engineers to breakdowns. Once Engineer response has been modelled, the machine

106
exits the Parts, planning and repairs sub module and continues to the Scheduled
maintenance sub module
B.5.3 Scheduled Maintenance Sub Module
Figure 41: Scheduled maintenance logic
1. After machines have left the Parts, planning and repairs sub module and enter the
Scheduled maintenance sub module, the critical fail point 2 attribute for each
subsystem of the machine is reset. Critical fail point 2 records the number of repairs
which were required for that subsystem and the default value is 1.The number of
subsystem repairs and critical reserve attributes are also reset to their default values.
2. The maintenance schedule is then evaluated to see if the repairs, which the machine
just underwent, are to be modelled as part of a scheduled maintenance period or not. If
the time until the next scheduled maintenance period is less than the operation
duration, then the machine goes into the scheduled maintenance. If not the machine
exits maintenance via the arrow on the right of Figure 41 and continues back to
production.
3. Depending on which maintenance period the machine is in, it goes to either a full
service or just the inspection. The machine also undergoes a delay which is

107
representative of the scheduled maintenance action that is taking place. This delay is
specified in the input sheet. The machine then proceeds to 4.
4. Here, the next maintenance schedule for this particular action is assigned. The
machine then exits via the arrow on the left of Figure 41 and returns to the
manufacturing system.

108
APPENDIX C: SUBSYSTEM SPECIFICATION
C.1 Subsystem Design
It was expected that the reliability characteristics of machine tool subsystems could be
sampled from actual data of advanced machine tool failure modes and rates. This has not
been possible however, so example subsystems are determined instead from information
from interviews with machine manufacturers and other academic resources. The machine
reliability characteristics may not be realistic which prevents effective validation; but this
should not affect the usefulness of the model itself for analysing machine performance and
services, as the benefits from CBM/PHM and different service designs on the performance of
a machine can still be evaluated. The data for specific machines can be entered into the
model by manufacturers from historical or reliability data where available.
Typical subsystems found in many metal cutting machine tools are selected, which are
described in Table 5, as are the reliability and maintenance characteristics of each. The three
subsystem characteristics include the characteristic reliability distribution, mean time between
failures (MTBF) and mean time to repair (MTTR). NCMT perform a basic maintenance and
inspection of components with known reliabilities of around 2000 hrs which includes oil filters
and some consumables such as lubricant. This service takes around a day. A more thorough
maintenance and service is performed every 6 months on components which have reliabilities
ranging between 4000 to 5000hrs and includes the motion components and the spindle
condition is checked again. This type of service can take up to three days. This data may be
used as to estimate the MTBFs of components and some variability is included to introduce
uncertainty. The reliability distribution however, cannot be inferred and a suitable substitute is
determined in discussion with machine researchers at the university.

109
Table 5: Nine machine tool subsystem
Subsystem DescriptionReliability
distributionMTBF (hrs) MTTR (hrs)
Spindle
Provides mainrotational force on
either the work pieceor the tool
Exponential 6000 16
Power supply
External source ofpower to machine
components includingthe controller and
motors
Uniform 5000 4
CNC controllerControls the machine
functions via acomputer
Uniform 5000 4
Lubrication systemMaintains lubricating
fluidLognormal 3000 3
Oil filtersMaintain the purity of
the machine oilLognormal 2000 1
Motor bearings
Ensure smoothrotation of motors and
absorb some of theloads generatedduring process
Exponential 4000 16
X motion system
Y motion system
Control the motion ofthe tool in the work
envelope andtherefore impact thequality of the finished
product
Exponential 4000 6
Rotary table
Rotates the workpiece in an axis and
also impacts theproduct quality.
Uniform 4000 6
C.2 Removal of Type II Failures
SHOAM characterises the failure of each subsystem by two failure modes. Each flight
is divided into two halves. Failure mode type I affects the first half of the flight, and type II
failure modes only affect the second half of the flight. If the aircraft fails during the first half of
the flight, it returns to the original location and the flight is considered as a failure. If it makes it
past the first half of a flight, then the aircraft will always complete the second half and the

110
flight is considered a success. It makes no difference if a subsystem fails via the type II failure
mode during the first half or the second and only maintenance resources will be required.
Prognostics are therefore only used on type I failure modes since it is only these which can
affect the operational performance of an aircraft. Indeed, a plane may fly repeatedly in
SHOAM having all subsystems failed via the type II failure mode. The modification to a
machine tool means removing the two ‘halves’ of an operation and reducing it to one. It also
means removing the second failure mode as this is an unsatisfactory way of characterising
failures. Only type I failure modes remain, characterised by the MTBF in Table 5
C.3 Improvement in Modelling PHM Systems
The reduction to just a single operation instead of two halves allows more variability for
manufacturing environments, as the duration of each operation may now model a complete
shift or a single operation. The response of prognostics and health management systems to
these changes can also be simulated as they will alter the system behaviour for the duration
of the shift or operation and not just the first half. In order to allow this however, fundamental
changes to the way fault forwarding and PHM are modelled had to be made. Fault forwarding
in SHOAM can only be used to order spares and maintenance during a single flight. The
benefits of using these systems mean that the maintenance resources can be ordered ahead
of the aircraft landing, and the reduced waiting time is that of the aircraft completing the flight.
In the modified model, operation durations may be much shorter, for example only an hour.
The benefits of using PHM systems will be entirely reduced then, if spares can only be
ordered before the machine completes a single job as only one hour will be saved. If spares
take 24 hours to arrive, any benefit of using fault forwarding is almost entirely wiped out.
To introduce greater flexibility the maintenance flag is introduced allowing spares to be
ordered ahead whilst the machine continues to perform operations (see §6.7). If an operation

111
happens to be only one hour long and a fault is detected during that operation, spares and
maintenance can be ordered using fault forwarding, whilst the machine continues with more
operations. This also reflects machine tool CBM more, because diagnosing the remaining life
of a machine tool component is often done separately to the machine using data collected
from the machine interface and the results sent to the customer with which they make
decisions over when the best time to perform maintenance will be.

112
APPENDIX D: INPUT SHEET DATA
The data which can be used to design a complete model simulation is entered in
the model input sheet and a list is given below. Not all fields need to be used and the
amount depends on the level of detail that the analyst wishes to model.
Key information:
(All times are in specified as hours)
Cell start size: The number of machines in the cell at the beginning of the simulation
Cell start time: ‘Delay time’ for machine delivery
PHM%: Percentage of machines in the cell which have PHM systems
Knowledge coefficient: learning capabilities of fault diagnostics
Parts delay: Time locate and retrieve part from the parts store
% with EOS: % of machines in cell with engineer available on site
Engineer response time: Time for engineers to respond to breakdowns
Max number of operations: Maximum number generated by production control
Average operation duration: Can also be used for shifts lengths etc
Setup time: Time taken to setup machine
TPM: Total productive maintenance activities
Service life: Maximum life in operational hours
Normal load: Mean operations generated per day
Business cycle: Mean operations generated per day during business cycle period
Business cycle duration: Length of business cycle period
Priority mode: Controls distribution of job priority assignments
Scheduled maintenance interval: interval between scheduled maintenance activities
Scheduled maintenance time: Time for each maintenance activity
Engineers for scheduled maintenance: No. engineers required for each maintenance
activity
Subsystem Spares and Maintenance Flag:
Engineers for subsystem repairs: No. engineers required to repair the subsystem
Starting spares: No spares for subsystem in parts store at beginning of simulation
Minimum spares level: Minimum no. of spares to hold when using scheduled spares
management
Flag: The time that the machine will continue in operation after a fault is detected

113
Compensation (%): The probability that the subsystem will not be used during an
operation. The column must not total over 100% and if all fields are 0 then all subsystems
will be aged the same.
Subsystem Tables:
(Distribution, key and P values correspond to Arena distribution table)
MTTR: Mean time to repair subsystem
MTBF: Mean time between subsystem failure
P-F interval: ‘Point-of-failure’ interval is the time between fault detection and failure
Prognostic coverage: The percentage of machines with PHM systems for this subsystem.
Defines the probability that the prognostic systems will be able to prevent catastrophic
failure
Delivery time for parts: Variability in delivery times for subsystem part
Message ambiguity: The probability that a message will be ambiguous
Diagnostic Time: Time to diagnose sub system fault if PHM are not used

114
APPENDIX E: SERVICE EVALUATION & SENSITIVITY ANALYSIS
The use of the model to evaluate service contracts for machine tools in service
arrangements is then given. More of the features in the model are then tested and the
sensitivity analysed.
E.1 Single Machine Cell
For comparison with the 10 machine cell in chapter 7, a single machine cell and a
three machine cell are compared against the four service contracts defined in Table 4.
Figure 42 shows the reduction in machine tool downtime under each service contract for a
single machine cell. The figure shows the time each machine spends in maintenance
when a breakdown occurs.
0
5
10
15
20
25
30
35
Contract 1 Contract 2 Contract 3 Contract 4
Tim
ein
main
tenance
Figure 42: Single machine cell downtime
Figure 43 shows the improvements to availability realised by the reduction to machine tool
downtime. Despite the increased machine downtime over contract 3, contract 4 uses CBM

115
which means that unnecessary maintenance is minimised and the total time in
maintenance over the lifecycle of the machine is reduced. This results in improved
availability of the machine seen in Figure 43.
88
89
90
91
92
93
94
95
96
Contract 1 Contract 2 Contract 3 Contract 4
Perf
orm
ance
(%)
Availability Quality
Figure 43: Single cell availability and quality
Figure 44 shows the annual output of the machine under each service contract. As
was seen in chapter 7, the improvement in output is not spectacular. The utilisation of the
machine reaches only 84%, which is the reason why improved output does not correspond
with the improved availability.

116
620
630
640
650
660
670
680
690
700
710
720
Contract 1 Contract 2 Contract 3 Contract 4
Pro
ducts
Total output Quality
Figure 44: Single cell productivity
Figure 45 shows the cost of each contract for each of the services provided. There are
clearly economies of scale between the single cell scenario and the ten machine scenario
from Chapter 7. The spares store in the ten machine scenario means that the cost of
maintenance resources such as spares and engineers are distributed among the ten
machines.

117
0%
100%
200%
300%
400%
500%
600%
700%
800%
Contract 1 Contract 2 Contract 3 Contract 4
Costin
cre
ase
Figure 45: Single cell lifecycle cost
E.2 Three Machine Cell
The three machine cell performs similar to the single machine, but with reduced
costs for contracts 3 and 4 due to the economies of scale.
Table 6: Three machine cell test results for each contract
Contract Availability QualityAnnual no.
breakdowns
Annualproductivity
(jobs)
Averagemachine
downtime(hrs)
Lifecyclecosts
1 89% 92% 63 2052 30 100%
2 91% 92% 64 2079 29 178%
3 96% 92% 61 2098 7 333%
4 96% 94% 19 2145 12 77%

118
E.3 Sensitivity Analysis
Some of the other modelling features which have not been used in the service
analysis, but which can be add value for service planners, are given below. A single
machine is used for testing and each result is a separate experimental run of the model.
Figure 46 below for example, demonstrates 11 different experiments with only one variable
being altered.
E.4 P-F Interval
The P-F interval is the time at which a fault or potential failure is detected before the
failure occurs. As Figure 46 demonstrates, the earlier that a fault can be detected, then the
greater the probability that a breakdown can be prevented.
Figure 46: Impact of extending the P-F interval on breakdowns
Figure 46 shows the P-F interval as a proportion of the operation duration, because
catastrophic failures (breakdowns) can only occur during an operation. The figure also
0
5
10
15
20
25
0% 13% 25% 38% 50% 63% 75% 88% 100% 113% 125%
P-F interval as a proportion of operation duration
No. breakdowns

119
shows that due to the inherent uncertainty in component reliability, breakdowns can rarely
be fully prevented.
E.5 Maintenance Flag
86
88
90
92
94
96
98
0 10 20 30 40 50
Maintenance flag (hrs)
Perf
orm
ance
(%)
Availability Quality
Figure 47: Maintenance flag
When a fault is detected during a flight in SHOAM the plane enters maintenance as
soon as it completes the flight. This is changed for industrial equipment to allow the
analyst to decide the optimal time to perform maintenance. The maintenance flag is
introduced to allow a differentiation between the detection of a failure and the maintenance
action. Upon detection of a fault, spares and resources are ordered from maintenance
whilst the machine continues in operation for the duration of time specified by the
maintenance flag. Figure 47 shows the impact of the maintenance flag on the
manufacturing performance in terms of quality and availability. The longer the
maintenance flag is set, the longer the machine spends in operation. This increases

120
availability, but after a certain point, reduces quality performance as the faults interfere
with the operation of the machine and the risk of breakdown goes up. Depending on the
effectiveness of the machine desired, the analyst can optimise the maintenance flag.
Another effect of the flag is the impact on spares levels. If the flag is set very late, spares
are ordered early which increases inventory costs.
E.6 Message Ambiguity
89
90
91
92
93
94
95
96
0 10 20 30 40 50 60 70 80 90 100
Message ambiguity (%)
Availa
bility
(%)
Figure 48: Impact of message ambiguity on availability
Another feature from SHOAM is the ability to analyse the impact of fault detection
system efficiency. If a fault detection system sends an ambiguous fault message, the
procedure of analysing the fault and ordering parts must take place in maintenance, which
reduces the availability of the machine (Figure 48) due to the increased downtime (Figure
49). A modification from SHOAM is the inclusion of a diagnosis period, in which a delay is
incurred in maintenance if a fault requires diagnosing. It is assumed that fault messages
which are not ambiguous will already have a diagnosis of the fault and this delay period is

121
not applied. Ambiguous messages and ordinary breakdowns will incur this delay period
which is specified for each subsystem in the diagnostic time table in the input sheet. A
lognormal distribution is chosen as it is assumed that an engineer will perform the
diagnosis.
0
5
10
15
20
25
30
35
40
45
50
0 10 20 30 40 50 60 70 80 90 100
Message ambiguity (%)
Tim
ein
main
tenance
(hrs
)
Figure 49: Impact of message ambiguity on average downtime
E.7 Subsystem Monitoring
Given the expense of CBM/PHM systems, manufacturers will want to maximise the
benefits gained from any investment and to minimise the risks involved. The model can be
used to analyse the benefits of monitoring particular subsystems so that the lifecycle costs
are minimised. Figure 50 shows the improvements in operational reliability (the number of
successful operations with no breakdown) over the lifecycle of a machine by monitoring
each subsystem. The improvements with each subsystem can be compared to the
subsystem MTBF and distribution, allowing those components of the highest risk to be
managed more effectively. Most improvement is achieved by monitoring the rotary table,

122
which has the same average MTBF as the X and Y motion systems, but a different
reliability distribution.
96.0%
96.5%
97.0%
97.5%
98.0%
98.5%
No
monitoring
Spindle Lube.
Pump
Motor B. X motion Y motion Rotary
table
Subsystem monitoring
Opera
tionalre
liabili
ty
Figure 50: Impact of monitoring different subsystems on operational reliability
E.8 Subsystem Compensation
The subsystem compensation modules are added to allow greater control over the
manufacturing environments in which the machines are used. All subsystems in SHOAM
age according to the duration of the flight. Machine tool subsystems however, can age
differently, depending on the material being processed, the geometric shape of the work
piece etc. The compensation module can therefore be used to simulate this uncertainty by
distributing operational harshness among the subsystems. Figure 51 shows the
predictable result of reducing the aging process of one subsystem on the total failures of
that system. The compensation table in the input sheet specifies the distribution of the
aging process in the environment. If the table is left blank, all subsystems are aged by the
operation duration.

123
0
5
10
15
20
25
30
35
40
45
50
0 10 20 30 40 50 60 70 80 90 100
Compensation (%)
Tota
loil
filte
rfa
ilure
s
Figure 51: Oil filter compensation
E.9 Long Term Scenario
Simulating long term business cycles or production cycles are necessary for
accurate analysis and optimisation of lifecycle performance and for reducing the risk in
lifecycle contracts. Figure 52 shows a long term cycle in which production orders increase
or ‘ramp up’ after the first year and drop down after the third. This may be used to model
the installation of machines at a new facility. This increases the demand on maintenance
resources after the first year as is shown by the increased consumption of spares.
Utilisation of the machine continues to go up after the third year because back orders
which accumulated during the ramp up phase must be cleared. Figure 52 also
demonstrates one of the modified output formats, which provides a breakdown of the
lifecycle performance into six month intervals.

124
0
1
2
3
4
5
6
7
8
9
10
0.5 1 1.5 2 2.5 3 3.5 4 4.5 5
Time (years)
No.
spare
s
0
10
20
30
40
50
60
70
80
Utilis
ation
(%)
No. Spares consumed Utilisation
Figure 52: Production ramp up scenario
E.10 Parts Store
In SHOAM, spares can be ordered using PHM systems or when the plane enters
maintenance. This is modified to allow spares to be ordered early and held in a store,
which is one service offered by machine suppliers. The minimum level of spares held in
the store is specified in the input sheet and the spares levels affect many elements in the
model. Figure 53 shows the impact of increasing the spares levels on machine availability.
Holding more spares means reducing the downtime spent in maintenance waiting for them
to be delivered.

125
89
90
91
92
93
94
95
96
0 10% 20% 30% 40% 50% 60% 70% 80% 90% 100% 110% 120% 130%
Spares increase
Availa
bili
ty(%
)
Figure 53: Impact of spares levels on availability
Holding more spares will push up inventory costs, but if the contract specifies the service
provider to pay for downtime, then the reduced time in maintenance (Figure 54) may
compensate for this increased cost. Some parts will also cost more than others and the
analyst can measure the benefits of holding a particular part before purchasing it.

126
0
5
10
15
20
25
30
35
010
%20
%30
%40
%50
%60
%70
%80
%90
%10
0%11
0%12
0%13
0%
Spares increase
Ave
rag
em
ain
ten
an
ce
tim
e
Figure 54: Impact of spares levels on downtime


![INTRODUCTION BARBARA [FARQUHARSON]: The Project has …](https://img.pdfslide.net/doc/110x75/628883449e26920697229a64/introduction-barbara-farquharson-the-project-has-.jpg)