Embed Size (px)
Citation preview
General Methodology
___________________________________________________________________________
___________________________________________________________________________
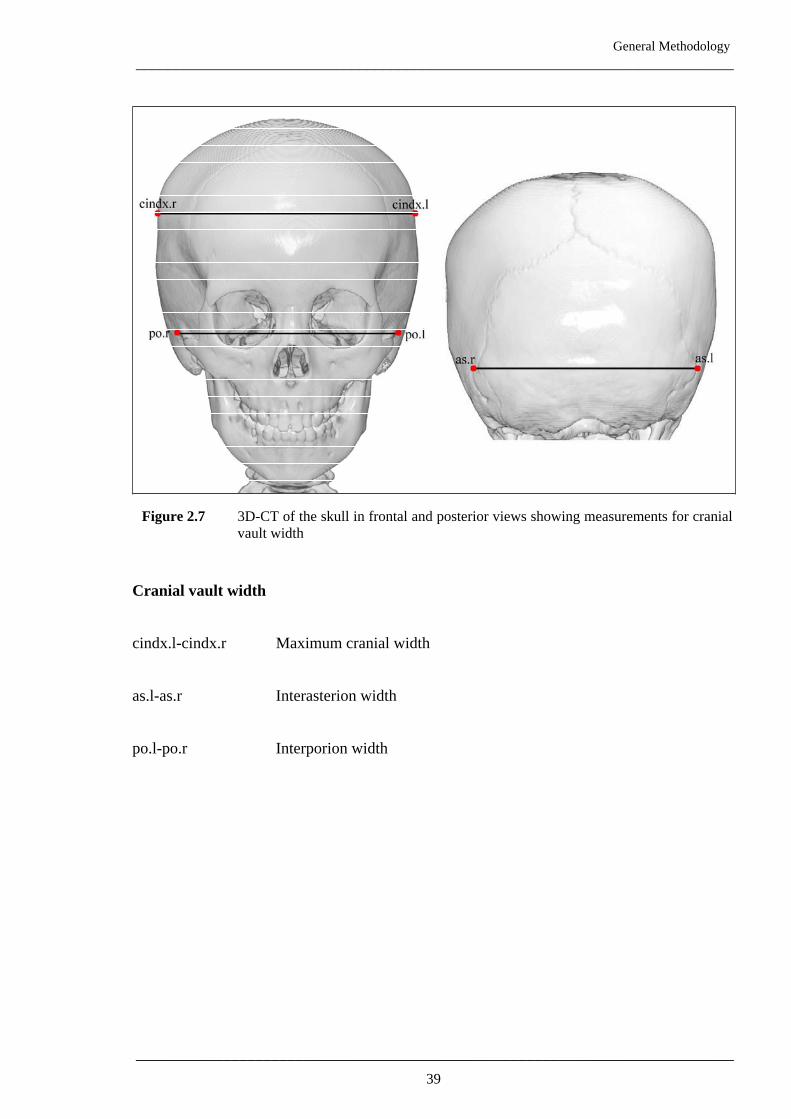
Figure 2.7 3D-CT of the skull in frontal and posterior views showing measurements for cranial
vault width
Cranial vault width
cindx.l-cindx.r Maximum cranial width
as.l-as.r Interasterion width
po.l-po.r Interporion width
39
General Methodology
___________________________________________________________________________
___________________________________________________________________________
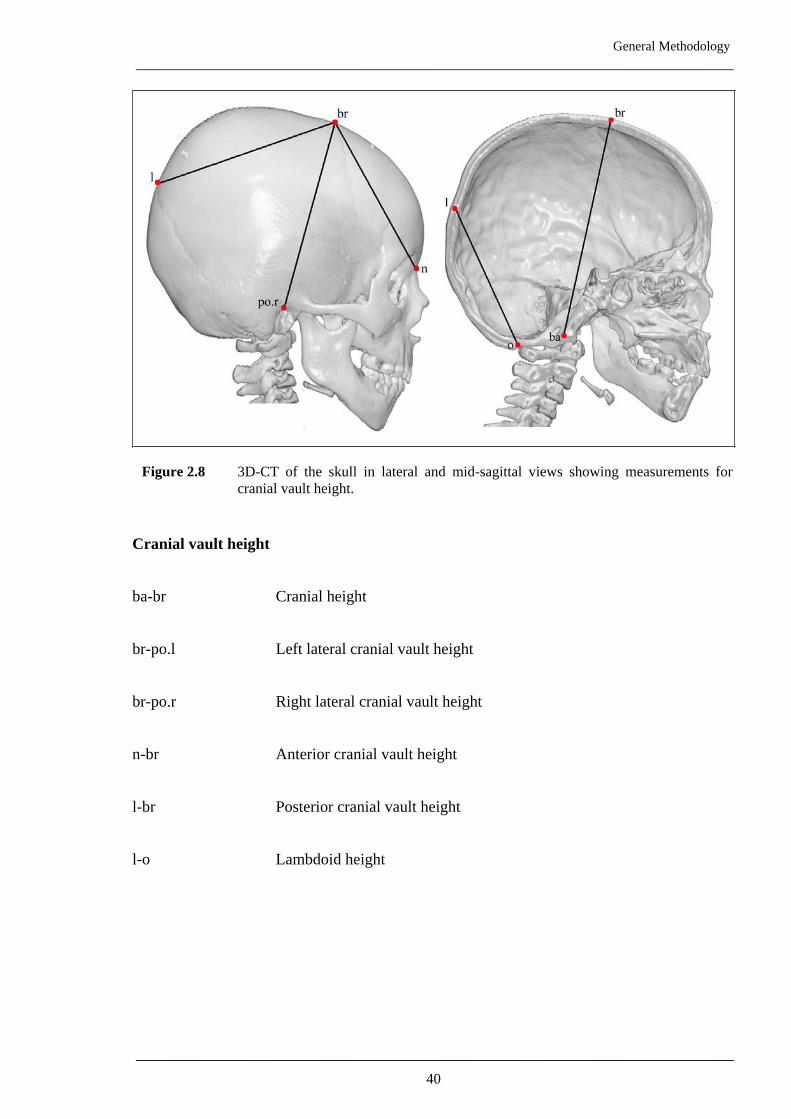
Figure 2.8 3D-CT of the skull in lateral and mid-sagittal views showing measurements for
cranial vault height.
Cranial vault height
ba-br Cranial height
br-po.l Left lateral cranial vault height
br-po.r Right lateral cranial vault height
n-br Anterior cranial vault height
l-br Posterior cranial vault height
l-o Lambdoid height
40
General Methodology
___________________________________________________________________________
___________________________________________________________________________
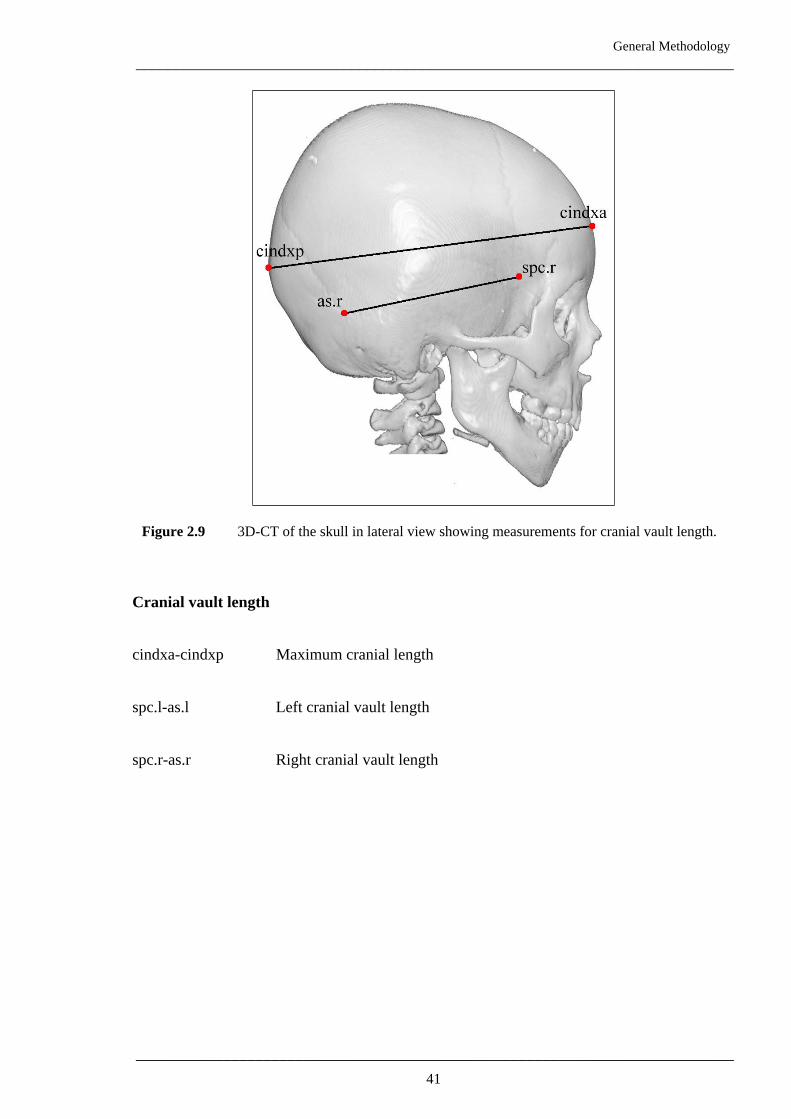
Figure 2.9 3D-CT of the skull in lateral view showing measurements for cranial vault length.
Cranial vault length
cindxa-cindxp Maximum cranial length
spc.l-as.l Left cranial vault length
spc.r-as.r Right cranial vault length
41
General Methodology
___________________________________________________________________________
___________________________________________________________________________
ss.l• •.r p
ss.r
pts ts.l• • ss.l• •.r p
ss.r
pts ts.l• •
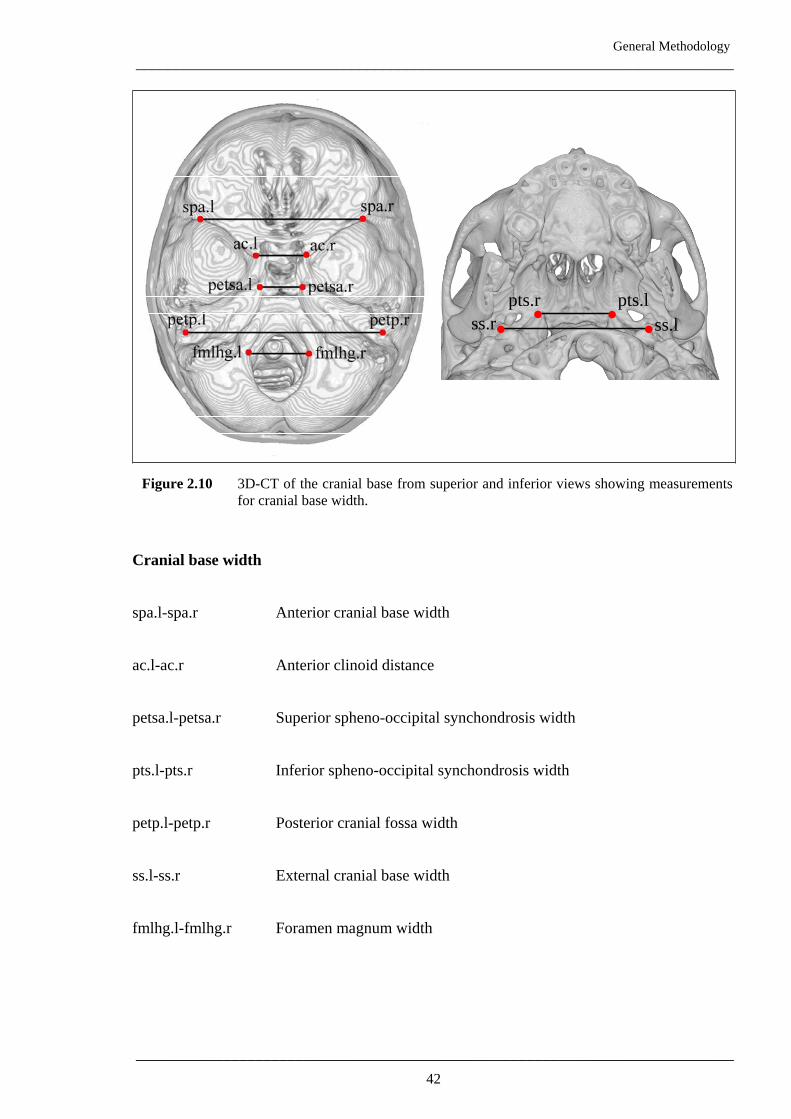
Figure 2.10 3D-CT of the cranial base from superior and inferior views showing measurements
for cranial base width.
Cranial base width
spa.l-spa.r Anterior cranial base width
ac.l-ac.r Anterior clinoid distance
petsa.l-petsa.r Superior spheno-occipital synchondrosis width
pts.l-pts.r Inferior spheno-occipital synchondrosis width
petp.l-petp.r Posterior cranial fossa width
ss.l-ss.r External cranial base width
fmlhg.l-fmlhg.r Foramen magnum width
42
General Methodology
___________________________________________________________________________
___________________________________________________________________________
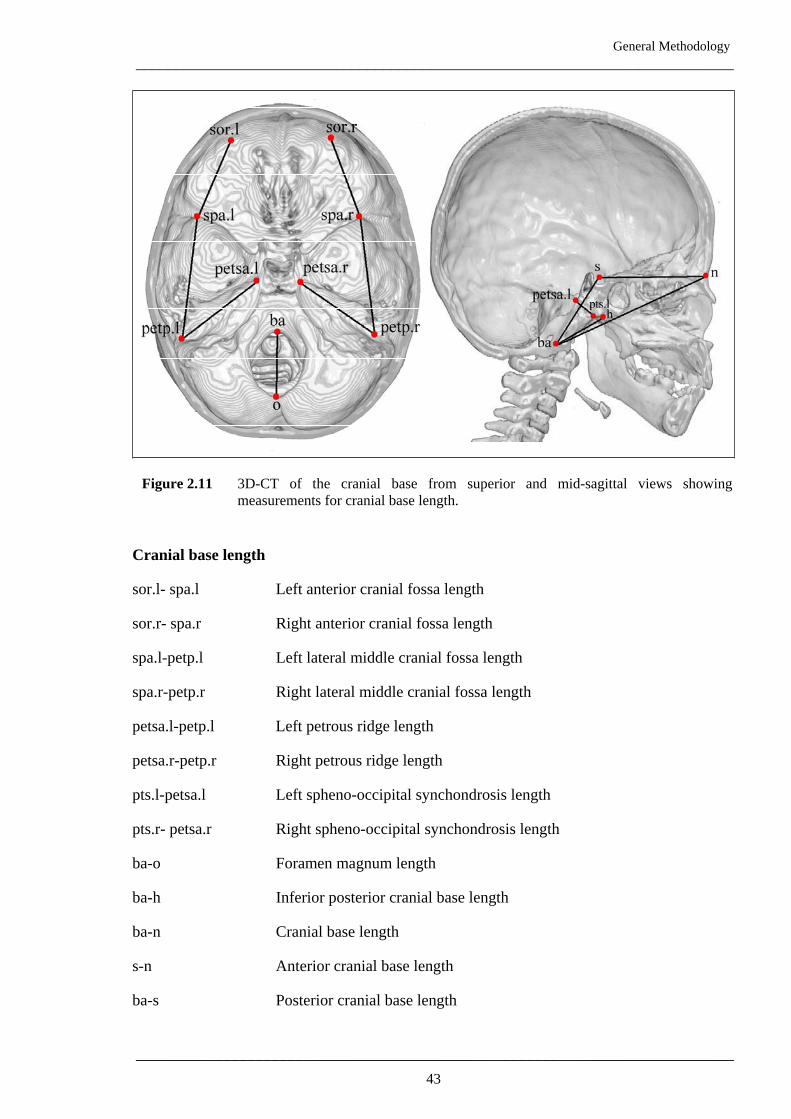
Figure 2.11 3D-CT of the cranial base from superior and mid-sagittal views showing
measurements for cranial base length.
Cranial base length
sor.l- spa.l Left anterior cranial fossa length
sor.r- spa.r Right anterior cranial fossa length
spa.l-petp.l Left lateral middle cranial fossa length
spa.r-petp.r Right lateral middle cranial fossa length
petsa.l-petp.l Left petrous ridge length
petsa.r-petp.r Right petrous ridge length
pts.l-petsa.l Left spheno-occipital synchondrosis length
pts.r- petsa.r Right spheno-occipital synchondrosis length
ba-o Foramen magnum length
ba-h Inferior posterior cranial base length
ba-n Cranial base length
s-n Anterior cranial base length
ba-s Posterior cranial base length
43
General Methodology
___________________________________________________________________________
___________________________________________________________________________
sor.r sor.l
or.l
m lor.lmorfl.r orfl.llor.r
ofa.lofa.r
•
••
••• •
••
•or.r
sor. sor.l
r.l
morfl r.llor
r
o
.r morfl.l lo.r
ofa.lofa.r
•
••
••• •
••
•or.r
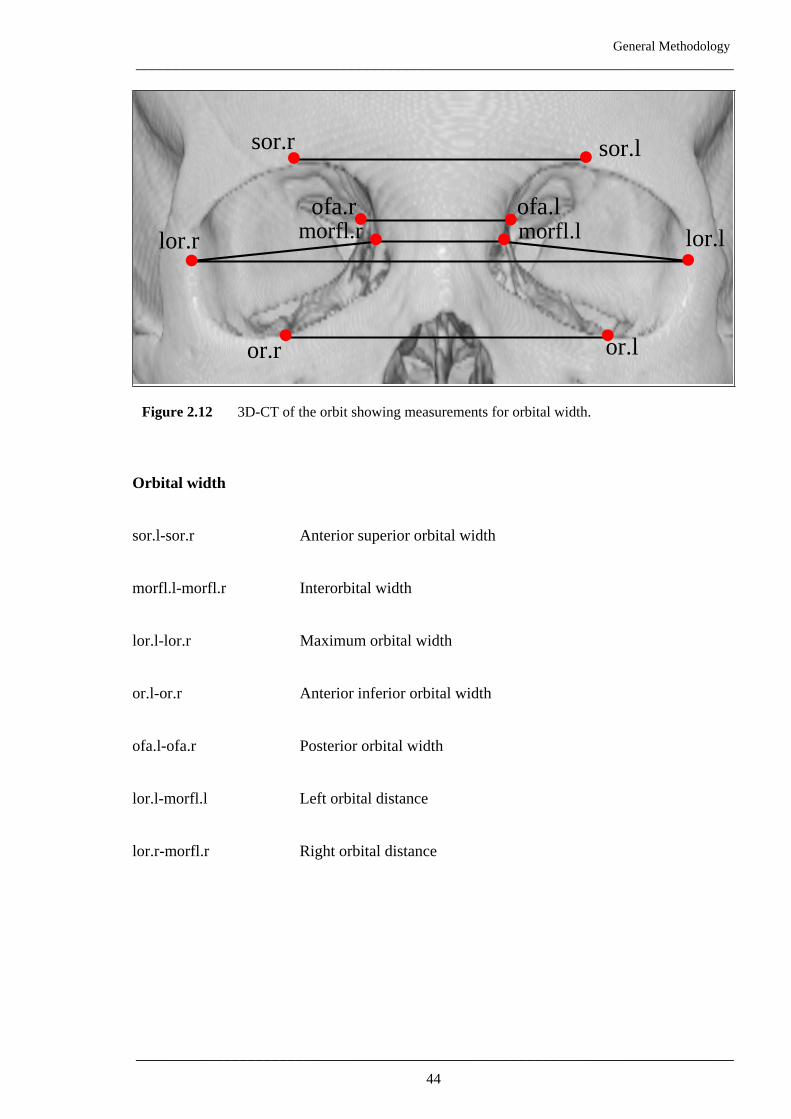
Figure 2.12 3D-CT of the orbit showing measurements for orbital width.
Orbital width
sor.l-sor.r Anterior superior orbital width
morfl.l-morfl.r Interorbital width
lor.l-lor.r Maximum orbital width
or.l-or.r Anterior inferior orbital width
ofa.l-ofa.r Posterior orbital width
lor.l-morfl.l Left orbital distance
lor.r-morfl.r Right orbital distance
44
General Methodology
___________________________________________________________________________
___________________________________________________________________________
sor.
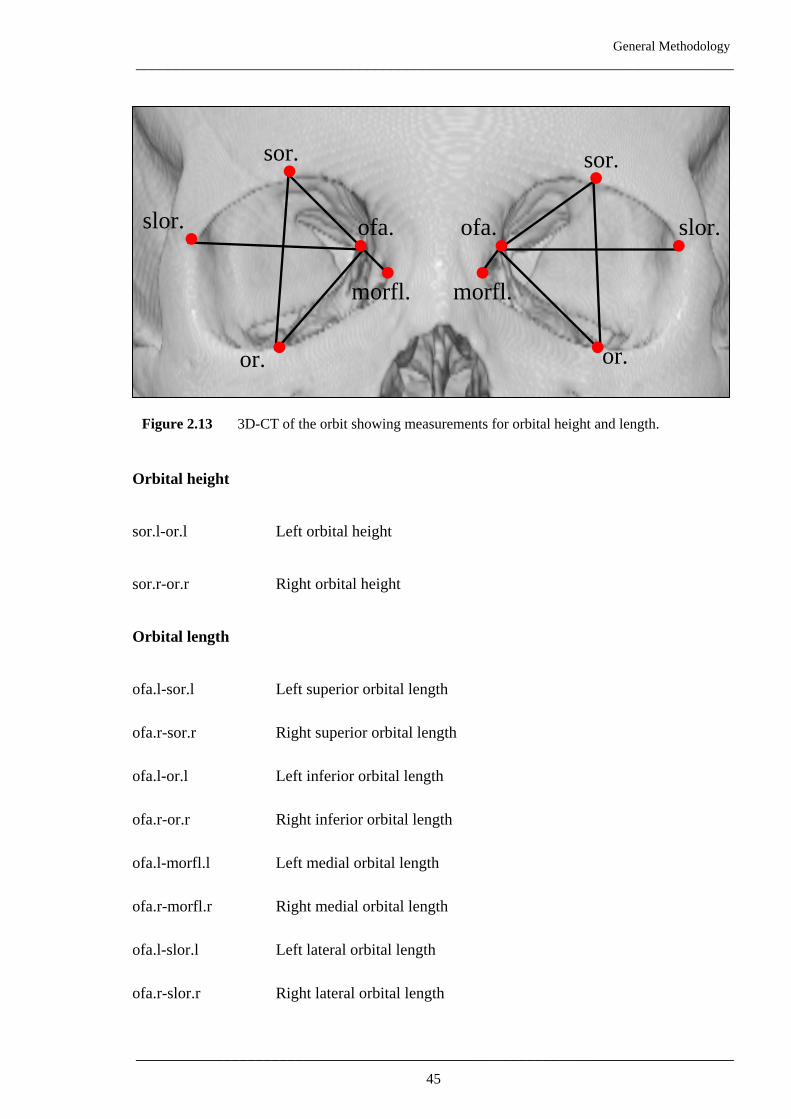
Orbital height
sor.l-or.l Left orbital height
sor.r-or.r Right orbital height
Orbital length
ofa.l-sor.l Left superior orbital length
ofa.r-sor.r Right superior orbital length
ofa.l-or.l Left inferior orbital length
ofa.r-or.r Right inferior orbital length
ofa.l-morfl.l Left medial orbital length
ofa.r-morfl.r Right medial orbital length
ofa.l-slor.l Left lateral orbital length
ofa.r-slor.r Right lateral orbital length
slor.
or.or.
sor.
slor.ofa.ofa.
morfl.morfl.
• •
• • • •• •
• •
Figure 2.13 3D-CT of the orbit showing measurements for orbital height and length.
45
General Methodology
___________________________________________________________________________
___________________________________________________________________________
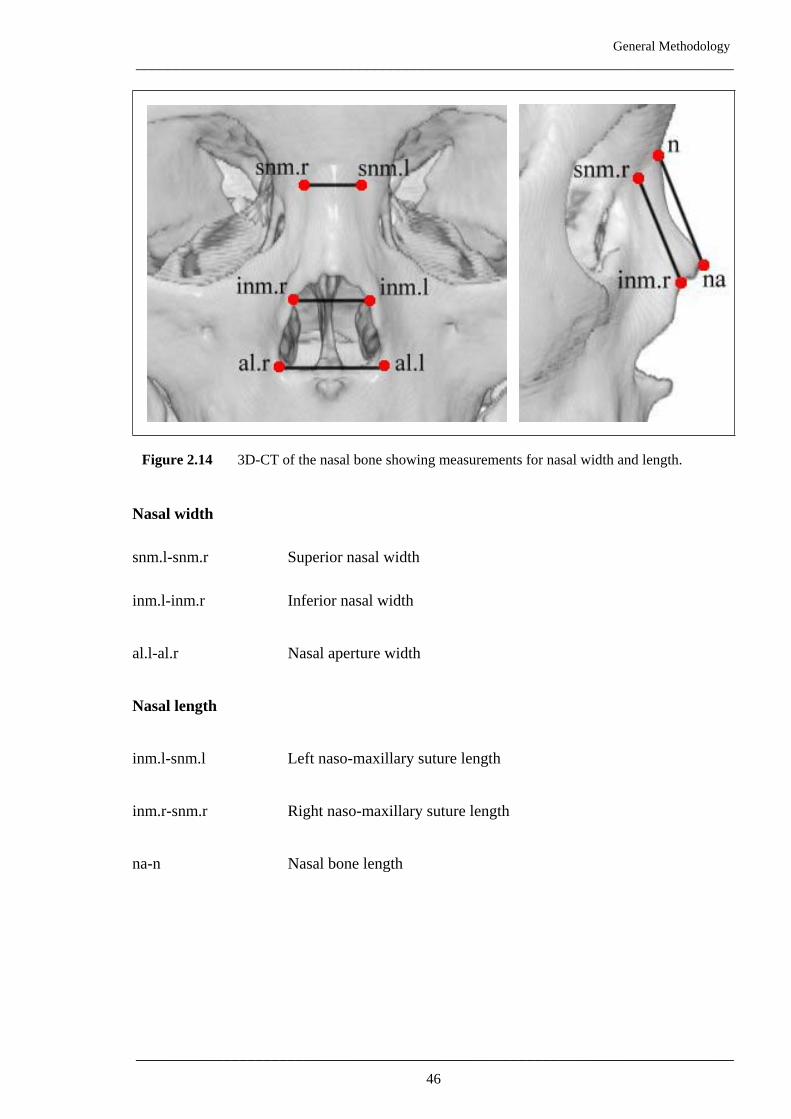
Figure 2.14 3D-CT of the nasal bone showing measurements for nasal width and length.
Nasal width
snm.l-snm.r Superior nasal width
inm.l-inm.r Inferior nasal width
al.l-al.r Nasal aperture width
Nasal length
inm.l-snm.l Left naso-maxillary suture length
inm.r-snm.r Right naso-maxillary suture length
na-n Nasal bone length
46
General Methodology
___________________________________________________________________________
___________________________________________________________________________
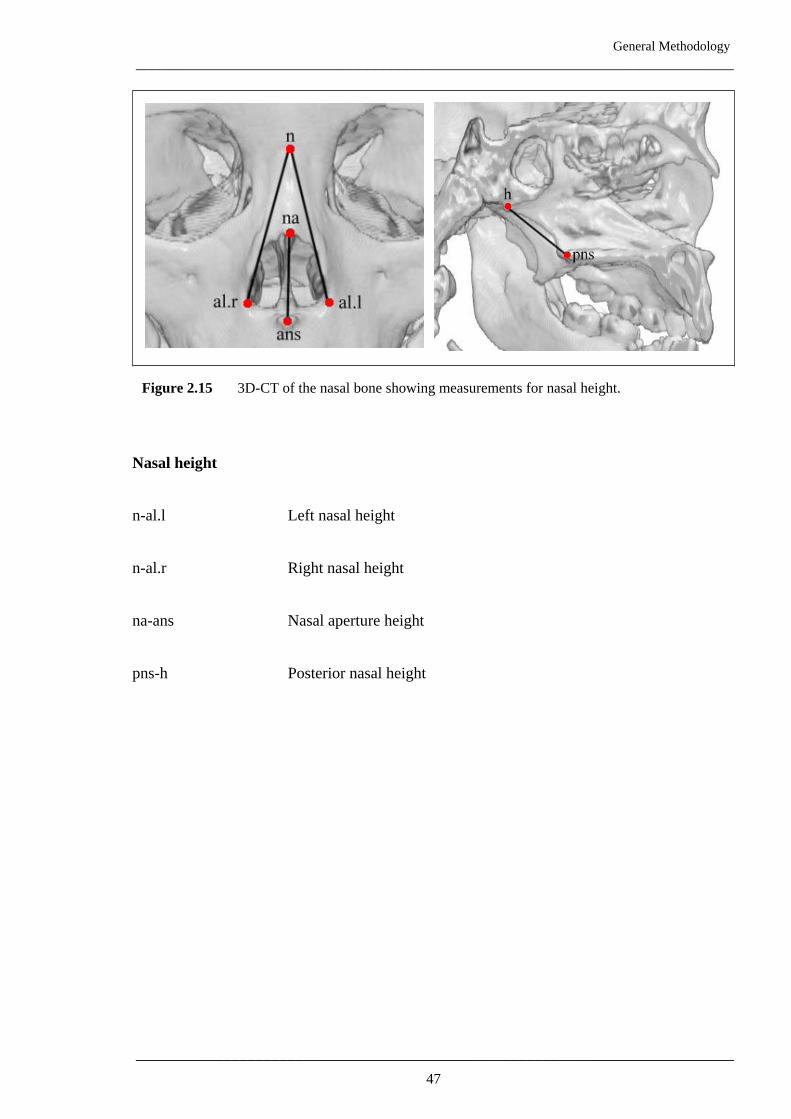
Figure 2.15 3D-CT of the nasal bone showing measurements for nasal height.
Nasal height
n-al.l Left nasal height
n-al.r Right nasal height
na-ans Nasal aperture height
pns-h Posterior nasal height
47
General Methodology
___________________________________________________________________________
___________________________________________________________________________
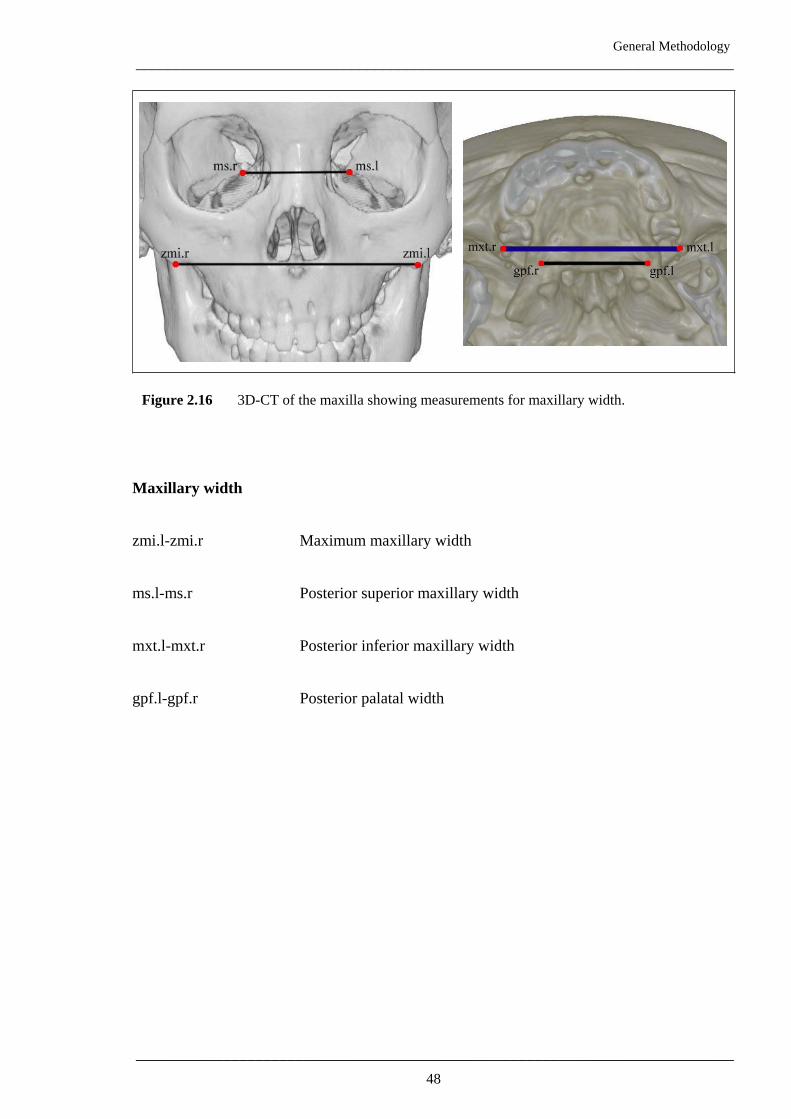
Figure 2.16 3D-CT of the maxilla showing measurements for maxillary width.
Maxillary width
zmi.l-zmi.r Maximum maxillary width
ms.l-ms.r Posterior superior maxillary width
mxt.l-mxt.r Posterior inferior maxillary width
gpf.l-gpf.r Posterior palatal width
48
General Methodology
___________________________________________________________________________
___________________________________________________________________________
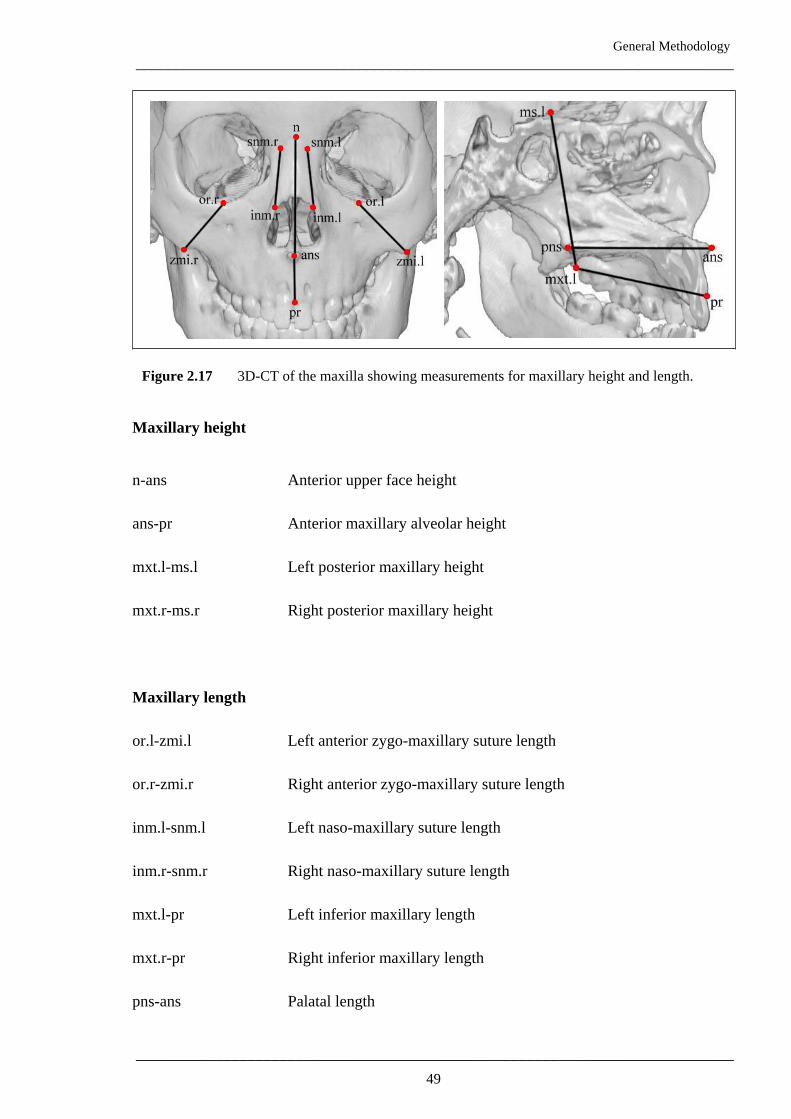
Figure 2.17 3D-CT of the maxilla showing measurements for maxillary height and length.
Maxillary height
n-ans Anterior upper face height
ans-pr Anterior maxillary alveolar height
mxt.l-ms.l Left posterior maxillary height
mxt.r-ms.r Right posterior maxillary height
Maxillary length
or.l-zmi.l Left anterior zygo-maxillary suture length
or.r-zmi.r Right anterior zygo-maxillary suture length
inm.l-snm.l Left naso-maxillary suture length
inm.r-snm.r Right naso-maxillary suture length
mxt.l-pr Left inferior maxillary length
mxt.r-pr Right inferior maxillary length
pns-ans Palatal length
49
General Methodology
___________________________________________________________________________
___________________________________________________________________________
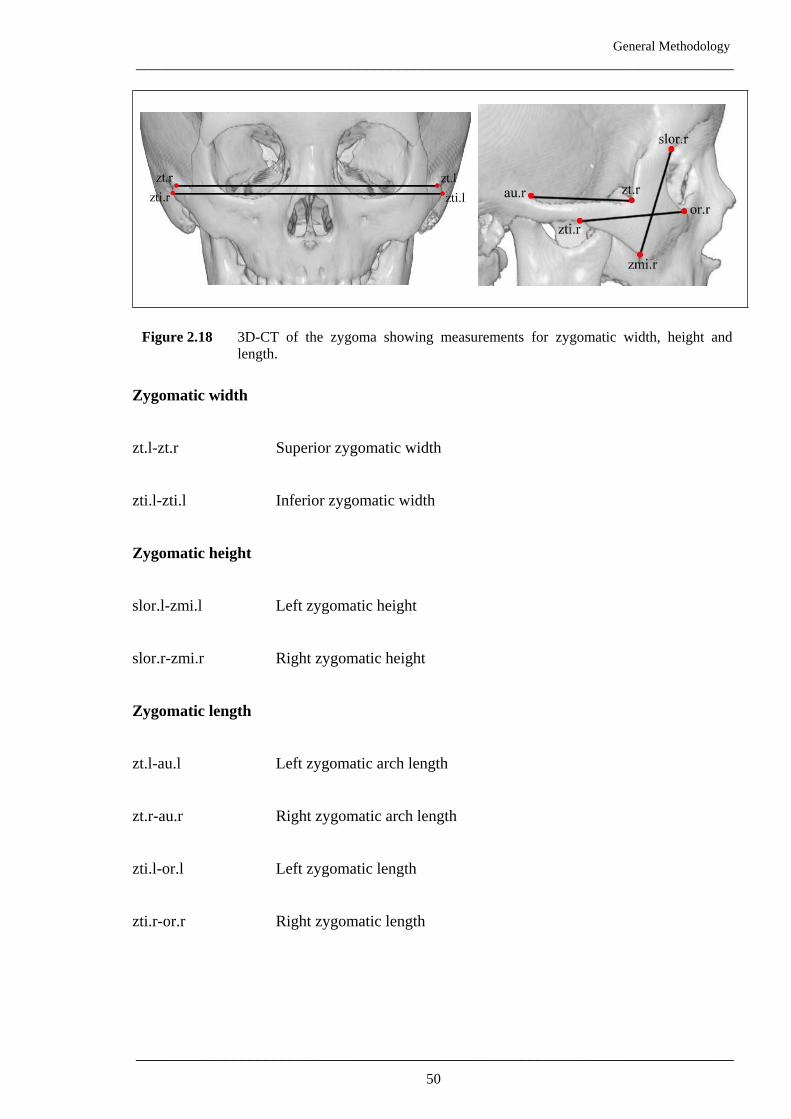
Figure 2.18 3D-CT of the zygoma showing measurements for zygomatic width, height and
length.
Zygomatic width
zt.l-zt.r Superior zygomatic width
zti.l-zti.l Inferior zygomatic width
Zygomatic height
slor.l-zmi.l Left zygomatic height
slor.r-zmi.r Right zygomatic height
Zygomatic length
zt.l-au.l Left zygomatic arch length
zt.r-au.r Right zygomatic arch length
zti.l-or.l Left zygomatic length
zti.r-or.r Right zygomatic length
50
General Methodology
___________________________________________________________________________
___________________________________________________________________________
••
•
•
•
•
•
•
•
cd.l
cd.rct.r
id
cd.r
go.r go.l
go.r
gn
••
•
•
•
•
•
•
•
cd.l
cd.rct.r
id
cd.r
go.r go.l
go.r
gn
••
•
•
•
•
•
•
•
cd.l
cd.rct.r
id
cd.r
go.r go.l
go.r
gn
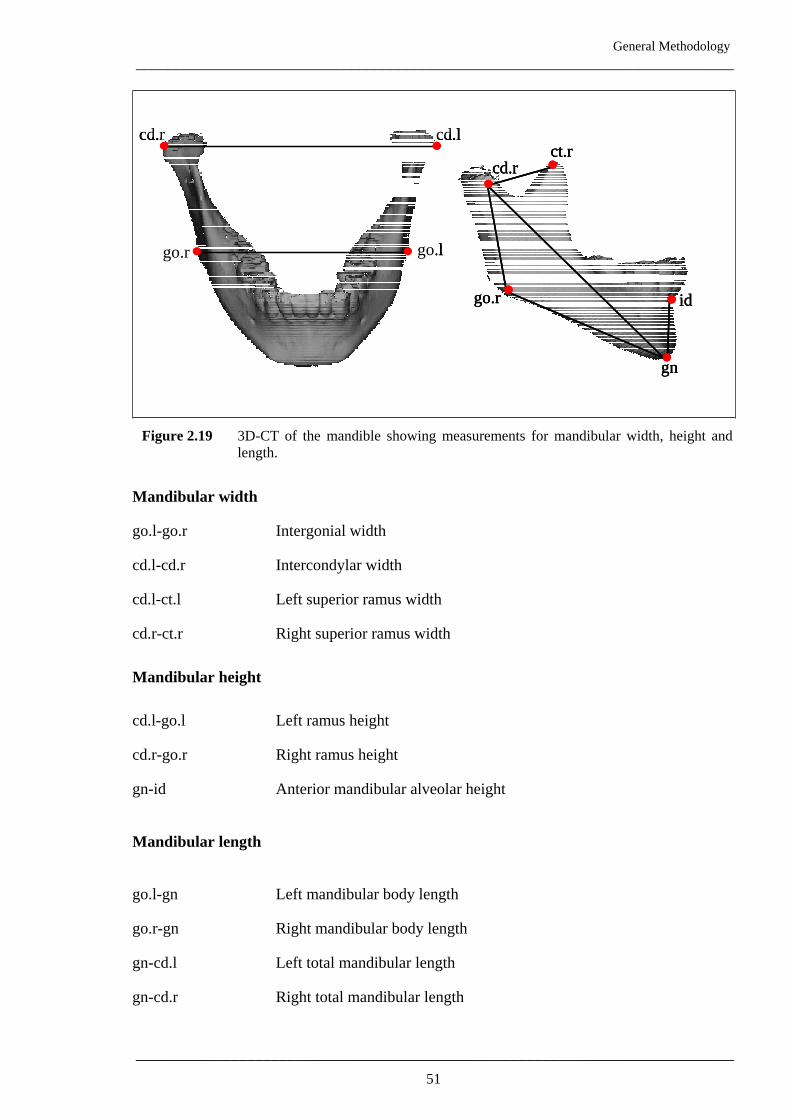
Figure 2.19 3D-CT of the mandible showing measurements for mandibular width, height and
length.
Mandibular width
go.l-go.r Intergonial width
cd.l-cd.r Intercondylar width
cd.l-ct.l Left superior ramus width
cd.r-ct.r Right superior ramus width
Mandibular height
cd.l-go.l Left ramus height
cd.r-go.r Right ramus height
gn-id Anterior mandibular alveolar height
Mandibular length
go.l-gn Left mandibular body length
go.r-gn Right mandibular body length
gn-cd.l Left total mandibular length
gn-cd.r Right total mandibular length
51
General Methodology
___________________________________________________________________________
___________________________________________________________________________
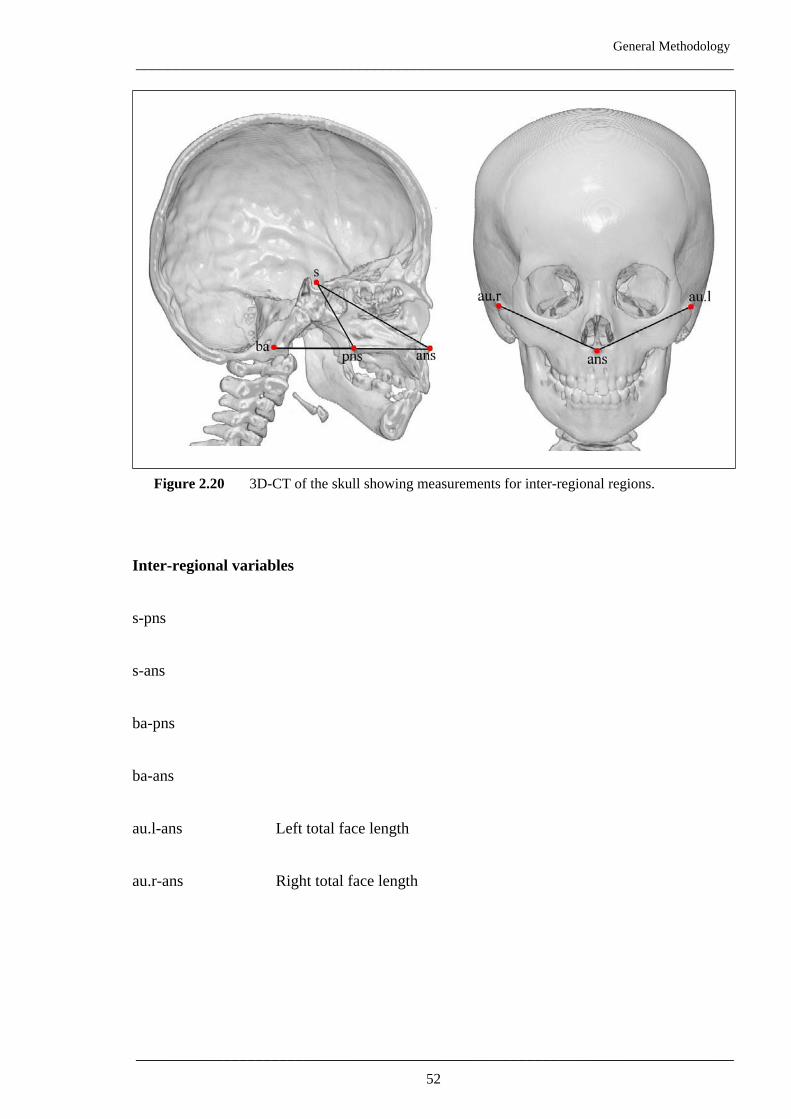
Figure 2.20 3D-CT of the skull showing measurements for inter-regional regions.
Inter-regional variables
s-pns
s-ans
ba-pns
ba-ans
au.l-ans Left total face length
au.r-ans Right total face length
52
General Methodology
___________________________________________________________________________
___________________________________________________________________________
•
•• )s n
na•
•• )s n
na
••
•morfl.lmorfl.r
n
)•
••morfl.lmorfl.r
n
••
•morfl.lmorfl.r
n
)
)• •
•
sn
ba
) n
ba
• •
•
s) )
au.r
petsa.l
zt.l
au.l
zt.r
petsa.r
) )au.r
petsa.l
zt.l
au.l
zt.r
petsa.r
) )au.r
petsa.l
zt.l
au.l
zt.r
petsa.r
•
•
•
cd.r
go.r
gn
)
•
•
•
cd.r
go.r
gn
)
•
•
•
cd.r
go.r
gn
)
•
.lgo.r
gn
)
•go•
•
.lgo.r
gn
•go•
•
.lgo.r
gn
•go•
•
.lgo.r
gn
)
(a)
(f)(e)
(d)(c)
(b)
•go•
•• )s n•
na•• )s n•
na
••
•morfl.lmorfl.r
n
)•
••morfl.lmorfl.r
n
••
•morfl.lmorfl.r
n
)
) n
ba
• •
•
s
) n
ba
• •
•
s) )
au.r
petsa.l
zt.l
au.l
zt.r
petsa.r
) )au.r
petsa.l
zt.l
au.l
zt.r
petsa.r
) )au.r
petsa.l
zt.l
au.l
zt.r
petsa.r
•
•
•
cd.r
go.r
gn
)
•
•
•
cd.r
go.r
gn
)
•
•
•
cd.r
go.r
gn
)
•
.lgo.r
gn
)
•go•
•
.lgo.r
gn
•go•
•
.lgo.r
gn
•go•
•
.lgo.r
gn
)
(a)
(f)(e)
(d)(c)
(b)
•go•
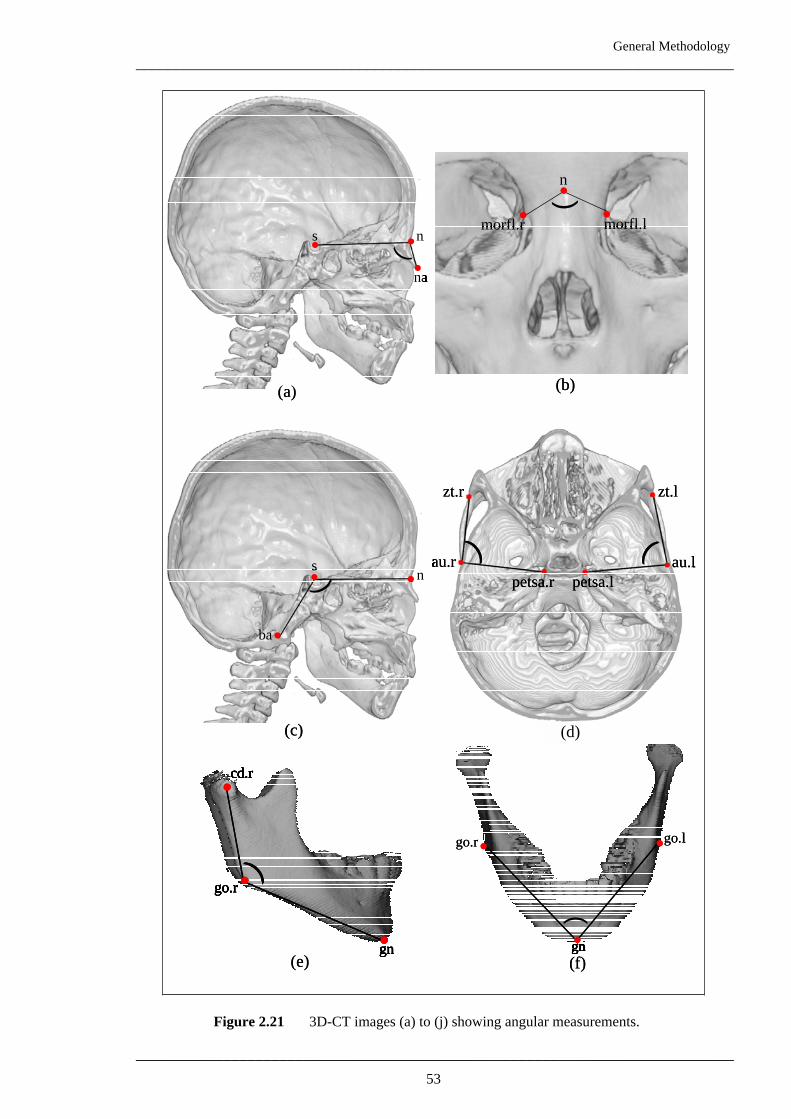
Figure 2.21 3D-CT images (a) to (j) showing angular measurements.
53
General Methodology
___________________________________________________________________________
___________________________________________________________________________
)
•
•
•
es
petp.l petp.r
)
es
petp.l petp.r•
•
•
) )
s•••
•
•
•
n
ac.lac.r
spa.lspa.r ) )
s•••
•
•
•
n
ac.lac.r
spa.lspa.r
•
•
s
anspns
}n
•
••
•
s
anspns
}n
•
•
••
(
pns nsa
n•
••
(
pns ns
(j)(i)
(h)(g)
)
es
petp.l petp.r•
•
•
)
es
petp.l petp.r
a
n•
•
•
•
) )
s•••
•
•
•
n
ac.lac.r
spa.lspa.r ) )
s•••
•
•
•
n
ac.lac.r
spa.lspa.r
•
•
s
anspns
}n
•
••
•
s
anspns
}n
•
•
••
(
pns nsa
n•
••
(
pns ns
(j)(i)
(h)(g)
a
n•
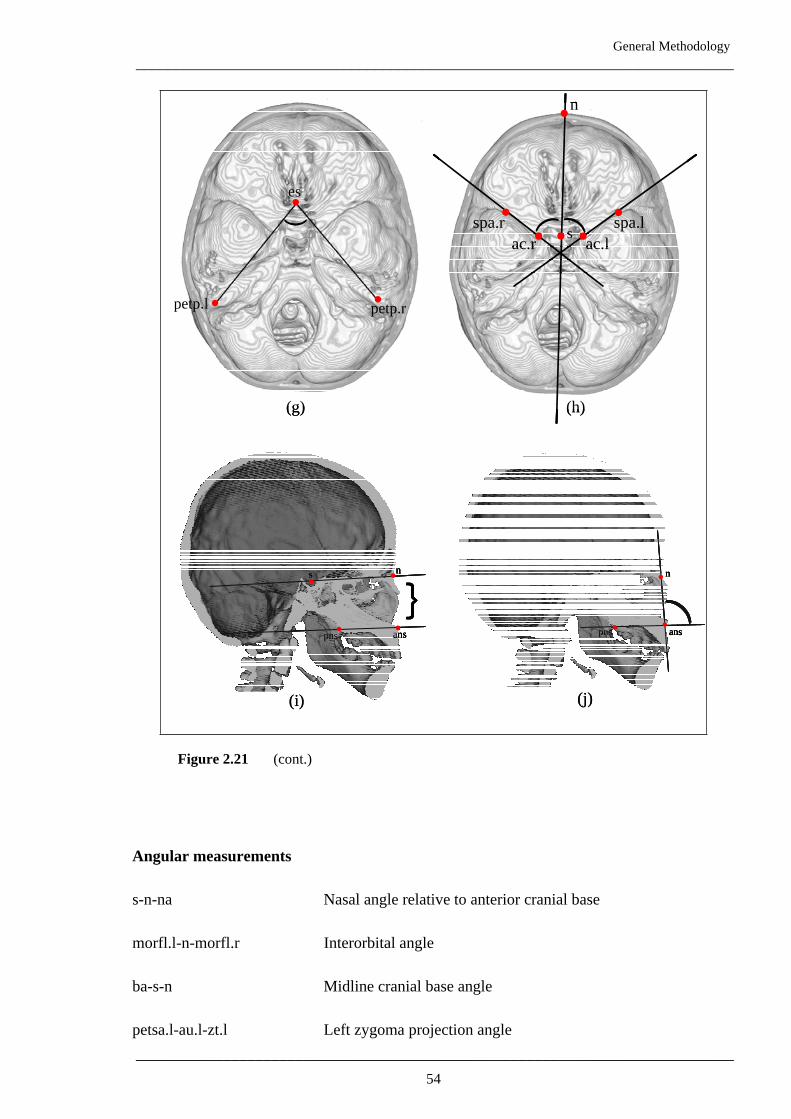
Figure 2.21 (cont.)
Angular measurements
s-n-na Nasal angle relative to anterior cranial base
morfl.l-n-morfl.r Interorbital angle
ba-s-n Midline cranial base angle
petsa.l-au.l-zt.l Left zygoma projection angle
54
General Methodology
___________________________________________________________________________
___________________________________________________________________________
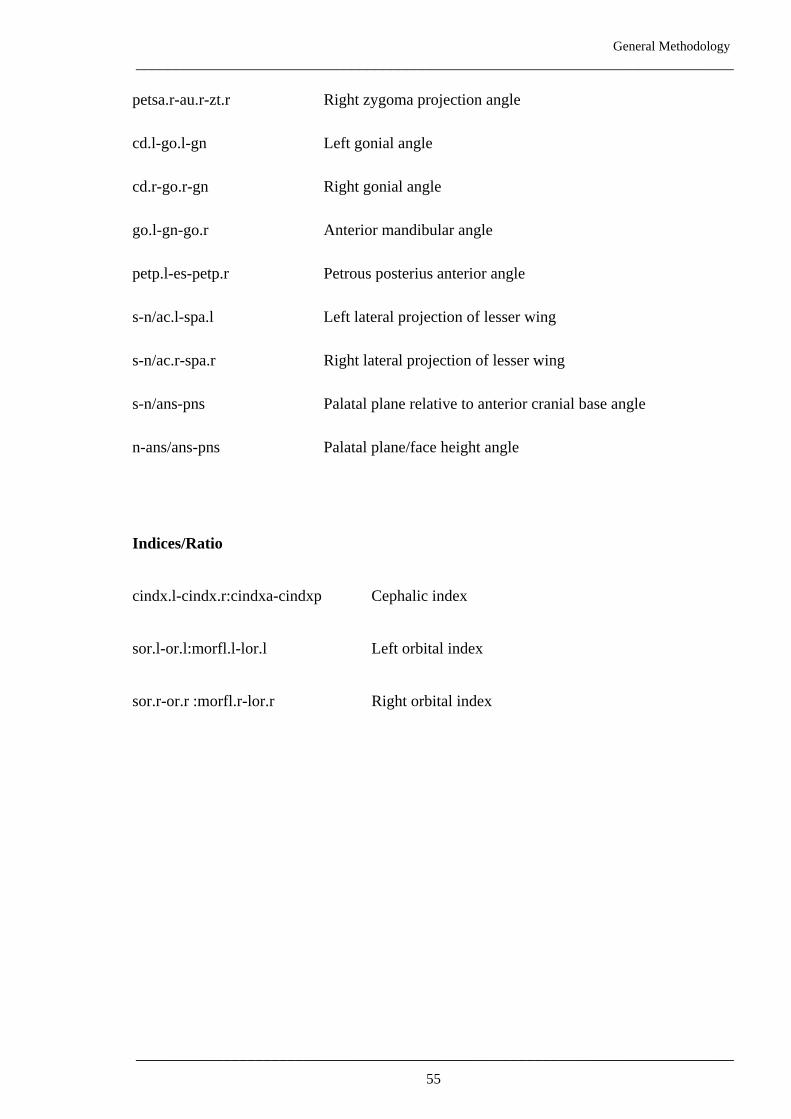
petsa.r-au.r-zt.r Right zygoma projection angle
cd.l-go.l-gn Left gonial angle
cd.r-go.r-gn Right gonial angle
go.l-gn-go.r Anterior mandibular angle
petp.l-es-petp.r Petrous posterius anterior angle
s-n/ac.l-spa.l Left lateral projection of lesser wing
s-n/ac.r-spa.r Right lateral projection of lesser wing
s-n/ans-pns Palatal plane relative to anterior cranial base angle
n-ans/ans-pns Palatal plane/face height angle
Indices/Ratio
cindx.l-cindx.r:cindxa-cindxp Cephalic index
sor.l-or.l:morfl.l-lor.l Left orbital index
sor.r-or.r :morfl.r-lor.r Right orbital index
55
General Methodology
___________________________________________________________________________
___________________________________________________________________________
2.7 Overview of Statistical Analysis of Measurement Techniques
A series of statistical analyses was performed on the collected data for different
purposes. More detailed descriptions of these analyses will be provided in subsequent
chapters. In Chapter 3, which mainly concerns with generation of new reference data for
craniofacial measurements, descriptive statistics such as mean values, standard deviations,
standard errors and coefficients of variation are presented. Scatter plots of variables against
age are also presented in this chapter and non-linear regression (growth) curves serve as
graphical presentations.
A linear modelling approach was used to compare mean values between males and
females. This method was used instead of a t-test because the ages of the males and females in
the various age categories were not matched exactly for comparison. Linear modelling
allowed comparisons to be made of adjusted mean ages in each of the selected age categories.
Paired t-tests were used to compare values between left and right sides for selected
variables. A linear modelling approach was also applied and plots generated to provide
graphical presentations of asymmetry.
Finally, Student’s t-test was utilised to compare the mean values of some of the
measurements from the Malay sample with published data from two studies of other ethnic
groups at selected ages.
56
General Methodology
___________________________________________________________________________
___________________________________________________________________________
2.8 Error of Measurements and Analysis
In this type of study where measurements are involved, it is important to establish the
degree of reliability of methods adopted. Researchers need to take into account the errors of
observation arising from the technique applied when making comparisons within and between
groups. Additionally, it is important to differentiate between the basic terms of validity and
reproducibility before exploring errors of measurements.
Validity refers to how well an instrument measures what it is supposed to measure in
the absence of measurement error. The term accuracy may also be used in this context.
Reproducibility or reliability means the closeness of successive measurements of the
same object. Reproducibility is affected by the condition of the object being measured, the
quality of records, the situation in which measurements are made, and the care and skill of the
measurer.
2.8.1 Type of Errors
There are two types of measurement errors i.e. systematic and random errors.
Systematic errors (or bias) occur if a particular measurement is persistently over- or under-
recorded. Examples of how systematic errors can occur include measurements being made by
different persons who have different concepts of a particular landmark, or when an observer’s
practice changes with experience over a period of time (Houston, 1983).
In cephalometry, random errors can arise from variations in positioning of subjects in
the cephalostat during x-ray taking. The greatest source of random errors is difficulty in
identifying a particular landmarks or lack of precision in its definition. In view of this, many
anatomic definitions lack precision. Despite many attempts being made to improve the
57
General Methodology
___________________________________________________________________________
___________________________________________________________________________
precision of definitions (Van der Linden, 1971), difficulties still exist even when a 3D-CT
approach is used.
To determine the landmark relocation error in this project, double determinations were
performed for 10% of the subjects. Due to radiation exposure, it was not possible to rescan the
patients. Therefore, the double determinations were based on two examinations of the same
CT scans performed at least one month apart. This time interval ensured point identification
clues would not be recalled to aid in relocation.
2.8.2 Detecting Systematic errors
The simplest approach to detect systematic errors is to conduct a paired t-test to
analyse the differences between pairs of determinations. This test calculates whether the mean
difference between the two determinations is significantly different from zero.
2.8.3 Calculating Random errors
Random errors may add to the natural variability of the measurements and may
therefore obscure real differences between groups. Calculation of the standard deviation of the
differences between the two measurements, Sd provides one way of measuring random errors.
The variance, Sd2, of differences between two measures is double that of a single
measurement. Sd2
should therefore be halved to give an estimation of the error of a single
measurement.
i.e. Se2 = Sd
2 /2 therefore
N
dSe
2
2
This is the formula proposed by Dahlberg (1940) to estimate the standard deviation of a single
determination. The term Se2 is referred as the error variance.
Se2 = d
2 /2n
58
General Methodology
___________________________________________________________________________
___________________________________________________________________________
2.8.4 Error Analysis for this Study
Calculation of the error of the method was performed by the process of double
determination performed over a specific time interval. Double determinations of different
scans of the same subjects would have been more ideal but this was not possible due to ethical
objections to unnecessary radiation exposure to the subjects. It would also be more ideal to
perform double determinations on all subjects but this was not possible due to the time
limitation for this study. Landmarks were determined on the same CT images on two separate
occasions for 20 subjects (10%), approximately one month apart. All 115 landmarks were
used for the study of reproducibility.
The following provides essentially a multi-variate description of Dahlberg’s method of
double determination.
The variable of interest (distance measurement or point location) is determined on n
individuals on two occasions sufficiently separated in time so that non-landmark related cues
would be forgotten.
Let d1, d2, … , dn be the observed differences for the n double determinations of a p-
dimensional variable (here 1, 2 or 3 dimensions) and each d have a p-variate normal
distribution with mean
j
d and variance-covariance matrix d. Then the mean difference vector
is given by
n
j
jn 1
1dd
and the estimated variance-covariance matrix Sd is given by (Johnson and Wichern, 1988).
'))((1
1
1
d
n
j
jjn
ddddS
Bold letters indicate vectors of dimension p and the prime indicates transpose.
59
General Methodology
___________________________________________________________________________
___________________________________________________________________________
When the null hypothesis of no systematic error holds )/,0(~ ndpNd , that is, d
The test statistic
dSd 12 ' dnT
has a Hotelling’s T2 distribution and is used to test the null hypothesis. The null hypothesis is
rejected at the -level if
T2 (n 1)p
(n p)Fp,n p( )
If the null hypothesis is retained then a suitable measure of the variance-covariance matrix of
the random error associated with a single determination of a p-dimensional variable is:
S1
2nd jd j
j 1
n
'
The factor of two in the denominator arises because the measurement error can be equally
ascribed to either determination. The factor n is used rather than the (n-1) because the mean
error has been taken to be zero.
In this study p = 3 dimensions for point measurements. For anthropometric variables such as
distances, where p = 1, the formulae reduce to Dahlberg’s original formulation of t-tests on
the mean differences and assigning the random measurement error, s, as
n
j
jdn
s1
22
2
1
In one dimension the T2 test statistic becomes:
)(~d 1,1
2
d
22
nFsnT or )(~)d( 1d ntsnTt
where sd is the estimator of the standard deviation of the differences between each
determination and )(1nt is Student’s t-distribution.
60
General Methodology
___________________________________________________________________________
___________________________________________________________________________
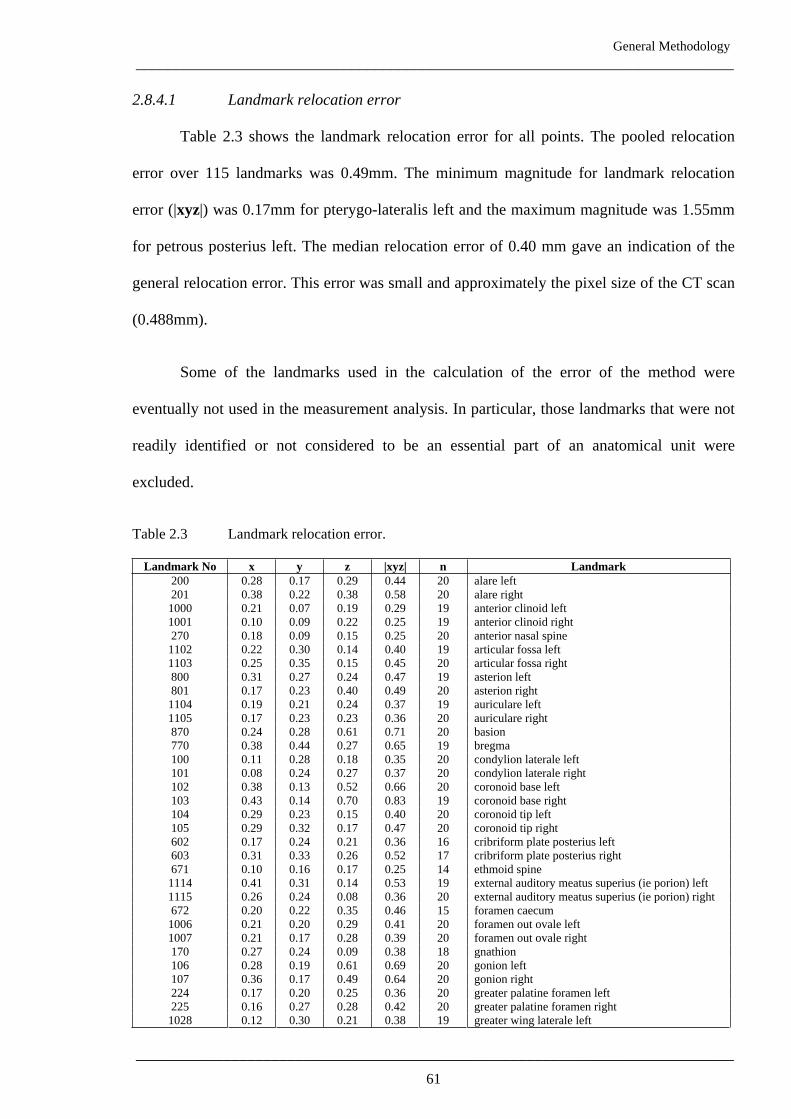
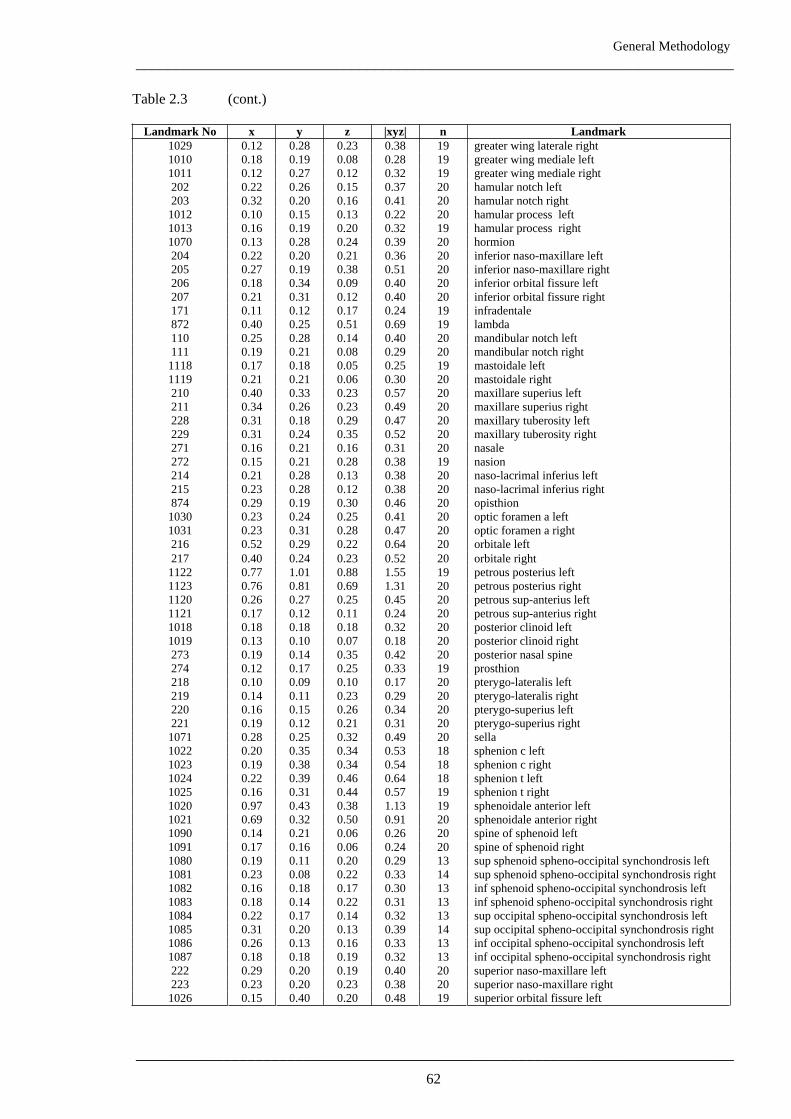
2.8.4.1 Landmark relocation error
Table 2.3 shows the landmark relocation error for all points. The pooled relocation
error over 115 landmarks was 0.49mm. The minimum magnitude for landmark relocation
error (|xyz|) was 0.17mm for pterygo-lateralis left and the maximum magnitude was 1.55mm
for petrous posterius left. The median relocation error of 0.40 mm gave an indication of the
general relocation error. This error was small and approximately the pixel size of the CT scan
(0.488mm).
Some of the landmarks used in the calculation of the error of the method were
eventually not used in the measurement analysis. In particular, those landmarks that were not
readily identified or not considered to be an essential part of an anatomical unit were
excluded.
Table 2.3 Landmark relocation error.
Landmark No x y z |xyz| n Landmark
200 0.28 0.17 0.29 0.44 20 alare left
201 0.38 0.22 0.38 0.58 20 alare right
1000 0.21 0.07 0.19 0.29 19 anterior clinoid left
1001 0.10 0.09 0.22 0.25 19 anterior clinoid right
270 0.18 0.09 0.15 0.25 20 anterior nasal spine
1102 0.22 0.30 0.14 0.40 19 articular fossa left
1103 0.25 0.35 0.15 0.45 20 articular fossa right
800 0.31 0.27 0.24 0.47 19 asterion left
801 0.17 0.23 0.40 0.49 20 asterion right
1104 0.19 0.21 0.24 0.37 19 auriculare left
1105 0.17 0.23 0.23 0.36 20 auriculare right
870 0.24 0.28 0.61 0.71 20 basion
770 0.38 0.44 0.27 0.65 19 bregma
100 0.11 0.28 0.18 0.35 20 condylion laterale left
101 0.08 0.24 0.27 0.37 20 condylion laterale right
102 0.38 0.13 0.52 0.66 20 coronoid base left
103 0.43 0.14 0.70 0.83 19 coronoid base right
104 0.29 0.23 0.15 0.40 20 coronoid tip left
105 0.29 0.32 0.17 0.47 20 coronoid tip right
602 0.17 0.24 0.21 0.36 16 cribriform plate posterius left
603 0.31 0.33 0.26 0.52 17 cribriform plate posterius right
671 0.10 0.16 0.17 0.25 14 ethmoid spine
1114 0.41 0.31 0.14 0.53 19 external auditory meatus superius (ie porion) left
1115 0.26 0.24 0.08 0.36 20 external auditory meatus superius (ie porion) right
672 0.20 0.22 0.35 0.46 15 foramen caecum
1006 0.21 0.20 0.29 0.41 20 foramen out ovale left
1007 0.21 0.17 0.28 0.39 20 foramen out ovale right
170 0.27 0.24 0.09 0.38 18 gnathion
106 0.28 0.19 0.61 0.69 20 gonion left
107 0.36 0.17 0.49 0.64 20 gonion right
224 0.17 0.20 0.25 0.36 20 greater palatine foramen left
225 0.16 0.27 0.28 0.42 20 greater palatine foramen right
1028 0.12 0.30 0.21 0.38 19 greater wing laterale left
61
General Methodology
___________________________________________________________________________
___________________________________________________________________________
Table 2.3 (cont.)
Landmark No x y z |xyz| n Landmark
1029 0.12 0.28 0.23 0.38 19 greater wing laterale right
1010 0.18 0.19 0.08 0.28 19 greater wing mediale left
1011 0.12 0.27 0.12 0.32 19 greater wing mediale right
202 0.22 0.26 0.15 0.37 20 hamular notch left
203 0.32 0.20 0.16 0.41 20 hamular notch right
1012 0.10 0.15 0.13 0.22 20 hamular process left
1013 0.16 0.19 0.20 0.32 19 hamular process right
1070 0.13 0.28 0.24 0.39 20 hormion
204 0.22 0.20 0.21 0.36 20 inferior naso-maxillare left
205 0.27 0.19 0.38 0.51 20 inferior naso-maxillare right
206 0.18 0.34 0.09 0.40 20 inferior orbital fissure left
207 0.21 0.31 0.12 0.40 20 inferior orbital fissure right
171 0.11 0.12 0.17 0.24 19 infradentale
872 0.40 0.25 0.51 0.69 19 lambda
110 0.25 0.28 0.14 0.40 20 mandibular notch left
111 0.19 0.21 0.08 0.29 20 mandibular notch right
1118 0.17 0.18 0.05 0.25 19 mastoidale left
1119 0.21 0.21 0.06 0.30 20 mastoidale right
210 0.40 0.33 0.23 0.57 20 maxillare superius left
211 0.34 0.26 0.23 0.49 20 maxillare superius right
228 0.31 0.18 0.29 0.47 20 maxillary tuberosity left
229 0.31 0.24 0.35 0.52 20 maxillary tuberosity right
271 0.16 0.21 0.16 0.31 20 nasale
272 0.15 0.21 0.28 0.38 19 nasion
214 0.21 0.28 0.13 0.38 20 naso-lacrimal inferius left
215 0.23 0.28 0.12 0.38 20 naso-lacrimal inferius right
874 0.29 0.46 20 opisthion
1030
1031
216
0.23
0.23
0.52
0.19
0.24
0.31
0.29
0.30
0.25
0.28
0.22
0.41
0.47
0.64
20
20
20
optic foramen a left
optic foramen a right
orbitale left
217 0.40 0.24 0.23 0.52 20 orbitale right
1122 0.77 1.01 0.88 1.55 19 petrous posterius left
1123 0.76 0.81 0.69 1.31 20 petrous posterius right
1120 0.26 0.27 0.25 0.45 20 petrous sup-anterius left
1121 0.17 0.12 0.11 0.24 20 petrous sup-anterius right
1018 0.18 0.18 0.18 0.32 20 posterior clinoid left
1019 0.13 0.10 0.07 0.18 20 posterior clinoid right
273 0.19 0.14 0.35 0.42 20 posterior nasal spine
274 0.12 0.17 0.25 0.33 19 prosthion
218 0.10 0.09 0.10 0.17 20 pterygo-lateralis left
219 0.14 0.11 0.23 0.29 20 pterygo-lateralis right
220 0.16 0.15 0.26 0.34 20 pterygo-superius left
221 0.19 0.12 0.21 0.31 20 pterygo-superius right
1071 0.28 0.25 0.32 0.49 20 sella
1022 0.20 0.35 0.34 0.53 18 sphenion c left
1023 0.19 0.38 0.34 0.54 18 sphenion c right
1024 0.22 0.39 0.46 0.64 18 sphenion t left
1025 0.16 0.31 0.44 0.57 19 sphenion t right
1020 0.97 0.43 0.38 1.13 19 sphenoidale anterior left
1021 0.69 0.32 0.50 0.91 20 sphenoidale anterior right
1090 0.14 0.21 0.06 0.26 20 spine of sphenoid left
1091 0.17 0.16 0.06 0.24 20 spine of sphenoid right
1080 0.19 0.11 0.20 0.29 13 sup sphenoid spheno-occipital synchondrosis left
1081 0.23 0.08 0.22 0.33 14 sup sphenoid spheno-occipital synchondrosis right
1082 0.16 0.18 0.17 0.30 13 inf sphenoid spheno-occipital synchondrosis left
1083 0.18 0.14 0.22 0.31 13 inf sphenoid spheno-occipital synchondrosis right
1084 0.22 0.17 0.14 0.32 13 sup occipital spheno-occipital synchondrosis left
1085 0.31 0.20 0.13 0.39 14 sup occipital spheno-occipital synchondrosis right
1086 0.26 0.13 0.16 0.33 13 inf occipital spheno-occipital synchondrosis left
1087 0.18 0.18 0.19 0.32 13 inf occipital spheno-occipital synchondrosis right
222 0.29 0.20 0.19 0.40 20 superior naso-maxillare left
223 0.23 0.20 0.23 0.38 20 superior naso-maxillare right
1026 0.15 0.40 0.20 0.48 19 superior orbital fissure left
62
General Methodology
___________________________________________________________________________
___________________________________________________________________________
Table 2.3 (cont.)
Landmark No x y z |xyz| n Landmark
1027 0.20 0.31 0.22 0.43 20 superior orbital fissure right
700 0.51 0.24 0.06 0.56 20 superior orbitale left
701 0.57 0.34 0.09 0.67 20 superior orbitale right
506 0.21 0.16 0.10 0.28 19 supero-lateral orbitale left
507 0.19 0.20 0.17 0.33 19 supero-lateral orbitale right
510 0.22 0.41 0.23 0.51 20 zygo-frontale left
511 0.20 0.32 0.20 0.43 20 zygo-frontale right
512 0.22 0.24 0.17 0.37 20 zygo-frontale sphenoidale left
513 0.23 0.19 0.22 0.37 20 zygo-frontale sphenoidale right
514 0.25 0.32 0.31 0.51 20 zygo-maxillare inferius left
515 0.23 0.17 0.22 0.36 20 zygo-maxillare inferius right
516 0.20 0.39 0.07 0.44 20 zygo-temporale left
517 0.38 0.35 0.16 0.55 20 zygo-temporale right
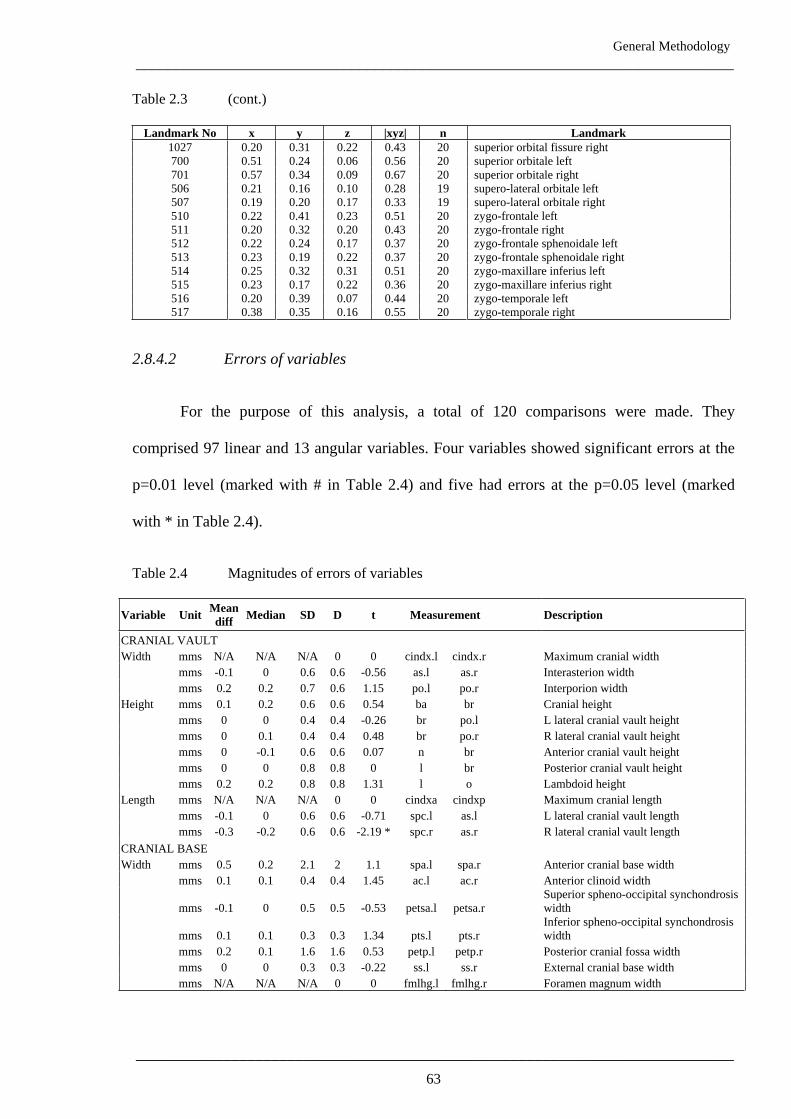
2.8.4.2 Errors of variables
For the purpose of this analysis, a total of 120 comparisons were made. They
comprised 97 linear and 13 angular variables. Four variables showed significant errors at the
p=0.01 level (marked with # in Table 2.4) and five had errors at the p=0.05 level (marked
with * in Table 2.4).
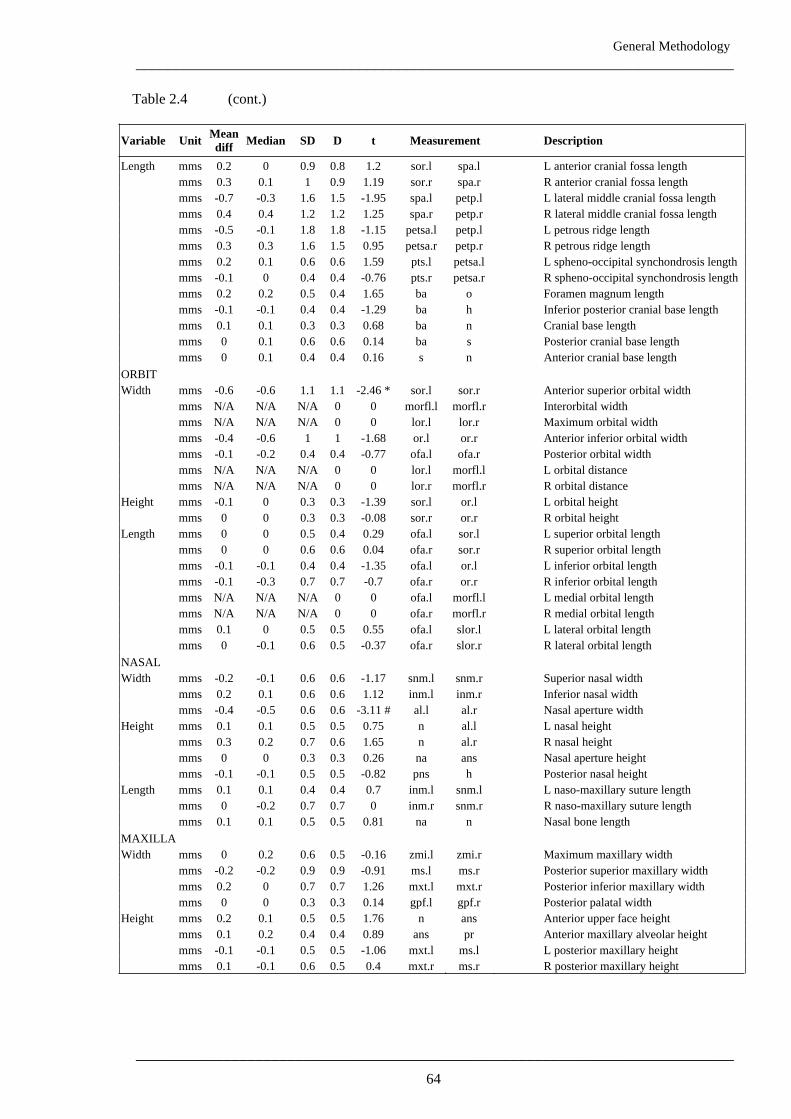
Table 2.4 Magnitudes of errors of variables
Variable UnitMean
diffMedian SD D t Measurement Description
CRANIAL VAULT
Width mms N/A N/A N/A 0 0 cindx.l cindx.r Maximum cranial width
mms -0.1 0 0.6 0.6 -0.56 as.l as.r Interasterion width
mms 0.2 0.2 0.7 0.6 1.15 po.l po.r Interporion width
Height mms 0.1 0.2 0.6 0.6 0.54 ba br Cranial height
mms 0 0 0.4 0.4 -0.26 br po.l L lateral cranial vault height
mms 0 0.1 0.4 0.4 0.48 br po.r R lateral cranial vault height
mms 0 -0.1 0.6 0.6 0.07 n br Anterior cranial vault height
mms 0 0 0.8 0.8 0 l br Posterior cranial vault height
mms 0.2 0.2 0.8 0.8 1.31 l o Lambdoid height
Length mms N/A N/A N/A 0 0 cindxa cindxp Maximum cranial length
mms -0.1 0 0.6 0.6 -0.71 spc.l as.l L lateral cranial vault length
mms -0.3 -0.2 0.6 0.6 -2.19 * spc.r as.r R lateral cranial vault length
CRANIAL BASE
Width mms 0.5 0.2 2.1 2 1.1 spa.l spa.r Anterior cranial base width
mms 0.1 0.1 0.4 0.4 1.45 ac.l ac.r Anterior clinoid width
mms -0.1 0 0.5 0.5 -0.53 petsa.l petsa.r
Superior spheno-occipital synchondrosis
width
mms 0.1 0.1 0.3 0.3 1.34 pts.l pts.r
Inferior spheno-occipital synchondrosis
width
mms 0.2 0.1 1.6 1.6 0.53 petp.l petp.r Posterior cranial fossa width
mms 0 0 0.3 0.3 -0.22 ss.l ss.r External cranial base width
mms N/A N/A N/A 0 0 fmlhg.l fmlhg.r Foramen magnum width
63
General Methodology
___________________________________________________________________________
___________________________________________________________________________
Table 2.4 (cont.)
Variable UnitMean
diffMedian SD D t Measurement Description
Length mms 0.2 0 0.9 0.8 1.2 sor.l spa.l L anterior cranial fossa length
mms 0.3 0.1 1 0.9 1.19 sor.r spa.r R anterior cranial fossa length
mms -0.7 -0.3 1.6 1.5 -1.95 spa.l petp.l L lateral middle cranial fossa length
mms 0.4 0.4 1.2 1.2 1.25 spa.r petp.r R lateral middle cranial fossa length
mms -0.5 -0.1 1.8 1.8 -1.15 petsa.l petp.l L petrous ridge length
mms 0.3 0.3 1.6 1.5 0.95 petsa.r petp.r R petrous ridge length
mms 0.2 0.1 0.6 0.6 1.59 pts.l petsa.l L spheno-occipital synchondrosis length
mms -0.1 0 0.4 0.4 -0.76 pts.r petsa.r R spheno-occipital synchondrosis length
mms 0.2 0.2 0.5 0.4 1.65 ba o Foramen magnum length
mms -0.1 -0.1 0.4 0.4 -1.29 ba h Inferior posterior cranial base length
mms 0.1 0.1 0.3 0.3 0.68 ba n Cranial base length
mms 0 0.1 0.6 0.6 0.14 ba s Posterior cranial base length
mms 0 0.1 0.4 0.4 0.16 s n Anterior cranial base length
ORBIT
Width mms -0.6 -0.6 1.1 1.1 -2.46 * sor.l sor.r Anterior superior orbital width
mms N/A N/A N/A 0 0 morfl.l morfl.r Interorbital width
mms N/A N/A N/A 0 0 lor.l lor.r Maximum orbital width
mms -0.4 -0.6 1 1 -1.68 or.l or.r Anterior inferior orbital width
mms -0.1 -0.2 0.4 0.4 -0.77 ofa.l ofa.r Posterior orbital width
mms N/A N/A N/A 0 0 lor.l morfl.l L orbital distance
mms N/A N/A N/A 0 0 lor.r morfl.r R orbital distance
Height mms -0.1 0 0.3 0.3 -1.39 sor.l or.l L orbital height
mms 0 0 0.3 0.3 -0.08 sor.r or.r R orbital height
Length mms 0 0 0.5 0.4 0.29 ofa.l sor.l L superior orbital length
mms 0 0 0.6 0.6 0.04 ofa.r sor.r R superior orbital length
mms -0.1 -0.1 0.4 0.4 -1.35 ofa.l or.l L inferior orbital length
mms -0.1 -0.3 0.7 0.7 -0.7 ofa.r or.r R inferior orbital length
mms N/A N/A N/A 0 0 ofa.l morfl.l L medial orbital length
mms N/A N/A N/A 0 0 ofa.r morfl.r R medial orbital length
mms 0.1 0 0.5 0.5 0.55 ofa.l slor.l L lateral orbital length
mms 0 -0.1 0.6 0.5 -0.37 ofa.r slor.r R lateral orbital length
NASAL
Width mms -0.2 -0.1 0.6 0.6 -1.17 snm.l snm.r Superior nasal width
mms 0.2 0.1 0.6 0.6 1.12 inm.l inm.r Inferior nasal width
mms -0.4 -0.5 0.6 0.6 -3.11 # al.l al.r Nasal aperture width
Height mms 0.1 0.1 0.5 0.5 0.75 n al.l L nasal height
mms 0.3 0.2 0.7 0.6 1.65 n al.r R nasal height
mms 0 0 0.3 0.3 0.26 na ans Nasal aperture height
mms -0.1 -0.1 0.5 0.5 -0.82 pns h Posterior nasal height
Length mms 0.1 0.1 0.4 0.4 0.7 inm.l snm.l L naso-maxillary suture length
mms 0 -0.2 0.7 0.7 0 inm.r snm.r R naso-maxillary suture length
mms 0.1 0.1 0.5 0.5 0.81 na n Nasal bone length
MAXILLA
Width mms 0 0.2 0.6 0.5 -0.16 zmi.l zmi.r Maximum maxillary width
mms -0.2 -0.2 0.9 0.9 -0.91 ms.l ms.r Posterior superior maxillary width
mms 0.2 0 0.7 0.7 1.26 mxt.l mxt.r Posterior inferior maxillary width
mms 0 0 0.3 0.3 0.14 gpf.l gpf.r Posterior palatal width
Height mms 0.2 0.1 0.5 0.5 1.76 n ans Anterior upper face height
mms 0.1 0.2 0.4 0.4 0.89 ans pr Anterior maxillary alveolar height
mms -0.1 -0.1 0.5 0.5 -1.06 mxt.l ms.l L posterior maxillary height
mms 0.1 -0.1 0.6 0.5 0.4 mxt.r ms.r R posterior maxillary height
64
General Methodology
___________________________________________________________________________
___________________________________________________________________________
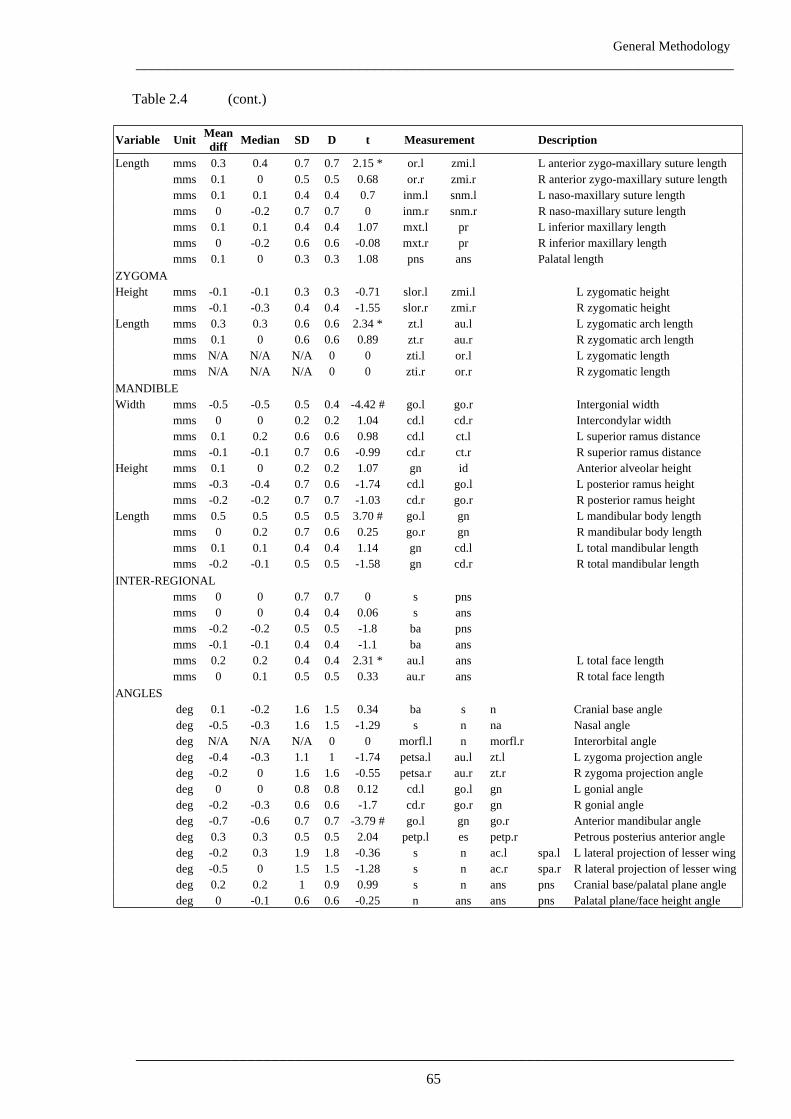
Table 2.4 (cont.)
Variable UnitMean
diffMedian SD D t Measurement Description
Length mms 0.3 0.4 0.7 0.7 2.15 * or.l zmi.l L anterior zygo-maxillary suture length
mms 0.1 0 0.5 0.5 0.68 or.r zmi.r R anterior zygo-maxillary suture length
mms 0.1 0.1 0.4 0.4 0.7 inm.l snm.l L naso-maxillary suture length
mms 0 -0.2 0.7 0.7 0 inm.r snm.r R naso-maxillary suture length
mms 0.1 0.1 0.4 0.4 1.07 mxt.l pr L inferior maxillary length
mms 0 -0.2 0.6 0.6 -0.08 mxt.r pr R inferior maxillary length
mms 0.1 0 0.3 0.3 1.08 pns ans Palatal length
ZYGOMA
Height mms -0.1 -0.1 0.3 0.3 -0.71 slor.l zmi.l L zygomatic height
mms -0.1 -0.3 0.4 0.4 -1.55 slor.r zmi.r R zygomatic height
Length mms 0.3 0.3 0.6 0.6 2.34 * zt.l au.l L zygomatic arch length
mms 0.1 0 0.6 0.6 0.89 zt.r au.r R zygomatic arch length
mms N/A N/A N/A 0 0 zti.l or.l L zygomatic length
mms N/A N/A N/A 0 0 zti.r or.r R zygomatic length
MANDIBLE
Width mms -0.5 -0.5 0.5 0.4 -4.42 # go.l go.r Intergonial width
mms 0 0 0.2 0.2 1.04 cd.l cd.r Intercondylar width
mms 0.1 0.2 0.6 0.6 0.98 cd.l ct.l L superior ramus distance
mms -0.1 -0.1 0.7 0.6 -0.99 cd.r ct.r R superior ramus distance
Height mms 0.1 0 0.2 0.2 1.07 gn id Anterior alveolar height
mms -0.3 -0.4 0.7 0.6 -1.74 cd.l go.l L posterior ramus height
mms -0.2 -0.2 0.7 0.7 -1.03 cd.r go.r R posterior ramus height
Length mms 0.5 0.5 0.5 0.5 3.70 # go.l gn L mandibular body length
mms 0 0.2 0.7 0.6 0.25 go.r gn R mandibular body length
mms 0.1 0.1 0.4 0.4 1.14 gn cd.l L total mandibular length
mms -0.2 -0.1 0.5 0.5 -1.58 gn cd.r R total mandibular length
INTER-REGIONAL
mms 0 0 0.7 0.7 0 s pns
mms 0 0 0.4 0.4 0.06 s ans
mms -0.2 -0.2 0.5 0.5 -1.8 ba pns
mms -0.1 -0.1 0.4 0.4 -1.1 ba ans
mms 0.2 0.2 0.4 0.4 2.31 * au.l ans L total face length
mms 0 0.1 0.5 0.5 0.33 au.r ans R total face length
ANGLES
deg 0.1 -0.2 1.6 1.5 0.34 ba s n Cranial base angle
deg -0.5 -0.3 1.6 1.5 -1.29 s n na Nasal angle
deg N/A N/A N/A 0 0 morfl.l n morfl.r Interorbital angle
deg -0.4 -0.3 1.1 1 -1.74 petsa.l au.l zt.l L zygoma projection angle
deg -0.2 0 1.6 1.6 -0.55 petsa.r au.r zt.r R zygoma projection angle
deg 0 0 0.8 0.8 0.12 cd.l go.l gn L gonial angle
deg -0.2 -0.3 0.6 0.6 -1.7 cd.r go.r gn R gonial angle
deg -0.7 -0.6 0.7 0.7 -3.79 # go.l gn go.r Anterior mandibular angle
deg 0.3 0.3 0.5 0.5 2.04 petp.l es petp.r Petrous posterius anterior angle
deg -0.2 0.3 1.9 1.8 -0.36 s n ac.l spa.l L lateral projection of lesser wing
deg -0.5 0 1.5 1.5 -1.28 s n ac.r spa.r R lateral projection of lesser wing
deg 0.2 0.2 1 0.9 0.99 s n ans pns Cranial base/palatal plane angle
deg 0 -0.1 0.6 0.6 -0.25 n ans ans pns Palatal plane/face height angle
65
General Methodology
___________________________________________________________________________
___________________________________________________________________________
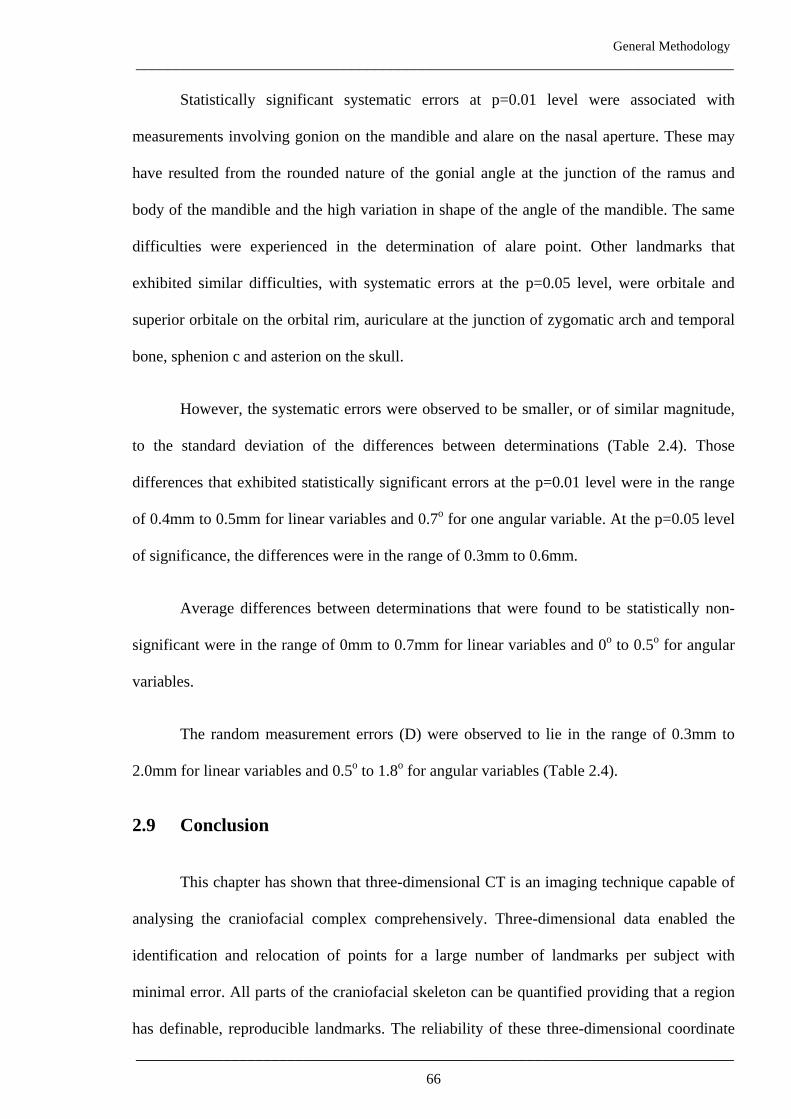
Statistically significant systematic errors at p=0.01 level were associated with
measurements involving gonion on the mandible and alare on the nasal aperture. These may
have resulted from the rounded nature of the gonial angle at the junction of the ramus and
body of the mandible and the high variation in shape of the angle of the mandible. The same
difficulties were experienced in the determination of alare point. Other landmarks that
exhibited similar difficulties, with systematic errors at the p=0.05 level, were orbitale and
superior orbitale on the orbital rim, auriculare at the junction of zygomatic arch and temporal
bone, sphenion c and asterion on the skull.
However, the systematic errors were observed to be smaller, or of similar magnitude,
to the standard deviation of the differences between determinations (Table 2.4). Those
differences that exhibited statistically significant errors at the p=0.01 level were in the range
of 0.4mm to 0.5mm for linear variables and 0.7o for one angular variable. At the p=0.05 level
of significance, the differences were in the range of 0.3mm to 0.6mm.
Average differences between determinations that were found to be statistically non-
significant were in the range of 0mm to 0.7mm for linear variables and 0o to 0.5
o for angular
variables.
The random measurement errors (D) were observed to lie in the range of 0.3mm to
2.0mm for linear variables and 0.5o to 1.8
o for angular variables (Table 2.4).
2.9 Conclusion
This chapter has shown that three-dimensional CT is an imaging technique capable of
analysing the craniofacial complex comprehensively. Three-dimensional data enabled the
identification and relocation of points for a large number of landmarks per subject with
minimal error. All parts of the craniofacial skeleton can be quantified providing that a region
has definable, reproducible landmarks. The reliability of these three-dimensional coordinate
66
General Methodology
___________________________________________________________________________
___________________________________________________________________________
positions opens up a valuable opportunity to study the human craniofacial complex in more
detail than has been possible in the past.
It can be concluded from the error study that location of landmarks from the 3D-CT
reconstructions generated in this study is both accurate and reproducible. Therefore, the
approach that has been used would appear to provide a suitable means of describing the
morphology of the human craniofacial skeleton in quantitative terms.
When considering the results presented in subsequent chapters, the errors of the
method need to be taken into account. However, overall they were small in magnitude and
unlikely to bias the results.
67